| Mississippi | 64-0862173 | |||||||
| (State or Other Jurisdiction of Incorporation or Organization) | (I.R.S. Employer Identification Number) | |||||||
| 6480 U.S. Hwy. 98 West, Suite A | ||||||||
| Hattiesburg, Mississippi | 39402 | |||||||
| (Address of principal executive offices) | (Zip Code) |
| Issuer’s telephone number: | (601) 268-8998 | |||||||
| Title of Each Class | Trading Symbol(s) | Name of Each Exchange on | ||||||||||||
Which Registered | ||||||||||||||
| Common Stock, $1.00 par value | FBMS | The | ||||||||||||
Indicate by check mark if disclosure of delinquent filers in response to Item 405 of Regulation S-K is not contained herein, and will not be contained, to the best of the registrant’s knowledge, in definitive proxy or information statements incorporated by reference in Part III of this Form 10-K or any amendment to this Form 10-Kx
Indicate by check mark whether the registrant is a shell company (as defined in Rule 12b-2 of the Exchange Act).
Yes¨ Nox
company
o Emerginggrowth company
o$776.6 million.
| Auditor Firm PCAOB ID: 686 | Auditor Name: FORVIS, LLP | Auditor Location: Jackson, MS | ||||||
| Page | ||||||||
In April 2013, we completed our first post-recession acquisition withGeorgia. We believe the purchase of First National Bank of Baldwin County, which resulted in our strategic entry into the south Alabama market. In July 2014 we completed our acquisition of Bay Bank, previously headquartered in Mobile, Alabama. The conversion and integration of these acquisitions have been successful to date, and we are optimistic that this marketthese markets will continue to contribute to our future growth and success. Also in 2014In addition, we established ade novo branch in Baton Rouge, Louisianacontinue to experience organic loan growth by continuing to strengthen our relationships with existing clients and a loan production office in Slidell, Louisiana.
creating new relationships.
We paid an aggregate purchase price for Gulf Coast of $2.3 million, consisting of 89,591 shares of our common stock, in exchange for all of the outstanding equity securities of Gulf Coast. System integration for both acquisitions was completed during the second quarter of 2017.
As of December 31, 2017, we had 415 full-time employees and 8 part-time employees, and as of March 13, 2018, we had 481 full-time employees and 6 part-time employees.
Atlanta.
Market Areas
Bank.
Recent Developments
Under the terms of the agreement, holders of Sunshine common stock will receive, at the election of each Sunshine shareholder, either (i) $27.00 in cash, or (ii) 0.93 of a share of First Bancshares’ common stock, provided that the total mix of merger consideration is fixed at 75% stock and 25% cash. The aggregate transaction consideration is valued at approximately $32.1 million.
At December 31, 2017, Sunshine had approximately $201 million in total consolidated assets, $168 million in total consolidated loans, $143 million in total consolidated deposits and $22 million in stockholder’s equity.
On March 1, 2018, we completed our merger (the “Southwest Merger”) with Southwest Banc Shares, Inc. (“Southwest”), the holding company of First Community Bank. Southwest was mergedHSBI with and into the Company, with the Company as the surviving corporation, and, immediately thereafter, First CommunityHeritage Southeast Bank was("Heritage Bank"), HSBI's wholly-owned subsidiary, merged with and into The First (collectively with the Southwest Merger referred to as the “Mergers”).Bank. The Company issued 1,134,010 sharespaid a total consideration of Company common stock valued at approximately $36,004,818 as of March 1, 2018, plus $24$221.5 million in cash, to the Southwestformer HSBI shareholders as consideration forin the Southwest Merger. Each outstanding shareacquisition, which included approximately 6,920,909 shares of the Company’sCompany's common stock, remained outstanding and was unaffected by the Mergers.
At December 31, 2017, Southwest had consolidated assetsapproximately $16 thousand in cash in lieu of $401 million, loans of $281 million, deposits of $354 million, and shareholders’ equity of $37 million.
fractional shares.
Deposit Services. We offer a full range of deposit services that are typically available in most banks and savings institutions, including checking accounts, NOW accounts, savings accounts, and other time deposits of various types, ranging from daily money market accounts to longer-term certificates of deposit. The transaction accounts and time certificates are tailored to our principal market areas at rates competitive to those offered by other banks in these areas. All deposit accounts are insured by the FDICFederal Deposit Insurance Corporation (“FDIC”) up to the maximum amount allowed by law. We solicit these accounts from individuals, businesses, associations, and organizations, and governmental authorities. In addition, we offer certain retirement account services, such as Individual Retirement Accounts (IRAs).
and health savings accounts.
We also compete with numerous financial and quasi-financial institutions for deposits and loans, including providers of financial services over the internet.internet, and financial technology, or fintech companies. Recent technology advances and other changes have allowed parties to effect financial transactions that previously required the involvement of banks. For example, consumers can maintain funds in brokerage accounts or mutual funds that would have historically been held as bank deposits. Consumers can also complete transactions such as paying bills and transferring funds directly without the assistance of banks.
These nontraditional financial service providers have been successful in developing digital and other products and services that effectively compete with traditional banking services, but are in some cases subject to fewer regulatory restrictions than banks and bank holding companies, allowing them to operate with greater flexibility and lower cost structures. Although digital products and services have been important competitive features of financial institutions for some time, the COVID-19 pandemic has accelerated the move toward digital financial services products and we expect that trend to continue.
We
Beginning with the enactmentexamined institution. The results of the Financial Institutions Reform, Recoveryexamination are confidential. Supervision and Enforcement Actregulation of 1989banks, their holding companies and followingaffiliates is intended primarily for the protection of depositors and customers, the Deposit Insurance Fund ("DIF") of the FDIC, and the U.S. banking and financial system rather than holders of our capital stock.
Bank Holding Company Regulation
The Company is subject to extensive regulation by the Board of Governors of the Federal Reserve System (the “Federal Reserve”) pursuant to the Bank Holding Company Act, of 1956, as amended (the “Bank Holding Company Act”("BHC Act"). We file quarterly reportsAs such, we are subject to comprehensive supervision, and other information withregulation by the Federal Reserve. We file reports with the SECReserve and are subject to its regulation with respectregulatory reporting requirements. Federal law subjects bank holding companies, such as the Company, to our securities, financial reporting and certain governance matters. Our securities are listedparticular restrictions on the Nasdaq Global Market,types of activities in which they may engage, and to a range of supervisory requirements and activities, including regulatory enforcement actions for violations of laws and regulations.
The Company is registered withthe safety and soundness of insured depository institutions, state banking regulators, the Federal Reserve, and separately the FDIC as the insurer of bank deposits, have the authority to compel or restrict certain actions on our part if they determine that we have insufficient capital or other resources, or are otherwise operating in a bank holding company and has electedmanner that may be deemed to be treated as a financial holding company under the Bank Holding Company Act. As such, the Companyinconsistent with safe and itssound banking practices. Under this authority, our bank regulators can require us or our subsidiaries areto enter into informal or formal supervisory agreements, including board resolutions, memoranda of understanding, written agreements and consent or cease and desist orders, pursuant to which we would be required to take identified corrective actions to address cited concerns and to refrain from taking certain actions.
The
The Bank Holding Company Act requires every
The Federal Reserve has adopted capital adequacy guidelines for use in its examination and regulation of bank holding companies and financial holding companies. The regulatory capitalvoting stock of a bank holding company or financial holding company under applicablea bank that a person may acquire without the prior approval of banking regulators. Under the federal capital adequacy guidelines is particularly importantChange in Bank Control Act and the regulations thereunder, a person or group must give advance notice to the Federal Reserve’s evaluationReserve before acquiring control of the overall safety and soundness of theany bank holding company, such as the Company, or financial holding company and are important factors considered bybefore acquiring control of any state member bank, such as The First. Upon receipt of such notice, the Federal Reserve may approve or disapprove the acquisition. The Change in evaluating any applications made by suchBank Control Act creates a rebuttable presumption of control if a member or group acquires a certain percentage or more of a bank holding companycompany’s or bank’s voting stock. As a result, a person or entity generally must provide prior notice to the Federal Reserve. If regulatory capital falls below minimum guideline levels,Reserve before acquiring the power to vote 10% or more of our outstanding common stock. The overall effect of such laws is to make it more difficult to acquire a financial holding company may lose its status as a financialbank holding company and a bank holding companyby tender offer or banksimilar means than it might be to acquire control of another type of corporation. Consequently, shareholders of the Company may be denied approvalless likely to benefit from the rapid increases in stock prices that may result from tender offers or similar efforts to acquire or establish additional banks or non-bank businesses orcontrol of other companies. Investors should be aware of these requirements when acquiring shares of our stock.
A financial holding company that becomes aware that it or a subsidiary bank has ceased to be well capitalized or well managed must notify the Federal Reserve and enter into an agreement to cure the identified deficiency. If the deficiency is not cured timely, the Federal Reserve may order the financial holding company to divest its banking operations. Alternatively, to avoid divestiture, a financial holding company may cease to engage in the financial holding company activities that are unrelated to banking or otherwise impermissible for a bank holding company. See “Capital Requirements” below for more information.
The Gramm-Leach-Bliley Act of 1999 established a comprehensive framework that permits affiliations among qualified bank holding companies, commercial banks, insurance companies, securities firms, and other financial service providers by revising and expanding the Bank Holding Company Act framework to permit a holding company to engage in a full range of financial activities through a financial holding company.
Federal Reserve Oversight
The Company is required to give the Federal Reserve prior written notice of any purchase or redemption of its outstanding equity securities if the gross consideration for the purchase or redemption, when combined with the net consideration paid for all such purchases or redemptions during the preceding 12 months, is equal to 10% or more of the Company’s consolidated net worth. The Federal Reserve may disapprove such a transaction if it determines that the proposed redemption or stock purchase would constitute an unsafe or unsound practice, would violate any law, regulation, Federal Reserve order or directive or any condition imposed by, or written agreement with, the Federal Reserve.
The Federal Reserve has issued its “Policy Statement on Cash Dividends Not Fully Covered by Earnings” (the “Policy Statement”) which sets forth various guidelines that the Federal Reserve believes a bank holding company should follow in establishing its dividend policy. In general, the Federal Reserve stated that bank holding companies should pay dividends only out of current earnings. The Federal Reserve also stated that dividends should not be paid unless the prospective rate of earnings retention by the holding company appears consistent with its capital needs, asset quality and overall financial condition.
The Company is required to file annual and quarterly reports with the Federal Reserve, and such additional information as the Federal Reserve may require pursuant to the Bank Holding Company Act. The Federal Reserve may examine a bank holding company or any of its subsidiaries.
Source of Strength Doctrine
Under the Dodd-Frank Act, bank holding companies must be well-capitalized and well-managed to engage in interstate transactions. In the past, only the subsidiary banks were required to meet those standards. The Federal Reserve Board’s “source of strength doctrine” has now been codified, mandating that bank holding companies such as the Company serve as a source of strength for their subsidiary banks, such that the bank holding company must be able to provide financial assistance in the event the subsidiary bank experiences financial distress.
Capital Requirements
Federal banking regulators have adopted a system using risk-based capital guidelines to evaluate the capital adequacy of banks and bank holding companies that is based upon the 1988 capital accord of the Bank for International Settlements’ Basel Committee on Banking Supervision (the “Basel Committee”), a committee of central banks and bank regulators from the major industrialized countries that coordinates international standards for bank regulation. Under the guidelines, specific categories of assets and off-balance-sheet activities such as letters of credit are assigned risk weights, based generally on the perceived credit or other risks associated with the asset. Off-balance-sheet activities are assigned a credit conversion factor based on the perceived likelihood that they will become on-balance-sheet assets. These risk weights are multiplied by corresponding asset balances to determine a “risk weighted” asset base which is then measured against various measures of capital to produce capital ratios.
An organization’s capital is classified in one of two tiers, Core Capital, or Tier 1, and Supplementary Capital, or Tier 2. Tier 1 capital includes common stock, retained earnings, qualifying non-cumulative perpetual preferred stock, minority interests in the equity of consolidated subsidiaries, a limited amount of qualifying trust preferred securities and qualifying cumulative perpetual preferred stock at the holding company level, less goodwill and most intangible assets. Tier 2 capital includes perpetual preferred stock and trust preferred securities not meeting the Tier 1 definition, mandatory convertible debt securities, subordinated debt, and allowances for loan and lease losses. Each category is subject to a number of regulatory definitional and qualifying requirements.
The Basel Committee in 2010 released a set of international recommendations for strengthening the regulation, supervision and risk management of banking organizations, known as Basel III. In July 2013, the Federal Reserve published final rules for the adoption of the Basel III regulatory capital framework (the “Basel III Capital Rules”). The Basel III Capital Rules became effective for us on January 1, 2015, with certain transition provisions phasing in over a period ending on January 1, 2019. The Basel III Capital Rules established a new category of capital measure, Common Equity Tier 1 capital, which includes a limited number of capital instruments from the existing definition of Tier 1 Capital, as well as raised minimum thresholds for Tier 1 Leverage capital (100 basis points), and Tier 1 Risk-based capital (200 basis points).
The Basel III Capital Rules established the following minimum capital ratios: 4.5 percent CET1 to risk-weighted assets; 6.0 percent Tier 1 capital to risk-weighted assets; 8.0 percent total capital to risk-weighted assets; and 4.0 percent Tier 1 leverage ratio to average consolidated assets. In addition, the Basel III Capital Rules also introduced a minimum “capital conservation buffer” equal to 2.5% of an organization’s total risk-weighted assets, which exists in addition to these new required minimum CET1, Tier 1, and total capital ratios. The “capital conservation buffer,” which must consist entirely of CET1, is designed to absorb losses during periods of economic stress. The Basel III Capital Rules provide for a number of deductions from and adjustments to CET1, which include the requirement that mortgage servicing rights, deferred tax assets arising from temporary differences that could not be realized through net operating loss carrybacks and significant investments in non-consolidated financial entities be deducted from CET1 to the extent that any one such category exceeds 10% of CET1 or all such categories in the aggregate exceed 15% of CET1.
The Company and The First elected in 2015 to exclude the effects of accumulated other comprehensive income items included in stockholders’ equity from the determination of regulatory capital under the Basel III Capital Rules. Based on estimated capital ratios using Basel III definitions, the Company and The First currently exceed all capital requirements of the new rule, including the fully phased-in conservation buffer.
Certain regulatory capital ratios of the Company and The First, as of December 31, 2017, are shown in the following table:
| Capital Adequacy Ratios | ||||||||||||||||
| Regulatory | ||||||||||||||||
| Minimums | ||||||||||||||||
| Regulatory | to be Well | The First | ||||||||||||||
| Minimums | Capitalized | Bancshares, Inc. | The First | |||||||||||||
| Common Equity Tier 1 risk-based capital ratio | 4.50 | % | 6.50 | % | 14.2 | % | 14.5 | % | ||||||||
| Tier 1 risk-based capital ratio | 6.00 | % | 8.00 | % | 14.9 | % | 14.5 | % | ||||||||
| Total risk-based capital ratio | 8.00 | % | 10.00 | % | 15.5 | % | 15.1 | % | ||||||||
| Leverage ratio | 4.00 | % | 5.00 | % | 11.7 | % | 11.4 | % | ||||||||
The essential difference between the leverage capital ratio and the risk-based capital ratios is that the latter identify and weight both balance sheet and off-balance sheet risks. Tier 1 capital generally includes common equity, retained earnings, qualifying minority interests (issued by consolidated depository institutions or foreign bank subsidiaries), accounts of consolidated subsidiaries and an amount of qualifying perpetual preferred stock, limited to 50% of Tier 1 capital. In calculating Tier 1 capital, goodwill and other disallowed intangibles and disallowed deferred tax assets and certain other assets are excluded. Tier 2 capital is a secondary component of risk-based capital, consisting primarily of perpetual preferred stock that may not be included as Tier 1 capital, mandatory convertible securities, certain types of subordinated debt and an amount of the allowance for loan losses (limited to 1.25% of risk weighted assets).
The risk-based capital guidelines are designed to make regulatory capital requirements more sensitive to differences in risk profiles among banks and bank holding companies, to take into account off-balance sheet exposure and to minimize disincentives for holding liquid assets. Under the risk-based capital guidelines, assets are assigned to one of four risk categories: 0%, 20%, 50% and 100%. For example, U.S. Treasury securities are assigned to the 0% risk category while most categories of loans are assigned to the 100% risk category. Off-balance sheet exposures such as standby letters of credit are risk-weighted and all or a portion thereof are included in risk-weighted assets based on an assessment of the relative risks that they present. The risk-weighted asset base is equal to the sum of the aggregate dollar values of assets and off-balance sheet items in each risk category, multiplied by the weight assigned to that category.
Prompt Corrective Action and Undercapitalization
The FDICIA established a system of prompt corrective action regulations and policies to resolve the problems of undercapitalized insured depository institutions. Under this system, insured depository institutions are ranked in one of five capital categories as described below. Regulators are required to take mandatory supervisory actions and are authorized to take other discretionary actions of increasing severity with respect to insured depository institutions in the three undercapitalized categories. The five capital categories for insured depository institutions under the prompt corrective action regulations consist of:
The prompt corrective action regulations provide that an institution may be downgraded to the next lower category if its regulator determines, after notice and opportunity for hearing or response, that the institution is in an unsafe or unsound condition or has received and not corrected a less-than-satisfactory rating for any of the categories of asset quality, management, earnings or liquidity in its most recent examination.
Federal bank regulatory agencies are required to implement arrangements for prompt corrective action for institutions failing to meet minimum requirements to be at least adequately capitalized. FDICIA imposes an increasingly stringent array of restrictions, requirements and prohibitions as an organization’s capital levels deteriorate. A bank rated "adequately capitalized" may not accept, renew or roll over brokered deposits. A "significantly undercapitalized" institution is subject to mandated capital raising activities, restrictions on interest rates paid and transactions with affiliates, removal of management and other restrictions. The OCC has only very limited discretion in dealing with a "critically undercapitalized" institution and generally must appoint a receiver or conservator (the FDIC) if the capital deficiency is not corrected promptly.
Under the Federal Deposit Insurance Act (“FDIA”), “critically undercapitalized” banks may not, beginning 60 days after becoming critically undercapitalized, make any payment of principal or interest on their subordinated debt (subject to certain limited exceptions). In addition, under Section 18(i) of the FDIA, banks are required to obtain the advance consent of the FDIC to retire any part of their subordinated notes. Under the FDIA, a bank may not pay interest on its subordinated notes if such interest is required to be paid only out of net profits, or distribute any of its capital assets, while it remains in default on any assessment due to the FDIC.
Federal bank regulators may set capital requirements for a particular banking organization that are higher than the minimum ratios when circumstances warrant. Federal Reserve and OCC guidelines provide that banking organizations experiencing significant growth or making acquisitions will be expected to maintain strong capital positions substantially above the minimum supervisory levels, without significant reliance on intangible assets. Concentration of credit risks, interest rate risk (imbalances in rates, maturities or sensitivities) and risks arising from non-traditional activities, as well as an institution’s ability to manage these risks, are important factors taken into account by regulatory agencies in assessing an organization’s overall capital adequacy.
The OCC and the Federal Reserve also use a leverage ratio as an additional tool to evaluate the capital adequacy of banking organizations. The leverage ratio is a company’s Tier 1 capital divided by its average total consolidated assets. A minimum leverage ratio of 3.0% is required for banks and bank holding companies that either have the highest supervisory rating or have implemented the appropriate federal regulatory authority’s risk-adjusted measure for market risk. All other banks and bank holding companies are required to maintain a minimum leverage ratio of 4.0%, unless a different minimum is specified by an appropriate regulatory authority. In order to be considered well capitalized the leverage ratio must be at least 5.0%.
Our Bank’s leverage ratio was 11.4% at December 31, 2017 and, as a result, it is currently classified as “well capitalized” for purposes of the OCC’s prompt corrective action regulations.
The risk-based and leverage capital ratios established by federal banking regulators are minimum supervisory ratios generally applicable to banking organizations that meet specified criteria, assuming that they otherwise have received the highest regulatory ratings in their most recent examinations. Banking organizations not meeting these criteria are expected to operate with capital positions in excess of the minimum ratios. Regulators can, from time to time, change their policies or interpretations of banking practices to require changes in risk weights assigned to our Bank's assets or changes in the factors considered in order to evaluate capital adequacy, which may require our Bank to obtain additional capital to support existing asset levels or future growth or reduce asset balances in order to meet minimum acceptable capital ratios.
Additional Regulatory Issues
In June 2010, the Federal Reserve, the OCC and the FDIC issued joint guidance on executive compensation designed to help ensure that a banking organization’s incentive compensation policies do not encourage imprudent risk taking and are consistent with the safety and soundness of the organization. In addition, the Dodd-Frank Act required those agencies, along with the SEC, to adopt rules to require reporting of incentive compensation and to prohibit certain compensation arrangements. The objective of the guidance is to assure that incentive compensation arrangements (i) provide incentives that do notthe agencies determine to encourage excessive risk-taking, (ii) are compatible with effective internal controls and risk management and (iii) are supported by strong corporate governance, including oversightinappropriate risks by the board of directors.institution. The banking agencies issued proposed rules in 2011 and previously issued guidance on sound incentive compensation policies. In 2016, the Federal Reserve and the FDICbanking agencies also proposed rules that would, depending upon the assets of the institution, directly regulate incentive compensation arrangements and would require enhanced oversight and recordkeeping. As of December 31, 2017,2023, these rules have not been implemented.
We have undertaken efforts to ensure that our incentive compensation plans do not encourage inappropriate risks, consistent with three key principles-that incentive compensation arrangements should appropriately balance risk and financial rewards, be compatible with effective controls and risk management, and be supported by strong corporate governance.
Capital Adequacy Ratios | |||||||||||||||||||||||||||||
| Regulatory Minimums | Regulatory Minimums to be Well Capitalized | Minimum Capital Required Basel III Fully Phased-In | The First Bancshares, Inc. | The First | |||||||||||||||||||||||||
| Common Equity Tier 1 risk-based capital ratio | 4.5 | % | 6.5 | % | 7.0 | % | 12.1 | % | 13.8 | % | |||||||||||||||||||
| Tier 1 risk-based capital ratio | 6.0 | % | 8.0 | % | 8.5 | % | 12.5 | % | 13.8 | % | |||||||||||||||||||
| Total risk-based capital ratio | 8.0 | % | 10.0 | % | 10.5 | % | 15.0 | % | 14.8 | % | |||||||||||||||||||
| Leverage ratio | 4.0 | % | 5.0 | % | 4.0 | % | 9.7 | % | 10.7 | % | |||||||||||||||||||
Stress Testing
The Dodd-Frank Act requires stress testing of certain bank holding companies and banks that have more than $10 billion but less than $50 billion of consolidated assets (“medium-sized companies”). Additional stress testing is required for banking organizations having $50 billion or more of assets. Becauseregulatory minimums plus the consolidated assets of the Companyapplicable capital conservation buffer.
Company Participation in Legislative and Regulatory Initiatives
The Congress, Treasury Department and the federal banking regulators, including the FDIC, have taken broad action since early September 2008 to address volatility in the U.S. banking system. In October 2008, the Emergency Economic Stabilization Act of 2008 (“EESA”) was enacted. The EESA authorized the Treasury Department to purchase from financialFederal Reserve has indicated that depository institutions and their holding companies upshould generally pay dividends only out of current operating earnings. Further, under Mississippi law, The First must obtain the non-objection of the Commissioner of the Mississippi Department of Banking and Consumer Finance prior to $700 billion in mortgage loans, mortgage-related securities and certain other financial instruments, including debt and equity securities issued by financial institutions and their holding companies in a troubled asset relief program (“TARP”). The purpose of TARP was to restore confidence and stabilitypaying any dividend to the U.S. banking systemCompany.
On February 6, 2009, as partregulation by the Mississippi Department of Banking and Consumer Finance. As a member bank of the CPP, the Company entered into a Letter Agreement and Securities Purchase Agreement (collectively, the “Purchase Agreement”) with the Treasury Department, pursuant to which the Company sold (i) 5,000 shares of the Company’s Fixed Rate Cumulative Perpetual Preferred Stock, Series UST (the “CPP Preferred Stock”) and (ii) a warrant (the “Warrant”) to purchase 54,705 shares of the Company’s Common Stock for an exercise price of $13.71 per share. On September 29, 2010, after successfully obtaining CDFI certification, the Company exited the CPP by refinancing its CPP funding into lower-cost CDCI funding and also accepted additional CDCI funding. In connection with this transaction, the Company retired its CPP Preferred Stock and issued to the Treasury Department 17,123 shares of the Company’s Fixed Rate Cumulative Perpetual Preferred Stock, Series CD (the “CDCI Preferred Stock”). Including refinanced funding and newly obtained funding, the Company’s total CDCI funding was $17,123,000.
The America Reinvestment and Recovery Act of 2009 (“ARRA”) contained expansive new restrictions on executive compensation for financial institutions and other companies participating in the TARP. As long as the Treasury continued to hold equity interests in the Company issued under the TARP, the Company monitored its compensation arrangements, modified such compensation arrangements, agreed to limit and limit its compensation deductions, and took such other actions as were necessary to comply with the standards discussed below. On December 6, 2016, the Company repurchased all 17,123 shares of its CDCI Preferred Shares from Treasury at fair market value. Therefore, as of December 6, 2016, the Company no longer had any obligations under TARP or the ARRA. However, as part of its repurchase obligations with the Treasury, the Company agreed to maintain its CDFI certification status for a period of two years. The eligibility requirements provide that the Company must:
• Have a primary mission of promoting community development;
• Provide both financial and educational services;
• Serve and maintain accountability to one or more defined target markets;
• Maintain accountability to a defined market; and
• Be a legal, non-governmental entity at the time of application (with the exception of Tribal governmental entities)
The First, A National Banking Association
OCC Regulation. The First operates as a national banking association incorporated under the laws of the United States and subject to supervision, inspection and examination by the OCC. The OCC regulates or monitors virtually all areas of The First’s operations, including security devices and procedures, adequacy of capitalization and loan loss reserves, loans, investments, borrowings, deposits, mergers, issuances of securities, payment of dividends, interest rates payable on deposits, interest rates or fees chargeable on loans, establishment of branches, corporate reorganizations, maintenance of books and records, and adequacy of staff training to carry on safe lending and deposit gathering practices. The OCC imposes limitations on The First’s aggregate investment in real estate, bank premises, and furniture and fixtures.Federal Reserve System, The First is required by the OCC to prepare quarterly reports onhold stock in its financial condition anddistrict Federal Reserve Bank in an amount equal to conduct an annual audit6% of its financial affairs in compliancecapital stock and surplus (half paid to acquire stock with minimum standards and procedures prescribed by the OCC.
Safe and Sound Banking Practices; Enforcementremainder held as a cash reserve). Banks and bank holding companies are prohibited from engaging in unsafe and unsound banking practices. Bank regulatorsMember banks do not have broad authority to prohibit and penalize activities of bank holding companies and their subsidiaries which represent unsafe and unsound banking practices or which constitute violations of laws, regulations or written directives of or agreements with regulators. Regulators have considerable discretion in identifying what they deem to be unsafe and unsound practices and in pursuing enforcement actions in response to them.
Under FDICIA, all insured institutions must undergo regular on-site examinations by their appropriate banking agency. The cost of examinations of insured depository institutions and any affiliates may be assessed by the appropriate agency against each institution or affiliate as it deems necessary or appropriate. Insured institutions are required to submit annual reports to the FDIC and the appropriate agency. FDICIA also directs the FDIC to develop with other appropriate agencies a method for insured depository institutions to provide supplemental disclosure of the estimated fair market value of assets and liabilities, to the extent feasible and practicable, in any balance sheet, financial statement, report of condition, or any other report of any insured depository institution. FDICIA also requires the federal banking regulatory agencies to prescribe, by regulation, standards for all insured depository institutions and depository institution holding companies relating, among other things, to: (i) internal controls, information systems, and audit systems; (ii) loan documentation; (iii) credit underwriting; (iv) interest rate risk exposure; and (v) asset quality.
National banks and their holding companies which have been chartered or registered or undergone a change in control within the past two years or which have been deemed by the OCC orover the Federal Reserve Board, respectively, toSystem as a result of owning the stock and the stock cannot be troubled institutions must give the OCCsold or the Federal Reserve Board, respectively, thirty days prior noticetraded.
Deposit Insurance.The FDIC establishes rates for the payment of premiums by federally insured banks and thrifts for deposit insurance. Deposits in The First are insured by the FDIC up to a maximum amount (generally $250,000 per depositor, subject to aggregation rules). The DIF is maintained by the FDIC for commercial banksapplicable limits, and, thrifts and funded with insurance premiums from the industry that are used to offset losses from insurance payouts when banks and thrifts fail. Since 1993, insured depository institutions like The First have paid for deposit insurance under a risk-based premium system. Assessments are calculated based on the depository institution’s average consolidated total assets, less its average amount of tangible equity.
Transactions With Affiliates and Insiders.The First is subject to Section 23A of the Federal Reserve Act, which places limits on the amount of loans to, and certain other transactions with, affiliates, as well as on the amount of advances to third parties collateralized by the securities or obligations of affiliates. The aggregate of all covered transactions is limited in amount, as to any one affiliate, to 10% of The First's capital and surplus and, as to all affiliates combined, to 20% of The First's capital and surplus. Furthermore, within the foregoing limitations as to amount, each covered transaction must meet specified collateral requirements.
accordingly, The First is also subject to Section 23Bcertain FDIC regulations and the FDIC has backup examination authority and some enforcement powers over The First.
Change in ControlWith certain limited exceptions, the BHCAspecified amounts. In addition, any transaction between The First and the Change in Bank Control Act, together with regulations promulgated thereunder, prohibit a personCompany or company or a group of persons deemedany affiliate are required to be “acting in concert” from, directly or indirectly, acquiring more than 10% (5% if the acquirer is a bank holding company) of any class of our voting stock or obtaining the ability to control in any manner the election of a majority of our directors or otherwise direct the management or policies of our company without prior notice or application to and the approval of the Federal Reserve.
Dividends.The principal source of funds from which we pay cash dividends are the dividends received from our bank subsidiary, The First. Federal banking laws also place similar restrictions on certain extensions of credit by insured banks, such as The First, to their directors, executive officers and regulations restrictprincipal shareholders.
Interstate Branching and Acquisitions.National banks are required by the National Bank Act to adhere to branch office banking laws applicable to state banks in the states in which they are located. Formerly, under the Riegle-Neal Interstate Banking and Branching Efficiency Act of 1994, a bank’s ability to branch into a particular state was largely dependent upon whether the state “opted in” to de novo interstate branching. Under the Dodd-Frank Act, de novo interstate branching by national banks is permitted if, under the laws of the state where the branch is to be located, a state bank chartered in that state would be permitted to establish a branch. Further, a bank headquartered in one state is authorized to merge with a bank headquartered in another state, as long as neither of the states have opted out of such interstate merger authority, and subject to any state requirement that the target bank shall have been in existence and operating for a minimum period of time, not to exceed five years and certain deposit market-share limitations. Under current Mississippi, Alabama, Louisiana and Florida law, The First may open branches or acquire existing banking operations throughout these states with the prior approval of the OCC. The Dodd-Frank Act permits out of state acquisitions by bank holding companies (subject to veto by new state law), interstate branching by banks if allowed by state law, interstate merging by banks, and de novo branching by national banks if allowed by state law. All branching in which The First may engage remains subject to regulatory approval and adherence to applicable legal and regulatory requirements.
Community Reinvestment Act.The Community Reinvestment Act (the “CRA”) requires depository institutions to assist in meeting the credit needs of their market areas consistent with safe and sound banking practice. Under the Community Reinvestment Act, each depository institution is required to help meet the credit needs of its market areas by, among other things, providing credit to low- and moderate-income individuals and communities. Depository institutions are periodically examined for compliance with the CRA and are assigned ratings. In order for a financial holding company to commence new activity permitted by the BHCA, each insured depository institution, subsidiarythe claims of depositors of the financialinstitution, including the claims of the FDIC as subrogee of insured depositors, and certain claims for administrative expenses of the FDIC as a receiver, will have priority over other general unsecured claims against the institution, including those of the parent bank holding company mustcompany.
USA Patriot Act. In 2001,soundness compliance plans.
Office of Foreign Assets Control.
them on the condition that (1) the customer obtain or provide some additional credit, property, or services from or to the bank or bank holding company or their subsidiaries or (2) the customer not obtain some other credit, property, or services from a competitor, except to the extent reasonable conditions are imposed to assure the soundness of the credit extended. A bank may, however, offer combined-balance products and may otherwise offer more favorable terms if a customer obtains two or more traditional bank products. The law also expressly permits banks to engage in other forms
Other Regulatory Matters
Risk-retention rules. Under the final risk-retention rules, banks that sponsor the securitization of asset-backed securities and residential-mortgage backed securities are required to retain 5% of any loan they sell or securitize, except for mortgages that meet low-risk standards to be developed by regulators.
Changes to federal preemption. The Dodd-Frank Act created a new independent supervisory body, the Consumer Financial Protection Bureau (the “CFPB”) that is housed within the Federal Reserve. The CFPB is the primary regulator for federal consumer financial statutes. State attorneys general are authorized to enforce new regulations issued by the CFPB. Although the application of most state consumer financial laws to The First will continue to be preempted under the National Bank Act, OCC determinations of such preemption are made on a case-by-case basis. As a result, it is possible that state consumer financial laws enacted in the future may be held to apply to our business activities. The cost of complying with any such additional laws could have a negative impact on our financial results.
Mortgage Rules. During 2013, the CFPB finalized a series of rules related to the extension of residential mortgage loans by banks. Among these rules are requirements that a bank make a good faith determination that a borrower has the ability to repay a mortgage loan prior to extending such credit, a requirement that certain mortgage loans provide for escrow payments, new appraisal requirements, and specific rules regarding how loan originators may be compensated and the servicing of residential mortgage loans. The implementation of these new rules began in January 2014.
Volcker Rule. In December 2013, the Federal Reserve, the FDIC, the OCC, the Commission, and the Commodity Futures Trading Commission issued the “Prohibitions And Restrictions On Proprietary Trading And Certain Interests In, And Relationships With, Hedge Funds And Private Equity Funds,” commonly referred to as the Volcker Rule, which regulates and restricts investments which may be made by banks. The Volcker Rule was adopted to implement a portion of the Dodd-Frank Act and new Section 13 of the Bank Holding Company Act, which prohibits any banking entity from engaging in proprietary trading or from acquiring or retaining an ownership interest in, or sponsoring or having certain relationships with, a hedge fund or private equity fund (“covered funds”), subject to certain exemptions.
Debit Interchange Fees
Interchange fees, or “swipe” fees, are fees that merchants pay to credit card companies and card-issuing banks such as The First for processing electronic payment transactions on their behalf. The maximum permissible interchange fee that an issuer may receive for an electronic debit transaction is the sum of 21 cents per transaction and 5 basis points multiplied by the value of the transaction, subject to an upward adjustment of 1 cent if an issuer certifies that it has implemented policies and procedures reasonably designed to achieve the fraud-prevention standards set forth by the Federal Reserve.
In addition, the legislation prohibits card issuers and networks from entering into exclusive arrangements requiring that debit card transactions be processed on a single network or only two affiliated networks, and allows merchants to determine transaction routing. Due to the Company’s size, the Federal Reserve rule limiting debit interchange fees has not reduced our debit card interchange revenues.
Summary
The foregoing is a brief summary of certain statutes, rules and regulations affecting the Company and The First. It is not intended to be an exhaustive discussion of all statutes and regulations having an impact on the operations of such entities.
Increased regulation generally has resulted in increased legal and compliance expense.
Finally, additional bills may be introduced in the future in the U.S. Congress and state legislatures to alter the structure, regulation and competitive relationships of financial institutions. It cannot be predicted whether and in what form any of these proposals will be adopted or the extent to which the business of the Company and The First may be affected thereby.
Effect of Governmental Monetary and Fiscal Policies
Making or continuing an investment in securities, including
Risk Factors Associated Withwith Our Business
financial results or liquidity.
Additionally, adverse
operations.
On January 1, 2021, the Company adopted Accounting Standards Update ("ASU") 2016-13, Financial Instruments - Credit Losses ("ASC 326"). The First makes various assumptionsFinancial Accounting Standards Board (the “FASB”) issued ASC 326 to replace the incurred loss model for loans and judgments aboutother financial assets with an expected loss model and requires consideration of a wider range of reasonable and supportable information to determine credit losses. In accordance with ASC 326, the collectability ofCompany has developed an allowance for credit losses (“ACL”) methodology effective January 1, 2021, which replaces its loan portfolio based on a number of factors. We maintain anprevious allowance for loan losses whichmethodology. The ACL is a reserve established throughvaluation account that is deducted from loans’ amortized cost basis to present the net amount expected to be collected on the loans. Loans are charged-off against the allowance when management believes the uncollectibility of a loan balance is confirmed. Expected recoveries do not exceed the aggregate of amounts previously charged-off and expected to be charged-off.
operations.
At present the Company’s one-year interest rate sensitivity position is asset sensitive. As with most financial institutions, the Company’s results of operations are affected by changes in interest rates and the Company’s ability to manage this risk. The difference between interest rates charged on interest-earning assets and interest rates paid on interest-bearing liabilities may be affected by changes in market interest rates, changes in relationships between interest rate indices, and/or changes in the relationships between long-term and short-term market interest rates. A change in this difference might result in an increase in interest expense relative to interest income, or a decrease in the Company’s interest rate spread.
Certain changes in interest rates, inflation, or the financial markets could affect demand for our products and our ability to deliver products efficiently.
Loan originations, and therefore loan revenues, could be adversely impacted by rising interest rates.Increases in market interest rates can have negative impacts on our business, including reducing our customers' desire to borrow money from us or adversely affecting their ability to repay their outstanding loans by increasing their debt service obligations through the periodic reset of adjustable interest rate loans. If our borrowers’ ability to repay their loans is impaired by increasing interest payment obligations, our level of non-performing assets would increase, producing an adverse effect on operating results. Asset values, especially commercial real estate as collateral, securities or other fixed rate earning assets, can decline significantly with relatively minor changes in interest rates.Conversely, falling rates could increase prepayments within our loan and securities portfolio lowering interest earnings from those assets. An unanticipated increase in inflation could cause operating costs related to salaries and benefits, technology, and supplies to increase at a faster pace than revenues.
Additionally, our management considers a wide range of factors about the security issuer and uses its reasonable judgment in evaluating the cause of the decline in the estimated fair value of the security and in assessing the prospects for recovery. Inherent in management’s evaluation of the security are assumptions and estimates about the operations of the issuer and its future earnings potential. Impairments to the carrying value of our investment securities may need to be taken in the future, which wouldcould have a material adverse effect on our results of operations and financial condition.
The full impact
Increased economic activity expected to result from the decrease in tax rates on businesses generally could spur additional economic activity that would encourage additional borrowing. At the same time, some customers may elect to use their additional cash flow from lower taxes to fund their existing levels of activity, decreasing borrowing needs. The eliminationimplementation of the federalInflation Reduction Act of 2022 ("IRA"), could significantly impact our business in the form of greater than expected income tax deductibility of business interest expense for a significant numberand taxes payable. Such changes may also negatively impact the financial condition of our customers effectively increasesand/or overall economic conditions. Further, future regulatory reforms that could include a heightened focus and scrutiny on BSA/AML related compliance, expansion of consumer protections, the costregulation of borrowingloan portfolios and makes equitycredit concentrations to borrows impacted by climate changes, increased capital and liquidity requirements and limitations or hybrid funding relatively more attractive. Thisadditional taxes on share repurchases and dividends, could increase our costs and impact our business.
We may be required to pay additional insurance premiums to the FDIC, which could negatively impact earnings.
Pursuant to the Dodd-Frank Act, the limit on FDIC coverage has been permanently increased to $250,000, causing the premiums assessed to
In addition, as the regulatory environment related to information security, data collection and use, and privacy becomes increasingly rigorous, with new and constantly changing requirements applicable to our business, compliance with those requirements could also result in additional costs.
We must maintain effective internal control over financial reporting.
Management regularly monitors, reviews and updates our disclosure controls and procedures, including our internal control over financial reporting. Any system of controls, however well designed and operated, is based in part on certain assumptions and can provide only reasonable, assurances that the controls will be effective. Any failure or circumvention of our controls and procedures or failure to comply with regulations related to controls and procedures could have a material adverse effect on our business, results of operations and financial condition.
Failure to achieve and maintain an effective internal control environment could prevent us from accurately reporting our financial results, preventing or detecting fraud, or providing timely and reliable financial information pursuant to our reporting obligations, which could have a material adverse effect on our business, financial condition, and results of operations.
Our business is susceptible to fraud.
We may fail to realize the anticipated cost savings and other financial benefits of recent acquisitions in the First Community Bank Acquisition and Sunshine Community Banktimeframe we expect, or at all.
The First, First Community Bank, and Sunshine Community Bank have historically operated independently. The successacquisition of the mergers of First Community Bank and Sunshine Community Bank into The First will depend, in part,HSBI on our ability to successfully combine the businesses of The First, First Community Bank, and Sunshine Community Bank. To realize these anticipated benefits, The First expects to integrate First Community Bank’s and Sunshine Community Bank’s businesses with its own businesses. We may face significant challenges in integrating both First Community Bank’s and Sunshine Community Bank’s operations into our operations in a timely and efficient manner and in retaining key personnel from these two banks.January 1, 2023. Achieving the anticipated cost savings and financial benefits of the mergers will depend, in part, on whether we can successfully integrate these businesses.businesses with and into the business of The First. It is possible that the integration process could result in the loss of key employees, the disruption of each company’s ongoing businesses or inconsistencies in standards, controls, procedures, and policies that adversely affect our ability to maintain relationships with clients, customers, depositors, and employees or to achieve the anticipated benefits of the merger.mergers. In addition, the integration of certain operations following the mergers has required and will continue to require the dedication of significant management resources, which may temporarily distract management’s attention from the day-to-day business of the combined company. Any inability to realize the full extent of, or any of, the anticipated cost savings and financial benefits of the mergers, as well as any delays encountered in the integration process, could have an adverse effect on the business and results of operations of the combined company.
In addition, Sunshine’s shareholders must approve the transaction before the acquisition of Sunshine Community Bank can be completed, and such shareholder approval may not be received. Failure to complete the acquisition could
We willcontinue to incur significant transaction and merger-related costs in connection with the acquisition of Southwest and First Community Bank and the pending acquisition of Sunshine and Sunshine Community Bank.
our recent acquisitions.
the price of our common stock. You may not receive dividends on our common stock. more information. “FBMS.” the Board of Directors and applicable regulatory requirements, the Company expects to continue its policy of paying regular cash dividends on a quarterly basis. A discussion of certain limitations on the ability of The this report. Period Total Average Total Number of Maximum May Yet Be Purchased The following provides a narrative discussion and analysis of The First Bancshares’ financial condition as of December 31, 2023 and 2022 and results of operations for the years ended December 31, discussed more fully under Part II - Item 8. Financial Statements and Supplementary Data - Note B - Summary of Significant Accounting Policies and Note C Business Combinations of this report. Goodwill is discussed more fully under Part II - Item 8. Financial Statements and Supplementary Data - Note B - Summary of Significant Accounting Policies of this report. 2022 to $75.5 million for the same period ended December 31, 2023. compared to 2021. non-interest expense. Consolidated net interest income was approximately 2021. Income/ Expenses Yield/ Rate Average Balance Income/ Expenses Yield/ Rate Average Balance Income/ Expenses Yield/ Rate 2017 versus 2016 Increase (decrease) due to 2016 versus 2015 Increase (decrease) due to Within Three Months After Three Through Twelve Months Within One Year Greater Than One Year or Nonsensitive Within Three Months After Three Through Twelve Months Within One Year Greater Than One Year or Nonsensitive Within Three Months After Three Through Twelve Months Within One Year Greater Than One Year or Nonsensitive The following tables depict, for the periods indicated, certain information related to interest rate sensitivity in net interest income and market value of Net Interest Income at Risk Market Value of Equity Change in Interest % Change Bank Policy Limit % Change from Base Bank Policy Limit Net Interest Income at Risk Market Value of Equity % Change Policy Limit % Change from Base Policy Limit Net Interest Income at Risk Market Value of Equity % Change Policy Limit % Change from Base Policy Limit equity: individually assessed loans. Loans are charged-off against the allowance when management believes the uncollectibility of a loan balance is confirmed. Expected recoveries do not exceed the aggregate of amounts previously charged-off and expected to be charged-off. The greater past due and still accruing interest. At December 31, credit marks in the Cadence Bank Branches loans acquired for the year ended December 31, 2022. 2022. indicated. expected income tax to be paid to taxing authorities. The Company also recognizes deferred tax for future income/deductible amounts resulting from differences in the financial statement and tax bases of assets and liabilities. this report. In the context of this discussion, a "real estate mortgage loan" is defined as any loan, other than loans for construction purposes, secured by real estate, regardless of the purpose of the loan. The Company follows the common practice of financial institutions in the Company’s market area of obtaining a security interest in real estate whenever possible, in addition to any other available collateral. This collateral is taken to reinforce the likelihood of the ultimate repayment of the loan and tends to increase the magnitude of the real estate loan portfolio component. Generally, the Company limits its loan-to-value ratio to 80%. Management attempts to maintain a conservative philosophy regarding its underwriting guidelines and believes it will reduce the risk elements of its loan portfolio through strategies that diversify the lending mix. 2023. Investment Securities. The investment securities portfolio is a significant component of the Expected maturities may differ from contractual maturities because issuers may have the right to call or prepay obligations. total deposits was 1.57% and 1.09% during 2023 compared to 0.37% and 0.26% in 2022. Average cost of interest bearing deposits increased 120 basis points to 1.57% at December 31, 2023 compared to 0.37% during the same time period in 2022. Average cost of total deposits increased 83 basis points to 1.09% at December 31, 2023 compared to 0.26% during the same time period in 2022. The higher average market interest rates. Average cost of interest-bearing deposits and total deposits remained unchanged at December 31, 2022 compared to 2021. The Company's brokered deposits were 1.8% of deposits at December 31, 2023. are set to mature one year from their issuance date. to be three-month term SOFR plus 3.39% plus a tenor spread adjustment of 0.026161%), payable quarterly in arrears. As provided in the Notes due 2033, under specified conditions the interest rate on the Notes due 2033 during the applicable floating rate period may be determined based on a rate other than Three-Month Term SOFR. The Company is entitled to redeem the Notes due 2033, in whole or in part, on any interest payment date on or after May 1, 2028, and to redeem the Notes due 2033 at any time in whole upon certain other specified events. 2021. The prompt corrective action rules have been modified to include the common equity Tier 1 capital ratio and to increase the Tier 1 capital ratio requirements for the various thresholds. For example, the requirements for the Company to be considered well-capitalized under the rules include a 5.0% leverage ratio, a 6.5% common equity Tier Under this guidance banking institutions with a CETI, Tier 1 Capital Ratio and Total Risk Based Capital above the minimum regulatory adequate capital ratios but below the capital conservation buffer will face constraints on their ability to pay dividends, repurchase equity and pay discretionary bonuses to executive officers, based on the amount of the shortfall. Capital Resources The As of December 31, 2023, the target federal funds rate was 5.25% to 5.50%. To identify areas of potential exposure to interest rate changes, we utilize commercially available modeling software to perform earnings simulations and calculate the Company’s market value of portfolio equity under varying interest rate scenarios every month. The model imports relevant information for the Company’s financial instruments and incorporates The economic value (or “fair value”) of financial instruments on the Company’s balance sheet will also vary under the interest rate scenarios previously discussed. The difference between the projected fair value of the Company’s financial assets and the fair value of its financial liabilities is referred to as the economic value of equity (“EVE”), and changes in EVE under different interest rate scenarios are effectively a gauge of the Company’s longer-term exposure to interest rate risk. Fair values for financial instruments are estimated by discounting projected cash flows (principal and interest) at projected replacement interest rates for each account type, while the fair value of non-financial accounts is assumed to equal their book value for all rate scenarios. An economic value simulation is a static measure utilizing balance sheet accounts at a given point in time, and the measurement can change substantially over time as the characteristics of the Company’s balance sheet evolve and interest rate and yield curve assumptions are updated. Audit Committee 2022 2021 (LOSS) 2021 Common Stock Preferred Stock Stock Warrants Additional Paid-in Capital Retained Earnings Accum- ulated Other Compre- hensive Income (Loss) Treasury Stock CASH FLOWS Common Stock Preferred Stock Stock Warrants Additional Paid-in Capital Retained Earnings Accum- ulated Other Compre- hensive Income (Loss) Treasury Stock CASH FLOWS Common Stock Preferred Stock Stock Warrants Additional Paid-in Capital Retained Earnings Accum- ulated Other Compre- hensive Income (Loss) Treasury Stock 2023, 2022 AND 2021 NOTES TO CONSOLIDATED FINANCIAL STATEMENTS Federal Reserve System through the Federal Reserve Bank of Atlanta. The charter conversion and name change are expected to have only a minimal impact on the Bank’s clients, and deposits will continue to be insured by the Federal Deposit Insurance Corporation up to the applicable limits. eliminated in consolidation. AFS securities are placed on nonaccrual status at the time any principal to interest payments become 90 days delinquent or if full collection of interest or principal becomes uncertain. Accrued interest for a security placed on nonaccrual is reversed against interest income. There was no accrued interest related to AFS securities reversed against interest income for the years ended December 31, 2023, 2022, and 2021. Gain and losses on the sales are determined using the adjusted cost of the specific security sold. HTM securities are placed on nonaccrual status at the time any principal to interest payments become 90 days delinquent or if full collection of interest or principal becomes uncertain. Accrued interest for a security placed on nonaccrual is reversed against interest income. There was no accrued interest related to HTM securities reversed against interest income for the years ended December 31, 2023, 2022, and 2021. Sale (LHFS) Premises and equipment are stated at cost, less accumulated depreciation. The depreciation policy is to provide for depreciation over the estimated useful lives of the assets using the straight-line method. Repairs and maintenance expenditures are charged to operating expenses; major expenditures for renewals and betterments are capitalized and depreciated over their estimated useful lives. Upon retirement, sale, or other disposition of property and equipment, the cost and accumulated depreciation are eliminated from the accounts, and any gains or losses are included in operations. Building and related components are depreciated using the straight-line method with useful lives ranging from 10 to 39 years. Furniture, fixtures, and equipment are depreciated using the straight-line (or accelerated) method with useful lives ranging from 3 to 10 years. existence of events or circumstances leads to a determination that is more likely than not the fair value is less than the carrying amount, including goodwill. If, based on the evaluation, it is determined to be more likely than not that the fair value is less than the carrying value, then goodwill is tested further for impairment. The goodwill impairment loss, if any, is measured as the amount by which the carrying amount of the reporting unit, including goodwill, exceeds its fair value. Subsequent increases in goodwill value are not recognized in the consolidated financial statements. The Commercial/Retail Bank segment of the Company is the only reporting unit for Gross Carrying Amount Accumulated Amortization Net Carrying Amount Gross Carrying Amount Accumulated Amortization Net Carrying Amount 2022: purchased and repurchase agreements. There were no anti-dilutive common stock equivalents excluded in the calculations. Net Income (Numerator) Shares (Denominator) Per Share Amount Net Income (Numerator) Shares (Denominator) Per Share Amount Net Income (Numerator) Shares (Denominator) Per Share Amount stockholders. 2021. Company's consolidated financial statements. consolidated financial statements. Company's consolidated financial statements. Non-PCD loans are acquired that have experienced no or insignificant deterioration in credit quality since origination. The difference between the fair value and outstanding balance of the non-PCD loans is recognized as an adjustment to interest income over the lives of the loan. Florida panhandle. stock. The Company on credit marks from the loans acquired from Beach Bank. Amortized Cost Gross Unrealized Gains Gross Unrealized Losses Estimated Fair Value Amortized Cost Gross Unrealized Gains Gross Unrealized Losses Estimated Fair Value Amortized Cost Gross Unrealized Gains Gross Unrealized Losses Estimated Fair Value Amortized Cost Estimated Fair Value Amortized Cost Estimated Fair Value Fair Value Gross Unrealized Losses Fair Value Gross Unrealized Losses Fair Value Gross Unrealized Losses Fair Value Gross Unrealized Losses Fair Value Gross Unrealized Losses Fair Value Gross Unrealized Losses 2022. The Percent of Total Percent of Total 2022, respectively. % of loans to total loans Current The following tables Past Due Days Past Due 90 Days or deemed to possess average to superior credit quality, requiring no more than normal attention. (In thousands) December 31, 2017 Real Estate Commercial follows: lease payments over the lease term. In 2023, the Bank had available $147.3 million to pay dividends. Amount Amount Amount in 2026. The Company expects to fully utilize the net operating losses. 2019. 2021. 2021. Upon the acquisition of Iberville Bank, Southwest Banc Shares, Inc., FMB Banking Corporation, and SWG, the Bank assumed deferred compensation agreements with directors and employees. At December 31, 2023. such options. These options had a weighted average exercise price of $29.23 and were fully vested upon acquisition. DEBT 649,607 at December 31, 2021. Commitments to extend credit and letters of credit include some exposure to credit loss in the event of nonperformance of the customer. Commitments to extend credit are agreements to lend to a customer as long as there is no violation of any condition established in the contract. Standby letters of credit are conditional commitments issued by the Bank to guarantee the performance of a customer to a third party. The credit policies and procedures for such commitments are the same as those used for lending activities. Because these instruments have fixed maturity dates and because a number expire without being drawn upon, they generally do not present any significant liquidity risk. No significant losses on commitments were incurred during the Loans securities and Level 3 for accrued interest receivable related to loans. Level 2 classification. follows: RELATED TRANSACTIONS AND DIRECTOR INDEPENDENCE Financial Statement Schedules: /s/ Valencia M. WilliamsonWithcompletion of the acquisitions of First Community Bank and Sunshine Community Bank, the market price ofperiod in which such impairment is determined to exist. Any such charge could have a material adverse effect on our common stock may be affected by factors different from those historically affecting our independent operations through The First.The historic businesses of each of The First, First Community Bank, and Sunshine Community Bank differ in important respects, and accordingly, the results of operationsoperations.·actual or anticipated quarterly fluctuations in our operating results, financial condition or asset quality; ·changes in financial estimates or the publication of research reports and recommendations by financial analysts or actions taken by rating agencies with respect to us or other financial institutions; ·failure to declare dividends on our common stock from time to time; ·failure to meet analysts’ revenue or earnings estimates; ·failure to integrate acquisitions or realize anticipated benefits from acquisitions; ·strategic actions by us or our competitors, such as acquisitions, restructurings, dispositions or financings; ·fluctuations in the stock price and operating results of our competitors or other companies that investors deem comparable to us; ·future sales of our common stock or other securities;·proposed or final regulatory changes or developments; ·anticipated or pending regulatory investigations, proceedings, or litigation that may involve or affect us; ·reports in the press or investment community generally relating to our reputation or the financial services industry; ·domestic and international economic and political factors unrelated to our performance; ·general market conditions and, in particular, developments related to market conditions for the financial services industry; 23·adverse weather conditions, including floods, tornadoes and hurricanes; and ·geopolitical conditions such as acts or threats of terrorism or military conflicts.Deposit Insurance Fund,DIF, or any other governmental agency or instrumentality, or any private insurer, and are subject to investment risk, including the possible loss of principal.share value.24loans a bank may make to its parent company. Under certain conditions, dividends paid to us bypay from The First are subject to approval by the OCC. A national bank may not pay dividends from its capital. All dividends must be paid out of undivided profits then on hand, after deducting expenses, including reservesFirst. See “Item 1. Business – Regulation and Supervision” included herein for losses and bad debts. In addition, a national bank is prohibited from declaring a dividend on its shares of common stock until its surplus equals its stated capital, unless the bank has transferred to surplus no less than one-tenth of its net profits of the preceding two consecutive half-year periods (in the case of an annual dividend). The approval of the OCC is required if the total of all dividends declared by a national bank in any calendar year exceeds the total of its net profits for that year combined with its retained net profits for the preceding two years, less any required transfers to surplus. In addition, under The Federal Deposit Insurance Corporation Improvement Act of 1991, the banks may not pay a dividend if, after paying the dividend, the bank would be undercapitalized.ITEM 1B.UNRESOLVED STAFF COMMENTScompany’sBoard of Directors’ Role in Oversight of Cybersecurity ThreatsHwyHighway 98 West in Hattiesburg, Mississippi. As of year-end, we had 43110 full service banking and financial servicesservice offices, and one motor bank facility as well as fourand five loan production offices. We lease the Hardy Court Branch, the Gulfport Downtown Branch, the Pascagoula Branch, the Ocean Springs Branch, the Fairhope Branch, the Bayley’s Corner Branch, the Theodore Branch, the Dauphin Island Branch, the Baton Rouge Branch,offices across Mississippi, Alabama, Florida, Georgia and the Pensacola Downtown Branch, which comprise ten of our full services banking and financial services offices. We also lease the Brandon, the Madison, the Ocean Springs and the Slidell loan production offices.Louisiana. Management ensures that all properties, whether owned or leased, are maintained in suitable condition.ITEM 4.MINE SAFETY DISCLOSURES25ITEM 5.MARKET FOR REGISTRANT’S COMMON EQUITY, RELATED STOCKHOLDER MATTERS AND ISSUER PURCHASES OF EQUITY SECURITIESOurtradesare traded on the Nasdaq Global Marketglobal market under the ticker symbol “FBMS”. The following table sets forth the high and low sales price of the Company’s common stock as reported on the NASDAQ Global Market. These prices do not reflect retail mark-ups, mark-downs or commissions. Cash High Low Dividends Sale Sale Paid 2017 4th quarter $ 34.35 $ 29.95 $ 0.0375 3rd quarter 30.35 26.35 0.0375 2nd quarter 28.65 27.225 0.0375 1st quarter 30.60 27.125 0.0375 2016 4th quarter $ 28.50 $ 17.10 $ 0.0375 3rd quarter 19.55 16.99 0.0375 2nd quarter 17.72 15.50 0.0375 1st quarter 18.50 15.32 0.0375 1,9614,618 record holders of the Company’s common stock at March 13, 2018February 21, 2024 and 12,339,49231,227,881 shares outstanding.PaymentDividendsprincipal sourcesFirsts to pay dividends to the Company and the ability of funds to the Company to pay dividends are the dividends received from The First, National Banking Association, Hattiesburg, Mississippi. Consequently, dividends are dependent upon The First’s earnings, capital needs, regulatory policies, as well as statutoryon its common stock is set forth in Part 1 – Item 1. Business – Supervision and regulatory limitations. Federal and state banking laws and regulations restrict the amountRegulation of dividends and loans a bank may make to its parent company. Approval by the Company’s regulators is required if the total of all dividends declared in any calendar year exceed the total of its net income for that year combined with its retained net income of the preceding two years.periodquarter ended December 31, 2017.2023.Period Total
Number of
Shares
PurchasedAverage
Price Paid
Per ShareTotal Number of
Shares Purchased as
Part of Publicly
Announced Plans or
ProgramsMaximum Number of
Shares that May Yet
Be Purchased Under
the Plans or Programs (in thousands) (a)October — $ — — $ 50,000 November — — — 50,000 December 856 26.91 — 50,000 Total 856 (b) $ 26.91 — Current Program
Number of
Shares
Purchased
Price Paid
Per Share
Shares Purchased
as Part of Publicly
Announced Plans or
Programs
Number of
Shares that
Under the
Plans or
Programs 1st Quarter 2017 10,403 $ 27.65 - - 2nd Quarter 2017 1,464 28.65 - - 3rd Quarter 2017 - - - - 4th Quarter 2017 - - - - Total 11,867 (a) $ 28.15 - - (a)Represents shares withheld by the Company in order to satisfy employee tax obligations for vesting of restricted stock awards.
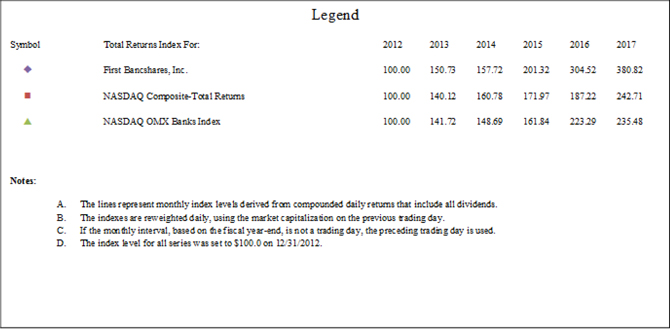
(a)On February 28, 2023, the Company announced that its Board of Directors authorized a new share repurchase program (the "2023 Repurchase Program"), pursuant to which the Company may purchase up to an aggregate of $50.0 million in shares of the Company's issued and outstanding common stock. The 2023 Repurchase Program expired on December 31, 2023.2620112018 and the reinvestment of dividends thereafter, to that of the common stocks of United States companies reported in the Nasdaq Composite-Total Returns Index and the common stocks of the Nasdaq OMX Banks Index. The Nasdaq OMX Banks Index contains securities of Nasdaq- listedNasdaq-listed companies classified according to the Industry Classification Benchmark as Banks.banks. They include banks pro-vidingproviding a broad range of financial services, including retail banking, loans and money transmissions.
27
Legend Symbol Total Returns Index For: 2018 2019 2020 2021 2022 2023 
First Bancshares, Inc. 100.00 118.55 104.82 133.07 112.80 106.66 
NASDAQ Composite-Total Returns 100.00 136.69 198.10 242.03 163.28 236.17 
NASDAQ OMX Banks Index 100.00 124.38 115.04 164.41 137.65 132.91 Notes: A. The lines represent monthly index levels derived from compounded daily returns that include all dividends. B. The indexes are reweighted daily, using the market capitalization on the previous trading day. C. If the monthly interval, based on the fiscal year-end, is not a trading day, the preceding trading day is used. D. The index level for all series was set to $100.00 on 12/31/2018. HIGHLIGHTS(Dollars In Thousands, Except Per Share Data) December 31, 2017 2016 2015 2014 2013 Earnings: Net interest income $ 59,160 $ 40,289 $ 36,994 $ 33,398 $ 28,401 Provision for loan Losses 506 625 410 1,418 1,076 Non-interest income 14,363 11,247 7,588 7,803 7,083 Non-interest expense 55,446 36,862 32,161 30,734 28,165 Net income 10,616 10,119 8,799 6,614 4,639 Net income applicable to common Stockholders 10,616 9,666 8,456 6,251 4,215 Per common share data: Basic net income per Share $ 1.12 $ 1.78 $ 1.57 $ 1.20 $ .98 Diluted net income per Share 1.11 1.57 1.55 1.19 .96 Per share data: Basic net income per share $ 1.12 $ 1.86 $ 1.64 $ 1.27 $ 1.07 Diluted net income per share 1.11 1.64 1.62 1.25 1.06 Selected Year End Balances: Total assets $ 1,813,238 $ 1,277,367 $ 1,145,131 $ 1,093,768 $ 940,890 Securities 372,862 255,799 254,959 270,174 258,023 Loans, net of allowance 1,221,808 865,424 769,742 700,540 577,574 Deposits 1,470,565 1,039,191 916,695 892,775 779,971 Stockholders’ equity 222,468 154,527 103,436 96,216 85,108
CONDITION AND RESULTS OF OPERATIONS28ITEM7.MANAGEMENT’S DISCUSSION AND ANALYSIS OF FINANCIAL CONDITION AND RESULTS OF OPERATIONS2017, 2016,2023, 2022, and 2015.2021. This discussion should be read in conjunction with the consolidated financial statements and the supplemental financial data included in Part II. Item 8.-Financial8. Financial Statements and Supplementary Data – included elsewhere in this report.In the preparationthe Company'sFinancial Condition and Results of Operations is based on our consolidated financial statements, certain significantwhich have been prepared in accordance with U.S. generally accepted accounting principles. The preparation of these financial statements requires us to make estimates and judgements that affect the reported amounts are based upon judgmentof assets, liabilities, revenues and expenses. While we base estimates on historical experience, current information and other factors deemed to be relevant, actual results could differ from those estimates. Accounting policies considered critical to our financial results include the allowance for credit losses and related provision, business combinations and goodwill. The most critical of these is the accounting policy related to the allowance for loancredit losses.Companies are required Effective January 1, 2021, the Company adopted perform periodic reviewsan expected loss model, as discussed more fully under Part II – Item 8. Financial Statements and Supplementary Data – Note B – Summary of individual securities in their investment portfolios to determine whether decline in the valueSignificant Accounting Policies of this report.security is other than temporary. A reviewbusiness combination are generally recorded at their fair value at the date of other-than-temporary impairment requires companies to make certain judgments regarding the materialityacquisition. The excess of the decline, its effect on the financial statements and the probability, extent and timing of a valuation recovery and the company’s intent and ability to hold the security. Pursuant to these requirements, Management assesses valuation declines to determine the extent to which such changes are attributable to fundamental factors specific to the issuer, such as financial condition, business prospects or other factors or market-related factors, such as interest rates. Declines inpurchase price over the fair value of securities below their cost thatassets acquired and liabilities assumed is recorded as goodwill. Determining the fair value of identifiable assets, particularly intangibles, and liabilities acquired also require management to make estimates, which are deemedbased on all available information and in some cases assumptions with respect to be other-than-temporarythe timing and amount of future revenues and expenses associated with an asset. Business combinations are recorded in earnings as realized losses.then compares the fair value of goodwill with its carrying amount, and then measures impaired loss by comparing the implied fair value of goodwill with the carrying amount of that goodwill. Other intangibles are also assessed for impairment, both annually and when events or circumstances occur, that make it more likely than not that impairment has occurred. No impairment was indicated when the annual test was performed in December, 2017.First Bancshares, Inc. (the Company)Company was incorporated on June 23, 1995, and serves as a bank holding company for The First, formerly known as The First, A National Banking Association, (“The First”), located in Hattiesburg, Mississippi. The First began operations on August 5, 1996, from its main office in the Oak Grove community, which is now incorporated within the city of Hattiesburg. Currently, the First has 57116 locations in Mississippi, Louisiana, Alabama, Florida, Georgia and Florida.Louisiana. The Company and The First engage in a general commercial and retail banking business characterized by personalized service and local decision-making, emphasizing the banking needs of small to medium-sized businesses, professional concerns, and individuals.292017 include:·On October 24, 2017, the Company announced the signing of an Agreement and Plan of Merger with Southwest Banc Shares, Inc. (“Southwest”), parent company of First Community Bank, headquartered in Chatom, Alabama. This acquisition closed March 1, 2018, and added 9 locations servicing southwest Alabama.·On October 31, 2017, the Company completed a sale of an aggregate of 2,012,500 shares of its common stock in a public offering. Net proceeds after underwriting discounts and estimated expenses were approximately $55.2 million.·On December 6, 2017, the Company announced the signing of an Agreement and Plan of Merger with Sunshine Financial, Inc. (“Sunshine”), parent company of Sunshine Community Bank, headquartered in Tallahassee, Florida. Upon completion, the acquisition will add 5 locations servicing Tallahassee and is expected to close during the second quarter of 2018 subject to Sunshine shareholder approval and customary closing conditions. Regulatory approval was received February 27, 2018.2017,2023, the Company had approximately $1.8$7.999 billion in total assets, an increase of $0.5$1.538 billion$1.3$6.462 billion at December 31, 2016.2022. Loans, including mortgage loans held for sale and net of the allowance for loancredit losses, increased to $1,221.8$5.119 billion at December 31, 2023 from $3.740 billion at December 31, 2022. Deposits increased to $6.463 billion at December 31, 2023 from $5.494 billion at December 31, 2022. Stockholders’ equity increased to $949.0 million at December 31, 20172023 from $865.4$646.7 million at December 31, 2016. Deposits increased to $1,470.6 million2022. The acquisition of Heritage Bank during 2023 contributed, at December 31, 2017 from $1,039.2 million at December 31, 2106. Stockholders’ equity increased to $222.5 million at December 31, 2017 from approximately $154.5 million at December 31, 2016. The acquisitionsacquisition, $1.565 billion, $1.159 billion, net of Iberville Bankpurchase accounting adjustments, and Gulf Coast Community Bank, which were completed on January 1, 2017, contributed $402.6 million, $237.3 million and $355.6 million$1.392 billion, net of purchase accounting adjustments, in assets, loans, and deposits, respectively.$12.6$81.8 million, $11.6$72.6 million and $9.6$73.9 million for the years ended December 31, 2017, 2016,2023, 2022, and 2015,2021, respectively. For the years ended December 31, 2017, 20162023, 2022 and 2015,2021, the Company reported consolidated net income applicableavailable to common stockholders of $10.6$75.5 million, $9.7$62.9 million and $8.5$64.2 million, respectively. The following discussion should be read in conjunction with the “Selected Consolidated Financial Data” and the Company's consolidated financial statements and the Notes thereto and the other financial data included elsewhere.byfor The First for(Bank only) the years ended December 31, 2017, 2016,2023, 2022, and 2015. 2017 2016 2015 (In thousands) Interest income $ 66,061 $ 44,535 $ 40,196 Interest expense 6,049 4,094 3,022 Net interest income 60,012 40,441 37,174 Provision for loan losses 506 625 410 Net interest income after provision for loan losses 59,506 39,816 36,764 Other income 14,312 10,540 7,589 Other expense 52,999 33,941 31,032 Income tax expense 8,177 4,766 3,701 Net income $ 12,642 $ 11,649 $ 9,620
2021.30($ in thousands) 2023 2022 2021 Interest income $ 340,897 $ 200,375 $ 176,735 Interest expense 83,638 15,085 12,306 Net interest income 257,259 185,290 164,429 Provision for credit losses 14,500 5,605 (1,104) Net interest income after provision for loan losses 242,759 179,685 165,533 Non-interest income 39,722 34,288 37,362 Non-interest expense 177,324 122,373 108,791 Income tax expense 23,352 19,033 20,210 Net income $ 81,805 $ 72,567 $ 73,894 2017, 2016,2023, 2022, and 2015: 2017 2016 2015 (In thousands) Net interest income: Net interest income of The First $ 60,012 $ 40,441 $ 37,174 Intercompany eliminations (852 ) (152 ) (180 ) $ 59,160 $ 40,289 $ 36,994 Net income applicable to common stockholders: Net income of The First $ 12,642 $ 11,649 $ 9,620 Net loss of the Company, excluding intercompany accounts (2,026 ) (1,983 ) (1,164 ) $ 10,616 $ 9,666 $ 8,456 ($ in thousands) 2023 2022 2021 Net interest income: Net interest income of The First $ 257,259 $ 185,290 $ 164,429 Interest expense 7,934 7,474 7,365 $ 249,325 $ 177,816 $ 157,064 Net income available to common shareholders: Net income of The First $ 81,805 $ 72,567 $ 73,894 Net loss of the Company (6,348) (9,648) (9,727) $ 75,457 $ 62,919 $ 64,167 applicableavailable to common stockholders of $10.6$75.5 million for the year ended December 31, 2017,2023, compared to a consolidated net income of $9.7$62.9 million for the year ended December 31, 2016,2022.consolidated netBeach Bank).of $8.5was $46.7 million for the year ended December 31, 2015.2023, an increase of $9.7 million as compared to the same period ended December 31, 2022. Service charges on deposit accounts and interchange fee income accounted for $11.7 million of the increase.in income was partially attributable to an$2.7 million in acquisition and charter conversion charges and $32.1 million in increased operating expenses related to the acquisitions of Beach Bank and Heritage Bank as well as $5.2 million in expenses associated with the U.S. Treasury awards and increases in FDIC premiums of $1.7 million and a $4.9 million increase in core deposit amortization for the year ended December 31, 2023.$18.9 million or 46.8%, an increasesecurities and loans and increased interest rates.other2021. Increased service charges on deposit accounts and interchange fee income of $3.1$2.5 million or 27.7%, which was offset by a decrease in mortgage income of $4.5 million.other expenses of $18.6 million or 50.4%. The increase in other expense was primarily due to a charge of $6.7acquisition and charter conversion charges and $3.3 million related to the acquisitions completed in 2017ongoing operations of the Cadence Bank branches and a $2.1$5.1 million charge to income tax expense related to a reductionthe Beach Bank branch operations accounted for the increase in our deferred tax asset resulting from the change in tax rate under the Tax Cuts and Jobs Act enacted in December of 2017.$59.2$249.3 million for the year ended December 31, 2017,2023, as compared to $40.3$177.8 million for the year ended December 31, 2016. This increase was the direct result2022, primarily due to interest income earned on a higher volume of increased loan volumes during 2017 as compared to 2016.loans (including loans acquired from Heritage Bank and Beach Bank). Average interest-bearing liabilities for the year 20172023 were $1,247.8 million$4.935 billion compared to $911.0 million$3.944 billion for the year 2016. At December 31, 2017, the net interest spread, which is the difference between the yield on earning assets and the rates paid on interest-bearing liabilities, was 3.72% compared to 3.63% at December 31, 2016. The net2022. Net interest margin, which is net interest income divided by average earning assets, was 3.83%3.59% for the year 20172023 compared to 3.71%3.19% for the year 2016.2022. Rates paid on average interest-bearing liabilities increased to 0.55%1.86% for the year 20172023 compared to 0.47%0.57% for the year 2016.2022. Interest earned on assets and interest accrued on liabilities is significantly influenced by market factors, specifically interest rates as set by Federalfederal agencies. Average loans comprised 74.1%71.4% of average earnings assets for the year 20172023 compared to 73.9%58.0% for the year 2016.
2022.31$40.3$177.8 million for the year ended December 31, 2016,2022, as compared to $37.0$157.1 million for the year ended December 31, 2015.2021. This increase was the direct result of higher volume of securities and loans and increased loan volumesinterest rates during 20162022 as compared to 2015.2021. Average interest-bearing liabilities for the year ended December 31, 20162022 were $911.0 million$3.944 billion compared to $822.7 million$3.435 billion for the year ended December 31, 2015. At December 31, 2016, the2021. Net interest margin, which is net interest spreadincome divided by average earning assets, was 3.63% compared to 3.65% at December 31, 2015. The net interest margin was 3.71%3.19% for the year 20162022 compared to 3.72%3.21% for the year 2015.2021. Rates paid on average interest-bearing liabilities increased to 0.47%was 0.57% for the year 2016 compared to 0.39%2022 and remained unchanged for the year 2015.ended 2021. Interest earned on assets and interest accrued on liabilities is significantly influenced by market factors, specifically interest rates as set by federal agencies. Average loans comprised 73.9%58.0% of average earnings assets for the year 20162022 compared to 71.7%60.8% for the year 2015.Years Ended December 31, 2023 2022 2021 ($ in thousands) Average
BalanceIncome/
ExpensesYield/
RateAverage
BalanceIncome/
ExpensesYield/
RateAverage
BalanceIncome/
ExpensesAssets Earning Assets Loans (1)(2) $ 5,036,021 $ 294,541 5.85 % $ 3,302,265 $ 157,761 4.78 % $ 3,019,605 $ 151,203 5.01 % Securities (4) 1,918,575 47,913 2.50 % 2,023,214 46,305 2.29 % 1,305,262 28,035 2.15 % Federal funds sold and interest bearing deposits with other banks (3) 97,183 2,453 2.52 % 366,465 50 0.01 % 642,042 121 0.02 % Total earning assets 7,051,779 344,907 4.89 % 5,691,944 204,116 3.59 % 4,966,909 179,359 3.61 % Other 866,869 584,164 526,877 Total assets $ 7,918,648 $ 6,276,108 $ 5,493,786 Liabilities Interest-bearing liabilities $ 4,934,875 $ 91,608 1.86 % $ 3,943,531 $ 22,577 0.57 % $ 3,434,964 $ 19,681 0.57 % Demand deposits 2,012,129 1,660,696 1,366,529 Other liabilities 77,252 45,065 34,827 Stockholders’ equity 894,392 626,816 657,466 Total liabilities and stockholders’ equity $ 7,918,648 $ 6,276,108 $ 5,493,786 Net interest spread 3.03 % 3.02 % 3.04 % Net yield on interest-earning assets $ 253,299 3.59 % $ 181,539 3.19 % $ 159,678 3.21 % Years Ended December 31, 2017 2016 2015 Average
Balance (Dollars in thousands) Assets Earning Assets Loans (1)(2) $ 1,168,882 $ 56,827 4.86 % $ 820,881 $ 38,497 4.69 % $ 730,326 $ 34,242 4.69 % Securities (4) 359,195 9,956 2.77 % 261,508 6,885 2.63 % 256,462 6,759 2.64 % Federal funds sold (3) 47,534 390 .82 % 18,806 127 .68 % 24,582 64 .26 % Other 2,515 163 .64 % 10,029 59 .59 % 7,585 93 1.23 % Total earning assets 1,578,126 67,336 4.27 % 1,111,224 45,568 4.10 % 1,018,955 41,158 4.04 % Other 185,277 117,735 103,237 Total assets $ 1,763,403 $ 1,228,959 $ 1,122,192 Liabilities Interest-bearing liabilities $ 1,247,823 $ 6,909 .55 % $ 911,037 $ 4,316 .47 % $ 822,708 $ 3,208 .39 % Demand deposits (1) 318,339 191,998 196,284 Other liabilities 26,404 5,601 4,594 Stockholders’ equity 170,837 120,323 98,606 Total liabilities and stockholders’ equity $ 1,763,403 $ 1,228,959 $ 1,122,192 Net interest spread 3.72 % 3.63 % 3.65 % Net yield on interest-earning assets $ 60,427 3.83 % $ 41,252 3.71 % $ 37,950 3.72 % _________________(1)All loans and deposits were made to borrowers in the United States. Includes non-accrual loans of $5,674, $3,265, and $7,368, for the years ended December 31, 2017, 2016, and 2015, respectively. Loans include held for sale loans.(2)Includes loan fees of $1,333, $857, and $692, for the years ended December 31, 2017, 2016, and 2016, respectively.(3)Includes Excess Balance Account-Mississippi National Banker’s Bank and Federal Reserve – New Orleans.(4)Tax equivalent yield assuming a 35% tax rate.
(1)Includes nonaccrual loans of $10,690, $12,591, and $28,013 for the years ended December 31, 2023, 2022, and 2021, respectively. Loans include held for sale loans.32Year Ended December 31,
2023 versus 2022
Increase (decrease) due toYear Ended December 31,
2022 versus 2021
Increase (decrease) due to($ in thousands) Volume Rate Net Volume Rate Net Earning Assets Loans $ 82,887 $ 53,893 $ 136,780 $ 14,176 $ (7,595) $ 6,581 Securities (1) (2,405) 4,013 1,608 15,436 2,832 18,268 Federal funds sold and interest bearing deposits with other banks (28) 2,431 2,403 (55) (37) (92) Total interest income 80,454 60,337 140,791 29,557 (4,800) 24,757 Interest-Bearing Liabilities Interest-bearing transaction accounts 903 19,659 20,562 1,278 (745) 533 Money market accounts and savings 491 16,071 16,562 226 819 1,045 Time deposits 2,078 18,160 20,238 294 (52) 242 Borrowed funds 10,642 1,027 11,669 241 835 1,076 Total interest expense 14,114 54,917 69,031 2,039 857 2,896 Net interest income $ 66,340 $ 5,420 $ 71,760 $ 27,518 $ (5,657) $ 21,861 Year Ended December 31, Year Ended December 31, Volume Rate Net Volume Rate Net (In thousands) Earning Assets Loans $ 18,630 $ (300 ) $ 18,330 $ 3,807 $ 448 $ 4,255 Securities 2,461 610 3,071 174 (48 ) 126 Federal funds sold 65 198 263 (63 ) 126 63 Other short-term investments 57 47 104 4 (38 ) (34 ) Total interest income 21,213 555 21,768 3,922 488 4,410 Interest-Bearing Liabilities Interest-bearing transaction accounts 609 562 1,171 207 215 422 Money market accounts and savings 155 (12 ) 143 (15 ) 54 39 Time deposits 448 55 503 108 313 421 Borrowed funds (87 ) 863 776 77 149 226 Total interest expense 1,125 1,468 2,593 377 731 1,108 Net interest income $ 20,088 $ (913 ) $ 19,175 $ 3,545 $ (243 ) $ 3,302 Company'sCompany’s interest sensitivity "gap," which is the positive or negative dollar difference between assets and liabilities that are subject to interest rate repricing within a given period of time. The Company also performs asset/liability modeling to assess the impact varying interest rates and balance sheet mix assumptions will have on net interest income. Interest rate sensitivity can be managed by repricing assets or liabilities, selling securities available-for-sale, replacing an asset or liability at maturity, or adjusting the interest rate during the life of an asset or liability. Managing the amount of assets and liabilities repricing in the same time interval helps to hedge the risk and minimize the impact on net interest income of rising or falling interest rates. The Company evaluates interest sensitivity risk and then formulates guidelines regarding asset generation and repricing, funding sources and pricing, and off-balance sheet commitments in order to decrease interest rate sensitivity risk.33Company'sCompany’s consolidated interest rate sensitivity and consolidated cumulative gap position by maturity at December 31, 2017, 2016,2023, 2022, and 2015. December 31, 2017 Total (In thousands) Assets Earning Assets: Loans $ 214,687 $ 119,492 $ 334,179 $ 895,917 $ 1,230,096 Securities (2) 24,716 17,823 42,539 330,323 372,862 Funds sold and other 475 48,466 48,941 - 48,941 Total earning assets $ 239,878 $ 185,781 $ 425,659 $ 1,226,240 $ 1,651,899 Liabilities Interest-bearing liabilities: Interest-bearing deposits: NOW accounts (1) $ - $ 601,694 $ 601,694 $ - $ 601,694 Money market accounts 149,715 - 149,715 - 149,715 Savings deposits (1) - 133,864 133,864 - 133,864 Time deposits 43,171 109,100 152,271 131,032 283,303 Total interest-bearing deposits 192,886 844,658 1,037,544 131,032 1,168,576 Borrowed funds (3) 75,000 18,572 93,572 10,500 104,072 Total interest-bearing liabilities 267,886 863,230 1,131,116 141,532 1,272,648 Interest-sensitivity gap per period $ (28,008 ) $ (677,449 ) $ (705,457 ) $ 1,084,708 $ 379,251 Cumulative gap at December 31, 2017 $ (28,008 ) $ (705,457 ) $ (705,457 ) $ 379,251 $ 379,251 Ratio of cumulative gap to total earning assets at December 31, 2017 (1.7 )% (42.7 )% (42.7 )% 23.0 % $ in thousands December 31, 2023 Within
Three
MonthsAfter Three
Through
Twelve
MonthsWithin
One
YearGreater Than
One Year or
NonsensitiveTotal Assets Earning assets: Loans $ 262,916 $ 406,261 $ 669,177 $ 4,503,779 $ 5,172,956 Securities (2) 51,735 35,679 87,414 1,609,490 1,696,904 Funds sold and other — 130,948 130,948 — 130,948 Total earning assets $ 314,651 $ 572,888 $ 887,539 $ 6,113,269 $ 7,000,808 Liabilities Interest-bearing liabilities: Interest-bearing deposits: NOW accounts (1) $ — $ 1,914,792 $ 1,914,792 $ — $ 1,914,792 Money market accounts 1,090,484 — 1,090,484 — 1,090,484 Savings deposits (1) — 532,827 532,827 — 532,827 Time deposits 361,342 618,134 979,476 96,280 1,075,756 Total interest-bearing deposits 1,451,826 3,065,753 4,517,579 96,280 $ 4,613,859 Borrowed funds (3) 250,000 140,000 390,000 — 390,000 Total interest-bearing liabilities 1,701,826 3,205,753 4,907,579 96,280 5,003,859 Interest-sensitivity gap per period $ (1,387,175) $ (2,492,865) $ (4,020,040) $ 6,016,989 $ 1,996,949 Cumulative gap at December 31, 2023 $ (1,387,175) $ (3,880,040) $ (4,020,040) $ 1,996,949 $ 1,996,949 Ratio of cumulative gap to total earning assets at December 31, 2023 (19.8) % (55.4) % (57.4) % 28.5 % $ in thousands December 31, 2022 Within
Three
MonthsAfter Three
Through
Twelve
MonthsWithin
One
YearGreater Than
One Year or
NonsensitiveTotal Assets Earning assets: Loans $ 180,128 $ 247,781 $ 427,909 $ 3,350,693 $ 3,778,602 Securities (2) 13,565 58,431 71,996 1,876,589 1,948,585 Funds sold and other — 78,139 78,139 — 78,139 Total earning assets $ 193,693 $ 384,351 $ 578,044 $ 5,227,282 $ 5,805,326 Liabilities Interest-bearing liabilities: Interest-bearing deposits: NOW accounts (1) $ — $ 1,769,699 $ 1,769,699 $ — $ 1,769,699 Money market accounts 825,813 — 825,813 — 825,813 Savings deposits (1) — 542,296 542,296 — 542,296 Time deposits 118,108 440,087 558,195 168,200 726,395 Total interest-bearing deposits 943,921 2,752,082 3,696,003 168,200 $ 3,864,203 Borrowed funds (3) 130,100 — 130,100 — 130,100 Total interest-bearing liabilities 1,074,021 2,752,082 3,826,103 168,200 3,994,303 Interest-sensitivity gap per period $ (880,328) $ (2,367,731) $ (3,248,059) $ 5,059,082 $ 1,811,023 Cumulative gap at December 31, 2022 $ (880,328) $ (3,248,059) $ (3,248,059) $ 1,811,023 $ 1,811,023 Ratio of cumulative gap to total earning assets at December 31, 2022 (15.2) % (55.9) % (55.9) % 31.2 % $ in thousand December 31, 2021 Within
Three
MonthsAfter Three
Through
Twelve
MonthsWithin
One
YearGreater Than
One Year or
NonsensitiveTotal Assets Earning assets: Loans $ 147,728 $ 256,450 $ 404,178 $ 2,563,053 $ 2,967,231 Securities (2) 8,959 51,457 60,416 1,713,642 1,774,058 Funds sold and other — 804,481 804,481 — 804,481 Total earning assets $ 156,687 $ 1,112,388 $ 1,269,075 $ 4,276,695 $ 5,545,770 Liabilities Interest-bearing liabilities: Interest-bearing deposits: NOW accounts (1) $ — $ 1,771,510 $ 1,771,510 $ — $ 1,771,510 Money market accounts 817,476 — 817,476 — 817,476 Savings deposits (1) — 502,808 502,808 — 502,808 Time deposits 132,025 312,958 444,983 139,626 584,609 Total interest-bearing deposits 949,501 2,587,276 3,536,777 139,626 3,676,403 Total interest-bearing liabilities 949,501 2,587,276 3,536,777 139,626 3,676,403 Interest-sensitivity gap per period $ (792,814) $ (1,474,888) $ (2,267,702) $ 4,137,069 $ 1,869,367 Cumulative gap at December 31, 2021 $ (792,814) $ (2,267,702) $ (2,267,702) $ 1,869,367 $ 1,869,367 Ratio of cumulative gap to total earning assets at December 31, 2021 (14.3) % (40.9) % (40.9) % 33.7 % December 31, 2016 Total (In thousands) Assets Earning Assets: Loans $ 121,391 $ 88,433 $ 209,824 $ 663,110 $ 872,934 Securities (2) 10,092 21,376 31,468 224,331 255,799 Funds sold and other 425 29,975 30,400 - 30,400 Total earning assets $ 131,908 $ 139,784 $ 271,692 $ 887,441 $ 1,159,133 Liabilities Interest-bearing liabilities: Interest-bearing deposits: NOW accounts (1) $ - $ 430,903 $ 430,903 $ - �� $ 430,903 Money market accounts 113,253 - 113,253 - 113,253 Savings deposits (1) - 69,540 69,540 - 69,540 Time deposits 31,273 93,456 124,729 98,288 223,017 Total interest-bearing deposits 144,526 593,899 738,425 98,288 836,713 Borrowed funds (3) 30,000 26,000 56,000 13,000 69,000 Total interest-bearing liabilities 174,526 619,899 794,425 111,288 905,713 Interest-sensitivity gap per period $ (42,618 ) $ (480,115 ) $ (522,733 ) $ 776,153 $ 253,420 Cumulative gap at December 31, 2016 $ (42,618 ) $ (522,733 ) $ (522,733 ) $ 253,420 $ 253,420 Ratio of cumulative gap to total earning assets at December 31, 2016 (3.7 )% (45.1 )% (45.1 )% 21.9 %
(1)NOW and savings accounts are subject to immediate withdrawal and repricing. These deposits do not tend to immediately react to changes in interest rates and the Company believes these deposits are fairly stable. Therefore, these deposits are included in the repricing period that management believes most closely matches the periods in which they are likely to reprice rather than the period in which the funds can be withdrawn contractually.34 December 31, 2015 Total (In thousands) Assets Earning Assets: Loans $ 101,160 $ 76,996 $ 178,156 $ 598,333 $ 776,489 Securities (2) 14,831 18,100 32,931 222,028 254,959 Funds sold and other 321 17,303 17,624 - 17,624 Total earning assets $ 116,312 $ 112,399 $ 228,711 $ 820,361 $ 1,049,072 Liabilities Interest-bearing liabilities: Interest-bearing deposits: NOW accounts (1) $ - $ 373,686 $ 373,686 $ - $ 373,686 Money market accounts 105,434 - 105,434 - 105,434 Savings deposits (1) - 68,657 68,657 - 68,657 Time deposits 37,222 83,549 120,771 58,702 179,473 Total interest-bearing deposits 142,656 525,892 668,548 58,702 727,250 Borrowed funds (3) 81,130 21,191 102,321 8,000 110,321 Total interest-bearing liabilities 223,786 547,083 770,869 66,702 837,571 Interest-sensitivity gap per period $ (107,474 ) $ (434,684 ) $ (542,158 ) $ 753,659 $ 211,501 Cumulative gap at December 31, 2015 $ (107,474 ) $ (542,158 ) $ (542,158 ) $ 211,501 $ 211,501 Ratio of cumulative gap to total earning assets at December 31, 2015 (10.2 )% (51.7 )% (51.7 )% 20.2 % (1)NOW and savings accounts are subject to immediate withdrawal and repricing. These deposits do not tend to immediately react to changes in interest rates and the Company believes these deposits are fairly stable. Therefore, these deposits are included in the repricing period that management believes most closely matches the periods in which they are likely to reprice rather than the period in which the funds can be withdrawn contractually.(2)Securities include mortgage backed and other installment paying obligations based upon stated maturity dates.(3)Does not include subordinated debentures of $10,310,000.frame.frame based on effective GAP which uses behavioral assumptions that model the rate sensitivity of non-maturity deposits by looking at the deposits’ behavior rather than their contractual ability to reprice. The cash flows used in the analysis are the projected dollars of assets and liabilities that “reprice” (including maturities, repricing, likely calls, prepayments, etc.). However, the Company's gap analysis is not a precise indicator of its interest sensitivity position. The analysis presents only a static view of the timing of maturities and repricing opportunities, without taking into consideration that changes in interest rates do not affect all assets and liabilities equally. For example, rates paid on a substantial portion of core deposits may change contractually within a relatively short time frame, but those rates are viewed by management as significantly less interest-sensitive than market-based rates such as those paid on non-core deposits. Accordingly, management believes a liabilityan asset sensitive-position within one year would not be as indicative of the Company’s true interest sensitivity as it would be for an organization which depends to a greater extent on purchased funds to support earning assets. Net interest income is also affected by other significant factors, including changes in the volume and mix of earning assets and interest-bearing liabilities.35equity.December 31, 2017
Rates
from Base Up 400 bps 7.7 % -20.0 % 40.3 % -40.0 % Up 300 bps 7.7 % -15.0 % 36.4 % -30.0 % Up 200 bps 6.3 % -10.0 % 28.8 % -20.0 % Up 100 bps 3.8 % -5.0 % 17.0 % -10.0 % Down 100 bps -6.2 % -5.0 % -21.2 % -10.0 % Down 200 bps -9.2 % -10.0 % -14.3 % -20.0 % December 31, 2016 Change in Interest
Rates
from Base Up 400 bps 15.4 % -20.0 % 22.9 % -40.0 % Up 300 bps 11.8 % -15.0 % 18.8 % -30.0 % Up 200 bps 8.0 % -10.0 % 13.7 % -20.0 % Up 100 bps 4.0 % -5.0 % 7.6 % -10.0 % Down 100 bps -4.8 % -5.0 % -9.5 % -10.0 % Down 200 bps -6.6 % -10.0 % -11.6 % -20.0 % December 31, 2015 Change in Interest
Rates
from Base Up 400 bps 11.2 % -20.0 % 34.3 % -40.0 % Up 300 bps 8.6 % -15.0 % 27.7 % -30.0 % Up 200 bps 5.8 % -10.0 % 20.0 % -20.0 % Up 100 bps 2.9 % -5.0 % 10.8 % -10.0 % Down 100 bps -2.7 % -5.0 % -11.5 % -10.0 % Down 200 bps -4.7 % -10.0 % -10.0 % -20.0 % December 31, 2023 Net Interest Income at Risk Market Value of Equity Change in Interest
Rates% Change
from BaseBank
Policy Limit% Change
from BaseBank
Policy LimitUp 400 bps (19.0) % (20.0) % (12.4) % (40.0) % Up 300 bps (9.1) % (15.0) % (6.7) % (30.0) % Up 200 bps (2.3) % (10.0) % (2.0) % (20.0) % Up 100 bps 0.7 % (5.0) % 0.6 % (10.0) % Down 100 bps 0.5 % (5.0) % (2.4) % (10.0) % Down 200 bps 2.3 % (10.0) % (5.0) % (20.0) % December 31, 2022 Net Interest Income at Risk Market Value of Equity Change in Interest
Rates% Change
from BaseBank
Policy Limit% Change
from BaseBank
Policy LimitUp 400 bps (11.3) % (20.0) % (16.6) % (40.0) % Up 300 bps (6.4) % (15.0) % (10.6) % (30.0) % Up 200 bps (2.9) % (10.0) % (5.8) % (20.0) % Up 100 bps (0.9) % (5.0) % (2.2) % (10.0) % Down 100 bps 1.1 % (5.0) % 0.9 % (10.0) % Down 200 bps (0.7) % (10.0) % (2.2) % (20.0) % December 31, 2021 Net Interest Income at Risk Market Value of Equity Change in Interest
Rates% Change
from BaseBank
Policy Limit% Change
from BaseBank
Policy LimitUp 400 bps 11.3% (20.0) % 20.0% (40.0) % Up 300 bps 10.2% (15.0) % 18.9% (30.0) % Up 200 bps 8.1% (10.0) % 15.5% (20.0) % Up 100 bps 4.7% (5.0) % 9.4% (10.0) % Down 100 bps (3.3) % (5.0) % (15.0) % (10.0) % Down 200 bps (4.6) % (10.0) % (34.2) % (20.0) % Allowancea specific allowance for Loan LossesCompany has developed policiesallowance is continuously monitored by management to maintain a level adequate to absorb expected credit losses in the loan portfolio.proceduresexternal sources, relating to past events, current conditions, and reasonable and supportable forecasts. Historical credit loss experience provides the basis for evaluating the overall qualityestimation of itsexpected credit losses. Adjustments to historical loss information are made for differences in current risk characteristics such as differences in underwriting standards, portfolio andmix, delinquency level, or term as well as for changes in environment conditions, such as changes in unemployment rates, property values, or other relevant factors. Management may selectively apply external market data to subjectively adjust the timely identification of potential problem loans. Management’s judgment as toCompany’s own loss history including index or peer data. Management evaluates the adequacy of the allowanceACL quarterly and makes provisions for credit losses based on this evaluation. See Note B – Summary of Significant Accounting Policies in the accompanying notes to the consolidated financial statements included elsewhere in this report for a complete description of the Company’s methodology and the quantitative and qualitative factors included in the calculation.is based upon a number of assumptions about future events which it believes to be reasonable, but which may not prove to be accurate. Thus, there can be no assurance that charge-offsincludes $10.7 million associated with day one post-merger accounting provision recorded for non-PCD loans and unfunded commitments acquired in future periods will not exceedthe HSBI acquisition. At December 31, 2022, the allowance for loancredit losses orwas approximately $38.9 million, which was 1.0% of LHFI. The Company maintains the allowance at a level that additional increasesmanagement believes is adequate to absorb expected credit losses in the loan lossportfolio. The 2022 provision for credit losses includes $3.9 million associated with a day one post-merger accounting provision recorded for non-PCD loans, unfunded commitments. A $1.3 million initial allowance will not be required.36The Company’s allowance consists of two parts. The first part is determinedwas recorded on PCD loans acquired in accordance with authoritative guidance issued by the FASB regardingBBI merger. Specifically, identifiable and quantifiable losses are immediately charged-off against the allowance.The Company’s determination of this part of the allowance is based upon quantitative and qualitative factors. The Company uses a loan loss history based upon the prior nine years to determine the appropriate allowance. Historical loss factorsallowance; recoveries are determined by criticized and uncriticized loans by loan type. These historical loss factorsgenerally recorded only when sufficient cash payments are appliedreceived subsequent to the loans by loan type to determine an indicated allowance. The loss factors of peer groups are considered in the determination of the allowance and are used to assist in the establishment of a long-term loss history for areas in which this data is unavailable and incorporated into the qualitative factors to be considered. The historical loss factors may also be modified based upon other qualitative factors including but not limited to local and national economic conditions, trends of delinquent loans, changes in lending policies and underwriting standards, concentrations, and management’s knowledge of the loan portfolio. These factors require judgment on the part of management and are based upon state and national economic reports received from various institutions and agencies including the Federal Reserve Bank, United States Bureau of Economic Analysis, Bureau of Labor Statistics, meetings with the Company’s loan officers and loan committees, and data and guidance received or obtained from the Company’s regulatory authorities.The second part of the allowance is determined in accordance with guidance issued by the FASB regarding impaired loans. Impaired loans are determined based upon a review by internal loan review and senior loan officers. Impaired loans are loans for which the Bank does not expect to receive contractual interest and/or principal by the due date. A specific allowance is assigned to each loan determined to be impaired based upon the value of the loan’s underlying collateral. Appraisals are used by management to determine the value of the collateral.The sum of the two parts constitutes management’s best estimate of an adequate allowance for loan losses. When the estimated allowance is determined, it is presented to the Company’s audit committee for review and approval on a quarterly basis.Our allowance for loan losses model is focused on establishing a loss history within the Bank and relies on specific impairment to determine credits that the Bank feels the ultimate repayment source will be liquidation of the subject collateral. Our model takes into account other factors such as local and national economic factors, portfolio trends, non performing asset, charge off, and delinquency trends as well as underwriting standards and the experience of branch management and lending staff. These trends are measured in the following ways:Local Trends: (Updated quarterly usually the month following quarter end)Local Unemployment RateInsurance Issues (Windpool Areas)Bankruptcy Rates (Increasing/Declining)Local Commercial R/E Vacancy RatesEstablished Market/New MarketHurricane ThreatNational Trends: (Updated quarterly usually the month following quarter end)Gross Domestic Product (GDP)Home SalesConsumer Price Index (CPI)Interest Rate Environment (Increasing/Steady/Declining)Single Family Construction StartsInflation RateRetail Sales
charge-off.37Portfolio Trends: (Updated monthly as the allowance for loan loss is calculated)Second MortgagesSingle Pay LoansNon-Recourse LoansLimited Guaranty LoansLoan to Value ExceptionsSecured by Non-Owner Occupied PropertyRaw Land LoansUnsecured LoansMeasurable Bank Trends: (Updated quarterly)Delinquency TrendsNon-Accrual TrendsNet Charge OffsLoan Volume TrendsNon-Performing AssetsUnderwriting Standards/Lending PoliciesExperience/Depth of Bank LendingManagementThe bank wide information and metrics, along with the local and national economic trends listed above, are all measured quarterly. Typically, this review is performed during the second month of every quarter to facilitate the release of economic data from the reporting agencies. As of December 31, 2017, most economic indicators pointed to a stable and improving economy thus most factors were assigned a neutral or decreasing allocation factor. In contrast, bank wide factors including the acquisition of new loan portfolios and lending staff through mergers, increased loan production volume causing healthy organic loan portfolio growth, and increasing concentrations in loan types considered to carry higher risk by banking standards, resulted in an increase to the assigned allocation factors related to these areas.At December 31, 2017, the consolidated allowance for loan losses was approximately $8.3 million, or 0.68% of outstanding loans excluding loans held for sale. Including valuation accounting adjustments on acquired loans, the total valuation plus allowance for loan losses was 1.11% of loans at December 31, 2017. At December 31, 2016, the allowance for loan losses amounted to approximately $7.5 million, which was 0.87% of outstanding loans. The provision for loancredit losses is a charge to earnings to maintain the allowance for loancredit losses at a level consistent with management’s assessment of the collectability of the loan portfolio in light of current economic conditions and market trends. The Company’s provision for loancredit losses was $506,000a $13.8 million for the year ended December 31, 2017, $625,0002023 and $5.4 million for the year ended December 31, 2016,2022, and $410,000a negative $1.5 million for the year ended December 31, 2015.2021. A majority of the 2023 and 2022 increase in the Company's provision for credit losses is attributed to the HSBI and BBI acquisitions detailed herein. The overall allowancenegative provision for loan losses results from consistent application of our loan loss reserve methodology as described above. 2021 is attributed to the improved macroeconomic outlook and the Company’s ACL calculation under ASC 326.2017,2023, management believes the allowance is appropriate and has been derived from consistent application of our methodology. Should any of the factors considered by management in evaluating the appropriateness of the allowance for loancredit losses change, management’s estimate of inherentexpected credit losses in the portfolio could also change, which would affect the level of future provisions for loancredit losses.reviewed for impairmentplaced on nonaccrual and the accrual of interest discontinued, when based on all available information and events, it displays characteristics causing management to determine that the probabilitycollection of collecting all principal, interest, and other related fees due according to the contractual terms of the loan agreement.agreement is not probable. Also at this time, the accrual of interest is discontinued. Alongidentified along with these loans in non-accrualnonaccrual status, allas well as loans determined by management to be labelled as “troubled debt restructure” based on regulatory guidance are reviewed for impairment. Loans that are identified as criticized90 days or classified based on unsatisfactory repayment performance, or other evidence of deteriorating credit quality, are not reviewed until being placed in non-accrual status or when considered to be troubled debt restructure.analyzedevaluated to determine whether the ultimate repayment source will be liquidation of collateral or some future source of cash flow. If the only source of repayment will come from the liquidation of collateral, impairment worksheetsthey are preparedanalyzed and documented as to document the amount ofwhether any impairment that exists. This method takes into accountconsiders collateral exposure, as well as all expected expenses related to the disposal of the collateral. SpecificIf there is any impairment, specific allowances for these loans are then accounted for on a per loan basis.
Loans that are identified as criticized or classified based on unsatisfactory repayment performance, or other evidence of deteriorating credit quality, are not reviewed until they meet one of the three criteria described above.38The following tables illustrate the Company’s past due and non-accrualTotal nonaccrual loans at December 31, 2017, 2016 and 2015. December 31, 2017 (In thousands) Past Due 30 to
89 Days Past Due 90 days or
more and still accruing Non-Accrual Real Estate-construction $ 192 $ 27 $ 92 Real Estate-mortgage 2,656 177 2,691 Real Estate-nonfarm nonresidential 1,487 82 1,724 Commercial 393 - 1,120 Consumer 57 - 46 Total $ 4,785 $ 286 $ 5,673 December 31, 2016 (In thousands) Past Due 30 to
89 Days Past Due 90 days or
more and still accruing Non-Accrual Real Estate-construction $ 204 $ 96 $ 658 Real Estate-mortgage 2,745 102 1,662 Real Estate-nonfarm nonresidential 269 - 909 Commercial 9 - 2 Consumer 22 - 33 Total $ 3,249 $ 198 $ 3,264 December 31, 2015 (In thousands) Past Due 30 to
89 Days Past Due 90 days or
more and still accruing Non-Accrual Real Estate-construction $ 311 $ - $ 2,956 Real Estate-mortgage 3,339 29 2,055 Real Estate-nonfarm nonresidential 736 - 2,225 Commercial 97 - 100 Consumer 70 - 32 Total $ 4,553 $ 29 $ 7,368 Total non-accrual loans at December 31, 2017,2023, were $5.7$10.7 million, an increasea decrease of $2.4$1.9 million compared to $3.3$12.6 million at December 31, 2016. The majority of the increase was the result of loans acquired from Iberville Bank and Gulf Coast Community Bank. Total non-accrual loans at December 31, 2016 decreased $4.1 million from $7.4 million at December 31, 2015. The majority of the decrease was the result of loans moving to Other Real Estate Owned.2022. Management believes these relationships were adequately reserved at December 31, 2017. Restructured loans not reported as past due or non-accrual at December 31, 2017, amounted to $4.7 million.2023. See Note E – Loans in the accompanying notes to the consolidated financial statements included elsewhere in this report for a description of restructuredmodified loans.dodoes not includemeet the categorystandard of special mention.a non-performing asset as outlined by regulatory guidance. These loans aremay or may not be current as to principal and interest and, accordingly,repayment, but they still possess some asset quality characteristics that give management a reason to believe that repayment in full under the contractual terms of the agreement are not included in nonperforming asset categories.possible. The level of potential problem loans is one factor used in the determination of the adequacy of the allowance for loancredit losses. At December 31, 2017, 20162023 and December 31, 2015,2022, The First had potential problem loans of $18,206,000, $12,297,000$107.1 million and $16,943,000,$108.1 million, respectively.Years Ended December 31, ($ in thousands) 2023 2022 2021 (1) Average LHFI outstanding $ 5,036,021 $ 3,302,265 $ 3,019,605 Loans outstanding at year end, including LHFS $ 5,172,956 $ 3,778,630 $ 2,967,231 Total nonaccrual loans $ 10,690 $ 12,591 $ 28,013 Beginning balance of allowance $ 38,917 $ 30,742 $ 35,820 Impact of ASC 326 adoption on non-PCD loans — — (718) Impact of ASC 326 adoption on PCD loans — — 1,115 Initial allowance on acquired PCD loans 3,176 1,303 — Loans charged-off (3,092) (1,218) (6,213) Total recoveries 1,281 2,740 2,194 Net loans (charged-off) recoveries (1,811) 1,522 (4,019) Provision for credit losses (2) 13,750 5,350 (1,456) Balance at year end $ 54,032 $ 38,917 $ 30,742 Net charge-offs to average loans (0.04)% 0.05% 0.13% Allowance as percent of total loans 1.04% 1.03% 1.04% Nonaccrual loans as a percentage of total loans 0.21% 0.33% 0.94% Allowance as a multiple of nonaccrual loans 5.05X 3.10X 1.10 X increaseCompany adopted ASC 326 using the modified retrospective approach.$5.9$1.5 million during 2017 was largely attributable tofor credit losses on the classifiedconsolidated statements of income is net of a $370 thousand provision for credit marks in the Cadence Bank Branches loans acquired infor the Iberville Bank and Gulf Coast Community Bank transactions.
year ended December 31, 2022.39Summary of Loan Loss ExperienceConsolidated Allowance For Loan Losses(In thousands) Years Ended December 31, 2017 2016 2015 2014 2013 Average loans outstanding $ 1,168,882 $ 820,881 $ 730,326 $ 632,049 $ 583,200 Loans outstanding at year end $ 1,230,096 $ 872,934 $ 776,489 $ 706,635 $ 583,302 Total non-accrual loans $ 5,673 $ 3,264 $ 7,368 $ 6,056 $ 3,181 Beginning balance of allowance $ 7,510 $ 6,747 $ 6,095 $ 5,728 $ 4,727 Loans charged-off (405 ) (771 ) (843 ) (1,459 ) (759 ) Total loans charged-off (405 ) (771 ) (843 ) (1,459 ) (759 ) Total recoveries 677 909 1,085 408 684 Net loans (charged-off) recoveries 272 138 242 (1,051 ) (75 ) Provision for loan losses 506 625 410 1,418 1,076 Balance at year end $ 8,288 $ 7,510 $ 6,747 $ 6,095 $ 5,728 Net charge-offs (recoveries) to average loans (.02 )% (.02 )% (.03 )% .17 % .01 % Allowance as percent of total loans .67 % .86 % .87 % .86 % .98 % Nonperforming loans as a percentage of total loans .46 % .37 % .95 % .86 % .55 % Allowance as a multiple of non-accrual loans 1.5 X 2.3 X .92 X 1.0 X 1.8 X 2017,2023, allowance as of percent of total loans increased 0.01% to 1.04% when compared to 1.03% at December 31, 2022. The increase is attributed to the increase in loan volume related to the HSBI acquisition and organic loan growth in 2023. At December 31, 2023, nonaccrual loans as a percentage of total loans decreased 0.12% to 0.21% when compared to 0.33% at December 31, 2022. The decrease is attributed to a $1.9 million decrease in nonaccrual loans mentioned above.allowanceACL for loan losses consisted of the following: Allowance (In thousands) Allocated: Impaired loans $ 661 Graded loans 7,627 $ 8,288 Graded loansyears 2023, 2022, and 2021.($ in thousands) Allowance for Credit Losses Allocated: 2023 2022 2021 Collateral dependent loans $ 408 $ 5 $ 6 Loans collectively evaluated 53,624 38,912 30,736 Total $ 54,032 $ 38,917 $ 30,742 40loancredit losses for the years 2017, 2016, 2015, 2014,2023, 2022, and 2013.2021.($ in thousands) Analysis of the Allowance for Credit Losses 2023 2022 2021 (1) Balance at beginning of period $ 38,917 $ 30,742 $ 35,820 Impact of ASC 326 adoption on non-PCD loans — — (718) Impact of ASC 326 adoption on PCD loans — — 1,115 Initial allowance on acquired PCD loans 3,176 1,303 — Loans charged-off: Commercial, financial and agriculture (745) (259) (1,662) Commercial real estate (250) (72) (3,523) Consumer real estate (49) (204) (473) Consumer installment (2,048) (683) (555) Total (3,092) (1,218) (6,213) Recoveries on loans previously charged-off: Commercial, financial and agriculture 349 433 433 Commercial real estate 116 591 888 Consumer real estate 249 1,015 311 Consumer installment 567 701 562 Total 1,281 2,740 2,194 Net (charge-offs) recoveries (1,811) 1,522 (4,019) Provision: Initial provision for acquired non-PCD loans 10,719 3,855 — Provision for credit losses charged to expense (2) 3,031 1,495 (1,456) Balance at end of period $ 54,032 $ 38,917 $ 30,742 AnalysisAllowanceconsolidated statements of income is net of a $370 thousand provision for Loan Losses Years Ended December 31, 2017 2016 2015 2014 2013 (In thousands) Balance at beginning of year $ 7,510 $ 6,747 $ 6,095 $ 5,728 $ 4,727 Charge-offs: Real Estate-construction (143 ) (274 ) (162 ) (47 ) (305 ) Real Estate-mortgage (119 ) (353 ) (372 ) (1,156 ) (152 ) Real Estate-nonfarm nonresidential (-) (-) (-) (-) (-) Commercial (62 ) (71 ) (183 ) (89 ) (105 ) Consumer (81 ) (73 ) (126 ) (167 ) (197 ) Total (405 ) (771 ) (843 ) (1,459 ) (759 ) Recoveries: Real Estate-construction 280 229 63 96 133 Real Estate-mortgage 228 519 827 212 393 Real Estate-nonfarm nonresidential 14 7 15 17 74 Commercial 50 84 99 15 18 Consumer 105 70 81 68 66 Total 677 909 1,085 408 684 Net (Charge-offs) Recoveries 272 138 242 (1,051 ) (75 ) Provision for Loan Losses 506 625 410 1,418 1,076 Balance at end of year $ 8,288 $ 7,510 $ 6,747 $ 6,095 $ 5,728 representrepresents how the allowance for loan lossesACL is allocated to a particular loan type as well as the percentage of the category to total gross loans at December 31, 2017, 20162023 and 2015.LoanCredit Losses December 31, 2017 (Dollars in thousands) Amount % of loans
in each category
to total loans Commercial Non Real Estate $ 1,608 14.0 % Commercial Real Estate 4,644 64.8 % Consumer Real Estate 1,499 18.9 % Consumer 173 2.3 % Unallocated 364 - Total $ 8,288 100 % December 31, 2016 (Dollars in thousands) Amount % of loans
in each category
to total loans Commercial Non Real Estate $ 1,118 15.6 % Commercial Real Estate 4,071 61.6 % Consumer Real Estate 1,589 20.3 % 41($ in thousands) December 31, 2023 December 31, 2022 December 31, 2021 Amount % of loans in
each category to
total gross loansAmount % of loans in
each category to
total gross loansAmount % of loans in
each category to
total gross loansCommercial, financial and agriculture $ 8,844 15.5 % $ 6,349 14.2 % $ 4,873 13.4 % Commercial real estate 29,125 59.2 % 20,389 56.5 % 17,552 57.0 % Consumer real estate 15,260 24.2 % 11,599 28.1 % 7,889 28.3 % Consumer installment 803 1.1 % 580 1.2 % 428 1.3 % Total loans $ 54,032 100 % $ 38,917 100 % $ 30,742 100 % Continued: Amount % of loans
in each category
to total loans Consumer 155 2.4 % Unallocated 577 0.1 % Total $ 7,510 100 % December 31, 2015 (Dollars in thousands) Amount % of loans
in each category
to total loans Commercial Non Real Estate $ 895 17.1 % Commercial Real Estate 3,018 58.4 % Consumer Real Estate 1,477 21.9 % Consumer 141 2.5 % Unallocated 1,216 0.1 % Total $ 6,747 100 % and ExpenseNon-interest Income. Company’sCompany's primary sources of noninterestnon-interest income are mortgage banking operations as well asand service charges on deposit accounts. Other sources of non-interest income include bankcard fees, commissions on check sales, safe deposit box rent, wire transfer fees, official check fees and bank owned life insurance income.$14.4$46.7 million at December 31, 2017,2023, an increase of $3.1$9.7 million or 27.7%26.4% compared to December 31, 2016, primarily consisting of increases2022. This increase was partially attributable to $11.7 million in service charges on deposit accounts and interchange fee income, and other charges and fees.a $5.3 million increase associated with the U.S. Treasury awards, offset by a $9.8 million loss on the sale of available-for-sale securities. Non-interest income increased $3.7was $37.0 million or 48.2% for the year endedat December 31, 20162022, a decrease of $512 thousand or 1.4% compared to $7.6December 31, 2021. Increased service charges on deposit accounts and interchange fee income of $2.5 million was offset by a decrease in mortgage income of $4.5 million.2015. Deposit activity fees were $7.4 million for 2017 compared to $5.1 million for 2016 and $5.0 million for 2015. Other service charges increased by $0.12023, an increase of $54.2 million, or 17.4%41.6% in year-over-year comparison. The increase was partially attributable to $2.7 million in acquisition and charter conversion charges and $32.1 million in increased operating expenses related to the acquisitions of Beach Bank and Heritage Bank as well as $5.2 million in expenses associated with the U.S. Treasury awards and increases in FDIC premiums of $1.7 million and a $4.9 million increase in core deposit amortization for the year ended 2017 to $0.6 million from $0.5December 31, 2023. Non-interest expense was $130.5 million for the year ended December 31, 2016 and other service charges increased $0.1 million or 12.8% for the year ended December 31, 2016, compared to $0.5 million for the year ended December 31, 2015. Mortgage income increased $3.4 million during 2016 due to increased volume from the acquisition of The Mortgage Connection, LLC in December, 2015.Non-interest expense was $55.4 million at December 31, 2017,2022, an increase of $18.6$15.9 million compared to December 31, 2021. An increase of $4.8 million in year-over-year comparison primarily resulting from increases in salariesacquisition and benefits of $8.4charter conversion charges and $3.3 million of which $6.7 million relatesrelated to the acquisitionsongoing operations of Gulf Coast Communitythe Cadence Bank branches and Iberville Bank. Increases in professional services and other non-interest expense increased $7.0$5.1 million which includes $6.7 million in merger-related costs. Non-interest expense increasedrelated to $36.9 millionthe Beach Bank branch operations accounted for the year ended December 31, 2016, from $32.2 million for the year ended December 31, 2015. The Company experienced slight increasesincrease in most expense categories. Salaries and employee benefits increased $3.6 million in 2016 as compared to 2015, due in part to a full yearnon-interest expense.indicated: Years ended December 31, 2017 2016 2015 (In thousands) Salaries and employee benefits $ 30,548 $ 22,137 $ 18,537 Occupancy 4,828 3,459 3,422 Equipment 1,225 1,262 1,199 Marketing and public relations 406 465 497 Data processing 1,039 535 150 Supplies and printing 640 287 300 Bank communications 1,296 782 631 Deposit and other insurance 1,252 1,020 1,051 Professional and consulting fees 6,757 1,805 1,332 Postage 546 396 400 ATM expense 1,188 883 763 Other 5,721 3,831 3,879 Total $ 55,446 $ 36,862 $ 32,161 ($ in thousands) Years ended December 31, 2023 2022 2021 Salaries and employee benefits $ 93,412 $ 73,077 $ 65,856 Occupancy 17,381 12,854 12,713 Furniture and equipment 3,987 2,981 2,848 Supplies and printing 1,240 967 903 Professional and consulting fees 6,446 3,558 4,035 Marketing and public relations 833 393 615 FDIC and OCC assessments 3,849 2,122 2,074 ATM expense 5,821 3,873 3,623 Bank communications 3,579 1,904 1,754 Data processing 2,771 2,211 1,578 Acquisition expense/charter conversion 9,075 6,410 1,607 Other 36,332 20,133 16,953 Total $ 184,726 $ 130,483 $ 114,559 On Income tax expense was $21.3 million for the year ended December 22, 2017,31, 2023, $15.8 million for theTax Cuts year ended December 31, 2022 and Jobs Act was enacted into law. This federal income tax reform, among other things, reduces$16.9 million for the federal corporateyear ended December 31, 2021. The Company’s effective income tax rate from 35%was 22.1%, 20.0% and 20.9% for the years ended December 31, 2023, 2022 and 2021, respectively. The effective tax rate differs each year primarily due to 21%, effective January 1, 2018. As a result, the Company revalued its deferred tax assets which was recorded as additional income tax expense of $2.1our investments in bank-qualified municipal securities, bank-owned life insurance, and certain merger related expenses. Income taxes are discussed more fully under Note K – Income Tax in the Company’s statement of operationsaccompanying notes to the consolidated financial statements included elsewhere in the fourth quarter of 2017.2017, 20162023, 2022, and 2015,2021, respectively, average loans accounted for 74.1%71.4%, 73.9%58.0% and 71.7%60.8% of average earning assets. Management attempts to control and counterbalance the inherent credit and liquidity risks associated with the higher loan yields without sacrificing asset quality to achieve its asset mix goals. Loans, excluding mortgage loans held for sale, averaged $1,168.9 million$5.036 billion during 20172023 and $820.9 million$3.302 billion during 2016,2022, as compared to $730.3 million$3.020 billion during 2015.
2021.43The following table shows the composition of the loan portfolio by category:Composition of Loan Portfolio December 31, 2017 2016 2015 Amount Percent
Of Total Amount Percent
of Total Amount Percent
Of Total (Dollars in thousands) Mortgage loans held for sale $ 4,790 0.3 % $ 5,880 0.6 % $ 3,974 0.5 % Commercial, financial and agricultural 165,780 13.5 % 129,423 14.8 % 129,197 16.6 % Real Estate: Mortgage-commercial 467,484 38.0 % 314,359 36.0 % 253,309 32.6 % Mortgage-residential 385,099 31.3 % 289,640 33.2 % 272,180 35.1 % Construction 183,328 14.9 % 109,394 12.5 % 99,161 12.8 % Lease Financing Receivable 2,450 0.2 % 2,204 0.3 % 2,650 0.3 % Obligations of states and subdivisions 3,109 0.3 % 6,698 0.8 % 969 0.1 % Consumer and other 18,056 1.5 % 15,336 1.8 % 15,049 2.0 % Total loans 1,230,096 100 % 872,934 100 % 776,489 100 % Allowance for loan losses (8,288 ) (7,510 ) (6,747 ) Net loans $ 1,221,808 $ 865,424 $ 769,742 Company's commercial and construction real estate loansCompany’s loan portfolio maturing within specified intervals at December 31, 2017. December 31, 2017 Type One Year
or Less Over One Year
Through
Five Years Over Five
Years Total (In thousands) Commercial, financial and agricultural $ 42,780 $ 98,452 $ 24,241 $ 165,473 Real estate – construction 78,917 79,460 24,951 183,328 $ 121,697 $ 177,912 $ 49,192 $ 348,801 Loans maturing after one year with: Fixed interest rates $ 198,541 Floating interest rates 28,563 $ 227,104 ($ in thousands) Due in One
Year or LessAfter One,
but Within
Five YearsAfter Five but
Within
Fifteen YearsAfter
Fifteen
YearsTotal Commercial, financial and agricultural $ 209,690 $ 392,382 $ 191,341 $ 6,911 $ 800,324 Commercial real estate 314,080 1,414,550 1,168,566 161,959 3,059,155 Consumer real estate 129,208 365,095 187,040 571,452 1,252,795 Consumer installment 13,285 39,110 5,125 248 57,768 Total $ 666,263 $ 2,211,137 $ 1,552,072 $ 740,570 $ 5,170,042 Loans with fixed interest rates: Commercial, financial and agricultural $ 130,524 $ 275,836 $ 126,964 $ 5,436 $ 538,760 Commercial real estate 231,270 1,215,711 717,414 19,742 2,184,137 Consumer real estate 68,229 267,122 104,973 89,254 529,578 Consumer installment 11,987 36,252 4,386 239 52,864 Total $ 442,010 $ 1,794,921 $ 953,737 $ 114,671 $ 3,305,339 Loans with floating interest rates: Commercial, financial and agricultural $ 79,166 $ 116,546 $ 64,377 $ 1,475 $ 261,564 Commercial real estate 82,810 198,839 451,152 142,217 875,018 Consumer real estate 60,979 97,973 82,067 482,198 723,217 Consumer installment 1,298 2,858 739 9 4,904 Total $ 224,253 $ 416,216 $ 598,335 $ 625,899 $ 1,864,703 44Company'sCompany’s total earning assets. Total securities averaged $359.2 million$1.919 billion in 2017,2023, as compared to $261.5 million$2.023 billion in 2016,2022, and $256.5 million$1.305 billion in 2015.2021. This represents 22.8%27.2%, 23.5%35.5%, and 25.2%26.3% of the average earning assets for the years ended December 31, 2017, 20162023, 2022 and 2015,2021, respectively. At December 31, 2017,2023, investment securities, including equity securities, were $372.9 million$1.735 billion and represented 22.6%28.5% of earning assets. The Company attempts to maintain a portfolio of high quality, highly liquid investments with returns competitive with short-term U.S. Treasury or agency obligations. This objective is particularly important as the Company focuses on growing its loan portfolio. The Company primarily invests in securities of U.S. Treasury, U.S. Government agencies, municipals, and corporate obligations with maturities up to fiveten years.summarizesdetails the carrying valueweighted-average yield for each range of maturities of securities forheld-to-maturity using the dates indicated.Securities Portfolio December 31, 2017 2016 2015 (In thousands) Available-for-sale U. S. Government agencies and Mortgage-backed Securities $ 201,570 $ 123,334 $ 118,536 States and municipal subdivisions 138,584 98,822 97,889 Corporate obligations 15,819 20,110 22,346 Mutual finds 920 940 961 Total available-for-sale 356,893 243,206 239,732 Held-to-maturity U.S. Government agencies - - 1,092 States and municipal subdivisions 6,000 6,000 6,000 Total held-to-maturity 6,000 6,000 7,092 Total $ 362,893 $ 249,206 $ 246,824 The following table shows, at carrying value, the scheduled maturities and average yields of securities heldamortized cost at December 31, 2017.Investment Securities Maturity Distribution and Yields (1) December 31, 2017 After One But After Five But Within One Year Within Five Years Within Ten Years After Ten Years (Dollars in thousands) Amount Yield Amount Yield Amount Yield Amount Yield Held-to-maturity: States and municipal subdivisions $ - - $ - - $ 6,000,000 .93 % $ - - Total investment securities held-to-maturity $ - - - - $ 6,000,000 $ - - Available-for-sale: U.S. Government agencies (2) 2,995,755 1.05 % 1,996,380 1.86 % - - - - States and municipal subdivisions. 11,065,790 3.22 % 47,779,208 3.27 % 47,360,399 3.96 % 32,378,641 3.96 % Corporate obligations and other - - 11,228,195 2.63 % 4,590,713 3.05 % Total investment securities available-for-sale $ 14,061,545 $ 49,775,588 $ 58,588,594 $ 36,969,354 (1) Investments with a call featureWithin One Year After One, But Within Five Years Maturing After Five But Within Ten Years After Ten Years Total Securities held-to-maturity U.S. Treasury 1.48 % 1.67 % — % — % 1.60 % Obligations of U.S. government agencies and sponsored entities — % 3.49 % 3.30 % — % 3.34 % Tax-exempt and taxable obligations of states and municipal subdivisions 1.91 % 2.04 % 3.96 % 4.83 % 4.57 % Mortgage-backed securities - residential — % — % 1.61 % 2.45 % 2.34 % Mortgage-backed securities - commercial — % 2.12 % 3.40 % 3.86 % 3.57 % Corporate obligations — % — % — % 3.13 % 3.13 % Total held-to-maturity 1.62 % 2.00 % 3.71 % 4.57 % 4.18 % shown as of the contractualincluded in maturity categories based on their stated maturity date.(2) Excludes mortgage-backed securities totaling $196.6 million with a yield of 2.47% and mutual funds of $0.9 million.$47.5$97.2 million in 2017, $18.82023, $366.5 million in 2016,2022, and $24.6$642.0 million in 2015. At2021. There were no federal funds sold at December 31, 2017, 2016,2023, 2022, and December 31, 2015, short-term investments totaled $475,000, $425,000 and $321,000, respectively.2021. These funds are a primary source of the Company's liquidity and are generally invested in an earning capacity on an overnight basis.45Deposits20172023 were $1,494.1 million,$6.555 billion, an increase of $473.0 million,$1.127 billion, or 46.3%20.8% compared to 2016.2022. Average total deposits at December 31, 20162022 were $1,021.1 million,$5.428 billion, an increase of $69.5$796.9 million, or 7.3%17.2% compared to $951.6 million$4.631 billion in 2015. 2021.2017,2023, total deposits were $1,470.6 million,$6.463 billion, compared to $1,039.2 million$5.494 billion at December 31, 2016,2022, an increase of $431.4$968.5 million, or 41.5%17.6%, and $916.7 million$5.227 billion at December 31, 2015. Deposits2021. During January 2023, deposits totaling $1.392 billion, net of $355.6purchase accounting adjustments, were acquired in the Heritage Bank acquisition. During August 2022, deposits totaling $490.6 million were acquired in 2017the BBI acquisition. During December 2021, deposits totaling $410.2 million were acquired in the Cadence Bank branches acquisition.acquisitionscurrent period presentation.December 31, ($ in thousands) 2023 2022 2021 Average
BalanceAverage
Rate
PaidAverage
BalanceAverage
Rate
PaidAverage
BalanceAverage
Rate
PaidNon-interest-bearing accounts $ 2,012,935 $ 1,660,301 $ 1,366,529 Interest bearing deposits: NOW accounts and other 2,017,154 1.41 % 1,810,575 0.44 % 1,529,293 0.48 % Money market accounts 1,013,701 1.79 % 831,463 0.29 % 756,951 0.20 % Savings accounts 606,421 0.18 % 535,449 0.04 % 440,977 0.03 % Time deposits 904,629 2.61 % 590,385 0.58 % 537,538 0.59 % Total interest-bearing deposits 4,541,905 1.57 % 3,767,872 0.37 % 3,264,759 0.37 % Total deposits $ 6,554,840 1.09 % $ 5,428,173 0.26 % $ 4,631,288 0.26 % Gulf Coast Community Bank.following table sets forthincrease in the average cost of deposits paid on our interest-bearing deposit products in 2023 compared to 2022, is a result of the Company by category for the period indicated. Deposits December 31, 2017 2016 2015 Percent
of Percent
of Percent
of (Dollars in thousands) Amount Deposits Amount Deposits Amount Deposits Non-interest-bearing accounts $ 301,989 20.5 % $ 202,478 19.5 % $ 189,445 20.6 % NOW accounts 601,694 40.9 % 430,903 41.5 % 373,686 40.8 % Money market accounts 149,715 10.2 % 113,253 10.9 % 105,434 11.5 % Savings accounts 133,864 9.1 % 69,540 6.7 % 68,657 7.5 % Time deposits less than $100,000 104,648 7.1 % 77,893 7.5 % 73,868 8.1 % Time deposits of $100,000 or over 178,655 12.2 % 145,124 13.9 % 105,605 11.5 % Total deposits $ 1,470,565 100 % $ 1,039,191 100 % $ 916,695 100 % 83.3%80.0% at December 31, 2017, 83.4%2023, 68.7% at December 31, 20162022 and 84.3%56.6% at December 31, 2015.2021. The loan-to-deposit ratio averaged 78.2%76.8% during 2017.2023. Core deposits, which exclude time deposits of $100,000$250,000 or more, provide a relatively stable funding source for the Company's loan portfolio and other earning assets. The Company's core deposits were $1,291.9 million$6.084 billion at December 31, 2017, $894.1 million2023, $5.198 billion at December 31, 2016,2022, and $811.1 million$4.504 billion at December 31, 2015. 2021.$100,000$250,000 or More After Three Within Three Through After Twelve (In thousands) Months Twelve Months Months Total December 31, 2017 $ 24,473 $ 67,469 $ 86,713 $ 178,655 ($ in thousands) Within Three
MonthsAfter Three
Through Six
MonthsAfter Six
Through
Twelve
MonthsAfter Twelve
MonthsTotal December 31, 2023 $ 103,032 $ 122,629 $ 44,767 $ 22,443 $ 292,871 2017,2023, advances from the FHLB totaled $88.1 million$0 compared to $48.0$130.1 million at December 31, 20162022 and $100.0 million$0 at December 31, 2015.2021. The advances are collateralized by a blanket lien on the first mortgage loans in the amount of the outstanding borrowings, FHLB capital stock, and amounts on deposit with the FHLB. There were $0, $0 and $5.3 million inno federal funds purchased at December 31, 2017, 2016,2023, 2022, and 2015,2021, respectively.46We hadOn March 12, 2023, the Federal Reserve Board announced the Bank Term Funding Program ("BTFP"), which offers loans to banks with a term up to one reverse repurchase agreementyear. The loans are secured by pledging the banks' U.S. treasuries, agency securities, agency mortgage-backed securities, and any other qualifying asset. These pledged securities will be valued atamountBTFP and had outstanding debt of $5,000,000. The agreement was secured by$390.0 million and pledged securities with a fair value of $5,470,105$362.4 million at December 31, 20162023. The securities pledged have a par value of $398.1 million. The Bank's BTFP borrowings, which were drawn between March 15, 2023 and $5,501,503 at December 31, 2015. On September 25, 2017, the underlying securities were repurchased28, 2023, bear interest rates ranging from 4.69% to 4.83% and the agreement was terminated.In of $4,124,000 to The First Bancshares Inc. Statutory Trust 2 (“Trust 2”). The debentures are the sole asset of Trust 2, and the Company is the sole owner of the common equity of Trust 2. Trust 2 issued $4.0 million of Trust Preferred Securities to investors. The Company’s obligations under the debentures and related documents, taken together, constitute a full and unconditional guarantee by the Company of the Trust 2.2’s obligations under the preferred securities. The Trust 2 issued $4,000,000 of preferred securities to investors.are redeemable by the Company at its option. The Company makes interest payments and will make principal payments onpreferred securities must be redeemed upon maturity of the debentures to the Trust 2. These payments will be the source of funds used to retirein 2036. Interest on the preferred securities whichis the three-month term Secured Overnight Financing Rate ("SOFR") plus 1.65% plus a tenor spread adjustment of 0.026161% and is payable quarterly. The terms of the subordinated debentures are redeemable at any time beginning in 2011 and thereafter, and mature in 2036. The Company entered into this arrangementidentical to provide funding for expected growth.Inthose of the preferred securities. of $6,186,000 to The First Bancshares Inc. Statutory Trust 3 (“Trust 3”). The Company owns all of the common equity of Trust 3, and the debentures are the sole asset of Trust 3. Trust 3 issued $6.0 million of Trust Preferred Securities to investors. The Company’s obligations under the debentures and related documents, taken together, constitute a full and unconditional guarantee by the Company of the Trust 3’s obligations under the preferred securities. The preferred securities are redeemable by the Company at its option. The preferred securities must be redeemed upon maturity of the debentures in 2037. Interest on the preferred securities is the three-month term SOFR plus 1.40% plus a tenor spread adjustment of 0.026161% and is payable quarterly. The terms of the subordinated debentures are identical to those of the preferred securities.3.are redeemable by the Company at its option. The preferred securities must be redeemed upon maturity of the debentures in 2033. Interest on the preferred securities is the three-month term SOFR plus 2.85% plus a tenor spread adjustment of 0.026161% and is payable quarterly.3II ("Liberty Trust"). The debentures are the sole asset of Liberty Trust, and the Company is the sole owner of the common equity of Liberty Trust. Liberty Trust issued $6,000,000$10.0 million of preferred securities to investors.an investor. The Company makes interest payments and will make principal payments onCompany's obligations under the debentures toand related documents, taken together, constitute a full and unconditional guarantee by the Company of Liberty Trust's obligations under the preferred securities. The preferred securities issued by the Liberty Trust 3. These payments willare redeemable by the Company at its option. The preferred securities must be redeemed upon maturity of the source of funds used to retiredebentures in 2036. Interest on the preferred securities whichis the three-month term SOFR plus 1.48% plus a tenor spread adjustment of 0.026161% and is payable quarterly.redeemable at any time beginningnot included in 2012 and thereafter, and mature in 2037.the consolidated financial statements.this arrangementtwo Subordinated Note Purchase Agreements pursuant to provide fundingwhich the Company sold and issued $24.0 million in aggregate principal amount of 5.875% fixed-to-floating rate subordinated notes due 2028 (the "Notes due 2028") and $42.0 million in aggregate principal amount of 6.40% fixed-to-floating rate subordinated notes due 2033 (the “Notes due 2033”). In May of 2023, the Company redeemed all $24.0 million of the outstanding 5.875% fixed-to-floating rate subordinated notes due 2028.growth.. for certain equity exposures. In November 2019, the federal banking agencies adopted a rule revising the scope of commercial real estate mortgages subject to a 150% risk weight. Under the risk-based standard, capital is classified into two tiers. Tier 1 capital consists of common stockholders'stockholders’ equity, excluding the unrealized gain (loss) on available-for-sale securities, minus certain intangible assets. Tier 2 capital consists of the general reserve for loan losses, subject to certain limitations. An institution’s total risk-based capital for purposes of its risk-based capital ratio consists of the sum of its Tier 1 and Tier 2 capital. The risk-based regulatory minimum requirements are 6% for Tier 1 and 8% for total risk-based capital.2017, 20162023, 2022 and 2015.will also beis required to establish a “conservation buffer,” consisting of a common equity Tier 1 capital amount equal to 2.5% of risk-weighted assets to be phased in byeffective January 2019. An institution that does not meet the conservation buffer will be subject to restrictions on certain activities including payment of dividends, stock repurchases, and discretionary bonuses to executive officers.471capital1 capital ratio, an 8.0% Tier 1 capital ratio, and a 10.0% total capital ratio. To be adequately capitalized, those ratios are 4.0%, 4.5%, 6.0%, and 8.0%, respectively.non-accrual,nonaccrual, securitization exposures, and in certain cases mortgage servicing rights and deferred tax assets.will bewas phased-in beginning in 2016, and will taketook full effect on January 1, 2019. Certain calculations under the rules will also have phase-in periods. The Company The First Adequately Well December 31, December 31, Capital Ratios Capitalized Capitalized 2017 2016 2015 2017 2016 2015 Leverage 4.0 % 5.0 % 11.7 % 11.9 % 8.7 % 11.4 % 13.1 % 8.6 % Risk-based capital: Common equity Tier 1 4.5 % 6.5 % 14.2 % 13.8 % 8.1 % 14.5 % 16.2 % 11.0 % Tier 1 6.0 % 8.0 % 14.9 % 14.7 % 11.1 % 14.5 % 16.2 % 11.0 % Total 8.0 % 10.0 % 15.5 % 15.5 % 11.9 % 15.1 % 17.0 % 11.8 % Ratios 2017 2016 2015 Return on assets (net income applicable to common stockholders divided by average total assets) .60 % .79 % .75 % Return on equity (net income applicable to common stockholders divided by average equity) 6.2 % 8.0 % 8.6 % Dividend payout ratio (dividends per share divided by net income per common share) 13.5 % 9.6 % 9.7 % Equity to asset ratio (average equity divided by average total assets) 9.7 % 9.8 % 8.8 % Capital Ratios Adequately
CapitalizedWell
CapitalizedMinimum
Capital
Required
Basel III
Fully
Phased InThe Company
December 31,The First
December 31,2023 2022 2021 2023 2022 2021 Leverage 4.0 % 5.0 % 7.0 % 9.7 % 9.3 % 9.2 % 10.7 % 11.1 % 10.8 % Risk-based capital: Common equity Tier 1 4.5 % 6.5 % 7.0 % 12.1 % 12.7 % 13.7 % 13.8 % 15.6 % 16.6 % Tier 1 6.0 % 8.0 % 8.5 % 12.5 % 13.0 % 14.1 % 13.8 % 15.6 % 16.6 % Total 8.0 % 10.0 % 10.5 % 15.0 % 16.7 % 18.6 % 14.8 % 16.4 % 17.4 % Market Risk ManagementCompany'sCompany’s sources and uses of funds in order to meet its day-to-day cash flow requirements while maximizing profits. Liquidity represents the ability of a company to convert assets into cash or cash equivalents without significant loss and to raise additional funds by increasing liabilities. Liquidity management is made more complicated because different balance sheet components are subject to varying degrees of management control. For example, the timing of maturities of the investment portfolio is very predictable and subject to a high degree of control at the time investment decisions are made; however, net deposit inflows and outflows are far less48Company'sCompany’s federal funds sold position, which includes funds due from banks and interest-bearing deposits with banks, is typically its primary source of liquidity. Federal funds sold averaged $50.0$97.2 million during the year ended December 31, 20172023 and totaled $48.9averaged $366.5 million at December 31, 2017. Also,2022. In addition, the Company has available advances from the Federal Home Loan Bank.FHLB. Advances available are generally based upon the amount of qualified first mortgage loans which can be used for collateral. At December 31, 2017,2023, advances available totaled approximately $556.4 million$2.051 billion, of which $110.6$355.2 million had been drawn, or used for letters of credit.2017,2023, the market value of unpledged debt securities plus pledged securities in excess of current pledging requirements comprised $95.5$661.8 million of the Company’s investment balances, compared to $100.2 million$1.066 billion at December 31, 2016. The increase in unpledged debt from December 2017 compared to December 2016 is primarily due to an increase in unpledged investments and letters of credit utilized for pledging purposes.2022. Other forms of balance sheet liquidity include but are not necessarily limited to any outstanding federal funds sold and vault cash. The Company has a higher level of actual balance sheet liquidity than might otherwise be the case, since we utilize a letter of credit from the FHLB rather than investment securities for certain pledging requirements. That letter of credit, which is backed by loans that are pledged to the FHLB by the Company, totaled $17.5 million at December 31, 2017. Management is of the opinionbelieves that available investments and other potentially liquid assets, along with the standby funding sources it has arranged, are more than sufficient to meet the Company’s current and anticipated short-term liquidity needs.20172023 was 12.8%17.6%, as compared to internal liquidity policy guidelines of 10% minimum. Other liquidity ratios reviewed include the following along with policy guidelines for the periods indicated: December 31, 2017 Policy Maximum Loans to Deposits (including FHLB advances) 71.1 % 90.0 % In Policy Net Non-core Funding Dependency Ratio 5.8 % 20.0 % In Policy Fed Funds Purchased / Total Assets 0.0 % 10.0 % In Policy FHLB Advances / Total Assets 4.9 % 20.0 % In Policy FRB Advances / Total Assets 0.0 % 10.0 % In Policy Pledged Securities to Total Securities 77.6 % 90.0 % In Policy December 31, 2016 Policy Maximum Loans to Deposits (including FHLB advances) 79.1 % 90.0 % In Policy Net Non-core Funding Dependency Ratio 8.3 % 30.0 % In Policy Fed Funds Purchased / Total Assets 0.4 % 10.0 % In Policy FHLB Advances / Total Assets 3.9 % 20.0 % In Policy FRB Advances / Total Assets 0.0 % 10.0 % In Policy Pledged Securities to Total Securities 66.6 % 90.0 % In Policy December 31, 2015 Policy Maximum Loans to Deposits (including FHLB advances) 75.4 % 90.0 % In Policy Net Non-core Funding Dependency Ratio 13.8 % 30.0 % In Policy Fed Funds Purchased / Total Assets 0.9 % 10.0 % In Policy FHLB Advances / Total Assets 8.9 % 20.0 % In Policy FRB Advances / Total Assets 0.0 % 10.0 % In Policy Pledged Securities to Total Securities 84.7 % 90.0 % In Policy Continued growth in core deposits and relatively high levels of potentially liquid investments have had a positive impact on our liquidity position in recent periods, but no assurance can be provided that our liquidity will continue at current robust levels.49December 31, 2023 Loans to Deposits (including FHLB advances) 79.3 % 90.0 % In Policy Net Non-core Funding Dependency Ratio 8.3 % 20.0 % In Policy Fed Funds Purchased / Total Assets 0.0 % 10.0 % In Policy FHLB Advances / Total Assets 0.0 % 20.0 % In Policy FRB Advances / Total Assets 5.0 % 10.0 % In Policy Pledged Securities to Total Securities 58.6 % 90.0 % In Policy December 31, 2022 Loans to Deposits (including FHLB advances) 67.9 % 90.0 % In Policy Net Non-core Funding Dependency Ratio 4.4 % 20.0 % In Policy Fed Funds Purchased / Total Assets 0.0 % 10.0 % In Policy FHLB Advances / Total Assets 2.0 % 20.0 % In Policy FRB Advances / Total Assets 0.0 % 10.0 % In Policy Pledged Securities to Total Securities 46.9 % 90.0 % In Policy December 31, 2021 Policy Maximum Loans to Deposits (including FHLB advances) 55.8 % 90.0 % In Policy Net Non-core Funding Dependency Ratio (14.6) % 20.0 % In Policy Fed Funds Purchased / Total Assets 0.0 % 10.0 % In Policy FHLB Advances / Total Assets 0.0 % 20.0 % In Policy FRB Advances / Total Assets 0.0 % 10.0 % In Policy Pledged Securities to Total Securities 48.5 % 90.0 % In Policy 2017,2023, fixed and determinable contractual obligations to third parties by payment date. Amounts in the table do not include accrued or accruing interest. Payments related to leases are based on actual payments specified in the underlying contracts. Further discussion of the nature of each obligation is included in the referenced note to the consolidated financial statements included elsewhere in this Form 10-K.(In thousands) Note
Reference Within One
Year After One But
Within Three
Years After Three
But Within
Five Years After
Five
Years Total Deposits without a stated maturity G $ 1,187,289 $ - $ - $ - $ 1,187,289 Time deposits G 152,550 105,098 25,628 - 283,276 Borrowings H 93,572 10,500 - - 104,072 Operating lease obligations I 586 257 343 312 1,498 Capital lease obligations I 275 466 175 - 916 Trust preferred subordinated debentures N - - - 10,310 10,310 Total Contractual obligations $ 1,434,272 $ 116,321 $ 26,146 $ 10,622 $ 1,587,361 ($ in thousands) Note
ReferenceWithin One
YearAfter One
But Within
Three YearsAfter Three
But Within
Five YearsAfter Five
YearsTotal Deposits without a stated maturity G $ 5,387,116 $ — $ — $ — $ 5,387,116 Time deposits G 971,259 73,460 22,510 8,527 1,075,756 Borrowings H 390,000 — — — 390,000 Lease obligations I 1,240 2,225 1,825 2,999 8,289 Trust preferred subordinated debentures N — — — 25,016 25,016 Subordinated note purchase agreement N — — — 98,370 98,370 Total Contractual obligations $ 6,749,615 $ 75,685 $ 24,335 $ 134,912 $ 6,984,547 Impact of InflationUnlike most industrial companies, the assets and liabilities of financial institutions such as the Company are primarily monetary in nature. Therefore, interest rates have a more significant effect on the Company's performance than do the effects of changes in the general rate of inflation and change in prices. In addition, interest rates do not necessarily move in the same direction or in the same magnitude as the prices of goods and services. As discussed previously, management seeks to manage the relationships between interest sensitive assets and liabilities in order to protect against wide interest rate fluctuations, including those resulting from inflation.ITEM 7A.QUANTITATIVE AND QUALITATIVE DISCLOSURES ABOUT MARKET RISK50Management’smanagement’s assumptions on pricing, duration, and optionality for anticipated new volumes. Various rate scenarios consisting of key rate and yield curve projections are then applied in order to calculate the expected effect of a given interest rate change on interest income, interest expense, and the value of the Company’s financial instruments. The rate projections can be shocked (an immediate and parallel change in all base rates, up or down), ramped (an incremental increase or decrease in rates over a specified time period), economic (based on current trends and econometric models) or stable (unchanged from current actual levels).100 basis100-basis point (bp) interest rate shock, 10% for a 200 bp shock, 15% for a 300 bp shock, and 20% for a 400 bp shock. As of December 31, 2017,2023, the Company had the following estimated net interest income, sensitivity profiles, without factoring in any potential negative impact on spreads resulting from competitive pressures or credit quality deterioration:December 31, 2017 Net Interest Income at Risk – Sensitivity Year 1 ($ In Thousands) -200 bp -100 bp STATIC +100 bp +200 bp +300 bp +400 bp Net Interest Income 54,702 56,491 60,023 61,041 60,588 58,764 55,384 Dollar Change -5,321 -3,532 1,018 565 -1,259 -4,639 NII @ Risk - Sensitivity Y1 -8.9 % -5.9 % 1.7 % 0.9 % -2.1 % -7.7 % December 31, 2023 Net Interest Income at Risk – Sensitivity Year 1 ($ in thousands) -200 bp -100 bp STATIC +100 bp +200 bp +300 bp +400 bp Net Interest Income 236,936 232,589 231,521 233,208 226,151 210,556 187,595 Dollar Change 5,415 1,068 1,687 (5,370) (20,965) (43,926) NII @ Risk - Sensitivity Year 1 2.3 % 0.5 % 0.7 % (2.3) % (9.1) % (19.0) % $5.3$5.4 million lowerhigher than in a stable interest rate scenario, for a negative variance of 8.9%2.3%. The unfavorable variance increases if rates were to drop below 200 basis points, due to the fact that certain deposit rates are already relatively low (on NOW accounts and savings accounts, for example), and will hit a natural floor of close to zero while non-floored variable-rate loan yields continue to drop. This effect is exacerbated by accelerated prepayments on fixed-rate loans and mortgage-backed securities when rates decline, although rate floors on some of our variable-rate loans partially offset other negative pressures. While we view further interest rate reductions as highly unlikely, the potential percentage drop in net interest income exceeds our internal policy guidelines in declining interest rate scenarios and we will continue to monitor our interest rate risk profile and take corrective action as deemed appropriate.improvedecrease by $0.5$5.4 million, or 0.9%(2.3)%, if interest rates were to increase by 200 basis points relative to a stable interest rate scenario, with the favorable variance expanding the higher interest rates rise.scenario. The initial increase in rising rate scenarios will be limited to some extent by the fact that some of our variable-rate loans are currently at rate floors, resulting in a re-pricing lag while base rates are increasing to floored levels, but we believe the Company still would benefit from a material upward shift in the yield curve.one yearone-year cumulative GAP ratio was approximately 221.83%118.0% at December 31, 2017 and 199.4%2023, 180.0% at December 31, 2016,2022 and 164.5% at December 31, 2021. The Company is considered “asset-sensitive” which means that there are more assets repricing than liabilities within the first year. The Company is “asset-sensitive.” The Company’s one year cumulative GAP ratio was approximately 168.3% at December 31, 2015, which meant that there were more liabilities repricing than assets within the first year. These results are based on cash flows from assumptions of assets and liabilities that reprice (maturities, likely calls, prepayments, etc.) Typically, the net interest income of asset-sensitive companies should improve with rising rates and decrease with declining rates. “surge” core deposits which flowed into the Company in the most recent economic cycle, and potential unfavorable movement in deposit rates relative to yields on earning assets. Even though net interest income will naturally be lower with no balance sheet growth, the rate-driven variances projected for net interest income in a static growth environment are similar to the changes noted above for our standard projections. When a greater level of non-maturity deposit runoff is assumed or unfavorable deposit rate changes are factored into the model, projected net interest income in declining rate and flat rate scenarios does not change materially relative to standard growth projections. However, the benefit we would otherwise experience in rising rate scenarios is minimized and net interest income remains relatively flat.51Management’smanagement’s best estimates. The table below shows estimated changes in the Company’s EVE as of the periods indicated under different interest rate scenarios relative to a base case of current interest rates: December 31, 2017 - Balance Sheet Shock (Dollars in thousands) -200 bp -100 bp STATIC
(Base) +100 bp +200 bp +300 bp +400 bp Market Value of Equity 274,743 252,585 320,631 375,144 412,957 437,500 449,926 Change in EVE from base -45,888 -68,046 54,513 92,326 116,896 129,295 % Change -14.3 % -21.2 % 17.0 % 28.8 % 36.5 % 40.3 % Policy Limits -20.0 % -10.0 % -10.0 % -20.0 % -30.0 % -40.0 % December 31, 2016 - Balance Sheet Shock (Dollars in thousands) -200 bp -100 bp STATIC
(Base) +100 bp +200 bp +300 bp +400 bp Market Value of Equity 315,609 323,038 356,983 384,268 406,044 424,054 438,668 Change in EVE from base -41,374 -33,945 27,285 49,061 67,071 81,685 % Change -11.6 % -9.5 % 7.6 % 13.7 % 18.8 % 22.9 % Policy Limits -20.00 % -10.00 % -10.00 % -20.00 % -30.00 % -40.00 % The tables show that our EVE will generally deteriorate in declining rate scenarios, but should benefit from a parallel shift upward in the yield curve. As noted previously, however, Management is of the opinion that the potential for a significant rate decline is low. December 31, 2023 - Balance Sheet Shock ($ in thousands) -200 bp -100 bp STATIC
(Base)+100 bp +200 bp +300 bp +400 bp Market Value of Equity 1,286,790 1,321,286 1,354,363 1,362,597 1,327,813 1,263,361 1,187,080 Change in EVE from base (67,573) (33,077) 8,234 (26,550) (91,002) (167,283) % Change (5.0) % (2.4) % 0.6 % (2.0) % (6.7) % (12.4) % Policy Limits (20.0) % (10.0) % (10.0) % (20.0) % (30.0) % (40.0) % December 31, 2022 - Balance Sheet Shock ($ in thousands) -200 bp -100 bp STATIC
(Base)+100 bp +200 bp +300 bp +400 bp Market Value of Equity 1,366,982 1,410,341 1,397,164 1,366,639 1,316,226 1,248,624 1,165,069 Change in EVE from base (30,182) 13,177 (30,525) (80,938) (148,540) (232,095) % Change (2.2) % 0.9 % (2.2) % (5.8) % (10.6) % (16.6) % Policy Limits (20.0) % (10.0) % (10.0) % (20.0) % (30.0) % (40.0) % 52ITEM 8.FINANCIAL STATEMENTS AND SUPPLEMENTARY DATAREPORT OF INDEPENDENTREGISTERED PUBLIC ACCOUNTING FIRMShareholders ofand subsidiary (the "Company"“Company”) as of December 31, 20172023 and 2016,2022, the related consolidated statements of income, comprehensive income changes in(loss), stockholders’ equity and cash flows for each of the three years in the three-year period ended December 31, 2017,2023, and the related notes (collectively referred to as the “financial statements”). In our opinion, the consolidated financial statements referred to above present fairly, in all material respects, the financial position of the Company as of December 31, 20172023 and 2016,2022, and the results of its operations and its cash flows for each of the three years in the three-year period ended December 31, 2017,2023, in conformity with theaccounting principles generally accepted accounting principles in the United States of America.2017,2023, based on criteria established in Internal Control-IntegratedControl – Integrated Framework (2013) issued by the Committee of Sponsoring Organizations of the Treadway Commission (2013 framework)(COSO) and our report dated March 16, 2018,February 29, 2024, expressed an unqualified opinion thereon.Company'sCompany’s management. Our responsibility is to express an opinion on the Company'sCompany’s financial statements based on our audits.53auditaudits to obtain reasonable assurance about whether the financial statements are free of material misstatement, whether due to error or fraud.includedinclude examining, on a test basis, evidence regarding the amounts and disclosures in the financial statements. Our audits also included evaluating the accounting principles used and significant estimates made by management, as well as evaluating the overall presentation of the financial statements. We believe that our audits provide a reasonable basis for our opinion./s/T.E. Lott & Companyauditorsauditor since 1996.Columbus,2021.March 16, 20185420172023 AND 2016 2017 2016 ASSETS Cash and due from banks $ 42,980,353 $ 31,719,187 Interest-bearing deposits with banks 48,466,424 29,974,698 Federal funds sold 475,000 425,000 Total cash and cash equivalents 91,921,777 62,118,885 Held-to-maturity securities (fair value of $7,397,966 in 2017 and $7,393,828 in 2016) 6,000,000 6,000,000 Available-for-sale securities 356,893,081 243,205,963 Other securities 9,969,200 6,592,750 Total securities 372,862,281 255,798,713 Loans held for sale 4,790,049 5,879,884 Loans, net of allowance for loan losses of $8,288,009 in 2017 and $7,510,314 in 2016 1,217,017,663 859,543,789 Interest receivable 6,704,915 4,358,098 Premises and equipment 46,426,031 34,624,352 Cash surrender value of life insurance 27,053,909 21,250,476 Goodwill 19,959,849 13,776,040 Other real estate owned 7,158,409 6,007,621 Other assets 19,343,560 14,009,388 Total assets $ 1,813,238,443 $ 1,277,367,246 LIABILITIES AND STOCKHOLDERS’ EQUITY Deposits: Non-interest-bearing $ 301,988,781 $ 202,478,442 Interest-bearing 1,168,575,736 836,712,820 Total deposits 1,470,564,517 1,039,191,262 Interest payable 353,143 306,080 Borrowed funds 104,072,294 69,000,000 Subordinated debentures 10,310,000 10,310,000 Other liabilities 5,470,569 4,033,197 Total liabilities 1,590,770,523 1,122,840,539 Stockholders’ Equity: Common stock, par value $1 per share: 20,000,000 shares authorized; 11,192,401 shares issued in 2017, and 9,017,891 shares issued in 2016, respectively 11,192,401 9,017,891 Additional paid-in capital 158,455,979 102,574,159 Retained earnings 53,720,927 44,476,386 Accumulated other comprehensive income (loss) (437,742 ) (1,078,084 ) Treasury stock, at cost (463,645 ) (463,645 ) Total stockholders’ equity 222,467,920 154,526,707 Total liabilities and stockholders’ equity $ 1,813,238,443 $ 1,277,367,246 2023 2022 ASSETS Cash and due from banks $ 224,199 $ 67,176 Interest-bearing deposits with banks 130,948 78,139 Total cash and cash equivalents 355,147 145,315 Securities available-for-sale, at fair value (amortized cost: $1,164,227 in 2023; $1,418,337 in 2022; allowance for credit losses: $0 in both 2023 and 2022) 1,042,365 1,257,101 Securities held to maturity, net of allowance for credit losses of $0 (fair value: $615,944 - 2023; $642,097 - 2022) 654,539 691,484 Other securities 37,754 33,944 Total securities 1,734,658 1,982,529 Loans held for sale 2,914 4,443 Loans, net of ACL of $54,032 in 2023 and $38,917 in 2022 5,116,010 3,735,240 Interest receivable 33,300 27,723 Premises and equipment 174,309 143,518 Operating lease right-of-use assets 6,387 7,620 Finance lease right-of-use assets 1,466 1,930 Cash surrender value of life insurance 134,249 95,571 Goodwill 272,520 180,254 Other real estate owned 8,320 4,832 Other assets 160,065 132,742 Total assets $ 7,999,345 $ 6,461,717 LIABILITIES AND STOCKHOLDERS' EQUITY Deposits: Non-interest-bearing $ 1,849,013 $ 1,630,203 Interest-bearing 4,613,859 3,864,201 Total deposits 6,462,872 5,494,404 Interest payable 22,702 3,324 Borrowed funds 390,000 130,100 Subordinated debentures 123,386 145,027 Operating lease liabilities 6,550 7,810 Finance lease liabilities 1,739 1,918 Allowance for credit losses on off-balance sheet credit exposures 2,075 1,325 Other liabilities 40,987 31,146 Total liabilities 7,050,311 5,815,054 Stockholders’ Equity: Common stock, par value $1 per share: 80,000,000 shares authorized; 32,338,983 shares issued in 2023, 40,000,000 shares authorized, and 25,275,369 shares issued in 2022, respectively 32,339 25,275 Additional paid-in capital 775,232 558,833 Retained earnings 300,150 252,623 Accumulated other comprehensive (loss) income (117,576) (148,957) Treasury stock, at cost (1,249,607 shares - 2023; 1,249,607 shares - 2022) (41,111) (41,111) Total stockholders' equity 949,034 646,663 Total liabilities and stockholders' equity $ 7,999,345 $ 6,461,717 552017, 2016,2023, 2022, AND 2015 2017 2016 2015 INTEREST INCOME Interest and fees on loans $ 56,826,566 $ 38,495,909 $ 34,242,067 Interest and dividends on securities: Taxable interest and dividends 6,340,610 4,052,162 3,948,459 Tax-exempt interest 2,349,889 1,869,644 1,854,213 Interest on federal funds sold 389,881 126,833 63,841 Interest on deposits in banks 162,467 59,449 93,276 Total interest income 66,069,413 44,603,997 40,201,856 INTEREST EXPENSE Interest on deposits 5,261,318 3,443,812 2,562,241 Interest on borrowed funds 1,647,933 871,523 645,207 Total interest expense 6,909,251 4,315,335 3,207,448 Net interest income 59,160,162 40,288,662 36,994,408 Provision for loan losses 505,653 625,271 410,069 Net interest income after provision for loan losses 58,654,509 39,663,391 36,584,339 OTHER INCOME Service charges on deposit accounts 7,358,531 5,125,846 5,013,983 Other service charges and fees 623,706 531,162 470,842 Secondary market mortgage income 4,501,618 4,432,705 1,075,118 Bank owned life insurance income 738,659 528,734 408,535 Gain (Loss) on sale of premises (22,123 ) (51,838 ) 133,339 Securities gains (losses) (15,889 ) 126,286 - Loss on sale of other real estate (198,296 ) (113,755 ) (246,859 ) Other 1,376,906 668,194 733,574 Total other income 14,363,112 11,247,334 7,588,532 OTHER EXPENSE Salaries 25,828,269 17,880,844 15,089,136 Employee benefits 4,719,821 4,255,690 3,447,367 Occupancy 4,827,711 3,459,206 3,422,116 Furniture and equipment 1,224,655 1,261,506 1,198,930 Supplies and printing 640,171 286,880 300,022 Professional and consulting fees 6,756,847 1,805,420 1,331,928 Marketing and public relations 405,552 465,344 496,638 FDIC and OCC assessments 1,252,434 1,019,668 965,642 ATM expense 1,187,614 882,657 763,248 Bank communications 1,295,932 782,024 631,261 Data processing 1,039,210 534,648 150,394 Other 6,268,117 4,227,812 4,364,440 Total other expense 55,446,333 36,861,699 32,161,122
2021562023 2022 2021 INTEREST INCOME Interest and fees on loans $ 294,541 $ 157,768 $ 151,203 Interest and dividends on securities: Taxable interest and dividends 32,202 29,656 16,685 Tax-exempt interest 11,737 11,017 7,721 Interest on deposits in banks 2,453 1,952 1,136 Total interest income 340,933 200,393 176,745 INTEREST EXPENSE Interest on deposits 71,359 13,978 12,062 Interest on borrowed funds 20,249 8,599 7,619 Total interest expense 91,608 22,577 19,681 Net interest income 249,325 177,816 157,064 Provision for credit losses, LHFI 13,750 5,350 (1,456) Provision for credit losses, OBSC exposures 750 255 352 Net interest income after provision for credit losses 234,825 172,211 158,168 NON-INTEREST INCOME Service charges on deposit accounts 14,175 8,668 7,264 Other service charges and fees 3,177 1,833 1,508 Interchange fees 18,914 12,702 11,562 Secondary market mortgage income 2,866 4,303 8,823 Bank owned life insurance income 3,319 2,101 1,955 BOLI death proceeds — 1,630 — Gain (loss) on sale of premises 35 (116) (264) Securities (loss) gain (9,716) (82) 143 Gain (loss) on sale of other real estate 6 214 (300) Government awards/grants 6,197 873 1,826 Bargain purchase gain — 281 1,300 Other 7,732 4,554 3,656 Total non-interest income 46,705 36,961 37,473 NON-INTEREST EXPENSE Salaries 76,609 57,903 53,371 Employee benefits 16,803 15,174 12,485 Occupancy 17,381 12,854 12,713 Furniture and equipment 3,987 2,981 2,848 Supplies and printing 1,240 967 903 Professional and consulting fees 6,446 3,558 4,035 Marketing and public relations 833 393 615 FDIC and OCC assessments 3,849 2,122 2,074 ATM expense 5,821 3,873 3,623 Bank communications 3,579 1,904 1,754 Data processing 2,771 2,211 1,578 Acquisition expense/charter conversion 9,075 6,410 1,607 Other 36,332 20,133 16,953 Total non-interest expense 184,726 130,483 114,559 2017, 2016,2023, 2022, AND 2015Continued: 2017 2016 2015 Income before income taxes $ 17,571,288 $ 14,049,026 $ 12,011,749 Income taxes 6,954,812 3,930,339 3,213,047 Net income 10,616,476 10,118,687 8,798,702 Preferred dividends and stock accretion - 452,305 342,460 Net income applicable to common stockholders $ 10.616,476 $ 9,666,382 $ 8,456,242 Net income per share: Basic $ 1.12 $ 1.86 $ 1.64 Diluted 1.11 1.64 1.62 Net income applicable to common stockholders: Basic $ 1.12 $ 1.78 $ 1.57 Diluted 1.11 1.57 1.55 Continued: 2023 2022 2021 Income before income taxes $ 96,804 $ 78,689 $ 81,082 Income taxes 21,347 15,770 16,915 Net income available to common stockholders $ 75,457 $ 62,919 $ 64,167 Earnings per share: Basic $ 2.41 $ 2.86 $ 3.05 Diluted 2.39 2.84 3.03 572017, 2016,2023, 2022, AND 2015 2017 2016 2015 Net income $ 10,616,476 $ 10,118,687 $ 8,798,702 Other comprehensive income: Unrealized gains on securities: Unrealized holding gains (losses) arising during the period on available-for-sale securities 1,080,344 (3,315,089 ) (1,093,182 ) Reclassification adjustment for (gains) losses included net income 15,889 (126,286 ) - Unrealized holding gains (losses) arising during the period on available-for-sale securities 1,096,233 (3,441,375 ) (1,093,182 ) Unrealized holding gains (losses) on loans held for Sale 79,759 (99,283 ) 2,753 Income tax benefit (expense) (459,522 ) 1,363,987 370,655 Other comprehensive income (loss) 716,470 (2,176,671 ) (719,774 ) Comprehensive income $ 11,332,946 $ 7,942,016 $ 8,078,928 ($ in thousands) 2023 2022 2021 Net income $ 75,457 $ 62,919 $ 64,167 Other comprehensive income (loss): Unrealized holding gain/(loss) arising during the period on available-for-sale securities 31,921 (173,428) (23,738) Net unrealized loss at time of transfer on securities available-for-sale transferred to held-to-maturity — (36,838) — Reclassification adjustment for (accretion) amortization of unrealized holdings gain/(loss) included in accumulated other comprehensive income from the transfer of securities available-for-sale to held-to-maturity 372 97 — Reclassification adjustment for loss/(gains) included in net income 9,716 82 (143) Unrealized holding gain/(loss) arising during the period on available-for-sale securities 42,009 (210,087) (23,881) Income tax (expense) benefit (10,628) 53,152 6,043 Other comprehensive income (loss) 31,381 (156,935) (17,838) Comprehensive income (loss) $ 106,838 $ (94,016) $ 46,329 58STOCKHOLDERS'STOCKHOLDERS’ EQUITY2017, 2016,2021, 2022 AND 2015 Total Balance, January 1, 2015 $ 5,342,670 $ 17,123,000 $ 283,738 $ 44,136,411 $ 27,975,049 $ 1,818,361 $ (463,645 ) $ 96,215,584 Net income 2015 - - - - 8,798,702 - - 8,798,702 Other comprehensive loss - - - - - (719,774 ) - (719,774 ) Dividends on preferred stock - - - - (342,460 ) - - (342,460 ) Cash dividend declared, $.15 per common share - - - - (806,576 ) - - (806,576 ) Grant of restricted stock 69,327 - - (69,327 ) - - - - Compensation cost on restricted stock - - - 721,124 - - - 721,124 Repurchase of restricted stock for payment of taxes (6,324 ) - - (86,066 ) - - - (92,390 ) Adjustment to consideration issued in BCB Holding acquisition (2,514 ) - - (33,196 ) - - - (35,710 ) Repurchase warrants - - (283,738 ) (18,672 ) - - - (302,410 ) Balance, December 31, 2015 $ 5,403,159 $ 17,123,000 $ - $ 44,650,274 $ 35,624,715 $ 1,098,587 $ (463,645 ) $ 103,436,090 Net income 2016 - - - - 10,118,687 - - 10,118,687 Other comprehensive loss - - - - - (2,176,671 ) - (2,176,671 )
202359Common Stock Additional
Paid-in
CapitalRetained
EarningsAccumulated
Other
Comprehensive
Income
(Loss)Treasury Stock Total Shares Amount Shares Amount Balance, January 1, 2021 21,598,993 $ 21,599 $ 456,919 $ 154,241 $ 25,816 (483,984) $ (13,760) $ 644,815 Net income, 2021 — — — 64,167 — 64,167 Common stock repurchased — — — — — (165,623) (5,171) (5,171) Other comprehensive loss — — — — (17,838) — — (17,838) Dividend on common stock, $.58 per common share — — — (12,180) — — — (12,180) Issuance restricted stock grant 93,578 94 (94) — — — — — Restricted stock grant forfeited (2,021) (2) 2 — — — — — Compensation expense — — 3,100 — — — — 3,100 Repurchase of restricted stock for payment of taxes (21,906) (22) (699) — — — — (721) Balance, December 31, 2021 21,668,644 $ 21,669 $ 459,228 $ 206,228 $ 7,978 (649,607) $ (18,931) $ 676,172 Net income, 2022 — — — 62,919 — — — 62,919 Common stock repurchased — — — — — (600,000) (22,180) (22,180) Other comprehensive loss — — — — (156,935) — — (156,935) Dividend on common stock, $.74 per common share — — — (16,524) — — — (16,524) Issuance of common shares for BBI acquisition 3,498,936 3,499 97,970 — — — — 101,469 Issuance restricted stock grant 129,950 130 (130) — — — — — Restricted stock grant forfeited (2,500) (3) 3 — — — — — Compensation expense — — 2,425 — — — — 2,425 Repurchase of restricted stock for payment of taxes (19,661) (20) (663) — — — — (683) Balance, December 31, 2022 25,275,369 $ 25,275 $ 558,833 $ 252,623 $ (148,957) (1,249,607) $ (41,111) $ 646,663 Net income, 2023 — — — 75,457 — — — 75,457 Other comprehensive income — — — — 31,381 — — 31,381 Dividend on common stock, $.90 per common share — — — (27,930) — — — (27,930) Issuance of common shares for HSBI acquisition 6,920,422 6,920 214,602 — — — — 221,522 Issuance restricted stock grant 167,173 167 (167) — — — — — Restricted stock grant forfeited (12,194) (12) 12 — — — — — Compensation expense — — 2,302 — — — — 2,302 Repurchase of restricted stock for payment of taxes (11,787) (11) (350) — — — — (361) Balance, December 31, 2023 32,338,983 $ 32,339 $ 775,232 $ 300,150 $ (117,576) (1,249,607) $ (41,111) $ 949,034 CHANGES IN STOCKHOLDERS' EQUITY2017, 2016,2023, 2022 AND 2015Continued: Total Dividends on preferred stock - - - - (452,305 ) - - (452,305 ) Cash dividend declared, $.15 per common share - - - - (814,711 ) - - (814,711 ) Grant of restricted stock 61,247 - - (61,247 ) - - - - Compensation cost on restricted stock - - - 772,311 - - - 772,311 Repurchase of restricted stock for payment of taxes (9,895 ) - - (166,217 ) - - - (176,112 ) Repayment of CDCI preferred shares - (17,123,000 ) - 1,198,000 - - - (15,925,000 ) Issuance of Preferred Stock, Series E - 63,249,996 - - - - - 63,249,996 Conversion of Preferred, Series E to common 3,563,380 (63,249,996 ) - 59,686,616 - - - - Costs associated with capital raise - - - (3,505,578 ) - - - (3,505,578 ) Balance, December 31, 2016 $ 9,017,891 $ - $ - $ 102,574,159 $ 44,476,386 $ (1,078,084 ) $ (463,645 ) $ 154,526,707 Net income, 2017 - - - - 10,616,476 - - 10,616,476 Other comprehensive Income - - - - - 716,470 - 716,470
202160($ in thousands) 2023 2022 2021 CASH FLOWS FROM OPERATING ACTIVITIES Net income $ 75,457 $ 62,919 $ 64,167 Adjustments to reconcile net income to net cash provided by operating activities: Depreciation and amortization 12,099 12,173 13,792 FHLB stock dividends (355) (28) (27) Provision for credit losses 14,500 5,605 (1,104) Deferred income taxes 7,006 940 1,739 Restricted stock expense 2,302 2,425 3,100 Increase in cash value of life insurance (3,319) (2,101) (1,955) Amortization and accretion, net, related to acquisitions (4,432) 1,706 (30) Bank premises and equipment loss/(gain) (35) 116 264 Acquisition gain — (281) (1,300) Securities loss (gain) 9,716 82 (143) Loss on sale/writedown of other real estate 774 159 815 Residential loans originated and held for sale (91,786) (152,776) (230,456) Proceeds from sale of residential loans held for sale 93,315 156,011 244,210 Changes in: Interest receivable (1,228) (2,987) 3,218 Other assets 16,086 (45,692) (1,056) Interest payable 19,378 1,613 (463) Operating lease liability (1,260) (1,306) (1,839) Other liabilities (39,710) 51,449 2,783 Net cash provided by operating activities 108,508 90,027 95,715 CASH FLOWS FROM INVESTING ACTIVITIES Available-for-sale securities: Sales 285,793 21,069 — Maturities, prepayments, and calls 132,919 197,417 229,091 Purchases (8,473) (6,500) (988,536) Held-to-maturity securities: Maturities, prepayments, and calls 40,469 474 — Purchases — (602,718) — Purchases of other securities (17,094) (11,444) — Proceeds from redemption of other securities 14,466 1,237 5,276 Net (increase)/decrease in loans (227,896) (326,113) 202,194 Net changes to premises and equipment (3,688) (15,522) (7,125) Bank-owned life insurance - death proceeds 221 1,630 — Purchase of bank owned life insurance — — (11,733) Proceeds from sale of other real estate owned 3,069 8,930 4,562 Proceeds from sale of land 1,416 712 — Cash received in excess of cash paid for acquisition 106,793 23,939 358,916 Net cash provided by (used in) investing activities 327,995 (706,889) (207,355) CHANGES IN STOCKHOLDERS' EQUITY2017, 2016, and 2015Continued: Total Reclassification of accumulated other comprehensive income due to statutory tax changes - - - - 76,128 (76,128 ) - - Cash dividend declared, $.15 per common share - - - - (1,448,063 ) - - (1,448,063 ) Issuance of common shares 2,012,500 - - 56,350,000 - - - 58,362,500 Costs associated with capital raise - - - (3,091,875 ) - - - (3,091,875 ) Repurchase of restricted stock for payment of taxes (11,867 ) - - (317,720 ) - - - (329,587 ) Grant of restricted stock 84,286 - - (84,286 ) - - - - Compensation cost on restricted stock - - - 866,558 - - - 866,558 Issuance of shares for GCCB acquisition 89,591 - - 2,159,143 - - - 2,248,734 Balance, December 31, 2017 $ 11,192,401 $ - $ - $ 158,455,979 $ 53,720,927 $ (437,742 ) $ (463,645 ) $ 222,467,920 Continued: 2023 2022 2021 CASH FLOWS FROM FINANCING ACTIVITIES Increase/(decrease) in deposits (427,481) (223,322) 601,575 Proceeds from borrowed funds 7,600,043 2,055,401 — Repayment of borrowed funds (7,340,143) (1,950,301) (114,647) Dividends paid on common stock (27,550) (16,275) (11,991) Cash paid to repurchase common stock — (22,180) (5,171) Repurchase of restricted stock for payment of taxes (361) (683) (721) Principal payment on finance lease liabilities (179) (176) (187) Payment on subordinated debt issuance costs — — (59) Called/repayment of subordinated debt (31,000) — — Net cash (used in) provided by financing activities (226,671) (157,536) 468,799 Net change in cash and cash equivalents 209,832 (774,398) 357,159 Cash and cash equivalents at beginning of year 145,315 919,713 562,554 Cash and cash equivalents at end of year $ 355,147 $ 145,315 $ 919,713 Supplemental disclosures: Cash paid during the year for: Interest $ 51,101 $ 16,932 $ 16,368 Income taxes, net of refunds 16,084 7,194 15,717 Non-cash activities: Transfers of loans to other real estate 6,602 2,560 2,143 Transfer of securities available-for-sale to held-to-maturity — 139,598 — Issuance of restricted stock grants 168 130 94 Stock issued in connection with BBI acquisition — 101,469 — Stock issued in connection with HSBI acquisition 221,522 — — Dividends on restricted stock grants 380 249 189 Right-of-use assets obtained in exchange for operating lease liabilities 817 2,698 168 Lease liabilities arising from BBI acquisition — 3,390 — Lease liabilities arising from HSBI acquisition 184 — — 61CONSOLIDATED STATEMENTS OF CASH FLOWSYEARS ENDED DECEMBER 31, 2017, 2016 AND 2015 2017 2016 2015 CASH FLOWS FROM OPERATING ACTIVITIES Net income $ 10,616,476 $ 10,118,687 $ 8,798,702 Adjustments to reconcile net income to net cash provided by operating activities: Depreciation and amortization 2,902,328 2,302,163 2,296,985 FHLB Stock dividends (54,400 ) (37,700 ) (8,600 ) Provision for loan losses 505,653 625,271 410,069 Deferred income taxes 6,445,865 (10,352 ) 255,638 Restricted stock expense 866,558 772,311 721,124 Increase in cash value of life insurance (738,659 ) (528,734 ) (408,535 ) Amortization and accretion, net, related to acquisitions 1,736,818 629,304 921,853 Loss/ (Gain) on sale of land/bank premises/ equipment 22,123 51,838 (133,339 ) Securities gains (losses) 15,889 (126,286 ) - Loss on sale/writedown of other real estate 891,617 244,466 386,590 Changes in: Loans held for sale 1,169,594 (2,005,402 ) (1,867,661 ) Interest receivable (714,501 ) (404,760 ) (294,332 ) Other assets 1,837,728 (3,553,728 ) (2,055,005 ) Interest payable 29,826 60,348 (70,112 ) Other liabilities (3,934,866 ) (121,118 ) (1,406,347 ) Net cash provided by operating activities 21,598,049 8,016,308 7,547,030 CASH FLOWS FROM INVESTING ACTIVITIES Purchases of available-for-sale securities (89,196,412 ) (53,403,251 ) (29,571,287 ) Purchases of other securities (2,890,850 ) (1,433,100 ) (4,079,400 ) Proceeds from maturities and calls of available- for-sale securities 57,995,529 45,296,821 42,569,677 Proceeds from maturities and calls of held-to- maturity securities - 1,094,138 1,099,898 Proceeds from sales of securities available-for- sale 7,731,444 250,000 - Proceeds from redemption of other securities 682,100 3,012,900 3,187,500 Increase in loans (121,437,376 ) (98,560,749 ) (68,588,377 ) Net additions to premises and equipment (4,675,400 ) (2,706,842 ) (1,230,531 ) Purchase of bank owned life insurance (468,834 ) (5,850,000 ) - Proceeds from sale of land/bank premises - - 949,516 Proceeds from sale of other real estate owned 6,945,936 1,560,773 2,190,625 Cash received (paid) in excess of cash paid for acquisition 3,910,489 - (843,895 ) Net cash used in investing activities (141,403,374 ) (110,739,310 ) (54,316,274 ) The accompanying notes are an integral part of these statements.62THE FIRST BANCSHARES, INC.CONSOLIDATED STATEMENTS OF CASH FLOWSYEARS ENDED DECEMBER 31, 2017, 2016 AND 2015Continued: 2017 2016 2015 CASH FLOWS FROM FINANCING ACTIVITIES Increase in deposits 75,916,176 122,496,150 24,090,591 Proceeds from borrowed funds 198,800,000 252,000,000 194,340,000 Repayment of borrowed funds (173,633,473 ) (293,321,245 ) (173,468,821 ) Dividends paid on common stock (1,415,524 ) (782,936 ) (778,428 ) Dividends paid on preferred stock - (452,305 ) (342,460 ) Repurchase of shares issued in BCB acquisition - - (35,710 ) Net proceeds from issuance of stock 55,270,625 59,744,418 - Repayment of CDCI Preferred shares - (15,925,000 ) - Repurchase of warrants - - (302,410 ) Repurchase of restricted stock for payment of taxes (329,587 ) (176,112 ) (92,390 ) Repayment of repurchase agreement (5,000,000 ) - - Net cash provided by financing activities 149,608,217 123,582,970 43,410,372 Net increase (decrease) in cash and cash equivalents 29,802,892 20,859,968 (3,358,872 ) Cash and cash equivalents at beginning of year 62,118,885 41,258,917 44,617,789 Cash and cash equivalents at end of year $ 91,921,777 $ 62,118,885 $ 41,258,917 Supplemental disclosures: Cash paid during the year for: Interest $ 7,053,879 $ 4,254,987 $ 3,448,525 Income taxes, net of refunds 354,200 4,725,814 4,152,050 Non-cash activities: Transfers of loans to other real estate 999,502 4,722,529 1,050,342 Issuance of restricted stock grants 84,286 61,247 69,327 Stock issued in connection with Gulf Coast Community Bank 2,248,734 - - The accompanying notes are an integral part of these statements.63THE FIRST BANCSHARES, INC.Association (the “Bank”).Association. The Bank provides a full range of banking services in its primary market area of Mississippi, Louisiana, Alabama, Florida, and Florida.Georgia. The Company is regulated by the Federal Reserve Bank. Its subsidiary bank is currently subject to the regulation of the OfficeFederal Reserve Bank and the Mississippi Department of Banking and Consumer Finance, and was previously subject to the regulation of the ComptrollerOCC.Currency (OCC).1.Principles of Consolidationeliminated.2.Estimatesloancredit losses, acquisition accounting, intangible assets, and deferred tax assets.3.Cash and Due From BanksIncludedassets, and fair value of financial instruments.cash and due from banks are legal reserve requirements which must be maintained on an average basis in the form of cash and balances due from the Federal Reserve. The reserve balance varies depending upon the types and amounts of deposits. At December 31, 2017, the required reserve balance on deposit with the Federal Reserve Bank was approximately $29.7 million.4.SecuritiesInvestments indebt securities are accounted for as follows:Securitiesnet of tax, as a component of accumulated other comprehensive income (loss), net of tax, in stockholders'stockholders’ equity, until realized. Premiums and discounts are recognized in interest income using the interest method. The Company evaluates all securities quarterly to determine if any securities in a loss position require a provision for credit losses in accordance with ASC 326, Measurement of Credit Losses on Financial Instruments. Gains and losses on the sale of available-for-sale securities are determined using the adjusted cost of the specific security sold.Securitieson hand at December 31, 20172023 and 2016.
2022.64Federal Home Loan Bank (FHLB),FHLB, Federal Reserve Bank and First National Bankers’ Bankshares, Inc. Management reviews for impairment based on the ultimate recoverability of the cost basis.Other-than-Temporary ImpairmentManagement evaluates for other-than-temporary impairment on a quarterly basis. A decline in the fair valueaccompanying consolidated balance sheets. Management reviews for impairment based on the ultimate recoverability of available-for-salethe cost basis. No impairment was noted for the years ended December 31, 2023, 2022 and held-to-maturity2021.below cost thatare amortized on the level-yield method without anticipating prepayments, except for mortgage backed securities where prepayments are anticipated. Gains and losses on sales are recorded on the trade date and determined using the specific identification method.deemed other-than-temporary is charged to earningsplaced on nonaccrual status at the time any principal or interest payments become 90 days past due. Interest accrued but not received for a declinesecurity placed in value deemed to be credit related and a new cost basisnonaccrual is reversed against interest income.the security is established. The decline in value attributed to non-credit related factors is recognized in accumulated other comprehensive income (loss).5.Loans held for salethe lower of cost or fair value in the aggregate as determined by the outstanding commitments from investors.6.Loansloan losses.credit losses, unearned income, any unamortized deferred fees or costs on originated loans and unamortized premiums or discounts on purchased loans. Interest income on loans is recognized based on the principal balance outstanding and the stated rate of the loan.loan and is excluded from the estimate of credit losses. Interest income is accrued in the unpaid principal balance. Loan origination fees and certain direct origination costs are deferred and recognized as an adjustment of the related loan yield using the interest method.A loan is considered impaired, in accordance with Premiums and discounts on purchased loans not deemed purchase credit deteriorated are deferred and amortized as a level yield adjustment over the impairment accounting guidance of Accounting Standards Codification (ASC) Section 310-10-35,Receivables, Subsequent Measurement, when, based upon current events and information, it is probable that the scheduled payments of principal and interest will not be collected in accordance with the contractual termsrespective term of the loan.agreement.does not share risk characteristics with its other financial assets, the Bank shall evaluate the financial asset for expected credit losses on an individual basis. Factors considered by management in determining impairment include payment status, collateral values, and the probability of collecting scheduled payments of principal and interest when due. Generally, impairment is measured on a loan by loan basis using the fair value of the supporting collateral.non-accrualnonaccrual status, and the accrual of interest on such loan is discontinued, when principal or interest is past due ninety90 days or when specifically determined to be impaired.impaired unless the loan is well-secured and in the process of collection. When a loan is placed on non-accrualnonaccrual status, interest accrued but not received is generally reversed against interest income. If collectibilitycollectability is in doubt, cash receipts on non-accrualnonaccrual loans are used to reduce principal rather than recorded in interest income. Past due status is determined based upon contractual terms.7. Loans are returned to accrual status when the obligation is brought current or has performed in accordance with the contractual terms for a reasonable period of time and the ultimate collectability of the total contractual principal and interest is no longer in doubt. Loan LossesFor financial reporting purposes,assets accounted for on an amortized cost basis. Expected losses are calculated using relevant information, from internal and external sources, about past events, including historical experience, current conditions, and reasonable and supportable forecasts that affect the provisioncollectability of the reported amount. Historical credit loss experience provides the basis for loan losses charged to operations is based upon management'sthe estimation of expected credit losses. Adjustments to historical loss information are made for differences in current risk characteristics such as differences in underwriting standards, portfolio mix, delinquency level, or term as well as for changes in environment conditions, such as changes in unemployment rates, property values, or other relevant factors. Management may selectively apply external market data to subjectively adjust the amount necessary to maintainCompany’s own loss history including index or peer data. Expected losses are estimated over the allowance at an adequate level. Allowancescontractual term of the loans, adjusted for any impaired loansexpected prepayments. The contractual term excludes expected extensions, renewals, and modifications. Loans are generally determined based on collateral values. A charge is takencharged-off against the allowance for loan losses when management believes the collectibilityuncollectibility of a loan balance is confirmed and recoveries are credited to the allowance when received. Expected recoveries amounts may not exceed the aggregate of amounts previously charged-off.principalclasses based on the level at which risk is unlikely.Management evaluatesmonitored within the adequacyACL methodology. Construction loans for 1-4 family residential properties with a call code 1A1, and other construction, all land development and other land loans with a call code 1A2 were previously separated between the Commercial Real Estate or Consumer Real Estate bands based on loan type code. Under our ASC 326 methodology 1A1 loans are all defined as part of the Consumer Real Estate band and 1A2 loans are all defined as part of the Commercial Real Estate Band.loancredit losses is determined using the same methodology as other loans held for investment. The initial allowance for credit losses determined on a regular basis. These evaluations are based upon a periodic reviewcollective basis is allocated to individual loans. The sum of the collectibility considering historical experience,loan’s purchase price and allowance for credit losses becomes its initial amortized cost basis. The difference between the natureinitial amortized cost basis and the par value of the loan portfolio, underlying collateral values, internal and independent loan reviews, and prevailing economic conditions. In addition,is a noncredit discount or premium, which is amortized into interest income over the OCC, as a partlife of the regulatory examination process, reviews the loan portfolio andloan. Subsequent changes to the allowance for credit losses are recorded through provision expense.losses and may require changes inis collateral dependent. PCD loans that are collateral dependent will be assessed individually. Loans are only removed from the existing segments if they are written off, paid off, or sold. Upon adoption of ASC 326, the allowance based upon information available atfor credit losses was determined for each segment and added to the timeband’s carrying amount to establish a new amortized cost basis. The difference between the unpaid principal balance of the examination. The allowance consists of two components: allocatedsegment and unallocated. The components represent an estimation performed pursuant to either ASC Topic 450,Contingencies,the new amortized cost basis is the noncredit premium or ASC Subtopic 310-10,Receivables. The allocated componentdiscount, which will be amortized into interest income over the remaining life of the allowance reflects expected losses resulting from an analysis developed through specific credit allocations for individual loans, including any impaired loans, and historical loan loss history. The analysis is performed quarterly and loss factors are updated regularly.The unallocated portion ofsegment. Changes to the allowance reflects management’s estimate of probable inherent but undetectedfor credit losses within the portfolio due to uncertainties in economic conditions, changes in collateral values, unfavorable information about a borrower’s financial condition,after adoption are recorded through provision expense.other risk factors that have not yet manifested themselves. In addition, the unallocated allowance includes a component that explicitly accounts for the inherent imprecision in the loan loss analysis.
Equipment658.Premises and Equipment9.Other Real Estate Ownedisare initially recorded at fair value less costs to sell when acquired, establishing a new cost basis. Physical possession of residential real estate property collateralizing a consumer mortgage loan occurs when legal title is obtained upon completion of foreclosure or when the borrower conveys all interest in the property to satisfy the loan through completion of a deed in lieu of foreclosure or through similar legal agreement. These assets are subsequently accounted for at lower of the outstanding loan balancecost or current appraisalfair value less estimated costs to sell. If fair value declines subsequent to foreclosure, a valuation allowance is recorded through expense. Operation costs after acquisition are expensed. Any write-down to fair value required at the time of foreclosure is charged to the allowance for loancredit losses. Subsequent gains or losses on other real estate are reported in other operating income or expenses. At December 31, 20172023 and 2016,2022, other real estate owned totaled $7,158,409,$8.3 million and $6,007,621,$4.8 million, respectively.10.Goodwill and Other Intangible Assetstotaled $19,959,849 and $13,776,040Other Intangible Assetsyears ended December 31, 2017, and 2016, respectively.totaling $6,183,810 was recordedis the only intangible assets with an indefinite life on our balance sheet.ended December 31, 2017, was a result of the acquisitions of Iberville Bank and Gulf Coast Community Bank. See Note C – Business Combinations to these consolidated financial statements for additional information on the acquisitions during 2017.The Company performed the required annual impairment tests of goodwill and other intangiblesis as of December 1, 2017. The Company’s annual impairment test did not indicate impairment as of the testing date, and subsequent to that date, management is not aware of any events or changes in circumstances since the impairment test that would indicate that goodwill or other intangibles might be impaired.The Company’s acquisition method recognizedfollows:($ in thousands) 2023 2022 2021 Beginning of year $ 180,254 $ 156,663 $ 156,944 Acquired goodwill and provisional adjustments 92,266 23,591 (281) End of year $ 272,520 $ 180,254 $ 156,663 which are subject to amortization, and included in other assets in the accompanying consolidated balance sheets, areconsist of core deposit intangibles,and acquired customer relationship intangible assets arising from whole bank and branch acquisitions and are amortized on a straight-line basis over a 10 year10-year average life. Such assets are periodically evaluated as to the recoverability of carrying values. The definite-lived intangible assets had the following carrying values at December 31, 20172023 and 2016: 2017 (In thousands) Core deposit intangibles $ 7,640 $ (2,930 ) $ 4,710 2016 (In thousands) Core deposit intangibles $ 4,000 $ (2,268 ) $ 1,732 ($ in thousands) 2023 Gross
Carrying
AmountAccumulated
AmortizationNet
Carrying
AmountCore deposit intangibles $ 99,071 $ (30,259) $ 68,812 2022 Core deposit intangibles $ 55,332 $ (20,696) $ 34,636 (In thousands) Amount Aggregate amortization expense for the year ended December 31: 2015 $ 399 2016 383 2017 664 66($ in thousands) Amount Aggregate amortization expense for the year ended December 31: 2021 $ 4,137 2022 4,664 2023 9,563 Continued: Amount Estimated amortization expense for the year ending December 31: 2018 $ 695 2019 695 2020 695 2021 625 2022 455 Thereafter 1,545 $ 4,710 11.Other Assets and Amount Estimated amortization expense for the year ending December 31: 2024 $ 9,533 2025 9,518 2026 9,518 2027 9,185 2028 8,193 Thereafter 22,865 Total amortization expense $ 68,812 Financing costs related to the issuance of junior subordinated debentures are being amortized over the life of the instruments and are included in other assets. Life Insurance(BOLI)(“BOLI”). BOLI involves the purchase of life insurance by the Company on a chosen group of employees. The Company is the owner of the policies and, accordingly, the cash surrender value of the policies is reported as an asset, and increases in cash surrender values are reported as income.12.Restricted Stockstock basedstock-based compensation in accordance with ASC Topic 718,Compensation - Stock Compensation. Compensation cost is recognized for all restricted stock granted based on the weighted average fair value stock price at the grant date.13.Income Taxes20172023 and 2016,2022, had no uncertain tax positions that qualify for either recognition or disclosure in the financial statements.14.Advertising Costs2017, 20162023, 2022 and 2015,2021, was $336,450, $401,751,$833 thousand, $393 thousand, and $437,085,$391 thousand, respectively.15. of Cash FlowsFor purposes of reporting cash flows, cashCash Flowsamounts due from banks, interest-bearing deposits with banksother financial institutions with maturities fewer than 90 days, federal funds sold, and collateral identified as "restricted cash" related to the Company's back-to-back SWAP transactions. Net cash flows are reported for customer loan and deposit transactions, interest bearing deposits in other financial institutions, and federal funds sold. Generally, federal funds are sold for a one to seven day period.16.Off-Balance Sheet Financial Instrumentsexercised.
funded.6717.Earnings Applicable to Common Stockholdersapplicableavailable to common stockholders:For the Year Ended December 31, 2017 Basic per common Share $ 10,616,476 9,484,460 $ 1.12 Effect of dilutive shares: Restricted Stock 76,800 $ 10,616,476 9,561,260 $ 1.11 For the Year Ended December 31, 2016 Basic per common Share $ 9,666,382 5,435,088 $ 1.78 Convertible Preferred Dividend 133,627 Effect of dilutive shares: Convertible Preferred, Series E 742,371 Restricted Stock 81,874 $ 9,800,009 6,259,333 $ 1.57 For the Year Ended December 31, 2015 Basic per common share $ 8,456,242 5,371,111 $ 1.57 Effect of dilutive shares: Restricted Stock 70,939 $ 8,456,242 5,442,050 $ 1.55 ($ in thousands, except per share amount) December 31, 2023 Net
Income
(Numerator)Weighted Average
Shares
(Denominator)Per Share
AmountBasic per common share $ 75,457 31,373,718 $ 2.41 Effect of dilutive shares: Restricted Stock — 192,073 $ 75,457 31,565,791 $ 2.39 December 31, 2022 Basic per common share $ 62,919 22,023,595 $ 2.86 Effect of dilutive shares: Restricted Stock — 141,930 $ 62,919 22,165,525 $ 2.84 December 31, 2021 Basic per common share $ 64,167 21,017,189 $ 3.05 Effect of dilutive shares: Restricted Stock — 149,520 $ 64,167 21,166,709 $ 3.03 6818.Mergers and Acquisitionseffectaffect a business combination. Those costs include advisory, legal, accounting, valuation, and other professional or consulting fees. Some other examples of costs to the Company include systems conversion, integration planning consultants and advertising costs. The Company accounts for acquisition-related costs as expenses in the periods in which the costs are incurred and the services are received, with one exception. The costs to issue debt or equity securities is recognized in accordance with other applicable GAAP. These acquisition-related costs have been and will be included within the Consolidated Statements of Income classified within the non-interest expense caption.19.Investment in Limited Partnership partner in a partnership that provides low-income housing. The Company is not the general partner and does not have controlling ownership. The carrying value of the Company’s investment in the limited partnership was $3,837,468$1.2 million at December 31, 20172023 and $4,058,801$1.6 million at December 31, 2016,2022, net of amortization, using the proportional method and is reported in other assets on the Consolidated Balance Sheets. The Company’s maximum exposure to loss is limited to the carrying value of its investment. The Company received $481,325$481 thousand in low-income housing tax credits during 2017, $160,442 in 20162023, 2022 and $0 in 2015.20.Reclassifications20162022 and 20152021 financial statements to conform with the classifications used in 2017.2023. These reclassifications did not impact the Company'sCompany’s consolidated financial condition or results of operations.21.Accounting PronouncementsFebruary, 2018,March 2020, the FASBFinancial Accounting Standards Board ("FASB") issued Accounting Standards Update (ASU) 2018-02,(“ASU”) No. 2020-04, Reference Rate Reform (ASC 848): “Facilitation of the Effects of Reference Rate Reform on Financial Reporting.” This ASU provides temporary optional guidance to ease the potential burden in accounting for reference rate reform. The ASU provides optional expedients and exceptions for applying generally accepted accounting principles to contract modifications and hedging relationships, subject to meeting certain criteria, that reference London Interbank Offer Rate ("LIBOR") or another reference rate expected to be discontinued. It is intended to help stakeholders during the global market-wide reference rate transition period. The Company adopted ASU 2020-04 effective January 1, 2023. Adoption of ASU 2020-04 did not have a material impact on the Company's consolidated financial statements.ReclassificationAmendments to SEC Paragraph Pursuant to SEC Staff Accounting Bulletin No. 120, SEC Staff Announcement at the March 24, 2022 Emerging Issues Task Force ("EITF") Meeting, and Staff Accounting Bulletin Topic 6.B, Accounting Series Release 280 - General Revision of Certain Tax Effects from Accumulated Other ComprehensiveRegulation S-X: Income. ASU No. 2018-02 allows for the reclassification from other comprehensive income or Loss Applicable to retained earnings for stranded tax effects resulting from the Tax Cuts and Jobs Act (the Act). The ASU also allows an accounting policy election to reclassify other stranded tax effects that relate to the Act but not directly related to the change in federal tax rate. Common Stock." This ASU is effective in the first quarter of 2019. Early adoption is permitted for reporting periods for which financial statements have not yet been issued. The Company adopted this ASU in the fourth quarter of 2017 by retrospective application. Upon adoption, the Company made a policy election to reclassify stranded tax effects of approximately $76 thousand from Accumulated Other Comprehensive Income to retained earnings using the specific identification method.In May 2017,amends the FASB issued ASUAccounting Standards Codification for SEC paragraphs pursuant to SEC Staff Accounting Bulletin No. 2017-09,Stock Compensation, Scope120, SEC Staff Announcement at the March 24, 2022 EITF Meeting, and Staff Accounting Bulletin Topic 6.B, Accounting Series Release 280 - General Revision of Modification Accounting. ASU 2017-09 clarifies when changesRegulation S-X: Income or Loss Applicable to the terms of conditions of a share-based payment award must be accounted for as modifications. Companies will apply the modification accounting guidance if any change in the value, vesting conditions or classification of the award occurs. The new guidance should reduce diversity in practiceCommon Stock. These updates were effective immediately and result in fewer changes to the terms of an award being accounted for as modifications, as the guidance will allow companies to make certain non-substantive changes to awards without accounting for them as modifications. It doesdid not change the accounting for modifications. ASU 2017-09 is effective for interim and annual reporting periods beginning after December 15, 2017; early adoption is permitted. ASU 2017-09 is not expected to have a material impact on the Company’s Consolidated Financial Statements.2017, the2023, FASB issued ASU No. 2017-08,Premium Amortization on Purchased Callable Debt Securities.2023-01, Leases (Topic 842) - "Common Control Arrangements." This ASU 2017-08 shortensrequires entities to determine whether a related party arrangement between entities under common control is a lease. If the amortization periodarrangement is determined to be a lease, an entity must classify and account for the premiumlease on certain purchased callable debt securitiesthe same basis as an arrangement with a related party. The ASU requires all entities to amortize leasehold improvements associated with common control leases over the useful life to the earliest call date. Currently, entities generally amortize the premium as an adjustment of yield over the contractual life of the security. The ASU does not change the accounting for purchased callable debt securities held at a discount as the discount will continue to be accreted to maturity. ASU 2017-08 is effective for interim and annual reporting periods beginning after December 15, 2018; early adoption is permitted. The guidance calls for a modified retrospective transition approach under which a cumulative-effect adjustment will be made to retained earnings as of the beginning of the first reporting period in which ASU 2017-08 is adopted. The Company is currently evaluating the provisions of ASU 2017-08 to determine the potential impact the new standard will have on its Consolidated Financial Statements.69In January 2017, the FASB issued ASU No. 2017-04,Simplifying the Test for Goodwill Impairment.ASU 2017- 04 removes Step 2 of the goodwill impairment test, which requires a hypothetical purchase price allocation. Under the amended guidance, a goodwill impairment charge will now be recognized for the amount by which the carrying value of a reporting unit exceeds its fair value, not to exceed the carrying amount of goodwill.common control group. This guidance is effective for interim and annual periods beginning after December 15, 2019, with early adoption permitted for any impairment tests performed afterthe Company January 1, 2017. The Company is currently assessing the impact of ASU 2017-04 on its Consolidated Financial Statements.In August 2016, the FASB issued ASU No. 2016-15,Classification of Certain Cash Receipts2024, and Cash Payments. Current GAAP is unclear or does not include specific guidance on how to classify certain transactions in the statement of cash flows. ASU 2016-15 is intended to reduce diversity in practice in how eight particular transactions are classified in the statement of cash flows. ASU 2016-15 is effective for interim and annual reporting periods beginning after December 15, 2017. Entities will be required to apply the guidance retrospectively. If it is impracticable to apply the guidance retrospectively for an issue, the amendments related to that issue would be applied prospectively. As this guidance only affects the classification within the statement of cash flows, ASU 2016-15 is not expected to have a material impact on the Company's Consolidated Financial Statements.June 2016, the Financial Accounting Standards Board (FASB)March 2023, FASB issued ASU No. 2016-13,Financial Instruments2023-02, Investments - Equity Method and Joint Venture (Topic 323): "Accounting for Investments in Tax Credit Losses (Topic 326): MeasurementStructures Using the Proportional Amortization Method." These amendments allow reporting entities to elect to account for qualifying tax equity investments using the proportional amortization method, regardless of Credit Losses on Financial Instruments(ASU 2016-13). ASU 2016-13 requires a new impairment model known as the current expected credit loss (“CECL”) which significantly changesprogram giving rise to the way impairment of financial instrumentsrelated income tax credits. This guidance is recognized by requiring immediate recognition of estimated credit losseseffective for the Company January 1, 2024, and is not expected to occur overhave a material impact on the remaining lifeCompany's consolidated financial statements.instruments.statements.main provisionskey amendments: 1. Require that a public entity disclose, on an annual and interim basis, significant segment expenses that are regularly provided to the chief operating decision maker (CODM) and included within each reported measure of segment profit or loss. 2. Require that a public entity disclose, on an annual and interim basis, an amount for other segment items by reportable segment and a description of its composition. The other segment items category is the difference between segment revenue less the2016-13 include (1) replacingTopic 280, Segment Reporting, in interim periods. 4. Clarify that if the “incurred loss” approach under current GAAPCODM uses more than one measure of a segment's profit or loss in assessing segment performance and deciding how to allocate resources, a public entity may report one or more of those additional measures of segment profit. However, at least one the reported segment profit or loss measures (or the single reported measure, if only one is disclosed) should be the measure that is most consistent with an “expected loss” model for instruments measured at amortized cost, (2) requiring entities to record an allowance for credit losses related to available-for-sale debt securities rather thanthe measurement principles used in measuring the corresponding amounts in the public entity's consolidated financial statements. 5. Require that a direct write-downpublic entity disclose the title and position of the carrying amountCODM and an explanation of how the investments, as isCODM uses the reported measure(s) of segment profit or loss in assessing segment performance and deciding how to allocate resources. 6. Require that a public entity has a single reportable segment provide all the disclosures required by the other-than- temporary-impairment model under current GAAP,amendments in the ASU and (3) a simplified accounting model for purchased credit-impaired debt securities and loans.all existing segment disclosures in Topic 280. This ASU 2016-13 is effective for interim and annual reporting periodsfiscal years beginning after December 15, 2019, although early adoption2023, and interim periods within fiscal years beginning after December 15, 2024. This guidance is permitted. The Company is currently assessingnot expected to have a material impact on the impact of the adoption of ASU 2016-13 on its Consolidated Financial Statements.March 2016, theDecember 2023, FASB issued ASU 2016-09,Compensation – Stock CompensationNo. 2023-09, "Income Taxes (Topic 718)740): Improvements to Employee Share-Based Payment Accounting, which simplifies several aspectsIncome Tax Disclosures." This ASU amendments require that a public business entities on an annual basis (1) disclose specific categories in the rate reconciliation and (2) provide additional information for reconciling items that meet a quantitative threshold (if the effect of those reconciling items is equal to or greater than 5 percent of the accounting for employee share-based payment transactions for both public and nonpublicamount computed by multiplying pretax income (or loss) by the applicable statutory income tax rate). The amendments require that all entities includingdisclose on an annual basis the accounting forfollowing information about income taxes forfeitures,paid: 1. The amount of income taxes paid (net of refunds received) disaggregated by federal (national), state, and statutoryforeign taxes. 2. The amount of income taxes paid (net of refunds received) disaggregated by individual jurisdictions in which income taxes paid (net of refunds received) is equal to or greater than 5 percent of total income taxes paid (net of refunds received). The amendments also require that all entities disclose the following information: 1. Income (or loss) from continuing operations before income tax withholding requirements, as well as classification in the statement of cash flows.expense (or benefit) disaggregated between domestic and foreign. 2. Income tax expense (or benefit) from continuing operations disaggregated by federal (national), state, and foreign. This ASU 2016-09 is effective for annual periods beginning after December 15, 2016, and interim periods within those annual periods. The Company adopted the amendments effective January 1, 2017. The Company has a stock-based compensation plan for which the ASU 2016-092024. This guidance results in the associated excess tax benefits or deficiencies being recognized as tax expense or benefit in the income statement instead of the previous accounting treatment, which requires excess tax benefits to be recognized as an adjustment to additional paid-in capital and excess tax deficiencies to be recognized as either an offset to accumulated excess tax benefits, if any, or to the income statement. In addition, such amounts are now classified as an operating activity in the statement of cash flows instead of the current accounting treatment, which required it to be classified as both an operating and a financing activity. The Company’s stock based compensation plan has not historically generated material amounts of excess tax benefits or deficiencies and, therefore, the Company has not experienced a material change in the Company’s financial position or results of operation as a result of the adoption and implementation of ASU 2016-09.In February 2016, the FASB issued ASU NO. 2016-02Leases (Topic 842).ASU 2016-02 establishes a right of use model that requires a lessee to record a right of use asset and a lease liability for all leases with terms longer than 12 months. Leases will be classified as either finance or operating with classification affecting the pattern of expense recognition in the income statement. For lessors, the guidance modifies the classification criteria and the accounting for sales-type and direct financing leases. A lease will be treated as a sale if it transfers all of the risks and rewards, as well as control of the underlying asset, to the lessee. If risks and rewards are conveyed without the transfer of control, the lease is treated as a financing. If neither risks and rewards nor control is conveyed, an operating lease results. The amendments are effective for fiscal years beginning after December 15, 2018, including interim periods within those fiscal years for public business entities. Entities are required to use a modified retrospective approach for leases that exist or are entered into after the beginning of the earliest comparative period in the financial statements, with certain practical expedients available. Early adoption is permitted. The Company is assessing the impact of ASU 2016-02 on its accounting and disclosures.In September of 2014, the FASB issued ASU 2014-09, Revenue from Contracts with Customers (Topic 606). ASU 2014-09 modifies the guidance used to recognize revenue from contracts with customers for transfers of goods and services and transfers of nonfinancial assets, unless those contracts are within the scope of other guidance. The guidance also requires new qualitative and quantitative disclosures about contract balances and performance obligations. The Company will adopt ASU 2014-09 in the first quarter of 2018 under the modified retrospective method where the cumulative effect is recognized at the date of initial application. Based upon an evaluation under the current guidance, the Company estimates that substantially all of its interest income and non-interest income will not be impacted by the adoption of this ASU because either the revenue from those contracts with customers is covered by other guidance in U.S. GAAP or the revenue recognition outcomes anticipated with the adoption of this ASU will likely be similar to the Company’s current revenue recognition practices. The adoption of this ASU is not expected to have a material effectimpact on the Company's consolidated financial statements.70–- BUSINESS COMBINATIONSten10 years.FairPCD loans that have experienced more than insignificant credit deterioration since origination are recorded at the amount paid. The ACL is determined on a collective basis and is allocated to the individual loans. The sum of the loan’s purchase price and ACL becomes its initial amortized cost basis. The difference between the initial amortized cost basis and the par value of the loans involves estimating the amount and timing of principal and interest cash flows expected to be collected on the loans and discounting those cash flows atloan is a market rate of interest. The excess or deficit of cash flows expected at acquisition over the estimated fair value is referred to as the accretablenoncredit discount or amortizable premium, andwhich is recognizedamortized into interest income over the remaining life of the loan.Iberville2017,2023, the Company completed its acquisition of 100%HSBI, pursuant to an Agreement and Plan of Merger dated July 27, 2022, by and between the Company and HSBI (the "HSBI Merger Agreement"). Upon the completion of the common stockmerger of IbervilleHSBI with and into the Company, Heritage Bank, Plaquemine, Louisiana, from A. Wilbert’s Sons Lumber and Shingle Co. (“Iberville Parent”), and immediately thereafter merged Iberville Bank (“Iberville”), theHSBI's wholly-owned subsidiary, of Iberville Parent,was merged with and into The First.First Bank. Under the terms of the HSBI Merger Agreement, each share of HSBI common stock was converted into the right to receive 0.965 of share of Company common stock. The Company paid a total consideration of $31.1$221.5 million to the former HSBI shareholders as consideration in cash. Approximately $2.5 millionthe acquisition, which included 6,920,422 shares of the purchase price was heldCompany's common stock, and $16 thousand in escrow as contingencycash in lieu of fractional shares. The HSBI acquisition provided the opportunity for flood-related lossesthe Company to expand its operations in Georgia and the loan portfolio incurred due to flooding in Iberville’s market area in the fall of 2016. The Company expects to receive $498,207 from the escrow for settlement of flood-related loans. Goodwill at December 31, 2017, reflects the escrow settlement.$5.1$91.9 million of goodwill, of which $3.2 million funded the ACL for estimated losses on the acquired PCD loans, and $2.7$43.7 million of core deposit intangible. Goodwill is not deductible for income taxes. The core deposit intangible is towill be amortized to expense over 10 years.The Company acquired Iberville’s $149.4 million loan portfolio at an estimated fair value discount of $0.8 million. The discount represents expected credit losses, adjusted for market interest rates and liquidity adjustments.$0$388 thousand and $3.6$4.9 million for the three months and twelve monthmonths period ended December 31, 2017,2023, respectively. These costs included system conversion and integrating operations charges as well asassociated with legal and consulting expenses, which have been expensed as incurred.2017:(In Thousands) Measurement As Initially Period Reported Adjustments As Adjusted Identifiable assets: Cash and due from banks $ 28,789 $ - $ 28,789 Investments 78,650 (37 ) 78,613 Loans 148,516 - 148,516 Core deposit intangible 3,186 (498 ) 2,688 Personal and real property 4,443 498 4,941 Other assets 9,330 1,140 10,470 Total assets 272,914 1,103 274,017
2023, along with valuation adjustments that have been made since initially reported.71($ in thousands) As Initially
ReportedMeasurement
Period
AdjustmentsAs Adjusted Identifiable assets: Cash and due from banks $ 106,973 $ (180) $ 106,793 Investments 172,775 — 172,775 Loans 1,155,712 — 1,155,712 Core deposit intangible 43,739 — 43,739 Personal and real property 35,963 — 35,963 Other real estate owned 857 332 1,189 Bank owned life insurance 35,579 — 35,579 Deferred taxes 6,761 (632) 6,129 Interest receivable 4,349 — 4,349 Other assets 3,103 — 3,103 Total assets 1,565,811 (480) 1,565,331 Liabilities and equity: Deposits 1,392,432 — 1,392,432 Trust Preferred 9,015 — 9,015 Other liabilities 34,271 — 34,271 Total liabilities 1,435,718 — 1,435,718 Net assets acquired 130,093 (480) 129,613 Consideration paid 221,538 — 221,538 Goodwill $ 91,445 $ 480 $ 91,925 Continued: Measurement As Initially Period Reported Adjustments As Adjusted Liabilities and equity: Deposits 243,656 - 243,656 Borrowed funds 456 - 456 Other liabilities 2,928 1,478 4,406 Total liabilities 247,040 1,478 248,518 Net assets acquired 25,874 (375 ) 25,499 Consideration paid 31,100 (498 ) 30,602 Goodwill resulting from Acquisition $ 5,226 $ (123 ) $ 5,103 Valuationsecurities, personalcash and due from banks, other real property,estate owned, and core deposit intangibledeferred taxes since initially reported.The outstanding principal balance and the carrying amount of these loans included in the consolidated balance sheet at December 31, 2017, are as follows:Outstanding principal balance $ 123,325,609 Carrying amount 122,621,607 There were no purchased credit impaired loans at December 31, 2017.Gulf Coast Community BankAlso on January2017,2022, the Company completed its acquisition of BBI, pursuant to an Agreement and Plan of Merger dated April 26, 2022 by and between the Company and BBI (the "BBI Merger Agreement"). Upon the completion of the merger of Gulf Coast CommunityBBI with and into the Company, Beach Bank, (“GCCB”), Pensacola, Florida,BBI's wholly-owned subsidiary, was merged with and into The First.First Bank. Under the terms of the BBI Merger Agreement, each share of BBI common stock and each share of BBI preferred stock was converted into the right to receive 0.1711 of a share of Company common stock (the "BBI Exchange Ratio"), and all stock options awarded under the BBI equity plans were converted automatically into an option to purchase shares of Company common stock on the same terms and conditions as applicable to each such BBI option as in effect immediately prior to the effective time, with the number of shares underlying each such option and the applicable exercise price adjusted based on the BBI Exchange Ratio. The BBI merger provides the opportunity for the Company to expand its operations in the Florida panhandle and enter the Tampa market. The Company issuedpaid consideration of approximately $101.5 million to GCCB’sthe former BBI shareholders including 3,498,936 shares of the Company’sCompany's common stock which, for purposesandGCCB acquisition, were valued through averaging the trading price of the Company’sCompany's common stock price over a 30 day trading period ending on the fifth business day prior to the closing of the acquisition. Fractional shares were acquired with cash. The consideration totaled approximately $2.3 million.$1.1$23.7 million of goodwill and $1.0$9.8 million of core deposit intangible. Goodwill is not deductible for income taxes. The core deposit intangible is towill be amortized to expense over 10 years.acquired GCCB’s $91.0also incurred $1.3 million loan portfolio at a fair value discount of approximately $2.2 million. The discount represents expectedprovision for credit losses adjusted for market interest rates and liquidity adjustments.$0$4.0 thousand and $2.8$1.4 million for the three monthmonths and twelve monthmonths period ended December 31, 2017,2023, respectively. These costs included systems conversion and integrating operations charges as well asassociated with legal and consulting expenses, which have been expensed as incurred.JanuaryAugust 1, 2017:(In Thousands) Measurement As Initially Period Reported Adjustments As Adjusted Identifiable assets: Cash and due from banks $ 6,047 $ (314 ) $ 5,733 Investments 13,833 (28 ) 13,805 Loans 88,801 - 88,801 Core deposit intangible 787 166 953 Personal and real property 4,739 - 4,739 Other real estate 7,057 336 7,393 Deferred tax asset 6,693 (15 ) 6,678 Other assets 490 (22 ) 468 Total assets 128,447 123 128,570 72Continued: Measurement As Initially Period Reported Adjustments As Adjusted Liabilities and equity: Deposits 111,993 - 111,993 Borrowed funds 14,450 - 14,450 Other liabilities 950 - 950 Total liabilities 127,393 - 127,393 Net assets acquired 1,054 123 1,177 Consideration paid 2,258 - 2,258 Goodwill resulting from Acquisition $ 1,204 $ (123 ) $ 1,081 Valuation2022, along with valuation adjustments that have been made since initially reported.($ in thousands) As Initially Reported Measurement Period Adjustments As Adjusted Purchase price: Cash and stock $ 101,470 $ — $ 101,470 Total purchase price 101,470 — 101,470 Identifiable assets: Cash $ 23,939 $ — $ 23,939 Investments 22,907 (264) 22,643 Loans 482,903 2,268 485,171 Other real estate 8,797 (580) 8,217 Bank owned life insurance 10,092 — 10,092 Core deposit intangible 9,791 — 9,791 Personal and real property 13,825 (1,868) 11,957 Deferred tax asset 28,105 (970) 27,135 Other assets 9,649 (414) 9,235 Total assets 610,008 (1,828) 608,180 Liabilities and equity: Deposits 490,588 3 490,591 Borrowings 25,000 — 25,000 Other liabilities 14,772 — 14,772 Total liabilities 530,360 3 530,363 Net assets acquired 79,648 (1,831) 77,817 Goodwill $ 21,822 $ 1,831 $ 23,653 securities, core deposit intangible, andinvestments, loans, other real estate, since initially reported. Also, certain amounts have been reclassified to conform to the classificationspersonal and real property, deferred tax asset, other assets, and deposits.the Company.On March 3, 2017, $5.0 million of loans acquiredseven Cadence Bank, N.A. (“Cadence”) branches in the acquisition were sold.Northeast Mississippi (the “Cadence Branches”). In connection with the sale,acquisition of the Cadence Branches, The First assumed $410.2 million in deposits, acquired $40.3 million in loans at fair value, acquired certain assets associated with the Cadence Branches at their book value, and paid a deposit premium of $1.0 million to Cadence. As a result of the acquisition, were sold. the Company will have an opportunity to increase its deposit base and reduce transaction costs. The Company also expects to reduce costs through economies of scale.sale,acquisition of the Cadence Branches, the Company recorded a $1.6 million bargain purchase gain and $2.9 million core deposit intangible. The bargain purchase gain was generated as a result of the estimated fair value of net assets acquired exceeding the merger consideration, based on provisional fair values. The bargain purchase gain is considered non-taxable for income taxes purposes. The core deposit intangible will be amortized to expense over 10 years.mark was decreased by $2.2 million,losses on credit marks from the amountloans acquired.which was included in the credit mark at acquisition.The outstanding principal balanceassets acquired and liabilities assumed and the carrying amountgoodwill (bargain purchase gain) generated from the transaction:($ in thousands) As Initially
ReportedMeasurement
Period
AdjustmentsAs Adjusted Identifiable assets: Cash and due from banks $ 359,916 $ — $ 359,916 Loans 40,262 — 40,262 Core deposit intangible 2,890 — 2,890 Personal and real property 9,675 — 9,675 Other assets 135 — 135 Total assets 412,878 — 412,878 Liabilities and equity: Deposits 410,171 — 410,171 Other liabilities 407 (281) 126 Total liabilities 410,578 (281) 410,297 Net assets acquired 2,300 281 2,581 Consideration paid 1,000 — 1,000 Bargain purchase gain $ (1,300) $ (281) $ (1,581) these loans included in2022, the consolidated balance sheetCompany finalized its analysis and valuation adjustments were made to other liabilities since initially reported.($ in thousands) 2023 2022 (unaudited) (unaudited) Net interest income $ 249,325 $ 248,639 Non-interest income 46,705 58,645 Total revenue 296,030 307,284 Income before income taxes 105,879 118,465 2017,2023 and 2022:($ in thousands) December 31, 2023 Amortized
CostGross
Unrealized
GainsGross
Unrealized
LossesFair
ValueAvailable-for-sale: U.S. Treasury $ 16,985 $ — $ 310 $ 16,675 Obligations of U.S. government agencies and sponsored entities 119,868 1 14,946 104,923 Tax-exempt and taxable obligations of states and municipal subdivisions 486,293 449 48,276 438,466 Mortgage-backed securities - residential 297,735 11 34,430 263,316 Mortgage-backed securities - commercial 198,944 76 20,675 178,345 Corporate obligations 41,347 — 3,750 37,597 Other 3,055 — 12 3,043 Total available-for-sale $ 1,164,227 $ 537 $ 122,399 $ 1,042,365 Held-to-maturity: U.S. Treasury $ 89,688 $ — $ 2,804 $ 86,884 Obligations of U.S. government agencies and sponsored entities 33,659 — 1,803 31,856 Tax-exempt and taxable obligations of states and municipal subdivisions 246,908 9,566 14,697 241,777 Mortgage-backed securities - residential 141,573 — 14,237 127,336 Mortgage-backed securities - commercial 132,711 — 12,334 120,377 Corporate obligations 10,000 — 2,286 7,714 Total held-to-maturity $ 654,539 $ 9,566 $ 48,161 $ 615,944 ($ in thousands) December 31, 2022 Amortized
CostGross
Unrealized
GainsGross
Unrealized
LossesFair
ValueAvailable-for-sale: U.S. Treasury $ 135,752 $ — $ 11,898 $ 123,854 Obligations of U.S. government agencies and sponsored entities 163,054 3 18,688 144,369 Tax-exempt and taxable obligations of states and municipal subdivisions 519,190 598 61,931 457,857 Mortgage-backed securities - residential 341,272 11 42,041 299,242 Mortgage-backed securities - commercial 215,200 60 24,363 190,897 Corporate obligations 43,869 — 2,987 40,882 Total available-for-sale $ 1,418,337 $ 672 $ 161,908 $ 1,257,101 Held-to-maturity: U.S. Treasury $ 109,631 $ — $ 5,175 $ 104,456 Obligations of U.S. government agencies and sponsored entities 33,789 — 2,153 31,636 Tax-exempt and taxable obligations of states and municipal subdivisions 247,467 4,525 13,699 238,293 Mortgage-backed securities - residential 156,119 — 17,479 138,640 Mortgage-backed securities - commercial 134,478 7 13,798 120,687 Corporate obligations 10,000 — 1,615 8,385 Total held-to-maturity $ 691,484 $ 4,532 $ 53,919 $ 642,097 follows:Outstanding principal balance $ 60,223,959 Carrying amount 60,320,605 Loans acquired inoutlined below:two acquisitions were accounted for in accordance with ASC 310-20,Receivables-Nonrefundable Fees and Other Costs. No loans were identified as purchased credit impaired loans.Recent AcquisitionsSee Note T – Subsequent Events for more information onextent to which the acquisitions of Southwest Banc Shares, Inc. and Sunshine Financial, Inc. that are scheduled to close in 2018.NOTE D – SECURITIESA summary offair value is less than the amortized cost and estimateddetermine if the decline is indicative of credit loss or other factors.($ in thousands) December 31, 2023 December 31, 2022 Aaa $ 431,527 $ 467,736 Aa1/Aa2/Aa3 129,751 110,854 A1/A2 13,902 13,757 BBB 10,000 10,000 Not rated 69,359 89,137 Total $ 654,539 $ 691,484 available-for-saledebt securities and held-to-maturity securities at December 31, 2017 and 2016 follows: December 31, 2017 Available-for-sale securities: Obligations of U.S. Government Agencies $ 4,996,142 $ - $ 4,007 $ 4,992,135 Tax-exempt and taxable obligations of states and municipal subdivisions 137,281,213 2,027,575 724,750 138,584,038 Mortgage-backed securities 197,346,171 785,321 1,553,516 196,577,976 Corporate obligations 16,599,433 20,901 801,426 15,818,908 Other 1,255,483 - 335,459 920,024 $ 357,478,442 $ 2,833,797 $ 3,419,158 $ 356,893,081 73Continued: Held-to-maturity securities: Taxable obligations of states and municipal subdivisions $ 6,000,000 $ 1,397,966 $ - $ 7,397,966 December 31, 2016 Available-for-sale securities: Obligations of U.S. Government Agencies $ 9,023,293 $ 27,718 $ 6,341 $ 9,044,670 Tax-exempt and taxable obligations of states and municipal subdivisions 98,327,829 1,677,764 1,183,186 98,822,407 Mortgage-backed securities 114,990,863 602,179 1,304,090 114,288,952 Corporate obligations 21,274,200 66,477 1,230,566 20,110,111 Other 1,255,483 - 315,660 939,823 $ 244,871,668 $ 2,374,138 $ 4,039,843 $ 243,205,963 Held-to-maturity securities: Taxable obligations of states and municipal subdivisions $ 6,000,000 $ 1,393,828 $ - $ 7,393,828 The scheduledare shown by contractual maturity. Expected maturities of securities at December 31, 2017, were as follows: Available-for-Sale Held-to-Maturity Due less than one year $ 14,048,332 $ 14,061,545 $ - $ - Due after one year through five years 49,518,696 49,775,588 - - Due after five years through ten years 57,713,034 58,588,594 6,000,000 7,397,966 Due greater than ten years 38,852,209 37,889,378 - - Mortgage-backed securities 197,346,171 196,577,976 - - $ 357,478,442 $ 356,893,081 $ 6,000,000 $ 7,397,966 Actual maturities canmay differ from contractual maturities becauseif borrowers have the obligations may be calledright to call or prepaidprepay obligations with or without call or prepayment penalties.In 2017, there was a net loss of $15,889 realized on($ in thousands) December 31, 2023 Available-for-Sale Amortized
CostFair
ValueWithin one year $ 45,559 $ 45,246 One to five years 150,165 143,592 Five to ten years 306,927 270,342 Beyond ten years 164,897 141,524 Mortgage-backed securities: residential 297,735 263,316 Mortgage-backed securities: commercial 198,944 178,345 Total $ 1,164,227 $ 1,042,365 Held-to-maturity Within one year $ 39,082 $ 38,725 One to five years 72,333 69,387 Five to ten years 54,428 49,697 Beyond ten years 214,412 210,422 Mortgage-backed securities: residential 141,573 127,336 Mortgage-backed securities: commercial 132,711 120,377 Total $ 654,539 $ 615,944 available-for-sale securities consistingand the associated gains and losses are listed below:($ in thousands) 2023 2022 2021 Gross gains $ 65 $ 82 $ 202 Gross losses 9,781 164 59 Realized net (loss) gain $ (9,716) $ (82) $ 143 a pre-tax gain of $4,384 and a pre-tax loss of $20,273. There was a net gain of $126,286 realized in 2016 and no gain or loss realized in 2015. No other-than-temporary impairment losses were recognized for each of the three years ended December 31, 2017.Securities with a carrying value of $289,001,490 and $170,593,273 at December 31, 2017 and 2016, respectively, weresecurities pledged as collateral, to secure public deposits repurchase agreements, and for other purposes, as required or permitted by law.74The details concerning securities classified as available-for-sale with unrealized losses as of December 31, 2017was $1.095 billion and 2016, were as follows: 2017 Losses < 12 Months Losses 12 Months or > Total Obligations of U.S. government agencies $ 4,992,134 $ 4,007 $ - $ - $ 4,992,134 $ 4,007 Tax-exempt and tax- able obligations of states and Municipal subdivisions 40,559,417 500,884 8,722,641 223,866 49,282,058 724,750 Mortgage-backed Securities 89,312,836 806,774 33,286,648 746,742 122,599,484 1,553,516 Corporate obligations 5,665,770 9,832 3,156,365 791,594 8,822,135 801,426 Other - - 920,024 335,459 920,024 335,459 $ 140,530,157 $ 1,321,497 $ 46,085,678 $ 2,097,661 $ 186,615,835 $ 3,419,158 2016 Losses < 12 Months Losses 12 Months or > Total Obligations of U.S. government Agencies $ 2,989,255 $ 6,341 $ - $ - $ 2,989,255 $ 6,341 Tax-exempt and tax- able obligations of states and municipal subdivisions 48,199,634 1,183,186 - - 48,199,634 1,183,186 Mortgage-backed Securities 78,467,029 1,294,942 1,905,698 9,148 80,372,727 1,304,090 Corporate obligations 5,075,850 17,932 2,828,766 1,212,634 7,904,616 1,230,566 Other - - 939,823 315,660 939,823 315,660 $ 134,731,768 $ 2,502,401 $ 5,674,287 $ 1,537,442 $ 140,406,055 $ 4,039,843 Approximately 38.0% of the number of securities in the investment portfolio$1.031 billion at December 31, 2017, reflected2023 and 2022, respectively.loss. Management islosses position for which an allowance for credit losses has not been recorded at December 31, 2023 and 2022. The securities are aggregated by major security type and length of time in a continuous unrealized loss position:2023 ($ in thousands) Less than 12 Months 12 Months or Longer Total Fair
ValueUnrealized
LossesFair
ValueUnrealized
LossesFair
ValueUnrealized
LossesAvailable-for-sale: U.S. Treasury $ — $ — $ 16,675 $ 310 $ 16,675 $ 310 Obligations of U.S. government agencies and sponsored entities 123 — 104,495 14,946 104,618 14,946 Tax-exempt and taxable obligations of states and municipal subdivisions 20,879 1,479 389,113 46,797 409,992 48,276 Mortgage-backed securities - residential 222 2 262,012 34,428 262,234 34,430 Mortgage-backed securities - commercial 2,896 52 170,256 20,623 173,152 20,675 Corporate obligations — — 37,597 3,750 37,597 3,750 Other 3,055 12 — — 3,055 12 Total available-for-sale $ 27,175 $ 1,545 $ 980,148 $ 120,854 $ 1,007,323 $ 122,399 Held-to-maturity: U.S. Treasury $ — $ — $ 86,884 $ 2,804 $ 86,884 $ 2,804 Obligations of U.S. government agencies and sponsored entities 747 5 31,109 1,798 31,856 1,803 Tax-exempt and taxable obligations of states and municipal subdivisions 10,472 3,949 91,480 10,748 101,952 14,697 Mortgage-backed securities - residential — — 127,336 14,237 127,336 14,237 Mortgage-backed securities - commercial 920 2 119,457 12,332 120,377 12,334 Corporate obligations — — 7,714 2,286 7,714 2,286 Total held-to-maturity $ 12,139 $ 3,956 $ 463,980 $ 44,205 $ 476,119 $ 48,161 2022 Less than 12 Months 12 Months or Longer Total ($ in thousands) Fair
ValueUnrealized
LossesFair
ValueUnrealized
LossesFair
ValueUnrealized
LossesAvailable-for-sale: U.S. Treasury $ 4,563 $ 419 $ 119,292 $ 11,479 $ 123,855 $ 11,898 Obligations of U.S. government agencies and sponsored entities 34,254 2,293 109,431 16,395 143,685 18,688 Tax-exempt and taxable obligations of states and municipal subdivisions 275,202 31,152 159,508 30,779 434,710 61,931 Mortgage-backed securities: residential 76,125 4,970 222,274 37,071 298,399 42,041 Mortgage-backed securities: commercial 50,193 3,025 136,062 21,338 186,255 24,363 Corporate obligations 35,142 1,995 5,739 992 40,881 2,987 Total available-for-sale $ 475,479 $ 43,854 $ 752,306 $ 118,054 $ 1,227,785 $ 161,908 Held-to-maturity: U.S. Treasury $ 104,457 $ 5,175 $ — $ — $ 104,457 $ 5,175 Obligations of U.S. government agencies and sponsored entities 31,636 2,153 — — 31,636 2,153 Tax-exempt and taxable obligations of states and municipal subdivisions 127,628 13,583 15,303 116 142,931 13,699 Mortgage-backed securities - residential 138,639 17,479 — — 138,639 17,479 Mortgage-backed securities - commercial 119,758 13,798 — — 119,758 13,798 Corporate obligations 8,385 1,615 — — 8,385 1,615 Total held-to-maturity $ 530,503 $ 53,803 $ 15,303 $ 116 $ 545,806 $ 53,919 opinionunderlying securities and not credit quality. The Company does not intend to sell these securities and it is more likely than not that the Company haswill not be required to sell the ability to hold these securities until such time as the value recoversinvestments before recovery of their amortized cost basis. No allowance for credit losses was needed at December 31, 2023 or the securities mature. Management also believes the deterioration in value is attributable to changes in market interest rates and lack of liquidity in the credit markets. We have determined that these securities are not other-than-temporarily impaired based upon anticipated cash flows.Loans typically provide higher yields thantypesbusiness purposes. This type of earning assets, and thus onecommercial loan shares a similar risk characteristic in that unlike commercial real estate loans, repayment is largely dependent on cash flow generated from the operation of the Company's goalsbusiness.for loans to bemainly dependent upon either the largest categorysale of the Company's earning assets. At December 31, 2017real estate, operation of the business occupying the real estate, or refinance of the debt obligation. This includes both owner-occupied and 2016, respectively,non-owner occupied CRE secured loans, accountedbecause they share similar risk characteristics related to these variables.74.5%the purpose of constructing improvements on the residential property, as well as home equity lines of credit.75.3%other loans are all loans issued to individuals that are not for any purpose related to operation of earning assets. The Company controlsa business, and mitigates the inherent credit and liquidity risks through the composition of its loan portfolio.
not secured by real estate. Repayment on these loans is mostly dependent on personal income, which may be impacted by general economic conditions.75 following table shows the composition of the loan portfolio by category:(In thousands) December 31, 2017 December 31, 2016 Amount Amount Mortgage loans held for sale $ 4,790 0.3 % $ 5,880 0.6 % Commercial, financial and agricultural 165,780 13.5 129,423 14.8 Real Estate: Mortgage-commercial 467,484 38.0 314,359 36.0 Mortgage-residential 385,099 31.3 289,640 33.2 Construction 183,328 14.9 109,394 12.5 Lease financing receivable 2,450 0.2 2,204 0.3 Obligations of states and subdivisions 3,109 0.3 6,698 0.8 Consumer and other 18,056 1.5 15,336 1.8 Total loans 1,230,096 100 % 872,934 100 % Allowance for loan losses (8,288 ) (7,510 ) Net loans $ 1,221.808 $ 865,424 In the contextas of this discussion, a "real estate mortgage loan"December 31, 2023 and December 31, 2022, is definedsummarized below:($ in thousands) December 31, 2023 December 31, 2022 Loans held for sale Mortgage loans held for sale $ 2,914 $ 4,443 Total LHFS $ 2,914 $ 4,443 Loans held for investment Commercial, financial, and agriculture (1) $ 800,324 $ 536,192 Commercial real estate 3,059,155 2,135,263 Consumer real estate 1,252,795 1,058,999 Consumer installment 57,768 43,703 Total loans 5,170,042 3,774,157 Less allowance for credit losses (54,032) (38,917) Net LHFI $ 5,116,010 $ 3,735,240 any loan, other than a loan for construction purposes, secured by real estate, regardless of the purpose of the loan. The Company follows the common practice of financial institutions in the Company’s market area of obtaining a security interest in real estate whenever possible, in addition to any other available collateral. This collateral is taken to reinforce the likelihood of the ultimate repayment of the loanDecember 31, 2023 and tends to increase the magnitude of the real estate loan portfolio component. Generally, the Company limits its loan-to-value ratio to 80%. Management attempts to maintain a conservative philosophy regarding its underwriting guidelines and believes it will reduce the risk elements of its loan portfolio through strategies that diversify the lending mix.Activityallowance for loan losses foramortized cost basis of the Company’s LHFI. At December 31, 2017, 20162023 and 20152022, accrued interest receivable for LHFI totaled $24.7 million and $18.0 million, respectively, with no related ACL and was reported in interest receivable on the accompanying consolidated balance sheet.follows:(In thousands) 2017 2016 2015 Balance at beginning of period $ 7,510 $ 6,747 $ 6,095 Loans charged-off: Real Estate (262 ) (627 ) (534 ) Installment and Other (81 ) (73 ) (126 ) Commercial, Financial and Agriculture (62 ) (71 ) (183 ) Total (405 ) (771 ) (843 ) Recoveries on loans previously charged-off: Real Estate 522 755 905 Installment and Other 105 70 81 Commercial, Financial and Agriculture 50 84 99 Total 677 909 1,085 Net (Charge-offs) Recoveries 272 138 242 Provision for Loan Losses 506 625 410 Balance at end of period $ 8,288 $ 7,510 $ 6,747
to principal or interest payments. Generally, the Company will place a delinquent loan in nonaccrual status when the loan becomes 90 days or more past due. At the time a loan is placed in nonaccrual status, all interest which has been accrued on the loan but remains unpaid is reversed and deducted from earnings as a reduction of reported interest income. No additional interest is accrued on the loan balance until the collection of both principal and interest becomes reasonably certain.76represent howpresents the allowance for loan losses is allocated to a particular loan type as well as the percentageaging of the categoryamortized cost basis in past due loans in addition to totalthose loans at December 31, 2017 and 2016.classified as nonaccrual including PCD loans:December 31, 2023 ($ in thousands) Past Due
30 to 89
DaysPast Due 90
Days or More
and
Still AccruingNonaccrual PCD Total
Past Due,
Nonaccrual
and PCDTotal
LHFINonaccrual
and PCD
with No
ACLCommercial, financial, and agriculture (1) $ 2,043 $ 313 $ 353 $ 965 $ 3,674 $ 800,324 $ 465 Commercial real estate 1,698 630 3,790 647 6,765 3,059,155 410 Consumer real estate 3,992 220 1,806 3,098 9,116 1,252,795 680 Consumer installment 180 — 31 — 211 57,768 — Total $ 7,913 $ 1,163 $ 5,980 $ 4,710 $ 19,766 $ 5,170,042 $ 1,555 Allocation of the Allowance for Loan Losses December 31, 2017 (Dollars in thousands) Amount
in each category Commercial Non Real Estate $ 1,608 14.0 % Commercial Real Estate 4,644 64.8 Consumer Real Estate 1,499 18.9 Consumer 173 2.3 Unallocated 364 - Total $ 8,288 100 % December 31, 2016 (Dollars in thousands) Amount % of loans
in each category
to total loans Commercial Non Real Estate $ 1,118 15.6 % Commercial Real Estate 4,071 61.6 Consumer Real Estate 1,589 20.3 Consumer 155 2.4 Unallocated 577 0.1 Total $ 7,510 100 % The following table represents the Company’s impaired loans at December 31, 2017 and 2016. This tableperforming troubled debt restructurings. December 31, December 31, 2017 2016 (In thousands) Impaired Loans: Impaired loans without a valuation allowance $ 6,559 $ 2,667 Impaired loans with a valuation allowance 4,015 3,461 Total impaired loans $ 10,574 $ 6,128 Allowance for loan losses on impaired loans at period End 661 682 Total non-accrual loans 5,674 3,264 Past due 90 days or more and still accruing 285 198 Average investment in impaired loans 9,041 8,509 The following table is a summary of interest recognized and cash-basis interest earned on impaired$386 thousand in PPP loans for the years ended December 31, 2017, 2016 and 2015: 2017 2016 2015 Interest income recognized during impairment - - - Cash-basis interest income recognized 326 188 211 The gross interest income that would have been recorded in the period that ended if the non-accrual loans had been current in accordance with their original terms and had been outstanding throughout the period or since origination, if held for part of the twelve months for the years ended December 31, 2017, 2016 and 2015, was $342,000, $389,000 and $437,000, respectively. The Company had no loan commitments to borrowers in non-accrual status at December 31, 2017 and 2016.77The following tables provide the ending balances in the Company's loans (excluding mortgage loans held for sale) and allowance for loan losses, broken down by portfolio segment as of December 31, 2017 and 2016. The tables also provide additional detail as to the amount of our2023.December 31, 2022 ($ in thousands) Past Due
30 to 89
DaysPast Due 90
Days or More
and
Still AccruingNonaccrual PCD Total
Past Due,
Nonaccrual
and PCDTotal
LHFINonaccrual
and PCD
with No
ACLCommercial, financial, and agriculture (1) $ 220 $ — $ 19 $ — $ 239 $ 536,192 $ — Commercial real estate 1,984 — 7,445 1,129 10,558 2,135,263 4,560 Consumer real estate 3,386 289 2,965 1,032 7,672 1,058,999 791 Consumer installment 173 — 1 — 174 43,703 — Total $ 5,763 $ 289 $ 10,430 $ 2,161 $ 18,643 $ 3,774,157 $ 5,351 and allowance that correspond to individual versus collective impairment evaluation. The impairment evaluation corresponds to the Company's systematic methodology for estimating its Allowance for Loan Losses.December 31, 2017 Installment Commercial, Real Estate and
Other Financial and
Agriculture Total (In thousands) Loans Individually evaluated $ 9,402 $ 52 $ 1,120 $ 10,574 Collectively evaluated 1,015,934 28,511 170,287 1,214,732 Total $ 1,025,336 $ 28,563 $ 171,407 $ 1,225,306 Allowance for Loan Losses Individually evaluated $ 371 $ 23 $ 267 $ 661 Collectively evaluated 5,952 334 1,341 7,627 Total $ 6,323 $ 357 $ 1,608 $ 8,288 December 31, 2016 Installment Commercial, Real Estate and
Other Financial and
Agriculture Total (In thousands) Loans Individually evaluated $ 5,935 $ 40 $ 153 $ 6,128 Collectively evaluated 704,923 21,317 134,686 860,926 Total $ 710,858 $ 21,357 $ 134,839 $ 867,054 Allowance for Loan Losses Individually evaluated $ 651 $ 21 $ 10 $ 682 Collectively evaluated 5,009 711 1,108 6,828 Total $ 5,660 $ 732 $ 1,118 $ 7,510 The following tables provide additional detail of impaired loans broken out according to class as of December 31, 2017, 20162022.2015. The recorded investment included inHSBI, the following table represents customer balances net of any partial charge-offs recognized on the loans, net of any deferred fees and costs. Recorded investment excludes any insignificant amount of accrued interest receivable on loans 90-days or more past due and still accruing. The unpaid balance represents the recorded balance prior to any partial charge-offs.78December 31, 2017 Average Interest Recorded Income Recorded Unpaid Related Investment Recognized Investment Balance Allowance YTD YTD (In thousands) Impaired loans with no related allowance: Commercial installment $ 270 $ 270 $ - $ 90 $ 1 Commercial real estate 4,080 4,176 - 3,502 101 Consumer real estate 2,180 2,424 - 1,897 83 Consumer installment 29 29 - 17 - Total $ 6,559 $ 6,899 $ - $ 5,506 $ 185 Impaired loans with a related allowance: Commercial installment $ 850 $ 850 $ 267 $ 262 $ 14 Commercial real estate 2,638 2,638 234 2,756 112 Consumer real estate 504 504 137 493 15 Consumer installment 23 23 23 24 - Total $ 4,015 $ 4,015 $ 661 $ 3,535 $ 141 Total Impaired Loans: Commercial installment $ 1,120 $ 1,120 $ 267 $ 352 $ 15 Commercial real estate 6,718 6,814 234 6,258 213 Consumer real estate 2,684 2,928 137 2,390 98 Consumer installment 52 52 23 41 - Total Impaired Loans $ 10,574 $ 10,914 $ 661 $ 9,041 $ 326 December 31, 2016 Average Interest Recorded Income Recorded Unpaid Related Investment Recognized Investment Balance Allowance YTD YTD (In thousands) Impaired loans with no related allowance: Commercial installment $ - $ - $ - $ - $ - Commercial real estate 2,324 2,570 - 4,368 37 Consumer real estate 329 329 - 291 1 Consumer installment 14 14 - 9 - Total $ 2,667 $ 2,913 $ - $ 4,668 $ 38 79Continued: Average Interest Recorded Income Recorded Unpaid Related Investment Recognized Investment Balance Allowance YTD YTD Impaired loans with a related allowance: Commercial installment $ 153 $ 153 $ 10 $ 244 $ 9 Commercial real estate 2,726 2,726 343 2,832 127 Consumer real estate 556 669 308 733 14 Consumer installment 26 27 21 32 - Total $ 3,461 $ 3,575 $ 682 $ 3,841 $ 150 Total Impaired Loans: Commercial installment $ 153 $ 153 $ 10 $ 244 $ 9 Commercial real estate 5,050 5,296 343 7,200 164 Consumer real estate 885 998 308 1,024 15 Consumer installment 40 41 21 41 - Total Impaired Loans $ 6,128 $ 6,488 $ 682 $ 8,509 $ 188 December 31, 2015 Average Interest Recorded Income Recorded Unpaid Related Investment Recognized Investment Balance Allowance YTD YTD (In thousands) Impaired loans with no related allowance: Commercial installment $ - $ - $ - $ 2 $ - Commercial real estate 5,790 5,828 - 5,099 50 Consumer real estate 223 223 - 205 - Consumer installment 7 7 - 8 - Total $ 6,020 $ 6,058 $ - $ 5,314 $ 50 Impaired loans with a related allowance: Commercial installment $ 306 $ 306 $ 50 $ 264 $ 14 Commercial real estate 2,927 2,927 444 2,891 132 Consumer real estate 842 842 438 1,152 15 Consumer installment 32 32 25 31 - Total $ 4,107 $ 4,107 $ 957 $ 4,338 $ 161 Total Impaired Loans: Commercial installment $ 306 $ 306 $ 50 $ 266 $ 14 Commercial real estate 8,717 8,755 444 7,990 182 Consumer real estate 1,065 1,065 438 1,357 15 Consumer installment 39 39 25 39 - Total Impaired Loans $ 10,127 $ 10,165 $ 957 $ 9,652 $ 211 80WeCompany acquired loans both with deterioratedand without evidence of credit quality in a 2014 acquisition. Thesedeterioration since origination. Acquired loans wereare recorded at estimatedtheir fair value at the time of acquisition date with no carryover offrom the relatedacquired institution's previously recorded allowance for loancredit losses. The acquired loans were segregated as of the acquisition date between those considered to be performing (acquired non-impaired loans) and those with evidence of credit deterioration (acquired impaired loans). Acquired loans are considered impaired if thereaccounted for under ASC 326, evidencebased upon several factors including the timing and payment of expected cash flows, as adjusted for estimated credit deteriorationlosses and ifprepayments, and then discounting these cash flows using comparable market rates. The resulting fair value adjustment is recorded in the form of premium or discount to the unpaid principal balance of each acquired loan. As it relates to acquired PCD loans, the net premium or net discount is probable,adjusted to reflect the Company's allowance for credit losses ("ACL") recorded for PCD loans at the time of acquisition, and the remaining fair value adjustment is accreted or amortized into interest income over the remaining life of the loan. As it relates to acquired loans not classified as PCD ("non-PCD") loans, the credit loss and yield components of the fair value adjustments are aggregated, and the resulting net premium or net discount is accreted or amortized into interest income over the average remaining life of those loans. The Company records an ACL for non-PCD loans at the time of acquisition through provision expense, and therefore, no further adjustments are made to the net premium or net discount for non-PCD loans.all contractually required payments willwas approximately $468.8 million, of which $6.4 million is the amount of contractual cash flows not expected to be collected.presents information regardingshows the contractually required payments receivable, cash flows expected to be collected and the estimated fair valuecarrying amount of loans acquired in the BBI and HSBI acquisition as of July 1, 2014,transaction for which there was, at the closing date of the transaction: July 1, 2014 (In thousands) Commercial,
financial and
agricultural Mortgage-
Commercial Mortgage-
Residential Commercial
and other Total Contractually required payments $ 1,519 $ 29,648 $ 7,933 $ 976 $ 40,076 Cash flows expected to be collected 1,570 37,869 9,697 1,032 50,168 Fair value of loans acquired 1,513 28,875 7,048 957 38,393 Total outstanding acquired impaired loans were $2,020,769 asacquisition, more than insignificant deterioration of December 31, 2017. The outstanding balance of these loans is the undiscounted sum of all amounts, including amounts deemed principal, interest, fees, penalties, and other under the loans, owed at the reporting date, whether or not currently due and whether or not any such amounts have been charged off.Changes in the carrying amount and accretable yield for acquired impaired loans were as follows for the year ended December 31, 2017 (In thousands): Accretable
Yield Carrying Amount
of Loans Balance at beginning of period $ 894 $ 1,305 Accretion (58 ) 58 Payments received, net - (178 ) Balance at end of period $ 836 $ 1,185 The following tables provide additional detail of troubled debt restructurings (TDRs) during the twelve months ended December 31, 2017, 2016 and 2015. December 31, 2017 Outstanding
Recorded Outstanding
Recorded Interest Investment
Pre-Modification Investment
Post-Modification Number of
Loans Income
Recognized (In thousands except number of loans) Commercial installment $ - $ - - $ - Commercial real estate 526 494 4 17 Consumer real estate 66 64 1 4 Consumer installment - - - - Total $ 592 $ 558 5 $ 21 December 31, 2016 Outstanding
Recorded Outstanding
Recorded Interest Investment
Pre-Modification Investment
Post-Modification Number of
Loans Income
Recognized (In thousands except number of loans) Commercial installment $ - $ - - $ - Commercial real estate 296 269 1 13 Consumer real estate - - - - Consumer installment - - - - Total $ 296 $ 269 1 $ 13
credit quality since origination:81($ in thousands) BBI HSBI Purchase price of loans at acquisition $ 27,669 $ 52,356 Allowance for credit losses at acquisition 1,303 3,176 Non-credit discount (premium) at acquisition 530 2,325 Par value of acquired loans at acquisition $ 29,502 $ 57,857 December 31, 2015 Outstanding
Recorded Outstanding
Recorded Interest Investment
Pre-Modification Investment
Post-Modification Number of
Loans Income
Recognized (In thousands except number of loans) Commercial installment $ - $ - - $ - Commercial real estate 499 492 2 10 Consumer real estate 45 40 1 - Consumer installment - - - - Total $ 544 $ 532 3 $ 10 The TDRs presented above increased the allowance for loan losses and resulted in charge-offs of $0, $208,000 and $0 for the years ended December 31, 2017, 2016 and 2015, respectively.The balance of troubled debt restructurings at December 31, 2017, 2016 and 2015, was $6.9 million, $4.1 million and $6.9 million, respectively, calculated for regulatory reporting purpose. 2017,2023 and 2022, the amortized cost of the Company’s PCD loans totaled $57.8 million and $24.0 million, respectively, which had an estimated ACL of $3.7 million and $1.7 million, respectively.($ in thousands) Term Extension Percentage of Total Loans Held for Investment Commercial real estate $ 581 0.02 % Total $ 581 0.02 % troubled debt restructuring.DuringTDR. As of December 31, 2022 and 2021 TDRs had a related ACL of $841 thousand and $4.3 million, respectively.month periodsmonths ended December 31, 2017, 20162022 and 2015,2021.($ in thousands, except for number of loans) December 31, 2022 Number of
LoansOutstanding
Recorded
Investment
Pre-ModificationOutstanding
Recorded
Investment
Post-ModificationInterest
Income
RecognizedConsumer real estate 1 $ 134 $ 135 $ 7 Total 1 $ 134 $ 135 $ 7 December 31, 2021 Commercial, financial, and agriculture 1 $ 38 $ 37 $ 4 Commercial real estate 5 5,151 4,890 230 Consumer real estate 4 222 187 5 Consumer installment 1 13 1 — Total 11 $ 5,424 $ 5,115 $ 239 terms of 5, 1ACL $22 thousand and 3$1.6 million and resulted in no charge-offs for the years ended December 31, 2022, and 2021, respectively.respectively, wereby class modified as TDRs. TDRs for which there was a payment default within twelve months following the modification during the year ending December 31, 2022 and 2021.($ in thousands, except for number of loans) 2022 2021 Troubled Debt Restructurings
That Subsequently Defaulted:Number of
LoansRecorded
InvestmentNumber of
LoansRecorded
InvestmentCommercial real estate — $ — — $ — Consumer real estate 1 134 2 55 Total 1 $ 134 2 $ 55 December 31, 2017
Loans Past Due
30-89 Past Due 90
days and still
accruing Non-Accrual Total Commercial installment $ - $ - $ - $ - $ - Commercial real estate 3,701,710 91,734 - 1,024,442 4,817,886 Consumer real estate 1,012,396 89,476 - 986,803 2,088,675 Consumer installment - - 5,188 18,319 23,507 Total $ 4,714,106 $ 181,210 $ 5,188 $ 2,029,564 $ 6,930,068 Allowance for loan losses $ 99,695 $ 21,610 $ 5,188 $ 27,241 $ 153,734 December 31, 2016 Current
Loans Past Due
30-89 Past Due 90
days and still
accruing Non-Accrual Total Commercial installment $ 150,509 $ - $ - $ - $ 150,509 Commercial real estate 2,463,484 - - 1,101,279 3,564,763 Consumer real estate 153,695 89,996 - 122,450 366,141 Consumer installment 5,898 - - 23,594 29,492 Total $ 2,773,586 $ 89,996 $ - $ 1,247,323 $ 4,110,905 Allowance for loan losses $ 124,484 $ - $ - $ 40,165 $ 164,649
A loan is considered to be in a payment default once it is 30 days contractually past due under the modified terms. The TDRs presented above increased the ACL $22 thousand and $21 thousand resulted in no charge-offs for the years ended December 31, 2022, and 2021, respectively.82 December 31, 2015 Current
Loans Past Due
30-89 Past Due 90
days and still
accruing Non-Accrual Total Commercial installment $ 206,237 $ - $ - $ 50,221 $ 256,458 Commercial real estate 1,823,217 - - 2,933,287 4,756,504 Consumer real estate 721,110 - - 1,134,816 1,855,926 Consumer installment 7,894 - - 29,435 37,329 Total $ 2,758,458 $ - $ - $ 4,147,759 $ 6,906,217 Allowance for loan losses $ 106,028 $ - $ - $ 197,338 $ 303,366 summarizerepresents the Company’s TDRs at December 31, 2022:December 31, 2022 ($ in thousands) Current
LoansPast Due
30-89Past Due 90
days and still
accruing Nonaccrual Total Commercial, financial, and agriculture $ 49 $ — $ — $ — $ 49 Commercial real estate 13,561 — — 6,121 19,682 Consumer real estate 1,077 — — 929 2,006 Consumer installment 14 — — — 14 Total $ 14,701 $ — $ — $ 7,050 $ 21,751 Allowance for credit losses $ 350 $ — $ — $ 491 $ 841 ourof loans classified as past dueof December 31, 2023 and 2022:December 31, 2023 ($ in thousands) Real Property Equipment Miscellaneous Total Commercial financial, and agriculture $ — $ 496 $ 918 $ 1,414 Commercial real estate 710 — — 710 Consumer real estate 778 — — 778 Total $ 1,488 $ 496 $ 918 $ 2,902 December 31, 2022 ($ in thousands) Real Property Total Commercial real estate $ 4,560 $ 4,560 Consumer real estate 998 998 Total $ 5,558 $ 5,558 excessproportion to each holder’s share of 30 days or more in additionownership; and no holder has the right to those loans classified as non-accrual: December 31, 2017 (In thousands)
30 to 89
More and
Still Accruing Non-Accrual Total
Past Due and
Non-Accrual Total
Loans Real Estate-construction $ 192 $ 27 $ 92 $ 311 $ 183,328 Real Estate-mortgage 2,656 176 2,692 5,524 385,099 Real Estate-nonfarm nonresidential 1,487 82 1,724 3,293 467,484 Commercial 393 - 1,120 1,513 165,780 Lease financing receivable - - - - 2,450 Obligations of states and subdivisions - - - - 3,109 Consumer 57 - 46 103 18,056 Total $ 4,785 $ 285 $ 5,674 $ 10,744 $ 1,225,306 December 31, 2016 (In thousands) Past Due
30 to 89
Days Past Due
90 Days or
More and
Still Accruing Non-Accrual Total
Past Due and
Non-Accrual Total
Loans Real Estate-construction $ 204 $ 96 $ 658 $ 958 $ 109,394 Real Estate-mortgage 2,745 102 1,662 4,509 289,640 Real Estate- nonfarm nonresidential 269 - 909 1,178 314,359 Commercial 9 - 2 11 129,423 Lease finance receivable - - - - 2,204 Obligations of states and subdivisions - - - - 6,698 Consumer 22 - 33 55 15,336 Total $ 3,249 $ 198 $ 3,264 $ 6,711 $ 867,054
pledge the entire financial asset unless all participating interest holders agree.83as:as current financial information, historical payment experience, credit documentation, public information, and current economic trends, among other factors. The Company analyzes loans individually to classify the loans as to credit risk. The Company uses the following definitions for risk ratings, whichratings:consistent with the definitions used in supervisory guidance:Mention.Mention: Loans classified as special mention have a potential weakness that deserves management's close attention. If left uncorrected, these potential weaknesses may result in deterioration of the repayment prospects for the loan or of the Company’s credit position at some future date.Substandard.Companyinstitution will sustain some loss if the deficiencies are not corrected.Doubtful.Loans not meetingcriteria above that are analyzed individuallymost current available as part of the above described process are considered to be pass rated loans.As of December 31, 20172023, and 2016,were generally updated within the prior year.($ in thousands) Term Loans Amortized Cost Basis by Origination Year As of December 31, 2023 2023 2022 2021 2020 2019 Prior Revolving
LoansTotal Commercial, financial and agriculture: Risk Rating Pass $ 102,263 $ 150,420 $ 113,487 $ 47,313 $ 36,065 $ 64,020 $ 281,646 $ 795,214 Special mention — — — 141 797 3 10 951 Substandard 451 330 121 185 550 1,894 628 4,159 Doubtful — — — — — — — — Total commercial, financial and agriculture $ 102,714 $ 150,750 $ 113,608 $ 47,639 $ 37,412 $ 65,917 $ 282,284 $ 800,324 Current period gross write offs $ 14 $ 51 $ 225 $ 139 $ 206 $ 110 $ — $ 745 Commercial real estate: Risk Rating Pass $ 385,954 $ 825,505 $ 558,742 $ 377,085 $ 253,746 $ 569,428 $ 6,397 $ 2,976,857 Special mention — 660 6,118 3,111 9,545 22,648 — 42,082 Substandard 136 7,293 393 566 5,427 26,401 — 40,216 Doubtful — — — — — — — — Total commercial real estate $ 386,090 $ 833,458 $ 565,253 $ 380,762 $ 268,718 $ 618,477 $ 6,397 $ 3,059,155 Current period gross write offs $ — $ — $ 193 $ — $ — $ 57 $ — $ 250 Consumer real estate: Risk Rating Pass $ 176,144 $ 334,056 $ 219,071 $ 127,539 $ 59,615 $ 163,464 $ 153,821 $ 1,233,710 Special mention — 1,081 — — 643 3,246 412 5,382 Substandard 502 404 511 1,559 514 6,988 3,225 13,703 Doubtful — — — — — — — — Total consumer real estate $ 176,646 $ 335,541 $ 219,582 $ 129,098 $ 60,772 $ 173,698 $ 157,458 $ 1,252,795 Current period gross write offs $ 5 $ 19 $ — $ — $ — $ 25 $ — $ 49 Consumer installment: Risk Rating Pass $ 24,482 $ 12,408 $ 7,316 $ 2,919 $ 1,213 $ 1,195 $ 8,156 $ 57,689 Special mention — — — — — — — — Substandard — 8 17 42 11 — 1 79 Doubtful — — — — — — — — Total consumer installment $ 24,482 $ 12,416 $ 7,333 $ 2,961 $ 1,224 $ 1,195 $ 8,157 $ 57,768 Current period gross write offs $ 226 $ 567 $ 223 $ 179 $ 156 $ 576 $ 121 $ 2,048 Total Pass $ 688,843 $ 1,322,389 $ 898,616 $ 554,856 $ 350,639 $ 798,107 $ 450,020 $ 5,063,470 Special mention — 1,741 6,118 3,252 10,985 25,897 422 48,415 Substandard 1,089 8,035 1,042 2,352 6,502 35,283 3,854 58,157 Doubtful — — — — — — — — Total $ 689,932 $ 1,332,165 $ 905,776 $ 560,460 $ 368,126 $ 859,287 $ 454,296 $ 5,170,042 Current period gross write offs $ 245 $ 637 $ 641 $ 318 $ 362 $ 768 $ 121 $ 3,092 ($ in thousands) Term Loans Amortized Cost Basis by Origination Year As of December 31, 2022 2022 2021 2020 2019 2018 Prior Revolving
LoansTotal Commercial, financial and agriculture: Risk Rating Pass $ 181,761 $ 141,174 $ 55,690 $ 53,954 $ 43,441 $ 52,038 $ 181 $ 528,239 Special mention 380 5,188 1,664 — — 412 — 7,644 Substandard 50 — — 34 33 192 — 309 Doubtful — — — — — — — — Total commercial, financial and agriculture $ 182,191 $ 146,362 $ 57,354 $ 53,988 $ 43,474 $ 52,642 $ 181 $ 536,192 Commercial real estate: Risk Rating Pass $ 582,895 $ 436,661 $ 305,140 $ 217,626 $ 140,682 $ 368,185 $ 1,765 $ 2,052,954 Special mention 672 1,345 3,938 11,643 9,885 16,612 — 44,095 Substandard 50 2,830 908 1,694 4,797 27,935 — 38,214 Doubtful — — — — — — — — Total commercial real estate $ 583,617 $ 440,836 $ 309,986 $ 230,963 $ 155,364 $ 412,732 $ 1,765 $ 2,135,263 Consumer real estate: Risk Rating Pass $ 325,853 $ 226,355 $ 136,052 $ 59,376 $ 51,515 $ 129,923 $ 112,278 $ 1,041,352 Special mention — — — — 823 3,846 — 4,669 Substandard 519 554 1,481 648 1,706 6,894 1,176 12,978 Doubtful — — — — — — — — Total consumer real estate $ 326,372 $ 226,909 $ 137,533 $ 60,024 $ 54,044 $ 140,663 $ 113,454 $ 1,058,999 Consumer installment: Risk Rating Pass $ 18,925 $ 11,618 $ 5,031 $ 2,078 $ 832 $ 1,445 $ 3,725 $ 43,654 Special mention — — — — — — — — Substandard 4 13 24 — 3 5 — 49 Doubtful — — — — — — — — Total consumer installment $ 18,929 $ 11,631 $ 5,055 $ 2,078 $ 835 $ 1,450 $ 3,725 $ 43,703 Total Pass $ 1,109,434 $ 815,808 $ 501,913 $ 333,034 $ 236,470 $ 551,591 $ 117,949 $ 3,666,199 Special mention 1,052 6,533 5,602 11,643 10,708 20,870 — 56,408 Substandard 623 3,397 2,413 2,376 6,539 35,026 1,176 51,550 Doubtful — — — — — — — — Total $ 1,111,109 $ 825,738 $ 509,928 $ 347,053 $ 253,717 $ 607,487 $ 119,125 $ 3,774,157 categorycharacteristics and a specific allowance for individually assessed loans. The allowance is continuously monitored by management to maintain a level adequate to absorb expected credit losses in the loan portfolio.classcall code will group loans that contain similar types of collateral, purposes, and are usually structured with similar terms making each loan’s risk profile very similar to the rest in that segment. Each of these segments then flows up into one of the four bands (bands), Commercial, Financial, and Agriculture, Commercial Real Estate, Consumer Real Estate, and Consumer Installment. In accordance with the guidance in ASC 326, the Company redefined its LHFI portfolio segments and related loan classes based on the level at which risk is monitored within the ACL methodology. Construction loans (excluding mortgagefor 1-4 family residential properties with a call code 1A1, and other construction, all land development and other land loans heldwith a call code 1A2 were previously separated between the Commercial Real Estate or Consumer Real Estate bands based on loan type code. Under our ASC 326 methodology 1A1 loans are all defined as part of the Consumer Real Estate band and 1A2 loans are all defined as part of the Commercial Real Estate Band.sale)each segment. This process is then repeated for all dates within the historical data range. These averaged PDs are used for an immediate reversion back to the historical mean. The historical data used to calculate this input was captured by the Company from 2009 through the most recent quarter end.follows: Commercial, Real Estate
Commercial Real Estate
Mortgage Installment and
Other Financial and
Agriculture Total Pass $ 763,572 $ 226,178 $ 28,482 $ 166,819 $ 1,185,051 Special Mention 15,987 680 - 2,908 19,575 Substandard 14,979 4,622 80 1,905 21,586 Doubtful 94 - - 23 117 Subtotal 794,632 231,480 28,562 171,655 1,226,329 Less: Unearned Discount 710 65 - 248 1,023 Loans, net of unearned discount $ 793,922 $ 231,415 $ 28,562 $ 171,407 $ 1,225,306 Commercial, December 31, 2016 Real Estate
Mortgage Installment and
Other Financial and
Agriculture Total Pass $ 522,949 $ 174,325 $ 21,278 $ 134,235 $ 852,787 Special Mention 376 237 - 618 1,231 Substandard 11,873 1,336 79 208 13,496 Doubtful - 200 - 40 240 Subtotal 535,198 176,098 21,357 135,101 867,754 Less: Unearned Discount 378 60 - 262 700 Loans, net of unearned discount $ 534,820 $ 176,038 $ 21,357 $ 134,839 $ 867,054 December 31, 2023 ($ in thousands) Commercial,
Financial and
AgricultureCommercial
Real EstateConsumer
Real EstateConsumer
InstallmentTotal Allowance for credit losses: Beginning balance $ 6,349 $ 20,389 $ 11,599 $ 580 $ 38,917 Initial allowance on PCD loans 727 2,260 182 7 3,176 Provision for credit losses 2,164 6,610 3,279 1,697 13,750 Loans charged-off (745) (250) (49) (2,048) (3,092) Recoveries 349 116 249 567 1,281 Total ending allowance balance $ 8,844 $ 29,125 $ 15,260 $ 803 $ 54,032 December 31, 2022 ($ in thousands) Commercial,
Financial and
AgricultureCommercial
Real EstateConsumer
Real EstateConsumer
InstallmentTotal Allowance for credit losses: Beginning balance $ 4,873 $ 17,552 $ 7,889 $ 428 $ 30,742 Initial allowance on PCD loans 614 576 113 — 1,303 Provision for credit losses 688 1,742 2,786 134 5,350 Loans charged-off (259) (72) (204) (683) (1,218) Recoveries 433 591 1,015 701 2,740 Total ending allowance balance $ 6,349 $ 20,389 $ 11,599 $ 580 $ 38,917 December 31, 2021 ($ in thousands) Commercial,
Financial and
AgricultureCommercial
Real EstateConsumer
Real EstateConsumer
InstallmentTotal Allowance for credit losses: Beginning balance $ 6,214 $ 24,319 $ 4,736 $ 551 $ 35,820 Impact of ASC 326 adoption on non-PCD loans (1,319) (4,607) 5,257 (49) (718) Impact of ASC 326 adoption on PCD loans 166 575 372 2 1,115 Provision for credit losses (1) 1,041 (100) (2,314) (83) (1,456) Loans charged-off (1,662) (3,523) (473) (555) (6,213) Recoveries 433 888 311 562 2,194 Total ending allowance balance $ 4,873 $ 17,552 $ 7,889 $ 428 $ 30,742 (1) 84The negative provision of $1.5 million for credit losses on the consolidated statements of income is net of a $370 thousand provision for credit marks in the Cadence Bank Branches loans acquired for the year ended December 31, 2022. ($ in thousands) Commercial,
Financial and
AgricultureCommercial
Real EstateConsumer
Real EstateConsumer
InstallmentTotal December 31, 2023 LHFI Individually evaluated $ 1,414 $ 710 $ 778 $ — $ 2,902 Collectively evaluated 798,910 3,058,445 1,252,017 57,768 5,167,140 Total $ 800,324 $ 3,059,155 $ 1,252,795 $ 57,768 $ 5,170,042 Allowance for Credit Losses Individually evaluated $ 408 $ — $ — $ — $ 408 Collectively evaluated 8,436 29,125 15,260 803 53,624 Total $ 8,844 $ 29,125 $ 15,260 $ 803 $ 54,032 ($ in thousands) Commercial,
Financial and
AgricultureCommercial
Real EstateConsumer
Real EstateConsumer
InstallmentTotal December 31, 2022 LHFI Individually evaluated $ — $ 4,560 $ 998 $ — $ 5,558 Collectively evaluated 536,192 2,130,703 1,058,001 43,703 3,768,599 Total $ 536,192 $ 2,135,263 $ 1,058,999 $ 43,703 $ 3,774,157 Allowance for Credit Losses Individually evaluated $ — $ — $ 5 $ — $ 5 Collectively evaluated 6,349 20,389 11,594 580 38,912 Total $ 6,349 $ 20,389 $ 11,599 $ 580 $ 38,917 2017 2016 Premises: Land $ 17,242,999 $ 10,566,139 Buildings and improvements 31,931,767 27,463,504 Equipment 12,546,553 10,436,712 Construction in progress 1,070,775 779,833 62,792,094 49,246,188 Less accumulated depreciation and amortization 16,366,063 14,621,836 $ 46,426,031 $ 34,624,352 ($ in thousands) 2023 2022 Premises: Land $ 48,460 $ 40,846 Buildings and improvements 126,013 100,830 Equipment 41,788 32,486 Construction in progress 1,808 6,447 218,069 180,609 Less accumulated depreciation and amortization 43,760 37,091 Total $ 174,309 $ 143,518 $2,046,005, $1,653,663$7.4 million, $5.7 million, and $1,645,081$5.4 million in 2017, 20162023, 2022 and 2015,2021, respectively.The aggregate amount of timein denominationsthat meet or exceed the FDIC Insurance limit of $250,000 or more as ofat December 31, 2017,2023 and as of December 31, 2016, was $71,596,0932022, were $292.9 million and $60,219,749$146.6 million, respectively.2017,2023, the scheduled maturities of time deposits included in interest-bearing deposits were as follows (In thousands):Year Amount 2018 $ 152,550 2019 89,431 2020 15,667 2021 9,212 2022 16,416 Thereafter - $ 283,276 ($ in thousands) Year Amount 2024 $ 971,259 2025 59,867 2026 13,593 2027 7,575 2028 14,935 Thereafter 8,527 Total $ 1,075,756 Borrowed 2017 2016 Reverse Repurchase Agreement $ - $ 5,000,000 FHLB advances 88,072,294 48,000,000 First Tennessee Bank 16,000,000 16,000,000 $ 104,072,294 $ 69,000,000 85($ in thousands) 2023 2022 Bank Term Funding Program $ 390,000 $ — FHLB advances — 130,100 Total $ 390,000 $ 130,100 Advanceshavewas payable at its maturity dates ranging from January 2018 through June 2019.date, with a prepayment penalty for fixed rate advances. Interest iswas payable monthly at rates ranging from .95%4.55% to 4.72%4.58%. Advances due to the FHLB are collateralized by a blanket lien on first mortgage loans in the amount of the outstanding borrowings, FHLB capital stock, and amounts on deposit with the FHLB. At December 31, 2017,In 2022, advances due to the FHLB advances availablewere collateralized by $3.651 billion in loans. Based on this collateral and unused totaled $445,799,187.Future annual principal repayment requirements onholdings of FHLB stock, the borrowings from the FHLBCompany is eligible to borrow up to a total of $2.051 billion and $1.679 billion at December 31, 2017, were2023 and 2022, respectively.Year Amount 2018 $ 77,572,294 2019 10,500,000 2020 - 2021 - Total $ 88,072,294 As of December 31, 2016, reverse repurchase agreements consisted of one $5,000,000 agreement. The agreement was secured by securities with a fair value of $5,470,105 at December 31, 2016. On September 25, 2017, the underlying securities were repurchased and the agreement was terminated.The Company entered into a loan agreement with First Tennessee Bank for a $20 million revolving line of credit. The maturity date is December 5, 2018. The interest rate will be at a rate of 2.50% over the LIBOR Rate. The Company executed a negative pledge agreement to which it agreed not to pledge any capital stock of the Bank so long as any indebtedness is outstanding under the line of credit. The loan agreement includes covenants that require the Company to maintain key financial ratios above or below a stated benchmark level and prohibit the Company from incurring loans other than those permitted by the loan agreement without prior written consent of the lender.($ in thousands) 2024 $ 390,000 2025 — 2026 — 2027 — 2028 — committed under several long-termreasonably certain the Company will exercise the option. In addition, the Company has elected to account for any non-lease components in its real estate leases as part of the associated lease component. The Company has also elected not to recognize leases with original lease terms of 12 months or less (short-term leases) on the Company’s balance sheet.which provideand short-term leases is recognized on a straight-line basis over the lease term and is recorded in net occupancy and equipment expense in the consolidated statements of income and other comprehensive income. Right-of-use assets represent our right to use an underlying asset for minimumthe lease payments. Certain leases contain options for renewal. Total rental expense under these operating leases amountedterm and lease liabilities represent our obligation to $602,000, $577,000make lease payments arising from the lease. Right-of-use assets and $530,000 aslease liabilities are recognized at the lease commencement date and based on the estimated present value of December 31, 2017, 2016 and 2015, respectively.also committed under two long-term capitalnot known. The Company’s incremental borrowing rate is based on the FHLB amortizing advance rate, adjusted for the lease agreements. One capitalterm and other factors.agreement had an outstanding balance of $708,000terms and $879,000 at December 31, 2017 and 2016, respectively (included in other liabilities). This lease has a remaining term of 4 years at December 31, 2017. Assetsdiscount rates, related to the capital lease are included in premises and the cost consists of $2,675,000 less accumulated depreciation of approximately $1,651,000 and $1,390,000 at December 31, 2017 and 2016, respectively. The second capital lease agreement had an outstanding balance of $161,000 at December 31, 2017. This lease has a remaining term of two years at December 31, 2017. Assets related to the capital lease are included in premises and the cost consists of $266,000 less accumulated depreciation of approximately $22,000, and $12,000 at December 31, 2017 and 2016, respectively.Minimum future lease payments for the operating and capital leases at December 31, 2017, were as follows: Operating
Leases Capital
Leases (In thousands) 2018 536 275 2019 440 275 2020 317 191 2021 197 175 2022 146 - Thereafter 312 - Total Minimum Lease Payments $ 1,948 $ 916 Less: Amount representing interest (47 ) Present value of minimum lease payments $ 869
2023 and 2022.86($ in thousands) December 31,
2023December 31,
2022Right-of-use assets: Operating leases $ 6,387 $ 7,620 Finance leases, net of accumulated depreciation 1,466 1,930 Total right-of-use assets $ 7,853 $ 9,550 Lease liabilities: Operating lease $ 6,550 $ 7,810 Finance lease 1,739 1,918 Total lease liabilities $ 8,289 $ 9,728 Weighted average remaining lease term Operating leases 7.2 years 7.5 years Finance leases 7.9 years 8.9 years Weighted average discount rate Operating leases 2.0% 1.8% Finance leases 2.2% 2.2% ($ in thousands) December 31, 2023 2022 2021 Operating lease cost $ 1,504 $ 1,464 $ 1,657 Finance lease cost: Interest on lease liabilities 40 44 7 Amortization of right-of-use 464 464 263 Net lease cost $ 2,008 $ 1,972 $ 1,927 ($ in thousands) December 31, 2023 Operating Leases Finance Leases 2024 $ 1,144 $ 220 2025 1,043 220 2026 945 222 2027 777 252 2028 691 252 Thereafter 2,439 735 Total lease payments 7,039 1,901 Less: Interest (489) (162) Present value of lease liabilities $ 6,550 $ 1,739 I1 capital (as defined) to risk-weighted assets (as defined), Tier I1 capital to adjusted total assets (leverage) and common equity Tier 1.2017,2023, that the Company and its subsidiary bank exceededmet all capital adequacy requirements.In 2013, the Federal Reserve votedrequirements to adopt final capital rules implementing Basel III requirements for U.S. Banking organizations. Under the final rule, minimum requirements increased for both the quantity and quality of capital held by banking organizations. The final rule includes a new minimum ratio of common equity Tier 1 capital (Tier 1 Common) to risk-weighted assets and a Tier 1 Common capital conservation buffer of 2.5% of risk-weighted assets that will apply to all supervised financial institutions. The rule also raises the minimum ratio of Tier 1 capital to risk-weighted assets and includes a minimum leverage ratio of 4% for all banking organizations. These new minimum capital ratios were effective on January 1, 2015, and will be fully phased in on January 1, 2019.At December 31, 2017 and 2016, the subsidiary bank was categorized by regulators as well-capitalized under the regulatory framework for prompt corrective action.which they are subject. Under Basel III requirements, a financial institution is considered to be well-capitalized if it has a total risk-based capital ratio of 10% or more, has a Tier I1 risk-based capital ratio of 8% or more, has a common equity Tier 1 of 6.5%, and has a Tier I1 leverage capital ratio of 5% or more. There are no conditions or anticipated events that, in the opinion of management, would change the categorization. 20172023 and 20162022 are presented in the following table. No amount was deducted from capital for interest-rate risk exposure.(Dollars in thousands) Company Subsidiary (Consolidated) The First Amount Ratio Amount Ratio December 31, 2017 Total risk-based $ 217,157 15.5 % $ 211,338 15.1 % Common equity Tier 1 199,170 14.2 % 203,050 14.5 % Tier I risk-based 208,869 14.9 % 203,050 14.5 % Tier I leverage 208,869 11.7 % 203,050 11.4 % December 31, 2016 Total risk-based $ 157,557 15.5 % $ 172,572 17.0 % Common equity Tier 1 140,747 13.8 % 165,062 16.2 % Tier I risk-based 150,047 14.7 % 165,062 16.2 % Tier I leverage 150,047 11.9 % 165,062 13.1 % 87($ in thousands) December 31, 2023 Company
(Consolidated)Amount Amount Total risk-based $ 892,310 15.0 % $ 875,071 14.8 % Common equity Tier 1 715,858 12.1 % 821,246 13.8 % Tier 1 risk-based 740,113 12.5 % 821,246 13.8 % Tier 1 leverage 740,113 9.7 % 821,246 10.7 % December 31, 2022 Amount Amount Ratio Total risk-based $ 753,708 16.7 % $ 739,616 16.4 % Common equity Tier 1 570,660 12.7 % 701,099 15.6 % Tier 1 risk-based 586,068 13.0 % 701,099 15.6 % Tier 1 leverage 586,068 9.3 % 701,099 11.1 % 31,2017,31, 2023, and 2016,2022, were as follows: (Dollars in thousands) Company Subsidiary (Consolidated) The First Amount Ratio Amount Ratio December 31, 2017 Total risk-based $ 111,933 8.0 % $ 111,789 8.0 % Common equity Tier 1 62,962 4.5 % 62,882 4.5 % Tier I risk-based 83,949 6.0 % 83,842 6.0 % Tier I leverage 71,362 4.0 % 71,290 4.0 % December 31, 2016 Total risk-based $ 81,504 8.0 % $ 81,391 8.0 % Common equity Tier 1 45,846 4.5 % 45,782 4.5 % Tier I risk-based 61,128 6.0 % 61,043 6.0 % Tier I leverage 50,412 4.0 % 50,364 4.0 % ($ in thousands) December 31, 2023 Company
(Consolidated)Amount Amount Total risk-based $ 475,183 8.0 % $ 474,679 8.0 % Common equity Tier 1 267,291 4.5 % 267,007 4.5 % Tier 1 risk-based 356,387 6.0 % 356,009 6.0 % Tier 1 leverage 237,592 4.0 % 237,339 4.0 % December 31, 2022 Amount Amount Ratio Total risk-based $ 360,597 8.0 % $ 360,071 8.0 % Common equity Tier 1 202,836 4.5 % 202,540 4.5 % Tier 1 risk-based 270,447 6.0 % 270,053 6.0 % Tier 1 leverage 180,298 4.0 % 180,035 4.0 % Company’sprincipal sources of funds to the Company to pay dividends if any, are expected to be made fromthe dividends received from the Bank. Consequently, dividends are dependent upon The First’s earnings, capital needs, regulatory policies, as well as statutory and regulatory limitations. Federal Reserve regulations limit dividends, stock repurchases and discretionary bonuses to executive officers if the Company’s regulatory capital is below the level of regulatory minimums plus the applicable capital conservation buffer. Federal and state banking laws and regulations restrict the amount of dividends and loans a bank may make to its subsidiary bank. The OCC limitsparent company. Approval by the Company’s regulators is required if the total of all dividends of a national bankdeclared in any calendar year toexceed the total of its net profits ofincome for that year combined with theits retained net profits forincome of the preceding two preceding years. Years Ended December 31, 2017 2016 2015 Current: Federal $ 408,086 $ 3,363,290 $ 2,484,372 State 100,861 577,401 473,037 Deferred (In 2017, includes $2,080,747 due to 6,445,865 (10,352 ) 255,638 Tax Cut and Jobs Act) $ 6,954,812 $ 3,930,339 $ 3,213,047 ($ in thousands) Years Ended December 31, 2023 2022 2021 Current: Federal $ 11,754 $ 12,071 $ 12,546 State 2,587 2,759 2,630 Deferred 7,006 940 1,739 Total income tax expense $ 21,347 $ 15,770 $ 16,915 Years Ended December 31, 2017 2016 2015 % % % Income taxes at statutory rate $ 6,149,951 35 % $ 4,917,159 35 % $ 4,083,995 34 % Tax-exempt income (1,154,595 ) (6 )% (927,506 ) (7 )% (831,141 ) (7 )% Nondeductible expenses 233,925 1 % 130,609 1 % 161,176 1 % State income tax, net of federal tax effect 65,560 - 375,311 3 % 307,951 3 % Tax credits, net (331,080 ) (2 )% (308,684 ) (2 )% (295,800 ) (2 )% Deferred tax adjustment due to Tax Cuts and Job Act 2,080,747 12 % - - - - Other, net (89,696 ) - (256,550 ) (2 )% (213,134 ) (2 )% $ 6,954,812 40 % $ 3,930,339 28 % $ 3,213,047 27 % On December 22, 2017, the Tax Cuts and Jobs Act was enacted which permanently reduced the U.S. corporate income tax rate from a maximum of 35% to a flat 21% rate, effective January 1, 2018. As a result of the reduction in the U.S corporate income tax rate, the Company reevaluated its ending net deferred tax asset as of December 31,2017 and recognized a tax expense of approximately $2.1 million.88($ in thousands) Years Ended December 31, 2023 2022 2021 Amount % Amount % Amount % Income taxes at statutory rate $ 20,289 21 % $ 16,525 21 % $ 17,027 21 % Tax-exempt income, net (1,696) (2) % (2,369) (3) % (1,692) (2) % Nondeductible expenses 144 — % 391 — % 29 — % State income tax, net of federal tax effect 3,064 4 % 2,251 3 % 2,299 3 % Federal tax credits, net (715) (1) % (715) (1) % (715) (1) % Other, net 261 — % (313) — % (33) — % $ 21,347 22 % $ 15,770 20 % $ 16,915 21 % December 31, 2017 2016 Deferred tax assets: Allowance for loan losses $ 2,096,866 $ 2,897,479 Net operating loss carryover 1,500,867 2,315,140 Non-accrual loan interest 344,187 35,208 Other real estate 842,797 272,598 Unrealized loss on available-for-sale securities 150,298 642,629 Other 965,766 1,184,474 5,900,781 7,347,528 Deferred tax liabilities: Securities (43,400 ) (115,737 ) Premises and equipment (315,550 ) (449,136 ) Core deposit intangible (204,103 ) (231,845 ) Goodwill (989,011 ) (1,228,960 ) (1,552,064 ) (2,025,678 ) Net deferred tax asset, included in other assets $ 4,348,717 $ 5,321,850 ($ in thousands) December 31, 2023 2022 Deferred tax assets: Allowance for credit losses $ 13,276 $ 9,581 Net operating loss carryover 27,256 24,531 Nonaccrual loan interest 826 600 Other real estate 1,092 894 Deferred compensation 1,161 1,205 Loan purchase accounting 6,438 2,554 Unrealized loss on available-for-sale securities 38,776 48,738 Lease liability 2,037 2,395 Other 5,014 3,299 95,876 93,797 Deferred tax liabilities: Securities (560) (627) Premises and equipment (9,017) (6,588) Core deposit intangible (16,094) (7,628) Goodwill (2,651) (2,388) Right-of-use asset (1,929) (2,517) Other (1,461) (596) (31,712) (20,344) Net deferred tax asset/(liability), included in other assets/(liabilities) $ 64,164 $ 73,453 Wiggins in 2006, Baldwin Bancshares, Inc. in 2013, BayBCB Holding Company, Inc. in 2014, and Gulf Coast Community Bank in 2017, Sunshine Financial, Inc. in 2018, and FPB Financial Corp. in 2019, SWG in 2020, BBI in 2022, and HSBI in 2023, the Company assumed federal tax net operating loss carryovers. These$228.9 million of net operating losses areremain available to the Company and begin to expire as follows :Years Amounts 2018 $ 551,818 2019 396,985 2020-2032 4,464,304 2033 281,800 2034 147,617 2035-2036 92,114 $ 5,934,638 2017,2023, the Company had no uncertain tax2014. In February 2017, the Company was notified that its federal income tax return for 2014 was to be examined by the Internal Revenue Service. The examination was completed during 2017 with no findings.(401(k)(401k plan) whereby employees contribute a percentage of their compensation. For employee contributions of six percent or less, the Company and its subsidiary bank provide a 50% matching contribution. Contributions totaled $512,800$1.5 million in 2017, $339,2002023, $1.2 million in 20162022, and $287,055$1.1 million in 2015.2017,2023, the ESOP held 5,728 shares valued at $168 thousand of Company common stock and had no debt obligation. All shares held by the plan were considered outstanding for net income per share purposes. Total ESOP expense was $3,675$24 thousand for 2017, $5,3462023, $33 thousand for 20162022, and $25,506$3 thousand for 2015.will beare accrued by the Company and included in other liabilities in the Consolidated Balance Sheets. The SERP balance at such retirement date.December 31, 2023 and 2022 was $4.6 million and $3.7 million, respectively. The Company accrued to expense $241,937$951 thousand for 20172023, $945 thousand for 2022, and $194,164$945 thousand for 2016 and $88,992 for 20152021 for future benefits payable under the SERP. The SERP is an unfunded plan and is considered a general contractual obligation of the Company.892017,2023, the total liability of the deferred compensation agreements was $1,189,456.$763 thousand, $1.1 million, $2.6 million, and $273 thousand, respectively. Deferred compensation expense totaled $31,309$24 thousand, $152 thousand, $112 thousand, and $19 thousand, respectively for 2017.DuringTotal shares issuable under the plan are 239,964 at year-end 2023, and 167,173 and 129,950 shares were issued in 2023 and 2022, respectively.endedfollows:Nonvested shares Shares Weighted-
Average
Grant-Date
Fair ValueNonvested at January 1, 2023 364,056 $ 31.88 Granted 167,173 Vested (54,094) Forfeited (12,194) Nonvested at December 31, 2023 464,941 $ 31.08 2015, 69,327 restricted stock awards were2023, there was $8.5 million of total unrecognized compensation cost related to nonvested shares granted under the Plan. DuringThe costs are expected to be recognized over the yearremaining term of the vesting period2016, 61,247 restricted stock awards were granted under the Plan. During the year ended December 31, 2017, 84,286 restricted stock awards were granted under the Plan2023, 2022 and no stock awards were forfeited due to separation. During 2017, 11,867 shares were repurchased for payment of taxes. During 2016, 9,895 shares were repurchased2021 was $1.7 million, $2.5 million, and during 2015, 6,324 shares were repurchased for payment of taxes. The weighted average grant-date fair value for these shares was $27.71 per share. $3.2 million.costscost in the amount of $866,558$2.3 million was recognized for the year ended December 31, 2017, $772,3112023, $2.4 million was recognized for the year ended December 31, 20162022 and $721,124$3.1 million for the year ended December 31, 2015.2021. Shares of restricted stock granted to employees under this stock plan are subject to restrictions as to the vesting period. The restricted stock award becomes 100% vested on the earliest of 1) the three or five year vesting period provided the Grantee has not incurred a termination of employment prior to that date, 2) the Grantee’s retirement, or 3) the Grantee’s death. During this period, the holder is entitled to full voting rights and dividends. The dividends which are held untilby the Company and only paid if and when the grants are vested. The 2007 Plan also contains a double trigger change-in-control provision pursuant to which unvested shares of stock granted through the plan will be accelerated upon a change in control if the executive is terminated without cause as a result of the transaction (as long as the shares granted remain part of the Company or are transferred into the shares of the new company). AsDecember 31, 2017, there was approximately $3,012,598the BBI acquisition, the Company assumed outstanding options previously granted by BBI under the BBI 2018 Stock Option Plan ("legacy BBI options"). In connection with the assumption of unrecognized compensation expense related to this Plan. The expense is expectedthe legacy BBI options, the Company reserved for issuance 310,427 shares of common stock to be recognized over the remaining termissued upon exercise of the vesting period (approximately 4 years).DEBENTURES$4,124,000$4.1 million of floating rate junior subordinated deferrable interest debentures to The First Bancshares Statutory Trust 2 in which the Company owns all of the common equity.(“Trust 2”). The debentures are the sole asset of Trust 2, and the Trust. TheCompany is the sole owner of the common equity of Trust 2. Trust 2 issued $4,000,000$4.0 million of Trust Preferred Securities to investors. The Company’s obligations under the debentures and related documents, taken together, constitute a full and unconditional guarantee by the Company of the Trust’sTrust 2’s obligations under the preferred securities. The preferred securities wereare redeemable by the Company at its option. The preferred securities must be redeemed upon maturity of the debentures in 2036. Interest on the preferred securities is the three month London Interbank Offerthree-month term Secured Overnight Financing Rate (LIBOR)("SOFR") plus 1.65% plus a tenor spread adjustment of 0.026161% and is payable quarterly. The terms of the subordinated debentures are identical to those of the preferred securities.$6,186,000$6.2 million of floating rate junior subordinated deferrable interest debentures to The First Bancshares Statutory Trust 3 in which the(“Trust 3”). The Company owns all of the common equity. Theequity of Trust 3, and the debentures are the sole asset of Trust 3. The Trust 3 issued $6,000,000$6.0 million of Trust Preferred Securities to investors. The Company’s obligations under the debentures and related documents, taken together, constitute a full and unconditional guarantee by the Company of the Trust’sTrust 3’s obligations under the preferred securities. The preferred securities are redeemable by the Company at its option. The preferred securities must be redeemed upon maturity of the debentures in 2037. Interest on the preferred securities is the three month LIBORthree-month term SOFR plus 1.40% plus a tenor spread adjustment of 0.026161% and is payable quarterly. The terms of the subordinated debentures are identical to those of the preferred securities.trustsTrust 2, Trust 3, FMB Trust, and Liberty Trust are not included in the consolidated financial statements.26,4941,249,607 at December 31, 2017, 2016,2023, 1,249,607 at December 31, 2022 and 2015.In the opinion of management, these loans are made on substantially the same terms, including interest rates and collateral, as those prevailing at the time for comparable transactions with other parties, are consistent with sound banking practices, and are within applicable regulatory and lending limitations. Such loans amounted to approximately $15,137,000$23.7 million and $15,788,000$28.3 million at December 31, 20172023 and 2016,2022, respectively. The activity in loans to current directors, executive officers, and their affiliates during the year ended December 31, 2017,2023, is summarized as follows (in thousands):follows:($ in thousands) 90Loans outstanding at beginning of year $ 28,338 Advances/new loans 725 Removed/payments (5,383) Loans outstanding at end of year $ 23,680 Loans outstanding at beginning of year $ 15,788 New loans 250 Repayments (901 ) Loans outstanding at end of year $ 15,137 The subsidiary bank had outstanding letters of credit of $8,207,000 and $1,742,000 at December 31, 2017 and 2016, respectively, and had made loan commitments of approximately $281,381,000 and $220,252,000 at December 31, 2017 and 2016, respectively.two years ended December 31, 2017,2023 and 2022, nor are any significant losses as a result of these transactions anticipated.primary market areas servedcontractual amounts of financial instruments with off-balance-sheet risk at year-end were as follows:2023 2022 ($ in thousands) Commitments to make loans $ 34,380 $ 50,226 $ 43,227 $ 15,758 Unused lines of credit 231,335 605,646 243,043 404,025 Standby letters of credit 15,573 13,114 4,260 9,909 ($ in thousands) 2023 2022 2021 Balance at beginning of period $ 1,325 $ 1,070 $ — Adoption of ASU 326 — — 718 Credit loss expense related to OBSC exposures 750 255 352 Balance at end of period $ 2,075 $ 1,325 $ 1,070 Bank are Forrest, Lamar, Jones, Pearl River, Jackson, Hancock, Stone, Harrison Counties within SouthCompany or for undrawn amounts under such arrangements that may be drawn prior to the cancellation on the arrangement.Madison County in Central Mississippi, as well as Washington Parish, St. Tammany Parish, Plaquemine ParishAlabama, Florida, Georgia, and East Baton Rouge Parish in Louisiana, Baldwin and Mobile Counties in South Alabama, and Escambia County in Northwestern Florida.Louisiana. Management closely monitors its credit concentrations and attempts to diversify the portfolio within its primary market area. As of December 31, 2017,2023, management does not consider there to be any significant credit concentrations within the loan portfolio. Although the that which establishes a framework for measuring fair value and expands disclosures about fair value measurements.Level 1:Valuations for assets and liabilities traded in active exchange markets, such as the New York Stock Exchange. Valuations are obtained from readily available pricing sources for market transactions involving identical assets or liabilities.Level 2:Valuations for assets and liabilities traded in less active dealer or broker markets. Valuations are obtained from third party pricing services for identical or comparable assets or liabilities which use observable inputs other than Level 1 prices, such as quoted prices for similar assets or liabilities; quoted prices in markets that are not active; or other inputs that are observable or can be corroborated by observable market data for substantially the full term of the assets and liabilities.Level 3:Unobservable inputs that are supported by little or no market activity and that are significant to the fair value of the assets or liabilities.91Followingdescriptionreasonable estimate of the valuation methodologies used for instruments measured at fair value on a recurring basis and recognized in the accompanying consolidated balance sheets.Available-for-Salevalue.Level 1 securities include mutual funds. If quoted market prices are not available, then fair values are estimated by using pricing models or quoted prices of securities with similar characteristics. Level 2 securities include U.S. Treasury securities, obligations of U.S. government corporations and agencies, obligations of states and political subdivisions, mortgage-backed securities, and collateralized mortgage obligations. In certain cases where Level 1 or Level 2 inputs are not available, securities are classified within Level 3 of the hierarchy.The following table presents the Company’s available-for-sale For securities thatwhere quoted prices or market prices of similar securities are measured atnot available, fair value on a recurring basis and the level within the hierarchy in which the fair value measurements fell as of December 31, 2017 and 2016 (In thousands): Fair Value Measurements Using Quoted Prices in
Active Markets
For
Identical Assets Significant
Other
Observable
Inputs Significant
Unobservable
Inputs Fair Value (Level 1) (Level 2) (Level 3) December 31, 2017 Obligations of U.S. Government agencies $ 4,992 $ - $ 4,992 $ - Municipal securities 138,584 - 138,584 - Mortgage-backed securities 196,578 - 196,578 - Corporate obligations 15,819 - 13,250 2,569 Other 920 920 - - Total $ 356,893 $ 920 $ 353,404 $ 2,569 Fair Value Measurements Using Quoted Prices in
Active Markets
For
Identical Assets Significant
Other
Observable
Inputs Significant
Unobservable
Inputs Fair Value (Level 1) (Level 2) (Level 3) December 31, 2016 Obligations of U.S. Government agencies $ 9,045 $ - $ 9,045 $ - Municipal securities 98,822 - 98,822 - Mortgage-backed securities 114,289 - 114,289 - Corporate obligations 20,110 - 17,869 2,241 Other 940 940 - - Total $ 243,206 $ 940 $ 240,025 $ 2,241 The following is a reconciliation of activity for assets measured at fair value based on significant unobservable (non-market) information.92(In thousands) Bank-Issued Trust
Trust Preferred
Securities 2017 2016 2015 Balance of recurring Level 3 assets at January 1 $ 2,241 $ 2,557 $ 2,801 Transfers into Level 3 - - - Transfers out of Level 3 - - - Unrealized income (loss) included in comprehensive Income 328 (316 ) (244 ) Balance of recurring Level 3 assets at December 31 $ 2,569 $ 2,241 $ 2,557 The following table presents quantitative information about recurring Level 3 fair value measurements (in thousands):Trust Preferred
Securities Fair Value Valuation Technique Significant
Unobservable Inputs Range of Inputs December 31, 2017 $ 2,569 Discounted cash flow Discount rate 2.07% - 3.77% December 31, 2016 $ 2,241 Discounted cash flow Discount rate 1.50% - 3.34% December 31, 2015 $ 2,557 Discounted cash flow Discount rate 1.08% - 2.77% Following is a description of the valuation methodologies used for assets and liabilities measured at fair value on a non-recurring basis and recognized in the accompanying balance sheets, as well as the general classification of such assets and liabilities pursuant to the valuation hierarchy.Impaired LoansLoans for which it is probable that the Company will not collect all principal and interest due according to contractual termsvalues are measured for impairment. Allowable methods for estimating fair value include using the fair value of the collateral for collateral dependent loans or, where a loan is determined not to be collateral dependent,calculated using the discounted cash flow method.If the impaired loan is identified as collateral dependent, then the fair value method of measuring the amount of impairment is utilized. This method requires obtaining a current independent appraisal of the collateral and applying a discount factor to the value. If the impaired loan is determined not to be collateral dependent, then the discounted cash flow method is used. This method requires the impaired loan to be recorded at the present value of expected future cash flows discounted at the loan’s effective interest rate. The effective interest rate of a loan is the contractual interest rate adjusted for any net deferred loan fees or costs, premiums or discounts existing at origination or acquisition of the loan. Impaired loans are classified within Level 2 of the fair value hierarchy.Other Real Estate OwnedOther real estate owned consists of properties obtained through foreclosure. The adjustment at the time of foreclosure is recorded through the allowance for loan losses. Fair value of other real estate owned is based on current independent appraisals. Due to the subjective nature of establishing the fair value when the asset is acquired, the actual fair value of the other real estate owned or foreclosed asset could differ from the original estimate. If it is determined the fair value declines subsequent to foreclosure, a valuation allowance is recorded through other income. Operating costs associated with the assets after acquisition are also recorded as non-interest expense. Gains and losses on the disposition of other real estate owned and foreclosed assets are netted and recorded in other income. Other real estate owned measured at fair value on a non-recurring basis at December 31, 2017, amounted to $7,158,409. Other real estate owned is classified within Level 2 of the fair value hierarchy.The following table presents the fair value measurement of assets and liabilities measured at fair value on a nonrecurring basis and the level within the fair value hierarchy in which the fair value measurements fell at December 31, 2017 and 2016 (In thousands)market indicators (Level 3).93 Fair Value Measurements Using Quoted Prices in
Active Markets
For
Identical Assets Significant
Other
Observable
Inputs Significant
Unobservable
Inputs Fair Value (Level 1) (Level 2) (Level 3) December 31, 2017 Impaired loans $ 10,574 $ - $ 10,574 $ - Other real estate owned 7,158 - 7,158 - December 31, 2016 Impaired loans $ 6,128 $ - $ 6,128 $ - Other real estate owned 6,007 - 6,007 - The following methods and assumptions were used to estimate the fair value of each class of financial instrument for which it is practicable to estimate that value:Cash and Cash Equivalents – For such short-term instruments, the carrying amount is a reasonable estimate of fair value.Investment in securities available-for-sale and held-to-maturity – The fair value measurement for securities available-for-sale was discussed earlier. The same measurement approach was used for securities held-to-maturity and other securities.iswas estimated by discounting the expected future cash flows using the current interest rates at which similar loans would be made to borrowers with similar credit ratings and for the same remaining maturities.Bank-owned Life Insurance– Thematurities, in accordance with the exit price notion as defined by FASB ASC 820, bank-owned life insurance approximates the fair value hierarchy.because upon liquidation of theseaccrued interest receivable approximates fair value and is classified as level 2 for accrued interest receivable related to investments the Company would receive the cash surrender value which equals the carrying amount.areis estimated using discounted cash flows, based on current incremental borrowing rates for similar types of borrowing arrangements. The carrying amount of any variable rate borrowing approximates its fair value.subordinated debentures bearcarrying amount of accrued interest atpayable approximates fair value resulting in a variable rate and the carrying value approximates the fair value.December 31, 2023 Fair Value Measurements ($ in thousands) Fair Value Quoted Prices in
Active Markets
For
Identical Assets
(Level 1)Significant
Other
Observable
Inputs
(Level 2)Significant
Unobservable
Inputs
(Level 3)Assets: Available-for-sale U.S. Treasury $ 16,675 $ 16,675 $ — $ — Obligations of U.S. government agencies and sponsored entities 104,923 — 104,923 — Municipal securities 438,466 — 420,283 18,183 Mortgage-backed Securities 441,661 — 441,661 — Corporate obligations 37,597 — 37,567 30 Other 3,043 — 3,043 — Total investment securities available-for-sale $ 1,042,365 $ 16,675 $ 1,007,477 $ 18,213 Loans held for sale 2,914 — 2,914 — Interest rate swaps $ 12,170 $ — $ 12,129 $ 41 Liabilities: Interest rate swaps $ 12,175 $ — $ 12,129 $ 46 December 31, 2022 Fair Value Measurements ($ in thousands) Fair Value Quoted Prices in
Active Markets
For
Identical Assets
(Level 1)Significant
Other
Observable
Inputs
(Level 2)Significant
Unobservable
Inputs
(Level 3)Assets: Available-for-sale U.S. Treasury $ 123,854 $ 123,854 $ — $ — Obligations of U.S. government agencies and sponsored entities 144,369 — 144,369 — Municipal securities 457,857 — 442,740 15,117 Mortgage-backed securities 490,139 — 490,139 — Corporate obligations 40,882 — 40,851 31 Total investment securities available-for-sale $ 1,257,101 $ 123,854 $ 1,118,099 $ 15,148 Loans held for sale $ 4,443 $ — $ 4,443 $ — Interest rate swaps $ 12,825 $ — $ 12,825 $ — Liabilities: Interest rate swaps $ 12,825 $ — $ 12,825 $ — Bank-Issued Trust
Preferred Securities($ in thousands) 2023 2022 Balance, January 1 $ 31 $ 43 Paydowns (1) (12) Balance, December 31 $ 30 $ 31 Municipal Securities ($ in thousands) 2023 2022 Balance, January 1 $ 15,117 $ 20,123 Maturities, calls and paydowns (2,639) (2,328) Transfer from level 2 to level 3 6,085 — Unrealized (loss) gain included in comprehensive income (380) (2,678) Balance, December 31 $ 18,183 $ 15,117 Interest Rate Swaps - Risk Participations ($ in thousands) 942023 Balance, January 1 $ — RPA-in (46) RPA-out 41 Balance at December 31 $ (5) ($ in thousands) Bank-Issued Trust Preferred Securities Fair Value Valuation Technique Significant Unobservable
InputsRange of Inputs December 31, 2023 $ 30 Discounted cash flow Discount rate 7.81% - 7.89% December 31, 2022 $ 31 Discounted cash flow Discount rate 6.98% - 7.19% Municipal Securities Fair Value Valuation Technique Significant Unobservable
InputsRange of Inputs December 31, 2023 $ 18,183 Discounted cash flow Discount rate 2.34% - 5.50% December 31, 2022 $ 15,117 Discounted cash flow Discount rate 3.00% - 4.00% As of December 31, 2017 Fair Value Measurements (In thousands) Carrying
Amount Estimated
Fair Value Quoted Prices
(Level 1) Significant
Other
Observable
Inputs
(Level 2) Significant
Unobservable
Inputs
(Level 3) Financial Instruments: Assets: Cash and cash equivalents $ 91,922 $ 91,922 $ 91,922 $ - $ - Securities available-for-sale 356,893 356,893 920 353,404 2,569 Securities held-to-maturity 6,000 7,398 - 7,398 - Other securities 9,969 9,969 - 9,969 - Loans, net 1,221,808 1,238,525 - - 1,238,525 Bank-owned life insurance 27,054 27,054 - 27,054 - Liabilities: Non-interest-bearing deposits $ 301,989 $ 301,989 $ - $ 301,989 $ - Interest-bearing deposits 1,168,576 1,165,682 - 1,165,682 - Subordinated debentures 10,310 10,310 - - 10,310 FHLB and other borrowings 104,072 104,072 - 104,072 - As of December 31, 2017 Fair Value Measurements (In thousands) Carrying
Amount Estimated
Fair Value Quoted Prices
(Level 1) Significant
Other
Observable
Inputs
(Level 2) Significant
Unobservable
Inputs
(Level 3) Financial Instruments: Assets: Cash and cash equivalents $ 62,119 $ 62,119 $ 62,119 $ - $ - Securities available-for-sale 243,206 243,206 940 240,025 2,241 Securities held-to-maturity 6,000 7,394 - 7,394 - Other securities 6,593 6,593 - 6,593 - Loans, net 865,424 883,161 - - 883,161 Bank-owned life insurance 21,250 21,250 - 21,250 - Liabilities: Non-interest-bearing deposits $ 202,478 $ 202,478 $ - $ 202,478 $ - Interest-bearing deposits 836,713 835,658 - 835,658 - Subordinated debentures 10,310 10,310 - - 10,310 FHLB and other borrowings 69,000 69,000 - 69,000 - Interest Rate Swaps - Risk Participations Fair Value Valuation Technique Significant Unobservable
InputsRange of Inputs December 31, 2023 $ (5) Credit Value Adjustment Credit Spread 225 bps - 300 bps Recovery Rate 70% Fair Value Measurements Using ($ in thousands) Fair Value Quoted Prices in
Active Markets
For
Identical Assets
(Level 1)Significant
Other
Observable
Inputs
(Level 2)Significant
Unobservable
Inputs
(Level 3)December 31, 2023 Collateral dependent loans $ 2,494 $ — $ — $ 2,494 Other real estate owned 8,320 — — 8,320 December 31, 2022 Collateral dependent loans $ 5,552 $ — $ — $ 5,552 Other real estate owned 4,832 — — 4,832 Fair Value Measurements December 31, 2023 Carrying
AmountEstimated
Fair ValueQuoted
Prices
(Level 1)Significant
Other Observable
Inputs
(Level 2)Significant
Unobservable
Inputs
(Level 3)($ in thousands) Financial Instruments: Assets: Cash and cash equivalents $ 355,147 $ 355,147 $ 355,147 $ — $ — Securities available-for-sale 1,042,365 1,042,365 16,675 1,007,477 18,213 Securities held-to-maturity 654,539 615,944 — 615,944 — Loans held for sale 2,914 2,914 — 2,914 — Loans, net 5,116,010 4,877,935 — — 4,877,935 Accrued interest receivable 33,300 33,300 — 8,632 24,668 Interest rate swaps 12,170 12,170 — 12,129 41 Liabilities: Non-interest-bearing deposits $ 1,849,013 $ 1,849,013 $ — $ 1,849,013 $ — Interest-bearing deposits 4,613,859 4,430,227 — 4,430,227 — Subordinated debentures 123,386 109,426 — — 109,426 FHLB and other borrowings 390,000 390,000 — 390,000 — Accrued interest payable 22,702 22,702 — 22,702 — Interest rate swaps 12,175 12,175 — 12,129 46 Fair Value Measurements December 31, 2022 Carrying
AmountEstimated
Fair ValueQuoted
Prices
(Level 1)Significant
Other Observable
Inputs
(Level 2)Significant
Unobservable
Inputs
(Level 3)($ in thousands) Financial Instruments: Assets: Cash and cash equivalents $ 145,315 $ 145,315 $ 145,315 $ — $ — Securities available-for-sale 1,257,101 1,257,101 123,854 1,118,099 15,148 Securities held-to-maturity 691,484 642,097 — 642,097 — Loans held for sale 4,443 4,443 — 4,443 — Loans, net 3,735,240 3,681,313 — — 3,681,313 Accrued interest receivable 27,723 27,723 — 9,757 17,966 Interest rate swaps 12,825 12,825 — 12,825 — Liabilities: Non-interest-bearing deposits $ 1,630,203 $ 1,630,203 $ — $ 1,630,203 $ — Interest-bearing deposits 3,864,201 3,505,990 — 3,505,990 — Subordinated debentures 145,027 133,816 — — 133,816 FHLB and other borrowings 130,100 130,100 — 130,100 — Accrued interest payable 3,324 3,324 — 3,324 — Interest rate swaps 12,825 12,825 — 12,825 — PREFERRED STOCKPursuantREVENUE FROM CONTRACTS WITH CUSTOMERStermsCompany’s revenue streams accounted for under ASC 606 is as follows:letter agreement betweenmonth, representing the Company and the United States Department of the Treasury (“Treasury”), the Company issued 17,123 CDCI Preferred Shares.95The Letter Agreement contains limitations on the payment of dividends on the common stock to no more than 100% of the aggregate per share dividend and distributions for the immediate prior fiscal year (dividends were declared and paid in 2011 through 2016) and on the Company’s ability to repurchase its common stock in the event of a non-payment of our dividend, and continues to subject the Company to certain of the executive compensation limitations included in the Emergency Economic Stabilization Act of 2008 (EESA), as previously disclosed by the Company. The CDCI Preferred Shares entitle the holder to an annual dividend of 2% for 8 years of the liquidation value of the shares, payable quarterly in arrears.On May 13, 2015, The First Bancshares, Inc. (the “Company”) entered into a Letter Agreement (the “Letter Agreement”), with the United States Department of the Treasury (“Treasury”), pursuant toperiod over which the Company redeemedsatisfies the Warrantperformance obligation. Overdraft fees are recognized at the point in time that the overdraft occurs. Service charges on deposits are withdrawn from the customer’s account balance.purchase upthe buyer, which generally occurs at the time of an executed deed. When the Company finances the sale of OREO to 54,705 sharesthe buyer, the Company assesses whether the buyer is committed to perform their obligations under the contract and whether the collectability of the transaction prices is probable. Once these criteria are met, the OREO asset is derecognized and the gain or loss on sale is recorded upon the transfer of control of the property to the buyer. In determining the gain or loss on the sale, the Company adjusts the transaction price and related gain (loss) on sale if a significant financing component is present.common stock, no par value per share (the “Common Stock”) issued to Treasury on February 6, 2009 underrevenue from contracts with customers in the Capital Purchase Program. In connection with this redemption, on May 13, 2015,scope of ASC 606 is recognized within non-interest income. The following table presents the Company paid Treasury an aggregate redemption priceCompany’s sources of $302,410.On December 6, 2016, the Company repurchased all 17,123 shares of its CDCI Preferred Shares at fair market value of $15,925,000, which equated to a discount of 7% to par, or $1,198,000.On October 14, 2016, the Company issued 3,563,380 shares of Series E Convertible Preferred Stock at $17.75 per share in a private placement offering and received approximately $59,744,000 in net proceeds after offering expenses of $3,506,000. The net proceeds from this private placement were used to finance the Iberville Bank acquisition and pay related expenses, to support our capital ratios in connection with the Iberville Bank acquisition and Gulf Coast Community Bank acquisition, andnon-interest income for general corporate purposes. All 3,563,380 shares of the Series E Convertible Preferred Stock were converted into 3,563,380 shares of common stock on January 4, 2017, following shareholder approval. Dividends were declared and paid on the Series E Convertible Preferred Stock.NOTE T – SUBSEQUENT EVENTSSubsequent events have been evaluated by management through the date the financial statements were issued.On March 1, 2018, the Company completed its acquisition of Southwest Banc Shares, Inc., (“Southwest”), and immediately thereafter merged First Community Bank with and into The First. The Company paid a total consideration of approximately $60.0 million in stock and cash. At December 31, 2017, First Community Bank had $400.6 million in total assets.($ in thousands) Year Ended December 31, 2023 Commercial/
Retail
BankMortgage
Banking
DivisionHolding
CompanyTotal Revenue by Operating Segments Non-interest income Service charges on deposits Overdraft fees $ 8,154 $ — $ — $ 8,154 Other 6,021 — — 6,021 Interchange income 18,914 — — 18,914 Investment brokerage fees 1,623 — — 1,623 Net gains on OREO 6 — — 6 Net losses on sales of securities (1) (9,716) — — (9,716) Gain on premises and equipment 35 — — 35 Gain on sale of loans 1,512 — — 1,512 Other 10,307 2,866 6,983 20,156 Total non-interest income $ 36,856 $ 2,866 $ 6,983 $ 46,705 ($ in thousands) Year Ended December 31, 2022 Commercial/
Retail
BankMortgage
Banking
DivisionHolding
CompanyTotal Revenue by Operating Segments Non-interest income Service charges on deposits Overdraft fees $ 4,023 $ 93 $ — $ 4,116 Other 8,679 — — 8,679 Interchange income 12,702 — — 12,702 Investment brokerage fees 1,566 — — 1,566 Net gains on OREO 214 — — 214 Net losses on sales of securities (1) (82) — — (82) Gain on acquisition (1) 281 — — 281 Loss on premises and equipment (116) — — (116) Other 2,724 4,210 2,667 9,601 Total non-interest income $ 29,991 $ 4,303 $ 2,667 $ 36,961 ($ in thousands) Year Ended December 31, 2021 Commercial/
Retail
BankMortgage
Banking
DivisionHolding
CompanyTotal Revenue by Operating Segments Non-interest income Service charges on deposits Overdraft fees $ 3,122 $ — $ — $ 3,122 Other 4,140 2 — 4,142 Interchange income 11,562 — — 11,562 Investment brokerage fees 1,349 — — 1,349 Net (losses) on OREO (300) — — (300) Net gains on sales of securities (1) 143 — — 143 Gain on acquisition (1) 1,300 — — 1,300 Loss on premises and equipment (264) — — (264) Other 7,487 8,821 111 16,419 Total non-interest income $ 28,539 $ 8,823 $ 111 $ 37,473 In connection with the acquisition, preliminarily, the Company expects to record approximately $26.3 milliongoodwill and $3.3 million of core deposit intangible. The core deposit intangible is to be expensed over 10 years.The Company acquired the $278 million loan portfolio at an estimated fair value discount of $4.4 million. The discount represents expected credit losses, adjusted for market interest rates and liquidity adjustments.Expenses associated with the acquisition were $3.6 million for the twelve month period ended December 31, 2017. These costs included charges associated with due diligence as well as legal and consulting expenses, which have been expensed as incurred.The following unaudited pro-forma financial information for the year ended December 31, 2017, gives effect to the acquisition as if the acquisition had occurred on January 1, 2017. The pro-forma financial information is not necessarily indicative of the results of operations had the acquisition been effective as of this date.(In thousands) Pro-Forma December 31, 2017 (unaudited) Net interest income $ 73,250 Non-interest income 17,481 Total revenue 90,731 Income before income taxes $ 17,930 Supplemental pro-forma earnings for 2017 were adjusted to exclude acquisition costs incurred during 2017.To fund the cash portion of the purchase price for the Company’s announced acquisition of Southwest, to fund other potential future acquisitions, and for general corporate purposes, including the repayment of debt and to support organic growth, the Company completed a sale in October, 2017, of an aggregate of 2,012,500 shares of its common stock in a public offering. Net proceeds after underwriting discounts and estimated expenses were approximately $55.2 million.
ASC 606.96On December 6, 2017, the Company entered into an Agreement and Plan of Merger with Sunshine Financial, Inc. (“Sunshine”), parent company of Sunshine Community Bank, whereby Sunshine will be merged with and into the Company (the “Sunshine Merger”). Sunshine’s wholly owned subsidiary bank, Sunshine Community Bank, (“Sunshine Community Bank”) will be merged with and into The First immediately following the Sunshine Merger. At December 31, 2017, Sunshine Community Bank had total assets of approximately $200.7 million. This transaction is expected to close in the second quarter of 2018, subject to shareholder approval. Regulatory approval was received February 27, 2018.UT - PARENT COMPANY FINANCIAL INFORMATIONfollow. December 31, 2017 2016 Assets: Cash and cash equivalents $ 20,435,721 $ 69,158 Investment in subsidiary bank 226,648,005 179,541,693 Investments in statutory trusts 310,000 310,000 Other 1,480,791 1,112,514 $ 248,874,517 $ 181,033,365 Liabilities and Stockholders’ Equity: Subordinated debentures $ 10,310,000 $ 10,310,000 Advances from First Tennessee Bank 16,000,000 16,000,000 Other 96,597 196,658 Stockholders’ equity 222,467,920 154,526,707 $ 248,874,517 $ 181,033,365 December 31, ($ in thousands) 2023 2022 Assets: Cash and cash equivalents $ 13,485 $ 9,843 Investment in subsidiary bank 1,056,369 778,885 Investments in statutory trusts 806 496 Bank owned life insurance 348 333 Other 3,275 3,962 $ 1,074,283 $ 793,519 Liabilities and Stockholders’ Equity: Subordinated debentures $ 123,386 $ 145,027 Other 1,863 1,830 Stockholders’ equity 949,034 646,663 $ 1,074,283 $ 793,519 Years Ended December 31, 2017 2016 2015 Income: Interest and dividends $ 8,296 $ 6,680 $ 5,573 Dividend income 3,675,000 2,875,000 1,650,000 Other 51,030 - - 3,734,326 2,881,680 1,655,573 Expenses: Interest on borrowed funds 859,823 222,152 185,351 Legal and professional 1,097,590 910,214 295,637 Other 1,349,143 1,240,863 833,502 3,306,556 2,373,229 1,314,490 Income before income taxes and equity in undistributed income of subsidiary 427,770 508,451 341,083 Income tax benefit 1,222,012 835,757 487,853 Income before equity in undistributed income of Subsidiary 1,649,782 1,344,208 828,936 Equity in undistributed income of subsidiary 8,966,694 8,774,479 7,969,766 Net income $ 10,616,476 $ 10,118,687 $ 8,798,702 97Years Ended December 31, ($ in thousands) 2023 2022 2021 Income: Interest and dividends $ 36 $ 17 $ 10 Dividend income 65,000 16,000 — Other 6,983 2,667 111 72,019 18,684 121 Expenses: Interest on borrowed funds 7,970 7,492 7,375 Legal and professional 1,136 593 941 Other 6,266 7,498 4,828 15,372 15,583 13,144 Income (loss) before income taxes and equity in undistributed income of subsidiary 56,647 3,101 (13,023) Income tax benefit 2,005 3,263 3,295 Income (loss) before equity in undistributed income of subsidiary 58,652 6,364 (9,728) Equity in undistributed income of subsidiary 16,805 56,555 73,895 Net income $ 75,457 $ 62,919 $ 64,167 Years Ended December 31, 2017 2016 2015 Cash flows from operating activities: Net income $ 10,616,476 $ 10,118,687 $ 8,798,702 Adjustments to reconcile net income to net cash used in operating activities: Equity in undistributed income of Subsidiary (8,966,694 ) (8,774,479 ) (7,969,766 ) Restricted stock expense 866,558 772,311 721,124 Gain on disposition of CVR (51,030 ) - - Other, net (624,261 ) (669,047 ) 151,251 Net cash provided by operating activities 1,841,049 1,447,472 1,701,311 Cash flows from investing activities: Investment in subsidiary bank (35,000,000 ) (60,000,000 ) - Outlays for acquisitions - - (35,709 ) Net cash used in investing activities (35,000,000 ) (60,000,000 ) (35,709 ) Cash flows from financing activities: Dividends paid on common stock (1,415,524 ) (782,936 ) (778,428 ) Dividends paid on preferred stock - (452,305 ) (342,460 ) Repurchase of restricted stock for payment of Taxes (329,587 ) (176,112 ) (92,390 ) Repurchase of warrants - - (302,410 ) Net proceeds from issuance of 3,563,380 shares - 59,744,418 - Net proceeds from issuance of 2,012,500 shares 55,270,625 Repayment of CDCI Preferred Shares - (15,925,000 ) - Proceeds of borrowed funds - 16,000,000 - Net cash provided by (used in) financing Activities 53,525,514 58,408,065 (1,515,688 ) Net increase (decrease) in cash and cash Equivalents 20,366,563 (144,463 ) 149,914 Cash and cash equivalents at beginning of year 69,158 213,621 63,707 Cash and cash equivalents at end of year $ 20,435,721 $ 69,158 $ 213,621 98Years Ended December 31, ($ in thousands) 2023 2022 2021 Cash flows from operating activities: Net income $ 75,457 $ 62,919 $ 64,167 Adjustments to reconcile net income to net cash used in operating activities: Equity in undistributed income of Subsidiary (16,805) (56,555) (73,895) Restricted stock expense 2,302 2,425 3,100 Other, net 9,263 6,255 (3,343) Net cash provided by (used in) operating activities 70,217 15,044 (9,970) Cash flows from investing activities: Investment in bank — (1,300) — Other, net — 290 — Net cash (used in) investing activities — (1,010) — Cash flows from financing activities: Dividends paid on common stock (27,550) (16,275) (11,991) Repurchase of restricted stock for payment of taxes (361) (683) (721) Common stock repurchased — (22,180) (5,171) Repayment of borrowed funds — — (4,647) Called/repayment of subordinated debt (31,000) — — Other, net (7,664) 216 — Net cash (used in) financing activities (66,575) (38,922) (22,530) Net increase (decrease) in cash and cash equivalents 3,642 (24,888) (32,500) Cash and cash equivalents at beginning of year 9,843 34,731 67,231 Cash and cash equivalents at end of year $ 13,485 $ 9,843 $ 34,731 VU - OPERATING SEGMENTS2017, 2016,2023, 2022, and 2015,2021, the Commercial/Retail Bank, the Mortgage Banking Division, and the Holding Company. (In thousands) Year Ended December 31, 2017 Commercial/ Mortgage Retail Banking Holding Bank Division Company Total Interest income $ 65,118 $ 943 $ 8 $ 66,069 Interest expense 6,048 1 860 6,909 Net interest income (loss) 59,070 942 (852 ) 59,160 Provision (credit) for loan losses 475 31 - 506 Net interest income (loss) after provision for loan losses 58,595 911 (852 ) 58,654 Non-interest income 9,807 4,505 51 14,363 Non-interest expense 49,143 3,857 2,446 55,446 Income (loss) before income taxes 19,259 1,559 (3,247 ) 17,571 Income tax (benefit) expense 7,740 437 (1,222 ) 6,955 Net income (loss) $ 11,519 $ 1,122 $ (2,025 ) $ 10,616 Total Assets $ 1,758,778 $ 32,234 $ 22,226 $ 1,813,238 Net Loans 1,196,365 25,443 - 1,221,808 Year Ended December 31, 2016 Commercial/ Mortgage Retail Banking Holding Bank Division Company Total Interest income $ 43,785 $ 812 $ 7 $ 44,604 Interest expense 3,679 414 222 4,315 Net interest income (loss) 40,106 398 (215 ) 40,289 Provision (credit) for loan losses 667 (42 ) - 625 Net interest income (loss) after provision for loan losses 39,439 440 (215 ) 39,664 Non-interest income 6,989 4,258 - 11,247 Non-interest expense 31,369 3,342 2,151 36,862 Income (loss) before income taxes 15,059 1,356 (2,366 ) 14,049 Income tax (benefit) expense 4,386 380 (836 ) 3,930 Net income (loss) $ 10,673 $ 976 $ (1,530 ) $ 10,119 Total Assets $ 1,254,476 $ 21,400 $ 1,491 $ 1,277,367 Net Loans 851,947 13,477 - 865,424 Year Ended December 31, 2015 Commercial/ Mortgage Retail Banking Holding Bank Division Company Total Interest income $ 39,422 $ 774 $ 6 $ 40,202 Interest expense 2,727 296 185 3,208 Net interest income (loss) 36,695 478 (179 ) 36,994 Provision for loan losses 410 - - 410 Net interest income (loss) after provision for loan losses 36,285 478 (179 ) 36,584 Non-interest income 6,513 1,075 - 7,588 Non-interest expense 29,786 1,245 1,129 32,160 Income (loss) before income taxes 13,012 308 (1,308 ) 12,012 Income tax (benefit) expense 3,618 �� 82 (487 ) 3,213 Net income (loss) $ 9,394 $ 226 $ (821 ) $ 8,799 Total Assets $ 1,123,240 $ 20,681 $ 1,210 $ 1,145,131 Net Loans 755,077 14,665 - 769,742 99($ in thousands) Year Ended December 31, 2023 Commercial/
Retail
BankMortgage
Banking
DivisionHolding
CompanyTotal Interest income $ 340,566 $ 331 $ 36 $ 340,933 Interest expense 83,497 141 7,970 91,608 Net interest income (loss) 257,069 190 (7,934) 249,325 Provision (credit) for credit losses 14,500 — — 14,500 Net interest income (loss) after provision for loan losses 242,569 190 (7,934) 234,825 Non-interest income 36,856 2,866 6,983 46,705 Non-interest expense 172,133 5,191 7,402 184,726 Income (loss) before income taxes 107,292 (2,135) (8,353) 96,804 Income tax (benefit) expense 23,892 (540) (2,005) 21,347 Net income (loss) $ 83,400 $ (1,595) $ (6,348) $ 75,457 Total Assets $ 7,971,373 $ 10,058 $ 17,914 $ 7,999,345 Net Loans 5,114,434 4,490 — 5,118,924 ($ in thousands) Year Ended December 31, 2022 Commercial/
Retail
BankMortgage
Banking
DivisionHolding
CompanyTotal Interest income $ 199,937 $ 439 $ 17 $ 200,393 Interest expense 14,979 106 7,492 22,577 Net interest income (loss) 184,958 333 (7,475) 177,816 Provision (credit) for loan losses 5,605 — — 5,605 Net interest income (loss) after provision for loan losses 179,353 333 (7,475) 172,211 Non-interest income 29,991 4,303 2,667 36,961 Non-interest expense 116,899 5,493 8,091 130,483 Income (loss) before income taxes 92,445 (857) (12,899) 78,689 Income tax (benefit) expense 19,250 (217) (3,263) 15,770 Net income (loss) $ 73,195 $ (640) $ (9,636) $ 62,919 Total Assets $ 6,428,889 $ 18,194 $ 14,634 $ 6,461,717 Net Loans 3,734,659 5,024 — 3,739,683 ($ in thousands) Year Ended December 31, 2021 Commercial/
Retail
BankMortgage
Banking
DivisionHolding
CompanyTotal Interest income $ 176,153 $ 582 $ 10 $ 176,745 Interest expense 12,166 140 7,375 19,681 Net interest income (loss) 163,987 442 (7,365) 157,064 Provision (credit) for loan losses (1,104) — — (1,104) Net interest income (loss) after provision for loan losses 165,091 442 (7,365) 158,168 Non-interest income 28,539 8,823 111 37,473 Non-interest expense 103,430 5,361 5,768 114,559 Income (loss) before income taxes 90,200 3,904 (13,022) 81,082 Income tax (benefit) expense 19,222 988 (3,295) 16,915 Net income (loss) $ 70,978 $ 2,916 $ (9,727) $ 64,167 Total Assets $ 6,015,664 $ 16,519 $ 45,231 $ 6,077,414 Net Loans 2,929,995 6,494 — 2,936,489 WV - SUMMARY OF QUARTERLY RESULTS OF OPERATIONS AND PER SHARE AMOUNTS (UNAUDITED) Three Months Ended March 31 June 30 Sept. 30 Dec. 31 (In thousands, except per share amounts) 2017 Total interest income $ 15,753 $ 16,464 $ 16,708 $ 17,143 Total interest expense 1,585 1,629 1,773 1,922 Net interest income 14,168 14,835 14,935 15,221 Provision for loan losses 46 248 90 122 Net interest income after provision for loan losses 14,122 14,587 14,845 15,099 Total non-interest income 3,391 3,757 3,658 3,556 Total non-interest expense 16,095 15,070 11,888 12,390 Income tax expense 296 908 1,901 3,851 Net income applicable to common Stockholders $ 1,122 $ 2,366 $ 4,714 $ 2,414 Per common share: Net income, basic $ .12 $ .26 $ .52 $ .23 Net income, diluted .12 .26 .51 .23 Cash dividends declared .0375 .0375 .0375 .0375 2016 Total interest income $ 10,596 $ 10,871 $ 11,269 $ 11,868 Total interest expense 922 1,016 1,202 1,176 Net interest income 9,674 9,855 10,067 10,692 Provision for loan losses 190 204 143 88 Net interest income after provision for loan losses 9,484 9,651 9,924 10,604 Total non-interest income 2,484 2,961 3,099 2,705 Total non-interest expense 8,395 8,921 9,416 10,132 Income tax expense 969 1,042 1,049 870 Net income 2,604 2,649 2,558 2,307 Preferred dividends 85 86 86 195 Net income applicable to common Stockholders $ 2,519 $ 2,563 $ 2,472 $ 2,112 Per common share: Net income, basic $ .47 $ .47 $ .46 $ .39 Net income, diluted .46 .47 .45 .26 Cash dividends declared .0375 .0375 .0375 .0375 100($ in thousands, except per share amounts) March 31 June 30 Sept. 30 Dec. 31 2023 Total interest income $ 80,338 $ 86,194 $ 85,681 $ 88,720 Total interest expense 15,412 20,164 24,977 31,055 Net interest income $ 64,926 $ 66,030 $ 60,704 $ 57,665 Provision for credit losses 11,000 1,250 1,000 1,250 Net interest income after provision for credit losses 53,926 64,780 59,704 56,415 Total non-interest income 12,612 12,423 19,324 2,346 Total non-interest expense 45,670 46,899 47,724 44,433 Income tax expense 4,597 6,525 6,944 3,281 Net income available to common stockholders $ 16,271 $ 23,779 $ 24,360 $ 11,047 Per common share: Net income, basic $ 0.52 $ 0.76 $ 0.78 $ 0.35 Net income, diluted 0.52 0.75 0.77 0.35 Cash dividends declared 0.21 0.22 0.23 0.24 2022 Total interest income $ 42,741 $ 45,847 $ 53,874 $ 57,931 Total interest expense 4,102 3,746 4,726 10,003 Net interest income $ 38,639 $ 42,101 $ 49,148 $ 47,928 Provision for credit losses — 600 4,300 705 Net interest income after provision for credit losses 38,639 41,501 44,848 47,223 Total non-interest income 11,157 8,664 9,022 8,118 Total non-interest expense 28,590 30,955 35,903 35,035 Income tax expense 4,377 3,457 3,924 4,012 Net income available to common stockholders $ 16,829 $ 15,753 $ 14,043 $ 16,294 Per common share: Net income, basic $ 0.81 $ 0.77 $ 0.61 $ 0.68 Net income, diluted 0.81 0.76 0.61 0.67 Cash dividends declared 0.17 0.18 0.19 0.20 2021 Total interest income $ 45,187 $ 43,238 $ 44,435 $ 43,885 Total interest expense 5,958 5,188 4,407 4,128 Net interest income $ 39,229 $ 38,050 $ 40,028 $ 39,757 Provision for loan losses — — — (1,104) Net interest income after provision for loan losses 39,229 38,050 40,028 40,861 Total non-interest income 9,472 8,822 9,586 9,593 Total non-interest expense 27,264 27,452 29,053 30,790 Income tax expense 4,793 3,820 4,429 3,873 Net income available to common stockholders $ 16,644 $ 15,600 $ 16,132 $ 15,791 Per common share: Net income, basic $ 0.79 $ 0.74 $ 0.77 $ 0.75 Net income, diluted 0.79 0.74 0.76 0.75 Cash dividends declared 0.13 0.14 0.15 0.16 2015 Total interest income $ 9,683 $ 10,022 $ 10,080 $ 10,417 Total interest expense 804 806 793 804 Net interest income 8,879 9,216 9,287 9,613 Provision for loan losses 150 - 250 10 Net interest income after provision for loan losses 8,729 9,216 9,037 9,603 Total non-interest income 1,850 1,854 1,982 1,903 Total non-interest expense 7,818 8,092 7,977 8,275 Income tax expense 732 793 815 873 Net income 2,029 2,185 2,227 2,358 Preferred dividends and stock accretion 85 86 86 85 Net income applicable to common Stockholders $ 1,944 $ 2,099 $ 2,141 $ 2,273 Per common share: Net income, basic $ .36 $ .39 $ .40 $ .42 Net income, diluted .36 .39 .39 .42 Cash dividends declared .0375 .0375 .0375 .0375 ITEM 9.CHANGES IN AND DISAGREEMENTS WITH ACCOUNTANTS ON ACCOUNTING AND FINANCIAL DISCLOSURE($ in thousands) December 31, 2023 December 31, 2022 Notional amount $ 493,290 $ 328,756 Weighted average pay rate 5.2 % 4.6 % Weighted average receive rate 5.2 % 4.3 % Weighted average maturity in years 5.39 6.11 ($ in thousands) December 31, 2023 December 31, 2022 Derivative Assets Derivative Liabilities Derivative Assets Derivative Liabilities Interest rate swap contracts $ 12,170 12,175 12,825 12,825 principal executive officermanagement, under the supervision of and principal financial officer have concluded, based upon theirwith the participation of the Chief Executive Officer and Chief Financial Officer, conducted an evaluation of the Company’s “disclosuredisclosure controls and procedures” (asprocedures as defined in Rules 13a-15(e) and 15d-15(e) under the Securities Exchange Act of 1934) as of December 31, 2017, that the Company’s disclosure controls and procedures were effective in recording, processing, summarizing and reporting, on a timely basis, information required to be disclosed by us in the reports that we file or submit under the Securities Exchange Act of 1934, as amended (the “Exchange Act”) as of December 31, 2023. Disclosure controls and were effective in ensuringprocedures are controls and procedures designed to ensure that information required to be disclosed by us in the reports that we filefiled or submitsubmitted under the Exchange Act is recorded, processed, summarized and reported within the time periods specified in the rules and forms of the SEC, and that such information is accumulated and communicated to the Company'sour management, including our Chief Executive Officer and our Chief Financial Officer, as appropriate, to allow timely decisions regarding required disclosure.During Based on that evaluation, the quarter ended December 31, 2017, noChief Executive Officer and the Chief Financial Officer have concluded that the Company’s disclosure controls and procedures were effective as of the end of the period covered by this report. No changes have occurred inwere made to the Company’s internal controlcontrols over financial reporting (as defined in Rules 13a-15(e) and 15d-15(f)Rule 13a-15(f) under the Securities Exchange Act)Act of 1934) during the last fiscal quarter that have materially affected or are reasonably likely to materially affect, the Company’s internal control over financial reporting.Overover Financial Reporting“internalinternal control over financial reporting”reporting (as defined in Rule 13a-15(f) or 15d-15(f) under the Securities Exchange Act of 1934).Act. Internal control over financial reporting is a process designed under the supervision of the Chief Executive Officer and the Chief Financial Officer to provide reasonable assurance regarding the reliability of financial reporting and the preparation of financial statements for external purposes in accordance with U.S. generally accepted accounting principles.Undermanagement, including the principal executive officerChief Executive Officer and principal financial officer, the CompanyChief Financial Officer, conducted an evaluation of the effectiveness of internal control over financial reporting as of December 31, 2023 based on the framework in Internal Control – Integrated Framework issued by the Committee of Sponsoring Organizations of the Treadway Commission (2013 framework). This assessment included controls over the preparation of the schedules equivalent to the basic financial statements(COSO) in accordance with the instructions for the Consolidated Financial Statements for Bank Holding Companies (Form FR Y-9C) to meet the reporting requirements of Section 112 of the Federal Deposit Insurance Corporation Improvement Act.Internal Control-Integrated Framework (2013). Based on this evaluation,that assessment, our management of the Company has concluded the Company maintained effective internal control over financial reporting, as such term is defined in Securities Exchange Act of 1934 Rule 13a-15(f),believes that, as of December 31, 2017.101Internal control over financial reporting cannot provide absolute assurance of achieving financial reporting objectives because of its inherent limitations. Internal control over financial reporting is a process that involves human diligence and compliance and is subject to lapses in judgment and breakdowns resulting from human failures. Internal control over financial reporting can also be circumvented by collusion or improper management override. Because of such limitations, there is a risk that material misstatements may not be prevented or detected on a timely basis by internal control over financial reporting. These inherent limitations, however, are known features of the financial reporting process. It is possible, therefore, to design into the process safeguards to reduce, though not eliminate, this risk.T. E. Lott & Company, an independent registered public accounting firm, which audited the Company’s consolidated financial statements included in this Form 10-K, has issued an attestation report on2023, the Company’s internal control over financial reporting which is included herein./s/ M. Ray (Hoppy) Cole, Jr./s/ Dee Dee LoweryCEO and PresidentExecutive VP and Chief Financial OfficerMarch 16, 2018March 16, 2018REPORT OF INDEPENDENTREGISTERED PUBLIC ACCOUNTING FIRMTowas effective based on those criteria.Boardoperations of Directors and Shareholdersthe HSBI acquisition from the scope ofThe First Bancshares, Inc.Hattiesburg, MississippiOpinion management’s report on Internal Controlinternal control over Financial ReportingWe have auditedfinancial reporting. HSBI was acquired during the year ended December 31, 2023. For the year ended December 31, 2023, HSBI represented approximately 19.6% of total consolidated assets. and subsidiary"Company"“Company”) internal control over financial reporting as of December 31, 2017,2023, based on criteria established inInternal Control ̶– Integrated FrameworkFramework: (2013) issued by the Committee of Sponsoring Organizations of the Treadway Commission (COSO). Because management's assessment and our audit were conducted to meet the reporting requirements of Section 112 of the Federal Deposit Insurance Corporation Improvement Act (FDICIA), management's assessment and our audit of the Company's internal control over financial reporting included controls over the preparation of the schedules equivalent to the basic financial statements in accordance with the instructions for the Consolidated Financial Statements for Bank Holding Companies (Form FR Y-9C). In our opinion, the Company maintained, in all material respects, effective internal control over financial reporting as of December 31, 2017,2023, based on criteria established inInternal Control ̶– Integrated FrameworkFramework: (2013)issued by COSO. not examined and, accordingly, we do not express an opinion or any other form of assurance on management's statement referring to compliance with laws and regulations.We have also audited, in accordance with the standards of the Public Company Accounting Oversight Board (United States) (PCAOB)(“PCAOB”), the consolidated financial statements of the Company as of December 31, 2023 and 2022 and for each of the yearyears in the three-year period ended December 31, 2017, of the Company2023, and our report dated March 16, 2018,February 29, 2024 expressed an unqualified opinion on those consolidated financial statements.102Company'sCompany’s management is responsible for maintaining effective internal control over financial reporting and for its assessment of the effectiveness of internal control over financial reporting, included in the accompanying Management'sManagement’s Report on Internal Control Over Financial Reporting.Reporting. Our responsibility is to express an opinion on the Company'sCompany’s internal control over financial reporting based on our audit.risk, andrisk. Our audit also included performing such other procedures as we considered necessary in the circumstances. We believe that our audit provides a reasonable basis for our opinion.103ToBoardscope of Directorsmanagement’s assessment of internal control over financial reporting as of December 31, 2023, has excluded Heritage Southeast Bancorporation, Inc. which was acquired during the year ended December 31, 2023. We have also excluded Heritage Southeast Bancorporation, Inc. from the scope of our audit of internal control over financial reporting. Heritage Southeast Bancorporation, Inc. represented approximately 22.4 percent of consolidated revenues for the year ended December 31, 2023, and Shareholdersapproximately 19.6 percent ofThe First Bancshares, Inc.Page 2Definition consolidated total assets as of December 31, 2023.company'scompany’s internal control over financial reporting is a process designed to provide reasonable assurance regarding the reliability of financial reporting and the preparation of reliable financial statements for external purposes in accordance with generally accepted accounting principles. A company'scompany’s internal control over financial reporting includes those policies and procedures that (1) pertain to the maintenance of records that, in reasonable detail, accurately and fairly reflect the transactions and dispositions of the assets of the company; (2) provide reasonable assurance that transactions are recorded as necessary to permit preparation of financial statements in accordance with generally accepted accounting principles, and that receipts and expenditures of the company are being made only in accordance with authorizations of management and directors of the company; and (3) provide reasonable assurance regarding prevention or timely detection of unauthorized acquisition, use, or disposition of the company'scompany’s assets that could have a material effect on the financial statements./s/ T. E. Lott & CompanyColumbus, MississippiMarch 16, 2018OFFICER,OFFICERS, AND CORPORATE GOVERNANCE24, 2018,23, 2024, which proxy materials will be filed with the SEC on or about April 11, 2018.
10, 2024.10424, 2018,23, 2024, which proxy materials will be filed with the SEC on or about April 11, 2018.Information required by this item is set forth in our definitive proxy materials regarding our annual meeting of stockholders to be held May 24, 2018, which proxy materials will be filed with the SEC on or about April 11, 2018.ITEM 13. CERTAIN RELATIONSHIPS AND RELATED TRANSACTIONS AND DIRECTOR INDEPENDENCE24, 2018,23, 2024, which proxy materials will be filed with the SEC on or about April 11, 2018.14. PRINCIPAL ACCOUNTANT FEES13. CERTAIN RELATIONSHIPS AND SERVICES24, 2018,23, 2024, which proxy materials will be filed with the SEC on or about April 11, 2018.
10, 2024.105(a)The following documents are filed as part1.The followingbalance sheets – December 31, 2017 and 2016 Consolidated statements of income – Years ended December 31, 2017, 2016, and 2015Consolidated statements of other comprehensive income – Years ended December 31, 2017, 2016, and 2015Consolidated statements of changes in stockholders’ equity– Years ended December 31, 2017, 2016 and 2015Consolidated statements of cash flows –Years ended December 31, 2017, 2016, and 2015Notes to consolidated financial statements – December 31, 2017, 2016, and 20152.Consolidated Financial Statement Schedules:3.Exhibits required to be filed by Item 601 of Regulation S-K, by Item 15(b) are listed below.(b)Exhibits:Exhibits:Exhibits:2.7 2.8 3.1 3.2 3.23.3 3.4 3.5 10610.22 10.23 21.1 23.1 31.1 31.2 32.1 97.1 101.INS XBRL Instance Document 101.SCH 101.SCHXBRL Taxonomy Extension Schema Document. 101.CAL 101.CALXBRL Taxonomy Extension Calculation Linkbase Document. 101.DEF 101.DEFXBRL Taxonomy Extension Definition Linkbase Document. 101.LAB 101.LABXBRL Taxonomy Extension Label Linkbase Document. 101.PRE 101.PREXBRL Taxonomy Extension Presentation Linkbase Document. 104 Cover Page Interactive Data File (formatted as inline XBRL and contained in Exhibit 101) 107THE FIRST BANCSHARES, INC. Date: March 16, 2018February 29, 2024By: /s/ M. Ray (Hoppy) Cole, Jr. M. Ray (Hoppy) Cole, Jr. Chief Executive Officer and President (Principal Executive Officer), Chairman of the Board Date: March 16, 2018February 29, 2024By: /s//s/ Dee Dee LoweryDee Dee Lowery Executive VP and Chief Financial Officer
(Principal Financial and Principal Accounting Officer)SIGNATURES CAPACITIES CAPACITIESDATE /s/ E. Ricky Gibson Director Director and Chairman of the BoardMarch 16, 2018February 29, 2024/s/ Rodney D. BennettDirectorMarch 16, 2018/s/ David W. Bomboy Director DirectorMarch 16, 2018February 29, 2024/s/ Jonathan A. Levy Director February 29, 2024 /s/ Charles R. Lightsey Director DirectorMarch 16, 2018February 29, 2024/s/ Fred McMurry Director DirectorMarch 16, 2018February 29, 2024/s/ Thomas E. Mitchell Director DirectorMarch 16, 2018February 29, 2024/s/ Renee Moore Director February 29, 2024 /s/ Ted E. Parker Lead Director DirectorMarch 16, 2018February 29, 2024/s/ J. Douglas Seidenburg Director DirectorMarch 16, 2018February 29, 2024/s/ Andrew D. Stetelman Director DirectorMarch 16, 2018February 29, 2024Director February 29, 2024 /s/ M. Ray (Hoppy) Cole, Jr. CEO, President, Director, and DirectorChairman ofMarch 16, 2018February 29, 2024(Principalthe Board (Principal Executive Officer)/s/ Donna T. (Dee Dee) Lowery Executive VP & Chief Financial Officer March 16, 2018February 29, 2024(Principal Financial and Accounting Officer) 108