U.S. SECURITIES AND EXCHANGE COMMISSION
WASHINGTON, D.C. 20549
FORM 10-K
| x | ANNUAL REPORT PURSUANT TO SECTION 13 OR 15(d) OF THE SECURITIES EXCHANGE ACT OF 1934 |
For the fiscal year ended December 31, 20172019
OR
| ¨ | TRANSITION REPORT PURSUANT TO SECTION 13 OR 15(d) OF THE SECURITIES EXCHANGE ACT OF 1934 |
For the transition period from ____ to ____
Commission file no. 333-94288
THE FIRST BANCSHARES, INC.
(Exact name of registrant as specified in its charter)
| Mississippi | 64-0862173 | |
| (State or Other Jurisdiction of Incorporation or Organization) | (I.R.S. Employer Identification Number) |
| 6480 U.S. Hwy. 98 West, Suite A | ||
| Hattiesburg, Mississippi | 39402 | |
| (Address of principal executive offices) | (Zip Code) |
| Issuer's telephone number: | (601) 268-8998 |
Securities registered under Section 12(b) of the Exchange Act:
| Name of Each Exchange on | ||||
| Title of Each Class | Trading Symbol(s) | Which Registered | ||
| Common Stock, $1.00 par value | FBMS | The |
Securities registered pursuant to Section 12(g) of the Act: None
Indicate by check mark if the registrant is a well-known seasoned issuer, as defined in rule 405 of the Securities Act.
Yes¨Nox
Indicate by check mark if the registrant is not required to file reports pursuant to Section 13 or 15(d) of the Act.
Yes¨Nox
Indicate by check mark whether the registrant (1) has filed all reports required to be filed by Section 13 or 15(d) of the Exchange Act of 1934 during the preceding 12 months (or for such shorter period that the registrant was required to file such reports), and (2) has been subject to such filing requirements for the past 90 days.
YesxNo¨
Indicate by check mark whether the registrant has submitted electronically and posted on its corporate Website, if any, every Interactive Data File required to be submitted and posted pursuant to Rule 405 of Regulation S-T (§ 232.405 of this chapter) during the preceding 12 months (or for such shorter period that the registrant was required to submit and post such files).
Yesx No¨
Indicate by check mark if disclosure of delinquent filers in response to Item 405 of Regulation S-K is not contained herein, and will not be contained, to the best of the registrant’s knowledge, in definitive proxy or information statements incorporated by reference in Part III of this Form 10-K or any amendment to this Form 10-Kx
Indicate by check mark whether the registrant is a shell company (as defined in Rule 12b-2 of the Exchange Act).
Yes¨ Nox
Indicate by check mark whether the registrant is a large accelerated filer, an accelerated filer, a non-accelerated filer, a smaller reporting company, or emerging growth company. See the definitions of “large accelerated filer,” “accelerated filer,” “non-accelerated filer,” “smaller reporting company”,company,” and “emerging growth company” in Rule 12b-2 of the Exchange Act (Check one):
Large accelerated filer¨Accelerated filerx Non-accelerated filer¨Smaller reporting Companycompany¨
Emerging Growth Companygrowth company¨
If an emerging growth company, indicate by check mark if the registrant has elected not to use the extended transition period for complying with any new or revised financial accounting standards provided pursuant to Section 13(a) of the Exchange Act.¨
Indicate by check mark whether the registrant is a shell company (as defined in Rule 12b-2 of the Act). Yes ¨ No x
Based on the price at which the registrant’s Common Stock was last sold on June 30, 2017,2019, the last business day of the registrant’s most recently completed second fiscal quarter, the aggregate market value of the registrant’s Common Stock held by non-affiliates of the registrant was $232,771,583.$492,335,524.
On March 13, 2018,6, 2020, the registrant had outstanding 12,339,49218,851,955 shares of common stock.
DOCUMENTS INCORPORATED BY REFERENCE
Certain portions of the Registrant’s proxy statement to be filed for the Annual Meeting of Shareholders to be held May 24, 201828, 2020 are incorporated by reference into Part III of this Annual Report on Form 10-K. Other than those portions of the proxy statement specifically incorporated by reference pursuant to Items 10-14 of Part III hereof, no other portions of the proxy statement shall be deemed so incorporated.
THE FIRST BANCSHARES, INC.
FORM 10-K
TABLE OF CONTENTS
THE FIRST BANCSHARES, INC.
FORM 10-K
This Annual Report on Form 10-K, including information incorporated by reference herein, contains statements which constitute forward-looking statements within the meaning of Section 27A of the Securities Act of 1933 (the “Securities Act”) and Section 21E of the Securities Exchange Act of 1934 (the “Exchange Act”), which statements are inherently subject to risks and uncertainties. These statements are based on many assumptions and estimates and are not guarantees of future performance. Forward lookingForward-looking statements are statements that include projections, predictions, expectations, or beliefs about future events or results or otherwise are not statements of historical fact. Such statements are often characterized by the use of qualifying words (and their derivatives) such as “may,” “would,” “could,” “should,” “will,” “expect,” “anticipate,” “predict,” “project,” “potential,” “continue,” “assume,” “believe,” “intend,” “plan,” “forecast,” “goal,” “estimate,” or other statements concerning opinions or judgments of the Company, the Bank, and management about possible future events or outcomes. Factors that could influence the accuracy of such forward lookingforward-looking statements include, but are not limited to, competitive pressures among financial institutions increasing significantly; economic conditions, either nationally or locally, in areas in which the Company conducts operations being less favorable than expected; interest rate risk; legislation or regulatory changes which adversely affect the ability of the consolidated Company to conduct business combinations or new operations; financial success or changing strategies of the Bank’s customers or vendors; actions of government regulators; the level of market interest rates; and risks related to the proposed acquisitions of Sunshine Financial, Inc., including the risk that the proposed acquisition does not close when expected or at all because of required shareholder or other approvals and other conditions to closing are not received or satisfied on a timely basis or at all, the terms of the proposed transaction may need to be modified to satisfy such approvals or conditions, and the risk that anticipated benefits from the acquisition of Southwest Banc Shares, Inc. or Sunshine Financial, Inc.recent acquisitions are not realized in the time frame anticipated or at all as a result of changes in general economic and market conditions.
Potential risks and uncertainties that could cause our actual results to differ materially from those anticipated in any forward-looking statements include, but are not limited to, the following:
| · | reduced earnings due to higher credit losses generally and specifically because losses in the sectors of our loan portfolio secured by real estate are greater than expected due to economic factors, including declining real estate values, increasing interest rates, increasing unemployment, or changes in payment behavior or other |
| · | general economic conditions, either nationally or regionally and especially in our primary service |
| · | adverse changes in asset quality and resulting credit risk-related losses and expenses; |
| · | ability of borrowers to repay loans, which can be adversely affected by a number of factors, including changes in economic conditions, adverse trends or events affecting business industry groups, reductions in real estate values or markets, business closings or |
| · | changes in monetary and tax policies, including potential impacts from the Tax Cuts and Jobs Act; |
| · | changes in political conditions or the legislative or regulatory environment; |
| · | the adequacy of the level of our allowance for loan losses and the amount of loan loss |
| · | reduced earnings due to higher credit losses because our loans are concentrated by loan type, industry segment, borrower type, or location of the borrower or collateral; |
| · | changes in the interest rate environment which could reduce anticipated or actual margins; |
| · | increased funding costs due to market illiquidity, increased competition for funding, higher interest rates, and increased regulatory requirements with regard to funding; |
| · | results of examinations by our regulatory authorities, including the possibility that the regulatory authorities may, among other things, require us to increase our allowance for loan losses through additional loan loss provisions or write-down of our assets; |
| · | the rate of delinquencies and amount of loans charged-off; |
| · | the impact of our efforts to raise capital on our financial position, liquidity, capital, and profitability; |
| · | risks and uncertainties relating to not successfully |
| · | significant increases in competition in the banking and financial services industries; |
| · | changes in the securities markets; and |
| · | loss of consumer confidence and economic disruptions resulting from national disasters or terrorist activities; |
| · | our ability to retain our existing customers, including our deposit relationships; |
| · | changes occurring in business conditions and inflation; |
| · | changes in |
| · | changes in deposit flows; |
| · | changes in accounting principles, policies, or |
| · | our ability to maintain adequate internal |
| · | other risks and uncertainties detailed from time to time in our filings with the Securities and Exchange Commission (“SEC”). |
We have based our forward-looking statements on our current expectations about future events. Although we believe that the expectations reflected in and the assumptions underlying our forward-looking statements are reasonable, we cannot guarantee that these expectations will be achieved or the assumptions will be accurate. The Company disclaims any obligation to update such factors or to publicly announce the results of any revisions to any of the forward-looking statements included herein to reflect future events or developments. Additional information concerning these risks and uncertainties is contained in this Annual Report on Form 10-K for the year ended December 31, 2017,2019, included in Item 1A. Risk Factors.Factors and in our future filings with the SEC. Further information on The First Bancshares, Inc. is available in its filings with the Securities and Exchange Commission, available at the SEC’s website,http://www.sec.gov.www.sec.gov.
BUSINESS OF THE COMPANY
Overview and History
The CompanyFirst Bancshares, Inc. (“Company”) was incorporated on June 23, 1995 to serve as a bank holding company for The First, A National Banking Association (“The First”), headquartered in Hattiesburg, Mississippi. The Company is a Mississippi corporation and is a registered financial holding company. The First began operations on August 5, 1996 from our main office in the Oak Grove community, which is now incorporated within the city of Hattiesburg. As of December 31, 2017,2019, The First operated its main office and 4372 full-service branches, one motor branch, and four loan production offices in Mississippi, Alabama, LouisianaFlorida, Georgia and Florida.Louisiana. Our principal executive offices are located at 6480 U.S. Highway 98 West, Hattiesburg, Mississippi 39402, and our telephone number is (601) 268-8998.
The Company is a community-focused financial institution that offers a full range of financial services to individuals, businesses, municipal entities, and nonprofit organizations in the communities that it serves. These services include consumer and commercial loans, deposit accounts trust services,and safe deposit services and brokerage services.
We exited the recent recession withhave benefitted from historically strong asset quality metrics compared to most of our peers, which we believe illustrates our historically disciplined underwriting and credit culture. As such, we benefited from our strength by taking advantage of growth opportunities when many of our peers were unable to do so. Since that time, weWe have also focused on growing earnings per share and increasing our tangible common equity and tangible book value per share.
In recent years, we have developed and executed a regional expansion strategy to take advantage of growth opportunities through several acquisitions, which has allowed us to expand our footprint to Alabama, Florida Louisiana and Georgia. We believe the conversion and integration of these acquisitions have been successful to date, and we are optimistic that these markets will continue to contribute to our future growth and success. In addition, we returnedcontinue to strong levels ofexperience organic loan growth by continuing to strengthen our relationships with existing clients and creating new relationships.
In April 2013,On March 2, 2019, we completed our first post-recession acquisition with the purchase of First National Bank of Baldwin County, which resulted in our strategic entry into the south Alabama market. In July 2014 we completed our acquisition of BayFPB Financial Corp., (“FPB”), and immediately thereafter merged its wholly-owned subsidiary, Florida Parishes Bank, previously headquarteredwith and into The First. The Company paid a total consideration of approximately $78.2 million to the former FPB shareholders as consideration in Mobile, Alabama. The conversionthe merger, which included 2,377,501 shares of the Company’s common stock, and integration of these acquisitions have been successful to date, and we are optimistic that this market will continue to contribute to our future growth and success. Also$5 thousand in 2014 we established ade novo branch in Baton Rouge, Louisiana and a loan production office in Slidell, Louisiana.cash.
On JanuaryNovember 1, 2017,2019, we completed the acquisitionsacquisition of IbervilleFirst Florida Bancorp, Inc., (“FFB”), and immediately thereafter merged its wholly-owned subsidiary, First Florida Bank, with and Gulf Coast Community Bank, which allowed us to expand our footprint in Florida and Louisiana. Weinto The First. The Company paid a total consideration of $31.1approximately $89.5 million to the former FFB shareholders as consideration in the merger, which included 1,682,889 shares of the Company’s common stock, and approximately $34.1 million in cash for all of the outstanding equity securities of Iberville Bank. $2.5 million of the purchase price was held in escrow as contingency for flood-related losses in the loan portfolio incurred due to flooding in Iberville’s market area in the fall of 2016. The Company expects to receive $498,207 from the escrow for settlement of flood-related loans.
We paid an aggregate purchase price for Gulf Coast of $2.3 million, consisting of 89,591 shares of our common stock, in exchange for all of the outstanding equity securities of Gulf Coast. System integration for both acquisitions was completed during the second quarter of 2017.cash.
As of December 31, 2017,2019, we had 415676 full-time employees and 8 part-time employees, and as of March 13, 2018, we had 481 full-time employees and 621 part-time employees.
Unless otherwise indicated or unless the context requires otherwise, all references in this report to “the Company”, “we”, “us”, “our”, or similar references, mean The First Bancshares, Inc. and our subsidiaries, including our banking subsidiary, The First, A National Banking Association on a consolidated basis. References to “The First” or the “Bank” mean our wholly owned banking subsidiary, The First, A National Banking Association.First.
Market Areas
As of December 31, 2019, The First currently operates in four states:had 78 locations across Mississippi, Louisiana, Alabama, Florida and Florida, as discussed below.Georgia.
Recent Developments
On December 6, 2017,18, 2019, the Company entered into an agreementAgreement and planPlan of merger to acquire SunshineMerger (the “Merger Agreement”) with Southwest Georgia Financial Inc.Corporation, a Georgia corporation (“Sunshine”SWG”), the holding company of Sunshine Community Bank. Pursuant to the merger agreement, Sunshinewhereby SWG will mergebe merged with and into the Company. Pursuant to and simultaneously with entering into the Merger Agreement, The First, Bancshares, with First Bancshares as the surviving company, (the “Sunshine Merger.”) Immediately after the Sunshine Merger, Sunshine Community Bank, a Florida-state chartered bank and SWG’s wholly owned subsidiary bank, Southwest Georgia Bank, entered into a Plan of Sunshine,Bank Merger whereby Southwest Georgia Bank will mergebe merged with and into The First with The First asimmediately following the surviving bank. The transaction was unanimously approved by the boardsmerger of directors of each of First Bancshares and Sunshine and is expected to close in the second quarter of 2018. Completion of the transaction is subject to customary closing conditions, and approval of Sunshine’s shareholders.
Under the terms of the agreement, holders of Sunshine common stock will receive, at the election of each Sunshine shareholder, either (i) $27.00 in cash, or (ii) 0.93 of a share of First Bancshares’ common stock, provided that the total mix of merger consideration is fixed at 75% stock and 25% cash. The aggregate transaction consideration is valued at approximately $32.1 million.
At December 31, 2017, Sunshine had approximately $201 million in total consolidated assets, $168 million in total consolidated loans, $143 million in total consolidated deposits and $22 million in stockholder’s equity.
On March 1, 2018, we completed our merger (the “Southwest Merger”) with Southwest Banc Shares, Inc. (“Southwest”), the holding company of First Community Bank. Southwest was mergedSWG with and into the Company with a purchase price, on the Company as the surviving corporation, and, immediately thereafter, First Community Bank was merged with and into The First (collectively with the Southwest Merger referred to as the “Mergers”). The Company issued 1,134,010 sharesannouncement date, of Company common stock valued at approximately $36,004,818 as of March 1, 2018, plus $24 million in cash, to the Southwest shareholders as consideration for the Southwest Merger. Each outstanding share of the Company’s common stock remained outstanding and was unaffected by the Mergers.
$88.0 million. At December 31, 2017, Southwest2019, SWG had consolidatedapproximately $555.4 million in assets, of $401$398.1 million in loans, of $281and $473.4 million deposits of $354 million, and shareholders’ equity of $37 million.
in deposits.
Banking Services
We strive to provide our customers with the breadth of products and services offered by large regional banks, while maintaining the timely response and personal service of a locally owned and managed bank. In addition to offering a full range of deposit services and commercial and personal loans, we have a mortgage division. The following is a description of the products and services we offer.
Deposit Services. We offer a full range of deposit services that are typically available in most banks and savings institutions, including checking accounts, NOW accounts, savings accounts, and other time deposits of various types, ranging from daily money market accounts to longer-term certificates of deposit. The transaction accounts and time certificates are tailored to our principal market areas at rates competitive to those offered by other banks in these areas. All deposit accounts are insured by the FDICFederal Deposit Insurance Corporation (“FDIC”) up to the maximum amount allowed by law. We solicit these accounts from individuals, businesses, associations, and organizations, and governmental authorities. In addition, we offer certain retirement account services, such as Individual Retirement Accounts (IRAs). and health savings accounts.
Loan Products. We offer a full range of commercial and personal loans. Commercial loans include both secured and unsecured loans for working capital (including loans secured by inventory and accounts receivable), business expansion (including acquisition of real estate and improvements), and purchase of equipment and machinery. Consumer loans include equity lines of credit, and secured and unsecured loans for financing automobiles, home improvements, education, and personal investments. We also make real estate construction and acquisition loans. Our lending activities are subject to a variety of lending limits imposed by federal law. While differing limits apply in certain circumstances based on the type of loan or the nature of the borrower (including the borrower's relationship to the bank), in general we are subject to an aggregate loans-to-one-borrower limit of 15% of our unimpaired capital and surplus.
Mortgage Loan Division. We have a residential mortgage loan division which originates conventional or government agency insured loans to purchase existing residential homes, or construct new homes and toor refinance existing mortgages.
Private Banking Division.We have a private banking division, which offers financial services and wealth management services to individuals who meet certain criteria.
Other Services. Other bank services we offer include on-line internet banking services, automated teller machines, voice response telephone inquiry services, commercial sweep accounts, cash management services, safe deposit boxes, travelers checks,merchant services, mobile deposit, direct deposit of payroll and social security checks, and automatic drafts for various accounts. We are associatednetwork with theother automated teller machines that may be used by our customers throughout our market area and other regions. The First also offers credit card services through a correspondent bank.
Competition
The First generally competes with other financial institutions through the selection of banking products and services offered, the pricing of services, the level of service provided, the convenience and availability of services, and the degree of expertise and the personal manner in which services are offered. State law permits statewide branching by banks and savings institutions, and many financial institutions in our market area have branch networks. Consequently, commercial banking in Mississippi, Alabama, Louisiana, Florida, and FloridaGeorgia is highly competitive. Many large banking organizations currently operate in our market area, several of which are controlled by out-of-state ownership. In addition, competition between commercial banks and thrift institutions (savings institutions and credit unions) has been intensified significantly by the elimination of many previous distinctions between the various types of financial institutions and the expanded powers and increased activity of thrift institutions in areas of banking which previously had been the sole domain of commercial banks. Federal legislation, together with other regulatory changes by the primary regulators of the various financial institutions, has resulted in the almost total elimination of practical distinctions between a commercial bank and a thrift institution. Consequently, competition among financial institutions of all types is largely unlimited with respect to legal ability and authority to provide most financial services. Currently there are numerous other commercial banks, savings institutions, and credit unions operating in The First's primary service area.
We face increased competition from both federally-chartered and state-chartered financial and thrift institutions, as well as credit unions, consumer finance companies, insurance companies, and other institutions in the Company's market area. Some of these competitors are not subject to the same degree of regulation and restriction imposed upon the Company. Many of these competitors also have broader geographic markets and substantially greater resources and lending limits than the Company and offer certain services such as trust banking that the Company does not currently provide. In addition, many of these competitors have numerous branch offices located throughout the extended market areas of the Company that may provide these competitors with an advantage in geographic convenience that the Company does not have at present.
We also compete with numerous financial and quasi-financial institutions for deposits and loans, including providers of financial services over the internet.internet, and financial technology, or fintech companies. Recent technology advances and other changes have allowed parties to effect financial transactions that previously required the involvement of banks. For example, consumers can maintain funds in brokerage accounts or mutual funds that would have historically been held as bank deposits. Consumers can also complete transactions such as paying bills and transferring funds directly without the assistance of banks.
Available Information
WePursuant to the Securities Exchange Act of 1934, as amended (the “Exchange Act”) we are required to file reports with the SEC. We make available free of charge, on or through our websitewww.thefirstbank.com, our Annual Reports on Form 10-K, Quarterly Reports on Form 10-Q, Current Reports on Form 8-K, proxy statements, and other filings pursuant to Section 13(a) or 15(d) of the Securities Exchange Act, of 1934, and amendments to such filings. The SEC maintains a website atwww.sec.gov that contains the reports, proxy statements, and other filings we electronically file with the SEC. Such information is also available free of charge on or through our websitewww.thefirstbank.com as soon as reasonably practicable after each is electronically filed with, or furnished to, the SEC. You may read and copy any materials we file with the SEC at the SEC’s Public Reference Room at 100 F Street, N.E., Washington, DC 20549. Information on the operation of the Public Reference Room may be obtained by calling the Commission at 1-800-SEC-0330. The SEC maintains a website that contains the Company’s reports, proxy statements, and the Company’s other SEC filings. The address of the SEC’s website is www.sec.gov. Information appearing on the Company’s website is not part of any report that it files with the SEC.
SUPERVISION AND REGULATION
The Company and The First are subject to state and federal banking laws and regulations which impose specific requirements or restrictions on and provide for general regulatory oversight with respect to virtually all aspects of our operations. These laws and regulations are generally intended to protect depositors, the deposit insurance fund ("DIF") of the Federal Deposit Insurance Corporation (“FDIC”)FDIC and the stability of the U.S. banking system as a whole, rather than for the protection of our shareholders and non-deposit creditors. To the extent that the following summary describes statutory or regulatory provisions, it is qualified in its entirety by reference to the particular statutory and regulatory provisions. Any change in applicable laws or regulations may have a material effect on the business and prospects of the Company.
Beginning with the enactment of the Financial Institutions Reform, Recovery and Enforcement Act of 1989 and following with the Federal Deposit Insurance Corporation Improvement Act of 1991 ("FDICIA"), and now most recently the sweeping Dodd-Frank Wall Street Reform and Consumer Protection Act of 2010 (the “Dodd-Frank Act”), numerous regulatory requirements have been placed on the banking industry in the recent years. A significant volumenumber of financial services regulations required by the Dodd-Frank Act have not yet been finalized by banking regulators, Congress continues to consider legislation that would make significant changes to the law and courts are addressing significant litigation arising under the Dodd-Frank Act, making it difficult to predict the ultimate effect of the Dodd-Frank Act on our business The operations of the Company and The First may be affected by legislative changes and the policies of various regulatory authorities. We are unable to predict the nature or the extent of the effect on our business and earnings that fiscal or monetary policies, economic control, or new federal or state legislation may have in the future.
5
Bank Holding Company Regulation
The Company is subject to extensive regulation by the Board of Governors of the Federal Reserve System (the “Federal Reserve”) pursuant to the Bank Holding Company Act of 1956, as amended (the “Bank Holding Company Act”). We file quarterly reports and other information with the Federal Reserve. We file reports with the SEC and are subject to its regulation with respect to our securities, financial reporting and certain governance matters. Our securities are listed on the Nasdaq Global Market, and we are subject to Nasdaq rules for listed companies.
The Company is registered with the Federal Reserve as a bank holding company and has elected to be treated as a financial holding company under the Bank Holding Company Act. As such, the Company and its subsidiaries are subject to the supervision, examination and reporting requirements of the Bank Holding Company Act and the regulations of the Federal Reserve.
The Bank Holding Company Act generally prohibits a corporation that owns a federally insured financial institution (“bank”) from engaging in activities other than banking and managing or controlling banks or other subsidiaries engaging in permissible activities. Also prohibited is acquiring or obtaining control 5% or more of the voting interests of any company that engages in activities other than those activities determined by the Federal Reserve to be so closely related to banking, managing or controlling banks as to be a proper incident thereto. In determining whether a particular activity is permissible, the Federal Reserve considers whether the performance of the activity can reasonably be expected to produce benefits to the public that outweigh possible adverse effects. Examples of activities that the Federal Reserve has determined to be permissible are making, acquiring or servicing loans; leasing personal property; providing certain investment or financial advice; performing certain data processing services; acting as agent or broker in selling credit life insurance; and performing certain insurance underwriting activities. The Bank Holding Company Act does not place territorial limits on permissible bank-related activities of bank holding companies. Even with respect to permissible activities, however, the Federal Reserve has the power to order a holding company or its subsidiaries to terminate any activity or its control of any subsidiary when the Federal Reserve has reasonable cause to believe that continuation of such activity or control of such subsidiary would pose a serious risk to the financial safety, soundness or stability of any bank subsidiary of that holding company.
The Bank Holding Company Act requires every bank holding company to obtain the prior approval of the Federal Reserve before it: (1) acquires ownership or control of any voting shares of any bank if, after such acquisition, such bank holding company will own or control 5% or more than 5% of the voting shares of such bank, (2) causes any of its non-bank subsidiaries to acquire all of the assets of a bank, (3) merges with any other bank holding company, or (4) engages in permissible non-banking activities. In reviewing a proposed covered acquisition, the Federal Reserve considers a bank holding company’s financial, managerial and competitive posture. The future prospects of the companies and banks concerned and the convenience and needs of the community to be served are also considered. The Federal Reserve also reviews any indebtedness to be incurred by a bank holding company in connection with the proposed acquisition to ensure that the bank holding company can service such indebtedness without adversely affecting its ability, and the ability of its subsidiaries, to meet their respective regulatory capital requirements. The Bank Holding Company Act further requires that consummation of approved bank holding company or bank acquisitions or mergers must be delayed for a period of not less than 15 or more than 30 days following the date of Federal Reserve approval. During such 15 to 30-day period, the Department of Justice has the right to review the competitive aspects of the proposed transaction. The Department of Justice may file a lawsuit with the relevant United States District Court seeking an injunction against the proposed acquisition.
The Federal Reserve has adopted capital adequacy guidelines for use in its examination and regulation of bank holding companies and financial holding companies. The regulatory capital of a bank holding company or financial holding company under applicable federal capital adequacy guidelines is particularly important in the Federal Reserve’s evaluation of the overall safety and soundness of the bank holding company or financial holding company and are important factors considered by the Federal Reserve in evaluating any applications made by such holding company to the Federal Reserve. If regulatory capital falls below minimum guideline levels, a financial holding company may lose its status as a financial holding company and a bank holding company or bank may be denied approval to acquire or establish additional banks or non-bank businesses or to open additional facilities. Additionally, each bank subsidiary of a financial holding company as well as the holding company itself must be well capitalized and well managed as determined by the subsidiary bank’s primary federal regulator, which in the case of The First, is the Office of the Comptroller of the Currency (the “OCC”). To be considered well managed, the bank and holding company must have received at least a satisfactory composite rating and a satisfactory management rating at its most recent examination. The Federal Reserve rates bank holding companies through a confidential component and composite 1-5 rating system, with a composite rating of 1 being the highest rating and 5 being the lowest. This system is designed to help identify institutions requiring special attention. Financial institutions are assigned ratings based on evaluation and rating of their financial condition and operations. Components reviewed include capital adequacy, asset quality, management capability, the quality and level of earnings, the adequacy of liquidity and sensitivity to interest rate fluctuations. As of December 31, 2017,2019, the Company and The First were both well capitalized and well managed.
A financial holding company that becomes aware that it or a subsidiary bank has ceased to be well capitalized or well managed must notify the Federal Reserve and enter into an agreement to cure the identified deficiency. If the deficiency is not cured timely, the Federal Reserve may order the financial holding company to divest its banking operations. Alternatively, to avoid divestiture, a financial holding company may cease to engage in the financial holding company activities that are unrelated to banking or otherwise impermissible for a bank holding company. See “Capital Requirements” below for more information.
The Gramm-Leach-Bliley Act of 1999 established a comprehensive framework that permits affiliations among qualified bank holding companies, commercial banks, insurance companies, securities firms, and other financial service providers by revising and expanding the Bank Holding Company Act framework to permit a holding company to engage in a full range of financial activities through a financial holding company.
Federal Reserve Oversight
The Company is required to give the Federal Reserve prior written notice of any purchase or redemption of its outstanding equity securities if the gross consideration for the purchase or redemption, when combined with the net consideration paid for all such purchases or redemptions during the preceding 12 months, is equal to 10% or more of the Company’s consolidated net worth. The Federal Reserve may disapprove such a transaction if it determines that the proposed redemption or stock purchase would constitute an unsafe or unsound practice, would violate any law, regulation, Federal Reserve order or directive or any condition imposed by, or written agreement with, the Federal Reserve.
The Federal Reserve has issued its “Policy Statement on Cash Dividends Not Fully Covered by Earnings” (the “Policy Statement”) which sets forth various guidelines that the Federal Reserve believes a bank holding company should follow in establishing its dividend policy. In general, the Federal Reserve stated that bank holding companies should pay dividends only out of current earnings. The Federal Reserve also stated that dividends should not be paid unless the prospective rate of earnings retention by the holding company appears consistent with its capital needs, asset quality and overall financial condition.
The Company is required to file annual and quarterly reports with the Federal Reserve, and such additional information as the Federal Reserve may require pursuant to the Bank Holding Company Act. The Federal Reserve may examine a bank holding company or any of its subsidiaries.
Source of Strength Doctrine
Under the Dodd-Frank Act, bank holding companies must be well-capitalized and well-managed to engage in interstate transactions. In the past, only the subsidiary banks were required to meet those standards. The Federal Reserve Board’s “source of strength doctrine” has now been codified, mandating that bank holding companies such as the Company serve as a source of strength for their subsidiary banks, such that the bank holding company must be able to provide financial assistance in the event the subsidiary bank experiences financial distress.
7
Capital Requirements
Federal banking regulators have adopted a system using risk-based capital guidelines to evaluate the capital adequacy of banks and bank holding companies that is based upon the 1988 capital accord of the Bank for International Settlements’ Basel Committee on Banking Supervision (the “Basel Committee”), a committee of central banks and bank regulators from the major industrialized countries that coordinates international standards for bank regulation. Under the guidelines, specific categories of assets and off-balance-sheet activities such as letters of credit are assigned risk weights, based generally on the perceived credit or other risks associated with the asset. Off-balance-sheet activities are assigned a credit conversion factor based on the perceived likelihood that they will become on-balance-sheet assets. These risk weights are multiplied by corresponding asset balances to determine a “risk weighted” asset base which is then measured against various measures of capital to produce capital ratios.
An organization’s capital is classified in one of two tiers, Core Capital, or Tier 1, and Supplementary Capital, or Tier 2. Tier 1 capital includes common stock, retained earnings, qualifying non-cumulative perpetual preferred stock, minority interests in the equity of consolidated subsidiaries, a limited amount of qualifying trust preferred securities and qualifying cumulative perpetual preferred stock at the holding company level, less goodwill and most intangible assets. Tier 2 capital includes perpetual preferred stock and trust preferred securities not meeting the Tier 1 definition, mandatory convertible debt securities, subordinated debt, and allowances for loan and lease losses. Each category is subject to a number of regulatory definitional and qualifying requirements.
The Basel Committee in 2010 released a set of international recommendations for strengthening the regulation, supervision and risk management of banking organizations, known as Basel III. In July 2013, the Federal Reserve published final rules for the adoption of the Basel III regulatory capital framework (the “Basel III Capital Rules”). The Basel III Capital Rules became effective for us on January 1, 2015, with certain transition provisions phasing in over a period endingthat ended on January 1, 2019. The Basel III Capital Rules established a new category of capital measure, Common Equity Tier 1 capital, which includes a limited number of capital instruments from the existing definition of Tier 1 Capital, as well as raised minimum thresholds for Tier 1 Leverage capital (100 basis points), and Tier 1 Risk-based capital (200 basis points).
The Basel III Capital Rules established the following minimum capital ratios: 4.5 percent CET1 to risk-weighted assets; 6.0 percent Tier 1 capital to risk-weighted assets; 8.0 percent total capital to risk-weighted assets; and 4.0 percent Tier 1 leverage ratio to average consolidated assets. In addition, the Basel III Capital Rules also introduced a minimum “capital conservation buffer” equal to 2.5% of an organization’s total risk-weighted assets, which exists in addition to these new required minimum CET1, Tier 1, and total capital ratios. The “capital conservation buffer,” which must consist entirely of CET1, is designed to absorb losses during periods of economic stress. The Basel III Capital Rules provide for a number of deductions from and adjustments to CET1, which include the requirement that mortgage servicing rights, deferred tax assets arising from temporary differences that could not be realized through net operating loss carrybacks and significant investments in non-consolidated financial entities be deducted from CET1 to the extent that any one such category exceeds 10% of CET1 or all such categories in the aggregate exceed 15% of CET1.
The Company and The First elected in 2015 to exclude the effects of accumulated other comprehensive income items included in stockholders’ equity from the determination of regulatory capital under the Basel III Capital Rules. Based on estimated capital ratios using Basel III definitions, the Company and The First currently exceed all capital requirements of the new rule, including the fully phased-in conservation buffer.
Certain regulatory capital ratios of the Company and The First, as of December 31, 2017,2019, are shown in the following table:
| Capital Adequacy Ratios | Capital Adequacy Ratios | |||||||||||||||||||||||||||||||
| Regulatory | Regulatory | |||||||||||||||||||||||||||||||
| Minimums | Minimums | |||||||||||||||||||||||||||||||
| Regulatory | to be Well | The First | Regulatory | to be Well | The First | |||||||||||||||||||||||||||
| Minimums | Capitalized | Bancshares, Inc. | The First | Minimums | Capitalized | Bancshares, Inc. | The First | |||||||||||||||||||||||||
| Common Equity Tier 1 risk-based capital ratio | 4.50 | % | 6.50 | % | 14.2 | % | 14.5 | % | 4.50 | % | 6.50 | % | 12.5 | % | 15.1 | % | ||||||||||||||||
| Tier 1 risk-based capital ratio | 6.00 | % | 8.00 | % | 14.9 | % | 14.5 | % | 6.00 | % | 8.00 | % | 13.0 | % | 15.1 | % | ||||||||||||||||
| Total risk-based capital ratio | 8.00 | % | 10.00 | % | 15.5 | % | 15.1 | % | 8.00 | % | 10.00 | % | 15.8 | % | 15.6 | % | ||||||||||||||||
| Leverage ratio | 4.00 | % | 5.00 | % | 11.7 | % | 11.4 | % | 4.00 | % | 5.00 | % | 10.3 | % | 11.8 | % | ||||||||||||||||
The essential difference between the leverage capital ratio and the risk-based capital ratios is that the latter identify and weight both balance sheet and off-balance sheet risks. Tier 1 capital generally includes common equity, retained earnings, qualifying minority interests (issued by consolidated depository institutions or foreign bank subsidiaries), accounts of consolidated subsidiaries and an amount of qualifying perpetual preferred stock, limited to 50% of Tier 1 capital. In calculating Tier 1 capital, goodwill and other disallowed intangibles and disallowed deferred tax assets and certain other assets are excluded. Tier 2 capital is a secondary component of risk-based capital, consisting primarily of perpetual preferred stock that may not be included as Tier 1 capital, mandatory convertible securities, certain types of subordinated debt and an amount of the allowance for loan losses (limited to 1.25% of risk weighted assets).
The risk-based capital guidelines are designed to make regulatory capital requirements more sensitive to differences in risk profiles among banks and bank holding companies, to take into account off-balance sheet exposure and to minimize disincentives for holding liquid assets. Under the risk-based capital guidelines, assets are assigned to one of four risk categories: 0%, 20%, 50% and 100%. For example, U.S. Treasury securities are assigned to the 0% risk category while most categories of loans are assigned to the 100% risk category. Off-balance sheet exposures such as standby letters of credit are risk-weighted and all or a portion thereof are included in risk-weighted assets based on an assessment of the relative risks that they present. The risk-weighted asset base is equal to the sum of the aggregate dollar values of assets and off-balance sheet items in each risk category, multiplied by the weight assigned to that category.
Prompt Corrective Action and Undercapitalization
The FDICIA established a system of prompt corrective action regulations and policies to resolve the problems of undercapitalized insured depository institutions. Under this system, insured depository institutions are ranked in one of five capital categories as described below. Regulators are required to take mandatory supervisory actions and are authorized to take other discretionary actions of increasing severity with respect to insured depository institutions in the three undercapitalized categories. The five capital categories for insured depository institutions under the prompt corrective action regulations consist of:
| · | Well capitalized - equals or exceeds a 10% total risk-based capital ratio, 8% Tier 1 risk-based capital ratio, and 5% leverage ratio and is not subject to any written agreement, order or directive requiring it to maintain a specific level for any capital measure; |
| · | Adequately capitalized - equals or exceeds an 8% total risk-based capital ratio, 6% Tier 1 risk-based capital ratio, and 4% leverage ratio; |
| · | Undercapitalized - total risk-based capital ratio of less than 8%, or a Tier 1 risk-based ratio of less than 6%, or a leverage ratio of less than 4%; |
| · | Significantly undercapitalized - total risk-based capital ratio of less than 6%, or a Tier 1 risk-based capital ratio of less than 4%, or a leverage ratio of less than 3%; and |
| · | Critically undercapitalized - a ratio of tangible equity to total assets equal to or less than 2%. |
The prompt corrective action regulations provide that an institution may be downgraded to the next lower category if its regulator determines, after notice and opportunity for hearing or response, that the institution is in an unsafe or unsound condition or has received and not corrected a less-than-satisfactory rating for any of the categories of asset quality, management, earnings or liquidity in its most recent examination.
Federal bank regulatory agencies are required to implement arrangements for prompt corrective action for institutions failing to meet minimum requirements to be at least adequately capitalized. FDICIA imposes an increasingly stringent array of restrictions, requirements and prohibitions as an organization’s capital levels deteriorate. A bank rated "adequately capitalized" may not accept, renew or roll over brokered deposits. A "significantly undercapitalized" institution is subject to mandated capital raising activities, restrictions on interest rates paid and transactions with affiliates, removal of management and other restrictions. The OCC has only very limited discretion in dealing with a "critically undercapitalized" institution and generally must appoint a receiver or conservator (the FDIC) if the capital deficiency is not corrected promptly.
Under the Federal Deposit Insurance Act (“FDIA”), “critically undercapitalized” banks may not, beginning 60 days after becoming critically undercapitalized, make any payment of principal or interest on their subordinated debt (subject to certain limited exceptions). In addition, under Section 18(i) of the FDIA, banks are required to obtain the advance consent of the FDIC to retire any part of their subordinated notes. Under the FDIA, a bank may not pay interest on its subordinated notes if such interest is required to be paid only out of net profits, or distribute any of its capital assets, while it remains in default on any assessment due to the FDIC.
Federal bank regulators may set capital requirements for a particular banking organization that are higher than the minimum ratios when circumstances warrant. Federal Reserve and OCC guidelines provide that banking organizations experiencing significant growth or making acquisitions will be expected to maintain strong capital positions substantially above the minimum supervisory levels, without significant reliance on intangible assets. Concentration of credit risks, interest rate risk (imbalances in rates, maturities or sensitivities) and risks arising from non-traditional activities, as well as an institution’s ability to manage these risks, are important factors taken into account by regulatory agencies in assessing an organization’s overall capital adequacy.
The OCC and the Federal Reserve also use a leverage ratio as an additional tool to evaluate the capital adequacy of banking organizations. The leverage ratio is a company’s Tier 1 capital divided by its average total consolidated assets. A minimum leverage ratio of 3.0% is required for banks and bank holding companies that either have the highest supervisory rating or have implemented the appropriate federal regulatory authority’s risk-adjusted measure for market risk. All other banks and bank holding companies are required to maintain a minimum leverage ratio of 4.0%, unless a different minimum is specified by an appropriate regulatory authority. In order to be considered well capitalized the leverage ratio must be at least 5.0%.
Our Bank’s leverage ratio was 11.4%11.8% at December 31, 20172019 and, as a result, it is currently classified as “well capitalized” for purposes of the OCC’s prompt corrective action regulations.
The risk-based and leverage capital ratios established by federal banking regulators are minimum supervisory ratios generally applicable to banking organizations that meet specified criteria, assuming that they otherwise have received the highest regulatory ratings in their most recent examinations. Banking organizations not meeting these criteria are expected to operate with capital positions in excess of the minimum ratios. Regulators can, from time to time, change their policies or interpretations of banking practices to require changes in risk weights assigned to our Bank's assets or changes in the factors considered in order to evaluate capital adequacy, which may require our Bank to obtain additional capital to support existing asset levels or future growth or reduce asset balances in order to meet minimum acceptable capital ratios.
Additional Regulatory Issues
In June 2010, the Federal Reserve, the OCC and the FDIC issued joint guidance on executive compensation designed to help ensure that a banking organization’s incentive compensation policies do not encourage imprudent risk taking and are consistent with the safety and soundness of the organization. In addition, the Dodd-Frank Act required those agencies, along with the SEC, to adopt rules to require reporting of incentive compensation and to prohibit certain compensation arrangements. The objective of the guidance is to assure that incentive compensation arrangements (i) provide incentives that do not encourage excessive risk-taking, (ii) are compatible with effective internal controls and risk management and (iii) are supported by strong corporate governance, including oversight by the board of directors. In 2016, the Federal Reserve and the FDIC proposed rules that would, depending upon the assets of the institution, directly regulate incentive compensation arrangements and would require enhanced oversight and recordkeeping. As of December 31, 2017,2019, these rules have not been implemented.
The Company is a legal entity separate and distinct from The First. There are various restrictions that limit the ability of The First to finance, pay dividends or otherwise supply funds to the Company or other affiliates. In addition, subsidiary banks of holding companies are subject to certain restrictions under Sections 23A and 23B of the Federal Reserve Act on any extension of credit to the bank holding company or any of its subsidiaries, on investments in the stock or other securities thereof and on the taking of such stock or securities as collateral for loans to any borrower. Further, a bank holding company and its subsidiaries are prohibited from engaging in certain tie-in arrangements in connection with extensions of credit, leases or sales of property, or furnishing of services.
Stress Testing
The Dodd-Frank Act requires stress testing of certain bank holding companies and banks that have more than. On May 24, 2018 the Economic Growth, Regulatory Relief and Consumer Protection Act (the “Regulatory Relief Act”) was signed into law, which amended portions of the Dodd-Frank Act and immediately raised the asset threshold for stress testing from $10 billion but less than $50to $100 billion of consolidated assets (“medium-sized companies”). Additionalfor bank holding companies. On December 18, 2018, the OCC proposed regulations that would raise the stress testing is requiredthreshold for banking organizations having $50national banks from $10 billion or more of assets. to $250 billion.Because the consolidated assets of the Company and The First are less than these threshold levels, the stress test requirements are not currently applicable to the Company or to The First.
Company Participation in Legislative and Regulatory Initiatives
The Congress, Treasury Department and the federal banking regulators, including the FDIC, have taken broad action since early September 2008 to address volatility in the U.S. banking system. In October 2008, the Emergency Economic Stabilization Act of 2008 (“EESA”) was enacted. The EESA authorized the Treasury Department to purchase from financial institutions and their holding companies up to $700 billion in mortgage loans, mortgage-related securities and certain other financial instruments, including debt and equity securities issued by financial institutions and their holding companies in a troubled asset relief program (“TARP”). The purpose of TARP was to restore confidence and stability to the U.S. banking system and to encourage financial institutions to increase their lending to customers and to each other. The Treasury Department allocated $250 billion towards the TARP Capital Purchase Program (“CPP”), pursuant to which the Treasury Department purchased debt or equity securities from participating institutions. The TARP also included the Community Development Capital Initiative (“CDCI”), which was made available only to certified Community Development Financial Institutions (“CDFIs”) and imposed a lower dividend or interest rate, as applicable, than the CPP funding. Participants in the TARP are subject to executive compensation limits and are encouraged to expand their lending and mortgage loan modifications.
On February 6, 2009, as part of the CPP, the Company entered into a Letter Agreement and Securities Purchase Agreement (collectively, the “Purchase Agreement”) with the Treasury Department, pursuant to which the Company sold (i) 5,000 shares of the Company’s Fixed Rate Cumulative Perpetual Preferred Stock, Series UST (the “CPP Preferred Stock”) and (ii) a warrant (the “Warrant”) to purchase 54,705 shares of the Company’s Common Stock for an exercise price of $13.71 per share. On September 29, 2010, after successfully obtaining CDFI certification, the Company exited the CPP by refinancing its CPP funding into lower-cost CDCI funding and also accepted additional CDCI funding. In connection with this transaction, the Company retired its CPP Preferred Stock and issued to the Treasury Department 17,123 shares of the Company’s Fixed Rate Cumulative Perpetual Preferred Stock, Series CD (the “CDCI Preferred Stock”). Including refinanced funding and newly obtained funding, the Company’s total CDCI funding was $17,123,000.
The America Reinvestment and Recovery Act of 2009 (“ARRA”) contained expansive new restrictions on executive compensation for financial institutions and other companies participating in the TARP. As long as the Treasury continued to hold equity interests in the Company issued under the TARP, the Company monitored its compensation arrangements, modified such compensation arrangements, agreed to limit and limit its compensation deductions, and took such other actions as were necessary to comply with the standards discussed below. On December 6, 2016, the Company repurchased all 17,123 shares of its CDCI Preferred Shares from Treasury at fair market value. Therefore, as of December 6, 2016, the Company no longer had any obligations under TARP or the ARRA. However, as part of its repurchase obligations with the Treasury, the Company agreed to maintain its CDFI certification status for a period of two years. The eligibility requirements provide that the Company must:
• Have a primary mission of promoting community development;
• Provide both financial and educational services;
• Serve and maintain accountability to one or more defined target markets;
• Maintain accountability to a defined market; and
• Be a legal, non-governmental entity at the time of application (with the exception of Tribal governmental entities)
The First, A National Banking Association
OCC Regulation. The First operates as a national banking association incorporated under the laws of the United States and subject to supervision, inspection and examination by the OCC. The OCC regulates or monitors virtually all areas of The First’s operations, including security devices and procedures, adequacy of capitalization and loan loss reserves, loans, investments, borrowings, deposits, mergers, issuances of securities, payment of dividends, interest rates payable on deposits, interest rates or fees chargeable on loans, establishment of branches, corporate reorganizations, maintenance of books and records, and adequacy of staff training to carry on safe lending and deposit gathering practices. The OCC imposes limitations on The First’s aggregate investment in real estate, bank premises, and furniture and fixtures. The First is required by the OCC to prepare quarterly reports on its financial condition and to conduct an annual audit of its financial affairs in compliance with minimum standards and procedures prescribed by the OCC.
Safe and Sound Banking Practices; Enforcement. Banks and bank holding companies are prohibited from engaging in unsafe and unsound banking practices. Bank regulators have broad authority to prohibit and penalize activities of bank holding companies and their subsidiaries which represent unsafe and unsound banking practices or which constitute violations of laws, regulations or written directives of or agreements with regulators. Regulators have considerable discretion in identifying what they deem to be unsafe and unsound practices and in pursuing enforcement actions in response to them.
Under FDICIA, all insured institutions must undergo regular on-site examinations by their appropriate banking agency. The cost of examinations of insured depository institutions and any affiliates may be assessed by the appropriate agency against each institution or affiliate as it deems necessary or appropriate. Insured institutions are required to submit annual reports to the FDIC and the appropriate agency. FDICIA also directs the FDIC to develop with other appropriate agencies a method for insured depository institutions to provide supplemental disclosure of the estimated fair market value of assets and liabilities, to the extent feasible and practicable, in any balance sheet, financial statement, report of condition, or any other report of any insured depository institution. FDICIA also requires the federal banking regulatory agencies to prescribe, by regulation, standards for all insured depository institutions and depository institution holding companies relating, among other things, to: (i) internal controls, information systems, and audit systems; (ii) loan documentation; (iii) credit underwriting; (iv) interest rate risk exposure; and (v) asset quality.
National banks and their holding companies which have been chartered or registered or undergone a change in control within the past two years or which have been deemed by the OCC or the Federal Reserve Board, respectively, to be troubled institutions must give the OCC or the Federal Reserve Board, respectively, thirty days prior notice of the appointment of any senior executive officer or director. Within the thirty-day period, the OCC or the Federal Reserve Board, as the case may be, may approve or disapprove any such appointment.
Deposit Insurance.The FDIC establishes rates for the payment of premiums by federally insured banks and thrifts for deposit insurance. Deposits in The First are insured by the FDIC up to a maximum amount (generally $250,000 per depositor, subject to aggregation rules). The DIF is maintained by the FDIC for commercial banks and thrifts and funded with insurance premiums from the industry that are used to offset losses from insurance payouts when banks and thrifts fail. Since 1993, insured depository institutions like The First have paid for deposit insurance under a risk-based premium system. Assessments are calculated based on the depository institution’s average consolidated total assets, less its average amount of tangible equity.
Transactions With Affiliates and Insiders.The First is subject to Section 23A of the Federal Reserve Act, which places limits on the amount of loans to, and certain other transactions with, affiliates, as well as on the amount of advances to third parties collateralized by the securities or obligations of affiliates. The aggregate of all covered transactions is limited in amount, as to any one affiliate, to 10% of The First's capital and surplus and, as to all affiliates combined, to 20% of The First's capital and surplus. Furthermore, within the foregoing limitations as to amount, each covered transaction must meet specified collateral requirements.
The First is also subject to Section 23B of the Federal Reserve Act, which prohibits an institution from engaging in certain transactions with affiliates unless the transactions are on terms substantially the same, or at least as favorable to such institution, as those prevailing at the time for comparable transactions with nonaffiliated companies. The First is subject to certain restrictions on extensions of credit to executive officers, directors, certain principal shareholders, and their related interests. Such extensions of credit (i) must be made on substantially the same terms, including interest rates and collateral, as those prevailing at the time for comparable transactions with third parties and (ii) must not involve more than the normal risk of repayment or present other unfavorable features.
Change in ControlControl.With certain limited exceptions, the BHCA and the Change in Bank Control Act, together with regulations promulgated thereunder, prohibit a person or company or a group of persons deemed to be “acting in concert” from, directly or indirectly, acquiring more than 10% (5% if the acquirer is a bank holding company) of any class of our voting stock or obtaining the ability to control in any manner the election of a majority of our directors or otherwise direct the management or policies of our company without prior notice or application to and the approval of the Federal Reserve.
Dividends.The principal source of funds from which we pay cash dividends are the dividends received from our bank subsidiary, The First. Federal banking laws and regulations restrict the amount of dividends and loans a bank may make to its parent company. A national bank may not pay dividends from its capital. All dividends must be paid out of undivided profits then on hand, after deducting expenses, including reserves for losses and bad debts. In addition, a national bank is prohibited from declaring a dividend on its shares of common stock until its surplus equals its stated capital, unless the bank has transferred to surplus no less than one-tenth of its net profits of the preceding two consecutive half-year periods (in the case of an annual dividend). The approval of the OCC is required if the total of all dividends declared by a national bank in any calendar year exceeds the total of its net profits for that year combined with its retained net profits for the preceding two years, less any required transfers to surplus. In addition, under FDICIA, the banks may not pay a dividend if, after paying the dividend, the bank would be undercapitalized. See "Capital Requirements" above.
Interstate Branching and Acquisitions.National banks are required by the National Bank Act to adhere to branch office banking laws applicable to state banks in the states in which they are located. Formerly, under the Riegle-Neal Interstate Banking and Branching Efficiency Act of 1994, a bank’s ability to branch into a particular state was largely dependent upon whether the state “opted in” to de novo interstate branching. Under the Dodd-Frank Act, de novo interstate branching by national banks is permitted if, under the laws of the state where the branch is to be located, a state bank chartered in that state would be permitted to establish a branch. Further, a bank headquartered in one state is authorized to merge with a bank headquartered in another state, as long as neither of the states have opted out of such interstate merger authority, and subject to any state requirement that the target bank shall have been in existence and operating for a minimum period of time, not to exceed five years and certain deposit market-share limitations. Under current Mississippi, Alabama, Louisiana, Florida and FloridaGeorgia law, The First may open branches or acquire existing banking operations throughout these states with the prior approval of the OCC. The Dodd-Frank Act permits out of state acquisitions by bank holding companies (subject to veto by new state law), interstate branching by banks if allowed by state law, interstate merging by banks, and de novo branching by national banks if allowed by state law. All branching in which The First may engage remains subject to regulatory approval and adherence to applicable legal and regulatory requirements.
Community Reinvestment Act.The Community Reinvestment Act (the “CRA”) requires depository institutions to assist in meeting the credit needs of their market areas consistent with safe and sound banking practice. Under the Community Reinvestment Act, each depository institution is required to help meet the credit needs of its market areas by, among other things, providing credit, making investments and providing community development services to low- and moderate-income individuals and communities. Depository institutions are periodically examined for compliance with the CRA and are assigned ratings. In order for a financial holding company to commence new activity permitted by the BHCA, each insured depository institution subsidiary of the financial holding company must have received a rating of at least “satisfactory” in its most recent examination under the CRA. These factors are considered in evaluating mergers, acquisitions, and applications to open a branch or facility.
USA Patriot Act. In 2001, the Uniting and Strengthening America by Providing Appropriate Tools Required to Intercept and Obstruct Terrorism Act of 2001 (the “USA Patriot Act”) was signed into law. The USA Patriot Act broadened the application of anti-money laundering regulations to apply to additional types of financial institutions, such as broker-dealers, and strengthened the ability of the U.S. government to detect and prosecute international money laundering and the financing of terrorism. The principal provisions of Title III of the USA Patriot Act require that regulated financial institutions, including banks: (i) establish an anti-money laundering program that includes training and audit components; (ii) comply with regulations regarding the verification of the identity of any person seeking to open an account; (iii) take additional required precautions with non-U.S. owned accounts; and (iv) perform certain verification and certification of money laundering risk for their foreign correspondent banking relationships. The USA Patriot Act also expanded the conditions under which funds in a U.S. interbank account may be subject to forfeiture and increased the penalties for violation of anti-money laundering regulations. Failure of a financial institution to comply with the USA Patriot Act’s requirements could have serious legal and reputational consequences for the institution. The First has adopted policies, procedures and controls to address compliance with the requirements of the USA Patriot Act under the existing regulations and will continue to revise and update its policies, procedures and controls to reflect changes required by the USA Patriot Act and implementing regulations.
Office of Foreign Assets Control. The U.S. Treasury Department’s Office of Foreign Assets Control (“OFAC”) is responsible for administering and enforcing economic and trade sanctions against specified foreign parties, including countries and regimes, foreign individuals and other foreign organizations and entities. OFAC publishes lists of prohibited parties that are regularly consulted by our Bank in the conduct of its business in order to assure compliance. We are responsible for, among other things, blocking accounts of, and transactions with, prohibited parties identified by OFAC, avoiding unlicensed trade and financial transactions with such parties and reporting blocked transactions after their occurrence. Failure to comply with OFAC requirements could have serious legal, financial and reputational consequences for our Bank.
Consumer Protection Regulations.Interest and certain other charges collected or contracted for by The First are subject to state usury laws and certain federal laws concerning interest rates. The First’s loan operations are subject to certain federal laws applicable to credit transactions, such as the federal Truth-In-Lending Act, governing disclosures of credit terms to consumer borrowers; the Home Mortgage Disclosure Act of 1975, requiring financial institutions to provide information to enable the public and public officials to determine whether a financial institution is fulfilling its obligation to help meet the housing needs community it serves; the Equal Credit Opportunity Act, prohibiting discrimination on the basis of race, color, religion, national origin or other prohibited factors in extending credit; the Fair Credit Reporting Act of 1978, governing the use and provision of information to credit reporting agencies; the Fair Debt Collection Practices Act, concerning the manner in which consumer debts may be collected by collection agencies; and the rules and regulations of the various federal agencies charged with the responsibility of implementing such federal laws. The deposit operations of The First also are subject to the Right to Financial Privacy Act, which imposes a duty to maintain confidentiality of consumer financial records and prescribes procedures for complying with administrative subpoenas of financial records, and the Electronic Funds Transfer Act and Regulation E issued by the Federal Reserve Board to implement that Act, which governs automatic deposits to and withdrawals from deposit accounts and customers' rights and liabilities arising from the use of automated teller machines and other electronic banking services.
Other Regulatory Matters
Risk-retention rules. Under the final risk-retention rules, banks that sponsor the securitization of asset-backed securities and residential-mortgage backed securities are required to retain 5% of any loan they sell or securitize, except for mortgages that meet low-risk standards to be developed by regulators.
Changes to federal preemption. The Dodd-Frank Act created a new independent supervisory body, the Consumer Financial Protection Bureau (the “CFPB”) that is housed within the Federal Reserve. The CFPB is the primary regulator for federal consumer financial statutes. State attorneys general are authorized to enforce new regulations issued by the CFPB. Although the application of most state consumer financial laws to The First will continue to be preempted under the National Bank Act, OCC determinations of such preemption are made on a case-by-case basis. As a result, it is possible that state consumer financial laws enacted in the future may be held to apply to our business activities. The cost of complying with any such additional laws could have a negative impact on our financial results.
Mortgage Rules. During 2013, the CFPB finalized a series of rules related to the extension of residential mortgage loans by banks. Among these rules are requirements that a bank make a good faith determination that a borrower has the ability to repay a mortgage loan prior to extending such credit, a requirement that certain mortgage loans provide for escrow payments, new appraisal requirements, and specific rules regarding how loan originators may be compensated and the servicing of residential mortgage loans. The implementation of these new rules began in January 2014.
Volcker Rule. In December 2013, the Federal Reserve, the FDIC, the OCC, the Commission, and the Commodity Futures Trading Commission issued the “Prohibitions And Restrictions On Proprietary Trading And Certain Interests In, And Relationships With, Hedge Funds And Private Equity Funds,” commonly referred to as the Volcker Rule, which regulates and restricts investments which may be made by banks. The Volcker Rule was adopted to implement a portion of the Dodd-Frank Act and new Section 13 of the Bank Holding Company Act, which prohibits any banking entity from engaging in proprietary trading or from acquiring or retaining an ownership interest in, or sponsoring or having certain relationships with, a hedge fund or private equity fund (“covered funds”), subject to certain exemptions.The Regulatory Relief Act narrowed the “banking entity” definition under the Volcker Rule by excluding from the term “insured depository institution” an institution that does not have, and is not controlled by a company that has more than $10 billion in total consolidated assets, and does not have total trading assets and trading liabilities of more than 5% of total consolidated assets. The intended effect of narrowing the scope of the “banking entity” definition is to reduce the regulatory burden imposed by the Volcker Rule on community banks, which generally include banks such as The First with total consolidated assets of less than $10 billion and limited trading activities.
Debit Interchange Fees
Interchange fees, or “swipe” fees, are fees that merchants pay to credit card companies and card-issuing banks such as The First for processing electronic payment transactions on their behalf. The maximum permissible interchange fee that an issuer may receive for an electronic debit transaction is the sum of 21 cents per transaction and 5 basis points multiplied by the value of the transaction, subject to an upward adjustment of 1 cent if an issuer certifies that it has implemented policies and procedures reasonably designed to achieve the fraud-prevention standards set forth by the Federal Reserve.
In addition, the legislation prohibits card issuers and networks from entering into exclusive arrangements requiring that debit card transactions be processed on a single network or only two affiliated networks, and allows merchants to determine transaction routing. Due to the Company’s size, the Federal Reserve rule limiting debit interchange fees has not reduced our debit card interchange revenues.
Summary
The foregoing is a brief summary of certain statutes, rules and regulations affecting the Company and The First. It is not intended to be an exhaustive discussion of all statutes and regulations having an impact on the operations of such entities.
Increased regulation generally has resulted in increased legal and compliance expense.
Finally, additional bills may be introduced in the future in the U.S. Congress and state legislatures to alter the structure, regulation and competitive relationships of financial institutions. It cannot be predicted whether and in what form any of these proposals will be adopted or the extent to which the business of the Company and The First may be affected thereby.
Effect of Governmental Monetary and Fiscal Policies
The difference between the interest rate paid on deposits and other borrowings and the interest rate received on loans and securities comprises most of a bank’s earnings. In order to mitigate the interest rate risk inherent in the industry, the banking business is becoming increasingly dependent on the generation of fee and service charge revenue.
The earnings and growth of a bank are affected by both general economic conditions and the monetary and fiscal policy of the U.S. government and its agencies, particularly the Federal Reserve. The Federal Reserve sets national monetary policy such as seeking to curb inflation and combat recession. This is accomplished by its open-market operations in U.S. government securities, adjustments in the amount of reserves that financial institutions are required to maintain and adjustments to the discount rates on borrowings and target rates for federal funds transactions. The actions of the Federal Reserve in these areas influence the growth of bank loans, investments and deposits and also affect interest rates on loans and deposits. The nature and timing of any future changes in monetary policies and their potential impact on the Company cannot be predicted.
Making or continuing an investment in securities, includingOur business is subject to risk. The following discussion, along with management’s discussion and analysis and our financial statements and footnotes, sets forth the Company’s Common Stock, involves certain risks that you should carefully consider. Themost significant risks and uncertainties described below are not the only risks that may have a material adverse effect on the Company. Additional risks and uncertainties alsowe believe could adversely affect the Company’s business and results of operations. If any of the following risks actually occur, our business, financial condition or results of operations could be affected, the market price for your securities could decline,operations. Additional risks and you could loseuncertainties that management is not aware of or that management currently deems immaterial may also have a material adverse effect on our business, financial condition or results of operations. There is no assurance that this discussion covers all or a part of your investment.potential risks that we face. Further, to the extent that any of the information contained in this Annual Report on Form 10-K constitutes forward-looking statements, the risk factors set forth below also are cautionary statements identifying important factors that could cause the Company’sour actual results to differ materially from those expressed in any forward-looking statements made by or on behalf of the Company.
herein.
Risk Factors Associated With Our Business
General economic conditions in the areas where our operations or loans are concentrated may adversely affect our customers’ ability to meet their obligations.financial results or liquidity.
A sudden or severe downturn in the economy in the geographic markets we serve in the states of Mississippi, Louisiana, Alabama, Florida or FloridaGeorgia may affect the ability of our customers to meet loan payment obligations on a timely basis. The local economic conditions in these areas have a significant impact on our commercial, real estate, and construction loans, the ability of borrowers to repay these loans and the value of the collateral securing such loans. Any deterioration in the economic conditions of these market areas could negatively impact the financial results of the Company’s banking operations, earnings, and profitability.
Additionally, adverse
Our Bank requires liquidity in the form of available funds to meet its deposit, debt and other obligations as they come due, borrower requests to draw on committed credit facilities as well as unexpected demands for cash payments. Adverse economic changes may cause customers to withdraw deposit balances, thereby causing a strain on our liquidity.We have historically had access to a number of alternative sources of liquidity, but if there is an increase in volatility in the credit and liquidity markets there is no assurance that we will be able to obtain such liquidity on terms that are favorable to us, or at all.
We may be vulnerable to certain sectors of the economy, including real estate.
A significant portion of our loan portfolio is secured by real estate.The market value of real estate can fluctuate significantly in a relatively short period of time as a result of market conditions in the geographic area in which the real estate is located.If the economy deteriorates and real estate values depress beyonddecline materially, a certain point, as happened during the last recession, the collateral valuesignificant part of theour loan portfolio could become under-collateralized and the revenue stream from those loanslosses incurred upon borrower defaults would increase. This could come under stress andresult in additional loan loss accruals could be required which would negatively impact our earnings. Our ability to dispose of foreclosed real estate at prices above the respective carrying values could also be impacted, which could cause our results of operations to be adversely affected.
Unpredictable market conditions may adversely affect the industry in which we operate.
The capital and credit markets are subject to volatility and disruption. Dramatic declines in the housing market in years past caused home prices to fall and increased foreclosures, unemployment and under-employment. These events, if they were to happen again, could negatively impact the credit performance of mortgage loans and result in significant write-downs of asset values, including government-sponsored entities as well as major commercial and investment banks. Market turmoil and tightening of credit could lead to an increased level of commercial and consumer delinquencies, lack of consumer confidence and widespread reduction of business activity generally. A worsening of these conditions would have an adverse effect on us and others in the financial institution industry generally, particularly in our real estate markets, as lower home prices and increased foreclosures would result in higher charge-offs and delinquencies.
The state of the economy and various economic factors, including inflation, recession, unemployment, interest rates and the level of U.S. debt, as well as governmental action and uncertainty resulting from U.S. and global political trends, may directly and indirectly, have a destabilizing effect on our financial condition and results of operations. An unfavorable or uncertain national or regional political or economic environment could drive losses beyond those which are provided for in our allowance for loan losses and could negatively impact our results of operationsoperations.
We must maintain an appropriate allowance for loan losses.
The First, as lender, is exposed to the risk that its customers will be unable to repay their loans in accordance with their terms and that any collateral securing the payment of their loans may not be sufficient to assure repayment. Credit losses are inherent in the business of making loans and could have a material adverse effect on our operating results. Credit risk with respect to our real estate and construction loan portfolio relates principally to the creditworthiness of the borrower corporations and the value of the real estate serving as security for the repayment of loans. Credit risk with respect to our commercial and consumer loan portfolio will relate principally to the general creditworthiness of the borrower businesses and individuals within our local markets.
The First makes various assumptions and judgments about the collectability of its loan portfolio based on a number of factors. We maintain an allowance for loan losses, which is a reserve established through a provision for loan losses charged to expense each quarter, that is consistent with management’s assessment of the collectability of the loan portfolio in light of the amount of loans committed and outstanding and current economic conditions, market trends and market trends.other factors. When specific loan losses are identified, the amount of the expected loss is removed, or charged-off, from the allowance. The First believes that its current allowance for loan losses is adequate.appropriate and is consistent with our methodology. However, if our assumptions or judgments prove to be incorrect, the allowance for loan losses may not be sufficient to cover actual loan losses. We may have to increase the allowance in the future in response to the request of one of our primary banking regulators, to adjust for changing conditions and assumptions, or as a result of any deterioration in the quality of the loan portfolio. The actual amount of future provisions for loan losses cannot be determined at this time and may vary from the amounts of past provisions. Any increase in the allowance for loan losses or in the amount of loan charge-offs required by regulatory agencies or for other factors could have a negative effect on our results of operations and financial condition.
In addition, the Company will adopt ASU 2016 “Financial Instruments - Credit Losses (Topic 326): Measurement of Credit Losses on Financial Instruments,” as amended on January 1, 2020. This standard makes significant changes to the accounting for credit losses on financial instruments presented on an amortized cost basis such as our loans held for investment, and disclosures about them. The new CECL impairment model will require an estimate of expected credit losses, measured over the contractual life of an instrument, which considers reasonable and supportable forecasts of future economic conditions in addition to information about past events and current conditions. The standard provides significant flexibility and requires a high degree of judgement with regards to pooling financial assets with similar risk characteristics and adjusting the relevant historical loss information in order to develop an estimate of expected lifetime losses. Providing for losses over the life of our portfolio is a change to the previous method of providing allowances for loan losses that are probable and incurred. This change may require us to increase our allowance for loan losses rapidly in future periods, and greatly increases the type of data we need to collect and review to determine the appropriate level of allowance for loan losses. In addition, there can be no assurance that the Company’s policies and procedures will reduce certain lending risks or that the Company’s allowance for loan losses will be adequate to cover actual losses. See note B – Summary of Significant Accounting Policies in the notes to consolidated financial statements.
We are subject to risks related to changes in market interest rates.
Our assets and liabilities are primarily monetary in nature, and as a result we are subject to significant risks resulting from changes in interest rates. Our profitability is largely dependent upon net interest income. Unexpected movement in interest rates markedly changing the slope of the current yield curve could cause net interest margins to decrease, subsequently decreasing net interest income. In addition, such changes could adversely affect the valuation of our assets and liabilities.
The fair market value of the securities portfolio and the investment income from these securities also fluctuates depending on general economic and market conditions. In addition, actual net investment income and/or cash flows from investments that carry prepayment risk, such as mortgage-backed and other asset-backed securities, may differ from those anticipated at the time of investment as a result of interest rate fluctuations.
At present the Company’s one-year interest rate sensitivity position is asset sensitive. As with most financial institutions, the Company’s results of operations are affected by changes in interest rates and the Company’s ability to manage this risk. The difference between interest rates charged on interest-earning assets and interest rates paid on interest-bearing liabilities may be affected by changes in market interest rates, changes in relationships between interest rate indices, and/or changes in the relationships between long-term and short-term market interest rates. A change in this difference might result in an increase in interest expense relative to interest income, or a decrease in the Company’s interest rate spread.
We may be adversely affected by changes in the method of determining the London Interbank Offered Rate (“LIBOR”), or the replacement of LIBOR with an alternative reference rate, for our variable rate loans and the interest expense paid on our subordinated notes and our subordinated debentures.
On July 27, 2017, the Financial Conduct Authority, which regulates LIBOR, announced that it intends to stop persuading or compelling banks to submit rates for the calculation of LIBOR to the LIBOR administration after 2021. The announcement indicates that the continuation of LIBOR on the current basis cannot and will not be guaranteed after 2021. It is impossible to predict whether and to what extent banks will continue to provide LIBOR submissions to the LIBOR administrator, whether LIBOR will cease to be published or supported before or after 2021 or whether any additional reforms to LIBOR may be enacted in the United Kingdom or elsewhere; however, it does appear highly likely that LIBOR will discontinued or modified by 2021. At this time, no consensus exists as to what reference rate or rates may become accepted alternatives to LIBOR and it is impossible to predict the effect of any such alternatives on the value of securities based on LIBOR such as our subordinated notes and our subordinated debentures.
Uncertainty as to the nature of such potential changes, alternative reference rates, the replacement or disappearance of LIBOR or other reforms may adversely affect the value of and the return on our subordinated notes and our subordinated debentures, as well as the interest we pay on those securities.
At December 31, 2019, approximately 2.1% of our total loan portfolio was indexed to 30-day, 90-day, and one-year LIBOR.
Certain changes in interest rates, inflation, or the financial markets could affect demand for our products and our ability to deliver products efficiently.
Loan originations, and therefore loan revenues, could be adversely impacted by rising interest rates.Increases in market interest rates can have negative impacts on our business, including reducing our customers' desire to borrow money from us or adversely affecting their ability to repay their outstanding loans by increasing their debt service obligations through the periodic reset of adjustable interest rate loans. If our borrowers’ ability to repay their loans is impaired by increasing interest payment obligations, our level of non-performingnonperforming assets would increase, producing an adverse effect on operating results. Asset values, especially commercial real estate as collateral, securities or other fixed rate earning assets, can decline significantly with relatively minor changes in interest rates.Conversely, falling If interest rates were to decrease, our yield on our variable rate loans and on our new loans would decrease, reducing our net interest income. In addition, lower interest rates may reduce our realized yields on investment securities, which would reduce our net interest income and cause downward pressure on net interest margin in future periods. A significant reduction in our net interest income could increase prepayments withinhave a material adverse impact on our loancapital, financial condition and securities portfolio lowering interest earnings from those assets. results of operations.
An unanticipated increase in inflation could cause operating costs related to salaries and benefits, technology, and supplies to increase at a faster pace than revenues.
The fair market value of the securities portfolio and the investment income from these securities also fluctuates depending on general economic and market conditions. In addition, actual net investment income and/or cash flows from investments that carry prepayment risk, such as mortgage-backed and other asset-backed securities, may differ from those anticipated at the time of investment as a result of interest rate fluctuations.
Evaluation of investment securities for other-than-temporary impairment involves subjective determinations and could materially impact our results of operations and financial condition.
The evaluation of impairments is a quantitative and qualitative process, which is subject to risks and uncertainties, and is intended to determine whether declines in the fair value of investments should be recognized in current period earnings. The risks and uncertainties include changes in general economic conditions, the issuers’ financial condition or future recovery prospects, the effects of changes in interest rates or credit spreads and the expected recovery period. Estimating future cash flows involves incorporating information received from third-party sources and making internal assumptions and judgments regarding the future performance of the underlying collateral and assessing the probability that an adverse change in future cash flows has occurred. The determination of the amount of other-than-temporary impairments is based upon the Company’s quarterly evaluation and assessment of known and inherent risks associated with the respective asset class. Such evaluations and assessments are revised as conditions change and new information becomes available.
Additionally, our management considers a wide range of factors about the security issuer and uses its reasonable judgment in evaluating the cause of the decline in the estimated fair value of the security and in assessing the prospects for recovery. Inherent in management’s evaluation of the security are assumptions and estimates about the operations of the issuer and its future earnings potential. Impairments to the carrying value of our investment securities may need to be taken in the future, which wouldcould have a material adverse effect on our results of operations and financial condition.
Changes in the policies of monetary authorities and other government action could adversely affect profitability.
The results of operations of the Company are affected by credit policies of monetary authorities, particularly the Board of Governors of the Federal Reserve System, which we refer to as the Federal Reserve Board. The instruments of monetary policy employed by the Federal Reserve Board include open market operations in U.S. government securities, changes in the discount rate or the federal funds rate on bank borrowings and changes in reserve requirements against bank deposits. In view of changing conditions in the national economy and monetary policy, we cannot predict the impact of future changes in interest rates, deposit levels, loan demand or the Company’s business and earnings. Furthermore, the actions of the United States government and other governments in responding to developing situations or implementing new fiscal or trade policies may result in currency fluctuations, exchange controls, market disruption and other unanticipated economic effects. Such actions could have an adverse effect on our results of operations and profitability.
We are subject to regulation by various Federal and State entities.
The Company and The First are subject to extensive regulation by various regulatory agencies, including the Federal Reserve Board, the Federal Deposit Insurance Corporation,FDIC, the OCC the Consumer Financial Protection Bureau and the SEC.CFPB. SeeSupervision and Regulation above for more information. New regulations issued by these agencies may adversely affect our ability to carry on our business activities. The Company is subject to various Federal and state laws and certain changes in these laws and regulations may adversely affect operations.
The Company and The First are also subject to the accounting rules and regulations of the SEC and the Financial Accounting Standards Board. Changes in accounting rules could adversely affect the reported financial statements or results of operations of the Company and may also require extraordinary efforts or additional costs to implement. Any of these laws or regulations may be modified or changed from time to time, and we cannot be assured that such modifications or changes will not adversely affect the Company.
The full impact of the Tax Cuts and Jobs Act (the "Tax Act") on us and our customers is unknown at present, creating uncertainty and risk related to our customers' future demand for credit and our future results.
Increased economic activity expected to result from the decrease in tax rates on businesses generally could spur additional economic activity that would encourage additional borrowing. At the same time, some customers may elect to use their additional cash flow from lower taxes to fund their existing levels of activity, decreasing borrowing needs. The elimination of the federal income tax deductibility of business interest expense for a significant number of our customers effectively increases the cost of borrowing and makes equity or hybrid funding relatively more attractive. This could have a long-term negative impact on business customer borrowing. We anticipate a significantrealized an increase in our after-tax net income available to stockholders in 2018, andhowever there is no guarantee that future years as a result ofyears' results will have the decrease in our effective tax rate.same benefit. Some or all of this benefit could be lost to the extent that the banks and financial services companies we compete with elect to lower interest rates and fees and we are forced to respond in order to remain competitive. Additionally, the tax benefits could be repealed as a result of future regulatory actions. There is no assurance that presently anticipated benefits of the Tax Act for the Company will be realized.
We may be required to pay additional insurance premiums to the FDIC, which could negatively impact earnings.
Pursuant to the Dodd-Frank Act, the limit on FDIC coverage has been permanently increased to $250,000, causing the premiums assessed to The First by the FDIC to increase. Depending upon any future losses that the FDIC insurance fund may suffer, there can be no assurance that there will not be additional premium increases in order to replenish the fund. The FDIC may need to set a higher base rate schedule or impose special assessments due to future financial institution failures and updated failure and loss projections. Potentially higher FDIC assessment rates than those currently projected could have an adverse impact on our results of operations.
We are subject to industry competition which may have an adverse impact upon our success.
The profitability of the Company depends on its ability to compete successfully with other financial services companies. We operate in a highly competitive financial services environment. Certain competitors are larger and may have more resources than we do. We face competition in our regional market areas from other commercial banks, savings institutions, credit unions, internet banks, finance companies, mutual funds, insurance companies, brokerage and investment banking firms, and other financial intermediaries that offer similar services. Some of the nonbank competitors are not subject to the same extensive regulations that govern the Company or The First and may have greater flexibility in competing for business.
Many of these competitors also have broader geographic markets and substantially greater resources and lending limits than The First and offer certain services such as trust banking that The First does not currently provide. In addition, many of these competitors have numerous branch offices located throughout the extended market areas of The First that may provide these competitors with an advantage in geographic convenience that The First does not have at present. Currently there are numerous other commercial banks, savings institutions, and credit unions operating in The First's primary service area.
We also compete with numerous financial and quasi-financial institutions for deposits and loans, including providers of financial services over the internet. Recent technology advances and other changes have allowed parties to effectuate financial transactions that previously required the involvement of banks. For example, consumers can maintain funds in brokerage accounts or mutual funds that would have historically been held as bank deposits. Consumers can also complete transactions such as paying bills and transferring funds directly without the assistance of banks. The process of eliminating banks as intermediaries, known as “disintermediation,” could result in the loss of fee income, as well as the loss of customer deposits and the related income generated from those deposits. The loss of these revenue streams and access to lower cost deposits as a source of funds could have a material adverse effect on our financial condition and results of operations.
Our information systems may experience an interruption or breach in security.
We rely heavily on communications and information systems to conduct our business. Any failure, interruption or breach in security of these systems could result in failures or disruptions in our customer relationship management, deposit, loan and other systems. While we have policies and procedures designed to prevent or limit the effect of the failure, interruption or security breach of our information systems, there can be no assurance that we can prevent any such failures, interruptions, cyber security breaches or other security breaches or, if they do occur, that they will be adequately addressed. The occurrenceWe have been, and likely will continue to be, subject to various forms of any failures, interruptions orexternal security breaches, which may include computer hacking, acts of vandalism or theft, malware, computer viruses or other malicious codes, phishing, employee error or malfeasance, catastrophes, unforeseen events or other cyber-attacks. To date, we have seen no material impact on our business or operations from these attacks or events. Any future significant compromise or breach of our information systems data security, whether external or internal, or misuse of customer, associate, supplier or Company datacould damage our reputation, result in a loss of customer business, subject us to additional regulatory scrutiny, or expose us to civil litigation and possible financial liability, any of which could have a material adverse effect on our financial condition and results of operations. In addition, as the regulatory environment related to information security, data collection and use, and privacy becomes increasingly rigorous, with new and constantly changing requirements applicable to our business, compliance with those requirements could also result in additional costs.
Natural disasters, public health emergencies, acts of war or terrorism and other external events could affect our ability to operate.
Our market areas are susceptible to natural disasters such as hurricanes and tornados. Natural disasters can disrupt operations, result in damage to properties that may be serving as collateral for our loan assets and negatively affect the local economies in which we operate. Climate change may be increasing the nature, severity and frequency of adverse weather conditions, making the impact from these types of natural disasters on our customers or us worse. We cannot predict whether or to what extent damage caused by future hurricanes, tornados or other natural disasters will affect operations or the economies in our market areas, but such weather events could cause a decline in loan originations, a decline in the value or destruction of properties serving as collateral for our loans and an increase in the risk of delinquencies, foreclosures or loan losses.
In addition, health emergencies, disease pandemics, acts of war or terrorism and other external events could cause disruption in our operations. The occurrence of any of these events could have a material adverse effect on our business, financial condition and results of operations.
We must maintain effective internal control over financial reporting.
Management regularly monitors, reviews and updates our disclosure controls and procedures, including our internal control over financial reporting. Any system of controls, however well designed and operated, is based in part on certain assumptions and can provide only reasonable, assurances that the controls will be effective. Any failure or circumvention of our controls and procedures or failure to comply with regulations related to controls and procedures could have a material adverse effect on our business, results of operations and financial condition.
Failure to achieve and maintain an effective internal control environment could prevent us from accurately reporting our financial results, preventing or detecting fraud, or providing timely and reliable financial information pursuant to our reporting obligations, which could have a material adverse effect on our business, financial condition and results of operations.
Our business is susceptible to fraud.
Our business exposes us to fraud risk from our loan and deposit customers, the parties they do business with, as well as from our employees, contractors and vendors. We rely on financial and other data from new and existing customers which could turn out to be fraudulent when accepting such customers, executing their financial transactions and making and purchasing loans and other financial assets. In times of increased economic stress we are at increased risk of fraud losses. We believe we have underwriting and operational controls in place to prevent or detect such fraud, but we cannot provide assurance that these controls will be effective in detecting fraud or that we will not experience fraud losses or incur costs or other damage related to such fraud, at levels that adversely affect our financial results or reputation. Our lending customers may also experience fraud in their businesses which could adversely affect their ability to repay their loans or make use of our services. Our exposure and the exposure of our customers to fraud may increase our financial risk and reputation risk as it may result in unexpected loan losses that exceed those that have been provided for in our allowance for loan losses.
We may not be able to attract and retain skilled personnel.
Our success depends, in large part, on our ability to attract and retain key personnel. Competition for the best personnel in most activities we engage in can be intense, and we may not be able to hire personnel or to retain them. The unexpected loss of services of one or more of our key personnel could have a material adverse impact on our business because of theirthe difficulty of promptly finding qualified replacement personnel with comparable skills, knowledge of our market, relationships in the communities we serve, and years of industry experience and the difficulty of promptly finding qualified replacement personnel.experience. Although we have employment agreements with certain of our executive officers, there is no guarantee that these officers and other key personnel will remain employed with the Company.
The failure of other financial institutions could adversely affect the Company.
Our ability to engage in routine funding transactions could be adversely affected by the actions and potential failures of other financial institutions. Financial institutions are interrelated as a result of trading, clearing, counterparty and other relationships. As a result, defaults by, or even rumors or concerns about, one or more financial institutions or the financial services industry generally have led tocould negatively impact market-wide liquidity problems and could lead to losses or defaults by the Company or by other institutions.
Merger-Related Risks
We may engage in acquisitions of other businesses from time to time, which may adversely impact our results.
From time to time, we may engage in acquisitions of other businesses. Difficulty in integrating an acquired business or company may cause us not to realize expected revenue increases, cost savings, increases in geographic or product presence, or other anticipated benefits from any acquisition. The integration could result in higher than expected deposit attrition (run-off), loss of key employees, disruption of the Company’s business or the business of the acquired company, or otherwise adversely affect the Company’s ability to maintain relationships with customers and employees or achieve the anticipated benefits of the acquisition. The acquired companies may also have legal contingencies, beyond those that we are aware of, that could result in unexpected costs. The Company may need to make additional investment in equipment and personnel to manage higher asset levels and loan balances as a result of any significant acquisition, which may adversely impact earnings.
We may fail to realize the anticipated cost savings and other financial benefits of recent acquisitions in the First Community Bank Acquisition and Sunshine Community Bank acquisition on the anticipated schedule, iftimeframe we expect, or at all..
The Company completed the acquisition of two regional banks during 2019, including Florida Parishes Bank on March 2, 2019 and First First CommunityFlorida Bank on November 1, 2019, resulting in each bank merging with and Sunshine Community Bank have historically operated independently. The success of the mergers of First Community Bank and Sunshine Community Bank into The First will depend, in part, on our abilityFirst. The Company has also entered into an Agreement and Plan of Merger dated December 18, 2019, pursuant to successfully combinewhich the businesses of The First, First Community Bank,Company would acquire Southwest Georgia Financial Corporation and Sunshine Communityits banking subsidiary, Southwest Georgia Bank. To realize these anticipated benefits, The First expects to integrate First Community Bank’s and Sunshine Community Bank’s businesses with its own businesses. We may face significant challenges in integrating both First Community Bank’s and Sunshine Community Bank’s operations into our operations in a timely and efficient manner and in retaining key personnel from these two banks. Achieving the anticipated cost savings and financial benefits of the mergers will depend, in part, on whether we can successfully integrate these businesses.businesses with and into the business of The First. It is possible that the integration process could result in the loss of key employees, the disruption of each company’s ongoing businesses or inconsistencies in standards, controls, procedures, and policies that adversely affect our ability to maintain relationships with clients, customers, depositors, and employees or to achieve the anticipated benefits of the merger.mergers. In addition, the integration of certain operations following the mergers has required and will continue to require the dedication of significant management resources, which may temporarily distract management’s attention from the day-to-day business of the combined company. Any inability to realize the full extent of, or any of, the anticipated cost savings and financial benefits of the mergers, as well as any delays encountered in the integration process, could have an adverse effect on the business and results of operations of the combined company.
In addition, Sunshine’s shareholders must approve the transaction before the acquisition of Sunshine Community Bank can be completed, and such shareholder approval may not be received. Failure to complete the acquisition couldWe have a negative impact on our reputationincurred and may affect the market price of our common stock.
We willcontinue to incur significant transaction and merger-related costs in connection with the acquisition of Southwest and First Community Bank and the pending acquisition of Sunshine and Sunshine Community Bank.our recent acquisitions.
We have incurred and expectmay continue to incur a number of non-recurring costs associated with theour recent acquisitions and our pending acquisition of Southwest and First Community Bank and the pending acquisition of Sunshine and Sunshine Community Bank.Georgia Financial Corporation. These costs and expenses include fees paid to financial, legal and accounting advisors, severance, retention bonus and other potential employment-related costs, filing fees, printing expenses and other related charges. Some of these costs are payable by us regardless of whether the acquisition is completed. There are also a large number of processes, policies, procedures, operations, technologies and systems that must be integrated in connection with the merger and the integration of these companies’ businesses. While we have assumed that a certain level of expenses would be incurred in connection with the acquisitions, there are many factors beyond our control that could affect the total amount or the timing of the integration and implementation expenses.
There may also be additional unanticipated significant costs in connection with the acquisitions that we may not recoup. These costs and expenses could reduce the realization of efficiencies, strategic benefits and additional income we expect to achieve from the acquisition.acquisitions. Although we expect that these benefits will offset the transaction expenses and implementation costs over time, the net benefit may not be achieved in the near term or at all.all, which could have a material adverse impact on our financial results.
With the completion of the acquisitions of First Community Bank and Sunshine Community Bank, the market price of our common stockWe may be affected by factors different from those historically affecting our independent operations through The First.incur impairment to goodwill.
The historic businesses of each of The First, First Community Bank, and Sunshine Community Bank differ in important respects, and accordingly, the results of operations of the combined company and the market price of the combined company’s shares of common stock may be affected by factors different from those historically affecting the independent results of operations of The First, First Community Bank, and Sunshine Community Bank.
We review our goodwill at least annually. Significant negative industry or economic trends, reduced estimates of future cash flows or disruptions to our business, could indicate that goodwill might be impaired. Our valuation methodology for assessing impairment requires management to make judgements and assumptions based on historical experience and to rely on projections of future operating performance. We operate in a competitive environment and projections of future operating results and cash flows may vary significantly from actual results. In addition, if our analysis results is an impairment to our goodwill, we would be required to record a non-cash charge to earnings in our financial statements during the period in which such impairment is determined to exists. Any such charge could have a material adverse effect on our results of operations.
Risks Relating to Our Securities
The price of our common stock may fluctuate significantly, which may make it difficult for investors to resell shares of common stock at a time or price they find attractive.
Our stock price may fluctuate significantly as a result of a variety of factors, many of which are beyond our control. In addition to those described in “Special Cautionary Notice Regarding Forward-Looking Statements,” these factors include, among others:
| · | actual or anticipated quarterly fluctuations in our operating results, financial condition or asset quality; |
| · | changes in financial estimates or the publication of research reports and recommendations by financial analysts or actions taken by rating agencies with respect to us or other financial institutions; |
| · | failure to declare dividends on our common stock from time to time; |
| · | failure to meet analysts’ revenue or earnings estimates; |
| · | failure to integrate acquisitions or realize anticipated benefits from acquisitions; |
| · | strategic actions by us or our competitors, such as acquisitions, restructurings, dispositions or financings; |
| · | fluctuations in the stock price and operating results of our competitors or other companies that investors deem comparable to us; |
| · | future sales of our common stock or other securities; |
| · | proposed or final regulatory changes or developments; |
| · | anticipated or pending regulatory investigations, proceedings, or litigation that may involve or affect us; |
| · | reports in the press or investment community generally relating to our reputation or the financial services industry; |
| · | domestic and international economic and political factors unrelated to our performance; |
| · | general market conditions and, in particular, developments related to market conditions for the financial services industry; |
| · | adverse weather conditions, including floods, tornadoes and hurricanes; |
| · | public health emergencies, including disease pandemics; and |
| · | geopolitical conditions such as acts or threats of terrorism or military conflicts. |
In addition, in recent years, the stock market in general has experienced extreme price and volume fluctuations. This volatility has had a significant effect on the market price of securities issued by many companies, including for reasons unrelated to their operating performance. These broad market fluctuations may adversely affect our stock price, notwithstanding our operating results. We expect that the market price of our common stock will continue to fluctuate and there can be no assurances about the levels of the market prices for our common stock.
General market fluctuations, industry factors and general economic and political conditions and events, such as economic slowdowns or recessions, interest rate changes or credit loss trends, could also cause our stock price to decrease regardless of operating results.
We may need to rely on the financial markets to provide needed capital.
Our common stock is listed and traded on the Nasdaq stock market. Although we anticipate that our capital resources will be adequate for the foreseeable future to meet our capital requirements, at times we may depend on the liquidity of the capital markets to raise additional capital. Our historical ability to raise capital through the sale of capital stock and debt securities may be affected by economic and market conditions or regulatory changes that are beyond our control. Adverse changes in our operating performance or financial condition could make raising additional capital difficult or more expensive or limit our access to customary sources of funding. If the market should fail to operate, or if conditions in the capital markets are adverse, our efforts to raise capital could require the issuance of securities at times and with maturities, conditions and rates that are disadvantageous, and which could have a dilutive impact on our current stockholders. Should these risks materialize, the ability to further expand our operations through organic or acquisitive growth may be limited.
Securities issued by the Company, including the Company’s common stock, are not FDIC insured.
Securities issued by the Company, including the Company’s common stock, are not savings or deposit accounts or other obligations of any bank and are not insured by the FDIC, the Deposit Insurance Fund, or any other governmental agency or instrumentality, or any private insurer, and are subject to investment risk, including the possible loss of principal.
Anti-takeover laws and certain agreements and charter provisions may adversely affect share value.the price of our common stock.
Certain provisions of state and federal law and our articles of incorporation may make it more difficult for someone to acquire control of the Company. Under federal law, subject to certain exemptions, a person, entity, or group must notify the federal banking agencies before acquiring 10% or more of the outstanding voting stock of a bank holding company, including the Company’s shares. Banking agencies review the acquisition to determine if it will result in a change of control. The banking agencies have 60 days to act on the notice, and take into account several factors, including the resources of the acquiror and the antitrust effects of the acquisition. There also are Mississippi statutory provisions and provisions in our articles of incorporation that may be used to delay or block a takeover attempt. As a result, these statutory provisions and provisions in our articles of incorporation could result in the Company being less attractive to a potential acquiror.
The trading volume in our common stock is less than that of other larger financial services companies.
Although our common stock is listed for trading on the Nasdaq Global Market, the trading volume for our common stock is low relative to other larger financial services companies, and you are not assured liquidity with respect to transactions in our common stock. A public trading market having the desired characteristics of depth, liquidity and orderliness depends on the presence in the marketplace of willing buyers and sellers of our common stock at any given time. This presence depends on the individual decisions of investors and general economic and market conditions over which we have no control. Given the lower trading volume of our common stock, significant sales of our common stock, or the expectation of these sales, could cause our stock price to fall.
You may not receive dividends on our common stock.
Although we have historically declared quarterly cash dividends on our common stock, we are not required to do so and may reduce or cease to pay common stock dividends in the future. If we reduce or cease to pay common stock dividends, the market price of our common stock could be adversely affected.
The principal source of funds from which we pay cash dividends are the dividends received from The First. Federal banking laws and regulations restrict the amount of dividends and loans a bank may make to its parent company. Under certain conditions, dividends paid to us by The First are subject to approval by the OCC. A national bank may not pay dividends from its capital. All dividends must be paid out of undivided profits then on hand, after deducting expenses, including reserves for losses and bad debts. In addition, a national bank is prohibited from declaring a dividend on its shares of common stock until its surplus equals its stated capital, unless the bank has transferred to surplus no less than one-tenth of its net profits of the preceding two consecutive half-year periods (in the case of an annual dividend). The approval of the OCC is required if the total of all dividends declared by a national bank in any calendar year exceeds the total of its net profits for that year combined with its retained net profits for the preceding two years, less any required transfers to surplus. In addition, under The Federal Deposit Insurance Corporation Improvement Act of 1991, the banksFDICIA, a bank may not pay a dividend if, after paying the dividend, the bank would be undercapitalized.
If we fail to pay dividends, capital appreciation, if any, of our common stock may be the sole opportunity for gains on an investment in our common stock. In addition, in the event The First becomes unable to pay dividends to us, we may not be able to service our debt or pay our other obligations or pay dividends on our common stock and preferred stock. Accordingly, our inability to receive dividends from The First could also have a material adverse effect on our business, financial condition and results of operations and the value of your investment in our common stock.
ITEM 1B. UNRESOLVED STAFF COMMENTS
None
24
Our company’sCompany’s main office, which is the holding company headquarters, is located at 6480 U.S. HwyHighway 98 West in Hattiesburg, Mississippi. As of year-end, we had 4373 full service banking and financial servicesservice offices, and one motor bank facility as well asand four loan production offices. We lease the Hardy Court Branch, the Gulfport Downtown Branch, the Pascagoula Branch, the Ocean Springs Branch, the Fairhope Branch, the Bayley’s Corner Branch, the Theodore Branch, the Dauphin Island Branch, the Baton Rouge Branch,offices across Mississippi, Alabama, Florida, Georgia and the Pensacola Downtown Branch, which comprise ten of our full services banking and financial services offices. We also lease the Brandon, the Madison, the Ocean Springs and the Slidell loan production offices.Louisiana. Management ensures that all properties, whether owned or leased, are maintained in suitable condition.
The following table sets forth banking office locations that are leased by the Company.
From time to time the Company and/or The First may be named as defendants in various lawsuits arising out of the normal course of business. At present, the Company is not aware of any legal proceedings that it anticipates may materially adversely affect its business.
ITEM 4. MINE SAFETY DISCLOSURES
Not applicable.
ITEM 5. MARKET FOR REGISTRANT’S COMMON EQUITY, RELATED STOCKHOLDER MATTERS AND ISSUER PURCHASES OF EQUITY SECURITIES
Market Information
Our common stock trades on the Nasdaq Global Market under the ticker symbol “FBMS”. The following table sets forth the high and low sales price of the Company’s common stock as reported on the NASDAQ Global Market. These prices do not reflect retail mark-ups, mark-downs or commissions.
| Cash | ||||||||||||||
| High | Low | Dividends | ||||||||||||
| Sale | Sale | Paid | ||||||||||||
| 2017 | 4th quarter | $ | 34.35 | $ | 29.95 | $ | 0.0375 | |||||||
| 3rd quarter | 30.35 | 26.35 | 0.0375 | |||||||||||
| 2nd quarter | 28.65 | 27.225 | 0.0375 | |||||||||||
| 1st quarter | 30.60 | 27.125 | 0.0375 | |||||||||||
| 2016 | 4th quarter | $ | 28.50 | $ | 17.10 | $ | 0.0375 | |||||||
| 3rd quarter | 19.55 | 16.99 | 0.0375 | |||||||||||
| 2nd quarter | 17.72 | 15.50 | 0.0375 | |||||||||||
| 1st quarter | 18.50 | 15.32 | 0.0375 | |||||||||||
There were approximately 1,9612,611 record holders of the Company’s common stock at March 13, 20186, 2020 and 12,339,49218,851,955 shares outstanding.
Payment of Dividends
The principal sources of funds to the Company to pay dividends are the dividends received from The First, National Banking Association, Hattiesburg, Mississippi. Consequently, dividends are dependent upon The First’s earnings, capital needs, regulatory policies, as well as statutory and regulatory limitations. Federal and state banking laws and regulations restrict the amount of dividends and loans a bank may make to its parent company. Approval by the Company’s regulators is required if the total of all dividends declared in any calendar year exceed the total of its net income for that year combined with its retained net income of the preceding two years.
Issuer Purchases of Equity Securities
The following table sets forth shares of our common stock we repurchased during the period ended December 31, 2017.2019.
| Current Program | ||||||||||||||||
Period |
Total |
Average |
Total Number of |
Maximum May Yet Be Purchased | ||||||||||||
| 1st Quarter 2017 | 10,403 | $ | 27.65 | - | - | |||||||||||
| 2nd Quarter 2017 | 1,464 | 28.65 | - | - | ||||||||||||
| 3rd Quarter 2017 | - | - | - | - | ||||||||||||
| 4th Quarter 2017 | - | - | - | - | ||||||||||||
| Total | 11,867 | (a) | $ | 28.15 | - | - | ||||||||||
| Period | Total Number of Shares Purchased | Average Price Paid Per Share | Total Number of Shares Purchased as Part of Publicly Announced Plans or Programs | Maximum Number of Shares that May Yet Be Purchased Under the Plans or Programs | ||||||||||||
| 1st Quarter 2019 | - | $ | - | - | - | |||||||||||
| 2nd Quarter 2019 | 143,566 | 31.09 | 143,566 | 498,336 | ||||||||||||
| 3rd Quarter 2019 | 13,873 | 31.13 | 13,873 | 485,948 | ||||||||||||
| 4th Quarter 2019 | 12,667 | (a) | 32.64 | 10,749 | 468,050 | |||||||||||
| Total | 170,106 | $ | 31.62 | 168,188 | ||||||||||||
(a) Includes 1,918 shares withheld by the Company in order to satisfy employee tax obligations for vesting of restricted stock awards.
Stock Performance Graph
The following performance graph and related information are neither “soliciting material” nor “filed’ with the SEC, nor shall such information be incorporated by reference into any future filings under the Securities Act of 1933 or the Securities Exchange Act of 1934, each as amended, except to the extent the Company specifically incorporates it by reference to such filing.
The performance graph compares the cumulative five-year shareholder return on the Company’s common stock, assuming an investment of $100 on December 31, 20112014 and the reinvestment of dividends thereafter, to that of the common stocks of United States companies reported in the Nasdaq Composite-Total Returns Index and the common stocks of the Nasdaq OMX Banks Index. The Nasdaq OMX Banks Index contains securities of Nasdaq- listed companies classified according to the Industry Classification Benchmark as Banks.banks. They include banks pro-vidingpro- viding a broad range of financial services, including retail banking, loans and money transmissions.
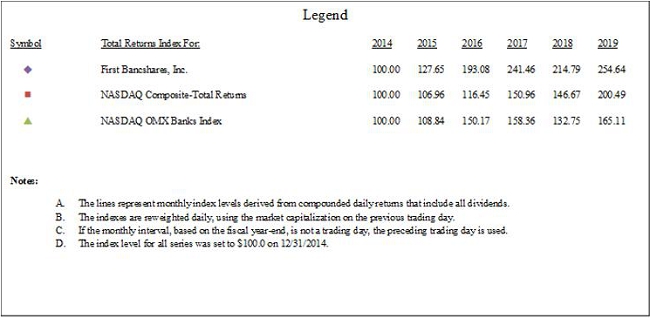

26
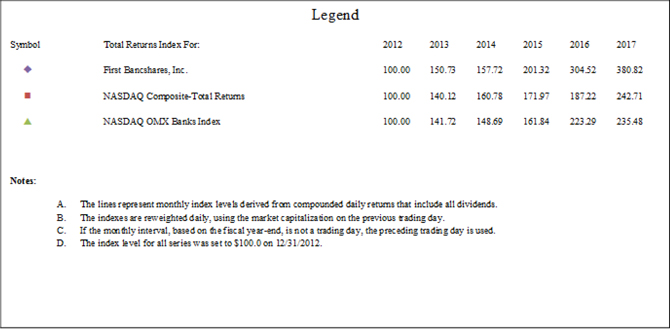
The following unaudited consolidated financial data is derived from The First Bancshares’ audited consolidated financial statements as of and for the five years ended December 31, 2017.2019.
SELECTED CONSOLIDATED FINANCIAL HIGHLIGHTS
(Dollars In Thousands, Except Per Share Data)$ in thousands, except per share data)
| December 31, | December 31, | |||||||||||||||||||||||||||||||||||||||
| 2017 | 2016 | 2015 | 2014 | 2013 | 2019 | 2018 | 2017 | 2016 | 2015 | |||||||||||||||||||||||||||||||
| Earnings: | ||||||||||||||||||||||||||||||||||||||||
| Net interest income | $ | 59,160 | $ | 40,289 | $ | 36,994 | $ | 33,398 | $ | 28,401 | $ | 121,806 | $ | 84,887 | $ | 59,160 | $ | 40,289 | $ | 36,994 | ||||||||||||||||||||
| Provision for loan Losses | 506 | 625 | 410 | 1,418 | 1,076 | |||||||||||||||||||||||||||||||||||
| Provision for loan losses | 3,738 | 2,120 | 506 | 625 | 410 | |||||||||||||||||||||||||||||||||||
| Non-interest income | 14,363 | 11,247 | 7,588 | 7,803 | 7,083 | 26,947 | 20,561 | 14,363 | 11,247 | 7,588 | ||||||||||||||||||||||||||||||
| Non-interest expense | 55,446 | 36,862 | 32,161 | 30,734 | 28,165 | 88,569 | 76,311 | 55,446 | 36,862 | 32,161 | ||||||||||||||||||||||||||||||
| Net income | 10,616 | 10,119 | 8,799 | 6,614 | 4,639 | 43,745 | 21,225 | 10,616 | 10,119 | 8,799 | ||||||||||||||||||||||||||||||
| Net income applicable to common Stockholders | 10,616 | 9,666 | 8,456 | 6,251 | 4,215 | |||||||||||||||||||||||||||||||||||
| Net income available to common stockholders | 43,745 | 21,225 | 10,616 | 9,666 | 8,456 | |||||||||||||||||||||||||||||||||||
| Per common share data: | ||||||||||||||||||||||||||||||||||||||||
| Basic net income per Share | $ | 1.12 | $ | 1.78 | $ | 1.57 | $ | 1.20 | $ | .98 | ||||||||||||||||||||||||||||||
| Diluted net income per Share | 1.11 | 1.57 | 1.55 | 1.19 | .96 | |||||||||||||||||||||||||||||||||||
| Basic net income per share | $ | 2.57 | $ | 1.63 | $ | 1.12 | $ | 1.78 | $ | 1.57 | ||||||||||||||||||||||||||||||
| Diluted net income per share | 2.55 | 1.62 | 1.11 | 1.57 | 1.55 | |||||||||||||||||||||||||||||||||||
| Per share data: | ||||||||||||||||||||||||||||||||||||||||
| Basic net income per share | $ | 1.12 | $ | 1.86 | $ | 1.64 | $ | 1.27 | $ | 1.07 | $ | 2.57 | $ | 1.63 | $ | 1.12 | $ | 1.86 | $ | 1.64 | ||||||||||||||||||||
| Diluted net income per share | 1.11 | 1.64 | 1.62 | 1.25 | 1.06 | 2.55 | 1.62 | 1.11 | 1.64 | 1.62 | ||||||||||||||||||||||||||||||
| Selected Year End Balances: | ||||||||||||||||||||||||||||||||||||||||
| Selected year end balances: | ||||||||||||||||||||||||||||||||||||||||
| Total assets | $ | 1,813,238 | $ | 1,277,367 | $ | 1,145,131 | $ | 1,093,768 | $ | 940,890 | $ | 3,941,863 | $ | 3,003,986 | $ | 1,813,238 | $ | 1,277,367 | $ | 1,145,131 | ||||||||||||||||||||
| Securities | 372,862 | 255,799 | 254,959 | 270,174 | 258,023 | 791,777 | 514,928 | 372,862 | 255,799 | 254,959 | ||||||||||||||||||||||||||||||
| Loans, net of allowance | 1,221,808 | 865,424 | 769,742 | 700,540 | 577,574 | 2,597,260 | 2,055,195 | 1,221,808 | 865,424 | 769,742 | ||||||||||||||||||||||||||||||
| Deposits | 1,470,565 | 1,039,191 | 916,695 | 892,775 | 779,971 | 3,076,533 | 2,457,459 | 1,470,565 | 1,039,191 | 916,695 | ||||||||||||||||||||||||||||||
| Stockholders’ equity | 222,468 | 154,527 | 103,436 | 96,216 | 85,108 | 543,658 | 363,254 | 222,468 | 154,527 | 103,436 | ||||||||||||||||||||||||||||||
| ITEM 7. MANAGEMENT’S DISCUSSION AND ANALYSIS OF FINANCIAL CONDITION AND RESULTS OF OPERATIONS |
The following provides a narrative discussion and analysis of The First Bancshares’ financial condition and results of operations for the years ended December 31, 2017, 2016,2019, 2018, and 2015.2017. This discussion should be read in conjunction with the consolidated financial statements and the supplemental financial data included in Part II. Item 8.-Financial Statements and Supplementary Data – included elsewhere in this report.
Critical Accounting Policies
In the preparation of the Company's consolidated financial statements, certain significant amounts are based upon judgment and estimates. The most critical of these is the accounting policy related to the allowance for loan losses. The allowance is based in large measure upon management's evaluation of borrowers' abilities to make loan payments, local and national economic conditions, and other subjective factors. If any of these factors were to deteriorate, management would update its estimates and judgments which may require additional loss provisions.
Effective January 1, 2020, the Company adoptedASU 2016-13, Financial Instruments – Measurement of Current Expected Credit Losses on Financial Instruments (CECL),which will modify the accounting for the allowance for loan losses from an incurred loss model to an expected loss model, as discussed more fully under “Part II – Item 8. Financial Statements and Supplementary Data – Note B – Summary of Significant Accounting Policies” of this report.
Companies are required to perform periodic reviews of individual securities in their investment portfolios to determine whether decline in the value of a security is other than temporary. A review of other-than-temporary impairment requires companies to make certain judgments regarding the materiality of the decline, its effect on the financial statements and the probability, extent and timing of a valuation recovery and the company’s intent and ability to hold the security. Pursuant to these requirements, Management assesses valuation declines to determine the extent to which such changes are attributable to fundamental factors specific to the issuer, such as financial condition, business prospects or other factors or market-related factors, such as interest rates. Declines in the fair value of securities below their cost that are deemed to be other-than-temporary are recorded in earnings as realized losses.
Goodwill is assessed for impairment both annually and when events or circumstances occur that make it more likely than not that impairment has occurred. As part of its testing, the Company first assesses qualitative factors to determine whether it is more likely than not that the fair value of a reporting unit is less than its carrying amount. If the Company determines the fair value of a reporting unit is less than its carrying amount using these qualitative factors, the Company then compares the fair value of goodwill with its carrying amount, and then measures impaired loss by comparing the implied fair value of goodwill with the carrying amount of that goodwill. Other intangibles are also assessed for impairment, both annually and when events or circumstances occur, that make it more likely than not that impairment has occurred. No impairment was indicated when the annual test was performed in December, 2017.2019.
Overview
The First Bancshares, Inc. (the Company) was incorporated on June 23, 1995, and serves as a bank holding company for The First, A National Banking Association (“The First”), located in Hattiesburg, Mississippi. The First began operations on August 5, 1996, from its main office in the Oak Grove community, which is now incorporated within the city of Hattiesburg. Currently, the First has 5778 locations in Mississippi, Louisiana, Alabama, Florida, Georgia and Florida.Louisiana. The Company and The First engage in a general commercial and retail banking business characterized by personalized service and local decision-making, emphasizing the banking needs of small to medium-sized businesses, professional concerns, and individuals.
The Company’s primary source of revenue is interest income and fees, which it earns by lending and investing the funds which are held on deposit. Because loans generally earn higher rates of interest than investments, the Company seeks to employ as much of its deposit funds as possible in the form of loans to individuals, businesses, and other organizations. To ensure sufficient liquidity, the Company also maintains a portion of its deposits in cash, government securities, deposits with other financial institutions, and overnight loans of excess reserves (known as “Federal Funds Sold”) to correspondent banks. The revenue which the Company earns (prior to deducting its overhead expenses) is essentially a function of the amount of the Company’s loans and deposits, as well as the profit margin (“interest spread”) and fee income which can be generated on these amounts.
Highlights for the year ended December 31, 20172019 include:
| · | On |
| · | On November 1, 2019, the Company closed its acquisition of FFB, parent company of First Florida Bank, headquartered in Destin, FL. The acquisition added 7 locations servicing the areas of Destin, Fort Walton, Crestview and Panama City, Florida. Systems integration was completed during the fourth quarter of 2019. |
| · | On December 18, 2019, the Company announced the signing of an Agreement and Plan of Merger with Southwest |
| · | Operating net earnings increased 59.9%, or $18.0 million for the fiscal year ended December 31, 2019, totaling $48.0 million as compared to $30.0 million for the fiscal year ended December 31, 2018. Operating net earnings for fiscal year 2019 excludes merger-related costs of $4.9 million, net of tax, and income in the form of financial assistance grant from the U. S. Department of Treasury of $0.7 million, net of tax. Operating net earnings for fiscal year 2018 excludes merger-related costs of $10.6 million, net of tax, income in the form of financial assistance grant from the U. S. Department of Treasury of $1.6 million, net of tax, and income from the sale of securities of $0.3 million, net of tax. Operating net earnings increased 59.9% to $48.0 million for the fiscal year ended December 31, 2019 as compared to fiscal year ended December 31, 2018. |
At December 31, 2017,2019, the Company had approximately $1.8$3.942 billion in total assets, an increase of $0.5 billion
$937.9 million compared to $1.3$3.004 billion at December 31, 2016.2018. Loans, net of the allowance for loan losses, increased to $1,221.8$2.597 billion at December 31, 2019 from $2.055 billion at December 31, 2018. Deposits increased to $3.077 billion at December 31, 2019 from $2.457 billion at December 31, 2018. Stockholders’ equity increased to $543.7 million at December 31, 20172019 from $865.4$363.3 million at December 31, 2016. Deposits increased to $1,470.6 million at December 31, 2017 from $1,039.2 million at December 31, 2106. Stockholders’ equity increased to $222.5 million at December 31, 2017 from approximately $154.5 million at December 31, 2016.2018. The acquisitionsaddition of IbervilleFlorida Parish Bank and Gulf Coast CommunityFirst Florida Bank which were completed on January 1, 2017,during 2019 contributed, $402.6at acquisition, $884.8 million, $237.3$492.0 million and $355.6$686.4 million in assets, loans, and deposits, respectively.
The First reported net income of $12.6$51.1 million, $11.6$26.9 million and $9.6$12.6 million for the years ended December 31, 2017, 2016,2019, 2018, and 2015,2017, respectively. For the years ended December 31, 2017, 20162019, 2018 and 2015,2017, the Company reported consolidated net income applicableavailable to common stockholders of $10.6$43.7 million, $9.7$21.2 million and $8.5$10.6 million, respectively. The following discussion should be read in conjunction with the “Selected Consolidated Financial Data” and the Company's consolidated financial statements and the Notes thereto and the other financial data included elsewhere.
Results of Operations
The following is a summary of the results of operations by The First for the years ended December 31, 2019, 2018, and 2017 2016, and 2015.($ in thousands).
| 2017 | 2016 | 2015 | ||||||||||||||||||||||
| (In thousands) | ||||||||||||||||||||||||
| 2019 | 2018 | 2017 | ||||||||||||||||||||||
| Interest income | $ | 66,061 | $ | 44,535 | $ | 40,196 | $ | 148,504 | $ | 99,967 | $ | 66,061 | ||||||||||||
| Interest expense | 6,049 | 4,094 | 3,022 | 21,805 | 11,637 | 6,049 | ||||||||||||||||||
| Net interest income | 60,012 | 40,441 | 37,174 | 126,699 | 88,330 | 60,012 | ||||||||||||||||||
| Provision for loan losses | 506 | 625 | 410 | 3,738 | 2,120 | 506 | ||||||||||||||||||
| Net interest income after provision for loan losses | 59,506 | 39,816 | 36,764 | 122,961 | 86,210 | 59,506 | ||||||||||||||||||
| Other income | 14,312 | 10,540 | 7,589 | |||||||||||||||||||||
| Non-interest income | 25,885 | 18,697 | 14,312 | |||||||||||||||||||||
| Other expense | 52,999 | 33,941 | 31,032 | |||||||||||||||||||||
| Non-interest expense | 82,751 | 70,724 | 52,999 | |||||||||||||||||||||
| Income tax expense | 8,177 | 4,766 | 3,701 | 14,992 | 7,288 | 8,177 | ||||||||||||||||||
| Net income | $ | 12,642 | $ | 11,649 | $ | 9,620 | $ | 51,103 | $ | 26,895 | $ | 12,642 | ||||||||||||
The following reconciles the above table to the amounts reflected in the consolidated financial statements of the Company at December 31, 2019, 2018, and 2017 2016, and 2015:($ in thousands):
| 2017 | 2016 | 2015 | ||||||||||||||||||||||
| (In thousands) | ||||||||||||||||||||||||
| 2019 | 2018 | 2017 | ||||||||||||||||||||||
| Net interest income: | ||||||||||||||||||||||||
| Net interest income of The First | $ | 60,012 | $ | 40,441 | $ | 37,174 | $ | 126,699 | $ | 88,330 | $ | 60,012 | ||||||||||||
| Intercompany eliminations | (852 | ) | (152 | ) | (180 | ) | (4,893 | ) | (3,443 | ) | (852 | ) | ||||||||||||
| $ | 59,160 | $ | 40,289 | $ | 36,994 | $ | 121,806 | $ | 84,887 | $ | 59,160 | |||||||||||||
| Net income applicable to common stockholders: | ||||||||||||||||||||||||
| Net income available to common shareholders: | ||||||||||||||||||||||||
| Net income of The First | $ | 12,642 | $ | 11,649 | $ | 9,620 | $ | 51,103 | $ | 26,895 | $ | 12,642 | ||||||||||||
| Net loss of the Company, excluding intercompany accounts | (2,026 | ) | (1,983 | ) | (1,164 | ) | ||||||||||||||||||
| Net loss of the Company | (7,358 | ) | (5,670 | ) | (2,026 | ) | ||||||||||||||||||
| $ | 10,616 | $ | 9,666 | $ | 8,456 | $ | 43,745 | $ | 21,225 | $ | 10,616 | |||||||||||||
Consolidated Net Income
The Company reported consolidated net income available to common stockholders of $43.7 million for the year ended December 31, 2019, compared to a consolidated net income of $21.2 million for the year ended December 31, 2018. Operating net earnings increased $18.0 million or 59.9% from $30.0 million for the twelve months ended December 31, 2018 to $48.0 million for the same period ended December 31, 2019. Operating net earnings excludes merger-related costs of $4.9 million, net of tax, and financial assistance grants of $697 thousand, net of tax, for the year ended December 31, 2019, and merger-related costs of $10.6 million, net of tax, financial assistance grants of $1.6 million, net of tax, and gain on sale of securities of $256 thousand, net of tax, for the year ended December 31, 2018. Net interest income increased $36.9 million in year-over-year comparison, primarily due to interest income earned on a higher volume of loans and securities. Non-interest income was $26.9 million at December 31, 2019, an increase of $6.4 million in year-over-year comparison consisting of increases in service charges on deposit accounts, interchange fee income, mortgage income, as well as other charges and fees. Non-interest expense was $88.6 million at December 31, 2019, an increase of $12.3 million in year-over-year comparison, of which $4.3 million is related to the operations of Southwest, Sunshine, FMB, FPB and FFB. The remaining increase of $8.0 million in expenses are related to increases in salaries and employee benefits of $3.7 million and increases in other expenses of $4.3 million.
The Company reported consolidated net income applicableavailable to common stockholders of $21.2 million for the year ended December 31, 2018, compared to a consolidated net income of $10.6 million for the year ended December 31, 2017, compared to a consolidated net income of $9.7 million for the year ended December 31, 2016, and consolidated net income of $8.5 million for the year ended December 31, 2015.2017. The increase in income was attributable to an increase in net interest income of $18.9$25.7 million or 46.8%43.5%, an increase in othernon-interest income of $3.1$6.2 million, or 27.7%43.2%, which was offset by an increase in othernon-interest expenses of $18.6$20.9 million or 50.4%37.6%. The increase in other expensenet interest income was primarily due to interest income earned on a chargehigher volume of $6.7loans as well as increased interest rates. Purchase accounting adjustments accounted for only $2.1 million of the increase. Non-interest increased as a result of increases in service charges on deposit accounts of $2.2 million and interchange fee income of $1.5 million on the increased deposit base related to the acquisitions, as well as the receipt of the Financial Assistance and Bank Enterprise Awards in the amount of $2.1 million. The increase in non-interest expense can be attributed to increases in salaries and benefits of $5.9 million related to the acquisitions completedof Southwest, Sunshine, and FMB, along with increased acquisition charges of $7.1 million. Increases in 2017occupancy, amortization of core deposit intangibles and a $2.1 million chargeother non-interest expense for the year-to-date period of 2018 were also attributable to income tax expense related to a reduction in our deferred tax asset resulting from the change in tax rate under the Tax Cuts and Jobs Act enacted in December of 2017.
acquisitions.
See Note C – Business Combinations in the accompanying notes to the consolidated financial statements included elsewhere in this report for more information on how the Company accounts for business combinations.
Consolidated Net Interest Income
The largest component of net income for the Company is net interest income, which is the difference between the income earned on assets and interest paid on deposits and borrowings used to support such assets. Net interest income is determined by the rates earned on the Company’s interest-earning assets and the rates paid on its interest-bearing liabilities, the relative amounts of interest-earning assets and interest-bearing liabilities, and the degree of mismatch and the maturity and repricing characteristics of its interest-earning assets and interest-bearing liabilities.
Consolidated net interest income was approximately $59.2$121.8 million for the year ended December 31, 2017,2019, as compared to $40.3$84.9 million for the year ended December 31, 2016.2018. This increase was the direct result of increased loan volumeshigher volume of loans and securities during 20172019 as compared to 2016.2018. Average interest-bearing liabilities for the year 20172019 were $1,247.8 million$2.3 billion compared to $911.0 million$1.7 billion for the year 2016.2018. At December 31, 2017,2019, the fully tax equivalent (“FTE”) net interest spread, which is the difference between the yield on earning assets and the rates paid on interest-bearing liabilities, was 3.72%3.75% compared to 3.63%3.75% at December 31, 2016. The net2018. Net interest margin, which is net interest income divided by average earning assets, was 3.83%4.02% for the year 20172019 compared to 3.71%3.94% for the year 2016.2018. At December 31, 2019, the FTE average yield on all earning assets increased 26 basis points to 4.89% compared to 4.63% at December 31, 2018. Rates paid on average interest-bearing liabilities increased to 0.55%1.14% for the year 20172019 compared to 0.47%0.88% for the year 2016.2018. Interest earned on assets and interest accrued on liabilities is significantly influenced by market factors, specifically interest rates as set by Federal agencies. Average loans comprised 74.1%76.5% of average earnings assets for the year 20172019 compared to 73.9%77.0% the year 2016.2018.
Consolidated net interest income was approximately $40.3$84.9 million for the year ended December 31, 2016,2018, as compared to $37.0$59.2 million for the year ended December 31, 2015.2017. This increase was the direct result of increased loan volumes during 20162018 as compared to 2015.2017, as well as increased interest rates. Average interest-bearing liabilities for the year ended December 31, 20162018 were $911.0 million$1.7 billion compared to $822.7 million$1.2 billion for the year ended December 31, 2015.2017. At December 31, 2016,2018, the net interest spread was 3.63%3.75% compared to 3.65%3.72% at December 31, 2015.2017. The net interest margin was 3.71%3.94% for the year 20162018 compared to 3.72%3.83% for the year 2015.2017. At December 31, 2018, the FTE average yield on all earning assets increased 36 basis points to 4.63% compared to 4.27% at December 31, 2017. Rates paid on average interest-bearing liabilities increased to 0.47%0.88% for the year 20162018 compared to 0.39%0.55% for the year 2015.2017. Average loans comprised 73.9%77.0% of average earnings assets for the year 20162018 compared to 71.7%74.1% for the year 2015.2017.
Average Balances, Income and Expenses, and Rates. The following tables depict, for the periods indicated, certain information related to the average balance sheet and average yields on assets and average costs of liabilities. Such yields are derived by dividing income or expense by the average balance of the corresponding assets or liabilities. Average balances have been derived from daily averages.
Average Balances, Income and Expenses, and Rates
| Years Ended December 31, | Years Ended December 31, | |||||||||||||||||||||||||||||||||||||||||||||||||||||||||||||||||||||||
| 2017 | 2016 | 2015 | 2019 | 2018 | 2017 | |||||||||||||||||||||||||||||||||||||||||||||||||||||||||||||||||||
| Average Balance | Income/ Expenses | Yield/ Rate | Average Balance | Income/ Expenses | Yield/ Rate | Average Balance | Income/ Expenses | Yield/ Rate | ||||||||||||||||||||||||||||||||||||||||||||||||||||||||||||||||
| (Dollars in thousands) | ||||||||||||||||||||||||||||||||||||||||||||||||||||||||||||||||||||||||
| ($ in thousands) | Average Balance | Income/ Expenses | Yield/ Rate | Average Balance | Income/ Expenses | Yield/ Rate | Average Balance | Income/ Expenses | Yield/ Rate | |||||||||||||||||||||||||||||||||||||||||||||||||||||||||||||||
| Assets | ||||||||||||||||||||||||||||||||||||||||||||||||||||||||||||||||||||||||
| Earning Assets | ||||||||||||||||||||||||||||||||||||||||||||||||||||||||||||||||||||||||
| Loans (1)(2) | $ | 1,168,882 | $ | 56,827 | 4.86 | % | $ | 820,881 | $ | 38,497 | 4.69 | % | $ | 730,326 | $ | 34,242 | 4.69 | % | $ | 2,341,202 | $ | 128,857 | 5.50 | % | $ | 1,678,746 | $ | 86,822 | 5.17 | % | $ | 1,168,882 | $ | 56,827 | 4.86 | % | ||||||||||||||||||||||||||||||||||||
| Securities (4) | 359,195 | 9,956 | 2.77 | % | 261,508 | 6,885 | 2.63 | % | 256,462 | 6,759 | 2.64 | % | 635,967 | 20,616 | 3.24 | % | 442,722 | 13,521 | 3.05 | % | 359,195 | 9,956 | 2.77 | % | ||||||||||||||||||||||||||||||||||||||||||||||||
| Federal funds sold (3) | 47,534 | 390 | .82 | % | 18,806 | 127 | .68 | % | 24,582 | 64 | .26 | % | ||||||||||||||||||||||||||||||||||||||||||||||||||||||||||||
| Other | 2,515 | 163 | .64 | % | 10,029 | 59 | .59 | % | 7,585 | 93 | 1.23 | % | ||||||||||||||||||||||||||||||||||||||||||||||||||||||||||||
| Federal funds sold and interest bearing deposits with other banks (3) | 84,171 | 264 | 0.31 | % | 58,900 | 631 | 1.07 | % | 50,049 | 553 | 1.10 | % | ||||||||||||||||||||||||||||||||||||||||||||||||||||||||||||
| Total earning assets | 1,578,126 | 67,336 | 4.27 | % | 1,111,224 | 45,568 | 4.10 | % | 1,018,955 | 41,158 | 4.04 | % | 3,061,340 | 149,737 | 4.89 | % | 2,180,368 | 100,974 | 4.63 | % | 1,578,126 | 67,336 | 4.27 | % | ||||||||||||||||||||||||||||||||||||||||||||||||
| Other | 185,277 | 117,735 | 103,237 | 401,614 | 248,289 | 185,277 | ||||||||||||||||||||||||||||||||||||||||||||||||||||||||||||||||||
| Total assets | $ | 1,763,403 | $ | 1,228,959 | $ | 1,122,192 | $ | 3,462,954 | $ | 2,428,657 | $ | 1,763,403 | ||||||||||||||||||||||||||||||||||||||||||||||||||||||||||||
| Liabilities | ||||||||||||||||||||||||||||||||||||||||||||||||||||||||||||||||||||||||
| Interest-bearing liabilities | $ | 1,247,823 | $ | 6,909 | .55 | % | $ | 911,037 | $ | 4,316 | .47 | % | $ | 822,708 | $ | 3,208 | .39 | % | $ | 2,344,755 | $ | 26,723 | 1.14 | % | $ | 1,712,255 | $ | 15,091 | 0.88 | % | $ | 1,247,823 | $ | 6,909 | 0.55 | % | ||||||||||||||||||||||||||||||||||||
| Demand deposits (1) | 318,339 | 191,998 | 196,284 | 327,805 | 254,118 | 318,339 | ||||||||||||||||||||||||||||||||||||||||||||||||||||||||||||||||||
| Other liabilities | 26,404 | 5,601 | 4,594 | 331,693 | 182,525 | 26,404 | ||||||||||||||||||||||||||||||||||||||||||||||||||||||||||||||||||
| Stockholders’ equity | 170,837 | 120,323 | 98,606 | 458,701 | 279,759 | 170,837 | ||||||||||||||||||||||||||||||||||||||||||||||||||||||||||||||||||
| Total liabilities and stockholders’ equity | $ | 1,763,403 | $ | 1,228,959 | $ | 1,122,192 | $ | 3,462,954 | $ | 2,428,657 | $ | 1,763,403 | ||||||||||||||||||||||||||||||||||||||||||||||||||||||||||||
| Net interest spread | 3.72 | % | 3.63 | % | 3.65 | % | 3.75 | % | 3.75 | % | 3.72 | % | ||||||||||||||||||||||||||||||||||||||||||||||||||||||||||||
| Net yield on interest-earning assets | $ | 60,427 | 3.83 | % | $ | 41,252 | 3.71 | % | $ | 37,950 | 3.72 | % | $ | 123,014 | 4.02 | % | $ | 85,883 | 3.94 | % | $ | 60,427 | 3.83 | % | ||||||||||||||||||||||||||||||||||||||||||||||||
_________________
| (1) | All loans and deposits were made to borrowers or received from depositors in the United States. Includes |
| (2) | Includes loan fees of |
| (3) | Includes Excess Balance Account-Mississippi National Banker’s Bank and Federal Reserve – New Orleans. |
| (4) |
Analysis of Changes in Net Interest Income. The following table presents the consolidated dollar amount of changes in interest income and interest expense attributable to changes in volume and to changes in rate. The combined effect in both volume and rate which cannot be separately identified has been allocated proportionately to the change due to volume and due to rate.
Analysis of Changes in Consolidated Net Interest Income
| Year Ended December 31, | Year Ended December 31, | Year Ended December 31, | Year Ended December 31, | |||||||||||||||||||||||||||||||||||||||||||||
2017 versus 2016 Increase (decrease) due to | 2016 versus 2015 Increase (decrease) due to | 2019 versus 2018 Increase (decrease) due to | 2018 versus 2017 Increase (decrease) due to | |||||||||||||||||||||||||||||||||||||||||||||
| Volume | Rate | Net | Volume | Rate | Net | |||||||||||||||||||||||||||||||||||||||||||
| (In thousands) | ||||||||||||||||||||||||||||||||||||||||||||||||
| ($ in thousands) | Volume | Rate | Net | Volume | Rate | Net | ||||||||||||||||||||||||||||||||||||||||||
| Earning Assets | ||||||||||||||||||||||||||||||||||||||||||||||||
| Loans | $ | 18,630 | $ | (300 | ) | $ | 18,330 | $ | 3,807 | $ | 448 | $ | 4,255 | $ | 34,294 | $ | 7,737 | $ | 42,031 | $ | 7,814 | $ | 22,181 | $ | 29,995 | |||||||||||||||||||||||
| Securities | 2,461 | 610 | 3,071 | 174 | (48 | ) | 126 | |||||||||||||||||||||||||||||||||||||||||
| Federal funds sold | 65 | 198 | 263 | (63 | ) | 126 | 63 | |||||||||||||||||||||||||||||||||||||||||
| Other short-term investments | 57 | 47 | 104 | 4 | (38 | ) | (34 | ) | ||||||||||||||||||||||||||||||||||||||||
| Securities (1) | 5,894 | 1,208 | 7,102 | 2,320 | 1,245 | 3,565 | ||||||||||||||||||||||||||||||||||||||||||
| Federal funds sold and interest bearing deposits with other banks | 270 | (640 | ) | (370 | ) | 330 | (252 | ) | 78 | |||||||||||||||||||||||||||||||||||||||
| Total interest income | 21,213 | 555 | 21,768 | 3,922 | 488 | 4,410 | 40,458 | 8,305 | 48,763 | 10,464 | 23,174 | 33,638 | ||||||||||||||||||||||||||||||||||||
| Interest-Bearing Liabilities | ||||||||||||||||||||||||||||||||||||||||||||||||
| Interest-bearing transaction accounts | 609 | 562 | 1,171 | 207 | 215 | 422 | 1,489 | 1,821 | 3,310 | 585 | 1,662 | 2,247 | ||||||||||||||||||||||||||||||||||||
| Money market accounts and savings | 155 | (12 | ) | 143 | (15 | ) | 54 | 39 | 424 | 1,828 | 2,252 | 408 | 281 | 689 | ||||||||||||||||||||||||||||||||||
| Time deposits | 448 | 55 | 503 | 108 | 313 | 421 | 1,953 | 1,579 | 3,532 | 1,515 | 1,072 | 2,587 | ||||||||||||||||||||||||||||||||||||
| Borrowed funds | (87 | ) | 863 | 776 | 77 | 149 | 226 | 2,299 | 239 | 2,538 | 2,423 | 236 | 2,659 | |||||||||||||||||||||||||||||||||||
| Total interest expense | 1,125 | 1,468 | 2,593 | 377 | 731 | 1,108 | 6,165 | 5,467 | 11,632 | 4,931 | 3,251 | 8,182 | ||||||||||||||||||||||||||||||||||||
| Net interest income | $ | 20,088 | $ | (913 | ) | $ | 19,175 | $ | 3,545 | $ | (243 | ) | $ | 3,302 | $ | 34,303 | $ | 2,828 | $ | 37,131 | $ | 5,533 | $ | 19,923 | $ | 25,456 | ||||||||||||||||||||||
| (1) | Fully tax equivalent yield assuming a 25.3% tax rate. |
Interest Sensitivity. The Company monitors and manages the pricing and maturity of its assets and liabilities in order to diminish the potential adverse impact that changes in interest rates could have on its net interest income. A monitoring technique employed by the Company is the measurement of the Company's interest sensitivity "gap," which is the positive or negative dollar difference between assets and liabilities that are subject to interest rate repricing within a given period of time. The Company also performs asset/liability modeling to assess the impact varying interest rates and balance sheet mix assumptions will have on net interest income. Interest rate sensitivity can be managed by repricing assets or liabilities, selling securities available-for-sale, replacing an asset or liability at maturity, or adjusting the interest rate during the life of an asset or liability. Managing the amount of assets and liabilities repricing in the same time interval helps to hedge the risk and minimize the impact on net interest income of rising or falling interest rates. The Company evaluates interest sensitivity risk and then formulates guidelines regarding asset generation and repricing, funding sources and pricing, and off-balance sheet commitments in order to decrease interest rate sensitivity risk.
The following tables illustrate the Company's consolidated interest rate sensitivity and consolidated cumulative gap position by maturity at December 31, 2019, 2018, and 2017 2016, and 2015.($ in thousands).
| December 31, 2017 | ||||||||||||||||||||||||||||||||||||||||
Within Three Months | After Three Through Twelve Months | Within One Year | Greater Than One Year or Nonsensitive | Total | December 31, 2019 | |||||||||||||||||||||||||||||||||||
| (In thousands) | Within Three Months | After Three Through Twelve Months | Within One Year | Greater Than One Year or Nonsensitive | Total | |||||||||||||||||||||||||||||||||||
| Assets | ||||||||||||||||||||||||||||||||||||||||
| Earning Assets: | ||||||||||||||||||||||||||||||||||||||||
| Loans | $ | 214,687 | $ | 119,492 | $ | 334,179 | $ | 895,917 | $ | 1,230,096 | $ | 179,998 | $ | 272,741 | $ | 452,739 | $ | 2,158,429 | $ | 2,611,168 | ||||||||||||||||||||
| Securities (2) | 24,716 | 17,823 | 42,539 | 330,323 | 372,862 | 9,125 | 25,282 | 34,407 | 757,370 | 791,777 | ||||||||||||||||||||||||||||||
| Funds sold and other | 475 | 48,466 | 48,941 | - | 48,941 | - | 79,128 | 79,128 | - | 79,128 | ||||||||||||||||||||||||||||||
| Total earning assets | $ | 239,878 | $ | 185,781 | $ | 425,659 | $ | 1,226,240 | $ | 1,651,899 | $ | 189,123 | $ | 377,151 | $ | 566,274 | $ | 2,915,799 | $ | 3,482,073 | ||||||||||||||||||||
| Liabilities | ||||||||||||||||||||||||||||||||||||||||
| Interest-bearing liabilities: | ||||||||||||||||||||||||||||||||||||||||
| Interest-bearing deposits: | ||||||||||||||||||||||||||||||||||||||||
| NOW accounts (1) | $ | - | $ | 601,694 | $ | 601,694 | $ | - | $ | 601,694 | $ | - | $ | 941,597 | $ | 941,597 | $ | - | $ | 941,517 | ||||||||||||||||||||
| Money market accounts | 149,715 | - | 149,715 | - | 149,715 | 462,810 | - | 462,810 | - | 462,810 | ||||||||||||||||||||||||||||||
| Savings deposits (1) | - | 133,864 | 133,864 | - | 133,864 | - | 287,200 | 287,200 | - | 287,200 | ||||||||||||||||||||||||||||||
| Time deposits | 43,171 | 109,100 | 152,271 | 131,032 | 283,303 | 123,978 | 378,170 | 502,148 | 159,570 | 661,718 | ||||||||||||||||||||||||||||||
| Total interest-bearing deposits | 192,886 | 844,658 | 1,037,544 | 131,032 | 1,168,576 | 586,788 | 1,606,967 | 2,193,755 | 159,570 | 2,353,325 | ||||||||||||||||||||||||||||||
| Borrowed funds (3) | 75,000 | 18,572 | 93,572 | 10,500 | 104,072 | 207,965 | 1,000 | 208,965 | 5,354 | 214,319 | ||||||||||||||||||||||||||||||
| Total interest-bearing liabilities | 267,886 | 863,230 | 1,131,116 | 141,532 | 1,272,648 | 794,753 | 1,607,967 | 2,402,720 | 164,924 | 2,567,644 | ||||||||||||||||||||||||||||||
| Interest-sensitivity gap per period | $ | (28,008 | ) | $ | (677,449 | ) | $ | (705,457 | ) | $ | 1,084,708 | $ | 379,251 | $ | (605,630 | ) | $ | (1,230,816 | ) | $ | (1,836,446 | ) | $ | 2,750,875 | $ | 914,429 | ||||||||||||||
| Cumulative gap at December 31, 2017 | $ | (28,008 | ) | $ | (705,457 | ) | $ | (705,457 | ) | $ | 379,251 | $ | 379,251 | |||||||||||||||||||||||||||
| Ratio of cumulative gap to total earning assets at December 31, 2017 | (1.7 | )% | (42.7 | )% | (42.7 | )% | 23.0 | % | ||||||||||||||||||||||||||||||||
| Cumulative gap at December 31, 2019 | $ | (605,630 | ) | $ | (1,836,466 | ) | $ | (1,836,446 | ) | $ | 914,429 | $ | 914,429 | |||||||||||||||||||||||||||
| Ratio of cumulative gap to total earning assets at December 31, 2019 | (17.4 | )% | (52.7 | )% | (52.7 | )% | 26.3 | % | ||||||||||||||||||||||||||||||||
| December 31, 2016 | ||||||||||||||||||||||||||||||||||||||||
Within Three Months | After Three Through Twelve Months | Within One Year | Greater Than One Year or Nonsensitive | Total | December 31, 2018 | |||||||||||||||||||||||||||||||||||
| (In thousands) | Within Three Months | After Three Through Twelve Months | Within One Year | Greater Than One Year or Nonsensitive | Total | |||||||||||||||||||||||||||||||||||
| Assets | ||||||||||||||||||||||||||||||||||||||||
| Earning Assets: | ||||||||||||||||||||||||||||||||||||||||
| Loans | $ | 121,391 | $ | 88,433 | $ | 209,824 | $ | 663,110 | $ | 872,934 | $ | 345,703 | $ | 175,228 | $ | 520,931 | $ | 1,544,329 | $ | 2,065,260 | ||||||||||||||||||||
| Securities (2) | 10,092 | 21,376 | 31,468 | 224,331 | 255,799 | 18,627 | 19,616 | 38,243 | 476,685 | 514,928 | ||||||||||||||||||||||||||||||
| Funds sold and other | 425 | 29,975 | 30,400 | - | 30,400 | - | 87,751 | 87,751 | - | 87,751 | ||||||||||||||||||||||||||||||
| Total earning assets | $ | 131,908 | $ | 139,784 | $ | 271,692 | $ | 887,441 | $ | 1,159,133 | $ | 364,330 | $ | 282,595 | $ | 646,925 | $ | 2,021,014 | $ | 2,667,939 | ||||||||||||||||||||
| Liabilities | ||||||||||||||||||||||||||||||||||||||||
| Interest-bearing liabilities: | ||||||||||||||||||||||||||||||||||||||||
| Interest-bearing deposits: | ||||||||||||||||||||||||||||||||||||||||
| NOW accounts (1) | $ | - | $ | 430,903 | $ | 430,903 | $ | - | �� | $ | 430,903 | $ | - | $ | 835,433 | $ | 835,433 | $ | - | $ | 835,433 | |||||||||||||||||||
| Money market accounts | 113,253 | - | 113,253 | - | 113,253 | 312,552 | - | 312,552 | - | 312,552 | ||||||||||||||||||||||||||||||
| Savings deposits (1) | - | 69,540 | 69,540 | - | 69,540 | - | 253,724 | 253,724 | - | 253,724 | ||||||||||||||||||||||||||||||
| Time deposits | 31,273 | 93,456 | 124,729 | 98,288 | 223,017 | 69,655 | 228,930 | 298,585 | 187,017 | 485,602 | ||||||||||||||||||||||||||||||
| Total interest-bearing deposits | 144,526 | 593,899 | 738,425 | 98,288 | 836,713 | 382,207 | 1,318,087 | 1,700,294 | 187,017 | 1,887,311 | ||||||||||||||||||||||||||||||
| Borrowed funds (3) | 30,000 | 26,000 | 56,000 | 13,000 | 69,000 | 75,000 | 10,500 | 85,500 | - | 85,500 | ||||||||||||||||||||||||||||||
| Total interest-bearing liabilities | 174,526 | 619,899 | 794,425 | 111,288 | 905,713 | 457,207 | 1,328,587 | 1,785,794 | 187,017 | 1,972,811 | ||||||||||||||||||||||||||||||
| Interest-sensitivity gap per period | $ | (42,618 | ) | $ | (480,115 | ) | $ | (522,733 | ) | $ | 776,153 | $ | 253,420 | $ | (92,877 | ) | $ | (1,045,992 | ) | $ | (1,138,869 | ) | $ | 1,833,997 | $ | 695,128 | ||||||||||||||
| Cumulative gap at December 31, 2016 | $ | (42,618 | ) | $ | (522,733 | ) | $ | (522,733 | ) | $ | 253,420 | $ | 253,420 | |||||||||||||||||||||||||||
| Ratio of cumulative gap to total earning assets at December 31, 2016 | (3.7 | )% | (45.1 | )% | (45.1 | )% | 21.9 | % | ||||||||||||||||||||||||||||||||
| Cumulative gap at December 31, 2018 | $ | (92,877 | ) | $ | (1,138,869 | ) | $ | (1,138,869 | ) | $ | 695,128 | $ | 695,128 | |||||||||||||||||||||||||||
| Ratio of cumulative gap to total earning assets at December 31, 2018 | (3.5 | )% | (42.7 | )% | (42.7 | )% | 26.1 | % | ||||||||||||||||||||||||||||||||
| December 31, 2015 | |||||||||||||||||||||||||||||||||||||||
Within Three Months | After Three Through Twelve Months | Within One Year | Greater Than One Year or Nonsensitive | Total | December 31, 2017 | ||||||||||||||||||||||||||||||||||
| (In thousands) | Within Three Months | After Three Through Twelve Months | Within One Year | Greater Than One Year or Nonsensitive | Total | ||||||||||||||||||||||||||||||||||
| Assets | |||||||||||||||||||||||||||||||||||||||
| Earning Assets: | |||||||||||||||||||||||||||||||||||||||
| Loans | $ | 101,160 | $ | 76,996 | $ | 178,156 | $ | 598,333 | $ | 776,489 | $ | 214,687 | $ | 119,492 | $ | 334,179 | $ | 895,917 | $ | 1,230,096 | |||||||||||||||||||
| Securities (2) | 14,831 | 18,100 | 32,931 | 222,028 | 254,959 | 24,716 | 17,823 | 42,539 | 330,323 | 372,862 | |||||||||||||||||||||||||||||
| Funds sold and other | 321 | 17,303 | 17,624 | - | 17,624 | 475 | 48,466 | 48,941 | - | 48,941 | |||||||||||||||||||||||||||||
| Total earning assets | $ | 116,312 | $ | 112,399 | $ | 228,711 | $ | 820,361 | $ | 1,049,072 | $ | 239,878 | $ | 185,781 | $ | 425,659 | $ | 1,226,240 | $ | 1,651,899 | |||||||||||||||||||
| Liabilities | |||||||||||||||||||||||||||||||||||||||
| Interest-bearing liabilities: | |||||||||||||||||||||||||||||||||||||||
| Interest-bearing deposits: | |||||||||||||||||||||||||||||||||||||||
| NOW accounts (1) | $ | - | $ | 373,686 | $ | 373,686 | $ | - | $ | 373,686 | $ | - | $ | 601,694 | $ | 601,694 | $ | - | $ | 601,694 | |||||||||||||||||||
| Money market accounts | 105,434 | - | 105,434 | - | 105,434 | 149,715 | - | 149,715 | - | 149,715 | |||||||||||||||||||||||||||||
| Savings deposits (1) | - | 68,657 | 68,657 | - | 68,657 | - | 133,864 | 133,864 | - | 133,864 | |||||||||||||||||||||||||||||
| Time deposits | 37,222 | 83,549 | 120,771 | 58,702 | 179,473 | 43,171 | 109,100 | 152,271 | 131,032 | 283,303 | |||||||||||||||||||||||||||||
| Total interest-bearing deposits | 142,656 | 525,892 | 668,548 | 58,702 | 727,250 | 192,886 | 844,658 | 1,037,544 | 131,032 | 1,168,576 | |||||||||||||||||||||||||||||
| Borrowed funds (3) | 81,130 | 21,191 | 102,321 | 8,000 | 110,321 | 75,000 | 18,572 | 93,572 | 10,500 | 104,072 | |||||||||||||||||||||||||||||
| Total interest-bearing liabilities | 223,786 | 547,083 | 770,869 | 66,702 | 837,571 | 267,886 | 863,230 | 1,131,116 | 141,532 | 1,272,648 | |||||||||||||||||||||||||||||
| Interest-sensitivity gap per period | $ | (107,474 | ) | $ | (434,684 | ) | $ | (542,158 | ) | $ | 753,659 | $ | 211,501 | $ | (28,008 | ) | $ | (677,449 | ) | $ | (705,457 | ) | $ | 1,084,708 | $ | 379,251 | |||||||||||||
| Cumulative gap at December 31, 2015 | $ | (107,474 | ) | $ | (542,158 | ) | $ | (542,158 | ) | $ | 211,501 | $ | 211,501 | ||||||||||||||||||||||||||
| Ratio of cumulative gap to total earning assets at December 31, 2015 | (10.2 | )% | (51.7 | )% | (51.7 | )% | 20.2 | % | |||||||||||||||||||||||||||||||
| Cumulative gap at December 31, 2017 | $ | (28,008 | ) | $ | (705,457 | ) | $ | (705,457 | ) | $ | 379,251 | $ | 379,251 | ||||||||||||||||||||||||||
| Ratio of cumulative gap to total earning assets at December 31, 2017 | (1.7 | )% | (42.7 | )% | (42.7 | )% | 23.0 | % | |||||||||||||||||||||||||||||||
| (1) | NOW and savings accounts are subject to immediate withdrawal and repricing. These deposits do not tend to immediately react to changes in interest rates and the Company believes these deposits are fairly stable. Therefore, these deposits are included in the repricing period that management believes most closely matches the periods in which they are likely to reprice rather than the period in which the funds can be withdrawn contractually. |
| (2) | Securities include mortgage backed and other installment paying obligations based upon stated maturity dates. |
| (3) | Does not include subordinated debentures of |
The Company generally would benefit from increasing market rates of interest when it has an asset-sensitive gap and generally from decreasing market rates of interest when it is liability sensitive. The Company currently is asset sensitive within the one-year time frame. However, the Company's gap analysis is not a precise indicator of its interest sensitivity position. The analysis presents only a static view of the timing of maturities and repricing opportunities, without taking into consideration that changes in interest rates do not affect all assets and liabilities equally. For example, rates paid on a substantial portion of core deposits may change contractually within a relatively short time frame, but those rates are viewed by management as significantly less interest-sensitive than market-based rates such as those paid on non-core deposits. Accordingly, management believes a liability sensitive-position within one year would not be as indicative of the Company’s true interest sensitivity as it would be for an organization which depends to a greater extent on purchased funds to support earning assets. Net interest income is also affected by other significant factors, including changes in the volume and mix of earning assets and interest-bearing liabilities.
The following tables depict, for the periods indicated, certain information related to interest rate sensitivity in net interest income and market value of equity.
| December 31, 2017 | ||||||||||||||||
Net Interest Income at Risk | Market Value of Equity | |||||||||||||||
Change in Interest |
% Change |
Bank Policy Limit |
% Change from Base |
Bank Policy Limit | ||||||||||||
| Up 400 bps | 7.7 | % | -20.0 | % | 40.3 | % | -40.0 | % | ||||||||
| Up 300 bps | 7.7 | % | -15.0 | % | 36.4 | % | -30.0 | % | ||||||||
| Up 200 bps | 6.3 | % | -10.0 | % | 28.8 | % | -20.0 | % | ||||||||
| Up 100 bps | 3.8 | % | -5.0 | % | 17.0 | % | -10.0 | % | ||||||||
| Down 100 bps | -6.2 | % | -5.0 | % | -21.2 | % | -10.0 | % | ||||||||
| Down 200 bps | -9.2 | % | -10.0 | % | -14.3 | % | -20.0 | % | ||||||||
December 31, 2019
| December 31, 2016 | ||||||||||||||||||||||||||||||||
Net Interest Income at Risk | Market Value of Equity | Net Interest Income at Risk | Market Value of Equity | |||||||||||||||||||||||||||||
| Change in Interest Rates |
% Change |
Policy Limit |
% Change from Base |
Policy Limit | % Change from Base | Bank Policy Limit | % Change from Base | Bank Policy Limit | ||||||||||||||||||||||||
| Up 400 bps | 15.4 | % | -20.0 | % | 22.9 | % | -40.0 | % | 0.7 | % | -20.0 | % | 21.3 | % | -40.0 | % | ||||||||||||||||
| Up 300 bps | 11.8 | % | -15.0 | % | 18.8 | % | -30.0 | % | 2.1 | % | -15.0 | % | 19.9 | % | -30.0 | % | ||||||||||||||||
| Up 200 bps | 8.0 | % | -10.0 | % | 13.7 | % | -20.0 | % | 2.3 | % | -10.0 | % | 16.3 | % | -20.0 | % | ||||||||||||||||
| Up 100 bps | 4.0 | % | -5.0 | % | 7.6 | % | -10.0 | % | 1.6 | % | -5.0 | % | 9.8 | % | -10.0 | % | ||||||||||||||||
| Down 100 bps | -4.8 | % | -5.0 | % | -9.5 | % | -10.0 | % | -3.0 | % | -5.0 | % | -6.4 | % | -10.0 | % | ||||||||||||||||
| Down 200 bps | -6.6 | % | -10.0 | % | -11.6 | % | -20.0 | % | -5.1 | % | -10.0 | % | 0.1 | % | -20.0 | % | ||||||||||||||||
| December 31, 2015 | ||||||||||||||||
Net Interest Income at Risk |
Market Value of Equity | |||||||||||||||
| Change in Interest Rates |
% Change |
Policy Limit |
% Change from Base |
Policy Limit | ||||||||||||
| Up 400 bps | 11.2 | % | -20.0 | % | 34.3 | % | -40.0 | % | ||||||||
| Up 300 bps | 8.6 | % | -15.0 | % | 27.7 | % | -30.0 | % | ||||||||
| Up 200 bps | 5.8 | % | -10.0 | % | 20.0 | % | -20.0 | % | ||||||||
| Up 100 bps | 2.9 | % | -5.0 | % | 10.8 | % | -10.0 | % | ||||||||
| Down 100 bps | -2.7 | % | -5.0 | % | -11.5 | % | -10.0 | % | ||||||||
| Down 200 bps | -4.7 | % | -10.0 | % | -10.0 | % | -20.0 | % | ||||||||
December 31, 2018
| Net Interest Income at Risk | Market Value of Equity | |||||||||||||||
| Change in Interest Rates | % Change from Base | Policy Limit | % Change from Base | Policy Limit | ||||||||||||
| Up 400 bps | 3.1 | % | -20.0 | % | 19.0 | % | -40.0 | % | ||||||||
| Up 300 bps | 4.2 | % | -15.0 | % | 17.9 | % | -30.0 | % | ||||||||
| Up 200 bps | 3.9 | % | -10.0 | % | 14.6 | % | -20.0 | % | ||||||||
| Up 100 bps | 2.5 | % | -5.0 | % | 8.8 | % | -10.0 | % | ||||||||
| Down 100 bps | -4.8 | % | -5.0 | % | -13.7 | % | -10.0 | % | ||||||||
| Down 200 bps | -9.6 | % | -10.0 | % | -20.8 | % | -20.0 | % | ||||||||
December 31, 2017
| Net Interest Income at Risk | Market Value of Equity | |||||||||||||||
| Change in Interest Rates | % Change from Base | Policy Limit | % Change from Base | Policy Limit | ||||||||||||
| Up 400 bps | 7.7 | % | -20.0 | % | 40.3 | % | -40.0 | % | ||||||||
| Up 300 bps | 7.7 | % | -15.0 | % | 36.4 | % | -30.0 | % | ||||||||
| Up 200 bps | 6.3 | % | -10.0 | % | 28.8 | % | -20.0 | % | ||||||||
| Up 100 bps | 3.8 | % | -5.0 | % | 17.0 | % | -10.0 | % | ||||||||
| Down 100 bps | -6.2 | % | -5.0 | % | -21.2 | % | -10.0 | % | ||||||||
| Down 200 bps | -9.2 | % | -10.0 | % | -14.3 | % | -20.0 | % | ||||||||
Provision and Allowance for Loan Losses
The Company has developed policies and procedures for evaluating the overall quality of its credit portfolio and the timely identification of potential problem loans. Management’s judgment as to the adequacy of the allowance for loan losses is based upon a number of assumptions about future events which it believes to be reasonable, but which may not prove to be accurate. Thus, there can be no assurance that charge-offs in future periods will not exceed the allowance for loan losses or that additional increases in the loan loss allowance will not be required.
The Company’s allowance consists of two parts. The first part is determined in accordance with authoritative guidance issued by the FASB regarding the allowance.allowance. The Company’s determination of this part of the allowance is based upon quantitative and qualitative factors. The Company uses a loan loss history based upon the prior nineten years to determine the appropriate allowance. Historical loss factors are determined by criticizedcalculated and uncriticizedallocated to loans by loan type. These historical loss factors are applied to the loans by loan type to determine an indicated allowance. The loss factors of peer groups are considered in the determination of the allowance and are used to assist in the establishment of a long-term loss history for areas in which this data is unavailable and incorporated into the qualitative factors to be considered. The historical loss factors may also be modified based upon other qualitative factors including but not limited to local and national economic conditions, trends of delinquent and problem loans, changes in lending policies and underwriting standards, concentrations, and management’s knowledge of the loan portfolio. These factors require judgment on the part of management and are based upon state and national economic reports received from various institutions and agencies including the Federal Reserve Bank, United States Bureau of Economic Analysis, Bureau of Labor Statistics, meetings with the Company’s loan officers and loan committees, and data and guidance received or obtained from the Company’s regulatory authorities.
The second part of the allowance is determined in accordance with guidance issued by the FASB regarding impaired loans. Impaired loans are determined based upon aongoing review by internal loan reviewsenior management in the areas of Credit Administration and senior loan officers.Portfolio Management. Impaired loans are loans for which the Bank does not expect to receive contractual interest and/or principalall contractually obligated repayment by the due date. A specific allowance is assigned to each loan determined to be impaired based upon the value of the loan’s underlying collateral. Appraisals are used by management to determine the value of the collateral.
The sum of the two parts constitutes management’s best estimate of an adequateappropriate allowance for loan losses. When the estimated allowance is determined, it is presented to the Company’s audit committeeALLL Committee and Audit Committee of the Board for review and approval on a quarterly basis.
Our allowance for loan losses modelloss model’s quantitative methodology is focused on establishing a loss history withinprobability using the BankBank’s historical default and relies onnet charge off data. The quantitative portion of the loss estimation model also includes specific impairment to determineimpairments individually reserved for credits that the Bank feelsdetermines the ultimate repayment source will be liquidation of the subject collateral. Our modelThe other qualitative component used in calculating a loss estimate takes into account other factors such as local and national economic factors, portfolio trends, non performingcomposition and collateral concentrations, asset charge off,quality, lending personnel knowledge and delinquency trendsexperience, as well as loan policy guidelines and their effect on underwriting standards and the experience of branch management and lending staff.standards. These trends are measured inby analyzing the following ways:variables:
Local Trends: (Updated quarterly usually the month following quarter end)
Local Unemployment Rate
Insurance Issues (Windpool Areas)
Bankruptcy Rates (Increasing/Declining)
Local Commercial R/E Vacancy Rates
Established Market/New Market
Hurricane Threat
| Local Unemployment Rate |
| Insurance Issues (Windpool Areas) |
| Bankruptcy Rates (Increasing/Declining) |
| Local Commercial R/E Vacancy Rates |
| Established Market/New Market |
| Hurricane Threat |
National Trends: (Updated quarterly usually the month following quarter end)
Gross Domestic Product (GDP)
Home Sales
Consumer Price Index (CPI)
Interest Rate Environment (Increasing/Steady/Declining)
Single Family Construction Starts
Inflation Rate
Retail Sales
| Gross Domestic Product (GDP) |
| Consumer Price Index (CPI) |
| Interest Rate Environment (Increasing/Steady/Declining) |
| Single Family Construction Starts |
| Inflation Rate |
| Retail Sales |
Portfolio Trends: (Updated monthly as the allowance for loan loss is calculated)
Second Mortgages
Single Pay Loans
Non-Recourse Loans
Limited Guaranty Loans
Loan to Value Exceptions
Secured by Non-Owner Occupied Property
Raw Land Loans
Unsecured Loans
| Second Mortgages |
| Single Pay Loans |
| Non-Recourse Loans |
| Limited Guaranty Loans |
| Loan to Value Exceptions |
| Secured by Non-Owner Occupied Property |
| Raw Land Loans |
| Unsecured Loans |
Measurable Bank Trends: (Updated quarterly)
Delinquency Trends
Non-Accrual Trends
Net Charge Offs
Loan Volume Trends
Non-Performing Assets
Underwriting Standards/Lending Policies
Experience/Depth of Bank Lending
Management
| Delinquency Trends |
| Non-Accrual Trends |
| Net Charge Offs |
| Loan Volume Trends |
| Non-Performing Assets |
| Underwriting Standards/Lending Policies |
| Experience/Depth of Bank Lending Management |
The bank wide information and metrics, along with the local and national economic trends listed above, are all measured quarterly. Typically, this review is performed during the second month of every quarter to facilitate the release of economic data from the reporting agencies. As of December 31, 2017, most2019, Unemployment remained at record lows throughout the 4th quarter, but fears of rising inflation caused the Federal Reserve to continue with 2019’s policy of raising key rates. This increase in market rates overall caused some stress in the financial sector, and was the reason to lower the grading on economic indicators pointedconditions, and thus increase that allocation factor. The Qualitative and Environmental (“Q&E”) factor assigned to asset quality was also increased due to a stable and improving economy thus most factors were assigned a neutral or decreasing allocation factor. In contrast, bank wide factors including the acquisition of new loan portfolios and lending staff through mergers, increased loan production volume causing healthy organic loan portfolio growth, and increasing concentrations4th quarter rise in loan types considered to carry higher risk by banking standards, resulted in an increasepast dues compared to the assigned allocationprevious three quarters in 2019. Easing of the regulatory burdens brought about in the past few years, as well as increased capital and lower CRE concentrations led to a decrease in those Q&E factors related to these areas.from previous quarters.
At December 31, 2017,2019, the consolidated allowance for loan losses was approximately $8.3$13.9 million, or 0.68%0.53% of outstanding loans excluding loans held for sale. Including valuation accounting adjustments on acquired loans, the total valuation plus allowance for loan losses was 1.11% of loans at December 31, 2017. At December 31, 2016,2018, the allowance for loan losses amounted to approximately $7.5$10.1 million, which was 0.87%0.49% of outstanding loans. The provision for loan losses is a charge to earnings to maintain the allowance for loan losses at a level consistent with management’s assessment of the collectability of the loan portfolio in light of current economic conditions and market trends. The Company’s provision for loan losses was $506,000$3.7 million for the year ended December 31, 2017, $625,0002019, $2.1 million for the year ended December 31, 2016,2018, and $410,000$506 thousand for the year ended December 31, 2015.2017. The $1.6 million increase in 2019 was primarily related to our internal assessment of the credit quality of the loan portfolio which included additional impairments of certain loans.The overall allowance for loan losses results from consistent application of our loan loss reserve methodology as described above. At December 31, 2017,2019, management believes the allowance is appropriate and has been derived from consistent application of our methodology. Should any of the factors considered by management in evaluating the appropriateness of the allowance for loan losses change, management’s estimate of inherent losses in the portfolio could also change, which would affect the level of future provisions for loan losses.
Non-PerformingWith the adoption of CECL beginning on January 1, 2020, provision expense may become more volatile due to changes in CECL model assumption of credit quality, macroeconomics factors and conditions, and loan composition, which drive the allowance for credit losses balance.
NonPerforming Assets
A loan is reviewed for impairment when, based on all available information and events, it displays characteristics causing management to determine that the probability of collecting all principal, interest, and other related fees due according to the contractual terms of the loan agreement. Also at this time, the accrual of interest is discontinued. Along with these loans in non-accrual status, all loans determined by management to be labelled as “troubled debt restructure” based on regulatory guidance are reviewed for impairment. Loans that are identified as criticized or classified based on unsatisfactory repayment performance, or other evidence of deteriorating credit quality, are not reviewed until being placed in non-accrual status or when considered to be troubled debt restructure.
Once these loans are identified, they are analyzed to determine whether the ultimate repayment source will be liquidation of collateral or some future source of cash flow. If the only source of repayment will come from the liquidation of collateral, impairment worksheets are prepared to document the amount of impairment that exists. This method takes into account collateral exposure, as well as all expected expenses related to the disposal of the collateral. Specific allowances for these loans are then accounted for on a per loan basis.
The following tables illustrate the Company’s past due and non-accrualnonaccrual loans, including PCI loans, at December 31, 2019, 2018 and 2017 2016 and 2015.($ in thousands).
| December 31, 2017 | ||||||||||||||||||||||||
| (In thousands) | ||||||||||||||||||||||||
| Past Due 30 to 89 Days | Past Due 90 days or more and still accruing | Non-Accrual | December 31, 2019 | |||||||||||||||||||||
| Past Due 30 to 89 Days | Past Due 90 days or more and still accruing | Nonaccrual | ||||||||||||||||||||||
| Real Estate-construction | $ | 192 | $ | 27 | $ | 92 | $ | 468 | $ | 363 | $ | 1,483 | ||||||||||||
| Real Estate-mortgage | 2,656 | 177 | 2,691 | |||||||||||||||||||||
| Residential secured loans including multi-family and farmland | 4,569 | 1,608 | 10,050 | |||||||||||||||||||||
| Real Estate-nonfarm nonresidential | 1,487 | 82 | 1,724 | 1,979 | 683 | 24,803 | ||||||||||||||||||
| Commercial | 393 | - | 1,120 | 515 | 61 | 2,234 | ||||||||||||||||||
| Consumer | 57 | - | 46 | |||||||||||||||||||||
| Installment and other | 226 | - | 265 | |||||||||||||||||||||
| Total | $ | 4,785 | $ | 286 | $ | 5,673 | $ | 7,757 | $ | 2,715 | $ | 38,835 | ||||||||||||
| December 31, 2016 | ||||||||||||||||||||||||
| (In thousands) | ||||||||||||||||||||||||
| Past Due 30 to 89 Days | Past Due 90 days or more and still accruing | Non-Accrual | December 31, 2018 | |||||||||||||||||||||
| Past Due 30 to 89 Days | Past Due 90 days or more and still accruing | Nonaccrual | ||||||||||||||||||||||
| Real Estate-construction | $ | 204 | $ | 96 | $ | 658 | $ | 818 | $ | 114 | $ | 612 | ||||||||||||
| Real Estate-mortgage | 2,745 | 102 | 1,662 | |||||||||||||||||||||
| Residential secured loans including multi-family and farmland | 5,528 | 650 | 8,586 | |||||||||||||||||||||
| Real Estate-nonfarm nonresidential | 269 | - | 909 | 4,319 | 456 | 14,320 | ||||||||||||||||||
| Commercial | 9 | - | 2 | 1,650 | - | 1,377 | ||||||||||||||||||
| Consumer | 22 | - | 33 | |||||||||||||||||||||
| Installment and other | 507 | 45 | 178 | |||||||||||||||||||||
| Total | $ | 3,249 | $ | 198 | $ | 3,264 | $ | 12,822 | $ | 1,265 | $ | 25,073 | ||||||||||||
| December 31, 2015 | ||||||||||||||||||||||||
| (In thousands) | ||||||||||||||||||||||||
| Past Due 30 to 89 Days | Past Due 90 days or more and still accruing | Non-Accrual | December 31, 2017 | |||||||||||||||||||||
| Past Due 30 to 89 Days | Past Due 90 days or more and still accruing | Nonaccrual | ||||||||||||||||||||||
| Real Estate-construction | $ | 311 | $ | - | $ | 2,956 | $ | 192 | $ | 27 | $ | 92 | ||||||||||||
| Real Estate-mortgage | 3,339 | 29 | 2,055 | |||||||||||||||||||||
| Residential secured loans including multi-family and farmland | 2,656 | 177 | 2,691 | |||||||||||||||||||||
| Real Estate-nonfarm nonresidential | 736 | - | 2,225 | 1,487 | 82 | 1,724 | ||||||||||||||||||
| Commercial | 97 | - | 100 | 393 | - | 1,120 | ||||||||||||||||||
| Consumer | 70 | - | 32 | |||||||||||||||||||||
| Installment and other | 57 | - | 46 | |||||||||||||||||||||
| Total | $ | 4,553 | $ | 29 | $ | 7,368 | $ | 4,785 | $ | 286 | $ | 5,673 | ||||||||||||
Total non-accrualnonaccrual loans at December 31, 2017,2019, were $5.7$38.8 million, an increase of $2.4$13.3 million compared to $3.3$25.1 million at December 31, 2016.2018. The majority of the increase is related to two legacy relationships that were moved to nonaccrual status during 2019. Total nonaccrual loans at December 31, 2018 increased $19.4 million from $5.7 million at December 31, 2017. The majority of the increase was the result of loans acquired from IbervilleFirst Community Bank, Sunshine and Gulf Coast Community Bank. Total non-accrual loans at December 31, 2016 decreased $4.1 million from $7.4 million at December 31, 2015. The majority of the decrease was the result of loans moving to Other Real Estate Owned.FMB. Management believes these relationships were adequately reserved at December 31, 2017.2019. Restructured loans not reported as past due or non-accrualnonaccrual at December 31, 2017, amounted to $4.72019 totaled $79.7 million. See Note E – Loans in the accompanying notes to the consolidated financial statements included elsewhere in this report for a description of restructured loans.
A potential problem loan is one in which management has serious doubts about the borrower’s future performance under the terms of the loan contract and dodoes not include the category of special mention. These loans are current as to principal and interest and, accordingly, they are not included in nonperforming asset categories. The level of potential problem loans is one factor used in the determination of the adequacy of the allowance for loan losses. At December 31, 2017, 20162019, 2018 and December 31, 2015,2017, The First had potential problem loans of $18,206,000, $12,297,000$67.9 million, $55.2 million and $16,943,000,$36.9 million, respectively.The increase of $5.9$12.7 million during 20172019 was largely attributable to the classifiedone legacy relationship and certain loans acquired in the Iberville BankFPB and Gulf Coast Community Bank transactions.FFB transactions that were identified as classified or criticized based on repayment performance or credit quality.
Summary of Loan Loss Experience
Consolidated Allowance For Loan Losses
(In thousands)
| Years Ended December 31, | Years Ended December 31, | |||||||||||||||||||||||||||||||||||||||
| 2017 | 2016 | 2015 | 2014 | 2013 | ||||||||||||||||||||||||||||||||||||
| ($ in thousands) | 2019 | 2018 | 2017 | 2016 | 2015 | |||||||||||||||||||||||||||||||||||
| Average loans outstanding | $ | 1,168,882 | $ | 820,881 | $ | 730,326 | $ | 632,049 | $ | 583,200 | $ | 2,341,202 | $ | 1,678,746 | $ | 1,168,882 | $ | 820,881 | $ | 730,326 | ||||||||||||||||||||
| Loans outstanding at year end | $ | 1,230,096 | $ | 872,934 | $ | 776,489 | $ | 706,635 | $ | 583,302 | $ | 2,611,168 | $ | 2,065,260 | $ | 1,230,096 | $ | 872,934 | $ | 776,489 | ||||||||||||||||||||
| Total non-accrual loans | $ | 5,673 | $ | 3,264 | $ | 7,368 | $ | 6,056 | $ | 3,181 | ||||||||||||||||||||||||||||||
| Total nonaccrual loans | $ | 38,835 | $ | 25,073 | $ | 5,673 | $ | 3,264 | $ | 7,368 | ||||||||||||||||||||||||||||||
| Beginning balance of allowance | $ | 7,510 | $ | 6,747 | $ | 6,095 | $ | 5,728 | $ | 4,727 | $ | 10,065 | $ | 8,288 | $ | 7,510 | $ | 6,747 | $ | 6,095 | ||||||||||||||||||||
| Prior period reclassification – Mortgage Reserve Funding | - | (181 | ) | - | - | - | ||||||||||||||||||||||||||||||||||
| Beginning balance of allowance restated | 10,065 | 8,107 | 7,510 | 6,747 | 6,095 | |||||||||||||||||||||||||||||||||||
| Loans charged-off | (405 | ) | (771 | ) | (843 | ) | (1,459 | ) | (759 | ) | (664 | ) | (581 | ) | (405 | ) | (771 | ) | (843 | ) | ||||||||||||||||||||
| Total loans charged-off | (405 | ) | (771 | ) | (843 | ) | (1,459 | ) | (759 | ) | ||||||||||||||||||||||||||||||
| Total recoveries | 677 | 909 | 1,085 | 408 | 684 | 769 | 419 | 677 | 909 | 1,085 | ||||||||||||||||||||||||||||||
| Net loans (charged-off) recoveries | 272 | 138 | 242 | (1,051 | ) | (75 | ) | 105 | (162 | ) | 272 | 138 | 242 | |||||||||||||||||||||||||||
| Provision for loan losses | 506 | 625 | 410 | 1,418 | 1,076 | 3,738 | 2,120 | 506 | 625 | 410 | ||||||||||||||||||||||||||||||
| Balance at year end | $ | 8,288 | $ | 7,510 | $ | 6,747 | $ | 6,095 | $ | 5,728 | $ | 13,908 | $ | 10,065 | $ | 8,288 | $ | 7,510 | $ | 6,747 | ||||||||||||||||||||
| Net charge-offs (recoveries) to average loans | (.02 | )% | (.02 | )% | (.03 | )% | .17 | % | .01 | % | (0.004 | )% | 0.01 | % | (0.02 | )% | (0.02 | )% | (0.03 | )% | ||||||||||||||||||||
| Allowance as percent of total loans | .67 | % | .86 | % | .87 | % | .86 | % | .98 | % | 0.53 | % | 0.49 | % | 0.67 | % | 0.86 | % | 0.87 | % | ||||||||||||||||||||
| Nonperforming loans as a percentage of total loans | .46 | % | .37 | % | .95 | % | .86 | % | .55 | % | 1.47 | % | 1.06 | % | 0.46 | % | 0.37 | % | 0.95 | % | ||||||||||||||||||||
| Allowance as a multiple of non-accrual loans | 1.5 | X | 2.3 | X | .92 | X | 1.0 | X | 1.8 | X | 0.36 | X | 0.46 | X | 1.5 | X | 2.3 | X | 0.92 | X | ||||||||||||||||||||
At December 31, 2017,2019, the components of the allowance for loan losses consisted of the following:following ($ in thousands):
| Allowance | ||||||||
| (In thousands) | Allowance | |||||||
| Allocated: | ||||||||
| Impaired loans | $ | 661 | $ | 4,424 | ||||
| Graded loans | 7,627 | |||||||
| Loans collectively evaluated | 9,484 | |||||||
| $ | 8,288 | $ | 13,908 | |||||
Graded loansLoan collectively evaluated are those loans or pools of loans assigned a grade by internal loan review.
The following table represents the activity of the allowance for loan losses for the years 2019, 2018, 2017, 2016, and 2015 2014, and 2013.($ in thousands).
Analysis of the Allowance for Loan Losses
| Years Ended December 31, | ||||||||||||||||||||||||||||||||||||||||
| 2017 | 2016 | 2015 | 2014 | 2013 | ||||||||||||||||||||||||||||||||||||
| (In thousands) | Years Ended December 31, | |||||||||||||||||||||||||||||||||||||||
| 2019 | 2018 | 2017 | 2016 | 2015 | ||||||||||||||||||||||||||||||||||||
| Balance at beginning of year | $ | 7,510 | $ | 6,747 | $ | 6,095 | $ | 5,728 | $ | 4,727 | $ | 10,065 | $ | 8,288 | $ | 7,510 | $ | 6,747 | $ | 6,095 | ||||||||||||||||||||
| Prior period reclassification - Mortgage Reserve Funding | - | (181 | ) | - | - | - | ||||||||||||||||||||||||||||||||||
| Balance at beginning of year restated | 10,065 | 8,107 | 7,510 | 6,747 | 6,095 | |||||||||||||||||||||||||||||||||||
| Charge-offs: | ||||||||||||||||||||||||||||||||||||||||
| Real Estate-construction | (143 | ) | (274 | ) | (162 | ) | (47 | ) | (305 | ) | - | (52 | ) | (143 | ) | (274 | ) | (162 | ) | |||||||||||||||||||||
| Real Estate-mortgage | (119 | ) | (353 | ) | (372 | ) | (1,156 | ) | (152 | ) | ||||||||||||||||||||||||||||||
| Residential secured loans including multi-family and farmland | (163 | ) | (7 | ) | (119 | ) | (353 | ) | (372 | ) | ||||||||||||||||||||||||||||||
| Real Estate-nonfarm nonresidential | (-) | (-) | (-) | (-) | (-) | (54 | ) | (170 | ) | (- | ) | (- | ) | (- | ) | |||||||||||||||||||||||||
| Commercial | (62 | ) | (71 | ) | (183 | ) | (89 | ) | (105 | ) | (141 | ) | (265 | ) | (62 | ) | (71 | ) | (183 | ) | ||||||||||||||||||||
| Consumer | (81 | ) | (73 | ) | (126 | ) | (167 | ) | (197 | ) | ||||||||||||||||||||||||||||||
| Installment and other | (306 | ) | (87 | ) | (81 | ) | (73 | ) | (126 | ) | ||||||||||||||||||||||||||||||
| Total | (405 | ) | (771 | ) | (843 | ) | (1,459 | ) | (759 | ) | (664 | ) | (581 | ) | (405 | ) | (771 | ) | (843 | ) | ||||||||||||||||||||
| Recoveries: | ||||||||||||||||||||||||||||||||||||||||
| Real Estate-construction | 280 | 229 | 63 | 96 | 133 | 129 | 34 | 280 | 229 | 63 | ||||||||||||||||||||||||||||||
| Real Estate-mortgage | 228 | 519 | 827 | 212 | 393 | |||||||||||||||||||||||||||||||||||
| Residential secured loans including multi-family and farmland | 240 | 183 | 228 | 519 | 827 | |||||||||||||||||||||||||||||||||||
| Real Estate-nonfarm nonresidential | 14 | 7 | 15 | 17 | 74 | 13 | 10 | 14 | 7 | 15 | ||||||||||||||||||||||||||||||
| Commercial | 50 | 84 | 99 | 15 | 18 | 85 | 44 | 50 | 84 | 99 | ||||||||||||||||||||||||||||||
| Consumer | 105 | 70 | 81 | 68 | 66 | |||||||||||||||||||||||||||||||||||
| Installment and other | 302 | 148 | 105 | 70 | 81 | |||||||||||||||||||||||||||||||||||
| Total | 677 | 909 | 1,085 | 408 | 684 | 769 | 419 | 677 | 909 | 1,085 | ||||||||||||||||||||||||||||||
| Net (Charge-offs) Recoveries | 272 | 138 | 242 | (1,051 | ) | (75 | ) | 105 | (162 | ) | 272 | 138 | 242 | |||||||||||||||||||||||||||
| Provision for Loan Losses | 506 | 625 | 410 | 1,418 | 1,076 | 3,738 | 2,120 | 506 | 625 | 410 | ||||||||||||||||||||||||||||||
| Balance at end of year | $ | 8,288 | $ | 7,510 | $ | 6,747 | $ | 6,095 | $ | 5,728 | $ | 13,908 | $ | 10,065 | $ | 8,288 | $ | 7,510 | $ | 6,747 | ||||||||||||||||||||
The following tables representrepresents how the allowance for loan losses is allocated to a particular loan type as well as the percentage of the category to total loans at December 31, 2019, 2018 and 2017 2016 and 2015.($ in thousands).
Allocation of the Allowance for Loan Losses
| December 31, 2017 | ||||||||
| (Dollars in thousands) | ||||||||
| Amount | % of loans in each category to total loans | |||||||
| Commercial Non Real Estate | $ | 1,608 | 14.0 | % | ||||
| Commercial Real Estate | 4,644 | 64.8 | % | |||||
| Consumer Real Estate | 1,499 | 18.9 | % | |||||
| Consumer | 173 | 2.3 | % | |||||
| Unallocated | 364 | - | ||||||
| Total | $ | 8,288 | 100 | % | ||||
| December 31, 2019 | ||||||||
| Amount | % of loans in each category to total loans | |||||||
| Commercial, financial and agriculture | $ | 3,043 | 13.1 | % | ||||
| Commercial real estate | 8,836 | 65.5 | % | |||||
| Consumer real estate | 1,694 | 19.8 | % | |||||
| Installment and other | 296 | 1.6 | % | |||||
| Unallocated | 39 | - | ||||||
| Total | $ | 13,908 | 100 | % | ||||
| December 31, 2016 | ||||||||
| (Dollars in thousands) | ||||||||
| Amount | % of loans in each category to total loans | |||||||
| Commercial Non Real Estate | $ | 1,118 | 15.6 | % | ||||
| Commercial Real Estate | 4,071 | 61.6 | % | |||||
| Consumer Real Estate | 1,589 | 20.3 | % | |||||
| December 31, 2018 | ||||||||
| Amount | % of loans in each category to total loans | |||||||
| Commercial, financial and agriculture | $ | 2,060 | 14.8 | % | ||||
| Commercial real estate | 6,258 | 64.6 | % | |||||
| Consumer real estate | 1,743 | 18.9 | % | |||||
| Installment and other | 201 | 1.7 | % | |||||
| Unallocated | (197 | ) | - | |||||
| Total | $ | 10,065 | 100 | % | ||||
Continued:
| Amount | % of loans in each category to total loans | |||||||
| Consumer | 155 | 2.4 | % | |||||
| Unallocated | 577 | 0.1 | % | |||||
| Total | $ | 7,510 | 100 | % | ||||
| December 31, 2015 | ||||||||
| (Dollars in thousands) | ||||||||
| Amount | % of loans in each category to total loans | |||||||
| Commercial Non Real Estate | $ | 895 | 17.1 | % | ||||
| Commercial Real Estate | 3,018 | 58.4 | % | |||||
| Consumer Real Estate | 1,477 | 21.9 | % | |||||
| Consumer | 141 | 2.5 | % | |||||
| Unallocated | 1,216 | 0.1 | % | |||||
| Total | $ | 6,747 | 100 | % | ||||
| December 31, 2017 | ||||||||
| Amount | % of loans in each category to total loans | |||||||
| Commercial, financial and agriculture | $ | 1,608 | 14.0 | % | ||||
| Commercial real estate | 4,644 | 64.8 | % | |||||
| Consumer real estate | 1,499 | 18.9 | % | |||||
| Installment and other | 173 | 2.3 | % | |||||
| Unallocated | 364 | - | ||||||
| Total | $ | 8,288 | 100 | % | ||||
Non-interest Income and Expense
Non-interest Income. The Company’s primary sources of noninterestnon-interest income are mortgage banking operations as well asand service charges on deposit accounts. Other sources of non-interest income include bankcard fees, commissions on check sales, safe deposit box rent, wire transfer fees, official check fees and bank owned life insurance income.
Non-interest income was $14.4$26.9 million at December 31, 2017,2019, an increase of $3.1$6.4 million or 27.7%31.1% compared to December 31, 2016,2018, primarily consisting of increases in service charges on deposit accounts of $2.0 million, interchange fee income of $2.8 million on the increased deposit base related to the acquisitions, as well as mortgage income and other charges and fees. Non-interest income increased $3.7$6.2 million or 48.2%43.2% for the year ended December 31, 20162018 compared to $7.6$14.4 million for the year ended December 31, 2015.2017. Deposit activity fees were $15.9 million for 2019 compared to $11.0 million for 2018 and $7.4 million for 2017 compared to $5.1 million for 2016 and $5.0 million for 2015.2017. Other service charges increased by $0.1 million$51 thousand or 17.4%5.1% for the year ended 20172019 to $0.6$1.0 million from $0.5 million$996 thousand for the year ended December 31, 20162018 and other service charges increased $0.1 million$372 thousand or 12.8%59.7% for the year ended December 31, 2016,2018, compared to $0.5 million$624 thousand for the year ended December 31, 2015. Mortgage income increased $3.4 million during 2016 due to increased volume from the acquisition of The Mortgage Connection, LLC in December, 2015.2017.
Non-interest Expense
Non-interest expense was $55.4$88.6 million at December 31, 2017,2019, an increase of $18.6$12.3 million in year-over-year comparison, of which $4.3 million is related to the operations of Southwest, Sunshine, FMB, FPB and FFB. The remaining increase of $8.0 million in expenses are related to increases in salaries and employee benefits of $3.7 million and increases in other expenses of $4.3 million.
Non-interest expense was $76.3 million at December 31, 2018, an increase of $20.9 million in year-over-year comparison primarily resulting from increases in salaries and benefits of $8.4$5.9 million of which $6.7 million relatesrelated to the acquisitions of Gulf Coast Community BankSouthwest, Sunshine and Iberville Bank.FMB, and increased acquisition charges of $7.1 million. Increases in professional servicesoccupancy, amortization of core deposit intangibles and other non-interest expense increased $7.0 million which includes $6.7 million in merger-related costs. Non-interest expense increased to $36.9 million for the year ended December 31, 2016, from $32.2 million foryear-to-date period of 2018 were also attributable to the year ended December 31, 2015. The Company experienced slight increases in most expense categories. Salaries and employee benefits increased $3.6 million in 2016 as compared to 2015, due in part to a full year of the addition of the Mortgage Connection and the lending teams in Mobile, Alabama and Jackson, Mississippi.acquisitions.
The following table sets forth the primary components of non-interest expense for the periods indicated:indicated ($ in thousands):
Non-interest Expense
| Years ended December 31, | |||||||||||||||||||||||
| 2017 | 2016 | 2015 | |||||||||||||||||||||
| (In thousands) | Years ended December 31, | ||||||||||||||||||||||
| 2019 | 2018 | 2017 | |||||||||||||||||||||
| Salaries and employee benefits | $ | 30,548 | $ | 22,137 | $ | 18,537 | $ | 47,675 | $ | 38,302 | $ | 30,548 | |||||||||||
| Occupancy | 4,828 | 3,459 | 3,422 | 8,775 | 6,818 | 4,828 | |||||||||||||||||
| Equipment | 1,225 | 1,262 | 1,199 | ||||||||||||||||||||
| Furniture and equipment | 1,838 | 1,575 | 1,225 | ||||||||||||||||||||
| Supplies and printing | 890 | 846 | 640 | ||||||||||||||||||||
| Professional and consulting fees | 6,449 | 5,381 | 6,757 | ||||||||||||||||||||
| Marketing and public relations | 406 | 465 | 497 | 859 | 508 | 406 | |||||||||||||||||
| Deposit and other insurance | 632 | 1,382 | 1,252 | ||||||||||||||||||||
| ATM expense | 2,821 | 3,241 | 1,188 | ||||||||||||||||||||
| Bank communications | 1,367 | 2,014 | 1,296 | ||||||||||||||||||||
| Data processing | 1,039 | 535 | 150 | 1,285 | 6,931 | 1,039 | |||||||||||||||||
| Supplies and printing | 640 | 287 | 300 | ||||||||||||||||||||
| Bank communications | 1,296 | 782 | 631 | ||||||||||||||||||||
| Deposit and other insurance | 1,252 | 1,020 | 1,051 | ||||||||||||||||||||
| Professional and consulting fees | 6,757 | 1,805 | 1,332 | ||||||||||||||||||||
| Postage | 546 | 396 | 400 | 933 | 751 | 546 | |||||||||||||||||
| ATM expense | 1,188 | 883 | 763 | ||||||||||||||||||||
| Other | 5,721 | 3,831 | 3,879 | 15,045 | 8,562 | 5,721 | |||||||||||||||||
| Total | $ | 55,446 | $ | 36,862 | $ | 32,161 | $ | 88,569 | $ | 76,311 | $ | 55,446 | |||||||||||
Income Tax Expense
Income tax expense consists of two components. The first is the current tax expense which represents the
expected income tax to be paid to taxing authorities. The Company also recognizes deferred tax for future income/deductible amounts resulting from differences in the financial statement and tax bases of assets and liabilities.
On Income tax expense was $12.7 million at December 22, 2017, theTax Cuts31, 2019, $5.8 million at December 31, 2018 and Jobs Act was enacted into law. This federal income tax reform, among other things, reduces the federal corporate income tax rate from 35% to 21%, effective January 1, 2018.$7.0 million at December 31, 2017. As a result of the CompanyTax Act, in 2017 we revalued itsour deferred tax assets which wasand recorded asan additional income tax expense of $2.1 million due to the statutory federal income tax for corporate entities decreasing from 35% to 21% for 2018 and future periods. The Company’s effective income tax rate was 22.5%, 21.4% and 39.6% for the years ended December 31, 2019, 2018 and 2017, respectively. The effective tax rate differs each year primarily due to our investments in bank-qualified municipal securities, bank-owed life insurance, and certain merger related expenses. The reduction in the Company’s statement of operationseffective rate for 2018 compared to 2017 was primarily due to the reduction in the fourth quarterfederal statutory corporate tax rate following enactment of 2017.the Tax Act. Income taxes are discussed more fully under Note K – “Income Tax” of this report.
Analysis of Financial Condition
Earning Assets
Loans. Loans typically provide higher yields than the other types of earning assets, and thus one of the Company's goals is for loans to be the largest category of the Company's earning assets. At December 31, 2017, 20162019, 2018 and 2015,2017, respectively, average loans accounted for 74.1%76.5%, 73.9%77.0% and 71.7%74.1% of average earning assets. Management attempts to control and counterbalance the inherent credit and liquidity risks associated with the higher loan yields without sacrificing asset quality to achieve its asset mix goals. Loans averaged $1,168.9 million$2.341 billion during 20172019 and $820.9 million$1.679 billion during 2016,2018, as compared to $730.3 million$1.169 billion during 2015.2017.
The following table shows the composition of the loan portfolio by category:category ($ in thousands):
Composition of Loan Portfolio
| December 31, | ||||||||||||||||||||||||
| 2017 | 2016 | 2015 | ||||||||||||||||||||||
| Amount | Percent Of Total | Amount | Percent of Total | Amount | Percent Of Total | |||||||||||||||||||
| (Dollars in thousands) | ||||||||||||||||||||||||
| Mortgage loans held for sale | $ | 4,790 | 0.3 | % | $ | 5,880 | 0.6 | % | $ | 3,974 | 0.5 | % | ||||||||||||
| Commercial, financial and agricultural | 165,780 | 13.5 | % | 129,423 | 14.8 | % | 129,197 | 16.6 | % | |||||||||||||||
| Real Estate: | ||||||||||||||||||||||||
| Mortgage-commercial | 467,484 | 38.0 | % | 314,359 | 36.0 | % | 253,309 | 32.6 | % | |||||||||||||||
| Mortgage-residential | 385,099 | 31.3 | % | 289,640 | 33.2 | % | 272,180 | 35.1 | % | |||||||||||||||
| Construction | 183,328 | 14.9 | % | 109,394 | 12.5 | % | 99,161 | 12.8 | % | |||||||||||||||
| Lease Financing Receivable | 2,450 | 0.2 | % | 2,204 | 0.3 | % | 2,650 | 0.3 | % | |||||||||||||||
| Obligations of states and subdivisions | 3,109 | 0.3 | % | 6,698 | 0.8 | % | 969 | 0.1 | % | |||||||||||||||
| Consumer and other | 18,056 | 1.5 | % | 15,336 | 1.8 | % | 15,049 | 2.0 | % | |||||||||||||||
| Total loans | 1,230,096 | 100 | % | 872,934 | 100 | % | 776,489 | 100 | % | |||||||||||||||
| Allowance for loan losses | (8,288 | ) | (7,510 | ) | (6,747 | ) | ||||||||||||||||||
| Net loans | $ | 1,221,808 | $ | 865,424 | $ | 769,742 | ||||||||||||||||||
| December 31, | ||||||||||||||||||||||
| 2019 | 2018 | 2017 | ||||||||||||||||||||
| Amount | Percent of Total | Amount | Percent of Total | Amount | Percent of Total | |||||||||||||||||
| Mortgage loans held for sale | $ | 10,810 | 0.4 | % | $ | 4,838 | 0.3 | % | $ | 4,790 | 0.3 | % | ||||||||||
| Commercial, financial and agricultural | 332,600 | 12.7 | % | 301,182 | 14.6 | % | 165,780 | 13.5 | % | |||||||||||||
| Real Estate: | ||||||||||||||||||||||
| Mortgage-commercial | 1,028,012 | 39.4 | % | 776,880 | 37.6 | % | 467,484 | 38.0 | % | |||||||||||||
| Mortgage-residential | 814,282 | 31.2 | % | 617,804 | 29.9 | % | 385,099 | 31.3 | % | |||||||||||||
| Construction | 359,195 | 13.8 | % | 298,718 | 14.5 | % | 183,328 | 14.9 | % | |||||||||||||
| Lease Financing Receivable | 3,095 | 0.1 | % | 2,891 | 0.1 | % | 2,450 | 0.2 | % | |||||||||||||
| Obligations of states and subdivisions | 20,716 | 0.8 | % | 16,941 | 0.8 | % | 3,109 | 0.3 | % | |||||||||||||
| Installment and other | 42,458 | 1.6 | % | 46,006 | 2.2 | % | 18,056 | 1.5 | % | |||||||||||||
| Total loans | 2,611,168 | 100 | % | 2,065,260 | 100 | % | 1,230,096 | 100 | % | |||||||||||||
| Allowance for loan losses | (13,908 | ) | (10,065 | ) | (8,288 | ) | ||||||||||||||||
| Net loans | $ | 2,597,260 | $ | 2,055,195 | $ | 1,221,808 | ||||||||||||||||
42
In the context of this discussion, a "real estate mortgage loan" is defined as any loan, other than loans for construction purposes, secured by real estate, regardless of the purpose of the loan. The Company follows the common practice of financial institutions in the Company’s market area of obtaining a security interest in real estate whenever possible, in addition to any other available collateral. This collateral is taken to reinforce the likelihood of the ultimate repayment of the loan and tends to increase the magnitude of the real estate loan portfolio component. Generally, the Company limits its loan-to-value ratio to 80%. Management attempts to maintain a conservative philosophy regarding its underwriting guidelines and believes it will reduce the risk elements of its loan portfolio through strategies that diversify the lending mix.
Loans held for sale consist of mortgage loans originated by the Bank and sold into the secondary market. Commitments from investors to purchase the loans are obtained upon origination.
The following table sets forth the Company's commercial and construction real estate loans maturing within specified intervals at December 31, 2017.2019 ($ in thousands).
Loan Maturity Schedule and Sensitivity to Changes in Interest Rates
| December 31, 2017 | ||||||||||||||||
| Type | One Year or Less | Over One Year Through Five Years | Over Five Years | Total | ||||||||||||
| (In thousands) | ||||||||||||||||
| Commercial, financial and agricultural | $ | 42,780 | $ | 98,452 | $ | 24,241 | $ | 165,473 | ||||||||
| Real estate – construction | 78,917 | 79,460 | 24,951 | 183,328 | ||||||||||||
| $ | 121,697 | $ | 177,912 | $ | 49,192 | $ | 348,801 | |||||||||
| Loans maturing after one year with: | ||||||||||||||||
| Fixed interest rates | $ | 198,541 | ||||||||||||||
| Floating interest rates | 28,563 | |||||||||||||||
| $ | 227,104 | |||||||||||||||
| Type | One Year or Less | Over One Year Through Five Years | Over Five Years | Total | ||||||||||||
| Commercial, financial and agricultural | $ | 78,820 | $ | 160,439 | $ | 93,341 | $ | 332,600 | ||||||||
| Real estate – construction | 157,215 | 134,774 | 67,206 | $ | 359,195 | |||||||||||
| Total | $ | 236,035 | $ | 295,213 | $ | 160,547 | $ | 691,795 | ||||||||
| Loans maturing after one year with: | ||||
| Fixed interest rates | $ | 338,570 | ||
| Floating interest rates | 117,190 | |||
| $ | 455,760 | |||
The information presented in the above table is based on the contractual maturities of the individual loans, including loans which may be subject to renewal at their contractual maturity. Renewal of such loans is subject to review and credit approval, as well as modification of terms upon their maturity.
Investment Securities. The investment securities portfolio is a significant component of the Company's total earning assets. Total securities averaged $636.0 million in 2019, as compared to $442.7 million in 2018, and $359.2 million in 2017, as compared to $261.5 million in 2016, and $256.5 million in 2015.2017. This represents 22.8%20.8%, 23.5%20.3%, and 25.2%22.8% of the average earning assets for the years ended December 31, 2017, 20162019, 2018 and 2015,2017, respectively. At December 31, 2017,2019, investment securities, including equity securities, were $372.9$791.8 million and represented 22.6%21.4% of earning assets. The Company attempts to maintain a portfolio of high quality, highly liquid investments with returns competitive with short-term U.S. Treasury or agency obligations. This objective is particularly important as the Company focuses on growing its loan portfolio. The Company primarily invests in securities of U.S. Government agencies, municipals, and corporate obligations with maturities up to fiveten years.
The following table summarizes the carrying value of securities for the dates indicated.indicated ($ in thousands).
Securities Portfolio
| December 31, | ||||||||||||
| 2017 | 2016 | 2015 | ||||||||||
| (In thousands) | ||||||||||||
| Available-for-sale | ||||||||||||
| U. S. Government agencies and Mortgage-backed Securities | $ | 201,570 | $ | 123,334 | $ | 118,536 | ||||||
| States and municipal subdivisions | 138,584 | 98,822 | 97,889 | |||||||||
| Corporate obligations | 15,819 | 20,110 | 22,346 | |||||||||
| Mutual finds | 920 | 940 | 961 | |||||||||
| Total available-for-sale | 356,893 | 243,206 | 239,732 | |||||||||
| Held-to-maturity | ||||||||||||
| U.S. Government agencies | - | - | 1,092 | |||||||||
| States and municipal subdivisions | 6,000 | 6,000 | 6,000 | |||||||||
| Total held-to-maturity | 6,000 | 6,000 | 7,092 | |||||||||
| Total | $ | 362,893 | $ | 249,206 | $ | 246,824 | ||||||
| December 31, | ||||||||||||
| 2019 | 2018 | 2017 | ||||||||||
| Available-for-sale | ||||||||||||
| U.S. Treasury | $ | 4,894 | $ | - | $ | - | ||||||
| U. S. Government agencies and Mortgage-backed Securities | 473,265 | 334,812 | 201,570 | |||||||||
| States and municipal subdivisions | 258,982 | 150,064 | 138,584 | |||||||||
| Corporate obligations | 27,946 | 7,348 | 15,819 | |||||||||
| Mutual funds | - | - | 920 | |||||||||
| Total available-for-sale | 765,087 | 492,224 | 356,893 | |||||||||
| Held-to-maturity | ||||||||||||
| U.S. Government agencies | - | |||||||||||
| States and municipal subdivisions | - | 6,000 | 6,000 | |||||||||
| Total held-to-maturity | - | 6,000 | 6,000 | |||||||||
| Total | $ | 765,087 | $ | 498,224 | $ | 362,893 | ||||||
43
The following table shows, at carrying value, the scheduled maturities and average yields of securities held at December 31, 2017.2019 ($ in thousands).
Investment Securities Maturity Distribution and Yields (1)
| December 31, 2017 | ||||||||||||||||||||||||||||||||
| After One But | After Five But | |||||||||||||||||||||||||||||||
| Within One Year | Within Five Years | Within Ten Years | After Ten Years | |||||||||||||||||||||||||||||
| (Dollars in thousands) | Amount | Yield | Amount | Yield | Amount | Yield | Amount | Yield | ||||||||||||||||||||||||
| Held-to-maturity: | ||||||||||||||||||||||||||||||||
| States and municipal subdivisions | $ | - | - | $ | - | - | $ | 6,000,000 | .93 | % | $ | - | - | |||||||||||||||||||
| Total investment securities held-to-maturity | $ | - | - | - | - | $ | 6,000,000 | $ | - | - | ||||||||||||||||||||||
| Available-for-sale: | ||||||||||||||||||||||||||||||||
| U.S. Government agencies (2) | 2,995,755 | 1.05 | % | 1,996,380 | 1.86 | % | - | - | - | - | ||||||||||||||||||||||
| States and municipal subdivisions. | 11,065,790 | 3.22 | % | 47,779,208 | 3.27 | % | 47,360,399 | 3.96 | % | 32,378,641 | 3.96 | % | ||||||||||||||||||||
| Corporate obligations and other | - | - | 11,228,195 | 2.63 | % | 4,590,713 | 3.05 | % | ||||||||||||||||||||||||
| Total investment securities available-for-sale | $ | 14,061,545 | $ | 49,775,588 | $ | 58,588,594 | $ | 36,969,354 | ||||||||||||||||||||||||
| After One But | After Five But | |||||||||||||||||||||||||||
| Within One Year | Within Five Years | Within Ten Years | After Ten Years | |||||||||||||||||||||||||
| Amount | Yield | Amount | Yield | Amount | Yield | Amount | Yield | |||||||||||||||||||||
| Available-for-sale: | ||||||||||||||||||||||||||||
| U.S. Treasury | $ | - | - | $ | - | - | $ | 4,894 | 1.6 | % | $ | - | - | |||||||||||||||
| U.S. Government agencies (2) | 5,992 | 3.0 | % | 17,651 | 3.0 | % | 51,920 | 2.9 | % | 2,387 | 3.0 | % | ||||||||||||||||
| States and municipal subdivisions | 19,331 | 3.0 | % | 51,477 | 3.0 | % | 80,986 | 3.2 | % | 107,188 | 3.0 | % | ||||||||||||||||
| Corporate obligations and other | 4,981 | 2.2 | % | 12,244 | 2.1 | % | 10,285 | 2.3 | % | 436 | 4.0 | % | ||||||||||||||||
| Total investment securities available-for-sale | $ | 30,304 | $ | 81,372 | $ | 148,085 | $ | 110,011 | ||||||||||||||||||||
(1) Investments with a call feature are shown as of the contractual maturity date.
(2) Excludes mortgage-backed securities totaling $196.6$395.3 million with a yield of 2.47% and mutual funds of $0.9 million.3.0%.
Short-Term Investments. Short-term investments, consisting of Federal Funds Sold, funds due from banks and interest-bearing deposits with banks, averaged $47.5$84.2 million in 2017, $18.82019, $58.9 million in 2016,2018, and $24.6$50.0 million in 2015.2017. At December 31, 2019, 2018, and 2017, 2016,federal funds sold totaled $0, $0 and December 31, 2015, short-term investments totaled $475,000, $425,000 and $321,000,$475 thousand, respectively. These funds are a primary source of the Company's liquidity and are generally invested in an earning capacity on an overnight basis.
Deposits
Deposits. Average total deposits at December 31, 20172019 were $1,494.1 million,$2.804 billion, an increase of $473.0$743 million, or 46.3%36.1% compared to 2016.2018. Average total deposits at December 31, 20162018 were $1,021.1 million,$2.061 billion, an increase of $69.5$567.0 million, or 7.3%37.9% compared to $951.6 million$1.494 billion in 2015.2017. At December 31, 2017,2019, total deposits were $1,470.6 million,$3.077 billion, compared to $1,039.2 million$2.457 billion at December 31, 2016,2018, an increase of $431.4$619 million, or 41.5%25.2%, and $916.7 million$1.471 billion at December 31, 2015.2017. Deposits of $355.6$686.4 million were acquired in 20172019 with the acquisitions of IbervilleFlorida Parishes Bank and Gulf Coast CommunityFirst Florida Bank. Deposits of $889.2 million were acquired in 2018 with the acquisitions of Southwest, Sunshine and FMB.
The following table sets forth the deposits of the Company by category for the period indicated.indicated ($ in thousand).
| Deposits | ||||||||||||||||||||||||
| December 31, | ||||||||||||||||||||||||
| 2017 | 2016 | 2015 | ||||||||||||||||||||||
| Percent of | Percent of | Percent of | ||||||||||||||||||||||
| (Dollars in thousands) | Amount | Deposits | Amount | Deposits | Amount | Deposits | ||||||||||||||||||
| Non-interest-bearing accounts | $ | 301,989 | 20.5 | % | $ | 202,478 | 19.5 | % | $ | 189,445 | 20.6 | % | ||||||||||||
| NOW accounts | 601,694 | 40.9 | % | 430,903 | 41.5 | % | 373,686 | 40.8 | % | |||||||||||||||
| Money market accounts | 149,715 | 10.2 | % | 113,253 | 10.9 | % | 105,434 | 11.5 | % | |||||||||||||||
| Savings accounts | 133,864 | 9.1 | % | 69,540 | 6.7 | % | 68,657 | 7.5 | % | |||||||||||||||
| Time deposits less than $100,000 | 104,648 | 7.1 | % | 77,893 | 7.5 | % | 73,868 | 8.1 | % | |||||||||||||||
| Time deposits of $100,000 or over | 178,655 | 12.2 | % | 145,124 | 13.9 | % | 105,605 | 11.5 | % | |||||||||||||||
| Total deposits | $ | 1,470,565 | 100 | % | $ | 1,039,191 | 100 | % | $ | 916,695 | 100 | % | ||||||||||||
Deposits
| December 31, | ||||||||||||||||||||||||
| 2019 | 2018 | 2017 | ||||||||||||||||||||||
| Percent of | Percent of | Percent of | ||||||||||||||||||||||
| Amount | Deposits | Amount | Deposits | Amount | Deposits | |||||||||||||||||||
| Non-interest-bearing accounts | $ | 723,208 | 23.5 | % | $ | 570,148 | 23.2 | % | $ | 301,989 | 20.5 | % | ||||||||||||
| NOW accounts | 941,598 | 30.6 | % | 835,434 | 34.0 | % | 601,694 | 40.9 | % | |||||||||||||||
| Money market accounts | 462,810 | 15.1 | % | 312,552 | 12.7 | % | 149,715 | 10.2 | % | |||||||||||||||
| Savings accounts | 287,200 | 9.3 | % | 253,724 | 10.3 | % | 133,864 | 9.1 | % | |||||||||||||||
| Time deposits less than $100,000 | 235,367 | 7.6 | % | 194,006 | 7.9 | % | 104,648 | 7.1 | % | |||||||||||||||
| Time deposits of $100,000 or over | 426,350 | 13.9 | % | 291,595 | 11.9 | % | 178,655 | 12.2 | % | |||||||||||||||
| Total deposits | $ | 3,076,533 | 100 | % | $ | 2,457,459 | 100 | % | $ | 1,470,565 | 100 | % | ||||||||||||
The Company’s loan-to-deposit ratio was 84.5% at December 31, 2019, 83.8% at December 31, 2018 and 83.3% at December 31, 2017, 83.4% at December 31, 2016 and 84.3% at December 31, 2015.2017. The loan-to-deposit ratio averaged 78.2%83.5% during 2017.2019. Core deposits, which exclude time deposits of $100,000 or more, provide a relatively stable funding source for the Company's loan portfolio and other earning assets. The Company's core deposits were $1,291.9 million$2.650 billion at December 31, 2017, $894.1 million2019, $2.166 billion at December 31, 2016,2018, and $811.1 million$1.292 billion at December 31, 2015.2017. Management anticipates that a stable base of deposits will be the Company's primary source of funding to meet both its short-term and long-term liquidity needs in the future. The Company has purchased brokered deposits from time to time to help fund loan growth. Brokered deposits and jumbo certificates of deposit generally carry a higher interest rate than traditional core deposits. Further, brokered deposit customers typically do not have loan or other relationships with the Company. The Company has adopted a policy not to permit brokered deposits to represent more than 10% of all of the Company’s deposits.
Maturities of Certificates of Deposit
of $100,000 or More
| After Three | ||||||||||||||||
| Within Three | Through | After Twelve | ||||||||||||||
| (In thousands) | Months | Twelve Months | Months | Total | ||||||||||||
| December 31, 2017 | $ | 24,473 | $ | 67,469 | $ | 86,713 | $ | 178,655 | ||||||||
| After Three | ||||||||||||||||
| Within Three | Through | After Twelve | ||||||||||||||
| ($ in thousands) | Months | Twelve Months | Months | Total | ||||||||||||
| December 31, 2019 | $ | 75,808 | $ | 249,234 | $ | 101,308 | $ | 426,350 | ||||||||
Borrowed Funds
Borrowed funds consist of advances from the Federal Home Loan Bank of Dallas (“FHLB”), loans from First Horizon Bank, federal funds purchased and reverse repurchase agreements. At December 31, 2017,2019, advances from the FHLB totaled $88.1$206.3 million compared to $48.0$85.5 million at December 31, 20162018 and $100.0$88.1 million at December 31, 2015.2017. The advances are collateralized by a blanket lien on the first mortgage loans in the amount of the outstanding borrowings, FHLB capital stock, and amounts on deposit with the FHLB. There were $0,$2.7 million, $0 and $5.3 million in$0 federal funds purchased at December 31, 2019, 2018, and 2017, 2016, and 2015, respectively.
We had one reverse repurchase agreement As part of the FFB acquisition, the Company assumed two loans in the amount of $5,000,000. The agreement was secured by securities$3.5 million and $2.0 million with a fair value of $5,470,105First Horizon Bank. Principal and interest is payable quarterly at December 31, 2016 and $5,501,503 at December 31, 2015. On September 25, 2017, the underlying securities were repurchased and the agreement was terminated.rates ranging from 3.80% - 4.10%.
Subordinated Debentures
In 2006, the Company issued subordinated debentures of $4,124,000$4.1 million to The First Bancshares, Inc. Statutory Trust 2 (“Trust 2”). The Company is the sole owner of the equity of the Trust 2. The Trust 2 issued $4,000,000$4.0 million of preferred securities to investors. The Company makes interest payments and will make principal payments on the debentures to the Trust 2. These payments will be the source of funds used to retire the preferred securities, which are redeemable at any time beginning in 2011 and thereafter, and mature in 2036. The Company entered into this arrangement to provide funding for expected growth.
In 2007, the Company issued subordinated debentures of $6,186,000$6.2 million to The First Bancshares, Inc. Statutory Trust 3 (“Trust 3”). The Company is the sole owner of the equity of the Trust 3. The Trust 3 issued $6,000,000$6.0 million of preferred securities to investors. The Company makes interest payments and will make principal payments on the debentures to the Trust 3. These payments will be the source of funds used to retire the preferred securities, which are redeemable at any time beginning in 2012 and thereafter, and mature in 2037. The Company entered into this arrangement to provide funding for expected growth.
In 2018, the Company acquired FMB Capital Trust 1 (“Trust 1”) as part of its acquisition of FMB Banking Corporation. The Company is the sole owner of the equity of Trust 1. The Trust 1 issued $6.0 million of preferred securities to investors. The Company makes interest payments and will make principal payments on the debentures to the Trust 1. These payments will be the source of funds used to retire the preferred securities, which are redeemable at any time beginning in 2008 and thereafter, and mature in 2033.
Subordinated Notes
On April 30, 2018, The Company entered into two Subordinated Note Purchase Agreements pursuant to which the Company sold and issued $24.0 million in aggregate principal amount of 5.875% fixed-to-floating rate subordinated notes due 2028 and $42.0 million in aggregate principal amount of 6.40% fixed-to-floating rate subordinated notes due 2033 (collectively, the “Notes”).
The Notes are not convertible into or exchangeable for any other securities or assets of the Company or any of its subsidiaries. The Notes are not subject to redemption at the option of the holder. Principal and interest on the Notes are subject to acceleration only in limited circumstances. The Notes are unsecured, subordinated obligations of the Company and rank junior in right to payment to the Company’s current and future senior indebtedness, and each Note is pari passu in right to payment with respect to the other Notes. The Company entered into this arrangement to provide funding for expected growth.
Capital
The Federal Reserve Board and bank regulatory agencies require bank holding companies and financial institutions to maintain capital at adequate levels based on a percentage of assets and off-balance sheet exposures, adjusted for risk weights ranging from 0% for U.S government and agency securities, to 600%. for certain equity exposures. In November 2019, the federal banking agencies adopted a rule revising the scope of commercial real estate mortgages subject to a 150% risk weight. Under the risk-based standard, capital is classified into two tiers. Tier 1 capital consists of common stockholders' equity, excluding the unrealized gain (loss) on available-for-sale securities, minus certain intangible assets. Tier 2 capital consists of the general reserve for loan losses, subject to certain limitations. An institution’s total risk-based capital for purposes of its risk-based capital ratio consists of the sum of its Tier 1 and Tier 2 capital. The risk-based regulatory minimum requirements are 6% for Tier 1 and 8% for total risk-based capital.
Bank holding companies and banks are also required to maintain capital at a minimum level based on total assets, which is known as the leverage ratio. The minimum requirement for the leverage ratio is 4%. All but the highest rated institutions are required to maintain ratios 100 to 200 basis points above the minimum. The Company and The First exceeded their minimum regulatory capital ratios as of December 31, 2017, 20162019, 2018 and 2015.2017.
The Federal Reserve and the Federal Deposit Insurance Corporation approved final capital rules in July 2013, that substantially amended the existing capital rules for banks. These new rules reflect, in part, certain standards initially adopted by the Basel Committee on Banking Supervision in December 2010 (which standards are commonly referred to as “Basel III”) as well as requirements contemplated by the Dodd-Frank Act.
Under the Basel III capital rules, the Company is required to meet certain minimum capital requirements that differ from past capital requirements. The rules implement a new capital ratio of common equity Tier 1 capital to risk-weighted assets. Common equity Tier 1 capital generally consists of retained earnings and common stock (subject to certain adjustments) as well as accumulated other comprehensive income (“AOCI”), however, the Company exercised a one-time irrevocable option to exclude certain components of AOCI as of March 31, 2015. The Company will also beis required to establish a “conservation buffer,” consisting of a common equity Tier 1 capital amount equal to 2.5% of risk-weighted assets to be phased in byeffective January 2019. An institution that does not meet the conservation buffer will be subject to restrictions on certain activities including payment of dividends, stock repurchases, and discretionary bonuses to executive officers.
The prompt corrective action rules have been modified to include the common equity Tier 1 capital ratio and to increase the Tier 1 capital ratio requirements for the various thresholds. For example, the requirements for the Company to be considered well-capitalized under the rules include a 5.0% leverage ratio, a 6.5%7.0% common equity Tier 1capital ratio, an 8.0%8.5% Tier 1 capital ratio, and a 10.0%10.5% total capital ratio. To be adequately capitalized, those ratios are 4.0%, 4.5%, 6.0%, and 8.0%, respectively.
The rules modify the manner in which certain capital elements are determined. The rules make changes to the methods of calculating the risk-weighting of certain assets, which in turn affects the calculation of the risk-weighted capital ratios. Higher risk weights are assigned to various categories of assets, including commercial real estate loans, credit facilities that finance the acquisition, development or construction of real property, certain exposures or credit that are 90 days past due or are non-accrual, securitization exposures, and in certain cases mortgage servicing rights and deferred tax assets.
The Company was required to comply with the new capital rules on January 1, 2015, with a measurement date of March 31, 2015. The conservation buffer will bewas phased-in beginning in 2016, and will taketook full effect on January 1, 2019. Certain calculations under the rules will also have phase-in periods.
Analysis of Capital
| The Company | The First | The Company | The First | |||||||||||||||||||||||||||||||||||||||||||||||||||||||||||||
| Adequately | Well | December 31, | December 31, | Adequately | Well | December 31, | December 31, | |||||||||||||||||||||||||||||||||||||||||||||||||||||||||
| Capital Ratios | Capitalized | Capitalized | 2017 | 2016 | 2015 | 2017 | 2016 | 2015 | Capitalized | Capitalized | 2019 | 2018 | 2017 | 2019 | 2018 | 2017 | ||||||||||||||||||||||||||||||||||||||||||||||||
| Leverage | 4.0 | % | 5.0 | % | 11.7 | % | 11.9 | % | 8.7 | % | 11.4 | % | 13.1 | % | 8.6 | % | 4.0 | % | 5.0 | % | 10.3 | % | 10.2 | % | 11.7 | % | 11.8 | % | 12.2 | % | 11.4 | % | ||||||||||||||||||||||||||||||||
| Risk-based capital: | ||||||||||||||||||||||||||||||||||||||||||||||||||||||||||||||||
| Common equity Tier 1 | 4.5 | % | 6.5 | % | 14.2 | % | 13.8 | % | 8.1 | % | 14.5 | % | 16.2 | % | 11.0 | % | 4.5 | % | 6.5 | % | 12.5 | % | 11.5 | % | 14.2 | % | 15.1 | % | 14.8 | % | 14.5 | % | ||||||||||||||||||||||||||||||||
| Tier 1 | 6.0 | % | 8.0 | % | 14.9 | % | 14.7 | % | 11.1 | % | 14.5 | % | 16.2 | % | 11.0 | % | 6.0 | % | 8.0 | % | 13.0 | % | 12.2 | % | 14.9 | % | 15.1 | % | 14.8 | % | 14.5 | % | ||||||||||||||||||||||||||||||||
| Total | 8.0 | % | 10.0 | % | 15.5 | % | 15.5 | % | 11.9 | % | 15.1 | % | 17.0 | % | 11.8 | % | 8.0 | % | 10.0 | % | 15.8 | % | 15.6 | % | 15.5 | % | 15.6 | % | 15.2 | % | 15.1 | % | ||||||||||||||||||||||||||||||||
Ratios
| 2017 | 2016 | 2015 | ||||||||||
| Return on assets (net income applicable to common stockholders divided by average total assets) | .60 | % | .79 | % | .75 | % | ||||||
| Return on equity (net income applicable to common stockholders divided by average equity) | 6.2 | % | 8.0 | % | 8.6 | % | ||||||
| Dividend payout ratio (dividends per share divided by net income per common share) | 13.5 | % | 9.6 | % | 9.7 | % | ||||||
| Equity to asset ratio (average equity divided by average total assets) | 9.7 | % | 9.8 | % | 8.8 | % | ||||||
| 2019 | 2018 | 2017 | ||||||||||
| Return on assets (net income available to common stockholders divided by average total assets) | 1.26 | % | 0.87 | % | 0.60 | % | ||||||
| Return on equity (net income available to common stockholders divided by average equity) | 9.5 | % | 7.6 | % | 6.2 | % | ||||||
| Dividend payout ratio (dividends per share divided by net income per common share) | 12.2 | % | 12.3 | % | 13.5 | % | ||||||
| Equity to asset ratio (average equity divided by average total assets) | 13.3 | % | 11.5 | % | 9.7 | % | ||||||
Liquidity and Market Risk ManagementCapital Resources
Liquidity management involves monitoring the Company's sources and uses of funds in order to meet its day-to-day cash flow requirements while maximizing profits. Liquidity represents the ability of a company to convert assets into cash or cash equivalents without significant loss and to raise additional funds by increasing liabilities. Liquidity management is made more complicated because different balance sheet components are subject to varying degrees of management control. For example, the timing of maturities of the investment portfolio is very predictable and subject to a high degree of control at the time investment decisions are made; however, net deposit inflows and outflows are far less predictable and are not subject to the same degree of control. Asset liquidity is provided by cash and assets which are readily marketable, which can be pledged, or which will mature in the near future. Liability liquidity is provided by access to core funding sources, principally the ability to generate customer deposits in the Company’s market area.
The Company's federal funds sold position, which includes funds due from banks and interest-bearing deposits with banks, is typically its primary source of liquidity. Federal funds sold averaged $50.0$84.2 million during the year ended December 31, 20172019 and totaled $48.9averaged $58.9 million at December 31, 2017. Also,2018. In addition, the Company has available advances from the Federal Home Loan Bank.FHLB. Advances available are generally based upon the amount of qualified first mortgage loans which can be used for collateral. At December 31, 2017,2019, advances available totaled approximately $556.4$963.3 million, of which $110.6$211.4 million had been drawn, or used for letters of credit.
As of December 31, 2017,2019, the market value of unpledged debt securities plus pledged securities in excess of current pledging requirements comprised $95.5$348.3 million of the Company’s investment balances, compared to $100.2$110.8 million at December 31, 2016.2018. The increase in unpledged debt from December 20172019 compared to December 20162018 is primarily due to an increase in unpledged investments and letters of credit utilized for pledging purposes.acquired deposits. Other forms of balance sheet liquidity include but are not necessarily limited to any outstanding federal funds sold and vault cash. The Company has a higher level of actual balance sheet liquidity than might otherwise be the case, since we utilize a letter of credit from the FHLB rather than investment securities for certain pledging requirements. That letter of credit, which is backed by loans that are pledged to the FHLB by the Company, totaled $17.5 million at December 31, 2017. Management is of the opinionbelieves that available investments and other potentially liquid assets, along with the standby funding sources it has arranged, are more than sufficient to meet the Company’s current and anticipated short-term liquidity needs.
47
The Company’s liquidity ratio as of December 31, 20172019 was 12.8%17.1%, as compared to internal liquidity policy guidelines of 10% minimum. Other liquidity ratios reviewed include the following along with policy guidelines for the periods indicated:
| December 31, 2017 | Policy Maximum | December 31, 2019 | Policy Maximum | |||||||||||||||||
| Loans to Deposits (including FHLB advances) | 71.1 | % | 90.0 | % | In Policy | 79.2 | % | 90.0 | % | In Policy | ||||||||||
| Net Non-core Funding Dependency Ratio | 5.8 | % | 20.0 | % | In Policy | 8.9 | % | 20.0 | % | In Policy | ||||||||||
| Fed Funds Purchased / Total Assets | 0.0 | % | 10.0 | % | In Policy | 0.1 | % | 10.0 | % | In Policy | ||||||||||
| FHLB Advances / Total Assets | 4.9 | % | 20.0 | % | In Policy | 5.2 | % | 20.0 | % | In Policy | ||||||||||
| FRB Advances / Total Assets | 0.0 | % | 10.0 | % | In Policy | 0.0 | % | 10.0 | % | In Policy | ||||||||||
| Pledged Securities to Total Securities | 77.6 | % | 90.0 | % | In Policy | 56.5 | % | 90.0 | % | In Policy | ||||||||||
| December 31, 2016 | Policy Maximum | December 31, 2018 | Policy Maximum | |||||||||||||||||
| Loans to Deposits (including FHLB advances) | 79.1 | % | 90.0 | % | In Policy | 80.5 | % | 90.0 | % | In Policy | ||||||||||
| Net Non-core Funding Dependency Ratio | 8.3 | % | 30.0 | % | In Policy | 3.8 | % | 20.0 | % | In Policy | ||||||||||
| Fed Funds Purchased / Total Assets | 0.4 | % | 10.0 | % | In Policy | 0.0 | % | 10.0 | % | In Policy | ||||||||||
| FHLB Advances / Total Assets | 3.9 | % | 20.0 | % | In Policy | 2.9 | % | 20.0 | % | In Policy | ||||||||||
| FRB Advances / Total Assets | 0.0 | % | 10.0 | % | In Policy | 0.0 | % | 10.0 | % | In Policy | ||||||||||
| Pledged Securities to Total Securities | 66.6 | % | 90.0 | % | In Policy | 77.8 | % | 90.0 | % | In Policy | ||||||||||
| December 31, 2015 | Policy Maximum | |||||||||
| Loans to Deposits (including FHLB advances) | 75.4 | % | 90.0 | % | In Policy | |||||
| Net Non-core Funding Dependency Ratio | 13.8 | % | 30.0 | % | In Policy | |||||
| Fed Funds Purchased / Total Assets | 0.9 | % | 10.0 | % | In Policy | |||||
| FHLB Advances / Total Assets | 8.9 | % | 20.0 | % | In Policy | |||||
| FRB Advances / Total Assets | 0.0 | % | 10.0 | % | In Policy | |||||
| Pledged Securities to Total Securities | 84.7 | % | 90.0 | % | In Policy | |||||
| December 31, 2017 | Policy Maximum | |||||||||
| Loans to Deposits (including FHLB advances) | 71.1 | % | 90.0 | % | In Policy | |||||
| Net Non-core Funding Dependency Ratio | 5.8 | % | 30.0 | % | In Policy | |||||
| Fed Funds Purchased / Total Assets | 0.0 | % | 10.0 | % | In Policy | |||||
| FHLB Advances / Total Assets | 4.9 | % | 20.0 | % | In Policy | |||||
| FRB Advances / Total Assets | 0.0 | % | 10.0 | % | In Policy | |||||
| Pledged Securities to Total Securities | 77.6 | % | 90.0 | % | In Policy | |||||
Continued growth in core deposits and relatively high levels of potentially liquid investments have had a positive impact on our liquidity position in recent periods, but no assurance can be provided that our liquidity will continue at current robust levels.
The holding company’s primary uses of funds are ordinary operating expenses and stockholder dividends, and its primary source of funds is dividends from the Bank since the holding company does not conduct regular banking operations. Management anticipates that the Bank will have sufficient earnings to provide dividends to the holding company to meet its funding requirements for the foreseeable future.
Management regularly reviews the liquidity position of the Company and has implemented internal policies which establish guidelines for sources of asset-based liquidity and limit the total amount of purchased funds used to support the balance sheet and funding from non-core sources.
On March 28, 2019, the Company announced that its Board of Directors authorized a share repurchase program to purchase up to an aggregate of $20 million of the Company’s common stock (the “March 2019 program”). This share repurchase program has an expiration date of December 31, 2019. Under the March 2019 program, the Company may repurchase shares of its common stock periodically in a manner determined by the Company’s management. The actual means and timing of purchase, target number of shares and maximum price or range of prices under the program will be determined by management at its discretion and will depend on a number of factors, including the market price of the Company’s common stock, general market and economic conditions, and applicable legal and regulatory requirements. The Company repurchased 168,188 shares under the March 2019 program in 2019.
Commitments and Contractual Obligations
The following table presents, as of December 31, 2017,2019, fixed and determinable contractual obligations to third parties by payment date. Amounts in the table do not include accrued or accruing interest. Payments related to leases are based on actual payments specified in the underlying contracts. Further discussion of the nature of each obligation is included in the referenced note to the consolidated financial statements included elsewhere in this Form 10-K.
| (In thousands) | Note Reference | Within One Year | After One But Within Three Years | After Three But Within Five Years | After Five Years | Total | ||||||||||||||||||||||||||||||||||||||||
| ($ in thousands) | Note Reference | Within One Year | After One But Within Three Years | After Three But Within Five Years | After Five Years | Total | ||||||||||||||||||||||||||||||||||||||||
| Deposits without a stated maturity | G | $ | 1,187,289 | $ | - | $ | - | $ | - | $ | 1,187,289 | G | $ | 2,414,816 | $ | - | $ | - | $ | - | $ | 2,414,816 | ||||||||||||||||||||||||
| Time deposits | G | 152,550 | 105,098 | 25,628 | - | 283,276 | G | 502,148 | 130,481 | 28,976 | 113 | 661,718 | ||||||||||||||||||||||||||||||||||
| Borrowings | H | 93,572 | 10,500 | - | - | 104,072 | H | 208,965 | 5,354 | 214,319 | ||||||||||||||||||||||||||||||||||||
| Operating lease obligations | I | 586 | 257 | 343 | 312 | 1,498 | ||||||||||||||||||||||||||||||||||||||||
| Capital lease obligations | I | 275 | 466 | 175 | - | 916 | ||||||||||||||||||||||||||||||||||||||||
| Lease obligations | I | 1,643 | 2,886 | 1,475 | 981 | 6,985 | ||||||||||||||||||||||||||||||||||||||||
| Trust preferred subordinated debentures | N | - | - | - | 10,310 | 10,310 | N | - | - | - | 15,742 | 15,742 | ||||||||||||||||||||||||||||||||||
| Subordinated note purchase agreement | N | - | - | - | 64,936 | 64,936 | ||||||||||||||||||||||||||||||||||||||||
| Total Contractual obligations | $ | 1,434,272 | $ | 116,321 | $ | 26,146 | $ | 10,622 | $ | 1,587,361 | $ | 3,127,572 | $ | 133,367 | $ | 30,451 | $ | 87,126 | $ | 3,378,516 | ||||||||||||||||||||||||||
Subprime Assets
The Bank does not engage in subprime lending activities targeted towards borrowers in high risk categories.
Accounting Matters
Information on new accounting matters is set forth in Note B – Summary of Significant Accounting Policies in the accompanying notes to the consolidated financial statements included elsewhere in this report. This information is incorporated herein by reference.
Impact of Inflation
Unlike most industrial companies, the assets and liabilities of financial institutions such as the Company are primarily monetary in nature. Therefore, interest rates have a more significant effect on the Company's performance than do the effects of changes in the general rate of inflation and change in prices. In addition, interest rates do not necessarily move in the same direction or in the same magnitude as the prices of goods and services. As discussed previously, management seeks to manage the relationships between interest sensitive assets and liabilities in order to protect against wide interest rate fluctuations, including those resulting from inflation.
ITEM 7A. QUANTITATIVE AND QUALITATIVE DISCLOSURES ABOUT MARKET RISK
Interest Rate Risk Management
Market risk arises from changes in interest rates, exchange rates, commodity prices and equity prices. The Company does not engage in the trading of financial instruments, nor does it have exposure to currency exchange rates. Our market risk exposure is primarily that of interest rate risk, and we have established policies and procedures to monitor and limit our earnings and balance sheet exposure to changes in interest rates. The principal objective of interest rate risk management is to manage the financial components of the Company’s balance sheet in a manner that will optimize the risk/reward equation for earnings and capital under a variety of interest rate scenarios.
To identify areas of potential exposure to interest rate changes, we utilize commercially available modeling software to perform earnings simulations and calculate the Company’s market value of portfolio equity under varying interest rate scenarios every month. The model imports relevant information for the Company’s financial instruments and incorporates Management’s assumptions on pricing, duration, and optionality for anticipated new volumes. Various rate scenarios consisting of key rate and yield curve projections are then applied in order to calculate the expected effect of a given interest rate change on interest income, interest expense, and the value of the Company’s financial instruments. The rate projections can be shocked (an immediate and parallel change in all base rates, up or down), ramped (an incremental increase or decrease in rates over a specified time period), economic (based on current trends and econometric models) or stable (unchanged from current actual levels).
We use seven standard interest rate scenarios in conducting our 12-month net interest income simulations: “static,” upward shocks of 100, 200, 300 and 400 basis points, and downward shocks of 100, and 200 basis points. Pursuant to policy guidelines, we typically attempt to limit the projected decline in net interest income relative to the stable rate scenario to no more than 5% for a 100 basis point (bp) interest rate shock, 10% for a 200 bp shock, 15% for a 300 bp shock, and 20% for a 400 bp shock. As of December 31, 2017,2019, the Company had the following estimated net interest income, sensitivity profiles, without factoring in any potential negative impact on spreads resulting from competitive pressures or credit quality deterioration:
| December 31, 2017 | Net Interest Income at Risk – Sensitivity Year 1 | |||||||||||||||||||||||||||
| ($ In Thousands) | -200 bp | -100 bp | STATIC | +100 bp | +200 bp | +300 bp | +400 bp | |||||||||||||||||||||
| Net Interest Income | 54,702 | 56,491 | 60,023 | 61,041 | 60,588 | 58,764 | 55,384 | |||||||||||||||||||||
| Dollar Change | -5,321 | -3,532 | 1,018 | 565 | -1,259 | -4,639 | ||||||||||||||||||||||
| NII @ Risk - Sensitivity Y1 | -8.9 | % | -5.9 | % | 1.7 | % | 0.9 | % | -2.1 | % | -7.7 | % | ||||||||||||||||
| December 31, 2019 | Net Interest Income at Risk – Year 1 | |||||||||||||||||||||||||||
| ($ in thousands) | -200 bp | -100 bp | STATIC | +100 bp | +200 bp | +300 bp | +400 bp | |||||||||||||||||||||
| Net Interest Income | 120,507 | 123,188 | 127,027 | 128,989 | 129,919 | 129,723 | 127,934 | |||||||||||||||||||||
| Dollar Change | -6,520 | -3,839 | 1,962 | 2,892 | 2,696 | 907 | ||||||||||||||||||||||
| NII @ Year 1 | -5.1 | % | -3.0 | % | 1.6 | % | 2.3 | % | 2.1 | % | 0.7 | % | ||||||||||||||||
If there were an immediate and sustained downward adjustment of 200 basis points in interest rates, all else being equal, net interest income over the next twelve months would likely be approximately $5.3$6.5 million lower than in a stable interest rate scenario, for a negative variance of 8.9%5.1%. The unfavorable variance increases if rates were to drop below 200 basis points, due to the fact that certain deposit rates are already relatively low (on NOW accounts and savings accounts, for example), and will hit a natural floor of close to zero while non-floored variable-rate loan yields continue to drop. This effect is exacerbated by accelerated prepayments on fixed-rate loans and mortgage-backed securities when rates decline, although rate floors on some of our variable-rate loans partially offset other negative pressures. While we view further interest rate reductions as highly unlikely, the potential percentage drop in net interest income exceeds our internal policy guidelines in declining interest rate scenarios and we will continue to monitor our interest rate risk profile and take corrective action as deemed appropriate.
Net interest income would likely improveincrease by $0.5$2.9 million, or 0.9%2.3%, if interest rates were to increase by 200 basis points relative to a stable interest rate scenario, with the favorable variance expanding the higher interest rates rise. The initial increase in rising rate scenarios will be limited to some extent by the fact that some of our variable-rate loans are currently at rate floors, resulting in a re-pricing lag while base rates are increasing to floored levels, but we believe the Company still would benefit from a material upward shift in the yield curve.
The Company’s one year cumulative GAP ratio was approximately 221.83%151.9% at December 31, 2017 and 199.4%2019, 191.6% at December 31, 2016,2018 and 221.8% at December 31, 2017. The Company is considered “asset-sensitive” which means that there are more assets repricing than liabilities within the first year. The Company is “asset-sensitive.” The Company’s one year cumulative GAP ratio was approximately 168.3% at December 31, 2015, which meant that there were more liabilities repricing than assets within the first year. These results are based on cash flows from assumptions of assets and liabilities that reprice (maturities, likely calls, prepayments, etc.) Typically, the net interest income of asset-sensitive companies should improve with rising rates and decrease with declining rates.
In addition to the net interest income simulations shown above, we run stress scenarios modeling the possibility of no balance sheet growth, the potential runoff of “surge” core deposits which flowed into the Company in the most recent economic cycle, and potential unfavorable movement in deposit rates relative to yields on earning assets. Even though net interest income will naturally be lower with no balance sheet growth, the rate-driven variances projected for net interest income in a static growth environment are similar to the changes noted above for our standard projections. When a greater level of non-maturity deposit runoff is assumed or unfavorable deposit rate changes are factored into the model, projected net interest income in declining rate and flat rate scenarios does not change materially relative to standard growth projections. However, the benefit we would otherwise experience in rising rate scenarios is minimized and net interest income remains relatively flat.
The economic value (or “fair value”) of financial instruments on the Company’s balance sheet will also vary under the interest rate scenarios previously discussed. The difference between the projected fair value of the Company’s financial assets and the fair value of its financial liabilities is referred to as the economic value of equity (“EVE”), and changes in EVE under different interest rate scenarios are effectively a gauge of the Company’s longer-term exposure to interest rate risk. Fair values for financial instruments are estimated by discounting projected cash flows (principal and interest) at projected replacement interest rates for each account type, while the fair value of non-financial accounts is assumed to equal their book value for all rate scenarios. An economic value simulation is a static measure utilizing balance sheet accounts at a given point in time, and the measurement can change substantially over time as the characteristics of the Company’s balance sheet evolve and interest rate and yield curve assumptions are updated.
The change in economic value under different interest rate scenarios depends on the characteristics of each class of financial instrument, including stated interest rates or spreads relative to current or projected market-level interest rates or spreads, the likelihood of principal prepayments, whether contractual interest rates are fixed or floating, and the average remaining time to maturity. As a general rule, fixed-rate financial assets become more valuable in declining rate scenarios and less valuable in rising rate scenarios, while fixed-rate financial liabilities gain in value as interest rates rise and lose value as interest rates decline. The longer the duration of the financial instrument, the greater the impact a rate change will have on its value. In our economic value simulations, estimated prepayments are factored in for financial instruments with stated maturity dates, and decay rates for non-maturity deposits are projected based on historical patterns and Management’s best estimates. The table below shows estimated changes in the Company’s EVE as of the periods indicated under different interest rate scenarios relative to a base case of current interest rates:
| December 31, 2017 - Balance Sheet Shock | December 31, 2019 - Balance Sheet Shock | |||||||||||||||||||||||||||||||||||||||||||||||||||||||
| (Dollars in thousands) | -200 bp | -100 bp | STATIC (Base) | +100 bp | +200 bp | +300 bp | +400 bp | |||||||||||||||||||||||||||||||||||||||||||||||||
| ($ in thousands) | -200 bp | -100 bp | STATIC (Base) | +100 bp | +200 bp | +300 bp | +400 bp | |||||||||||||||||||||||||||||||||||||||||||||||||
| Market Value of Equity | 274,743 | 252,585 | 320,631 | 375,144 | 412,957 | 437,500 | 449,926 | 834,772 | 780,800 | 833,959 | 916,032 | 969,472 | 999,703 | 1,011,517 | ||||||||||||||||||||||||||||||||||||||||||
| Change in EVE from base | -45,888 | -68,046 | 54,513 | 92,326 | 116,896 | 129,295 | 813 | -53,159 | 82,073 | 135,513 | 165,744 | 177,558 | ||||||||||||||||||||||||||||||||||||||||||||
| % Change | -14.3 | % | -21.2 | % | 17.0 | % | 28.8 | % | 36.5 | % | 40.3 | % | 0.1 | % | -6.4 | % | 9.8 | % | 16.3 | % | 19.9 | % | 21.3 | % | ||||||||||||||||||||||||||||||||
| Policy Limits | -20.0 | % | -10.0 | % | -10.0 | % | -20.0 | % | -30.0 | % | -40.0 | % | -20.0 | % | -10.0 | % | -10.0 | % | -20.0 | % | -30.0 | % | -40.0 | % | ||||||||||||||||||||||||||||||||
| December 31, 2016 - Balance Sheet Shock | December 31, 2018 - Balance Sheet Shock | |||||||||||||||||||||||||||||||||||||||||||||||||||||||
| (Dollars in thousands) | -200 bp | -100 bp | STATIC (Base) | +100 bp | +200 bp | +300 bp | +400 bp | |||||||||||||||||||||||||||||||||||||||||||||||||
| ($ in thousands) | -200 bp | -100 bp | STATIC (Base) | +100 bp | +200 bp | +300 bp | +400 bp | |||||||||||||||||||||||||||||||||||||||||||||||||
| Market Value of Equity | 315,609 | 323,038 | 356,983 | 384,268 | 406,044 | 424,054 | 438,668 | 583,220 | 635,499 | 736,005 | 801,046 | 843,268 | 867,553 | 875,626 | ||||||||||||||||||||||||||||||||||||||||||
| Change in EVE from base | -41,374 | -33,945 | 27,285 | 49,061 | 67,071 | 81,685 | -152,785 | -100,506 | 65,041 | 107,263 | 131,548 | 139,621 | ||||||||||||||||||||||||||||||||||||||||||||
| % Change | -11.6 | % | -9.5 | % | 7.6 | % | 13.7 | % | 18.8 | % | 22.9 | % | -20.8 | % | -13.7 | % | 8.8 | % | 14.6 | % | 17.9 | % | 19.0 | % | ||||||||||||||||||||||||||||||||
| Policy Limits | -20.00 | % | -10.00 | % | -10.00 | % | -20.00 | % | -30.00 | % | -40.00 | % | -20.0 | % | -10.0 | % | -10.0 | % | -20.0 | % | -30.0 | % | -40.0 | % | ||||||||||||||||||||||||||||||||
The tables show that our EVE will generally deteriorate in declining rate scenarios, but should benefit from a parallel shift upward in the yield curve. As noted previously, however, Management is of the opinion that the potential for a significant rate decline is low. We also run stress scenarios for EVE to simulate the possibility of higher loan prepayment rates, unfavorable changes in deposit rates, and higher deposit decay rates. Model results are highly sensitive to changes in assumed decay rates for non-maturity deposits, in particular.
51
| ITEM 8. | FINANCIAL STATEMENTS AND SUPPLEMENTARY DATA |
REPORT OF INDEPENDENTReport of Independent Registered Public Accounting Firm
REGISTERED PUBLIC ACCOUNTING FIRM
Shareholders and the Board of Directors of The First Bancshares, Inc.
Hattiesburg, Mississippi
Opinions on the Financial Statements and Internal Control over Financial Reporting
We have audited the accompanying consolidated balance sheets of The First Bancshares, Inc. (the "Company") as of December 31, 2019 and 2018, the related consolidated statements of income, comprehensive income, changes in stockholders’ equity, and cash flows for each of the years ended December 31, 2019 and 2018, and the related notes (collectively referred to as the "financial statements"). We also have audited the Company’s internal control over financial reporting as of December 31, 2019, based on criteria established in Internal Control – Integrated Framework: (2013) issued by the Committee of Sponsoring Organizations of the Treadway Commission (COSO).
In our opinion, the financial statements referred to above present fairly, in all material respects, the financial position of the Company as of December 31, 2019 and 2018, and the results of its operations and its cash flows for each of the years ended December 31, 2019 and 2018 in conformity with accounting principles generally accepted in the United States of America. Also in our opinion, the Company maintained, in all material respects, effective internal control over financial reporting as of December 31, 2019, based on criteria established in Internal Control – Integrated Framework: (2013) issued by COSO.
Basis for Opinions
The Company’s management is responsible for these financial statements, for maintaining effective internal control over financial reporting, and for its assessment of the effectiveness of internal control over financial reporting, included in the accompanying Management’s Report on Internal Control over Financial Reporting. Our responsibility is to express an opinion on the Company’s financial statements and an opinion on the Company’s internal control over financial reporting based on our audits. We are a public accounting firm registered with the Public Company Accounting Oversight Board (United States) ("PCAOB") and are required to be independent with respect to the Company in accordance with the U.S. federal securities laws and the applicable rules and regulations of the Securities and Exchange Commission and the PCAOB.
We conducted our audits in accordance with the standards of the PCAOB. Those standards require that we plan and perform the audits to obtain reasonable assurance about whether the financial statements are free of material misstatement, whether due to error or fraud, and whether effective internal control over financial reporting was maintained in all material respects.
Our audits of the financial statements included performing procedures to assess the risks of material misstatement of the financial statements, whether due to error or fraud, and performing procedures that respond to those risks. Such procedures included examining, on a test basis, evidence regarding the amounts and disclosures in the financial statements. Our audits also included evaluating the accounting principles used and significant estimates made by management, as well as evaluating the overall presentation of the financial statements. Our audit of internal control over financial reporting included obtaining an understanding of internal control over financial reporting, assessing the risk that a material weakness exists, and testing and evaluating the design and operating effectiveness of internal control based on the assessed risk. As permitted, The First Bancshares, Inc. has excluded the operations of FPB Financial Corp. and First Florida Bancorp, Inc. acquired during 2019, which is described in Note C of the consolidated financial statements, from the scope of Management’s Report on Internal Control over Financial Reporting. As such, it has also been excluded from the scope of our audit of internal control over financial reporting. Our audits also included performing such other procedures as we considered necessary in the circumstances. We believe that our audits provide a reasonable basis for our opinions.
Definition and Limitations of Internal Control Over Financial Reporting
A company’s internal control over financial reporting is a process designed to provide reasonable assurance regarding the reliability of financial reporting and the preparation of financial statements for external purposes in accordance with generally accepted accounting principles. A company’s internal control over financial reporting includes those policies and procedures that (1) pertain to the maintenance of records that, in reasonable detail, accurately and fairly reflect the transactions and dispositions of the assets of the company; (2) provide reasonable assurance that transactions are recorded as necessary to permit preparation of financial statements in accordance with generally accepted accounting principles, and that receipts and expenditures of the company are being made only in accordance with authorizations of management and directors of the company; and (3) provide reasonable assurance regarding prevention or timely detection of unauthorized acquisition, use, or disposition of the company’s assets that could have a material effect on the financial statements.
Because of its inherent limitations, internal control over financial reporting may not prevent or detect misstatements. Also, projections of any evaluation of effectiveness to future periods are subject to the risk that controls may become inadequate because of changes in conditions, or that the degree of compliance with the policies or procedures may deteriorate.
/s/ Crowe LLP
We have served as the Company's auditor since 2018
Atlanta, Georgia
March 16, 2020
| 53 |
Report of Independent Registered Public Accounting Firm
To the Board of Directors and Shareholders of
The First Bancshares, Inc.
Hattiesburg, Mississippi
Opinion on the Financial Statements
We have audited the accompanying consolidated balance sheets of The First Bancshares, Inc. and subsidiary (the "Company") as of December 31, 2017 and 2016, the related consolidated statements of income, comprehensive income, changes in stockholders’ equity, and cash flows of The First Bancshares, Inc., and subsidiary (the “Company”) for each of the three years in the periodyear ended December 31, 2017, and the related notes (collectively referred to as the “financial statements”). In our opinion, the 2017 financial statements present fairly, in all material respects, the financial positionresults of the Company as of December 31, 2017 and 2016, and the results of itsCompany’s operations and its cash flows for each of the three years in the periodyear ended December 31, 2017, in conformity with theaccounting principles generally accepted accounting principles in the United States of America.
We also have audited, in accordance with the standards of the Public Company Accounting Oversight Board (United States) (PCAOB), the Company’s internal control over financial reporting as of December 31, 2017, based on criteria established in Internal Control-Integrated Framework issued by the Committee of Sponsoring Organizations of the Treadway Commission (2013 framework) and our report dated March 16, 2018, expressed an unqualified opinion thereon.
Basis for Opinion
These financial statements are the responsibility of the Company'sCompany’s management. Our responsibility is to express an opinion on the Company'sCompany’s financial statements based on our audits.audit. We are a public accounting firm registered with the PCAOBPublic Company Accounting Oversight Board (United States) (PCAOB) and are required to be independent with respect to the Company in accordance with the U.S. federal securities laws and the applicable rules and regulations of the Securities and Exchange Commission and the PCAOB.
We conducted our auditsaudit in accordance with the standards of the PCAOB. Those standards require that we plan and perform the audit to obtain reasonable assurance about whether the financial statements are free of material misstatement, whether due to error or fraud. Our auditsaudit included performing procedures to assess the risks of material misstatement of the financial statements, whether due to error or fraud, and performing procedures that respond to those risks. Such procedures included examining, on a test basis, evidence regarding the amounts and disclosures in the financial statements. Our auditsaudit also included evaluating the accounting principles used and significant estimates made by management, as well as evaluating the overall presentation of the financial statements. We believe that our audits provideaudit provides a reasonable basis for our opinion.
| /s/ |
We have served as the Company’s auditors since 1996.
Columbus, Mississippi
March 16, 2018
We began serving as the Company’s auditor in 1996. In 2018, we became the predecessor auditor.
| 54 |
CONSOLIDATED BALANCE SHEETS
DECEMBER 31, 20172019 AND 20162018
($ in thousands except per share data)
| 2017 | 2016 | 2019 | 2018 | |||||||||||||
| ASSETS | ||||||||||||||||
| Cash and due from banks | $ | 42,980,353 | $ | 31,719,187 | $ | 89,736 | $ | 71,356 | ||||||||
| Interest-bearing deposits with banks | 48,466,424 | 29,974,698 | 79,128 | 87,751 | ||||||||||||
| Federal funds sold | 475,000 | 425,000 | ||||||||||||||
| Total cash and cash equivalents | 91,921,777 | 62,118,885 | 168,864 | 159,107 | ||||||||||||
| Held-to-maturity securities (fair value of $7,397,966 in 2017 and $7,393,828 in 2016) | 6,000,000 | 6,000,000 | ||||||||||||||
| Available-for-sale securities | 356,893,081 | 243,205,963 | ||||||||||||||
| Held-to-maturity securities (fair value of $0 in 2019 and $7,028 in 2018) | - | 6,000 | ||||||||||||||
| Debt securities available-for-sale securities | 765,087 | 492,224 | ||||||||||||||
| Other securities | 9,969,200 | 6,592,750 | 26,690 | 16,704 | ||||||||||||
| Total securities | 372,862,281 | 255,798,713 | 791,777 | 514,928 | ||||||||||||
| Loans held for sale | 4,790,049 | 5,879,884 | 10,810 | 4,838 | ||||||||||||
| Loans, net of allowance for loan losses of $8,288,009 in 2017 and $7,510,314 in 2016 | 1,217,017,663 | 859,543,789 | ||||||||||||||
| Loans, net of allowance for loan losses of $13,908 in 2019 and $10,065 in 2018 | 2,586,450 | 2,050,357 | ||||||||||||||
| Interest receivable | 6,704,915 | 4,358,098 | 14,802 | 10,778 | ||||||||||||
| Premises and equipment | 46,426,031 | 34,624,352 | 104,980 | 74,783 | ||||||||||||
| Cash surrender value of life insurance | 27,053,909 | 21,250,476 | 59,572 | 50,796 | ||||||||||||
| Goodwill | 19,959,849 | 13,776,040 | 158,572 | 89,750 | ||||||||||||
| Other real estate owned | 7,158,409 | 6,007,621 | 7,299 | 10,869 | ||||||||||||
| Other assets | 19,343,560 | 14,009,388 | 38,737 | 37,780 | ||||||||||||
| Total assets | $ | 1,813,238,443 | $ | 1,277,367,246 | $ | 3,941,863 | $ | 3,003,986 | ||||||||
| LIABILITIES AND STOCKHOLDERS’ EQUITY | ||||||||||||||||
| Deposits: | ||||||||||||||||
| Non-interest-bearing | $ | 301,988,781 | $ | 202,478,442 | $ | 723,208 | $ | 570,148 | ||||||||
| Interest-bearing | 1,168,575,736 | 836,712,820 | 2,353,325 | 1,887,311 | ||||||||||||
| Total deposits | 1,470,564,517 | 1,039,191,262 | 3,076,533 | 2,457,459 | ||||||||||||
| Interest payable | 353,143 | 306,080 | 2,508 | 1,519 | ||||||||||||
| Borrowed funds | 104,072,294 | 69,000,000 | 214,319 | 85,500 | ||||||||||||
| Subordinated debentures | 10,310,000 | 10,310,000 | 80,678 | 80,521 | ||||||||||||
| Other liabilities | 5,470,569 | 4,033,197 | 24,167 | 15,733 | ||||||||||||
| Total liabilities | 1,590,770,523 | 1,122,840,539 | 3,398,205 | 2,640,732 | ||||||||||||
| Stockholders’ Equity: | ||||||||||||||||
| Common stock, par value $1 per share: 20,000,000 shares authorized; 11,192,401 shares issued in 2017, and 9,017,891 shares issued in 2016, respectively | 11,192,401 | 9,017,891 | ||||||||||||||
| Common stock, par value $1 per share: 40,000,000 shares authorized;18,996,948 shares issued in 2019, 40,000,000 shares authorized and 14,857,092 shares issued in 2018, respectively | 18,997 | 14,857 | ||||||||||||||
| Additional paid-in capital | 158,455,979 | 102,574,159 | 409,805 | 278,659 | ||||||||||||
| Retained earnings | 53,720,927 | 44,476,386 | 110,460 | 71,998 | ||||||||||||
| Accumulated other comprehensive income (loss) | (437,742 | ) | (1,078,084 | ) | 10,089 | (1,796 | ) | |||||||||
| Treasury stock, at cost | (463,645 | ) | (463,645 | ) | ||||||||||||
| Treasury stock, at cost (194,682 shares - 2019; 26,494 shares - 2018) | (5,693 | ) | (464 | ) | ||||||||||||
| Total stockholders’ equity | 222,467,920 | 154,526,707 | 543,658 | 363,254 | ||||||||||||
| Total liabilities and stockholders’ equity | $ | 1,813,238,443 | $ | 1,277,367,246 | $ | 3,941,863 | $ | 3,003,986 | ||||||||
The accompanying notes are an integral part of these statements.
| 55 |
CONSOLIDATED STATEMENTS OF INCOME
YEARS ENDED DECEMBER 31, 2019, 2018, AND 2017
($ in thousands, except per share amount)
| 2019 | 2018 | 2017 | ||||||||||
| INTEREST INCOME | ||||||||||||
| Interest and fees on loans | $ | 128,858 | $ | 86,822 | $ | 56,826 | ||||||
| Interest and dividends on securities: | ||||||||||||
| Taxable interest and dividends | 14,244 | 9,020 | 6,341 | |||||||||
| Tax-exempt interest | 3,566 | 2,939 | 2,350 | |||||||||
| Interest on federal funds sold | 7 | 206 | 390 | |||||||||
| Interest on deposits in banks | 1,854 | 991 | 162 | |||||||||
| Total interest income | 148,529 | 99,978 | 66,069 | |||||||||
| INTEREST EXPENSE | ||||||||||||
| Interest on deposits | 19,763 | 10,785 | 5,261 | |||||||||
| Interest on borrowed funds | 6,960 | 4,306 | 1,648 | |||||||||
| Total interest expense | 26,723 | 15,091 | 6,909 | |||||||||
| Net interest income | 121,806 | 84,887 | 59,160 | |||||||||
| Provision for loan losses | 3,738 | 2,120 | 506 | |||||||||
| Net interest income after provision for loan losses | 118,068 | 82,767 | 58,654 | |||||||||
| NON-INTEREST INCOME | ||||||||||||
| Service charges on deposit accounts | 7,838 | 5,792 | 3,601 | |||||||||
| Other service charges and fees | 1,047 | 996 | 624 | |||||||||
| Interchange fees | 8,024 | 5,247 | 3,758 | |||||||||
| Secondary market mortgage income | 5,988 | 4,048 | 4,502 | |||||||||
| Bank owned life insurance income | 1,414 | 937 | 739 | |||||||||
| Gain (loss) on sale of premises | 13 | (137 | ) | (22 | ) | |||||||
| Securities gains (losses) | 122 | 334 | (16 | ) | ||||||||
| Gain (loss) on sale of other real estate | (144 | ) | 60 | (199 | ) | |||||||
| Financial assistance and bank enterprise awards | 947 | 2,098 | - | |||||||||
| Other | 1,698 | 1,186 | 1,376 | |||||||||
| Total non-interest income | 26,947 | 20,561 | 14,363 | |||||||||
| NON-INTEREST EXPENSE | ||||||||||||
| Salaries | 41,065 | 33,640 | 25,828 | |||||||||
| Employee benefits | 6,610 | 4,662 | 4,720 | |||||||||
| Occupancy | 8,775 | 6,818 | 4,828 | |||||||||
| Furniture and equipment | 1,838 | 1,575 | 1,225 | |||||||||
| Supplies and printing | 890 | 846 | 640 | |||||||||
| Professional and consulting fees | 6,449 | 5,381 | 6,757 | |||||||||
| Marketing and public relations | 859 | 508 | 406 | |||||||||
| FDIC and OCC assessments | 632 | 1,382 | 1,252 | |||||||||
| ATM expense | 2,821 | 3,241 | 1,188 | |||||||||
| Bank communications | 1,367 | 2,014 | 1,296 | |||||||||
| Data processing | 1,285 | 6,931 | 1,039 | |||||||||
| Other | 15,978 | 9,313 | 6,267 | |||||||||
| Total non-interest expense | 88,569 | 76,311 | 55,446 | |||||||||
| Income before income taxes | $ | 56,446 | $ | 27,017 | $ | 17,571 | ||||||
| Income taxes | 12,701 | 5,792 | 6,955 | |||||||||
| Net income available to common stockholders | $ | 43,745 | $ | 21,225 | $ | 10,616 | ||||||
| Earnings per share: | ||||||||||||
| Basic | $ | 2.57 | $ | 1.63 | $ | 1.12 | ||||||
| Diluted | 2.55 | 1.62 | 1.11 | |||||||||
The accompanying notes are an integral part of these statements.
THE FIRST BANCSHARES, INC.
CONSOLIDATED STATEMENTS OF INCOME
YEARS ENDED DECEMBER 31, 2017, 2016, AND 2015
| 2017 | 2016 | 2015 | ||||||||||
| INTEREST INCOME | ||||||||||||
| Interest and fees on loans | $ | 56,826,566 | $ | 38,495,909 | $ | 34,242,067 | ||||||
| Interest and dividends on securities: | ||||||||||||
| Taxable interest and dividends | 6,340,610 | 4,052,162 | 3,948,459 | |||||||||
| Tax-exempt interest | 2,349,889 | 1,869,644 | 1,854,213 | |||||||||
| Interest on federal funds sold | 389,881 | 126,833 | 63,841 | |||||||||
| Interest on deposits in banks | 162,467 | 59,449 | 93,276 | |||||||||
| Total interest income | 66,069,413 | 44,603,997 | 40,201,856 | |||||||||
| INTEREST EXPENSE | ||||||||||||
| Interest on deposits | 5,261,318 | 3,443,812 | 2,562,241 | |||||||||
| Interest on borrowed funds | 1,647,933 | 871,523 | 645,207 | |||||||||
| Total interest expense | 6,909,251 | 4,315,335 | 3,207,448 | |||||||||
| Net interest income | 59,160,162 | 40,288,662 | 36,994,408 | |||||||||
| Provision for loan losses | 505,653 | 625,271 | 410,069 | |||||||||
| Net interest income after provision for loan losses | 58,654,509 | 39,663,391 | 36,584,339 | |||||||||
| OTHER INCOME | ||||||||||||
| Service charges on deposit accounts | 7,358,531 | 5,125,846 | 5,013,983 | |||||||||
| Other service charges and fees | 623,706 | 531,162 | 470,842 | |||||||||
| Secondary market mortgage income | 4,501,618 | 4,432,705 | 1,075,118 | |||||||||
| Bank owned life insurance income | 738,659 | 528,734 | 408,535 | |||||||||
| Gain (Loss) on sale of premises | (22,123 | ) | (51,838 | ) | 133,339 | |||||||
| Securities gains (losses) | (15,889 | ) | 126,286 | - | ||||||||
| Loss on sale of other real estate | (198,296 | ) | (113,755 | ) | (246,859 | ) | ||||||
| Other | 1,376,906 | 668,194 | 733,574 | |||||||||
| Total other income | 14,363,112 | 11,247,334 | 7,588,532 | |||||||||
| OTHER EXPENSE | ||||||||||||
| Salaries | 25,828,269 | 17,880,844 | 15,089,136 | |||||||||
| Employee benefits | 4,719,821 | 4,255,690 | 3,447,367 | |||||||||
| Occupancy | 4,827,711 | 3,459,206 | 3,422,116 | |||||||||
| Furniture and equipment | 1,224,655 | 1,261,506 | 1,198,930 | |||||||||
| Supplies and printing | 640,171 | 286,880 | 300,022 | |||||||||
| Professional and consulting fees | 6,756,847 | 1,805,420 | 1,331,928 | |||||||||
| Marketing and public relations | 405,552 | 465,344 | 496,638 | |||||||||
| FDIC and OCC assessments | 1,252,434 | 1,019,668 | 965,642 | |||||||||
| ATM expense | 1,187,614 | 882,657 | 763,248 | |||||||||
| Bank communications | 1,295,932 | 782,024 | 631,261 | |||||||||
| Data processing | 1,039,210 | 534,648 | 150,394 | |||||||||
| Other | 6,268,117 | 4,227,812 | 4,364,440 | |||||||||
| Total other expense | 55,446,333 | 36,861,699 | 32,161,122 | |||||||||
| 56 |
CONSOLIDATED STATEMENTS OF COMPREHENSIVE INCOME
YEARS ENDED DECEMBER 31, 2017, 2016,2019, 2018, AND 20152017
| Continued: | 2017 | 2016 | 2015 | |||||||||
| Income before income taxes | $ | 17,571,288 | $ | 14,049,026 | $ | 12,011,749 | ||||||
| Income taxes | 6,954,812 | 3,930,339 | 3,213,047 | |||||||||
| Net income | 10,616,476 | 10,118,687 | 8,798,702 | |||||||||
| Preferred dividends and stock accretion | - | 452,305 | 342,460 | |||||||||
| Net income applicable to common stockholders | $ | 10.616,476 | $ | 9,666,382 | $ | 8,456,242 | ||||||
| Net income per share: | ||||||||||||
| Basic | $ | 1.12 | $ | 1.86 | $ | 1.64 | ||||||
| Diluted | 1.11 | 1.64 | 1.62 | |||||||||
| Net income applicable to common stockholders: | ||||||||||||
| Basic | $ | 1.12 | $ | 1.78 | $ | 1.57 | ||||||
| Diluted | 1.11 | 1.57 | 1.55 | |||||||||
| ($ in thousands) | 2019 | 2018 | 2017 | |||||||||
| Net income | $ | 43,745 | $ | 21,225 | $ | 10,616 | ||||||
| Other comprehensive income: | ||||||||||||
| Unrealized gains/losses on securities: | ||||||||||||
| Unrealized holding (loss)/gain arising during the period on available-for-sale securities | 16,084 | (1,484 | ) | 1,160 | ||||||||
| Reclassification adjustment for losses (gains) included net income | (122 | ) | (334 | ) | 16 | |||||||
| Unrealized holding (loss)/gain arising during the period on available-for-sale securities | 15,962 | (1,818 | ) | 1,176 | ||||||||
| Income tax benefit (expense) | (4,077 | ) | 460 | (460 | ) | |||||||
| Other comprehensive income (loss) | 11,885 | (1,358 | ) | 716 | ||||||||
| Comprehensive income | $ | 55,630 | $ | 19,867 | $ | 11,332 | ||||||
The accompanying notes are an integral part of these statements.
| 57 |
CONSOLIDATED STATEMENTS OF COMPREHENSIVE INCOMECHANGES IN STOCKHOLDERS’ EQUITY
YEARS ENDED DECEMBER 31, 2017, 2016,2018 AND 20152019
($ in thousands except per share amount)
| 2017 | 2016 | 2015 | ||||||||||
| Net income | $ | 10,616,476 | $ | 10,118,687 | $ | 8,798,702 | ||||||
| Other comprehensive income: | ||||||||||||
| Unrealized gains on securities: | ||||||||||||
| Unrealized holding gains (losses) arising during the period on available-for-sale securities | 1,080,344 | (3,315,089 | ) | (1,093,182 | ) | |||||||
| Reclassification adjustment for (gains) losses included net income | 15,889 | (126,286 | ) | - | ||||||||
| Unrealized holding gains (losses) arising during the period on available-for-sale securities | 1,096,233 | (3,441,375 | ) | (1,093,182 | ) | |||||||
| Unrealized holding gains (losses) on loans held for Sale | 79,759 | (99,283 | ) | 2,753 | ||||||||
| Income tax benefit (expense) | (459,522 | ) | 1,363,987 | 370,655 | ||||||||
| Other comprehensive income (loss) | 716,470 | (2,176,671 | ) | (719,774 | ) | |||||||
| Comprehensive income | $ | 11,332,946 | $ | 7,942,016 | $ | 8,078,928 | ||||||
| Common Stock | Additional Paid-in | Retained | Accumulated Other Comprehensive | Treasury Stock | ||||||||||||||||||||||||||||
| Shares | Amount | Capital | Earnings | Income (Loss) | Shares | Amount | Total | |||||||||||||||||||||||||
| Balance, January 1, 2017 | 9,017,891 | $ | 9,018 | $ | 102,574 | $ | 44,477 | $ | (1,078 | ) | (26,494 | ) | $ | (464 | ) | $ | 154,527 | |||||||||||||||
| Net income | - | - | - | 10,616 | - | - | - | 10,616 | ||||||||||||||||||||||||
| Other comprehensive income | - | - | - | - | 716 | - | - | 716 | ||||||||||||||||||||||||
| Accumulated other comprehensiveincome due to statutory tax change | - | - | - | 76 | (76 | ) | - | - | - | |||||||||||||||||||||||
| Cash dividend declared, $.15 percommon share | - | - | - | (1,448 | ) | - | - | - | (1,448 | ) | ||||||||||||||||||||||
| Issuance of common shares | 2,012,500 | 2,013 | 56,350 | - | - | - | - | 58,363 | ||||||||||||||||||||||||
| Costs associated with capital raise | - | - | (3,092 | ) | - | - | - | - | (3,092 | ) | ||||||||||||||||||||||
| Repurchase of restricted stock forpayment of taxes | (11,867 | ) | (12 | ) | (318 | ) | - | - | - | - | (330 | ) | ||||||||||||||||||||
| Issuance of restricted stock grant | 84,286 | 84 | (84 | ) | - | - | - | - | - | |||||||||||||||||||||||
| Compensation cost on restricted stock | - | - | 867 | - | - | - | - | 867 | ||||||||||||||||||||||||
| Issuance of shares for GCCB acquisition | 89,591 | 90 | 2,159 | - | - | - | - | 2,249 | ||||||||||||||||||||||||
| Balance, December 31, 2017 | 11,192,401 | $ | 11,193 | $ | 158,456 | $ | 53,721 | $ | (438 | ) | (26,494 | ) | $ | (464 | ) | $ | 222,468 | |||||||||||||||
| Net income, 2018 | - | - | - | 21,225 | - | - | - | 21,225 | ||||||||||||||||||||||||
| Other comprehensive income | - | - | - | - | (1,358 | ) | - | - | (1,358 | ) | ||||||||||||||||||||||
| Dividend on common stock, $.20 percommon share | - | - | - | (2,600 | ) | - | - | - | (2,600 | ) | ||||||||||||||||||||||
| Issuance of shares for Southwestacquisition | 1,134,010 | 1,134 | 34,871 | - | - | - | - | 36,005 | ||||||||||||||||||||||||
| Issuance of shares for Sunshineacquisition | 726,461 | 726 | 22,702 | - | - | - | - | 23,428 | ||||||||||||||||||||||||
| Issuance of shares for FMB acquisition | 1,763,042 | 1,763 | 61,777 | - | - | - | - | 63,540 | ||||||||||||||||||||||||
| Issuance restricted stock grant | 60,984 | 61 | (61 | ) | - | - | - | - | - | |||||||||||||||||||||||
| Restricted stock grant forfeited | (19,236 | ) | (19 | ) | 19 | - | - | - | - | - | ||||||||||||||||||||||
| Expense associated with common stockissuance | - | - | (237 | ) | - | - | - | - | (237 | ) | ||||||||||||||||||||||
| Compensation expense | - | - | 1,154 | - | - | - | - | 1,154 | ||||||||||||||||||||||||
| ASU 2016-01 implementation | - | - | - | (348 | ) | - | - | - | (348 | ) | ||||||||||||||||||||||
| Repurchase of restricted stock forpayment of taxes | (570 | ) | (1 | ) | (22 | ) | - | - | - | - | (23 | ) | ||||||||||||||||||||
| Balance, December 31, 2018 | 14,857,092 | $ | 14,857 | $ | 278,659 | $ | 71,998 | $ | (1,796 | ) | (26,494 | ) | $ | (464 | ) | $ | 363,254 | |||||||||||||||
| Net income, 2019 | - | - | - | 43,745 | - | - | - | 43,745 | ||||||||||||||||||||||||
| Common stock repurchased | - | - | - | - | - | (168,188 | ) | (5,229 | ) | (5,229 | ) | |||||||||||||||||||||
| Other comprehensive income | - | - | - | - | 11,885 | - | - | 11,885 | ||||||||||||||||||||||||
| Dividend on common stock, $.31 percommon share | - | - | - | (5,283 | ) | - | - | - | (5,283 | ) | ||||||||||||||||||||||
| Issuance of shares for FPB acquisition | 2,377,501 | 2,378 | 75,842 | - | - | - | - | 78,220 | ||||||||||||||||||||||||
| Issuance of shares for FFB acquisition | 1,682,889 | 1,683 | 53,785 | - | - | - | - | 55,468 | ||||||||||||||||||||||||
| Issuance restricted stock grant | 89,315 | 89 | (89 | ) | - | - | - | - | - | |||||||||||||||||||||||
| Restricted stock grant forfeited | (7,931 | ) | (8 | ) | 8 | - | - | - | - | - | ||||||||||||||||||||||
| Compensation expense | - | - | 1,661 | - | - | - | - | 1,661 | ||||||||||||||||||||||||
| Repurchase of restricted stock forpayment of taxes | (1,918 | ) | (2 | ) | (61 | ) | - | - | - | - | (63 | ) | ||||||||||||||||||||
| Balance, December 31, 2019 | 18,996,948 | $ | 18,997 | $ | 409,805 | $ | 110,460 | $ | 10,089 | (194,682 | ) | $ | (5,693 | ) | $ | 543,658 | ||||||||||||||||
See Notes to Consolidated Financial Statements
| 58 |
CONSOLIDATED STATEMENTS OF CASH FLOWS
YEARS ENDED DECEMBER 31, 2019, 2018 AND 2017
| ($ in thousands) | 2019 | 2018 | 2017 | |||||||||
| CASH FLOWS FROM OPERATING ACTIVITIES | ||||||||||||
| Net income | $ | 43,745 | $ | 21,225 | $ | 10,616 | ||||||
| Adjustments to reconcile net income to net cash provided by operating activities: | ||||||||||||
| Depreciation and amortization | 5,314 | 4,300 | 2,902 | |||||||||
| FHLB Stock dividends | (171 | ) | (97 | ) | (54 | ) | ||||||
| Provision for loan losses | 3,738 | 2,120 | 506 | |||||||||
| Deferred income taxes | 912 | 2,523 | 6,446 | |||||||||
| Restricted stock expense | 1,661 | 1,154 | 866 | |||||||||
| Increase in cash value of life insurance | (1,414 | ) | (937 | ) | (739 | ) | ||||||
| Amortization and accretion, net, related to acquisitions | (1,791 | ) | (680 | ) | 1,737 | |||||||
| Loss/(Gain) on sale of land/bank premises/equipment | (13 | ) | 137 | 22 | ||||||||
| Securities (gain)/losses | (122 | ) | (334 | ) | 16 | |||||||
| Loss on sale/writedown of other real estate | 680 | 342 | 892 | |||||||||
| Payments on operating leases | (898 | ) | - | - | ||||||||
| Residential loans originated and held for sale | (186,132 | ) | (137,287 | ) | �� | (162,491 | ) | |||||
| Proceeds from sale of residential loans held for sale | 180,120 | 137,293 | 163,661 | |||||||||
| Changes in: | ||||||||||||
| Interest receivable | (1,203 | ) | (671 | ) | (715 | ) | ||||||
| Other assets | 1,157 | 2,401 | 1,838 | |||||||||
| Interest payable | 914 | 144 | 30 | |||||||||
| Other liabilities | (1,797 | ) | (133 | ) | (3,935 | ) | ||||||
| Net cash provided by operating activities | 44,700 | 31,500 | 21,598 | |||||||||
| CASH FLOWS FROM INVESTING ACTIVITIES | ||||||||||||
| Purchases of available-for-sale securities | (180,502 | ) | (66,350 | ) | (89,196 | ) | ||||||
| Purchases of other securities | (11,085 | ) | (8,644 | ) | (2,891 | ) | ||||||
| Proceeds from maturities and calls of available-for-sale securities | 109,189 | 61,587 | 57,996 | |||||||||
| Proceeds from sales of securities available-for-sale | 32,976 | 40,289 | 7,731 | |||||||||
| Proceeds from redemption of other securities | 2,712 | 5,714 | 682 | |||||||||
| Increase in loans | (44,102 | ) | (81,193 | ) | (121,437 | ) | ||||||
| Net additions to premises and equipment | (7,892 | ) | (4,057 | ) | (4,675 | ) | ||||||
| Purchase of bank owned life insurance | - | - | (469 | ) | ||||||||
| Proceeds from sale of other real estate owned | 5,097 | 1,396 | 6,946 | |||||||||
| Proceeds from sale of other assets | 65 | - | - | |||||||||
| Cash received in excess of cash paid for acquisition | 30,860 | 42,450 | 3,910 | |||||||||
| Net cash used in investing activities | (62,682 | ) | (8,808 | ) | (141,403 | ) | ||||||
The accompanying notes are an integral part of these statements.
THE FIRST BANCSHARES, INC.
CONSOLIDATED STATEMENTS OF CHANGES IN STOCKHOLDERS' EQUITY
YEARS ENDED DECEMBER 31, 2017, 2016, AND 2015
Common Stock | Preferred Stock | Stock Warrants | Additional Paid-in Capital | Retained Earnings | Accum- ulated Other Compre- hensive Income (Loss) | Treasury Stock | Total | |||||||||||||||||||||||||
| Balance, January 1, 2015 | $ | 5,342,670 | $ | 17,123,000 | $ | 283,738 | $ | 44,136,411 | $ | 27,975,049 | $ | 1,818,361 | $ | (463,645 | ) | $ | 96,215,584 | |||||||||||||||
| Net income 2015 | - | - | - | - | 8,798,702 | - | - | 8,798,702 | ||||||||||||||||||||||||
| Other comprehensive loss | - | - | - | - | - | (719,774 | ) | - | (719,774 | ) | ||||||||||||||||||||||
| Dividends on preferred stock | - | - | - | - | (342,460 | ) | - | - | (342,460 | ) | ||||||||||||||||||||||
| Cash dividend declared, $.15 per common share | - | - | - | - | (806,576 | ) | - | - | (806,576 | ) | ||||||||||||||||||||||
| Grant of restricted stock | 69,327 | - | - | (69,327 | ) | - | - | - | - | |||||||||||||||||||||||
| Compensation cost on restricted stock | - | - | - | 721,124 | - | - | - | 721,124 | ||||||||||||||||||||||||
| Repurchase of restricted stock for payment of taxes | (6,324 | ) | - | - | (86,066 | ) | - | - | - | (92,390 | ) | |||||||||||||||||||||
| Adjustment to consideration issued in BCB Holding acquisition | (2,514 | ) | - | - | (33,196 | ) | - | - | - | (35,710 | ) | |||||||||||||||||||||
| Repurchase warrants | - | - | (283,738 | ) | (18,672 | ) | - | - | - | (302,410 | ) | |||||||||||||||||||||
| Balance, December 31, 2015 | $ | 5,403,159 | $ | 17,123,000 | $ | - | $ | 44,650,274 | $ | 35,624,715 | $ | 1,098,587 | $ | (463,645 | ) | $ | 103,436,090 | |||||||||||||||
| Net income 2016 | - | - | - | - | 10,118,687 | - | - | 10,118,687 | ||||||||||||||||||||||||
| Other comprehensive loss | - | - | - | - | - | (2,176,671 | ) | - | (2,176,671 | ) | ||||||||||||||||||||||
| 59 |
THE FIRST BANCSHARES, INC.
CONSOLIDATED STATEMENTS OF CHANGES IN STOCKHOLDERS' EQUITY
YEARS ENDED DECEMBER 31, 2017, 2016, AND 2015
| Continued: | ||||||||||||||||||||||||||||||||
Common Stock | Preferred Stock | Stock Warrants | Additional Paid-in Capital | Retained Earnings | Accum- ulated Other Compre- hensive Income (Loss) | Treasury Stock | Total | |||||||||||||||||||||||||
| Dividends on preferred stock | - | - | - | - | (452,305 | ) | - | - | (452,305 | ) | ||||||||||||||||||||||
| Cash dividend declared, $.15 per common share | - | - | - | - | (814,711 | ) | - | - | (814,711 | ) | ||||||||||||||||||||||
| Grant of restricted stock | 61,247 | - | - | (61,247 | ) | - | - | - | - | |||||||||||||||||||||||
| Compensation cost on restricted stock | - | - | - | 772,311 | - | - | - | 772,311 | ||||||||||||||||||||||||
| Repurchase of restricted stock for payment of taxes | (9,895 | ) | - | - | (166,217 | ) | - | - | - | (176,112 | ) | |||||||||||||||||||||
| Repayment of CDCI preferred shares | - | (17,123,000 | ) | - | 1,198,000 | - | - | - | (15,925,000 | ) | ||||||||||||||||||||||
| Issuance of Preferred Stock, Series E | - | 63,249,996 | - | - | - | - | - | 63,249,996 | ||||||||||||||||||||||||
| Conversion of Preferred, Series E to common | 3,563,380 | (63,249,996 | ) | - | 59,686,616 | - | - | - | - | |||||||||||||||||||||||
| Costs associated with capital raise | - | - | - | (3,505,578 | ) | - | - | - | (3,505,578 | ) | ||||||||||||||||||||||
| Balance, December 31, 2016 | $ | 9,017,891 | $ | - | $ | - | $ | 102,574,159 | $ | 44,476,386 | $ | (1,078,084 | ) | $ | (463,645 | ) | $ | 154,526,707 | ||||||||||||||
| Net income, 2017 | - | - | - | - | 10,616,476 | - | - | 10,616,476 | ||||||||||||||||||||||||
| Other comprehensive Income | - | - | - | - | - | 716,470 | - | 716,470 | ||||||||||||||||||||||||
THE FIRST BANCSHARES, INC.
CONSOLIDATED STATEMENTS OF CHANGES IN STOCKHOLDERS' EQUITY
YEARS ENDED DECEMBER 31, 2017, 2016, and 2015
| Continued: | ||||||||||||||||||||||||||||||||
Common Stock | Preferred Stock | Stock Warrants | Additional Paid-in Capital | Retained Earnings | Accum- ulated Other Compre- hensive Income (Loss) | Treasury Stock | Total | |||||||||||||||||||||||||
| Reclassification of accumulated other comprehensive income due to statutory tax changes | - | - | - | - | 76,128 | (76,128 | ) | - | - | |||||||||||||||||||||||
| Cash dividend declared, $.15 per common share | - | - | - | - | (1,448,063 | ) | - | - | (1,448,063 | ) | ||||||||||||||||||||||
| Issuance of common shares | 2,012,500 | - | - | 56,350,000 | - | - | - | 58,362,500 | ||||||||||||||||||||||||
| Costs associated with capital raise | - | - | - | (3,091,875 | ) | - | - | - | (3,091,875 | ) | ||||||||||||||||||||||
| Repurchase of restricted stock for payment of taxes | (11,867 | ) | - | - | (317,720 | ) | - | - | - | (329,587 | ) | |||||||||||||||||||||
| Grant of restricted stock | 84,286 | - | - | (84,286 | ) | - | - | - | - | |||||||||||||||||||||||
| Compensation cost on restricted stock | - | - | - | 866,558 | - | - | - | 866,558 | ||||||||||||||||||||||||
| Issuance of shares for GCCB acquisition | 89,591 | - | - | 2,159,143 | - | - | - | 2,248,734 | ||||||||||||||||||||||||
| Balance, December 31, 2017 | $ | 11,192,401 | $ | - | $ | - | $ | 158,455,979 | $ | 53,720,927 | $ | (437,742 | ) | $ | (463,645 | ) | $ | 222,467,920 | ||||||||||||||
The accompanying notes are an integral part of these statements.
THE FIRST BANCSHARES, INC.
CONSOLIDATED STATEMENTS OF CASH FLOWS
YEARS ENDED DECEMBER 31, 2017, 20162019, 2018 AND 20152017
| 2017 | 2016 | 2015 | ||||||||||
| CASH FLOWS FROM OPERATING ACTIVITIES | ||||||||||||
| Net income | $ | 10,616,476 | $ | 10,118,687 | $ | 8,798,702 | ||||||
| Adjustments to reconcile net income to net cash provided by operating activities: | ||||||||||||
| Depreciation and amortization | 2,902,328 | 2,302,163 | 2,296,985 | |||||||||
| FHLB Stock dividends | (54,400 | ) | (37,700 | ) | (8,600 | ) | ||||||
| Provision for loan losses | 505,653 | 625,271 | 410,069 | |||||||||
| Deferred income taxes | 6,445,865 | (10,352 | ) | 255,638 | ||||||||
| Restricted stock expense | 866,558 | 772,311 | 721,124 | |||||||||
| Increase in cash value of life insurance | (738,659 | ) | (528,734 | ) | (408,535 | ) | ||||||
| Amortization and accretion, net, related to acquisitions | 1,736,818 | 629,304 | 921,853 | |||||||||
| Loss/ (Gain) on sale of land/bank premises/ equipment | 22,123 | 51,838 | (133,339 | ) | ||||||||
| Securities gains (losses) | 15,889 | (126,286 | ) | - | ||||||||
| Loss on sale/writedown of other real estate | 891,617 | 244,466 | 386,590 | |||||||||
| Changes in: | ||||||||||||
| Loans held for sale | 1,169,594 | (2,005,402 | ) | (1,867,661 | ) | |||||||
| Interest receivable | (714,501 | ) | (404,760 | ) | (294,332 | ) | ||||||
| Other assets | 1,837,728 | (3,553,728 | ) | (2,055,005 | ) | |||||||
| Interest payable | 29,826 | 60,348 | (70,112 | ) | ||||||||
| Other liabilities | (3,934,866 | ) | (121,118 | ) | (1,406,347 | ) | ||||||
| Net cash provided by operating activities | 21,598,049 | 8,016,308 | 7,547,030 | |||||||||
| CASH FLOWS FROM INVESTING ACTIVITIES | ||||||||||||
| Purchases of available-for-sale securities | (89,196,412 | ) | (53,403,251 | ) | (29,571,287 | ) | ||||||
| Purchases of other securities | (2,890,850 | ) | (1,433,100 | ) | (4,079,400 | ) | ||||||
| Proceeds from maturities and calls of available- for-sale securities | 57,995,529 | 45,296,821 | 42,569,677 | |||||||||
| Proceeds from maturities and calls of held-to- maturity securities | - | 1,094,138 | 1,099,898 | |||||||||
| Proceeds from sales of securities available-for- sale | 7,731,444 | 250,000 | - | |||||||||
| Proceeds from redemption of other securities | 682,100 | 3,012,900 | 3,187,500 | |||||||||
| Increase in loans | (121,437,376 | ) | (98,560,749 | ) | (68,588,377 | ) | ||||||
| Net additions to premises and equipment | (4,675,400 | ) | (2,706,842 | ) | (1,230,531 | ) | ||||||
| Purchase of bank owned life insurance | (468,834 | ) | (5,850,000 | ) | - | |||||||
| Proceeds from sale of land/bank premises | - | - | 949,516 | |||||||||
| Proceeds from sale of other real estate owned | 6,945,936 | 1,560,773 | 2,190,625 | |||||||||
| Cash received (paid) in excess of cash paid for acquisition | 3,910,489 | - | (843,895 | ) | ||||||||
| Net cash used in investing activities | (141,403,374 | ) | (110,739,310 | ) | (54,316,274 | ) | ||||||
| Continued: | ||||||||||||
| 2019 | 2018 | 2017 | ||||||||||
| CASH FLOWS FROM FINANCING ACTIVITIES | ||||||||||||
| (Decrease)/Increase in deposits | (67,821 | ) | 46,224 | 75,916 | ||||||||
| Proceeds from borrowed funds | 364,715 | 105,000 | 198,800 | |||||||||
| Repayment of borrowed funds | (258,673 | ) | (168,680 | ) | (173,633 | ) | ||||||
| Dividends paid on common stock | (5,190 | ) | (2,557 | ) | (1,416 | ) | ||||||
| Net proceeds from issuance of stock | - | (237 | ) | 55,271 | ||||||||
| Cash paid to repurchase common stock | (5,229 | ) | - | - | ||||||||
| Repurchase of restricted stock for payment oftaxes | (63 | ) | (23 | ) | (330 | ) | ||||||
| Repayment of repurchase agreement | - | - | (5,000 | ) | ||||||||
| Issuance of subordinated debt, net | - | 64,766 | - | |||||||||
| Net cash provided by financing activities | 27,739 | 44,493 | 149,608 | |||||||||
| Net increase in cash and cash equivalents | 9,757 | 67,185 | 29,803 | |||||||||
| Cash and cash equivalents at beginning of year | 159,107 | 91,922 | 62,119 | |||||||||
| Cash and cash equivalents at end of year | $ | 168,864 | $ | 159,107 | $ | 91,922 | ||||||
| Supplemental disclosures: | ||||||||||||
| Cash paid during the year for: | ||||||||||||
| Interest | $ | 20,673 | $ | 10,982 | $ | 7,054 | ||||||
| Income taxes, net of refunds | 11,102 | 2,120 | 354 | |||||||||
| Non-cash activities: | ||||||||||||
| Transfers of loans to other real estate | 1,706 | 1,528 | 1,000 | |||||||||
| Issuance of restricted stock grants | 89 | 61 | 84 | |||||||||
| Stock issued in connection with Gulf Coast Community Bank acquisition | - | - | 2,249 | |||||||||
| Stock issued in connection with Southwest acquisition | - | 36,005 | - | |||||||||
| Stock issued in connection with Sunshine acquisition | - | 23,428 | - | |||||||||
| Stock issued in connection with FMB acquisition | - | 63,540 | - | |||||||||
| Stock issued in connection with FPB acquisition | 78,220 | - | - | |||||||||
| Stock issued in connection with FFB acquisition | 55,468 | - | - | |||||||||
| Dividends on restricted stock grants | 93 | 43 | 33 | |||||||||
| Right-of-use obtained in exchange for operating lease liabilities | 6,717 | - | - | |||||||||
The accompanying notes are an integral part of these statements.
CONSOLIDATED STATEMENTS OF CASH FLOWS
YEARS ENDED DECEMBER 31, 2017, 2016 AND 2015
| Continued: | ||||||||||||
| 2017 | 2016 | 2015 | ||||||||||
| CASH FLOWS FROM FINANCING ACTIVITIES | ||||||||||||
| Increase in deposits | 75,916,176 | 122,496,150 | 24,090,591 | |||||||||
| Proceeds from borrowed funds | 198,800,000 | 252,000,000 | 194,340,000 | |||||||||
| Repayment of borrowed funds | (173,633,473 | ) | (293,321,245 | ) | (173,468,821 | ) | ||||||
| Dividends paid on common stock | (1,415,524 | ) | (782,936 | ) | (778,428 | ) | ||||||
| Dividends paid on preferred stock | - | (452,305 | ) | (342,460 | ) | |||||||
| Repurchase of shares issued in BCB acquisition | - | - | (35,710 | ) | ||||||||
| Net proceeds from issuance of stock | 55,270,625 | 59,744,418 | - | |||||||||
| Repayment of CDCI Preferred shares | - | (15,925,000 | ) | - | ||||||||
| Repurchase of warrants | - | - | (302,410 | ) | ||||||||
| Repurchase of restricted stock for payment of taxes | (329,587 | ) | (176,112 | ) | (92,390 | ) | ||||||
| Repayment of repurchase agreement | (5,000,000 | ) | - | - | ||||||||
| Net cash provided by financing activities | 149,608,217 | 123,582,970 | 43,410,372 | |||||||||
| Net increase (decrease) in cash and cash equivalents | 29,802,892 | 20,859,968 | (3,358,872 | ) | ||||||||
| Cash and cash equivalents at beginning of year | 62,118,885 | 41,258,917 | 44,617,789 | |||||||||
| Cash and cash equivalents at end of year | $ | 91,921,777 | $ | 62,118,885 | $ | 41,258,917 | ||||||
| Supplemental disclosures: | ||||||||||||
| Cash paid during the year for: | ||||||||||||
| Interest | $ | 7,053,879 | $ | 4,254,987 | $ | 3,448,525 | ||||||
| Income taxes, net of refunds | 354,200 | 4,725,814 | 4,152,050 | |||||||||
| Non-cash activities: | ||||||||||||
| Transfers of loans to other real estate | 999,502 | 4,722,529 | 1,050,342 | |||||||||
| Issuance of restricted stock grants | 84,286 | 61,247 | 69,327 | |||||||||
| Stock issued in connection with Gulf Coast Community Bank | 2,248,734 | - | - | |||||||||
The accompanying notes are an integral part of these statements.
THE FIRST BANCSHARES, INC.
NOTES TO CONSOLIDATED FINANCIAL STATEMENTS
NOTE A - NATURE OF BUSINESS
The First Bancshares, Inc. (the “Company”) is a bank holding company whose business is primarily conducted by its wholly-owned subsidiary, The First, A National Banking Association (the “Bank”). The Bank provides a full range of banking services in its primary market area of Mississippi, Louisiana, Alabama, Florida and Florida.Georgia. The Company is regulated by the Federal Reserve Bank. Its subsidiary bank is subject to the regulation of the Office of the Comptroller of the Currency (OCC).
The principal products produced and services rendered by the Company and are as follows:
Commercial Banking – The Company provides a full range of commercial banking services to corporations and other business customers. Loans are provided for a variety of general corporate purposes, including financing for commercial and industrial projects, income producing commercial real estate, owner-occupied real estate and construction and land development. The Company also provides deposit services, including checking, savings and money market accounts and certificate of deposit as well as treasury management services.
Consumer Banking – The Company provides mortgage banking services to consumers, including checking, savings and money market accounts as well as certificate of deposit and individual retirement accounts. In addition, the Company provides consumers with installment and real estate loans and lines of credit.
Mortgage Banking – The Company provides residential mortgage banking services, including construction financing, for conventional and government insured home loans to be sold in the secondary market.
NOTE B - SUMMARY OF SIGNIFICANT ACCOUNTING POLICIES
The Company and the Bank follow accounting principles generally accepted in the United States of America including, where applicable, general practices within the banking industry.
| 1. | Principles of Consolidation |
The consolidated financial statements include the accounts of the Company and the Bank. All significant intercompany accounts and transactions have been eliminated.
| 2. | Estimates |
The preparation of financial statements in conformity with accounting principles generally accepted in the United States of America requires management to make estimates and assumptions that affect the reported amounts of assets and liabilities and disclosure of contingent assets and liabilities at the date of the financial statements and the reported amounts of revenues and expenses during the reporting period. Actual results could differ from those estimates. Material estimates that are particularly susceptible to significant change in the near term relate to the determination of the allowance for loan losses, acquisition accounting, intangible assets, and deferred tax assets.
| 3. | Cash and Due From Banks |
Included in cash and due from banks are legal reserve requirements which must be maintained on an average basis in the form of cash and balances due from the Federal Reserve. The reserve balance varies depending upon the types and amounts of deposits. At December 31, 2017,2019, the required reserve balance on deposit with the Federal Reserve Bank was approximately $29.7$75.6 million.
| 61 |
| 4. | Securities |
Investments in securities are accounted for as follows:
Available-for-Sale Securities
Securities classified as available-for-sale are those securities that are intended to be held for an indefinite period of time, but not necessarily to maturity. Any decision to sell a security classified as available-for-sale would be based on various factors, including movements in interest rates, liquidity needs, security risk assessments, changes in the mix of assets and liabilities and other similar factors. These securities are carried at their estimated fair value, and the net unrealized gain or loss is reported net of tax, as a component of accumulated other comprehensive income (loss) in stockholders'stockholders’ equity, until realized. Premiums and discounts are recognized in interest income using the interest method. Gains and losses on the sale of available-for-sale securities are determined using the adjusted cost of the specific security sold.
Securities to be Held-to-Maturity
Securities classified as held-to-maturity are those securities for which there is a positive intent and ability to hold to maturity. These securities are carried at cost adjusted for amortization of premiums and accretion of discounts, computed by the interest method.
Trading Account Securities
Trading account securities are those securities which are held for the purpose of selling them at a profit. There were no trading account securities on hand at December 31, 20172019 and 2016.2018.
Equity Securities
Equity securities are carried at fair value, with changes in fair value reported in net income. Equity securities without readily determinable fair values are carried at cost, minus impairment, if any, plus or minus changes resulting from observable price changes in orderly transactions for the identical or a similar investment. There were no equity securities on hand at December 31, 2019 and 2018.
Other Securities
Other securities are carried at cost and are restricted in marketability. Other securities consist of investments in the Federal Home Loan Bank (FHLB), Federal Reserve Bank and First National Bankers’ Bankshares, Inc. Management reviews for impairment based on the ultimate recoverability of the cost basis.
Shares of Federal Home Loan Bank (FHLB), Federal Reserve Bank and First National Bankers’ Bankshares, Inc. common stock are equity securities that do not have a readily determinable fair value because their ownership is restricted and lacks marketability. The common stock is carried at cost and evaluated for impairment. The Company’s investment in member bank stock is included in other securities in the accompanying consolidated balance sheets. Management reviews for impairment based on the ultimate recoverability of the cost basis. No other-than-temporary impairment was noted for the years ended December 31, 2019, 2018 and 2017.
Interest Income
Interest income includes amortization of purchase premium or discount. Premiums and discounts on securities are amortized on the level-yield method without anticipating prepayments, except for mortgage backed securities where prepayments are anticipated. Gains and losses on sales are recorded on the trade date and determined using the specific identification method.
On January 1, 2018, the Company adopted the new accounting standard for Financial Instruments, which requires investments (except those accounted for under the equity method of accounting or those that result in consolidation of the investee) to be measured at fair value with the changes in fair value recognized in net income. The adoption of this guidance in 2018 resulted in a $348 thousand decrease to retained earnings.
| 62 |
Other-than-Temporary Impairment (“OTTI”)
Management evaluates investment securities for other-than-temporary impairment on a quarterly basis, and more frequently when economic or market conditions warrant such an evaluation. For securities in an unrealized loss position, management considers the extent and duration of the unrealized loss, and the financial condition and near-term prospects of the issuer. Management also assesses whether it intends to sell, or it is more likely than not that it will be required to sell, a security in an unrealized loss position before recovery of its amortized cost basis. A declineIf either of the criteria regarding intent or requirement to sell is met, the entire difference between amortized cost and fair value is recognized as impairment through earnings. For debt securities that do not meet the aforementioned criteria, the amount of impairment is split into two components as follows: 1) OTTI related to credit loss, which must be recognized in the fair value of available-for-saleincome statement and held-to-maturity securities below cost that is deemed2) other-than-temporary is chargedimpairment (OTTI) related to earnings for a decline in value deemed to be credit related and a new cost basis for the security is established. The decline in value attributed to non-credit relatedother factors, which is recognized in accumulated other comprehensive income (loss).income. The credit loss is defined as the difference between the present value of the cash flows expected to be collected and the amortized cost basis. For equity securities, the entire amount of impairment is recognized through earnings.
| 5. | Loans held for sale |
The Bank originates fixed rate single family, residential first mortgage loans on a presold basis. The Bank issues a rate lock commitment to a customer and concurrently “locks in” with a secondary market investor under a best efforts delivery mechanism. Such loans are sold without the mortgage servicing rights being retained by the Bank. The terms of the loan are dictated by the secondary investors and are transferred within several weeks of the Bank initially funding the loan. The Bank recognizes certain origination fees and service release fees upon the sale, which are included in other income on loans in the consolidated statements of income. Between the initial funding of the loans by the Bank and the subsequent purchase by the investor, the Bank carries the loans held for sale at the lower of cost or fair value in the aggregate as determined by the outstanding commitments from investors.
| 6. | Loans |
Loans are carried at the principal amount outstanding, net of the allowance for loan losses. Interest income on loans is recognized based on the principal balance outstanding and the stated rate of the loan. Loan origination fees and certain direct origination costs are deferred and recognized as an adjustment of the related loan yield using the interest method.
A loan is considered impaired, in accordance with the impairment accounting guidance of Accounting Standards Codification (ASC) Section 310-10-35,Receivables, Subsequent Measurement, when, based upon current events and information, it is probable that the scheduled payments of principal and interest will not be collected in accordance with the contractual terms of the loan agreement. Factors considered by management in determining impairment include payment status, collateral values, and the probability of collecting scheduled payments of principal and interest when due. Generally, impairment is measured on a loan by loan basis using the fair value of the supporting collateral.
Loans are generally placed on a non-accrual status, and the accrual of interest on such loan is discontinued, when principal or interest is past due ninety days or when specifically determined to be impaired.impaired unless the loan is well-secured and in the process of collection. When a loan is placed on non-accrual status, interest accrued but not received is generally reversed against interest income. If collectibilitycollectability is in doubt, cash receipts on non-accrual loans are used to reduce principal rather than recorded in interest income. Past due status is determined based upon contractual terms. Loans are returned to accrual status when the obligation is brought current or has performed in accordance with the contractual terms for a reasonable period of time and the ultimate collectability of the total contractual principal and interest is no longer in doubt.
| 7. | Allowance for Loan Losses |
For financial reporting purposes, the provisionThe allowance for loan losses charged to operations is based upon management's estimation of the amount necessary to maintain thea valuation allowance at an adequate level. Allowancesreserved for any impaired loans are generally determined based on collateral values.probable incurred credit losses. A charge is taken against the allowance for loan losses when management believes the collectibility of the loan principal is confirmed to be unlikely.
Subsequent recoveries, if any, are credited back to the allowance. Management evaluates the adequacy of the allowance for loan losses on a regular basis. These evaluations are based upon a periodic review of the collectibility considering historical loan loss experience, the nature and value of the loan portfolio, underlying collateral values, internal and independent loan reviews, and prevailing economic conditions. In addition, the OCC, as a part of the regulatory examination process, reviews the loan portfolio and the allowance for loan losses and may require changes in the allowance based upon information available at the time of the examination.
| 63 |
The allowance consists of two components: allocatedcomponents, a reserve for general pool (or formula pool) loans that are collectively evaluated for impairment, and unallocated. Thea reserve for loans individually evaluated for impairment based on expected loan specific losses. These components represent an estimation performed pursuant to either ASC Topic 450,Contingencies, or ASC Subtopic 310-10,Receivables. The allocated componentLoans individually evaluated for specific impairment are loans where management has determined that all amounts due according to the contractual terms of the allowance reflectsloan agreement are unable to be collected. Loans that are considered to be troubled debt restructurings (TDRs) are individually evaluated for specific impairment as well. Factors considered in determining impairment include the present value of estimated future cash flows when there is a possibility of collecting principal and interest payments as scheduled, or by using the fair value less liquidation costs of collateral if it is expected losses resulting from an analysis developed through specific credit allocations for individual loans, including any impaired loans, and historicalthat this is the only future possibility of repayment. The general pool (or formula pool) loan impairment is calculated using the Bank’s actual loan loss history.history segregated by portfolio segment grouping together loans with similar risk characteristics. The analysis is performed quarterlyfour major segments or “bands” are Commercial Real Estate, Commercial Non-Real Estate, Consumer Real Estate, and Consumer Non-Real Estate. These loss factors are updated regularly.also supplemented with other qualitative and economic factors including but not limited to current local and national economic conditions, changes in lending policies/management/staff, changes in credit concentrations, as well as trends in the volume and size of loans.
The unallocated portionBank also has acquired loan portfolios accounted for under the acquisition method of the allowance reflects management’s estimateaccounting. Within these portfolios are purchased credit impaired loans accounted for under ASC Topic 310-30. Impairment may be determined specifically at an individual loan level, or estimated on various pools of probable inherent but undetected losses within the portfolio due to uncertainties in economic conditions, changes in collateral values, unfavorable information about a borrower’s financial condition, and otherloans having common risk factors that have not yet manifested themselves. In addition, the unallocated allowance includes a component that explicitly accounts for the inherent imprecision in the loan loss analysis.characteristics.
| 8. | Purchased Credit Impaired Loans (“PCI”) |
The Company purchases individual loans and groups of loans, some of which have shown evidence of credit deterioration since origination. These purchased credit impaired loans are recorded at the amount paid, such that there is no carryover of the seller’s allowance for loan losses. After acquisition, losses are recognized by an increase in the allowance for loan losses.
Such purchased credit impaired loans are accounted for individually or aggregated into pools of loans based on common risk characteristics such as credit score, loan type, and date of origination. The Company estimates the amount and timing of expected cash flows for each loan or pool, and the expected cash flows in excess of amount paid is recorded as interest income over the remaining life of the loan or pool (accretable yield). The excess of the loan’s or pool’s contractual principal and interest over expected cash flows is not recorded (nonaccretable difference).
Over the life of the loan or pool, expected cash flows continue to be estimated. If the present value of expected cash flows is less than the carrying amount, a loss is recorded as a provision for loan losses. If the present value of expected cash flows is greater than the carrying amount, it is recognized as part of future interest income.
| 9. | Premises and Equipment |
Premises and equipment are stated at cost, less accumulated depreciation. The depreciation policy is to provide for depreciation over the estimated useful lives of the assets using the straight-line method. Repairs and maintenance expenditures are charged to operating expenses; major expenditures for renewals and betterments are capitalized and depreciated over their estimated useful lives. Upon retirement, sale, or other disposition of property and equipment, the cost and accumulated depreciation are eliminated from the accounts, and any gains or losses are included in operations. Building and related components are depreciated using the straight-line method with useful lives ranging from 10 to 39 years. Furniture, fixtures and equipment are depreciated using the straight-line (or accelerated) method with useful lives ranging from 3 to 10 years.
| 64 |
| Other Real Estate Owned |
Other real estate owned consists of properties acquired through foreclosure and, as held for sale property, isare initially recorded at fair value less costs to sell when acquired, establishing a new cost basis. Physical possession of residential real estate property collateralizing a consumer mortgage loan occurs when legal title is obtained upon completion of foreclosure or when the borrower conveys all interest in the property to satisfy the loan through completion of a deed in lieu of foreclosure or through similar legal agreement. These assets are subsequently accounted for at lower of the outstanding loan balancecost or current appraisalfair value less estimated costs to sell. If fair value declines subsequent to foreclosure, a valuation allowance is recorded through expense. Operation costs after acquisition are expensed. Any write-down to fair value required at the time of foreclosure is charged to the allowance for loan losses. Subsequent gains or losses on other real estate are reported in other operating income or expenses. At December 31, 20172019 and 2016,2018, other real estate owned totaled $7,158,409,$7.3 million and $6,007,621,$10.9 million, respectively.
| Goodwill and Other Intangible Assets |
Goodwill totaled $19,959,849 and $13,776,040 for the years ended December 31, 2017, and 2016, respectively.
Goodwill totaling $6,183,810 was recordedThe change in goodwill during the year ended December 31, 2017, was a result of the acquisitions of Iberville Bank and Gulf Coast Community Bank. See Note C – Business Combinations to these consolidated financial statements for additional information on the acquisitions during 2017.is as follows ($ in thousands):
| 2019 | 2018 | 2017 | ||||||||||
| Beginning of year | $ | 89,750 | $ | 19,960 | $ | 13,776 | ||||||
| Acquired goodwill | 68,822 | 69,790 | 6,184 | |||||||||
| End of year | $ | 158,572 | $ | 89,750 | $ | 19,960 | ||||||
The Company performed the required annual impairment tests of goodwill and other intangibles as of December 1, 2017.2019. The Company’s annual impairment test did not indicate impairment as of the testing date, and subsequent to that date, management is not aware of any events or changes in circumstances since the impairment test that would indicate that goodwill or other intangibles might be impaired. All goodwill is related to the Commercial/Retail Bank segment of the Company.
The Company’s acquisition method recognized intangible assets, which are subject to amortization, and included in other assets in the accompanying consolidated balance sheets, are core deposit intangibles, amortized on a straight-line basis, over a 10 year average life. The definite-lived intangible assets had the following carrying values at December 31, 20172019 and 2016:2018:
| 2017 | ||||||||||||
| (In thousands) | Gross Carrying Amount |
Accumulated Amortization | Net Carrying Amount | |||||||||
| Core deposit intangibles | $ | 7,640 | $ | (2,930 | ) | $ | 4,710 | |||||
| 2019 | ||||||||||||
| ($ in thousands) | Gross Carrying Amount | Accumulated Amortization | Net Carrying Amount | |||||||||
| Core deposit intangibles | $ | 38,095 | $ | (7,802 | ) | $ | 30,293 | |||||
| 2016 | ||||||||||||
| (In thousands) | Gross Carrying Amount | Accumulated Amortization | Net Carrying Amount | |||||||||
| Core deposit intangibles | $ | 4,000 | $ | (2,268 | ) | $ | 1,732 | |||||
| 2018 | ||||||||||||
| Gross Carrying Amount | Accumulated Amortization | Net Carrying Amount | ||||||||||
| Core deposit intangibles | $ | 27,752 | $ | (4,586 | ) | $ | 23,166 | |||||
| 65 |
The related amortization expense of business combination related intangible assets is as follows:
| (In thousands) | ||||
| Amount | ||||
| Aggregate amortization expense for the year ended December 31: | ||||
| 2015 | $ | 399 | ||
| 2016 | 383 | |||
| 2017 | 664 | |||
| ($ in thousands) | Amount | ||||
| Aggregate amortization expense for the year ended December 31: | |||||
| 2017 | $ | 664 | |||
| 2018 | 1,656 | ||||
| 2019 | 3,216 | ||||
| Amount | |||||
| Estimated amortization expense for the year ending December 31: | |||||
| 2020 | $ | 3,751 | |||
| 2021 | 3,681 | ||||
| 2022 | 3,511 | ||||
| 2023 | 3,466 | ||||
| 2024 | 3,436 | ||||
| Thereafter | 12.448 | ||||
| $ | 30,293 |
| Continued: | ||||
| Amount | ||||
| Estimated amortization expense for the year ending December 31: | ||||
| 2018 | $ | 695 | ||
| 2019 | 695 | |||
| 2020 | 695 | |||
| 2021 | 625 | |||
| 2022 | 455 | |||
| Thereafter | 1,545 | |||
| $ | 4,710 | |||
| Other Assets and Cash Surrender Value |
Financing costs related to the issuance of junior subordinated debentures are being amortized over the life of the instruments and are included in other assets. The Company invests in bank owned life insurance (BOLI). BOLI involves the purchase of life insurance by the Company on a chosen group of employees. The Company is the owner of the policies and, accordingly, the cash surrender value of the policies is reported as an asset, and increases in cash surrender values are reported as income.
| Other Liabilities |
Financing costs related to the issuance of junior subordinated debentures are being amortized over the life of the instruments and are included in other liabilities.
| 14. | Restricted Stock |
The Company accounts for stock based compensation in accordance with ASC Topic 718,Compensation - Stock Compensation. Compensation cost is recognized for all restricted stock granted based on the weighted average fair value stock price at the grant date.
| Income Taxes |
The Company and its subsidiary file consolidated income tax returns. The subsidiary provides for income taxes on a separate return basis and remits to the Company amounts determined to be payable.
Income taxes are provided for the tax effects of the transactions reported in the financial statements and consist of taxes currently payable plus deferred taxes related primarily to differences between the bases of assets and liabilities as measured by income tax laws and their bases as reported in the financial statements. The deferred tax assets and liabilities represent the future tax consequences of those differences, which will either be taxable or deductible when the assets and liabilities are recovered or settled.
ASC Topic 740,Income Taxes,provides guidance on financial statement recognition and measurement of tax positions taken, or expected to be taken, in tax returns. ASC Topic 740 requires an evaluation of tax positions to determine if the tax positions will more likely than not be sustainable upon examination by the appropriate taxing authority. The Company, at December 31, 20172019 and 2016,2018, had no uncertain tax positions that qualify for either recognition or disclosure in the financial statements.
| 66 |
| Advertising Costs |
Advertising costs are expensed in the period in which they are incurred. Advertising expense for the years ended December 31, 2019, 2018 and 2017, 2016was $648 thousand, $382 thousand, and 2015, was $336,450, $401,751, and $437,085,$336 thousand, respectively.
| Statements of Cash Flows |
For purposes of reporting cash flows, cash and cash equivalents include cash, amounts due from banks, interest-bearing deposits with banks and federal funds sold. Generally, federal funds are sold for a one to seven day period.
| Off-Balance Sheet Financial Instruments |
In the ordinary course of business, the subsidiary bank enters into off-balance sheet financial instruments consisting of commitments to extend credit, credit card lines and standby letters of credit. Such financial instruments are recorded in the financial statements when they are exercised.
| Earnings |
Per share amounts are presented in accordance with ASC Topic 260,Earnings Per Share. Under ASC Topic 260, two per share amounts are considered and presented, if applicable. Basic per share data is calculated based on the weighted-average number of common shares outstanding during the reporting period. Diluted per share data includes any dilution from securities that may be converted into common stock, such as outstanding restricted stock. There were no anti-dilutive common stock equivalents excluded in the calculations.
The following tables disclose the reconciliation of the numerators and denominators of the basic and diluted computations applicableavailable to common stockholders:stockholders ($ in thousands, except per share amount):
| For the Year Ended December 31, 2017 | ||||||||||||
Net Income (Numerator) | Shares (Denominator) | Per Share Amount | ||||||||||
| Basic per common Share | $ | 10,616,476 | 9,484,460 | $ | 1.12 | |||||||
| Effect of dilutive shares: | ||||||||||||
| Restricted Stock | 76,800 | |||||||||||
| $ | 10,616,476 | 9,561,260 | $ | 1.11 | ||||||||
For the Year Ended December 31, 2019
| For the Year Ended December 31, 2016 | ||||||||||||
Net Income (Numerator) | Shares (Denominator) | Per Share Amount | ||||||||||
| Basic per common Share | $ | 9,666,382 | 5,435,088 | $ | 1.78 | |||||||
| Convertible Preferred Dividend | 133,627 | |||||||||||
| Effect of dilutive shares: | ||||||||||||
| Convertible Preferred, Series E | 742,371 | |||||||||||
| Restricted Stock | 81,874 | |||||||||||
| $ | 9,800,009 | 6,259,333 | $ | 1.57 | ||||||||
Net Income (Numerator) | Weighted Average Shares (Denominator) |
Per Share Amount | ||||||||||
| Basic per common | ||||||||||||
| Share | $ | 43,745 | 17,050,095 | $ | 2.57 | |||||||
| Effect of dilutive shares: | ||||||||||||
| Restricted Stock | - | 133,990 | ||||||||||
| $ | 43,745 | 17,184,085 | $ | 2.55 | ||||||||
| For the Year Ended December 31, 2015 | ||||||||||||
Net Income (Numerator) | Shares (Denominator) | Per Share Amount | ||||||||||
| Basic per common share | $ | 8,456,242 | 5,371,111 | $ | 1.57 | |||||||
| Effect of dilutive shares: | ||||||||||||
| Restricted Stock | 70,939 | |||||||||||
| $ | 8,456,242 | 5,442,050 | $ | 1.55 | ||||||||
For the Year Ended December 31, 2018
Net Income (Numerator) | Weighted Average Shares (Denominator) |
Per Share Amount | ||||||||||
| Basic per common | ||||||||||||
| Share | $ | 21,225 | 12,985,733 | $ | 1.63 | |||||||
| Effect of dilutive shares: | ||||||||||||
| Restricted Stock | - | 108,192 | ||||||||||
| $ | 21,225 | 13,093,925 | $ | 1.62 | ||||||||
| 67 |
For the Year Ended December 31, 2017
| Net | Weighted Average | |||||||||||
| Income | Shares | Per Share | ||||||||||
| (Numerator) | (Denominator) | Amount | ||||||||||
| Basic per common Share | $ | 10,616 | 9,484,460 | $ | 1.12 | |||||||
| Effect of dilutive shares: | ||||||||||||
| Restricted Stock | - | 76,800 | ||||||||||
| $ | 10,616 | 9,561,260 | $ | 1.11 | ||||||||
The diluted per share amounts were computed by applying the treasury stock method.
20. Mergers and Acquisitions
Business combinations are accounted for under ASC 805, “Business Combinations”, using the acquisition method of accounting. The acquisition method of accounting requires an acquirer to recognize the assets acquired and the liabilities assumed at the acquisition date measured at their fair values as of that date. To determine the fair values, the Company relies on third party valuations, such as appraisals, or internal valuations based on discounted cash flow analyses or other valuation techniques. Under the acquisition method of accounting, the Company identifies the acquirer and the closing date and applies applicable recognition principles and conditions. Acquisition-related costs are costs the Company incurs to effect a business combination. Those costs include advisory, legal, accounting, valuation, and other professional or consulting fees. Some other examples of costs to the Company include systems conversion, integration planning consultants and advertising costs. The Company accounts for acquisition-related costs as expenses in the periods in which the costs are incurred and the services are received, with one exception. The costs to issue debt or equity securities is recognized in accordance with other applicable GAAP. These acquisition-related costs have been and will be included within the Consolidated Statements of Income classified within the non-interest expense caption.
21. Investment in Limited Partnership
The Company isinvested $4.4 million in a limited partner in a partnership that provides low-income housing. The Company is not the general partner and does not have controlling ownership. The carrying value of the Company’s investment in the limited partnership was $3,837,468$3.0 million at December 31, 20172019 and $4,058,801$3.4 million at December 31, 2016,2018, net of amortization, using the proportional method and is reported in other assets on the Consolidated Balance Sheets. The Company’s maximum exposure to loss is limited to the carrying value of its investment. The Company received $481,325$481 thousand in low-income housing tax credits during 2017, $160,442 in 20162019, 2018 and $0 in 2015.2017.
22. Reclassifications
Certain reclassifications have been made to the 20162018 and 20152017 financial statements to conform with the classifications used in 2017.2019. These reclassifications did not impact the Company's consolidated financial condition or results of operations.
23. Accounting Standards
In February, 2018, the FASB issuedAdoption of New Accounting Standards Update (ASU) 2018-02,
Income Statement - Reporting Comprehensive Income (Topic 220): Reclassification of Certain Tax Effects from Accumulated Other Comprehensive Income.
On January 1, 2019, the Company adopted ASU No. 2018-02 allows for2016-02 “Leases (Topic 842)” and subsequent amendments thereto, which requires the reclassification from other comprehensive incomeCompany to retained earnings for stranded tax effects resulting fromrecognize most leases on the Tax Cutsbalance sheet. We adopted the standard under the cumulative effect transition method as of the date of adoption and Jobs Act (the Act). The ASU also allows an accounting policy electionelected to reclassify other stranded tax effects that relateapply several of the available practical expedients, including:
| · | Carryover of historical lease determination and lease classification conclusions |
| · | Carryover of historical initial direct cost balances for existing leases |
| · | Accounting for lease and non-lease components in contracts in which the Company is a lessee as a single lease component |
Adoption of the leasing standard resulted in the recognition of operating right-of-use assets of $1.8 million, and operating lease liabilities of $1.8 million as of January 1, 2019. These amounts were determined based on the present value of remaining minimum lease payments, discounted using the Company’s incremental borrowing rate as of the date of adoption. There was no material impact to the Act buttiming of expense or income recognition in the Company’s Consolidated Income Statements. Prior periods were not directlyrestated and continue to be presented under legacy GAAP. Disclosures about the Company’s leasing activities are presented in Note I – Lease Obligations.
In December 2019, the Company early adopted the amendments in ASU 2019-04 –Codification Improvements to Topic 326, Financial Instruments – Credit Losses, Topic 815, Derivatives and Hedging, and Topic 825 Financial Instruments.These amendments clarifies and improves areas of guidance related to the changerecently issued standards on credit losses, hedging, and recognition and measurement. An entity may reclassify a debt security from held-to-maturity to available-for-sale if it is an eligible hedged item under the last-layer method. Any unrealized gain or loss at the transfer date would be recorded in federal tax rate. This ASU is effective in the first quarter of 2019. Early adoption is permitted for reporting periods for which financial statements have not yet been issued.accumulated other comprehensive income. The Company adopted this ASUreclassified $6.3 million in securities with an unrealized holdings gain of $1.2 million from the fourth quarter of 2017 by retrospective application. Upon adoption,held-to-maturity portfolio to the Company made a policy election to reclassify stranded tax effects of approximately $76 thousand from Accumulated Other Comprehensive Income to retained earnings using the specific identification method.available-for-sale portfolio.
New Accounting Standards That Have Not Yet Been Adopted
In May 2017,December 2019, the FASB issued ASU No. 2017-09,2019-12,Stock Compensation, Scope of ModificationIncome Taxes (Topic 740): Simplifying the Accounting for Income Taxes.. ASU 2017-09 clarifies when changes2019-12 removes specific exceptions to the terms of conditions of a share-based payment award must be accounted for as modifications. Companies will apply the modification accounting guidance if any changegeneral principles in the value, vesting conditions or classification of the award occurs. The new guidance should reduce diversity in practice and result in fewer changes to the terms of an award being accounted for as modifications, as the guidance will allow companies to make certain non-substantive changes to awards without accounting for them as modifications. It does not changeTopic 740. This update simplifies the accounting for modifications.income taxes by eliminating certain exceptions to the guidance in ASC 740 related to the approach for intraperiod tax allocation, the methodology for calculating income taxes in an interim period and the recognition for deferred tax liabilities for outside basis differences. The ASU 2017-09 isalso improves financial statement preparers’ application for income tax-related guidance, simplifies GAAP for franchise taxes and enacted changes in tax laws or rates, and clarifies the accounting for transactions that result in a step-up in the tax basis of goodwill. ASU 2019-12 will be effective for interimon January 1, 2021 and annual reporting periods beginning after December 15, 2017; early adoption is permitted. ASU 2017-09 is not expected to have a material impact on the Company’s Consolidated Financial Statements.
In March 2017,2019, the FASB issued ASU No. 2017-08,2019-01,Premium AmortizationLeases: Codification Improvements.ASU 2019-01 provides clarification to increase transparency and comparability among organizations by recognizing lease assets and liabilities on Purchased Callable Debt Securities.the balance sheet and disclosing essential information about leasing transactions. This ASU 2017-08 shortens(1) allows the amortization period for the premium on certain purchased callable debt securities to the earliest call date. Currently, entities generally amortize the premium as an adjustment of yield over the contractual lifefair value of the security. The ASU doesunderlying asset reported by lessors that are not change the accounting for purchased callable debt securities held at a discount as the discount willmanufacturers or dealers to continue to be accretedits cost and not fair value as measured under the fair value definition, (2) allows for the payments received from sales-type and direct financing leases to maturity.continue to be presented as results from investing activities in the statement of cash flows, and (3) clarifies that entities do not have to disclose the effect of the lease standard on adoption year interim amounts. ASU 2017-082019-01 was effective on January 1, 2020 and will not have a material impact on the Company’s Consolidated Financial Statements.
In August 2018, the FASB issued ASU No. 2018-13,Disclosure Framework – Changes to the Disclosure Requirements for Fair Value Measurement.ASU 2018-11 eliminates, adds and modifies certain disclosure requirements for fair value measurements. Among the changes, entities will no longer be required to disclose the amount of and reasons for transfers between Level 1 and Level 2 of the fair value hierarchy, but will be required to disclose the range and weighted average used to develop significant unobservable inputs for Level 3 fair value measurements. ASU 2018-13 is effective for interim and annual reporting periods beginning after December 15, 2018;2019; early adoption is permitted. Entities are also allowed to elect for early adoption the eliminated or modified disclosure requirements and delay adoption of the new disclosure requirements until their effective date. The revised disclosure requirements will not have a material impact on the Company’s Consolidated Financial Statements.
In August 2018, the FASB issued ASU No. 2018-15,“Intangibles – Goodwill and Other – Internal-Use Software (Subtopic 350-40): Customer’s Accounting for Implementation Costs Incurred in a Cloud Computing Arrangement That Is a Service Contract.”These amendments align the requirements for capitalizing implementation costs incurred in a hosting arrangement that is a service contract with the requirements for capitalizing implementation costs incurred to develop or obtain internal-use software (and hosting arrangements that include an internal-use software license). The accounting for the service element of a hosting arrangement that is a service contract is not affected by these amendments. The guidance callsis effective for public business entities for annual periods, including interim periods within those annual periods, beginning after December 15, 2019. Early adoption is permitted. ASU 2018-15 will not have a modified retrospective transition approach under which a cumulative-effect adjustment will be made to retained earnings as ofmaterial impact on the beginning of the first reporting period in which ASU 2017-08 is adopted. The Company is currently evaluating the provisions of ASU 2017-08 to determine the potential impact the new standard will have on itsCompany’s Consolidated Financial Statements.
| 69 |
In January 2017, the FASB issued ASU No. 2017-04,“Simplifying the Test for Goodwill Impairment.”ASU 2017- 042017-04 removes Step 2 of the goodwill impairment test, which requires a hypothetical purchase price allocation. Under the amended guidance, a goodwill impairment charge will now be recognized for the amount by which the carrying value of a reporting unit exceeds its fair value, not to exceed the carrying amount of goodwill. This guidance is effective for interim and annual periods beginning after December 15, 2019, with early adoption permitted for any impairment tests performed after January 1, 2017. The Company is currently assessing the impact of ASU 2017-04 on its Consolidated Financial Statements.
In August 2016, the FASB issued ASU No. 2016-15,Classification of Certain Cash Receipts and Cash Payments. Current GAAP is unclear or does not include specific guidance on how to classify certain transactionswill be determined in the statement of cash flows. ASU 2016-15 is intended to reduce diversity in practice in how eight particular transactionsfuture as goodwill impairment tests are classified in the statement of cash flows. ASU 2016-15 is effective for interim and annual reporting periods beginning after December 15, 2017. Entities will be required to apply the guidance retrospectively. If it is impracticable to apply the guidance retrospectively for an issue, the amendments related to that issue would be applied prospectively. As this guidance only affects the classification within the statement of cash flows, ASU 2016-15 is not expected to have a material impact on the Company's Consolidated Financial Statements.conducted.
In June 2016, the Financial Accounting Standards Board (FASB)FASB issued ASU No. 2016-13,Financial “Financial Instruments -– Credit Losses (Topic 326): Measurement of Credit Losses on Financial Instruments(Instruments” (“ASU 2016-13)2016-13”). ASU 2016-13 requires aThe FASB issued new impairmentguidance (Topic 326) to replace the incurred loss model knownfor loans and other financial assets with an expected loss model, which is referred to as the current expected credit loss (“CECL”) which significantly changes(CECL) model. The CECL model is applicable to the way impairmentmeasurement of financial instruments is recognized by requiring immediate recognition of estimated credit losses expected to occur over the remaining life ofon financial instruments. The main provisions of ASU 2016-13 include (1) replacing the “incurred loss” approach under current GAAP with an “expected loss” model for instrumentsassets measured at amortized cost, (2) requiring entitiesincluding loan receivables and held-to-maturity debt securities. It also applies to record an allowanceoff-balance sheet credit exposures not accounted for as insurance (loan commitments, standby letters of credit, financial guarantees, and other similar instruments) and net investments in certain leases recognized by a lessor. In addition, the amendments in Topic 326 require credit losses related toon available-for-sale debt securities to be presented as a valuation allowance rather than as a direct write-down of the carrying amount of the investments, as is required by the other-than- temporary-impairment model under current GAAP, and (3) a simplified accounting model for purchased credit-impaired debt securities and loans. ASU 2016-13 is effective for interim and annual reporting periods beginning after December 15, 2019, although early adoption is permitted.write-down. The Company is currently assessing the impact of the adoption of ASU 2016-13 on its Consolidated Financial Statements.
In March 2016, the FASB issued ASU 2016-09,Compensation – Stock Compensation (Topic 718): Improvements to Employee Share-Based Payment Accounting, which simplifies several aspects of the accounting for employee share-based payment transactions for both public and nonpublic entities, including the accounting for income taxes, forfeitures, and statutory tax withholding requirements, as well as classification in the statement of cash flows. ASU 2016-09 is effective for annual periods beginning after December 15, 2016, and interim periods within those annual periods. The Company adopted the amendments effective January 1, 2017. The Company has a stock-based compensation plan for which the ASU 2016-09 guidance results in the associated excess tax benefits or deficiencies being recognized as tax expense or benefit in the income statement instead of the previous accounting treatment, which requires excess tax benefits to be recognized as an adjustment to additional paid-in capital and excess tax deficiencies to be recognized as either an offset to accumulated excess tax benefits, if any, or to the income statement. In addition, such amounts are now classified as an operating activity in the statement of cash flows instead of the current accounting treatment, which required it to be classified as both an operating and a financing activity. The Company’s stock based compensation plan has not historically generated material amounts of excess tax benefits or deficiencies and, therefore, the Company has not experienced a material change in the Company’s financial position or results of operation as a result of the adoption and implementation of ASU 2016-09.
In February 2016, the FASB issued ASU NO. 2016-02Leases (Topic 842).ASU 2016-02 establishes a right of use model that requires a lessee to record a right of use asset and a lease liability for all leases with terms longer than 12 months. Leasesstandard will be classified as either finance or operating with classification affecting the pattern of expense recognition in the income statement. For lessors, the guidance modifies the classification criteria and the accounting for sales-type and direct financing leases. A lease will be treated as a sale if it transfers all of the risks and rewards, as well as control of the underlying asset, to the lessee. If risks and rewards are conveyed without the transfer of control, the lease is treated as a financing. If neither risks and rewards nor control is conveyed, an operating lease results. The amendments are effective for fiscal years beginning after December 15, 2018,2019, including interim periods withinin those fiscal yearsyears. For calendar year-end SEC filers, it is effective for public business entities. Entities are requiredMarch 31, 2020 interim financial statements. For debt securities with other-than-temporary impairment (OTTI), the guidance will be applied prospectively. Existing purchased credit impaired (PCI) assets will be grandfathered and classified as purchased credit deteriorated (PCD) assets at the date of adoption. The assets will be grossed up for the allowance for expected credit losses for all PCD assets at the date of adoption and will continue to userecognize the noncredit discount in interest income based on the yield of such assets as of the adoption date. Subsequent changes in expected credit losses will be recorded through the allowance. For all other assets within the scope of CECL, a modified retrospective approach for leases that exist or are entered into aftercumulative-effect adjustment will be recognized in retained earnings as of the beginning of the earliest comparativefirst reporting period in which the financial statements, with certain practical expedients available. Earlyguidance is effective.
The Company’s Allowance for Credit Loss Committee (ACL Committee), made up of executive and senior management from corporate administration, accounting, risk management, and credit and portfolio administration, have reviewed and approved the methodology and initial setup of the CECL Model. All historical data used in the model’s calculation, the mathematical accuracy of that calculation, and any inputs provided externally that affect the calculation have been independently validated. Internal controls necessary in maintaining accuracy to estimate an adequate reserve have been designed but not tested for operating effectiveness. At this time, the Company has determined that the impact to the allowance for credit losses will be an increase under the new standard due to the life of loan loss estimation methodology, as well as the requirement to record an allowance on acquired loans previously recorded at fair value. It can be reasonably expected that a probable range in the reserve as a percentage of total loans after adoption is permitted.of this guidance to be between 0.68% and 1.39%. The Company is assessing the impactcurrently focused on refining key adjustments and assumptions for a final loss estimate, for a final cumulative adjustment to retained earnings that will be recorded net of ASU 2016-02 on its accounting and disclosures.tax as of January 1, 2020.
In September of 2014, the FASB issued ASU 2014-09, Revenue from Contracts with Customers (Topic 606). ASU 2014-09 modifies the guidance used to recognize revenue from contracts with customers for transfers of goods and services and transfers of nonfinancial assets, unless those contracts are within the scope of other guidance. The guidance also requires new qualitative and quantitative disclosures about contract balances and performance obligations. The Company will adopt ASU 2014-09 indoes not expect material allowance for credit losses to be recorded on available-for-sale debt securities, as the first quartermajority of 2018 under the modified retrospective method whereportfolio consists of government agency-backed securities for which the cumulative effectrisk of loss is recognized at the date of initial application. Based upon an evaluation under the current guidance, the Company estimates that substantially all of its interest income and non-interest income will not be impacted by the adoption of this ASU because either the revenue from those contracts with customers is covered by other guidance in U.S. GAAP or the revenue recognition outcomes anticipated with the adoption of this ASU will likely be similar to the Company’s current revenue recognition practices. The adoption of this ASU is not expected to have a material effect on the consolidated financial statements.minimal.
NOTE C – BUSINESS COMBINATIONS
The Company accounts for its business combinations using the acquisition method. Acquisition accounting requires the total purchase price to be allocated to the estimated fair values of assets acquired and liabilities assumed, including certain intangible assets that must be recognized. Typically, this allocation results in the purchase price exceeding the fair value of net assets acquired, which is recorded as goodwill. Core deposit intangibles are a measure of the value of checking, money market and savings deposits acquired in business combinations accounted for under the acquisition method. Core deposit intangibles and other identified intangibles with finite useful lives are amortized using the straight-line method over their estimated useful lives of up to ten years. Loans that the Company acquires in connection with acquisitions are recorded at fair value with no carryover of the related allowance for credit losses. Fair value of the loans involves estimating the amount and timing of principal and interest cash flows expected to be collected on the loans and discounting those cash flows at a market rate of interest. The excess or deficit of cash flows expected at acquisition over the estimated fair value is referred to as the accretable discount or amortizable premium and is recognized into interest income over the remaining life of the loan.
| 70 |
Acquisitions
Iberville BankFirst Florida Bancorp, Inc.
On JanuaryNovember 1, 2017,2019, the Company completed its acquisition of 100% of the common stock of Iberville Bank, Plaquemine, Louisiana, from A. Wilbert’s Sons Lumber and Shingle Co.First Florida Bancorp, Inc. (“Iberville Parent”FFB”), and immediately thereafter merged Iberville Bank (“Iberville”), theits wholly-owned subsidiary, of Iberville Parent,First Florida Bank with and into The First. The Company paid a total consideration of $31.1$89.5 million in cash. Approximately $2.5 million ofstock to the purchase price was held in escrowFFB shareholders as contingency for flood-related lossesconsideration in the loan portfolio incurred due to floodingmerger, which included 1,682,889 shares of Company common stock and approximately $34.1 million in Iberville’s market area in the fall of 2016. The Company expects to receive $498,207 from the escrow for settlement of flood-related loans. Goodwill at December 31, 2017, reflects the escrow settlement.cash.
In connection with the acquisition, the Company recorded approximately $5.1$40.0 million of goodwill and $2.7$3.7 million of core deposit intangible. Goodwill is not deductible for income taxes. The core deposit intangible is towill be amortized to expense over 10 years.
The Company acquired Iberville’s $149.4the $248.9 million loan portfolio at an estimated fair value discount of $0.8$1.7 million. The discount represents expected credit losses, adjusted for market interest rates and liquidity adjustments.
Expenses associated with the acquisition were $0 and $3.6$2.4 million for the three and twelve month period ended December 31, 2017,2019. These costs included system conversion and integrating operations charges and legal and consulting expenses, which have been expensed as incurred.
The assets acquired and liabilities assumed and consideration paid in the acquisition of FFB were recorded at their estimated fair values based on management’s best estimates using information available at the date of the acquisition and are subject to adjustment for up to one year after the closing date of the acquisition. While the fair values are not expected to be materially different from the estimates, accounting guidance provides that an acquirer must recognize adjustments to provisional amounts that are identified during the measurement period, which runs through November 1, 2020, in the measurement period in which the adjustment amounts are determined. The acquirer must record in the financial statements, the effect on earnings of changes in depreciation, amortization or other income effects, if any, as a result of changes to the provisional amounts, calculated as if the accounting had been completed at the acquisition date. The items most susceptible to adjustment are the credit fair value adjustments on loans, core deposit intangible and the deferred income tax assets resulting from the acquisition.
The following table summarizes the provisional fair values of the assets acquired and liabilities assumed on November 1, 2019 ($ in thousands):
| Purchase price: | ||||
| Cash and stock | $ | 89,520 | ||
| Total purchase price | 89,520 | |||
| Identifiable assets: | ||||
| Cash and due from banks | 50,169 | |||
| Investments | 122,084 | |||
| Loans | 247,263 | |||
| Core deposit intangible | 3,745 | |||
| Personal and real property | 4,991 | |||
| Other assets | 2,283 | |||
| Total assets | 430,535 | |||
| Liabilities and equity: | ||||
| Deposits | 373,908 | |||
| Borrowed funds | 5,527 | |||
| Other liabilities | 1,619 | |||
| Total liabilities | 381,054 | |||
| Net assets acquired | 49,481 | |||
| Goodwill resulting from acquisition | $ | 40,039 |
| 71 |
The outstanding principal balance and the carrying amount of these loans included in the consolidated balance sheets at December 31, 2019, are as follows ($ in thousands):
| Outstanding principal balance | $ | 245,190 | ||
| Carrying amount | 243,601 |
PCI loans are discussed more fully under “Part II – Item 8. Financial Statements and Supplementary Data – Note E – “Loans” of this report.
FPB Financial Corp.
On March 2, 2019, the Company completed its acquisition of FPB Financial Corp., (“FPB”), and immediately thereafter merged its wholly-owned subsidiary, Florida Parishes Bank with and into The First. The Company paid a total consideration of $78.2 million in stock to the FPB shareholders as consideration in the merger, which included 2,377,501 shares of Company common stock and $5 thousand in cash.
In connection with the acquisition, the Company recorded approximately $28.8 million of goodwill and $6.6 million of core deposit intangible. Goodwill is not deductible for income taxes. The core deposit intangible will be amortized to expense over 10 years.
The Company acquired the $247.8 million loan portfolio at an estimated fair value discount of $3.1 million. The discount represents expected credit losses, adjusted for market interest rates and liquidity adjustments.
Expenses associated with the acquisition were $2.3 million for the twelve months period ended December 31, 2019. These costs included system conversion and integrating operations charges and legal and consulting expenses, which have been expensed as incurred.
The assets acquired and liabilities assumed and consideration paid in the acquisition of FPB were recorded at their estimated fair values based on management’s best estimates using information available at the date of the acquisition and are subject to adjustment for up to one year after the closing date of the acquisition. While the fair values are not expected to be materially different from the estimates, accounting guidance provides that an acquirer must recognize adjustments to provisional amounts that are identified during the measurement period, which runs through March 2, 2020, in the measurement period in which the adjustment amounts are determined. The acquirer must record in the financial statements, the effect on earnings of changes in depreciation, amortization or other income effects, if any, as a result of changes to the provisional amounts, calculated as if the accounting had been completed at the acquisition date. The items most susceptible to adjustment are the credit fair value adjustments on loans, core deposit intangible and the deferred income tax assets resulting from the acquisition.
| 72 |
The following table summarizes the provisional fair values of the assets acquired and liabilities assumed on March 2, 2019 ($ in thousands):
| Purchase price: | ||||
| Cash and stock | $ | 78,225 | ||
| Total purchase price | 78,225 | |||
| Identifiable assets: | ||||
| Cash and due from banks | 14,748 | |||
| Investments | 93,604 | |||
| Loans | 244,665 | |||
| Bank owned life insurance | 7,312 | |||
| Core deposit intangible | 6,597 | |||
| Personal and real property | 17,358 | |||
| Other assets | 1,152 | |||
| Total assets | 385,436 | |||
| Liabilities and equity: | ||||
| Deposits | 312,453 | |||
| Borrowed funds | 17,250 | |||
| Other liabilities | 6,291 | |||
| Total liabilities | 335,994 | |||
| Net assets acquired | 49,442 | |||
| Goodwill resulting from acquisition | $ | 28,783 |
The outstanding principal balance and the carrying amount of these loans included in the consolidated balance sheets at December 31, 2019, are as follows ($ in thousands):
| Outstanding principal balance | $ | 192,126 | ||
| Carrying amount | 190,034 |
PCI loans are discussed more fully under “Part II – Item 8. Financial Statements and Supplementary Data – Note E – “Loans” of this report.
FMB Financial Corp.
On November 1, 2018, the Company completed its acquisition of FMB Banking Corporation (“FMB), and immediately thereafter merged its wholly-owned subsidiary, Farmers & Merchants Bank, with and into The First. The Company paid a total consideration of $79.5 million to the former FMB shareholders including 1,763,042 shares of the Company’s common stock and $16.0 million in cash.
In Connection with the acquisition, the Company recorded $36.4 million of goodwill and $10.2 million of core deposit intangible. Goodwill is not deductible for income taxes. The core deposit intangible will be amortized to expense over 10 years.
The Company acquired FMB’s $325.5 million loan portfolio at an estimated fair value discount of $7.6 million. The discount represents expected credit losses, adjusted for market interest rates and liquidity adjustments.
Expenses associated with the acquisition were $600 thousand and $4.2 million for the twelve month period ended December 31, 2019 and 2018, respectively. These costs included system conversion and integrating operations charges, as well as legal and consulting expenses, which have been expensed as incurred.
| 73 |
The following table summarizes the finalized fair values of the assets acquired and liabilities assumed on JanuaryNovember 1, 2017:2018:
| (In Thousands) | ||||||||||||
| Measurement | ||||||||||||
| As Initially | Period | |||||||||||
| Reported | Adjustments | As Adjusted | ||||||||||
| Identifiable assets: | ||||||||||||
| Cash and due from banks | $ | 28,789 | $ | - | $ | 28,789 | ||||||
| Investments | 78,650 | (37 | ) | 78,613 | ||||||||
| Loans | 148,516 | - | 148,516 | |||||||||
| Core deposit intangible | 3,186 | (498 | ) | 2,688 | ||||||||
| Personal and real property | 4,443 | 498 | 4,941 | |||||||||
| Other assets | 9,330 | 1,140 | 10,470 | |||||||||
| Total assets | 272,914 | 1,103 | 274,017 | |||||||||
| Continued: | Measurement | |||||||||||||||||||||||
| As Initially | Period | Measurement | ||||||||||||||||||||||
| As Initially | Period | |||||||||||||||||||||||
| ($ in thousands) | Reported | Adjustments | As Adjusted | |||||||||||||||||||||
| Identifiable assets: | ||||||||||||||||||||||||
| Cash and due from banks | $ | 28,556 | $ | - | $ | 28,556 | ||||||||||||||||||
| Investments | 97,331 | - | 97,331 | |||||||||||||||||||||
| Loans | 317,909 | - | 317,909 | |||||||||||||||||||||
| Bank owned life insurance | 13,639 | - | 13,639 | |||||||||||||||||||||
| Core deposit intangible | 10,203 | - | 10,203 | |||||||||||||||||||||
| Personal and real property | 15,204 | (254 | ) | 14,950 | ||||||||||||||||||||
| Other assets | 2,902 | 152 | 3,054 | |||||||||||||||||||||
| Total assets | 485,744 | (102 | ) | 485,642 | ||||||||||||||||||||
| Reported | Adjustments | As Adjusted | ||||||||||||||||||||||
| Liabilities and equity: | ||||||||||||||||||||||||
| Deposits | 243,656 | - | 243,656 | 431,276 | - | 431,276 | ||||||||||||||||||
| Borrowed funds | 456 | - | 456 | 5,369 | - | 5,369 | ||||||||||||||||||
| Other liabilities | 2,928 | 1,478 | 4,406 | 5,894 | - | 5,894 | ||||||||||||||||||
| Total liabilities | 247,040 | 1,478 | 248,518 | 442,539 | - | 442,539 | ||||||||||||||||||
| Net assets acquired | 25,874 | (375 | ) | 25,499 | 43,205 | (102 | ) | 43,103 | ||||||||||||||||
| Consideration paid | 31,100 | (498 | ) | 30,602 | 79,547 | - | 79,547 | |||||||||||||||||
| Goodwill resulting from Acquisition | $ | 5,226 | $ | (123 | ) | $ | 5,103 | |||||||||||||||||
| Goodwill resulting from acquisition | $ | 36,342 | $ | (102 | ) | $ | 36,444 | |||||||||||||||||
Valuation adjustments have been made to securities, personal and real property and core deposit intangibleother assets since initially reported.
The outstanding principal balance and the carrying amount of these loans included in the consolidated balance sheet at December 31, 2017,2019, are as follows:follows ($ in thousands):
| Outstanding principal balance | $ | 123,325,609 | $ | 222,464 | ||||
| Carrying amount | 122,621,607 | 217,539 |
There were no purchased credit impairedPCI loans at December 31, 2017.are discussed more fully under “Part II – Item 8. Financial Statements and Supplementary Data – Note E – “Loans” of this report.
Gulf Coast Community BankSunshine Financial, Inc.
Also on JanuaryOn April 1, 2017,2018, the Company completed the mergerits acquisition of Gulf CoastSunshine Financial, Inc. (“Sunshine”), and immediately thereafter merged its wholly-owned subsidiary, Sunshine Community Bank, (“GCCB”), Pensacola, Florida, with and into The First. The Company issuedpaid a total consideration of $30.5 million to GCCB’sthe former Sunshine shareholders including 726,461 shares of the Company’s common stock which, for purposes of the GCCB acquisition, were valued through averaging the trading price of the Company’s common stock price over a 30 day trading period ending on the fifth business day prior to the closing of the acquisition. Fractional shares were acquired withand $7.0 million in cash. The consideration totaled approximately $2.3 million.
In connection with the acquisition, the Company recorded approximately $1.1$9.5 million of goodwill and $1.0$4.1 million of core deposit intangible. Goodwill is not deductible for income tax purposes. The core deposit intangible is towill be amortized to expense over 10 years.
The Company acquired GCCB’s $91.0Sunshine’s $173.1 million loan portfolio at aan estimated fair value discount of approximately $2.2$4.5 million. The discount represents expected credit losses, adjusted for market interest rates and liquidity adjustments.
Expenses associated with the acquisition were $0$253 thousand and $2.8$4.2 million for the three month and twelve month period ended December 31, 2017,2019 and 2018, respectively. These costs included systemssystem conversion and integrating operations charges, as well as legal and consulting expenses, which have been expensed as incurred.
The following table summarizes the finalized fair values of the assets acquired and liabilities assumed on January 1, 2017:
| (In Thousands) | ||||||||||||
| Measurement | ||||||||||||
| As Initially | Period | |||||||||||
| Reported | Adjustments | As Adjusted | ||||||||||
| Identifiable assets: | ||||||||||||
| Cash and due from banks | $ | 6,047 | $ | (314 | ) | $ | 5,733 | |||||
| Investments | 13,833 | (28 | ) | 13,805 | ||||||||
| Loans | 88,801 | - | 88,801 | |||||||||
| Core deposit intangible | 787 | 166 | 953 | |||||||||
| Personal and real property | 4,739 | - | 4,739 | |||||||||
| Other real estate | 7,057 | 336 | 7,393 | |||||||||
| Deferred tax asset | 6,693 | (15 | ) | 6,678 | ||||||||
| Other assets | 490 | (22 | ) | 468 | ||||||||
| Total assets | 128,447 | 123 | 128,570 | |||||||||
| Continued: | Measurement | |||||||||||
| As Initially | Period | |||||||||||
| Reported | Adjustments | As Adjusted | ||||||||||
| Liabilities and equity: | ||||||||||||
| Deposits | 111,993 | - | 111,993 | |||||||||
| Borrowed funds | 14,450 | - | 14,450 | |||||||||
| Other liabilities | 950 | - | 950 | |||||||||
| Total liabilities | 127,393 | - | 127,393 | |||||||||
| Net assets acquired | 1,054 | 123 | 1,177 | |||||||||
| Consideration paid | 2,258 | - | 2,258 | |||||||||
| Goodwill resulting from Acquisition | $ | 1,204 | $ | (123 | ) | $ | 1,081 | |||||
Valuation adjustments have been made to securities, core deposit intangible, and other real estate since initially reported. Also, certain amounts have been reclassified to conform to the classifications of the Company.Southwest Banc Shares, Inc.
On March 3, 2017, $5.01, 2018, the Company completed its acquisition of Southwest Banc Shares, Inc. (“Southwest”), and immediately thereafter merged its wholly-owned subsidiary, First Community Bank, with and into The First. The Company paid a total consideration of $60.0 million to the former Southwest shareholders including 1,134,010 shares of the Company’s common stock and $24.0 million in cash.
In connection with the acquisition, the Company recorded $23.9 million of goodwill and $5.8 million of core deposit intangible. Goodwill is not deductible for income tax purposes. The core deposit intangible will be amortized to expense over 10 years.
The Company acquired Southwest’s $274.7 million loan portfolio at an estimated fair value discount of $3.5 million. The discount represents expected credit losses, adjusted for market interest rates and liquidity adjustments.
Expenses associated with the acquisition were $519 thousand the twelve month period ended December 31, 2019. These costs included system conversion and integrating operations charges, as well as legal and consulting expenses, which have been expensed as incurred.
Supplemental Pro Forma Information
The following table presents certain supplemental pro forma information, for illustrative purposes only, for the years December 31, 2019 and 2018 as if the Southwest Banc Shares, Sunshine Financial, FMB, FPB and FFB acquisitions had occurred on January 1, 2018. The pro forma financial information is not necessarily indicative of the results of operations had the acquisitions been effective as of this date.
Pro Forma for the Year Ended December 31, | ||||||||
| 2019 | 2018 | |||||||
| ($ in thousands) | (unaudited) | (unaudited) | ||||||
| Net interest income | $ | 137,655 | $ | 138,422 | ||||
| Non-interest income | 30,699 | 29,434 | ||||||
| Total revenue | 168,354 | 167,856 | ||||||
| Income before income taxes | 77,936 | 55,069 | ||||||
Supplemental pro-forma earnings were adjusted to exclude acquisition costs incurred.
Non-credit impaired loans acquired in the acquisition were sold. In connection with the sale, the acquisition were sold. In connection with the sale, the acquisition credit mark was decreased by $2.2 million, the amount of which was included in the credit mark at acquisition.
The outstanding principal balance and the carrying amount of these loans included in the consolidated balance sheet at December 31, 2017, are as follows:
| Outstanding principal balance | $ | 60,223,959 | ||
| Carrying amount | 60,320,605 |
Loans acquired in the two acquisitions were accounted for in accordance with ASC 310-20,Receivables-
NonrefundableReceivables-Nonrefundable Fees and Other CostsCosts.. No loans were identified as purchasedPurchased credit impaired loans.loans acquired in the Southwest, FMB, FPB and FFB acquisitions were accounted for in accordance with ASC 310-30Accounting for Purchased Loans with Deteriorated Credit Quality. PCI loans are discussed more fully under “Part II – Item 8. Financial Statements and Supplementary Data – Note E – “Loans” of this report.
Recent Acquisitions
See Note T – Subsequent Events for more information on the acquisitions of Southwest Banc Shares, Inc. and Sunshine Financial, Inc. that are scheduled to close in 2018.
NOTE D – SECURITIES
A summary ofThe following table summarizes the amortized cost and estimated fair value of securities available-for-sale and securities and held-to-maturity securities at December 31, 20172019 and 2016 follows:2018 and the corresponding amounts of gross unrealized gains and losses recognized in accumulated other comprehensive income (loss) and gross unrecognized gains and losses:
| December 31, 2017 | ||||||||||||||||
Amortized Cost | Gross Unrealized Gains | Gross Unrealized Losses | Estimated Fair Value | |||||||||||||
| Available-for-sale securities: | ||||||||||||||||
| Obligations of U.S. Government Agencies | $ | 4,996,142 | $ | - | $ | 4,007 | $ | 4,992,135 | ||||||||
| Tax-exempt and taxable obligations of states and municipal subdivisions | 137,281,213 | 2,027,575 | 724,750 | 138,584,038 | ||||||||||||
| Mortgage-backed securities | 197,346,171 | 785,321 | 1,553,516 | 196,577,976 | ||||||||||||
| Corporate obligations | 16,599,433 | 20,901 | 801,426 | 15,818,908 | ||||||||||||
| Other | 1,255,483 | - | 335,459 | 920,024 | ||||||||||||
| $ | 357,478,442 | $ | 2,833,797 | $ | 3,419,158 | $ | 356,893,081 | |||||||||
| Continued: | Amortized Cost | Gross Unrealized Gains | Gross Unrealized Losses | Estimated Fair Value | ||||||||||||
| Held-to-maturity securities: | ||||||||||||||||
| Taxable obligations of states and municipal subdivisions | $ | 6,000,000 | $ | 1,397,966 | $ | - | $ | 7,397,966 | ||||||||
| December 31, 2016 | ||||||||||||||||
Amortized Cost | Gross Unrealized Gains | Gross Unrealized Losses | Estimated Fair Value | |||||||||||||
| Available-for-sale securities: | ||||||||||||||||
| Obligations of U.S. Government Agencies | $ | 9,023,293 | $ | 27,718 | $ | 6,341 | $ | 9,044,670 | ||||||||
| Tax-exempt and taxable obligations of states and municipal subdivisions | 98,327,829 | 1,677,764 | 1,183,186 | 98,822,407 | ||||||||||||
| Mortgage-backed securities | 114,990,863 | 602,179 | 1,304,090 | 114,288,952 | ||||||||||||
| Corporate obligations | 21,274,200 | 66,477 | 1,230,566 | 20,110,111 | ||||||||||||
| Other | 1,255,483 | - | 315,660 | 939,823 | ||||||||||||
| $ | 244,871,668 | $ | 2,374,138 | $ | 4,039,843 | $ | 243,205,963 | |||||||||
| Held-to-maturity securities: | ||||||||||||||||
| Taxable obligations of states and municipal subdivisions | $ | 6,000,000 | $ | 1,393,828 | $ | - | $ | 7,393,828 | ||||||||
| December 31, 2019 | ||||||||||||||||
| ($ in thousands) | Amortized Cost | Gross Unrealized Gains | Gross Unrealized Losses | Fair Value | ||||||||||||
| Available-for-sale securities: | ||||||||||||||||
| U.S Treasury | $ | 4,967 | $ | - | $ | 73 | $ | 4,894 | ||||||||
| Obligations of U.S. government agencies and sponsored entities | 76,699 | 1,475 | 224 | 77,950 | ||||||||||||
| Tax-exempt and taxable obligations of states and municipal subdivisions | 253,527 | 5,602 | 147 | 258,982 | ||||||||||||
| Mortgage-backed securities - residential | 263,229 | 4,726 | 107 | 267,848 | ||||||||||||
| Mortgage-backed securities - commercial | 125,292 | 2,398 | 223 | 127,467 | ||||||||||||
| Corporate obligations | 27,877 | 218 | 149 | 27,946 | ||||||||||||
| Total available-for-sale | $ | 751,591 | $ | 14,419 | $ | 923 | $ | 765,087 | ||||||||
| December 31, 2018 | ||||||||||||||||
| ($ in thousands) | Amortized Cost | Gross Unrealized Gains | Gross Unrealized Losses | Fair Value | ||||||||||||
| Available-for-sale securities: | ||||||||||||||||
| Obligations of U.S. government agencies and sponsored entities | $ | 47,212 | $ | 405 | $ | 275 | $ | 47,342 | ||||||||
| Tax-exempt and taxable obligations of states and municipal subdivisions | 150,215 | 1,070 | 1,221 | 150,064 | ||||||||||||
| Mortgage-backed securities - residential | 250,132 | 727 | 3,407 | 247,452 | ||||||||||||
| Mortgage-backed securities - commercial | 39,613 | 444 | 39 | 40,018 | ||||||||||||
| Corporate obligations | 7,518 | 15 | 185 | 7,348 | ||||||||||||
| Total available-for-sale | $ | 494,690 | $ | 2,661 | $ | 5,127 | $ | 492,224 | ||||||||
| Held-to-maturity securities: | ||||||||||||||||
| Taxable obligations of states and municipal subdivisions | $ | 6,000 | $ | 1,028 | $ | - | $ | 7,028 | ||||||||
| Total held-to-maturity | $ | 6,000 | $ | 1,028 | $ | - | $ | 7,028 | ||||||||
The scheduledamortized cost and fair value of debt securities are shown by contractual maturity. Expected maturities of securities at December 31, 2017, were as follows:
| Available-for-Sale | Held-to-Maturity | |||||||||||||||
Amortized Cost | Estimated Fair Value | Amortized Cost | Estimated Fair Value | |||||||||||||
| Due less than one year | $ | 14,048,332 | $ | 14,061,545 | $ | - | $ | - | ||||||||
| Due after one year through five years | 49,518,696 | 49,775,588 | - | - | ||||||||||||
| Due after five years through ten years | 57,713,034 | 58,588,594 | 6,000,000 | 7,397,966 | ||||||||||||
| Due greater than ten years | 38,852,209 | 37,889,378 | - | - | ||||||||||||
| Mortgage-backed securities | 197,346,171 | 196,577,976 | - | - | ||||||||||||
| $ | 357,478,442 | $ | 356,893,081 | $ | 6,000,000 | $ | 7,397,966 | |||||||||
Actual maturities canmay differ from contractual maturities becauseif borrowers have the obligations may be calledright to call or prepaidprepay obligations with or without call or prepayment penalties.
| December 31, 2019 | ||||||||
| ($ in thousands) Available-for-Sale | Amortized Cost | Fair Value | ||||||
| Within one year | $ | 30,141 | $ | 30,303 | ||||
| One to five years | 80,119 | 81,372 | ||||||
| Five to ten years | 143,811 | 148,085 | ||||||
| Beyond ten years | 108,999 | 110,012 | ||||||
| Mortgage-backed securities: residential | 263,229 | 267,848 | ||||||
| Mortgage-backed securities: commercial | 125,292 | 127,467 | ||||||
| Total | $ | 751,591 | $ | 765,087 | ||||
In 2017, there was a net loss of $15,889 realized on
| 76 |
The proceeds from sales and calls of available-for-sale securities consisting of a pre-tax gain of $4,384 and a pre-tax loss of $20,273. There was a net gain of $126,286 realized in 2016the associated gains and no gain or loss realized in 2015. No other-than-temporary impairment losses were recognized for each of the three years ended December 31, 2017.are listed below:
| ($ in thousands) | 2019 | 2018 | 2017 | |||||||||
| Gross gains | $ | 147 | $ | 880 | $ | 5 | ||||||
| Gross losses | 25 | 546 | 21 | |||||||||
| Realized net gain (loss) | $ | 122 | $ | 334 | $ | (16 | ) | |||||
Securities with a carrying value of $289,001,490$447.0 million and $170,593,273$411.9 million at December 31, 20172019 and 2016,2018, respectively, were pledged to secure public deposits, repurchase agreements, and for other purposes as required or permitted by law.
The following table summarizes available-for-sale securities with unrealized and unrecognized losses at December 31, 2019 and December 31, 2018, aggregated by major security type and length of time in a continuous unrealized or unrecognized loss position:
| 2019 | ||||||||||||||||||||||||
| Less than 12 Months | 12 Months or Longer | Total | ||||||||||||||||||||||
| ($ in thousands) | Fair Value | Unrealized Losses | Fair Value | Unrealized Losses | Fair Value | Unrealized Losses | ||||||||||||||||||
| U.S. Treasury | $ | - | $ | - | $ | 4,894 | $ | 73 | $ | 4,894 | $ | 73 | ||||||||||||
| Obligations of U.S. government agencies and sponsored entities | - | - | 22,987 | 224 | 22,987 | 224 | ||||||||||||||||||
| Tax-exempt and taxable obligations of states and municipal subdivisions | - | - | 28,235 | 147 | 28,235 | 147 | ||||||||||||||||||
| Mortgage-backed securities: residential | - | - | 29,930 | 107 | 29,930 | 107 | ||||||||||||||||||
| Mortgage-backed securities: commercial | 9,306 | 16 | 19,130 | 207 | 28,436 | 223 | ||||||||||||||||||
| Corporate obligations | 500 | - | 10,572 | 149 | 11,072 | 149 | ||||||||||||||||||
| Total available-for-sale | $ | 9,806 | $ | 16 | $ | 115,748 | $ | 907 | $ | 125,554 | $ | 923 | ||||||||||||
| 2018 | ||||||||||||||||||||||||
| Less than 12 Months | 12 Months or Longer | Total | ||||||||||||||||||||||
| Fair Value | Unrealized Losses | Fair Value | Unrealized Losses | Fair Value | Unrealized Losses | |||||||||||||||||||
| Obligations of U.S. government agencies and sponsored entities | $ | 11,034 | $ | 52 | $ | 7,838 | $ | 223 | $ | 18,872 | $ | 275 | ||||||||||||
| Tax-exempt and taxable obligations of states and municipal subdivisions | 38,200 | 311 | 42,102 | 910 | 80,302 | 1,221 | ||||||||||||||||||
| Mortgage-backed securities | 93,294 | 843 | 101,005 | 2,603 | 194,299 | 3,446 | ||||||||||||||||||
| Corporate obligations | 1,962 | 40 | 4,969 | 145 | 6,931 | 185 | ||||||||||||||||||
| Total available-for-sale | $ | 144,490 | $ | 1,246 | $ | 155,914 | $ | 3,881 | $ | 300,404 | $ | 5,127 | ||||||||||||
At December 31, 2019 and December 31, 2018, the Company’s security portfolio consisted of 156 and 427 securities, respectively, that were in an unrealized loss position. The Company reviews its investment portfolio quarterly for indications of other-than-temporary impairment (“OTTI”), with attention given to securities in a continuous loss position of at least ten percent for over twelve months. Management believes that none of the losses on available-for-sale securities noted above constitute an OTTI and does not have the intent to sell these securities and it is likely that it will not be required to sell the securities before their anticipated recovery. The noted losses are considered temporary due to market fluctuations in available interest rates. Management considers the issuers of the securities to be financially sound, the corporate bonds are investment grade, and the collectability of all contractual principal and interest payments is reasonably expected. No OTTI losses were recognized at December 31, 2019 and 2018.
The details concerning securities classified as available-for-sale with unrealized losses asOn January 1, 2018, the Company adopted the new accounting standard for Financial Instruments, which requires equity investments (except those accounted for under the equity method of December 31, 2017 and 2016, were as follows:
| 2017 | ||||||||||||||||||||||||
| Losses < 12 Months | Losses 12 Months or > | Total | ||||||||||||||||||||||
Fair Value | Gross Unrealized Losses |
Fair Value | Gross Unrealized Losses |
Fair Value | Gross Unrealized Losses | |||||||||||||||||||
| Obligations of U.S. government agencies | $ | 4,992,134 | $ | 4,007 | $ | - | $ | - | $ | 4,992,134 | $ | 4,007 | ||||||||||||
| Tax-exempt and tax- able obligations of states and Municipal subdivisions | 40,559,417 | 500,884 | 8,722,641 | 223,866 | 49,282,058 | 724,750 | ||||||||||||||||||
| Mortgage-backed Securities | 89,312,836 | 806,774 | 33,286,648 | 746,742 | 122,599,484 | 1,553,516 | ||||||||||||||||||
| Corporate obligations | 5,665,770 | 9,832 | 3,156,365 | 791,594 | 8,822,135 | 801,426 | ||||||||||||||||||
| Other | - | - | 920,024 | 335,459 | 920,024 | 335,459 | ||||||||||||||||||
| $ | 140,530,157 | $ | 1,321,497 | $ | 46,085,678 | $ | 2,097,661 | $ | 186,615,835 | $ | 3,419,158 | |||||||||||||
| 2016 | ||||||||||||||||||||||||
| Losses < 12 Months | Losses 12 Months or > | Total | ||||||||||||||||||||||
Fair Value | Gross Unrealized Losses | Fair Value | Gross Unrealized Losses | Fair Value | Gross Unrealized Losses | |||||||||||||||||||
| Obligations of U.S. government Agencies | $ | 2,989,255 | $ | 6,341 | $ | - | $ | - | $ | 2,989,255 | $ | 6,341 | ||||||||||||
| Tax-exempt and tax- able obligations of states and municipal subdivisions | 48,199,634 | 1,183,186 | - | - | 48,199,634 | 1,183,186 | ||||||||||||||||||
| Mortgage-backed Securities | 78,467,029 | 1,294,942 | 1,905,698 | 9,148 | 80,372,727 | 1,304,090 | ||||||||||||||||||
| Corporate obligations | 5,075,850 | 17,932 | 2,828,766 | 1,212,634 | 7,904,616 | 1,230,566 | ||||||||||||||||||
| Other | - | - | 939,823 | 315,660 | 939,823 | 315,660 | ||||||||||||||||||
| $ | 134,731,768 | $ | 2,502,401 | $ | 5,674,287 | $ | 1,537,442 | $ | 140,406,055 | $ | 4,039,843 | |||||||||||||
Approximately 38.0%accounting or those that result in consolidation of the number of securities ininvestee) to be measured at fair value with the investment portfolio at December 31, 2017, reflected an unrealized loss. Management is of the opinion the Company has the ability to hold these securities until such time as the value recovers or the securities mature. Management also believes the deterioration in value is attributable to changes in market interest rates and lackfair value recognized in net income. The adoption of liquiditythis guidance in the credit markets. We have determined that these securities are not other-than-temporarily impaired based upon anticipated cash flows.
2018 resulted in a $348 thousand decrease to retained earnings.
NOTE E - LOANS
Loans typically provide higher yields thanThe Company uses four different categories to classify loans in its portfolio based on the underlying collateral securing each loan. The loans grouped together in each category have been determined to share similar risk characteristics with respect to credit quality. Those four categories are commercial, financial and agriculture, commercial real estate, consumer real estate, installment and other;
Commercial, financial and agriculture – Commercial, financial and agriculture loans include loans to business entities issued for commercial, industrial, or other typesbusiness purposes. This type of earning assets, and thus onecommercial loan shares a similar risk characteristic in that unlike commercial real estate loans, repayment is largely dependent on cash flow generated from the operation of the Company's goalsbusiness.
Commercial real estate – Commercial real estate loans are grouped as such because repayment is for loans to bemainly dependent upon either the largest categorysale of the Company's earning assets. At December 31, 2017real estate, operation of the business occupying the real estate, or refinance of the debt obligation. This includes both owner occupied and 2016, respectively,non-owner occupied CRE secured loans, accounted for 74.5% and 75.3% of earning assets. The Company controls and mitigates the inherent credit and liquidity risks through the composition of its loan portfolio.because they share similar risk characteristics related to these variables.
Consumer real estate – Consumer real estate loans consist primarily of loans secured by 1-4 family residential properties and/or residential lots. This includes loans for the purpose of constructing improvements on the residential property, as well as home equity lines of credit.
Installment and other – Installment and other loans are all loans issued to individuals that are not for any purpose related to operation of a business, and not secured by real estate. Repayment on these loans is mostly dependent on personal income, which may be impacted by general economic conditions.
The following table shows the composition of the loan portfolio by category:
| (In thousands) | December 31, 2017 | December 31, 2016 | ||||||||||||||
| Amount | Percent of Total | Amount | Percent of Total | |||||||||||||
| Mortgage loans held for sale | $ | 4,790 | 0.3 | % | $ | 5,880 | 0.6 | % | ||||||||
| Commercial, financial and agricultural | 165,780 | 13.5 | 129,423 | 14.8 | ||||||||||||
| Real Estate: | ||||||||||||||||
| Mortgage-commercial | 467,484 | 38.0 | 314,359 | 36.0 | ||||||||||||
| Mortgage-residential | 385,099 | 31.3 | 289,640 | 33.2 | ||||||||||||
| Construction | 183,328 | 14.9 | 109,394 | 12.5 | ||||||||||||
| Lease financing receivable | 2,450 | 0.2 | 2,204 | 0.3 | ||||||||||||
| Obligations of states and subdivisions | 3,109 | 0.3 | 6,698 | 0.8 | ||||||||||||
| Consumer and other | 18,056 | 1.5 | 15,336 | 1.8 | ||||||||||||
| Total loans | 1,230,096 | 100 | % | 872,934 | 100 | % | ||||||||||
| Allowance for loan losses | (8,288 | ) | (7,510 | ) | ||||||||||||
| Net loans | $ | 1,221.808 | $ | 865,424 | ||||||||||||
In the context of this discussion, a "real estate mortgage loan" is defined as any loan, other than a loan for construction purposes, secured by real estate, regardless of the purpose of the loan. The Company follows the common practice of financial institutions in the Company’s market area of obtaining a security interest in real estate whenever possible, in addition to any other available collateral. This collateral is taken to reinforce the likelihood of the ultimate repayment of the loan and tends to increase the magnitude of the real estate loan portfolio component. Generally, the Company limits its loan-to-value ratio to 80%. Management attempts to maintain a conservative philosophy regarding its underwriting guidelines and believes it will reduce the risk elements of its loan portfolio through strategies that diversify the lending mix.
| December 31, 2019 | December 31, 2018 | |||||||||||||||
| ($ in thousands) | Amount | Percent of Total | Amount | Percent of Total | ||||||||||||
| Mortgage loans held for sale | $ | 10,810 | 0.4 | % | $ | 4,838 | 0.3 | % | ||||||||
| Commercial, financial and agricultural | 332,600 | 12.7 | % | 301,182 | 14.6 | % | ||||||||||
| Real Estate: | ||||||||||||||||
| Mortgage-commercial | 1,028,012 | 39.4 | % | 776,880 | 37.6 | % | ||||||||||
| Mortgage-residential | 814,282 | 31.2 | % | 617,804 | 29.9 | % | ||||||||||
| Construction | 359,195 | 13.8 | % | 298,718 | 14.5 | % | ||||||||||
| Lease financing receivable | 3,095 | 0.1 | % | 2,891 | 0.1 | % | ||||||||||
| Obligations of states and subdivisions | 20,716 | 0.8 | % | 16,941 | 0.8 | % | ||||||||||
| Installment and other | 42,458 | 1.6 | % | 46,006 | 2.2 | % | ||||||||||
| Total loans | 2,611,168 | 100 | % | 2,065,260 | 100 | % | ||||||||||
| Allowance for loan losses | (13,908 | ) | (10,065 | ) | ||||||||||||
| Net loans | $ | 2,597,260 | $ | 2,055,195 | ||||||||||||
Loans held for sale consist of mortgage loans originated by the Bank and sold into the secondary market. Commitments from investors to purchase the loans are obtained upon origination.
| 78 |
Activity in the allowance for loan losses for December 31, 2017, 20162019, 2018 and 20152017 was as follows:
(In thousands)
| 2017 | 2016 | 2015 | ||||||||||
| Balance at beginning of period | $ | 7,510 | $ | 6,747 | $ | 6,095 | ||||||
| Loans charged-off: | ||||||||||||
| Real Estate | (262 | ) | (627 | ) | (534 | ) | ||||||
| Installment and Other | (81 | ) | (73 | ) | (126 | ) | ||||||
| Commercial, Financial and Agriculture | (62 | ) | (71 | ) | (183 | ) | ||||||
| Total | (405 | ) | (771 | ) | (843 | ) | ||||||
| Recoveries on loans previously charged-off: | ||||||||||||
| Real Estate | 522 | 755 | 905 | |||||||||
| Installment and Other | 105 | 70 | 81 | |||||||||
| Commercial, Financial and Agriculture | 50 | 84 | 99 | |||||||||
| Total | 677 | 909 | 1,085 | |||||||||
| Net (Charge-offs) Recoveries | 272 | 138 | 242 | |||||||||
| Provision for Loan Losses | 506 | 625 | 410 | |||||||||
| Balance at end of period | $ | 8,288 | $ | 7,510 | $ | 6,747 | ||||||
| ($ in thousands) | 2019 | 2018 | 2017 | |||||||||
| Balance at beginning of period | $ | 10,065 | $ | 8,288 | $ | 7,510 | ||||||
| Prior period reclassification - Mortgage Reserve Funding | - | (181 | ) | - | ||||||||
| Beginning balance of allowance restated | 10,065 | 8,107 | 7,510 | |||||||||
| Loans charged-off: | ||||||||||||
| Commercial, financial and agriculture | (141 | ) | (265 | ) | (62 | ) | ||||||
| Commercial real estate | (54 | ) | (222 | ) | (110 | ) | ||||||
| Consumer real estate | (163 | ) | (7 | ) | (152 | ) | ||||||
| Installment and other | (306 | ) | (87 | ) | (81 | ) | ||||||
| Total | (664 | ) | (581 | ) | (405 | ) | ||||||
| Recoveries on loans previously charged-off: | ||||||||||||
| Commercial, financial and agriculture | 85 | 44 | 50 | |||||||||
| Commercial real estate | 142 | 44 | 279 | |||||||||
| Consumer real estate | 240 | 183 | 243 | |||||||||
| Installment and other | 302 | 148 | 105 | |||||||||
| Total | 769 | 419 | 677 | |||||||||
| Net (Charge-offs) Recoveries | 105 | (162 | ) | 272 | ||||||||
| Provision for Loan Losses | 3,738 | 2,120 | 506 | |||||||||
| Balance at end of period | $ | 13,908 | $ | 10,065 | $ | 8,288 | ||||||
The following tables represent how the allowance for loan losses is allocated to a particular loan type as well as the percentage of the category to total loans at December 31, 20172019 and 2016.2018.
Allocation of the Allowance for Loan Losses
| Allocation of the Allowance for Loan Losses | ||||||||
| December 31, 2019 | ||||||||
| ($ in thousands) | Amount | % of loans in each category to total loans | ||||||
| Commercial, financial and agriculture | $ | 3,043 | 13.1 | % | ||||
| Commercial real estate | 8,836 | 65.5 | % | |||||
| Consumer real estate | 1,694 | 19.8 | % | |||||
| Installment and other | 296 | 1.6 | % | |||||
| Unallocated | 39 | - | ||||||
| Total | $ | 13,908 | 100 | % | ||||
| December 31, 2017 | ||||||||
| (Dollars in thousands) | ||||||||
| Amount | % of loans to total loans | |||||||
| Commercial Non Real Estate | $ | 1,608 | 14.0 | % | ||||
| Commercial Real Estate | 4,644 | 64.8 | ||||||
| Consumer Real Estate | 1,499 | 18.9 | ||||||
| Consumer | 173 | 2.3 | ||||||
| Unallocated | 364 | - | ||||||
| Total | $ | 8,288 | 100 | % | ||||
| December 31, 2016 | ||||||||
| (Dollars in thousands) | ||||||||
| Amount | % of loans in each category to total loans | |||||||
| Commercial Non Real Estate | $ | 1,118 | 15.6 | % | ||||
| Commercial Real Estate | 4,071 | 61.6 | ||||||
| Consumer Real Estate | 1,589 | 20.3 | ||||||
| Consumer | 155 | 2.4 | ||||||
| Unallocated | 577 | 0.1 | ||||||
| Total | $ | 7,510 | 100 | % | ||||
| December 31, 2018 | |||||||
| Amount | % of loans in each category to total loans | |||||||
| Commercial, financial and agriculture | $ | 2,060 | 14.8 | % | ||||
| Commercial real estate | 6,258 | 64.6 | % | |||||
| Consumer real estate | 1,743 | 18.9 | % | |||||
| Installment and other | 201 | 1.7 | % | |||||
| Unallocated | (197 | ) | - | |||||
| Total | $ | 10,065 | 100 | % | ||||
The following table represents the Company’s impaired loans at December 31, 2017 and 2016. This table includes performing troubled debt restructurings.
| December 31, | December 31, | |||||||
| 2017 | 2016 | |||||||
| (In thousands) | ||||||||
| Impaired Loans: | ||||||||
| Impaired loans without a valuation allowance | $ | 6,559 | $ | 2,667 | ||||
| Impaired loans with a valuation allowance | 4,015 | 3,461 | ||||||
| Total impaired loans | $ | 10,574 | $ | 6,128 | ||||
| Allowance for loan losses on impaired loans at period End | 661 | 682 | ||||||
| Total non-accrual loans | 5,674 | 3,264 | ||||||
| Past due 90 days or more and still accruing | 285 | 198 | ||||||
| Average investment in impaired loans | 9,041 | 8,509 | ||||||
The following table is a summary of interest recognized and cash-basis interest earned on impaired loans for the years ended December 31, 2017, 2016 and 2015:
| 2017 | 2016 | 2015 | ||||||||||
| Interest income recognized during impairment | - | - | - | |||||||||
| Cash-basis interest income recognized | 326 | 188 | 211 | |||||||||
The gross interest income that would have been recorded in the period that ended if the non-accrual loans had been current in accordance with their original terms and had been outstanding throughout the period or since origination, if held for part of the twelve months for the years ended December 31, 2017, 2016 and 2015, was $342,000, $389,000 and $437,000, respectively. The Company had no loan commitments to borrowers in non-accrual status at December 31, 2017 and 2016.
The following tables provide the ending balances in the Company's loans (excluding mortgage loans held for sale) and allowance for loan losses, broken down by portfolio segment as of December 31, 20172019 and 2016.2018. The tables also provide additional detail as to the amount of our loans and allowance that correspond to individual versus collective impairment evaluation. The impairment evaluation corresponds to the Company's systematic methodology for estimating its Allowance for Loan Losses.Losses ($ in thousands).
| December 31, 2017 | Installment | Commercial, | ||||||||||||||||||||||||||||||||||||||
| Real Estate | and Other | Financial and Agriculture | Total | Commercial, | Installment | |||||||||||||||||||||||||||||||||||
| (In thousands) | Financial and | Commercial | Consumer | and | ||||||||||||||||||||||||||||||||||||
| December 31, 2019 | Agriculture | Real Estate | Real Estate | Other | Unallocated | Total | ||||||||||||||||||||||||||||||||||
| Loans | ||||||||||||||||||||||||||||||||||||||||
| Individually evaluated | $ | 9,402 | $ | 52 | $ | 1,120 | $ | 10,574 | $ | 2,493 | $ | 25,984 | $ | 1,181 | $ | 281 | $ | - | $ | 29,939 | ||||||||||||||||||||
| Collectively evaluated | 1,015,934 | 28,511 | 170,287 | 1,214,732 | 339,003 | 1,773,934 | 398,471 | 41,112 | - | 2,552,520 | ||||||||||||||||||||||||||||||
| PCI Loans | 191 | 10,471 | 7,204 | 33 | - | 17,899 | ||||||||||||||||||||||||||||||||||
| Total | $ | 1,025,336 | $ | 28,563 | $ | 171,407 | $ | 1,225,306 | $ | 341,687 | $ | 1,810,389 | $ | 406,856 | $ | 41,426 | $ | - | $ | 2,600,358 | ||||||||||||||||||||
| Allowance for Loan Losses | ||||||||||||||||||||||||||||||||||||||||
| Individually evaluated | $ | 371 | $ | 23 | $ | 267 | $ | 661 | $ | 1,182 | $ | 3,021 | $ | 141 | $ | 80 | $ | - | $ | 4,424 | ||||||||||||||||||||
| Collectively evaluated | 5,952 | 334 | 1,341 | 7,627 | 1,861 | 5,815 | 1,553 | 216 | 39 | 9,484 | ||||||||||||||||||||||||||||||
| Total | $ | 6,323 | $ | 357 | $ | 1,608 | $ | 8,288 | $ | 3,043 | $ | 8,836 | $ | 1,694 | $ | 296 | $ | 39 | $ | 13,908 | ||||||||||||||||||||
| December 31, 2016 | Installment | Commercial, | ||||||||||||||||||||||||||||||||||||||
| Real Estate | and Other | Financial and Agriculture | Total | Commercial, | Installment | |||||||||||||||||||||||||||||||||||
| (In thousands) | Financial and | Commercial | Consumer | and | ||||||||||||||||||||||||||||||||||||
| December 31, 2018 | Agriculture | Real Estate | Real Estate | Other | Unallocated | Total | ||||||||||||||||||||||||||||||||||
| Loans | ||||||||||||||||||||||||||||||||||||||||
| Individually evaluated | $ | 5,935 | $ | 40 | $ | 153 | $ | 6,128 | $ | 1,657 | $ | 10,932 | $ | 804 | $ | 66 | $ | - | $ | 13.459 | ||||||||||||||||||||
| Collectively evaluated | 704,923 | 21,317 | 134,686 | 860,926 | 302,329 | 1,309,322 | 383,368 | 34,292 | - | 2,029,311 | ||||||||||||||||||||||||||||||
| PCI Loans | 197 | 11,626 | 5,777 | 52 | - | 17,652 | ||||||||||||||||||||||||||||||||||
| Total | $ | 710,858 | $ | 21,357 | $ | 134,839 | $ | 867,054 | $ | 304,183 | $ | 1,331,880 | $ | 389,949 | $ | 34,410 | $ | - | $ | 2,060,422 | ||||||||||||||||||||
| Allowance for Loan Losses | ||||||||||||||||||||||||||||||||||||||||
| Individually evaluated | $ | 651 | $ | 21 | $ | 10 | $ | 682 | $ | 329 | $ | 758 | $ | 66 | $ | 26 | $ | - | $ | 1,179 | ||||||||||||||||||||
| Collectively evaluated | 5,009 | 711 | 1,108 | 6,828 | 1,731 | 5,500 | 1,677 | 175 | (197 | ) | 8,886 | |||||||||||||||||||||||||||||
| Total | $ | 5,660 | $ | 732 | $ | 1,118 | $ | 7,510 | $ | 2,060 | $ | 6,258 | $ | 1,743 | $ | 201 | $ | (197 | ) | $ | 10,065 | |||||||||||||||||||
For those PCI loans disclosed above, no impairment has been provided through the allowance for loan losses.
The following tables provide additional detail of impaired loans broken out according to class as of December 31, 2017, 20162019, 2018 and 2015.2017. The tables do not include PCI loans. The recorded investment included in the following table represents customer balances net of any partial charge-offs recognized on the loans, net of any deferred fees and costs. Recorded investment excludes any insignificant amount of accrued interest receivable on loans 90-days or more past due and still accruing. The unpaid balance represents the recorded balance prior to any partial charge-offs.
| December 31, 2017 | Average | Interest | ||||||||||||||||||
| Recorded | Income | |||||||||||||||||||
| Recorded | Unpaid | Related | Investment | Recognized | ||||||||||||||||
| Investment | Balance | Allowance | YTD | YTD | ||||||||||||||||
| (In thousands) | ||||||||||||||||||||
| Impaired loans with no related allowance: | ||||||||||||||||||||
| Commercial installment | $ | 270 | $ | 270 | $ | - | $ | 90 | $ | 1 | ||||||||||
| Commercial real estate | 4,080 | 4,176 | - | 3,502 | 101 | |||||||||||||||
| Consumer real estate | 2,180 | 2,424 | - | 1,897 | 83 | |||||||||||||||
| Consumer installment | 29 | 29 | - | 17 | - | |||||||||||||||
| Total | $ | 6,559 | $ | 6,899 | $ | - | $ | 5,506 | $ | 185 | ||||||||||
| Impaired loans with a related allowance: | ||||||||||||||||||||
| Commercial installment | $ | 850 | $ | 850 | $ | 267 | $ | 262 | $ | 14 | ||||||||||
| Commercial real estate | 2,638 | 2,638 | 234 | 2,756 | 112 | |||||||||||||||
| Consumer real estate | 504 | 504 | 137 | 493 | 15 | |||||||||||||||
| Consumer installment | 23 | 23 | 23 | 24 | - | |||||||||||||||
| Total | $ | 4,015 | $ | 4,015 | $ | 661 | $ | 3,535 | $ | 141 | ||||||||||
| Total Impaired Loans: | ||||||||||||||||||||
| Commercial installment | $ | 1,120 | $ | 1,120 | $ | 267 | $ | 352 | $ | 15 | ||||||||||
| Commercial real estate | 6,718 | 6,814 | 234 | 6,258 | 213 | |||||||||||||||
| Consumer real estate | 2,684 | 2,928 | 137 | 2,390 | 98 | |||||||||||||||
| Consumer installment | 52 | 52 | 23 | 41 | - | |||||||||||||||
| Total Impaired Loans | $ | 10,574 | $ | 10,914 | $ | 661 | $ | 9,041 | $ | 326 | ||||||||||
| December 31, 2016 | Average | Interest | ||||||||||||||||||
| Recorded | Income | |||||||||||||||||||
| Recorded | Unpaid | Related | Investment | Recognized | ||||||||||||||||
| Investment | Balance | Allowance | YTD | YTD | ||||||||||||||||
| (In thousands) | ||||||||||||||||||||
| Impaired loans with no related allowance: | ||||||||||||||||||||
| Commercial installment | $ | - | $ | - | $ | - | $ | - | $ | - | ||||||||||
| Commercial real estate | 2,324 | 2,570 | - | 4,368 | 37 | |||||||||||||||
| Consumer real estate | 329 | 329 | - | 291 | 1 | |||||||||||||||
| Consumer installment | 14 | 14 | - | 9 | - | |||||||||||||||
| Total | $ | 2,667 | $ | 2,913 | $ | - | $ | 4,668 | $ | 38 | ||||||||||
Continued:
| Average | Interest | |||||||||||||||||||
| Recorded | Income | |||||||||||||||||||
| Recorded | Unpaid | Related | Investment | Recognized | ||||||||||||||||
| Investment | Balance | Allowance | YTD | YTD | ||||||||||||||||
| Impaired loans with a related allowance: | ||||||||||||||||||||
| Commercial installment | $ | 153 | $ | 153 | $ | 10 | $ | 244 | $ | 9 | ||||||||||
| Commercial real estate | 2,726 | 2,726 | 343 | 2,832 | 127 | |||||||||||||||
| Consumer real estate | 556 | 669 | 308 | 733 | 14 | |||||||||||||||
| Consumer installment | 26 | 27 | 21 | 32 | - | |||||||||||||||
| Total | $ | 3,461 | $ | 3,575 | $ | 682 | $ | 3,841 | $ | 150 | ||||||||||
| Total Impaired Loans: | ||||||||||||||||||||
| Commercial installment | $ | 153 | $ | 153 | $ | 10 | $ | 244 | $ | 9 | ||||||||||
| Commercial real estate | 5,050 | 5,296 | 343 | 7,200 | 164 | |||||||||||||||
| Consumer real estate | 885 | 998 | 308 | 1,024 | 15 | |||||||||||||||
| Consumer installment | 40 | 41 | 21 | 41 | - | |||||||||||||||
| Total Impaired Loans | $ | 6,128 | $ | 6,488 | $ | 682 | $ | 8,509 | $ | 188 | ||||||||||
| December 31, 2015 | Average | Interest | ||||||||||||||||||
| Recorded | Income | |||||||||||||||||||
| Recorded | Unpaid | Related | Investment | Recognized | ||||||||||||||||
| Investment | Balance | Allowance | YTD | YTD | ||||||||||||||||
| (In thousands) | ||||||||||||||||||||
| Impaired loans with no related allowance: | ||||||||||||||||||||
| Commercial installment | $ | - | $ | - | $ | - | $ | 2 | $ | - | ||||||||||
| Commercial real estate | 5,790 | 5,828 | - | 5,099 | 50 | |||||||||||||||
| Consumer real estate | 223 | 223 | - | 205 | - | |||||||||||||||
| Consumer installment | 7 | 7 | - | 8 | - | |||||||||||||||
| Total | $ | 6,020 | $ | 6,058 | $ | - | $ | 5,314 | $ | 50 | ||||||||||
| Impaired loans with a related allowance: | ||||||||||||||||||||
| Commercial installment | $ | 306 | $ | 306 | $ | 50 | $ | 264 | $ | 14 | ||||||||||
| Commercial real estate | 2,927 | 2,927 | 444 | 2,891 | 132 | |||||||||||||||
| Consumer real estate | 842 | 842 | 438 | 1,152 | 15 | |||||||||||||||
| Consumer installment | 32 | 32 | 25 | 31 | - | |||||||||||||||
| Total | $ | 4,107 | $ | 4,107 | $ | 957 | $ | 4,338 | $ | 161 | ||||||||||
| Total Impaired Loans: | ||||||||||||||||||||
| Commercial installment | $ | 306 | $ | 306 | $ | 50 | $ | 266 | $ | 14 | ||||||||||
| Commercial real estate | 8,717 | 8,755 | 444 | 7,990 | 182 | |||||||||||||||
| Consumer real estate | 1,065 | 1,065 | 438 | 1,357 | 15 | |||||||||||||||
| Consumer installment | 39 | 39 | 25 | 39 | - | |||||||||||||||
| Total Impaired Loans | $ | 10,127 | $ | 10,165 | $ | 957 | $ | 9,652 | $ | 211 | ||||||||||
| 80 |
December 31, 2019
| Average | Interest | |||||||||||||||||||
| Recorded | Income | |||||||||||||||||||
| Recorded | Unpaid | Related | Investment | Recognized | ||||||||||||||||
| ($ in thousands) | Investment | Balance | Allowance | YTD | YTD | |||||||||||||||
Impaired loans with no related allowance: | ||||||||||||||||||||
| Commercial, financial and agriculture | $ | 59 | $ | 62 | $ | - | $ | 294 | $ | 7 | ||||||||||
| Commercial real estate | 13,556 | 13,671 | - | 10,473 | 591 | |||||||||||||||
| Consumer real estate | 542 | 594 | - | 2,173 | - | |||||||||||||||
| Consumer installment | 21 | 21 | - | 23 | - | |||||||||||||||
| Total | $ | 14,178 | $ | 14,348 | $ | - | $ | 12,963 | $ | 598 | ||||||||||
Impaired loans with a related allowance: | ||||||||||||||||||||
| Commercial, financial and agriculture | $ | 2,434 | $ | 2,434 | $ | 1,182 | $ | 2,039 | $ | 13 | ||||||||||
| Commercial real estate | 12,428 | 12,563 | 3,021 | 10,026 | 49 | |||||||||||||||
| Consumer real estate | 639 | 657 | 141 | 560 | 3 | |||||||||||||||
| Consumer installment | 260 | 260 | 80 | 164 | 2 | |||||||||||||||
| Total | $ | 15,761 | $ | 15,914 | $ | 4,424 | $ | 12,789 | $ | 67 | ||||||||||
| Commercial, financial and agriculture | $ | 2,493 | $ | 2,496 | $ | 1,182 | $ | 2,333 | $ | 20 | ||||||||||
| Commercial real estate | 25,984 | 26,234 | 3,021 | 20,499 | 640 | |||||||||||||||
| Consumer real estate | 1,181 | 1,251 | 141 | 2,733 | 3 | |||||||||||||||
| Consumer installment | 281 | 281 | 80 | 187 | 2 | |||||||||||||||
| Total Impaired Loans | $ | 29,939 | $ | 30,262 | $ | 4,424 | $ | 25,752 | $ | 665 | ||||||||||
| 81 |
December 31, 2018
| Average | Interest | |||||||||||||||||||
| Recorded | Income | |||||||||||||||||||
| Recorded | Unpaid | Related | Investment | Recognized | ||||||||||||||||
| ($ in thousands) | Investment | Balance | Allowance | YTD | YTD | |||||||||||||||
Impaired loans with no related allowance: | ||||||||||||||||||||
| Commercial, financial and agriculture | $ | 709 | $ | 709 | $ | - | $ | 379 | $ | 27 | ||||||||||
| Commercial real estate | 6,441 | 8,170 | - | 7,685 | 427 | |||||||||||||||
| Consumer real estate | 445 | 760 | - | 4,522 | 69 | |||||||||||||||
| Consumer installment | - | - | - | 82 | 3 | |||||||||||||||
| Total | $ | 7,595 | $ | 9,639 | $ | - | $ | 12,668 | $ | 526 | ||||||||||
Impaired loans with a related allowance: | ||||||||||||||||||||
| Commercial, financial and agriculture | $ | 960 | $ | 960 | $ | 329 | $ | 968 | $ | 3 | ||||||||||
| Commercial real estate | 4,512 | 4,512 | 758 | 2,868 | 176 | |||||||||||||||
| Consumer real estate | 366 | 366 | 66 | 555 | 16 | |||||||||||||||
| Consumer installment | 26 | 26 | 26 | 24 | - | |||||||||||||||
| Total | $ | 5,846 | $ | 5,864 | $ | 1,179 | $ | 4,415 | $ | 195 | ||||||||||
| Total Impaired Loans: | ||||||||||||||||||||
| Commercial, financial and agriculture | $ | 1,669 | $ | 1,669 | $ | 329 | $ | 1,347 | $ | 30 | ||||||||||
| Commercial real estate | 10,953 | 12,682 | 758 | 10,553 | 603 | |||||||||||||||
| Consumer real estate | 811 | 1,126 | 66 | 5,077 | 85 | |||||||||||||||
| Consumer installment | 26 | 26 | 26 | 106 | 3 | |||||||||||||||
| Total Impaired Loans | $ | 13,459 | $ | 15,503 | $ | 1,179 | $ | 17,083 | $ | 721 | ||||||||||
December 31, 2017
| Average | Interest | |||||||||||||||||||
| Recorded | Income | |||||||||||||||||||
| Recorded | Unpaid | Related | Investment | Recognized | ||||||||||||||||
| ($ in thousands) | Investment | Balance | Allowance | YTD | YTD | |||||||||||||||
Impaired loans with no related allowance: | ||||||||||||||||||||
| Commercial, financial and agriculture | $ | 270 | $ | 270 | $ | - | $ | 90 | $ | 1 | ||||||||||
| Commercial real estate | 4,080 | 4,176 | - | 3,502 | 101 | |||||||||||||||
| Consumer real estate | 2,180 | 2,424 | - | 1,897 | 83 | |||||||||||||||
| Consumer installment | 29 | 29 | - | 17 | - | |||||||||||||||
| Total | $ | 6,559 | $ | 6,899 | $ | - | $ | 5,506 | $ | 185 | ||||||||||
Impaired loans with a related allowance: | ||||||||||||||||||||
| Commercial, financial and agriculture | $ | 850 | $ | 850 | $ | 267 | $ | 262 | $ | 14 | ||||||||||
| Commercial real estate | 2,638 | 2,638 | 234 | 2,756 | 112 | |||||||||||||||
| Consumer real estate | 504 | 504 | 137 | 493 | 15 | |||||||||||||||
| Consumer installment | 23 | 23 | 23 | 24 | - | |||||||||||||||
| Total | $ | 4,015 | $ | 4,015 | $ | 661 | $ | 3,535 | $ | 141 | ||||||||||
Total Impaired Loans: | ||||||||||||||||||||
| Commercial, financial and agriculture | $ | 1,120 | $ | 1,120 | $ | 267 | $ | 352 | $ | 15 | ||||||||||
| Commercial real estate | 6,718 | 6,814 | 234 | 6,258 | 213 | |||||||||||||||
| Consumer real estate | 2,684 | 2,928 | 137 | 2,390 | 98 | |||||||||||||||
| Consumer installment | 52 | 52 | 23 | 41 | - | |||||||||||||||
| Total Impaired Loans | $ | 10,574 | $ | 10,914 | $ | 661 | $ | 9,041 | $ | 326 | ||||||||||
| 82 |
The cash basis interest earned in the chart above is materially the same as the interest recognized during impairment for the years ended December 31, 2019, 2018 and 2017.
The gross interest income that would have been recorded in the period that ended if the nonaccrual loans had been current in accordance with their original terms and had been outstanding throughout the period or since origination, if held for part of the twelve months for the years ended December 31, 2019, 2018 and 2017, was $348 thousand, $782 thousand and $342 thousand, respectively. The Company had no loan commitments to borrowers in nonaccrual status at December 31, 2019 and 2018.
We acquired loans with deteriorated credit quality in a 2014, acquisition.2017, 2018 and 2019. These loans were recorded at estimated fair value at the acquisition date with no carryover of the related allowance for loan losses. The acquired loans were segregated as of the acquisition date between those considered to be performing (acquired non-impaired loans) and those with evidence of credit deterioration (acquired(purchased credit impaired loans). Acquired loans are considered to be impaired if there is evidence of credit deterioration and if it is probable, at acquisition,based on current available information, that the Company will be unable to collect all contractually required paymentscash flows as expected. If expected cash flows cannot reasonably be estimated as to what will be collected, there will not be collected.any interest income recognized on these loans.
The following table presents information regarding the contractually required payments receivable, cash flows expected to be collected and the estimated fair value of PCI loans acquired in the acquisition as of July 1, 2014, the closing date of the transaction: acquisitions from 2018 and 2019.
| July 1, 2014 | ||||||||||||||||||||
| (In thousands) | ||||||||||||||||||||
| Commercial, financial and agricultural | Mortgage- Commercial | Mortgage- Residential | Commercial and other | Total | ||||||||||||||||
| Contractually required payments | $ | 1,519 | $ | 29,648 | $ | 7,933 | $ | 976 | $ | 40,076 | ||||||||||
| Cash flows expected to be collected | 1,570 | 37,869 | 9,697 | 1,032 | 50,168 | |||||||||||||||
| Fair value of loans acquired | 1,513 | 28,875 | 7,048 | 957 | 38,393 | |||||||||||||||
| ($ in thousands) | Southwest | Sunshine | FMB | FPB | FFB | Total | ||||||||||||||||||
| Contractually required payments at acquisition | $ | 925 | $ | 4,194 | $ | 9,939 | $ | 4,715 | $ | 947 | $ | 20,720 | ||||||||||||
| Cash flows expected to be collected at acquisition | 706 | 3,894 | 8,604 | 4,295 | 955 | 18,454 | ||||||||||||||||||
| Fair value of loans at acquisition | 657 | 3,837 | 7,978 | 3,916 | 809 | 17,197 | ||||||||||||||||||
Total outstanding acquiredpurchased credit impaired loans were $2,020,769$14.6 million and the related purchase accounting discount was $3.3 million as of December 31, 2017.2019, and $13.8 million and $3.8 million as of December 31, 2018, respectively. The outstanding balance of these loans is the undiscounted sum of all amounts, including amounts deemed principal, interest, fees, penalties, and other under the loans, owed at the reporting date, whether or not currently due and whether or not any such amounts have been charged off.
| 83 |
Changes in the carrying amount and accretable yield for acquiredpurchased credit impaired loans were as follows for the year ended December 31, 2017 (In2019 and 2018 ($ in thousands):
| 2019 | 2018 | |||||||||||||||||||||||
| Accretable Yield | Carrying Amount of Loans | Accretable Yield | Carrying Amount of Loans | Accretable Yield | Carrying Amount of Loans | |||||||||||||||||||
| Balance at beginning of period | $ | 894 | $ | 1,305 | $ | 3,835 | $ | 13,817 | $ | 836 | $ | 1,185 | ||||||||||||
| Reclassification from prior years | - | - | 859 | 3,229 | ||||||||||||||||||||
| Additions, including transfers from non-accretable | 525 | 5,250 | 2,487 | 12,290 | ||||||||||||||||||||
| Accretion | (58 | ) | 58 | (943 | ) | 943 | (337 | ) | 337 | |||||||||||||||
| Payments received, net | - | (178 | ) | - | (5,528 | ) | - | (3,214 | ) | |||||||||||||||
| Charge-off | - | - | (10 | ) | (10 | ) | ||||||||||||||||||
| Balance at end of period | $ | 836 | $ | 1,185 | $ | 3,417 | $ | 14,482 | $ | 3,835 | $ | 13,817 | ||||||||||||
The following tables provide additional detaildetails of troubled debt restructurings (TDRs) during the twelve months ended December 31, 2019, 2018 and 2017 2016 and 2015.($ in thousands, except for number of loans).
| December 31, 2017 | Outstanding Recorded | Outstanding Recorded | Interest | |||||||||||||||||||||||||||||
| Outstanding Recorded | Outstanding Recorded | Interest | ||||||||||||||||||||||||||||||
| Investment Pre-Modification | Investment Post-Modification | Number of Loans | Income Recognized | |||||||||||||||||||||||||||||
| (In thousands except number of loans) | ||||||||||||||||||||||||||||||||
| Commercial installment | $ | - | $ | - | - | $ | - | |||||||||||||||||||||||||
| December 31, 2019 | Investment Pre-Modification | Investment Post-Modification | Number of Loans | Income Recognized | ||||||||||||||||||||||||||||
| Commercial, financial and agriculture | $ | 979 | $ | 1,023 | 7 | $ | 19 | |||||||||||||||||||||||||
| Commercial real estate | 526 | 494 | 4 | 17 | 15,953 | 16,122 | 14 | 137 | ||||||||||||||||||||||||
| Consumer real estate | 66 | 64 | 1 | 4 | ||||||||||||||||||||||||||||
| Residential real estate | 551 | 553 | 3 | 12 | ||||||||||||||||||||||||||||
| Consumer installment | - | - | - | - | 10 | 11 | 2 | - | ||||||||||||||||||||||||
| Total | $ | 592 | $ | 558 | 5 | $ | 21 | $ | 17,493 | $ | 17,709 | 26 | $ | 168 | ||||||||||||||||||
| December 31, 2016 | Outstanding Recorded | Outstanding Recorded | Interest | |||||||||||||||||||||||||||||
| Outstanding Recorded | Outstanding Recorded | Interest | ||||||||||||||||||||||||||||||
| Investment Pre-Modification | Investment Post-Modification | Number of Loans | Income Recognized | |||||||||||||||||||||||||||||
| (In thousands except number of loans) | ||||||||||||||||||||||||||||||||
| Commercial installment | $ | - | $ | - | - | $ | - | |||||||||||||||||||||||||
| December 31, 2018 | Investment Pre-Modification | Investment Post-Modification | Number of Loans | Income Recognized | ||||||||||||||||||||||||||||
| Commercial, financial and agriculture | $ | 681 | $ | 663 | 2 | $ | 23 | |||||||||||||||||||||||||
| Commercial real estate | 296 | 269 | 1 | 13 | 3,536 | 3,532 | 3 | 80 | ||||||||||||||||||||||||
| Consumer real estate | - | - | - | - | ||||||||||||||||||||||||||||
| Residential real estate | - | - | - | - | ||||||||||||||||||||||||||||
| Consumer installment | - | - | - | - | - | - | - | - | ||||||||||||||||||||||||
| Total | $ | 296 | $ | 269 | 1 | $ | 13 | $ | 4,217 | $ | 4,195 | 5 | $ | 103 | ||||||||||||||||||
| December 31, 2015 | Outstanding Recorded | Outstanding Recorded | Interest | |||||||||||||||||||||||||||||
| Outstanding Recorded | Outstanding Recorded | Interest | ||||||||||||||||||||||||||||||
| Investment Pre-Modification | Investment Post-Modification | Number of Loans | Income Recognized | |||||||||||||||||||||||||||||
| (In thousands except number of loans) | ||||||||||||||||||||||||||||||||
| Commercial installment | $ | - | $ | - | - | $ | - | |||||||||||||||||||||||||
| December 31, 2017 | Investment Pre-Modification | Investment Post-Modification | Number of Loans | Income Recognized | ||||||||||||||||||||||||||||
| Commercial, financial and agriculture | $ | - | $ | - | - | $ | - | |||||||||||||||||||||||||
| Commercial real estate | 499 | 492 | 2 | 10 | 526 | 494 | 4 | 17 | ||||||||||||||||||||||||
| Consumer real estate | 45 | 40 | 1 | - | ||||||||||||||||||||||||||||
| Residential real estate | 66 | 64 | 1 | 4 | ||||||||||||||||||||||||||||
| Consumer installment | - | - | - | - | - | - | - | - | ||||||||||||||||||||||||
| Total | $ | 544 | $ | 532 | 3 | $ | 10 | $ | 592 | $ | 558 | 5 | $ | 21 | ||||||||||||||||||
The TDRs presented above increased the allowance for loan losses and resulted in no charge-offs of $0, $208,000 and $0 for the years ended December 31, 2017, 20162019, 2018 and 2015, respectively.2017.
| 84 |
The balance of troubled debt restructuringsTDRs at December 31, 2019, 2018 and 2017, 2016 and 2015, was $6.9$32.0 million, $4.1$14.3 million and $6.9 million, respectively, calculated for regulatory reporting purpose.respectively. As of December 31, 2017,2019, the Company had no additional amount committed on any loan classified as troubled debt restructuring.a TDR.
During the twelve month periods ended December 31, 2017, 20162019, 2018 and 2015,2017, the terms of 26, 5 1 and 35 loans, respectively, were modified as TDRs. The modifications included one of the following or a combination of the following: maturity date extensions, interest only payments, amortizations were extended beyond what would be available on similar type loans, and payment waiver. No interest rate concessions were given on these nor were any of these loans written down.
| December 31, 2017 | ||||||||||||||||||||
Current | Past Due 30-89 | Past Due 90 days and still accruing | Non-Accrual | Total | ||||||||||||||||
| Commercial installment | $ | - | $ | - | $ | - | $ | - | $ | - | ||||||||||
| Commercial real estate | 3,701,710 | 91,734 | - | 1,024,442 | 4,817,886 | |||||||||||||||
| Consumer real estate | 1,012,396 | 89,476 | - | 986,803 | 2,088,675 | |||||||||||||||
| Consumer installment | - | - | 5,188 | 18,319 | 23,507 | |||||||||||||||
| Total | $ | 4,714,106 | $ | 181,210 | $ | 5,188 | $ | 2,029,564 | $ | 6,930,068 | ||||||||||
| Allowance for loan losses | $ | 99,695 | $ | 21,610 | $ | 5,188 | $ | 27,241 | $ | 153,734 | ||||||||||
The following tables represents the Company’s TDRs for the year ended December 31, 2019, 2018 and 2017:
| December 31, 2016 | Past Due 90 | |||||||||||||||||||||||||||||||||||||||
| Current Loans | Past Due 30-89 | Past Due 90 days and still accruing | Non-Accrual | Total | ||||||||||||||||||||||||||||||||||||
| Commercial installment | $ | 150,509 | $ | - | $ | - | $ | - | $ | 150,509 | ||||||||||||||||||||||||||||||
| December 31, 2019 | Current | Past Due | days and still | |||||||||||||||||||||||||||||||||||||
| ($ in thousands) | Loans | 30-89 | accruing | Nonaccrual | Total | |||||||||||||||||||||||||||||||||||
| Commercial, financial and agriculture | $ | 583 | $ | 64 | $ | - | $ | 1,062 | $ | 1,709 | ||||||||||||||||||||||||||||||
| Commercial real estate | 2,463,484 | - | - | 1,101,279 | 3,564,763 | 4,299 | 809 | 109 | 19,991 | 25,208 | ||||||||||||||||||||||||||||||
| Consumer real estate | 153,695 | 89,996 | - | 122,450 | 366,141 | 1,905 | 112 | 58 | 2,940 | 5,015 | ||||||||||||||||||||||||||||||
| Consumer installment | 5,898 | - | - | 23,594 | 29,492 | 37 | - | - | - | 37 | ||||||||||||||||||||||||||||||
| Total | $ | 2,773,586 | $ | 89,996 | $ | - | $ | 1,247,323 | $ | 4,110,905 | $ | 6,824 | $ | 985 | $ | 167 | $ | 23,993 | $ | 31,969 | ||||||||||||||||||||
| Allowance for loan losses | $ | 124,484 | $ | - | $ | - | $ | 40,165 | $ | 164,649 | $ | 128 | $ | - | $ | - | $ | 1,997 | $ | 2,125 | ||||||||||||||||||||
| Past Due 90 | ||||||||||||||||||||
| December 31, 2018 | Current | Past Due | days and still | |||||||||||||||||
| ($ in thousands) | Loans | 30-89 | accruing | Nonaccrual | Total | |||||||||||||||
| Commercial, financial and agriculture | $ | 13 | $ | 646 | $ | - | $ | 18 | $ | 676 | ||||||||||
| Commercial real estate | 4,827 | - | - | 5,425 | 10,252 | |||||||||||||||
| Consumer real estate | 442 | 86 | - | 2,801 | 3,329 | |||||||||||||||
| Consumer installment | 25 | - | - | 13 | 38 | |||||||||||||||
| Total | $ | 5,307 | $ | 732 | $ | - | $ | 8,257 | $ | 14,295 | ||||||||||
| Allowance for loan losses | $ | 80 | $ | 13 | $ | - | $ | 110 | $ | 203 | ||||||||||
| Past Due 90 | ||||||||||||||||||||
| December 31, 2017 | Current | Past Due | days and still | |||||||||||||||||
| ($ in thousands) | Loans | 30-89 | accruing | Nonaccrual | Total | |||||||||||||||
| Commercial, financial and agriculture | $ | - | $ | - | $ | - | $ | - | $ | - | ||||||||||
| Commercial real estate | 3,702 | 92 | - | 1,024 | 4,818 | |||||||||||||||
| Consumer real estate | 1,013 | 89 | - | 987 | 2,089 | |||||||||||||||
| Consumer installment | - | - | 5 | 18 | 23 | |||||||||||||||
| Total | $ | 4,715 | $ | 181 | $ | 5 | $ | 2,029 | $ | 6,930 | ||||||||||
| Allowance for loan losses | $ | 100 | $ | 22 | $ | 5 | $ | 27 | $ | 154 | ||||||||||
| December 31, 2015 | ||||||||||||||||||||
| Current Loans | Past Due 30-89 | Past Due 90 days and still accruing | Non-Accrual | Total | ||||||||||||||||
| Commercial installment | $ | 206,237 | $ | - | $ | - | $ | 50,221 | $ | 256,458 | ||||||||||
| Commercial real estate | 1,823,217 | - | - | 2,933,287 | 4,756,504 | |||||||||||||||
| Consumer real estate | 721,110 | - | - | 1,134,816 | 1,855,926 | |||||||||||||||
| Consumer installment | 7,894 | - | - | 29,435 | 37,329 | |||||||||||||||
| Total | $ | 2,758,458 | $ | - | $ | - | $ | 4,147,759 | $ | 6,906,217 | ||||||||||
| Allowance for loan losses | $ | 106,028 | $ | - | $ | - | $ | 197,338 | $ | 303,366 | ||||||||||
The following table presents loans by modified as troubled debt restructurings for which there was a payment default within twelve months following the modification during the year ending December 2019, 2018 and 2017 ($ in thousands, except for number of loans).
| 2019 | 2018 | 2017 | ||||||||||||||||||||||
| Troubled Debt Restructurings | Number of | Recorded | Number of | Recorded | Number of | Recorded | ||||||||||||||||||
| That Subsequently Defaulted: | Loans | Investment | Loans | Investment | Loans | Investment | ||||||||||||||||||
| Commercial, financial and agriculture | 10 | $ | 458 | 2 | $ | 663 | 0 | $ | - | |||||||||||||||
| Commercial real estate | 4 | 15,423 | 2 | 3,419 | 2 | 302 | ||||||||||||||||||
| Total | 14 | $ | 15,881 | 4 | $ | 4,082 | 2 | $ | 302 | |||||||||||||||
The TDRs presented above increased the allowance for loan losses and resulted in no charge-offs for the years ended December 31, 2019, 2018 and 2017.
The following tables summarize by class our loans classified as past due in excess of 30 days or more in addition to those loans classified as non-accrual:nonaccrual including PCI loans:
| December 31, 2017 | ||||||||||||||||||||
| (In thousands) | ||||||||||||||||||||
Past Due Days | Past Due 90 Days or | Non-Accrual | Total Past Due and Non-Accrual | Total Loans | ||||||||||||||||
| Real Estate-construction | $ | 192 | $ | 27 | $ | 92 | $ | 311 | $ | 183,328 | ||||||||||
| Real Estate-mortgage | 2,656 | 176 | 2,692 | 5,524 | 385,099 | |||||||||||||||
| Real Estate-nonfarm nonresidential | 1,487 | 82 | 1,724 | 3,293 | 467,484 | |||||||||||||||
| Commercial | 393 | - | 1,120 | 1,513 | 165,780 | |||||||||||||||
| Lease financing receivable | - | - | - | - | 2,450 | |||||||||||||||
| Obligations of states and | ||||||||||||||||||||
| subdivisions | - | - | - | - | 3,109 | |||||||||||||||
| Consumer | 57 | - | 46 | 103 | 18,056 | |||||||||||||||
| Total | $ | 4,785 | $ | 285 | $ | 5,674 | $ | 10,744 | $ | 1,225,306 | ||||||||||
| December 31, 2019 | ||||||||||||||||||||||||
| ($ in thousands) |
Past Due 30 to 89 Days | Past Due 90 Still Accruing | NonAccrual | PCI | Total Past Due, NonAccrual |
Total Loans | ||||||||||||||||||
| Commercial, financial and agriculture | $ | 515 | $ | 61 | $ | 2,137 | $ | 97 | $ | 2,810 | $ | 332,600 | ||||||||||||
| Commercial real estate | 2,447 | 1,046 | 22,441 | 3,844 | 29,778 | 1,387,207 | ||||||||||||||||||
| Consumer real estate | 4,569 | 1,608 | 1,902 | 8,148 | 16,227 | 814,282 | ||||||||||||||||||
| Consumer installment | 226 | - | 260 | 6 | 492 | 42,458 | ||||||||||||||||||
| Lease financing receivable | - | - | - | - | - | 3,095 | ||||||||||||||||||
| Obligations of states and subdivisions | - | - | - | - | - | 20,716 | ||||||||||||||||||
| Total | $ | 7,757 | $ | 2,715 | $ | 26,740 | $ | 12,095 | $ | 49,307 | $ | 2,600,358 | ||||||||||||
| December 31, 2016 | ||||||||||||||||||||
| (In thousands) | ||||||||||||||||||||
| Past Due 30 to 89 Days | Past Due 90 Days or More and Still Accruing | Non-Accrual | Total Past Due and Non-Accrual | Total Loans | ||||||||||||||||
| Real Estate-construction | $ | 204 | $ | 96 | $ | 658 | $ | 958 | $ | 109,394 | ||||||||||
| Real Estate-mortgage | 2,745 | 102 | 1,662 | 4,509 | 289,640 | |||||||||||||||
| Real Estate- nonfarm nonresidential | 269 | - | 909 | 1,178 | 314,359 | |||||||||||||||
| Commercial | 9 | - | 2 | 11 | 129,423 | |||||||||||||||
| Lease finance receivable | - | - | - | - | 2,204 | |||||||||||||||
| Obligations of states and | ||||||||||||||||||||
| subdivisions | - | - | - | - | 6,698 | |||||||||||||||
| Consumer | 22 | - | 33 | 55 | 15,336 | |||||||||||||||
| Total | $ | 3,249 | $ | 198 | $ | 3,264 | $ | 6,711 | $ | 867,054 | ||||||||||
| December 31, 2018 | ||||||||||||||||||||||||
| ($ in thousands) |
Past Due 30 to 89 | Past Due 90 Still Accruing |
NonAccrual | PCI | Total Past Due, NonAccrual and PCI |
Total Loans | ||||||||||||||||||
| Commercial, financial and agriculture | $ | 1,650 | $ | - | $ | 1,024 | $ | 184 | $ | 2,858 | $ | 301,182 | ||||||||||||
| Commercial real estate | 5,137 | 570 | 9,187 | 5,406 | 20,300 | 1,075,598 | ||||||||||||||||||
| Consumer real estate | 5,529 | 650 | 1,411 | 7,781 | 15,371 | 617,804 | ||||||||||||||||||
| Consumer installment | 506 | 45 | 46 | 34 | 631 | 46,006 | ||||||||||||||||||
| Lease financing receivable | - | - | - | - | - | 2,891 | ||||||||||||||||||
| Obligations of states and subdivisions | - | - | - | - | - | 16,941 | ||||||||||||||||||
| Total | $ | 12,822 | $ | 1,265 | $ | 11,668 | $ | 13,405 | $ | 39,160 | $ | 2,060,422 | ||||||||||||
The Company categorizes loans into risk categories based on relevant information about the ability of borrowers to service their debt, such as: current financial information, historical payment experience, credit documentation, public information, and current economic trends, among other factors. The Company uses the following definitions for risk ratings, which are consistent with the definitions used in supervisory guidance:
Pass: Loans classified as pass are deemed to possess average to superior credit quality, requiring no more than normal attention.
Special Mention.Mention: Loans classified as special mention have a potential weakness that deserves management's close attention. If left uncorrected, these potential weaknesses may result in deterioration of the repayment prospects for the loan or of the Company’s credit position at some future date.
Substandard.Substandard: Loans classified as substandard are inadequately protected by the current net worth and paying capacity of the obligor or of the collateral pledged, if any. Loans so classified have a well-defined weakness or weaknesses that jeopardize the liquidation of the debt. They are characterized by the distinct possibility that the Company will sustain some loss if the deficiencies are not corrected.
Doubtful.Doubtful: Loans classified as doubtful have all the weaknesses inherent in those classified as substandard, with the added characteristic that the weaknesses make collection or liquidation in full, on the basis of currently existing facts, conditions, and values, highly questionable and improbable.
Loans not meeting the criteria above that are analyzed individually as part of the above described process are considered to be pass rated loans.
| 86 |
As of December 31, 20172019 and 2016,2018, and based on the most recent analysis performed, the risk category of loans by class of loans (excluding mortgage loans held for sale) was as follows:
| Commercial, | Commercial, | |||||||||||||||||||||||||||||||||||||||
(In thousands) December 31, 2017 | Real Estate Commercial | Real Estate Mortgage | Installment and Other | Financial and Agriculture | Total | |||||||||||||||||||||||||||||||||||
| December 31, 2019 | Financial and | Commercial | Consumer | Consumer | ||||||||||||||||||||||||||||||||||||
| ($ in thousands) | Agriculture | Real Estate | Real Estate | Installment | Total | |||||||||||||||||||||||||||||||||||
| Pass | $ | 763,572 | $ | 226,178 | $ | 28,482 | $ | 166,819 | $ | 1,185,051 | $ | 327,205 | $ | 1,645,496 | $ | 499,426 | $ | 41,008 | $ | 2,513,135 | ||||||||||||||||||||
| Special Mention | 15,987 | 680 | - | 2,908 | 19,575 | 3,493 | 8,876 | 1,194 | 21 | 13,584 | ||||||||||||||||||||||||||||||
| Substandard | 14,979 | 4,622 | 80 | 1,905 | 21,586 | 10,972 | 50,554 | 13,244 | 397 | 75,167 | ||||||||||||||||||||||||||||||
| Doubtful | 94 | - | - | 23 | 117 | 16 | 77 | - | - | 93 | ||||||||||||||||||||||||||||||
| Subtotal | 794,632 | 231,480 | 28,562 | 171,655 | 1,226,329 | $ | 341,686 | $ | 1,705,003 | $ | 513,864 | $ | 41,426 | $ | 2,601,979 | |||||||||||||||||||||||||
| Less: | ||||||||||||||||||||||||||||||||||||||||
| Unearned Discount | 710 | 65 | - | 248 | 1,023 | - | 1,621 | - | - | 1,621 | ||||||||||||||||||||||||||||||
| Loans, net of unearned discount | $ | 793,922 | $ | 231,415 | $ | 28,562 | $ | 171,407 | $ | 1,225,306 | $ | 341,686 | $ | 1,703,382 | $ | 513,864 | $ | 41,426 | $ | 2,600,358 | ||||||||||||||||||||
| Commercial, | ||||||||||||||||||||
| December 31, 2016 | Real Estate Commercial | Real Estate Mortgage | Installment and Other | Financial and Agriculture | Total | |||||||||||||||
| Pass | $ | 522,949 | $ | 174,325 | $ | 21,278 | $ | 134,235 | $ | 852,787 | ||||||||||
| Special Mention | 376 | 237 | - | 618 | 1,231 | |||||||||||||||
| Substandard | 11,873 | 1,336 | 79 | 208 | 13,496 | |||||||||||||||
| Doubtful | - | 200 | - | 40 | 240 | |||||||||||||||
| Subtotal | 535,198 | 176,098 | 21,357 | 135,101 | 867,754 | |||||||||||||||
| Less: | ||||||||||||||||||||
| Unearned Discount | 378 | 60 | - | 262 | 700 | |||||||||||||||
| Loans, net of unearned discount | $ | 534,820 | $ | 176,038 | $ | 21,357 | $ | 134,839 | $ | 867,054 | ||||||||||
| Commercial, | ||||||||||||||||||||
| December 31, 2018 | Financial and | Commercial | Consumer | Consumer | ||||||||||||||||
| ($ in thousands) | Agriculture | Real Estate | Real Estate | Installment | Total | |||||||||||||||
| Pass | $ | 300,685 | $ | 1,286,151 | $ | 377,028 | $ | 34,127 | $ | 1,997,991 | ||||||||||
| Special Mention | 842 | 12,401 | 1,962 | 13 | 15,218 | |||||||||||||||
| Substandard | 2,640 | 33,856 | 10,959 | 270 | 47,725 | |||||||||||||||
| Doubtful | 16 | 85 | - | - | 101 | |||||||||||||||
| Subtotal | $ | 304,183 | $ | 1,332,493 | $ | 389,949 | $ | 34,410 | $ | 2,061,035 | ||||||||||
| Less: | ||||||||||||||||||||
| Unearned Discount | - | 613 | - | - | 613 | |||||||||||||||
| Loans, net of unearned discount | $ | 304,183 | $ | 1,331,880 | $ | 389,949 | $ | 34,410 | $ | 2,060,422 | ||||||||||
NOTE F - PREMISES AND EQUIPMENT
Premises and equipment owned and utilized in the operations of the Company are stated at cost, less accumulated depreciation and amortization as follows:
| 2017 | 2016 | |||||||||||||||
| ($ in thousands) | 2019 | 2018 | ||||||||||||||
| Premises: | ||||||||||||||||
| Land | $ | 17,242,999 | $ | 10,566,139 | $ | 30,094 | $ | 26,305 | ||||||||
| Buildings and improvements | 31,931,767 | 27,463,504 | 63,346 | 48,998 | ||||||||||||
| Equipment | 12,546,553 | 10,436,712 | 22,394 | 19,005 | ||||||||||||
| Construction in progress | 1,070,775 | 779,833 | 6,258 | 666 | ||||||||||||
| 62,792,094 | 49,246,188 | 122,092 | 94,974 | |||||||||||||
| Less accumulated depreciation and amortization | 16,366,063 | 14,621,836 | 23,634 | 20,191 | ||||||||||||
| $ | 46,426,031 | $ | 34,624,352 | $ | 98,458 | $ | 74,783 | |||||||||
The amounts charged to operating expense for depreciation were $2,046,005, $1,653,663$3.8 million, $2.6 million and $1,645,081$2.0 million in 2017, 20162019, 2018 and 2015,2017, respectively.
| 87 |
NOTE G - DEPOSITS
The aggregate amount of timeTime deposits in denominationsthat meet or exceed the FDIC Insurance limit of $250,000 or more as ofat December 31, 2017,2019 and as of December 31, 2016, was $71,596,0932018, were $187.8 million and $60,219,749$110.9 million, respectively.
At December 31, 2017,2019, the scheduled maturities of time deposits included in interest-bearing deposits were as follows (In($ in thousands):
| Year | Amount | Amount | ||||||
| 2018 | $ | 152,550 | ||||||
| 2019 | 89,431 | |||||||
| 2020 | 15,667 | $ | 496,211 | |||||
| 2021 | 9,212 | 99,567 | ||||||
| 2022 | 16,416 | 30,914 | ||||||
| 2023 | 15,071 | |||||||
| 2024 | 13,905 | |||||||
| Thereafter | - | 6,050 | ||||||
| $ | 283,276 | $ | 661,718 | |||||
NOTE H - BORROWED FUNDS
BorrowedAt December 31, 2019 and 2018, borrowed funds consisted of the following:
| 2017 | 2016 | |||||||
| Reverse Repurchase Agreement | $ | - | $ | 5,000,000 | ||||
| FHLB advances | 88,072,294 | 48,000,000 | ||||||
| First Tennessee Bank | 16,000,000 | 16,000,000 | ||||||
| $ | 104,072,294 | $ | 69,000,000 | |||||
| ($ in thousands) | 2019 | 2018 | ||||||
| Fed Funds Purchased | $ | 2,715 | $ | - | ||||
| FHLB advances | 206,250 | 85,500 | ||||||
| First Horizon Bank | 5,354 | - | ||||||
| $ | 214,319 | $ | 85,500 | |||||
Advances from the FHLB have maturity dates ranging from January 20182020 through June 2019.December 2020. Interest is payable monthly at rates ranging from .95%1.50% to 4.72%3.76%. Advances due to the FHLB are collateralized by a blanket lien on first mortgage loans in the amount of the outstanding borrowings, FHLB capital stock, and amounts on deposit with the FHLB. AtAdvances due to the FHLB are collateralized by $2.302 billion in loans. Based on this collateral and holdings of FHLB stock, the Company is eligible to borrow up to a total of $1.2 billion at December 31, 2017, FHLB advances available2019. As part of the FFB acquisition, the Company assumed two loans in the amount of $3.5 million and unused totaled $445,799,187.$2.0 million with First Horizon Bank. Principal and interest is payable quarterly at rates ranging from 3.80% - 4.10%.
Future annual principal repayment requirements on the borrowings from the FHLB at December 31, 2017,2019, were as follows:follows ($ in thousands):
| Year | Amount | Amount | ||||||
| 2018 | $ | 77,572,294 | ||||||
| 2019 | 10,500,000 | |||||||
| 2020 | - | $ | 209,672 | |||||
| 2021 | - | 735 | ||||||
| Total | $ | 88,072,294 | ||||||
| 2022 | 764 | |||||||
| 2023 | 795 | |||||||
| 2024 | 826 | |||||||
| Thereafter | 1,527 | |||||||
| $ | 214,319 | |||||||
As of December 31, 2016, reverse repurchase agreements consisted of one $5,000,000 agreement. The agreement was secured by securities with a fair value of $5,470,105 at December 31, 2016. On September 25, 2017, the underlying securities were repurchased and the agreement was terminated.
| 88 |
The Company entered into a loan agreement with First Tennessee Bank for a $20 million revolving line of credit. The maturity date is December 5, 2018. The interest rate will be at a rate of 2.50% over the LIBOR Rate. The Company executed a negative pledge agreement to which it agreed not to pledge any capital stock of the Bank so long as any indebtedness is outstanding under the line of credit. The loan agreement includes covenants that require the Company to maintain key financial ratios above or below a stated benchmark level and prohibit the Company from incurring loans other than those permitted by the loan agreement without prior written consent of the lender.
NOTE I – LEASE OBLIGATIONS
The Company is committed under several long-term operatingenters into leases in the normal course of business primarily for financial centers, back office operations locations and business development offices. The Company’s leases have remaining terms ranging from 1 to 8 years. The Company does not currently have any significant finance leases in which provide for minimum lease payments. Certain leases contain options for renewal. Total rental expense under these operating leases amounted to $602,000, $577,000 and $530,000 as of December 31, 2017, 2016 and 2015, respectively.we are the lessee.
The Company includes lease extension and termination options in the lease term if, after considering relevant economic factors, it is reasonably certain the Company will exercise the option. In addition, the Company has elected to account for any non-lease components in its real estate leases as part of the associated lease component. The Company has also committed under two long-term capitalelected not to recognize leases with original lease agreements. One capitalterms of 12 months or less (short-term leases) on the Company’s balance sheet.
Leases are classified as operating or finance leases at the lease agreement had an outstanding balance of $708,000commencement date. Operating leases in which we are the lessee are recorded as operating lease right-of-use assets and $879,000 at December 31, 2017 and 2016, respectively (included in other liabilities). Thisoperating lease has a remaining term of 4 years at December 31, 2017. Assets related to the capital leaseliabilities, which are included in premises and equipment and other liabilities, respectively, on our consolidated balance sheets. Lease expense for operating leases and short-term leases is recognized on a straight-line basis over the cost consistslease term, and is recorded in net occupancy and equipment expense in the consolidated statements of $2,675,000 less accumulated depreciationincome and other comprehensive income. Right-of-use assets represent our right to use an underlying asset for the lease term and lease liabilities represent our obligation to make lease payments arising from the lease. Right-of-use assets and lease liabilities are recognized at the lease commencement date and based on the estimated present value of approximately $1,651,000lease payments over the lease term.
The Company uses its incremental borrowing rate at lease commencement to calculate the present value of lease payments when the rate implicit in a lease is not known. The Company’s incremental borrowing rate is based on the FHLB amortizing advance rate, adjusted for the lease term and $1,390,000 atother factors.
As of December 31, 20172019, operating lease right-of-use assets and 2016, respectively. The second capital lease agreement had an outstanding balance of $161,000 at December 31, 2017. This lease has a remaining term of two years at December 31, 2017. Assets related to the capital lease are included in premisesliabilities were $6.5 million and the cost consists of $266,000 less accumulated depreciation of approximately $22,000, and $12,000 at December 31, 2017 and 2016,$6.5 million, respectively.
Minimum futureThe components of total lease cost were as follows for the period ending:
| ($ in thousands) | December 31, 2019 | |||
| Operating lease costs | $ | 898 | ||
| Cash paid for amounts included in the measurement of lease liability | ||||
| Operating cash flows from operating leases | $ | 898 | ||
Future lease payments for the operating and capital leases atwith initial terms of one year or more as of December 31, 2017, were2019 are as follows:
| Operating Leases | Capital Leases | |||||||
| (In thousands) | ||||||||
| 2018 | 536 | 275 | ||||||
| 2019 | 440 | 275 | ||||||
| 2020 | 317 | 191 | ||||||
| 2021 | 197 | 175 | ||||||
| 2022 | 146 | - | ||||||
| Thereafter | 312 | - | ||||||
| Total Minimum Lease Payments | $ | 1,948 | $ | 916 | ||||
| Less: Amount representing interest | (47 | ) | ||||||
| Present value of minimum lease payments | $ | 869 | ||||||
| ($ in thousands) | |||||
| 2020 | $ | 1,643 | |||
| 2021 | 1,527 | ||||
| 2022 | 1,359 | ||||
| 2023 | 844 | ||||
| 2024 | 631 | ||||
| Thereafter | 981 | ||||
| Total lease payments | $ | 6,985 | |||
| Less: Interest | (467 | ) | |||
| Present value of lease liabilities | $ | 6,518 | |||
The table below summarizes other information related to our operating leases:
| Weighted-average remaining lease term | 5.0 years | |||
| Weighted-average discount rate | 2.5% |
As a result of the adoption of ASC 842, The Company did not restate the prior period audited consolidated financial statements and all prior period amounts and disclosures are presented under ASC 840. At December 31, 2018, minimum future lease payments were as follows ($ in thousands):
| Operating Leases | Capital Leases | |||||||
| 2019 | $ | 784 | $ | 275 | ||||
| 2020 | 463 | 191 | ||||||
| 2021 | 347 | 175 | ||||||
| 2022 | 256 | - | ||||||
| 2023 | 229 | - | ||||||
| Thereafter | 197 | - | ||||||
| Total minimum lease payments | $ | 2,276 | $ | 641 | ||||
| Less:Amount representing interest | (25 | ) | ||||||
| Present value of minimum lease payments | $ | 616 | ||||||
NOTE J - REGULATORY MATTERS
The Company and its subsidiary bank are subject to regulatory capital requirements administered by federal banking agencies. Failure to meet minimum capital requirements can initiate certain mandatory and possibly additional discretionary actions by regulators that, if undertaken, could have a direct material effect on the Company’s financial statements. Under capital adequacy guidelines and the regulatory framework for prompt corrective action, the Company and its subsidiary bank must meet specific capital guidelines that involve quantitative measures of assets, liabilities, and certain off-balance sheet items as calculated under regulatory accounting practices. Capital amounts and classifications are also subject to qualitative judgment by regulators about components, risk weightings, and other related factors.
To ensure capital adequacy, quantitative measures have been established by regulators, and these require the Company and its subsidiary bank to maintain minimum amounts and ratios (set forth in the table below) of total and Tier I1 capital (as defined) to risk-weighted assets (as defined), Tier I1 capital to adjusted total assets (leverage) and common equity Tier 1.
Management believes, as of December 31, 2017,2019, that the Company and its subsidiary bank exceededmet all capital adequacy requirements.
In 2013, the Federal Reserve votedrequirements to adopt final capital rules implementing Basel III requirements for U.S. Banking organizations. Under the final rule, minimum requirements increased for both the quantity and quality of capital held by banking organizations. The final rule includes a new minimum ratio of common equity Tier 1 capital (Tier 1 Common) to risk-weighted assets and a Tier 1 Common capital conservation buffer of 2.5% of risk-weighted assets that will apply to all supervised financial institutions. The rule also raises the minimum ratio of Tier 1 capital to risk-weighted assets and includes a minimum leverage ratio of 4% for all banking organizations. These new minimum capital ratios were effective on January 1, 2015, and will be fully phased in on January 1, 2019.
At December 31, 2017 and 2016, the subsidiary bank was categorized by regulators as well-capitalized under the regulatory framework for prompt corrective action.which they are subject. Under Basel III requirements, a financial institution is considered to be well-capitalized if it has a total risk-based capital ratio of 10% or more, has a Tier I1 risk-based capital ratio of 8% or more, has a common equity Tier 1 of 6.5%, and has a Tier I1 leverage capital ratio of 5% or more. There are no conditions or anticipated events that, in the opinion of management, would change the categorization. The actual capital amounts and ratios, excluding unrealized losses, at December 31, 20172019 and 20162018 are presented in the following table. No amount was deducted from capital for interest-rate risk exposure.
| Company | Subsidiary | |||||||||||||||
| December 31, 2019 | (Consolidated) | The First | ||||||||||||||
| ($ in thousands) | Amount | Ratio | Amount | Ratio | ||||||||||||
| Total risk-based | $ | 446,571 | 15.8 | % | $ | 439,538 | 15.6 | % | ||||||||
| Common equity Tier 1 | 352,481 | 12.5 | % | 425,630 | 15.1 | % | ||||||||||
| Tier 1 risk-based | 367,727 | 13.0 | % | 425,630 | 15.1 | % | ||||||||||
| Tier 1 leverage | 367,727 | 10.3 | % | 425,630 | 11.8 | % | ||||||||||
| (Dollars in thousands) | Company | Subsidiary | ||||||||||||||
| (Consolidated) | The First | |||||||||||||||
| Amount | Ratio | Amount | Ratio | |||||||||||||
| December 31, 2017 | ||||||||||||||||
| Total risk-based | $ | 217,157 | 15.5 | % | $ | 211,338 | 15.1 | % | ||||||||
| Common equity Tier 1 | 199,170 | 14.2 | % | 203,050 | 14.5 | % | ||||||||||
| Tier I risk-based | 208,869 | 14.9 | % | 203,050 | 14.5 | % | ||||||||||
| Tier I leverage | 208,869 | 11.7 | % | 203,050 | 11.4 | % | ||||||||||
| December 31, 2016 | ||||||||||||||||
| Total risk-based | $ | 157,557 | 15.5 | % | $ | 172,572 | 17.0 | % | ||||||||
| Common equity Tier 1 | 140,747 | 13.8 | % | 165,062 | 16.2 | % | ||||||||||
| Tier I risk-based | 150,047 | 14.7 | % | 165,062 | 16.2 | % | ||||||||||
| Tier I leverage | 150,047 | 11.9 | % | 165,062 | 13.1 | % | ||||||||||
| December 31, 2018 | ||||||||||||||||
| ($ in thousands) | Amount | Ratio | Amount | Ratio | ||||||||||||
| Total risk-based | $ | 348,295 | 15.6 | % | $ | 339,376 | 15.2 | % | ||||||||
| Common equity Tier 1 | 258,206 | 11.5 | % | 329,311 | 14.8 | % | ||||||||||
| Tier 1 risk-based | 273,398 | 12.2 | % | 329,311 | 14.8 | % | ||||||||||
| Tier 1 leverage | 273,398 | 10.2 | % | 329,311 | 12.2 | % | ||||||||||
The minimum amounts of capital and ratios, not including Accumulated Other Comprehensive Income, as established by banking regulators at December 31,2017,31, 2019, and 2016,2018, were as follows: (Dollars in thousands)
| Company | Subsidiary | |||||||||||||||
| (Consolidated) | The First | |||||||||||||||
| Amount | Ratio | Amount | Ratio | |||||||||||||
| December 31, 2017 | ||||||||||||||||
| Total risk-based | $ | 111,933 | 8.0 | % | $ | 111,789 | 8.0 | % | ||||||||
| Common equity Tier 1 | 62,962 | 4.5 | % | 62,882 | 4.5 | % | ||||||||||
| Tier I risk-based | 83,949 | 6.0 | % | 83,842 | 6.0 | % | ||||||||||
| Tier I leverage | 71,362 | 4.0 | % | 71,290 | 4.0 | % | ||||||||||
| December 31, 2016 | ||||||||||||||||
| Total risk-based | $ | 81,504 | 8.0 | % | $ | 81,391 | 8.0 | % | ||||||||
| Common equity Tier 1 | 45,846 | 4.5 | % | 45,782 | 4.5 | % | ||||||||||
| Tier I risk-based | 61,128 | 6.0 | % | 61,043 | 6.0 | % | ||||||||||
| Tier I leverage | 50,412 | 4.0 | % | 50,364 | 4.0 | % | ||||||||||
| Company | Subsidiary | |||||||||||||||
| December 31, 2019 | (Consolidated) | The First | ||||||||||||||
| ($ in thousands) | Amount | Ratio | Amount | Ratio | ||||||||||||
| Total risk-based | $ | 225,932 | 8.0 | % | $ | 225,413 | 8.0 | % | ||||||||
| Common equity Tier 1 | 127,087 | 4.5 | % | 126,795 | 4.5 | % | ||||||||||
| Tier 1 risk-based | 169,449 | 6.0 | % | 169,060 | 6.0 | % | ||||||||||
| Tier 1 leverage | 143,460 | 4.0 | % | 143,940 | 4.0 | % | ||||||||||
| December 31, 2018 | Amount | Ratio | Amount | Ratio | ||||||||||||
| ($ in thousands) | ||||||||||||||||
| Total risk-based | $ | 179,177 | 8.0 | % | $ | 178,578 | 8.0 | % | ||||||||
| Common equity Tier 1 | 100,787 | 4.5 | % | 100,450 | 4.5 | % | ||||||||||
| Tier 1 risk-based | 134,383 | 6.0 | % | 133,934 | 6.0 | % | ||||||||||
| Tier 1 leverage | 107,739 | 4.0 | % | 107,593 | 4.0 | % | ||||||||||
The Company’sprincipal sources of funds to the Company to pay dividends if any, are expected to be made fromthe dividends received from The First, A National Banking Association, Hattiesburg, Mississippi. Consequently, dividends are dependent upon The First’s earnings, capital needs, regulatory policies, as well as statutory and regulatory limitations. Federal Reserve regulations limit dividends, stock repurchases and discretionary bonuses to executive officers if the Company’s regulatory capital is below the level of regulatory minimums plus the applicable capital conservation buffer. Federal and state banking laws and regulations restrict the amount of dividends and loans a bank may make to its subsidiary bank. The OCC limitsparent company. Approval by the Company’s regulators is required if the total of all dividends of a national bankdeclared in any calendar year toexceed the total of its net profits ofincome for that year combined with theits retained net profits forincome of the preceding two preceding years. In 2019, the Company had available $22.7 million to pay dividends.
In December 2018, the OCC, the Board of Governors of the Federal Reserve System, and the FDIC approved a final rule to address changes to the credit loss accounting under GAAP, including banking organizations implementation of CECL. The final rule provides banking organizations the option to phase in over a three year period the day one adverse effects on regulatory capital that may result from the adoption of the new accounting standard. Based on the Company’s assessment of the CECL accounting standard and the impact of adoption on the consolidated financial statements and regulatory capital calculations, the Company is planning to adopt the capital transition relief over the permissible three year period.
| 91 |
NOTE K - INCOME TAXES
The components of income tax expense are as follows:follows ($ in thousands):
| Years Ended December 31, | ||||||||||||
| 2017 | 2016 | 2015 | ||||||||||
| Current: | ||||||||||||
| Federal | $ | 408,086 | $ | 3,363,290 | $ | 2,484,372 | ||||||
| State | 100,861 | 577,401 | 473,037 | |||||||||
| Deferred (In 2017, includes $2,080,747 due to | 6,445,865 | (10,352 | ) | 255,638 | ||||||||
| Tax Cut and Jobs Act) | $ | 6,954,812 | $ | 3,930,339 | $ | 3,213,047 | ||||||
| Years Ended December 31, | ||||||||||||
| 2019 | 2018 | 2017 | ||||||||||
| Current: | ||||||||||||
| Federal | $ | 9,477 | $ | 2,435 | $ | 408 | ||||||
| State | 2,312 | 834 | 101 | |||||||||
| Deferred (In 2017, includes $2,081 due to | 912 | 2,523 | 6,446 | |||||||||
| Tax Cut and Jobs Act) | $ | 12,701 | $ | 5,792 | $ | 6,955 | ||||||
The Company's income tax expense differs from the amounts computed by applying the federal income tax statutory rates to income before income taxes. A reconciliation of the differences is as follows:follows (in thousands):
| Years Ended December 31, | ||||||||||||||||||||||||
| 2017 | 2016 | 2015 | ||||||||||||||||||||||
Amount | % | Amount | % | Amount | % | |||||||||||||||||||
| Income taxes at statutory rate | $ | 6,149,951 | 35 | % | $ | 4,917,159 | 35 | % | $ | 4,083,995 | 34 | % | ||||||||||||
| Tax-exempt income | (1,154,595 | ) | (6 | )% | (927,506 | ) | (7 | )% | (831,141 | ) | (7 | )% | ||||||||||||
| Nondeductible expenses | 233,925 | 1 | % | 130,609 | 1 | % | 161,176 | 1 | % | |||||||||||||||
| State income tax, net of federal tax effect | 65,560 | - | 375,311 | 3 | % | 307,951 | 3 | % | ||||||||||||||||
| Tax credits, net | (331,080 | ) | (2 | )% | (308,684 | ) | (2 | )% | (295,800 | ) | (2 | )% | ||||||||||||
| Deferred tax adjustment due to Tax Cuts and Job Act | 2,080,747 | 12 | % | - | - | - | - | |||||||||||||||||
| Other, net | (89,696 | ) | - | (256,550 | ) | (2 | )% | (213,134 | ) | (2 | )% | |||||||||||||
| $ | 6,954,812 | 40 | % | $ | 3,930,339 | 28 | % | $ | 3,213,047 | 27 | % | |||||||||||||
| Years Ended December 31, | ||||||||||||||||||||||||
| 2019 | 2018 | 2017 | ||||||||||||||||||||||
| Amount | % | Amount | % | Amount | % | |||||||||||||||||||
| Income taxes at statutory rate | $ | 11,854 | 21 | % | $ | 5,674 | 21 | % | $ | 6,150 | 35 | % | ||||||||||||
| Tax-exempt income | (1,176 | ) | (2 | )% | (867 | ) | (3 | )% | (1,155 | ) | (6 | )% | ||||||||||||
| Nondeductible expenses | 348 | 1 | % | 403 | 1 | % | 234 | 1 | % | |||||||||||||||
| State income tax, net of federal tax effect | 1,969 | 4 | % | 1,058 | 4 | % | 66 | - | ||||||||||||||||
| Tax credits, net | (334 | ) | (1 | )% | (334 | ) | (1 | )% | (331 | ) | (2 | )% | ||||||||||||
| Deferred tax adjustment due to Tax Cuts and Job Act | - | - | - | - | 2,081 | 12 | % | |||||||||||||||||
| Other, net | 40 | - | % | (142 | ) | (1 | )% | (90 | ) | - | ||||||||||||||
| $ | 12,701 | 23 | % | $ | 5,792 | 21 | % | $ | 6,955 | 40 | % | |||||||||||||
On December 22, 2017, the Tax Cuts and Jobs Act was enacted which permanently reduced the U.S. corporate income tax rate from a maximum of 35% to a flat 21% rate, effective January 1, 2018. As a result of the reduction in the U.S corporate income tax rate, the Company reevaluated its ending net deferred tax asset as of December 31,201731, 2017 and recognized a tax expense of approximately $2.1 million.
The components of deferred income taxes included in the consolidated financial statements were as follows:follows ($ in thousands):
| December 31, | December 31, | |||||||||||||||
| 2017 | 2016 | 2019 | 2018 | |||||||||||||
| Deferred tax assets: | ||||||||||||||||
| Allowance for loan losses | $ | 2,096,866 | $ | 2,897,479 | $ | 3,430 | $ | 2,547 | ||||||||
| Net operating loss carryover | 1,500,867 | 2,315,140 | 2,830 | 2,831 | ||||||||||||
| Non-accrual loan interest | 344,187 | 35,208 | 895 | 601 | ||||||||||||
| Other real estate | 842,797 | 272,598 | 506 | 494 | ||||||||||||
| Unrealized loss on available-for-sale securities | 150,298 | 642,629 | - | 611 | ||||||||||||
| Deferred Compensation | 1,190 | 1,235 | ||||||||||||||
| Loan Purchase Accounting | 3,467 | 3,505 | ||||||||||||||
| Right-of-use asset | 1,650 | - | ||||||||||||||
| Other | 965,766 | 1,184,474 | 2,146 | 776 | ||||||||||||
| 5,900,781 | 7,347,528 | 16,114 | 12,600 | |||||||||||||
| Deferred tax liabilities: | ||||||||||||||||
| Unrealized gain on available-for-sale securities | (3,417 | ) | - | |||||||||||||
| Securities | (43,400 | ) | (115,737 | ) | (81 | ) | (149 | ) | ||||||||
| Premises and equipment | (315,550 | ) | (449,136 | ) | (5,002 | ) | (3,056 | ) | ||||||||
| Core deposit intangible | (204,103 | ) | (231,845 | ) | (6,864 | ) | (4,959 | ) | ||||||||
| Goodwill | (989,011 | ) | (1,228,960 | ) | (1,631 | ) | (1,356 | ) | ||||||||
| Right-of-use liability | (1,650 | ) | - | |||||||||||||
| Other | (331 | ) | (254 | ) | ||||||||||||
| (1,552,064 | ) | (2,025,678 | ) | (18,976 | ) | (9,774 | ) | |||||||||
| Net deferred tax asset, included in other assets | $ | 4,348,717 | $ | 5,321,850 | ||||||||||||
| Net deferred tax asset/(liability), included in other assets/(liabilities) | $ | (2,862 | ) | $ | 2,826 | |||||||||||
| 92 |
With the acquisition of Wiggins in 2006, Baldwin in 2013, Bay in 2014, and Gulf Coast in 2017, Sunshine 2018, and FPB in 2019, the Company assumed federal tax net operating loss carryovers. These$11.7 million of net operating losses are available to the Company and begin to expire as follows :in 2026. The Company expects to fully utilize the net operating losses.
| Years | Amounts | |||
| 2018 | $ | 551,818 | ||
| 2019 | 396,985 | |||
| 2020-2032 | 4,464,304 | |||
| 2033 | 281,800 | |||
| 2034 | 147,617 | |||
| 2035-2036 | 92,114 | |||
| $ | 5,934,638 | |||
The Company follows the guidance of ASC Topic 740,Income Taxes,which prescribes a recognition threshold and measurement attribute for the financial statement recognition and measurement of a tax position taken or expected to be taken in a tax return. ASC Topic 740 also provides guidance on derecognition, classification, interest and penalties, accounting in interim periods, disclosure and transition. As of December 31, 2017,2019, the Company had no uncertain tax positions that it believes should be recognized in the financial statements. The tax years still subject to examination by taxing authorities are years subsequent to 2014. In February 2017, the Company was notified that its federal income tax return for 2014 was to be examined by the Internal Revenue Service. The examination was completed during 2017 with no findings.
2015.
NOTE L - EMPLOYEE BENEFITS
The Company and the Bank provide a deferred compensation arrangement (401(k) plan) whereby employees contribute a percentage of their compensation. For employee contributions of six percent or less, the Company and its subsidiary bank provide a 50% matching contribution. Contributions totaled $512,800$771 thousand in 2017, $339,2002019, $628 thousand in 20162018 and $287,055$513 thousand in 2015.2017.
The Company sponsors an Employee Stock Ownership Plan (ESOP) for employees who have completed one year of service for the Company and attained age 21. Employees become fully vested after five years of service. Contributions to the plan are at the discretion of the Board of Directors. At December 31, 2017,2019, the ESOP held 5,728 shares valued at $203 thousand of Company common stock and had no debt obligation. All shares held by the plan were considered outstanding for net income per share purposes. Total ESOP expense was $3,675$11 thousand for 2017, $5,3462019, $4 thousand for 20162018 and $25,506$4 thousand for 2015.2017.
In 2014, the Company established a Supplemental Executive Retirement Plan (“SERP”) for three active key executives. During 2016, the Company established a SERP for eight additional active key executives. Pursuant to the SERP, these officers are entitled to receive 180 equal monthly payments commencing at the later of obtaining age 65 or separation from service. The costs of such benefits, assuming a retirement date at age 65, will be accrued by the Company at such retirement date. The Company accrued to expense $241,937$257 thousand for 20172019 and $194,164$259 thousand for 20162018 and $88,992$242 thousand for 20152017 for future benefits payable under the SERP. The SERP is an unfunded plan and is considered a general contractual obligation of the Company.
Upon the acquisition of Iberville Bank, Southwest and FMB, the Bank assumed deferred compensation agreements with directors and employees. At December 31, 2017,2019, the total liability of the deferred compensation agreements was $1,189,456.$1.1 million, $1.1 million, and $3.1million, respectively. Deferred compensation expense totaled $31,309$24 thousand, $80 thousand, and $136 thousand, respectively for 2017.2019.
| 93 |
NOTE M - STOCK PLANS
In 2007, the Company adopted the 2007 Stock Incentive Plan. The 2007 Plan provided for the issuance of up to 315,000 shares of Company Common Stock, $1.00 par value per share. In 2015, the Company adopted an amendment to the 2007 Stock Incentive Plan which provided for the issuance of an additional 300,000 shares of Company Common Stock, $1.00 par value per share, for a total of 615,000 shares. Shares issued under the 2007 Plan may consist in whole or in part of authorized but unissued shares or treasury shares. DuringTotal shares issuable under the plan are 120,578 at year-end 2019, and 89,315 and 60,984 shares were issued in 2019 and 2018, respectively.
A summary of changes in the Company’s nonvested shares for the year endedfollows:
| Nonvested shares | Shares | Weighted- Average Grant-Date Fair Value | ||||||
| Nonvested at January 1, 2019 | 255,055 | $ | 22.94 | |||||
| Granted | 89,315 | |||||||
| Vested | (7,300 | ) | ||||||
| Forfeited | (7,931 | ) | ||||||
| Nonvested at December 31, 2019 | 329,139 | $ | 25.61 | |||||
As of December 31, 2015, 69,327 restricted stock awards were2019, there was $4.8 million of total unrecognized compensation cost related to nonvested shares granted under the Plan. DuringThe costs is expected to be recognized over the yearremaining term of the vesting period (approximately 5 years). The total fair value of shares vested during the years ended December 31, 2016, 61,247 restricted stock awards were granted under the Plan. During the year ended December 31,2019, 2018 and 2017 84,286 restricted stock awards were granted under the Planwas $240 thousand, $90 thousand, and no stock awards were forfeited due to separation. During 2017, 11,867 shares were repurchased for payment of taxes. During 2016, 9,895 shares were repurchased and during 2015, 6,324 shares were repurchased for payment of taxes. The weighted average grant-date fair value for these shares was $27.71 per share. $1.8 million.
Compensation costscost in the amount of $866,558$1.7 million was recognized for the year ended December 31, 2017, $772,3112019, $1.2 million was recognized for the year ended December 31, 20162018 and $721,124$867 thousand for the year ended December 31, 2015.2017. Shares of restricted stock granted to employees under this stock plan are subject to restrictions as to the vesting period. The restricted stock award becomes 100% vested on the earliest of 1) the three or five year vesting period provided the Grantee has not incurred a termination of employment prior to that date, 2) the Grantee’s retirement, or 3) the Grantee’s death. During this period, the holder is entitled to full voting rights and dividends. The dividends which are held untilby the Company and only paid if and when the grants are vested. The 2007 Plan also contains a double trigger change-in-control provision pursuant to which unvested shares of stock granted through the plan will be accelerated upon a change in control if the executive is terminated without cause as a result of the transaction (as long as the shares granted remain part of the Company or are transferred into the shares of the new company). As of December 31, 2017, there was approximately $3,012,598 of unrecognized compensation expense related to this Plan. The expense is expected to be recognized over the remaining term of the vesting period (approximately 4 years).
NOTE N – SUBORDINATED DEBT
NOTE N - SUBORDINATED DEBENTURESDebentures
On June 30, 2006, the Company issued $4,124,000 of floating rate junior subordinated deferrable interest debentures to The First Bancshares Statutory Trust 2 in which the Company owns all of the common equity. The debentures are the sole asset of the Trust.Trust 1. The Trust issued $4,000,000 of Trust Preferred Securities to investors. The Company’s obligations under the debentures and related documents, taken together, constitute a full and unconditional guarantee by the Company of the Trust’s obligations under the preferred securities. The preferred securities were redeemable by the Company at its option. The preferred securities must be redeemed upon maturity of the debentures in 2036. Interest on the preferred securities is the three month London Interbank Offer Rate (LIBOR) plus 1.65% and is payable quarterly. The terms of the subordinated debentures are identical to those of the preferred securities.
| 94 |
On July 27, 2007, the Company issued $6,186,000 of floating rate junior subordinated deferrable interest debentures to The First Bancshares Statutory Trust 3 in which the Company owns all of the common equity. The debentures are the sole asset of Trust 3. The Trust issued $6,000,000 of Trust Preferred Securities to investors. The Company’s obligations under the debentures and related documents, taken together, constitute a full and unconditional guarantee by the Company of the Trust’s obligations under the preferred securities. The preferred securities are redeemable by the Company at its option. The preferred securities must be redeemed upon maturity of the debentures in 2037. Interest on the preferred securities is the three month LIBOR plus 1.40% and is payable quarterly. The terms of the subordinated debentures are identical to those of the preferred securities.
In 2018, the Company acquired FMB’s Capital Trust 1, which consisted of $6.1 million of floating rate junior subordinated deferrable interest debentures in which the Company owns all of the common equity. The debentures are the sole asset of Trust 1. The Trust issued $6,000,000 of Trust Preferred Securities to investors. The Company’s obligations under the debentures and related documents, taken together, constitute a full and unconditional guarantee by the Company of the Trust’s obligations under the preferred securities. The preferred securities are redeemable by the Company at its option. The preferred securities must be redeemed upon maturity of the debentures in 2033. Interest on the preferred securities is the three month LIBOR plus 2.85% and is payable quarterly. The terms of the subordinated debentures are identical to those of the preferred securities. In accordance with the provisions of ASC Topic 810,Consolidation,the trusts are not included in the consolidated financial statements.
Notes
On April 30, 2018, The Company entered into two Subordinated Note Purchase Agreements pursuant to which the Company sold and issued $24.0 million in aggregate principal amount of 5.875% fixed-to-floating rate subordinated notes due 2028 and $42.0 million in aggregate principal amount of 6.40% fixed-to-floating rate subordinated notes due 2033 (collectively, the “Notes”).
The Notes are not convertible into or exchangeable for any other securities or assets of the Company or any of its subsidiaries. The Notes are not subject to redemption at the option of the holder. Principal and interest on the Notes are subject to acceleration only in limited circumstances. The Notes are unsecured, subordinated obligations of the Company and rank junior in right to payment to the Company’s current and future senior indebtedness, and each Note is pari passu in right to payment with respect to the other Notes.
NOTE O - TREASURY STOCK
Shares held in treasury totaled 194,682 at December 31, 2019 and 26,494 at December 31, 2017, 2016,2018, and 2015.2017.
On March 28, 2019, the Company announced that its Board of Directors authorized a share repurchase program to purchase up to an aggregate of $20 million of the Company’s common stock (the “March 2019 program”). This share repurchase program has an expiration date of December 31, 2019. Under the March 2019 program, the Company may repurchase shares of its common stock periodically in a manner determined by the Company’s management. The actual means and timing of purchase, target number of shares and maximum price or range of prices under the program will be determined by management at its discretion and will depend on a number of factors, including the market price of the Company’s common stock, general market and economic conditions, and applicable legal and regulatory requirements. The Company repurchased 168,188 shares under the March 2019 program during 2019.
| 95 |
NOTE P - RELATED PARTY TRANSACTIONS
In the normal course of business, the Bank makes loans to its directors and executive officers and to companies in which they have a significant ownership interest. In the opinion of management, these loans are made on substantially the same terms, including interest rates and collateral, as those prevailing at the time for comparable transactions with other parties, are consistent with sound banking practices, and are within applicable regulatory and lending limitations. Such loans amounted to approximately $15,137,000$23.7 million and $15,788,000$20.6 million at December 31, 20172019 and 2016,2018, respectively. The activity in loans to current directors, executive officers, and their affiliates during the year ended December 31, 2017,2019, is summarized as follows (in thousands):follows:
| ($ in thousands) | ||||
| Loans outstanding at beginning of year | $ | 20,593 | ||
| New loans | 6,603 | |||
| Repayments | (3,499 | ) | ||
| Loans outstanding at end of year | $ | 23,697 |
| Loans outstanding at beginning of year | $ | 15,788 | ||
| New loans | 250 | |||
| Repayments | (901 | ) | ||
| Loans outstanding at end of year | $ | 15,137 |
Deposits from principal officers, directors, and their affiliates at year-end 2019 and 2018 were $6.2 million and $6.1 million.
NOTE Q - COMMITMENTS, CONTINGENCIES, AND CONCENTRATIONS OF CREDIT RISK
In the normal course of business, there are outstanding various commitments and contingent liabilities, such as guaranties, commitments to extend credit, etc., which are not reflected in the accompanying financial statements. The subsidiary bank had outstanding letters of credit of $8,207,000 and $1,742,000 at December 31, 2017 and 2016, respectively, and had made loan commitments of approximately $281,381,000 and $220,252,000 at December 31, 2017 and 2016, respectively.
Commitments to extend credit and letters of credit include some exposure to credit loss in the event of nonperformance of the customer. Commitments to extend credit are agreements to lend to a customer as long as there is no violation of any condition established in the contract. Standby letters of credit are conditional commitments issued by the Bank to guarantee the performance of a customer to a third party. The credit policies and procedures for such commitments are the same as those used for lending activities. Because these instruments have fixed maturity dates and because a number expire without being drawn upon, they generally do not present any significant liquidity risk. No significant losses on commitments were incurred during the two years ended December 31, 2017,2019, nor are any significant losses as a result of these transactions anticipated.
The primary market areas served by the Bankcontractual amounts of financial instruments with off-balance-sheet risk at year-end were as follows:
| 2019 | 2018 | |||||||||||||||
| ($ in thousands) | Fixed Rate | Variable Rate | Fixed Rate | Variable Rate | ||||||||||||
| Commitments to make loans | $ | 42,774 | $ | 5,676 | $ | 32,624 | $ | 36,780 | ||||||||
| Unused lines of credit | 137,966 | 208,728 | 115,524 | 131,741 | ||||||||||||
| Standby letters of credit | 3,648 | 8,475 | 2,357 | 8,367 | ||||||||||||
Commitments to make loans are Forrest, Lamar, Jones, Pearl River, Jackson, Hancock, Stone, Harrison Counties within Southgenerally made for periods of 90 days or less. The fixed rate loan commitments have interest rates ranging from 0.5% to 18.0% and maturities ranging from 1 year to 30 years.
The Company currently has 73 full service banking and financial service offices, one motor bank facility and four loan production offices across Mississippi, Madison County in Central Mississippi, as well as Washington Parish, St. Tammany Parish, Plaquemine ParishAlabama, Florida, Georgia and East Baton Rouge Parish in Louisiana, Baldwin and Mobile Counties in South Alabama, and Escambia County in Northwestern Florida.Louisiana. Management closely monitors its credit concentrations and attempts to diversify the portfolio within its primary market area. As of December 31, 2017,2019, management does not consider there to be any significant credit concentrations within the loan portfolio. Although the Bank’s loan portfolio, as well as existing commitments, reflects the diversity of its primary market area, a substantial portion of a borrower's ability to repay a loan is dependent upon the economic stability of the area.
In the normal course of business, the Company and its subsidiary are subject to pending and threatened legal actions. Although the Company is not able to predict the outcome of such actions, after reviewing pending and threatened actions with counsel, management believes that based on the information currently available the outcome of such actions, individually or in the aggregate, will not have a material adverse effect on the Company’s consolidated financial statements.
NOTE R - FAIR VALUES OF ASSETS AND LIABILITIES
The Company follows the guidance of ASC Topic 820,Fair Value Measurements and Disclosures, that establishes a framework for measuring fair value and expands disclosures about fair value measurements.
| 96 |
The guidance defines the fair value as the price that would be received to sell an asset or paid to transfer a liability in an orderly transaction between market participants at the measurement date. It also establishes a fair value hierarchy which requires an entity to maximize the use of observable inputs and minimize the use of unobservable inputs when measuring fair value.
In accordance with the guidance, the Company groups its financial assets and financial liabilities measured at fair value in three levels, based on the markets in which the assets and liabilities are traded and the reliability of the assumptions used to determine fair value. These levels are:
| Level 1: | Valuations for assets and liabilities traded in active exchange markets, such as the New York Stock Exchange. Valuations are obtained from readily available pricing sources for market transactions involving identical assets or liabilities. | |
| Level 2: | Valuations for assets and liabilities traded in less active dealer or broker markets. Valuations are obtained from third party pricing services for identical or comparable assets or liabilities which use observable inputs other than Level 1 prices, such as quoted prices for similar assets or liabilities; quoted prices in markets that are not active; or other inputs that are observable or can be corroborated by observable market data for substantially the full term of the assets and liabilities. | |
| Level 3: | Unobservable inputs that are supported by little or no market activity and that are significant to the fair value of the assets or liabilities. |
Following is a description of the valuation methodologies used for instruments measured at fair value on a recurring basis and recognized in the accompanying consolidated balance sheets.
Available-for-Sale Securities
The fair value of available-for-sale securities is determined by various valuation methodologies. Where quoted market prices are available in an active market, securities are classified within Level 1. Level 1 securities include mutual funds. If quoted market prices are not available, then fair values are estimated by using pricing models or quoted prices of securities with similar characteristics. Level 2 securities include U.S. Treasury securities, obligations of U.S. government corporations and agencies, obligations of states and political subdivisions, mortgage-backed securities and collateralized mortgage obligations. In certain cases where Level 1 or Level 2 inputs are not available, securities are classified within Level 3 of the hierarchy. For securities where quoted prices or market prices of similar securities are not available, fair values are calculated using the discounted cash flow or other market indicators (Level 3).
The following table presents the Company’s available-for-sale securities that are measured at fair value on a recurring basis and the level within the hierarchy in which the fair value measurements fell as of December 31, 20172019 and 2016 (In2018 ($ in thousands):
| Fair Value Measurements Using | ||||||||||||||||
| Quoted Prices in Active Markets For Identical Assets | Significant Other Observable Inputs | Significant Unobservable Inputs | ||||||||||||||
| Fair Value | (Level 1) | (Level 2) | (Level 3) | |||||||||||||
| December 31, 2017 | ||||||||||||||||
| Obligations of U.S. Government agencies | $ | 4,992 | $ | - | $ | 4,992 | $ | - | ||||||||
| Municipal securities | 138,584 | - | 138,584 | - | ||||||||||||
| Mortgage-backed securities | 196,578 | - | 196,578 | - | ||||||||||||
| Corporate obligations | 15,819 | - | 13,250 | 2,569 | ||||||||||||
| Other | 920 | 920 | - | - | ||||||||||||
| Total | $ | 356,893 | $ | 920 | $ | 353,404 | $ | 2,569 | ||||||||
December 31, 2019
| Fair Value Measurements Using | ||||||||||||||||
| Quoted Prices in Active Markets For Identical Assets | Significant Other Observable Inputs | Significant Unobservable Inputs | ||||||||||||||
| Fair Value | (Level 1) | (Level 2) | (Level 3) | |||||||||||||
| December 31, 2016 | ||||||||||||||||
| Obligations of U.S. Government agencies | $ | 9,045 | $ | - | $ | 9,045 | $ | - | ||||||||
| Municipal securities | 98,822 | - | 98,822 | - | ||||||||||||
| Mortgage-backed securities | 114,289 | - | 114,289 | - | ||||||||||||
| Corporate obligations | 20,110 | - | 17,869 | 2,241 | ||||||||||||
| Other | 940 | 940 | - | - | ||||||||||||
| Total | $ | 243,206 | $ | 940 | $ | 240,025 | $ | 2,241 | ||||||||
| Fair Value Measurements | ||||||||||||||||
| Quoted Prices in Active Markets For Identical Assets | Significant Other Observable Inputs | Significant Unobservable Inputs | ||||||||||||||
| ($ in thousands) | Fair Value | (Level 1) | (Level 2) | (Level 3) | ||||||||||||
| Available-for-sale | ||||||||||||||||
| U.S Treasury | $ | 4,894 | $ | 4,894 | $ | - | $ | - | ||||||||
| Obligations of U.S. government agencies and sponsored entities | 77,950 | - | 77,950 | $ | - | |||||||||||
| Municipal securities | 258,982 | - | 248,637 | 10,345 | ||||||||||||
| Mortgage-backed securities | 395,315 | - | 395,315 | - | ||||||||||||
| Corporate obligations | 27,946 | - | 27,538 | 408 | ||||||||||||
| Total available for sale | $ | 765,087 | $ | 4,894 | $ | 749,440 | $ | 10,753 | ||||||||
| 97 |
December 31, 2018
| Fair Value Measurements | ||||||||||||||||
| Quoted Prices in Active Markets For Identical Assets | Significant Other Observable Inputs | Significant Unobservable Inputs | ||||||||||||||
| ($ in thousands) | Fair Value | (Level 1) | (Level 2) | (Level 3) | ||||||||||||
| Available-for-sale | ||||||||||||||||
| Obligations of U.S. government agencies and sponsored entities | $ | 47,342 | $ | - | $ | 47,342 | $ | - | ||||||||
| Municipal securities | 150,064 | - | 142,490 | 7,574 | ||||||||||||
| Mortgage-backed securities | 287,470 | - | 287,470 | - | ||||||||||||
| Corporate obligations | 7,348 | - | 6,474 | 874 | ||||||||||||
| Total available for sale | $ | 492,224 | $ | - | $ | 483,776 | $ | 8,448 | ||||||||
The following is a reconciliation of activity for assets measured at fair value based on significant unobservable (non-market)(Level 3) information.
| Bank-Issued Trust | ||||||||
| Preferred Securities | ||||||||
| ($ in thousands) | 2019 | 2018 | ||||||
| Balance, January 1 | $ | 874 | $ | 2,569 | ||||
| Unrealized loss included in comprehensive income | (466 | ) | (1,695 | ) | ||||
| Balance at December 31, 2019 and 2018 | $ | 408 | $ | 874 | ||||
| Municipal Securities | ||||||||
| ($ in thousands) | 2019 | 2018 | ||||||
| Balance, January 1 | $ | 7,574 | $ | 4,818 | ||||
| Unrealized gain included in comprehensive income | 2,771 | 2,756 | ||||||
| Balance at December 31, 2019 and 2018 | $ | 10,345 | $ | 7,574 | ||||
| (In thousands) | Bank-Issued Trust Trust Preferred Securities | |||||||||||
| 2017 | 2016 | 2015 | ||||||||||
| Balance of recurring Level 3 assets at January 1 | $ | 2,241 | $ | 2,557 | $ | 2,801 | ||||||
| Transfers into Level 3 | - | - | - | |||||||||
| Transfers out of Level 3 | - | - | - | |||||||||
| Unrealized income (loss) included in comprehensive Income | 328 | (316 | ) | (244 | ) | |||||||
| Balance of recurring Level 3 assets at December 31 | $ | 2,569 | $ | 2,241 | $ | 2,557 | ||||||
The following table presentsmethods and assumptions were used to estimate the fair values of the Company’s assets measured at fair value on a recurring basis at December 31, 2019 and 2018. The following tables present quantitative information about recurring Level 3 fair value measurements (in($ in thousands):
| Trust Preferred Securities | Fair Value | Valuation Technique | Significant Unobservable Inputs | Range of Inputs | ||||||
| December 31, 2017 | $ | 2,569 | Discounted cash flow | Discount rate | 2.07% - 3.77% | |||||
| December 31, 2016 | $ | 2,241 | Discounted cash flow | Discount rate | 1.50% - 3.34% | |||||
| December 31, 2015 | $ | 2,557 | Discounted cash flow | Discount rate | 1.08% - 2.77% | |||||
| Trust Preferred Securities | Fair Value | Valuation Technique | Significant Unobservable Inputs | Range of Inputs | ||||||||
| December 31, 2019 | $ | 408 | Discounted cash flow | Discount rate | 2.73% - 4.15% | |||||||
| December 31, 2018 | $ | 874 | Discounted cash flow | Discount rate | 3.71% - 5.03% | |||||||
| Municipal Securities | Fair Value | Valuation Technique | Significant Unobservable Inputs | Range of Inputs | ||||||||
| December 31, 2019 | $ | 10,345 | Discounted cash flow | Discount rate | 1.50% - 4.40% | |||||||
| December 31, 2018 | $ | 7,574 | Discounted cash flow | Discount rate | 2.00% - 3.50% | |||||||
Following is a description of the valuation methodologies used for assets and liabilities measured at fair value on a non-recurring basis and recognized in the accompanying balance sheets, as well as the general classification of such assets and liabilities pursuant to the valuation hierarchy.
Impaired Loans
Loans for which it is probable that the Company will not collect all principal and interest due according to contractual terms are measured for impairment. Allowable methods for estimating fair value include using the fair value of the collateral for collateral dependent loans or, where a loan is determined not to be collateral dependent, using the discounted cash flow method.
If the impaired loan is identified as collateral dependent, then the fair value method of measuring the amount of impairment is utilized. This method requires obtaining a current independent appraisal of the collateral. These appraisals may utilize a single valuation approach or a combination of approaches including comparable sales and the income approach. Adjustments are routinely made in the appraisal process by the independent appraisers to adjust for differences between the comparable sales and income date available for similar loans and collateral and applyingunderlying such loans. Such adjustments, if any, result in a discount factor to the value. If the impaired loan is determined not to be collateral dependent, then the discounted cash flow method is used. This method requires the impaired loan to be recorded at the present value of expected future cash flows discounted at the loan’s effective interest rate. The effective interest rate of a loan is the contractual interest rate adjusted for any net deferred loan fees or costs, premiums or discounts existing at origination or acquisitionLevel 3 classification of the loan.inputs for determining fair value. The Company adjust the appraisal 10 percent. Non-real estate collateral may be valued using an appraisal, net book value per the borrower’s financial statements, or aging reports, adjusted or discounted based on management’s expertise and knowledge of the client and client’s business, resulting in a Level 3 fair value classification. Impaired loans are classified within Level 2 of the fair value hierarchy.evaluated on a quarterly basis for additional impairment.
Other Real Estate Owned
Other real estate owned consists of properties obtained through foreclosure. The adjustment at the time of foreclosure is recorded through the allowance for loan losses. Fair value of other real estate owned is based on current independent appraisals of the collateral less costs to sell when acquired, establishing a new costs basis. These assets are subsequently accounted for at lower of cost or fair value less estimated costs to sell. Fair value is commonly based on recent real estate appraisals, which are updated no less frequently than annually. These appraisals may utilize a single valuation approach or a combination of approaches including comparable sales and the income approach with data from comparable properties. Adjustments are routinely made in the appraisal process by the independent appraisers to adjust for differences between the comparable sales and income data available. Such adjustments, if any, result in a Level 3 classification of the inputs for determining fair value. In the determination of fair value subsequent to foreclosure, Management also considers other factors or recent developments, such as changes in market conditions from the time of valuation and anticipated sales values considering plans for disposition, which could result in an adjustment to lower the collateral value estimates indicated in the appraisals. The Company adjust the appraisal 10 percent. Periodic revaluations are classified as Level 3 in the fair value hierarchy since assumptions are used that may not be observable in the market. Due to the subjective nature of establishing the fair value when the asset is acquired, the actual fair value of the other real estate owned or foreclosed asset could differ from the original estimate. If it is determined the fair value declines subsequent to foreclosure, a valuation allowance is recorded through other income. Operating costs associated with the assets after acquisition are also recorded as non-interest expense. Gains and losses on the disposition of other real estate owned and foreclosed assets are netted and recorded in other income. Other real estate owned measured at fair value on a non-recurring basis at December 31, 2017,2019, amounted to $7,158,409.$7.3 million. Other real estate owned is classified within Level 23 of the fair value hierarchy.
| 99 |
The following table presents the fair value measurement of assets and liabilities measured at fair value on a nonrecurring basis and the level within the fair value hierarchy in which the fair value measurements fellwere reported at December 31, 20172019 and 2016 (In thousands).2018.
| Fair Value Measurements Using | ||||||||||||||||
| Quoted Prices in Active Markets For Identical Assets | Significant Other Observable Inputs | Significant Unobservable Inputs | ||||||||||||||
| ($ in thousands) | Fair Value | (Level 1) | (Level 2) | (Level 3) | ||||||||||||
| December 31, 2019 | ||||||||||||||||
| Impaired loans | $ | 11,337 | $ | - | $ | - | $ | 11,337 | ||||||||
| Other real estate owned | 7,299 | - | - | 7,299 | ||||||||||||
| December 31, 2018 | ||||||||||||||||
| Impaired loans | $ | 11,571 | $ | - | $ | - | $ | 11,571 | ||||||||
| Other real estate owned | 10,869 | - | - | 10,869 | ||||||||||||
| Fair Value Measurements Using | ||||||||||||||||
| Quoted Prices in Active Markets For Identical Assets | Significant Other Observable Inputs | Significant Unobservable Inputs | ||||||||||||||
| Fair Value | (Level 1) | (Level 2) | (Level 3) | |||||||||||||
| December 31, 2017 | ||||||||||||||||
| Impaired loans | $ | 10,574 | $ | - | $ | 10,574 | $ | - | ||||||||
| Other real estate owned | 7,158 | - | 7,158 | - | ||||||||||||
| December 31, 2016 | ||||||||||||||||
| Impaired loans | $ | 6,128 | $ | - | $ | 6,128 | $ | - | ||||||||
| Other real estate owned | 6,007 | - | 6,007 | - | ||||||||||||
The following methods and assumptions were used to estimate the fair value of each class of financial instrument for which it is practicable to estimate that value:
Cash and Cash Equivalents – For such short-term instruments, the carrying amount is a reasonable estimate of fair value.
Investment in securities available-for-sale and held-to-maturity – The fair value measurement for securities available-for-sale was discussed earlier. The same measurement approach was used for securities held-to-maturity and other securities.
Loans – The fair value of loans iswas estimated by discounting the expected future cash flows using the current interest rates at which similar loans would be made to borrowers with similar credit ratings and for the same remaining maturities.maturities, in accordance with the exit price notion as defined by FASB ASC 820,Fair Value Measurement ("ASC 820"). Expected future cash flows were projected based on contractual cash flows, adjusted for estimated prepayments and as a result of the adoption of ASU 2016-01, which also included credit risk and other market factors to calculate the exit price fair value in accordance with ASC 820.
Bank-owned Life Insurance– The fair value of bank-owned life insurance approximates the carrying amount, because upon liquidation of these investments, the Company would receive the cash surrender value which equals the carrying amount.
Accrued Interest Receivable –The carrying amount of accrued interest receivable approximates fair value and is classified as level 2 for accrued interest receivable related to investments securities and Level 3 for accrued interest receivable related to loans.
Deposits – The fair values of demand deposits are, as required by ASC Topic 825, equal to the carrying value of such deposits. Demand deposits include non-interest-bearing demand deposits, savings accounts, NOW accounts, and money market demand accounts. The fair value of variable rate term deposits, those repricing within six months or less, approximates the carrying value of these deposits. Discounted cash flows have been used to value fixed rate term deposits and variable rate term deposits repricing after six months. The discount rate used is based on interest rates currently being offered on comparable deposits as to amount and term.
| 100 |
Short-Term Borrowings – The carrying value of any federal funds purchased and other short-term borrowings approximates their fair values.
FHLB and Other Borrowings – The fair value of the fixed rate borrowings are estimated using discounted cash flows, based on current incremental borrowing rates for similar types of borrowing arrangements. The carrying amount of any variable rate borrowing approximates its fair value.
Subordinated Debentures –Fair values are determined based on the current market value of like instruments of a similar maturity and structure.
Accrued Interest Payable –The subordinated debentures bearcarrying amount of accrued interest atpayable approximates fair value resulting in a variable rate and the carrying value approximates the fair value.Level 2 classification.
Off-Balance Sheet Instruments– Fair values of off-balance sheet financial instruments are based on fees charged to enter into similar agreements. However, commitments to extend credit do not represent a significant value until such commitments are funded or closed. Management has determined that these instruments do not have a distinguishable fair value and no fair value has been assigned.
Fair Value Measurements | ||||||||||||||||||||
| December 31, 2019 | Carrying | Estimated | Quoted Prices | Significant Other Observable Inputs | Significant Unobservable Inputs | |||||||||||||||
| ($ in thousands) | Amount | Fair Value | (Level 1) | (Level 2) | (Level 3) | |||||||||||||||
| Financial Instruments: | ||||||||||||||||||||
| Assets: | ||||||||||||||||||||
| Cash and cash equivalents | $ | 168,864 | $ | 168,864 | $ | 168,864 | $ | - | $ | - | ||||||||||
| Securities available-for-sale | 765,087 | 765,087 | 4,894 | 749,440 | 10,753 | |||||||||||||||
| Loans, net | 2,597,260 | 2,560,668 | - | - | 2,560,668 | |||||||||||||||
| Accrued interest receivable | 14,802 | 14,802 | - | 4,246 | 10,556 | |||||||||||||||
| Liabilities: | ||||||||||||||||||||
| Non-interest-bearing deposits | $ | 723,208 | $ | 723,208 | $ | - | $ | 723,208 | $ | - | ||||||||||
| Interest-bearing deposits | 2,353,325 | 2,339,537 | - | 2,339,537 | - | |||||||||||||||
| Subordinated debentures | 80,678 | 80,330 | - | - | 80,330 | |||||||||||||||
| FHLB and other borrowings | 214,319 | 214,319 | - | 214,319 | - | |||||||||||||||
| Accrued interest payable | 2,508 | 2,508 | - | 2,508 | - | |||||||||||||||
| As of December 31, 2017 | Fair Value Measurements | |||||||||||||||||||
| (In thousands) | Carrying Amount | Estimated Fair Value | Quoted Prices (Level 1) | Significant Other Observable Inputs (Level 2) | Significant Unobservable Inputs (Level 3) | |||||||||||||||
| Financial Instruments: | ||||||||||||||||||||
| Assets: | ||||||||||||||||||||
| Cash and cash equivalents | $ | 91,922 | $ | 91,922 | $ | 91,922 | $ | - | $ | - | ||||||||||
| Securities available-for-sale | 356,893 | 356,893 | 920 | 353,404 | 2,569 | |||||||||||||||
| Securities held-to-maturity | 6,000 | 7,398 | - | 7,398 | - | |||||||||||||||
| Other securities | 9,969 | 9,969 | - | 9,969 | - | |||||||||||||||
| Loans, net | 1,221,808 | 1,238,525 | - | - | 1,238,525 | |||||||||||||||
| Bank-owned life insurance | 27,054 | 27,054 | - | 27,054 | - | |||||||||||||||
| Liabilities: | ||||||||||||||||||||
| Non-interest-bearing deposits | $ | 301,989 | $ | 301,989 | $ | - | $ | 301,989 | $ | - | ||||||||||
| Interest-bearing deposits | 1,168,576 | 1,165,682 | - | 1,165,682 | - | |||||||||||||||
| Subordinated debentures | 10,310 | 10,310 | - | - | 10,310 | |||||||||||||||
| FHLB and other borrowings | 104,072 | 104,072 | - | 104,072 | - | |||||||||||||||
| As of December 31, 2017 | Fair Value Measurements | |||||||||||||||||||
| (In thousands) | Carrying Amount | Estimated Fair Value | Quoted Prices (Level 1) | Significant Other Observable Inputs (Level 2) | Significant Unobservable Inputs (Level 3) | |||||||||||||||
| Financial Instruments: | ||||||||||||||||||||
| Assets: | ||||||||||||||||||||
| Cash and cash equivalents | $ | 62,119 | $ | 62,119 | $ | 62,119 | $ | - | $ | - | ||||||||||
| Securities available-for-sale | 243,206 | 243,206 | 940 | 240,025 | 2,241 | |||||||||||||||
| Securities held-to-maturity | 6,000 | 7,394 | - | 7,394 | - | |||||||||||||||
| Other securities | 6,593 | 6,593 | - | 6,593 | - | |||||||||||||||
| Loans, net | 865,424 | 883,161 | - | - | 883,161 | |||||||||||||||
| Bank-owned life insurance | 21,250 | 21,250 | - | 21,250 | - | |||||||||||||||
| Liabilities: | ||||||||||||||||||||
| Non-interest-bearing deposits | $ | 202,478 | $ | 202,478 | $ | - | $ | 202,478 | $ | - | ||||||||||
| Interest-bearing deposits | 836,713 | 835,658 | - | 835,658 | - | |||||||||||||||
| Subordinated debentures | 10,310 | 10,310 | - | - | 10,310 | |||||||||||||||
| FHLB and other borrowings | 69,000 | 69,000 | - | 69,000 | - | |||||||||||||||
NOTE S - PREFERRED STOCK
Fair Value Measurements | ||||||||||||||||||||
| December 31, 2018 | Carrying | Estimated | Quoted Prices | Significant Other Observable Inputs | Significant Unobservable Inputs | |||||||||||||||
| ($ in thousands) | Amount | Fair Value | (Level 1) | (Level 2) | (Level 3) | |||||||||||||||
| Financial Instruments: | ||||||||||||||||||||
| Assets: | ||||||||||||||||||||
| Cash and cash equivalents | $ | 159,107 | $ | 159,107 | $ | 159,107 | $ | - | $ | - | ||||||||||
| Securities available-for-sale | 492,224 | 492,224 | - | 483,776 | 8,448 | |||||||||||||||
| Securities held-to-maturity | 6,000 | 7,028 | - | 7,028 | - | |||||||||||||||
| Loans, net | 2,055,195 | 2,020,782 | - | - | 2,020,782 | |||||||||||||||
| Accrued interest receivable | 10,778 | 10,778 | - | 2,673 | 8,105 | |||||||||||||||
| Liabilities: | ||||||||||||||||||||
| Non-interest-bearing deposits | $ | 570,148 | $ | 570,148 | $ | - | $ | 570,148 | $ | - | ||||||||||
| Interest-bearing deposits | 1,887,311 | 1,855,637 | - | 1,855,637 | - | |||||||||||||||
| Subordinated debentures | 80,521 | 76,986 | - | - | 76,986 | |||||||||||||||
| FHLB and other borrowings | 85,500 | 85,500 | - | 85,500 | - | |||||||||||||||
| Accrued interest payable | 1,519 | 1,519 | - | 1,519 | - | |||||||||||||||
Pursuant to the terms of a letter agreement between the Company and the United States Department of the Treasury (“Treasury”), the Company issued 17,123 CDCI Preferred Shares.
The Letter Agreement contains limitations on the payment of dividends on the common stock to no more than 100% of the aggregate per share dividend and distributions for the immediate prior fiscal year (dividends were declared and paid in 2011 through 2016) and on the Company’s ability to repurchase its common stock in the event of a non-payment of our dividend, and continues to subject the Company to certain of the executive compensation limitations included in the Emergency Economic Stabilization Act of 2008 (EESA), as previously disclosed by the Company. The CDCI Preferred Shares entitle the holder to an annual dividend of 2% for 8 years of the liquidation value of the shares, payable quarterly in arrears.
On May 13, 2015, The First Bancshares, Inc. (the “Company”) entered into a Letter Agreement (the “Letter Agreement”), with the United States Department of the Treasury (“Treasury”), pursuant to which the Company redeemed the Warrant to purchase up to 54,705 shares of the Company’s common stock, no par value per share (the “Common Stock”) issued to Treasury on February 6, 2009 under the Capital Purchase Program. In connection with this redemption, on May 13, 2015, the Company paid Treasury an aggregate redemption price of $302,410.NOTE S - REVENUE FROM CONTRACTS WITH CUSTOMERS
On December 6, 2016,January 1, 2018, the Company repurchased all 17,123 sharesadopted ASU No. 2014-09, Revenue from Contracts with Customers. ASU 2014-09 implements a common revenue standard that clarifies the principles for recognizing revenue. The core principle of its CDCI Preferred Shares at fair market valueASU 2014-09 is that an entity should recognize revenue to depict the transfer of $15,925,000,promised goods or services to customers in an amount that reflects the consideration to which equatedthe entity expects to be entitled in exchange for those goods or services. To achieve that core principle, an entity should apply the following steps: (i) identify the contract(s) with a discount of 7%customer, (ii) identify the performance obligations in the contract; (iii) determine the transaction price, (iv) allocate the transaction price to par, or $1,198,000.the performance obligations in the contract and (v) recognize revenue when (or as) the entity satisfies a performance obligation.
On October 14, 2016,The Company concluded that there was no change to the timing and pattern of revenue recognition for its current revenue streams or the presentation of revenue as gross versus net. No adjustment to retained earnings was required on the adoption date. Because there was no change to the timing and pattern of revenue recognition, there were no material changes to the Company’s processes and internal controls.
All of the Company’s revenue from contracts with customers within the scope of ASC 606 is recognized within non-interest income. The guidance does not apply to revenue associated with financial instruments, including loans and investment securities that are accounted for under other GAAP, which comprise a significant portion of our revenue stream. A description of the Company’s revenue streams accounted for under ASC 606 is as follows:
Service Charges on Deposit Accounts: The Company earns fees from deposit customers for transaction-based, account maintenance, and overdraft services. Transaction-based fees, which include services such as ATM use fees, stop payment charges, statement rendering, and ACH fees, are recognized at the time the transaction is executed at the point in the time the Company issued 3,563,380 sharesfulfills the customer’s request. Account maintenance fees, which relate primarily to monthly maintenance, are earned over the course of Series E Convertible Preferred Stocka month, representing the period over which the Company satisfies the performance obligation. Overdraft fees are recognized at $17.75 per sharethe point in time that the overdraft occurs. Service charges on deposits are withdrawn from the customer’s account balance.
Interchange Income: The Company earns interchange fees from debit and credit card holder transaction conducted through various payment networks. Interchange fees from cardholder transactions represent a private placement offeringpercentage of the underlying transaction value and received approximately $59,744,000 in net proceeds after offering expenses of $3,506,000. The net proceeds from this private placement were used to finance the Iberville Bank acquisition and pay related expenses, to support our capital ratios in connectionare recognized daily, concurrently with the Iberville Bank acquisition and Gulf Coast Community Bank acquisition, and for general corporate purposes. All 3,563,380 sharestransaction processing services provided by the cardholder.
Gains/Losses on Sales of OREO: The Company records a gain or loss from the sale of OREO when control of the Series E Convertible Preferred Stock were converted into 3,563,380 sharesproperty transfers to the buyer, which generally occurs at the time of common stockan executed deed. When the Company finances the sale of OREO to the buyer, the Company assesses whether the buyer is committed to perform their obligations under the contract and whether the collectability of the transaction prices is probable. Once these criteria are met, the OREO asset is derecognized and the gain or loss on January 4, 2017, following shareholder approval. Dividends were declared and paidsale is recorded upon the transfer of control of the property to the buyer. In determining the gain or loss on the Series E Convertible Preferred Stock.sale, the Company adjusts the transaction price and related gain (loss) on sale if a significant financing component is present.
| 102 |
All of the Company’s revenue from contracts with customers in the scope of ASC 606 is recognized within non-interest income. The following table presents the Company’s sources of non-interest income for December 31, 2019 and 2018. Items outside the scope of ASC 606 are noted as such.
| Year Ended December 31, 2019 | ||||||||||||||||
| Commercial/ | Mortgage | |||||||||||||||
| Revenue by Operating Segments | Retail | Banking | Holding | |||||||||||||
| ($ in thousands) | Bank | Division | Company | Total | ||||||||||||
| Non-interest income | ||||||||||||||||
| Service charges on deposits | ||||||||||||||||
| Overdraft fees | $ | 4,277 | $ | 1 | $ | - | $ | 4,278 | ||||||||
| Other | 3,558 | 2 | - | 3,560 | ||||||||||||
| Interchange income | 8,024 | - | - | 8,024 | ||||||||||||
| Investment brokerage fees | 83 | - | - | 83 | ||||||||||||
| Net gains (losses) on OREO | (144 | ) | - | - | (144 | ) | ||||||||||
| Net gains (losses) on sales of securities (a) | 122 | - | - | 122 | ||||||||||||
| Other | 3,977 | 5,985 | 1,062 | 11,024 | ||||||||||||
| Total non-interest income | $ | 19,897 | $ | 5,988 | $ | 1,062 | $ | 26,947 | ||||||||
| Year Ended December 31, 2018 | ||||||||||||||||
| Commercial/ | Mortgage | |||||||||||||||
| Retail | Banking | Holding | ||||||||||||||
| ($ in thousands) | Bank | Division | Company | Total | ||||||||||||
| Non-interest income | ||||||||||||||||
| Service charges on deposits | ||||||||||||||||
| Overdraft fees | $ | 3,306 | $ | 2 | $ | - | $ | 3,308 | ||||||||
| Other | 2,483 | 2 | - | 2,485 | ||||||||||||
| Interchange income | 5,247 | - | - | 5,247 | ||||||||||||
| Investment brokerage fees | 43 | - | - | 43 | ||||||||||||
| Net (losses) gains on OREO | 60 | - | - | 60 | ||||||||||||
| Net gains on sale of loans (a) | 33 | - | - | 33 | ||||||||||||
| Net gains (losses) on sales of securities (a) | 334 | - | - | 334 | ||||||||||||
| Other | 3,142 | 4,044 | 1,865 | 9,051 | ||||||||||||
| Total non-interest income | $ | 14,648 | $ | 4,048 | $ | 1,865 | $ | 20,561 | ||||||||
| (a) | Not within scope of ASC 606 |
NOTE T – SUBSEQUENT EVENTS
Subsequent events have been evaluated by management through the date the financial statements were issued.
On March 1, 2018, the Company completed its acquisition of Southwest Banc Shares, Inc., (“Southwest”), and immediately thereafter merged First Community Bank with and into The First. The Company paid a total consideration of approximately $60.0 million in stock and cash. At December 31, 2017, First Community Bank had $400.6 million in total assets.
In connection with the acquisition, preliminarily, the Company expects to record approximately $26.3 million of goodwill and $3.3 million of core deposit intangible. The core deposit intangible is to be expensed over 10 years.
The Company acquired the $278 million loan portfolio at an estimated fair value discount of $4.4 million. The discount represents expected credit losses, adjusted for market interest rates and liquidity adjustments.
Expenses associated with the acquisition were $3.6 million for the twelve month period ended December 31, 2017. These costs included charges associated with due diligence as well as legal and consulting expenses, which have been expensed as incurred.
The following unaudited pro-forma financial information for the year ended December 31, 2017, gives effect to the acquisition as if the acquisition had occurred on January 1, 2017. The pro-forma financial information is not necessarily indicative of the results of operations had the acquisition been effective as of this date.
| (In thousands) | Pro-Forma | |||
| December 31, 2017 | ||||
| (unaudited) | ||||
| Net interest income | $ | 73,250 | ||
| Non-interest income | 17,481 | |||
| Total revenue | 90,731 | |||
| Income before income taxes | $ | 17,930 | ||
Supplemental pro-forma earnings for 2017 were adjusted to exclude acquisition costs incurred during 2017.
To fund the cash portion of the purchase price for the Company’s announced acquisition of Southwest, to fund other potential future acquisitions, and for general corporate purposes, including the repayment of debt and to support organic growth, the Company completed a sale in October, 2017, of an aggregate of 2,012,500 shares of its common stock in a public offering. Net proceeds after underwriting discounts and estimated expenses were approximately $55.2 million.
On December 6, 2017, the Company entered into an Agreement and Plan of Merger with Sunshine Financial, Inc. (“Sunshine”), parent company of Sunshine Community Bank, whereby Sunshine will be merged with and into the Company (the “Sunshine Merger”). Sunshine’s wholly owned subsidiary bank, Sunshine Community Bank, (“Sunshine Community Bank”) will be merged with and into The First immediately following the Sunshine Merger. At December 31, 2017, Sunshine Community Bank had total assets of approximately $200.7 million. This transaction is expected to close in the second quarter of 2018, subject to shareholder approval. Regulatory approval was received February 27, 2018.
NOTE U - PARENT COMPANY FINANCIAL INFORMATION
The balance sheets, statements of income and cash flows for The First Bancshares, Inc. (parent company only) follow.
Condensed Balance Sheets
| December 31, | December 31, | |||||||||||||||
| 2017 | 2016 | |||||||||||||||
| ($ in thousands) | 2019 | 2018 | ||||||||||||||
| Assets: | ||||||||||||||||
| Cash and cash equivalents | $ | 20,435,721 | $ | 69,158 | $ | 5,941 | $ | 3,081 | ||||||||
| Investment in subsidiary bank | 226,648,005 | 179,541,693 | 616,807 | 434,352 | ||||||||||||
| Investments in statutory trusts | 310,000 | 310,000 | 496 | 496 | ||||||||||||
| Bank owned life insurance | 4,200 | 4,087 | ||||||||||||||
| Other | 1,480,791 | 1,112,514 | 2,292 | 2,927 | ||||||||||||
| $ | 248,874,517 | $ | 181,033,365 | $ | 629,736 | $ | 444,943 | |||||||||
| Liabilities and Stockholders’ Equity: | ||||||||||||||||
| Subordinated debentures | $ | 10,310,000 | $ | 10,310,000 | $ | 80,678 | $ | 80,521 | ||||||||
| Advances from First Tennessee Bank | 16,000,000 | 16,000,000 | ||||||||||||||
| Advances from First Horizon Bank | 5,354 | - | ||||||||||||||
| Other | 96,597 | 196,658 | 46 | 1,168 | ||||||||||||
| Stockholders’ equity | 222,467,920 | 154,526,707 | 543,658 | 363,254 | ||||||||||||
| $ | 248,874,517 | $ | 181,033,365 | $ | 629,736 | $ | 444,943 | |||||||||
Condensed Statements of Income
| Years Ended December 31, | Years Ended December 31, | |||||||||||||||||||||||
| 2017 | 2016 | 2015 | ||||||||||||||||||||||
| ($ in thousands) | 2019 | 2018 | 2017 | |||||||||||||||||||||
| Income: | ||||||||||||||||||||||||
| Interest and dividends | $ | 8,296 | $ | 6,680 | $ | 5,573 | $ | 26 | $ | 11 | $ | 8 | ||||||||||||
| Dividend income | 3,675,000 | 2,875,000 | 1,650,000 | 50,390 | 13,889 | 3,675 | ||||||||||||||||||
| Other | 51,030 | - | - | 1,062 | 1,865 | 51 | ||||||||||||||||||
| 3,734,326 | 2,881,680 | 1,655,573 | 51,478 | 15,765 | 3,734 | |||||||||||||||||||
| Expenses: | ||||||||||||||||||||||||
| Interest on borrowed funds | 859,823 | 222,152 | 185,351 | 4,918 | 3,454 | 860 | ||||||||||||||||||
| Legal and professional | 1,097,590 | 910,214 | 295,637 | 3,401 | 3,833 | 1,097 | ||||||||||||||||||
| Other | 1,349,143 | 1,240,863 | 833,502 | 2,418 | 1,755 | 1,349 | ||||||||||||||||||
| 3,306,556 | 2,373,229 | 1,314,490 | 10,737 | 9,042 | 3,306 | |||||||||||||||||||
| Income before income taxes and equity in undistributed income of subsidiary | 427,770 | 508,451 | 341,083 | 40,741 | 6,723 | 428 | ||||||||||||||||||
| Income tax benefit | 1,222,012 | 835,757 | 487,853 | 2,291 | 1,496 | 1,222 | ||||||||||||||||||
| Income before equity in undistributed income of Subsidiary | 1,649,782 | 1,344,208 | 828,936 | 43,032 | 8,219 | 1,650 | ||||||||||||||||||
| Equity in undistributed income of subsidiary | 8,966,694 | 8,774,479 | 7,969,766 | 713 | 13,006 | 8,966 | ||||||||||||||||||
| Net income | $ | 10,616,476 | $ | 10,118,687 | $ | 8,798,702 | $ | 43,745 | $ | 21,225 | $ | 10,616 | ||||||||||||
Condensed Statements of Cash Flows
| Years Ended December 31, | ||||||||||||
| 2017 | 2016 | 2015 | ||||||||||
| Cash flows from operating activities: | ||||||||||||
| Net income | $ | 10,616,476 | $ | 10,118,687 | $ | 8,798,702 | ||||||
| Adjustments to reconcile net income to net cash used in operating activities: | ||||||||||||
| Equity in undistributed income of Subsidiary | (8,966,694 | ) | (8,774,479 | ) | (7,969,766 | ) | ||||||
| Restricted stock expense | 866,558 | 772,311 | 721,124 | |||||||||
| Gain on disposition of CVR | (51,030 | ) | - | - | ||||||||
| Other, net | (624,261 | ) | (669,047 | ) | 151,251 | |||||||
| Net cash provided by operating activities | 1,841,049 | 1,447,472 | 1,701,311 | |||||||||
| Cash flows from investing activities: | ||||||||||||
| Investment in subsidiary bank | (35,000,000 | ) | (60,000,000 | ) | - | |||||||
| Outlays for acquisitions | - | - | (35,709 | ) | ||||||||
| Net cash used in investing activities | (35,000,000 | ) | (60,000,000 | ) | (35,709 | ) | ||||||
| Cash flows from financing activities: | ||||||||||||
| Dividends paid on common stock | (1,415,524 | ) | (782,936 | ) | (778,428 | ) | ||||||
| Dividends paid on preferred stock | - | (452,305 | ) | (342,460 | ) | |||||||
| Repurchase of restricted stock for payment of Taxes | (329,587 | ) | (176,112 | ) | (92,390 | ) | ||||||
| Repurchase of warrants | - | - | (302,410 | ) | ||||||||
| Net proceeds from issuance of 3,563,380 shares | - | 59,744,418 | - | |||||||||
| Net proceeds from issuance of 2,012,500 shares | 55,270,625 | |||||||||||
| Repayment of CDCI Preferred Shares | - | (15,925,000 | ) | - | ||||||||
| Proceeds of borrowed funds | - | 16,000,000 | - | |||||||||
| Net cash provided by (used in) financing Activities | 53,525,514 | 58,408,065 | (1,515,688 | ) | ||||||||
| Net increase (decrease) in cash and cash Equivalents | 20,366,563 | (144,463 | ) | 149,914 | ||||||||
| Cash and cash equivalents at beginning of year | 69,158 | 213,621 | 63,707 | |||||||||
| Cash and cash equivalents at end of year | $ | 20,435,721 | $ | 69,158 | $ | 213,621 | ||||||
| Years Ended December 31, | ||||||||||||
| ($ in thousands) | 2019 | 2018 | 2017 | |||||||||
| Cash flows from operating activities: | ||||||||||||
| Net income | $ | 43,745 | $ | 21,225 | $ | 10,616 | ||||||
| Adjustments to reconcile net income to net cash used in operating activities: | ||||||||||||
| Equity in undistributed income of Subsidiary | (713 | ) | (13,006 | ) | (8,966 | ) | ||||||
| Restricted stock expense | 1,661 | 1,154 | 867 | |||||||||
| Gain on disposition of CVR | - | - | (51 | ) | ||||||||
| Other, net | 1,185 | 1,364 | (625 | ) | ||||||||
| Net cash provided by operating activities | 45,878 | 10,737 | 1,841 | |||||||||
| Cash flows from investing activities: | ||||||||||||
| Investment in subsidiary bank | - | (27,000 | ) | (35,000 | ) | |||||||
| Net outlays for acquisitions | (32,363 | ) | (47,041 | ) | - | |||||||
| Net cash used in investing activities | (32,363 | ) | (74,041 | ) | (35,000 | ) | ||||||
| Cash flows from financing activities: | ||||||||||||
| Dividends paid on common stock | (5,190 | ) | (2,557 | ) | (1,416 | ) | ||||||
| Repurchase of restricted stock for payment of taxes | (63 | ) | (23 | ) | (329 | ) | ||||||
| Common stock repurchased | (5,229 | ) | - | - | ||||||||
| Net proceeds from issuance of 2,012,500 shares | - | (237 | ) | 55,271 | ||||||||
| Proceeds (repayment) of borrowed funds | (173 | ) | (16,000 | ) | - | |||||||
| Issuance of subordinated debt | - | 64,766 | - | |||||||||
| Net cash provided by (used in) financing Activities | (10,655 | ) | 45,949 | 53,526 | ||||||||
| Net increase(decrease) in cash and cash equivalents | 2,860 | (17,355 | ) | 20,367 | ||||||||
| Cash and cash equivalents at beginning of year | 3,081 | 20,436 | 69 | |||||||||
| Cash and cash equivalents at end of year | $ | 5,941 | $ | 3,081 | $ | 20,436 | ||||||
NOTE V - OPERATING SEGMENTS
The Company is considered to have three principal business segments in 2017, 2016,2019, 2018, and 2015,2017, the Commercial/Retail Bank, the Mortgage Banking Division, and the Holding Company. (In thousands)
| Year Ended December 31, 2017 | Year Ended December 31, 2019 | |||||||||||||||||||||||||||||||
| Commercial/ | Mortgage | Commercial/ | Mortgage | |||||||||||||||||||||||||||||
| Retail | Banking | Holding | Retail | Banking | Holding | |||||||||||||||||||||||||||
| Bank | Division | Company | Total | |||||||||||||||||||||||||||||
| ($ in thousands) | Bank | Division | Company | Total | ||||||||||||||||||||||||||||
| Interest income | $ | 65,118 | $ | 943 | $ | 8 | $ | 66,069 | $ | 147,500 | $ | 1,003 | $ | 26 | $ | 148,529 | ||||||||||||||||
| Interest expense | 6,048 | 1 | 860 | 6,909 | 21,388 | 417 | 4,918 | 26,723 | ||||||||||||||||||||||||
| Net interest income (loss) | 59,070 | 942 | (852 | ) | 59,160 | 126,112 | 586 | (4,892 | ) | 121,806 | ||||||||||||||||||||||
| Provision (credit) for loan losses | 475 | 31 | - | 506 | 3,781 | (43 | ) | - | 3,738 | |||||||||||||||||||||||
| Net interest income (loss) after provision for loan losses | 58,595 | 911 | (852 | ) | 58,654 | 122,331 | 629 | (4,892 | ) | 118,068 | ||||||||||||||||||||||
| Non-interest income | 9,807 | 4,505 | 51 | 14,363 | 19,897 | 5,988 | 1,062 | 26,947 | ||||||||||||||||||||||||
| Non-interest expense | 49,143 | 3,857 | 2,446 | 55,446 | 78,440 | 4,310 | 5,819 | 88,569 | ||||||||||||||||||||||||
| Income (loss) before income taxes | 19,259 | 1,559 | (3,247 | ) | 17,571 | 63,914 | 2,181 | (9,649 | ) | 56,446 | ||||||||||||||||||||||
| Income tax (benefit) expense | 7,740 | 437 | (1,222 | ) | 6,955 | 14,595 | 490 | (2,384 | ) | 12,701 | ||||||||||||||||||||||
| Net income (loss) | $ | 11,519 | $ | 1,122 | $ | (2,025 | ) | $ | 10,616 | $ | 49,319 | $ | 1,691 | $ | (7,265 | ) | $ | 43,745 | ||||||||||||||
| Total Assets | $ | 1,758,778 | $ | 32,234 | $ | 22,226 | $ | 1,813,238 | $ | 3,902,703 | $ | 26,231 | $ | 12,929 | $ | 3,941,863 | ||||||||||||||||
| Net Loans | 1,196,365 | 25,443 | - | 1,221,808 | 2,584,385 | 12,875 | - | 2,597,260 | ||||||||||||||||||||||||
| Year Ended December 31, 2016 | ||||||||||||||||
| Commercial/ | Mortgage | |||||||||||||||
| Retail | Banking | Holding | ||||||||||||||
| Bank | Division | Company | Total | |||||||||||||
| Interest income | $ | 43,785 | $ | 812 | $ | 7 | $ | 44,604 | ||||||||
| Interest expense | 3,679 | 414 | 222 | 4,315 | ||||||||||||
| Net interest income (loss) | 40,106 | 398 | (215 | ) | 40,289 | |||||||||||
| Provision (credit) for loan losses | 667 | (42 | ) | - | 625 | |||||||||||
| Net interest income (loss) after provision for loan losses | 39,439 | 440 | (215 | ) | 39,664 | |||||||||||
| Non-interest income | 6,989 | 4,258 | - | 11,247 | ||||||||||||
| Non-interest expense | 31,369 | 3,342 | 2,151 | 36,862 | ||||||||||||
| Income (loss) before income taxes | 15,059 | 1,356 | (2,366 | ) | 14,049 | |||||||||||
| Income tax (benefit) expense | 4,386 | 380 | (836 | ) | 3,930 | |||||||||||
| Net income (loss) | $ | 10,673 | $ | 976 | $ | (1,530 | ) | $ | 10,119 | |||||||
| Total Assets | $ | 1,254,476 | $ | 21,400 | $ | 1,491 | $ | 1,277,367 | ||||||||
| Net Loans | 851,947 | 13,477 | - | 865,424 | ||||||||||||
| Year Ended December 31, 2015 | ||||||||||||||||
| Commercial/ | Mortgage | |||||||||||||||
| Retail | Banking | Holding | ||||||||||||||
| Bank | Division | Company | Total | |||||||||||||
| Interest income | $ | 39,422 | $ | 774 | $ | 6 | $ | 40,202 | ||||||||
| Interest expense | 2,727 | 296 | 185 | 3,208 | ||||||||||||
| Net interest income (loss) | 36,695 | 478 | (179 | ) | 36,994 | |||||||||||
| Provision for loan losses | 410 | - | - | 410 | ||||||||||||
| Net interest income (loss) after provision for loan losses | 36,285 | 478 | (179 | ) | 36,584 | |||||||||||
| Non-interest income | 6,513 | 1,075 | - | 7,588 | ||||||||||||
| Non-interest expense | 29,786 | 1,245 | 1,129 | 32,160 | ||||||||||||
| Income (loss) before income taxes | 13,012 | 308 | (1,308 | ) | 12,012 | |||||||||||
| Income tax (benefit) expense | 3,618 | �� | 82 | (487 | ) | 3,213 | ||||||||||
| Net income (loss) | $ | 9,394 | $ | 226 | $ | (821 | ) | $ | 8,799 | |||||||
| Total Assets | $ | 1,123,240 | $ | 20,681 | $ | 1,210 | $ | 1,145,131 | ||||||||
| Net Loans | 755,077 | 14,665 | - | 769,742 | ||||||||||||
| Year Ended December 31, 2018 | ||||||||||||||||
| Commercial/ | Mortgage | |||||||||||||||
| Retail | Banking | Holding | ||||||||||||||
| ($ in thousands) | Bank | Division | Company | Total | ||||||||||||
| Interest income | $ | 98,758 | $ | 1,209 | $ | 11 | $ | 99,978 | ||||||||
| Interest expense | 11,113 | 524 | 3,454 | 15,091 | ||||||||||||
| Net interest income (loss) | 87,645 | 685 | (3,443 | ) | 84,887 | |||||||||||
| Provision (credit) for loan losses | 2,259 | (139 | ) | - | 2,120 | |||||||||||
| Net interest income (loss) after provision for loan losses | 85,386 | 824 | (3,443 | ) | 82,767 | |||||||||||
| Non-interest income | 14,648 | 4,048 | 1,865 | 20,561 | ||||||||||||
| Non-interest expense | 66,875 | 3,848 | 5,588 | 76,311 | ||||||||||||
| Income (loss) before income taxes | 33,159 | 1,024 | (7,166 | ) | 27,017 | |||||||||||
| Income tax (benefit) expense | 7,034 | 254 | (1,496 | ) | 5,792 | |||||||||||
| Net income (loss) | $ | 26,125 | $ | 770 | $ | (5,670 | ) | $ | 21,225 | |||||||
| Total Assets | $ | 2,969,560 | $ | 23,865 | $ | 10,592 | $ | 3,003,986 | ||||||||
| Net Loans | 2,038,395 | 16,799 | - | 2,055,195 | ||||||||||||
| Year Ended December 31, 2017 | ||||||||||||||||
| Commercial/ | Mortgage | |||||||||||||||
| Retail | Banking | Holding | ||||||||||||||
| ($ in thousands) | Bank | Division | Company | Total | ||||||||||||
| Interest income | $ | 65,118 | $ | 943 | $ | 8 | $ | 66,069 | ||||||||
| Interest expense | 6,048 | 1 | 860 | 6,909 | ||||||||||||
| Net interest income (loss) | 59,070 | 942 | (852 | ) | 59,160 | |||||||||||
| Provision (credit) for loan losses | 475 | 31 | - | 506 | ||||||||||||
| Net interest income (loss) after provision for loan losses | 58,595 | 911 | (852 | ) | 58,654 | |||||||||||
| Non-interest income | 9,807 | 4,505 | 51 | 14,363 | ||||||||||||
| Non-interest expense | 49,143 | 3,857 | 2,446 | 55,446 | ||||||||||||
| Income (loss) before income taxes | 19,259 | 1,559 | (3,247 | ) | 17,571 | |||||||||||
| Income tax (benefit) expense | 7,740 | 437 | (1,222 | ) | 6,955 | |||||||||||
| Net income (loss) | $ | 11,519 | $ | 1,122 | $ | (2,025 | ) | $ | 10,616 | |||||||
| Total Assets | $ | 1,758,778 | $ | 32,234 | $ | 22,226 | $ | 1,813,238 | ||||||||
| Net Loans | 1,196,365 | 25,443 | - | 1,221,808 | ||||||||||||
| 106 |
NOTE W - SUMMARY OF QUARTERLY RESULTS OF OPERATIONS AND PER SHARE
AMOUNTS (UNAUDITED)
| ($ in thousands, except per share amounts) | March 31 | June 30 | Sept. 30 | Dec. 31 | ||||||||||||||||||||||||||||
| 2019 | ||||||||||||||||||||||||||||||||
| Total interest income | $ | 33,273 | $ | 37,571 | $ | 37,241 | $ | 40,444 | ||||||||||||||||||||||||
| Total interest expense | 6,142 | 6,799 | 6,782 | 7,000 | ||||||||||||||||||||||||||||
| Net interest income | $ | 27,131 | $ | 30,772 | $ | 30,459 | $ | 33,444 | ||||||||||||||||||||||||
| Provision for loan losses | 1,123 | 791 | 974 | 850 | ||||||||||||||||||||||||||||
| Net interest income after provision for loan losses | 26,008 | 29,981 | 29,485 | 32,594 | ||||||||||||||||||||||||||||
| Total non-interest income | 5,554 | 6,716 | 7,103 | 7,574 | ||||||||||||||||||||||||||||
| Total non-interest expense | 21,893 | 20,891 | 20,825 | 24,960 | ||||||||||||||||||||||||||||
| Income tax expense | 2,034 | 3,823 | 3,491 | 3,353 | ||||||||||||||||||||||||||||
| Net income available to common stockholders | $ | 7,635 | $ | 11,983 | $ | 12,272 | $ | 11,855 | ||||||||||||||||||||||||
| Per common share: | ||||||||||||||||||||||||||||||||
| Net income, basic | $ | 0.48 | $ | 0.69 | $ | 0.71 | $ | 0.64 | ||||||||||||||||||||||||
| Net income, diluted | 0.63 | 0.70 | 0.74 | 0.72 | ||||||||||||||||||||||||||||
| Cash dividends declared | 0.07 | 0.08 | 0.08 | 0.08 | ||||||||||||||||||||||||||||
| Three Months Ended | ||||||||||||||||||||||||||||||||
| March 31 | June 30 | Sept. 30 | Dec. 31 | |||||||||||||||||||||||||||||
| 2018 | ||||||||||||||||||||||||||||||||
| Total interest income | $ | 18,758 | $ | 25,037 | $ | 25,628 | $ | 30,555 | ||||||||||||||||||||||||
| Total interest expense | 2,379 | 3,468 | 3,959 | 5,285 | ||||||||||||||||||||||||||||
| Net interest income | $ | 16,379 | $ | 21,569 | $ | 21,669 | $ | 25,270 | ||||||||||||||||||||||||
| Provision for loan losses | 277 | 857 | 412 | 574 | ||||||||||||||||||||||||||||
| Net interest income after provision for loan losses | 16,102 | 20,712 | 21,257 | 24,696 | ||||||||||||||||||||||||||||
| Total non-interest income | 3,459 | 5,632 | 5,074 | 6,396 | ||||||||||||||||||||||||||||
| Total non-interest expense | 14,596 | 19,680 | 19,786 | 22,249 | ||||||||||||||||||||||||||||
| Income tax expense | 1,008 | 1,419 | 1,383 | 1,982 | ||||||||||||||||||||||||||||
| Net income available to common stockholders | $ | 3,957 | $ | 5,245 | $ | 5,162 | $ | 6,861 | ||||||||||||||||||||||||
| Per common share: | ||||||||||||||||||||||||||||||||
| Net income, basic | $ | 0.34 | $ | 0.40 | $ | 0.39 | $ | 0.48 | ||||||||||||||||||||||||
| Net income, diluted | 0.34 | 0.40 | 0.39 | 0.48 | ||||||||||||||||||||||||||||
| Cash dividends declared | 0.05 | 0.05 | 0.05 | 0.05 | ||||||||||||||||||||||||||||
| (In thousands, except per share amounts) | ||||||||||||||||||||||||||||||||
| 2017 | ||||||||||||||||||||||||||||||||
| Total interest income | $ | 15,753 | $ | 16,464 | $ | 16,708 | $ | 17,143 | $ | 15,753 | $ | 16,464 | $ | 16,708 | $ | 17,143 | ||||||||||||||||
| Total interest expense | 1,585 | 1,629 | 1,773 | 1,922 | 1,585 | 1,629 | 1,773 | 1,922 | ||||||||||||||||||||||||
| Net interest income | 14,168 | 14,835 | 14,935 | 15,221 | 14,168 | 14,835 | 14,935 | 15,221 | ||||||||||||||||||||||||
| Provision for loan losses | 46 | 248 | 90 | 122 | 46 | 248 | 90 | 122 | ||||||||||||||||||||||||
| Net interest income after provision for loan losses | 14,122 | 14,587 | 14,845 | 15,099 | 14,122 | 14,587 | 14,845 | 15,099 | ||||||||||||||||||||||||
| Total non-interest income | 3,391 | 3,757 | 3,658 | 3,556 | 3,391 | 3,757 | 3,658 | 3,556 | ||||||||||||||||||||||||
| Total non-interest expense | 16,095 | 15,070 | 11,888 | 12,390 | 16,095 | 15,070 | 11,888 | 12,390 | ||||||||||||||||||||||||
| Income tax expense | 296 | 908 | 1,901 | 3,851 | 296 | 908 | 1,901 | 3,851 | ||||||||||||||||||||||||
| Net income applicable to common Stockholders | $ | 1,122 | $ | 2,366 | $ | 4,714 | $ | 2,414 | ||||||||||||||||||||||||
| Net income available to common stockholders | $ | 1,122 | $ | 2,366 | $ | 4,714 | $ | 2,414 | ||||||||||||||||||||||||
| Per common share: | ||||||||||||||||||||||||||||||||
| Net income, basic | $ | .12 | $ | .26 | $ | .52 | $ | .23 | $ | 0.12 | $ | 0.26 | $ | 0.52 | $ | 0.23 | ||||||||||||||||
| Net income, diluted | .12 | .26 | .51 | .23 | 0.12 | 0.26 | 0.51 | 0.23 | ||||||||||||||||||||||||
| Cash dividends declared | .0375 | .0375 | .0375 | .0375 | 0.0375 | 0.0375 | 0.0375 | 0.0375 | ||||||||||||||||||||||||
| 2016 | ||||||||||||||||||||||||||||||||
| Total interest income | $ | 10,596 | $ | 10,871 | $ | 11,269 | $ | 11,868 | ||||||||||||||||||||||||
| Total interest expense | 922 | 1,016 | 1,202 | 1,176 | ||||||||||||||||||||||||||||
| Net interest income | 9,674 | 9,855 | 10,067 | 10,692 | ||||||||||||||||||||||||||||
| Provision for loan losses | 190 | 204 | 143 | 88 | ||||||||||||||||||||||||||||
| Net interest income after provision for loan losses | 9,484 | 9,651 | 9,924 | 10,604 | ||||||||||||||||||||||||||||
| Total non-interest income | 2,484 | 2,961 | 3,099 | 2,705 | ||||||||||||||||||||||||||||
| Total non-interest expense | 8,395 | 8,921 | 9,416 | 10,132 | ||||||||||||||||||||||||||||
| Income tax expense | 969 | 1,042 | 1,049 | 870 | ||||||||||||||||||||||||||||
| Net income | 2,604 | 2,649 | 2,558 | 2,307 | ||||||||||||||||||||||||||||
| Preferred dividends | 85 | 86 | 86 | 195 | ||||||||||||||||||||||||||||
| Net income applicable to common Stockholders | $ | 2,519 | $ | 2,563 | $ | 2,472 | $ | 2,112 | ||||||||||||||||||||||||
| Per common share: | ||||||||||||||||||||||||||||||||
| Net income, basic | $ | .47 | $ | .47 | $ | .46 | $ | .39 | ||||||||||||||||||||||||
| Net income, diluted | .46 | .47 | .45 | .26 | ||||||||||||||||||||||||||||
| Cash dividends declared | .0375 | .0375 | .0375 | .0375 | ||||||||||||||||||||||||||||
| 2015 | ||||||||||||||||
| Total interest income | $ | 9,683 | $ | 10,022 | $ | 10,080 | $ | 10,417 | ||||||||
| Total interest expense | 804 | 806 | 793 | 804 | ||||||||||||
| Net interest income | 8,879 | 9,216 | 9,287 | 9,613 | ||||||||||||
| Provision for loan losses | 150 | - | 250 | 10 | ||||||||||||
| Net interest income after provision for loan losses | 8,729 | 9,216 | 9,037 | 9,603 | ||||||||||||
| Total non-interest income | 1,850 | 1,854 | 1,982 | 1,903 | ||||||||||||
| Total non-interest expense | 7,818 | 8,092 | 7,977 | 8,275 | ||||||||||||
| Income tax expense | 732 | 793 | 815 | 873 | ||||||||||||
| Net income | 2,029 | 2,185 | 2,227 | 2,358 | ||||||||||||
| Preferred dividends and stock accretion | 85 | 86 | 86 | 85 | ||||||||||||
| Net income applicable to common Stockholders | $ | 1,944 | $ | 2,099 | $ | 2,141 | $ | 2,273 | ||||||||
| Per common share: | ||||||||||||||||
| Net income, basic | $ | .36 | $ | .39 | $ | .40 | $ | .42 | ||||||||
| Net income, diluted | .36 | .39 | .39 | .42 | ||||||||||||
| Cash dividends declared | .0375 | .0375 | .0375 | .0375 |
| ITEM 9. | CHANGES IN AND DISAGREEMENTS WITH ACCOUNTANTS ON ACCOUNTING AND FINANCIAL DISCLOSURE |
None.
| ITEM 9A. | CONTROLS AND PROCEDURES |
ITEM 9A. CONTROLS AND PROCEDURES
Evaluation of Disclosure Controls and Procedures
The Company’s principal executive officermanagement, under the supervision of and principal financial officer have concluded, based upon theirwith the participation of the Chief Executive Officer and Chief Financial Officer, conducted an evaluation of the Company’s “disclosuredisclosure controls and procedures” (asprocedures as defined in Rules 13a-15(e) and 15d-15(e) under the Securities Exchange Act of 1934) as of December 31, 2017, that the Company’s disclosure controls and procedures were effective in recording, processing, summarizing and reporting, on a timely basis, information required to be disclosed by us in the reports that we file or submit under the Securities Exchange Act of 1934, as amended (the “Exchange Act”) as of December 31, 2019. Disclosure controls and were effective in ensuringprocedures are controls and procedures designed to ensure that information required to be disclosed by us in the reports that we filefiled or submitsubmitted under the Exchange Act is recorded, processed, summarized and reported within the time periods specified in the rules and forms of the SEC, and that such information is accumulated and communicated to the Company'sour management, including our Chief Executive Officer and our Chief Financial Officer, as appropriate, to allow timely decisions regarding required disclosure.
During Based on that evaluation, the quarter ended December 31, 2017, noChief Executive Officer and the Chief Financial Officer have concluded that the Company’s disclosure controls and procedures were effective as of the end of the period covered by this report. No changes have occurred inwere made to the Company’s internal controlcontrols over financial reporting (as defined in Rules 13a-15(e) and 15d-15(f)Rule 13a-15(f) under the Securities Exchange Act)Act of 1934) during the last fiscal quarter that have materially affected or are reasonably likely to materially affect, the Company’s internal control over financial reporting.
The First Bancshares, Inc.
Management’s Report on Internal Control Overover Financial Reporting
Management of the Company is responsible for establishing and maintaining effective “internalinternal control over financial reporting”reporting (as defined in Rule 13a-15(f) or 15d-15(f) under the Securities Exchange Act of 1934).Act. Internal control over financial reporting is a process designed under the supervision of the Chief Executive Officer and the Chief Financial Officer to provide reasonable assurance regarding the reliability of financial reporting and the preparation of financial statements for external purposes in accordance with U.S. generally accepted accounting principles.
Under the supervision and with the participation of management, including the principal executive officer and principal financial officer, the Company conducted an evaluation of the effectiveness of internal control over financial reporting based on the framework in Internal Control – Integrated Framework issued by the Committee of Sponsoring Organizations of the Treadway Commission (2013 framework). This assessment included controls over the preparation of the schedules equivalent to the basic financial statements in accordance with the instructions for the Consolidated Financial Statements for Bank Holding Companies (Form FR Y-9C) to meet the reporting requirements of Section 112 of the Federal Deposit Insurance Corporation Improvement Act. Based on this evaluation, management of the Company has concluded the Company maintained effective internal control over financial reporting, as such term is defined in Securities Exchange Act of 1934 Rule 13a-15(f), as of December 31, 2017.
Internal control over financial reporting cannot provide absolute assurance of achieving financial reporting objectives because of its inherent limitations. Internal control over financial reporting is a process that involves human diligence and compliance and is subject to lapses in judgment and breakdowns resulting from human failures. Internal control over financial reporting can also be circumvented by collusion or improper management override. Because of such limitations, there is a risk that material misstatements may not be prevented or detected on a timely basis by internal control over financial reporting. These inherent limitations, however, are known features of the financial reporting process. It is possible, therefore, to design into the process safeguards to reduce, though not eliminate, this risk.
T. E. Lott & Company, an independent registered public accounting firm, which audited the Company’s consolidated financial statements included in this Form 10-K, has issued an attestation report on the Company’s internal control over financial reporting, which is included herein.
REPORT OF INDEPENDENT
REGISTERED PUBLIC ACCOUNTING FIRM
To the Board of Directors and Shareholders of
The First Bancshares, Inc.
Hattiesburg, Mississippi
Opinion on Internal Control over Financial Reporting
We have audited the internal control over financial reporting of The First Bancshares, Inc. and subsidiary (the "Company") as of December 31, 2017, based on criteria established inInternal Control ̶ Integrated Framework (2013) issued by the Committee of Sponsoring Organizations of the Treadway Commission (COSO). Because management's assessment and our audit were conducted to meet the reporting requirements of Section 112 of the Federal Deposit Insurance Corporation Improvement Act (FDICIA), management's assessment and our audit of the Company's internal control over financial reporting included controls over the preparation of the schedules equivalent to the basic financial statements in accordance with the instructions for the Consolidated Financial Statements for Bank Holding Companies (Form FR Y-9C). In our opinion, the Company maintained, in all material respects, effective internal control over financial reporting as of December 31, 2017, based on criteria established inInternal Control ̶ Integrated Framework (2013) issued by COSO.
We have not examined and, accordingly, we do not express an opinion or any other form of assurance on management's statement referring to compliance with laws and regulations.
We have also audited, in accordance with the standards of the Public Company Accounting Oversight Board (United States) (PCAOB), the consolidated financial statements as of and for the year ended December 31, 2017, of the Company and our report dated March 16, 2018, expressed an unqualified opinion on those financial statements.
Basis for Opinion
The Company's management is responsible for maintaining effective internal control over financial reporting and for its assessment of the effectiveness of internal control over financial reporting, included in the accompanying Management's Report on Internal Control Over Financial Reporting. Our responsibility is to express an opinion on the Company's internal control over financial reporting based on our audit. We are a public accounting firm registered with the PCAOB and are required to be independent with respect to the Company in accordance with the U.S. federal securities laws and the applicable rules and regulations of the Securities and Exchange Commission and the PCAOB.
We conducted our audit in accordance with the standards of the PCAOB. Those standards require that we plan and perform the audit to obtain reasonable assurance about whether effective internal control over financial reporting was maintained in all material respects. Our audit included obtaining an understanding of internal control over financial reporting, assessing the risk that a material weakness exists, testing and evaluating the design and operating effectiveness of internal control based on the assessed risk, and performing such other procedures as we considered necessary in the circumstances. We believe that our audit provides a reasonable basis for our opinion.
To the Board of Directors and Shareholders of
The First Bancshares, Inc.
Page 2
Definition and Limitations of Internal Control over Financial Reporting
A company's internal control over financial reporting is a process designed to provide reasonable assurance regarding the reliability of financial reporting and the preparation of financial statements for external purposes in accordance with generally accepted accounting principles. A company's internal control over financial reporting includes those policies and procedures that (1) pertain to the maintenance of records that, in reasonable detail, accurately and fairly reflect the transactions and dispositions of the assets of the company; (2) provide reasonable assurance that transactions are recorded as necessary to permit preparation of financial statements in accordance with generally accepted accounting principles, and that receipts and expenditures of the company are being made only in accordance with authorizations of management and directors of the company; and (3) provide reasonable assurance regarding prevention or timely detection of unauthorized acquisition, use, or disposition of the company's assets that could have a material effect on the financial statements.
Because of its inherent limitations, internal control over financial reporting may not prevent or detect misstatements. Also, projectionsAll internal control systems, no matter how well designed, have inherent limitations. Therefore, even those systems determined to be effective can provide only reasonable assurance with respect to financial statement preparation and presentation. Projections of any evaluation of effectiveness to future periods are subject to the risk that controls may become inadequate because of changes in conditions, or that the degree of compliance with the policies or procedures may deteriorate.
The Company’s management, under the supervision of and with the participation of the Chief Executive Officer and Chief Financial Officer, conducted an evaluation of the effectiveness of internal control over financial reporting as of December 31, 2019 based on the framework issued by the Committee of Sponsoring Organizations of the Treadway Commission (COSO) in Internal Control-Integrated Framework (2013). Based on that assessment, our management believes that, as of December 31, 2019, the Company’s internal control over financial reporting was effective based on those criteria.
As permitted by SEC guidance, management has excluded the operations of FPB and FFB from the scope of management’s report on internal control over financial reporting, each of which was acquired during the year ended December 31, 2019. For the year ended December 31, 2019, FPB represented approximately 10.2% of total consolidated assets and 16.6% of total consolidated net income and FFB represented approximately 10.2% of total consolidated assets and 1.9% of total consolidated net income.
This Annual Report on Form 10-K contains an audit report of Crowe LLP, our independent registered public accounting firm, regarding internal control over financial reporting for the fiscal year ended December 31, 2019 pursuant to the rules of the SEC. Their report appears in the section captioned “Report of Independent Registered Public Accounting Firm” included in Part II. Item 8 – Financial Statements and Supplementary Data of this report.
| ITEM 9B. | OTHER INFORMATION |
Not applicable.
ITEM 10. DIRECTORS, EXECUTIVE OFFICER, AND CORPORATE GOVERNANCE
| ITEM 10. | DIRECTORS, EXECUTIVE OFFICERS, AND CORPORATE GOVERNANCE |
Information required by this item is set forth in our definitive proxy materials regarding our Annual Meeting of Shareholders to be held May 24, 2018,28, 2020, which proxy materials will be filed with the SEC on or about April 11, 2018.15, 2020.
ITEM 11. EXECUTIVE COMPENSATION
Information required by this item is set forth in our definitive proxy materials regarding our Annual Meeting of Shareholders to be held May 24, 2018,28, 2020, which proxy materials will be filed with the SEC on or about April 11, 2018.15, 2020.
ITEM 12. SECURITY OWNERSHIP OF CERTAIN BENEFICIAL OWNERS AND MANAGEMENT AND RELATED STOCKHOLDER MATTERS
Information required by this item is set forth in our definitive proxy materials regarding our annual meeting of stockholders to be held May 24, 2018, which proxy materials will be filed with the SEC on or about April 11, 2018.
ITEM 13. CERTAIN RELATIONSHIPS AND RELATED TRANSACTIONS AND DIRECTOR INDEPENDENCE
| ITEM 12. | SECURITY OWNERSHIP OF CERTAIN BENEFICIAL OWNERS AND MANAGEMENT AND RELATED STOCKHOLDER MATTERS |
Information required by this item is set forth in our definitive proxy materials regarding our Annual Meeting of Shareholders to be held May 24, 2018,28, 2020, which proxy materials will be filed with the SEC on or about April 11, 2018.15, 2020.
ITEM 14. PRINCIPAL ACCOUNTANT FEES AND SERVICES
| ITEM 13. | CERTAIN RELATIONSHIPS AND RELATED TRANSACTIONS AND DIRECTOR INDEPENDENCE |
Information required by this item is set forth in our definitive proxy materials regarding our Annual Meeting of Shareholders to be held May 24, 2018,28, 2020, which proxy materials will be filed with the SEC on or about April 11, 2018.15, 2020.
| ITEM 14. | PRINCIPAL ACCOUNTANT FEES AND SERVICES |
Information required by this item is set forth in our definitive proxy materials regarding our Annual Meeting of Shareholders to be held May 28, 2020, which proxy materials will be filed with the SEC on or about April 15, 2020.
ITEM 15. EXHIBITS AND FINANCIAL STATEMENT SCHEDULES
| ITEM 15. | EXHIBITS AND FINANCIAL STATEMENT SCHEDULES |
| (a) | The following documents are filed as part of this Report: |
| 1. | The following consolidated financial statements of The First Bancshares, Inc. and subsidiaries are incorporated as part of this Report under Item 8 – Financial Statements and Supplementary Data. |
Consolidated balance sheets – December 31, 20172019 and 2016 2018
Consolidated statements of income – Years ended December 31, 2017, 2016,2019, 2018, and 20152017
Consolidated statements of cash flows –Years ended December 31, 2017, 2016,2019, 2018, and 20152017
Notes to consolidated financial statements – December 31, 2017, 2016,2019, 2018, and 20152017
| 2. | Consolidated Financial Statement Schedules: |
All schedules have been omitted, as the required information is either inapplicable or included in the Notes to Consolidated Financial Statements.
| 3. | Exhibits required to be filed by Item 601 of Regulation S-K, by Item 15(b) are listed below. |
| (b) | Exhibits: |
All other financial statements and schedules are omitted as the required information is inapplicable or the required information is presented in the consolidated financial statements or related notes.
(a) 3. Exhibits:
| 110 |
| 111 |
| 101.INS | XBRL Instance Document |
| 101.SCH | XBRL Taxonomy Extension Schema Document. |
| 101.CAL | XBRL Taxonomy Extension Calculation Linkbase Document. |
| 101.DEF | XBRL Taxonomy Extension Definition Linkbase Document. |
| 101.LAB | XBRL Taxonomy Extension Label Linkbase Document. |
| 101.PRE | XBRL Taxonomy Extension Presentation Linkbase Document. |
* Filed herewith.
**Furnished herewith.
+ Denotes management contract or compensatory plan or arrangement.
| ITEM 16. | FORM 10-K SUMMARY |
None.
ITEM 16. FORM 10-K SUMMARYSIGNATURES
None.
SIGNATURES
In accordance with Section 13 or 15(d) of the Exchange Act, the registrant caused this report to be signed on its behalf by the undersigned, thereunto duly authorized.
| THE FIRST BANCSHARES, INC. | |||
| Date: March 16, | By: | /s/ M. Ray (Hoppy) Cole, Jr. | |
| M. Ray (Hoppy) Cole, Jr. | |||
| Chief Executive Officer and President (Principal Executive Officer) | |||
| Date: March 16, | By: | ||
| Dee Dee Lowery | |||
| Executive VP and Chief Financial Officer | |||
| (Principal Financial and Principal Accounting Officer) | |||
POWER OF ATTORNEY
KNOW ALL PERSONS BY THESE PRESENTS, that each person whose signature appears below hereby constitutes and appoints M. Ray (Hoppy) Cole, Jr. and Donna T. (Dee Dee) Lowery, with full power to act without the other, his or her true and lawful attorney-in-fact and agent, with full and several powers of substitution and resubsititution, for him or her and in his or her name, place and stead, in any and all capacities, to sign any and all amendments to this Annual Report on Form 10-K, and to file the same, with all exhibits thereto and other documents in connection therewith, with the Securities and Exchange Commission, and hereby grants to such attorneys-in-fact and agents, and each of them, full power and authority to do and perform each and every act and thing requisite and necessary to be done, as fully as to all intents and purposes as each of the undersigned might or could do in person, hereby ratifying and confirming all that said attorneys-in-fact and agents, or any of them, or their or his substitute or substitutes, may lawfully do or cause to be done by virtue hereof.
In accordance with the Exchange Act, this report has been signed below by the following persons on behalf of the registrant and in the capacities and on the dates indicated.
| SIGNATURES | CAPACITIES | DATE | ||
| /s/ E. Ricky Gibson | Director and Chairman of the Board | March 16, | ||
| /s/ Rodney D. Bennett | Director | March 16, | ||
| /s/ David W. Bomboy | Director | March 16, | ||
| /s/ Charles R. Lightsey | Director | March 16, | ||
| /s/ Fred McMurry | Director | March 16, | ||
| /s/ Thomas E. Mitchell | Director | March 16, | ||
| /s/ Ted E. Parker | Director | March 16, | ||
| /s/ J. Douglas Seidenburg | Director | March 16, | ||
| /s/ Andrew D. Stetelman | Director | March 16, | ||
/s/ M. Ray (Hoppy) Cole, Jr. | CEO, President and Director | March 16, | ||
| (Principal Executive Officer) | ||||
| /s/ Donna T. (Dee Dee) Lowery | Executive VP & Chief Financial Officer | |||
| (Principal Financial and Accounting Officer) | ||||
| March 16, 2020 |