ASBURY AUTOMOTIVE GROUP, INC.
(Exact name of Registrant as specified in its charter)
| Delaware | 01-0609375 | ||||||||||||||||||
(State or other jurisdiction of incorporation or organization) | (I.R.S. Employer Identification No.) | |||||
| 2905 Premiere Parkway, NW, | Suite 300 | ||||||||||||||||
| Duluth, | Georgia | 30097 | |||||||||||||||
| ( | (Zip Code) | ||||||||||||||||
(770) 418-8200
(Registrant's telephone number, including area code)
Securities registered pursuant to Section 12(b) of the Act:
| Trading | ||||||||||||||
| Title of each class | Symbol(s) | Name of each exchange on which registered | ||||||||||||
| Common | ABG | New York Stock Exchange | ||||||||||||
Securities registered pursuant to Section 12(g) of the Act:
None.
a
Indicate by check mark if the registrant is a well-known seasoned issuer, as defined in Rule 405 of the Securities Act. Yes xNo o
Indicate by check mark if the registrant is not required to file reports pursuant to Section 13 or Section 15(d) of the Act. Yes o No x
Indicate by check mark whether the registrant (1) has filed all reports required to be filed by Section 13 or 15(d) of the Securities Exchange Act of 1934 during the preceding 12 months (or for such shorter period that the registrant was required to file such reports), and (2) has been subject to such filing requirements for the past 90 days. Yes x No o
Indicate by check mark whether the registrant has submitted electronically and posted on its website, if any, every Interactive Data File required to be submitted and posted pursuant to Rule 405 of Regulation S-T (§ 232.405 of this chapter) during the preceding 12 months (or for such shorter period that the registrant was required to submit and post such files). Yes x No o
Indicate by check mark whether the registrant is a large accelerated filer, an accelerated filer, a non-accelerated filer, or a smaller reporting company, (as definedor an emerging growth company. See the definitions of "large accelerated filer," "accelerated filer," "smaller reporting company," and "emerging growth company" in Rule 12b-2 of the Act).
Exchange Act.
| Large Accelerated Filer | ☒ | Accelerated Filer | |||||||||||||||||
| Non-Accelerated Filer | ☐ | Smaller Reporting Company | ☐ | ||||||||||||||||
| Emerging Growth Company | |||||||||||||||||||
If an emerging growth company, indicate by check mark if the registrant has elected not to use the extended transition period for complying with any new or revised financial accounting standards provided pursuant to Section 13(a) of the Exchange Act. o
Indicate by check mark whether the registrant has filed a report on and attestation to its management’s assessment of
the effectiveness of its internal control over financial reporting under Section 404(b) of the Sarbanes-Oxley Act (15 U.S.C.
7262(b)) by the registered public accounting firm that prepared or issued its audit report. ☒
If securities are registered pursuant to Section 12(b) of the Act, indicate by check mark whether the financial statements of the registrant included in the filing reflect the correction of an error to previously issued financial statements. ☐
Indicate by check mark whether any of those error corrections are restatements that required a recovery analysis of incentive-based compensation received by any of the registrant’s executive officers during the relevant recovery period pursuant to §240.10D-1(b). ☐
Indicate by check mark whether registrant is a shell company (as defined in Rule 12b-2 of the Exchange Act). Yes o ☐No x
Based on the closing price of the registrant's common stock as of June 30, 2017,2023, the aggregate market value of the common stock held by non-affiliates of the registrant was $1.16$4.92 billion (based upon the assumption, solely for purposes of this computation, that all of the officers and directors of the registrant were affiliates of the registrant).
Indicate the number of shares outstanding of each of the registrant's classes of common stock, as of the latest practicable date: The number of shares of common stock outstanding as of February 26, 201827, 2024 was 20,913,251.20,404,121.
DOCUMENTS INCORPORATED BY REFERENCE
List hereunder the following documents if incorporated by reference and the Part of the Form 10-K into which the document is incorporated:
Portions of the registrant's definitive Proxy Statement for the 20182024 Annual Meeting of Stockholders, to be filed within 120 days after the end of the registrant's fiscal year, are incorporated by reference into Part III, Items 10 through 14 of this Annual Report on Form 10-K.
ASBURY AUTOMOTIVE GROUP, INC.
ANNUAL REPORT ON FORM 10-K
FOR THE YEAR ENDED
DECEMBER 31, 20172023
| Page | ||||||||||
| PART I | ||||||||||
| PART II | ||||||||||
| PART III | ||||||||||
| PART IV | ||||||||||
PART I.
Forward-Looking Information
Certain of the discussions and information included or incorporated by reference in this report may constitute "forward-looking statements" within the meaning of the federal securities laws. Forward-looking statements are statements that are not historical in nature and may include statements relating to our goals, plans and projections regarding industry and general economic trends, our expected financial position, results of operations or market position and our business strategy. Such statements can generally be identified by words such as "may," "target," "could," "would," "will," "should," "believe," "expect," "anticipate," "plan," "intend," "foresee," and other similar words or phrases. Forward-looking statements may also relate to our expectations and assumptions with respect to, among other things:
•the seasonally adjusted annual rate ("SAAR") of new vehicle sales in the U.S.;United States;
•general economic conditions and its expected impact on our revenuesrevenue and expenses;
•our expected parts and service revenue due to, among other things, improvements in manufacturing quality;vehicle technology;
•our ability to limit our exposure to regional economic downturns due to our geographic diversity and brand mix;
•manufacturers' willingness to continue tocontinued use of incentive programs to drive demand for their product offerings;
•our capital allocation strategy, including as it relates to acquisitions and divestitures, stock repurchases, dividends and capital expenditures;
•the growth of import and luxurythe brands that comprise our portfolio over the long-term;
•disruptions in the production and supply of vehicles and parts from our ability to mitigate any future negative trends in new vehicle sales; and
•our estimated future capital expenditures, which can be impacted by increasing prices and labor shortages and acquisitions and divestitures.
Forward-looking statements involve known and unknown risks, uncertainties and other factors that may cause our actual future results, performance or achievements to be materially different from any future results, performance, or achievements expressed or implied by the forward-looking statements. Such factors include, but are not limited to:
•the ability to acquire and successfully integrate acquired businesses into our existing operations and realize expected benefits and synergies from such acquisitions;
•the effects of increased expenses or unanticipated liabilities incurred as a result of, or due to activities related to our acquisitions or divestitures;
•changes in general economic and business conditions, including the current inflationary environment, the current interest rate environment, changes in employment levels, consumer demand, preferences and confidence levels, consumer demand and preferences, the availability and cost of credit, fuel prices and levels of discretionary personal income and interest rates;income;
•our ability to executegenerate sufficient cash flows, maintain our balanced automotive retailingliquidity and service business strategy;obtain any necessary additional funds for working capital, capital expenditures, acquisitions, stock repurchases, debt maturity payments and other corporate purposes, if necessary or desirable;
•significant disruptions in the production and delivery of vehicles and parts for any reason, including supply shortages, the ongoing conflict in Russia and Ukraine, including any government sanctions imposed in connection therewith, natural disasters, severe weather, civil unrest, product recalls, work stoppages or other occurrences that are outside of our control;
•our ability to successfully attract and retain skilled employees;
•our ability to successfully operate, including our ability to maintain, and obtain future necessary regulatory approvals, for Total Care Auto, Powered by Landcar ("TCA"), our finance and insurance ("F&I ") product provider;
•adverse conditions affecting the vehicle manufacturesmanufacturers whose brands we sell, and their ability to design, manufacture, deliver and market their vehicles successfully;
•changes in the mix and total number of vehicles we are able to sell;
•our outstanding indebtedness and our continued ability to comply with applicable covenants in our various financing and lease agreements, or to obtain waivers of these covenants as necessary;
4
•high levels of competition in our industry, which may create pricing and margin pressures on our products and services;
•our relationships with manufacturers of the vehicles we sell and our ability to renew, and enter into new framework and dealer agreements with vehicle manufacturers whose brands we sell, on terms acceptable to us;
•the availability of manufacturer incentive programs and our ability to earn these incentives;
•failure of our, or those of our third-party service providers, management information systems or systems;
•any data security breaches;breaches occurring, including with regard to personally identifiable information ("PII");
•changes in laws and regulations governing the operation of automobile franchises, including trade restrictions, consumer protections, accounting standards, taxation requirements and environmental laws;
•changes in, or the imposition of, new tariffs or trade restrictions on imported vehicles or parts;
•adverse results from litigation, regulatory investigations or other similar proceedings involving us;us, including costs, expenses, settlements and judgments related thereto;
•our ability to generate sufficient cash flows, maintain our liquidityconsummate planned or pending mergers, acquisitions and obtain any necessary additional funds for working capital, capital expenditures, acquisitions, stock repurchases and/or dividends, debt maturity payments, and other corporate purposes;dispositions;
•any disruptions in the financial markets, which may impact our ability to access capital;
•our relationships with, and the financial stability of, our lenders and lessors;
•our ability to execute our initiatives and other strategies; and
•our ability to leverage gains fromscale and cost structure to improve operating efficiencies across our dealership portfolio.
Many of these factors are beyond our ability to control or predict, and their ultimate impact could be material. Moreover, the factors set forth under "Item 1A. Risk Factors" and "Item 7. Management's Discussion and Analysis of Financial Condition and Results of Operations" below and other cautionary statements made in this report should be read and considered as forward-looking statements subject to such uncertainties. We urge you to carefully consider those factors.
Forward-looking statements speak only as of the date of this report. We expressly disclaim any obligation to update any forward-looking statement contained herein.
Additional Information
Our annual reports on Form 10-K, quarterly reports on Form 10-Q, current reports on Form 8-K, and any amendments to such reports filed pursuant to Section 13(a) or 15(d) of the Securities Exchange Act of 1934, are made available free of charge on our website at http://www.asburyauto.com as soon as practical after such reports are filed with the U.S. Securities and Exchange Commission (the "Commission"). In addition, the proxy statement that will be delivered to our stockholders in connection with our 20172024 Annual Meeting of Stockholders, when filed, will also be available on our website, and at the URL stated in such proxy statement. We also make available on our website copies of our certificate of incorporation, bylaws, and other materials that outline our corporate governance policies and practices, including:
•the respective charters of our audit committee, governance and nominating committee, compensation and human resources committee, and capital allocation and risk management committee;
•our criteria for independence of the members of our boardBoard of directors,Directors, audit committee, and compensation and human resources committee;
•our Corporate Governance Guidelines; and
•our Code of Business Conduct and Ethics for Directors, Officers, and Employees.
We intend to provide any information required by Item 5.05 of Form 8-K (relating to amendments or waivers of our Code of Business Conduct and Ethics for Directors, Officers, and Employees) by disclosure on our website.
You may also obtain a printed copy of the foregoing materials by sending a written request to: Investor Relations Department, Asbury Automotive Group, Inc., 2905 Premiere Parkway, NW, Suite 300, Duluth, Georgia 30097. In addition, the Commission makes available on its website, free of charge, reports, proxy and information statements, and other information regarding issuers, such as us, that file electronically with the Commission. The Commission's website is http://www.sec.gov. Unless otherwise specified, information contained on our website, available by hyperlink from our website or on the Commission's website, is not incorporated into this report or other documents we file with, or furnish to, the Commission.
5
Except as the context otherwise requires, "we," "our," "us," "Asbury," and "the Company" refer to Asbury Automotive Group, Inc. and its subsidiaries.
Item 1. BUSINESS
Asbury Automotive Group, Inc., a Delaware corporation organized in 2002, is a Fortune 500 company and one of the largest franchised automotive retailers in the United States. Our mission and vision is to put the guest experience first and follow our "North Star" to be the most guest-centric automotive retailer in the industry. We follow three key principles to guide us: (1) have a fun, supportive and inclusive culture where team members thrive personally while building meaningful bonds with one another; (2) be great brand ambassadors and exceptional stewards of capital for our partners who fuel our mission; and (3) be caring professionals who strive to delight our guests and foster love for the brand. Our strong organizational culture and purposeful mission allow us to continuously deliver best-in-class experiences to our guests. As of December 31, 2023, we owned and operated 208 new vehicle franchises, representing 31 brands of automobiles at 158 dealership locations, 37 collision centers, and Total Care Auto, Powered by Landcar ("TCA" or "TCA Business"), our finance and insurance ("F&I") product provider, within 16 states. Our store operations are conducted by our subsidiaries.
Our omni-channel platform is designed to engage with customers where and when they want to interact and to increase our market share through digital innovation. We are focused on providing a high level of customer service and have designed our dealerships’ services to meet the increasingly sophisticated needs of customers throughout the vehicle ownership lifecycle. Our digital capabilities further enhance our physical dealership network and drive additional revenue. Our ability to provide a low friction experience across our omni-channel platform drives customer satisfaction and repeat business across our dealership portfolio.
Acquisitions
On December 11, 2023, the Company completed the acquisition of the business of the Jim Koons ("Koons") Automotive Companies, (collectively, the "Koons acquisition"), thereby acquiring 20 new vehicle dealerships, six collision centers and the real property related thereto for an aggregate purchase price of approximately $1.50 billion, which includes $256.1 million of new vehicle floor plan financing and $103.8 million of assets held for sale related to Koons Lexus of Wilmington. The acquisition was funded with borrowings under Asbury’s existing credit facility and cash on hand. The Koons acquisition diversifies Asbury's geographic mix, with expansion in the greater Washington-Baltimore region of the United States.
There were no acquisitions during the year ended December 31, 2022.
On December 17, 2021, the Company completed the acquisition of the businesses of the Larry H. Miller ("LHM") Dealerships and TCA (collectively, the "LHM acquisition"), thereby acquiring 54 new vehicle dealerships, seven used cars stores, 11 collision centers, a used vehicle wholesale business, the real property related thereto, and the entities comprising the TCA business for a total purchase price of $3.48 billion. The purchase price was financed through a combination of cash, debt, including senior notes, real estate facilities, new and used vehicle floor plan facilities and the proceeds from the issuance of common stock. As a result of the transaction, the Company operates in two reportable segments, the Dealerships and TCA segments.
In addition our geographic footprint decreases our exposure to regional economic conditionsthe LHM acquisition, during the year ended December 31, 2021, we acquired the assets of 11 franchises (10 dealership locations) in the Denver, Colorado market and our brand diversification decreases our exposurethree franchises (one dealership location) in the Indianapolis, Indiana market for a combined purchase price of $485.7 million. We funded these acquisitions with an aggregate of $455.1 million of cash and $9.6 million of floor plan borrowings for the purchase of the related new vehicle inventory. In the aggregate, these acquisitions included purchase price holdbacks of $21.0 million for potential indemnity claims made by us with respect to manufacturer-specific risks, such as brand perception or production disruptions. Approximately 84%the acquired franchises.
Divestitures
During the year ended December 31, 2023, we sold one franchise (one dealership location) in Austin, Texas. The Company recorded a pre-tax gain totaling $13.5 million.
6
During the year ended December 31, 2022, we sold one franchise (one dealership location) in St. Louis, Missouri, three franchises (three dealership locations) and service,one collision center in Denver, Colorado, two franchises (two dealership locations) in Spokane, Washington, one franchise (one dealership location) in Albuquerque, New Mexico and finance11 franchises (nine dealership locations) and insurance which historically have been more stable throughout economic cycles.two collision centers in North Carolina. The Company recorded a pre-tax gain totaling $207.1 million.
During the year ended December 31, 2021, we sold one franchise (one dealership location) in the Charlottesville, Virginia market. The Company recorded a pre-tax gain totaling $8.0 million.
Four Key Components of Our Business
The following charts presentchart presents the contribution to total revenue and gross profit by each line of business for the year ended December 31, 2017:2023:
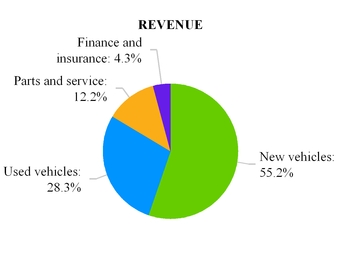
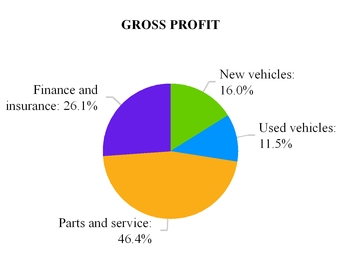

7
Our new vehicle franchise retail network within our Dealerships segment is made up of dealerships located in 17 metropolitan markets in 916 states operating primarily under eight locally-branded16 locally branded dealership groups. The following chart provides a detailed breakdown of our markets,states, brand names, and franchises as of December 31, 2017:
2023:
____________________________
| Dealership Group Brand Name | State | Franchise | ||||||||||||||
| Coggin Automotive Group | Florida | Acura, BMW, | ||||||||||||||
| Courtesy Autogroup | Florida | Chrysler, Dodge, Genesis, Honda, Hyundai, Infiniti, Jeep, Kia, Mercedes-Benz, Nissan, | ||||||||||||||
| Crown Automotive Company | South Carolina | |||||||||||||||
| Virginia | ||||||||||||||||
| David McDavid Auto Group | Texas | |||||||||||||||
| Greenville Automotive Group | South Carolina | Land Rover, Porsche, Toyota, Volvo | ||||||||||||||
| Hare, Bill Estes & Kahlo Automotive Groups | Indiana | Buick, Chevrolet(b), Chrysler(a), Dodge(a), Ford, GMC, Honda, Isuzu, Jeep(a), Toyota | ||||||||||||||
| Jim Koons Automotive Companies | Maryland | Buick, Chevrolet(a), Ford, GMC, Kia, Mercedes-Benz, Sprinter, Toyota(b), Volvo | ||||||||||||||
| Virginia | Buick(a), Chevrolet, Chrysler, Dodge, Ford(b), GMC(a), Hyundai, Jeep, Kia, Toyota(a) | |||||||||||||||
| Delaware | Lexus | |||||||||||||||
| Larry H. Miller Dealerships | Arizona | Chrysler(b), Dodge(c), Fiat, Ford, Genesis, Hyundai, Jeep(b), Nissan, Toyota, Volkswagen(a) | ||||||||||||||
| California | Toyota(a) | |||||||||||||||
| Colorado | Chrysler(a), Dodge(b), Fiat, Ford, Jeep(a), Nissan(b), Volkswagen | |||||||||||||||
| Idaho | Chrysler, Dodge, Honda, Jeep, | |||||||||||||||
| New Mexico | ||||||||||||||||
| Utah | ||||||||||||||||
| Washington | Honda | |||||||||||||||
| Mike Shaw, Stevinson & Arapahoe Automotive Groups | Colorado | |||||||||||||||
| Nalley Automotive Group | Georgia | Acura, Audi, Bentley, BMW, | ||||||||||||||
| Park Place Automotive | Texas | Acura, Lexus(a), Land Rover, Mercedes-Benz(b), Porsche, Volvo, Sprinter(b) | ||||||||||||||
| Plaza Motor Company | Missouri | Audi, BMW, Infiniti, | ||||||||||||||
(a)This state has two of these franchises.
(b)This state has three of these franchises.
(c)This state has four of these franchises.
(d)This state has five of these franchises.
8
Operations
New Vehicle Sales
The following table reflects the number of franchises we owned as of December 31, 20172023 and the percentage of new vehicle revenues represented by class and franchise for the year ended December 31, 2017:2023:
| Class/Franchise | Number of Franchises Owned | % of New Vehicle Revenues | ||||||||||||
| Luxury | ||||||||||||||
| Lexus | 9 | 11 | % | |||||||||||
| Mercedes-Benz | 9 | 8 | ||||||||||||
| BMW | 5 | 3 | ||||||||||||
| Acura | 4 | 2 | ||||||||||||
| Infiniti | 4 | 1 | ||||||||||||
| Land Rover | 3 | 2 | ||||||||||||
| Porsche | 3 | 2 | ||||||||||||
| Volvo | 3 | 1 | ||||||||||||
| Audi | 2 | 1 | ||||||||||||
| Genesis | 2 | 1 | ||||||||||||
| Lincoln | 2 | 1 | ||||||||||||
| Bentley | 1 | * | ||||||||||||
| Jaguar | 1 | * | ||||||||||||
| Total Luxury | 48 | 33 | % | |||||||||||
| Import | ||||||||||||||
| Toyota | 19 | 16 | % | |||||||||||
| Honda | 13 | 10 | ||||||||||||
| Hyundai | 9 | 4 | ||||||||||||
| Nissan | 9 | 3 | ||||||||||||
| Sprinter | 8 | 1 | ||||||||||||
| Kia | 4 | 2 | ||||||||||||
| Volkswagen | 4 | 1 | ||||||||||||
| Subaru | 3 | 2 | ||||||||||||
| Fiat | 2 | * | ||||||||||||
| MINI | 1 | * | ||||||||||||
| Isuzu | 1 | * | ||||||||||||
| Total Import | 73 | 39 | % | |||||||||||
| Domestic | ||||||||||||||
| Chrysler, Dodge, Jeep, Ram | 52 | 12 | % | |||||||||||
| Chevrolet, Buick, GMC | 22 | 6 | ||||||||||||
| Ford | 13 | 10 | ||||||||||||
| Total Domestic | 87 | 28 | % | |||||||||||
| Total Franchises | 208 | 100 | % | |||||||||||
| Class/Franchise | Number of Franchises Owned | % of New Vehicle Revenues | ||||
| Luxury | ||||||
| Mercedes-Benz | 4 | 7 | % | |||
| Lexus | 4 | 7 | ||||
| BMW | 7 | 6 | ||||
| Acura | 6 | 4 | ||||
| Infiniti | 4 | 3 | ||||
| Audi | 2 | 3 | ||||
| Lincoln | 3 | 1 | ||||
| Volvo | 2 | 1 | ||||
| Land Rover | 2 | 1 | ||||
| Jaguar | 2 | 1 | ||||
| Porsche | 1 | * | ||||
| Bentley | 1 | * | ||||
| Total Luxury | 38 | 34 | % | |||
| Import | ||||||
| Honda | 11 | 18 | % | |||
| Toyota | 6 | 11 | ||||
| Nissan | 10 | 12 | ||||
| Kia | 2 | 2 | ||||
| Hyundai | 3 | 2 | ||||
| Volkswagen | 1 | 1 | ||||
| MINI | 1 | * | ||||
| smart (a) | — | * | ||||
| Isuzu | 1 | * | ||||
| Sprinter | 3 | * | ||||
| Total Import | 38 | 46 | % | |||
| Domestic | ||||||
| Ford | 6 | 11 | % | |||
| Chevrolet | 3 | 4 | ||||
| Dodge | 3 | 3 | ||||
| Jeep | 2 | 1 | ||||
| GMC | 1 | 1 | ||||
| Chrysler | 2 | * | ||||
| Buick | 1 | * | ||||
| Total Domestic | 18 | 20 | % | |||
| Total Franchises | 94 | 100 | % | |||
* Franchise accounted for less than 1% of new vehicle revenues for the year ended December 31, 2017.2023.
Our new vehicle revenues include new vehicle sales and lease transactions arranged by our dealerships with third-party financial institutions. We believe that leasing provides a number of benefits to our other business lines, including the historical customer loyalty to the leasing dealership for repairs and maintenance services and the fact that lessors typically give the leasing dealership the first option to purchase the off-lease vehicle.
9
Used Vehicle Sales
We sell used vehicles at all of our franchised dealership locations. Used vehicle sales include the sale of used vehicles to individual retail customers ("used retail") and the sale of used vehicles to other dealers at auction ("wholesale") (the terms "used retail" and "wholesale" collectively referred to as "used").
Gross profit from the sale of used vehicles depends primarily on our dealerships' ability to obtain a high quality supply of used vehicles and our use of technology to manage our inventory. Our new vehicle operations typically provide our used vehicle operations with a large supply of trade-ins and off-lease vehicles, which we believe are good sources of high quality used vehicles. We also purchase a portion of our used vehicle inventory at "open" auctions and auctions restricted to new vehicle dealers. Additionally, our used vehicle sales benefit from our ability to sell certified pre-owned vehicles from our franchised dealerships.
Parts and Service
We provide vehicle repair and maintenance services, sell replacement parts, and recondition used vehicles at all of our dealerships. In addition, we provide collision repair services at our 2437 free-standing collision repair centers that we operate either on the premises of, or in close proximity to, our dealerships. Historically, parts and service revenues have been more stable than those from vehicle sales. Industry-wide, parts and service revenues have consistently increased over time primarily due to the increased cost of maintaining vehicles, the added technical complexity of vehicles, and the increasing number of vehicles on the road.
The automotive parts and service industry tends to be highly fragmented, with franchised dealerships and independent repair shops competing for this business. We believe, however, that the increased use of advanced technology in vehicles is making it difficult for independent repair shops to compete effectively with franchised dealerships as they may not be able to make the investment necessary to perform major or technical repairs. In an effort to maintain the necessary knowledge to service vehicles and further develop our technician staff, we focus on our internal and manufacturer specific training and development programs for new and existing technicians. We believe our parts and service business is also well-positioned to benefit from the service work potentially generated through the sale of extended service contracts to customers who purchase new and used vehicles from us, as historically these customers tend to have their vehicles serviced at the location where they purchased the extended service contract. In addition, our franchised dealerships benefit from manufacturer policies requiring that warranty and recall related repairs be performed at a franchised dealership. We believe that our collision repair centers provide us with an attractive opportunity to grow our business due to the high margins provided by collision repair services and the fact that we are able to source original equipment manufacturer parts from our franchised dealerships.
Finance and Insurance
We offer a wide variety of automotive finance and insurance ("F&I")&I products to our customers. Through the acquisition of TCA in December 2021, we offer extended vehicle service contracts, prepaid maintenance contracts, key replacement contracts, guaranteed asset protection contracts, paintless dent repair contracts, appearance protection contracts, tire and wheel, and lease wear and tear contracts. These F&I products are sold to our customers via our network of dealerships.
In addition to the TCA F&I products, we offer our customers a variety of vehicle protection products through independent third parties in connection with the purchase of vehicles. These products are underwritten and administered by these third parties. Under our arrangements with the providers of these products, we primarily sell the products on a straight commission basis. We are subject to chargebacks for service and other contracts as a result of early termination, default, or prepayment of the contract. In addition, we participate in future profits associated with the performance of the third-party held underlying portfolio for certain products pursuant to retrospective commission arrangements.
We also arrange third-party financing for the sale or lease of vehicles to our customers in exchange for a feecompensation paid to us by the third-party financial institution. We do not directly finance our customers' vehicle purchases or leases, therefore our exposure to losses in connection with those third-party financing arrangements is limited generally to the fees thatcompensation we receive. The feescompensation we receive areis subject to chargeback, or repayment, to the third-party finance company if a customer defaults or prepays the retail installment contract typically during some limited time period at the beginning of the contract term. We have negotiated agreements with certain lenders pursuant to which we receive additional feescompensation upon reaching a certain volume of business.
F&I revenue in our TCA segment represents the premium revenue earned from customers a variety of vehicle protectionfor F&I products primarily sold in connection with the purchase of vehicles. These productsvehicles at our dealerships. The premium revenue is recognized over the life of the F&I
10
product contract as services are underwrittenprovided. We capitalize costs, such as employee sales commissions, to obtain customer contracts, and administered by independent third-parties. Under our arrangements withamortize those costs over the providers of these products, we primarily sell the products on a straight commission basis. We are subject to chargebacks for insurance contracts as a result of early termination, default, or prepaymentlife of the contract. Amortization of costs to obtain customer contracts is included in selling, general and administrative expenses in the consolidated statements of income. The portion of commissions that are paid to affiliated dealerships are eliminated in the TCA segment upon consolidation. The Dealerships segment also provides vehicle repair and maintenance services to TCA customers in connection with claims related to TCA's products. Upon consolidation, the associated service revenue and costs recorded by the Dealerships segment are eliminated against claims expense recorded by the TCA segment. Third-party claims paid related to the contracts are recognized in F&I cost of sales.
In addition, we participate in future profits associated withF&I revenue includes investment income and other gains and losses related to the performance of the third-party held underlying portfolio for certain products pursuant to retrospective commission arrangements. The following is a brief description of some of the vehicle protection products we offer to our customers:
Business Strategy
We seek to be the most guest-centric automotive retailer and to create long-term value for our stockholders by striving to drive operational excellence and deploy capital to its highest risk adjusted returns. To achieve these objectives, we employ the strategies described below.
We are guided by our mission and vision to be the most guest-centric automotive retailer in the industry and use that framework as our North Star. We have designed our dealerships’ services to meet the needs of an increasingly sophisticated and demanding automotive consumer. We endeavor to establish relationships that we believe will result in both repeat business and additional business through customer referrals. Furthermore, we provide our dealership managers with appropriate incentives to employ efficient selling approaches, engage in extensive follow-up to develop long-term relationships with customers, and extensively train our sales staff to meet customer needs.
Accelerate same store growth and guest experience through technology investment.
As part of our long-term growth strategy, we invest in technologies or partner with leading software platform vendors to develop applications that (i) serve our guests with omni-channel buying options offering enhanced speed, and transparency, (ii) drive a more efficient guest experience at a lower cost to serve and (iii) offer tailored recommendations to value add products and services.
Grow F&I product penetration and expand TCA's service offerings across the full dealership portfolio.
We are positioned to leverage the acquisition of LHM to improve profitability via the ownership of TCA, a highly scalable provider of a full-suite of F&I products. TCA’s key offerings include vehicle service contracts, prepaid maintenance, protection plans, key and remote replacement, leased vehicle protection and tire and wheel protection. We are continuing to integrate TCA’s service offerings across our full dealership portfolio to increase our F&I product penetration and profitability. We expect to complete the rollout of TCA's service offerings to all of our dealerships in 2024.
Attract, retain and retaininvest in top talent to drive growth and optimize operations.
We believe the core of our business success lies in our talent pool, so we are focused on attracting, hiring and retaining the best talent
people. We also invest in resources to train and develop our employees. Our executive management team has extensive experience in the auto retail sector and is able to leverage experience from all positions throughout the Company. In addition, we believe that local management of dealership operations enables our retail network to provide market specific responses to sales, customer service and inventory requirements. The general manager of each of our dealerships is responsible for the operations, personnel and financial performance of that dealership as well as other day-to-day operations. We believe our general managers' familiarity with their respective markets enables them to effectively run day-to-day operations, market to customers, and recruit new employees. The general manager of each dealership is supported, in most cases, by a new vehicle sales manager, a used vehicle sales manager, an F&I manager, a parts manager, and a service manager. Our dealership management teams typically have many years of experience in the automotive retail industry. This management structure is complemented by support from our market-based management teams and the corporate office, which we refer to as the Dealership Support Center ("DSC"), through our advanced technology solutions, centralized processes, marketing support, and financial oversight.
Leverage our scale and cost structure to improve our operating efficienciesefficiencies.
We are positioned to leverage our significant scale so that we are able to achieve competitive operating margins by centralizing and streamlining various back-office functions. We are able to improve financial controls and lower servicing costs by maintaining key store-level accounting and administrative activities in our shared service centers, and we leverage our scale to reduce costs related to purchasing certain equipment, supplies, and services through national vendor relationships. Similarly, we are able to leverage our scale to implement these best practices when integrating newly acquired dealerships allowing us to continue to improve our operating efficiencies.
Deploy Capitalcapital to Highest Returnshighest returns and continue to invest in the business.
Our capital allocation decisions are made within the context of maintaining sufficient liquidity and a prudent capital structure. We continually evaluatetarget a 2.5x to 3.5x adjusted net leverage ratio, which is calculated as set forth in our investment opportunities based upon: (i)credit facility, in a normal
11
business environment. The Company’s adjusted net leverage ratio was 2.5x at December 31, 2023, compared to 1.7x at December 31, 2022. We believe our cash position and cash equivalents on hand, (ii) the funds that we expect to generate through future operations, (iii)borrowing capacity, combined with our current and expected borrowing availability under our credit facilities and mortgage financings, (iv) amountsfuture cash generation capability, provides us with financial flexibility to, among other things, reinvest in our new vehicle floor plan notes payable offset accounts,business, acquire dealerships and (v) the potential impact of any contemplated or pending future transactions, including, but not limited to, financings, acquisitions, dispositions or other capital expenditures.
We continually evaluate our existing dealership network and seek to make strategic investments whichthat will increase the capacity of our dealerships and improve the customer experience. In addition, we continue to execute on our strategy of selectively acquiring our leased properties where financing rates make it attractive to be an owner.owner and provide us a further means to finance our business.
Evaluate opportunities to refine ourthe dealership portfolio, including acquiring value added operating assets and dealershipsportfolio.
We evaluate dealership acquisition opportunities based on market position and geography, brand representation and availability, key personnel, and other factors. We believe our financial position, IT systems, management structure, and experience, position us to efficiently and opportunistically complete, integrate, and benefit from dealership acquisitions. We alsocontinually evaluate the financial and operating results of our owned dealerships, as well as each dealership'sdealership’s geographical location and, based on various financial and strategic rationales, may make decisions to dispose of dealerships to refine our dealership and real estate portfolio. We also evaluate dealership acquisition opportunities based on market position and geography, brand representation and availability, key personnel and other factors. Our approach to dispositions and acquisitions is highly disciplined with a focus on long-term strategic value to stockholders.
We continually evaluate additional opportunities to drive revenue growth while maintaining our disciplined approach to capital allocation. In February 2024, the Company announced an update to stockholders through share repurchase programs and/our strategic outlook targeting revenue of $30 billion or dividends
Competition
The automotive retail and service industry is highly competitive with respect to price, service, location, and selection. For new vehicle sales, our dealerships compete with other franchised dealerships, primarily in their regions. Our new vehicle store competitors also have franchise agreements with the various vehicle manufacturers, and as such, generally obtain new vehicle inventory from vehicle manufacturers on the same terms as us. The franchise agreements grant the franchised dealership a non-exclusive right to sell the manufacturer's (or distributor's) brand of vehicles and offer related parts and service within a specified market area. State automotive franchise laws restrict competitors from relocating their stores or establishing new stores of a
particular vehicle brand within a specified area that is served by our dealership of the same vehicle brand. Recently, certain electric vehicle manufacturers have been permitted to circumvent the state automotive franchise laws of several states in the United States thereby permitting them to sell their new vehicles directly to consumers. We rely on our advertising and merchandising, sales expertise, service reputation, strong local branding, and location of our dealerships to assist in the sale of new vehicles.
Our used vehicle operations compete with other franchised dealerships, non-franchised automotive dealerships, regional and national vehicle rental companies, and Internet-basedinternet-based vehicle brokers for the supply and resale of used vehicles.
We compete with other franchised dealerships to perform warranty and recall-related repairs and with other franchised dealerships and independent service centers for non-warranty repair and maintenance services. We compete with other automobile dealers, service stores, and auto parts retailers in our parts operations. We believe that we have a competitive advantage in parts and service sales due to our ability to use factory-approved replacement parts, our skilled manufacturer trained and certified technicians, our competitive prices, our familiarity with manufacturer brands and models, and the quality of our customer service.
We compete with a broad range of financial institutions in arranging financing for our customerscustomers' vehicle purchases. In addition, many financial institutions are now offering F&I products through the Internet,internet, which has increased competition and may reduce our profits on certain of these items. We believe that the principal competitive factors in providing financing are convenience, interest rates, and flexibility in contract length.
Seasonality
The automobile industry has historically been subject to seasonal variations. Demand for new vehicles is generally highest during the second, third, and fourth quarters of each year and, accordingly, we expect our revenues and operating results to generally be higher during these periods. In addition, we typically experience higher sales of luxury vehicles, in the fourth quarter, which have higher average selling prices and gross profit per vehicle retailed.retailed, in the fourth quarter. Revenues and operating results may be impacted significantly from quarter to quarter by changing economic conditions, vehicle manufacturer incentive programs, or adverse weather events.
12
Dealer and Framework Agreements
Each of our dealerships operate pursuant to a dealer agreement between the dealership and the manufacturer (or in some cases the distributor) of each brand of new vehicles sold and/or serviced at the dealership. The dealer agreements grant the franchised dealership a non-exclusive right to sell the manufacturer's (or distributor's) brand of vehicles and offer related parts and service within a specified market area. Each dealer agreement also grants our dealerships the right to use the manufacturer's trademarks and service marks in connection with the dealershipsdealerships' operations and they also impose numerous operational requirements related to, among other things, the following:
•inventories of new vehicles and manufacturer replacement parts;
•maintenance of minimum net working capital requirements, and in some cases, minimum net worth requirements;
•achievement of certain sales and customer satisfaction targets;
•advertising and marketing practices;
•facilities and signs;
•products offered to customers;
•dealership management;
•personnel training;
•information systems;
•geographic market, including but not limited to requirements to meet sales and service targets within an assigned market area, geographic limitations on where the dealership may locate or advertise, and restrictions on the export of vehicles; and
•dealership monthly and annual financial reporting.
Our dealer agreements are for various terms, ranging from one year to indefinite. We expect that we will be able to renew expiring agreements in the ordinary course of business. However, typical dealer agreements give the manufacturer the right to terminate or the option of non-renewal of the dealer agreement under certain circumstances, subject to applicable state automotive dealership franchise laws, including:
•insolvency or bankruptcy of the dealership;
•failure to adequately operate the dealership or to maintain required capitalization levels;
•impairment of the reputation or financial condition of the dealership;
•change of ownership or management of the dealership without manufacturer consent;
•certain extraordinary corporate transactions such as a merger or sale of all or substantially all of our assets without manufacturer consent;
•failure to complete facility upgrades required by the manufacturer or agreed to by the dealer;
•failure to maintain any license, permits or authorization required to conduct the dealership's business;
•conviction of a dealer/manager or owner for certain crimes; or
•material breach of other provisions of a dealer agreement.
Notwithstanding the terms of any dealer agreement, the states in which we operate have automotive dealership franchise laws thatwhich provide that it is unlawful for a manufacturer to terminate or not renew a franchise unless "good cause" exists.
In addition to requirements under dealer agreements, we are subject to provisions contained in supplemental agreements, framework agreements, dealer addenda and manufacturers' policies, collectively referred to as "framework agreements." Framework agreements impose requirements on us in addition to those described above. Such agreements also define other standards and limitations, including:
•company-wide performance criteria;
•capitalization requirements;
•limitations on changes in our ownership or management;
13
•limitations on the number of a particular manufacturer's franchises owned by us;
•restrictions or prohibitions on our ability to pledge the stock of certain of our subsidiaries; and
•conditions for consent to proposed acquisitions, including sales and customer satisfaction criteria, as well as limitations on the total local, regional, and national market share percentage that would be represented by a particular manufacturer's franchises owned by us after giving effect to a proposed acquisition.
Some dealer agreements and framework agreements grant the manufacturer the right to terminate or not renew our dealer and framework agreements, or to compel us to divest our dealerships, for a number of reasons, including default under the agreement, any unapproved change of control (which specific(specific changes vary from manufacturer to manufacturer, but which include material changes in the composition of our Board of Directors during a specified time period, the acquisition of 5% or more of our voting stock by another vehicle manufacturer or distributor, the acquisition of 20% or more of our voting stock by third parties, and the acquisition of an ownership interest sufficient to direct or influence management and policies), or certain other unapproved events (including certain extraordinary corporate transactions such as a merger or sale of all or substantially all of our assets). Triggers of the clauses are often based upon actions by our stockholders and are generally outside of our control. Some of our dealer agreements and framework agreements also give the manufacturer a right of first refusal if we propose to sell any dealership representing the manufacturer's brands to a third-party. These agreements may also attempt to limit the protections available under applicable state laws and require us to resolve disputes through binding arbitration. For additional information, please refer to the risk factor captioned "We are dependent upon our relationships with the manufacturers of vehicles that we sell and are subject to restrictions imposed by, and significant influence from, these vehicle manufacturers. Any of these restrictions or any changes or deterioration of these relationships could have a material adverse effect on our business, financial condition, results of operations, and cash flows."
Our framework agreements with certain manufacturers contain provisions that, among other things, attempt to limit the protections available to dealers under these laws. If these laws are repealed in the states in which we operate, manufacturers may be able to terminate our franchises without providing us with advance notice, an opportunity to cure or a showing of good cause. Without the protection of these laws, it may also be more difficult for us to renew our dealer agreements upon expiration.
Changes in laws that provide manufacturers the ability to terminate our dealer agreements could materially adversely affect our business, financial condition and results of operations. Furthermore, if a manufacturer seeks protection from creditors in
bankruptcy, courts have held that the federal bankruptcy laws may supersede these laws, resulting in either the termination, non-renewal or rejection of franchises by such manufacturers, which, in turn, could materially adversely affect our business, financial condition, and results of operations. For additional information, please refer to the risk factor captioned "If state laws that protect automotive retailers are repealed, weakened, or superseded by our framework agreements with manufacturers, our dealerships will be more susceptible to termination, non-renewal or renegotiation of their dealer agreements which could have a materially adverse effect on our business, financial condition, and results of operations."
Regulations
We operate in a highly regulated industry. In every state in which we operate, we must obtain one or more licenses issued by state regulatory authorities in order to operate our business. In addition, we are subject to numerous complex federal, state, and local laws regulating the conduct of our business, including those relating to our sales, operations, finance and insurance, advertising,marketing, and employment practices. These laws and regulations include state franchise laws and regulations, product standards and recalls, consumer protection laws, privacy and data security laws, anti-money laundering laws, and other extensive laws and regulations applicable to new and used motor vehicle dealers. These laws also include federal and state wage and hour, anti-discrimination, and other laws governing employment practices.
Industry Regulations
The Federal Trade Commission ("FTC") has regulatory authority over automotive dealers and has implemented enforcement initiatives relating to the marketing practices of automotive dealers. Our operations are also subject to the National Traffic and Motor Vehicle Safety Act, Federal Motor Vehicle Safety Standards and other product standards promulgated by the United States Department of Transportation, and the rules and regulations of various state motor vehicle regulatory agencies.
Our financing activities with customers are subject to federal truth-in-lending, consumer leasing, and equal credit opportunity laws and regulations, as well as state and local motor vehicle finance laws, leasing laws, installment finance laws, usury laws, and other installment state and leasing laws and regulations. Some U.S. states regulate fees and charges that may be paidcollected as a result of vehicle sales.sales and service. Claims arising out of actual or alleged violations of law may be asserted against us or our stores by individuals or governmental entities and may expose us to significant damages, fines or other penalties, including revocation or suspension of our license to conduct store operations. Our financing activities, as well as our sale of finance and insurance products, may also be impacted indirectly by laws and regulations that govern automotive finance
14
companies and Consumer Protection Act was signed into law and establishedother financial institutions, including regulations adopted by the Consumer Financial Protection Bureau ("CFPB"(the "CFPB") with broad regulatory powers. Although automotive dealers are generally excluded from.
Our TCA business involves the CFPB's regulatory authority, the CFPB has announced its intention to regulate automotive financing activities through its regulationoffer and sale of automotive finance companiesextended vehicle service contracts, debt protection products, vehicle protection plans and other financial institutions that service the automotive industry.miscellaneous vehicle protection products, which are subject to a wide range of federal, state and local laws and regulations. The CFPB has issued regulatory guidance instructing financial institutions to monitor dealer lending practices for potential discrimination, resulting from the system used to compensate dealers for assisting in the customer financing transaction. The CFPB has instructed lenders that, if discrimination is found, the lender would be required to change dealer compensation practices. In addition, the CFPB has announced its intention to regulate the saleDepartments of other finance and insurance products. The Federal Trade Commission has certainInsurance of U.S. states have regulatory authority over automotive dealersour TCA business. Our TCA business is subject to state licensing and has implemented an enforcement initiative relating to the advertising practices of automotive dealers.registration requirements, and financial responsibility and security requirements. For additional information, please refer to the risk factor captionedfactors captioned: "Our operations are subject to extensive governmental laws and regulations. If we are found to be in purported violation of or subject to liabilities under any of these laws or regulations, or if new laws or regulations are enacted that adversely affect our operations, our business, our reputation, financial condition, results of operations, and prospects could suffer" and "Our TCA business is subject to a wide range of federal, state and local laws and regulations, some of which we may not have previously been subject. If we are found to be in purported violation of or subject to liabilities under any of these laws or regulations, or if new laws or regulations are enacted that adversely affect our TCA business, our business, results of operations, financial condition, cash flows, reputation and prospects could suffer."
Environmental, Health and Safety Laws and Regulations
We are subject to a wide range of environmental laws and regulations, including those governing discharges into water, air emissions, storage of petroleum substances and chemicals, handling and disposal of solid and hazardous wastes, remediation of various types of contamination, and otherwise relating to health, safety and protection of the environment. For example, and without creating an exhaustive list: as with automobile dealerships generally, and service and parts and collision repair center operations in particular, our business involves the generation, use, handling, and disposal of hazardous or toxic substances and wastes and the use of above ground and underground storage tanks (ASTs and USTs). Operations involving the management of wastes and the use of ASTs and USTs are subject to requirements of the Resource Conservation and Recovery Act, analogous state statutes, and their implementing regulations. Pursuant to these laws, federal and state environmental agencies have established approved methods for handling, storing, treating, transporting, and disposing of regulated substances and wastes with which we must comply. We also are subject to laws and regulations governing responses to any releases of contamination at or from our facilities or at facilities that receive our hazardous wastes for treatment or disposal. The Comprehensive Environmental Response, Compensation and Liability Act ("CERCLA") and similar state statutes, can impose strict and joint and several liability for cleanup costs on those that are considered to have contributed to the release of a "hazardous substance." We also are subject to the Clean Water Act, analogous state statutes, and their implementing regulations which, among other things, prohibit discharges of pollutants into regulated waters without permits, require containment of potential discharges of oil or hazardous substances, and require preparation of spill contingency plans. Currently, we are not aware of any non-compliance with these or any other environmental requirements applicable to our operations, nor are we aware of any material remedial liabilities to which we are subject.
We have incurred, and will continue to incur, costs and capital expenditures to comply with these laws and regulations and to obtain and maintain all necessary environmental permits.regulations. We believe that our operations currently are being conducted in substantial compliance with all applicable environmental laws.regulations. From time to time, we may experience incidents and encounter conditions that are not in compliance with environmental laws and regulations. We may occasionally receive notices from environmentalgovernmental agencies regarding potential violations of environmentalthese laws or regulations. In such cases, we will work with the agencies to address any issues and to implement appropriate corrective action when necessary. However, none of our dealerships havehas been subject to any material environmental liabilities in the past, nor do we know of any fact or condition that would result in any material environmental liabilities being incurred in the future.
Mission and Vision
At Asbury, our North Star and our mission is to be the most guest-centric automotive retailer. Our success depends on our employees and their commitment to delivering a consistent and exceptional guest experience. Our employees work at locations in Colorado, Florida, Georgia, Indiana, Missouri, South Carolina, Texas, California, Arizona, New Mexico, Idaho, Utah, Washington, Virginia, Maryland and Delaware. We believe that our employees help to set us apart from our competitors, and, therefore, we understand they are our greatest asset. As a result, a critical part of our business strategy is investing in, supporting and developing our employees so that they are trained and incentivized to provide best-in-class service to our guests.
As of December 31, 2017,2023, we employed approximately 8,00015,000 full-time and part-time employees, none of whom were covered by collective bargaining agreements. We believe we have good relations with our employees.
We strive to recruit new employees based on their diversity of thought, background and experience as well as diversity of personal characteristics to best reflect our guests and communities we serve.
15
The goal of our diversity, equity and inclusion ("DE&I") efforts is to create more welcoming and inclusive workplaces throughout our dealerships and offices to enable us to attract, retain and develop the careers of diverse, highly talented team members. We intend to continue to learn and develop - working towards building a workplace where every Asbury team member feels included and welcomed.Our Chief Diversity Equity and Inclusion Officer and her team lead the strategic focus and execution of our DE&I strategy in partnership with our operations leadership and support teams throughout the company.
Community Outreach
Through our Asbury Cares program, we support selected community partner organizations to focus on reducing social inequality. Since 2021, we have awarded all of our employees with an additional 40 hours of paid time off per year that can only be used to volunteer with our local community partners. We have seen significant year-over-year growth in employee participation in our community engagement events.
A significant portion of our Asbury Cares Community Initiative revolves around education and making sure that young people in underserved communities have access to a quality education. We formed a partnership with HBCU Change, an app-based organization that lets users round up their spending and donate to historically black colleges and universities ("HBCU"). We learned that many HBCUs historically lag in funding and resources compared to other public or private universities and many have closed their doors in recent years. Many of our Asbury team members are proud HBCU alumni and these institutions provide a unique community of support and understanding for not only African American students, but students of all races and backgrounds.
In partnership with HBCU Change, we launched a campaign to help raise funds for HBCUs across the country and in the local communities where we operate. All the point-of-sale credit card machines in all our locations show a prompt asking our guests if they would like to round up their change or donate $1, $3, $5, or a custom amount to HBCUs in their communities. At the end of each quarter, the funds raised are donated to the HBCUs across the country. Through donations from our guests and company match, we have contributed more than $1 million to HBCUs since the start of our partnership with HBCU Change in May 2021.
Recruitment and Talent Development
When recruiting for open positions, we search for people of varying backgrounds, perspectives, and experiences in order to support a diverse and inclusive culture. We also partner with local colleges and trade schools to develop apprenticeship and internship programs. This allows us to help provide valuable training to entry-level candidates while also growing our pipeline.
Our goal is to promote employees from within to career growth opportunities whenever possible. We invest resources to train and develop our employees to reach their career goals. In 2022, we launched a training curriculum for all store positions. In addition, we offer our employees access to an online career path tool, which helps them plan their desired career path and see the required performance goals and milestones to be considered for a promotion. Our fixed operations organization encourages technicians to obtain and maintain certification status with our vehicle manufacturers, and in most cases, our dealership pays for the training. Our employees also attend vehicle manufacturer-sponsored and industry training events.
We pride ourselves on rewarding and developing talented and tenured employees.
Compensation and Benefits
We offer competitive compensation and benefits to attract and retain the best people, including the following benefits for our full-time employees:
•Health, dental, and vision benefits with multiple plan choices;
•Discounted healthcare premiums for biometric screening and completion of health survey; and
•Employee assistance program.
Saving and retirement
•Holiday match; and
•401(k) match.
16
Paid time off
•Up to 4 weeks paid time off;
•Paid pregnancy leave; and
•Paid parental leave.
Disability and accident insurance
•Short-term disability and long-term disability insurance;
•Accident insurance, hospital indemnity, employee critical illness insurance;
•Employer paid life insurance; and
•Supplemental life insurance.
Scholarships for education
•Annual scholarship program.
Broad employee equity ownership
•We also lead the industry by offering equity awards to frontline employees because we want them to be owners of our Company and committed to our long-term success.
Self-Insurance Programs
Due to the inherent risk in the automotive retail industry, our operations expose us to a variety of liabilities. These risks generally require significant levels of insurance covering liabilities such as claims from employees, customers, or other third parties, for personal injury and property relatedproperty-related losses occurring in the course of our operations. We may be subject to fines and civil and criminal penalties in connection with alleged violations of federal and state laws or regulatory environments. Further, the automobile retail industry is subject to substantial risk of real and personal property loss, due to the significant concentration of property values located at the various dealership locations.
Provisions for retained losses and deductibles are made by charges to expense based upon periodic evaluations of the estimated ultimate liabilities on reported and unreported claims. The insurance companies that underwrite our insurance require that we secure certain of our obligations for deductible reimbursements with collateral. Our collateral requirements are set by the insurance companies and, to date, have been satisfied by posting surety bonds, letters of credit, and/or cash deposits. Our collateral requirements may change from time to timetime-to-time based on, among other things, our claims experience.
17
Item 1A. Risk Factors
In addition to the other information contained, referred to or incorporated by reference into this report, you should consider carefully the following factors when evaluating our business and before making an investment decision. Our business, operations, ability to implement our strategy, reputation, results of operations, financial condition, cash flows, and prospects may be materially adversely affected by the risks described below. In addition, other risks or uncertainties not presently known to us or that we currently do not deem material could arise, any of which could also materially adversely affect us.
Risks Related to Our Business
Operating Risks
Disruptions in the production and delivery of new vehicles and parts from manufacturers due to the lack of availability of parts and key components from suppliers could have a material adverse effect on our business, results of operations, financial condition and cash flows.
Historically, we have generated a significant portion of our revenue through new vehicle sales, and new vehicle sales also tend to lead to sales of higher-margin products and services, such as F&I products and vehicle-related parts and service.In addition, new vehicle buyers often trade in an owned vehicle, or turn in a leased vehicle, to us at the time of purchase, and these traded vehicles have historically been an important source for our used vehicle inventory. We rely exclusively on the various vehicle manufacturers for our new vehicle inventory and maintenance and replacement parts inventory. In turn, our vehicle manufacturers rely on certain third-party suppliers to manufacture and deliver certain parts and key components for their vehicles. As a result, our profitability is dependent to a great extent on various aspects of vehicle manufacturers’ operations and timely delivery of new vehicles and parts.
Property loss or other uninsured liabilities could have a material adverse impact on our results of operations.
We are subject to substantial risk of property loss due to the significant concentration of property at dealership locations, including vehicles and parts. We have historically experienced business interruptions from time to time at several of our dealerships, due to actual or threatened adverse weather conditions or natural disasters, such as hurricanes, earthquakes, tornadoes, floods, hail storms, fires or other extraordinary events. Concentration of property at dealership locations also makes the automotive retail business particularly vulnerable to theft, fraud and misappropriation of assets. Illegal or unethical conduct by employees, customers, vendors, and unaffiliated third parties can result in loss of assets, disrupt operations, impact brand reputation, jeopardize manufacturer and other relationships, result in the imposition of fines or penalties, and subject us to governmental investigations or lawsuits. While we maintain insurance to protect against a number of losses, this insurance coverage often contains significant deductibles. In addition, we "self-insure" a portion of our potential liabilities, meaning we do not carry insurance from a third-party for such liabilities, and are wholly responsible for any related losses including for certain potential liabilities that some states prohibit the maintenance of insurance to protect against. In certain instances, our insurance may not fully cover a loss depending on the applicable deductible or the magnitude and nature of the claim. Additionally, changes in the cost or availability of insurance in the future could substantially increase our costs to maintain our current level of coverage or could cause us to reduce our insurance coverage and increase our self-insured risks. To the extent we incur significant additional costs for insurance, suffer losses that are not covered by in-force insurance or suffer losses for which we are self-insured, our financial condition, results of operations and cash flows could be materially adversely impacted.
If we are unable to acquire and successfully integrate additional businesses into our existing operations, and realize expected benefits and synergies from such acquisitions, our revenue and earnings growth may be adversely affected.
We believe that the automotive retailing industry is a mature industry whose sales are significantly impacted by the prevailing economic climate, both nationally and in local markets. Accordingly, we believe that our future growth depends in part on our ability to manage expansion, control costs in our operations and acquire and effectively integrate acquired dealerships into our organization. For example, with the recent consummation of the Koons acquisition, we will experience significantly more sales, and have more assets and employees than we did prior to the transaction. The integration processes require us to expend significant capital and significantly expand the scope of our operations and financial systems. Integration also requires support or other actions by third-parties such as vendors, suppliers, and licensing agencies and the untimely or inadequate responses from such third-parties can delay or otherwise negatively impact the integration process.
When seeking to acquire other dealerships, we often compete with several other national, regional and local dealership groups, and other strategic and financial buyers, some of which may have greater financial resources than us. Competition for attractive acquisition targets may result in fewer acquisition opportunities for us and we may have to forgo acquisition opportunities to the extent we cannot negotiate such acquisitions on acceptable terms.
18
We also face additional risks commonly encountered with growth through acquisitions. These risks include, but are not limited to: (i) failing to obtain manufacturers’ consents to acquisitions of additional franchises; (ii) incurring significant transaction-related costs for both completed and failed acquisitions; (iii) incurring significantly higher capital expenditures and operating expenses; (iv) failing to integrate the operations and personnel of the acquired dealerships and impairing relationships with employees; (v) incorrectly valuing entities to be acquired or incurring undisclosed liabilities at acquired dealerships; (vi) disrupting our ongoing business and diverting our management resources to newly acquired dealerships; (vii) failing to achieve expected performance levels; (viii) impairing relationships with manufacturers and customers as a result of changes in management; (ix) failing to realize expected benefits and synergies from the transaction; and (ix) failing to implement or improve controls, policies and information systems and related security measures in the acquired businesses.
We may not adequately anticipate all the demands that our growth will impose on our personnel, procedures and structures, including our financial and reporting control systems, information technology systems, data processing systems, and management structure. Moreover, our failure to retain qualified management personnel at any acquired dealership may increase the risks associated with integrating the acquired dealership. If we cannot adequately anticipate and respond to these demands, we may fail to realize acquisition synergies and our resources will be focused on incorporating new operations into our structure rather than on areas that may be more profitable.
We are a holding company and as a result are dependent on our operating subsidiaries to generate sufficient cash and distribute cash to us to service our indebtedness and fund our ongoing operations.
Our ability to make payments on our indebtedness and fund our ongoing operations depends on our operating subsidiaries' ability to generate cash in the future and distribute that cash to us. It is possible that our subsidiaries may not generate cash from operations in an amount sufficient to enable us to service our indebtedness. In addition, many of our subsidiaries are required to comply with the provisions of franchise agreements, dealer agreements, other agreements with manufacturers, mortgages, and credit facility providers. Many of these agreements contain minimum working capital or net worth requirements, and are subject to change at least annually. Although the requirements contained in these agreements did not restrict our subsidiaries from distributing cash to us as of December 31, 2023, unexpected changes to our financial metrics or to the terms of our franchise agreements, dealer agreements, or other agreements with manufacturers could require us to alter the manner in which we distribute or use cash. If our operating subsidiaries are unable to generate and distribute sufficient cash to us to service our indebtedness and fund our ongoing operations, our financial condition may be materially adversely affected.
Our inability to execute a substantial portion of our business strategy, including our mission to grow and transform our business, could have an adverse effect on our business, results of operations, financial condition and cash flows.
Our inability to execute a substantial portion of our business strategy, could adversely affect our business, results of operations, financial condition and cash flows. We seek to execute on our strategic plan using a variety of growth efforts including, driving same-store revenue growth and acquiring additional revenue through strategic acquisitions. Many of the factors that impact our ability to execute our strategic vision, such as the advancement of certain technologies, general economic conditions and legal and regulatory obstacles are beyond our control.
Consumers are increasingly shopping for new and used vehicles, automotive repair and maintenance service and other automotive products and services online and through mobile applications, including through third-party online and mobile sales platforms, with which we compete, that are designed to generate consumer sales that are sold to automotive dealers. We have invested and will continue to invest in our omni-channel and other online applications in furtherance of our strategic vision. We face increased competition for market share from other automotive retailers and other sales platforms that have also invested in digital channels. There can be no assurance that our initiatives and investments in digital channels will be successful or result in improved financial performance.
We may not adequately anticipate all the demands that our growth will impose on our personnel, procedures and structures, including our financial and reporting control systems, information technology systems, data processing systems, and management structure. Furthermore, we may decide to alter or discontinue aspects of our strategic plan and may adopt alternative or additional strategies in response to business or competitive factors or other factors or events beyond our control. We cannot give assurance that we will be able to execute a substantial portion of our strategic plan which could have a material adverse effect on our business, financial condition, results of operations, and cash flows.
19
Goodwill and manufacturer franchise rights comprise a significant portion of our total assets. We must test our goodwill and manufacturer franchise rights for impairment at least annually, which could result in a material, non-cash write-down of goodwill or manufacturer franchise rights and could have a material adverse effect on our results of operations and stockholders’ equity.
Our principal intangible assets are goodwill and our rights under our franchise agreements with vehicle manufacturers. Goodwill and indefinite-lived intangible assets, including manufacturer franchise rights, are subject to impairment assessments at least annually (or more frequently when events or changes in circumstances indicate that an impairment may have occurred), by applying a qualitative or quantitative assessment. A decrease in our market capitalization or profitability increases the risk of goodwill impairment. The fair value of our manufacturer franchise rights is determined by discounting a subset of the projected cash flows at a dealership that we attribute to the value of the franchise. Changes to the business mix or declining cash flows in a dealership increase the risk of impairment. During the year ended December 31, 2023, we recognized asset impairment charges of $117.2 million associated with manufacturer franchise rights recorded at certain dealerships and goodwill associated with certain asset disposal groups. We cannot accurately predict the amount and timing of any additional impairment charges at this time; however, any such impairment charge could have an adverse effect on our results of operations and stockholders' equity. See Note 10 "Goodwill and Intangible Franchise Rights" of the notes to the consolidated financial statements for more information.
The loss of key personnel and limited management and personnel resources could adversely affect our business.
Our success depends, to a significant degree, upon the continued contributions of our management team, and service and sales personnel. In addition, manufacturer dealer or framework agreements may require the prior approval of the applicable manufacturer before any change is made in dealership general managers or other management positions. The loss of the services of one or more of these key employees may materially impair the profitability of our operations, or may result in a violation of an applicable dealer or framework agreement. In addition, the market for qualified employees in the industry and in the states in which we operate, specifically for general managers and sales and service personnel, is highly competitive and may subject us to increased labor costs during periods of low unemployment. The loss of the services of such employees or the inability to attract additional qualified employees may adversely affect the ability of our dealerships to conduct their operations in accordance with the standards set by us or the manufacturers. If we are unable to retain our key personnel, we may be unable to successfully execute our business plans, which may have a material adverse effect on our business.
Risks Related to Macroeconomic and Market Conditions
The automotive retail industry is sensitive to unfavorable changes in general economic conditions and various other factors that could affect demand for our products and services, which could have a material adverse effect on our business, our ability to implement our strategy and our results of operations.
Our future performance will be impacted by general economic conditions including:including among other things: changes in employment levels; consumer demand, preferences and confidence levels; the availability and cost of credit; fuel prices; levels of discretionary personal income; inflation; and interest rates. Recently, inflation has increased throughout the U.S. economy. Inflation can adversely affect us by increasing the costs of labor, fuel and other costs as well as by reducing demand for automobiles. Sales of certain vehicles, particularly trucks and sport utility vehicles that historically have provided us with higher gross profit per vehicle retailed, may be sensitive to fuel prices. In addition, rapid changes in fuel prices can cause shifts in consumer preferences which are difficult to accommodate given the long lead-time of inventory acquisition. Inflation is also often accompanied by higher interest rates, which could reduce the fair value of our outstanding debt obligations. Changes in interest rates can also significantly impact new and used vehicle sales and vehicle affordability due to the direct relationship between interest rates and monthly loan payments, a critical factor for many vehicle buyers, and the impact interest rates have on customers’ borrowing capacity and disposable income. In an inflationary environment, depending on automotive industry and other economic conditions, we may be unable to raise prices to keep up with the rate of inflation, which would reduce our profit margins. We have experienced, and continue to experience, increases in the prices of labor, fuel and other costs of providing service. Continued inflationary pressures could impact our profitability.
We also are subject to economic, competitive, and other conditions prevailing in the various markets in which we operate, even if those conditions are not prominent nationally.
Retail vehicle sales are cyclical and historically have experienced periodic downturns characterized by oversupply and weak demand, which could result in a need for us to lower the prices at which we sell vehicles, which would reduce our revenue per vehicle sold and our margins. Additionally, a shift in consumer'sconsumer’s vehicle preferences driven by pricing, fuel costs or other factors may have a material adverse effect on our revenues, margins and results of operations.
20
Changes in general economic conditions may make it difficult for us to execute our business strategy. In such an event, we may be required to enter into certain transactions in order to generate additional cash, which may include, but not be limited to, selling certain of our dealerships or other assets or increasing borrowings under our existing, or any future, credit facilities. There can be no assurance that, if necessary, we would be able to enter into any such transactions in a timely manner or on reasonable terms, if at all. Furthermore, in the event we were required to sell dealership assets, the sale of any material portion of such assets could have a material adverse effect on our revenue and profitability.
Adverse conditions affecting one or more of the vehicle manufacturers with which we hold franchises or their inability to deliver a desirable mix of vehicles that our consumers demand could have a material adverse effect on our business, results of operations, financial condition and cash flows.
Historically, we have generated most of our revenue through new vehicle sales, and new vehicle sales also tend to lead to sales of higher-margin products and services, such as finance and insurance products and vehicle relatedvehicle-related parts and service. As a result, our profitability is dependent to a great extent on various aspects of vehicle manufacturers'manufacturers’ operations, many of which are outside of our control. Our ability to sell new vehicles is dependent on manufacturers'manufacturers’ ability to design and produce, and willingness to allocate and deliver to our dealerships, a desirable mix of popular new vehicles that consumers demand. PopularFor example, improvements in electric, battery-powered and hybrid gas/electric vehicles have increased consumer demand for such vehicles. If consumer demand increases for certain types of vehicles, including electric, battery-powered and hybrid gas/electric, and our manufacturers are not able to adapt and produce such vehicles that meet consumer demands, our new and used vehicle sales volumes, parts and service revenue and our results of operations may be adversely affected. Further, if manufacturers shift significant resources away from traditional production models to invest in clean vehicles and new technologies, we may experience an inadequate supply of historically popular vehicles and other adverse effects on our new and used vehicle sales volume, parts and service revenue and our results of operations until such time as consumer preferences for clean vehicles and other new technologies become widespread. In addition, popular vehicles may often be difficult to obtain from manufacturers for a number of reasons, including the fact that manufacturers generally allocate their vehicles to dealerships based on sales history and capital expenditures associated with such dealerships. Further, if a manufacturer fails to produce desirable vehicles or develops a reputation for producing undesirable vehicles or produces vehicles that do not comply with applicable laws or government regulations, and we own dealerships thatwhich sell that manufacturer'smanufacturer’s vehicles, our revenues from those dealerships could be adversely affected as consumers shift their vehicle purchases away from that brand.
Although we seek to limit our dependence on any one vehicle manufacturer, there can be no assurance that the brand mix allocated and delivered to our dealerships by the manufacturers will be appropriate or sufficiently diverse, to protect us from a significant decline in the desirability of vehicles manufactured by a particular manufacturer or disruptions in a manufacturer's ability to produce vehicles. For the year ended December 31, 2017,2023, manufacturers representing 5% or more of our revenues from new vehicle sales were as follows:
| Manufacturer (Vehicle Brands): | % of Total New Vehicle Revenues | ||||||||
Toyota Motor Sales, U.S.A., Inc. (Toyota and Lexus) | 27 | % | |||||||
Stellantis N.V. (Chrysler, Dodge, Jeep, Ram and Fiat) | 12 | % | |||||||
American Honda Motor Co., Inc. (Honda and Acura) | 12 | % | |||||||
Ford Motor Company (Ford and Lincoln) | 11 | % | |||||||
Mercedes-Benz USA, LLC (Mercedes-Benz | 9 | % | |||||||
| 6 | % | ||||||||
Hyundai Motor North America | 5 | ||||||||
Similar to automotive retailers, vehicle manufacturers may be affected by the long-term U.S. and international economic climate. In addition, we remain vulnerable to other matters that may impact the manufacturers of the vehicles we sell, many of which are outside of our control, including: (i) changes in their respective financial condition; (ii) changes in their respective marketing efforts; (iii) changes in their respective reputation; (iv) manufacturer and other product defects, including recalls; (v) changes in their respective management; (vi) disruptions in the production and delivery of vehicles and parts due to natural disasters, pandemics or other reasons; and (vii) issues with respect to labor relations. Our business is highly dependent on consumer demand and brand preferences for our manufacturersmanufacturers’ products. Manufacturer recall campaigns are a common occurrence that have accelerated in frequency and scope over the last several years.scope. Manufacturer recall campaigns could (i) adversely affect our new and used vehicle sales or customer residual trade-in valuations, could(ii) cause us to temporarily remove vehicles from our inventory, could(iii) force us to incur increased costs, and could(iv) expose us to litigation and adverse publicity related to the sale of recalled vehicles, which could have a material adverse effect on our business, results of operations, financial condition and cash flows. Vehicle manufacturers that produce vehicles outside of the U.S. are subject to additional risks including changes in quotas, tariffs or
21
duties, fluctuations in foreign currency exchange rates, regulations governing imports and the costs related thereto, and foreign governmental regulations.
Adverse conditions that materially affect a vehicle manufacturer and its ability to profitably design, market, produce or distribute desirable new vehicles could in turn materially adversely affect our ability to (i) sell vehicles produced by that manufacturer, (ii) obtain or finance our new vehicle inventories, (iii) access or benefit from manufacturer financial assistance programs, (iv) collect in full or on a timely basis any amounts due therefrom, and/or (v) obtain other goods and services provided by the impacted manufacturer. In addition, we depend on manufacturers'manufacturers’ ability to design, produce, and supply parts to us and any failure to do so could have a material adverse effect on our parts and services business. Our business, results of operations, financial condition, and cash flows could be materially adversely affected as a result of any event that has an adverse effect on any vehicle manufacturer.
In addition, if a vehicle manufacturer'smanufacturer’s financial condition worsens and it seeks protection from creditors in bankruptcy or similar proceedings, or otherwise under the laws of its jurisdiction of organization, (i) the manufacturer could seek to terminate or reject all or certain of our franchises, (ii) if the manufacturer is successful in terminating all or certain of our franchises, we may not receive adequate compensation for those franchises, (iii) our cost to obtain financing for our new vehicle inventory
may increase or no longer be available from such manufacturer'smanufacturer’s captive finance subsidiary, (iv) consumer demand for such manufacturer'smanufacturer’s products could be materially adversely affected, especially if costs related to improving such manufacturer'smanufacturer’s financial condition are factored into the price of its products, (v) there may be a significant disruption in the availability of consumer credit to purchase or lease that manufacturer'smanufacturer’s vehicles or negative changes in the terms of such financing, which may negatively impact our sales, or (vi) there may be a reduction in the value of receivables and inventory associated with that manufacturer, among other things. The occurrence of any one or more of these events could have a material adverse effect on our business, results of operations, financial condition, and cash flows.
Furthermore, the automotive manufacturing supply chain spans the globe. As such, supply chain disruptions resulting from natural disasters, adverse weather, pandemics, labor stoppages and other events may affect the flow of vehicle and parts inventories to us or our manufacturing partners. If we experience disruptions in the supply of vehicle and parts inventories, such disruptions could have a material adverse effect on our business, results of operations, financial condition, and cash flows.
Substantial competition in automobile sales and services may have a material adverse effect on our results of operations.
The automotive retail and service industry is highly competitive with respect to price, service, location, and selection. Our competition includes: (i) franchised automobile dealerships in our markets that sell the same or similar new and used vehicles; (ii) privately negotiated sales of used vehicles; (iii) other used vehicle retailers, including regional and national vehicle rental companies; (iv) companies with a primarily internet-based business model, such as Carvana, and used vehicle brokers that sell used vehicles to consumers; (v) service center and parts supply chain stores; and (vi) independent service and repair shops.
We do not have any cost advantage over other retailers in purchasing new vehicles from manufacturers. We typically rely on our advertising, merchandising, sales expertise, service reputation, strong local branding and dealership location to sell new vehicles. Because our dealer agreements only grant us a non-exclusive right to sell a manufacturer’s product within a specified market area, our revenues, gross profit and overall profitability may be materially adversely affected if competing dealerships expand their market share. Further, our vehicle manufacturers may decide to award additional franchises in our markets in ways that negatively impact our sales.
The internet has become a significant part of the advertising and sales process in our industry. Customers are using the internet to shop, and compare prices, for new and used vehicles, automotive repair and maintenance services, finance and insurance products and other automotive products. If we are unable to effectively use the internet to attract customers to our own online channels, and mobile applications, and, in turn, to our stores, our business, financial condition, results of operations and cash flows could be materially adversely affected. Additionally, the growing use of social media by consumers increases the speed and extent that information and opinions can be shared, and negative posts or comments on social media about us or any of our stores could damage our reputation and brand names, which could have a material adverse effect on our business, financial condition, results of operations and cash flows.
Additionally, we rely on the protection of state franchise laws in the states in which we operate and if those laws are repealed or weakened, our framework, franchise and related agreements may become more susceptible to termination, nonrenewal or renegotiation. These laws have historically restricted the ability of automobile manufacturers to directly enter the retail market and sell vehicles directly to consumers. However, many states have recently passed or introduced legislation to permit direct to consumer sales of electric vehicles by certain companies, such as Tesla and Rivian, without the requirements of establishing a dealer network. If the state franchise laws are repealed, weakened or amended to permit vehicle manufacturers to sell vehicles (whether electric or not) directly to consumers, they may be able to have a competitive advantage over the
22
traditional dealers, which could have a material adverse effect on our sales in those states, which in turn, could have a material adverse effect on our business, financial condition, results of operations and cash flows.
We are dependent upon our relationships with the manufacturers of vehicles that we sell and are subject to restrictions imposed by, and significant influence from, these vehicle manufacturers. Any of these restrictions or any changes or deterioration of these relationships could have a material adverse effect on our business, financial condition, results of operations and cash flows.
We are dependent on our relationships with the manufacturers of the vehicles we sell, which have the ability to exercise a great deal of control and influence over our day-to-day operations, as a result of the terms of our dealer, framework and related agreements. We may obtain new vehicles from manufacturers, service vehicles, sell new vehicles and display vehicle manufacturers’ trademarks only to the extent permitted under these agreements. The terms of these agreements may conflict with our interests and objectives and may impose limitations on key aspects of our operations, including acquisition strategy and capital spending.
For example, manufacturers can set performance standards with respect to sales volume, sales effectiveness and customer satisfaction, and require us to obtain manufacturer consent before we can acquire dealerships selling a manufacturer’s automobiles. From time to time, we may be precluded under agreements with certain manufacturers from acquiring additional franchises, or subject to other adverse actions, to the extent we are not meeting certain performance criteria at our existing stores (with respect to matters such as sales volume, customer satisfaction and sales effectiveness) until our performance improves in accordance with the agreements, subject to applicable state franchise laws. In addition, many vehicle manufacturers place limits on the total number of franchises that any group of affiliated dealerships may own and certain manufacturers place limits on the number of franchises or share of total brand vehicle sales that may be maintained by an affiliated dealership group on a national, regional or local basis, as well as limits on store ownership in contiguous markets. If we reach any of these limits, we may be prevented from making further acquisitions, or we may be required to dispose of certain dealerships, which could adversely affect our future growth. We cannot provide assurance that manufacturers will approve future acquisitions timely, if at all, which could significantly impair the execution of our acquisition strategy.
In addition, certain manufacturers use a dealership’s manufacturer-determined customer satisfaction index ("CSI") score as a factor governing participation in incentive programs. To the extent we do not meet minimum score requirements, our future payments may be materially reduced or we may be precluded from receiving certain incentives, which could materially adversely affect our business, financial condition, results of operations and cash flows.
Manufacturers also typically establish facilities and minimum capital requirements for dealerships on a case-by-case basis. In certain circumstances, including as a condition to obtaining consent to a proposed acquisition and qualifying for certain financial incentives, a manufacturer may require us to remodel, upgrade or move our facilities, and capitalize the subject dealership at levels we would not otherwise choose to fund, causing us to divert our financial resources away from uses that management believes may be of higher long-term value to us. Delays in obtaining, or failing to obtain, manufacturer consent, would impede our ability to execute acquisitions that we believe would integrate well with our overall strategy and limit our ability to expand our business.
Manufacturers can also establish new franchises or relocate existing franchises, subject to applicable state franchise laws. The establishment or relocation of franchises in our markets could have a material adverse effect on the business, financial condition and results of operations of our dealerships in the market in which the action is taken.
Manufacturers may also limit our ability to divest one or more of our franchise dealerships in a timely manner. Most of our dealer agreements provide the manufacturer with a right of first refusal to purchase any of the manufacturer’s franchises we seek to sell. Divestitures of our franchise dealerships may also require manufacturer consent and failure to obtain consent would require us to find another potential buyer or wait until the buyer is able to meet the requirements of the manufacturer. A delay in the sale of a dealership could have a negative impact on our business, financial condition, results of operations, and cash flows.
Manufacturers may terminate or may not renew our dealer and framework agreements, or may compel us to divest our dealerships, for a number of reasons, including default under the agreement, any unapproved change of control (which specific changes vary from manufacturer to manufacturer, but which include material changes in the composition of our Board of Directors during a specified time period, the acquisition of 5% or more of our voting stock by another vehicle manufacturer or distributor, the acquisition of 20% or more of our voting stock by third parties, and the acquisition of an ownership interest sufficient to direct or influence management and policies), or certain other unapproved events (including certain extraordinary corporate transactions such as a merger or sale of all or substantially all of our assets). Triggers of these clauses are often based upon actions by our stockholders and are generally outside of our control. Restrictions on any unapproved changes of ownership or management may adversely impact our value, as they may prevent or deter prospective acquirers from gaining
23
control of us. In addition, actions taken by a manufacturer to exploit its bargaining position in negotiating the terms of renewals of franchise agreements or otherwise could also have a material adverse effect on our revenues and profitability.
There can be no assurances that we will be able to renew our dealer and framework agreements on a timely basis, on acceptable terms, or at all. Our business, financial condition and results of operations may be materially adversely affected to the extent that our rights become compromised or our operations are restricted due to the terms of our dealer or framework agreements or if we lose franchises representing a significant percentage of our revenues due to the termination of, or failure to renew, such agreements.
If vehicle manufacturers reduce or discontinue sales incentive, warranty or other promotional programs, our business, financial condition, results of operations and cash flows may be materially adversely affected.
We benefit from certain sales incentive, warranty, and other promotional programs of vehicle manufacturers that are intended to promote and support their respective new vehicle sales. Key incentive programs include: (i) customer rebates on new vehicles; (ii) dealer incentives on new vehicles; (iii) special financing or leasing terms; (iv) warranties on new and used vehicles; and (v) sponsorship of used vehicle sales by authorized new vehicle dealers.
Vehicle manufacturers often make many changes to their incentive programs. Any reduction or discontinuation of manufacturers’ incentive programs for any reason, including a supply and demand imbalance, may reduce our sales volume which, in turn, could have a material adverse effect on our business, financial condition, results of operations and cash flows.
Technological advances, including electrification of vehicles and adoption of autonomous vehicles in the long-term, could have a material adverse effect on our business.
The automotive industry is predicted to experience change over the long-term. Technological advances are facilitating the development of electric, battery powered and hybrid gas/electric vehicles and autonomous vehicles. While most major vehicle manufacturers have announced plans to electrify some or all of their new vehicle offerings, the eventual timing of widespread availability of electric, battery powered and hybrid gas/electric vehicles and driverless vehicles is uncertain due to regulatory requirements, additional technological requirements, and uncertain consumer acceptance of these vehicles. We expect to continue to sell electric, battery powered and hybrid gas/electric vehicles through our dealerships, however, the effect of these vehicles on the automotive retail business is uncertain and could include changes in the level of the new and used vehicle sales, the price of new and used vehicles and the levels of service required for such vehicles and the profitability of our parts and service business, our finance and insurance business, including our TCA business, and the role of franchised dealers, any of which could materially adversely affect our business, financial condition, results of operations and cash flows.
Risks Related to Our Indebtedness and Financial Matters
Our outstanding indebtedness, ability to incur additional debt and the provisions in the agreements governing our debt, and certain other agreements, could have a material adverse effect on our business, financial condition, results of operations, and cash flows.
As of December 31, 2017,2023, we had total debt of $879.3 million, which excludes$3.23 billion and total floor plan notes payable, net of $732.1 million.$1.79 billion. We have the ability to incur substantial additional debt in the future to finance, among other things, acquisitions, working capital and capital expenditures, and new and used vehicle inventory, as well as to refinance new and used vehicle inventory, subject in each case to the restrictions contained in our debt instruments and other agreements existing at the time such indebtedness is incurred. We will continue to have substantial debt service obligations, consisting of required cash payments of principal and interest, for the foreseeable future.
Our debt service obligations could have important consequences to us for the foreseeable future, including the following: (i) our ability to obtain additional financing, or to obtain such financing on attractive terms, for acquisitions, capital expenditures, working capital or other general corporate purposes may be impaired; (ii) a substantial portion of our cash flow from operating activities must be dedicated to the payment of principal and interest on our debt, thereby reducing the funds available to us for our operations and other corporate purposes; (iii) some of our borrowings are and will continue to be at variable rates of interest, which exposes us to certain risks of interest rate increases; and (iv) we may be or become substantially more leveraged than some of our competitors, which may place us at a relative competitive disadvantage and make us more vulnerable to changes in market conditions and governmental regulations.
In addition to our ability to incur additional debt in the future, there are operating and financial restrictions and covenants, such as leverage covenants, in certain of our debt and mortgage agreements, including the agreement governing our senior credit facility, the indenture governing our senior notes2023 Senior Credit Facility and our mortgage agreements and related mortgage guarantees, as well as certain other agreements to which we are a party that may adversely affect our ability to finance our future operations or capital needs or to pursue certain business activities. These limit, among other things, our ability to incur certain additional debt, create certain liens or other
24
encumbrances and make certain payments (including dividends and repurchases of our common stock and for investments). Certain of these agreements also require us to maintain compliance with certain financial ratios.ratios, including, but not limited to, our adjusted net leverage ratio.
Our failure to comply with any of these covenants in the future could constitute a default under the relevant agreement, which could, depending on the relevant agreement, (i) entitle the creditors under such agreement to terminate our ability to borrow under the relevant agreement and accelerate our obligations to repay outstanding borrowings; (ii) require us to repay those borrowings; (iii) entitle the creditors under such agreement to foreclose on the property securing the relevant indebtedness; or (iv) prevent us from making debt service payments on certain of our other indebtedness, any of which would have a material adverse effect on our business, financial condition, results of operations orand cash flows. In many cases, a default under one of our debt, mortgage, or other agreements, could trigger cross-default provisions in one or more of our other debt or mortgage agreements. There can be no assurance that our creditors would agree to an amendment or waiver of our covenants. In the event we obtain an amendment or waiver, we would likely incur additional fees and higher interest expense.
In addition to the financial and other covenants contained in our various debt or mortgage agreements, certain of our lease agreements contain covenants that give our landlords the right to terminate the lease, seek significant cash damages, or evict us from the applicable property, if we fail to comply. Similarly, our failure to comply with any financial or other covenants in any of our framework agreements would give the relevant manufacturer certain rights, including the right to reject proposed acquisitions, and may give it the right to repurchase its franchises from us. Events that give rise to such rights, and our inability to acquire additional dealerships or the requirement that we sell one or more of our dealerships at any time, could inhibit the growth of our business, and could have a material adverse effect on our business, financial condition, results of operations and cash flows. Manufacturers may also have the right to restrict our ability to provide guarantees of our operating companies, pledges of the capital stock of our subsidiaries and liens on our assets, which could materially adversely effectaffect our ability to obtain financing for our business and operations on favorable terms or at desired levels, if at all.
The occurrence of any one of these events may limit our ability to take strategic actions that would otherwise enable us to manage our business in a manner in which we otherwise would, absent such limitations, which could materially adversely affect our business, financial condition, results of operations and cash flows.
Our business, financial condition and results of operations may be materially adversely affected by increases in interest rates.
We generally finance our purchases of new vehicle inventory, have the ability to finance the purchases of used vehicle inventory, and have the availability to borrow funds for working capital under our senior secured credit facilities that charge interest at variable rates. Therefore, our interest expense from variable rate debt will rise with increases in interest rates. In addition, a significant rise in interest rates may also have the effect of depressing demand in the interest rate sensitive aspects of our business, particularly new and used vehicle sales and the related profit margins and F&I revenue per vehicle, because most of our customers finance their vehicle purchases.As a result, rising interest rates may have the effect of simultaneously increasing our capital costs and reducing our revenues. Given our variable interest rate debt and floor plan notes payable outstanding as of December 31, 2017,2023, each one percent increase in market interest rates would increase our total annual interest expense by as much as $7.2approximately $18.1 million. When considered in connection with reduced expected sales, as and if interest rates increase, any such increase could materially adversely affect our business, financial condition and results of operations.
Our vehicle sales, financial condition and results of operations may be materially adversely affected by changes in costs or availability of consumer financing.
The majority of vehicles purchased by our customers are financed. Reductions in the availability of credit to consumers have contributed to declines in our vehicle sales in past periods. Reductions in available consumer credit or increased costs of that credit, could result in a decline in our vehicle sales, which would have a material adverse effect on our financial condition and results of operations.
Lenders that have historically provided financing to those buyers who, for various reasons, do not have access to traditional financing, including those buyers who have a poor credit history or lack the down payment necessary to purchase a vehicle, are often referred to as subprime lenders. If market conditions cause subprime lenders to tighten credit standards, or if interest rates increase, the ability to obtain financing from subprime lenders for these consumers to purchase vehicles could become limited, resulting in a decline in our vehicle sales, which in turn, could have a material adverse effect on our financial condition and results of operations.
25
We may haveidentify a material adverse effect on our results of operations.
As described under Item 9A. "Controls and Procedures" below, we previously concluded that sell the same or similar new and used vehicles; (ii) privately negotiated sales of used vehicles; (iii) other used vehicle retailers, including regional and national vehicle rental companies; (iv) Internet-based used vehicle brokers that sell used vehicles to consumers; (v) service center and parts supply chain stores; and (vi) independent service and repair shops.
During 2023, we completed the termsremediation measures related to the material weakness and we have concluded that our internal control over financial reporting is effective as of December 31, 2023. Completion of remediation does not provide assurance that our remediation or other controls will continue to operate properly. Failure to maintain effective internal control over financial reporting may adversely affect the accuracy and reliability of our dealer, framework,financial statements and related agreements. We may obtain new vehicles from manufacturers, service vehicles, sell new vehicles, and display vehicle manufacturers' trademarks only to the extent permitted under these agreements. The terms of these agreements may conflict with our interests and objectives and may impose limitations on key aspects of our operations, including acquisition strategy and capital spending.
If state laws that protect automotive retailers are repealed, weakened, or superseded by our framework agreements with manufacturers, our dealerships will be more susceptible to termination, non-renewal, or renegotiation of their dealer agreements,which could have a material adverse effect on our business, results of operations, financial condition and results of operations.cash flows.
Applicable state laws generally provide that an automobile manufacturer may not terminate or refuse to renew a dealer agreement unless it has first provided the dealer with written notice setting forth "good cause" and stating the grounds for termination or non-renewal. Many states also limit the circumstances in which an automobile manufacturer may sell vehicles directly to consumers.Some state laws allow dealers to file protests or petitions or allow them to attempt to comply with the manufacturer'smanufacturer’s criteria within a notice period to avoid the termination or non-renewal. Our framework agreements with certain manufacturers contain provisions that, among other things, attempt to limit the protections available to dealers under these laws, and, though unsuccessful to date, manufacturers'manufacturers’ ongoing lobbying efforts may lead to the repeal or revision of these laws. If these laws are repealed in the states in which we operate, manufacturers may be able to terminate our franchises without providing advance notice, an opportunity to cure or a showing of good cause. Without the protection of these state laws, it may also be more difficult for us to renew our dealer agreements upon expiration. Changes in laws that provide manufacturers the ability to terminate our dealer agreements could materially adversely affect our business, results of operations, financial condition and results of operations.cash flows. Furthermore, if a manufacturer seeks protection from creditors in bankruptcy, courts have held that the federal bankruptcy laws may supersede the state laws that protect automotive retailers resulting in either the termination, non-renewal or rejection of franchises by such manufacturers, which, in turn, could materially adversely affect our business, result of operations, financial condition and cash flows.Market disruptors continue to push for legislation permitting direct-to-consumer sales models; if those lobbying efforts are successful, automotive manufacturers could bypass the traditional franchised dealer network, which in turn could materially adversely affect our business, results of operations.operations, financial condition and cash flows.
New laws, regulations, or governmental policies in response to climate change, including fuel economy and greenhouse gas emission standards, or changes to existing standards, could adversely impact our business, results of operations, financial condition, cash flow, and prospects.
New laws and regulations designed to address climate change concerns could affect vehicle manufacturers’ ability to produce cost effective vehicles. For example, laws and regulations enacted that directly or indirectly affect vehicle manufacturers (through an increase in the cost of production or their ability to produce satisfactory products) or our business (through an impact on our inventory availability, cost of sales, operations or demand for the products we sell) could materially adversely impact our business, results of operations, financial condition, cash flow, and prospects. In addition, vehicle manufacturers are subject to government-mandated fuel economy and greenhouse gas, or GHG, emission standards, which continue to change and become more stringent over time. Significant increases in fuel economy requirements or new federal or state restrictions on emissions of carbon dioxide that may be imposed on vehicles and automobile fuels could adversely affect demand for vehicles, annual miles driven or the products we sell or lead to changes in automotive technology.
26
A failure of any of our management information systems or those of our third-party service providers, or a data security breach with regard to personally identifiable information ("PII") about our customers or employees, could have a material adverse effect on our business, financial condition, results of operations, financial condition and cash flows.
We depend on the efficient operation of our information systems and those of our third partythird-party service providers. We rely on management information systems at our dealerships in all aspects of our sales and service efforts, as well in the preparation of our consolidated financial and operating data. All of our dealerships currently operate on two dealer management systems ("DMS"). Additionally, in the ordinary course of business, we and our partners receive significant PII about our customers in order to complete the sale or service of a common DMS. vehicle and related products. We also receive PII from our employees. The regulatory environment surrounding information security and privacy is increasingly demanding, with numerous state and federal regulations, as well as payment card industry and other vendor standards, governing the collection and maintenance of PII from consumers and other individuals.
Cyber incidents can result from human error or intentional (or deliberate) attacks or unintentional events by insiders (e.g., employees) or third parties, including cybercriminals, competitors, nation-states and “hacktivists,” among others. Cyber incidents can include, for example, phishing, credential harvesting or use of stolen access credentials, unauthorized access to systems, networks or devices (for example, through hacking activity), structured query language attacks, infection from or spread of malware, ransomware, computer viruses or other malicious software code, corruption of data, exfiltration of data to malicious sites, the dark web or other locations or threat actors, the use of fraudulent or fake websites, and other attacks (including, but not limited to, denial-of-service attacks on websites), which shut down, disable, slow, impair or otherwise disrupt operations, business processes, technology, connectivity or website or internet access, functionality or performance. In addition to intentional cyber incidents, unintentional cyber incidents can occur (for example, the inadvertent release of confidential or non-public personal information). Changes to our business, processes, systems, or technology, if not implemented properly, can increase our vulnerability to cyber incidents.
Our business could be significantly disrupted if (i) the DMS fails to integrate with other third-party management information systems, customer relations management tools or other software, or to the extent that any of these systems become unavailable to us or fail to perform as designed for an extended period of time or (ii) our relationship with our DMS providerproviders or any other third-party provider deteriorates. Additionally, any disruption to access and connectivity of our information systems due to natural disasters, power loss or other reasons could disrupt our business operations, impact sales and results of operations, expose us to customer or third partythird-party claims, or result in adverse publicity.
criminal investigations or actions, and infringe on proprietary information, any of which could have a material adverse effect on our business, financial condition, or results of operations.operations or cash flows.
Our dealership operations and facilities are subject to extensive governmental laws and regulations. If we are found to be in purported violation of or subject to liabilities under any of these laws or regulations, or if new laws or regulations are enacted that adversely affect our operations, our business, our reputation,results of operations, financial condition, results of operations,cash flows, reputation and prospects could suffer.
The automotive retail industry, including our facilities and operations, is subject to a wide range of federal, state, and local laws and regulations, such as those relating to motor vehicle sales, retail installment sales, leasing, finance and insurance, marketing, licensing, consumer protection, consumer privacy, escheatment, anti-money laundering, environmental, vehicle emissions and fuel economy, and health and safety. In addition, with respect to employment practices, we are subject to various
27
laws and regulations, including complex federal, state, and local wage and hour and anti-discrimination laws. The violation of the laws or regulations to which we are subject could result in administrative, civil, or criminal sanctions against us, which may include a cease and desist order against the subject operations or even revocation or suspension of our license to operate the subject business, as well as significant fines and penalties. Violation of certain laws and regulations to which we are subject may also subject us to consumer class action or other lawsuits or governmental investigations and adverse publicity. We currently devote significant resources to comply with applicable federal, state, and local regulation of health, safety, environmental, zoning and land use regulations, and we may need to spend additional time, effort, and money to keep our operations and existing or acquired facilities in compliance therewith.
In addition, there is a risk that our employees could engage in misconduct that violates the laws or regulations to which we are subject. It is not always possible to detect or deter employee misconduct, and the precautions we take to detect and prevent this activity may not be effective in all cases. If any of our employees were to engage in misconduct or were to be accused of such misconduct, our business and reputation could be adversely affected.
The Dodd-Frank Act, which was signed into law on July 21, 2010, established the CFPB an independent federal agency funded by the United States Federal Reserve with broaddoes not have direct regulatory powers and limited oversight from the United States Congress. Althoughauthority over automotive dealers are generally excluded, the Dodd-Frank Actbut could lead toimplement additional, indirect regulation of automotive dealers, in particular, their sale and marketing of finance and insurance products, through its regulation of automotive finance companies and other financial institutions. In addition, the CFPB possesses supervisory authority with respect to certain non-bank lenders, including automotive finance companies, participating in automotive financing. The Dodd-Frank Act also provided the FTC with new and expanded authority regarding automotive dealers. Since then, the FTC has been gathering information on consumer protection issues through roundtables, public comments and consumer surveys. The FTC may exercise its additional rule-making authority to expand consumer protection regulations relating to the sale, financing and leasing of motor vehicles.
In 2014, the FTC implemented an enforcement initiative relating to the advertising practices of automotive dealers. In connection therewith, in May 2016, we signed a consent order with the FTC to settle allegations that in certain instances our advertisements did not adequately disclose information about used vehicles with open safety recalls. Under the consent order, we did not agree to make any payments or admit wrong-doing, but we did agree to make certain disclosures in marketing materials and at the point of sale and comply with certain record-keeping obligations. Our failure to comply with the consent order may result in the imposition of significant fines and/or penalties, which could have a material adverse effect on our results of operations. In January 2024, the FTC published the Combatting Auto Retail Scams Final Rule (the “CARS Rule”), which prohibits a broad range of current accepted industry sales and marketing practices and imposes significant new dealer disclosure obligations and record-keeping requirements throughout the vehicle-buying process.The FTC has stayed the CARS Rule’s original effective date of July 30, 2024 pending the resolution of a judicial challenge to the CARS Rule.Compliance with the CARS Rule, if it becomes effective, would be burdensome and cause us to incur increased costs.A failure to comply with the CARS Rule would expose us to potential significant damages, penalties and adverse publicity, which could have a material adverse effect on our business, operations and financial results.
Continued pressure from the CFPB, FTC, and other federal agencies could lead to significant changes in the manner that dealers are compensated for arranging customer financing and vehicle protection products, and while it is difficult to predict how any such changes might impact us, any adverse changes could have a material adverse impact on our finance and insurance business and results of operations. Furthermore, we expect that new laws and regulations, particularly at the federal level, in other areas may be enacted, which could also materially adversely impact our business. On August 3, 2022, we received a Civil Investigative Demand (“CID”) from the FTC requesting information and documents concerning the Company’s corporate structure and operation of six of its dealerships. We responded to the CID by producing information and documents for the period August 1, 2019 to April 24, 2023. On February 8, 2024, the FTC staff counsel sent to us a proposed consent order and draft complaint, alleging that the Company and three of our dealerships had violated Section 5 of the Federal Trade Commission Act (“FTC Act”) and certain provisions of the Equal Credit Opportunity Act (“ECOA”) in connection with the sale of add-on products (e.g., vehicle service contracts, maintenance plans, etc.), and advising that it would recommend the filing of an enforcement action if the Company did not settle the FTC’s claims. The Company disputes the FTC’s allegations that it violated the FTC Act and the ECOA, and is currently involved in discussions with the FTC staff regarding the matter. There can be no assurance that negotiations between us and the FTC for a favorable settlement will be successful, or that we will succeed in any litigation as a result of the investigation. At this time, we are unable to reasonably predict the possible outcome of this matter, or provide a reasonably possible range of loss, if any, as a result of the investigation. If the FTC files a suit against us based on these allegations, whether meritorious or not, it may adversely affect our ability to attract customers, result in the loss of existing customers, harm our reputation and cause us to incur defense costs and other expenses.
Environmental laws and regulations govern, among other things, discharges into the air and water, storage of petroleum substances and chemicals, the handling and disposal of solid and hazardous wastes, investigation and remediation of contamination, and otherwise protective of health, safety and the environment.contamination. Similar to many of our competitors, we have incurred and expect to continue to incur capital and operating expenditures and other costs to comply with such federal and state statutes.laws and regulations. In addition, we may become subject to broad liabilities arising out of contamination at our currently and formerly owned or operated facilities, at locations to which hazardous substances were transported from such facilities, and at such locations related to entities formerly affiliated with us.
28
Liability under these laws and regulations can be imposed on a joint and several basis and without regard to fault. For such potential liabilities, we believe we are entitled to indemnification from other entities. However, we cannot assure youprovide assurance that such entities will view their obligations as we do or will be able or willing to satisfy them. We may have indemnity obligations for liabilities relating to contamination at our currently or formerly owned and/or operated facilities as part of the acquisition or divestiture of certain properties in the ordinary course of business. Failure to comply with applicable laws and regulations, or significant additional expenditures required to maintain compliance therewith, could have a material adverse effect on our business, results of operations, financial condition or cash flows.
A significant judgment against us or the imposition of a significant fine could have a material adverse effect on our business, financial condition and future prospects. We further expect that, from time to time, new laws and regulations,
particularly in the environmental area, will be enacted, and compliance with such laws, or penalties for failure to comply, could significantly increase our costs. For example, vehicle manufacturers are subject to government-mandated fuel economy and greenhouse gas emission standards, which continue to change and become more stringent over time. Specifically, vehicle manufacturers are subject to corporate average fuel economy standards ("CAFE") for passenger cars and light trucks. Failure of a manufacturer to develop passenger vehicles and light trucks that meet CAFE and/or greenhouse gas emissionthese and other government standards could subject the manufacturer to substantial penalties, increase the cost of vehicles sold to us, and adversely affect our ability to market and sell vehicles to meet consumer needs and desires, which could have a material adverse effect on our business, results of operations, financial condition or cash flows.
Our TCA business is subject to a wide range of federal, state, and local laws and regulations, some of which we may not have previously been subject. If we are found to be in purported violation of or subject to liabilities under any of these laws or regulations, or if new laws or regulations are enacted that adversely affect our TCA business, our business, results of operations, financial condition, cash flows, reputation and prospects could suffer.
The TCA business is, and will continue to be, subject to a wide range of federal, state, and local laws and regulations, some of which Asbury may not have been previously subject. Such laws and regulations include but are not limited to:
•state and local licensing requirements;
•federal and state laws regulating vehicle finance and insurance products; and
•federal and state consumer protection laws.
No assurance can be given that applicable statutes, regulations, and other laws will not be amended or construed differently, that new laws will not be adopted, or that any of these laws will not be enforced more aggressively. For example, changes in the regulatory and supervisory environments could adversely affect the TCA business in substantial and unpredictable ways. Further, the TCA business’ noncompliance with applicable laws (whether as a result of changes in interpretation or enforcement, system or human errors, or otherwise) could result in the suspension or revocation of licenses or registrations necessary to the operation, or the initiation of enforcement actions or private litigation.
In addition, we are required to set aside an amount of restricted cash sufficient to satisfy potential claims associated with the TCA business. While we are permitted to invest such cash in fixed income and equity securities, and other investments, we cannot provide any assurance that a loss in such investments would not have a material adverse effect on our ability to honor customers’ claims, which could have a material adverse effect on our business.
We are subject to risks related to the provision of employee health care benefits, which could have a material adverse effect on our business, financial condition, results of operations, financial condition and cash flows.
We use a combination of insurance and self-insurance for health care plans. We record expenses under those plans based on estimates of the costs of expected claims, administrative costs, stop-loss insurance premiums, and expected health care trends. Actual costs under these plans are subject to variability that is dependent upon participant enrollment, demographics and the actual costs of claims made. Negative trends in any of these areas could cause us to incur additional unplanned health care costs, which could adversely impact our business, financial condition, results of operations and cash flows. In addition, if enrollment in our health care plans increases significantly, the additional costs that we will incur may be significant enough to materially affect our business, financial condition, results of operations and cash flows.
We are, and expect to continue to be, subject to legal and administrative proceedings, which, if the outcomes are adverse to us, could have a material adverse effect on our business, financial condition, results of operations, financial condition, cash flows, reputation and cash flows.prospects.
We are involved and expect to continue to be involved in numerous legal proceedings arising out of the conduct of our business, including litigation with customers, employment-related lawsuits, class actions, purported class actions, and actions brought by governmental authorities. We do not believe that the ultimate resolution of any known matters will have a material
29
adverse effect on our business, reputation, financial condition, results of operations, cash flows or cash flows.prospects. However, the results of these matters cannot be predicted with certainty, and an unfavorable resolution of one or more of these matters could have a material adverse effect on our business, financial condition, results of operations and cash flows.
A decline in our credit rating or a general disruption in the credit markets could negatively impact our liquidity and ability to conduct our operations.
A deterioration of our credit rating, or a general disruption in the credit markets, could limit our ability to obtain credit on terms acceptable to us, or at all. In addition, uncertain economic conditions or the re-pricing of certain credit risks may make it more difficult for us to obtain one or more types of funding in the amounts, or at rates considered acceptable to us, at any given time. Our inability to access necessary or desirable funding, or to enter into certain related transactions, at times and at costs deemed appropriate by us, could have a negative impact on our liquidity and our ability to conduct our operations. Any of these developments could also reduce the ability or willingness of the financial institutions that have extended credit commitments to us, or that have entered into hedge or similar transactions with us, to fulfill their obligations to us, which also could have a material adverse effect on our liquidity, and our ability to conduct our operations.
operations and our prospects.
We are subject to risks of doing businessassociated with manufacturers that produce vehicles outside of the United States including importimported product restrictions or limitations, foreign trade risks, and currency valuations.
Item 1B. Unresolved Staff Comments
None.
Item 1C. Cybersecurity
Overview
We have processes in place designed to protect our information systems, data, assets, infrastructure, and computing environments from cybersecurity threats and risks while maintaining confidentiality, integrity, and availability.Our cybersecurity risk management processes are integrated into our enterprise risk management program.
Training
We conduct regular training for cybersecurity awareness of our employees, senior executives, and certain other vendors or personnel.We also perform phishing and social engineering simulations and provide cybersecurity training for personnel with Company email and access to Company assets. We disseminate security awareness communications to certain employees to highlight emerging or urgent cybersecurity threats.
Asbury’s information and data security training programs are housed in a Learning Management System (LMS). We migrate our acquired companies into Asbury’s current LMS.
Governance
Our Chief Information Officer (“CIO”), who has over 35 years of experience in the technology field, oversees cybersecurity, data privacy and manages Asbury’s information and security procedures. Asbury also has a Director of Cybersecurity, as well as a formal team of analysts.
Our Board of Directors maintains ultimate oversight of the Company’s enterprise risk management program, which includes material cyber security risks.Under the oversight of the audit committee and capital allocation and risk management committee of the Company’s Board of Directors, and as directed by the Company’s Chief Executive Officer, our CIO is primarily responsible for the assessment and management of material cybersecurity risks. Our CIO oversees the Company’s cybersecurity incident response plan and related processes that are designed to assess and manage material risks from cybersecurity threats.
30
The CIO also coordinates with the Company’s legal counsel and third parties, such as consultants and legal advisors, to assess and manage material risks from cybersecurity threats. Our CIO is informed about and monitors the prevention, detection, mitigation, and remediation of cybersecurity incidents pursuant to criteria set forth in the Company’s incident response plan and related processes.
The capital allocation and risk management committee of the Company’s Board of Directors assists the Board in the periodic review and evaluation of the Company’s risk profile and related risk management processes which identify and manage the Company’s key financial, strategic and operational risks.The audit committee of the Company’s Board of Directors oversees, among other things, the adequacy and effectiveness of the Company’s internal controls, including internal controls designed to assess, identify, and manage material risks from cybersecurity threats. The audit committee is informed of material risks from cybersecurity threats pursuant to the escalation criteria as set forth in the Company’s disclosure controls and procedures. Further, our CIO reports on cybersecurity matters, including material risks and threats, to the Company’s audit committee on a quarterly basis, and the audit committee provides updates to the Company’s Board of Directors at regular board meetings. In addition, the audit committee and capital allocation and risk management committee hold a joint meeting annually during which the CIO provides a comprehensive update regarding the assessment and management of material cybersecurity risks. Our CIO also provides updates as appropriate to the Company’s Board of Directors.
Risk Management
We have processes for assessing, identifying, and managing material risks from cybersecurity threats. These processes are integrated into the Company’s overall risk management systems. These processes also include overseeing and identifying risks from cybersecurity threats associated with the use of third-party service providers. The Company conducts security assessments of certain third-party providers before engagement and has established monitoring procedures in its effort to mitigate risks related to data breaches or other security incidents originating from third parties. The Company from time to time engages third-party consultants, legal advisors, and audit firms in evaluating and testing the Company’s risk management systems and assessing and remediating certain potential cybersecurity incidents as appropriate.
Management
In an effort to effectively prevent, detect, and respond to cybersecurity threats, we employ a multi-layered cybersecurity risk management program supervised by our CIO, whose team is responsible for leading enterprise-wide cybersecurity strategy, policy, architecture, and processes. This responsibility includes identifying, considering, and assessing potentially material cybersecurity incidents on an ongoing basis, establishing processes designed to prevent and monitor potential cybersecurity risks, implementing mitigation and remedial measures, and maintaining our cybersecurity program. To do so, our program leverages both internal and external techniques and expertise. Internally, among other things, we may perform penetration tests, internal tests/code reviews, and simulations using cybersecurity professionals to assess vulnerabilities in our information systems and evaluate our cyber defense capabilities. Our cybersecurity capabilities, processes, and other security measures also include, without limitation:
•Service Organization Controls ("SOC")-as-a-Service (SOCaas) wherein a third-party vendor operates and maintains a fully-managed SOC on a subscription basis via the cloud;
•Security Information and Event Management (“SIEM”) software, which provides a threat detection, compliance, and security incident management system;
•Endpoint Detection and Response (“EDR”) software, which monitors for malicious activities on internal endpoints (e.g., Windows workstations, servers, MAC clients, and Linux endpoints);
•Cloud monitoring; and
•Disaster recovery and incident response plans, including a ransomware response plan.
Although we believe we have systems and processes in place to protect against risks associated with cybersecurity incidents in the future, depending on the nature of an incident, these protections may not be fully sufficient. We have experienced targeted cybersecurity incidents in the past that have resulted in unauthorized persons gaining access to certain of our information systems, and we could in the future experience similar incidents.As of the date of this Form 10-K, no cybersecurity incident or attack, or any risk from cybersecurity threat, has materially affected or has been determined to be reasonably likely to materially affect the Company, our business strategy, results of operations, or financial condition. For additional information regarding the risks from cybersecurity threats we face, see the section captioned. For further discussion of the risks associated with cybersecurity incidents, see “A failure of any of our information systems or those of our third-party service providers, or a data security breach with regard to personally identifiable information ("PII") about our customers or
31
employees, could have a material adverse effect on our business, results of operations, financial condition and cash flows.” beginning on page 27 of the section entitled “Item 1A. Risk Factors” in this Form 10-K.
Item 2. Properties
We lease our corporate headquarters, which is located at 2905 Premiere Parkway, NW, Suite 300, Duluth, Georgia 30097. We also have a corporate office in Texas. The operations of our TCA business are located in leased office space in Utah.
As of December 31, 2017,2023, our operations encompassed 80158 franchised dealership locations, throughout 9 states, and 2437 collision repair centers, throughout 16 states as follows:
| Dealerships | Collision Repair Centers | ||||||||||||||||||||||||||||||||||||||||||||||||||||||||||||
| Dealership Group: | Owned | Leased | Owned | Leased | |||||||||||||||||||||||||||||||||||||||||||||||||||||||||
| Dealerships | Dealerships | Collision Repair Centers | |||||||||||||||||||||||||||||||||||||||||||||||||||||||||||
| Dealership Group Brand Name: | Dealership Group Brand Name: | Owned | Leased | Owned | Leased | ||||||||||||||||||||||||||||||||||||||||||||||||||||||||
| Coggin Automotive Group | 12 | 4 | (a) | 5 | 2 | ||||||||||||||||||||||||||||||||||||||||||||||||||||||||
| Courtesy Autogroup | 5 | 3 | 2 | — | |||||||||||||||||||||||||||||||||||||||||||||||||||||||||
| Crown Automotive Company | 13 | 5 | (b) | 3 | — | ||||||||||||||||||||||||||||||||||||||||||||||||||||||||
| David McDavid Auto Group | 7 | ��� | 4 | 1 | |||||||||||||||||||||||||||||||||||||||||||||||||||||||||
| Gray-Daniels Auto Family | — | 5 | (b) | — | 1 | ||||||||||||||||||||||||||||||||||||||||||||||||||||||||
| Hare Automotive Group | 2 | — | — | 1 | |||||||||||||||||||||||||||||||||||||||||||||||||||||||||
| Greenville Automotive Group | |||||||||||||||||||||||||||||||||||||||||||||||||||||||||||||
| Hare, Bill Estes & Kahlo Automotive Groups | |||||||||||||||||||||||||||||||||||||||||||||||||||||||||||||
| Koons Automotive Group | |||||||||||||||||||||||||||||||||||||||||||||||||||||||||||||
| Larry H. Miller Dealerships | |||||||||||||||||||||||||||||||||||||||||||||||||||||||||||||
| Mike Shaw, Stevinson & Arapahoe Automotive Groups | |||||||||||||||||||||||||||||||||||||||||||||||||||||||||||||
| Nalley Automotive Group | 16 | 1 | 3 | 1 | |||||||||||||||||||||||||||||||||||||||||||||||||||||||||
| Park Place Automotive | |||||||||||||||||||||||||||||||||||||||||||||||||||||||||||||
| Plaza Motor Company | 6 | 1 | (b) | — | 1 | ||||||||||||||||||||||||||||||||||||||||||||||||||||||||
| Total | 61 | 19 | 17 | 7 | |||||||||||||||||||||||||||||||||||||||||||||||||||||||||
(a)Includes one dealership that leases a new vehicle facility and operates a separate used vehicle facility that is owned.
(b)Includes one dealership location where we lease the underlying land but own the building facilities on that land.
(c)Includes two dealership location where we lease the underlying land but own the building facilities on that land.
Item 3. Legal Proceedings
From time to time, we and our dealerships are involved and will continue to be involved in various claims relating to, and arising out of, our business and our operations. These claims may involve, but are not limited to, financial and other audits by vehicle manufacturers or lenders, and certain federal, state, and local government authorities, which relate primarily to (i) incentive and warranty payments received from vehicle manufacturers, or allegations of violations of manufacturer agreements or policies, (ii) compliance with lender rules and covenants and (iii) payments made to government authorities relating to federal, state, and local taxes, as well as compliance with other government regulations. Claims may also arise through litigation, government proceedings, and other dispute resolution processes. Such claims, including class actions, can relate to, but are not limited to, the practice of charging administrative fees, employment-related matters, truth-in-lending practices, contractual disputes, actions brought by governmental authorities, and other matters. We evaluate pending and threatened
claims and establish loss contingency reserves based upon outcomes we currently believe to be probable and reasonably estimable. We do not believe that the ultimate resolution of the claims we are involved in will have a material adverse effect on our business, results of operations, financial condition, cash flow and prospects.
On August 3, 2022, we received a Civil Investigative Demand (“CID”) from the FTC requesting information and documents concerning the Company’s corporate structure and operation of six of its dealerships. We responded to the CID by producing information and documents for the period August 1, 2019 to April 24, 2023. On February 8, 2024, the FTC staff counsel sent to us a proposed consent order and draft complaint, alleging that the Company and three of our dealerships had violated Section 5 of the Federal Trade Commission Act (“FTC Act”) and certain provisions of the Equal Credit Opportunity Act (“ECOA”) in connection with the sale of add-on products (e.g., vehicle service contracts, maintenance plans, etc.), and advising that it would recommend the filing of an enforcement action if the Company did not settle the FTC’s claims. The Company disputes the FTC’s allegations that it violated the FTC Act and the ECOA, and is currently involved in discussions with the FTC staff regarding the matter. There can be no assurance that negotiations between us and the FTC for a favorable settlement will be successful, or that we will succeed in any litigation as a result of the investigation. At this time, we are unable to reasonably predict the possible outcome of this matter, or provide a reasonably possible range of loss, if any, as a result of the
32
investigation. If the FTC files a suit against us based on these allegations, whether meritorious or not, it may adversely affect our ability to attract customers, result in the loss of existing customers, harm our reputation and cause us to incur defense costs and other expenses.
Item 4. Mine Safety Disclosures
Not applicable.
33
PART II
Item 5. Market for Registrant's Common Equity, Related Stockholder Matters, and Issuer Purchases of Equity Securities
Our common stock is traded on the New York Stock Exchange (the "NYSE") under the symbol "ABG." Quarterly information concerning our high and low closing sales price per share of our common stock as reported by the NYSE is as follows:
| High | Low | ||||||
| Fiscal Year Ended December 31, 2016 | |||||||
| First Quarter | $ | 66.52 | $ | 45.07 | |||
| Second Quarter | 62.61 | 51.97 | |||||
| Third Quarter | 61.44 | 50.57 | |||||
| Fourth Quarter | $ | 65.30 | $ | 48.85 | |||
| Fiscal Year Ended December 31, 2017 | |||||||
| First Quarter | $ | 69.45 | $ | 60.10 | |||
| Second Quarter | 63.65 | 52.25 | |||||
| Third Quarter | 61.60 | 50.15 | |||||
| Fourth Quarter | $ | 67.75 | $ | 55.05 | |||
We didhave not paypaid any dividends during any of these periods.since 2008. On February 26, 2018,27, 2024, the last reported sale price of our common stock on the NYSE was $69.30$212.00 per share, and there were approximately 141505 record holders of our common stock.
Our credit agreement with Bank of America, N.A. ("Bank of America"), as administrative agent, and the other agents and lenders party thereto (the "2016"2023 Senior Credit Facility") and the IndentureIndentures governing our 6.0%the Senior Notes (the "Indenture"(as defined below) (collectively, the "Indentures") currently allow for us to make certain restricted payments, including payments to repurchase shares of our common stock, among other things, subject to our continued compliance with certain covenants. For additional information, see the "Covenants and Defaults" section within "Liquidity and Capital Resources."
Issuer Purchases of Equity Securities
Share repurchases are implemented through purchases made from time to time in either the open market or private transactions. The share repurchases could include purchases pursuant to a written trading plan in accordance with Rule 10b5-1 under the Securities Exchange Act of 1934, as amended, which allows companies to repurchase shares of stock at times when they might otherwise be prevented from doing so by securities laws or under self-imposed trading blackout periods. The extent that the Company repurchases its shares, the number of shares and the timing of any repurchases will depend on general market conditions, legal requirements and other corporate considerations. The repurchase program may be modified, suspended or terminated at any time without prior notice.
Information about the shares of our common stock that we repurchased during the quarter ended December 31, 2023 is set forth below:
| Period | Total Number of Shares (or Units) Purchased | Average Price Paid per Share (or Unit) | Total Number of Shares (or Units) Purchased as Part of Publicly Announced Plans or Programs | Maximum Number (or Approximate Dollar Value) of Shares (or Units) that May Yet Be Purchased Under the Plans or Programs (In millions | ||||||||||||||||||||||
| 10/01/2023 - 10/31/2023 | 130,785 | $ | 188.33 | 129,834 | $ | 225.6 | ||||||||||||||||||||
| 11/01/2023 - 11/30/2023 | 116,397 | $ | 197.20 | 116,207 | $ | 202.6 | ||||||||||||||||||||
| 12/01/2023 - 12/31/2023 | — | $ | — | — | $ | 202.6 | ||||||||||||||||||||
| Total | 247,182 | 246,041 | ||||||||||||||||||||||||
On January 30, 2014,May 26, 2023, our Board of Directors announced that it authorized our currenta new $250.0 million share repurchase programauthorization (the "Repurchase Program""New Share Repurchase Authorization"). On January 24, 2018,, which replaced our Board of Directors reset theprevious share repurchase authorization under our Repurchase Program to $100.0 million in the aggregate, for the repurchase of our common stock in open market transactions or privately negotiated transactions from time to time. During the year ended December 31, 2017, we repurchased 584,696 sharesor in other manners as permitted by federal security laws and other legal and contractual requirements.
34
PERFORMANCE GRAPH
The following graph furnished by us shows the value as of December 31, 2017,2023, of a $100 investment in our common stock made on December 31, 2012,2018, as compared with similar investments based on (i) the value of the S&P 500 Index (with dividends reinvested) and (ii) the value of a market-weighted Peer Group Index composed of the common stock of AutoNation, Inc.; Sonic Automotive, Inc.; Group 1 Automotive, Inc.; Penske Automotive Group, Inc.; and Lithia Motors, Inc., in each case on a "total return" basis assuming the reinvestment of any dividends. The market-weighted Peer Group Index values were calculated from the beginning of the performance period. The historical stock performance shown below is not necessarily indicative of future expected performance.
The forgoing graph is not, and shall not be deemed to be, filed as part of our annual report on Form 10-K. Such graph is not, and will not be deemed, filed or incorporated by reference into any filing by us under the Securities Act of 1933 or the Securities Exchange Act of 1934, except to the extent specifically incorporated by reference therein by us.
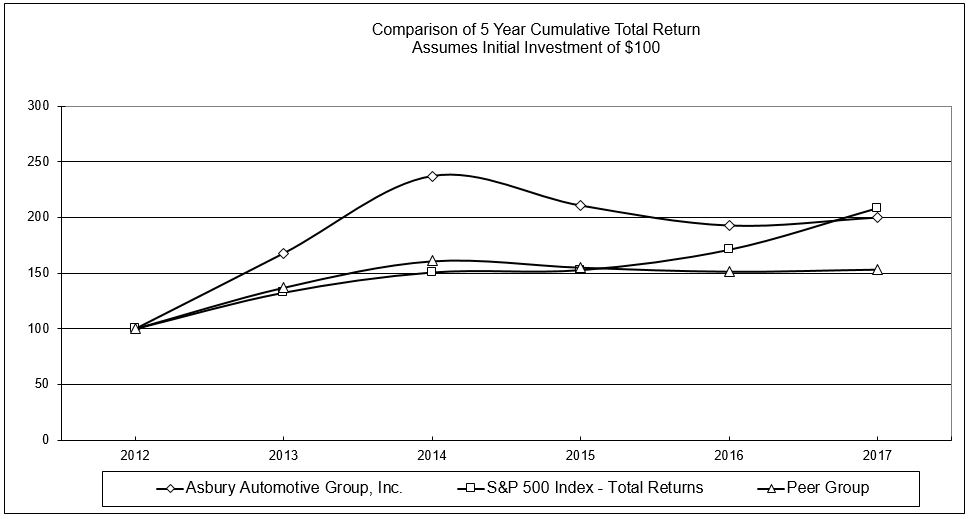

35
Item 6. Selected Financial DataReserved
| For the Years Ended December 31, | ||||||||||||||||||||
| Income Statement Data: | 2017 | 2016 | 2015 | 2014 | 2013 | |||||||||||||||
| (in millions, except per share data) | ||||||||||||||||||||
| REVENUE: | ||||||||||||||||||||
| New vehicle | $ | 3,561.1 | $ | 3,611.9 | $ | 3,652.5 | $ | 3,230.6 | $ | 2,952.2 | ||||||||||
| Used vehicle | 1,834.1 | 1,876.4 | 1,931.7 | 1,741.5 | 1,564.2 | |||||||||||||||
| Parts and service | 786.1 | 778.5 | 740.7 | 666.6 | 611.6 | |||||||||||||||
| Finance and insurance, net | 275.2 | 261.0 | 263.4 | 229.0 | 206.9 | |||||||||||||||
| TOTAL REVENUE | 6,456.5 | 6,527.8 | 6,588.3 | 5,867.7 | 5,334.9 | |||||||||||||||
| COST OF SALES | 5,400.6 | 5,469.1 | 5,527.5 | 4,900.5 | 4,458.9 | |||||||||||||||
| GROSS PROFIT | 1,055.9 | 1,058.7 | 1,060.8 | 967.2 | 876.0 | |||||||||||||||
| OPERATING EXPENSES: | ||||||||||||||||||||
| Selling, general, and administrative expenses | 729.7 | 732.5 | 729.9 | 671.6 | 617.8 | |||||||||||||||
| Depreciation and amortization | 32.1 | 30.7 | 29.5 | 26.4 | 24.3 | |||||||||||||||
| Franchise rights impairment | 5.1 | — | — | — | — | |||||||||||||||
| Other operating expense (income), net | 1.3 | (2.3 | ) | (0.2 | ) | 1.0 | 7.8 | |||||||||||||
| INCOME FROM OPERATIONS | 287.7 | 297.8 | 301.6 | 268.2 | 226.1 | |||||||||||||||
| OTHER EXPENSES (INCOME): | ||||||||||||||||||||
| Floor plan interest expense | 22.7 | 19.3 | 16.1 | 12.4 | 12.5 | |||||||||||||||
| Other interest expense, net | 53.9 | 53.1 | 44.0 | 38.9 | 39.0 | |||||||||||||||
| Swap interest expense | 2.0 | 3.1 | 3.0 | 2.0 | 2.5 | |||||||||||||||
| Loss on extinguishment of long-term debt, net | — | — | — | 31.9 | 6.8 | |||||||||||||||
| (Gain) loss on divestitures | — | (45.5 | ) | (34.9 | ) | — | — | |||||||||||||
| Total other expenses, net | 78.6 | 30.0 | 28.2 | 85.2 | 60.8 | |||||||||||||||
| INCOME FROM CONTINUING OPERATIONS BEFORE INCOME TAX | 209.1 | 267.8 | 273.4 | 183.0 | 165.3 | |||||||||||||||
| Income tax expense | 70.0 | 100.6 | 104.0 | 71.0 | 64.2 | |||||||||||||||
| INCOME FROM CONTINUING OPERATIONS | 139.1 | 167.2 | 169.4 | 112.0 | 101.1 | |||||||||||||||
| Discontinued operations, net of tax | — | — | (0.2 | ) | (0.4 | ) | 8.0 | |||||||||||||
| NET INCOME | $ | 139.1 | $ | 167.2 | $ | 169.2 | $ | 111.6 | $ | 109.1 | ||||||||||
| Income from continuing operations per common share: | ||||||||||||||||||||
| Basic | $ | 6.69 | $ | 7.43 | $ | 6.44 | $ | 3.75 | $ | 3.29 | ||||||||||
| Diluted | $ | 6.62 | $ | 7.40 | $ | 6.42 | $ | 3.72 | $ | 3.25 | ||||||||||
| As of December 31, | ||||||||||||||||||||
| Balance Sheet Data: | 2017 | 2016 | 2015 | 2014 | 2013 | |||||||||||||||
| (in millions) | ||||||||||||||||||||
| Working capital | $ | 243.9 | $ | 227.5 | $ | 323.4 | $ | 225.4 | $ | 265.1 | ||||||||||
| Inventories | 826.0 | 894.9 | 917.2 | 886.0 | 767.7 | |||||||||||||||
| Total assets | 2,356.7 | 2,336.1 | 2,294.1 | 2,178.0 | 1,879.4 | |||||||||||||||
| Floor plan notes payable | 732.1 | 781.8 | 712.2 | 766.8 | 609.5 | |||||||||||||||
| Total debt | 875.5 | 926.7 | 954.3 | 697.4 | 545.1 | |||||||||||||||
| Total shareholders' equity | $ | 394.2 | $ | 279.7 | $ | 314.5 | $ | 444.9 | $ | 490.6 | ||||||||||
Item 7. Management's Discussion and Analysis of Financial Condition and Results of Operations
This MD&A should be read in conjunction with the accompanying audited consolidated financial statements and notes. Forward-looking statements in this MD&A are not guarantees of future performance and may involve risks and uncertainties that could cause actual results to differ materially from those projected. Refer to the "Forward-Looking Statements" and Part I, Item 1A. Risk Factors for a discussion of these risks and uncertainties. The discussion of our financial condition and results of operations for the year ended December 31, 2021 is included in Item 7. Management's Discussion and Analysis of Financial Condition and Results of Operations in our Annual Report on Form 10-K for the year ended December 31, 2022.
OVERVIEW
We are one of the largest automotive retailers in the United States. As of December 31, 20172023, through our Dealerships segment, we owned and operated 94208 new vehicle franchises (80(158 dealership locations), representing 2931 brands of automobiles, and 24within 16 states. We also operated 37 collision centers, in 17 metropolitan markets, within nine states.and Total Care Auto, Powered by Landcar ("TCA"), our F&I product provider. Our stores offer an extensive range of automotive products and services, including new and used vehicles; parts and service, which include repair and maintenance services, replacement parts, and collision repair service; and finance and insurance products. As ofThe finance and insurance products are provided by both independent third parties and TCA. The F&I products offered by TCA are sold through affiliated dealerships. For the year ended December 31, 2017,2023, our new vehicle revenue brand mix consisted of 46%39% imports, 34%33% luxury, and 20%28% domestic brands. The Company manages its operations in two reportable segments: Dealerships and TCA.
Our Dealerships segment revenues are derived primarily from: (i) the sale of new vehicles; (ii) the sale of used vehicles to individual retail customers ("used retail") and to other dealers at auction ("wholesale") (the terms "used retail" and "wholesale" are collectively referred to as "used"); (iii) repair and maintenance services, including collision repair, the sale of automotive replacement parts, and the reconditioning of used vehicles (collectively referred to as "parts and service"); and (iv) the arrangement of third-party vehicle financing and the sale of a number of vehicle protection products. F&I products (defined below and collectively referredare offered by dealerships to as "F&I").customers in connection with the purchase of vehicles through either TCA or independent third parties. We evaluate the results of our new and used vehicle sales based on unit volumes and gross profit per vehicle sold, our parts and service operations based on aggregate gross profit, and our F&I business based on F&I gross profit per vehicle sold. Amounts presented have been calculated using non-rounded amounts for all periods presented and therefore certain amounts may not compute or tie to prior year financial statements due to rounding.
Our dealerships gross profit margin varies with our revenue mix. Historically, the sales of new vehicles generally results in a lower gross profit margin than used vehicle sales, sales of parts and service, and sales of F&I products. As a result, when used vehicle, parts and service, and F&I revenue increase as a percentage of total revenue, we expect our overall gross profit margin to increase. However, recently, new vehicle gross profit margins have been above historical levels and higher than used vehicle gross margins as a result of inventory disruptions from supply chain issues.
Our TCA segment revenues, reflected in F&I revenue, net, are derived from the sale of various vehicle protection products including vehicle service contracts, GAP, prepaid maintenance contracts, and appearance protection contracts. These products are sold through company-owned dealerships. TCA's F&I revenues also include investment gains or losses and income earned associated with the performance of TCA's investment portfolio.
Our TCA segment gross profit margin can vary due to incurred claims expense and the performance of our investment portfolio. Certain F&I products may result in higher gross profit margins to TCA. Therefore, the product mix of F&I products sold by TCA can affect the gross profits earned. In addition, interest rate volatility based on economic and market conditions outside the control of the Company, may increase or reduce TCA segment gross profit margins as well as the fair market values of certain securities within our investment portfolio. Fair market values typically fluctuate inversely to the fluctuations in interest rates.
Selling, general, and administrative ("SG&A") expenses consist primarily of fixed and incentive-based compensation, advertising, rent, insurance, utilities, and other customary operating expenses. A significant portion of our cost structure is variable (such as sales commissions) or controllable (such as advertising), which we believe allows us to adapt to changes in the retail environment over the long-term. We evaluate commissions paid to salespeople as a percentage of retail vehicle gross profit, advertising expense on a per vehicle retailed ("PVR") basis, and all other SG&A expenses in the aggregate as a percentage of total gross profit. Commissions expense paid by TCA to our affiliated dealerships and reflected as F&I revenue in our Dealerships segment is eliminated in the TCA segment upon consolidation.
36
Our continued organic growth is dependent upon the execution of our balanced automotive retailing and service business strategy, the continued strength of our brand mix, and the production and allocation of desirable vehicles from the automobile manufacturers whose brands we sell. Our vehicle sales have historically fluctuated with product availability as well as local and national economic conditions, including consumer confidence, availability of consumer credit, fuel prices, and employment levels. Additionally,
In addition, our ability to sell certain new and used vehicles can be negatively impacted by a number of factors, some of which are outside of our controlcontrol. Manufacturers continue to be hampered by the lack of availability of parts and maykey components from suppliers which has impacted new vehicle inventory levels and availability of certain parts. We cannot predict with any certainty how long the automotive retail industry will continue to be subject to these production slowdowns or when normalized production will resume at these manufacturers.
Jim Koons Acquisition
On December 11, 2023, the Company completed the acquisition of substantially all of the assets, including all real property and businesses of the Jim Koons Dealerships ("Koons") pursuant to a Purchase and Sale Agreement with various entities that comprise the Jim Koons automotive dealerships group (the "Koons acquisition") for an aggregate purchase price of approximately $1.50 billion, which includes $256.1 million of new vehicle floor plan financing and $103.8 million of assets held for sale related to Koons Lexus of Wilmington. The acquisition was funded with borrowings under Asbury’s existing credit facility and cash on hand. The Koons acquisition comprised 20 new vehicle dealerships and six collision centers.
Larry H. Miller Acquisition
On December 17, 2021, the Company completed the acquisition of the businesses of the Larry H. Miller ("LHM") Dealerships and TCA (collectively, the "LHM acquisition"), thereby acquiring 54 new vehicle dealerships, seven used cars stores, 11 collision centers, a used vehicle wholesale business, the real property related thereto, and the entities comprising the TCA business for an aggregate purchase price of $3.48 billion. The purchase price was financed through a combination of cash, debt, including senior notes, real estate facilities, new and used vehicle floor plan facilities and the proceeds from the issuance of common stock.
Financial Highlights
Highlights related to our financial condition and results of operations include manufacturer imposed stop-sales or open safety recalls,the following:
•Consolidated revenue for the year ended December 31, 2023 decreased to $14.80 billion, compared to $15.43 billion for the prior year.
•Consolidated gross profit for the year ended December 31, 2023 decreased to $2.76 billion, compared to $3.10 billion for the prior year.
•The decrease in consolidated revenue and gross profit is primarily due to but not limitedlower used vehicle and F&I revenue. Additionally, lower gross profit was driven by lower gross profit per vehicle sold for both new and used vehicles as margins continue to vehicle safety concerns or a vehicle's failure to meet environmental related requirements. We believeshift downward from the historic highs in recent years.
•The effects of dealership divestitures also impacted consolidated revenue and gross profit. During the year ended December 31, 2023, we sold one franchise (one dealership location) in Austin, Texas. During 2022, we completed sixteen divestitures that contributed $683 million in revenue for the impact on our businessyear ended December 31, 2022. Four of any future negative trends in new vehicle sales would be partially mitigated by (i) the expected relative stability of our parts and service operations over the long-term, (ii) the variable nature of significant components of our cost structure, and (iii) our diversified brand and geographic mix.
•Our capital allocation priorities were supported by changing economic conditions, vehicle manufacturer incentive programs, adverse weather events, or other developments outside our control.
| Used vehicle lower of cost and net realizable value reserve: | Reserve Amount (in millions) | Percentage of Gross Used Vehicle Inventory | |||||
| As of December 31, 2017 | $ | 5.1 | 3.6 | % | |||
| As of December 31, 2016 | $ | 5.8 | 4.2 | % | |||
•On October 20, 2023, we entered into a fourth amended and 2015 were $34.0 million, $34.9 million, and $31.3 million, respectively. Our chargeback reserves were $43.7 million and $43.0 millionrestated credit agreement with Bank of America, as of December 31, 2017 and December 31, 2016, respectively. Total chargebacks as a percentage of F&I revenue for the years ended December 31, 2017, 2016, and 2015, were 12%, 14%, and 13%, respectively. A 100 basis point change in our estimated reserve rate for future chargebacks, would change our finance and insurance chargeback reserve by approximately $3.0 million as of December 31, 2017.
37
CONSOLIDATED RESULTS OF OPERATIONS
| For the Year Ended December 31, | Increase (Decrease) | % Change | ||||||||||||
| 2017 | 2016 | |||||||||||||
| (Dollars in millions, except per share data) | ||||||||||||||
| REVENUE: | ||||||||||||||
| New vehicle | $ | 3,561.1 | $ | 3,611.9 | $ | (50.8 | ) | (1 | )% | |||||
| Used vehicle | 1,834.1 | 1,876.4 | (42.3 | ) | (2 | )% | ||||||||
| Parts and service | 786.1 | 778.5 | 7.6 | 1 | % | |||||||||
| Finance and insurance, net | 275.2 | 261.0 | 14.2 | 5 | % | |||||||||
| TOTAL REVENUE | 6,456.5 | 6,527.8 | (71.3 | ) | (1 | )% | ||||||||
| GROSS PROFIT: | ||||||||||||||
| New vehicle | 169.0 | 187.1 | (18.1 | ) | (10 | )% | ||||||||
| Used vehicle | 121.9 | 127.3 | (5.4 | ) | (4 | )% | ||||||||
| Parts and service | 489.8 | 483.3 | 6.5 | 1 | % | |||||||||
| Finance and insurance, net | 275.2 | 261.0 | 14.2 | 5 | % | |||||||||
| TOTAL GROSS PROFIT | 1,055.9 | 1,058.7 | (2.8 | ) | — | % | ||||||||
| OPERATING EXPENSES: | ||||||||||||||
| Selling, general, and administrative | 729.7 | 732.5 | (2.8 | ) | — | % | ||||||||
| Depreciation and amortization | 32.1 | 30.7 | 1.4 | 5 | % | |||||||||
| Franchise rights impairment | 5.1 | — | 5.1 | — | % | |||||||||
| Other operating expense (income), net | 1.3 | (2.3 | ) | 3.6 | NM | |||||||||
| INCOME FROM OPERATIONS | 287.7 | 297.8 | (10.1 | ) | (3 | )% | ||||||||
| OTHER EXPENSES (INCOME): | ||||||||||||||
| Floor plan interest expense | 22.7 | 19.3 | 3.4 | 18 | % | |||||||||
| Other interest expense, net | 53.9 | 53.1 | 0.8 | 2 | % | |||||||||
| Swap interest expense | 2.0 | 3.1 | (1.1 | ) | (35 | )% | ||||||||
| Gain on divestitures | — | (45.5 | ) | 45.5 | (100 | )% | ||||||||
| Total other expenses, net | 78.6 | 30.0 | 48.6 | 162 | % | |||||||||
| INCOME BEFORE INCOME TAXES | 209.1 | 267.8 | (58.7 | ) | (22 | )% | ||||||||
| Income tax expense | 70.0 | 100.6 | (30.6 | ) | (30 | )% | ||||||||
| NET INCOME | $ | 139.1 | $ | 167.2 | $ | (28.1 | ) | (17 | )% | |||||
| Income from continuing operations per common share—Diluted | $ | 6.62 | $ | 7.40 | $ | (0.78 | ) | (11 | )% | |||||
| Net income per common share—Diluted | $ | 6.62 | $ | 7.40 | $ | (0.78 | ) | (11 | )% | |||||
| For the Year Ended December 31, | |||||
| 2017 | 2016 | ||||
| REVENUE MIX PERCENTAGES: | |||||
| New vehicles | 55.2 | % | 55.3 | % | |
| Used retail vehicles | 25.2 | % | 25.7 | % | |
| Used vehicle wholesale | 3.1 | % | 3.1 | % | |
| Parts and service | 12.2 | % | 11.9 | % | |
| Finance and insurance, net | 4.3 | % | 4.0 | % | |
| Total revenue | 100.0 | % | 100.0 | % | |
| GROSS PROFIT MIX PERCENTAGES: | |||||
| New vehicles | 16.0 | % | 17.7 | % | |
| Used retail vehicles | 11.4 | % | 12.3 | % | |
| Used vehicle wholesale | 0.1 | % | (0.3 | )% | |
| Parts and service | 46.4 | % | 45.6 | % | |
| Finance and insurance, net | 26.1 | % | 24.7 | % | |
| Total gross profit | 100.0 | % | 100.0 | % | |
| GROSS PROFIT MARGIN | 16.4 | % | 16.2 | % | |
| SG&A EXPENSES AS A PERCENTAGE OF GROSS PROFIT | 69.1 | % | 69.2 | % | |
We assess the organic growth of our revenue and gross profit on a same store basis. We believe that our assessment on a same store basis represents an important indicator of comparative financial performance and provides relevant information to assess our performance. As such, for the following discussion, same store amounts consist of information from dealerships for identical months in each comparative period, commencing with the first full month we owned the dealership. Additionally, amounts related to divested dealerships are excluded from each comparative period. During 2022, the Company completed sixteen divestitures that contributed $683 million in revenue for the year. Four of the divestitures closed in the first quarter, three in the second quarter, and nine in the fourth quarter of 2022.
The Year Ended December 31, 2023 Compared to the Year Ended December 31, 2022
| For the Year Ended December 31, | Increase (Decrease) | % Change | |||||||||||||||||||||
| 2023 | 2022 | ||||||||||||||||||||||
| (Dollars in millions, except per share data) | |||||||||||||||||||||||
| REVENUE: | |||||||||||||||||||||||
| New vehicle | $ | 7,630.7 | $ | 7,365.6 | $ | 265.1 | 4 | % | |||||||||||||||
| Used vehicle | 4,414.3 | 5,197.1 | (782.8) | (15) | % | ||||||||||||||||||
| Parts and service | 2,081.5 | 2,074.2 | 7.3 | — | % | ||||||||||||||||||
| Finance and insurance, net | 676.2 | 797.0 | (120.8) | (15) | % | ||||||||||||||||||
| TOTAL REVENUE | 14,802.7 | 15,433.8 | (631.2) | (4) | % | ||||||||||||||||||
| GROSS PROFIT: | |||||||||||||||||||||||
| New vehicle | 703.0 | 844.0 | (141.0) | (17) | % | ||||||||||||||||||
| Used vehicle | 264.0 | 353.2 | (89.2) | (25) | % | ||||||||||||||||||
| Parts and service | 1,150.6 | 1,152.6 | (2.1) | — | % | ||||||||||||||||||
| Finance and insurance, net | 638.2 | 750.7 | (112.5) | (15) | % | ||||||||||||||||||
| TOTAL GROSS PROFIT | 2,755.8 | 3,100.6 | (344.8) | (11) | % | ||||||||||||||||||
| OPERATING EXPENSES: | |||||||||||||||||||||||
| Selling, general, and administrative | 1,617.4 | 1,763.4 | (146.0) | (8) | % | ||||||||||||||||||
| Depreciation and amortization | 67.7 | 69.0 | (1.3) | (2) | % | ||||||||||||||||||
| Asset impairments | 117.2 | — | 117.2 | NM | |||||||||||||||||||
| Other operating income, net | — | (4.4) | 4.4 | (100) | % | ||||||||||||||||||
| INCOME FROM OPERATIONS | 953.5 | 1,272.6 | (319.1) | (25) | % | ||||||||||||||||||
| OTHER (INCOME) EXPENSES: | |||||||||||||||||||||||
| Floor plan interest expense | 9.6 | 8.4 | 1.3 | 15 | % | ||||||||||||||||||
| Other interest expense, net | 156.1 | 152.2 | 3.9 | 3 | % | ||||||||||||||||||
| Gain on dealership divestitures, net | (13.5) | (207.1) | 193.6 | NM | |||||||||||||||||||
| Total other expenses (income), net | 152.2 | (46.5) | 198.8 | NM | |||||||||||||||||||
| INCOME BEFORE INCOME TAXES | 801.3 | 1,319.1 | (517.8) | (39) | % | ||||||||||||||||||
| Income tax expense | 198.8 | 321.8 | (123.0) | (38) | % | ||||||||||||||||||
| NET INCOME | $ | 602.5 | $ | 997.3 | $ | (394.8) | (40) | % | |||||||||||||||
| Net income per common share—Diluted | $ | 28.74 | $ | 44.61 | $ | (15.87) | (36) | % | |||||||||||||||
NM—Not Meaningful
38
| For the Year Ended December 31, | |||||||||||
| 2023 | 2022 | ||||||||||
| REVENUE MIX PERCENTAGES: | |||||||||||
| New vehicles | 51.5 | % | 47.7 | % | |||||||
| Used retail vehicles | 27.1 | % | 31.3 | % | |||||||
| Used vehicle wholesale | 2.7 | % | 2.4 | % | |||||||
| Parts and service | 14.1 | % | 13.4 | % | |||||||
| Finance and insurance, net | 4.6 | % | 5.2 | % | |||||||
| Total revenue | 100.0 | % | 100.0 | % | |||||||
| GROSS PROFIT MIX PERCENTAGES: | |||||||||||
| New vehicles | 25.5 | % | 27.2 | % | |||||||
| Used retail vehicles | 9.0 | % | 11.2 | % | |||||||
| Used vehicle wholesale | 0.6 | % | 0.2 | % | |||||||
| Parts and service | 41.8 | % | 37.2 | % | |||||||
| Finance and insurance, net | 23.2 | % | 24.2 | % | |||||||
| Total gross profit | 100.0 | % | 100.0 | % | |||||||
| GROSS PROFIT MARGIN | 18.6 | % | 20.1 | % | |||||||
| SG&A EXPENSES AS A PERCENTAGE OF GROSS PROFIT | 58.7 | % | 56.9 | % | |||||||
Total revenue during 2023 decreased by $631.2 million (4%) compared to 2022, due to a $782.8 million (15%) decrease in used vehicle revenue, a $120.8 million (15%) decrease in F&I revenue, offset by a $265.1 million (4%) increase in new vehicle revenue and a $7.3 million increase in parts and service revenue.
The $344.8 million (11%) decrease in gross profit during 2023 was the result of a $141.0 million (17%) decrease in new vehicle gross profit, an $89.2 million (25%) decrease in used vehicle gross profit, a $2.1 million decrease in parts and service gross profit and a $112.5 million (15%) decrease in F&I gross profit. Our total gross profit margin decreased 147 basis points from 20.1% in 2022 to 18.6% in 2023.
Income from operations during 2023 decreased by $319.1 million (25%) compared to 2022, primarily due to a $344.8 million (11%) decrease in gross profit and a $117.2 million increase in asset impairments, partially offset by a $146.0 million (8%) decrease in selling, general, and administrative expenses.
Total other expenses (income), net increased by $198.8 million from income of $46.5 million in 2022 to $152.2 million of expenses in 2023, primarily due to a $193.6 million decrease in gain on dealership divestitures, a $3.9 million (3%) increase in other interest expense, net and a $1.3 million (15%) increase in floor plan interest expense. As a result, income before income taxes decreased by $517.8 million (39%) to $801.3 million in 2023. The $123.0 million (38%) decrease in income tax expense was primarily attributable to the 39% decrease in income before taxes, partially offset by a 41 basis point increase in the 2023 effective tax rate. Overall, net income decreased by $394.8 million (40%) from $997.3 million in 2022 to $602.5 million in 2023.
39
New Vehicle—
| For the Year Ended December 31, | Increase (Decrease) | % Change | |||||||||||||||||||||
| 2023 | 2022 | ||||||||||||||||||||||
| (Dollars in millions, except for per vehicle data) | |||||||||||||||||||||||
| As Reported: | |||||||||||||||||||||||
| Revenue: | |||||||||||||||||||||||
| Luxury | $ | 2,524.1 | $ | 2,315.7 | $ | 208.4 | 9 | % | |||||||||||||||
| Import | 3,002.6 | 2,914.9 | 87.7 | 3 | % | ||||||||||||||||||
| Domestic | 2,104.1 | 2,135.0 | (30.9) | (1) | % | ||||||||||||||||||
| Total new vehicle revenue | $ | 7,630.7 | $ | 7,365.6 | $ | 265.1 | 4 | % | |||||||||||||||
| Gross profit: | |||||||||||||||||||||||
| Luxury | $ | 274.3 | $ | 293.0 | $ | (18.7) | (6) | % | |||||||||||||||
| Import | 265.8 | 338.7 | (72.9) | (22) | % | ||||||||||||||||||
| Domestic | 162.9 | 212.3 | (49.5) | (23) | % | ||||||||||||||||||
| Total new vehicle gross profit | $ | 703.0 | $ | 844.0 | $ | (141.0) | (17) | % | |||||||||||||||
| New vehicle units: | |||||||||||||||||||||||
| Luxury | 35,300 | 33,904 | 1,396 | 4 | % | ||||||||||||||||||
| Import | 77,740 | 78,388 | (648) | (1) | % | ||||||||||||||||||
| Domestic | 36,469 | 38,887 | (2,418) | (6) | % | ||||||||||||||||||
| Total new vehicle units | 149,509 | 151,179 | (1,670) | (1) | % | ||||||||||||||||||
| Same Store: | |||||||||||||||||||||||
| Revenue: | |||||||||||||||||||||||
| Luxury | $ | 2,503.2 | $ | 2,210.4 | $ | 292.8 | 13 | % | |||||||||||||||
| Import | 2,967.3 | 2,744.2 | 223.1 | 8 | % | ||||||||||||||||||
| Domestic | 2,059.0 | 2,074.3 | (15.4) | (1) | % | ||||||||||||||||||
| Total new vehicle revenue | $ | 7,529.5 | $ | 7,028.9 | $ | 500.6 | 7 | % | |||||||||||||||
| Gross profit: | |||||||||||||||||||||||
| Luxury | $ | 272.0 | $ | 281.6 | $ | (9.6) | (3) | % | |||||||||||||||
| Import | 262.0 | 319.5 | (57.5) | (18) | % | ||||||||||||||||||
| Domestic | 159.6 | 206.5 | (46.9) | (23) | % | ||||||||||||||||||
| Total new vehicle gross profit | $ | 693.6 | $ | 807.6 | $ | (114.0) | (14) | % | |||||||||||||||
| New vehicle units: | |||||||||||||||||||||||
| Luxury | 34,947 | 32,154 | 2,793 | 9 | % | ||||||||||||||||||
| Import | 76,896 | 73,845 | 3,051 | 4 | % | ||||||||||||||||||
| Domestic | 35,700 | 37,699 | (1,999) | (5) | % | ||||||||||||||||||
| Total new vehicle units | 147,543 | 143,698 | 3,845 | 3 | % | ||||||||||||||||||
40
| For the Year Ended December 31, | Increase (Decrease) | % Change | ||||||||||||
| 2017 | 2016 | |||||||||||||
| (Dollars in millions, except for per vehicle data) | ||||||||||||||
| As Reported: | ||||||||||||||
| Revenue: | ||||||||||||||
| Luxury | $ | 1,200.2 | $ | 1,251.3 | $ | (51.1 | ) | (4 | )% | |||||
| Import | 1,637.4 | 1,617.8 | 19.6 | 1 | % | |||||||||
| Domestic | 723.5 | 742.8 | (19.3 | ) | (3 | )% | ||||||||
| Total new vehicle revenue | $ | 3,561.1 | $ | 3,611.9 | $ | (50.8 | ) | (1 | )% | |||||
| Gross profit: | ||||||||||||||
| Luxury | $ | 78.9 | $ | 84.4 | $ | (5.5 | ) | (7 | )% | |||||
| Import | 56.8 | 68.9 | (12.1 | ) | (18 | )% | ||||||||
| Domestic | 33.3 | 33.8 | (0.5 | ) | (1 | )% | ||||||||
| Total new vehicle gross profit | $ | 169.0 | $ | 187.1 | $ | (18.1 | ) | (10 | )% | |||||
| New vehicle units: | ||||||||||||||
| Luxury | 22,525 | 23,875 | (1,350 | ) | (6 | )% | ||||||||
| Import | 58,685 | 58,466 | 219 | — | % | |||||||||
| Domestic | 18,765 | 20,019 | (1,254 | ) | (6 | )% | ||||||||
| Total new vehicle units | 99,975 | 102,360 | (2,385 | ) | (2 | )% | ||||||||
| Same Store: | ||||||||||||||
| Revenue: | ||||||||||||||
| Luxury | $ | 1,200.2 | $ | 1,226.5 | $ | (26.3 | ) | (2 | )% | |||||
| Import | 1,610.3 | 1,557.8 | 52.5 | 3 | % | |||||||||
| Domestic | 652.2 | 698.4 | (46.2 | ) | (7 | )% | ||||||||
| Total new vehicle revenue | $ | 3,462.7 | $ | 3,482.7 | $ | (20.0 | ) | (1 | )% | |||||
| Gross profit: | ||||||||||||||
| Luxury | $ | 79.0 | $ | 82.4 | $ | (3.4 | ) | (4 | )% | |||||
| Import | 56.3 | 67.0 | (10.7 | ) | (16 | )% | ||||||||
| Domestic | 28.7 | 31.9 | (3.2 | ) | (10 | )% | ||||||||
| Total new vehicle gross profit | $ | 164.0 | $ | 181.3 | $ | (17.3 | ) | (10 | )% | |||||
| New vehicle units: | ||||||||||||||
| Luxury | 22,525 | 23,424 | (899 | ) | (4 | )% | ||||||||
| Import | 57,813 | 56,430 | 1,383 | 2 | % | |||||||||
| Domestic | 16,731 | 18,716 | (1,985 | ) | (11 | )% | ||||||||
| Total new vehicle units | 97,069 | 98,570 | (1,501 | ) | (2 | )% | ||||||||
New Vehicle Metrics—
| For the Year Ended December 31, | Increase (Decrease) | % Change | |||||||||||||||||||||
| 2023 | 2022 | ||||||||||||||||||||||
| As Reported: | |||||||||||||||||||||||
| Revenue per new vehicle sold | $ | 51,038 | $ | 48,721 | $ | 2,318 | 5 | % | |||||||||||||||
| Gross profit per new vehicle sold | $ | 4,702 | $ | 5,583 | $ | (881) | (16) | % | |||||||||||||||
| New vehicle gross margin | 9.2 | % | 11.5 | % | (2.2) | % | |||||||||||||||||
| Luxury: | |||||||||||||||||||||||
| Gross profit per new vehicle sold | $ | 7,770 | $ | 8,642 | $ | (871) | (10) | % | |||||||||||||||
| New vehicle gross margin | 10.9 | % | 12.7 | % | (1.8) | % | |||||||||||||||||
| Import: | |||||||||||||||||||||||
| Gross profit per new vehicle sold | $ | 3,419 | $ | 4,320 | $ | (901) | (21) | % | |||||||||||||||
| New vehicle gross margin | 8.9 | % | 11.6 | % | (2.8) | % | |||||||||||||||||
| Domestic: | |||||||||||||||||||||||
| Gross profit per new vehicle sold | $ | 4,466 | $ | 5,460 | $ | (994) | (18) | % | |||||||||||||||
| New vehicle gross margin | 7.7 | % | 9.9 | % | (2.2) | % | |||||||||||||||||
| Same Store: | |||||||||||||||||||||||
| Revenue per new vehicle sold | $ | 51,033 | $ | 48,915 | $ | 2,118 | 4 | % | |||||||||||||||
| Gross profit per new vehicle sold | $ | 4,701 | $ | 5,620 | $ | (919) | (16) | % | |||||||||||||||
| New vehicle gross margin | 9.2 | % | 11.5 | % | (2.3) | % | |||||||||||||||||
| Luxury: | |||||||||||||||||||||||
| Gross profit per new vehicle sold | $ | 7,783 | $ | 8,758 | $ | (975) | (11) | % | |||||||||||||||
| New vehicle gross margin | 10.9 | % | 12.7 | % | (1.9) | % | |||||||||||||||||
| Import: | |||||||||||||||||||||||
| Gross profit per new vehicle sold | $ | 3,407 | $ | 4,326 | $ | (919) | (21) | % | |||||||||||||||
| New vehicle gross margin | 8.8 | % | 11.6 | % | (2.8) | % | |||||||||||||||||
| Domestic: | |||||||||||||||||||||||
| Gross profit per new vehicle sold | $ | 4,472 | $ | 5,479 | $ | (1,007) | (18) | % | |||||||||||||||
| New vehicle gross margin | 7.8 | % | 10.0 | % | (2.2) | % | |||||||||||||||||
| For the Year Ended December 31, | Increase (Decrease) | % Change | ||||||||||||
| 2017 | 2016 | |||||||||||||
| As Reported: | ||||||||||||||
| Revenue per new vehicle sold | $ | 35,620 | $ | 35,286 | $ | 334 | 1 | % | ||||||
| Gross profit per new vehicle sold | $ | 1,690 | $ | 1,828 | $ | (138 | ) | (8 | )% | |||||
| New vehicle gross margin | 4.7 | % | 5.2 | % | (0.5 | )% | ||||||||
| Luxury: | ||||||||||||||
| Gross profit per new vehicle sold | 3,503 | 3,535 | (32 | ) | (1 | )% | ||||||||
| New vehicle gross margin | 6.6 | % | 6.7 | % | (0.1 | )% | ||||||||
| Import: | ||||||||||||||
| Gross profit per new vehicle sold | $ | 968 | $ | 1,178 | $ | (210 | ) | (18 | )% | |||||
| New vehicle gross margin | 3.5 | % | 4.3 | % | (0.8 | )% | ||||||||
| Domestic: | ||||||||||||||
| Gross profit per new vehicle sold | $ | 1,775 | $ | 1,688 | $ | 87 | 5 | % | ||||||
| New vehicle gross margin | 4.6 | % | 4.6 | % | — | % | ||||||||
| Same Store: | ||||||||||||||
| Revenue per new vehicle sold | $ | 35,673 | $ | 35,332 | $ | 341 | 1 | % | ||||||
| Gross profit per new vehicle sold | $ | 1,690 | $ | 1,839 | $ | (149 | ) | (8 | )% | |||||
| New vehicle gross margin | 4.7 | % | 5.2 | % | (0.5 | )% | ||||||||
| Luxury: | ||||||||||||||
| Gross profit per new vehicle sold | $ | 3,507 | $ | 3,518 | $ | (11 | ) | — | % | |||||
| New vehicle gross margin | 6.6 | % | 6.7 | % | (0.1 | )% | ||||||||
| Import: | ||||||||||||||
| Gross profit per new vehicle sold | $ | 974 | $ | 1,187 | $ | (213 | ) | (18 | )% | |||||
| New vehicle gross margin | 3.5 | % | 4.3 | % | (0.8 | )% | ||||||||
| Domestic: | ||||||||||||||
| Gross profit per new vehicle sold | $ | 1,715 | $ | 1,704 | $ | 11 | 1 | % | ||||||
| New vehicle gross margin | 4.4 | % | 4.6 | % | (0.2 | )% | ||||||||
New vehicle gross profit decreased by $20.0$141.0 million (1%)(17)% in 2023 when compared to 2022, as a result of a 2% decrease in new vehicle units sold partially offset by a 1% increase in revenue per new vehicle sold.
The seasonally adjusted annual rate ("SAAR") for new vehicle sales in the U.S. during the year ended December 31, 2023 was approximately 15.4 million which increased as compared to approximately 13.7 million during the year ended December 31, 2022. The increase in new vehicle sales revenue on a higher mixsame store basis for the year ended December 31, 2023 over the same period in the prior year is primarily attributable to an increase of $2,118 of revenue per new vehicle sold and unit salesan increase of 3,845 in our import brands, which have traditionally had lower margins than our luxury and domesticnew vehicle units sold. The increase in SAAR period over period reflects higher inventory supply, including fleet, coupled with continued consumer demand for new vehicles. However, we continue to be negatively impacted by the significant variation in new vehicle days supply among brands and experienced margin pressure during 2017.models. We ended the year with approximately 43
41
days of supply of new vehicle inventory which reflects an increase from 26 days of supply as of December 31, 2022 but remains well below historical levels.
Used Vehicle—
| For the Year Ended December 31, | Increase (Decrease) | % Change | |||||||||||||||||||||
| 2023 | 2022 | ||||||||||||||||||||||
| (Dollars in millions, except for per vehicle data) | |||||||||||||||||||||||
| As Reported: | |||||||||||||||||||||||
| Revenue: | |||||||||||||||||||||||
| Used vehicle retail revenue | $ | 4,017.5 | $ | 4,828.8 | $ | (811.3) | (17) | % | |||||||||||||||
| Used vehicle wholesale revenue | 396.7 | 368.3 | 28.5 | 8 | % | ||||||||||||||||||
| Used vehicle revenue | $ | 4,414.3 | $ | 5,197.1 | $ | (782.8) | (15) | % | |||||||||||||||
| Gross profit: | |||||||||||||||||||||||
| Used vehicle retail gross profit | $ | 248.5 | $ | 347.1 | $ | (98.5) | (28) | % | |||||||||||||||
| Used vehicle wholesale gross profit | 15.5 | 6.2 | 9.3 | 151 | % | ||||||||||||||||||
| Used vehicle gross profit | $ | 264.0 | $ | 353.2 | $ | (89.2) | (25) | % | |||||||||||||||
| Used vehicle retail units: | |||||||||||||||||||||||
| Used vehicle retail units | 127,507 | 151,464 | (23,957) | (16) | % | ||||||||||||||||||
| Same Store: | |||||||||||||||||||||||
| Revenue: | |||||||||||||||||||||||
| Used vehicle retail revenue | $ | 3,949.1 | $ | 4,503.7 | $ | (554.6) | (12) | % | |||||||||||||||
| Used vehicle wholesale revenue | 389.7 | 348.9 | 40.8 | 12 | % | ||||||||||||||||||
| Used vehicle revenue | $ | 4,338.8 | $ | 4,852.6 | $ | (513.7) | (11) | % | |||||||||||||||
| Gross profit: | |||||||||||||||||||||||
| Used vehicle retail gross profit | $ | 243.7 | $ | 323.7 | $ | (80.0) | (25) | % | |||||||||||||||
| Used vehicle wholesale gross profit | 15.3 | 7.1 | 8.3 | 117 | % | ||||||||||||||||||
| Used vehicle gross profit | $ | 259.1 | $ | 330.8 | $ | (71.7) | (22) | % | |||||||||||||||
| Used vehicle retail units: | |||||||||||||||||||||||
| Used vehicle retail units | 125,124 | 139,446 | (14,322) | (10) | % | ||||||||||||||||||
| For the Year Ended December 31, | Increase (Decrease) | % Change | ||||||||||||
| 2017 | 2016 | |||||||||||||
| (Dollars in millions, except for per vehicle data) | ||||||||||||||
| As Reported: | ||||||||||||||
| Revenue: | ||||||||||||||
| Used vehicle retail revenues | $ | 1,635.3 | $ | 1,675.0 | $ | (39.7 | ) | (2 | )% | |||||
| Used vehicle wholesale revenues | 198.8 | 201.4 | (2.6 | ) | (1 | )% | ||||||||
| Used vehicle revenue | $ | 1,834.1 | $ | 1,876.4 | $ | (42.3 | ) | (2 | )% | |||||
| Gross profit: | ||||||||||||||
| Used vehicle retail gross profit | $ | 121.1 | $ | 131.0 | $ | (9.9 | ) | (8 | )% | |||||
| Used vehicle wholesale gross profit | 0.8 | (3.7 | ) | 4.5 | (122 | )% | ||||||||
| Used vehicle gross profit | $ | 121.9 | $ | 127.3 | $ | (5.4 | ) | (4 | )% | |||||
| Used vehicle retail units: | ||||||||||||||
| Used vehicle retail units | 76,929 | 79,259 | (2,330 | ) | (3 | )% | ||||||||
| Same Store: | ||||||||||||||
| Revenue: | ||||||||||||||
| Used vehicle retail revenues | $ | 1,577.3 | $ | 1,571.4 | $ | 5.9 | — | % | ||||||
| Used vehicle wholesale revenues | 190.5 | 192.3 | (1.8 | ) | (1 | )% | ||||||||
| Used vehicle revenue | $ | 1,767.8 | $ | 1,763.7 | $ | 4.1 | — | % | ||||||
| Gross profit: | ||||||||||||||
| Used vehicle retail gross profit | $ | 115.4 | $ | 123.0 | $ | (7.6 | ) | (6 | )% | |||||
| Used vehicle wholesale gross profit | 1.1 | (2.9 | ) | 4.0 | (138 | )% | ||||||||
| Used vehicle gross profit | $ | 116.5 | $ | 120.1 | $ | (3.6 | ) | (3 | )% | |||||
| Used vehicle retail units: | ||||||||||||||
| Used vehicle retail units | 73,772 | 73,490 | 282 | — | % | |||||||||
Used Vehicle Metrics—
| For the Year Ended December 31, | Increase (Decrease) | % Change | For the Year Ended December 31, | Increase (Decrease) | % Change | ||||||||||||||||||||||||||||||||||||||||||
| 2017 | 2016 | ||||||||||||||||||||||||||||||||||||||||||||||
| As Reported: | |||||||||||||||||||||||||||||||||||||||||||||||
| As Reported: | |||||||||||||||||||||||||||||||||||||||||||||||
| As Reported: | |||||||||||||||||||||||||||||||||||||||||||||||
| Revenue per used vehicle retailed | |||||||||||||||||||||||||||||||||||||||||||||||
| Revenue per used vehicle retailed | |||||||||||||||||||||||||||||||||||||||||||||||
| Revenue per used vehicle retailed | $ | 21,257 | $ | 21,133 | $ | 124 | 1 | % | $ | 31,508 | $ | $ | 31,881 | $ | $ | (372) | (1) | (1) | % | ||||||||||||||||||||||||||||
| Gross profit per used vehicle retailed | $ | 1,574 | $ | 1,653 | $ | (79 | ) | (5 | )% | Gross profit per used vehicle retailed | $ | 1,949 | $ | $ | 2,291 | $ | $ | (342) | (15) | (15) | % | ||||||||||||||||||||||||||
| Used vehicle retail gross margin | 7.4 | % | 7.8 | % | (0.4 | )% | |||||||||||||||||||||||||||||||||||||||||
| Same Store: | |||||||||||||||||||||||||||||||||||||||||||||||
| Same Store: | |||||||||||||||||||||||||||||||||||||||||||||||
| Same Store: | |||||||||||||||||||||||||||||||||||||||||||||||
| Revenue per used vehicle retailed | |||||||||||||||||||||||||||||||||||||||||||||||
| Revenue per used vehicle retailed | |||||||||||||||||||||||||||||||||||||||||||||||
| Revenue per used vehicle retailed | $ | 21,381 | $ | 21,383 | $ | (2 | ) | — | % | $ | 31,562 | $ | $ | 32,297 | $ | $ | (735) | (2) | (2) | % | |||||||||||||||||||||||||||
| Gross profit per used vehicle retailed | $ | 1,564 | $ | 1,674 | $ | (110 | ) | (7 | )% | Gross profit per used vehicle retailed | $ | 1,948 | $ | $ | 2,321 | $ | $ | (374) | (16) | (16) | % | ||||||||||||||||||||||||||
| Used vehicle retail gross margin | 7.3 | % | 7.8 | % | (0.5 | )% | |||||||||||||||||||||||||||||||||||||||||
Used vehicle revenue decreased by $42.3$782.8 million (2%(15%), as a result of a 3%due to an $811.3 million (17%) decrease in used vehicle retail units sold,revenue, partially offset by a 1%$28.5 million (8%) increase in revenue per used vehicle retailed.wholesale revenue. Same store used vehicle revenue decreased by $513.7 million (11%) due to a $554.6 million (12%) decrease in used vehicle retail revenue, partially offset by a $40.8 million (12%) increase in used vehicle wholesale revenue. Used vehicle revenues and unit volume have continued to
42
contract during 2023, along with margins on both an all store and same store basis. Used vehicle revenue and unit volumes have been negatively impacted by the affordability headwinds and lack of inventory availability, especially in vehicles with lower mileage.
In 2017,2023, total Company and same store used vehicle retail gross profit margins decreased by $7.6 million (6%), resulting in a decrease in our gross margin from 7.8% in 2016100 and 102 basis points, respectively, to 7.3% in 2017.both 6.2%. We primarily attribute the 50 basis point decreasedecreases in same store used vehicle retail gross profit margin to increased competition and price transparency withina softening in the used vehicle marketplace.
market, which was at record highs in 2021 and, to a lesser extent 2022, as a result of new vehicle inventory shortages initially caused by COVID-19 disruptions followed by supply chain issues.
We believe that our used vehicle inventory continues to be well-aligned with current consumer demand, with approximately 3132 days of supply as of December 31, 2017.
2023. This level of days of supply is in line with our historic targeted range of 30 to 35 days.
Parts and Service—
| For the Year Ended December 31, | Increase (Decrease) | % Change | |||||||||||||||||||||
| 2023 | 2022 | ||||||||||||||||||||||
| (Dollars in millions) | |||||||||||||||||||||||
| As Reported: | |||||||||||||||||||||||
| Parts and service revenue | $ | 2,081.5 | $ | 2,074.2 | $ | 7.3 | — | % | |||||||||||||||
| Parts and service gross profit: | |||||||||||||||||||||||
| Customer pay | 709.5 | 709.7 | (0.1) | — | % | ||||||||||||||||||
| Warranty | 148.4 | 142.4 | 5.9 | 4 | % | ||||||||||||||||||
| Wholesale parts | 78.7 | 79.4 | (0.7) | (1) | % | ||||||||||||||||||
| Parts and service gross profit, excluding reconditioning and preparation | 936.6 | 931.5 | 5.1 | 1 | % | ||||||||||||||||||
| Parts and service gross margin, excluding reconditioning and preparation | 45.0% | 44.9% | 0.1 | % | |||||||||||||||||||
| Reconditioning and preparation * | 214.0 | 221.1 | (7.1) | (3) | % | ||||||||||||||||||
| Total parts and service gross profit | $ | 1,150.6 | $ | 1,152.6 | $ | (2.1) | — | % | |||||||||||||||
| Total parts and service gross margin | 55.3% | 55.6% | (0.3) | % | |||||||||||||||||||
| Same Store: | |||||||||||||||||||||||
| Parts and service revenue | $ | 2,063.2 | $ | 1,960.5 | $ | 102.6 | 5 | % | |||||||||||||||
| Parts and service gross profit: | |||||||||||||||||||||||
| Customer pay | 702.3 | 668.4 | 33.8 | 5 | % | ||||||||||||||||||
| Warranty | 147.5 | 136.2 | 11.3 | 8 | % | ||||||||||||||||||
| Wholesale parts | 78.3 | 75.9 | 2.5 | 3 | % | ||||||||||||||||||
| Parts and service gross profit, excluding reconditioning and preparation | 928.1 | 880.5 | 47.6 | 5 | % | ||||||||||||||||||
| Parts and service gross margin, excluding reconditioning and preparation | 45.0% | 44.9% | 0.1 | % | |||||||||||||||||||
| Reconditioning and preparation * | 212.7 | 207.3 | 5.4 | 3 | % | ||||||||||||||||||
| Total parts and service gross profit | $ | 1,140.7 | $ | 1,087.8 | $ | 52.9 | 5 | % | |||||||||||||||
| Total parts and service gross margin | 55.3% | 55.5% | (0.2) | % | |||||||||||||||||||
| For the Year Ended December 31, | Increase (Decrease) | % Change | ||||||||||||
| 2017 | 2016 | |||||||||||||
| (Dollars in millions) | ||||||||||||||
| As Reported: | ||||||||||||||
| Parts and service revenue | $ | 786.1 | $ | 778.5 | $ | 7.6 | 1 | % | ||||||
| Parts and service gross profit: | ||||||||||||||
| Customer pay | $ | 272.3 | $ | 268.2 | $ | 4.1 | 2 | % | ||||||
| Warranty | 81.7 | 73.7 | 8.0 | 11 | % | |||||||||
| Wholesale parts | 21.2 | 20.7 | 0.5 | 2 | % | |||||||||
| Parts and service gross profit, excluding reconditioning and preparation | $ | 375.2 | $ | 362.6 | $ | 12.6 | 3 | % | ||||||
| Parts and service gross margin, excluding reconditioning and preparation | 47.7 | % | 46.6 | % | 1.1 | % | ||||||||
| Reconditioning and preparation | 114.6 | 120.7 | (6.1 | ) | (5 | )% | ||||||||
| Total parts and service gross profit | 489.8 | 483.3 | 6.5 | 1 | % | |||||||||
| Total parts and service gross margin | 62.3 | % | 62.1 | % | 0.2 | % | ||||||||
| Same Store: | ||||||||||||||
| Parts and service revenue | $ | 772.7 | $ | 743.8 | $ | 28.9 | 4 | % | ||||||
| Parts and service gross profit: | ||||||||||||||
| Customer pay | $ | 267.2 | $ | 257.3 | $ | 9.9 | 4 | % | ||||||
| Warranty | 80.5 | 71.4 | 9.1 | 13 | % | |||||||||
| Wholesale parts | 21.0 | 19.4 | 1.6 | 8 | % | |||||||||
| Parts and service gross profit, excluding reconditioning and preparation | $ | 368.7 | $ | 348.1 | $ | 20.6 | 6 | % | ||||||
| Parts and service gross margin, excluding reconditioning and preparation | 47.7 | % | 46.8 | % | 0.9 | % | ||||||||
| Reconditioning and preparation | 112.0 | 114.7 | (2.7 | ) | (2 | )% | ||||||||
| Total parts and service gross profit | 480.7 | 462.8 | 17.9 | 4 | % | |||||||||
| Total parts and service gross margin | 62.2 | % | 62.2 | % | — | % | ||||||||
The $7.6$7.3 million (1%) increase in parts and service revenue is primarilywas due to a $13.2$6.3 million (9%increase in customer pay revenue and a $10.2 million (4%) increase in warranty revenue, partially offset by a $5.6$9.2 million (1%(2%) decrease in customer paywholesale parts revenue. Same store parts and service revenue increased $28.9 million (4%$102.6 (5%) from $743.8 million$1.96 billion in 20162022 to $772.7 million$2.06 billion in 2017.2023. The increase in same store parts and service revenue was primarily due to a $15.4$72.1 million (11%(6%) increase in customer pay revenue, a $19.8 million (8%) increase in warranty revenue and a $6.9$10.7 million (2%) increase in wholesale parts revenue.
43
Parts and service gross profit, excluding reconditioning and preparation, increased by $5.1 million (1%) to $936.6 million and same store gross profit, excluding reconditioning and preparation, increased by $47.6 million (5%) to $928.1 million. The $47.6 million increase in same store gross profit, excluding reconditioning and preparation, is primarily due to a $33.8 million (5%) increase in customer pay gross profit, an $11.3 million (8%) increase in warranty gross profit, and a $2.5 million (3%) increase in wholesale parts gross profit. As a result of the shortage of new vehicle inventory, many customers have elected to keep their current vehicles longer which has generated additional customer pay and wholesale parts gross profit for the parts and service departments. We continue to focus on increasing our customer pay parts and service revenue over the long-term by improving the customer experience, providing competitive benefits to our technicians, capitalizing on our dealership training programs and upgrading equipment.
Finance and Insurance, net—
| For the Year Ended December 31, | Increase (Decrease) | % Change | |||||||||||||||||||||
| 2023 | 2022 | ||||||||||||||||||||||
| (Dollars in millions, except for per vehicle data) | |||||||||||||||||||||||
| As Reported: | |||||||||||||||||||||||
| Finance and insurance, net revenue | $ | 676.2 | $ | 797.0 | $ | (120.8) | (15) | % | |||||||||||||||
| Finance and insurance, net gross profit | $ | 638.2 | $ | 750.7 | $ | (112.5) | (15) | % | |||||||||||||||
| Finance and insurance, net per vehicle sold | $ | 2,304 | $ | 2,480 | $ | (177) | (7) | % | |||||||||||||||
| Same Store: | |||||||||||||||||||||||
| Finance and insurance, net revenue | $ | 667.3 | $ | 761.7 | $ | (94.4) | (12) | % | |||||||||||||||
| Finance and insurance, net gross profit | $ | 629.4 | $ | 715.5 | $ | (86.1) | (12) | % | |||||||||||||||
| Finance and insurance, net per vehicle sold | $ | 2,308 | $ | 2,527 | $ | (219) | (9) | % | |||||||||||||||
F&I revenue, net decreased by $120.8 million (15%) in 2023 when compared to 2022 primarily as a result of an 8% decrease in new and used retail unit sales and a 7% decrease in F&I per vehicle retailed.
On a same store basis F&I revenue, net decreased by $94.4 million (12%) in 2023 when compared to 2022 primarily as a result of a 4% decrease in new and used retail unit sales and a 9% decrease in F&I per vehicle retailed.
The financial results of the TCA segment, after dealership eliminations, are as follows:
| For the Year Ended December 31, | Increase (Decrease) | % Change | |||||||||||||||||||||
| 2023 | 2022 | ||||||||||||||||||||||
| (Dollars in millions) | |||||||||||||||||||||||
| Finance and insurance, revenue | $ | 138.3 | $ | 126.0 | $ | 12.3 | 10 | % | |||||||||||||||
| Finance and insurance, cost of sales | $ | 37.9 | $ | 46.3 | $ | (8.4) | (18) | % | |||||||||||||||
| Finance and insurance, gross profit | $ | 100.4 | $ | 79.8 | $ | 20.7 | 26 | % | |||||||||||||||
TCA offers a variety of F&I products, such as extended vehicle service contracts, prepaid maintenance contracts, GAP, appearance protection contracts and lease wear-and-tear contracts. TCA's products are sold through our automobile dealerships.
Revenue generated by TCA is earned over the period of the related product contract. The method for recognizing revenue is assigned based on contract type and expected claim patterns. Premium revenues are supplemented with investment gains or losses and income earned associated with the performance of TCA's investment portfolio. During the year ended December 31, 2023, TCA generated $138.3 million of revenue, consisting primarily of earned premium and $15.7 million from the investment portfolio.
Direct expenses incurred for the acquisition of F&I contracts on which revenue has not yet been recognized have been deferred and are amortized over the related contract period. During the year ended December 31, 2023, TCA recorded $37.9 million of cost of sales consisting primarily of claims expense, after the elimination of claims paid to affiliated dealerships. Commissions expense paid by TCA to our affiliated dealerships and reflected as F&I revenue in our Dealerships segment is eliminated in the TCA segment upon consolidation.
44
As we continue to integrate TCA, we expect a rollout of TCA products to our remaining stores by the end of 2024. With the ownership of TCA, while the combined profitability of the transaction is higher, the timing of revenue and cost recognition is deferred and amortized over the life of the contract. We expect that this rollout will result in lower F&I revenue and gross profit over the next two to three years due to the change in how these contracts are earned.
Selling, General, and Administrative Expense—
| For the Year Ended December 31, | Increase (Decrease) | % of Gross Profit Increase (Decrease) | |||||||||||||||||||||||||||||||||
| 2023 | % of Gross Profit | 2022 | % of Gross Profit | ||||||||||||||||||||||||||||||||
| (Dollars in millions) | |||||||||||||||||||||||||||||||||||
| As Reported: | |||||||||||||||||||||||||||||||||||
| Personnel costs | $ | 1,081.7 | 39.3 | % | $ | 1,247.4 | 40.2 | % | $ | (165.7) | (1.0) | % | |||||||||||||||||||||||
| Rent and related expenses | 119.0 | 4.3 | % | 121.7 | 3.9 | % | (2.7) | 0.4 | % | ||||||||||||||||||||||||||
| Advertising | 47.5 | 1.7 | % | 50.1 | 1.6 | % | (2.6) | 0.1 | % | ||||||||||||||||||||||||||
| Other | 369.2 | 13.4 | % | 344.2 | 11.1 | % | 25.0 | 2.3 | % | ||||||||||||||||||||||||||
| Selling, general, and administrative expense | $ | 1,617.4 | 58.7 | % | $ | 1,763.4 | 56.9 | % | $ | (146.0) | 1.8 | % | |||||||||||||||||||||||
| Gross profit | $ | 2,755.8 | $ | 3,100.6 | |||||||||||||||||||||||||||||||
| Same Store: | |||||||||||||||||||||||||||||||||||
| Personnel costs | $ | 1,068.5 | 39.2 | % | $ | 1,181.8 | 40.2 | % | $ | (113.3) | (0.9) | % | |||||||||||||||||||||||
| Rent and related expenses | 117.9 | 4.3 | % | 116.3 | 4.0 | % | 1.6 | 0.4 | % | ||||||||||||||||||||||||||
| Advertising | 45.6 | 1.7 | % | 43.8 | 1.5 | % | 1.8 | 0.2 | % | ||||||||||||||||||||||||||
| Other | 361.6 | 13.3 | % | 329.0 | 11.2 | % | 32.6 | 2.1 | % | ||||||||||||||||||||||||||
| Selling, general, and administrative expense | $ | 1,593.6 | 58.5 | % | $ | 1,670.9 | 56.8 | % | $ | (77.3) | 1.7 | % | |||||||||||||||||||||||
| Gross profit | $ | 2,722.8 | $ | 2,941.7 | |||||||||||||||||||||||||||||||
SG&A expense as a percentage of gross profit increased 182 basis points from 56.9% in 2022 to 58.7% in 2023. Same store SG&A expense as a percentage of gross profit increased 173 basis points from 56.8% in 2022 to 58.5% in 2023. The increase in SG&A as a percentage of gross profit is primarily the result of lower gross profits for 2023 when compared to 2022. SG&A expense for the year ended December 31, 2023 includes $4.3 million of expense related to hail damage, a $3.6 million gain from the sale of real estate and $4.1 million of professional fees related to the Koons acquisition. SG&A expense for the year ended December 31, 2022 includes $2.7 million of professional fees related to acquisition due diligence.
Asset Impairments —
During the year ended December 31, 2023, we recognized asset impairment charges of $117.2 million as compared to no impairment charges during the year ended December 31, 2022. The asset impairment charges resulted from our annual franchise rights impairment tests and the classification of certain asset disposal groups as held for sale which resulted in additional franchise rights and goodwill impairment charges.
Floor Plan Interest Expense —
Floor plan interest expense increased by $1.3 million (15%) to $9.6 million during 2023 compared to $8.4 million during 2022 due to less cash held in the floor plan offset account in December 2023 as a result of funding the Koons acquisition.
Other Interest Expense —
Other interest expense increased $3.9 million (3%) from $152.2 million in 2022 to $156.1 million in 2023. The increase is primarily due to higher loaner payable interest expense driven by higher loaner vehicle balances, as well as interest expense on our revolving credit agreement in December 2023.
45
Gain on Dealership Divestitures —
During the year ended December 31, 2023, we sold one franchise (one dealership location) in Austin, Texas. The Company recorded a pre-tax gain totaling $13.5 million.
During the year ended December 31, 2022, we sold one franchise (one dealership location) in St. Louis, Missouri, three franchises (three dealership locations) and one collision center in Colorado, two franchises (two dealership locations) in Spokane, Washington, one franchise (one dealership location) in Albuquerque, New Mexico and 11 franchises (nine dealership locations) and two collision centers in North Carolina. The Company recorded a net pre-tax gain totaling $207.1 million.
Income Tax Expense —
The $123.0 million (38%) decrease in income tax expense was primarily the result of a $517.8 million (39%) decrease in income before income taxes. Our effective tax rate increased 41 basis points from 24.4% in 2022 to 24.8% in 2023. The increase in our effective tax rate was primarily due to lower income before taxes and our acquisition and divestiture activity. Stores acquired are located in relatively high tax rate states while the stores divested are located in relatively low or no tax rate states.
Refer to Note 16 "Income Taxes" for additional information regarding income taxes.
46
CONSOLIDATED RESULTS OF OPERATIONS
The Company's full year results for 2022 include the results of the dealerships acquired in the fourth quarter of 2021. Accordingly, the significant increases in revenue, gross profit and income from operations for 2022 compared to 2021 are largely a result of these acquisitions.
The Year Ended December 31, 2022 Compared to the Year Ended December 31, 2021
| For the Year Ended December 31, | Increase (Decrease) | % Change | |||||||||||||||||||||
| 2022 | 2021 | ||||||||||||||||||||||
| (Dollars in millions, except per share data) | |||||||||||||||||||||||
| REVENUE: | |||||||||||||||||||||||
| New vehicle | $ | 7,365.6 | $ | 4,934.1 | $ | 2,431.5 | 49 | % | |||||||||||||||
| Used vehicle | 5,197.1 | 3,315.6 | 1,881.4 | 57 | % | ||||||||||||||||||
| Parts and service | 2,074.2 | 1,182.9 | 891.4 | 75 | % | ||||||||||||||||||
| Finance and insurance, net | 797.0 | 405.1 | 391.9 | 97 | % | ||||||||||||||||||
| TOTAL REVENUE | 15,433.8 | 9,837.7 | 5,596.2 | 57 | % | ||||||||||||||||||
| GROSS PROFIT: | |||||||||||||||||||||||
| New vehicle | 844.0 | 490.5 | 353.5 | 72 | % | ||||||||||||||||||
| Used vehicle | 353.2 | 288.3 | 64.9 | 22 | % | ||||||||||||||||||
| Parts and service | 1,152.6 | 721.9 | 430.8 | 60 | % | ||||||||||||||||||
| Finance and insurance, net | 750.7 | 401.5 | 349.2 | 87 | % | ||||||||||||||||||
| TOTAL GROSS PROFIT | 3,100.6 | 1,902.2 | 1,198.4 | 63 | % | ||||||||||||||||||
| OPERATING EXPENSES: | |||||||||||||||||||||||
| Selling, general, and administrative | 1,763.4 | 1,073.9 | 689.4 | 64 | % | ||||||||||||||||||
| Depreciation and amortization | 69.0 | 41.9 | 27.1 | 65 | % | ||||||||||||||||||
| Other operating income, net | (4.4) | (5.4) | 1.0 | (19) | % | ||||||||||||||||||
| INCOME FROM OPERATIONS | 1,272.6 | 791.8 | 480.8 | 61 | % | ||||||||||||||||||
| OTHER (INCOME) EXPENSES: | |||||||||||||||||||||||
| Floor plan interest expense | 8.4 | 8.2 | 0.2 | 2 | % | ||||||||||||||||||
| Other interest expense, net | 152.2 | 93.9 | 58.3 | 62 | % | ||||||||||||||||||
| Gain on dealership divestitures, net | (207.1) | (8.0) | (199.1) | NM | |||||||||||||||||||
| Total other (income) expenses, net | (46.5) | 94.1 | (140.6) | NM | |||||||||||||||||||
| INCOME BEFORE INCOME TAXES | 1,319.1 | 697.7 | 621.4 | 89 | % | ||||||||||||||||||
| Income tax expense | 321.8 | 165.3 | 156.5 | 95 | % | ||||||||||||||||||
| NET INCOME | $ | 997.3 | $ | 532.4 | $ | 464.9 | 87 | % | |||||||||||||||
| Net income per common share—Diluted | $ | 44.61 | $ | 26.49 | $ | 18.12 | 68 | % | |||||||||||||||
NM—Not Meaningful
47
| For the Year Ended December 31, | |||||||||||
| 2022 | 2021 | ||||||||||
| REVENUE MIX PERCENTAGES: | |||||||||||
| New vehicles | 47.7 | % | 50.2 | % | |||||||
| Used retail vehicles | 31.3 | % | 31.1 | % | |||||||
| Used vehicle wholesale | 2.4 | % | 2.6 | % | |||||||
| Parts and service | 13.4 | % | 12.0 | % | |||||||
| Finance and insurance, net | 5.2 | % | 4.1 | % | |||||||
| Total revenue | 100.0 | % | 100.0 | % | |||||||
| GROSS PROFIT MIX PERCENTAGES: | |||||||||||
| New vehicles | 27.2 | % | 25.8 | % | |||||||
| Used retail vehicles | 11.2 | % | 13.8 | % | |||||||
| Used vehicle wholesale | 0.2 | % | 1.4 | % | |||||||
| Parts and service | 37.2 | % | 38.0 | % | |||||||
| Finance and insurance, net | 24.2 | % | 21.1 | % | |||||||
| Total gross profit | 100.0 | % | 100.0 | % | |||||||
| GROSS PROFIT MARGIN | 20.1 | % | 19.3 | % | |||||||
| SG&A EXPENSES AS A PERCENTAGE OF GROSS PROFIT | 56.9 | % | 56.5 | % | |||||||
Total revenue during 2022 increased by $5.60 billion (57%) compared to 2021, due to a $2.43 billion (49%) increase in new vehicle revenue, a $1.88 billion (57%) increase in used vehicle revenue, a $891.4 million (75%) increase in parts and service revenue and a $391.9 million (97%) increase in F&I revenue.
The $1.20 billion (63%) increase in gross profit during 2022 was the result of a $353.5 million (72%) increase in new vehicle gross profit, a $64.9 million (22%) increase in used vehicle gross profit, a $430.8 million (60%) increase in parts and service gross profit and a $349.2 million (87%) increase in F&I gross profit. Our total gross profit margin increased 75 basis points from 19.3% in 2021 to 20.1% in 2022.
Income from operations during 2022 increased by $480.8 million (61%) compared to 2021, primarily due to a $1.20 billion (63%) increase in gross profit, partially offset by a $689.4 million (64%) increase in selling, general, and administrative expenses and a $27.1 million (65%) increase in depreciation and amortization expenses.
Total other (income) expenses, net decreased by $140.6 million (149%) from expense of $94.1 million in 2021 to $46.5 million of income in 2022, primarily due to a $199.1 million increase in gain on dealership divestitures, partially offset by a $58.3 million increase in other interest expense, net, and a $0.2 million increase in floor plan interest expense. As a result, income before income taxes increased by $621.4 million (89%) to $1.32 billion in 2022. The $156.5 million (95%) increase in income tax expense was primarily attributable to the 89% increase in income before taxes and a 70 basis point increase in the 2022 effective tax rate. Overall, net income increased by $464.9 million (87%) from $532.4 million in 2021 to $997.3 million in 2022.
48
DEALERSHIPS SEGMENT
New Vehicle—
| For the Year Ended December 31, | Increase (Decrease) | % Change | |||||||||||||||||||||
| 2022 | 2021 | ||||||||||||||||||||||
| (Dollars in millions, except for per vehicle data) | |||||||||||||||||||||||
| As Reported: | |||||||||||||||||||||||
| Revenue: | |||||||||||||||||||||||
| Luxury | $ | 2,315.7 | $ | 2,183.0 | $ | 132.7 | 6 | % | |||||||||||||||
| Import | 2,914.9 | 1,935.8 | 979.2 | 51 | % | ||||||||||||||||||
| Domestic | 2,135.0 | 815.3 | 1,319.7 | 162 | % | ||||||||||||||||||
| Total new vehicle revenue | $ | 7,365.6 | $ | 4,934.1 | $ | 2,431.5 | 49 | % | |||||||||||||||
| Gross profit: | |||||||||||||||||||||||
| Luxury | $ | 293.0 | $ | 241.1 | $ | 51.9 | 22 | % | |||||||||||||||
| Import | 338.7 | 175.3 | 163.4 | 93 | % | ||||||||||||||||||
| Domestic | 212.3 | 74.1 | 138.2 | 187 | % | ||||||||||||||||||
| Total new vehicle gross profit | $ | 844.0 | $ | 490.5 | $ | 353.5 | 72 | % | |||||||||||||||
| New vehicle units: | |||||||||||||||||||||||
| Luxury | 33,904 | 34,648 | (744) | (2) | % | ||||||||||||||||||
| Import | 78,388 | 58,413 | 19,975 | 34 | % | ||||||||||||||||||
| Domestic | 38,887 | 16,849 | 22,038 | 131 | % | ||||||||||||||||||
| Total new vehicle units | 151,179 | 109,910 | 41,269 | 38 | % | ||||||||||||||||||
| Same Store: | |||||||||||||||||||||||
| Revenue: | |||||||||||||||||||||||
| Luxury | $ | 1,919.4 | $ | 2,031.4 | $ | (112.0) | (6) | % | |||||||||||||||
| Import | 1,532.2 | 1,739.1 | (207.0) | (12) | % | ||||||||||||||||||
| Domestic | 563.7 | 652.5 | (88.8) | (14) | % | ||||||||||||||||||
| Total new vehicle revenue | $ | 4,015.2 | $ | 4,423.0 | $ | (407.8) | (9) | % | |||||||||||||||
| Gross profit: | |||||||||||||||||||||||
| Luxury | $ | 239.1 | $ | 225.4 | $ | 13.7 | 6 | % | |||||||||||||||
| Import | 178.5 | 156.2 | 22.3 | 14 | % | ||||||||||||||||||
| Domestic | 52.8 | 57.6 | (4.8) | (8) | % | ||||||||||||||||||
| Total new vehicle gross profit | $ | 470.4 | $ | 439.2 | $ | 31.2 | 7 | % | |||||||||||||||
| New vehicle units: | |||||||||||||||||||||||
| Luxury | 27,920 | 32,005 | (4,085) | (13) | % | ||||||||||||||||||
| Import | 42,179 | 52,719 | (10,540) | (20) | % | ||||||||||||||||||
| Domestic | 10,799 | 13,591 | (2,792) | (21) | % | ||||||||||||||||||
| Total new vehicle units | 80,898 | 98,315 | (17,417) | (18) | % | ||||||||||||||||||
49
New Vehicle Metrics—
| For the Year Ended December 31, | Increase (Decrease) | % Change | |||||||||||||||||||||
| 2022 | 2021 | ||||||||||||||||||||||
| As Reported: | |||||||||||||||||||||||
| Revenue per new vehicle sold | $ | 48,721 | $ | 44,892 | $ | 3,829 | 9 | % | |||||||||||||||
| Gross profit per new vehicle sold | $ | 5,583 | $ | 4,462 | $ | 1,120 | 25 | % | |||||||||||||||
| New vehicle gross margin | 11.5 | % | 9.9 | % | 1.5 | % | |||||||||||||||||
| Luxury: | |||||||||||||||||||||||
| Gross profit per new vehicle sold | $ | 8,642 | $ | 6,958 | $ | 1,684 | 24 | % | |||||||||||||||
| New vehicle gross margin | 12.7 | % | 11.0 | % | 1.6 | % | |||||||||||||||||
| Import: | |||||||||||||||||||||||
| Gross profit per new vehicle sold | $ | 4,320 | $ | 3,001 | $ | 1,319 | 44 | % | |||||||||||||||
| New vehicle gross margin | 11.6 | % | 9.1 | % | 2.6 | % | |||||||||||||||||
| Domestic: | |||||||||||||||||||||||
| Gross profit per new vehicle sold | $ | 5,460 | $ | 4,397 | $ | 1,063 | 24 | % | |||||||||||||||
| New vehicle gross margin | 9.9 | % | 9.1 | % | 0.9 | % | |||||||||||||||||
| Same Store: | |||||||||||||||||||||||
| Revenue per new vehicle sold | $ | 49,633 | $ | 44,988 | $ | 4,645 | 10 | % | |||||||||||||||
| Gross profit per new vehicle sold | $ | 5,815 | $ | 4,468 | $ | 1,348 | 30 | % | |||||||||||||||
| New vehicle gross margin | 11.7 | % | 9.9 | % | 1.8 | % | |||||||||||||||||
| Luxury: | |||||||||||||||||||||||
| Gross profit per new vehicle sold | $ | 8,563 | $ | 7,041 | $ | 1,522 | 22 | % | |||||||||||||||
| New vehicle gross margin | 12.5 | % | 11.1 | % | 1.4 | % | |||||||||||||||||
| Import: | |||||||||||||||||||||||
| Gross profit per new vehicle sold | $ | 4,233 | $ | 2,964 | $ | 1,269 | 43 | % | |||||||||||||||
| New vehicle gross margin | 11.7 | % | 9.0 | % | 2.7 | % | |||||||||||||||||
| Domestic: | |||||||||||||||||||||||
| Gross profit per new vehicle sold | $ | 4,892 | $ | 4,241 | $ | 652 | 15 | % | |||||||||||||||
| New vehicle gross margin | 9.4 | % | 8.8 | % | 0.5 | % | |||||||||||||||||
New vehicle revenue increased by $2.43 billion (49%), as a result of a 38% increase in new vehicle unit sales and a 9% increase in revenue per new vehicle sold. Same store new vehicle revenue decreased by $407.8 million (9%) as a result of a 18% decrease in new vehicle units sold offset by a 10% increase in revenue per new vehicle sold.
New vehicle gross profit increased by $353.5 million (72%) , as a result of a 25% increase in gross profit per new vehicle sold and a 38% increase in unit volumes. Same store new vehicle gross profit increased by $31.2 million (7%) in 2022, as a result of a 30% increase in gross profit per new vehicle sold partially offset by a 18% decrease in unit volumes. Same store new vehicle gross margin increased 179 basis points to 11.7% in 2022, primarily as a result of supply challenges for much of 2022 caused by a global semi-conductor shortage which led to manufacturer production challenges. We finished 2022 with a 26 days of supply of new vehicle inventory which is below our targeted days supply primarily as a result of these manufacturer production challenges.
50
Used Vehicle—
| For the Year Ended December 31, | Increase (Decrease) | % Change | |||||||||||||||||||||
| 2022 | 2021 | ||||||||||||||||||||||
| (Dollars in millions, except for per vehicle data) | |||||||||||||||||||||||
| As Reported: | |||||||||||||||||||||||
| Revenue: | |||||||||||||||||||||||
| Used vehicle retail revenue | $ | 4,828.8 | $ | 3,055.9 | $ | 1,772.8 | 58 | % | |||||||||||||||
| Used vehicle wholesale revenue | 368.3 | 259.7 | 108.6 | 42 | % | ||||||||||||||||||
| Used vehicle revenue | $ | 5,197.1 | $ | 3,315.6 | $ | 1,881.4 | 57 | % | |||||||||||||||
| Gross profit: | |||||||||||||||||||||||
| Used vehicle retail gross profit | $ | 347.1 | $ | 262.0 | $ | 85.1 | 32 | % | |||||||||||||||
| Used vehicle wholesale gross profit | 6.2 | 26.4 | (20.2) | (77) | % | ||||||||||||||||||
| Used vehicle gross profit | $ | 353.2 | $ | 288.3 | $ | 64.9 | 22 | % | |||||||||||||||
| Used vehicle retail units: | |||||||||||||||||||||||
| Used vehicle retail units | 151,464 | 105,206 | 46,258 | 44 | % | ||||||||||||||||||
| Same Store: | |||||||||||||||||||||||
| Revenue: | |||||||||||||||||||||||
| Used vehicle retail revenue | $ | 2,988.0 | $ | 2,761.1 | $ | 226.9 | 8 | % | |||||||||||||||
| Used vehicle wholesale revenue | 154.3 | 232.4 | (78.1) | (34) | % | ||||||||||||||||||
| Used vehicle revenue | $ | 3,142.3 | $ | 2,993.6 | $ | 148.7 | 5 | % | |||||||||||||||
| Gross profit: | |||||||||||||||||||||||
| Used vehicle retail gross profit | $ | 190.6 | $ | 238.0 | $ | (47.4) | (20) | % | |||||||||||||||
| Used vehicle wholesale gross profit | 1.6 | 24.5 | (22.8) | (93) | % | ||||||||||||||||||
| Used vehicle gross profit | $ | 192.3 | $ | 262.5 | $ | (70.2) | (27) | % | |||||||||||||||
| Used vehicle retail units: | |||||||||||||||||||||||
| Used vehicle retail units | 91,433 | 94,336 | (2,903) | (3) | % | ||||||||||||||||||
Used Vehicle Metrics—
| For the Year Ended December 31, | Increase (Decrease) | % Change | |||||||||||||||||||||
| 2022 | 2021 | ||||||||||||||||||||||
| As Reported: | |||||||||||||||||||||||
| Revenue per used vehicle retailed | $ | 31,881 | $ | 29,047 | $ | 2,833 | 10 | % | |||||||||||||||
| Gross profit per used vehicle retailed | $ | 2,291 | $ | 2,490 | $ | (199) | (8) | % | |||||||||||||||
| Used vehicle retail gross margin | 7.2 | % | 8.6 | % | (1.4) | % | |||||||||||||||||
| Same Store: | |||||||||||||||||||||||
| Revenue per used vehicle retailed | $ | 32,679 | $ | 29,269 | $ | 3,411 | 12 | % | |||||||||||||||
| Gross profit per used vehicle retailed | $ | 2,085 | $ | 2,523 | $ | (438) | (17) | % | |||||||||||||||
| Used vehicle retail gross margin | 6.4 | % | 8.6 | % | (2.2) | % | |||||||||||||||||
Used vehicle revenue increased by $1.88 billion (57%), due to a $1.77 billion (58%) increase in used retail revenue and a $108.6 million (42%) increase in used vehicle wholesale revenue. Same store used vehicle revenue increased by $148.7 million (5%) due to a $226.9 million (8%) increase in used vehicle retail revenue, partially offset by a $78.1 million (34%) decrease in used vehicle wholesale revenue.
In 2022, total Company and same store used vehicle retail gross profit margins both decreased 139 and 224 basis points to 7.2% and 6.4%, respectively. We attribute the decreases in used vehicle retail gross profit margin to a softening in the used
51
vehicle market, which was at record highs in 2021 as a result of new vehicle inventory shortages caused by semiconductor supply chain issues and COVID-19 disruptions.
We believe that our used vehicle inventory continues to be well-aligned with current consumer demand, with approximately 27 days of supply as of December 31, 2022.
Parts and Service—
| For the Year Ended December 31, | Increase (Decrease) | % Change | |||||||||||||||||||||
| 2022 | 2021 | ||||||||||||||||||||||
| (Dollars in millions) | |||||||||||||||||||||||
| As Reported: | |||||||||||||||||||||||
| Parts and service revenue | $ | 2,107.5 | $ | 1,184.3 | $ | 923.3 | 78 | % | |||||||||||||||
| Parts and service gross profit: | |||||||||||||||||||||||
| Customer pay | 724.8 | 434.2 | 290.6 | 67 | % | ||||||||||||||||||
| Warranty | 142.4 | 98.0 | 44.4 | 45 | % | ||||||||||||||||||
| Wholesale parts | 79.4 | 34.3 | 45.1 | 132 | % | ||||||||||||||||||
| Parts and service gross profit, excluding reconditioning and preparation | 946.7 | 566.5 | 380.2 | 67 | % | ||||||||||||||||||
| Parts and service gross margin, excluding reconditioning and preparation | 44.9% | 47.8% | (2.9) | % | |||||||||||||||||||
| Reconditioning and preparation * | 221.1 | 153.6 | 67.5 | 44 | % | ||||||||||||||||||
| Total parts and service gross profit | $ | 1,167.8 | $ | 720.1 | $ | 447.7 | 62 | % | |||||||||||||||
| Total parts and service gross margin | 55.4% | 60.8% | (5.4) | % | |||||||||||||||||||
| Same Store: | |||||||||||||||||||||||
| Parts and service revenue | $ | 1,181.8 | $ | 1,055.5 | $ | 126.3 | 12 | % | |||||||||||||||
| Parts and service gross profit: | |||||||||||||||||||||||
| Customer pay | 450.3 | 390.3 | 60.1 | 15 | % | ||||||||||||||||||
| Warranty | 82.5 | 88.2 | (5.7) | (7) | % | ||||||||||||||||||
| Wholesale parts | 32.9 | 29.7 | 3.2 | 11 | % | ||||||||||||||||||
| Parts and service gross profit, excluding reconditioning and preparation | 565.7 | 508.1 | 57.5 | 11 | % | ||||||||||||||||||
| Parts and service gross margin, excluding reconditioning and preparation | 47.9% | 48.1% | (0.3) | % | |||||||||||||||||||
| Reconditioning and preparation * | 141.6 | 137.6 | 4.0 | 3 | % | ||||||||||||||||||
| Total parts and service gross profit | $ | 707.3 | $ | 645.7 | $ | 61.6 | 10 | % | |||||||||||||||
| Total parts and service gross margin | 59.8% | 61.2% | (1.3) | % | |||||||||||||||||||
* Reconditioning and preparation represents the gross profit earned by our parts and service departments for internal work performed and is included as a reduction of Parts and service cost of sales within the accompanying consolidated statements of income upon the sale of the vehicle.
The $923.3 million (78%) increase in parts and service revenue was due to a $568.1 million (70%) increase in customer pay revenue, a $270.2 million (143%) increase in wholesale parts revenue and a $85.0 million (47%) increase in warranty revenue. Same store parts and service revenue increased $126.3 million (12%) from $1.06 billion in 2021 to $1.18 billion in 2022. The increase in same store parts and service revenue was due to a $108.7 million (15%) increase in customer pay revenue and a $6.6$26.8 million (6%(17%) increase in wholesale parts revenue, partially offset by a $9.1 million (6%) decrease in warranty revenue.
Parts and service gross profit, excluding reconditioning and preparation, increased by $12.6$380.2 million (3%(67%) to $375.2$946.7 million and same store gross profit, excluding reconditioning and preparation, increased by $20.6$57.5 million (6%(11%) to $368.7$565.7 million. The $20.6$57.5 million increase in same store gross profit is primarily due to a $9.1 million (13%) increase in warranty gross profit and a $9.9 million (4%) increase in customer pay gross profit, which has continued to benefit from our strategic focus to improve customer retention and the recent trend of increasing new vehicle sales over the past few years.
| For the Year Ended December 31, | Increase (Decrease) | % Change | ||||||||||||
| 2017 | 2016 | |||||||||||||
| (Dollars in millions, except for per vehicle data) | ||||||||||||||
| As Reported: | ||||||||||||||
| Finance and insurance, net | $ | 275.2 | $ | 261.0 | $ | 14.2 | 5 | % | ||||||
| Finance and insurance, net per vehicle sold | $ | 1,556 | $ | 1,437 | $ | 119 | 8 | % | ||||||
| Same Store: | ||||||||||||||
| Finance and insurance, net | $ | 266.9 | $ | 249.1 | $ | 17.8 | 7 | % | ||||||
| Finance and insurance, net per vehicle sold | $ | 1,562 | $ | 1,448 | $ | 114 | 8 | % | ||||||
| For the Year Ended December 31, | Increase (Decrease) | % of Gross Profit Increase (Decrease) | ||||||||||||||||||
| 2017 | % of Gross Profit | 2016 | % of Gross Profit | |||||||||||||||||
| (Dollars in millions) | ||||||||||||||||||||
| As Reported: | ||||||||||||||||||||
| Personnel costs | $ | 348.7 | 33.0 | % | $ | 343.1 | 32.4 | % | $ | 5.6 | 0.6 | % | ||||||||
| Sales compensation | 111.1 | 10.5 | % | 112.0 | 10.6 | % | (0.9 | ) | (0.1 | )% | ||||||||||
| Share-based compensation | 13.6 | 1.3 | % | 12.0 | 1.1 | % | 1.6 | 0.2 | % | |||||||||||
| Outside services | 80.8 | 7.7 | % | 78.3 | 7.4 | % | 2.5 | 0.3 | % | |||||||||||
| Advertising | 30.3 | 2.9 | % | 34.0 | 3.2 | % | (3.7 | ) | (0.3 | )% | ||||||||||
| Rent | 26.7 | 2.5 | % | 29.9 | 2.8 | % | (3.2 | ) | (0.3 | )% | ||||||||||
| Utilities | 15.4 | 1.5 | % | 15.5 | 1.5 | % | (0.1 | ) | — | % | ||||||||||
| Insurance | 13.4 | 1.3 | % | 15.9 | 1.5 | % | (2.5 | ) | (0.2 | )% | ||||||||||
| Other | 89.7 | 8.4 | % | 91.8 | 8.7 | % | (2.1 | ) | (0.3 | )% | ||||||||||
| Selling, general, and administrative expense | $ | 729.7 | 69.1 | % | $ | 732.5 | 69.2 | % | $ | (2.8 | ) | (0.1 | )% | |||||||
| Gross profit | $ | 1,055.9 | $ | 1,058.7 | ||||||||||||||||
| Same Store: | ||||||||||||||||||||
| Personnel costs | $ | 338.2 | 32.9 | % | $ | 327.1 | 32.3 | % | $ | 11.1 | 0.6 | % | ||||||||
| Sales compensation | 107.2 | 10.4 | % | 106.6 | 10.5 | % | 0.6 | (0.1 | )% | |||||||||||
| Share-based compensation | 13.6 | 1.3 | % | 12.1 | 1.2 | % | 1.5 | 0.1 | % | |||||||||||
| Outside services | 78.7 | 7.7 | % | 73.6 | 7.3 | % | 5.1 | 0.4 | % | |||||||||||
| Advertising | 28.9 | 2.8 | % | 30.1 | 3.0 | % | (1.2 | ) | (0.2 | )% | ||||||||||
| Rent | 26.7 | 2.6 | % | 29.9 | 3.0 | % | (3.2 | ) | (0.4 | )% | ||||||||||
| Utilities | 15.0 | 1.5 | % | 14.5 | 1.4 | % | 0.5 | 0.1 | % | |||||||||||
| Insurance | 13.0 | 1.3 | % | 14.9 | 1.5 | % | (1.9 | ) | (0.2 | )% | ||||||||||
| Other | 87.8 | 8.5 | % | 87.9 | 8.6 | % | (0.1 | ) | (0.1 | )% | ||||||||||
| Selling, general, and administrative expense | $ | 709.1 | 69.0 | % | $ | 696.7 | 68.8 | % | $ | 12.4 | 0.2 | % | ||||||||
| Gross profit | $ | 1,028.1 | $ | 1,013.3 | ||||||||||||||||
| For the Year Ended December 31, | Increase (Decrease) | % Change | ||||||||||||
| 2016 | 2015 | |||||||||||||
| (Dollars in millions, except per share data) | ||||||||||||||
| REVENUE: | ||||||||||||||
| New vehicle | $ | 3,611.9 | $ | 3,652.5 | $ | (40.6 | ) | (1 | )% | |||||
| Used vehicle | 1,876.4 | 1,931.7 | (55.3 | ) | (3 | )% | ||||||||
| Parts and service | 778.5 | 740.7 | 37.8 | 5 | % | |||||||||
| Finance and insurance, net | 261.0 | 263.4 | (2.4 | ) | (1 | )% | ||||||||
| TOTAL REVENUE | 6,527.8 | 6,588.3 | (60.5 | ) | (1 | )% | ||||||||
| GROSS PROFIT: | ||||||||||||||
| New vehicle | 187.1 | 203.0 | (15.9 | ) | (8 | )% | ||||||||
| Used vehicle | 127.3 | 131.8 | (4.5 | ) | (3 | )% | ||||||||
| Parts and service | 483.3 | 462.6 | 20.7 | 4 | % | |||||||||
| Finance and insurance, net | 261.0 | 263.4 | (2.4 | ) | (1 | )% | ||||||||
| TOTAL GROSS PROFIT | 1,058.7 | 1,060.8 | (2.1 | ) | — | % | ||||||||
| OPERATING EXPENSES: | ||||||||||||||
| Selling, general, and administrative | 732.5 | 729.9 | 2.6 | — | % | |||||||||
| Depreciation and amortization | 30.7 | 29.5 | 1.2 | 4 | % | |||||||||
| Other operating income, net | (2.3 | ) | (0.2 | ) | (2.1 | ) | NM | |||||||
| INCOME FROM OPERATIONS | 297.8 | 301.6 | (3.8 | ) | (1 | )% | ||||||||
| OTHER EXPENSES (INCOME): | ||||||||||||||
| Floor plan interest expense | 19.3 | 16.1 | 3.2 | 20 | % | |||||||||
| Other interest expense, net | 53.1 | 44.0 | 9.1 | 21 | % | |||||||||
| Swap interest expense | 3.1 | 3.0 | 0.1 | 3 | % | |||||||||
| Gain on divestitures | (45.5 | ) | (34.9 | ) | (10.6 | ) | 30 | % | ||||||
| Total other expenses, net | 30.0 | 28.2 | 1.8 | 6 | % | |||||||||
| INCOME FROM CONTINUING OPERATIONS BEFORE INCOME TAXES | 267.8 | 273.4 | (5.6 | ) | (2 | )% | ||||||||
| Income tax expense | 100.6 | 104.0 | (3.4 | ) | (3 | )% | ||||||||
| INCOME FROM CONTINUING OPERATIONS | 167.2 | 169.4 | (2.2 | ) | (1 | )% | ||||||||
| Discontinued operations, net of tax | — | (0.2 | ) | 0.2 | (100 | )% | ||||||||
| NET INCOME | $ | 167.2 | $ | 169.2 | $ | (2.0 | ) | (1 | )% | |||||
| Income from continuing operations per common share—Diluted | $ | 7.40 | $ | 6.42 | $ | 0.98 | 15 | % | ||||||
| Net income per common share—Diluted | $ | 7.40 | $ | 6.41 | $ | 0.99 | 15 | % | ||||||
| For the Year Ended December 31, | |||||
| 2016 | 2015 | ||||
| REVENUE MIX PERCENTAGES: | |||||
| New vehicles | 55.3 | % | 55.4 | % | |
| Used retail vehicles | 25.7 | % | 26.1 | % | |
| Used vehicle wholesale | 3.1 | % | 3.3 | % | |
| Parts and service | 11.9 | % | 11.2 | % | |
| Finance and insurance, net | 4.0 | % | 4.0 | % | |
| Total revenue | 100.0 | % | 100.0 | % | |
| GROSS PROFIT MIX PERCENTAGES: | |||||
| New vehicles | 17.7 | % | 19.1 | % | |
| Used retail vehicles | 12.3 | % | 12.9 | % | |
| Used vehicle wholesale | (0.3 | )% | (0.4 | )% | |
| Parts and service | 45.6 | % | 43.6 | % | |
| Finance and insurance, net | 24.7 | % | 24.8 | % | |
| Total gross profit | 100.0 | % | 100.0 | % | |
| GROSS PROFIT MARGIN | 16.2 | % | 16.1 | % | |
| SG&A EXPENSES AS A PERCENTAGE OF GROSS PROFIT | 69.2 | % | 68.8 | % | |
| For the Year Ended December 31, | Increase (Decrease) | % Change | ||||||||||||
| 2016 | 2015 | |||||||||||||
| (Dollars in millions, except for per vehicle data) | ||||||||||||||
| As Reported: | ||||||||||||||
| Revenue: | ||||||||||||||
| Luxury | $ | 1,251.3 | $ | 1,302.6 | $ | (51.3 | ) | (4 | )% | |||||
| Import | 1,617.8 | 1,667.5 | (49.7 | ) | (3 | )% | ||||||||
| Domestic | 742.8 | 682.4 | 60.4 | 9 | % | |||||||||
| Total new vehicle revenue | $ | 3,611.9 | $ | 3,652.5 | $ | (40.6 | ) | (1 | )% | |||||
| Gross profit: | ||||||||||||||
| Luxury | $ | 84.4 | $ | 87.2 | $ | (2.8 | ) | (3 | )% | |||||
| Import | 68.9 | 77.3 | (8.4 | ) | (11 | )% | ||||||||
| Domestic | 33.8 | 38.5 | (4.7 | ) | (12 | )% | ||||||||
| Total new vehicle gross profit | $ | 187.1 | $ | 203.0 | $ | (15.9 | ) | (8 | )% | |||||
| New vehicle units: | ||||||||||||||
| Luxury | 23,875 | 25,441 | (1,566 | ) | (6 | )% | ||||||||
| Import | 58,466 | 61,633 | (3,167 | ) | (5 | )% | ||||||||
| Domestic | 20,019 | 18,907 | 1,112 | 6 | % | |||||||||
| Total new vehicle units | 102,360 | 105,981 | (3,621 | ) | (3 | )% | ||||||||
| Same Store: | ||||||||||||||
| Revenue: | ||||||||||||||
| Luxury | $ | 1,226.5 | $ | 1,253.5 | $ | (27.0 | ) | (2 | )% | |||||
| Import | 1,544.6 | 1,514.4 | 30.2 | 2 | % | |||||||||
| Domestic | 667.8 | 639.7 | 28.1 | 4 | % | |||||||||
| Total new vehicle revenue | $ | 3,438.9 | $ | 3,407.6 | $ | 31.3 | 1 | % | ||||||
| Gross profit: | ||||||||||||||
| Luxury | $ | 82.4 | $ | 83.7 | $ | (1.3 | ) | (2 | )% | |||||
| Import | 66.4 | 71.2 | (4.8 | ) | (7 | )% | ||||||||
| Domestic | 29.8 | 36.0 | (6.2 | ) | (17 | )% | ||||||||
| Total new vehicle gross profit | $ | 178.6 | $ | 190.9 | $ | (12.3 | ) | (6 | )% | |||||
| New vehicle units: | ||||||||||||||
| Luxury | 23,424 | 24,539 | (1,115 | ) | (5 | )% | ||||||||
| Import | 55,960 | 56,224 | (264 | ) | — | % | ||||||||
| Domestic | 17,804 | 17,669 | 135 | 1 | % | |||||||||
| Total new vehicle units | 97,188 | 98,432 | (1,244 | ) | (1 | )% | ||||||||
| For the Year Ended December 31, | Increase (Decrease) | % Change | ||||||||||||
| 2016 | 2015 | |||||||||||||
| As Reported: | ||||||||||||||
| Revenue per new vehicle sold | $ | 35,286 | $ | 34,464 | $ | 822 | 2 | % | ||||||
| Gross profit per new vehicle sold | $ | 1,828 | $ | 1,915 | $ | (87 | ) | (5 | )% | |||||
| New vehicle gross margin | 5.2 | % | 5.6 | % | (0.4 | )% | ||||||||
| Luxury: | ||||||||||||||
| Gross profit per new vehicle sold | $ | 3,535 | $ | 3,428 | $ | 107 | 3 | % | ||||||
| New vehicle gross margin | 6.7 | % | 6.7 | % | — | % | ||||||||
| Import: | ||||||||||||||
| Gross profit per new vehicle sold | $ | 1,178 | $ | 1,254 | $ | (76 | ) | (6 | )% | |||||
| New vehicle gross margin | 4.3 | % | 4.7 | % | (0.4 | )% | ||||||||
| Domestic: | ||||||||||||||
| Gross profit per new vehicle sold | $ | 1,688 | $ | 2,036 | $ | (348 | ) | (17 | )% | |||||
| New vehicle gross margin | 4.5 | % | 5.6 | % | (1.1 | )% | ||||||||
| Same Store: | ||||||||||||||
| Revenue per new vehicle sold | $ | 35,384 | $ | 34,619 | $ | 765 | 2 | % | ||||||
| Gross profit per new vehicle sold | $ | 1,838 | $ | 1,939 | $ | (101 | ) | (5 | )% | |||||
| New vehicle gross margin | 5.2 | % | 5.6 | % | (0.4 | )% | ||||||||
| Luxury: | ||||||||||||||
| Gross profit per new vehicle sold | $ | 3,518 | $ | 3,411 | $ | 107 | 3 | % | ||||||
| New vehicle gross margin | 6.7 | % | 6.7 | % | — | % | ||||||||
| Import: | ||||||||||||||
| Gross profit per new vehicle sold | $ | 1,187 | $ | 1,266 | $ | (79 | ) | (6 | )% | |||||
| New vehicle gross margin | 4.3 | % | 4.7 | % | (0.4 | )% | ||||||||
| Domestic: | ||||||||||||||
| Gross profit per new vehicle sold | $ | 1,674 | $ | 2,037 | $ | (363 | ) | (18 | )% | |||||
| New vehicle gross margin | 4.5 | % | 5.6 | % | (1.1 | )% | ||||||||
| For the Year Ended December 31, | Increase (Decrease) | % Change | ||||||||||||
| 2016 | 2015 | |||||||||||||
| (Dollars in millions, except for per vehicle data) | ||||||||||||||
| As Reported: | ||||||||||||||
| Revenue: | ||||||||||||||
| Used vehicle retail revenues | $ | 1,675.0 | $ | 1,717.5 | $ | (42.5 | ) | (2 | )% | |||||
| Used vehicle wholesale revenues | 201.4 | 214.2 | (12.8 | ) | (6 | )% | ||||||||
| Used vehicle revenue | $ | 1,876.4 | $ | 1,931.7 | $ | (55.3 | ) | (3 | )% | |||||
| Gross profit: | ||||||||||||||
| Used vehicle retail gross profit | $ | 131.0 | $ | 136.1 | $ | (5.1 | ) | (4 | )% | |||||
| Used vehicle wholesale gross profit | (3.7 | ) | (4.3 | ) | 0.6 | (14 | )% | |||||||
| Used vehicle gross profit | $ | 127.3 | $ | 131.8 | $ | (4.5 | ) | (3 | )% | |||||
| Used vehicle retail units: | ||||||||||||||
| Used vehicle retail units | 79,259 | 82,589 | (3,330 | ) | (4 | )% | ||||||||
| Same Store: | ||||||||||||||
| Revenue: | ||||||||||||||
| Used vehicle retail revenues | $ | 1,578.0 | $ | 1,561.3 | $ | 16.7 | 1 | % | ||||||
| Used vehicle wholesale revenues | 191.9 | 198.2 | (6.3 | ) | (3 | )% | ||||||||
| Used vehicle revenue | $ | 1,769.9 | $ | 1,759.5 | $ | 10.4 | 1 | % | ||||||
| Gross profit: | ||||||||||||||
| Used vehicle retail gross profit | $ | 123.6 | $ | 125.1 | $ | (1.5 | ) | (1 | )% | |||||
| Used vehicle wholesale gross profit | (3.2 | ) | (3.1 | ) | (0.1 | ) | 3 | % | ||||||
| Used vehicle gross profit | $ | 120.4 | $ | 122 | $ | (1.6 | ) | (1 | )% | |||||
| Used vehicle retail units: | ||||||||||||||
| Used vehicle retail units | 74,027 | 74,312 | (285 | ) | — | % | ||||||||
| For the Year Ended December 31, | Increase (Decrease) | % Change | ||||||||||||
| 2016 | 2015 | |||||||||||||
| As Reported: | ||||||||||||||
| Revenue per used vehicle retailed | $ | 21,133 | $ | 20,796 | $ | 337 | 2 | % | ||||||
| Gross profit per used vehicle retailed | $ | 1,653 | $ | 1,648 | $ | 5 | — | % | ||||||
| Used vehicle retail gross margin | 7.8 | % | 7.9 | % | (0.1 | )% | ||||||||
| Same Store: | ||||||||||||||
| Revenue per used vehicle retailed | $ | 21,317 | $ | 21,010 | $ | 307 | 1 | % | ||||||
| Gross profit per used vehicle retailed | $ | 1,670 | $ | 1,683 | $ | (13 | ) | (1 | )% | |||||
| Used vehicle retail gross margin | 7.8 | % | 8 | % | (0.2 | )% | ||||||||
| For the Year Ended December 31, | Increase (Decrease) | % Change | ||||||||||||
| 2016 | 2015 | |||||||||||||
| (Dollars in millions) | ||||||||||||||
| As Reported: | ||||||||||||||
| Parts and service revenue | $ | 778.5 | $ | 740.7 | $ | 37.8 | 5 | % | ||||||
| Parts and service gross profit: | ||||||||||||||
| Customer pay | $ | 268.2 | $ | 250.9 | $ | 17.3 | 7 | % | ||||||
| Warranty | 73.7 | 71.0 | 2.7 | 4 | % | |||||||||
| Wholesale parts | 20.7 | 21.2 | (0.5 | ) | (2 | )% | ||||||||
| Parts and service gross profit, excluding reconditioning and preparation | $ | 362.6 | $ | 343.1 | $ | 19.5 | 6 | % | ||||||
| Parts and service gross margin, excluding reconditioning and preparation | 46.6 | % | 46.3 | % | 0.3 | % | ||||||||
| Reconditioning and preparation | 120.7 | 119.5 | 1.2 | 1 | % | |||||||||
| Total parts and service gross profit | $ | 483.3 | $ | 462.6 | $ | 20.7 | 4 | % | ||||||
| Total parts and service gross margin | 62.1 | % | 62.5 | % | (0.4 | )% | ||||||||
| Same Store: | ||||||||||||||
| Parts and service revenue | $ | 736.1 | $ | 683.4 | $ | 52.7 | 8 | % | ||||||
| Parts and service gross profit: | ||||||||||||||
| Customer pay | $ | 255.1 | $ | 234.6 | $ | 20.5 | 9 | % | ||||||
| Warranty | 70.3 | 65.4 | 4.9 | 7 | % | |||||||||
| Wholesale parts | 19.2 | 18.9 | 0.3 | 2 | % | |||||||||
| Parts and service gross profit, excluding reconditioning and preparation | $ | 344.6 | $ | 318.9 | $ | 25.7 | 8 | % | ||||||
| Parts and service gross margin, excluding reconditioning and preparation | 46.8 | % | 46.7 | % | 0.1 | % | ||||||||
| Reconditioning and preparation | 114.3 | 109.4 | 4.9 | 4 | % | |||||||||
| Total parts and service gross profit | $ | 458.9 | $ | 428.3 | $ | 30.6 | 7 | % | ||||||
| Total parts and service gross margin | 62.3 | % | 62.7 | % | (0.4 | )% | ||||||||
52
Finance and Insurance, net—
| For the Year Ended December 31, | Increase (Decrease) | % Change | |||||||||||||||||||||||||||||||||||||||||||||
| For the Year Ended December 31, | Increase (Decrease) | % Change | |||||||||||||||||||||||||||||||||||||||||||||
| 2016 | 2015 | ||||||||||||||||||||||||||||||||||||||||||||||
| (Dollars in millions, except for per vehicle data) | (Dollars in millions, except for per vehicle data) | ||||||||||||||||||||||||||||||||||||||||||||||
| As Reported: | |||||||||||||||||||||||||||||||||||||||||||||||
| Finance and insurance, net | $ | 261.0 | $ | 263.4 | $ | (2.4 | ) | (1 | )% | ||||||||||||||||||||||||||||||||||||||
| Finance and insurance, net | |||||||||||||||||||||||||||||||||||||||||||||||
| Finance and insurance, net | $ | 670.9 | $ | 402.7 | $ | 268.2 | 67 | % | |||||||||||||||||||||||||||||||||||||||
| Finance and insurance, net per vehicle sold | $ | 1,437 | $ | 1,397 | $ | 40 | 3 | % | Finance and insurance, net per vehicle sold | $ | 2,217 | $ | $ | 1,872 | $ | $ | 345 | 18 | 18 | % | |||||||||||||||||||||||||||
| Same Store: | |||||||||||||||||||||||||||||||||||||||||||||||
| Same Store: | |||||||||||||||||||||||||||||||||||||||||||||||
| Same Store: | |||||||||||||||||||||||||||||||||||||||||||||||
| Finance and insurance, net | |||||||||||||||||||||||||||||||||||||||||||||||
| Finance and insurance, net | |||||||||||||||||||||||||||||||||||||||||||||||
| Finance and insurance, net | $ | 247.6 | $ | 243.3 | $ | 4.3 | 2 | % | $ | 403.0 | $ | $ | 362.7 | $ | $ | 40.4 | 11 | 11 | % | ||||||||||||||||||||||||||||
| Finance and insurance, net per vehicle sold | $ | 1,446 | $ | 1,408 | $ | 38 | 3 | % | Finance and insurance, net per vehicle sold | $ | 2,339 | $ | $ | 1,883 | $ | $ | 456 | 24 | 24 | % | |||||||||||||||||||||||||||
F&I revenue, decreasednet increased by $2.4$268.2 million (1%(67%) during 2016in 2022 when compared to 20152021 primarily as a result of a % decrease41% increase in new and used retail unit sales partially offset by a $40 (3%)and an 18% increase in F&I per vehicle retailed.
On a same store basis F&I revenue, net increased by $4.3$40.4 million (2%(11%), in 20162022 when compared to 20152021 primarily as a result of a $38 (3%)24% increase in F&I per vehicle retailed, partially offset by a 1%11% decrease in new and used retail unit sales.
The financial results of the fourth quarterTCA segment, after dealership eliminations, are as follows:
| For the Year Ended December 31, | Increase (Decrease) | % Change | |||||||||||||||||||||
| 2022 | 2021 | ||||||||||||||||||||||
| (Dollars in millions) | |||||||||||||||||||||||
| Finance and insurance, revenue | $ | 126.0 | $ | 2.3 | $ | 123.7 | NM | ||||||||||||||||
| Finance and insurance, cost of sales | $ | 46.3 | $ | 3.6 | $ | 42.7 | NM | ||||||||||||||||
| Finance and insurance, gross profit | $ | 79.8 | $ | (1.3) | $ | 81.0 | NM | ||||||||||||||||
TCA offers a variety of 2016, we began operating under an amended agreementF&I products, such as extended vehicle service contracts, prepaid maintenance contracts, GAP, appearance protection contracts and lease wear-and-tear contracts. TCA's products are sold through our automobile dealerships.
Revenue generated by TCA is earned over the period of the related product contract. The method for recognizing revenue is assigned based on contract type and expected claim patterns. Premium revenues are supplemented with investment gains or losses and income earned associated with the performance of TCA's investment portfolio. During the year ended December 31, 2022, TCA generated $126.0 million of revenue, consisting primarily of earned premium partially offset by a loss of $8.0 million in the investment portfolio.
Direct expenses incurred for the acquisition of F&I contracts on which revenue has not yet been recognized have been deferred and are amortized over the related contract period. During the year ended December 31, 2022, TCA recorded $46.3 million of cost of sales consisting primarily of claims expense, after the elimination of claims paid to affiliated dealerships. Commissions expense paid by TCA to our primary insurance products underwriter. Underaffiliated dealerships and reflected as F&I revenue in our Dealerships segment is eliminated in the termsTCA segment upon consolidation.
53
CONSOLIDATED
Selling, General, and Administrative Expense—
| For the Year Ended December 31, | Increase (Decrease) | % of Gross Profit (Decrease) Increase | |||||||||||||||||||||||||||||||||||||||||||||||||||||||||||||||||||||||
| For the Year Ended December 31, | Increase (Decrease) | % of Gross Profit (Decrease) Increase | |||||||||||||||||||||||||||||||||||||||||||||||||||||||||||||||||||||||
| 2016 | % of Gross Profit | 2015 | % of Gross Profit | ||||||||||||||||||||||||||||||||||||||||||||||||||||||||||||||||||||||
| (Dollars in millions) | (Dollars in millions) | ||||||||||||||||||||||||||||||||||||||||||||||||||||||||||||||||||||||||
| As Reported: | |||||||||||||||||||||||||||||||||||||||||||||||||||||||||||||||||||||||||
| Personnel costs | $ | 343.1 | 32.4 | % | $ | 334.6 | 31.5 | % | $ | 8.5 | 0.9 | % | |||||||||||||||||||||||||||||||||||||||||||||||||||||||||||||
| Sales compensation | 112.0 | 10.6 | % | 115.5 | 10.9 | % | (3.5 | ) | (0.3 | )% | |||||||||||||||||||||||||||||||||||||||||||||||||||||||||||||||
| Share-based compensation | 12.0 | 1.1 | % | 10.0 | 0.9 | % | 2.0 | 0.2 | % | ||||||||||||||||||||||||||||||||||||||||||||||||||||||||||||||||
| Outside services | 78.3 | 7.4 | % | 77.4 | 7.3 | % | 0.9 | 0.1 | % | ||||||||||||||||||||||||||||||||||||||||||||||||||||||||||||||||
| Personnel costs | |||||||||||||||||||||||||||||||||||||||||||||||||||||||||||||||||||||||||
| Personnel costs | $ | 1,247.4 | 40.2 | % | $ | 747.5 | 39.3 | % | $ | 499.9 | 0.9 | % | |||||||||||||||||||||||||||||||||||||||||||||||||||||||||||||
| Rent and related expenses | Rent and related expenses | 121.7 | 3.9 | % | 96.1 | 5.0 | % | 25.6 | (1.1) | % | |||||||||||||||||||||||||||||||||||||||||||||||||||||||||||||||
| Advertising | 34.0 | 3.2 | % | 40.1 | 3.8 | % | (6.1 | ) | (0.6 | )% | Advertising | 50.1 | 1.6 | 1.6 | % | 30.7 | 1.6 | 1.6 | % | 19.4 | — | — | % | ||||||||||||||||||||||||||||||||||||||||||||||||||
| Rent | 29.9 | 2.8 | % | 31.3 | 3.0 | % | (1.4 | ) | (0.2 | )% | |||||||||||||||||||||||||||||||||||||||||||||||||||||||||||||||
| Utilities | 15.5 | 1.5 | % | 16.7 | 1.6 | % | (1.2 | ) | (0.1 | )% | |||||||||||||||||||||||||||||||||||||||||||||||||||||||||||||||
| Insurance | 15.9 | 1.5 | % | 11.8 | 1.1 | % | 4.1 | 0.4 | % | ||||||||||||||||||||||||||||||||||||||||||||||||||||||||||||||||
| Other | 91.8 | 8.7 | % | 92.5 | 8.7 | % | (0.7 | ) | — | % | Other | 344.2 | 11.1 | 11.1 | % | 199.7 | 10.5 | 10.5 | % | 144.5 | 0.6 | 0.6 | % | ||||||||||||||||||||||||||||||||||||||||||||||||||
| Selling, general, and administrative expense | $ | 732.5 | 69.2 | % | $ | 729.9 | 68.8 | % | $ | 2.6 | 0.4 | % | Selling, general, and administrative expense | $ | 1,763.4 | 56.9 | 56.9 | % | $ | 1,073.9 | 56.5 | 56.5 | % | $ | 689.4 | 0.4 | 0.4 | % | |||||||||||||||||||||||||||||||||||||||||||||
| Gross profit | $ | 1,058.7 | $ | 1,060.8 | |||||||||||||||||||||||||||||||||||||||||||||||||||||||||||||||||||||
| Same Store: | |||||||||||||||||||||||||||||||||||||||||||||||||||||||||||||||||||||||||
| Same Store: | |||||||||||||||||||||||||||||||||||||||||||||||||||||||||||||||||||||||||
| Same Store: | |||||||||||||||||||||||||||||||||||||||||||||||||||||||||||||||||||||||||
| Personnel costs | $ | 324.8 | 32.3 | % | $ | 309.2 | 31.4 | % | $ | 15.6 | 0.9 | % | |||||||||||||||||||||||||||||||||||||||||||||||||||||||||||||
| Sales compensation | 105.8 | 10.5 | % | 106.0 | 10.8 | % | (0.2 | ) | (0.3 | )% | |||||||||||||||||||||||||||||||||||||||||||||||||||||||||||||||
| Share-based compensation | 12.0 | 1.2 | % | 10.0 | 1.0 | % | 2.0 | 0.2 | % | ||||||||||||||||||||||||||||||||||||||||||||||||||||||||||||||||
| Outside services | 73.4 | 7.3 | % | 71.1 | 7.2 | % | 2.3 | 0.1 | % | ||||||||||||||||||||||||||||||||||||||||||||||||||||||||||||||||
| Personnel costs | |||||||||||||||||||||||||||||||||||||||||||||||||||||||||||||||||||||||||
| Personnel costs | $ | 717.3 | 40.5 | % | $ | 693.3 | 40.5 | % | $ | 24.0 | (0.1) | % | |||||||||||||||||||||||||||||||||||||||||||||||||||||||||||||
| Rent and related expenses | Rent and related expenses | 52.3 | 3.0 | % | 54.6 | 3.2 | % | (2.3) | (0.2) | % | |||||||||||||||||||||||||||||||||||||||||||||||||||||||||||||||
| Advertising | 30.3 | 3.0 | % | 34.2 | 3.5 | % | (3.9 | ) | (0.5 | )% | Advertising | 20.6 | 1.2 | 1.2 | % | 25.0 | 1.5 | 1.5 | % | (4.4) | (0.3) | (0.3) | % | ||||||||||||||||||||||||||||||||||||||||||||||||||
| Rent | 29.9 | 3.0 | % | 31.2 | 3.2 | % | (1.3 | ) | (0.2 | )% | |||||||||||||||||||||||||||||||||||||||||||||||||||||||||||||||
| Utilities | 14.4 | 1.4 | % | 15.1 | 1.5 | % | (0.7 | ) | (0.1 | )% | |||||||||||||||||||||||||||||||||||||||||||||||||||||||||||||||
| Insurance | 14.9 | 1.5 | % | 10.5 | 1.1 | % | 4.4 | 0.4 | % | ||||||||||||||||||||||||||||||||||||||||||||||||||||||||||||||||
| Other | 87.9 | 8.8 | % | 85.6 | 8.6 | % | 2.3 | 0.2 | % | Other | 218.1 | 12.3 | 12.3 | % | 205.7 | 12.0 | 12.0 | % | 12.4 | 0.3 | 0.3 | % | |||||||||||||||||||||||||||||||||||||||||||||||||||
| Selling, general, and administrative expense | $ | 693.4 | 69.0 | % | $ | 672.9 | 68.3 | % | $ | 20.5 | 0.7 | % | Selling, general, and administrative expense | $ | 1,008.4 | 56.9 | 56.9 | % | $ | 978.6 | 57.2 | 57.2 | % | $ | 29.8 | (0.4) | (0.4) | % | |||||||||||||||||||||||||||||||||||||||||||||
| Gross profit | $ | 1,005.5 | $ | 984.5 | |||||||||||||||||||||||||||||||||||||||||||||||||||||||||||||||||||||
SG&A expense as a percentage of gross profit was 69.2% for 2016 comparedincreased 41 basis points from 56.5% in 2021 to 68.8% for 2015.56.9% in 2022. Same store SG&A expense as a percentage of gross profit increased by 70decreased 35 basis points from 68.3%57.2% in 20152021 to 69.0%56.9% in 2016,2022. The increase, was duedecrease in SG&A as a percentage of gross profit is primarily to increased personnel costs, which was athe result of higher employee benefitgross profits earned across our Dealerships segment, as well as maintaining expense discipline, particularly in personnel costs, and higher insurance expense, which includes expenses associated with hail storm damage incurred at certainenhanced productivity of our dealerships during 2016.team members.
Depreciation and Amortization Expense —
The $1.2$27.1 million (4%(65%) increase in depreciation and amortization expense during 20162022 compared to 2015,2021, was primarily the result of increased capital expendituresdepreciation associated with dealership acquisitions during 2021 and the completion of construction projects, resulting in newly depreciableadditional assets placed into service during the year.
Floor Plan Interest Expense —
$8.2 million during 2021.
Other Interest Expense —
Other interest expense increased $9.1$58.3 million (21%(62%) from $44.0$93.9 million in 20152021 to $53.1$152.2 million in 2016.2022. The increase inis due to having a full year of interest expense was primarilyin 2022 in connection with acquisition-related financing that we entered into during the resultfourth quarter of our add-on issuance of $200.0 million aggregate principal amount of our 6.0% Senior Subordinated Notes due 2024, which we completed in October 2015.2021.
Gain on Dealership Divestitures —
During the year ended December 31, 2021, we sold one franchise (one dealership location) in the Charlottesville, Virginia market. The Company recorded a pre-tax gain totaling $8.0 million.
54
Income Tax Expense—Expense —
The $3.4$156.5 million (3%(95%) decreaseincrease in income tax expense was the result of a $621.4 million (89%) increase in income before income taxes. Our effective tax rate increased 70 basis points from 23.7% in 2021 to 24.4% in 2022. The increase in our effective tax rate was primarily due to the apportionment of income to states with higher tax rates we began doing business in as a result of the $5.6 million (2%) decrease in income before income taxes in 2016 compared to 2015. Our effective tax rate was 37.6% in 2016 compared to 38.0% in 2015. Our effective tax rate is highly dependent on our levelacquisitions made during the fourth quarter of income before income taxes and permanent differences between book and tax income.2021.
LIQUIDITY AND CAPITAL RESOURCES
As of December 31, 2017,2023, we had total available liquidity of $379.5$459.8 million, which consisted of cash and cash equivalents of $4.7$32.5 million $49.3(excluding $13.2 million ofheld by TCA), available funds in our floor plan offset accounts $190.0of $95.2 million of availability under our new vehicle floor plan facility that is able to be re-designated to our revolving credit facility, $46.7million and $332.1 million of availability under our revolving credit facility, and $88.8 million of availability under our used vehicle revolving floor plan facility. The borrowing capacities under our revolving credit facility and our used vehicle revolving floor plan facility are limited by borrowing base calculations and, from time to time, may be further limited by our required compliance with certain financial covenants. As of December 31, 2017, these financial covenants did not further limit our availability under our other credit facilities. For more information on our financial covenants, see "Covenants and Defaults" and "Share Repurchases and Dividend Restrictions" below.
We continually evaluate our liquidity and capital resources based upon (i) our cash and cash equivalents on hand, (ii) the funds that we expect to generate through future operations, (iii) current and expected borrowing availability under our 20162023 Senior Credit Facility our other floor plan facilities, our Real Estate Credit Agreement, our Restated Master Loan Agreement, and our mortgage financings (each, as defined(discussed further below), (iv) amounts in our new vehicle floor plan notes payable offset accounts, and (v) the potential impact of our capital allocation strategy and any contemplated or pending future transactions, including, but not limited to, financings, acquisitions, dispositions, equity and/or debt repurchases, dividends, or other capital expenditures. We believe we will have sufficient liquidity to meet our debt service and working capital requirements; commitments and contingencies; debt repayment, maturity and repurchase obligations; acquisitions; capital expenditures; and any operating requirements for at least the next twelve months.months and the foreseeable future.
Material Indebtedness
We currently are party to the following material credit facilities and agreements and have the following material indebtedness outstanding. For a more detailed description of the material terms of these agreements and facilities, and this indebtedness, refer to the "Long-Term Debt" footnotesee Note 14 "Debt" included in the Notesnotes to Consolidated Financial Statements.consolidated financial statements.
Revolving Credit Facility—A $250.0$500.0 million revolving credit facilityRevolving Credit Facility for, among other things, acquisitions, working capital and capital expenditures, including a $50.0 million sub-limit for letters of credit. As of December 31, 2017,2023, we re-designated $190.0converted $389.0 million of availability from our revolving credit facilitythe New Vehicle Floor Plan Facility (as defined below) back to our new vehicle floor planthe Revolving Credit facility resulting in $60.0$346.1 million ofin borrowing capacity. In addition, as of December 31, 2023, we had $13.3$14.0 million in outstanding letters of credit, resulting in $46.7$332.1 million of borrowing availabilityavailability. We began the year with no amounts drawn on our revolving credit facility. During the year ended December 31, 2023, we had borrowings of $329.0 million and $329.0 million in repayments, resulting in no outstanding borrowings as of December 31, 2017.2023.
New Vehicle Floor Plan Facility—A $900.0 million new vehicle revolving floor plan facility. In connection, with the new vehicle floor plan facility, we established an account with Bank of America that$1.93 billion New Vehicle Floor Plan Facility which allows us to transfer cash as an offset to floor plan notes payable. These transfers reduce the amount of outstanding new vehicle floor plan notes payable that would otherwise accrue interest, while retaining the ability to transfer
amounts from the offset account into our operating cash accounts within one to two days. As a result of the use of ourthis floor plan offset account, we experienceexperienced a reduction in Floor Plan Interest Expensefloor plan interest expense on our Consolidated Statementsconsolidated statements of Income.income. As of December 31, 2017,2023, we had $627.9 million$1.46 billion outstanding under the New Vehicle Floor Plan Facility, which includes $127.2 million classified in loaner vehicles notes payable which is included in accounts payable and accrued liabilities in our new vehicleconsolidated balance sheets. As of December 31, 2023, we held $44.7 million in the floor plan facility, which is net of $38.7 million in our floor plannotes payable offset account, .account.
Used Vehicle Floor Plan Facility—A $150.0$375.0 million used vehicle revolving floor plan facilityUsed Vehicle Floor Plan Facility to finance the acquisition of used vehicle inventory and for among other things, working capital and capital expenditures, as well as to refinance used vehicles. OurWe began the year with no amounts drawn on our Used Vehicle Floor Plan Facility. During the year ended December 31, 2023, we had additional borrowings of $547.1 million and $240.0 million in
55
repayments resulting in $307.1 million outstanding borrowings as of December 31, 2023. We did not have any borrowing capacity under the used vehicle floor plan facility was limited to $88.8 million,Used Vehicle Floor Plan Facility based on our borrowing base calculation as of December 31, 2017. We began the year with nothing drawn on our used vehicle floor plan facility and during the year ended December 31, 2017, we had borrowings of $35.0 million and made repayments of $35.0 million, resulting in no outstanding amounts under our used vehicle floor plan facility as of December 31, 2017.
2023.
Subject to compliance with certain conditions, the agreement governing the 20162023 Senior Credit FacilityAgreement provides that we have the ability, at our option and subject to the receipt of additional commitments from existing or new lenders, to increase the size of the facilities by up to $325.0$750.0 million in the aggregate without lender consent.
At our option, we have the ability to re-designate a portion of our availability under ourthe Revolving Credit Facility to the New Vehicle Floor Plan Facility or the Used Vehicle Floor Plan Facility. The maximum amount we are allowed to re-designate is determined based on our current borrowing availabilityaggregate commitments under ourthe Revolving Credit Facility, less $50.0 million. In addition, we are able to re-designate any amounts moved to the New Vehicle Floor plan facilityPlan Facility or the Used Vehicle Floor Plan Facility back to the Revolving Credit Facility. As of December 31, 2017, we re-designated $190.02022, $389.0 million of availability under ourthe Revolving Credit Facility was re-designated to ourthe New Vehicle Floor Plan facility.Facility. We re-designated this amount to take advantage of the lower commitment fee rates on ourthe New Vehicle Floor Plan Facility when compared to ourthe Revolving Credit Facility.
further details.
In addition to the payment of interest on borrowings outstanding under the 20162023 Senior Credit Facility, we are required to pay a quarterly commitment fee on the total unused commitments thereunder. The fee for unused commitments under the Revolving Credit Facility is between 0.20%0.15% and 0.45%0.40% per year, based on the Company's total lease adjusted leverage ratio, and the fee for unused commitments under the New Vehicle Facility Floor Plan and the Used Vehicle Facility Floor Plan Facility is 0.15% per year.
•Manufacturer affiliated new vehicle floor plan facilities and other financing facilities—We have a floor plan facility with the Ford Motor Credit Company ("Ford Credit") to purchase new Ford and Lincoln vehicle inventory, which matures on December 5, 2019.inventory. Our floor plan facility with Ford Credit was amended in July 2020 and can be terminated by either the Company or Ford Credit with a 30-day notice period. We have also haveestablished a floor plan offset account with Ford Credit, which operates in a similar manner to our floor plan offset account with Bank of America. As of December 31, 2017,2023, we had $104.2$195.1 million, outstanding under our floor plan facility which is net of $10.6$50.5 million in our floor plan offset account. Additionally, we had $86.8 millionaccount, outstanding under facilities with certain manufacturers for the financing of loaner vehicles, which were presented within Accounts Payable and Accrued Liabilities in our Consolidated Balance Sheets.floor plan facility. Neither our floor plan facility with Ford Credit nor our facilities for loaner vehicles have stated borrowing limitations.
•2029 and 2032 Senior Notes—On November 19, 2021, the Company completed its offering of $800.0 million aggregate principal amount of 4.625% senior notes due 2029 (the "2029 Senior Notes") and $600.0 million aggregate principal amount of 5.000% senior notes due 2032 (the "2032 Senior Notes"). The 2029 Senior Notes and 2032 Senior Notes mature on November 15, 2029 and February 15, 2032, respectively. Interest is payable semiannually, on November 15 and May 15 of each year. The 2029 Senior Notes and the 2032 Senior Notes were offered, together with additional borrowings and cash on hand, to (i) fund the LHM Acquisition and (ii) pay related fees and expenses.
The 2029 Notes and 2032 Notes have been fully and unconditionally guaranteed, on a joint and several basis, by substantially all of our subsidiaries other than the TCA Non-Guarantor Subsidiaries. In addition, the notes are subject to customary covenants, events of default and optional redemption revisions. The 2029 Senior Notes and the 2032 Senior Notes are not required to be registered under the Securities Act of 1933.
•2028 and 2030 Senior Notes—On February 19, 2020, the Company completed its offering of senior unsecured notes, consisting of $525.0 million aggregate principal amount of the Existing 2028 Notes and $600.0 million aggregate principal amount of the Existing 2030 Notes. The 2028 Notes and 2030 Notes mature on March 1, 2028 and March 1, 2030, respectively. Interest is payable semiannually, on March 1 and September 1 of each year. The 2028 Notes and the 2030 Notes were offered, together with additional borrowings and cash on hand, to (i) fund the acquisition of substantially all of the assets of Park Place, (ii) redeem all of our outstanding $600.0 million aggregate principal amount of 6.0% Senior Subordinated Notes due 2024 ("6.0%(the "6.0% Notes") and (iii) pay fees and expenses.
On March 24, 2020, the Company redeemed $245.0 million aggregate principal million of the 2028 Notes and $280.0 million aggregate principal amount of the 2030 Notes pursuant to a special mandatory redemption.
56
In September 2020, the Company completed an add-on issuance of $250.0 million aggregate principal amount of additional senior notes consisting of $125.0 million aggregate principal amount of additional 2028 Notes at a price of 101.00% of par, plus accrued interest from September 1, 2020, and $125.0 million aggregate principal amount of additional 2030 Notes (together with the additional 2028 Notes, the "Additional Notes") at a price of 101.75% of par, plus accrued interest from September 1, 2020 (the "September 2020 Offering"). After deducting the initial purchasers' discounts of $2.8 million, we received net proceeds of approximately $250.6 million from the September 2020 Offering. The $3.5 million premium paid by the initial purchasers of the Additional Notes was recorded as a component of long-term debt on our consolidated balance sheets and is being amortized as a reduction of interest expense over the remaining term of the Notes. The proceeds of the September 2020 Offering were used to redeem certain seller notes issued in connection with the acquisition of Park Place.
The 2028 Notes and the 2030 Notes are guaranteed, jointly and severally, on a senior unsecured basis, by each of our existing and future restricted subsidiaries, other than the TCA Non-Guarantor Subsidiaries. In addition, the Notes are subject to customary covenants, events of default and optional redemption revisions. The 2028 Notes and the 2030 Notes were required to be registered under the Securities Act of 1933 within 270 days of the closing date for the offering of each respective series. The Company completed the registration of the 2028 Notes and 2030 Notes in October 2020.
•Mortgage Financings—asWe have multiple mortgage agreements with finance companies affiliated with our vehicle manufacturers ("captive mortgages"). As of December 31, 20172023 we had $600.0total mortgage notes payable outstanding of $31.9 million in aggregate principal amounts outstanding related to our 6.0% Notes. We are required to pay interest on the 6.0% Notes on June 15 and December 15 of each year until maturity on December 15, 2024.
•2021 Real Estate Facility—On December 17, 2021, we entered into a real estate atterm loan credit agreement with Bank of America, N.A., as administrative agent and the other lenders party thereto, which provided for term loans in an aggregate amount equal to $689.7 million (the "2021 Real Estate Facility"). As of December 31, 2023, we had $614.4 million of outstanding borrowings under the 2021 Real Estate Facility. There is no further borrowing availability under the 2021 Real Estate Facility.
•2021 BofA Real Estate Facility—On May 10, 2021, we entered into a real estate term loan credit agreement (the "2021 BofA Real Estate Credit Agreement"), by and among the Company and certain of its subsidiaries, Bank of America, N.A., as administrative agent and the various financial institutions party thereto, as lenders, which provided for term loans in an aggregate amount equal to $184.4 million, subject to customary terms and conditions (the "2021 BofA Real Estate Facility"). As of December 31, 2023, we had $165.9 million of outstanding borrowings under the 2021 BofA Real Estate Facility. There is no further borrowing availability under the 2021 BofA Real Estate Credit Agreement. On May 25, 2022, certain of our subsidiaries entered into amendments to our 2021 BofA Real Estate Facility to replace the benchmark reference rate of LIBOR to SOFR, effective June 1, 2022. See Note 14 "Debt" for further details.
•2018 BofA Real Estate Facility—On November 13, 2018, we entered into a real estate term loan credit agreement (as amended, restated or supplemented from time to time, the "2018 BofA Real Estate Credit Agreement") with Bank of America, as lender, providing for term loans in an aggregate amount not to exceed $128.1 million, subject to customary terms and conditions (the "2018 BofA Real Estate Facility"). Our right to make draws under the 2018 BofA Real Estate Facility terminated on November 13, 2019. All of the real property financed by an operating dealership locations.
subsidiary of the Company under the 2018 BofA Real Estate Facility is collateralized by first priority liens, subject to certain permitted exceptions. As of December 31, 2023, we had $50.3 million, of outstanding borrowings under the 2018 BofA Real Estate Facility. There is no further borrowing availability under the 2018 BofA Real Estate Facility. On May 25, 2022, certain of our subsidiaries entered into an amendment to the 2018 BofA Real Estate Credit Agreement to replace the benchmark reference rate of LIBOR to SOFR, effective June 1, 2022. See Note 14 "Debt" for further details.57
June 1, 2022, certain of our subsidiaries entered into an amendment to our 2018 Wells Fargo Master Loan Agreement to replace the benchmark reference rate of LIBOR to SOFR. See Note 14 "Debt" for further details.
•2015 Wells Fargo Master Loan Facility—On February 3, 2015, certain of our subsidiaries entered into an amended and restated master loan agreement (the "2015 Wells Fargo Master Loan Agreement") with Wells Fargo Bank, National Association ("Wells Fargo"), as lender, which provides for term loans to certain of our subsidiaries that are borrowers under the 2015 Wells Fargo Master Loan Agreement in an aggregate amount not to exceed $100.0 million (the "2015 Wells Fargo Master Loan Facility"). Borrowings under the Restated2015 Wells Fargo Master Loan AgreementFacility are guaranteed by us and are
collateralized by the real property financed under the Restated2015 Wells Fargo Master Loan Agreement.Facility. As of December 31, 2017,2023, the outstanding balance under the Restated Master Loan Agreementthis agreement was $88.5$37.2 million. There is no further borrowing availability under this facility.the 2015 Wells Fargo Master Loan Facility. On and with effect from June 1, 2022, certain of our subsidiaries entered into an amendment to our 2015 Wells Fargo Master Loan Agreement to replace the benchmark reference rate of LIBOR to SOFR. See Note 14 "Debt" for further details.
•2013 BofA Real Estate Credit Agreement Facility—On September 26, 2013, we entered into a real estate term loan credit agreement with an initial principal value of $75.0 million collateralized by first priority liens, subject to certain permitted exceptions, on all of the real property financed thereunder. As of December 31, 2017, we had $48.5 million of mortgage note obligations outstanding under the(the "2013 BofA Real Estate Credit Agreement. There is no further borrowing availabilityAgreement") with Bank of America, N.A., as lender, providing for term loans in an aggregate amount not to exceed $75.0 million, subject to customary terms and conditions (the "2013 BofA Real Estate Facility"). In June 2023, the Company prepaid the aggregate principal amounts remaining under this agreement.
the 2013 BofA Real Estate Facility for an aggregate amount of approximately $23.9 million with cash on hand.Covenants and Defaults
We are subject to a number of customary covenants in our various debt and lease agreements, including those described below. We were in compliance with all of our covenants as of December 31, 2017.2023. Failure to comply with any of our debt covenants would constitute a default under the relevant debt agreements, which would entitle the lenders under such agreements to terminate our ability to borrow under the relevant agreements and accelerate our obligations to repay outstanding borrowings, if any, unless compliance with the covenants were waived. In many cases, defaults under one of our agreements could trigger cross-default provisions in our other agreements. If we are unable to remain in compliance with our financial or other covenants, we would be required to seek waivers or modifications of our covenants from our lenders, or we would need to raise debt and/or equity financing or sell assets to generate proceeds sufficient to repay such debt. We cannot give any assurance that we would be able to successfully take any of these actions on terms, or at times, that may be necessary or desirable.
The representations and covenants contained in the 2016 Senior2021 Real Estate Facility, 2021 BofA Real Estate Credit Facility include,Agreement, 2018 BofA Real Estate Credit Agreement, 2018 Wells Fargo Master Loan Agreement, 2015 Wells Fargo Master Loan Agreement, and the related documents are customary for financing transactions of this nature, including, among others, a requirementrequirements to comply with a minimum consolidated current ratio, consolidated fixed charge coverage ratio and a maximum consolidated total lease adjusted leverage ratio, in each case, as set out in the 2016 Senior Credit Facility.applicable. In addition, certain other covenants could restrict our ability to incur additional debt, pay dividends or acquire or dispose of assets. Each of these agreements provides for events of default that are customary for financing transactions of this nature, including cross-defaults to other material indebtedness. Upon the occurrence of an event of default, we could be required by the applicable agreement to immediately repay all amounts outstanding thereunder.
The 2016representations and covenants contained in the agreement governing the 2023 Senior Credit Facility are customary for financing transactions of this nature including, among others, a requirement to comply with a minimum consolidated fixed charge coverage ratio and maximum consolidated total lease adjusted leverage ratio, in each case as set out in the agreement governing the 2023 Senior Credit Facility. In addition, certain other covenants could restrict the Company's ability to incur additional debt, pay dividends or acquire or dispose of assets. The agreement governing the 2023 Senior Credit Facility also provides for events of default that are customary for financing transactions of this nature, including cross-defaults to other material indebtedness. In certain instances, an event of default under either the revolving credit facilityRevolving Credit Facility or the used vehicle floor plan facilityUsed Vehicle Floor Plan Facility could be, or result in, an event of default under the new vehicle floor plan facility,New Vehicle Floor Plan Facility, and vice versa. Upon the occurrence of an event of default, wethe Company could be required to immediately repay all amounts outstanding under the 2016 Senior Credit Facility.applicable facility.
The representations and covenants contained in the Real Estate Credit Agreement are customary for financing transactions of this nature including, among others, a requirement to comply with a minimum consolidated current ratio, minimum consolidated fixed charge coverage ratio, and a maximum consolidated total lease adjusted leverage ratio, in each case as set out in the Real Estate Credit Agreement. In addition, certain other covenants could restrict our ability to incur additional debt, pay dividends or acquire or dispose of assets.
Subject to our continued compliance with a consolidated fixed charge coverage ratio and a maximum consolidated total lease adjusted leverage ratio, in each case as set out in the Indenture,Indentures, restricted payments capacity additions (or subtractions if negative) equal to a base level plus the cumulative amount of (i) 50% of our net income (as defined in the 20162023 Senior Credit Facility and the Indenture) beginning on October 1, 2014 and ending on the date of the most recently completed fiscal quarter (the "Measurement Period"),Facility) plus (ii) 100% of any cash proceeds we receive from the sale of equity interests during the Measurement Period minus (iii) the dollar amount of share purchases made and dividends
58
paid on or afterduring the defined measurement periods, subject to certain exceptions. In the event that our Consolidated Total Leverage Ratio does (or would) exceed 3.0 to 1.0, the 2023 Senior Credit Facility and the Indentures would then also allow for restricted payments under mutually exclusive parameters, subject to certain exclusions. The Company may otherwise make restricted payments only up to the aforementioned cumulative capacity. Our restricted payment capacity balance as of December 4, 2014.31, 2023 and 2022 was $1.18 billion and $1.11 billion, respectively.
Share Repurchases and Dividend Restrictions
Our ability to repurchase shares or pay dividends on our common stock is subject to our compliance with the covenants and restrictions described in "Covenants and Defaults" above.
As of December 31, 20172023, we had remaining authorization to repurchase $53.3up to an additional $202.6 million in shares of our common stock under the Repurchase Program. stock. Any repurchases will be subject to applicable limitations in our debt or other financing agreements that may be in existence from time to time.
On January 24, 2018,May 26, 2023, our Board of Directors reset theannounced that it authorized a new $250.0 million share repurchase authorization under(the "New Share Repurchase Authorization"), which replaced our Repurchase Program to $100.0 million in the aggregate,previous share repurchase authorization for the repurchase of our common stock in open market transactions or privately negotiated transactions fromor in other manners as permitted by federal securities laws and other legal and contractual requirements. The extent that the Company repurchases its shares, the number of shares and the timing of any repurchases will depend on general market conditions, legal requirements and other corporate considerations. The repurchase program may be modified, suspended or terminated at any time to time.without prior notice.
Contractual Obligations
As of December 31, 2017,2023, we had the followingsignificant contractual obligations (in millions;related to our floor plan notes payable disclosed in Notes 11 and 12, operating lease liabilities disclosed in Note 19 and long-term debt arrangements discussed in Note 14. Disclosures related to our commitments and contingencies are outlined in Note 21. All note references are to the notes to our Consolidated Financial Statementsconsolidated financial statements included elsewhere herein):
| Payments due by period | |||||||||||||||||||||||||||
| 2018 | 2019 | 2020 | 2021 | 2022 | Thereafter | Total | |||||||||||||||||||||
| Floor plan notes payable (Notes10&11) | $ | 732.1 | $ | — | $ | — | $ | — | $ | — | $ | — | $ | 732.1 | |||||||||||||
| Operating leases (Note 18) | 23.9 | 22.8 | 22.1 | 19.1 | 14.0 | 22.0 | 123.9 | ||||||||||||||||||||
| Long-term debt (Note 13) | 15.4 | 39.9 | 30.5 | 13.7 | 28.6 | 751.2 | 879.3 | ||||||||||||||||||||
| Interest on long-term debt (a) | 48.5 | 47.6 | 46.1 | 45.4 | 43.4 | 80.1 | 311.1 | ||||||||||||||||||||
| Total contractual obligations | $ | 819.9 | $ | 110.3 | $ | 98.7 | $ | 78.2 | $ | 86.0 | $ | 853.3 | $ | 2,046.4 | |||||||||||||
herein.
Cash Flows
Classification of Cash Flows Associated with Floor Plan Notes Payable
Borrowings and repayments of floor plan notes payable to a lender unaffiliated with the manufacturer from which we purchase a particular new vehiclethrough our 2023 Senior Credit Facility ("Non-Trade"), and all floor plan notes payable relating to used vehicles (together referred to as "Floor Plan Notes Payable—Non-Trade"), are classified as financing activities on the accompanying Consolidated Statementsconsolidated statements of Cash Flows,cash flows, with borrowings reflected separately from repayments. The net change in floor plan notes payable to a lender affiliated with the manufacturer from which we purchase a particular new vehicle (collectively referred to as "Floor Plan Notes Payable—Trade") is classified as an operating activity on the accompanying Consolidated Statementsconsolidated statements of Cash Flows.cash flows. Borrowings of floor plan notes payable associated with inventory acquired in connection with all acquisitions and repayments made in connection with all divestitures are classified as a financing activity in the accompanying Consolidated Statementconsolidated statement of Cash Flows.cash flows. Cash flows related to floor plan notes payable included in operating activities differ from cash flows related to floor plan notes payable included in financing activities only to the extent that the former are payable to a lender affiliated with the manufacturer from which we purchased the related inventory, while the latter are payable to a lenderour 2023 Senior Credit Facility that includes lenders affiliated with the manufacturers and lenders not affiliated with the manufacturermanufacturers from which we purchased the related inventory. The majority of our floor plan notes are payable to parties unaffiliated with the entities from which we purchase our new vehicle inventory,2023 Senior Credit Facility, with the exception of floor plan notes payable relating to the financing of new Ford and Lincoln vehicles.
vehicles and certain loaner vehicle programs.
Floor plan borrowings are required by all vehicle manufacturers for the purchase of new vehicles, and all floor plan lenders require amounts borrowed for the purchase of a vehicle to be repaid within a short time period after the related vehicle is sold. As a result, we believe that it is important to understand the relationship between the cash flows of all of our floor plan notes payable and new vehicle inventory in order to understand our working capital and operating cash flow and to be able to compare our operating cash flow to that of our competitors (i.e., if our competitors have a different mix of trade and non-trade floor plan financing as compared to us). In addition, we include all floor plan borrowings and repayments in our internal
59
operating cash flow forecasts. As a result, we use the non-GAAP measure "cash"Adjusted cash flow provided by operating activities, as adjusted"activities" (defined below) to compare our results to forecasts. We believe that splitting the cash flows of floor plan notes payable between operating activities and financing activities, while all new vehicle inventory activity is included in operating activities, results in significantly different operating cash flow than if all the cash flows of floor plan notes payable were classified together in operating activities.
We have provided below a reconciliation of cash flow fromprovided by operating activities, as if all changes in floor plan notes payable, except for (i) borrowings associated with acquisitions and repayments associated with divestitures and (ii) borrowings and repayments associated with the purchase of used vehicle inventory and (iii) changes in the floorplan offset accounts were classified as an operating activity.activity for both floorplan notes payable - non-trade and floor plan notes payable - trade.
| For the Years Ended December 31, | |||||||||||
| 2017 | 2016 | 2015 | |||||||||
| (In millions) | |||||||||||
| Reconciliation of Cash provided by operating activities to Cash provided by operating activities, as adjusted | |||||||||||
| Cash provided by operating activities, as reported | $ | 266.3 | $ | 142.5 | $ | 160.0 | |||||
New vehicle floor plan borrowings (repayments)—non-trade, net | (70.7 | ) | 118.0 | (36.5 | ) | ||||||
| Cash provided by operating activities, as adjusted | $ | 195.6 | $ | 260.5 | $ | 123.5 | |||||
| For the Year Ended December 31, | |||||||||||||||||||||||
| 2023 | 2022 | 2021 | |||||||||||||||||||||
| (In millions) | |||||||||||||||||||||||
| Reconciliation of cash provided by operating activities to cash provided by operating activities, as adjusted | |||||||||||||||||||||||
| Cash provided by operating activities, as reported | $ | 313.0 | $ | 696.0 | $ | 1,163.7 | |||||||||||||||||
| Change in Floor Plan Notes Payable Non-Trade, net | 1,018.9 | (191.1) | (608.7) | ||||||||||||||||||||
| Change in Floor Plan Notes Payable Non-Trade associated with floor plan offset, used vehicle borrowing base changes adjusted for acquisition and divestitures | (571.3) | 462.4 | 131.1 | ||||||||||||||||||||
| Change in Floor Plan Notes Payable Trade associated with floor plan offset and acquisitions and divestitures, net | (55.3) | 19.7 | (54.0) | ||||||||||||||||||||
| Adjusted cash flow provided by operating activities | $ | 705.4 | $ | 987.0 | $ | 632.1 | |||||||||||||||||
Operating Activities—
Net cash provided by operating activities totaled $266.3$313.0 million, $142.5$696.0 million, and $160.0$1.16 billion for the years ended December 31, 2023, 2022, and 2021, respectively. Adjusted cash flow provided by operating activities totaled $705.4 million, $987.0 million, and $632.1 million for the years ended December 31, 2017, 2016,2023, 2022, and 2015,2021, respectively. NetAdjusted cash flow provided by operating activities as adjusted, totaled $195.6 million, $260.5 million, and $123.5 million for the years ended December 31, 2017, 2016, and 2015 respectively. Net cash provided by operating activities, as adjusted, includes net income, adjustments to reconcile net income to net cash provided by operating activities, changes in working capital, andchanges in used vehicle borrowing base, changes in floor plan notes payable—non-trade.payable - non-trade and trade, excluding the impact of offsets, and excluding operating cash flows associated with acquisitions and divestitures related to loaner vehicles and new vehicle inventories financed through floor plan notes payable - trade.
The $64.9$281.6 million decrease in our netadjusted cash flow provided by operating activities as adjusted, for the year ended December 31, 20172023 compared to the year ended December 31, 2016,2022, was primarily the result of the following:
•decrease in $192.4 million in net income and non-cash adjustments to net income;
•$29.4144.1 million decrease related to sale volume and the timing of collection of accounts receivable and contracts-in-transit during 2023 compared to 2022;
•$210.9 million decrease related to the change in other current assets, net;
•$2.6 million decrease in other long term assets and liabilities, net; and
•$1.3 million decrease related to the change in operating lease liabilities.
60
The decrease in our adjusted cash flow provided by operating activities, was partially offset by:
•$155.2 million related to an increase in inventory, net of floor plan notes payable, including both trade and non-trade;non-trade, excluding offset and including used vehicle borrowing base changes adjusted for acquisitions and divestitures; and
•$47.1114.4 million related to the change in other current and non-current assets and liabilities; and
The decrease$354.9 million increase in our netadjusted cash flow provided by operating activities asfor the year ended December 31, 2022 compared to the year ended December 31, 2021, was primarily the result of the following:
•increase of $431.9 million in net income and non-cash adjustments to net income;
•$126.7 million related to an increase in inventory, net of floor plan notes payable, including both trade and non-trade, excluding offset and including used vehicle borrowing base changes adjusted for acquisitions and divestitures; and
•$16.2 million increase in other long term assets and liabilities, net.
The increase in our adjusted cash flow provided by operating activities, was partially offset by:
•$25.953.2 million related to salessale volume and the timing of collection of accounts receivable and contracts-in-transit during 2017 as2022 compared to 2016; and2021;
•$19.7 million related to non-cash adjustments to net income.
•$8.635.3 million related to a decreasethe change in accounts payable and accrued liabilitiesliabilities; and other long-term assets and liabilities during 2016 when compared to 2015; and
•$6.84.8 million decrease in net income adjusted for non-cash items, primarily attributablerelated to the $45.5 million gain on divestitureschange in 2016 compared to the $34.9 million gain on divestitures in 2015, the $3.6 million of impairment expenses in 2016operating lease liabilities.
Investing Activities—
Net cash used in investing activities totaled $127.8 million$1.68 billion and $61.9 million$3.92 billion for the yearsyear ended December 31, 20172023 and 2015, respectively. Net2021, respectively, compared to net cash provided by investing activities totaled $4.9of $464.7 million for the year ended December 31, 2016.2022. Cash flows from investing activities relate primarily to capital expenditures, acquisitions, divestitures, and the sale of property and equipment.
Capital expenditures, excluding the purchase of real estate, and acquisitions, were $42.3$142.3 million, $81.4$94.6 million, and $71.7$74.2 million for the years ended December 31, 2017, 2016,2023, 2022 and 2015,2021, respectively. There were no purchases related to real estate for the year ended December 31, 2023. Purchases of real estate totaled $5.8 million, $10.6$13.3 million and $30.3$7.8 million for the years ended December 31, 2017, 2016,2022, and 2015,2021, respectively. In addition, we purchased previously leased facilities for $5.4$217.1 million and $19.6 million during the years ended December 31, 2017 and 2016, respectively. There were no purchases of previously leased facilities during the year ended December 31, 2015.
2021.
We expect that capital expenditures during 20182024 will total approximately $50.0$250.0 million to upgrade or replace our existing facilities, construct new facilities, expand our service capacity, and invest in technology and equipment. AsIn addition, as part of our capital allocation strategy, we continually evaluate opportunities to purchase properties currently under lease and acquire properties in connection with future dealership relocations. No assurances can be provided that we will have or be able to access capital at times or on terms in amounts deemed necessary to execute this strategy.
On December 17, 2021, we completed the acquisition of LHM and TCA for a total purchase price of approximately $3.48 billion. The sources of the purchase price included 2029 Notes, 2032 Notes, 2021 Real Estate Facility, proceeds from our common stock offering, new floorplan notes payable trade and non-trade, used vehicle floorplan notes payable, payables to Seller and cash. In addition to these acquisitions, during the year ended December 31, 2017 and 20152021, we acquired twothe assets of 11 franchises (two(10 dealership locations) in the Denver, Colorado market and three franchises (one dealership location) in the Indianapolis, Indiana market for a combined purchase price of $485.7 million. We funded these acquisitions with an aggregate of $455.1 million of cash, and $9.6 million of floor plan borrowings for the purchase of the related new vehicle inventory. In aggregate, these acquisitions included purchase price holdbacks of $21.0 million for potential indemnity claims made by us with respect to the acquired franchises. In addition to the acquisition amounts above, we released $1.0 million of purchase price holdbacks related to current and prior year acquisitions during the year ended December 31, 2021.
During the year ended December 31, 2023, the Company sold one franchise (one dealership location) in Austin, Texas for proceeds of $30.7 million.
61
During the year ended December 31, 2022, we sold one franchise (one dealership location) in St. Louis, Missouri, three franchises (three dealership locations) and one collision center for an aggregate purchase price of $80.1 million andin Denver, Colorado, two franchises (two dealership locations) in Spokane, Washington, one franchise (one dealership location) in Albuquerque, New Mexico and 11 franchises (nine dealership locations) and two collision centers in North Carolina for an aggregate purchase priceproceeds of $69.4 million, respectively. We did not acquire any franchises during the year ended December 31, 2016.$701.2 million.
Proceeds from the sale of assets, unrelated to a dealership divestiture, were $16.3 million of mortgage note repayments were paid directly byand $21.5 million for the buyer as part of these divestitures. During the yearyears ended December 31, 2015, we divested seven franchises (five dealership locations)2023 and one collision center for proceeds of $105.9 million. In addition, $19.3 million of mortgage note repayments were paid directly by the buyer as part of these divestitures. Additionally,2021, respectively. W did not have any proceeds from the sale of assets, unrelated to thea dealership divestitures were $5.8in 2022.
During the years ended December 31, 2023, 2022, and 2021, we purchased $195.2 million, $2.2$202.2 million and $3.6$1.1 million of debt securities and $41.4 million and $1.1 million of equity securities in December 31, 2022 and 2021, respectively. We did not purchase any equity securities in 2023.
During the years ended December 31, 2023, 2022, and 2021, we also received proceeds of $60.3 million, $69.7 million, and $0.8 million from the sale of debt securities and $51.8 million, $50.3 million and $0.4 million, from the sale of equity securities, respectively.
Financing Activities—
Net cash provided by financing activities totaled $1.18 billion and $2.93 billion for the years ended December 31, 2017, 2016,2023 and 2015,2021, respectively.
Net cash used in financing activities totaled $137.2 million, $146.8 million and $98.2 million for the years$1.10 billion year ended December 31, 2017, 2016 and 2015, respectively.2022.
During the years ended December 31, 2017, 2016,2023, 2022, and 2015,2021, we had non-trade floor plan borrowings of $3.85$8.39 billion, $3.87$7.41 billion, and $4.13$5.04 billion, respectively. Included in our non-trade floor plan borrowings, were borrowings of $35.0 million, $55.0$307.1 million and $254.0$294.0 million for the years ended December 31, 2017, 2016,2023 and 2015,2021, respectively, related to our used vehicle floor plan facility. We did not have any floor plan borrowing related to our used vehicle floor plan facility as of December 31,2022.
During the year ended December 31, 2023, 2022 and 2021, we borrowed $329.0 million, $330.0 million, and $439.0 million, and repaid $329.0 million, $499.0 million and $270.0 million, respectively, on our revolving line of credit.
In addition, during the years ended December 31, 2017,2023 and 2015,2021, we had non-trade floor plan borrowings of $25.1$256.1 million and $16.7$214.5 million respectively, related to acquisitions. There were no borrowings related to
During the years ended December 31, 2017, 2016,2023, 2022, and 2015,2021, we made non-trade floor plan repayments of $3.92$7.06 billion, $3.75$7.89 billion, and $4.17$5.36 billion, respectively. Included in our non-trade floor plan repayments were repayments of $35.0 million, $55.0 million, and $254.0 million for the years ended December 31, 2017, 2016, and 2015, respectively, related to our used vehicle floor plan facility. In addition, during the years ended December 31, 20162022 and 2015,2021, we had floor plan repayments associated with dealership divestitures of $31.2$48.4 million and $44.0$0.8 million, respectively. There were noDuring 2023, we did not have any floor plan repayments related to divestitures duringassociated with dealership divestitures.
During the year ended December 31, 2017.
Repayments of borrowings totaled $52.0$126.0 million, $15.2$106.2 million and $11.3$41.5 million, for the years ended December 31, 2017, 2016,2023, 2022, and 2015,2021, respectively.
During the yearyears ended December 31, 20172022, and 2021, we repaid three mortgages prior to their maturity date for a totalreceived net proceeds from the issuance of $36.6 million.common stock totaling $1.4 million and $666.9 million, respectively. We did not have any net proceeds from the issuance of common stock in 2023.
During the year ended December 31, 2017,2023 and 2022, we repurchased a total of 584,6961,316,167 and 1,635,030 shares of our common stock under our Repurchase Program for a total of $34.8$258.1 million and 74,670$297.0 million and 48,262 and 56,024 shares of our common stock for $4.8$11.4 million and $9.2 million from employees in connection with a net share settlement feature of employee equity-based awards.awards, respectively. We did not have any share repurchases in 2021.
62
Off Balance Sheet Arrangements
We had no off balance sheet arrangements during any of the periods presented other than those disclosed in Note 18 "Lease Obligations" and Note 1921 "Commitments and Contingencies" of the Company's consolidated financial statements.
Guarantor Financial Information
As of December 31, 2023, the Company had outstanding $405 million of 4.500% Senior Notes due 2028 and $445 million of 4.750% Senior Notes due 2030. As explained in Note 14 of the Company's consolidated financial statements as of and for the year ended December 31, 2023, the Senior Notes have been fully and unconditionally guaranteed, jointly and severally, on a senior unsecured basis, by each existing and future restricted subsidiary of the Company (the "Guarantor Subsidiaries"), which are listed in Exhibit 21, with the exception of Landcar Administration Company, Landcar Agency, Inc. and Landcar Casualty Company and their respective subsidiaries (collectively, the "TCA Non-Guarantor Subsidiaries").
The following tables present summarized financial information for the Company and the Guarantor Subsidiaries on a combined basis after elimination of (i) intercompany transactions and balances among Asbury and the Guarantor Subsidiaries and (ii) assets, liabilities, and equity in earnings from and investments in any non-guarantor subsidiaries.
| Summarized Balance Sheet Data of Asbury and Guarantor Subsidiaries | |||||
| As of December 31, | |||||
| 2023 | |||||
| (In millions) | |||||
| Current assets | $ | 2,969.8 | |||
| Current assets - affiliates | 4.8 | ||||
| Non-current assets | 6,382.4 | ||||
| Current liabilities | 2,470.6 | ||||
| Current liabilities - affiliates | 13.0 | ||||
| Non-current liabilities | 3,595.6 | ||||
| Summarized Statement of Operations Data for Asbury and Guarantor Subsidiaries | |||||
| For the Year Ended December 31, | |||||
| 2023 | |||||
| (In millions) | |||||
| Net sales | $ | 14,699.0 | |||
| Gross profit | 2,671.1 | ||||
| Income from operations | 862.6 | ||||
| Net income | 529.5 | ||||
CRITICAL ACCOUNTING POLICIES AND ESTIMATES
Preparation of financial statements in conformity with accounting principles generally accepted in the United States of America requires management to Consolidated Financial Statements thereto.make estimates and assumptions that affect the amounts of assets and liabilities and disclosures of contingent assets and liabilities, as of the date of the financial statements, and reported amounts of revenues and expenses during the periods presented. On an ongoing basis, management evaluates their estimates and assumptions and the effects of any such revisions are reflected in the financial statements, in the period in which they are determined to be necessary. Actual outcomes could differ materially from those estimates in a manner that could have a material effect on our consolidated financial statements. Set forth below are the policies and estimates that we have identified as critical to our business operations and understanding our results of operations, based on the high degree of judgment or complexity in their application.
Goodwill and Manufacturer Franchise Rights
Goodwill represents the excess cost of an acquired business over the fair market value of its identifiable assets and liabilities. We have determined, based on how we integrate acquisitions into our business, how the components of our business
63
share resources and interact with one another, and how we review the results of our operations, that we have several geographic market-based operating segments. We have determined the dealerships in each of our operating segments are components that are aggregated into several geographic market-based reporting units for the purpose of testing goodwill for impairment, as they (i) have similar economic characteristics, (ii) offer similar products and services (all of our franchised dealerships offer new and used vehicles, parts and service, and arrange for third-party vehicle financing and the sale of insurance products), (iii) have similar customers, (iv) have similar distribution and marketing practices (all of our dealerships distribute products and services through dealership facilities that market to customers in similar ways) and (v) operate under similar regulatory environments. Our TCA segment also represents a reporting unit for the purpose of testing goodwill for impairment.
Our only other significant identifiable intangible assets are our rights under franchise agreements with manufacturers, which are recorded at an individual franchise level. The fair value of our manufacturer franchise rights are determined at the acquisition date, by discounting the projected cash flows specific to each franchise. We have determined that manufacturer franchise rights have an indefinite life as there are no economic, contractual or other factors that limit their useful lives, and they are expected to generate cash flows indefinitely due to the historically long lives of the manufacturers' brand names. Furthermore, to the extent that any agreements evidencing our manufacturer franchise rights would expire, we expect that we would be able to renew those agreements in the ordinary course of business.
We do not amortize goodwill and other intangible assets that are deemed to have indefinite lives. We review goodwill and manufacturer franchise rights for impairment annually as of October 1st, or more often if events or circumstances indicate that any impairment may have occurred. We have the option of performing a qualitative assessment of impairment to determine whether any further quantitative assessment for impairment is necessary. The option of whether or not to perform a qualitative assessment is made annually and may vary by reporting unit. Factors we consider in the qualitative assessment include general macroeconomic conditions, industry and market conditions, cost factors, overall financial performance of our reporting units, events or changes affecting the composition or carrying amount of the net assets of our reporting units, sustained decrease in our share price, and other relevant entity-specific events. If we elect to bypass the qualitative assessment or if we determine, on the basis of qualitative factors, that the fair value of the reporting unit is more likely than not less than the carrying amount, a quantitative test would be required.
As a result of our annual franchise rights impairment tests as of October 1, 2023, we identified several dealerships with franchise rights carrying values that exceeded their fair values due to the underperformance of certain stores, limited primarily to two brands, and an increase in discount rates. As a result, we recorded non-cash impairment charges totaling $73.1 million during the year ended December 31, 2023 reflected in asset impairments within our consolidated statements of income. For certain stores, the fair value of the franchise rights equals the carrying amount.
In connection with a change in reporting units in our Dealerships segment, we performed quantitative impairment tests of goodwill for the affected reporting units as of October 1, 2023, both before and after the change in reporting units. The results of our quantitative goodwill impairment tests related to certain reporting units indicated that the fair value of these reporting units exceeded their carrying values. For all reporting units, for which a qualitative or quantitative impairment test was performed as of October 1, 2023, the fair values exceeded their carrying amounts. We believe that the fair value of our reporting units is substantially in excess of its carrying amount, except for the Arizona and Utah reporting units, which exceeded their carrying amounts by less than 5% as of October 1, 2023. The goodwill balance for the Arizona and Utah reporting units as of December 31, 2023 was $204.4 million and $197.8 million, respectively.
In December 2023, certain dealerships met the held for sale criteria and the assets and liabilities associated with these dealerships were reclassified as assets held for sale and liabilities associated with assets held for sale in our consolidated balance sheets. As a result, we evaluated the disposal groups to ensure their recording at the lower of their carrying value or fair value less costs to sell. The quantitative impairment tests of each disposal group included a comparison of the estimated fair value to the carrying value of the disposal group less costs to sell. The Company determined the estimated fair value of each disposal group based on the estimated sales proceeds less cost to sell. As a result of this analysis, we recorded asset impairment charges of $44.1 million. These asset impairment charges are reflected in asset impairments in our consolidated statements of income. Since the resulting impairment charges and the decision to dispose of these dealerships represented a triggering event for goodwill, we performed quantitative impairment tests of goodwill for the affected reporting units in December 2023. The results of our quantitative goodwill impairment tests for the affected reporting units indicated that the fair value of these reporting units exceeded their carrying values.
In total, we recognized asset impairments of $117.2 million during the year ended December 31, 2023. No franchise rights or goodwill impairments were identified in 2022 or 2021.
We continue to monitor developments related to macroeconomic conditions and the performance of our stores and reporting units. It is reasonably possible that future developments could have a negative effect on the estimates and assumptions utilized in our impairment assessments and could result in material impairment charges in future periods.
64
Item 7A. Quantitative and Qualitative Disclosures About Market Risk
Interest Rate Risk
We are exposed to risk from changes in interest rates on a significant portion of our outstanding indebtedness. Based on $718.4 million$1.81 billion of total variable interest rate debt, which includes our floor plan notes payable, amounts drawn on our used vehicle floor plan, revolver and certain mortgage liabilities, outstanding as of December 31, 2017,2023, a 100 basis point change in interest rates couldwould result in a change of as much as $7.2$18.1 million in annual interest expense.
We periodically receive floor plan assistance from certain automobile manufacturers.manufacturers, which is primarily accounted for as a reduction in our new vehicle inventory cost. Floor plan assistance reduced our cost of sales for the years ended December 31, 2017, 2016,2023, 2022, and 2015,2021, by $36.4$87.0 million, $35.3$85.8 million, and $33.6$57.5 million, respectively. We cannot provide assurance as to the future amount of floor plan assistance and these amounts may be negatively impacted due to future changes in interest rates.
As part of our strategy to mitigate our exposure to fluctuations in interest rates, we have various interest rate swap agreements. All of our interest rate swaps qualify for cash flow hedge accounting treatment and do not contain any ineffectiveness.
As of December 31, 2023 we had six interest rate swap agreements. In June 2015,January 2022, we entered into antwo new interest rate swap agreementagreements with a combined notional principal amount of $100.0$550.0 million. This swap wasThese swaps are designed to provide a hedge against changes in variable rate cash flows regarding fluctuations in the one month LIBOR rate, through maturity in February 2025. The notional value of this swap was $90.4 million and $95.6 million as of December 31, 2017 and 2016, respectively, and is reducing over its remaining term to $53.1 million at maturity.
| Inception Date | Notional Value at Inception | Notional Value | Notional Value at Maturity | Maturity Date | ||||||||||||||||||||||
| (In millions) | (In millions) | (In millions) | ||||||||||||||||||||||||
| January 2022 | $ | 300.0 | $ | 273.8 | $ | 228.8 | December 2026 | |||||||||||||||||||
| January 2022 | $ | 250.0 | $ | 250.0 | $ | 250.0 | December 2031 | |||||||||||||||||||
| May 2021 | $ | 184.4 | $ | 165.9 | $ | 110.6 | May 2031 | |||||||||||||||||||
| July 2020 | $ | 93.5 | $ | 76.2 | $ | 50.6 | December 2028 | |||||||||||||||||||
| July 2020 | $ | 85.5 | $ | 68.0 | $ | 57.3 | November 2025 | |||||||||||||||||||
| June 2015 | $ | 100.0 | $ | 58.8 | $ | 53.1 | February 2025 | |||||||||||||||||||
These interest rate swaps are marked to market at each reporting date and 2016, were $60.2 millionany unrealized gains or losses are included in accumulated other comprehensive income and $64.0 million, respectively, andreclassified to other interest expense in the notional value will reduce over its remaining term to $38.7 million at maturity.
same period or periods during which the hedged transactions affect earnings. For additional information about the effect of our derivative instruments, on the accompanying Consolidated Financial Statements, seeplease refer to Note 1415 "Financial Instruments and Fair Value" within the accompanying consolidated financial statements.
65
Item 8.Financial Statements and Supplementary Data
INDEX TO CONSOLIDATED FINANCIAL STATEMENTS
| Page | |||||
66
REPORT OF INDEPENDENT REGISTERED PUBLIC ACCOUNTING FIRM
Asbury Automotive Group, Inc.
Opinion on the Financial Statements
We have audited the accompanying consolidated balance sheets of Asbury Automotive Group, Inc. (the Company) as of December 31, 20172023 and 2016,2022, the related consolidated statements of income, comprehensive income, shareholders' equity and cash flows for each of the three years in the period ended December 31, 2017,2023, and the related notes (collectively referred to as the “financial“consolidated financial statements”). In our opinion, the consolidated financial statements present fairly, in all material respects, the consolidated financial position of the Company at December 31, 20172023 and 2016,2022, and the consolidated results of its operations and its cash flows for each of the three years in the period ended December 31, 2017,2023, in conformity with U.S. generally accepted accounting principles.
We also have audited, in accordance with the standards of the Public Company Accounting Oversight Board (United States) (PCAOB), the Company's internal control over financial reporting as of December 31, 2017,2023, based on criteria established in Internal Control-Integrated Framework issued by the Committee of Sponsoring Organizations of the Treadway Commission (2013 framework) and our report dated February 27, 201829, 2024 expressed an unqualified opinion thereon.
Basis for Opinion
These financial statements are the responsibility of the Company's management. Our responsibility is to express an opinion on the Company’s financial statements based on our audits. We are a public accounting firm registered with the PCAOB and are required to be independent with respect to the Company in accordance with the U.S. federal securities laws and the applicable rules and regulations of the Securities and Exchange Commission and the PCAOB.
We conducted our audits in accordance with the standards of the PCAOB. Those standards require that we plan and perform the audit to obtain reasonable assurance about whether the financial statements are free of material misstatement, whether due to error or fraud. Our audits included performing procedures to assess the risks of material misstatement of the financial statements, whether due to error or fraud, and performing procedures that respond to those risks. Such procedures included examining, on a test basis, evidence regarding the amounts and disclosures in the financial statements. Our audits also included evaluating the accounting principles used and significant estimates made by management, as well as evaluating the overall presentation of the financial statements. We believe that our audits provide a reasonable basis for our opinion.
Critical Audit Matter
The critical audit matter communicated below is a matter arising from the current period audit of the financial statements that was communicated or required to be communicated to the audit committee and that: (1) relates to accounts or disclosures that are material to the financial statements and (2) involved our especially challenging, subjective or complex judgments. The communication of the critical audit matter does not alter in any way our opinion on the consolidatedfinancial statements, taken as a whole, and we are not, by communicating the critical audit matter below, providing a separate opinion on the critical audit matter or on the accounts or disclosures to which it relates.
Manufacturer Franchise Rights Quantitative Impairment Assessment
| Description of the Matter | At December 31, 2023, the Company’s manufacturer franchise rights had an aggregate carrying value for franchises acquired of approximately $2,095.8 million, as disclosed in Note 10 of the consolidated financial statements. Manufacturer franchise rights are assessed for impairment annually as of October 1st, or more often if events or circumstances indicate that impairment may have occurred. If the fair value of the franchise right is less than its carrying amount, an impairment loss is recognized in an amount equal to the difference. | ||||
| We identified the assessment of the Company’s quantitative impairment tests over manufacturer franchise rights acquired prior to the fourth quarter of 2023 as a critical audit matter. In connection with its annual quantitative impairment assessment during the year ended December 31, 2023, the Company recorded impairment charges of $73.1 million related to manufacturer franchise rights. | |||||
67
| Auditing the Company's fair value estimates used in its annual impairment assessment is complex due to the significant management judgments and estimates required. The Company's model for estimating the fair value of these assets utilizes market participant assumptions related to the cash flows directly attributable to the franchise rights, including year-over-year and terminal growth rates, weighted average cost of capital, future gross margins, and future selling, general, and administrative expenses, all of which are forward-looking and affected by expectations about economic, industry and company-specific factors. | |||||
| How We Addressed the Matter in Our Audit | We obtained an understanding, evaluated the design and tested the operating effectiveness of the Company’s controls over the manufacturer franchise rights fair value estimates used in conjunction with its annual quantitative impairment assessment. This included testing controls over management’s review of the model, significant assumptions, other inputs and the completeness and accuracy of the data used in the measurements. | ||||
| Procedures performed to test the fair value of the Company's manufacturer franchise rights as part of the quantitative impairment assessment included, among others, testing of the significant assumptions described above and testing the completeness and accuracy of the underlying data. We involved our valuation specialists to assist in the testing of the weighted average cost of capital and to assess the appropriateness of the model used. We compared the significant assumptions to current industry, market and economic trends, as well as to the Company's historical results. In addition, we assessed the accuracy of the Company’s historical projections by comparing them to actual operating results and evaluated the Company’s intent and ability to carry out a particular course of action by evaluating the Company’s past history of carrying out its stated intentions. We also performed sensitivity analyses on the significant assumptions to evaluate the potential change in the fair value of the manufacturer franchise rights resulting from changes in underlying assumptions. | |||||
/s/ Ernst & Young LLP
We have served as the Company’s auditor since 2008.
Atlanta, Georgia
February 27, 201829, 2024
68
REPORT OF INDEPENDENT REGISTERED PUBLIC ACCOUNTING FIRM
Asbury Automotive Group, Inc.
Opinion on Internal Control over Financial Reporting
We have audited Asbury Automotive Group, Inc.’s internal control over financial reporting as of December 31, 2017,2023, based on criteria established in Internal Control-IntegratedControl—Integrated Framework issued by the Committee of Sponsoring Organizations of the Treadway Commission (2013 framework) (the COSO criteria). In our opinion, Asbury Automotive Group, Inc. (the Company)maintained, in all material respects, effective internal control over financial reporting as of December 31, 2017,2023, based on the COSO criteria.
As indicated in the accompanying Management’s Report on Internal Control Over Financial Reporting, management’s assessment of and conclusion on the effectiveness of internal control over financial reporting did not include an evaluation of the internal controls of two franchises acquired during 2017,the Jim Koons Dealerships, which are included in the 20172023 consolidated financial statements of the Company from the date of acquisition and constituted $64.0 millionrepresented approximately $1.65 billion of consolidated total assets as of December 31, 20172023, and $136.0approximately $168.2 million of consolidated revenues for the year then ended. Our audit of internal control over financial reporting of the Company also did not include an evaluation of the internal control over financial reporting of the two franchises.Jim Koons Dealerships.
We also have audited, in accordance with the standards of the Public Company Accounting Oversight Board (United States) (PCAOB), the consolidated balance sheets of Asbury Automotive Group, Inc.the Company as of December 31, 20172023 and 2016,2022, the related consolidated statements of income, comprehensive income, shareholders' equity and cash flows for each of the three years in the period ended December 31, 2017,2023, and the related notes (collectively referred to as the “consolidated financial statements”) and our report dated February 27, 201829, 2024 expressed an unqualified opinion thereon.
Basis for Opinion
The Company’s management is responsible for maintaining effective internal control over financial reporting and for its assessment of the effectiveness of internal control over financial reporting included in the accompanying Management’s Report on Internal Control Over Financial Reporting. Our responsibility is to express an opinion on the Company’s internal control over financial reporting based on our audit. We are a public accounting firm registered with the PCAOB and are required to be independent with respect to the Company in accordance with the U.S. federal securities laws and the applicable rules and regulations of the Securities and Exchange Commission and the PCAOB.
We conducted our audit in accordance with the standards of the PCAOB. Those standards require that we plan and perform the audit to obtain reasonable assurance about whether effective internal control over financial reporting was maintained in all material respects.
Our audit included obtaining an understanding of internal control over financial reporting, assessing the risk that a material weakness exists, testing and evaluating the design and operating effectiveness of internal control based on the assessed risk, and performing such other procedures as we considered necessary in the circumstances. We believe that our audit provides a reasonable basis for our opinion.
Definition and Limitations of Internal Control Over Financial Reporting
A company’s internal control over financial reporting is a process designed to provide reasonable assurance regarding the reliability of financial reporting and the preparation of financial statements for external purposes in accordance with generally accepted accounting principles. A company’s internal control over financial reporting includes those policies and procedures that (1) pertain to the maintenance of records that, in reasonable detail, accurately and fairly reflect the transactions and dispositions of the assets of the company; (2) provide reasonable assurance that transactions are recorded as necessary to permit preparation of financial statements in accordance with generally accepted accounting principles, and that receipts and expenditures of the company are being made only in accordance with authorizations of management and directors of the company; and (3) provide reasonable assurance regarding prevention or timely detection of unauthorized acquisition, use, or disposition of the company’s assets that could have a material effect on the financial statements.
69
Because of its inherent limitations, internal control over financial reporting may not prevent or detect misstatements. Also, projections of any evaluation of effectiveness to future periods are subject to the risk that controls may become inadequate because of changes in conditions, or that the degree of compliance with the policies or procedures may deteriorate.
/s/ Ernst & Young LLP
Atlanta, Georgia
February 27, 201829, 2024
70
ASBURY AUTOMOTIVE GROUP, INC.
CONSOLIDATED BALANCE SHEETS
(In millions, except par value and share data)
| As of December 31, | |||||||||||
| 2023 | 2022 | ||||||||||
| ASSETS | |||||||||||
| CURRENT ASSETS: | |||||||||||
| Cash and cash equivalents | $ | 45.7 | $ | 235.3 | |||||||
| Short term investments | 6.2 | 5.4 | |||||||||
| Contracts-in-transit, net | 279.7 | 220.8 | |||||||||
| Accounts receivable, net | 226.1 | 171.9 | |||||||||
| Inventories, net | 1,768.3 | 959.2 | |||||||||
| Assets held for sale | 342.2 | 29.1 | |||||||||
| Other current assets | 388.9 | 288.1 | |||||||||
| Total current assets | 3,057.1 | 1,909.8 | |||||||||
| INVESTMENTS | 326.7 | 235.0 | |||||||||
| PROPERTY AND EQUIPMENT, net | 2,315.7 | 1,941.0 | |||||||||
| OPERATING LEASE RIGHT-OF-USE ASSETS | 241.8 | 235.4 | |||||||||
| GOODWILL | 2,009.0 | 1,783.4 | |||||||||
| INTANGIBLE FRANCHISE RIGHTS | 2,095.8 | 1,800.1 | |||||||||
| OTHER LONG-TERM ASSETS | 113.3 | 116.7 | |||||||||
| Total assets | $ | 10,159.4 | $ | 8,021.4 | |||||||
| LIABILITIES AND SHAREHOLDERS' EQUITY | |||||||||||
| CURRENT LIABILITIES: | |||||||||||
| Floor plan notes payable—trade, net | $ | 195.1 | $ | 51.0 | |||||||
| Floor plan notes payable—non-trade, net | 1,590.6 | — | |||||||||
| Current maturities of long-term debt | 84.9 | 84.5 | |||||||||
| Current maturities of operating leases | 26.2 | 23.6 | |||||||||
| Accounts payable and accrued liabilities | 748.1 | 645.0 | |||||||||
| Deferred revenue—current | 228.6 | 218.9 | |||||||||
| Liabilities associated with assets held for sale | 2.1 | 10.5 | |||||||||
| Total current liabilities | 2,875.7 | 1,033.4 | |||||||||
| LONG-TERM DEBT | 3,121.2 | 3,216.8 | |||||||||
| LONG-TERM LEASE LIABILITY | 222.1 | 218.4 | |||||||||
| DEFERRED REVENUE | 508.1 | 495.0 | |||||||||
| DEFERRED INCOME TAXES | 136.4 | 100.7 | |||||||||
| OTHER LONG-TERM LIABILITIES | 51.7 | 53.5 | |||||||||
| COMMITMENTS AND CONTINGENCIES (Note 21) | |||||||||||
| SHAREHOLDERS' EQUITY: | |||||||||||
| Preferred stock, $.01 par value, 10,000,000 shares authorized; none issued or outstanding | — | — | |||||||||
| Common stock, $.01 par value, 90,000,000 shares authorized; 42,352,001 and 43,593,809 shares issued, including shares held in treasury, respectively | 0.4 | 0.4 | |||||||||
| Additional paid-in capital | 1,288.4 | 1,281.4 | |||||||||
| Retained earnings | 2,961.5 | 2,610.1 | |||||||||
| Treasury stock, at cost; 22,018,537 and 22,024,479 shares, respectively | (1,067.3) | (1,063.0) | |||||||||
| Accumulated other comprehensive income | 61.1 | 74.4 | |||||||||
| Total shareholders' equity | 3,244.1 | 2,903.5 | |||||||||
| Total liabilities and shareholders' equity | $ | 10,159.4 | $ | 8,021.4 | |||||||
| As of December 31, | |||||||
| 2017 | 2016 | ||||||
| ASSETS | |||||||
| CURRENT ASSETS: | |||||||
| Cash and cash equivalents | $ | 4.7 | $ | 3.4 | |||
| Contracts-in-transit, net | 193.3 | 182.6 | |||||
| Accounts receivable, net | 128.5 | 138.4 | |||||
| Inventories, net | 826.0 | 894.9 | |||||
| Assets held for sale | 30.3 | 16.1 | |||||
| Other current assets | 119.3 | 97.0 | |||||
| Total current assets | 1,302.1 | 1,332.4 | |||||
| PROPERTY AND EQUIPMENT, net | 834.2 | 815.4 | |||||
| GOODWILL | 160.8 | 128.1 | |||||
| INTANGIBLE FRANCHISE RIGHTS | 49.6 | 48.5 | |||||
| OTHER LONG-TERM ASSETS | 10.0 | 11.7 | |||||
| Total assets | $ | 2,356.7 | $ | 2,336.1 | |||
| LIABILITIES AND SHAREHOLDERS' EQUITY | |||||||
| CURRENT LIABILITIES: | |||||||
| Floor plan notes payable—trade, net | $ | 104.2 | $ | 108.3 | |||
| Floor plan notes payable—non-trade, net | 627.9 | 673.5 | |||||
| Current maturities of long-term debt | 12.9 | 14.0 | |||||
| Accounts payable and accrued liabilities | 313.2 | 309.1 | |||||
| Total current liabilities | 1,058.2 | 1,104.9 | |||||
| LONG-TERM DEBT | 862.6 | 912.7 | |||||
| DEFERRED INCOME TAXES | 12.5 | 8.9 | |||||
| OTHER LONG-TERM LIABILITIES | 29.2 | 29.9 | |||||
| COMMITMENTS AND CONTINGENCIES (Note 19) | |||||||
| SHAREHOLDERS' EQUITY: | |||||||
| Preferred stock, $.01 par value, 10,000,000 shares authorized; none issued or outstanding | — | — | |||||
| Common stock, $.01 par value, 90,000,000 shares authorized; 40,969,987 and 40,750,765 shares issued, including shares held in treasury, respectively | 0.4 | 0.4 | |||||
| Additional paid-in capital | 563.5 | 549.4 | |||||
| Retained earnings | 750.3 | 611.5 | |||||
| Treasury stock, at cost; 20,156,962 and 19,497,596 shares, respectively | (919.1 | ) | (879.5 | ) | |||
| Accumulated other comprehensive loss | (0.9 | ) | (2.1 | ) | |||
| Total shareholders' equity | 394.2 | 279.7 | |||||
| Total liabilities and shareholders' equity | $ | 2,356.7 | $ | 2,336.1 | |||
See accompanying Notes to Consolidated Financial Statements
71
ASBURY AUTOMOTIVE GROUP, INC.
CONSOLIDATED STATEMENTS OF INCOME
(In millions, except per share data)
| For the Year Ended December 31, | |||||||||||||||||
| 2023 | 2022 | 2021 | |||||||||||||||
| REVENUE: | |||||||||||||||||
| New vehicle | $ | 7,630.7 | $ | 7,365.6 | $ | 4,934.1 | |||||||||||
| Used vehicle | 4,414.3 | 5,197.1 | 3,315.6 | ||||||||||||||
| Parts and service | 2,081.5 | 2,074.2 | 1,182.9 | ||||||||||||||
| Finance and insurance, net | 676.2 | 797.0 | 405.1 | ||||||||||||||
| TOTAL REVENUE | 14,802.7 | 15,433.8 | 9,837.7 | ||||||||||||||
| COST OF SALES: | |||||||||||||||||
| New vehicle | 6,927.8 | 6,521.6 | 4,443.6 | ||||||||||||||
| Used vehicle | 4,150.2 | 4,843.8 | 3,027.3 | ||||||||||||||
| Parts and service | 931.0 | 921.6 | 461.0 | ||||||||||||||
| Finance and insurance | 37.9 | 46.3 | 3.6 | ||||||||||||||
| TOTAL COST OF SALES | 12,046.9 | 12,333.3 | 7,935.5 | ||||||||||||||
| GROSS PROFIT | 2,755.8 | 3,100.6 | 1,902.2 | ||||||||||||||
| OPERATING EXPENSES: | |||||||||||||||||
| Selling, general, and administrative | 1,617.4 | 1,763.4 | 1,073.9 | ||||||||||||||
| Depreciation and amortization | 67.7 | 69.0 | 41.9 | ||||||||||||||
| Asset impairments | 117.2 | — | — | ||||||||||||||
| Other operating income, net | — | (4.4) | (5.4) | ||||||||||||||
| INCOME FROM OPERATIONS | 953.5 | 1,272.6 | 791.8 | ||||||||||||||
| OTHER EXPENSES (INCOME): | |||||||||||||||||
| Floor plan interest expense | 9.6 | 8.4 | 8.2 | ||||||||||||||
| Other interest expense, net | 156.1 | 152.2 | 93.9 | ||||||||||||||
| Gain on dealership divestitures, net | (13.5) | (207.1) | (8.0) | ||||||||||||||
| Total other expenses (income), net | 152.2 | (46.5) | 94.1 | ||||||||||||||
| INCOME BEFORE INCOME TAXES | 801.3 | 1,319.1 | 697.7 | ||||||||||||||
| Income tax expense | 198.8 | 321.8 | 165.3 | ||||||||||||||
| NET INCOME | $ | 602.5 | $ | 997.3 | $ | 532.4 | |||||||||||
| EARNINGS PER COMMON SHARE: | |||||||||||||||||
| Basic— | |||||||||||||||||
| Net Income | $ | 28.87 | $ | 44.78 | $ | 26.75 | |||||||||||
| Diluted— | |||||||||||||||||
| Net Income | $ | 28.74 | $ | 44.61 | $ | 26.49 | |||||||||||
| WEIGHTED AVERAGE COMMON SHARES OUTSTANDING: | |||||||||||||||||
| Basic | 20.9 | 22.3 | 19.9 | ||||||||||||||
| Restricted stock | — | 0.1 | 0.1 | ||||||||||||||
| Performance share units | 0.1 | — | 0.1 | ||||||||||||||
| Diluted | 21.0 | 22.4 | 20.1 | ||||||||||||||
| For the Year Ended December 31, | |||||||||||
| 2017 | 2016 | 2015 | |||||||||
| REVENUE: | |||||||||||
| New vehicle | $ | 3,561.1 | $ | 3,611.9 | $ | 3,652.5 | |||||
| Used vehicle | 1,834.1 | 1,876.4 | 1,931.7 | ||||||||
| Parts and service | 786.1 | 778.5 | 740.7 | ||||||||
| Finance and insurance, net | 275.2 | 261.0 | 263.4 | ||||||||
| TOTAL REVENUE | 6,456.5 | 6,527.8 | 6,588.3 | ||||||||
| COST OF SALES: | |||||||||||
| New vehicle | 3,392.1 | 3,424.8 | 3,449.5 | ||||||||
| Used vehicle | 1,712.2 | 1,749.1 | 1,799.9 | ||||||||
| Parts and service | 296.3 | 295.2 | 278.1 | ||||||||
| TOTAL COST OF SALES | 5,400.6 | 5,469.1 | 5,527.5 | ||||||||
| GROSS PROFIT | 1,055.9 | 1,058.7 | 1,060.8 | ||||||||
| OPERATING EXPENSES: | |||||||||||
| Selling, general, and administrative | 729.7 | 732.5 | 729.9 | ||||||||
| Depreciation and amortization | 32.1 | 30.7 | 29.5 | ||||||||
| Franchise rights impairment | 5.1 | — | — | ||||||||
| Other operating expense (income), net | 1.3 | (2.3 | ) | (0.2 | ) | ||||||
| INCOME FROM OPERATIONS | 287.7 | 297.8 | 301.6 | ||||||||
| OTHER EXPENSES (INCOME): | |||||||||||
| Floor plan interest expense | 22.7 | 19.3 | 16.1 | ||||||||
| Other interest expense, net | 53.9 | 53.1 | 44.0 | ||||||||
| Swap interest expense | 2.0 | 3.1 | 3.0 | ||||||||
| Gain on divestitures | — | (45.5 | ) | (34.9 | ) | ||||||
| Total other expenses, net | 78.6 | 30.0 | 28.2 | ||||||||
| INCOME FROM CONTINUING OPERATIONS BEFORE INCOME TAXES | 209.1 | 267.8 | 273.4 | ||||||||
| Income tax expense | 70.0 | 100.6 | 104.0 | ||||||||
| INCOME FROM CONTINUING OPERATIONS | 139.1 | 167.2 | 169.4 | ||||||||
| Discontinued operations, net of tax | — | — | (0.2 | ) | |||||||
| NET INCOME | $ | 139.1 | $ | 167.2 | $ | 169.2 | |||||
| EARNINGS PER COMMON SHARE: | |||||||||||
| Basic— | |||||||||||
| Continuing operations | $ | 6.69 | $ | 7.43 | $ | 6.44 | |||||
| Discontinued operations | — | — | (0.01 | ) | |||||||
| Net income | $ | 6.69 | $ | 7.43 | $ | 6.43 | |||||
| Diluted— | |||||||||||
| Continuing operations | $ | 6.62 | $ | 7.40 | $ | 6.42 | |||||
| Discontinued operations | — | — | (0.01 | ) | |||||||
| Net income | $ | 6.62 | $ | 7.40 | $ | 6.41 | |||||
| WEIGHTED AVERAGE COMMON SHARES OUTSTANDING: | |||||||||||
| Basic | 20.8 | 22.5 | 26.3 | ||||||||
| Restricted stock | 0.1 | 0.0 | 0.0 | ||||||||
| Performance share units | 0.1 | 0.1 | 0.1 | ||||||||
| Diluted | 21.0 | 22.6 | 26.4 | ||||||||
See accompanying Notes to Consolidated Financial Statements
72
ASBURY AUTOMOTIVE GROUP, INC.
CONSOLIDATED STATEMENTS OF COMPREHENSIVE INCOME
(In millions)
| For the Year Ended December 31, | |||||||||||||||||
| 2023 | 2022 | 2021 | |||||||||||||||
| Net income | $ | 602.5 | $ | 997.3 | $ | 532.4 | |||||||||||
| Other comprehensive (loss) income: | |||||||||||||||||
| Change in fair value of cash flow swaps | (22.6) | 103.3 | 6.3 | ||||||||||||||
| Unrealized gains (losses) on available-for-sale debt securities | 5.2 | (4.0) | 0.2 | ||||||||||||||
| Income tax benefit (expense) associated with other comprehensive income items | 4.0 | (24.3) | (1.6) | ||||||||||||||
| Comprehensive income | $ | 589.1 | $ | 1,072.2 | $ | 537.3 | |||||||||||
| For the Year Ended December 31, | |||||||||||
| 2017 | 2016 | 2015 | |||||||||
| Net income | $ | 139.1 | $ | 167.2 | $ | 169.2 | |||||
| Other comprehensive income (loss): | |||||||||||
| Change in fair value of cash flow swaps | 1.9 | 2.3 | (3.1 | ) | |||||||
| Income tax (expense) benefit associated with cash flow swaps | (0.7 | ) | (0.9 | ) | 1.1 | ||||||
| Comprehensive income | $ | 140.3 | $ | 168.6 | $ | 167.2 | |||||
See accompanying Notes to Consolidated Financial Statements
73
ASBURY AUTOMOTIVE GROUP, INC.
CONSOLIDATED STATEMENTS OF SHAREHOLDERS' EQUITY
(Dollars in millions)
| Common Stock | Additional Paid-in Capital | Retained Earnings | Treasury Stock | Accumulated Other Comprehensive Income (Loss) | Total | ||||||||||||||||||||||||
| Shares | Amount | Shares | Amount | ||||||||||||||||||||||||||
| Balances, December 31, 2014 | 40,327,625 | $ | 0.4 | $ | 522.6 | $ | 275.1 | 11,803,711 | $ | (351.7 | ) | $ | (1.5 | ) | $ | 444.9 | |||||||||||||
| Comprehensive Income: | |||||||||||||||||||||||||||||
| Net income | — | — | — | 169.2 | — | — | — | 169.2 | |||||||||||||||||||||
| Change in fair value of cash flow swaps, net of reclassification adjustment and $1.1 tax benefit | — | — | — | — | — | — | (2.0 | ) | (2.0 | ) | |||||||||||||||||||
| Comprehensive income (loss) | — | — | — | 169.2 | — | — | (2.0 | ) | 167.2 | ||||||||||||||||||||
| Share-based compensation | — | — | 10.0 | — | — | — | — | 10.0 | |||||||||||||||||||||
| Issuance of common stock in connection with share-based payment arrangements, including $4.6 excess tax benefit | 179,688 | — | 4.6 | — | — | — | — | 4.6 | |||||||||||||||||||||
| Repurchase of common stock associated with net share settlements of employee share-based awards | — | — | — | — | 99,646 | (8.0 | ) | — | (8.0 | ) | |||||||||||||||||||
| Purchase of treasury shares | — | — | — | — | 3,793,186 | (304.2 | ) | — | (304.2 | ) | |||||||||||||||||||
| Balances, December 31, 2015 | 40,507,313 | $ | 0.4 | $ | 537.2 | $ | 444.3 | 15,696,543 | $ | (663.9 | ) | $ | (3.5 | ) | $ | 314.5 | |||||||||||||
| Comprehensive Income: | |||||||||||||||||||||||||||||
| Net income | — | — | — | 167.2 | — | — | — | 167.2 | |||||||||||||||||||||
| Change in fair value of cash flow swaps, net of reclassification adjustment and $0.9 tax expense | — | — | — | — | — | — | 1.4 | 1.4 | |||||||||||||||||||||
| Comprehensive income | — | — | — | 167.2 | — | — | 1.4 | 168.6 | |||||||||||||||||||||
| Share-based compensation | — | — | 12.0 | — | — | — | — | 12.0 | |||||||||||||||||||||
| Issuance of common stock in connection with share-based payment arrangements, including $0.2 excess tax benefit | 243,452 | — | 0.2 | — | — | — | — | 0.2 | |||||||||||||||||||||
| Repurchase of common stock associated with net share settlements of employee share-based awards | — | — | — | — | 70,411 | (3.7 | ) | — | (3.7 | ) | |||||||||||||||||||
| Purchase of treasury shares | — | — | — | — | 3,730,642 | (211.9 | ) | — | (211.9 | ) | |||||||||||||||||||
| Balances, December 31, 2016 | 40,750,765 | $ | 0.4 | $ | 549.4 | $ | 611.5 | 19,497,596 | $ | (879.5 | ) | $ | (2.1 | ) | $ | 279.7 | |||||||||||||
| Comprehensive Income: | |||||||||||||||||||||||||||||
| Net income | — | — | — | 139.1 | — | — | — | 139.1 | |||||||||||||||||||||
| Change in fair value of cash flow swaps, net of reclassification adjustment and $0.7 tax expense | — | — | — | — | — | — | 1.2 | 1.2 | |||||||||||||||||||||
| Comprehensive income | — | — | — | 139.1 | — | — | 1.2 | 140.3 | |||||||||||||||||||||
| Cumulative Effect Adjustment of ASU 2016-09 (Note 2) | 0.5 | (0.3 | ) | 0.2 | |||||||||||||||||||||||||
| Share-based compensation | — | — | 13.6 | — | — | — | — | 13.6 | |||||||||||||||||||||
| Issuance of common stock in connection with share-based payment arrangements | 219,222 | — | — | — | — | — | — | — | |||||||||||||||||||||
| Repurchase of common stock associated with net share settlements of employee share-based awards | — | — | — | — | 74,670 | (4.8 | ) | — | (4.8 | ) | |||||||||||||||||||
| Purchase of treasury shares | — | — | — | — | 584,696 | (34.8 | ) | — | (34.8 | ) | |||||||||||||||||||
| Balances, December 31, 2017 | 40,969,987 | $ | 0.4 | $ | 563.5 | $ | 750.3 | 20,156,962 | $ | (919.1 | ) | $ | (0.9 | ) | $ | 394.2 | |||||||||||||
| Common Stock | Additional Paid-in Capital | Retained Earnings | Treasury Stock | Accumulated Other Comprehensive Income (Loss) | Total | ||||||||||||||||||||||||||||||||||||||||||
| Shares | Amount | Shares | Amount | ||||||||||||||||||||||||||||||||||||||||||||
| Balances, December 31, 2020 | 41,133,668 | $ | 0.4 | $ | 595.5 | $ | 1,348.9 | 21,848,314 | $ | (1,033.7) | $ | (5.6) | $ | 905.5 | |||||||||||||||||||||||||||||||||
| Comprehensive Income: | |||||||||||||||||||||||||||||||||||||||||||||||
| Net income | — | — | — | 532.4 | — | — | — | 532.4 | |||||||||||||||||||||||||||||||||||||||
| Unrealized gains on changes in fair value of debt securities, net of $0 tax expense | — | — | — | — | — | — | 0.2 | 0.2 | |||||||||||||||||||||||||||||||||||||||
| Change in fair value of cash flow swaps, net of reclassification adjustment and $1.6 million tax expense | — | — | — | — | — | — | 4.7 | 4.7 | |||||||||||||||||||||||||||||||||||||||
| Comprehensive income | — | — | — | 532.4 | — | — | 4.9 | 537.3 | |||||||||||||||||||||||||||||||||||||||
| Share-based compensation | — | — | 16.2 | — | — | — | — | 16.2 | |||||||||||||||||||||||||||||||||||||||
| Proceeds from secondary offering of common stock, net | 3,795,000 | — | 666.9 | — | — | — | — | 666.9 | |||||||||||||||||||||||||||||||||||||||
| Issuance of common stock, net of forfeitures, in connection with share-based payment arrangements | 123,625 | — | — | — | — | — | — | — | |||||||||||||||||||||||||||||||||||||||
| Repurchase of common stock associated with net share settlements of employee share-based awards | — | — | — | — | 65,937 | (10.4) | — | (10.4) | |||||||||||||||||||||||||||||||||||||||
| Balances, December 31, 2021 | 45,052,293 | $ | 0.4 | $ | 1,278.6 | $ | 1,881.3 | 21,914,251 | $ | (1,044.1) | $ | (0.7) | $ | 2,115.5 | |||||||||||||||||||||||||||||||||
| Comprehensive Income: | |||||||||||||||||||||||||||||||||||||||||||||||
| Net income | — | — | — | 997.3 | — | — | — | 997.3 | |||||||||||||||||||||||||||||||||||||||
| Change in fair value of cash flow swaps, net of reclassification adjustment and $25.1 million tax expense | — | — | — | — | — | — | 78.1 | 78.1 | |||||||||||||||||||||||||||||||||||||||
| Unrealized loss on changes in fair value of debt securities, net of $0.8 million tax benefit | — | — | — | — | — | — | (3.2) | (3.2) | |||||||||||||||||||||||||||||||||||||||
| Comprehensive income | — | — | — | 997.3 | — | — | 74.9 | 1,072.2 | |||||||||||||||||||||||||||||||||||||||
| Share-based compensation | — | — | 20.6 | — | — | — | — | 20.6 | |||||||||||||||||||||||||||||||||||||||
| Issuance of common stock, net of forfeitures, in connection with share-based payment arrangements | 122,342 | — | — | — | — | — | — | — | |||||||||||||||||||||||||||||||||||||||
| Share issues (repurchases) | — | — | 1.4 | — | 1,635,030 | (297.0) | — | (295.6) | |||||||||||||||||||||||||||||||||||||||
| Repurchase of common stock associated with net share settlements of employee share-based awards | — | — | — | — | 56,024 | (9.2) | — | (9.2) | |||||||||||||||||||||||||||||||||||||||
| Retirement of common stock | (1,580,826) | — | (19.1) | (268.3) | (1,580,826) | 287.4 | — | — | |||||||||||||||||||||||||||||||||||||||
| Balances, December 31, 2022 | 43,593,809 | $ | 0.4 | $ | 1,281.4 | $ | 2,610.1 | 22,024,479 | $ | (1,063.0) | $ | 74.4 | $ | 2,903.5 | |||||||||||||||||||||||||||||||||
| Comprehensive Income: | |||||||||||||||||||||||||||||||||||||||||||||||
| Net income | — | — | — | 602.5 | — | — | — | 602.5 | |||||||||||||||||||||||||||||||||||||||
| Change in fair value of cash flow swaps, net of reclassification adjustment and $5.1 million tax benefit | — | — | — | — | — | — | (17.5) | (17.5) | |||||||||||||||||||||||||||||||||||||||
| Unrealized gain on changes in fair value of debt securities, net of $1.1 million tax expense | — | — | — | — | — | — | 4.1 | 4.1 | |||||||||||||||||||||||||||||||||||||||
| Comprehensive income | — | — | — | 602.5 | — | — | (13.4) | 589.1 | |||||||||||||||||||||||||||||||||||||||
| Share-based compensation | — | — | 23.5 | — | — | — | — | 23.5 | |||||||||||||||||||||||||||||||||||||||
| Issuance of common stock, net of forfeitures, in connection with share-based payment arrangements | 128,563 | — | — | — | — | — | — | — | |||||||||||||||||||||||||||||||||||||||
| Share issues (repurchases) | — | — | — | — | 1,316,167 | (260.6) | — | (260.6) | |||||||||||||||||||||||||||||||||||||||
| Repurchase of common stock associated with net share settlements of employee share-based awards | — | — | — | — | 48,262 | (11.4) | — | (11.4) | |||||||||||||||||||||||||||||||||||||||
| Retirement of common stock | (1,370,371) | — | (16.5) | (251.1) | (1,370,371) | 267.7 | — | — | |||||||||||||||||||||||||||||||||||||||
| Balances, December 31, 2023 | 42,352,001 | $ | 0.4 | $ | 1,288.4 | $ | 2,961.5 | 22,018,537 | $ | (1,067.3) | $ | 61.0 | $ | 3,244.1 | |||||||||||||||||||||||||||||||||
See accompanying Notes to Consolidated Financial Statements
74
ASBURY AUTOMOTIVE GROUP, INC.
CONSOLIDATED STATEMENTS OF CASH FLOWS
(In millions)
| For the Year Ended December 31, | |||||||||||||||||
| 2023 | 2022 | 2021 | |||||||||||||||
| CASH FLOW FROM OPERATING ACTIVITIES: | |||||||||||||||||
| Net income | $ | 602.5 | $ | 997.3 | $ | 532.4 | |||||||||||
| Adjustments to reconcile net income to net cash provided by operating activities— | |||||||||||||||||
| Depreciation and amortization | 67.7 | 69.0 | 41.9 | ||||||||||||||
| Share-based compensation | 23.5 | 20.6 | 16.2 | ||||||||||||||
| Deferred income taxes | 39.7 | 148.5 | 31.2 | ||||||||||||||
| Asset impairments | 117.2 | — | — | ||||||||||||||
| Unrealized (gain) loss on investments | (2.1) | 14.1 | (1.0) | ||||||||||||||
| Loaner vehicle amortization | 34.8 | 14.7 | 20.9 | ||||||||||||||
| Gain on divestitures, net | (13.5) | (207.1) | (8.0) | ||||||||||||||
| Change in right-of-use asset | 26.8 | 25.3 | 22.3 | ||||||||||||||
| Other adjustments, net | (1.9) | 4.6 | (0.8) | ||||||||||||||
| Changes in operating assets and liabilities, net of acquisitions and divestitures— | |||||||||||||||||
| Contracts-in-transit | (58.9) | (17.0) | 48.5 | ||||||||||||||
| Accounts receivable | (54.6) | 47.6 | 35.3 | ||||||||||||||
| Inventories | (144.5) | 6.9 | 670.5 | ||||||||||||||
| Other current assets | (564.6) | (353.7) | (227.1) | ||||||||||||||
| Floor plan notes payable—trade, net | 144.1 | 13.8 | (27.6) | ||||||||||||||
| Deferred revenue | 22.8 | 42.9 | 3.6 | ||||||||||||||
| Accounts payable and accrued liabilities | 119.5 | (69.8) | 39.2 | ||||||||||||||
| Operating lease liabilities | (26.7) | (25.4) | (20.6) | ||||||||||||||
| Other long-term assets and liabilities, net | (18.8) | (36.3) | (13.2) | ||||||||||||||
| Net cash provided by operating activities | 313.0 | 696.0 | 1,163.7 | ||||||||||||||
| CASH FLOW FROM INVESTING ACTIVITIES: | |||||||||||||||||
| Capital expenditures—excluding real estate | (142.3) | (94.6) | (74.2) | ||||||||||||||
| Capital expenditures—real estate | — | (13.3) | (7.8) | ||||||||||||||
| Purchases of previously leased real estate | — | — | (217.1) | ||||||||||||||
| Acquisitions, net of cash acquired | (1,500.0) | (5.0) | (3,660.4) | ||||||||||||||
| Proceeds from dealership divestitures | 30.7 | 701.2 | 21.3 | ||||||||||||||
| Purchases of debt securities—available-for-sale | (195.2) | (202.2) | (1.1) | ||||||||||||||
| Purchases of equity securities | — | (41.4) | (0.4) | ||||||||||||||
| Proceeds from the sale of debt securities—available-for-sale | 60.3 | 69.7 | 0.8 | ||||||||||||||
| Proceeds from the sale of equity securities | 51.8 | 50.3 | 0.4 | ||||||||||||||
| Proceeds from the sale of assets | 16.3 | — | 21.5 | ||||||||||||||
| Net cash (used in) provided by investing activities | (1,678.4) | 464.7 | (3,917.0) | ||||||||||||||
| CASH FLOW FROM FINANCING ACTIVITIES: | |||||||||||||||||
| Floor plan borrowings—non-trade | 8,385.8 | 7,406.5 | 5,042.8 | ||||||||||||||
| Floor plan borrowings—acquisitions | 256.1 | — | 214.5 | ||||||||||||||
| Floor plan repayments—non-trade | (7,059.8) | (7,891.6) | (5,357.5) | ||||||||||||||
| Floor plan repayments—divestitures | — | (48.4) | (0.8) | ||||||||||||||
| Proceeds from borrowings | — | — | 2,274.0 | ||||||||||||||
| Repayments of borrowings | (126.0) | (106.2) | (41.5) | ||||||||||||||
| Proceeds from revolving credit facility | 329.0 | 330.0 | 439.0 | ||||||||||||||
| Repayments of revolving credit facility | (329.0) | (499.0) | (270.0) | ||||||||||||||
| Proceeds from issuance of common stock | — | 1.4 | 666.9 | ||||||||||||||
75
| For the Year Ended December 31, | |||||||||||
| 2017 | 2016 | 2015 | |||||||||
| CASH FLOW FROM OPERATING ACTIVITIES: | |||||||||||
| Net income | $ | 139.1 | $ | 167.2 | $ | 169.2 | |||||
| Adjustments to reconcile net income to net cash provided by operating activities— | |||||||||||
| Depreciation and amortization | 32.1 | 30.7 | 29.5 | ||||||||
| Share-based compensation | 13.6 | 12.0 | 10.0 | ||||||||
| Deferred income taxes | 2.8 | 6.1 | 9.5 | ||||||||
| Franchise rights impairment | 5.1 | — | — | ||||||||
| Non-cash impairment charges | — | 3.6 | — | ||||||||
| Loaner vehicle amortization | 22.4 | 21.5 | 19.0 | ||||||||
| Gain on divestitures | — | (45.5 | ) | (34.9 | ) | ||||||
| Other adjustments, net | 4.3 | 4.1 | 4.2 | ||||||||
| Changes in operating assets and liabilities, net of acquisitions and divestitures— | |||||||||||
| Contracts-in-transit | (10.7 | ) | (6.9 | ) | (20.1 | ) | |||||
| Accounts receivable | 10.2 | (19.5 | ) | (11.2 | ) | ||||||
| Inventories | 251.5 | 105.3 | 50.1 | ||||||||
| Other current assets | (197.2 | ) | (152.2 | ) | (118.4 | ) | |||||
| Floor plan notes payable—trade, net | (4.1 | ) | (17.2 | ) | 11.2 | ||||||
| Accounts payable and accrued liabilities | (2.6 | ) | 31.4 | 37.7 | |||||||
| Other long-term assets and liabilities, net | (0.2 | ) | 1.9 | 4.2 | |||||||
| Net cash provided by operating activities | 266.3 | 142.5 | 160.0 | ||||||||
| CASH FLOW FROM INVESTING ACTIVITIES: | |||||||||||
| Capital expenditures—excluding real estate | (42.3 | ) | (81.4 | ) | (71.7 | ) | |||||
| Capital expenditures—real estate | (5.8 | ) | (10.6 | ) | (30.3 | ) | |||||
| Purchases of previously leased real estate | (5.4 | ) | (19.6 | ) | — | ||||||
| Acquisitions | (80.1 | ) | — | (69.4 | ) | ||||||
| Divestitures | — | 114.3 | 105.9 | ||||||||
| Proceeds from the sale of assets | 5.8 | 2.2 | 3.6 | ||||||||
| Net cash (used in) provided by investing activities | (127.8 | ) | 4.9 | (61.9 | ) | ||||||
| CASH FLOW FROM FINANCING ACTIVITIES: | |||||||||||
| Floor plan borrowings—non-trade | 3,850.3 | 3,866.3 | 4,130.3 | ||||||||
| Floor plan borrowings—acquisitions | 25.1 | — | 16.7 | ||||||||
| Floor plan repayments—non-trade | (3,921.0 | ) | (3,748.3 | ) | (4,168.8 | ) | |||||
| Floor plan repayments—divestitures | — | (31.2 | ) | (44.0 | ) | ||||||
| Proceeds from borrowings | — | — | 293.1 | ||||||||
| Repayments of borrowings | (52.0 | ) | (15.2 | ) | (11.3 | ) | |||||
| Payment of debt issuance costs | — | (2.8 | ) | (2.0 | ) | ||||||
| Repurchases of common stock, including amounts associated with net share settlements of employee share-based awards | (39.6 | ) | (215.6 | ) | (312.2 | ) | |||||
| Net cash used in financing activities | (137.2 | ) | (146.8 | ) | (98.2 | ) | |||||
| Net increase (decrease) in cash and cash equivalents | 1.3 | 0.6 | (0.1 | ) | |||||||
| CASH AND CASH EQUIVALENTS, beginning of period | 3.4 | 2.8 | 2.9 | ||||||||
| CASH AND CASH EQUIVALENTS, end of period | $ | 4.7 | $ | 3.4 | $ | 2.8 | |||||
| For the Year Ended December 31, | |||||||||||||||||
| 2023 | 2022 | 2021 | |||||||||||||||
| Payment of debt issuance costs | (1.2) | (0.4) | (26.2) | ||||||||||||||
| Purchase of treasury stock | (267.7) | (287.4) | — | ||||||||||||||
| Repurchases of common stock, including amounts associated with net share settlements of employee share-based awards | (11.4) | (9.2) | (10.4) | ||||||||||||||
| Net cash provided by (used in) financing activities | 1,175.8 | (1,104.3) | 2,930.8 | ||||||||||||||
| Net (decrease) increase in cash and cash equivalents | (189.6) | 56.4 | 177.5 | ||||||||||||||
| CASH AND CASH EQUIVALENTS, beginning of period | 235.3 | 178.9 | 1.4 | ||||||||||||||
| CASH AND CASH EQUIVALENTS, end of period | $ | 45.7 | $ | 235.3 | $ | 178.9 | |||||||||||
See Note 1718 for supplemental cash flow information
See accompanying Notes to Consolidated Financial Statements
76
ASBURY AUTOMOTIVE GROUP, INC.
NOTES TO CONSOLIDATED FINANCIAL STATEMENTS
(December 31, 2017, 2016,2023, 2022, and 2015)2021)
1. DESCRIPTION OF BUSINESS AND SUMMARY OF SIGNIFICANT ACCOUNTING POLICIES
As of December 31, 20172023, we owned and operated 94208 new vehicle franchises (80(158 vehicle dealership locations), representing 2931 brands of automobiles, and 2437 collision centers in 17 metropolitan markets, within nine16 states. Our stores offer an extensive range of automotive products and services, including new and used vehicles,vehicles; parts and service, which includes repair and maintenance services, replacement parts and collision repair services (collectively referred to as "parts and services" or "P&S"); and finance and insurance products. As("F&I") products, including arranging vehicle financing through third parties and aftermarket products, such as extended service contracts, guaranteed asset protection ("GAP") debt cancellation and prepaid maintenance. The finance and insurance products are provided by independent third parties and Total Care Auto, Powered by Landcar ("TCA"). The Company manages its operations in two reportable segments: Dealerships and TCA.
On December 11, 2023, the Company completed the acquisition of December 31, 2017, oursubstantially all of the assets, including all real property and businesses of the Jim Koons Dealerships ("Koons") pursuant to a Purchase and Sale Agreement with various entities that comprise the Jim Koons automotive dealerships group (the "Koons acquisition") for an aggregate purchase price of approximately $1.50 billion, which includes $256.1 million of new vehicle revenue brand mix consistedfloor plan financing and $103.8 million of 46% imports, 34% luxury,assets held for sale related to Koons Lexus of Wilmington.The acquisition was funded with borrowings under Asbury’s existing credit facility and 20% domestic brands.cash on hand. The Koons acquisition comprised 20 new vehicle dealerships and six collision centers. See Note 3 "Acquisitions and Divestitures" for details of the Koons acquisition.
Our operating results are generally subject to seasonal variations. Demand for new vehicles is generally highest during the second, third, and fourth quarters of each year and, accordingly, we expect our revenues to generally be higher during these periods. In addition, we typically experience higher sales of luxury vehicles in the fourth quarter, which have higher average selling prices and gross profit per vehicle retailed. Revenues and operating results may be impacted significantly from quarter to quarter by changing economic conditions, inventory availability, vehicle manufacturer incentive programs, or adverse weather events.
Basis of Presentation
The accompanying consolidated financial statements have been prepared in accordance with accounting principles generally accepted in the United States of America ("GAAP"), and reflect the consolidated accounts of Asbury Automotive Group, Inc. (the "Company") and our wholly owned subsidiaries. All intercompany transactions have been eliminated in consolidation. In addition, certainIf necessary, reclassifications of amounts previously reported have been made to the accompanying Consolidated Financial Statementsconsolidated financial statements in order to conform to current presentation. Amounts presented have been calculated using non-rounded amounts for all periods presented and therefore certain amounts may not compute or tie to prior year financial statements due to rounding.
Use of Estimates
The preparation of financial statements in conformity with GAAP requires management to make estimates and assumptions that affect the reported amounts of assets and liabilities, disclosures of contingent assets and liabilities as of the date of the financial statements, and the reported amounts of revenues and expenses during the periods presented. Actual results could differ materially from these estimates. Estimates and assumptions are reviewed quarterly, and the effects of any revisions are reflected in the consolidated financial statements in the period they are determined to be necessary. Significant estimatesEstimates made in the accompanying consolidated financial statements include, but are not limited to, those relating to inventory valuation reserves, reserves for chargebacks against revenue recognized from the sale of finance and insurance products, reserves for insuranceself-insurance programs, and certain assumptions related to goodwill and dealership franchise rights intangible and long-lived assets, and reserves for certain legal or similar proceedings relating to our business operations.assets.
Cash and Cash Equivalents
Cash and cash equivalents include investments in money market accounts and short-term certificates of deposit, which have maturity dates of less than 90 days when purchased.
77
Restricted Cash and Securities
TCA places securities on statutory deposit with certain state agencies to retain the right to do business in those states. Securities held on deposit with various state regulatory authorities had a fair value of $3.5 million at December 31, 2023. These securities are reflected in investments in our consolidated balance sheets.
Short-Term Investments
Short-term investments consist of debt securities that are callable or have a maturity date within the next 12 months and are classified as current assets. Debt securities classified as short-term investments are designated as available-for-sale as management intends to hold these securities for indefinite periods of time or may sell the securities in response to changes in interest rates, prepayments, or other similar factors. Available-for-sale debt securities are reported at fair market value with any unrealized gain or loss, net of applicable income tax, reported in other comprehensive income, as a separate component of shareholders’ equity. Premiums and discounts on debt securities classified as short-term investments are amortized or accreted using the effective interest method over the period from the purchase date to the expected maturity or call date of the related security and are reported in net income.
Investments
Investments consist of available-for-sale debt securities, equity securities, and other investments. These securities are classified as non-current investments as they are not intended to fund current operations or have stated call dates or maturity dates beyond the next 12 months. Equity securities may consist of both preferred stock and common stock.
Debt securities classified as non-current investments are designated as available-for-sale as management intends to hold these securities for indefinite periods of time or may sell the securities in response to changes in interest rates, prepayments, or other similar factors. Available-for-sale debt securities included in non-current investments are reported at fair market value with any unrealized gain or loss, net of applicable income tax, reported in other comprehensive income, as a separate component of shareholders’ equity. Premiums and discounts on debt securities included in non-current investments are amortized or accreted, as applicable, using the effective interest method over the period from the purchase date to the expected maturity or call date of the related security and are reported in net income.
Equity securities included in non-current investments are reported at fair market value with the change in value, during the reporting period, recognized in net income.
We review the debt securities portfolio at the security level on a quarterly basis for potential credit losses, which takes into consideration numerous factors. Some factors evaluated include changes in credit ratings, financial conditions of the issuer, recent payment activity, and other industry specific economic conditions. If a security is considered to have a potential credit loss, we compare the present value of expected cash flows to the amortized cost basis of the security to estimate the allowance for credit losses. The amount of the allowance is limited to the gross unrealized loss on an individual security. An unrealized loss on a debt security is generally considered to not be related to credit when the fair value of the security is below the carrying value of the security primarily due to changes in risk-free interest rates and when there has not been a significant deterioration in the financial condition of the issuer. If the Company no longer has the intent or ability to hold a security in an unrealized loss position until recovery of the security’s cost basis, a loss is realized immediately in net income.
Contracts-In-Transit
Contracts-in-transit represent receivables from third-party finance companies for the portion of new and used vehicle purchase price financed by customers through sources arranged by us.
Inventories
Inventories are stated at the lower of cost and net realizable value. We use the specific identification method to value vehicle inventories and parts and accessories are valued at the "first-in, first-out" method ("FIFO") to account for our parts inventories.lower of cost or net realizable value. Our new vehicle sales histories have indicatedhistory indicates that the vast majority of the new vehicles we sell are sold for, or in excess of, our cost to purchase those vehicles. Therefore, we generally do not maintain a reserve for new vehicle inventory. We maintain a reserve for used vehicle inventory where cost basis exceeds net realizable value. In assessing lower of cost and net realizable value for used vehicles, we consider (i) the aging of our used vehicles, (ii) historical sales experience of used vehicles, and (iii) current market conditions and trends in used vehicle sales. We also review and consider the following metrics related to used vehicle sales (both on a recent and longer-term historical basis): (i) days of supply in our used vehicle inventory, (ii) used vehicle units sold at less than original cost as a percentage of total used vehicles sold, and (iii) average vehicle selling price of used vehicle units sold at less than original cost. We then determine the appropriate level of reserve required to reduce our used vehicle inventory to the lower of cost and net realizable value, and record the resulting adjustment in the period in which we determine a loss has occurred.
78
We receive assistance from certain automobile manufacturers in the form of advertising and floor plan interest credits. Manufacturer advertising credits that are reimbursements of costs associated with specific advertising programs are recognized as a reduction of advertising expense in the period they are earned. All other manufacturer advertising and certain floor plan interest credits are accounted for as purchase discounts, and are recorded as a reduction of inventory and recognized as a reduction to New Vehicle Costnew vehicle cost of Salessales in the accompanying Consolidated Statementsconsolidated statements of Incomeincome in the period the related vehicle is sold. Certain floor plan interest credits are reflected as a reduction in floor plan interest expense in the accompanying consolidated statements of income.
Property and Equipment
Property and equipment are recorded at cost and depreciated using the straight-line method over their estimated useful lives. Depreciation is included in Depreciationdepreciation and Amortizationamortization on the accompanying Consolidated Statementsconsolidated statements of Income.income. Leasehold improvements are capitalized and amortized over the lesser of the life of theremaining lease term or the useful life of the related asset. The ranges of estimated useful lives are as follows (in years):
| Buildings and improvements | 10-40 | ||||
| Machinery and equipment | 5-10 | ||||
| Furniture and fixtures | 3-10 | ||||
| Company vehicles | 3-5 | ||||
Expenditures for major additions or improvements, which extend the useful lives of assets, are capitalized. Minor replacements, maintenance and repairs, which do not improve or extend the lives of such assets, are expensed as incurred. We capitalize interest on borrowings during the active construction period of capital projects. Capitalized interest is added to the cost of the assets and is depreciated over the estimated useful lives of the assets.
We review property and equipment for impairment whenever events or changes in circumstances indicate the carrying value may not be recoverable. When we test our long-lived assets for impairment, we first compare the carrying amount of the underlying assets to their net recoverable value by reviewing the undiscounted cash flows expected from the use and eventual disposition of the underlying assets. If the carrying amount of the underlying assets is less than their net recoverable value, then we calculate an impairment equal to the excess of the carrying amount over the fair market value, and the impairment loss would be charged to operations in the period identified. AsDuring the year ended December 31, 2023, we recorded a result of$1.1 million impairment tests conductedcharge included in 2017, 2016,selling, general and 2015, weadministrative expenses related to construction in progress. We did not record an impairment ofcharge related to our property and equipment.equipment in 2022 and 2021.
Acquisitions
Acquisitions are accounted for under the acquisition method of accounting and the assets acquired and liabilities assumed are recorded at their fair value at the acquisition date. The resultsResults of operations of acquired businesses, which are primarily dealerships, are included in theour accompanying Consolidated Statementsconsolidated statements of Income,income commencing on the date of acquisition. Our acquisitions are accounted for such that the assets acquired and liabilities assumed are recognized at their acquisition date fair values, with any excess of the consideration transferred over the estimated fair values of the identifiable net assets acquired recorded as goodwill. Goodwill is an asset representing operational synergies and future economic benefits arising from other assets acquired in a business combination that are not individually identified and separately recognized. Upon the completion of purchase accounting, the fair value of our manufacturer franchise rights are determined as of the acquisition date, by discounting the projected cash flows specific to each franchise. Included in this analysis are market participant assumptions related to the cash flows directly attributable to the franchise rights, including year-over-year and terminal growth rates, working capital requirements, weighted average cost of capital, future gross margins, and future selling, general, and administrative expenses.
Goodwill and Other Intangible AssetsFranchise Rights
Goodwill represents the excess cost of an acquired business over the estimated fair market value of its identifiable net assets. We have determined that, based on how we integrate acquisitions into our business, how the components of our business share resources and interact with one another, and how we review the results of our operations, that we have several geographic market-based operating segments.segments which consist of our dealerships. We have determined that the dealerships in each of our operating segments are components that are aggregated into several geographic market-based reporting units for the purpose of testing goodwill for impairment, as they (i) have similar economic characteristics, (ii) offer similar products and services (all of our dealerships offer new and used vehicles, service, parts and third-party finance and insurance products), (iii) have similar
79
customers, (iv) have similar distribution and marketing practices (all of our dealerships distribute products and services through dealership facilities that market to customers in similar ways), and (v) operate under similar regulatory environments. Our dealership operating segments are aggregated into our single dealerships reportable segment. Goodwill associated with TCA is tested for impairment at the operating segment level which is the same as the reporting unit for this business.
Goodwill and manufacturer franchise rights are deemed to have indefinite lives and therefore are not subject to amortization. We review goodwill and manufacturer franchise rights for impairment annually as of October 1st, or more often if events or circumstances indicate that impairment may have occurred. We are subject to financial statement risk to the extent that goodwill becomes impaired due to decreases in the fair value of our automotive retail business or manufacturer franchise rights become impaired due to decreases in the fair value of our individual franchises.
Our identifiable intangible assets, other than goodwill, are our rights under franchise agreements with manufacturers, which are recorded at an individual franchise level, and the value of business acquired ("VOBA") which is recorded at the TCA segment level. We recorded VOBA of $5.6 million in connection with the acquisition of TCA. VOBA reflects the estimated fair value of the expected future profits in unearned premium for in-force service contracts acquired in the LHM acquisition. VOBA is reflected in other long-term assets within the consolidated balance sheets and is amortized over 5 years, which represents the approximate term of the underlying contracts.
Debt Issuance Costs
Debt issuance costs are presented as a contra-liability within Current Maturitiescurrent maturities of Long-Term Debtlong-term debt or Long-Term Debtlong-term debt on our Consolidated Balance Sheets,consolidated balance sheets, except for debt issuance costs associated with our line-of-credit arrangements, which are presented as an asset within Other Current Assetsother current assets or Other Long-Term Assetsother long-term assets on our Consolidated Balance Sheets.consolidated balance sheets. Debt issuance costs are amortized to Floor Plan Interest Expensefloor plan interest expense and Other Interest Expense,other interest expense, net in the accompanying Consolidated Statementsconsolidated statements of Incomeincome through maturity using the effective interest method.method or the straight-line method for our line-of-credit arrangements.
Derivative Instruments and Hedging Activities
From time to time, we utilize derivative financial instruments to manage our interest rate risk. The types of risks hedged are those relating to the variability of cash flows caused by fluctuations in interest rates. We document our risk management strategy and assess hedge effectiveness at each interest rate swapsswap's inception and during the term of each hedge. Derivatives are reported at fair value on the accompanying Consolidated Balance Sheets.consolidated balance sheets.
The effective portion of the gain or losschanges in fair value on our hedges is reported as a component of Accumulated Other Comprehensive Lossaccumulated other comprehensive loss on the accompanying Consolidated Balance Sheets,consolidated balance sheets, and reclassified to Swap Interest Expenseother interest expense, net in the accompanying Consolidated Statementsconsolidated statements of Incomeincome in the period during which the hedged transaction affects earnings.
We are self-insured for most of our employee medical claims and maintain stop lossstop-loss insurance for large-dollar individual claims. We have high deductible insurance programs for workers compensation, property and general liability claims. We maintain and review our claim and loss history to assist in assessing our expected future liability for these claims. We also use professional service providers, such as account administrators and actuaries, to help us accumulate and assess this information. Provisions for retained losses and deductibles are made by charges to expense based upon periodic evaluations of the estimated ultimate liabilities on reported and unreported claims.
Revenue Recognition
We recognize revenue in accordance with ASC 606, Revenue from Contracts with Customers ("Topic 606"). Under that guidance, the transaction price is attributed to the underlying performance obligations in the contract and revenue is deferred and recognized as income as the Company satisfies the performance obligations in the contract. Incremental costs of obtaining a contract with a customer are capitalized and amortized to the extent that the Company expects to recover those costs. The Company satisfies performance obligations either over time or at a point in time as discussed in further detail below. Revenue is
80
recognized at the time the related performance obligation is satisfied by transferring a promised good or performing a service. Sales and other taxes we collect, concurrent with revenue-producing activities, are excluded from revenue.
New vehicle and used vehicle retail
Revenue from the sale of new and used vehicles (which excludes sales tax) is recognized uponwhen the latestterms of delivery,the customer contract are satisfied which generally occurs with the signing of the sales contract and transfer of control of the vehicle to the customer. Payment is generally received at the time of sale or approvalfrom a third-party financial institution within a short period of financing. Revenuetime following the sale of the vehicle. Amounts due from third-party financial institutions are reflected in contracts-in-transit or vehicle receivables within accounts receivable, net on our consolidated balance sheets. Costs associated with incidental items that are immaterial in the context of the contract are accrued at the time of sale.
Used vehicle wholesale
Proceeds from the sale of these vehicles are recognized in used vehicle revenue upon transfer of control to end-users at auction.
Sale of vehicle parts service and collision repair work (which excludes sales tax)accessories
The Company recognizes revenue upon transfer of control to the customer which occurs at a point in time. Payment is recognized upon deliverytypically received when control of the parts and accessories transfers to the customer or atwithin 30 days of such time. When the Company performs shipping and handling activities after the transfer of control to the customer (e.g., when control transfers prior to delivery), they are considered as fulfillment activities, and accordingly, the costs are accrued when the related revenue is recognized.
Vehicle repair and maintenance services
The Company provides vehicle repair and maintenance services to its customers pursuant to the terms and conditions included within the customer contract ("repair order"). Payment for services are typically received upon completion of the services or within 30 days following the completion of the services. Satisfaction of this performance obligation creates an asset with no alternative use for which an enforceable right to payment for performance to date exists within our contractual agreements. As such, the Company recognizes revenue over time vehicle service oras the Company satisfies its performance obligation. Additionally, the Company has determined that parts and labor are not individually distinct in the context of a repair work is completed, as applicable. Manufacturer incentivesorder and rebates, including manufacturer holdbacks, floor plan interest assistance and certain advertising assistance, are recognizedtherefore treated as a reductionsingle performance obligation. Certain of New Vehicle Cost of Sales atthese services are provided by the timeDealerships segment to TCA customers in connection with claims related to TCA's vehicle protection products. Revenues recorded by the related vehiclesDealerships segment and the associated claims expense recorded by the TCA segment are sold, ineliminated upon consolidation.
Finance and Insurance, net
Within the accompanying Consolidated Statements of Income.
The dealerships commission arrangements with TCA, third-party lenders and insurance administrators consists of fixed ("upfront") and variable consideration. Variable consideration includes commission chargebacks ("chargebacks") in the event a contract is prepaid, defaulted upon, or terminated ("chargebacks"). F&I commissions are recorded atby the time a vehicle is sold and a reserveend-user. The Company reserves for future chargebacks is established based on historical chargeback experience and the termination provisions of the applicable contract.contract, and these reserves are established in the same period that the related revenue is recognized. Commissions revenue and related reserves for future chargebacks in connection with the sale of TCA F&I commissions, net of estimated future chargebacks,products by our dealerships, are includedeliminated in Finance and Insurance, net in the accompanying Consolidated Statements of Income. Additionally, weconsolidation.
We also participate in future profits associated with the performance of the third-party held underlying portfolio for certain products, pursuant to retrospective commission arrangements. Our retrospective portfolioarrangements, which meet the definition of variable consideration, for certain insurance products associated with a third-party portfolio. The Company estimates the amount of variable consideration to be included in the transaction price based on historical payment trends and further constrains the variable consideration such that it is probable that a significant reversal of previously recognized revenue will not occur. In making these assessments the Company considers the likelihood and magnitude of a potential reversal of revenue and updates its assessment when uncertainties associated with the constraint are removed.
81
Within our TCA segment, all revenue, other than investment and interest income, is recordedthe result of contracts with customers. Each contract is considered to have a single performance obligation which extends over the life of the contract. Revenue is recognized ratably over the contract term based on earnings factors that align with the performance obligation. We capitalize costs to obtain customer contracts, employee sales commissions, and amortize those costs over the estimated life of the contract. Amortization of costs to obtain customer contracts is included in selling, general and administrative expenses. The portion of commissions that are paid to affiliated dealerships are eliminated upon consolidation. Unearned premium reserves are established to cover the unexpired portion of premiums written.
Deferred Revenue
We earn and recognize premium revenue related to the TCA segment over the period of the related service contract. Accordingly, we record deferred revenue as we ratably recognize revenue atover the time itservice contract period.
Unpaid Losses and Loss Adjustment Expense Reserve
Losses and loss adjustment expense reserves represent management's best estimate of the ultimate net cost of all reported and unreported losses incurred through December 31, 2023. The Company does not discount liabilities for unpaid losses or unpaid loss adjustment expense reserves. The reserves for unpaid losses and loss adjustment expenses are estimated using individual case-basis valuation and statistical analysis. Those estimates are subject to the effects of trends in loss severity and frequency. Although considerable variability is receivedinherent in such estimates, management believes the reserves for losses and loss adjustment expenses are adequate. The estimates are continually reviewed and adjusted as necessary as experience develops or new information becomes known; such adjustments are included in income from our third-party providers.operations.
Claims are counted when incidents that may result in a liability are reported and are based on policy coverage.
Internal Profit
Revenues and expenses associated with internal work performed by our parts and service departments on new and used vehicle inventory are eliminated in consolidation. The gross profit earned by our parts and service departments for internal
work performed is included as a reduction of Partsparts and Service Costservice cost of Salessales on the accompanying Consolidated Statementsconsolidated statements of Incomeincome upon the sale of the vehicle. The costs incurred by our new and used vehicle departments for work performed by our parts and service departments is included in either New Vehicle Costnew vehicle cost of Salessales or Used Vehicle Costused vehicle cost of Salessales on the accompanying Consolidated Statementsconsolidated statements of Income,income, depending on the classification of the vehicle serviced. We maintain a reserve to eliminate the internal profit on vehicles that have not been sold.remain in inventory at period end.
Intersegment Elimination
TCA's vehicle protection products are sold through affiliated dealerships and the revenue from the related commissions are included in finance and insurance, net revenues in the Dealerships segment before consolidation. The corresponding claims expense incurred and the amortization of deferred acquisition costs is recorded as a cost of sales in the TCA segment. The Dealerships segment also provides vehicle repair and maintenance services to TCA customers in connection with claims related to TCA's vehicle protection products. Revenues recorded by the Dealerships segment and the associated claims expense recorded by the TCA segment are eliminated upon consolidation. Intersegment revenues and profits from contracts and services are eliminated in consolidation. See Note 20 "Segment Information" for further details.
Share-Based Compensation
We record share-based compensation expense under the fair value method on a straight-line basis over the vesting period, unless the awards are subject to performance conditions, in which case we recognize the expense over the requisite service period of each separate vesting tranche. In addition, we account for the forfeiture of share-based awards as they occur.
Share Repurchases
Share repurchases may be made from time-to-time in open market transactions or through privately negotiated transactions under the authorization approved by the Board of Directors. Periodically, the Company may retire repurchased shares of common stock previously held by the Company as treasury stock. In accordance with our accounting policy, we allocate any excess share repurchase price over par value between additional paid-in capital, which is limited to amounts initially recorded for the same issue, and retained earnings.
During the year ended December 31, 2023 and 2022, the Company repurchased 1,316,167 and 1,635,030 and retired 1,370,371 and 1,580,826 shares of our common stock under our share repurchase program, respectively. The Company did not repurchase any shares under the repurchase program or retire any treasury shares during 2021. On May 25, 2023, our Board of
82
Directors approved a new authorization to repurchase up to $250.0 million of the Company's common stock (the "New Share Repurchase Authorization"), which replaces our previous share repurchase authorization. As of December 31, 2023, the Company had $202.6 million remaining on its share repurchase authorization.
Earnings per Common Share
Basic earnings per common share is computed by dividing net income by the weighted-average common shares outstanding during the period. Diluted earnings per common share is computed by dividing net income by the weighted-average common shares and common share equivalents outstanding during the period. For all periods presented, there were no adjustments to the numerator necessary to compute diluted earnings per share.
Advertising
We expense costs of advertising as incurred and production costs when the advertising initially takes place, net of certain advertising credits and other discounts received from certain automobile manufacturers. Advertising expense from continuing operations totaled $30.3$47.5 million, $34.0$50.1 million, and $40.1$30.7 million for the years ended December 31, 2017, 20162023, 2022, and 2015,2021, which was net of earned advertising credits of $18.0$36.5 million, $16.8$35.5 million, and $17.1$22.4 million, respectively, and is included in Selling, General,selling, general, and Administrativeadministrative expense in the accompanying Consolidated Statementsconsolidated statements of Income.income.
Income Taxes
We use the liability method to account for income taxes. Under this method, deferred tax assets and liabilities are recognized for the expected future tax consequences of differences between the carrying amounts of assets and liabilities and their respective tax basis using currently enacted tax rates. The effect on deferred tax assets and liabilities of a change in tax rates is recognized in income in the period when the change is enacted. Deferred tax assets are reduced by a valuation allowance when it is more likely than not that some portion or all the deferred tax assets will not be realized.
Assets Held for Sale and Liabilities Associated with Assets Held for Sale
Certain amounts have been classified as Assets Heldassets held for Salesale as of December 31, 20172023 and 20162022 in the accompanying Consolidated Balance Sheets.consolidated balance sheets. Assets and liabilities classified as held for sale include assets and liabilities associated with pending dealership disposals, real estate not currently used in our operations that we are actively marketing to sell, and any related mortgage notes payable or other liabilities, if applicable. Classification as held for sale begins on the date that we have met all of the criteria for classification as held for sale.
At the time of classifying assets as held for sale, we compare the carrying value of these assets to estimates of fair value to assess for impairment. We compare the carrying value to estimates of fair value utilizing the assistance of third-party broker opinions of value and third-party desktop appraisals to assist in our fair value estimates related to real estate properties.
Statements of Cash Flows
Borrowings and repayments of floor plan notes payable to a lender unaffiliatedthrough our senior secured credit agreement with Bank of America, as administrative agent, and the manufacturer from which we purchase a particular new vehicle ("Non-Trade"other agents and lenders party thereto (as amended, the "2023 Senior Credit Facility") and all floor plan notes payable relating to pre-ownedused vehicles (together referred to as "Floor Plan Notes Payable—Non-Trade"), are classified as financing activities onin the accompanying Consolidated Statementsconsolidated statements of Cash Flows,cash flows, with borrowings reflected separately from repayments. The net change in floor plan notes payable to a lender affiliated with the manufacturer from which we purchase a particular new vehicle (collectively referred to as "Floor Plan Notes Payable—Trade") is classified as an operating activity onin the accompanying Consolidated Statementsconsolidated statements of Cash Flows.cash flows. Borrowings of floor plan notes payable associated with inventory acquired in connection with all acquisitions and repayments made in connection with all divestitures are classified as a financing activity in the accompanying
Loaner vehicles account for a significant portion of Other Current Assets.other current assets. We acquire loaner vehicles either with available cash or through borrowings from either our manufacturer affiliated lenders or through our senior secured credit agreement with Bank of America, as administrative agent, and the other agents and lenders party thereto (the "20162023 Senior Credit Facility").Facility. Loaner vehicles are initially used by our service department for only a short period of time (typically 6 to 12 months) before we seek to sell them. Therefore, we classify the acquisition of loaner vehicles in Other Current Assetsother current assets and the borrowings and repayments of loaner vehicle notes payable in Accounts Payableaccounts payable and Accrued Liabilitiesaccrued liabilities in the accompanying Consolidated Statementsconsolidated statements of Cash Flows.cash flows. Loaner vehicles are depreciated over the service period to their estimated value. At the end of the loaner service period,
83
loaner vehicles are transferred from Other Current Assetsother current assets to used vehicle inventory. These transfers are reflected as non-cash transfers between Other Current Assetsother current assets and Inventoryinventory in the accompanying Consolidated Statementsconsolidated statements of Cash Flows.cash flows.
Business and Credit Concentration Risk
Financial instruments, which potentially subject us to a concentration of credit risk, consist principally of cash deposits.deposits and investments. We maintain cash balances at financial institutions with strong credit ratings. Generally, amounts maintained with these financial institutions are in excess of FDIC insurance limits. In addition, we limit our exposure through the kind, quality and concentration of these investments. As of December 31, 2023, the Company had total investments of $332.9 million.
We have substantial debt service obligations. As of December 31, 2017,2023, we had total debt of $879.3 million, excluding$3.23 billion, which excludes floor plan notes payable, debt issuance costs, and the debt premium on the 6.0%4.5% Senior Subordinated Notes (the "4.5% Notes") and 4.75% Senior Notes (the "4.75% Notes") due 2024 ("6.0% Notes"),2028 and debt issuance costs.2030, respectively. In addition, we and our subsidiaries have the ability to obtain additional debt from time to time to finance acquisitions, real property purchases, capital expenditures, share repurchases or for other purposes, although such borrowings are subject to the restrictions contained in the secondfourth amended and restated senior secured credit agreement with Bank of America, N.A. ("Bank of America"), as administrative agent, and the other lenders party thereto (the "2016"2023 Senior Credit Facility") and, the indentureindentures governing our 6.0% Senior Subordinated4.5% Notes, due 20244.625% Notes, 4.75% Notes and 5.0% Notes (the "Indenture""Indentures")., and our other debt instruments. We will have substantial debt service obligations, consisting of required cash payments of principal and interest, for the foreseeable future.
We are subject to operating and financial restrictions and covenants in certain of our leases and in our debt instruments, including the 20162023 Senior Credit Facility, the Indenture,Indentures, and the credit agreements covering our mortgage obligations. These agreements contain restrictions on, among other things, our ability to incur additional indebtedness, to create liens or other encumbrances, and to make certain payments (including dividends and repurchases of our shares and investments). These agreements may also require us to maintain compliance with certain financial and other ratios. Our failure to comply with any of these covenants in the future would constitute a default under the relevant agreement, which would, depending on the relevant agreement, (i) entitle the creditors under such agreement to terminate our ability to borrow under the relevant agreement and accelerate our obligations to repay outstanding borrowings; (ii) require us to apply our available cash to repay these borrowings; (iii) entitle the creditors under such agreement to foreclose on the property securing the relevant indebtedness; and/or (iv) prevent us from making debt service payments on certain of our other indebtedness, any of which would have a material adverse effect on our business, financial condition or results of operations. In many cases, a default under one of our debt or mortgage agreements could trigger cross-default provisions in one or more of our other debt or mortgages.
A number of our dealerships are located on properties that we lease. Each of the leases governing such properties has certain covenants with which we must comply. If we fail to comply with the covenants under our leases, the respective landlords could terminate the leases and seek damages from us.
Concentrations of credit risk with respect to contracts-in-transit and accounts receivable are limited primarily to automotive manufacturers and financial institutions. Credit risk arising from receivables fromwith commercial customers is minimal due to the large number of customers comprising our customer base.
A significant portion of our new vehicle sales are derived from a limited number of automotive manufacturers. For the year ended December 31, 2017,2023, manufacturers representing 5% or more of our revenues from new vehicle sales were as
follows:
| Manufacturer (Vehicle Brands): | % of Total New Vehicle Revenues | ||||||||
Toyota Motor Sales, U.S.A., Inc. (Toyota and Lexus) | 27 | % | |||||||
Stellantis N.V. (Chrysler, Dodge, Jeep, Ram and Fiat) | 12 | % | |||||||
American Honda Motor Co., Inc. (Honda and Acura) | 12 | % | |||||||
Ford Motor Company (Ford and Lincoln) | 11 | % | |||||||
Mercedes-Benz USA, LLC (Mercedes-Benz | 9 | % | |||||||
| 6 | % | ||||||||
Hyundai Motor North America | 5 | ||||||||
No other manufacturers individually accounted for more than 5% of our total new vehicle revenue for the year ended December 31, 2017.2023.
84
Recent Accounting Pronouncements
In November 2023, the FASB issued Accounting StandardStandards Update ("ASU") 2016-09, Compensation—Stock Compensation (Topic 718)2023-07, Segment Reporting: Improvements to Reportable Segment Disclosures ("ASU 2023-07"), to simplify certain aspects ofwhich enhances the accounting for share-based payment transactions to employees. The new standard requires excess tax benefits and tax deficiencies to be recorded in the statements of income as a component of the provision for income taxes when stock awards vest or are settled.disclosures primarily around segment expenses. In addition, it eliminates the requirement to reclassify cash flows related to excess tax benefits from operating activities to financing activities onamendments expand the consolidated statementsscope of cash flows.quarterly financial reporting by requiring disclosure of both existing annual segment reporting disclosures and the expanded disclosures outlined in ASU 2023-07. The standard also provides an accounting policy election to account for forfeitures as they occur, allows us to withhold more of an employee’s vesting shares for tax withholding purposes without triggering liability accounting, and clarifies that all cash payments made to tax authorities on an employee’s behalf for withheld sharesguidance should be presented as a financing activity on our statements of cash flows.
In March 2020, the FASB issued ASU 2020-04, Reference Rate Reform (Topic 848): Facilitation of the Effects of Reference Rate Reform on Financial Reporting ("ASU 2020-04"). In January 2021, the FASB issued ASU 2021-01, Reference Rate Reform (Topic 848): Scope, which clarified the scope and application of the original guidance. The guidance in these standards apply to contract accounting, hedging relationships, and other transactions affected by reference rate reform if certain criteria are met, and provides optional expedients and exceptions for a limited time to ease the potential burden in accounting for reference rate reform. The amendments apply only to contracts and hedging relationships that reference LIBOR or another reference rate expected to be discontinued due to reference rate reform. ASU 2020-04 is effective upon issuance and generally can be applied to applicable contract modifications through December 31, 2022. LIBOR benchmarking was utilized in our debt (including mortgages), revolving credit facilities, floorplan facilities, and interest rate swaps.
During the quarter ended June 30, 2022, we amended our LIBOR-based debt arrangements and related hedging financial instruments to revise their interest basis from LIBOR to a Secured Overnight Financing Rate ("SOFR"). See Note 14 "Debt" for further details. The impact of these amendments to our debt arrangements and related interest rate swap derivative agreements, along with the adoption of the provisions from this standard, did not have a material impact on our consolidated financial statements.
85
2. REVENUE RECOGNITION
Disaggregation of Revenue
Revenue from Contractscontracts with Customers (Topic 606), a new standard on revenue recognition. Further,customers consists of the FASB has issued a number of additional ASUs regardingfollowing:
| For the year ended December 31, | |||||||||||||||||
| 2023 | 2022 | 2021 | |||||||||||||||
| (In millions) | |||||||||||||||||
| Revenue: | |||||||||||||||||
| New vehicle | $ | 7,630.7 | $ | 7,365.6 | $ | 4,934.1 | |||||||||||
| Used vehicle retail | 4,017.5 | 4,828.8 | 3,055.9 | ||||||||||||||
| Used vehicle wholesale | 396.7 | 368.3 | 259.7 | ||||||||||||||
| New and used vehicle | 12,045.0 | 12,562.6 | 8,249.7 | ||||||||||||||
| Sale of vehicle parts and accessories | 496.3 | 510.2 | 212.0 | ||||||||||||||
| Vehicle repair and maintenance services | 1,585.3 | 1,564.1 | 970.9 | ||||||||||||||
| Parts and services | 2,081.5 | 2,074.2 | 1,182.9 | ||||||||||||||
| Finance and insurance, net | 676.2 | 797.0 | 405.1 | ||||||||||||||
| Total revenue | $ | 14,802.7 | $ | 15,433.8 | $ | 9,837.7 | |||||||||||
Contract Assets
Changes in contract assets during the new revenue recognition
| Vehicle Repair and Maintenance Services | Finance and Insurance, net | Deferred Sales Commissions | Total | ||||||||||||||||||||
| (In millions) | |||||||||||||||||||||||
| Contract Assets, December 31, 2021 | $ | 12.3 | $ | 13.5 | $ | 1.4 | $ | 27.2 | |||||||||||||||
| Transferred to receivables from contract assets recognized at the beginning of the period | (12.3) | (13.5) | — | (25.8) | |||||||||||||||||||
| Amortization of costs incurred to obtain a contract with a customer | — | — | (4.6) | (4.6) | |||||||||||||||||||
| Costs incurred to obtain a contract with a customer | — | — | 40.3 | 40.3 | |||||||||||||||||||
| Increases related to revenue recognized, inclusive of adjustments to constraint, during the period | 14.7 | 14.7 | — | 29.4 | |||||||||||||||||||
| Contract Assets, December 31, 2022 | $ | 14.7 | $ | 14.7 | $ | 37.2 | $ | 66.6 | |||||||||||||||
| Transferred to receivables from contract assets recognized at the beginning of the period | (14.7) | (14.7) | — | (29.4) | |||||||||||||||||||
| Amortization of costs incurred to obtain a contract with a customer | — | — | (12.2) | (12.2) | |||||||||||||||||||
| Costs incurred to obtain a contract with a customer | — | — | 43.3 | 43.3 | |||||||||||||||||||
| Increases related to revenue recognized, inclusive of adjustments to constraint, during the period | 20.5 | 13.8 | — | 34.3 | |||||||||||||||||||
| Contract Assets, December 31, 2023 | $ | 20.5 | $ | 13.8 | $ | 68.4 | $ | 102.7 | |||||||||||||||
| Contract Assets (current), December 31, 2023 | $ | 20.5 | $ | 13.8 | $ | 19.5 | $ | 53.8 | |||||||||||||||
| Contract Assets (long-term), December 31, 2023 | $ | — | $ | — | $ | 48.9 | $ | 48.9 | |||||||||||||||
86
Contract Liabilities
The consolidated balance sheet reflects $736.7 million and $713.9 million in deferred revenue as well asof December 31, 2023 and 2022, respectively. Approximately $227.9 million of deferred revenue associated with arranging the sale of certainat December 31, 2022 was recorded in finance and insurance, products to be affected by the new standard.
3. ACQUISITIONS AND DIVESTITURES
On December 11, 2023, we completed the acquisition of acquired dealerships arethe Jim Koons Dealerships. The results of the Jim Koons Dealerships have been included in our accompanying Consolidated Statementsconsolidated financial statements since that date. The Koons acquisition diversifies Asbury's geographic mix, with expansion in the greater Washington-Baltimore region of Income commencing on the dateUnited States.
As a result of acquisition. Our acquisitionsthe Koons acquisition, we acquired 20 new vehicle dealerships, six collision centers and the real property related thereto, for a total purchase price of approximately $1.50 billion, which includes $256.1 million of new vehicle floor plan financing and $103.8 million of assets held for sale related to Koons Lexus of Wilmington. The preliminary purchase price was paid in cash.
The sources of the preliminary purchase consideration are accounted for usingas follows:
| (In millions) | |||||
| Cash | $ | 936.8 | |||
| New vehicle floor plan facility | 256.1 | ||||
| Used vehicle floor plan facility | 307.1 | ||||
| Preliminary purchase price | $ | 1,500.0 | |||
Under the acquisition method of accounting, which requires, among other things, thatthe tangible and intangible assets acquired and liabilities assumed are recorded at their estimated fair value based on information currently available. The following table summarizes the amounts recorded based on preliminary estimates of fair value:
| Summary of Assets Acquired and Liabilities Assumed | |||||
| (In millions) | |||||
| Assets | |||||
| Inventories, net | $ | 311.6 | |||
| Other current assets | 10.3 | ||||
| Assets held for sale | 103.8 | ||||
| Total current assets | 425.7 | ||||
| Property and equipment, net | 420.0 | ||||
| Goodwill | 231.7 | ||||
| Intangible franchise rights | 429.0 | ||||
| Operating lease right-of-use assets | 11.2 | ||||
| Total assets acquired | $ | 1,517.6 | |||
| Liabilities | |||||
| Operating lease liabilities | $ | 11.2 | |||
| Other liabilities | 6.4 | ||||
| Total liabilities assumed | 17.6 | ||||
| Net assets acquired | $ | 1,500.0 | |||
The preliminary acquisition accounting is based upon the Company’s estimates of fair value. The estimated fair values of the assets acquired and liabilities assumed beand the related preliminary acquisition accounting are based on management’s estimates and assumptions, as well as other information compiled by management, including the books and records of Koons. Our estimates and assumptions are subject to change during the measurement period, not to exceed one year from the acquisition date. The areas of acquisition accounting that are not yet finalized primarily relate to the following significant items: (i) finalizing the review and valuation of inventory, land, land improvements, buildings and non-real property and equipment (including the models, key assumptions, estimates and inputs used) and assignment of remaining useful lives associated with
87
the depreciable assets, and (ii) finalizing the review and valuation of manufacturer franchise rights (including key assumptions, inputs and estimates). As the initial acquisition accounting is based on our preliminary assessments, actual values may differ (possibly materially) when final information becomes available that differs from our current estimates. Additionally, the total consideration transferred is subject to certain post-close adjustments. We believe that the information gathered to date provides a reasonable basis for estimating the preliminary fair values of assets acquired and liabilities assumed. We will continue to evaluate these items until they are satisfactorily resolved and adjust our acquisition accounting accordingly, within the allowable measurement period.
Approximately $429.0 million of the purchase price was assigned to the indefinite lived franchise rights intangible assets related to the dealer agreements applicable to each new vehicle dealership. In addition, goodwill of $231.7 million was recognized and is primarily attributable to the anticipated synergies that Asbury expects to derive from the Koons acquisition as well as the acquired assembled workforce of the Koons dealerships.
The Company recorded $4.1 million of acquisition related costs during the year ended December 31, 2023. These costs are included in selling, general, and administrative in the consolidated statements of income.
The Company's consolidated statements of income included revenue and net income attributable to the Jim Koons Dealerships from December 11, 2023 through December 31, 2023 of $168.2 million and $7.0 million, respectively.
The following represents the unaudited pro forma information as if the Koons acquisition had been included in the consolidated results of the Company since January 1, 2022:
| For the Year Ended December 31, | |||||||||||
| 2023 | 2022 | ||||||||||
| (In millions) | |||||||||||
| (Unaudited) | |||||||||||
| Pro forma revenue | $ | 17,540.4 | $ | 18,516.1 | |||||||
| Pro forma net income | $ | 660.8 | $ | 1,092.9 | |||||||
The above pro forma financial information adjusts the revenue and net income related to the Koons acquisition primarily for (1) depreciation and interest expense assuming that the fair value adjustments and indebtedness incurred in connection with the Koons acquisition had occurred on January 1, 2022 and (2) the exclusion of Koons Lexus of Wilmington, which is classified as assets held for sale as of December 31, 2023. The pro forma net income for the year ended December 31, 2023 includes $117.2 million of asset impairments recorded by the Company during the fourth quarter of 2023.
LHM Acquisition
On December 17, 2021, we completed the acquisition of the equity interests of, and the real property related to the businesses of the Larry H. Miller Dealerships and TCA (the "LHM acquisition"). The results of the LHM Dealerships and TCA business have been included in the consolidated financial statements since that date. The acquisition diversified Asbury's geographic mix, with entry into six Western states; Arizona, Utah, New Mexico, Idaho, California and Washington, and added to the Company’s growing Colorado presence.
As a result of the LHM acquisition, we acquired 54 new vehicle dealerships, seven used car stores, 11 collision centers, a used vehicle wholesale business, the real property related thereto, and the entities comprising the TCA business for a total purchase price of approximately $3.48 billion. The purchase price was paid in cash.
88
The sources of the purchase consideration are as follows:
| (In millions) | |||||
| Cash, net of cash acquired | $ | 195.0 | |||
| Common stock offering | 666.9 | ||||
| Senior notes | 1,378.5 | ||||
| Revolving credit facility | 200.0 | ||||
| Real estate facility | 513.0 | ||||
| New vehicle floor plan facility | 183.5 | ||||
| Used vehicle floor plan facility | 51.0 | ||||
| Payable to sellers | 6.0 | ||||
| Purchase price, net of cash acquired | $ | 3,193.9 | |||
Under the acquisition method of accounting, the tangible and intangible assets acquired and liabilities assumed are recorded at their estimated fair value based on information currently available. The following table summarizes the amounts recorded based on final estimates of fair value:
| Summary of Assets Acquired and Liabilities Assumed | |||||
| (In millions) | |||||
| Assets | |||||
| Cash and cash equivalents | $ | 287.4 | |||
| Investments | 133.5 | ||||
| Contracts-in-transit, net | 99.5 | ||||
| Accounts receivable, net | 110.0 | ||||
| Inventories, net | 282.1 | ||||
| Other current assets | 25.0 | ||||
| Total current assets | 937.5 | ||||
| Property and equipment, net | 805.6 | ||||
| Goodwill | 1,205.3 | ||||
| Intangible franchise rights | 1,309.7 | ||||
| Operating lease right-of-use assets | 34.1 | ||||
| Deferred income taxes | 139.7 | ||||
| Other long-term assets | 5.6 | ||||
| Total assets acquired | $ | 4,437.6 | |||
| Liabilities | |||||
| Accounts payable and accrued liabilities | $ | 229.5 | |||
| Operating lease liabilities | 34.1 | ||||
| Deferred revenue | 667.6 | ||||
| Other long-term liabilities | 25.2 | ||||
| Total liabilities assumed | 956.4 | ||||
| Net assets acquired | $ | 3,481.2 | |||
The acquisition dateaccounting is based upon the Company’s estimates of fair values, with any excess of the consideration transferred over thevalue. The estimated fair values of the identifiable net assets acquired and liabilities assumed and the related acquisition accounting are based on management’s estimates and assumptions, as well as other information compiled by management, including the books and records of LHM and TCA. The effects of the measurement-period adjustments on our consolidated statement of income for the year ended December 31, 2022 were not material.
Approximately $1.31 billion of the purchase price was assigned to the indefinite lived franchise rights intangible assets related to the dealer agreements applicable to each new vehicle dealership. In addition, goodwill of $1.21 billion was recognized and is primarily attributable to the anticipated synergies that Asbury expects to derive from the LHM acquisition as
89
well as the acquired assembled workforce of LHM and TCA. Goodwill of $536.6 million was assigned to the TCA segment while $668.7 million was assigned to the Dealerships segment.
The Company recorded $4.9 million of acquisition related costs during the year ended December 31, 2021. These costs are included in selling, general, and administrative in the consolidated statements of income.
The Company's consolidated statements of income included revenue and net income attributable to LHM from December 17, 2021 through December 31, 2021 of $256.4 million and $15.7 million, respectively.
The following represents the unaudited pro forma information as goodwill. Goodwill is an asset representing operational synergiesif the LHM acquisition had been included in the consolidated results of the Company since January 1, 2020:
| For the Year Ended December 31, | |||||||||||
| 2021 | 2020 | ||||||||||
| (In millions) | |||||||||||
| (Unaudited) | |||||||||||
| Pro forma revenue | $ | 15,431.5 | $ | 12,927.3 | |||||||
| Pro forma net income | $ | 777.3 | $ | 359.9 | |||||||
This pro forma information incorporates the Company's accounting policies and future economic benefits arising from other assets acquiredadjusts the results of the LHM acquisition for depreciation, rent expense, and interest expense assuming that the fair value adjustments and indebtedness incurred in a business combination that are not individually identifiedconnection with the LHM acquisition had occurred on January 1, 2020. They have also been adjusted to reflect the $4.9 million of acquisition related costs incurred during 2021 as having occurred on January 1, 2020.
Other Acquisitions and separately recognized.Divestitures
During the year ended December 31, 2017,2022, we did not complete any dealership acquisitions.
In addition to the LHM acquisition during the year ended December 31, 2021, we acquired the assets of two11 franchises (two(10 dealership locations) in the Denver, Colorado market and one collision centerthree franchises (one dealership location) in the Indianapolis, Indiana market for a combined purchase price of $80.1$485.7 million. We financedfunded these acquisitions with $55.0an aggregate of $455.1 million of cash and $25.1$9.6 million of floor plan borrowings for the purchase of the related new vehicle inventory. We did not acquire any dealerships duringIn the year ended December 31, 2016.
On May 20, 2021, we exercised the purchase option for certain Park Place real estate leases whose original operating lease right-of-use assets and liabilities totaled $99.5 million. We acquired these acquisitions. properties for $217.1 million which was partly financed through the 2021 BofA Real Estate Facility.
Goodwill and manufacturer franchise rights associated with our Dealerships segment acquisitions will beis deductible for federal and state income tax purposes ratably over a 15-year period.
| 2017 | |||
| (In millions) | |||
| Inventory | $ | 25.9 | |
| Real estate | 12.2 | ||
| Property and equipment | 1.4 | ||
| Goodwill | 32.7 | ||
| Manufacturer franchise rights | 6.2 | ||
| Loaner and rental vehicles | 3.2 | ||
| Liabilities assumed | $ | (1.5 | ) |
| Total purchase price | $ | 80.1 | |
| As of December 31, | |||||
| 2021 | |||||
| (In millions) | |||||
| Inventory | $ | 37.5 | |||
| Real estate | 99.9 | ||||
| Property and equipment | 4.2 | ||||
| Goodwill | 110.5 | ||||
| Manufacturer franchise rights | 228.2 | ||||
| Loaner vehicles | 8.9 | ||||
| Other | (3.5) | ||||
| Total purchase price | $ | 485.7 | |||
90
During the year ended December 31, 2016,2023, we sold one franchise (one dealership location) in Austin, Texas. The Company recorded a pre-tax gain totaling $13.5 million.
During the remaining fiveyear ended December 31, 2022, we sold one franchise (one dealership location) in St. Louis, Missouri, three franchises (four(three dealership locations) and one collision center in Denver, Colorado, two franchises (two dealership locations) in Spokane, Washington, one franchise (one dealership location) in Albuquerque, New Mexico and 11 franchises (nine dealership locations) and two collision centers in the Little Rock, AR market. WeNorth Carolina. The Company recorded a pre-tax gain associated with the sale of the franchises totaling $45.5 million ($28.4 million net of tax) in our accompanying Consolidated Statements of Income.$207.1 million.
During the year ended December 31, 2015,2021, we sold two franchises (two dealership locations) in Princeton, NJ; one franchise (one dealership location) in the St. Louis, MO market; one collision center in Austin, TX; and four franchises (three dealership locations) in the Little Rock, ARCharlottesville, Virginia market. WeThe Company recorded a pre-tax gain associated with the sale of the franchises totaling $34.9 million ($21.6 million net of tax) in our accompanying Consolidated Statements of Income.$8.0 million.
4. ACCOUNTS RECEIVABLE
Accounts receivable consisted of the following:
| As of December 31, | |||||||||||
| 2023 | 2022 | ||||||||||
| (In millions) | |||||||||||
| Vehicle receivables | $ | 72.5 | $ | 50.4 | |||||||
| Manufacturer receivables | 68.0 | 43.3 | |||||||||
| Other receivables | 88.1 | 80.5 | |||||||||
| Total accounts receivable | 228.6 | 174.1 | |||||||||
| Less—Allowance for credit losses | (2.6) | (2.2) | |||||||||
| Accounts receivable, net | $ | 226.1 | $ | 171.9 | |||||||
| As of December 31, | |||||||
| 2017 | 2016 | ||||||
| (In millions) | |||||||
| Vehicle receivables | $ | 48.3 | $ | 53.2 | |||
| Manufacturer receivables | 47.0 | 45.5 | |||||
| Other receivables | 34.8 | 41.6 | |||||
| Total accounts receivable | 130.1 | 140.3 | |||||
| Less—Allowance for doubtful accounts | (1.6 | ) | (1.9 | ) | |||
| Accounts receivable, net | $ | 128.5 | $ | 138.4 | |||
5. INVENTORIES
Inventories consisted of the following:
| As of December 31, | |||||||||||||||||||||||||||||
| As of December 31, | As of December 31, | ||||||||||||||||||||||||||||
| 2017 | 2016 | 2023 | 2022 | ||||||||||||||||||||||||||
| (In millions) | (In millions) | ||||||||||||||||||||||||||||
| New vehicles | $ | 646.5 | $ | 720.6 | |||||||||||||||||||||||||
| Used vehicles | 135.9 | 132.7 | |||||||||||||||||||||||||||
| Parts and accessories | 43.6 | 41.6 | |||||||||||||||||||||||||||
| Total inventories | $ | 826.0 | $ | 894.9 | |||||||||||||||||||||||||
| Total inventories, net (a) | |||||||||||||||||||||||||||||
(a) Inventories, net as of December 31, 2023 and December 31, 2022, excluded $84.5 million and $3.4 million classified as assets held for sale, respectively.
The lower of cost and net realizable value reserves reduced total inventory cost by $5.7$8.8 million and $6.5$10.7 million, respectively as of December 31, 20172023 and December 31, 2016, respectively.2022. As of December 31, 20172023 and December 31, 2016,2022, certain automobile manufacturer incentives reduced new vehicle inventory cost by $7.4$8.3 million and $8.2$2.7 million,, respectively, and reduced new vehicle cost of sales from continuing operations for the yearsyear ended December 31, 2017, 2016,2023, 2022, and 20152021 by $40.1$94.1 million,, $40.6 $91.5 million,, and $38.8$60.4 million, respectively.
6. ASSETS HELD FOR SALE
Assets and liabilities classified as held for sale comprisinginclude (i) assets and liabilities associated with pending dealership disposals,(ii) real estate not currently used in our operations and that we are actively marketing to sell totaled $30.3 million and $16.1 million(iii) the related mortgage notes payable, if applicable.
91
A summary of assets held for sale and liabilities associated with assets held for sale is as follows:
| As of December 31, | |||||||||||
| 2023 | 2022 | ||||||||||
| (In millions) | |||||||||||
| Assets: | |||||||||||
| Inventory | $ | 84.5 | $ | 3.4 | |||||||
| Loaners, net | 4.5 | 0.9 | |||||||||
| Property and equipment, net | 136.6 | 24.0 | |||||||||
| Operating lease right-of-use assets | 2.1 | — | |||||||||
| Goodwill | 26.1 | 0.9 | |||||||||
| Franchise rights | 88.5 | — | |||||||||
| Total assets held for sale | 342.2 | 29.1 | |||||||||
| Liabilities: | |||||||||||
| Floor plan notes payable—non-trade | — | 2.8 | |||||||||
| Loaners/ Notes payable | — | 0.8 | |||||||||
| Current maturities of long-term debt | — | 0.6 | |||||||||
| Current maturities of operating leases | 0.2 | — | |||||||||
| Long-term debt | — | 6.2 | |||||||||
| Operating lease liabilities | 1.9 | — | |||||||||
| Total liabilities associated with assets held for sale | 2.1 | 10.5 | |||||||||
| Net assets held for sale | $ | 340.1 | $ | 18.7 | |||||||
As of December 31, 2017 and 2016, respectively, and there were no liabilities associated with the real estate2023, assets held for sale. Additionally, during the years endedsale consisted of 11 franchise (11 dealership locations) in addition to one real estate property not currently used in our operations.
As of December 31, 2017 and 2016, we sold two vacant properties with a total net book value2022, assets held for sale consisted of $5.7 million and one vacantfranchise (one dealership location) in addition to one real estate property with a net book value of $2.3 million, respectively.not currently used in our operations.
During the year ended December 31, 2016,2023, the Company sold one franchise (one dealership location) for a pre-tax gain totaling $13.5 million.
During the year ended December 31, 2022, the Company sold 18 franchises (16 dealership locations) and three collision centers for a pre-tax gain totaling $207.1 million.
7. OTHER CURRENT ASSETS
Other current assets consisted of the following:
| As of December 31, | |||||||||||
| 2023 | 2022 | ||||||||||
| (In millions) | |||||||||||
| Loaner vehicles | $ | 262.6 | $ | 178.2 | |||||||
| Contract assets (see Note 2) | 53.8 | 40.5 | |||||||||
| Prepaid expenses | 41.4 | 43.0 | |||||||||
| Prepaid taxes | 18.4 | 5.8 | |||||||||
| Notes receivable | 5.2 | 12.9 | |||||||||
| Deposits | 4.5 | 4.1 | |||||||||
| Other | 3.1 | 3.6 | |||||||||
| Other current assets | $ | 388.9 | $ | 288.1 | |||||||
92
8. INVESTMENTS
TCA has an investment portfolio funded primarily by product premiums. The amortized cost, gross unrealized gains and losses and estimated fair values of debt securities available-for-sale, equity securities, and other investments measured at net asset value are as follows:
| As of December 31, 2023 | |||||||||||||||||||||||||||||
| Amortized Cost | Gross Unrealized Gains | Gross Unrealized Losses | Fair Value | ||||||||||||||||||||||||||
| (In millions) | |||||||||||||||||||||||||||||
| Short-term investments | $ | 6.3 | $ | — | $ | (0.1) | $ | 6.2 | |||||||||||||||||||||
| U.S Treasury | 13.6 | 0.1 | (0.1) | 13.5 | |||||||||||||||||||||||||
| Municipal | 30.1 | 0.2 | (0.2) | 30.1 | |||||||||||||||||||||||||
| Corporate | 131.5 | 1.6 | (0.9) | 132.2 | |||||||||||||||||||||||||
| Mortgage and other asset-backed securities | 150.1 | 1.6 | (0.9) | 150.9 | |||||||||||||||||||||||||
| Total debt securities | 331.6 | 3.5 | (2.2) | 332.9 | |||||||||||||||||||||||||
| Total investments | $ | 331.6 | $ | 3.5 | $ | (2.2) | $ | 332.9 | |||||||||||||||||||||
| As of December 31, 2022 | |||||||||||||||||||||||||||||
| Amortized Cost | Gross Unrealized Gains | Gross Unrealized Losses | Fair Value | ||||||||||||||||||||||||||
| (In millions) | |||||||||||||||||||||||||||||
| Short-term investments | $ | 5.4 | $ | — | $ | — | $ | 5.4 | |||||||||||||||||||||
| U.S Treasury | 11.8 | — | (0.2) | 11.6 | |||||||||||||||||||||||||
| Municipal | 22.8 | — | (0.4) | 22.4 | |||||||||||||||||||||||||
| Corporate | 81.8 | 0.2 | (2.3) | 79.7 | |||||||||||||||||||||||||
| Mortgage and other asset-backed securities | 73.8 | 0.3 | (1.4) | 72.7 | |||||||||||||||||||||||||
| Total debt securities | 195.5 | 0.5 | (4.4) | 191.7 | |||||||||||||||||||||||||
| Common stock | 48.7 | — | — | 48.7 | |||||||||||||||||||||||||
| Total investments | $ | 244.2 | $ | 0.5 | $ | (4.4) | $ | 240.4 | |||||||||||||||||||||
There were no equity securities held as of December 31, 2023.
As of December 31, 2023 and 2022, the Company had $2.5 million and $1.3 million of accrued interest receivable, which was included in other current assets on the consolidated balance sheets. The Company does not consider accrued interest receivable in the carrying amount of financial assets held at amortized cost basis or in the allowance for credit losses.
93
A summary of amortized costs and fair value of investments by time to maturity, is as follows:
| As of December 31, 2023 | |||||||||||
| Amortized Costs | Fair Value | ||||||||||
| (In millions) | |||||||||||
| Due in 1 year or less | $ | 6.3 | $ | 6.2 | |||||||
| Due in 1-5 years | 116.9 | 116.9 | |||||||||
| Due in 5-10 years | 52.9 | 53.4 | |||||||||
| Due after 10 years | 5.4 | 5.5 | |||||||||
| Total by maturity | 181.5 | 182.0 | |||||||||
| Mortgage and other asset-backed securities | 150.1 | 150.9 | |||||||||
| Total investment securities | $ | 331.6 | $ | 332.9 | |||||||
During the year ended December 31, 2023, we recorded $2.7$0.5 million of impairment expensegross gains and $1.5 million gross losses realized related to real estate propertiesthe sales of available-for-sale debt securities carried at fair value. During the year ended December 31, 2023, we recorded $3.7 million gross gains and $0.9 million gross losses realized related to the sales of equity securities carried at fair value.
During the year ended December 31, 2022, we recorded $0.1 million gross gains and $2.0 million gross losses realized related to the sales of available-for-sale debt securities carried at fair value. During the year ended December 31, 2022, we recorded $10.1 million gross gains and $3.6 million gross losses realized related to the sales of equity securities carried at fair value. There were actively marketingno gross gains and losses realized related to the sales of available-for-sale debt and equity securities carried at fair value from the acquisition date of December 17, 2021 to December 31, 2021.
The following tables summarize the amount of unrealized losses, defined as the amount by which the amortized cost exceeds fair value, and the related fair value of investments with unrealized losses. The investments were segregated into two categories: those that have been in a continuous unrealized loss position for less than 12 months and those that have been in a continuous unrealized loss position of 12 or more months. The reference point for determining how long an investment was in an unrealized loss position was December 31, 2023.
| As of December 31, 2023 | |||||||||||||||||||||||||||||||||||
| Less than 12 Months | Greater than 12 Months | Total | |||||||||||||||||||||||||||||||||
| Fair Value | Unrealized Losses | Fair Value | Unrealized Losses | Fair Value | Unrealized Losses | ||||||||||||||||||||||||||||||
| (In millions) | |||||||||||||||||||||||||||||||||||
| Short-term investments | $ | — | $ | — | $ | 6.0 | $ | (0.1) | $ | 6.0 | $ | (0.1) | |||||||||||||||||||||||
| U.S Treasury | 3.4 | (0.1) | 5.0 | (0.1) | 8.5 | (0.1) | |||||||||||||||||||||||||||||
| Municipal | 6.4 | (0.1) | 10.4 | (0.1) | 16.8 | (0.2) | |||||||||||||||||||||||||||||
| Corporate | 11.4 | (0.1) | 48.0 | (0.8) | 59.4 | (0.9) | |||||||||||||||||||||||||||||
| Mortgage and other asset-backed securities | 29.8 | (0.4) | 33.1 | (0.5) | 62.9 | (0.9) | |||||||||||||||||||||||||||||
| Total debt securities | $ | 51.1 | $ | (0.7) | $ | 102.5 | $ | (1.6) | $ | 153.6 | $ | (2.2) | |||||||||||||||||||||||
94
| As of December 31, 2022 | |||||||||||||||||||||||||||||||||||
| Less than 12 Months | Greater than 12 Months | Total | |||||||||||||||||||||||||||||||||
| Fair Value | Unrealized Losses | Fair Value | Unrealized Losses | Fair Value | Unrealized Losses | ||||||||||||||||||||||||||||||
| (In millions) | |||||||||||||||||||||||||||||||||||
| U.S Treasury | $ | 9.2 | $ | (0.2) | $ | — | $ | — | $ | 9.2 | $ | (0.2) | |||||||||||||||||||||||
| Municipal | 19.0 | (0.4) | — | — | 19.0 | (0.4) | |||||||||||||||||||||||||||||
| Corporate | 66.2 | (0.1) | 5.2 | (0.3) | 71.4 | (0.4) | |||||||||||||||||||||||||||||
| Mortgage and other asset-backed securities | 51.4 | (1.3) | 1.5 | (0.2) | 52.9 | (1.5) | |||||||||||||||||||||||||||||
| Total debt securities | $ | 145.7 | $ | (2.0) | $ | 6.8 | $ | (0.5) | $ | 152.6 | $ | (2.5) | |||||||||||||||||||||||
The credit loss model applicable to the available-for-sale debt securities, requires the recognition of credit losses through an allowance account, which are recognized once securities become impaired. The Company reviews the investment securities portfolio at the security level on a quarterly basis for potential credit losses, which takes into consideration numerous factors as described in Note 1. The decline in fair value identified in the tables above are a result of widening market spreads and not a result of credit quality. Additionally, the Company has determined it has both the intent and ability to hold these investments until the market price recovers or until maturity and does not believe it will be required to sell basedthe securities before maturity. Accordingly, no credit losses were recognized on offers received from prospective buyers and third-party brokers' opinion of value. We did not record any impairment expense associated with real estate properties that we were actively marketing to sellthese securities during the years ended December 31, 2017 or 2015.2023, 2022, and 2021.
| As of December 31, | |||||||
| 2017 | 2016 | ||||||
| (In millions) | |||||||
| Service loaner vehicles | $ | 85.4 | $ | 82.2 | |||
| Prepaid expenses | 5.2 | 4.5 | |||||
| Prepaid taxes | 19.5 | 4.0 | |||||
| Other | 9.2 | 6.3 | |||||
| Other current assets | $ | 119.3 | $ | 97.0 | |||
Property and equipment, net consisted of the following:
| As of December 31, | |||||||||||
| 2023 | 2022 | ||||||||||
| (In millions) | |||||||||||
| Land | $ | 868.3 | $ | 673.8 | |||||||
| Buildings and leasehold improvements | 1,465.2 | 1,318.8 | |||||||||
| Machinery and equipment | 171.9 | 145.4 | |||||||||
| Furniture and fixtures | 97.8 | 91.1 | |||||||||
| Company vehicles | 16.5 | 14.0 | |||||||||
| Construction in progress | 92.0 | 36.5 | |||||||||
| Gross property and equipment | 2,711.7 | 2,279.5 | |||||||||
| Less—Accumulated depreciation | (396.1) | (338.5) | |||||||||
| Property and equipment, net (a) | $ | 2,315.7 | $ | 1,941.0 | |||||||