


| ANNUAL REPORT PURSUANT TO SECTION 13 OR 15(d) OF THE SECURITIES EXCHANGE ACT OF 1934 FOR THE FISCAL YEAR ENDED SEPTEMBER |
| TRANSITION REPORT PURSUANT TO SECTION 13 OR 15 (d) OF THE SECURITIES EXCHANGE ACT OF 1934 FOR THE TRANSITION PERIOD FROM |
New Jersey | 22-1935537 | |||||
| (State or other jurisdiction of incorporation or organization) | (I.R.S. Employer Identification No.) | |||||
| 6000 Central Highway | ||||||
| 08109 | ||||||
| (Address of principal executive offices) | (Zip Code) | |||||
| Title of Each Class | Name of Each Exchange on Which Registered | |
| Common Stock, no par value | The NASDAQ Global Select Exchange |
| Large accelerated filer | Accelerated filer (X) | ||||||
| Non-accelerated filer | ( ) | Smaller reporting company | |||||
| (Do not check if a smaller reporting company) | |||||||
| Page | |||||||||||||
| PART I | |||||||||||||
| Item 1 | Business | 1 | |||||||||||
| Risk Factors | 6 | ||||||||||||
| Item 1B | Unresolved Staff Comments | 8 | |||||||||||
| Item 2 | Properties | 9 | |||||||||||
| Item 3 | Legal Proceedings | 10 | |||||||||||
| Item 4 | [Removed and reserved] | 10 | |||||||||||
| PART II | |||||||||||||
| 5 | |||||||||||||
| Market For Registrant’s Common Equity, Related Stockholder Matters And Issuer Purchases Of Equity Securities | 11 | ||||||||||||
| Selected Financial Data | 12 | ||||||||||||
Management’s Discussion And Analysis Of Financial Condition And Results Of Operations | 13 | ||||||||||||
Quantitative And Qualitative Disclosures About Market Risk | 23 | ||||||||||||
| Financial Statements And Supplementary Data | 24 | ||||||||||||
Changes In And Disagreements With Accountants On Accounting And Financial Disclosure | 24 | ||||||||||||
| Controls and Procedures | 24 | ||||||||||||
| Item 9B | Other Information | 25 | |||||||||||
| PART III | |||||||||||||
| Directors, Executive Officers and Corporate Governance | 25 | ||||||||||||
| Executive Compensation | 26 | ||||||||||||
Security Ownership Of Certain Beneficial Owners And Management And Related Stockholder Matters | 26 | ||||||||||||
Certain Relationships And Related Transactions, and Director Independence | 27 | ||||||||||||
| Principal Accountant Fees and Services | 27 | ||||||||||||
| PART IV | |||||||||||||
| Item 15 | Exhibits, Financial Statement Schedules | 27 | |||||||||||
| Item 1. | Business |
* | BARQ’S is a registered trademark of Barq’s Inc. |
| ** | MINUTE MAID is a registered trademark of the Coca-Cola Company |
| * | CINNAPRETZEL is a registered trademark of Cinnabon, Inc. |
| Item 1A. | Risk Factors |
| -- | a classified Board of Directors; |
| -- | the requirement that our shareholders may only remove Directors for cause; |
| -- | limitations on share holdings and voting of certain persons; |
| -- | special Director voting rights; and |
| -- | the ability of the Board of Directors to consider the interests of various constituencies, including our employees, customers, suppliers, creditors and the local communities in which we operate. |
| Item 1B. | Unresolved Staff Comments |
| Item 2. | Properties |
| Item 3. | Legal Proceedings |
| Item 4. | [Removed and reserved] |
Market For Registrant’s Common Equity, Related Stockholder Matters And Issuer Purchases Of Equity Securities |
| High | Low | Declared Dividend | ||||||||||||
|---|---|---|---|---|---|---|---|---|---|---|---|---|---|---|
Fiscal 2008 | ||||||||||||||
| First quarter | $ | 38.76 | $ | 29.01 | $ | .0925 | ||||||||
| Second quarter | 31.85 | 23.38 | .0925 | |||||||||||
| Third quarter | 29.97 | 26.74 | .0925 | |||||||||||
| Fourth quarter | 36.07 | 27.00 | .0925 | |||||||||||
Fiscal 2009 | ||||||||||||||
| First quarter | $ | 34.50 | $ | 24.07 | $ | .0975 | ||||||||
| Second quarter | 36.57 | 30.12 | .0975 | |||||||||||
| Third quarter | 40.14 | 32.10 | .0975 | |||||||||||
| Fourth quarter | 44.75 | 35.17 | .0975 | |||||||||||
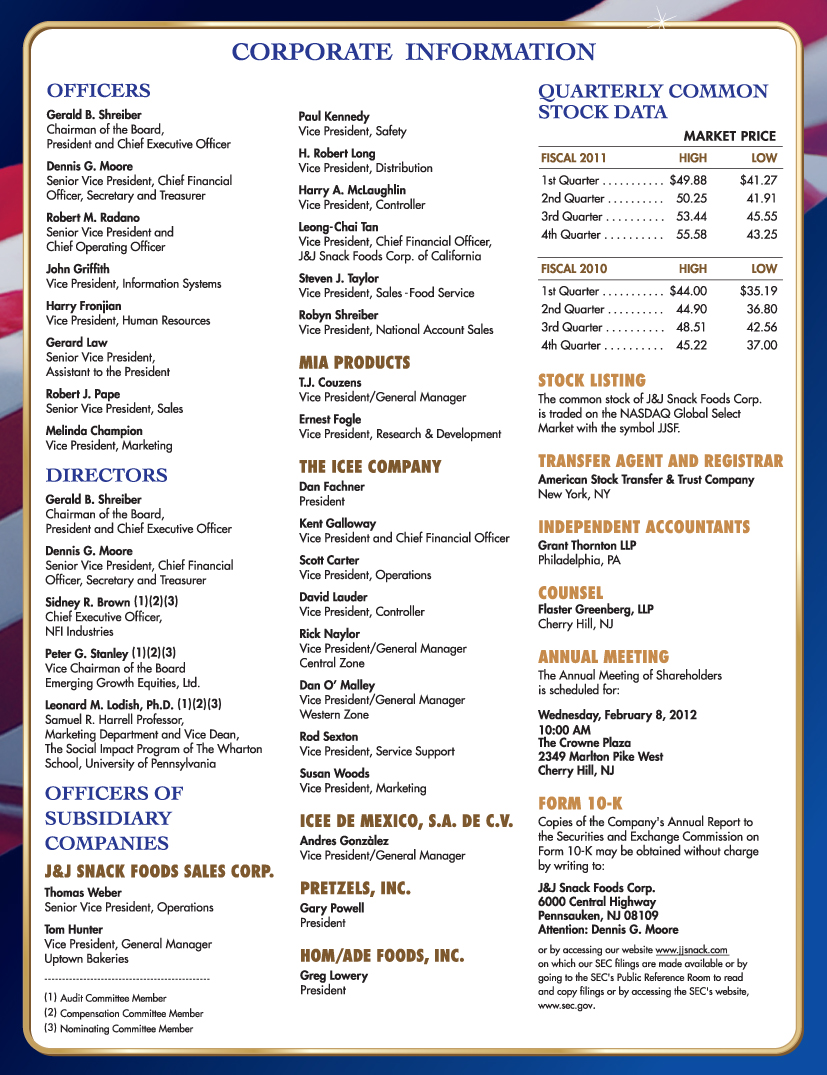
| Common Stock Market Price | ||||||||||||
| Dividend | ||||||||||||
| High | Low | Declared | ||||||||||
| Fiscal 2010 | ||||||||||||
| First quarter | $ | 44.00 | $ | 35.19 | $ | 0.1075 | ||||||
| Second quarter | 44.90 | 36.80 | 0.1075 | |||||||||
| Third quarter | 48.51 | 42.56 | 0.1075 | |||||||||
| Fourth quarter | 45.22 | 37.00 | 0.1075 | |||||||||
| Fiscal 2011 | ||||||||||||
| First quarter | $ | 49.88 | $ | 41.27 | $ | 0.1175 | ||||||
| Second quarter | 50.25 | 41.91 | 0.1175 | |||||||||
| Third quarter | 53.44 | 45.55 | 0.1175 | |||||||||
| Fourth quarter | 55.58 | 43.25 | 0.1175 | |||||||||
| Item 6. | Selected Financial Data |

| Fiscal year ended in September (In thousands except per share data) | |||||||||||||||||||||||
|---|---|---|---|---|---|---|---|---|---|---|---|---|---|---|---|---|---|---|---|---|---|---|---|
| 2009 | 2008 | 2007 | 2006 | 2005 | |||||||||||||||||||
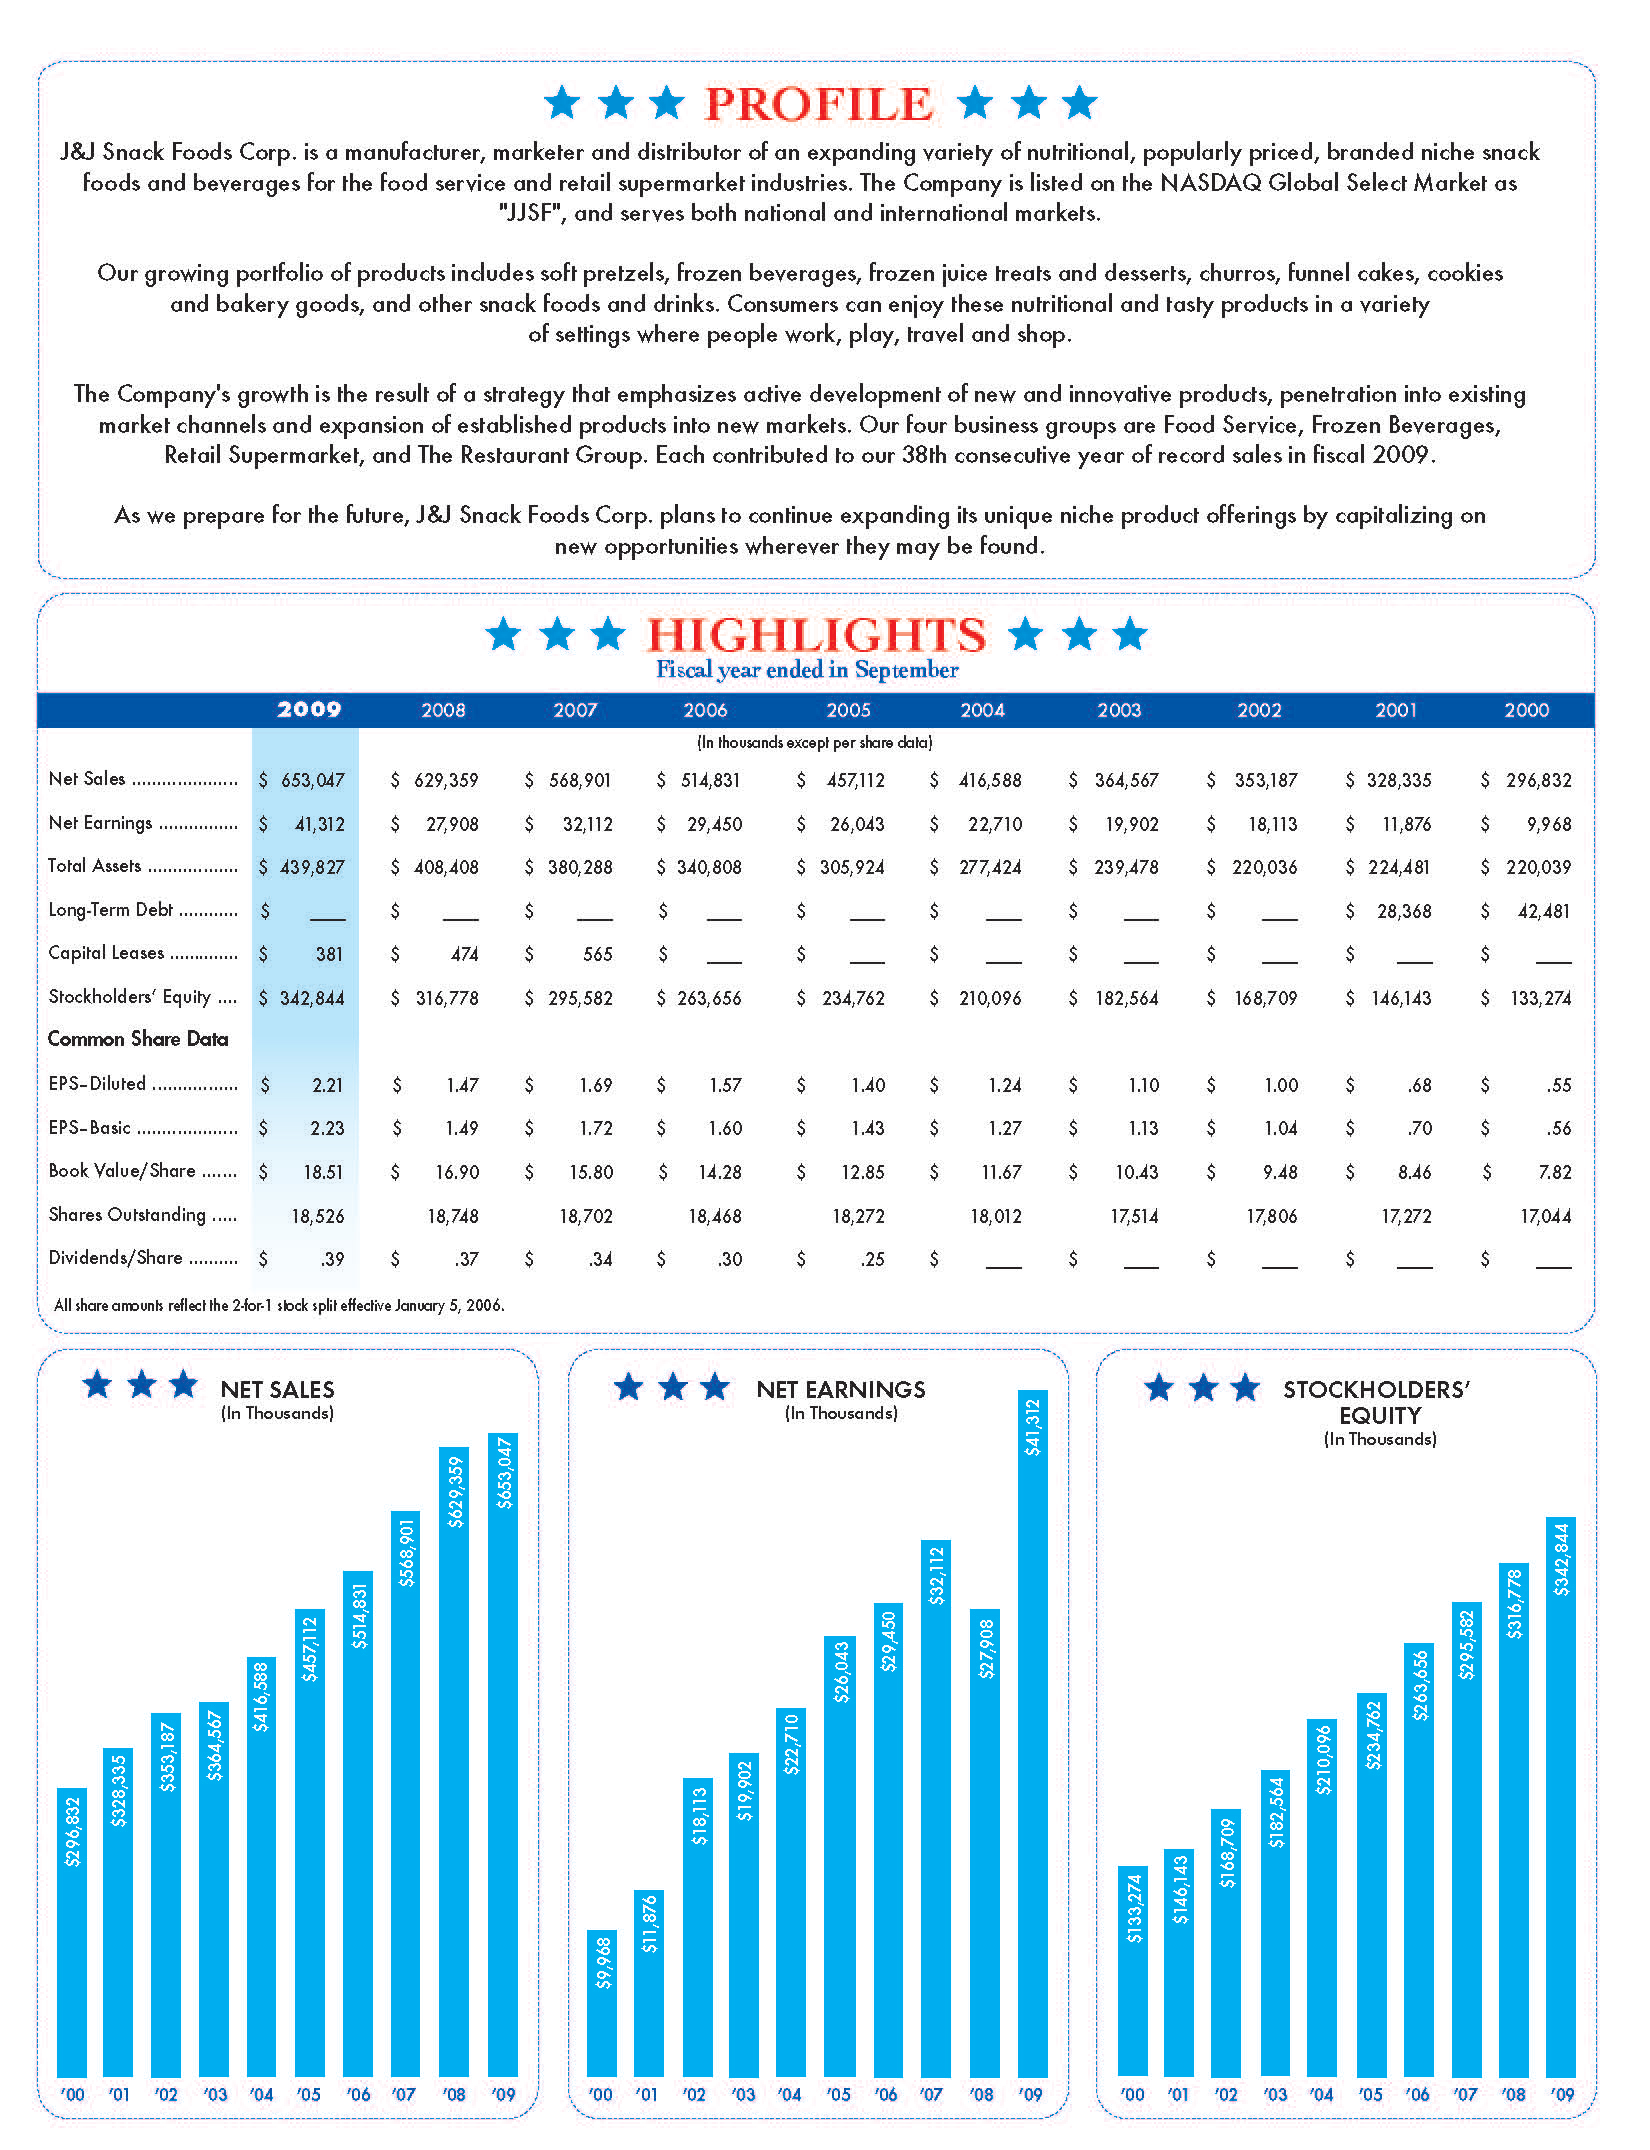
| Net Sales | $ | 653,047 | $ | 629,359 | $ | 568,901 | $ | 514,831 | $ | 457,112 | |||||||||||||
| Net Earnings | $ | 41,312 | $ | 27,908 | $ | 32,112 | $ | 29,450 | $ | 26,043 | |||||||||||||
| Total Assets | $ | 439,827 | $ | 408,408 | $ | 380,288 | $ | 340,808 | $ | 305,924 | |||||||||||||
| Long-Term Debt | $ | — | $ | — | $ | — | $ | — | $ | — | |||||||||||||
| Capital Lease Obligations | $ | 381 | $ | 474 | $ | 565 | $ | — | $ | — | |||||||||||||
| Stockholders’ Equity | $ | 342,844 | $ | 316,778 | $ | 295,582 | $ | 263,656 | $ | 234,762 | |||||||||||||
| Common Share Data | |||||||||||||||||||||||
| Earnings Per Diluted Share | $ | 2.21 | $ | 1.47 | $ | 1.69 | $ | 1.57 | $ | 1.40 | |||||||||||||
| Earnings Per Basic Share | $ | 2.23 | $ | 1.49 | $ | 1.72 | $ | 1.60 | $ | 1.43 | |||||||||||||
| Book Value Per Share | $ | 18.51 | $ | 16.90 | $ | 15.80 | $ | 14.28 | $ | 12.85 | |||||||||||||
| Common Shares Outstanding At Year End | 18,526 | 18,748 | 18,702 | 18,468 | 18,272 | ||||||||||||||||||
| Cash Dividends Declared Per Common Share | $ | .39 | $ | .37 | $ | .34 | $ | .30 | $ | .25 | |||||||||||||
| Fiscal year ended in September | ||||||||||||||||||||
(In thousands except per share data) | ||||||||||||||||||||
| 2011 | 2010 | 2009 | 2008 | 2007 | ||||||||||||||||
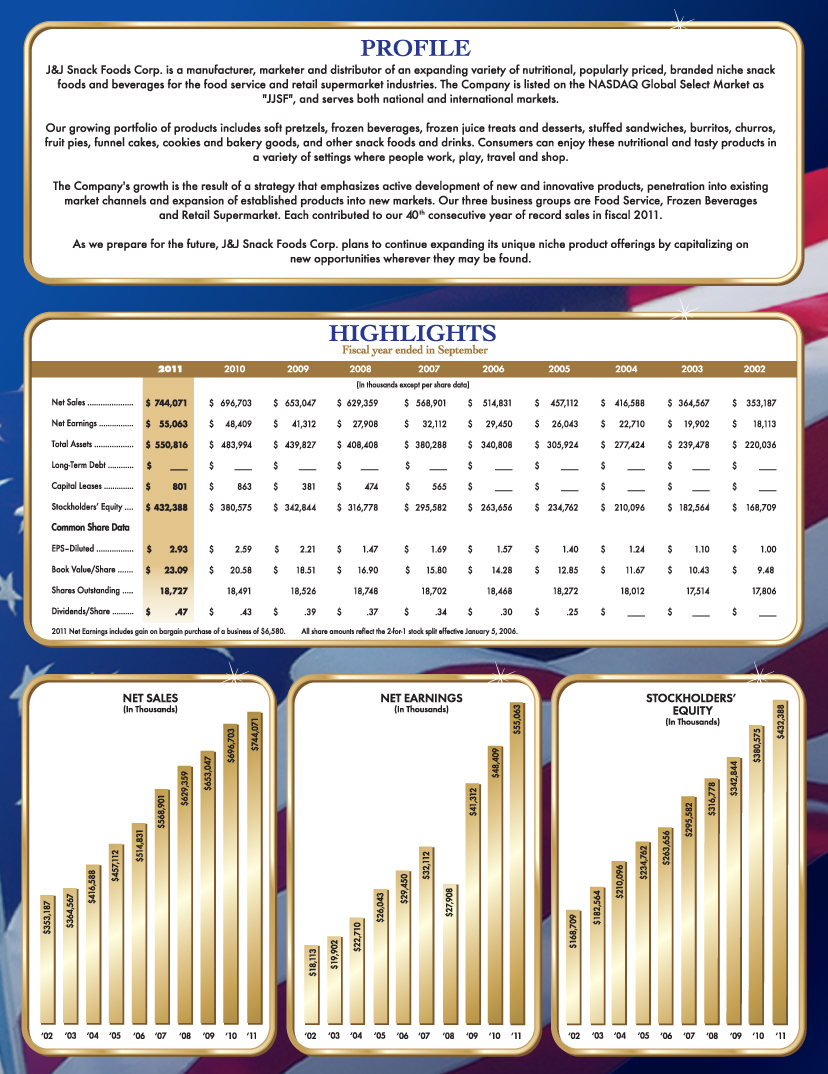
| Net Sales | $ | 744,071 | $ | 696,703 | $ | 653,047 | $ | 629,359 | $ | 568,901 | ||||||||||
| Net Earnings | $ | 55,063 | $ | 48,409 | $ | 41,312 | $ | 27,908 | $ | 32,112 | ||||||||||
| Total Assets | $ | 550,816 | $ | 483,994 | $ | 439,827 | $ | 408,408 | $ | 380,288 | ||||||||||
| Long-Term Debt | $ | - | $ | - | $ | - | $ | - | $ | - | ||||||||||
| Capital Lease | ||||||||||||||||||||
| Obligations | $ | 801 | $ | 863 | $ | 381 | $ | 474 | $ | 565 | ||||||||||
| Stockholders' Equity | $ | 432,388 | $ | 380,575 | $ | 342,844 | $ | 316,778 | $ | 295,582 | ||||||||||
| Common Share Data | ||||||||||||||||||||
| Earnings Per Diluted | ||||||||||||||||||||
| Share | $ | 2.93 | $ | 2.59 | $ | 2.21 | $ | 1.47 | $ | 1.69 | ||||||||||
| Earnings Per Basic | ||||||||||||||||||||
| Share | $ | 2.95 | $ | 2.61 | $ | 2.23 | $ | 1.49 | $ | 1.72 | ||||||||||
| Book Value Per Share | $ | 23.09 | $ | 20.58 | $ | 18.51 | $ | 16.90 | $ | 15.80 | ||||||||||
| Common Shares Outstanding | ||||||||||||||||||||
| At Year End | 18,727 | 18,491 | 18,526 | 18,748 | 18,702 | |||||||||||||||
| Cash Dividends Declared | ||||||||||||||||||||
| Per Common Share | $ | 0.47 | $ | 0.43 | $ | 0.39 | $ | 0.37 | $ | 0.34 | ||||||||||
| Item 7. | Management’s Discussion And Analysis Of Financial Condition And Results Of Operations |
| . | Tangible net worth must initially be more than $294 million. |
| . | Total funded indebtedness divided by earnings beforeinterest expense, income taxes, depreciation and amortization shall not be greater than 2.25 to 1. |
| Payments Due by Period (in thousands) | |||||||||||||||||||||||
|---|---|---|---|---|---|---|---|---|---|---|---|---|---|---|---|---|---|---|---|---|---|---|---|
| Total | Less Than 1 Year | 1-3 Years | 4-5 Years | After 5 Years | |||||||||||||||||||
| Long-term debt, including current maturities | $ | — | $ | — | $ | — | $ | — | $ | — | |||||||||||||
| Capitalized lease obligations | 381 | 96 | 199 | 86 | — | ||||||||||||||||||
| Purchase commitments | 46,000 | 46,000 | — | — | — | ||||||||||||||||||
| Operating leases | 43,176 | 9,167 | 13,893 | 7,626 | 12,490 | ||||||||||||||||||
| Total | $ | 89,557 | $ | 55,263 | $ | 14,092 | $ | 7,712 | $ | 12,490 | |||||||||||||
Payments Due by Period | ||||||||||||||||||||
| (in thousands) | ||||||||||||||||||||
| Less | ||||||||||||||||||||
| Than | 1-3 | 4-5 | After | |||||||||||||||||
| Total | 1 Year | Years | Years | 5 Years | ||||||||||||||||
Long-term debt, including current maturities | $ | - | $ | - | $ | - | $ | - | $ | - | ||||||||||
Capital lease obligations | 801 | 278 | 422 | 65 | 36 | |||||||||||||||
| Purchase commitments | 60,000 | 60,000 | - | - | - | |||||||||||||||
| Construction Contracts | 4,300 | 4,300 | - | - | - | |||||||||||||||
| Operating leases | 49,298 | 8,809 | 12,451 | 7,377 | 20,661 | |||||||||||||||
| Total | $ | 114,399 | $ | 73,387 | $ | 12,873 | $ | 7,442 | $ | 20,697 | ||||||||||
Table$16,866,000 in 2010. This change of Contents
$42,591,000 was partially offset by lower spending of $16,379,000 and $4,407,000 on the purchase of companies and property, plant and equipment, respectively.
| Item 7A. | Quantitative And Qualitative Disclosures About Market Risk |
| Item 8. | Financial Statements And Supplementary Data |
| Item 9. | Changes In And Disagreements With Accountants OnAccounting And Financial Disclosure |
| Item 9A. | Controls And Procedures |
| · | Pertain to the maintenance of records that in reasonable detail accurately and fairly reflect the transactions and dispositions of our assets; |
| · | Provide reasonable assurance that transactions are recorded as necessary to permit preparation of financial statements in accordance with generally accepted accounting principles, and that receipts and expenditures of the company are being made only in accordance with authorizations of our management and board of directors; |
| · | Provide reasonable assurance regarding prevention or timely detection of unauthorized acquisition, use or disposition of our assets that could have a material effect on the financial statements. |
| Item 9B. | Other Information |
| Item 10. | Directors, Executive Officers and CorporateGovernance |
| Item 11. | Executive Compensation |
| Name | Age | Position | |||||||||||||
| Gerald B. Shreiber | 69 | Chairman of the Board, President, Chief Executive Officer and Director | |||||||||||||
| Dennis G. Moore | 56 | Senior Vice President, Chief Financial Officer, Secretary, Treasurer and Director | |||||||||||||
| Robert M. Radano | 62 | Senior Vice President, Sales and Chief Operating Officer | |||||||||||||
| 51 | President of The ICEE Company Subsidiary | ||||||||||||||
| 37 | Senior Vice President and Assistant to the President | ||||||||||||||
| Robert J. Pape | 54 | Senior Vice President, | |||||||||||||
| Security Ownership Of Certain Beneficial Owners |
| (a) | (b) | (c) | ||||||||||||
|---|---|---|---|---|---|---|---|---|---|---|---|---|---|---|
| Plan Category | Number of securities to be issued upon exercise of outstanding options, warrants and rights | Weighted-average exercise price of outstanding options, warrants and rights | Number of securities remaining available for future issuance under equity compensation plans (excluding securities reflected in column (a)) | |||||||||||
| Equity compensation plans approved by security holders | 746,000 | $ | 23.70 | 1,321,000 | ||||||||||
| Equity compensation plans not approved by security holders | — | — | — | |||||||||||
| Total | 746,000 | $ | 23.70 | 1,321,000 | ||||||||||
| ( a ) | ( b ) | ( c ) | ||||||||||
| Plan Category | Number of securities to be issued upon exercise of outstanding options, warrants and rights | Weighted-average exercise price of outstanding options, warrants and rights | Number of Securities Remaining available for future issuance under equity compensation plans (excluding securities reflected in column (a) ) | |||||||||
Equity compensation plans approved by security holders | 559,287 | $ | 37.55 | 1,054,000 | ||||||||
Equity compensation plans not approved by security holders | - | - | - | |||||||||
| Total | 559,287 | $ | 37.55 | 1,054,000 | ||||||||
| Item 13. | Certain Relationships And Related Transactions, andDirector Independence |
| 3.1 | Amended and Restated Certificate of Incorporation filed February 28, |
| 3.2** | Revised Bylaws adopted |
| 4.3 | Amended and Restated Loan Agreement dated December 1, 2006 by and among J & J Snack Foods Corp. and Certain of its Subsidiaries and Citizens Bank of Pennsylvania, as |
| First Amendment and |
10.2* | J & J Snack Foods Corp. Stock Option |
10.3* | Adoption Agreement for MFS Retirement Services, Inc. Non-Standardized 401(K) Profit Sharing Plan and Trust, effective September 1, |
10.4* | J & J Snack Foods Corp. Directors’ and Consultants’ Deferred Compensation Plan adopted November 21, |
| 10.7 | Lease dated August 29, 1995 between J & J Snack Foods Corp. and 5353 Downey Associated Ltd. for the lease of the Vernon, CA |
10.8* | J & J Snack Foods Corp. Employee Stock Purchase Plan (Incorporated by reference from the Company’s Form S-8 dated May 16, 1996). |
| 10.11 | Amendment No. 1 to Lease dated August 29, 1995 between J & J Snack Foods Corp. and 5353 Downey Associated Ltd. for the lease of the Vernon, CA |
| 10.14 | Leases and amendments to leases between Liberty Venture I, LP and J & J Snack Foods Corp. for the three buildings located in Bridgeport, New |
| 10.15 | Amendment No. 2 to Lease dated August 29, 1995 between J & J Snack Foods Corp. and 5353 Downey Associated Ltd. for the lease of the Vernon, CA facility (Incorporated by reference from the Company's Form 10-K dated December 6, 2010). |
| 10.16 | Amendment to Lease dated January 1, 1996 between Country Home Bakers, LLC and Borck Associates Limited Partnership for the lease of the Atlanta, GA facility (Incorporated by reference from the Company's Form 10-k dated December 6, 2011). |
| 14.1 | Code of Ethics Pursuant to Section 406 of |
21.1** | Subsidiaries of J & J Snack Foods Corp. |
23.1** | Consent of Independent Registered Public Accounting Firm. |
31.1** | Certification Pursuant to Section 302 of the Sarbanes-Oxley Act of 2002. |
31.2** | Certification Pursuant to Section 302 of the Sarbanes-Oxley Act of 2002. |
32.1** | Certification Pursuant to 18 U.S.C. Section 1350, As Adopted Pursuant To Section 906 Of The Sarbanes-Oxley Act of 2002. |
32.2** | Certification Pursuant to 18 U.S.C. Section 1350, As Adopted Pursuant To Section 906 Of The Sarbanes-Oxley Act of 2002. |
| 101.1** | The following financial information from J&J Snack Foods Corp.'s Form 10-K for the year ended September 24, 2011, formatted in XBRL (eXtensible Business Reporting Language): |
| (i) | Consolidated Statements of Earnings, | |
| (ii) | Consolidated Balance Sheets | |
| (iii) | Consolidated Statements of Cash Flows and | |
| (iv) | Consolidated Statement of Changes in Stockholders' Equity |
| * | Compensatory Plan |
| ** | Filed Herewith |
J & J SNACK FOODS CORP. | |||||||||||
| December 6, 2011 | By: | /s/ Gerald B. Shreiber | |||||||||
Gerald B. Shreiber, Chairman of the Board, President, Chief Executive Officer and Director (Principal Executive Officer) | |||||||||||
/s/ Gerald B. Shreiber | |||||||||||
| December 6, 2011 | Gerald B. Shreiber, Chairman of the Board, President, Chief Executive Officer and Director (Principal Executive Officer) | ||||||||||
/s/ Dennis G. Moore | |||||||||||
| December 6, 2011 | Dennis G. Moore, Senior Vice President, Chief Financial Officer and Director (Principal Financial Officer) (Principal Accounting Officer) | ||||||||||
| /s/ Sidney R. Brown | ||||||
| December 6, 2011 | Sidney R. Brown, Director | |||||
| /s/ Peter G. Stanley | ||||||
| December 6, 2011 | Peter G. Stanley, Director | |||||
| /s/ Leonard M. Lodish | ||||||
| December 6, 2011 | Leonard M. Lodish, Director |
| Financial Statements: | ||||||
Report of Independent Registered Public Accounting Firm | F-2 | |||||
Consolidated Balance Sheets as of September | 25, 2010 | F-3 | ||||
| Consolidated Statements of Earnings for fiscal years ended September 24, 2011, September 25, 2010 and September 26, 2009 | F-4 | |||||
Consolidated Statement of Changes in Stockholders’ Equity for the fiscal years ended September 24, 2011, September 25, 2010 and September 26, 2009 | F-5 | |||||
| Consolidated Statements of Cash Flows for fiscal years ended September 24, 2011, September 25, 2010 and September 26, 2009 | F-6 | |||||
| Notes to Consolidated Financial Statements | F-7 | |||||
| Financial Statement Schedule: | ||||||
| Schedule II | S-1 |
| September 26, 2009 | September 27, 2008 | ||||||||||
|---|---|---|---|---|---|---|---|---|---|---|---|
| (in thousands, except share amounts) | |||||||||||
Assets | |||||||||||
| Current Assets | |||||||||||
| Cash and cash equivalents | $ | 60,343 | $ | 44,265 | |||||||
| Marketable securities held to maturity | 38,653 | 2,470 | |||||||||
| Auction market preferred stock | — | 14,000 | |||||||||
| Receivables | |||||||||||
| Trade, less allowances of $623 and $926, respectively | 59,734 | 61,176 | |||||||||
| Other | 808 | 677 | |||||||||
| Inventories | 46,004 | 49,095 | |||||||||
| Prepaid expenses and other | 1,910 | 1,962 | |||||||||
| Deferred income taxes | 3,659 | 3,555 | |||||||||
| Total current assets | 211,111 | 177,200 | |||||||||
| Property, Plant and Equipment, at cost | 383,156 | 364,164 | |||||||||
| Less accumulated depreciation and amortization | 285,983 | 271,100 | |||||||||
| 97,173 | 93,064 | ||||||||||
| Other Assets | |||||||||||
| Goodwill | 60,314 | 60,314 | |||||||||
| Other intangible assets, net | 49,125 | 53,633 | |||||||||
| Marketable securities held to maturity | 19,994 | — | |||||||||
| Auction market preferred stock | — | 21,200 | |||||||||
| Other | 2,110 | 2,997 | |||||||||
| 131,543 | 138,144 | ||||||||||
| $ | 439,827 | $ | 408,408 | ||||||||
Liabilities and Stockholders’ Equity | |||||||||||
| Current Liabilities | |||||||||||
| Current obligations under capital leases | $ | 96 | $ | 93 | |||||||
| Accounts payable | 48,204 | 48,580 | |||||||||
| Accrued liabilities | 5,919 | 5,557 | |||||||||
| Accrued compensation expense | 11,656 | 10,232 | |||||||||
| Dividends payable | 1,804 | 1,732 | |||||||||
| Total current liabilities | 67,679 | 66,194 | |||||||||
| Long-term obligations under capital leases | 285 | 381 | |||||||||
| Deferred income taxes | 27,033 | 23,056 | |||||||||
| Other long-term liabilities | 1,986 | 1,999 | |||||||||
Stockholders’ Equity | |||||||||||
| Preferred stock, $1 par value; authorized, 10,000,000 shares; none issued | — | — | |||||||||
| Common stock, no par value; authorized, 50,000,000 shares; issued and outstanding 18,526,000 and 18,748,000 respectively | 41,777 | 48,415 | |||||||||
| Accumulated other comprehensive loss | (3,431 | ) | (2,003 | ) | |||||||
| Retained earnings | 304,498 | 270,366 | |||||||||
| 342,844 | 316,778 | ||||||||||
| $ | 439,827 | $ | 408,408 | ||||||||
| J & J SNACK FOODS CORP. AND SUBSIDIARIES | ||||||||
| CONSOLIDATED BALANCE SHEETS | ||||||||
| (in thousands, except share amounts) | ||||||||
| September 24, | September 25, | |||||||
| 2011 | 2010 | |||||||
| Assets | ||||||||
| Current assets | ||||||||
| Cash and cash equivalents | $ | 87,479 | $ | 74,665 | ||||
Marketable securities held to maturity | 25,506 | 15,481 | ||||||
| Accounts receivable, net | 75,000 | 69,875 | ||||||
| Inventories, net | 63,461 | 50,630 | ||||||
| Prepaid expenses and other | 4,196 | 6,067 | ||||||
| Deferred income taxes | 4,208 | 3,813 | ||||||
| Total current assets | 259,850 | 220,531 | ||||||
| Property, plant and equipment, at cost | 446,856 | 414,403 | ||||||
Less accumulated depreciation and amortization | 322,206 | 304,311 | ||||||
| 124,650 | 110,092 | |||||||
| Other assets | ||||||||
| Goodwill | 70,070 | 70,070 | ||||||
| Other intangible assets, net | 52,005 | 55,284 | ||||||
| Marketable securities held to maturity | 42,000 | 26,300 | ||||||
| Other | 2,241 | 1,717 | ||||||
| 166,316 | 153,371 | |||||||
| $ | 550,816 | $ | 483,994 | |||||
| Liability and Stockholder's Equity | ||||||||
| Current Liabilities | ||||||||
| Current obligations under capital leases | $ | 278 | $ | 244 | ||||
| Accounts payable | 55,918 | 52,338 | ||||||
| Accrued liabilities | 4,593 | 4,269 | ||||||
| Accrued compensation expense | 12,859 | 12,244 | ||||||
| Dividends payable | 2,200 | 1,986 | ||||||
| Total current liabilities | 75,848 | 71,081 | ||||||
| Long-term obligations under capital leases | 523 | 619 | ||||||
| Deferred income taxes | 41,050 | 30,401 | ||||||
| Other long-term liabilities | 1,007 | 1,318 | ||||||
| Stockholders' Equity | ||||||||
Preferred stock, $1 par value; authorized 10,000,000 shares; none issued | - | - | ||||||
Common stock, no par value; authorized, 50,000,000 shares; issued and outstanding 18,727,000 and 18,491,000 respectively | 45,017 | 38,453 | ||||||
| Accumulated other comprehensive loss | (3,914 | ) | (2,854 | ) | ||||
| Retained Earnings | 391,285 | 344,976 | ||||||
| 432,388 | 380,575 | |||||||
| $ | 550,816 | $ | 483,994 | |||||
| The accompanying notes are an integral part of these statements. | ||||||||
| J & J SNACK FOODS CORP. AND SUBSIDIARIES | ||||||||||||
| CONSOLIDATED STATEMENTS OF EARNINGS | ||||||||||||
| (in thousands, except per share information) | ||||||||||||
| Fiscal year ended | ||||||||||||
| September 24, | September 25, | September 26, | ||||||||||
| 2011 | 2010 | 2009 | ||||||||||
| (52 weeks) | (52 weeks) | (52 weeks) | ||||||||||
| Net Sales | $ | 744,071 | $ | 696,703 | $ | 653,047 | ||||||
Cost of goods sold (1) | 514,297 | 468,923 | 444,203 | |||||||||
| Gross Profit | 229,774 | 227,780 | 208,844 | |||||||||
| Operating expenses | ||||||||||||
Marketing (2) | 70,637 | 72,103 | 69,493 | |||||||||
Distribution (3) | 57,462 | 52,146 | 49,705 | |||||||||
Administrative (4) | 24,568 | 24,282 | 22,713 | |||||||||
| Other general expense (income) | 524 | 2,087 | (5 | ) | ||||||||
| 153,191 | 150,618 | 141,906 | ||||||||||
| Operating Income | 76,583 | 77,162 | 66,938 | |||||||||
| Other income (expenses) | ||||||||||||
Gain on bargain purchase of a business | 6,580 | - | - | |||||||||
| Investment income | 1,041 | 1,114 | 1,386 | |||||||||
| Interest expense & other | (138 | ) | (179 | ) | (115 | ) | ||||||
Earnings before income taxes | 84,066 | 78,097 | 68,209 | |||||||||
| Income taxes | 29,003 | 29,688 | 26,897 | |||||||||
| NET EARNINGS | $ | 55,063 | $ | 48,409 | $ | 41,312 | ||||||
| Earnings per diluted share | $ | 2.93 | $ | 2.59 | $ | 2.21 | ||||||
Weighted average number of diluted shares | 18,789 | 18,703 | 18,713 | |||||||||
| Earnings per basic share | $ | 2.95 | $ | 2.61 | $ | 2.23 | ||||||
Weighted average number of basic shares | 18,672 | 18,528 | 18,516 | |||||||||
| (1) | Includes share-based compensation expense of $157 for the year ended September 24, 2011, $182 for the year ended September 25, 2010, and $211 for the year ended September 26, 2009. |
| (2) | Includes share-based compensation expense of $347 for the year ended September 24, 2011, $448 for the year ended September 25, 2010, and $729 for the year ended September 26, 2009. |
| (3) | Includes share-based compensation expense of $18 for the year ended September 24, 2011, $21 for the year ended September 25, 2010, and $21 for the year ended September 26, 2009. |
| (4) | Includes share-based compensation expense of $396 for the year ended September 24, 2011, $597 for the year ended September 25, 2010, and $755 for the year ended September 26, 2009. |
| J & J SNACK FOODS CORP. AND SUBSIDIARIES | ||||||||||||||||||||||||
| CONSOLIDATED STATEMENT OF CHANGES IN STOCKHOLDERS' EQUITY | ||||||||||||||||||||||||
| (in thousands) | ||||||||||||||||||||||||
| Accumulated | ||||||||||||||||||||||||
| Other | ||||||||||||||||||||||||
| Common Stock | Comprehensive | Retained | Comprehensive | |||||||||||||||||||||
| Shares | Amount | Loss | Earnings | Total | Income | |||||||||||||||||||
| Balance at September 28, 2008 | 18,748 | $ | 48,415 | $ | (2,003 | ) | $ | 270,366 | $ | 316,778 | ||||||||||||||
Issuance of common stock upon exercise of stock options | 198 | 3,284 | - | - | 3,284 | |||||||||||||||||||
Issuance of common stock for employee stock purchase plan | 26 | 687 | - | - | 687 | |||||||||||||||||||
Foreign currency translation adjustment | - | - | (1,428 | ) | - | (1,428 | ) | $ | (1,428 | ) | ||||||||||||||
Issuance of common stock under deferred stock plan | 5 | 368 | - | - | 368 | |||||||||||||||||||
| Dividends declared | - | - | - | (7,180 | ) | (7,180 | ) | |||||||||||||||||
| Share-based compensation | - | 1,533 | - | - | 1,533 | |||||||||||||||||||
| Repurchase of common stock | (451 | ) | (12,510 | ) | - | - | (12,510 | ) | ||||||||||||||||
| Net earnings | - | - | - | 41,312 | 41,312 | 41,312 | ||||||||||||||||||
| Comprehensive income | - | - | - | - | - | $ | 39,884 | |||||||||||||||||
| Balance at September 26, 2009 | 18,526 | $ | 41,777 | $ | (3,431 | ) | $ | 304,498 | $ | 342,844 | ||||||||||||||
Issuance of common stock upon exercise of stock options | 142 | 2,325 | - | - | 2,325 | |||||||||||||||||||
Issuance of common stock for employee stock purchase plan | 22 | 726 | - | - | 726 | |||||||||||||||||||
Foreign currency translation adjustment | - | - | 577 | - | 577 | $ | 577 | |||||||||||||||||
Issuance of common stock under deferred stock plan | 5 | 280 | - | - | 280 | |||||||||||||||||||
| Dividends declared | - | - | - | (7,931 | ) | (7,931 | ) | |||||||||||||||||
| Share-based compensation | - | 1,113 | - | - | 1,113 | |||||||||||||||||||
| Repurchase of common stock | (204 | ) | (7,768 | ) | - | - | (7,768 | ) | ||||||||||||||||
| Net earnings | - | - | - | 48,409 | 48,409 | 48,409 | ||||||||||||||||||
| Comprehensive income | - | - | - | - | - | $ | 48,986 | |||||||||||||||||
| Balance at September 25, 2010 | 18,491 | $ | 38,453 | $ | (2,854 | ) | $ | 344,976 | $ | 380,575 | ||||||||||||||
Issuance of common stock upon exercise of stock options | 214 | 4,608 | - | - | 4,608 | |||||||||||||||||||
Issuance of common stock for employee stock purchase plan | 20 | 769 | - | - | 769 | |||||||||||||||||||
Foreign currency translation adjustment | - | - | (1,060 | ) | - | (1,060 | ) | $ | (1,060 | ) | ||||||||||||||
Issuance of common stock to directors | 2 | 75 | - | - | 75 | |||||||||||||||||||
| Dividends declared | - | (8,754 | ) | (8,754 | ) | |||||||||||||||||||
| Share-based compensation | 1,112 | - | - | 1,112 | ||||||||||||||||||||
| Repurchase of common stock | - | - | - | - | - | |||||||||||||||||||
| Net earnings | - | - | - | 55,063 | 55,063 | 55,063 | ||||||||||||||||||
| Comprehensive income | - | - | - | - | - | $ | 54,003 | |||||||||||||||||
| Balance at September 24, 2011 | 18,727 | $ | 45,017 | $ | (3,914 | ) | $ | 391,285 | $ | 432,388 | ||||||||||||||
| The accompanying notes are an integral part of this statement. | ||||||||||||||||||||||||
| J & J SNACK FOODS CORP. AND SUBSIDIARIES | ||||||||||||
| CONSOLIDATED STATEMENTS OF CASH FLOWS | ||||||||||||
| (in thousands) | ||||||||||||
| Fiscal Year Ended | ||||||||||||
| September 24, | September 25, | September 26, | ||||||||||
| 2011 | 2010 | 2009 | ||||||||||
| (52 weeks) | (52 weeks) | (52 weeks) | ||||||||||
| Operating activities: | ||||||||||||
| Net earnings | $ | 55,063 | $ | 48,409 | $ | 41,312 | ||||||
Adjustments to reconcile net earnings to net cash provided by operating activities: | ||||||||||||
| Depreciation of fixed assets | 25,046 | 24,498 | 22,663 | |||||||||
Amortization of intangibles and deferred costs | 5,188 | 5,354 | 5,090 | |||||||||
Losses(gains) from disposals and impairment of property & equipment | 52 | (14 | ) | (31 | ) | |||||||
| Share-based compensation | 918 | 1,248 | 1,716 | |||||||||
| Gain on bargain purchase of a business | (6,580 | ) | - | - | ||||||||
| Deferred income taxes | 6,108 | 3,219 | 3,839 | |||||||||
Changes in assets and liabilities net of effects from purchase of companies: | ||||||||||||
| (Increase)decrease in accounts receivable | (5,231 | ) | (8,629 | ) | 1,144 | |||||||
| (Increase)decrease in inventories | (6,262 | ) | (4,422 | ) | 2,993 | |||||||
| Decrease(increase) in prepaid expenses and other | 1,870 | (4,101 | ) | 37 | ||||||||
Increase in accounts payable and accrued liabilities | 4,284 | 2,446 | 1,870 | |||||||||
| Net cash provided by operating activities | 80,456 | 68,008 | 80,633 | |||||||||
| Investing activities: | ||||||||||||
Payments for purchases of companies, net of cash acquired | (8,806 | ) | (25,185 | ) | - | |||||||
Purchases of property, plant and equipment | (29,124 | ) | (33,531 | ) | (27,190 | ) | ||||||
| Purchases of marketable securities | (63,293 | ) | (50,496 | ) | (66,380 | ) | ||||||
Proceeds from redemption and sales of marketable securities | 37,568 | 67,362 | 10,204 | |||||||||
Proceeds from redemption and sales of auction market preferred stock | - | - | 35,200 | |||||||||
Proceeds from disposal of property and equipment | 394 | 407 | 326 | |||||||||
| Other | (644 | ) | (12 | ) | 15 | |||||||
| Net cash used in investing activities | (63,905 | ) | (41,455 | ) | (47,825 | ) | ||||||
| Financing activities: | ||||||||||||
| Payments to repurchase common stock | - | (7,768 | ) | (12,510 | ) | |||||||
| Proceeds from issuance of common stock | 5,377 | 3,051 | 3,971 | |||||||||
| Payments on capitalized lease obligations | (244 | ) | (143 | ) | (93 | ) | ||||||
| Payment of cash dividend | (8,540 | ) | (7,749 | ) | (7,108 | ) | ||||||
| Net cash used in financing activities | (3,407 | ) | (12,609 | ) | (15,740 | ) | ||||||
Effect of exchange rate on cash and cash equivalents | (330 | ) | 378 | (990 | ) | |||||||
| Net increase in cash and cash equivalents | 12,814 | 14,322 | 16,078 | |||||||||
Cash and cash equivalents at beginning of year | 74,665 | 60,343 | 44,265 | |||||||||
Cash and cash equivalents at end of year | $ | 87,479 | $ | 74,665 | $ | 60,343 | ||||||
| The accompanying notes are an integral part of these statements. | ||||||||||||
| Fiscal year ended | |||||||||||||||
|---|---|---|---|---|---|---|---|---|---|---|---|---|---|---|---|
| September 26, 2009 (52 weeks) | September 27, 2008 (52 weeks) | September 29, 2007 (52 weeks) | |||||||||||||
| Net Sales | $ | 653,047 | $ | 629,359 | $ | 568,901 | |||||||||
| Cost of goods sold(1) | 444,203 | 442,452 | 382,374 | ||||||||||||
| Gross profit | 208,844 | 186,907 | 186,527 | ||||||||||||
| Operating expenses | |||||||||||||||
| Marketing(2) | 69,493 | 69,792 | 70,248 | ||||||||||||
| Distribution(3) | 49,705 | 52,609 | 48,945 | ||||||||||||
| Administrative(4) | 22,713 | 21,545 | 20,142 | ||||||||||||
| Other general income | (5 | ) | (375 | ) | (1,388 | ) | |||||||||
| 141,906 | 143,571 | 137,947 | |||||||||||||
| Operating income | 66,938 | 43,336 | 48,580 | ||||||||||||
| Other income (expenses) | |||||||||||||||
| Investment income | 1,386 | 2,665 | 2,720 | ||||||||||||
| Interest expense and other | (115 | ) | (116 | ) | (142 | ) | |||||||||
| 1,271 | 2,549 | 2,578 | |||||||||||||
| Earnings before income taxes | 68,209 | 45,885 | 51,158 | ||||||||||||
| Income taxes | 26,897 | 17,977 | 19,046 | ||||||||||||
| NET EARNINGS | $ | 41,312 | $ | 27,908 | $ | 32,112 | |||||||||
| Earnings per diluted share | $ | 2.21 | $ | 1.47 | $ | 1.69 | |||||||||
| Weighted average number of diluted shares | 18,713 | 19,008 | 19,005 | ||||||||||||
| Earnings per basic share | $ | 2.23 | $ | 1.49 | $ | 1.72 | |||||||||
| Weighted average number of basic shares | 18,516 | 18,770 | 18,635 | ||||||||||||
| Common Stock | ||||||||||||||||||||||||||
|---|---|---|---|---|---|---|---|---|---|---|---|---|---|---|---|---|---|---|---|---|---|---|---|---|---|---|
| Shares | Amount | Accumulated Other Comprehensive Loss | Retained Earnings | Total | Comprehensive Income | |||||||||||||||||||||
| Balance at October 1, 2006 | 18,468 | $ | 41,098 | $ | (1,964 | ) | $ | 224,522 | $ | 263,656 | ||||||||||||||||
| Issuance of common stock upon exercise of stock options | 211 | 3,669 | — | — | 3,669 | |||||||||||||||||||||
| Issuance of common stock for employee stock purchase plan | 23 | 700 | — | — | 700 | |||||||||||||||||||||
| Foreign currency translation adjustment | — | — | (42 | ) | — | (42 | ) | $ | (42 | ) | ||||||||||||||||
| Issuance of common stock under deferred stock plan | — | 275 | — | — | 275 | |||||||||||||||||||||
| Dividends declared | — | — | — | (6,326 | ) | (6,326 | ) | |||||||||||||||||||
| Share-based compensation | — | 1,538 | — | — | 1,538 | |||||||||||||||||||||
| Net earnings | — | — | — | 32,112 | 32,112 | 32,112 | ||||||||||||||||||||
| Comprehensive income | — | — | — | — | — | $ | 32,070 | |||||||||||||||||||
| Balance at September 29, 2007 | 18,702 | $ | 47,280 | $ | (2,006 | ) | $ | 250,308 | $ | 295,582 | ||||||||||||||||
| Cumulative effective of change in accounting for income taxes | — | — | — | (925 | ) | (925 | ) | |||||||||||||||||||
| Issuance of common stock upon exercise of stock options | 150 | 2,029 | — | — | 2,029 | |||||||||||||||||||||
| Issuance of common stock for employee stock purchase plan | 31 | 782 | — | — | 782 | |||||||||||||||||||||
| Foreign currency translation adjustment | — | — | 3 | — | 3 | $ | 3 | |||||||||||||||||||
| Issuance of common stock under deferred stock plan | — | 388 | — | — | 388 | |||||||||||||||||||||
| Dividends declared | — | — | — | (6,925 | ) | (6,925 | ) | |||||||||||||||||||
| Share-based compensation | �� | — | 1,475 | — | — | 1,475 | ||||||||||||||||||||
| Repurchase of common stock | (135 | ) | (3,539 | ) | — | — | (3,539 | ) | ||||||||||||||||||
| Net earnings | — | — | — | 27,908 | 27,908 | 27,908 | ||||||||||||||||||||
| Comprehensive income | — | — | — | — | — | $ | 27,911 | |||||||||||||||||||
| Balance at September 27, 2008 | 18,748 | $ | 48,415 | $ | (2,003 | ) | $ | 270,366 | $ | 316,778 | ||||||||||||||||
| Issuance of common stock upon exercise of stock options | 198 | 3,284 | — | — | 3,284 | |||||||||||||||||||||
| Issuance of common stock for employee stock purchase plan | 26 | 687 | — | — | 687 | |||||||||||||||||||||
| Foreign currency translation adjustment | — | — | (1,428 | ) | — | (1,428 | ) | $ | (1,428 | ) | ||||||||||||||||
| Issuance of common stock under deferred stock plan | 5 | 368 | — | — | 368 | |||||||||||||||||||||
| Dividends declared | — | — | — | (7,180 | ) | (7,180 | ) | |||||||||||||||||||
| Share-based compensation | — | 1,533 | — | — | 1,533 | |||||||||||||||||||||
| Repurchase of common stock | (451 | ) | (12,510 | ) | — | — | (12,510 | ) | ||||||||||||||||||
| Net earnings | — | — | — | 41,312 | 41,312 | 41,312 | ||||||||||||||||||||
| Comprehensive income | — | — | — | — | — | $ | 39,884 | |||||||||||||||||||
| Balance at September 26, 2009 | 18,526 | $ | 41,777 | $ | (3,431 | ) | $ | 304,498 | $ | 342,844 | ||||||||||||||||
| Fiscal year ended | |||||||||||||||
|---|---|---|---|---|---|---|---|---|---|---|---|---|---|---|---|
| September 26, 2009 (52 weeks) | September 27, 2008 (52 weeks) | September 29, 2007 (52 weeks) | |||||||||||||
Operating activities: | |||||||||||||||
| Net earnings | $ | 41,312 | $ | 27,908 | $ | 32,112 | |||||||||
| Adjustments to reconcile net earnings to net cash provided by operating activities: | |||||||||||||||
| Depreciation and amortization of fixed assets | 22,663 | 22,181 | 22,451 | ||||||||||||
| Amortization of intangibles and deferred costs | 5,090 | 5,289 | 4,557 | ||||||||||||
| Gains from disposals and impairment of property & equipment | (31 | ) | (174 | ) | (49 | ) | |||||||||
| Other | — | — | (150 | ) | |||||||||||
| Share-based compensation | 1,716 | 1,851 | 1,740 | ||||||||||||
| Deferred income taxes | 3,839 | 3,446 | 557 | ||||||||||||
| Changes in assets and liabilities, net of effects from purchase of companies: | |||||||||||||||
| Decrease (increase) in accounts receivable | 1,144 | (4,701 | ) | (569 | ) | ||||||||||
| Decrease (increase) in inventories | 2,993 | (2,448 | ) | (5,722 | ) | ||||||||||
| Decrease (increase) in prepaid expenses and other | 37 | (537 | ) | (65 | ) | ||||||||||
| Increase in accounts payable and accrued liabilities | 1,870 | 2,082 | 2,981 | ||||||||||||
| Net cash provided by operating activities | 80,633 | 54,897 | 57,843 | ||||||||||||
Investing activities: | |||||||||||||||
| Purchases of property, plant and equipment | (27,190 | ) | (22,781 | ) | (22,765 | ) | |||||||||
| Payments for purchases of companies, net of cash acquired | — | — | (52,747 | ) | |||||||||||
| Purchase of marketable securities | (66,380 | ) | (2,470 | ) | — | ||||||||||
| Proceeds from redemption and sales of marketable securities | 10,204 | — | — | ||||||||||||
| Purchase of auction market preferred stock | — | (10,500 | ) | (60,875 | ) | ||||||||||
| Proceeds from redemption and sales of auction market preferred stock | 35,200 | 16,500 | 78,882 | ||||||||||||
| Proceeds from disposal of property and equipment | 326 | 932 | 592 | ||||||||||||
| Other | 15 | (535 | ) | (921 | ) | ||||||||||
| Net cash used in investing activities | (47,825 | ) | (18,854 | ) | (57,834 | ) | |||||||||
Financing activities: | |||||||||||||||
| Payments to repurchase common stock | (12,510 | ) | (3,539 | ) | — | ||||||||||
| Proceeds from issuance of common stock | 3,971 | 2,811 | 4,369 | ||||||||||||
| Payments of cash dividend | (7,108 | ) | (6,781 | ) | (6,123 | ) | |||||||||
| Payments on capitalized lease obligations | (93 | ) | (91 | ) | (15 | ) | |||||||||
| Net cash used in financing activities | (15,740 | ) | (7,600 | ) | (1,769 | ) | |||||||||
| Effect of exchange rate on cash and cash equivalents | (990 | ) | 3 | (42 | ) | ||||||||||
| Net increase (decrease) in cash and cash equivalents | 16,078 | 28,446 | (1,802 | ) | |||||||||||
| Cash and cash equivalents at beginning of year | 44,265 | 15,819 | 17,621 | ||||||||||||
| Cash and cash equivalents at end of year | $ | 60,343 | $ | 44,265 | $ | 15,819 | |||||||||
| (in thousands) | ||||
| Balance at September 25, 2010 | $ | 1,249 | ||
Additions based on tax positions related to the current year | 110 | |||
| Reductions for tax positions of prior years | (386 | ) | ||
| Settlements | - | |||
| Balance at September 24, 2011 | $ | 973 | ||
| Fiscal Year Ended September 26, 2009 | |||||||||||||||
|---|---|---|---|---|---|---|---|---|---|---|---|---|---|---|---|
| Income (Numerator) | Shares (Denominator) | Per Share Amount | |||||||||||||
| (in thousands, except per share amounts) | |||||||||||||||
Earnings Per Basic Share | |||||||||||||||
| Net Income available to common stockholders | $ | 41,312 | 18,516 | $ | 2.23 | ||||||||||
Effect of Dilutive Securities | |||||||||||||||
| Options | — | 197 | (.02 | ) | |||||||||||
Earnings Per Diluted Share | |||||||||||||||
| Net Income available to common stockholders plus assumed conversions | $ | 41,312 | 18,713 | $ | 2.21 | ||||||||||
| Fiscal Year Ended September 24, 2011 | ||||||||||||
| Income | Shares | Per Share | ||||||||||
| (Numerator) | (Denominator) | Amount | ||||||||||
| (in thousands, except per share amounts) | ||||||||||||
| Earnings Per Basic Share | ||||||||||||
Net Income available to common stockholders | $ | 55,063 | 18,672 | $ | 2.95 | |||||||
| Effect of Dilutive Securities | ||||||||||||
| Options | - | 117 | $ | (0.02 | ) | |||||||
| Earnings Per Diluted Share | ||||||||||||
Net Income available to common stockholders plus assumed conversions | $ | 55,063 | 18,789 | $ | 2.93 | |||||||
143,515 anti-dilutive shares have been excluded in the computation of 2011 diluted EPS because the options' exercise price is greater than the average market price of the common stock. | ||||||||||||
| Fiscal Year Ended September 27, 2008 | |||||||||||||||
|---|---|---|---|---|---|---|---|---|---|---|---|---|---|---|---|
| Income (Numerator) | Shares (Denominator) | Per Share Amount | |||||||||||||
| (in thousands, except per share amounts) | |||||||||||||||
Earnings Per Basic Share | |||||||||||||||
| Net Income available to common stockholders | $ | 27,908 | 18,770 | $ | 1.49 | ||||||||||
Effect of Dilutive Securities | |||||||||||||||
| Options | — | 238 | (.02 | ) | |||||||||||
Earnings Per Diluted Share | |||||||||||||||
| Net Income available to common stockholders plus assumed conversions | $ | 27,908 | 19,008 | $ | 1.47 | ||||||||||
| Fiscal Year Ended September 25, 2010 | ||||||||||||
| Income | Shares | Per Share | ||||||||||
| (Numerator) | (Denominator) | Amount | ||||||||||
| (in thousands, except per share amounts) | ||||||||||||
| Earnings Per Basic Share | ||||||||||||
Net Income available to common stockholders | $ | 48,409 | 18,528 | $ | 2.61 | |||||||
| Effect of Dilutive Securities | ||||||||||||
| Options | - | 175 | (0.02 | ) | ||||||||
| Earnings Per Diluted Share | ||||||||||||
Net Income available to common stockholders plus assumed conversions | $ | 48,409 | 18,703 | $ | 2.59 | |||||||
110,910 anti-dilutive shares have been excluded in the computation of 2010 diluted EPS because the options' exercise price is greater than the average market price of the common stock. | ||||||||||||
| Fiscal Year Ended September 29, 2007 | |||||||||||||||
|---|---|---|---|---|---|---|---|---|---|---|---|---|---|---|---|
| Income (Numerator) | Shares (Denominator) | Per Share Amount | |||||||||||||
| (in thousands, except per share amounts) | |||||||||||||||
Earnings Per Basic Share | |||||||||||||||
| Net Income available to common stockholders | $ | 32,112 | 18,635 | $ | 1.72 | ||||||||||
Effect of Dilutive Securities | |||||||||||||||
| Options | — | 370 | (.03 | ) | |||||||||||
Earnings Per Diluted Share | |||||||||||||||
| Net Income available to common stockholders plus assumed conversions | $ | 32,112 | 19,005 | $ | 1.69 | ||||||||||
| Fiscal Year Ended September 26, 2009 | ||||||||||||
| Income | Shares | Per Share | ||||||||||
| (Numerator) | (Denominator) | Amount | ||||||||||
| (in thousands, except per share amounts) | ||||||||||||
| Earnings Per Basic Share | ||||||||||||
Net Income available to common stockholders | $ | 41,312 | 18,516 | $ | 2.23 | |||||||
| Effect of Dilutive Securities | ||||||||||||
| Options | - | 197 | (0.02 | ) | ||||||||
| Earnings Per Diluted Share | ||||||||||||
Net Income available to common stockholders plus assumed conversions | $ | 41,312 | 18,713 | $ | 2.21 | |||||||
114,236 anti-dilutive shares have been excluded in the computation of 2009 diluted EPS because the options' exercise price is greater than the average market price of the common stock. | ||||||||||||
| September 26, 2009 | September 27, 2008 | September 29, 2007 | |||||||||||||
|---|---|---|---|---|---|---|---|---|---|---|---|---|---|---|---|
| (in thousands, except per share amounts) | |||||||||||||||
| Stock options | $ | 508 | $ | 1,019 | $ | 833 | |||||||||
| Stock purchase plan | 237 | 137 | 146 | ||||||||||||
| Deferred stock issued to outside directors | 138 | 138 | 138 | ||||||||||||
| Restricted stock issued to an employee | 87 | 100 | 31 | ||||||||||||
| $ | 970 | $ | 1,394 | $ | 1,148 | ||||||||||
| Per diluted share | $ | .05 | $ | .07 | $ | .06 | |||||||||
| The above compensation is net of tax benefits | $ | 746 | $ | 457 | $ | 592 | |||||||||
Fiscal year ended | ||||||||||||
| September 24, | September 25, | September 26, | ||||||||||
| 2011 | 2010 | 2009 | ||||||||||
| (in thousands, except per share amounts) | ||||||||||||
| Stock options | $ | 288 | $ | 592 | $ | 508 | ||||||
| Stock purchase plan | 203 | 184 | 237 | |||||||||
Deferred stock issued to outside directors | 46 | 138 | 138 | |||||||||
Restricted stock issued to an employee | - | 28 | 87 | |||||||||
| $ | 537 | $ | 942 | $ | 970 | |||||||
| Per diluted share | $ | 0.03 | $ | 0.05 | $ | 0.05 | ||||||
The above compensation is net of tax benefits | $ | 381 | $ | 306 | $ | 746 | ||||||
| Hom/Ade | Radar | Other | |||||||||||||
|---|---|---|---|---|---|---|---|---|---|---|---|---|---|---|---|
| (in thousands) | |||||||||||||||
| Working Capital | $ | 1,410 | $ | 1,284 | $ | 989 | |||||||||
| Property, plant & equipment | 233 | 5,750 | 1,442 | ||||||||||||
| Trade Names | 6,220 | 1,960 | 3,086 | ||||||||||||
| Customer Relationships | 17,250 | 10,730 | 58 | ||||||||||||
| Covenant not to Compete | 301 | 109 | — | ||||||||||||
| Goodwill | 476 | 1,287 | 603 | ||||||||||||
| $ | 25,890 | $ | 21,120 | $ | 6,178 | ||||||||||
| California Churros | Other | |||||||
| (in thousands) | ||||||||
| Working Capital | $ | 1,075 | $ | - | ||||
| Property, plant & equipment | 2,373 | 1,135 | ||||||
| Trade Names | 4,024 | - | ||||||
| Customer Relationships | 6,737 | - | ||||||
| Covenant not to Compete | 35 | 50 | ||||||
| Goodwill | 9,756 | - | ||||||
| $ | 24,000 | $ | 1,185 | |||||
| (in thousands) | ||||
| Working Capital | $ | 6,955 | ||
| Property, plant & equipment | 11,036 | |||
| Trade Names | 1,325 | |||
| Customer Relationships | 207 | |||
| Deferred tax liability | (4,137 | ) | ||
| Net Assets Acquired | 15,386 | |||
| Purchase Price | 8,806 | |||
| Gain on bargain purchase | $ | 6,580 | ||
| Pro Forma | |||||||||||||||
|---|---|---|---|---|---|---|---|---|---|---|---|---|---|---|---|
| Fiscal year ended | |||||||||||||||
| September 26, 2009 (52 weeks) | September 27, 2008 (52 weeks) | September 29, 2007 (52 weeks) | |||||||||||||
| (in thousands except per share information) | |||||||||||||||
| Net Sales | $ | 653,047 | $ | 629,359 | $ | 581,024 | |||||||||
| Net Earnings | $ | 41,312 | $ | 27,908 | $ | 33,235 | |||||||||
| Earnings per diluted share | $ | 2.21 | $ | 1.47 | $ | 1.75 | |||||||||
| Earnings per basic share | $ | 2.23 | $ | 1.49 | $ | 1.78 | |||||||||
| Level 1 | Observable inputs such as quoted prices in active markets for identical assets or liabilities; |
| Level 2 | Observable inputs, other than Level 1 inputs in active markets, that are observable either directly or indirectly; and |
| Level 3 | Unobservable inputs for which there is little or no market data, which require the reporting entity to develop its own assumptions. |
| Amortized Cost | Gross Unrealized Gains | Fair Unrealized Losses | Market Value | ||||||||||||||||
|---|---|---|---|---|---|---|---|---|---|---|---|---|---|---|---|---|---|---|---|
| (in thousands) | |||||||||||||||||||
| US Government Agency Debt | $ | 6,009 | $ | 22 | $ | 1 | $ | 6,030 | |||||||||||
| FDIC Backed Corporate Debt | 13,213 | 198 | — | 13,411 | |||||||||||||||
| Certificates of Deposit | 39,425 | 21 | 3 | 39,443 | |||||||||||||||
| $ | 58,647 | $ | 241 | $ | 4 | $ | 58,884 | ||||||||||||
| Gross | Gross | Fair | ||||||||||||||
| Amortized | Unrealized | Unrealized | Market | |||||||||||||
| Cost | Gains | Losses | Value | |||||||||||||
| (in thousands) | ||||||||||||||||
| US Government Agency Debt | $ | 42,000 | $ | 52 | $ | 62 | $ | 41,990 | ||||||||
| FDIC Backed Corporate Debt | 8,015 | 18 | - | 8,033 | ||||||||||||
| Certificates of Deposit | 17,491 | 1 | - | 17,492 | ||||||||||||
| $ | 67,506 | $ | 71 | $ | 62 | $ | 67,515 | |||||||||
| Certificates of Deposit | $ | 2,470 | $ | — | $ | 6 | $ | 2,464 | ||||||||||
| $ | 2,470 | $ | — | $ | 6 | $ | 2,464 |
| Gross | Gross | Fair | ||||||||||||||
| Amortized | Unrealized | Unrealized | Market | |||||||||||||
| Cost | Gains | Losses | Value | |||||||||||||
| (in thousands) | ||||||||||||||||
| US Government Agency Debt | $ | 8,000 | $ | 53 | $ | - | $ | 8,053 | ||||||||
| FDIC Backed Corporate Debt | 13,107 | 144 | - | 13,251 | ||||||||||||
| Certificates of Deposit | 20,674 | 5 | 20,679 | |||||||||||||
| $ | 41,781 | $ | 202 | $ | - | $ | 41,983 | |||||||||
| September 26, 2009 | September 27, 2008 | ||||||||||||||||||
|---|---|---|---|---|---|---|---|---|---|---|---|---|---|---|---|---|---|---|---|
| Amortized Cost | Fair Market Value | Amortized Cost | Fair Market Value | ||||||||||||||||
| (in thousands) | |||||||||||||||||||
| Due in one year or less | $ | 38,653 | $ | 38,668 | $ | 2,470 | $ | 2,464 | |||||||||||
| Due after one year through five years | 19,994 | 20,216 | — | — | |||||||||||||||
| Total held to maturity securities | $ | 58,647 | $ | 58,884 | $ | 2,470 | $ | 2,464 | |||||||||||
| Less current portion | 38,653 | 38,668 | 2,470 | 2,464 | |||||||||||||||
| Long term held to maturity securities | $ | 19,994 | $ | 20,216 | $ | — | $ | — | |||||||||||
| September 24, 2011 | September 25, 2010 | |||||||||||||||
| Fair | Fair | |||||||||||||||
| Amortized | Market | Amortized | Market | |||||||||||||
| Cost | Value | Cost | Value | |||||||||||||
| (in thousands) | ||||||||||||||||
| Due in one year or less | $ | 25,506 | $ | 25,525 | $ | 15,481 | $ | 15,501 | ||||||||
Due after one year through five years | 6,000 | 6,014 | 26,300 | 26,482 | ||||||||||||
Due after five years through ten years | 36,000 | 35,976 | - | - | ||||||||||||
Total held to maturity securities | $ | 67,506 | $ | 67,515 | $ | 41,781 | $ | 41,983 | ||||||||
| Less current portion | 25,506 | 25,525 | 15,481 | 15,501 | ||||||||||||
Long term held to maturity securities | $ | 42,000 | $ | 41,990 | $ | 26,300 | $ | 26,482 | ||||||||
| Amortized Cost | Gross Unrealized Gains | Gross Unrealized Losses | Fair Market Value | ||||||||||||||||
|---|---|---|---|---|---|---|---|---|---|---|---|---|---|---|---|---|---|---|---|
| (in thousands) | |||||||||||||||||||
| Auction Market Preferred Stock | |||||||||||||||||||
| Equity Securities | $ | 35,200 | $ | — | $ | — | $ | 35,200 | |||||||||||
| $ | 35,200 | $ | — | $ | — | $ | 35,200 | ||||||||||||
| September 26, 2009 | September 27, 2008 | ||||||||||
|---|---|---|---|---|---|---|---|---|---|---|---|
| (in thousands) | |||||||||||
| Finished goods | $ | 19,913 | $ | 23,512 | |||||||
| Raw materials | 8,060 | 7,658 | |||||||||
| Packaging materials | 5,141 | 5,405 | |||||||||
| Equipment parts and other | 12,890 | 12,520 | |||||||||
| $ | 46,004 | $ | 49,095 | ||||||||
| September 24, | September 25, | |||||||
| 2011 | 2010 | |||||||
| (in thousands) | ||||||||
| Finished goods | $ | 28,770 | $ | 22,171 | ||||
| Raw materials | 13,160 | 8,702 | ||||||
| Packaging materials | 5,791 | 4,727 | ||||||
| Equipment parts and other | 15,740 | 15,030 | ||||||
| $ | 63,461 | $ | 50,630 | |||||
| September 26, 2009 | September 27, 2008 | Estimated Useful Lives | |||||||||||||
|---|---|---|---|---|---|---|---|---|---|---|---|---|---|---|---|
| (in thousands) | |||||||||||||||
| Land | $ | 1,416 | $ | 1,416 | — | ||||||||||
| Buildings | 8,672 | 8,672 | 15–39.5 years | ||||||||||||
| Plant machinery and equipment | 133,758 | 124,591 | 5–20 years | ||||||||||||
| Marketing equipment | 202,708 | 195,878 | 5–7 years | ||||||||||||
| Transportation equipment | 2,733 | 2,878 | 5 years | ||||||||||||
| Office equipment | 11,461 | 10,820 | 3–5 years | ||||||||||||
| Improvements | 18,454 | 17,694 | 5–20 years | ||||||||||||
| Construction in progress | 3,954 | 2,215 | — | ||||||||||||
| $ | 383,156 | $ | 364,164 | ||||||||||||
| September 24, | September 25, | Estimated | ||||||||||
| 2011 | 2010 | Useful Lives | ||||||||||
(in thousands) | ||||||||||||
| Land | $ | 2,496 | $ | 2,016 | - | |||||||
| Buildings | 15,766 | 13,266 | 15-39.5 years | |||||||||
Plant machinery and equipment | 158,408 | 144,697 | 5-20 years | |||||||||
| Marketing equipment | 223,490 | 214,545 | 5-7 years | |||||||||
Transportation equipment | 4,264 | 3,785 | 5 years | |||||||||
| Office equipment | 13,650 | 12,690 | 3-5 years | |||||||||
| Improvements | 21,054 | 19,590 | 5-20 years | |||||||||
Construction in Progress | 7,728 | 3,814 | - | |||||||||
| $ | 446,856 | $ | 414,403 | |||||||||
| September 26, 2009 | September 27, 2008 | ||||||||||||||||||
|---|---|---|---|---|---|---|---|---|---|---|---|---|---|---|---|---|---|---|---|
| Gross Carrying Amount | Accumulated Amortization | Gross Carrying Amount | Accumulated Amortization | ||||||||||||||||
| (in thousands) | |||||||||||||||||||
Food Service | |||||||||||||||||||
| Indefinite lived intangible assets | |||||||||||||||||||
| Trade Names | $ | 8,180 | $ | — | $ | 8,180 | $ | — | |||||||||||
| Amortized intangible assets | |||||||||||||||||||
| Non compete agreements | 435 | 282 | 435 | 215 | |||||||||||||||
| Customer relationships | 33,287 | 11,526 | 33,287 | 8,087 | |||||||||||||||
| Licenses and rights | 3,606 | 2,061 | 3,606 | 1,835 | |||||||||||||||
| $ | 45,508 | $ | 13,869 | $ | 45,508 | $ | 10,137 | ||||||||||||
| September 24, 2011 | September 25, 2010 | |||||||||||||||
| Gross | Gross | |||||||||||||||
| Carrying | Accumulated | Carrying | Accumulated | |||||||||||||
| Amount | Amortization | Amount | Amortization | |||||||||||||
| (in thousands) | ||||||||||||||||
| FOOD SERVICE | ||||||||||||||||
Indefinite lived intangible assets | ||||||||||||||||
| Trade Names | $ | 12,880 | $ | - | $ | 12,204 | $ | - | ||||||||
| Amortized intangible assets | ||||||||||||||||
| Non compete agreements | 470 | 425 | 470 | 351 | ||||||||||||
| Customer relationships | 40,024 | 18,993 | 40,024 | 15,160 | ||||||||||||
| License and rights | 3,606 | 2,425 | 3,606 | 2,287 | ||||||||||||
| $ | 56,980 | $ | 21,843 | $ | 56,304 | $ | 17,798 | |||||||||
| RETAIL SUPERMARKETS | ||||||||||||||||
Indefinite lived intangible assets | ||||||||||||||||
| Trade Names | $ | 3,380 | $ | - | $ | 2,731 | $ | - | ||||||||
| Amortized Intangible Assets | ||||||||||||||||
| Customer relationships | 207 | 8 | - | - | ||||||||||||
| $ | 3,587 | $ | 8 | $ | 2,731 | $ | - | |||||||||
| FROZEN BEVERAGES | ||||||||||||||||
Indefinite lived intangible assets | ||||||||||||||||
| Trade Names | $ | 9,315 | $ | - | $ | 9,315 | $ | - | ||||||||
| Amortized intangible assets | ||||||||||||||||
| Non compete agreements | 198 | 189 | 198 | 165 | ||||||||||||
| Customer relationships | 6,478 | 3,540 | 6,478 | 2,876 | ||||||||||||
| Licenses and rights | 1,601 | 574 | 1,601 | 504 | ||||||||||||
| $ | 17,592 | $ | 4,303 | $ | 17,592 | $ | 3,545 | |||||||||
| CONSOLIDATED | $ | 78,159 | $ | 26,154 | $ | 76,627 | $ | 21,343 | ||||||||
| September 26, 2009 | September 27, 2008 | ||||||||||||||||||
|---|---|---|---|---|---|---|---|---|---|---|---|---|---|---|---|---|---|---|---|
| Gross Carrying Amount | Accumulated Amortization | Gross Carrying Amount | Accumulated Amortization | ||||||||||||||||
| (in thousands) | |||||||||||||||||||
Retail Supermarket | |||||||||||||||||||
| Indefinite lived intangible assets | |||||||||||||||||||
| Trade Names | $ | 2,731 | $ | — | $ | 2,731 | $ | — | |||||||||||
The Restaurant Group | |||||||||||||||||||
| Amortized intangible assets | |||||||||||||||||||
| Licenses and rights | $ | — | $ | — | $ | — | $ | — | |||||||||||
Frozen Beverages | |||||||||||||||||||
| Indefinite lived intangible assets | |||||||||||||||||||
| Trade Names | $ | 9,315 | $ | — | $ | 9,315 | $ | — | |||||||||||
Amortized intangible assets | |||||||||||||||||||
| Non compete agreements | 148 | 141 | 148 | 99 | |||||||||||||||
| Customer relationships | 6,478 | 2,212 | 6,478 | 1,548 | |||||||||||||||
| Licenses and rights | 1,601 | 434 | 1,601 | 364 | |||||||||||||||
| $ | 17,542 | $ | 2,787 | $ | 17,542 | $ | 2,011 | ||||||||||||
| Food Service | Retail Supermarkets | Restaurant Group | Frozen Beverages | Total | |||||||||||||||||||
|---|---|---|---|---|---|---|---|---|---|---|---|---|---|---|---|---|---|---|---|---|---|---|---|
| (in thousands) | |||||||||||||||||||||||
| Balance at September 26, 2009 | $ | 23,988 | $ | — | $ | 386 | $ | 35,940 | $ | 60,314 | |||||||||||||
| Balance at September 27, 2008 | $ | 23,988 | $ | — | $ | 386 | $ | 35,940 | $ | 60,314 | |||||||||||||
| Food | Retail | Frozen | ||||||||||||||
| Service | Supermarkets | Beverages | Total | |||||||||||||
| (in thousands) | ||||||||||||||||
Balance at September 24, 2011 | $ | 34,130 | $ | - | $ | 35,940 | $ | 70,070 | ||||||||
Balance at September 25, 2010 | $ | 34,130 | $ | - | $ | 35,940 | $ | 70,070 | ||||||||
| September 26, 2009 | September 27, 2008 | ||||||||||
|---|---|---|---|---|---|---|---|---|---|---|---|
| (in thousands) | |||||||||||
| Capital lease obligations, with interest at 2.6%, payable in monthly installments of $8,700, through August 2013 | $ | 381 | $ | 474 | |||||||
| Less current portion | 96 | 93 | |||||||||
| $ | 285 | $ | 381 | ||||||||
| September 24, | September 25, | |||||||
| 2011 | 2010 | |||||||
| (in thousands) | ||||||||
Capital lease obligations, with interest at 7.6%, payable in monthly installments of $3,162, through November 2017 | $ | 182 | $ | - | ||||
Capital lease obligations, with interest at 5.8%, payable in monthly installments of $14,625, through May 2014 | 432 | 578 | ||||||
Capital lease obligations, with interest at 2.6%, payable in monthly installments in $8,700, through August 2013 | 187 | 285 | ||||||
| 801 | 863 | |||||||
| Less current portion | 278 | 244 | ||||||
| $ | 523 | $ | 619 | |||||
| Fiscal year ended | |||||||||||||||
|---|---|---|---|---|---|---|---|---|---|---|---|---|---|---|---|
| September 26, 2009 | September 27, 2008 | September 29, 2007 | |||||||||||||
| (in thousands) | |||||||||||||||
| Current | |||||||||||||||
| U.S. Federal | $ | 18,574 | $ | 11,417 | $ | 15,485 | |||||||||
| Foreign | 706 | 844 | 423 | ||||||||||||
| State | 3,744 | 2,270 | 2,581 | ||||||||||||
| 23,024 | 14,531 | 18,489 | |||||||||||||
| Deferred | |||||||||||||||
| U.S. Federal | 3,106 | 2,983 | 474 | ||||||||||||
| Foreign | 109 | (168 | ) | — | |||||||||||
| State | 658 | 631 | 83 | ||||||||||||
| 3,873 | 3,446 | 557 | |||||||||||||
| $ | 26,897 | $ | 17,977 | $ | 19,046 | ||||||||||
Fiscal year ended | ||||||||||||
| September 24, | September 25, | September 26, | ||||||||||
| 2011 | 2010 | 2009 | ||||||||||
| (in thousands) | ||||||||||||
| Current | ||||||||||||
| U.S. Federal | $ | 17,065 | $ | 21,020 | $ | 18,574 | ||||||
| Foreign | 950 | 970 | 706 | |||||||||
| State | 4,871 | 4,484 | 3,744 | |||||||||
| 22,886 | 26,474 | 23,024 | ||||||||||
| Deferred | ||||||||||||
| U.S. Federal | $ | 3,988 | $ | 2,692 | $ | 3,106 | ||||||
| Foreign | 409 | (48 | ) | 109 | ||||||||
| State | 1,720 | 570 | 658 | |||||||||
| 6,117 | 3,214 | 3,873 | ||||||||||
| $ | 29,003 | $ | 29,688 | $ | 26,897 | |||||||
| Fiscal year ended | |||||||||||||||
|---|---|---|---|---|---|---|---|---|---|---|---|---|---|---|---|
| September 26, 2009 | September 27, 2008 | September 29, 2007 | |||||||||||||
| (in thousands) | |||||||||||||||
| Income taxes at statutory rates | $ | 23,873 | $ | 16,059 | $ | 17,905 | |||||||||
| Increase (decrease) in taxes resulting from: | |||||||||||||||
| State income taxes, net of federal income tax benefit | 2,958 | 1,918 | 1,819 | ||||||||||||
| Other, net | 66 | — | (678 | ) | |||||||||||
| $ | 26,897 | $ | 17,977 | $ | 19,046 | ||||||||||
| Fiscal year ended | ||||||||||||
| September 24, | September 25, | September 26, | ||||||||||
| 2011 | 2010 | 2009 | ||||||||||
| (in thousands) | ||||||||||||
Income taxes at statutory rates | $ | 29,423 | $ | 27,334 | $ | 23,873 | ||||||
Increase (decrease) in taxes resulting from: | ||||||||||||
State income taxes, net of federal income tax benefit | 3,279 | 3,403 | 2,958 | |||||||||
Domestic production activities deduction | (1,500 | ) | (850 | ) | (400 | ) | ||||||
| Gain on bargain purchase | (2,303 | ) | - | - | ||||||||
| Other, net | 104 | (199 | ) | 466 | ||||||||
| $ | 29,003 | $ | 29,688 | $ | 26,897 | |||||||
| September 26, 2009 | September 27, 2008 | ||||||||||
|---|---|---|---|---|---|---|---|---|---|---|---|
| (in thousands) | |||||||||||
| Deferred tax assets | |||||||||||
| Vacation accrual | $ | 1,233 | $ | 1,117 | |||||||
| Insurance accrual | 2,943 | 2,634 | |||||||||
| Deferred income | 67 | 105 | |||||||||
| Allowances | 1,902 | 1,865 | |||||||||
| Inventory capitalization | 499 | 519 | |||||||||
| Share-based compensation | 1,113 | 896 | |||||||||
| Other, net | 65 | 104 | |||||||||
| 7,822 | 7,240 | ||||||||||
| Deferred tax liabilities | |||||||||||
| Amortization of goodwill and other intangible assets | 13,388 | 11,899 | |||||||||
| Depreciation of property and equipment | 17,793 | 14,818 | |||||||||
| Other, net | 15 | 24 | |||||||||
| 31,196 | 26,741 | ||||||||||
| $ | 23,374 | $ | 19,501 | ||||||||
| September 24, | September 25, | |||||||
| 2011 | 2010 | |||||||
| (in thousands) | ||||||||
| Deferred tax assets | ||||||||
| Vacation accrual | $ | 1,390 | $ | 1,334 | ||||
| Insurance accrual | 2,591 | 3,098 | ||||||
| Deferred income | 34 | 60 | ||||||
| Allowances | 2,074 | 1,881 | ||||||
| Inventory capitalization | 653 | 573 | ||||||
| Share-based compensation | 1,301 | 1,209 | ||||||
| Unclaimed Property | 632 | - | ||||||
| Other, net | 19 | 56 | ||||||
| 8,694 | 8,211 | |||||||
| Deferred tax liabilities | ||||||||
Amortization of goodwill and other intangible assets | 17,418 | 14,885 | ||||||
Depreciation of property and equipment | 28,090 | 19,907 | ||||||
| Other, net | 28 | 7 | ||||||
| 45,536 | 34,799 | |||||||
| $ | 36,842 | $ | 26,588 | |||||
| Plants and Offices | Equipment | Total | |||||||||||||
|---|---|---|---|---|---|---|---|---|---|---|---|---|---|---|---|
| (in thousands) | |||||||||||||||
| 2010 | $ | 5,008 | $ | 4,159 | $ | 9,167 | |||||||||
| 2011 | 4,263 | 3,543 | 7,806 | ||||||||||||
| 2012 | 3,868 | 2,219 | 6,087 | ||||||||||||
| 2013 | 3,516 | 724 | 4,240 | ||||||||||||
| 2014 | 3,357 | 29 | 3,386 | ||||||||||||
| 2015 and thereafter | 12,490 | — | 12,490 | ||||||||||||
| $ | 32,502 | $ | 10,674 | $ | 43,176 | ||||||||||
| Plants and | ||||||||||||
| Offices | Equipment | Total | ||||||||||
| (in thousands) | ||||||||||||
| 2012 | $ | 5,390 | $ | 3,419 | $ | 8,809 | ||||||
| 2013 | 4,811 | 2,010 | 6,821 | |||||||||
| 2014 | 4,407 | 1,223 | 5,630 | |||||||||
| 2015 | 3,971 | 415 | 4,386 | |||||||||
| 2016 | 2,911 | 80 | 2,991 | |||||||||
| 2017 and thereafter | 20,626 | 35 | 20,661 | |||||||||
| $ | 42,116 | $ | 7,182 | $ | 49,298 | |||||||
| Incentive Stock Options | Nonqualified Stock Options | ||||||||||||||||||
|---|---|---|---|---|---|---|---|---|---|---|---|---|---|---|---|---|---|---|---|
| Stock Options Outstanding | Weighted- Average Exercise Price | Stock Options Outstanding | Weighted- Average Exercise Price | ||||||||||||||||
| Balance, October 1, 2007 | 729,935 | 17.93 | 492,354 | 13.30 | |||||||||||||||
| Granted | 114,700 | 41.45 | 35,000 | 36.49 | |||||||||||||||
| Exercised | (151,130 | ) | 17.45 | (68,000 | ) | 6.19 | |||||||||||||
| Cancelled | (20,100 | ) | 23.70 | — | |||||||||||||||
| Balance, September 29, 2007 | 673,405 | 21.87 | 459,354 | 16.12 | |||||||||||||||
| Granted | 96,345 | 33.22 | 20,000 | 34.17 | |||||||||||||||
| Exercised | (111,768 | ) | 16.57 | (77,000 | ) | 9.66 | |||||||||||||
| Cancelled | (44,150 | ) | 26.36 | (5,000 | ) | 38.54 | |||||||||||||
| Balance, September 27, 2008 | 613,832 | 24.29 | 397,354 | 18.00 | |||||||||||||||
| Granted | 4,500 | 32.13 | — | — | |||||||||||||||
| Exercised | (169,388 | ) | 18.73 | (71,000 | ) | 10.70 | |||||||||||||
| Cancelled | (20,000 | ) | 26.79 | (20,000 | ) | 20.02 | |||||||||||||
| Balance, September 26, 2009 | 428,944 | $ | 26.45 | 306,354 | $ | 19.55 | |||||||||||||
| Exercisable Options, September 26, 2009 | 238,149 | 236,354 | |||||||||||||||||
| Incentive Stock Options | Nonqualified Stock Options | |||||||||||||||
| Weighted- | Weighted- | |||||||||||||||
| Stock | Average | Stock | Average | |||||||||||||
| Options | Exercise | Options | Exercise | |||||||||||||
| Outstanding | Price | Outstanding | Price | |||||||||||||
| Balance, September 28, 2008 | 613,832 | $ | 24.29 | 397,354 | $ | 18.00 | ||||||||||
| Granted | 4,500 | 32.13 | - | - | ||||||||||||
| Exercised | (169,388 | ) | 18.73 | (71,000 | ) | 10.70 | ||||||||||
| Cancelled | (20,000 | ) | 26.79 | (20,000 | ) | 20.02 | ||||||||||
| Balance, September 26, 2009 | 428,944 | 26.45 | 306,354 | 19.55 | ||||||||||||
| Granted | 101,330 | 36.77 | 20,000 | 41.75 | ||||||||||||
| Exercised | (92,760 | ) | 16.40 | (72,354 | ) | 10.12 | ||||||||||
| Cancelled | (19,505 | ) | 33.47 | (10,000 | ) | 38.81 | ||||||||||
| Balance, September 25, 2010 | 418,009 | 30.86 | 244,000 | 23.38 | ||||||||||||
| Granted | 101,200 | 50.93 | 45,315 | 49.57 | ||||||||||||
| Exercised | (186,039 | ) | 23.52 | (62,000 | ) | 10.30 | ||||||||||
Cancelled | (10,050 | ) | 36.77 | - | - | |||||||||||
| Balance, September 24, 2011 | 323,120 | $ | 41.18 | 227,315 | $ | 32.17 | ||||||||||
| Exercisable Options | ||||||||||||||||
| September 24, 2011 | 126,436 | 142,000 | ||||||||||||||
| Options Outstanding | Options Exercisable | ||||||||||||||||||||||
|---|---|---|---|---|---|---|---|---|---|---|---|---|---|---|---|---|---|---|---|---|---|---|---|
| Range of Exercise Prices | Number Outstanding at September 26, 2009 | Weighted- Average Remaining Contractual Life | Weighted- Average Exercise Price | Number Exercisable at September 26, 2009 | Weighted- Average Exercise Price | ||||||||||||||||||
| $ 6.38 – $ 7.94 | 47,000 | .9 | years | $ | 6.57 | 47,000 | $ | 6.57 | |||||||||||||||
| $10.60 – $10.60 | 92,632 | 1.9 | years | $ | 10.60 | 92,632 | $ | 10.60 | |||||||||||||||
| $27.42 – $38.28 | 194,612 | 2.2 | years | $ | 31.43 | 98,517 | $ | 29.70 | |||||||||||||||
| $41.50 – $41.60 | 94,700 | 2.2 | years | $ | 41.60 | — | $ | — | |||||||||||||||
| 428,944 | 238,149 | ||||||||||||||||||||||
| Options Outstanding | Options Exercisable | ||||||||||||||||||||||
|---|---|---|---|---|---|---|---|---|---|---|---|---|---|---|---|---|---|---|---|---|---|---|---|
| Range of Exercise Prices | Number Outstanding at September 26, 2009 | Weighted- Average Remaining Contractual Life | Weighted- Average Exercise Price | Number Exercisable at September 26, 2009 | Weighted- Average Exercise Price | ||||||||||||||||||
| $ 7.97 – $10.30 | 124,000 | 1.1 | years | $ | 9.13 | 124,000 | $ | 9.13 | |||||||||||||||
| $19.77 – $27.42 | 92,354 | 3.0 | years | $ | 20.27 | 92,354 | $ | 20.27 | |||||||||||||||
| $29.78 – $38.81 | 90,000 | 7.0 | years | $ | 33.17 | 20,000 | $ | 29.78 | |||||||||||||||
| 306,354 | 236,354 | ||||||||||||||||||||||
The following table summarizes information about incentive stock options outstanding at September 24, 2011: | |||||||||||||||||
| Options Outstanding | Options Exercisable | ||||||||||||||||
| Number | Weighted- | Number | |||||||||||||||
| Outstanding | Average | Weighted- | Exercisable | Weighted- | |||||||||||||
| at | Remaining | Average | at | Average | |||||||||||||
| Range of | September 24, | Contractual | Exercise | September 24, | Exercise | ||||||||||||
| Exercise Prices | 2011 | Life | Price | 2011 | Price | ||||||||||||
| $27.45-$41.16 | 166,170 | 2.3 years | $ | 35.15 | 69,936 | $ | 33.25 | ||||||||||
| $41.50-$51.14 | 156,950 | 3.2 years | $ | 47.57 | 56,500 | $ | 41.60 | ||||||||||
| 323,120 | 126,436 | ||||||||||||||||
The following table summarizes information about nonqualified stock options outstanding at September 24, 2011: | |||||||||||||||||
| Options Outstanding | Options Exercisable | ||||||||||||||||
| Number | Weighted- | �� | Number | ||||||||||||||
| Outstanding | Average | Weighted- | Exercisable | Weighted- | |||||||||||||
| at | Remaining | Average | at | Average | |||||||||||||
| Range of | September 24, | Contractual | Exercise | September 24, | Exercise | ||||||||||||
| Exercise Prices | 2011 | Life | Price | 2011 | Price | ||||||||||||
| $19.77-$20.43 | 82,000 | 1.2 years | $ | 19.93 | 82,000 | $ | 19.93 | ||||||||||
| $29.78-$41.75 | 100,000 | 6.2 years | $ | 34.32 | 60,000 | $ | 31.90 | ||||||||||
| $47.59-$51.14 | 45,315 | 7.1 years | $ | 49.57 | - | $ | - | ||||||||||
| 227,315 | 142,000 | ||||||||||||||||
| Fiscal Year Ended | |||||||||||||||
|---|---|---|---|---|---|---|---|---|---|---|---|---|---|---|---|
| September 26, 2009 | September 27, 2008 | September 29, 2007 | |||||||||||||
| (in thousands) | |||||||||||||||
| Cash paid for: | |||||||||||||||
| Interest | $ | 14 | $ | 21 | $ | 6 | |||||||||
| Income taxes | 21,345 | 13,896 | 17,753 | ||||||||||||
| Non cash items: | |||||||||||||||
| Capital leases | $ | — | $ | — | $ | 580 | |||||||||
| Fiscal Year Ended | ||||||||||||
| September 24, | September 25, | September 26, | ||||||||||
| 2011 | 2010 | 2009 | ||||||||||
| (in thousands) | ||||||||||||
| Cash paid for: | ||||||||||||
| Interest | $ | 36 | $ | 76 | $ | 14 | ||||||
| Income taxes | 19,594 | 31,379 | 21,345 | |||||||||
| Non cash items: | ||||||||||||
| Capital leases | $ | 182 | $ | 625 | $ | - | ||||||
| Fiscal year ended | |||||||||||||||
|---|---|---|---|---|---|---|---|---|---|---|---|---|---|---|---|
| September 26, 2009 | September 27, 2008 | September 29, 2007 | |||||||||||||
| (in thousands) | |||||||||||||||
| Sales to external customers: | |||||||||||||||
| Food Service | $ | 417,753 | $ | 400,194 | $ | 355,764 | |||||||||
| Retail Supermarket | 65,158 | 57,112 | 52,131 | ||||||||||||
| The Restaurant Group | 1,257 | 1,635 | 2,766 | ||||||||||||
| Frozen Beverages | 168,879 | 170,418 | 158,240 | ||||||||||||
| $ | 653,047 | $ | 629,359 | $ | 568,901 | ||||||||||
| Depreciation and Amortization: | |||||||||||||||
| Food Service | $ | 16,530 | $ | 16,655 | $ | 16,176 | |||||||||
| Retail Supermarket | — | — | — | ||||||||||||
| The Restaurant Group | 33 | 54 | 60 | ||||||||||||
| Frozen Beverages | 11,190 | 10,761 | 10,772 | ||||||||||||
| $ | 27,753 | $ | 27,470 | $ | 27,008 | ||||||||||
| Fiscal year ended | ||||||||||||
| September 24, | September 25, | September 26, | ||||||||||
| 2011 | 2010 | 2009 | ||||||||||
| (in thousands) | ||||||||||||
| Sales to External Customers: | ||||||||||||
| Food Service | ||||||||||||
| Soft pretzels | $ | 103,943 | $ | 100,694 | $ | 99,471 | ||||||
| Frozen juices and ices | 49,740 | 47,273 | 50,272 | |||||||||
| Churros | 41,583 | 31,732 | 29,404 | |||||||||
| Handhelds | 8,865 | - | - | |||||||||
| Bakery | 241,288 | 234,032 | 229,371 | |||||||||
| Other | 18,143 | 24,075 | 10,492 | |||||||||
| $ | 463,562 | $ | 437,806 | $ | 419,010 | |||||||
| Retail Supermarket | ||||||||||||
| Soft pretzels | $ | 32,044 | $ | 30,463 | $ | 30,506 | ||||||
| Frozen juices and ices | 51,940 | 48,288 | 37,819 | |||||||||
| Handhelds | 9,424 | - | - | |||||||||
| Coupon redemption | (3,857 | ) | (3,399 | ) | (3,753 | ) | ||||||
| Other | 1,548 | 767 | 586 | |||||||||
| $ | 91,099 | $ | 76,119 | $ | 65,158 | |||||||
| Frozen Beverages | ||||||||||||
| Beverages | $ | 133,372 | $ | 128,125 | $ | 112,983 | ||||||
Repair and maintenance service | 42,608 | 40,410 | 42,013 | |||||||||
| Machines sales | 11,362 | 11,964 | 11,729 | |||||||||
| Other | 2,068 | 2,279 | 2,154 | |||||||||
| $ | 189,410 | $ | 182,778 | $ | 168,879 | |||||||
| Consolidated Sales | $ | 744,071 | $ | 696,703 | $ | 653,047 | ||||||
| Depreciation and Amortization: | ||||||||||||
| Food Service | $ | 16,994 | $ | 17,252 | $ | 16,563 | ||||||
| Retail Supermarket | - | - | - | |||||||||
| Frozen Beverages | 13,240 | 12,600 | 11,190 | |||||||||
| $ | 30,234 | $ | 29,852 | $ | 27,753 | |||||||
| Operating Income: | ||||||||||||
| Food Service | $ | 46,171 | $ | 50,220 | $ | 44,960 | ||||||
| Retail Supermarket | 11,830 | 11,281 | 7,442 | |||||||||
| Frozen Beverages | 18,582 | 15,661 | 14,536 | |||||||||
| $ | 76,583 | $ | 77,162 | $ | 66,938 | |||||||
| Capital Expenditures: | ||||||||||||
| Food Service | $ | 14,905 | $ | 18,392 | $ | 14,979 | ||||||
| Retail Supermarket | - | - | - | |||||||||
| Frozen Beverages | 14,219 | 15,139 | 12,211 | |||||||||
| $ | 29,124 | $ | 33,531 | $ | 27,190 | |||||||
| Assets: | ||||||||||||
| Food Service | $ | 405,927 | $ | 341,285 | $ | 307,814 | ||||||
| Retail Supermarket | 3,579 | 2,731 | 2,731 | |||||||||
| Frozen Beverages | 141,310 | 139,978 | 129,282 | |||||||||
| $ | 550,816 | $ | 483,994 | $ | 439,827 | |||||||
| Fiscal year ended | |||||||||||||||
|---|---|---|---|---|---|---|---|---|---|---|---|---|---|---|---|
| September 26, 2009 | September 27, 2008 | September 29, 2007 | |||||||||||||
| (in thousands) | |||||||||||||||
| Operating Income (Loss): | |||||||||||||||
| Food Service | $ | 45,024 | $ | 24,784 | $ | 33,417 | |||||||||
| Retail Supermarket | 7,442 | 4,665 | (2 | ) | |||||||||||
| The Restaurant Group | (64 | ) | (140 | ) | 31 | ||||||||||
| Frozen Beverages | 14,536 | 14,027 | 15,134 | ||||||||||||
| �� | $ | 66,938 | $ | 43,336 | $ | 48,580 | |||||||||
| Capital Expenditures: | |||||||||||||||
| Food Service | $ | 14,979 | $ | 11,898 | $ | 12,755 | |||||||||
| Retail Supermarket | — | — | — | ||||||||||||
| The Restaurant Group | — | — | 102 | ||||||||||||
| Frozen Beverages | 12,211 | 10,883 | 9,908 | ||||||||||||
| $ | 27,190 | $ | 22,781 | $ | 22,765 | ||||||||||
| Assets: | |||||||||||||||
| Food Service | $ | 309,988 | $ | 277,481 | $ | 252,843 | |||||||||
| Retail Supermarket | — | — | — | ||||||||||||
| The Restaurant Group | 557 | 629 | 690 | ||||||||||||
| Frozen Beverages | 129,282 | 130,298 | 126,755 | ||||||||||||
| $ | 439,827 | $ | 408,408 | $ | 380,288 | ||||||||||
| Fiscal Year Ended September 24, 2011 | ||||||||||||||||
| Net Earnings | ||||||||||||||||
| Per | ||||||||||||||||
| Gross | Net | Diluted | ||||||||||||||
| Net Sales | Profit | Earnings | Share(1) | |||||||||||||
| (in thousands, except per share information) | ||||||||||||||||
| 1st Quarter | $ | 155,632 | $ | 46,101 | $ | 7,094 | $ | 0.38 | ||||||||
| 2nd Quarter | 162,731 | 49,022 | 8,659 | 0.46 | ||||||||||||
| 3rd Quarter | 206,328 | 67,541 | 23,326 | 1.24 | ||||||||||||
| 4th Quarter | 219,380 | 67,110 | 15,984 | 0.85 | ||||||||||||
| Total | $ | 744,071 | $ | 229,774 | $ | 55,063 | $ | 2.93 | ||||||||
| Fiscal Year Ended September 25, 2010 | ||||||||||||||||
| Net Earnings | ||||||||||||||||
| Per | ||||||||||||||||
| Gross | Net | Diluted | ||||||||||||||
| Net Sales | Profit | Earnings | Share(1) | |||||||||||||
| (in thousands, except per share information) | ||||||||||||||||
| 1st Quarter | $ | 149,102 | $ | 46,019 | $ | 7,091 | $ | 0.38 | ||||||||
| 2nd Quarter | 157,361 | 49,797 | 9,000 | 0.48 | ||||||||||||
| 3rd Quarter | 189,729 | 65,031 | 15,861 | 0.85 | ||||||||||||
| 4th Quarter | 200,511 | 66,933 | 16,457 | 0.88 | ||||||||||||
| Total | $ | 696,703 | $ | 227,780 | $ | 48,409 | $ | 2.59 | ||||||||
| Fiscal Year Ended September 26, 2009 | |||||||||||||||||||
|---|---|---|---|---|---|---|---|---|---|---|---|---|---|---|---|---|---|---|---|
| Net Sales | Gross Profit | Net Earnings | Net Earnings Per Diluted Share (1) | ||||||||||||||||
| (in thousands, except per share information) | |||||||||||||||||||
1st Quarter | $ | 141,142 | $ | 40,682 | $ | 4,319 | $ | .23 | |||||||||||
2nd Quarter | 149,352 | 45,377 | 7,244 | .39 | |||||||||||||||
3rd Quarter | 179,761 | 61,034 | 14,929 | .80 | |||||||||||||||
4th Quarter | 182,792 | 61,751 | 14,820 | .79 | |||||||||||||||
| Total | $ | 653,047 | $ | 208,844 | $ | 41,312 | $ | 2.21 | |||||||||||
| Fiscal Year Ended September 27, 2008 | |||||||||||||||||||
|---|---|---|---|---|---|---|---|---|---|---|---|---|---|---|---|---|---|---|---|
| Net Sales | Gross Profit | Net Earnings | Net Earnings Per Diluted Share (1) | ||||||||||||||||
| (in thousands, except per share information) | |||||||||||||||||||
1st Quarter | $ | 130,898 | $ | 35,387 | $ | 1,897 | $ | .10 | |||||||||||
2nd Quarter | 144,229 | 40,400 | 3,998 | .21 | |||||||||||||||
3rd Quarter | 176,839 | 55,752 | 10,820 | .57 | |||||||||||||||
4th Quarter | 177,393 | 55,368 | 11,193 | .59 | |||||||||||||||
| Total | $ | 629,359 | $ | 186,907 | $ | 27,908 | $ | 1.47 | |||||||||||
| (1) | Total of quarterly amounts do not necessarily agree to the annual report amounts due to separate quarterly calculations of weighted average shares outstanding |
| Year | Description | Opening Balance | Charged to Expense | Deductions | Closing Balance | |||||||||||||||||
|---|---|---|---|---|---|---|---|---|---|---|---|---|---|---|---|---|---|---|---|---|---|---|
| 2009 | Allowance for doubtful account | $ | 926,000 | $ | 492,000 | $ | 795,000 | (1) | $ | 623,000 | ||||||||||||
| 2008 | Allowance for doubtful accounts | $ | 1,052,000 | $ | 502,000 | $ | 628,000 | (1) | $ | 926,000 | ||||||||||||
| 2007 | Allowance for doubtful accounts | $ | 963,000 | $ | 189,000 | $ | 100,000 | (1) | $ | 1,052,000 | ||||||||||||
| 2009 | Inventory Reserve | $ | 3,817,000 | $ | 2,036,000 | $ | 1,644,000 | (2) | $ | 4,209,000 | ||||||||||||
| 2008 | Inventory Reserve | $ | 2,864,000 | $ | 3,149,000 | $ | 2,196,000 | (2) | $ | 3,817,000 | ||||||||||||
| 2007 | Inventory Reserve | $ | 2,330,000 | $ | 1,911,000 | $ | 1,377,000 | (2) | $ | 2,864,000 | ||||||||||||
| Opening | Charged to | Closing | |||||||||||||||||
| Year | Description | Balance | Expense | Deductions | Balance | ||||||||||||||
| 2011 | Allowance for doubtful accounts | $ | 591,000 | $ | 423,000 | $ | 361,000 | (1 | ) | $ | 653,000 | ||||||||
| 2010 | Allowance for doubtful accounts | $ | 623,000 | $ | 493,000 | $ | 525,000 | (1 | ) | $ | 591,000 | ||||||||
| 2009 | Allowance for doubtful accounts | $ | 926,000 | $ | 492,000 | $ | 795,000 | (1 | ) | $ | 623,000 | ||||||||
| 2011 | Inventory Reserve | $ | 4,189,000 | $ | 1,931,000 | $ | 1,505,000 | (2 | ) | $ | 4,615,000 | ||||||||
| 2010 | Inventory Reserve | $ | 4,209,000 | $ | 1,509,000 | $ | 1,529,000 | (2 | ) | $ | 4,189,000 | ||||||||
| 2009 | Inventory Reserve | $ | 3,817,000 | $ | 2,036,000 | $ | 1,644,000 | (2 | ) | $ | 4,209,000 | ||||||||
| (1) Write-off of uncollectible accounts receivable. | |||||||||||||||||||
| (2) Disposals of obsolete inventory. | |||||||||||||||||||