0001156039antm:CommercialSpecialtyBusinessSegmentMemberantm:ManagedCareServicesMember2018-01-012018-12-31
UNITED STATES
SECURITIES AND EXCHANGE COMMISSION
Washington, D.C. 20549
FORM 10-K
(Mark One)
| | | | | |
| ☒ | ANNUAL REPORT PURSUANT TO SECTION 13 OR 15(d) OF THE
SECURITIES EXCHANGE ACT OF 1934 |
For the fiscal year ended December 31, 20202022
OR
| | | | | |
| ☐ | TRANSITION REPORT PURSUANT TO SECTION 13 OR 15(d) OF THE
SECURITIES EXCHANGE ACT OF 1934 |
For the transition period from to
Commission file number: 001-16751
ANTHEM,
ELEVANCE HEALTH, INC.
(Exact name of registrant as specified in its charter)
| | | | | | | | |
| Indiana | | 35-2145715 |
(State or other jurisdiction of
incorporation or organization) | | (I.R.S. Employer Identification Number) |
| |
220 Virginia Avenue
Indianapolis, Indiana 46204
(Address of principal executive offices) (Zip Code)
Registrant’s telephone number, including area code: (800) 331-1476833) 401-1577
Securities registered pursuant to Section 12(b) of the Act:
| | | | | | | | | | | | | | |
| Title of each class | | Trading symbol(s) | | Name of each exchange on which registered |
| Common Stock, Par Value $0.01 | | ANTMELV | | New York Stock Exchange |
Securities registered pursuant to Section 12(g) of the Act: NONE
Indicate by check mark if the registrant is a well-known seasoned issuer, as defined in Rule 405 of the Securities Act. Yes x No ¨
Indicate by check mark if the registrant is not required to file reports pursuant to Section 13 or Section 15(d) of the Act. Yes ¨ No x
Indicate by check mark whether the registrant (1) has filed all reports required to be filed by Section 13 or 15(d) of the Securities Exchange Act of 1934 during the preceding 12 months (or for such shorter period that the registrant was required to file such reports), and (2) has been subject to such filing requirements for the past 90 days. Yes x No ¨
Indicate by check mark whether the registrant has submitted electronically every Interactive Data File required to be submitted pursuant to Rule 405 of Regulation S-T (§232.405 of this chapter) during the preceding 12 months (or for such shorter period that the registrant was required to submit such files). Yes x No ¨
Indicate by check mark whether the registrant is a large accelerated filer, an accelerated filer, a non-accelerated filer, a smaller reporting company, or an emerging growth company. See the definitions of “large accelerated filer,” “accelerated filer,” “smaller reporting company,” and “emerging growth company” in Rule 12b-2 of the Exchange Act.
| | | | | | | | | | | | | | | | | |
| Large accelerated filer | ☒ | | | Accelerated filer | ☐ |
| Non-accelerated filer | ☐ | | | Smaller reporting company | ☐ |
| Emerging growth company | ☐ | | | | |
If an emerging growth company, indicate by check mark if the registrant has elected not to use the extended transition period for complying with any new or revised financial accounting standards provided pursuant to Section 13(a) of the Exchange Act. ¨
Indicate by check mark whether the registrant has filed a report on and attestation to its management’s assessment of the effectiveness of its internal control over financial reporting under Section 404(b) of the Sarbanes-Oxley Act (15 U.S.C. 7262(b)) by the registered public accounting firm that prepared or issued its audit report. x
If securities are registered pursuant to Section 12(b) of the Act, indicate by check mark whether the financial statements of the registrant included in the filing reflect the correction of an error to previously issued financial statements. ¨
Indicate by check mark whether any of those error corrections are restatements that required a recovery analysis of incentive-based compensation received by any of the registrants’s executive officers during the relevant recovery period pursuant to §240.10D-1(b) ¨
Indicate by check mark whether the registrant is a shell company (as defined in Rule 12b-2 of the Exchange Act). Yes ☐ No x
The aggregate market value of the voting and non-voting common equity held by non-affiliates of the registrant (assuming solely for the purposes of this calculation that all directors and executive officers of the registrant are “affiliates”) as of June 30, 20202022 was approximately $66,230,779,383.$115,691,972,993.
As of February 4, 2021, 244,905,6891, 2023, 237,457,776 shares of the registrant’s common stock were outstanding.
DOCUMENTS INCORPORATED BY REFERENCE
Part III of this Annual Report on Form 10-K incorporates by reference information from the registrant’s Definitive Proxy Statement for the Annual Meeting of Shareholders to be held May 26, 2021.10, 2023.
Anthem,Elevance Health, Inc.
Annual Report on Form 10-K
For the Year Ended December 31, 20202022
Table of Contents
| | | | | | | | |
| |
| ITEM 1. | | |
| ITEM 1A. | | |
| ITEM 1B. | | |
| ITEM 2. | | |
| ITEM 3. | | |
| ITEM 4. | | |
| |
| |
| ITEM 5. | | |
| ITEM 6. | | |
| ITEM 7. | | |
| ITEM 7A. | | |
| ITEM 8. | | |
| ITEM 9. | | |
| ITEM 9A. | | |
| ITEM 9B. | | |
| ITEM 9C. | | |
| |
| |
| ITEM 10. | | |
| ITEM 11. | | |
| ITEM 12. | | |
| ITEM 13. | | |
| ITEM 14. | | |
| |
| |
| ITEM 15. | | |
| ITEM 16. | FORM 10-K SUMMARY | |
| |
| |
On May 18, 2022, our shareholders approved a proposal to amend our amended and restated articles of incorporation to change our name from Anthem, Inc. to Elevance Health, Inc. This amendment and name change went into effect on June 27, 2022. We began operating as Elevance Health, Inc. and trading under our new ticker symbol “ELV” on June 28, 2022. References in this Annual Report on Form 10-K to the terms “we,” “our,” “us,” “Anthem”“Elevance Health” or the “Company” refer to Anthem,Elevance Health, Inc., an Indiana corporation, and, unless the context otherwise requires, its direct and indirect subsidiaries. References to the term “states” include the District of Columbia and Puerto Rico, unless the context otherwise requires.
CAUTIONARY STATEMENT REGARDING FORWARD-LOOKING STATEMENTS
This Annual Report on Form 10-K, including Part II, Item 7, “Management’s Discussion and Analysis of Financial Condition and Results of Operations,”document contains certain forward-looking statements within the meaning of the Private Securities Litigation Reform Act of 1995. Forward-looking statements reflect our views about future events and financial performance and are generally not historical facts. Words such as “expect,” “feel,” “believe,” “will,” “may,” “should,” “anticipate,” “intend,” “estimate,” “project,” “forecast,” “plan” and similar expressions are intended to identify forward-looking statements. These statements include, but are not limited to: financial projections and estimates and their underlying assumptions; statements regarding plans, objectives and expectations with respect to future operations, products and services; and statements regarding future performance. Such statements are subject to certain risks and uncertainties, many of which are difficult to predict and generally beyond our control, that could cause actual results to differ materially from those expressed in, or implied or projected by, the forward-looking statements. You are cautioned not to place undue reliance on these forward-looking statements that speak only as of the date hereof. You are also urged to carefully review and consider the various risks and other disclosures discussed in our reports filed with the U.S. Securities and Exchange Commission from time to time, which attempt to advise interested parties of the factors that affect our business. Except to the extent otherwise required by federal securities laws,law, we do not undertake any obligation to republish revisedupdate or revise any forward-looking statements to reflect events or circumstances occurring after the date hereof. These risks and uncertainties include, but are not limited to: trends in healthcare costs and utilization rates; reduced enrollment; our ability to secure and implement sufficient premium rates; the impact of large scale medical emergencies, such as public health epidemics and pandemics, including COVID-19, and other catastrophes; trends in healthcare costs and utilization rates; our ability to secure sufficient premium rates, including regulatory approval for and implementation of such rates; the impact of federal and state regulation, including ongoingnew or changes in existing federal, state and international laws or regulations, including healthcare laws and regulations, or their enforcement or application; the Patient Protection and Affordable Care Act and the Health Care and Education Reconciliation Actimpact of 2010, as amended (collectively, the “ACA”), and the ultimate outcome of legal challengescyber-attacks or other privacy or data security incidents or breaches or our failure to the ACA;comply with any privacy or security laws or regulations, including any investigations, claims or litigation related thereto; information technology disruptions; changes in economic and market conditions, as well as regulations that may negatively affect our liquidity and investment portfolios; our ability to contract with providers on cost-effective and competitive terms; competitive pressures and our ability to adapt to changes in the industry and develop and implement strategic growth opportunities; reduced enrollment; unauthorized disclosure of member or employee sensitive or confidential information, including the impact and outcome of any investigations, inquiries, claims and litigation related thereto; risks and uncertainties regarding Medicare and Medicaid programs, including those related to non-compliance with the complex regulations imposed thereon; our ability to maintain and achieve improvement in Centers for Medicare and Medicaid Services Star ratings and other quality scores and funding risks with respect to revenue received from participation therein; a negative change in our healthcare product mix; costs and other liabilities associated with litigation, government investigations, audits or reviews; the ultimate outcome of litigation between Cigna Corporation,our ability to contract with providers on cost-effective and us relatedcompetitive terms; failure to the merger agreement between the partieseffectively maintain and the potential for such litigation to cause us to incur substantial additional costs, including potential settlement and judgment costs;modernize our information systems; risks and uncertainties related to ourassociated with providing pharmacy benefit management (“PBM”) business,, healthcare and other diversified products and services, including medical malpractice or professional liability claims and non-compliance by any party with the PBM services agreement between us and CaremarkPCS Health, L.L.C.; medical malpractice or professional liability claims or other risks related to healthcare and PBM services provided by our subsidiaries; general risks associated with mergers, acquisitions, joint ventures and strategic alliances; possible impairment of the value of our intangible assets if future results do not adequately support goodwill and other intangible assets; possible restrictions in the payment of dividends from our subsidiaries and increases in required minimum levels of capital; our ability to repurchase shares of our common stock and pay dividends on our common stock due to the adequacy of our cash flow and earnings and other considerations; the potential negative effect from our substantial amount of outstanding indebtedness;indebtedness and the risk that increased interest rates or market volatility could impact our access to or further increase the cost of financing; a downgrade in our financial strength ratings; the effects of any negative publicity related to the health benefits industry in general or us in particular; failure to effectively maintain and modernize our information systems; events that may negatively affect our licenses with the Blue Cross and Blue Shield Association; the impact of international laws and regulations; changes in U.S. tax laws; intense competition to attract and retain employees; risks associated with our international operations; and various laws and provisions in our governing documents that may prevent or discourage takeovers and business combinations.
PART I
ITEM 1. BUSINESS.
General
At Elevance Health, our purpose – to improve the health of humanity – is central to who we are. It inspires all we do and is the driving force behind our unique approach to health. We know to meaningfully improve health we must take a broader view. That is why our foundational approach looks at whole health and its most critical drivers: social, behavioral and physical. We believe in working together to achieve our mission of improving lives and communities, simplifying healthcare and expecting more. We strive to deliver on our mission by maximizing the power of partnerships, innovating to fuel growth and health equity, and having a high-performance culture. Our strategy is to become a lifetime, trusted health partner through the following four core focus areas:
•Whole Health – Partner to address physical, behavioral, social, and pharmacy needs to improve health, affordability, quality, equity, and access for individuals and communities.
•Exceptional Experiences – Put the people we serve at the center of all that we do, to exceed expectations and optimize health outcomes.
•Care Provider Enablement – Be the easiest payer to work with by supporting care provider partners with data, insights, and tools they need to deliver exceptional care for our consumers.
•Digital Platform – Use digital technologies to improve efficiency and experiences, convert data into insights, and create a platform that connects stakeholders from across the health ecosystem.
With an unyielding commitment to meeting the needs of our diverse customers, we are guided by the following values:
•Leadership – Redefine what is possible
•Community – Committed, connected, invested
•Integrity – Do the right thing, with a spirit of excellence
•Agility – Delivery today, transform tomorrow
•Diversity – Open our hearts and minds
We are one of the largest health benefits companiesinsurers in the United States in terms of medical membership, serving approximately 4347.5 million medical members through our affiliated health plans as of December 31, 2020.2022. We deliver a number of leading health benefit solutions throughoffer a broad portfoliospectrum of integratednetwork-based managed care risk-based plans to Individual, Group, Medicaid and Medicare markets. In addition, we provide a broad array of managed care services to fee-based customers, including claims processing, stop loss insurance, provider network access, medical management, care management and wellness programs, actuarial services and other administrative services. We provide services to the federal government in connection with our Federal Health Products & Services business, which administers the Federal Employees Health Benefits (“FEHB”) Program. We provide an array of specialty services both to customers of our subsidiary health plans and related services, along with a wide range of specialty products as well as flexible spending accounts. In the second quarter of 2019, we began using ouralso unaffiliated health plans, including pharmacy benefits manager called IngenioRx to market and offer pharmacy benefitsbenefit management (“PBM”) services to our affiliatedand dental, vision, life, disability and supplemental health plan customers throughout the country,insurance benefits, as well as to customers outside of the health plans we own. In addition, we are expanding our business into integrated health services through our Diversified Business Group, which includes certain of our subsidiaries such as AIM Specialty Health, Aspire Health, and Beacon Health Options, Inc. (“Beacon”) and other companies. At the time of its acquisition in 2020, Beacon was the largest independently held behavioral health organization in the country. Our acquisition of Beacon aligns with our strategy to diversify into health services and deliver both integrated solutions and care delivery models that personalize care for people with complex and chronic conditions.services.
We are an independent licensee of the Blue Cross and Blue Shield Association (“BCBSA”), an association of independent health benefit plans. We serve our members as the Blue Cross licensee for California and as the Blue Cross and Blue Shield (“BCBS”) licensee for Colorado, Connecticut, Georgia, Indiana, Kentucky, Maine, Missouri (excluding 30 counties in the Kansas City area), Nevada, New Hampshire, New York (in the New York City metropolitan area and upstate New York), Ohio, Virginia (excluding the Northern Virginia suburbs of Washington, D.C.) and Wisconsin. In a majority of these service areas, we do business as Anthem Blue Cross, Anthem Blue Cross and Blue Shield, and Empire Blue Cross Blue Shield or Empire Blue Cross. We alsoIn addition, we conduct business through arrangements with other BCBS licensees as well as other strategic partners. Through our subsidiaries, we also serve customers in numerous states across the country as AIM Specialty Health, Amerigroup, Aspire Health, Beacon, CareMore, Freedom Health, HealthLink, HealthSun, MMM, Optimum HealthCare,Healthcare, Simply Healthcare, UniCare and/or UniCare.Wellpoint. We offer PBM services through our CarelonRx, Inc. (“CarelonRx”) subsidiary, which was named IngenioRx, Inc. prior to January 1, 2023. We are licensed to conduct insurance operations in all 50 states, and the District of Columbia and Puerto Rico through our subsidiaries.
For our insurance products, based on the level of risk we assume in the product contract, we categorize principal funding arrangements as fully-insured and self-funded. Fully-insured products are products in which we indemnify our policyholders against costs for health benefits. Self-funded products are offered to customers, generally larger employers, who elect to retain most or all of the financial risk associated with their employees’ healthcare costs. Some self-funded customers choose to purchase stop loss coverage to limit their retained risk. For our fully-insured products, we charge a premium and assume the risk for the cost of covered healthcare services. Under self-funded products, we charge a fee for services and the employer or plan sponsor funds or reimburses us for the healthcare costs. In addition, we charge a premium to underwrite stop loss insurance for employers that maintain self-funded health plans. We also generate revenues from providing PBM services including prescription drug fulfillment.
We offer a broad spectrum of network-based managed care plans to Large Group, Small Group, Individual, Medicaid and Medicare markets. Our managed care plans include: Preferred Provider Organizations (“PPOs”); Health Maintenance Organizations (“HMOs”); Point-of-Service (“POS”) plans; traditional indemnity plans and other hybrid plans, including Consumer-Driven Health Plans (“CDHPs”); and hospital only and limited benefit products. In addition, we provide a broad array of managed care services to self-funded customers, including claims processing, stop loss insurance, actuarial services, provider network access, medical cost management, disease management, wellness programs and other administrative services. We provide an array of specialty and other insurance products and services such as PBM services, dental, vision, life and disability insurance benefits, radiology benefit management and analytics-driven personal healthcare. We also provide services to the federal government in connection with our Federal Health Products & Services business (“FHPS”) which administers the Federal Employees Health Benefits (“FEHB”) Program.
An ongoing focus on healthcare costs by employers, the government and consumers has continued to drive the growth of alternatives to traditional indemnity health insurance. HMO, PPO and hybrid plans are among the various forms of managed care products that have been developed. Through these types of products, insurers attempt to contain the cost of healthcare by
negotiating contracts with hospitals, physiciansAs part of our name change to Elevance Health, in June 2022, we announced that over the next several years we will organize our brand portfolio into the following core go-to-market brands:
•Anthem Blue Cross/Anthem Blue Cross and other providersBlue Shield — represents our existing Anthem-branded and affiliated Blue Cross and/or Blue Shield licensed plans;
•Wellpoint — we intend to deliver high-quality healthcareunite select non-BCBSA licensed Medicare, Medicaid and Commercial plans under the Wellpoint name; and
•Carelon — this brand brings together our healthcare-related services and capabilities, including our formerly named Diversified Business Group and IngenioRx businesses, under a single brand name.
In 2022, we managed our operations by customer type through four reportable segments: Commercial & Specialty Business, Government Business, CarelonRx (formerly known as IngenioRx) and Other. As we continue our journey to members at favorable rates. These products usually feature medical managementevolve our business from a traditional health insurance company into a lifetime, trusted health partner, we are evaluating and other quality and cost optimization measures such as pre-admissionmaking changes to how we manage our business. This included a review and approval for certain non-emergency services, pre-authorization of outpatient surgical procedures, network credentialing to determine that network physicians and hospitals have the required certifications and expertise, and various levels of care management programs to help members better understand and navigate the healthcare system. In addition, providers may have incentives to achieve certain quality measures, may share medical cost risk or may have other incentives to deliver quality medical services in a cost-effective manner. Also, certain plans offer members incentives for healthy behaviors, such as smoking cessation and weight management. Members are charged periodic, prepaid premiums and generally pay co-payments, coinsurance and/or deductibles when they receive services. While the distinctions between the various types of plans have lessened over recent years, PPO, POS and CDHP products generally provide reduced benefits for out-of-network services, while traditional HMO products generally provide little to no reimbursement for non-emergency out-of-network utilization, but often offer more generous benefit coverage. An HMO plan may also require members to select one of the network primary care physicians (“PCPs”) to coordinate their care and approve any specialist or other services.
Economic factors, greater consumer and employer sophistication and accountability have resulted in an increased demand for choice in both product/benefit designs and provider network configurations. As a result, we continue to offer our broad access PPO networks with multiple benefit designs, but are also focused on leveraging our provider collaboration initiatives with our accountable care organization (“ACO”) partnerships to develop both narrow and tiered network offerings. This array of network and product configurations allows both the employer and the employee to design and select the combination of benefit designs (e.g., traditional PPOs, high deductibles, health reimbursement accounts, health savings accounts, PCP based products tiered copays) and networks (e.g., broad, narrow, tiered, closed or exclusive provider, and open) that optimize choice, quality and price at the consumer, employer and market level. We believe we are well-positioned in each of our states to respond to these market preferences.
Our medical membership includes seven different customer types: Local Group, Individual, National Accounts, BlueCard®,Medicare, Medicaid and FEHB. In addition, we also serve customers who purchase one or moreoperating segments, which resulted in restructurings between some of our other products or services that are often ancillary tooperating segments. Therefore, our health business.
Our products are generally developedreportable segment presentation in 2023 and marketed with an emphasisits composition will reflect how we began managing our operations and monitoring performance, aligning strategies and allocating resources on the differing needs of our customers. In particular, our product developmentJanuary 1, 2023. For additional discussion, see “Reportable Segments” below in this “Business” section and marketing efforts take into account the differing characteristics between the various customers served by us, as well as the unique needs of educational and public entities, labor groups, FEHB program, national employers and state-run programs servicing low-income, high-risk and underserved markets. Overall, we seek to establish pricing and product designs to provide value for our customers while achieving an appropriate level of profitability for each of our customer categories balanced with the competitive objective to grow market share. We believe that oneNote 20, “Segment Information,” of the keysNotes to our success has been our focus on these distinct customer types, which better enables us to develop benefit plans and services that meet our customers’ unique needs. Further, IngenioRx was built to simplify pharmacy care and focus on the whole person, and we expect it will make it easier for our customers to achieve better health outcomes at a lower total cost of care.
We market our Individual, Medicare and certain Local Group products through direct marketing activities and an extensive network of independent agents, brokers and retail partnerships. Products for National Accounts and Local Group customers with a larger employee base are generally sold through independent brokers or consultants retained by the customer who work with industry specialists from our in-house sales force. In the Individual and Small Group markets, we offer on-exchange products through state- or federally-facilitated marketplaces, referred to as public exchanges, and off-exchange products. Federal subsidies are available for certain members, subject to income and family size, who purchase public exchange products.
Being a licensee of the BCBS association of companies, of which there were 36 independent primary licensees including us as of December 31, 2020, provides significant market value, especially when competing for very large multi-state employer groups. For example, each BCBS member company is able to utilize other BCBS licensees’ substantial provider networks and discounts when any BCBS member works or travels outside of the state in which their policy is written. This program is referred to as BlueCard® and is a source of revenue when we provide member services in the states where we are the BCBS licensee to individuals who are customers of BCBS plans not affiliated with us. This program also provides a national provider network for our members when they travel to other states. See “BCBSA Licenses” herein for additional information on our BCBSA licenses. We refer to members in our service areas licensed by the BCBSA as our BCBS-branded
business. Non-BCBS-branded business refers to members in our non-BCBS-branded Amerigroup, Freedom Health, HealthSun, Optimum Health Care and Simply Healthcare plans, as well as Beacon, HealthLink and UniCare members.
For additional information describing each of our customer types, detailed marketing efforts and changes in medical membership over the last three years, see “Management’s Discussion and Analysis ofConsolidated Financial Condition and Results of Operations”Statements included in Part II, Item 78 of this Annual Report on Form 10-K.
Our results of operations depend in large part on our ability to accurately predict and effectively manage healthcare costs through effective contracting with providers of care to our members, product pricing, medical management and health and wellness programs, including service coordination and case management for addressing complex and specialized healthcare needs, innovative product design and our ability to maintain or achieve improvement in our Centers for Medicare and Medicaid Services (“CMS”) Star ratings. CMS Star ratings affect Medicare Advantage plan reimbursements as well as our eligibility to earn quality-based bonus payments for those plans. See “Regulation” herein for additional information on our CMS Star ratings. For additional information on our networks and provider relations, product pricing and healthcare cost management programs, see “Networks and Provider Relations”, “Pricing and Underwriting of Our Products”, “Medical Management Programs”, “Care Management Programs” and “Healthcare Quality Initiatives” herein.
Advances in medical technology, increases in specialty drug costs, increases in hospital expenditures and other provider costs, the aging of the population, other demographic characteristics and the COVID-19 pandemic continue to contribute to rising healthcare costs. Our managed care plans and products are designed to encourage providers and members to participate in quality, cost-effective health benefit programs by using the full range of our innovative medical management services, quality initiatives and financial incentives. Our market share and high business retention rates enable us to realize the long-term benefits of investing in preventive and early detection programs. Our ability to provide cost-effective health benefits products and services is enhanced through a disciplined approach to internal cost containment, prudent management of our risk exposure and successful integration of acquired businesses. In addition, our ability to manage selling, general and administrative costs continues to be a driver of our overall profitability.
The future results of our operations will also be impacted by certain external forces and resulting changes in our business model and strategy. The continuing growth in our government-sponsored business exposes us to increased regulatory oversight. The Patient Protection and Affordable Care Act and the Health Care and Education Reconciliation Act of 2010, as amended (collectively, the “ACA”), has changed and may continue to make broad-based changes to the U.S. healthcare system. The ACA presented us with new growth opportunities, but also introduced new risks, regulatory challenges and uncertainties, and required changes in the way products are designed, underwritten, priced, distributed and administered. We currently offer Individual ACA-compliant products in 103 of the 143 rating regions in which we operate. Our strategy has been, and will continue to be, to only participate in rating regions where we have an appropriate level of confidence that these markets are on a path toward sustainability, including, but not limited to, factors such as expected financial performance, regulatory environment, and underlying market characteristics. Changes to our business environment are likely to continue as elected officials at the national and state levels continue to enact, and both elected officials and candidates for election continue to propose, significant modifications to existing laws and regulations, including changes to taxes and fees. In addition, the legal challenges regarding the ACA, including a federal district court decision invalidating the ACA, which was argued before the U.S. Supreme Court in November 2020 and has been stayed pending the U.S. Supreme Court’s decision, continue to contribute to this uncertainty. We will continue to evaluate the impact of the ACA as additional guidance is made available and any further developments or judicial rulings occur. For additional discussion, see “Regulation” herein and Part I, Item 1A “Risk Factors” in this Annual Report on Form 10-K.
In addition to the external forces discussed in the preceding paragraph, our results of operations are impacted by levels and mix of membership which can change as a result of the quality and pricing of our health benefits products and services, aging population, economic conditions, changes in unemployment, acquisitions, entry into new markets and expansions in or exits from existing markets. These membership trends could be negatively impacted by various factors that could have a material adverse effect on our future results of operations such as general economic downturns that result in business failures, failure to obtain new customers or retain existing customers, premium increases, benefit changes or our exit from a specific market. See Part I, Item 1A “Risk Factors” and Part II, Item 7 “Management’s Discussion and Analysis of Financial Condition and Results of Operations” included in this Annual Report on Form 10-K.
We believe healthcare is local and that we have the strong local presence required to understand and meet local customer needs with regard to any product they are enrolled in with us. Further, we believe we are well-positioned to deliver what customers want: innovative, choice-based and affordable products; distinctive service; simplified transactions; and better access to information for quality care. Our local presence, combined with our national expertise, has created opportunities for collaborative programs that reward physicians and hospitals for clinical quality and excellence. We feel that our commitment to health improvement and care management provides added value to customers and healthcare professionals. Ultimately, we believe that practical and sustainable improvements in healthcare must focus on improving healthcare quality while managing costs for total affordability. We have implemented initiatives driving payment innovation and partneringpartnered with providers to lower cost and improve the quality of healthcare for our members, and we continue to develop new and innovative ways to effectively manage risk and engage our members. Further, we are expandingcontinue to expand our financial arrangements with providers to includeimplement payment models that encourageadvance value-based care. We believe focusing on quality of care rather than volume of care is the foundation for improving patient outcomes. Our value-based payment model supports patient-centered care by improving collaboration between providers and health partners and delivering to our patients the right care, at the right time, in the right place. In addition, we are focused on achieving efficiencies from our national scale while optimizing service performance for our customers. Finally, we expect to continue to rationalize our portfolio of businesses and products and align our investments to capitalizeoptimize our core businesses, invest in high-growth opportunities, and accelerate capabilities and services.
Impact on new opportunitiesOur Results of Operations
Our results of operations depend in large part on our ability to drive growthaccurately predict and effectively manage healthcare costs through effective contracting with providers of care to our members, product pricing, medical management and health and wellness programs, including service coordination and case management for addressing complex and specialized healthcare needs, innovative product design and our ability to maintain or achieve improvement in our Centers for Medicare and Medicaid Services (“CMS”) Star ratings. CMS Star ratings affect Medicare Advantage plan reimbursements as well as our eligibility to earn quality-based bonus payments for those plans. See “Regulation” below in this “Business” section for additional information on our CMS Star ratings. For additional information on our networks and provider relations, product pricing and healthcare cost management programs, see “Pricing and Underwriting of Our Products,” “Networks and Provider Relations,” “Medical Management Programs,” “Care Management and Wellness Products and Programs” and “Healthcare Quality Initiatives” below in this “Business” section.
Advances in medical technology, including new specialty drugs, the aging population, other demographic characteristics and the COVID-19 pandemic continue to contribute to rising healthcare costs. Our managed care plans and products are designed to encourage providers and members to participate in quality, cost-effective health benefit programs by using the full range of our innovative medical management services, health-outcomes based initiatives and health quality-based
financial incentives. We believe our market position and high business retention rates will enable us to realize the long-term benefits of investing in preventive and early detection programs. Our ability to provide cost-effective health benefits products and services is enhanced through a disciplined approach to internal cost containment, prudent management of our risk exposure and successful integration of acquired businesses. In addition, our ability to manage general and administrative costs continues to be a driver of our overall profitability.
Our future results of operations will also be impacted by certain external forces and resulting changes in our business model and strategy. Changes to our business environment will continue as elected officials at the national and state levels enact, and both elected officials and candidates for election propose, modifications to existing marketslaws and expandregulations, including changes to taxes and fees. For additional discussion, see “Regulation” below in this “Business” section and Part I, Item 1A “Risk Factors” in this Annual Report on Form 10-K.
Our results of operations are also impacted by levels and mix of membership, which can change as a result of the quality and pricing of our health benefits products and services, an aging population, economic conditions, changes in unemployment, the continued and future impact of the COVID-19 pandemic, acquisitions, entry into new markets and expansions in the future.or exits from existing markets. These membership trends could be negatively impacted by various factors that could have a material adverse effect on our future results of operations such as general economic downturns that result in business failures, failure to obtain new customers or retain existing customers, premium increases, benefit changes, membership impacts caused by COVID-19, including how our members access healthcare services, or our exit from a specific market. See Part I, Item 1A “Risk Factors” and Part II, Item 7 “Management’s Discussion and Analysis of Financial Condition and Results of Operations” included in this Annual Report on Form 10-K.
We continue to enhance interactions with customers, providers, brokers, agents, employees and other stakeholders through digital technology and improvingimprovements to internal operations. Our approach includes not only the sales and distribution of health benefits products through digital technology, but also implementing advanced capabilities that improve services benefiting customers, agents, brokers and providers while optimizing administrative costs. These enhancements can also help improve the quality, coordination and safety of healthcare through increased communications between patients and their physicians.
At Anthem,Through our participation in various federal government programs, we strive to improve the health of humanity. We believe in working together to achieve our mission of improving lives and communities, simplifying healthcare and expecting more. As we seek to accomplish these goals through a collaborative focus on execution and delivering for those we serve, our vision is to be the most innovative, valuable and inclusive health partner. We focus on ensuring quality products and services that give members access to the care they need. With an unyielding commitment to meeting the needsgenerated approximately 28% of our diverse customers, wetotal consolidated revenues from agencies of the U.S. government for each of the years ended December 31, 2022, 2021 and 2020. The majority of these revenues are guided by the following values:
•Leadership – Redefine what is possible
•Community – Committed, connected, invested
•Integrity – Do the right thing, with a spirit of excellence
•Agility – Delivery today, transform tomorrow
•Diversity – Open your hearts and minds
In pursuing our vision, we intend to transform healthcare by providing trusted and caring solutions and delivering quality products and services that give customers access to the care they need. At the same time, we will focus on earnings, organic membership growth, improvementscontained in our operating cost structure, strategic acquisitions and the efficient useGovernment Business segment as described below. An immaterial amount of capital.
COVID-19
In March 2020, the World Health Organization declared the outbreak of a novel strain of coronavirus (“COVID-19”) a global health pandemic. The COVID-19 pandemic continues to evolve, and the virus and mitigation efforts have continued to impact the global economy, cause market instability, increase unemployment in the United States, and put pressure on the healthcare system, and it has impacted and will continue to impact our membership and benefit expense. As the COVID-19 pandemic continues, we remain focused on increasing access and coverage for our members, making changes to our membership benefits and business operations and adapting tools and policies to assist consumers and care providers, including:
•Waiving cost-sharing for COVID-19 diagnostic tests and treatment;
•Providing expanded telehealth coverage for our Medicare and Medicaid plans, where permissible, and waiving cost-sharing for in-network telehealth visits, including telephonic visits and those for mental health;
•Providing expanded telehealth coverage for our members in fully-insured employer plans and Individual plans (we also waived cost-sharing for in-network telehealth and phone visits through September 30, 2020);
•Encouraging the use of home delivery services to enable access to necessary medications and relaxing early prescription refill policies for maintenance and specialty medications for our members in fully-insured employer plans and Individual plans at least through September 30, 2020, and for Medicare and Medicaid plans in accordance with applicable regulations;
•Providing a one-month premium credit to members enrolled in select individual plans and to fully insured employer group customers rangingtotal consolidated revenues is derived from 10 to 15 percentactivities outside of the monthly premium;
•Providing a one-month premium credit of 50 percent of the monthly premium to individuals in stand-aloneU.S. and group dental plans;Puerto Rico.
•Leveraging data and advanced analytics to provide innovative solutions in response to the COVID-19 pandemic, and introducing a suite of digital tools that serve various functions, including providing member data and updates related to COVID-19, aggregating real-time COVID-19 data to present trends and predictions for our communities, and providing individuals with resources for mental health and free or reduced-cost programs that provide food, transportation, childcare and more;
•Providing support to care provider partners of our affiliated health plans to help them continue to focus on caring for patients, including funding and financial assistance, working with care providers to accelerate claims processing for outstanding accounts receivables, resolve claims where possible and appropriate, and accelerate payments to support state-specific Medicaid programs;
•Simplifying access to care by temporarily suspending select prior authorization requirements for certain services and equipment critical to COVID-19 treatment;
•Offering in-network dental providers a $10 personal protective equipment credit per patient, per visit, through December 31, 2020;
•Transitioning the majority of our employees to a remote work environment, expanding our employee benefits to provide additional support, imposing travel limitations and implementing workplace modifications consistent with the Centers for Disease Control and Prevention guidelines and social distancing protocols;
•Committing to lifting up our local communities through a variety of partnership and relief efforts, contributing $50 million to the Anthem Foundation to support its COVID-19 response and recovery efforts to help areas of greatest need, including care provider safety, food insecurity, and mental and behavioral health resources; and
•Sponsoring and participating in collaborative efforts to promote innovative solutions related to COVID-19 and healthcare needs caused by the pandemic.
For additional discussion see Part II, Item 7, “Management’s Discussion and Analysis of Financial Condition and Results of Operations–COVID-19” included in this Annual Report on Form 10-K. For information regarding our risks related to the COVID-19 pandemic and our other risk factors, see Part I, Item 1A, “Risk Factors,” included in this Annual Report on Form 10-K.
Competition
The managed care industry is highly competitive, both nationally and in our local markets. Competition continues to be intense due to aggressive marketing, pricing, government-sponsored programs bid activity, business consolidations, new strategic alliances, new competitors in the market, a proliferation of new products, technological advancements, the impact of legislative reform, increased quality awareness and price sensitivity among customers and changing market practice such as increased usage of telehealth.
We believe that participants in the managed care industry compete for customers based on quality of service, price, access to provider networks, access to care management and wellness programs (including health information), innovation, effective use of technology such as electronic data transfer, breadth and flexibility of products and benefits, expertise and reputation (including National Committee on Quality Assurance (“NCQA”) accreditation status as well as CMS Star ratings), brand recognition and financial stability. Our ability to attract and retain customers is substantially tied to our ability to distinguish ourselves from our competitors in these areas.
We believe our exclusive right to market products under the most recognized brand in the industry, BCBS, in our most significant markets provides us with greater brand recognition over competitive product offerings. Typically, we are the largest participant in each of our BCBS branded markets and, thus, are a closely-watched target by other insurance competitors.
Product pricing remains competitive and we strive to price our healthcare benefit products and design our Medicare and Medicaid bids consistent with anticipated underlying medical trends. We believe our pricing and bid strategy, based on predictive modeling, proprietary research and data-driven processes, has positioned us to benefit from the potential growth opportunities available through entry into new markets, expansions in existing markets and as a result of any future changes to the current regulatory scheme. We believe that our pricing and bid strategy, brand name and network quality will provide a strong foundation for membership growth opportunities in the future.
Our provider networks give us a highly competitive unit cost position and provide distinctive service levels which allow us to offer a broad range of affordable health benefit products to our customers. To build our provider networks, we compete with other health benefits plans for the best contracts with hospitals, physicians and other providers. We believe that physicians and other providers primarily consider customer volume, reimbursement rates, timeliness of reimbursement and administrative service capabilities along with the reduction of non-value added administrative tasks when deciding whether to contract with a health benefits plan.
At the sales and distribution level, we compete for qualified agents and brokers to recommend and distribute our products. Strong competition exists among insurance companies and health benefits plans for agents and brokers with demonstrated ability to secure new business and maintain existing accounts. We believe that the quality and price of our products, support services, reputation and prior relationships, along with a reasonable commission structure, are the factors agents and brokers consider in choosing whether to market our products. We believe that we have good relationships with our agents and brokers, and that our products, support services and commission structure compare favorably to those of our competitors in all of our markets.
In addition, the PBM industry is highly competitive, and IngenioRx is subject to competition from national, regional and local PBMs, insurers, health plans, large retail pharmacy chains, large retail stores, supermarkets, other mail order pharmacies, web pharmacies and specialty pharmacies. Strong competition within the PBM industry has generated greater demand for lower product and service pricing, increased revenue sharing and enhanced product and service offerings.
Reportable Segments
We manage our operations through four reportable segments: Commercial & Specialty Business, Government Business, IngenioRx and Other. We regularly evaluate the appropriateness of our reportable segments, particularly in light of organizational changes, merger and acquisition activity and changing laws and regulations.
Our As discussed in the “General” section above, we are in the process of organizing our brand portfolio into three core go-to-market brands, and are reviewing and modifying how we will manage our businesses in the future. In 2022, we managed our operations by customer type through four reportable segments: Commercial & Specialty Business, and Government Business, segments both offer a diversified mix of managed care products, including PPOs, HMOs, traditional indemnity benefitsCarelonRx (formerly known as IngenioRx) and POS plans, as well as a variety of hybrid benefit plans including CDHPs, hospital only and limited benefit products.Other.
Our Commercial & Specialty Business segment includesoffers plans and services to our LocalIndividual, Group National Accounts, Individualrisk-based, Group fee-based and Specialty businesses. Business units in theBlueCard® members. The Commercial & Specialty Business segment offer fully-insuredoffers health products; provideproducts on a full-risk basis; provides a broad array of administrative managed care services to self-funded customers including claims processing, stop loss insurance, provider network access, medical cost management, disease management, wellness programs, underwriting, actuarial servicesour fee-based customers; and other administrative services; and provide an arrayprovides a variety of specialty and other insurance products and services such as stop loss, dental, vision, life, disability and disabilitysupplemental health insurance benefits.benefits as described below.
Our Government Business segment includes our Medicare and Medicaid businesses, National Government Services (“NGS”) and services provided to the federal government in connection with our FHPSthe FEHB business. Medicaid makes federal matching funds available to all states for the delivery of healthcare benefits to eligible individuals, principally those with incomes below specified levels who meet other state-specified requirements. Medicaid is structured to allow each state to establish its own eligibility standards, benefits package, payment rates and program administration under broad federal guidelines. Our Medicare customers are Medicare-eligible individual members age 65 and over who have enrolled in Medicare Advantage, a managed care alternative for the Medicare program, or who have purchased Medicare Supplement benefit coverage, some disabled members under age 65, or members of all ages with end stage renal disease. Medicare Supplement policies are sold to Medicare recipients as supplements to the benefits they receive from the Medicare program. Medicare Supplement policy rates are filed with, and in some cases approved by, state insurance departments. Most of the premium for Medicare Advantage is based on bids submitted to CMS and paid directly by the federal government on behalf of the participant who may also be charged a small premium. Additionally, through our alliance partnership engagements with larger provider groups and BCBS plans, we offer a variety of Medicaid and Medicare services that include joint ventures, administrative service offerings, and full-risk arrangements. NGS acts as a Medicare contractor for the federal government in several regions across the nation.
Our IngenioRxCarelonRx (formerly IngenioRx) segment includes our PBM business, which began its operations during the second quarter of 2019. IngenioRxbusiness. CarelonRx markets and offers PBM services to our affiliated health plan customers, as well as to external customers outside of the health plans we own. IngenioRxCarelonRx has a comprehensive PBM services portfolio, which includes services such as formulary management, pharmacy networks, a prescription drug database, member services and mail order capabilities. In 2019, IngenioRx was included in our Other reportable segment.
Our Other segment includes our Diversified Business Group, (“DBG”),now known as Carelon Services, which is our integrated health services business focused on lowering the cost and improving the quality of healthcare by enabling and creating new care delivery and payment models, with a special emphasis on serving those with complex and chronic conditions. This segment also includes certain intercompany eliminations and corporate expenses not allocated to our other reportable segments.
As we continue our journey to evolve our business from a traditional health insurance company into a lifetime, trusted health partner, we are evaluating and making changes to how we manage our business. This included a review of the products in each of our operating segments, which resulted in restructurings between some of our operating segments. Therefore, our reportable segment presentation in 2023 and its composition will reflect how we began managing our operations and monitoring performance, aligning strategies and allocating resources on January 1, 2023. As a result of these changes, beginning with our Quarterly Report on Form 10-Q for the first quarter of 2023, we will report our results in the following four reportable segments: (i) Health Benefits, which will combine our existing Commercial & Specialty Business and Government Business segments; (ii) our existing CarelonRx segment; (iii) Carelon Services (our former Diversified Business Group), which will be carved out from our existing Other segment; and (iv) Corporate and Other, which will include businesses that do not individually meet the quantitative thresholds for an operating segment, as well as corporate expenses not allocated to our other reportable segments. We expect to reclassify previously reported information to conform to the new presentation.
For additional information, see Note 20, “Segment Information”,Information,” of the Notes to Consolidated Financial Statements included in Part II, Item 8 of this Annual Report on Form 10-K.
We experience seasonality inMembership
Our medical membership includes seven different customer types: Individual, Group risk-based, Group fee-based, BlueCard®,Medicare, Medicaid and FEHB. In addition, we also serve customers who purchase one or more of our Commercial & Specialty Businessother products or services that are often ancillary to our health business.
Our products are generally developed and Government Business segments. Whilemarketed with an emphasis on the differing needs of our premium revenues are not seasonal,customers. In particular, our benefit costs typically increase duringproduct development and marketing efforts take into account the yeardiffering characteristics between the various customers served by us, as our fully-insured members pay their annual deductibles and reach their out-of-pocket maximum limits. However, this seasonality may change in the futurewell as the COVID-19 pandemic continuesunique needs of educational and COVID-19 vaccines become widely available. Our expenses associatedpublic entities, labor groups, the FEHB program, national employers and state-run programs servicing low-income, high-risk and underserved markets. Overall, we seek to establish pricing and product designs to provide value for our customers while achieving an appropriate level of profitability for each of our customer categories balanced with COVID-19, including testingthe competitive objective to grow market share. We believe that one of the keys to our success has been our focus on these distinct customer types, which better enables us to develop benefit plans and treatmentservices that meet our customers’ unique needs. Further, CarelonRx was built to simplify pharmacy care and focus on the whole person, and we expect it will make it easier for our customers to achieve better health outcomes at a lower total cost of care.
We market our Individual, Medicare and certain Group products with a smaller employee base through direct marketing activities and an extensive network of independent agents, brokers and retail partnerships. Products for Commercial customers with a larger employee base are generally sold through independent brokers or consultants retained by the customer who work with industry specialists from our in-house sales force. In the Individual markets, we offer on-exchange products through state- or federally-facilitated marketplaces (the “Public Exchange”) in compliance with the Patient Protection and Affordable Care Act and the actions takenHealth Care and Education Reconciliation Act of 2010, as amended (collectively, the “ACA”) and off-exchange products. Federal subsidies are available for certain members, subject to support our members in responseincome and family size, who purchase Public Exchange products.
In 2022, we made the decision to the pandemic, accelerated in the fourth quarter of 2020 and exceeded the benefit we experienced during the quarter from the lower volume of healthcare claims attributable to decreased utilization of non-COVID-19 health services.
Throughexpand our participation in various federal government programs,the Public Exchange market for 2023 after also expanding in 2022.As a result, for 2023 we generated approximately 20.3%, 20.7% and 19.8% of our total consolidated revenues from agenciesare offering Individual Public Exchange products in 138 of the U.S. government for143 rating regions in which we operate, in comparison to 122 of 143 rating regions in 2022.Our strategy has been, and will continue to be, to only participate in rating regions where we have an appropriate level of confidence that these markets are on a path toward sustainability, including, but not limited to, factors such as expected financial performance, regulatory environment and underlying market characteristics.
Being a licensee of the years endedBCBS association of companies, of which there were 34 independent primary licensees including us as of December 31, 2020, 2019 and 2018, respectively. These revenues are contained in the Government Business segment. An immaterial amount of our total consolidated revenues is derived from activities outside of the U.S.
Product and Service Descriptions
A general description of our products and services is provided below:
Preferred Provider Organization: PPO products offer the member an option to select any healthcare provider, with benefits reimbursed by us at a higher level2022, provides significant market value, especially when care is received from a participating network provider. Increasingly, customers are choosing our PPO products offered with an exclusive provider organization, which eliminates coverage out ofcompeting for very large multi-state
network. Coverageemployer groups. For example, each BCBS member company is subjectable to co-payments utilize other BCBS licensees’ substantial provider networks and discounts when any BCBS member works or travels outside of the state in which their policy is written. This program is referred to as BlueCard®. BlueCard® host members are generally members who reside in or travel to a state in which an Elevance Health subsidiary is the Blue Cross and/or Blue Shield licensee and who are covered under an employer-sponsored health plan serviced by a non-Elevance Health controlled BCBS licensee, which is the “home” plan. We perform certain administrative functions for BlueCard® host members, including claims pricing and administration, for which we receive administrative fees from the BlueCard® members’ home plan. Other administrative functions, including maintenance of enrollment information and customer services, are performed by the home plan. See “BCBSA Licenses” below in this “Business” section for additional information on our BCBSA licenses. We refer to members in our service areas licensed by the BCBSA as our BCBS-branded, or Anthem BCBS, business. Non-BCBS-branded business refers to members in our non-BCBS-branded, or Wellpoint plans, which include Amerigroup, Freedom Health, HealthSun, MMM, Optimum Healthcare and Simply Healthcare plans, as well as HealthLink and UniCare members.
For additional information describing each of our customer types and changes in medical membership over the last three years, see “Management’s Discussion and Analysis of Financial Condition and Results of Operations - Membership” included in Part II, Item 7 of this Annual Report on Form 10-K.
Product and Service Descriptions
Various forms of managed care products have been developed to contain the cost of healthcare by negotiating contracts with hospitals, physicians and other providers to deliver high-quality healthcare to members at favorable rates. These products usually feature medical management and other quality and cost optimization measures such as pre-admission review and approval for certain non-emergency services, pre-authorization of outpatient surgical procedures, network credentialing to determine that network physicians and hospitals have the required certifications and expertise, and various levels of care management programs to help members better understand and navigate the healthcare system. In addition, providers may have incentives to achieve certain quality measures, may share medical cost risk or may have other incentives to deliver quality medical services in a cost-effective manner. Also, certain plans offer members incentives for healthy behaviors, such as smoking cessation and weight management. Members are charged periodic, prepaid premiums and generally pay copayments, coinsurance and/or deductibles and coinsurance, with member cost sharing usually limited by out-of-pocket maximums.when they receive services.
Commercial & Specialty Business
•Commercial Risk-Based Products.Our Commercial & Specialty Business offers employer groups a diversified mix of managed care risk-based products including: Preferred Provider Organization (“PPO”), Health Maintenance Organization (“HMO”), Consumer-Driven Health Plans: Plans (“CDHP”), Traditional Indemnity and Point-of-Service (“POS”) plans. PPO plans generally provide members the freedom to choose any healthcare provider, but require the member to pay a greater portion of the provider’s fee in the event the member chooses not to use a provider participating in the PPO’s network. HMOs include comprehensive managed care benefits generally through a participating network of physicians, hospitals and other providers. CDHPs provide consumers with increased financial responsibility, choice and control regarding how their healthcare dollars are spent. Generally, CDHPsgenerally combine a high-deductible PPO plan with an employer-funded and/or employee-funded personal care account, which may result in tax benefits to the employee. Someemployee and allow some or all of the dollars remaining in the personal care account at year-end canto be rolled over to the next year for future healthcare needs.
Traditional Indemnity: Indemnity productsindemnity plans offer the member an option to select any healthcare provider for covered services. Coverage isservices, with coverage subject to deductibles and coinsurance and with member cost sharingcost-sharing usually limited by out-of-pocket maximums.
Health Maintenance Organization: HMO products include comprehensive managed care benefits, generally through a participating network of physicians, hospitals and other providers. A member in one of our HMOs must typically select a PCP from our network. PCPs generally are family practitioners, internists or pediatricians who provide necessary preventive and primary medical care, and are generally responsible for coordinating other necessary healthcare services. We offer HMO plans with varying levels of co-payments, which result in different levels of premium rates.
Point-of-Service: POS products blend the characteristics of HMO, PPO and indemnity plans. Members can have comprehensive HMO-style benefits through participatingIn general, POS plans allow members to choose to seek care from a provider within the plan’s network providers with minimum out-of-pocket expenses (co-payments) and also can go directly, without a referral, to any provider they choose,or outside the network, subject to, among other things, certain deductibles and coinsurance. Member cost sharing is limited by out-of-pocket maximums.
We also offer Individual risk-based products on and off the Public Exchange, and Off-Exchange Products: Individual and Small Group products covercovering essential health benefits as(as defined in the ACAACA) along with many other requirements and cost-sharing features. Individual and Small Group products offered on and off the public exchanges meet the definition
•Commercial Fee-Based Products.Our Commercial & Specialty Business provides a broad array of the “metal” product requirements (bronze, silver, gold and platinum) and each metal product must satisfy a specific actuarial value with respect to essential benefits. Health insurers participating on the public exchanges must offer at least one silver and one gold product.
Administrative Services: In addition to fully-insured products, we provide administrativemanaged care services to Large Group, Small Group and National Account employers that maintain self-funded health plans. These administrative services includefee-based groups, including claims processing, provider network access, medical cost management, diseasecare management and wellness programs, underwriting, actuarial services and other administrative services for self-funded employers. Self-fundedservices. Fee-based health plans are also able to use our provider networks and to realize savings through our negotiated provider arrangements, while allowing employers the ability to design certain health benefit plans in accordance with their own requirements and objectives. We
also charge a premium to underwrite stop loss insurance for self-funded plans.employers that maintain fee-based plans but want to limit their retained risk.
BlueCard®: BlueCard® is a national program that links participating healthcare providers and independent BCBS plans. BlueCard® host members are generally members who reside in or travel to a state in which an Anthem subsidiary is the Blue Cross and/or Blue Shield licensee and who are covered under an employer-sponsored health plan serviced by a non-Anthem controlled BCBS licensee, which is the “home” plan. WeIn addition, we perform certain administrative functions for BlueCard® host members, discussed under “Membership” above, including claims pricing and administration, for which we receive administrative fees from the BlueCard® members’ home plans. Other administrative functions, including maintenance of enrollment information and customer service, are performed by the home plan.
•Specialty Products.We offer an array of products and services to both risk-based and fee-based customers in conjunction with our health plans as well as to unaffiliated healthcare plans that are not Elevance Health subsidiaries.
◦Stop Loss Insurance. Our stop loss insurance arrangements are built around our clients’ needs while assuming 100% of the risk. We offer specific and aggregate plans that will provide options to meet our clients’ coverage terms, budget and risk tolerance; active claims management to help avoid errors and missing claims; as well as cost containment to assist our clients with claims and cost control.
◦Dental.Our dental plans include networks in certain states in which we operate and are offered on both a risk-based and fee-based basis. Our members also have access to additional dental providers through our participation in the National Dental GRID, a national dental network developed by and for BCBS plans that offers in-network discounts across the country.
◦Vision.Our vision plans include networks within the states in which we operate and are offered on both a risk-based and fee-based basis.
◦Life.We offer an array of competitive individual and group term life insurance benefit products. The life insurance products include term life and accidental death and dismemberment.
◦Disability.We offer short-term and long-term disability and leave of absence products.
◦Supplemental Health.We offer supplemental health products, including accident, critical illness and hospital indemnity, which provide coverage for specific conditions or circumstances.
Government Business
•Medicare Plans:Plans. We offer a wide variety of plans, products and options to individuals age 65 and older such as Medicare Supplement plans; Medicare Advantage, including Special Needs Plans (“SNPs”), also known asdual-eligible programs through Medicare-Medicaid Plans (“MMPs”), Medicare Advantage SNPs;Supplement plans and Medicare Part D Prescription Drug Plans (“Medicare Part D”); and dual-eligible programs through Medicare-Medicaid Plans (“MMPs”). Medicare Supplement plans typically pay the difference between healthcare costs incurred by a beneficiary and amounts paid by Medicare.
Medicare Advantage plans provide Medicare beneficiaries with a managed care alternative to traditional Medicare and often include a Medicare Part D benefit. In addition, our Medicare Advantage SNPs provide tailored benefits to special needs individuals who are institutionalized or have severe or disabling chronic conditions and to dual-eligible customers, who are low-income seniors and persons under age 65 with disabilities. Medicare Advantage SNPs are coordinated care plans specifically designed to provide targeted care, covering all the healthcare services considered medically necessary for members and often providing professional care coordination services, with personal guidance and programs that help members maintain their health. Medicare Advantage membership also
includes Medicare Advantage members in our Group Retiree Solutions business who are related to National Accounts, retired members of Local GroupCommercial accounts or retired members of groups who are not affiliated with our Commercial accounts whothat have selected a Medicare Advantage product through us. Medicare Part D offers a prescription drug plan to Medicare and MMP beneficiaries. MMP is a demonstration program focused on serving members who are dually eligible for Medicaid and Medicare. Medicare which was established asSupplement plans typically pay the difference between healthcare costs incurred by a result ofbeneficiary and amounts paid by the passage of the ACA.traditional Medicare Fee-For-Service program. Medicare Part D offers a prescription drug plan to Medicare and MMP beneficiaries.
Individual Plans: We offer a full range of health insurance plans with a variety of options and deductibles for individuals who are not covered by employer-sponsored coverage and are not eligible for government sponsored plans, such as Medicare and/or Medicaid. Individual policies are generally sold through independent agents and brokers, retail partnerships, our in-house sales force or via the exchanges. Individual business is sold on a fully-insured basis. We offer on-exchange products through public exchanges and off-exchange products. Federal premium subsidies are available only for certain public exchange Individual products. Unsubsidized Individual customers are generally more sensitive to product pricing and, to a lesser extent, the configuration of the network and the efficiency of administration. Instability in the Individual market has resulted in a targeted approach where we offer products in select geographies.
•Medicaid Plans and Other State-Sponsored Programs:Programs. We have state contracts to serve members enrolled in publicly fundedOur Medicaid business includes our managed care alternatives through public-funded healthcare programs, including Medicaid; ACA-related Medicaid expansion programs; Temporary Assistance for Needy Families (“TANF”); programs for seniors and people with disabilities (“SPD”); Children’s Health Insurance Programs (“CHIP”); and specialty programs such as those focused on long-term services and support (“LTSS”), HIV/AIDS, children living in foster care, behavioral health and/or substance abuse disorders, and intellectual disabilities and/or developmental disabilities (“ID/DD programs”).disabilities. The Medicaid program makes federal matching funds available to all states for the delivery of healthcare benefits for low income and/or high medical risk individuals. These programs are managed by the individual states based on broad federal guidelines. TANF is a state and federally funded program designed for a population consisting primarily of low-income children and their guardians. SPD is a federal income supplement program designed for Supplemental Security Income recipients; however, states can broaden eligibility criteria. This population generally consists of low-income seniors and people with disabilities. CHIP is a state and federally funded program that provides healthcare coverage to children not otherwise covered by Medicaid or other insurance programs. LTSS is a state and federally funded program that offers states a broad and flexible set of program design options and covers the delivery of long-term services and support for our members who receive home and community- or institution-based services for long-term care. Our HIV/AIDS program is a state and federally sponsored program that provides services to those living with HIV/AIDS. Our foster care program is a state and federally sponsored program serving children with complex needs within the foster care system. Our behavioral health program is a state and federally sponsored program providing services to those with mental health and/or substance abuse disorders. ID/DD is a state and federally sponsored program serving those living with limitations in intellectual functioning and adaptive behavior learning disabilities. Our Medicaid plans also cover certain dual-eligible customers, as previously described above, who also receive Medicare benefits. WeAs of December 31, 2022, we provide Medicaid and
other state sponsored services, such as administrative services, in Arkansas, California, Colorado, Florida, Georgia, Indiana, Iowa, Kentucky, Louisiana, Maryland, Minnesota, Missouri, Nebraska, Nevada, New Jersey, New York, North Carolina, Ohio, Puerto Rico, South Carolina, Tennessee, Texas, Virginia, Washington, West Virginia and Wisconsin.
•Pharmacy Products:Federal Employees Health Benefits Program. In the second quarterFEHB members consist of 2019, we began using IngenioRx to marketUnited States government employees and offer PBM services totheir dependents within our affiliated health plan customers throughout the country, as well as to customers outside of the health plans we own. Our comprehensive PBM services portfolio includes features such as formulary management, pharmacy networks, a prescription drug database, member services, and mail order capabilities. IngenioRx delegates certain PBM administrative functions, such as claims processing and prescription fulfillment, to CaremarkPCS Health, L.L.C., which is a subsidiary of CVS Health Corporation (“CVS Health”), pursuant to a five-year agreement (the “CVS PBM Agreement”). With IngenioRx, we retain the responsibilities for clinical and formulary strategy and development, member and employer experiences, operations, sales, marketing, account management and retail network strategy. From December 2009 through December 2019, we delegated certain PBM functions and administrative services to Express Scripts Inc. (“Express Scripts”). Express Scripts managed the network of pharmacy providers, operated mail order pharmacies and processed prescription drug claims on our behalf, while we sold and supported the product for our members, made formulary decisions, sold drug benefit design strategy and provided front line member support. We began transitioning existing members from Express Scripts to IngenioRx in the second quarter of 2019, and completed the transition by January 1, 2020.
Behavioral Health: We offer managed care and member services for behavioral health and/or substance use disorders under contracts with state publicly funded healthcare programs, including Medicare and Medicaid, and through private health
plans and ACOs. In addition, we provide management and member benefit services for employee assistance plans to private employers and the federal government’s Military OneSource support services. Through our subsidiary, Beacon, we also provide direct behavioral health counseling services through licensed clinicians in convenient and accessible locations, principally within a retail store environment.
Life Insurance: We offer an array of competitive individual and group life insurance benefit products to both Large Group and Small Group customers in conjunction with our health plans. The life insurance products include term life and accidental death and dismemberment.
Disability: We offer short-term and long-term disability products, usually in conjunction with our health plans.
Dental: Our dental plans include networks in certain states in which we operate. Many of the dental benefits are provided to customers enrolled in our health plans and are offered on both a fully-insured and self-funded basis. Our members also have access to additional dental providersgeographic markets through our participation in the National Dental GRID, a national dental network developed by and for BCBS plans. The National Dental GRID includes dentists in all 50 statescontract between the BCBSA and the DistrictU.S. Office of Columbia and provides multi-state customers with a national solution that offers in-network discounts across the country. Additionally, we offer managed dental services to other healthcare plans to assist those plans in providing dental benefits to their customers.Personnel Management.
Vision Services and Products: •Our vision plans include networks within the states in which we operate. Many of the vision benefits are provided to customers enrolled in our health plans and are offered on both a fully-insured and self-funded basis.
Medicare Administrative Operations:Operations. Through our NGS subsidiary, NGS, we serve as a fiscal intermediary, carrier and Medicare administrative contractor for the federal government by providing administrative services for the Medicare program, Parts A and B, which generally provides coverage for persons who are 65 or older and for persons who are under 65 and disabled or with end-stage renal disease. Part A of the Medicare program provides coverage for services provided by hospitals, skilled nursing facilities and other healthcare facilities. Part B of the Medicare program provides coverage for services provided by physicians, physical and occupational therapists and other professional providers, as well as certain durable medical equipment and medical supplies.
CarelonRx
Our subsidiary CarelonRx markets and offers PBM services to our affiliated health plan customers throughout the country in both our Commercial & Specialty and our Government business segments, as well as to customers outside of the health plans we own. Our comprehensive PBM services portfolio includes features such as formulary management, pharmacy networks, a prescription drug database, member services and mail order capabilities.
CarelonRx delegates certain PBM administrative functions, such as claims processing and prescription fulfillment, to CaremarkPCS Health, L.L.C., which is a subsidiary of CVS Health Corporation (“CVS Health”), pursuant to a five-year agreement (the “CVS PBM Agreement”) that is set to terminate on December 31, 2024. With CarelonRx, we retain the responsibilities for clinical and formulary strategy and development, member and employer experiences, operations, sales, marketing, account management and retail network strategy. From December 2009 through December 2019, we delegated certain PBM functions and administrative services to Express Scripts Inc. (“Express Scripts”). We transitioned existing members from Express Scripts to CarelonRx by January 1, 2020.
Other
Our Other segment includes our Diversified Business Group, now known as Carelon Services. Business units in Carelon Services offer a broad array of healthcare related services and capabilities to internal and external customers including integrated care delivery, behavioral health, palliative care, utilization management, payment integrity services and subrogation services, as well as health and wellness programs. Key services offered include:
Radiology Benefit Management:•Behavioral Health. We offer outpatient diagnostic imagingprovide comprehensive behavioral health management services through clinical and network administration. In a limited capacity, we also provide high-quality, evidence-based behavioral healthcare and counseling services through licensed clinicians in convenient and accessible locations.
•Care Delivery. We provide highly integrated, personalized care to patients with chronic and complex conditions, whether in their home, care centers, mobile units, skilled nursing facilities, hospitals, or virtually. Additionally, we provide non-hospice, community based palliative care to deliver an extra layer of personalized support and whole-person care.
•Advanced Analytics and Services. We leverage data, analytics, and insights to help improve outcomes and lower the cost of care, by working to ensure that our members receive safe, appropriate, high-quality, cost-effective care and that our providers are reimbursed accurately and timely.
Competition
The managed care industry is highly competitive, both nationally and in our local markets. Competition continues to be intense due to aggressive marketing, pricing, bid activity for government-sponsored programs, business consolidations, new strategic alliances, new competitors in the market, a proliferation of new products, technological advancements, the impact of legislative reform, increased quality awareness and price sensitivity among customers and changing market practices, such as increased usage of telehealth.
We believe that participants in the managed care industry compete for customers based on quality of service, price, access to provider networks, access to care management and wellness programs (including health information), innovation, effective use of digital technology, breadth and flexibility of products and benefits, expertise and reputation (including National Committee on Quality Assurance (“NCQA”) accreditation status as well as CMS Star ratings), brand recognition and financial stability. Our ability to attract and retain customers is substantially tied to our ability to distinguish ourselves from our competitors in these areas.
We believe our exclusive right to market products under the most recognized brand in the industry, BCBS, in our most significant markets provides us with greater brand recognition over competitive product offerings. Typically, we are the largest participant in each of our BCBS branded markets, and thus are closely-watched by other health benefits companies.
Product pricing remains competitive and we strive to price our health benefit products and design our Medicare and Medicaid bids consistent with anticipated underlying medical trends. We believe our pricing and bid strategy, based on predictive modeling, proprietary research and data-driven processes, has positioned us to benefit from the potential growth opportunities available through entry into new markets, expansions in existing markets and as a result of any future changes to the current regulatory scheme. We believe that our pricing and bid strategy, brand name and network quality will provide a strong foundation for membership growth opportunities in the future.
Our provider networks give us a highly competitive unit cost position and provide distinctive service levels which allow us to offer a broad range of affordable health benefit products to our customers. To build our provider networks, we compete with other health benefits plans for the best contracts with hospitals, physicians and other providers. We believe that physicians and other providers primarily consider customer volume, reimbursement rates, timeliness of reimbursement and administrative service capabilities along with the reduction of non-value added administrative tasks when deciding whether to contract with a health benefits plan.
At the sales and distribution level, we compete for qualified agents and brokers to recommend and distribute our products. Strong competition exists among insurance companies and health benefits plans for agents and brokers with demonstrated ability to secure new business and maintain existing accounts. We believe that the quality and price of our products, support services, reputation and prior relationships, along with a reasonable commission structure, are the factors agents and brokers consider in choosing whether to market our products. We believe that we have good relationships with our agents and brokers, and that our products, support services and commission structure compare favorably to those of our competitors in all of our markets.
In addition, the PBM industry is highly competitive, and CarelonRx is subject to competition from national, regional and local PBMs, insurers, health plans, large retail pharmacy chains, large retail stores, supermarkets, mail order pharmacies, web pharmacies and specialty pharmacies. Strong competition within the PBM industry has generated greater demand for lower product and service pricing, increased revenue sharing and enhanced product and service offerings.
Pricing and Underwriting of Our Products
We price our products based on our assessment of current healthcare claim costs and emerging healthcare cost trends, combined with charges for administrative expenses, risk and profit. We continually review our product designs and pricing guidelines on a national and regional basis so that our products remain competitive and consistent with our profitability goals and strategies.
Our revenue on Medicare policies is based on annual bids submitted to CMS. We base the Commercial and Medicaid premiums we charge and our Medicare bids on our estimates of future medical costs over the fixed contract period. In applying our pricing to each employer group and customer, we aim to maintain consistent, competitive and disciplined underwriting standards. We employ our proprietary accumulated actuarial and financial data to determine underwriting and pricing parameters for both our risk-based and fee-based businesses.
In most circumstances, our pricing and underwriting decisions follow a prospective rating process in which promotea fixed premium is determined at the most appropriate usebeginning of the contract period. For our risk-based business, any deviation, favorable or unfavorable, from the medical costs assumed in determining the premium is our responsibility. Some of our larger groups employ retrospective rating reviews, where positive experience is partially refunded to the group, and negative experience is charged against a rate stabilization fund established from the group’s favorable experience or charged against future favorable
experience. In addition, our ACA and government risk-based contracts may include minimum medical loss ratio, risk adjustment, or risk corridor arrangements, which also stabilize premiums based upon claims experience.
Our pharmacy pricing through CarelonRx is presented to market via discounts off the average wholesale price for drugs dispensed through the retail, mail and specialty channels as well as through rebate projections. We utilize group-specific script data, formulary, network and clinical servicescare program selection combined with administrative expense, risk and profit guidance to improveset market competitive pricing discounts and rebate projections. Pharmacy pricing guidelines guide the quality of care deliveredunderwriting process and undergo an annual external review process to members. These services include utilization management for advanced diagnostic imaging procedures, network development and optimization, patient safety, claims adjudication and provider payment.ensure market competitiveness.
Personal Healthcare Guidance: We offer evidence-based and analytics-driven personal healthcare guidance. These services help improve the quality, coordination and safety of healthcare, enhance communications between patients and their physicians, and reduce medical costs.
Networks and Provider Relations
Our relationships with physicians, hospitals and professionals that render healthcare services to our members are guided by local, regional and national standards for network development, reimbursement and contract methodologies. While following industry standards, we are simultaneously seeking to lead transformation efforts within our healthcare system, moving from a fragmented model premised on episodic intervention to one based on proactive, coordinated care built around the needs of the patient. A key element of this transformation involves a transition from traditional fee-for-service payment models to models where providers are paid based on the value, both in quality and affordability, of the care they deliver.
We establish “market-based” hospital reimbursement payments that we believe are fair, but aggressive, and among the most competitive in the market. We also seek to ensure that physicians in our network are paid in a timely manner at appropriate rates. In many instances, we deploy multi-year contracting strategies, including case rates or fixed rates, to limit our exposure to medical cost inflation and to increase cost predictability. We maintain both broad and narrow provider networks to ensure member choice, based on both price and access needs, while implementing programs designed to improve the quality of care our members receive. Increasingly, we are supplementing our broad-based networks with smaller or more
cost-effective networks that are designed to be attractive to a more price-sensitive customer segment, such as public exchangePublic Exchange customers.
Our reimbursement strategies vary across markets and depend on the degree of consolidation and integration of physician groups and hospitals. Under a fee-for-service reimbursement methodology for physicians, fee schedules are developed at the state level based on an assessment of several factors and conditions, including the CMS resource-based relative value system (“RBRVS”), medical practice cost inflation and physician supply. We utilize CMS RBRVS fee schedules as a reference point for fee schedule development and analysis. The RBRVS structure was developed, maintained, and updated by CMS and is used by the Medicare program and other major payers.health plans. In addition, we have implemented and continue to expand physician incentive contracting, or “pay-for-performance,” which ties physician payment levels to performance on clinical measures.
While we generally do not delegate full financial responsibility to our physician providers in the form of capitation-based reimbursement, we maintain capitation-based arrangements in certain markets where we determine that market dynamics result in it being a useful method to lower costs and reduce underwriting risk. Our provider engagement and contracting strategies have evolved to include value-based contracting arrangements that meet providers where they are in the movement from traditional fee-for-service to value-based care. These programs are designed to support Commercial, Medicare and Medicaid programs and the unique characteristics of these populations. Our value-based contracting programs are designed to reward our contracted providers for improving the overall quality of care they deliver by adhering to evidence-based medicine. In addition, these value-based contracts also share with the providers total cost of care savings that are achieved by adhering to evidence-based medicine over time. For providers who contract in one of our value-based programs, we work with them to share gaps in care information and other important data to assist them in managing the care of their patients. Often providers will also grant us access to data to support the efficient administration of program components. This data can allow us to more efficiently capture information regarding the risk of our membership and the overall adherence to evidence-based medicine, as well as information to more efficiently perform utilization management administration.
Our hospital contracts provide for a variety of reimbursement arrangements depending on local market dynamics and current hospital utilization efficiency. Most hospitals are reimbursed a fixed amount per day or reimbursed a per-case amount, per admission, for inpatient covered services. A small percentage of hospitals, primarily rural, sole community hospitals, are reimbursed on a discount from approved charge basis for covered services. Our “per-case” reimbursement
methods utilize many of the same attributes contained in Medicare’s Diagnosis Related Groups methodology. Hospital outpatient services are reimbursed by fixed case rates, fee schedules or percent of approved charges. Our hospital contracts recognize unique hospital attributes, such as academic medical centers or community hospitals, and the volume of care performed for our members. To improve predictability of expected costs, we frequently use a multi-year contracting approach with providers. In addition, the majority of our hospital contracts include a pay-for-performance component where reimbursement levels are linked to improved clinical performance, patient safety and medical error reduction.
Our provider engagementSeasonality
We experience seasonality in our Commercial & Specialty Business and contracting strategiesGovernment Business segments. While our premium revenues are moving away from “unit price” or volume-based payment models to payment models that align compensation withnot seasonal, our benefit costs typically increase during the value deliveredyear as measured by healthcare outcomes, qualityour risk-based members pay their contractual portion of claims responsibility under annual deductibles and cost. Our Enhanced Personal Health Care program augments traditional fee-for-service with shared savings opportunities for providers when actual healthcare costs are below projected costs and providers meet specific quality measures. The quality measures are based on nationally accepted, credible standards (e.g., NCQA, the American Diabetes Association and the American Academy of Pediatrics) and span preventive, acute and chronic care. We understand, however, that payment incentives alone are insufficient to create the large-scale, system-wide transformation required to achieve meaningful impacts on cost, quality and member experience. Accordingly, we are investing in care delivery transformation and population health management support structures to help providers succeed under value-based payment models. This support includes our web-based population health management technology and teams of dedicated practice consultants who work alongside providers, sharing best practices, and helping them leverage our data to the benefit ofreach their patients. In some of these arrangements, participating physician practices receive a per-member, per-month clinical coordination fee to compensate them for important care management activities that occur outside of the patient visit (e.g., purchasing an electronic health record or hiring care management nurses), all of which have been shown to reduce healthcare costs and improve care outcomes. Since the launch of our Enhanced Personal Health Care program, we now have arrangements with provider organizations covering 52% of our PCPs and have rolled this program out in each of the 14 states where we operate as a licensee of the BCBSA.out-of-pocket maximum limits.
Medical Management Programs
Our medical management programs includeWe have a broad array of medical management activities that facilitate improvements in the quality of care provided to our members and promote cost-effective medical care. These medical management activities and programs are administered and directed by physicians and nurses. The goalsnurses with the goal of our medical management strategies are to ensureensuring that the care delivered to our members is supported by appropriate medical and scientific evidence, is received on a timely basis and occurs in the most appropriate setting. The following is a general description of our medical management programs which are available to our members may vary depending on the particular plan or product in which they participate:participate.
Precertification: A traditional medical management program involves assessmentCare coordination is one of the strategies we utilize and is based on nationally recognized criteria developed by third-party medical specialists to help coordinate inpatient as well as outpatient care and monitor appropriate utilization of such services. Our case management focuses on identifyingmembership that will require a high level of intervention and providing assistance to manage their healthcare needs. Precertification is utilized to assess appropriateness of certain hospitalizations and other medical services prior to the services being rendered. For example, precertification is used to
determine whether a set of hospital and medical services is being appropriately applied to the member’s clinical condition, in accordance with criteria for medical necessity as that term is defined in the member’s benefits contract. All of our health plans have implemented precertification programs for selected medical services including surgeries, major diagnostic procedures, devices, drugs and other services to help members maximize benefits and avoid unnecessary charges or penalties. Through our American Imaging Management, Inc. subsidiary, doing business as AIM Specialty Health (“AIM”) we promote appropriate, safe and affordable member care in the areas of imaging, sleep disorders, cardiac testing, oncology drugs and musculoskeletal procedures. These expanded specialty benefit management solutions leverage clinical expertise and technology to engage our provider communities and members in more effective and efficient use of outpatient services.
Care coordination: Another traditional medical management strategy we use is care coordination, which is based on nationally recognized criteria developed by third-party medical specialists. With inpatient care coordination, the requirements and intensity of services during a patient’s hospital stay are reviewed, at times by an onsite, skilled nurse professional in collaboration with the hospital’s medical and nursing staff, in order to coordinate care and determine the most effective transition of care from the hospital setting. In addition, continued stay cases are reviewed with physician medical directors to ensure appropriate utilization of medical services. We also coordinate care for outpatient services to help ensure that patients with chronic conditions who receive care from multiple physicians are able to manage the exchange of information between physicians and coordinate office visits to their physicians.
Case management: We have implemented a medical management strategy focused on identifying the small percentage of the membership that will require a high level of intervention and assistance to manage their healthcare needs. Case management identifies members who are likely to be re-admitted to the hospital through claims analysis using predictive modeling techniques, the use of health risk assessment data, utilization management reports and referrals from a physician or one of our other programs, such as the 24/7 NurseLine. Registered nurses, medical directors, behavioral health experts, pharmacists and other clinicians focus on these members and help them coordinate their care through pharmacy compliance, post-hospital care, follow-up visits to see their physician and support in their home. Increasingly, we collaborate with our providers and key health partners within the member’s provider care team by providing actionable patient data insights, practice-coaching capabilities, technology and programs and products that help our providers and health partners to successfully deliver the right care, at the right time, in the right place.
Formulary management: We have developed formularies, which are selections of drugs based on clinical quality and effectiveness. A pharmacy and therapeutics committee of physicians uses scientific and clinical evidence to ensure that our members have access to the appropriate drug therapies and receive these therapies through proper settings.
Medical policy: AOur medical policy committee determines our national policies and guidelines for the application of medical technologies, procedures and services. This committee is comprised of internalservices and external physician leaders from various specialtiesreviews these policies and areas of the country. We also work in cooperation with academic medical centers, practicing community physicians and medical specialty organizations. All guidelines and policies are reviewed at least once a year or as new published clinical evidence becomes available.
Quality programs: We are actively engaged with our hospital and physician networks to enable them to improve medical and surgical care and achieve better outcomes for our members. We endorse, encourage and incentivize hospitals and physicians to support national initiatives to improve the quality of clinical care and patient outcomes and to reduce medication errors and hospital infections.
External review procedures: Wealso work with outside experts through a process of external review to provide our members scientifically and clinically, evidence-based medical care. When we receive member concerns, we have formal appeals procedures that ultimately allow coverage disputes related to medical necessity decisions under the benefits contract to be settled by independent expert physicians.
Provider cost comparison tools: Through Estimate Your Cost, Care & Cost Finder, and otherOur web-based tools allow our members canto obtain or compare cost estimates quality accreditation data and patient reviews for common services at contracted providers, with cost estimates for facility, professional and ancillary services. These cost estimates bundle related services typically performed at the time of the procedure, not just for the procedure itself. Users can review cost data for over 400 common, shop-able medical procedures in all states. Members can also estimatecare, including out-of-pocket costs based on a member’s own benefit coverage, deductible, and out-of-pocket maximum. We also offer information on overall facilitycosts.
ratings and patient experience using trusted third-party data. We continueremain committed to work on enhancing and evolvingassisting our tools to assist members in making informed and value-based healthcare decisions. In addition, we collaborate with an external independent vendor to support employers wanting to purchase a consumer engagement solution with certain additional functionality.
Anthem Health Guide: Anthem Health Guide integrates the customer service experience with clinical and wellness coaching to providedecisions, providing for easier navigation of healthcare services for our members. Anthem Health Guide provides members with education on benefit options and digital opportunities that fit member references, and makes recommendations for eligible clinical programs to ensure members are connected to the most appropriate care and clinical resources. By allowing members to connect with us using voice, click-to-chat, secure email and mobile technology, we enhance our ability to engage with our members.
Anthem Whole Health Connection: Anthem Whole Health Connection is a differentiated approach to whole person health that connects medical, pharmacy, dental, vision, disability, behavioral health and supplemental health clinical and claims data to proactively identify health issues earlier and engage our members with their health providers in new ways to support health, lower costs and deliverdelivering a better healthcare experience. Anthem Whole Health Connection is included when Anthem health benefits are combined with one or more of the Anthem pharmacy, dental, vision, life, disability, behavioral health or supplemental health coverage plans.
Care Management and Wellness Products and Programs
We continue to expand our360º Health suite of integrated care management programs and tools. 360º Health offers the followingAvailability of these programs among others, which are availableand tools to our members dependingmay depend on the particular plan or product in which they participate,participate. Our care management tools and have been provenprograms are designed to increase quality and reduce medical costs for our members:
ConditionCaremembers and FutureMoms arehelp them make better decisions about their well-being as they navigate the healthcare system. Our digital engagement platform, Sydney Health, is designed to give our members access to personalized health and wellness resources; medical, pharmacy, dental, vision, life, and disability benefits details; as well as virtual care services, all in one place. Our care management, infertility services and maternity management programs that serve as adjuncts to physician care. Skilled nurse professionals, with added support from our team of dietitians, social workers, pharmacists, health educators and other healthThrough these programs, medical professionals help to educate participants understandregarding their condition, their doctor’s orderscare and how to become a better self-manager of their condition. We also offer members infertility consultation through our SpecialOffers@Anthem program, a comprehensive and integrated assembly of discounted health and wellness products and services from a variety of the nation’s leading retailers.
Our 24/7 NurseLine offers access to qualified, registered nurses anytime. This allowsto allow our members to make informed decisions about the appropriate level of care and avoid unnecessary worry. This program also includesOur CareMore subsidiary specializes in whole-person care for members with complex and chronic conditions to improve clinical outcomes and patient wellbeing. Our Aspire Health subsidiary engages with members near-end-of life and/or requiring palliative care to manage serious illnesses and improve quality of life during a referral process to the nearest urgent care facility, a robust audio library, accessible by phone, with more than 600 health and wellness topics, as well as on-line health education topics designed to educate members about symptoms and treatment of many common health concerns.
MyHealth Advantage utilizesdifficult time. With our integrated information systems and sophisticated data analytics, towe help our members improve their compliance with evidence-based care guidelines, providingprovide personal care notes that alert members to potential gaps in care, enable more prudent healthcare choices and assist in the realization of member out-of-pocket cost savings. Key opportunities are also sharedOur employee assistance programs provide 24/7 telephonic support for personal and crisis events and provide resources such as counseling and referral assistance with physicians through Availity® at the time of membership eligibility verification. Availity® is an electronic data interchange system that allows for the exchange of health information among providers over a secure network.
MyHealth Coach provides our members with a professional guide who helps them navigate the healthcare system and make better decisions about their well-being. MyHealth Coach proactively reaches out to people who are at risk for potentially serious health issues or have complex healthcare needs. Our health coaches help participants understand and manage chronic conditions, handle anychildcare, health and wellness, related services they needfinancial issues, legal issues, adoption and make smart lifestyle choices.
HealthyLifestyles helps employees transform unhealthy habits into positive ones by focusing on behaviors that candaily living. We have a positive effect on theircomprehensive behavioral health and their employer’s financial well-being. case
HealthyLifestyles programs include smoking cessation, weight management, stress management, physical activity, and diet and nutrition.
Behavioral Health Case Management is a comprehensivemanagement program supporting a wide range of members who are impacted by their behavioral health condition, including specialty areas such as eating disorders, anxiety, depression and
substance abuse. The program assists members and their families with obtaining appropriate behavioral health treatment, offering community resources, providing education and telephonic support, and promoting provider collaboration.
Autism Spectrum Disorder Program is a specialized case management program staffed by a dedicated team of clinicians who have been trained on the unique challenges and needs of families with a member who has a diagnosis of autism spectrum disorder. These clinicians provide education, information on community resources to help with care and support, guidance on the appropriate usage of benefits, and assistance in exploring effective treatments, such as medical services, that may help the member and their families.
Employee Assistance Programs provide 24/7 telephonic support for personal and crisis events. Members also gain access to many resources that allow support within work and personal life by providing quick and easy access to confidential resources to help meet the challenges of daily life. Examples of services available include counseling, referral assistance with child care, health and wellness, financial issues, legal issues, adoption and daily living.
Healthcare Quality Initiatives
Increasingly, the healthcare industry is able to define quality healthcare based on effective, safe, equitable and affordable care in preventive health, measurements, outcomes of care and optimal care management for chronic disease. A key to our success has been our ability to workdevelop partnerships by working with our network physicians, hospitals, and hospitalssocial resources providers to improve the quality and outcomes of the healthcare and social impact services provided to our members.members, their families, and the community-at-large. Our ability to promote quality medical care, address health-related social risks, and advance health equity has been recognized by NCQA, the largest and most respected national accreditation program for managed care health plans.
Several quality healthcare measures, including the Healthcare Effectiveness Data and Information Set (“HEDIS®”), have been incorporated into NCQA’s accreditation processes. HEDIS® measures range from preventive services, such as screening mammography and pediatric immunization, to elements of care, including decreasing the complications of diabetes, and improving treatment for patients with heart disease. In 2020, NCQA announced that it was eliminating its then-existing status levels for health plans and moving to CMS Star ratings in order to make accreditation ratings more transparent. Accredited plans earn ratings after they submit HEDIS/CAHPS reporting and can advertise the rating alongside their accreditation seal. Due to the COVID-19 pandemic, NCQA did not release 2020-2021 Health Plan Ratings or Star ratings for any product line. CMS reported Star ratings for Medicare; however, HEDIS/CAHPS utilized the scores from the 2018 measurement year.
Even though the utilizationdisease, integration of clinical data for scoring is uncertain, we continued to support our members by promotingbehavioral health, and wellness in a variety of ways. In an effortracial and ethnic stratification measurement to help close healthcare disparities.
Through our AIM Specialty Health (“AIM”) subsidiary, we promote the importance of preventive screeningsappropriate, safe and chronic condition management, we conducted check-in calls to high-risk Medicaid and Medicare members at the onset of the COVID-19 pandemic to address access to medication, adequate food supply and social isolation. Outreach was also conducted to remind our members of overdue screenings and appointment scheduling assistance was provided, when requested by the member. Additionally, to address our members’ concerns over potential exposure to COVID-19, we deployed home lab kits to members enabling them to complete colon cancer screenings and manage their diabetesaffordable member care in the safetyareas of their own homes.
Our wholly-owned health outcomes research subsidiary, HealthCore, Inc. (“HealthCore”) generates consistentimaging, sleep disorders, cardiac testing, oncology drugs and actionable evidencemusculoskeletal procedures. These expanded specialty benefit management solutions leverage clinical expertise and technology to support decision making while helping to guide fresh initiatives for a range of stakeholdersengage provider communities and members in the healthcare industry. By leveraging a rich arraymore effective and efficient use of medicaloutpatient services and pharmacy utilization data queried from administrative claims, patient surveys, medical charts and laboratory diagnostics, among other health records, HealthCore’s multi-disciplinary research teams develop a broad spectrum of safety, clinical research trials, effectiveness, pharmacoepidemiology, and health economics evidence. HealthCore’s real world evidence and comparative effectiveness research, among other data, have played roles in the product planning and development campaigns of biotechnology and pharmaceutical companies and today it lists most of the leading biologics and drug manufacturers as clients or alliance partners.
Our AIM subsidiary supports quality by implementing clinical appropriateness and patient safety solutions for advanced imaging procedures, cardiology, sleep medicine, medical oncology, radiation therapy, rehabilitative, certain outpatient surgical and musculoskeletal services. These programs, based on widely accepted and evidence-based clinical guidelines,to promote the most appropriate use of clinical services to improve the quality of overall healthcare delivered to our members and members of other health plans that are covered under AIM’s programs. To provide additional impact
Through our myNEXUS, Inc. (“myNEXUS”) subsidiary, we perform management review for home health services provided to its clinical appropriateness program, AIMMedicare members, with the goal of ensuring they receive appropriate, high-quality care and supporting their transition back into the home. Effective management of these services can help reduce preventable hospital admissions and readmissions, thereby improving healthcare outcomes for patients. Additionally, myNEXUS has also implemented a provider assessment program, OptiNet®, which promotes more
informed selectiondeveloped programs to address healthcare quality by identifying social determinants of diagnostic imaging and testing facilities by providing cost and facility information to physician offices at the point that a procedure is ordered. We have also leveraged AIM’s provider network assessment information to proactively engage and educatehealth needs of our members about imaging providers and sleep testing choices based on site capabilitiesseeking to close gaps in care through an in-home assessment. Both AIM and cost differences. This program is another examplemyNEXUS programs are examples of how we facilitate improvements in the quality of care provided to our members and promote cost-effective medical care.
PricingThe physical aspects of health have been traditionally the focus and Underwritingthe priority for healthcare. However, unique life circumstances and experiences impact every individual and their health. We seek to understand our members' health-related social needs to create a healthcare system that synchronizes care delivery for physical, behavioral, social and pharmacy needs. We are advancing our efforts through consistent screening of Our Products
We price our products based on our assessment of current healthcare claim costs and emerging healthcare cost trends, combined with chargesmembers for administrative expenses, risk and profit, including chargestheir social needs by using industry-standard tools such as the Protocol for the ACA taxes and fees, where applicable. We continually review our product designs and pricing guidelines on a national and regional basis so that our products remain competitive and consistentResponding to & Assessing Patients’ Assets, Risks & Experiences, co-creating social action plans with our profitability goalsmembers, connecting members to related social support services, and strategies.
Our revenueevaluating the entire process for continuous quality improvement. We are committed to ensuring that all people, regardless of age, race or ethnicity, sexual orientation, gender identity, disability, and geographic or financial access can receive individualized care. Harnessing data gives a more complete picture of each individual and their health needs and can help make healthcare more personalized and equitable. Strengthening communities has a positive effect on Medicare policies is based on annual bids submitted to CMS. We base the commercialhealth therefore we value and Medicaid premiums we charge andnurture our Medicare bids on our estimates of future medical costs over the fixed contract period. In applying our pricing to each employer group and customer, we aim to maintain consistent, competitive, disciplined underwriting standards. We employ our proprietary accumulated actuarial and financial data to determine underwriting and pricing parameters for both our fully-insured and self-funded businesses.
In most circumstances, our pricing and underwriting decisions followlocal ties which are a prospective rating process in which a fixed premium is determined at the beginning of the contract period. For our fully-insured business, any deviation, favorable or unfavorable, from the medical costs assumed in determining the premium is our responsibility. Somekey component of our larger groups employ retrospective rating reviews, where positive experience is partially refundedwhole-health approach and drive us to work closely with community organizations that create support networks. Using our data, we also identify the group, and negative experience is charged against a rate stabilization fund established fromresources needed to support local residents, including the group’s favorable experience or charged against future favorable experience. In addition, our ACA and government fully-insured contracts may include minimum medical loss ratio, risk adjustment, or risk corridor arrangements, which also stabilize premiums based upon claims experience.
Our pharmacy pricing through IngenioRx is presented to market via discounts off the average wholesale price for drugs dispensed through the retail, mail and specialty channels as well as through rebate projections. We utilize group-specific script data, formulary, network and clinical care program selection combined with administrative expense, risk and profit guidance to set market competitive pricing discounts and rebate projections. Pharmacy pricing guidelines guide the underwriting process and undergo an annual external review processpeople who we serve, to ensure market competitiveness.those resources can better meet local needs.
BCBSA Licenses
We are a party to license agreements with the BCBSA that entitle us to the exclusive, and in certain areas, non-exclusive, use of the Blue Cross and Blue Shield names and marks in assigned geographic territories. BCBSA is a national trade association of independent Blue Cross and Blue Shield licensees,companies, the primary function of which is to promote and preserve the integrity of the BCBS names and marks, as well as provide certain coordination among the member companies. Each BCBSA licensee
is an independent legal organization and is not responsible for obligations of other BCBSA member organizations. Although previously we did not have noa right to marketsell products and services using the BCBS names and marks outside of the states in which we are licensed to sell BCBS products, in accordance withunder the terms of the subscriber settlement agreement and release (“Subscriber Settlement Agreement”) that was agreed to in 2020 byamong the class of plaintiffs, BCBSA and Blue Cross and/or Blue Shield licensees, including us (the “Blue plans”), some large national employers with self-funded benefits plans (specifically identified in the Subscriber Settlement Agreement) have a right to request a bid for insurance coverage from a second Blue plan bid in addition to a bid from the local Blue plan. The Subscriber Settlement Agreement received final approval in August 2022. We are required to pay an annual license fee to the BCBSA based on enrollment and also to comply with various requirements and restrictions regarding our operations and our use of the BCBS names and marks. These requirements and restrictions include, among other things: minimum capital and liquidity requirements; enrollment and customer service performance requirements; participation in programs that provide portability of membership between plans; disclosures to the BCBSA relating to enrollment and financial conditions; disclosures as to the structure of the BCBS system in contracts with third parties and in public statements; plan governance requirements; cybersecurity requirements; a requirement that at least 80% (or, in the case of Blue Cross of California, substantially all) of a licensee’s annual combined local net revenue, as defined by the BCBSA, attributable to healthcare plans and related services within its service areas must be sold, marketed, administered or underwritten under the BCBS names and marks; a requirement that at least two-thirds of a licensee’s annual combined national net revenue, as defined by the BCBSA, attributable to healthcare plans and related services must be sold, marketed, administered or underwritten under the BCBS names and marks; a requirement that neither a plan nor any of its licensed affiliates may permit an entity other than a plan or
a licensed affiliate to obtain control of the plan or the licensed affiliate or to acquire a substantial portion of its assets related to licensable services; governance requirements such as a requirement that we divide our Board of Directors into three classes serving staggered three-year terms; a requirement that we guarantee certain contractual and financial obligations of our licensed affiliates; and a requirement that we indemnify the BCBSA against any claims asserted against it resulting from the contractual and financial obligations of any subsidiary that serves as a fiscal intermediary providing administrative services for Medicare Parts A and B. In addition, a change of control or violation of the BCBSA ownership limitations on our capital stock, impending financial insolvency or the appointment of a trustee or receiver or the commencement of any action against us seeking our dissolution could cause a termination of our BCBSA license agreements.
We believe that we and our licensed affiliates are currently in compliance with these standards. The standards under the license agreements may be modified in certain instances by the BCBSA. See Part I, Item 1A, “Risk Factors” in this Annual Report on Form 10-K for additional details on the impact if we were not to comply with these license agreements and Note 14, “Commitments and Contingencies -– Litigation and Regulatory Proceedings – Blue Cross Blue Shield Antitrust Litigation” of the Notes to our Consolidated Financial Statements included in Part II, Item 8 of this Annual Report on Form 10-K for additional information on the Subscriber Settlement Agreement.
Regulation
General
Our operations are subject to comprehensive and detailed state, federal and international regulation throughout the jurisdictions in which we do business. These laws and regulations, which can vary significantly from jurisdiction to jurisdiction, restrict how we conduct our businesses and result in additional burdens and costs to us. Further, federal and state laws and regulations are subject to amendments and changing interpretations in each jurisdiction. The application of these complex legal and regulatory requirements to the detailed operation of our businesses creates areas of uncertainty. In addition, there are numerous proposed healthcare laws and regulations at the federal and state levels, including single payer, Medicare for All and public option proposals, some of which could materially adversely affect our businesses if they were to be enacted.
Supervisory agencies, including federal and state regulators and departments of health, insurance and corporation, have broad authority to:
•grant, suspend and revoke licenses to transact business;
•regulate our products and services in great detail;
•regulate, limit, or suspend our ability to market products, including participation in Medicare and the ACA public exchanges;Public Exchanges;
•determine through a procurement process our ability to participate in certain programs, including state Medicaid programs;
•retroactively adjust premium rates;
•monitor our solvency and reserve adequacy;
•audit, and recovery of audit discrepancies, including risk adjustment data validation (“RADV”) audits;
•scrutinize our investment activities on the basis of quality, diversification and other quantitative criteria; and
•impose monetary and criminal sanctions for non-compliance with regulatory requirements.
To carry out these tasks, these government entities periodically examine our operations and accounts.
The health benefits business also may be adversely impacted by court and regulatory decisions that expand or invalidate the interpretations of existing statutes and regulations. It is uncertain whether we could recoup, through higher premiums or other measures, the increased costs of mandated benefits or other increased costs caused by potential legislation, regulation or court rulings. See Part I, Item 1A “Risk Factors” in this Annual Report on Form 10-K.
COVID-19
FederalWith the declaration of COVID-19 as a public health emergency (“PHE”), the federal and state legislation has beengovernments have enacted, and is likely tomay continue to be enacted,enact, legislation and regulations in response to the COVID-19 pandemic that hashave had, and we expect will continue to have, a significant impact on all of our lines of business, including mandates to waive cost-sharing on COVID-19 vaccination, testing, treatment and related services. The federal government enacted the Coronavirus Preparedness and Response Supplemental Appropriations Act, the Families First Coronavirus Response Act and the Coronavirus Aid, Relief and Economic Security (“CARES”) Act in March 2020, the Paycheck Protection Program and Health Care Enhancement Act in April 2020, and the Consolidated Appropriations Act of 2021 in December 2020 (the “Appropriations Act”). These acts provide, among other things, prohibitions on prior authorization and cost-sharing for certain items and services related to COVID-19 tests, reforms including waiving Medicare originating site restrictions for qualified providers providing telehealth services, financial support to healthcare providers, including expansion of the Medicare accelerated payment program to all providers receiving Medicare payments, and funding to replenish and administer small business loan programs to help small businesses keep their workers employed and healthcare benefits covered in the group market.
Regulatory changes have also been enacted, and are likely to continue to be enacted, at the state and federal level in response to the COVID-19 pandemic. Those changes, which could have, a significant impact on health benefits, consumer eligibility for public programs and our cash flows include mandated expansionfor all lines of premium payment terms including the time periodbusiness, and which have introduced increased uncertainty around our cost structure. These actions, which are or have been in effect for which claims can be deniedvarious durations, provide, among other things: mandates to waive cost-sharing for lack of payment,COVID-19 testing, vaccines and related services; financial support to healthcare providers; and mandates related to prior authorizations, and payment levels to providers, additional consumer enrollment windows and an increased abilitytelehealth services. The Biden administration renewed the PHE on January 11, 2023 and has indicated that they intend for the PHE to provide servicesexpire on May 11, 2023.
Under the Consolidated Appropriations Act of 2023 (the “2023 Appropriations Act”), Congress decoupled Medicaid eligibility recertification from the PHE. As a result, states may begin removing ineligible beneficiaries from their Medicaid programs starting April 1, 2023. When recertifications resume, we expect a decline in our Medicaid membership. At the same time, we expect growth in our Commercial risk-based and fee-based plans and Medicare, including through telehealth. We are providing extensions to premium payment termsthe Public Exchanges, as members exiting Medicaid in certain situations and working closely with state regulators that are mandating or requesting such relief.our 14 Commercial states seek coverage elsewhere.
The AppropriationsInflation Reduction Act of 2022
The AppropriationsInflation Reduction Act of 2022 (the “Inflation Reduction Act”), which was signed into law in August 2022, contains a numbervariety of provisions that impact our business including an extension of the American Rescue Plan Act of 2021's enhanced Premium Tax Credits (“PTC”) through 2025; imposing a new corporate alternative minimum tax; providing a one percent excise tax on repurchases of stock made after December 31, 2022; allowing CMS to negotiate prices on a limited set of prescription drugs in Medicare Parts B and D beginning in 2026; instituting caps on insulin cost sharing in Medicare Parts B and D; redesigning of the Medicare Part D benefit; adding a requirement that drug manufacturers pay rebates if prices increase beyond inflation; and delaying the implementation of the Trump Administration Medicare drug rebate rule to 2032. The extension of the enhanced PTC will likely allow for growth in Individual exchange market enrollment as Medicaid eligibility recertifications resume, supporting continuity of coverage for more people.
The Consolidated Appropriations Act of 2021
The Consolidated Appropriations Act of 2021 (the “2021 Appropriations Act”) has impacted us since passage and in the future may have a material effect upon our business, including procedures and coverage requirements related to surprise medical bills and new mandates for continuity of care for certain patients, price comparison tools, disclosure of broker compensation, mental health parity reporting, and reporting on pharmacy benefits and drug costs. The various health plan-related requirements of the 2021 Appropriations Act will go into effect on January 1,applicable to us have varying effective dates, some of which were effective in December 2021 and during 2022, and our first report on pharmacy benefits and drug costs due on December 27, 2021.others of which have been extended into 2023 since the enactment of the 2021 Appropriations Act.
State Regulation of Insurance Companies and HMOs
Our insurance and HMO subsidiaries must obtain a certificate of authority and maintain that license in the jurisdictions in which they conduct business. The National Association of Insurance Commissioners (“NAIC”) has adopted model regulations that, where adopted by states, require expanded governance practices, risk and solvency assessment reporting and
the filing of periodic financial and operating reports. Most states have adopted these or similar measures to expand the scope of regulations relating to corporate governance and internal control activities of HMOs and insurance companies. Health insurers and HMOs are subject to state examination and periodic license renewal.
In addition, we are regulated as an insurance holding company and are subject to the insurance holding company acts of the states in which our insurance company and HMO subsidiaries are domiciled. These acts contain certain reporting requirements, as well as restrictions on transactions between an insurer or HMO and its affiliates, and may restrict the ability of our regulated subsidiaries to pay dividends to our holding companies. These holding company laws and regulations generally require registration with applicable state departments of insurance and the filing of reports describing capital structure, ownership, financial condition, certain intercompany transactions, enterprise risks, corporate governance and general business operations. In addition, stateState insurance holding company laws and regulations require notice or prior regulatory approval of transactions including acquisitions, material intercompany transfers of assets, guarantees and other transactions between the regulated companies and their affiliates, including parent holding companies. Applicable state insurance holding company acts also restrict the ability of any person to obtain control of an insurance company or HMO without prior regulatory approval. “Control” is generally defined as the direct or indirect power to direct or cause the direction of the management and policies of a person and is presumed to exist if a person directly or indirectly owns or controls 10% or more of the voting securities of another person. Dispositions of control generally are also regulated under the state insurance holding company acts.
The states of domicile of our regulated subsidiaries have statutory risk-based capital (“RBC”) requirements for health and other insurance companies and HMOs based on the Risk-Based Capital (RBC) For Health Organizations Model Act. These RBC requirements are intended to assess the capital adequacy of life and health insurers and HMOs, taking into account the risk characteristics of a company’s investments and products. In general, under these laws, an insurance company or HMO must submit a report of its RBC level to the insurance department or insurance commissioner of its state of domicile for each calendar year. The law requires increasing degrees of regulatory oversight and intervention as a company’s RBC declines. As of December 31, 2020,2022, the RBC levels of our insurance and HMO subsidiaries exceeded all applicable mandatory RBC requirements. For more information on RBC capital and additional liquidity and capital requirements for a licensee of the BCBSA, see “Management’s Discussion and Analysis of Financial Condition and Results of Operations–Liquidity and Capital Resources–Risk-Based Capital Resources,” included in Part II, Item 7 of this Annual Report on Form 10-K.
Ongoing Requirements and Changes Stemming from the ACA
The ACA significantly changed the United States healthcare system. While we anticipate continued efforts to invalidate, modify, repeal or replaceSince its enactment in 2010, the ACA either through Congress or courthas introduced new risks, regulatory challenges weand uncertainties, has impacted our business model and strategy and has required changes in the way our products are designed, underwritten, priced, distributed and administered. We expect the major portions of the ACA to remain in place andwill continue to significantly impact our business operations and results of operations, including pricing, minimum medical loss ratios (“MLRs”) and the geographies in which our products are available.
The ACA prohibits lifetime limits, certain annual limits, member cost-sharing We also expect further and ongoing regulatory guidance on specified preventive benefits and pre-existing condition exclusions. Further, the ACA implemented certain requirements for insurers, including changes to Medicare Advantage payments and the minimum MLR provision that requires insurers to pay rebates to customers when insurers do not meet or exceed the specified MLR thresholds. In addition, the ACA also required a number of other changes with significant effects on both federalissues related to Medicare, including evolving methodology for ratings and state health insurance markets, including strict rules on how health insurance is rated, what benefits must be offered, the assessment of new taxes and fees (including annual fees on health insurance companies), the creation of public exchanges for Individuals and Small Groups, the availability of premium subsidies for qualified individuals, and expansions in eligibility for Medicaid. Changes to our business environment are likely to continue as elected officials at the national and state levels continue to enact, and both elected officials and candidates for election continue to propose, significant modifications to existing laws and regulations, includingquality bonus payments. CMS also frequently proposes changes to taxes and fees. In addition, the legal challenges regarding the ACA, including a federal district court decision invalidating the ACA in its entirety, which was argued before the U.S. Supreme Court in November 2020 and has been stayed pending the U.S. Supreme Court’s decision, continue to contribute to this uncertainty.
In a separate development, in April 2020, the U.S. Supreme Court ruledprogram that the federal government is required to pay health insurance companies for amounts owed, as calculatedaudits data submitted under the risk corridor program of the ACA. In June 2020, the U.S. Court of Federal Claims entered a final judgment stipulatingadjustment programs in ways that we are entitled to reimbursement for risk corridor amountscould increase financial recoveries from 2014, 2015 and 2016. At the end of December 2020, the U.S. Department of Health and Human Services (“HHS”) issued guidance on how to treat the risk corridor recoveries, which requires us to revise previously filed minimum MLR reports and issue incremental MLR rebate payments. We recognized the net premium impact of the risk corridor recoveries in the fourth quarter of 2020.plans. We will continue to review and evaluate the impact of the ACA as any further developments or judicial rulings occur.
In general, the Individual market risk pool that includes public exchange markets has become less healthy since its inception in 2014 and continues to exhibit risk volatility. Based on our experience in public exchange markets to date, we have made adjustments to our premium rates and participation footprint and continue to evaluate the performance of our public exchange plans. In addition, insurers have faced uncertainties related to federal government funding for various ACA programs. These factors may have a material adverse effect on our results of operations if premiums are not adequate or do not appropriately reflect the acuity of these individuals. Any variation from our expectations regarding acuity, enrollment levels, adverse selection, or other assumptions utilized in setting premium rates could have a material adverse effect on our results of operations, financial position, and cash flows.
Further, implementationCertain significant provisions of the ACA brings with it significant oversight responsibilities by health insurers that may result in increased governmental audits, increased assertions of False Claims Act violations, and an increased risk of other litigation.
Federal regulatory agencies continue to modify regulations and guidance related to the ACA and markets more broadly. Some of the more significant ACA rules are described below:include, among others:
•The creation of Public Exchanges for individuals and small group customers.
•The establishment of minimum MLR thresholds by line of business for the Commercial market as defined by HHS, are as follows:
| | | | | | | | |
Line of Business | | % |
Large Group | | 85 |
Small Group | | 80 |
Individual | | 80 |
New York state regulations require us(which may be subject to meet a more restrictive MLR threshold of 82% for both Small Group and Individual lines of business. The minimum MLR thresholds disclosed above are based on definitions of an MLR calculation provided by HHS, or specific states, as applicable, and differ from our calculation of “benefit expense ratio” based on premium revenue and benefit expense as reported in accordance with U.S. generally accepted accounting principles (“GAAP”). Furthermore, the definitions of the lines of business differ under the various federal and state regulations, and may not correspond to our lines of business. Definitions under the MLR regulation also impact insurers differently depending upon their organizational structure or tax status, which could resultsuch as those in a competitive advantage to some insurance providers that may not be available to us, resulting in an uneven playing field in the industry.
The ACA also imposed a separate minimum MLR threshold of 85% for Medicare Advantage and Medicare Part D prescription drug plans (“Medicare Part D plans”)New York). Medicare Advantage or Medicare Part D prescription drug plans that do not meet thisthe mandated threshold will have to pay a minimum MLR rebate. If a plan’srebate, will be subject to restricted enrollment if MLR is below 85%the threshold for three consecutive years, enrollment will be restricted. A Medicare Advantage or Medicare Part D planand are subject to contract will be terminatedtermination if the plan’s MLR is below 85%the threshold for five consecutive years.
In addition, state Medicaid programs are required to set managed care capitation rates such that a minimum 85% MLR is projected to be achieved; however, states are not required to collect remittances if the minimum MLR is not achieved.
Approximately 54.8%52.3% and 20.2%17.5% of our premium revenue and medical membership, respectively, were subject to the minimum MLR regulations as of and for the year ended December 31, 2020.2022. Approximately 58.9%53.6% and 20.8% 18.4%
of our premium revenue and medical membership, respectively, were subject to the minimum MLR regulations as of and for the year ended December 31, 2019.2021.
•The ACA createdcreation of an incentive payment program for Medicare Advantage plans. CMS developed the Medicare Advantage Star ratings system, which awards between 1.0 and 5.0 starsStars to Medicare Advantage plans based on performance in several categories, including quality of care and customer service. The Star ratings are used by CMS to award quality-based bonus payments to plans that receive a rating of 4.0 or higher. The methodology and measures included in the Star ratings system can be modified by CMS annually. As of December 31, 2020, allFor payment year 2023, we expect to have approximately 73% of our Medicare Advantage plans have received a rating of 3.0members in 4.0 or higher.
•Regulations require premium rate increases to be reviewed for Small Group and Individual products above specified thresholds, and may be adjusted from time to time. The regulations provide for state insurance regulators to conduct the reviews, except for cases where a state does not have an “effective” rate review program or in federal enforcement states, in which cases HHS will conduct the reviews for any rate increase.higher rated plans.
•The ACA precludes health insurers from using health status and gender in the determinationimplementation of the insurance premium.
•The ACA imposed an annual Health Insurance Provider Fee (“HIP Fee”) on health insurers that write certain types of health insurance on U.S. risks, which has been permanently eliminated effective January 1, 2021. The HIP Fee was allocated to health insurers based on the ratio of the amount of an insurer’s net premium revenues written during the preceding calendar year to the amount of health insurance premium for all U.S. health risk for those certain lines of business written during the preceding calendar year. The HIP Fee was non-deductible for federal income tax purposes. Our affected products were priced to cover the increased selling, general and administrative and income
tax expenses associated with the HIP Fee when it was in effect. The total amount due from allocations to health insurers was $15.5 billion for 2020 and was suspended for 2019.
•a Medicare Advantage payment formula, which prevents reimbursement rates will not increasefrom increasing as much as theyotherwise would otherwise duebe expected.
We continue to evaluate our experience in the payment formula promulgated byPublic Exchange markets. Based on the ACAviability of the Public Exchanges and availability of federal subsidies, we have made adjustments to our premium rates and geographic participation, including a modest expansion in the Public Exchange markets in 2022 and further expansion into a limited number of additional counties in 2023. Any variation from our expectations regarding acuity, enrollment levels, adverse selection, or other assumptions utilized in setting premium rates could have a material adverse effect on our results of operations, financial position, and cash flows, and may require further adjustments to our rates and participation going forward. As a result, for 2023 we are offering Individual Public Exchange products in 138 of the 143 rating regions in which we operate, in comparison to 122 of 143 rating regions in 2022.Our strategy has been, and will continue to be, to only participate in rating regions where we have an appropriate level of confidence that continues to impact reimbursements. We also expect further and ongoing regulatory guidancethese markets are on a number of issues relatedpath toward sustainability, including, but not limited to, Medicare, including evolving methodology for ratingsfactors such as expected financial performance, regulatory environment and quality bonus payments. CMS is also proposing changes to its program that audits data submitted under the risk adjustment programs in a way that would increase financial recoveries from plans.underlying market characteristics.
Drug Benefit and Pharmacy Benefit Manager Regulation
Pharmacy benefit managers are regulated at both the federal and state levels and must comply with federal and state statutes and regulations governing labeling, packaging, advertising and adulteration of prescription drugs, dispensing of controlled substances and licensing. In recent years the federal government has banned certain business practices, including “gag clauses,” which prohibited pharmacists from informing patients when a lower cost drug was available as a substitute, and “clawbacks,” which occurred when pharmacy benefit managers sought to recoup the difference between the reimbursed cost of the drug and the patient’s copay andwhen the drug itself was less expensive than the copay paid by the patient. Regulation in the states varies dramatically and ranges from licensure of PBMs as third-party administrators, licensure specifically as a pharmacy benefit manager, and licensure accompanied by additional disclosures and limitations of business practices to varying degrees. The NAIC is working onfinalized a PBM model law that, if adopted widely, could result in a more standardized approach to PBM regulation in the states in the future. However,Additionally, in December 2020, the U.S. Supreme Court let stand an Arkansas law regulating PBMs, which could be a precursor to greater state regulation of PBMs in the future. In June 2021, the NAIC announced a proposed white paper addressing PBMs and examining the impact of this Supreme Court case on its model law, which could result in expansion of the NAIC model law and additional regulatory oversight, which could materially affect current industry practices and our PBM business.
A number of proposals are being considered at the federal and state levels that would increase regulation of drug benefits and pharmacy benefit managers. Such proposals under consideration include (1) regulation of rebates from drug manufacturers that would require rebate dollars to be applied at the point-of-sale, (2) federal policy changes to set the prices for a subset of drugs covered under the Medicare program, (3) reforms to the Medicare drug benefit, such as beneficiary cost-sharing changes that aim to lower consumer costs, (4) attempts at both the federal and state levels to banprohibit the use of spread pricing contracts in both the Commercial and Medicaid markets, and (5) electronic prior authorizations of drugs. These reforms have the potential to have broad impacts on our PBM business and could materially adversely affect our business if they are enacted.
Privacy, Confidentiality and Data Standards Regulation
The federal Health Insurance Portability and Accountability Act of 1996 (“HIPAA”) and the administrative simplification provisions of HIPAA impose a number of requirements on covered entities (including insurers, HMOs, group health plans, providers and clearinghouses) and their business associates relating to the use, disclosure and safeguarding of
protected health information. These requirements include uniform standards of common electronic healthcare transactions; privacy and security regulations; and unique identifier rules for employers, health plans and providers.
Also, the Health Information Technology for Economic and Clinical Health (“HITECH”) Act provisions of the American Recovery and Reinvestment Act of 2009 and corresponding implementing regulations have imposed additional requirements on the use and disclosure of protected health information such as additional data breach notification and reporting requirements, contracting requirements for HIPAA business associate agreements, strengthened enforcement mechanisms and increased penalties for HIPAA violations. Federal consumer protection laws may also apply in some instances to privacy and security practices related to personally identifiable information.
The federal Gramm-Leach-Bliley Act generally places restrictions on the disclosure of non-public information to non-affiliated third parties, and requires financial institutions, including insurers, to provide customers with notice regarding how their non-public personal information is used, including an opportunity to “opt out” of certain disclosures. State departments of insurance and certain federal agencies adopted implementing regulations as required by federal law.
The Cybersecurity Information Sharing Act of 2015 encourages organizations to share cyber threat indicators with the federal government and, among other things, directed HHS to develop a set of voluntary cybersecurity best practices for organizations in the healthcare industry.
industry, which were issued in 2018.In addition, public exchangesPublic Exchanges are required to adhere to privacy and security standards with respect to personally identifiable information and to impose privacy and security standards that are at least as protective as those the public exchangePublic Exchange has implemented for itself on insurers offering plans through the public exchangesPublic Exchanges and their designated downstream entities, including pharmacy benefit managers and other business associates. These standards may differ from, and be more stringent than, HIPAA.
Furthermore, states have begun enacting more comprehensive privacy laws and regulations addressing consumer rights to data protection or transparency that may affect our privacy and security practices, such as state laws like the California Consumer Privacy Rights Act of 2020 that govern the use, disclosure and protection of member data and impose additional breach notification requirements. The NAIC is planning potential revisions to one or more of its privacy model acts, which could expand consumer privacy rights. State consumer protection laws may also apply to privacy and security practices related to personally identifiable information, including information related to consumers and care providers. Complying with conflicting cybersecurity regulations and varying enforcement philosophies, which may differ from state to state, requires significant resources and may materially and adversely affect our ability to standardize our products and services across state lines.
Federal regulations have been finalized in the following areas that will continue to materially impact our operations:
•Federal regulations on data interoperability that will require claims data to be made available to third parties unaffiliated with Anthem;us; and
•Federal regulations requiring hospitals and health insurers to publish negotiated prices for services.services, including the health plan price transparency regulations issued in October 2020 by the U.S. Departments of Health and Human Services, Labor and Treasury (the “Health Plan Transparency Rule”).
Federal regulations have also been proposed thatBeginning in July 2022, the Health Plan Transparency Rule required us to disclose, on a monthly basis, detailed pricing information regarding negotiated rates for all covered items and services between the plan or issuer and in-network providers and historical payments to, and billed charges from, out-of-network providers. Additionally, beginning in 2023, we are now required to make available to members personalized out-of-pocket cost information and the underlying negotiated rates for 500 covered healthcare items and services, including prescription drugs. In 2024, this requirement will expand the final regulation on data interoperability to require health insurers to build new application programming interfaces to afford patients access to their health informationall items and require electronic prior authorizations for commercial Qualified Health Plans in the federal exchange as well as Medicaid and CHIP fee-for-service and managed care organizations. These regulations are expected to materially impact our operations if finalized.services.
Employee Retirement Income Security Act of 1974
The provision of services to certain employee welfare benefit plans is subject to the Employee Retirement Income Security Act of 1974, as amended (“ERISA”), a complex set of laws and regulations subject to interpretation and enforcement by the Internal Revenue Service (“IRS”) and the Department of Labor. ERISA regulates certain aspects of the relationships between us, the employers that maintain employee welfare benefit plans subject to ERISA and participants in
such plans. Some of our administrative services and other activities may also be subject to regulation under ERISA. In addition, certain states require licensure or registration of companies providing third-party claims administration services for benefit plans. We provide a variety of products and services to employee welfare benefit plans that are covered by ERISA. Plans subject to ERISA can also be subject to state laws, and the question of whether and to what extent ERISA preempts a state law has been, and will continue to be, interpreted by many courts.
Guaranty Fund Assessments
Under insolvency or guaranty association laws in most states, insurance companies and HMOs can be assessed for amounts paid by guaranty funds for policyholder losses incurred when an insurance company or HMO becomes insolvent. Most state insolvency or guaranty association laws currently provide for assessments based upon the amount of premiums received on insurance underwritten within such state (with a minimum amount payable even if no premium is received). Under many of these guaranty association laws, assessments are made retrospectively. Some states permit insurers or HMOs to recover assessments paid through full or partial premium tax offsets or through future policyholder surcharges. The amount and timing of any future assessments cannot be predicted with certainty; however, future assessments are likely to occur.
International Regulation
We have various international subsidiaries, which provide back-office services, that are subject to different, and sometimes more stringent, legal and regulatory requirements that vary widely by jurisdiction. In addition, our non-U.S. operations are subject to U.S. laws regulating the conduct and activities of U.S.-based businesses operating abroad, including but not limited to, the Foreign Corrupt Practices Act and corresponding foreign laws governing anti-bribery, anti-corruption and anti-money laundering.
Human Capital
At Anthem, itThe foundation of our strategy starts with our culture, and our associates are critical to fulfilling our purpose of improving the health of humanity. As of December 31, 2020,2022, our employee population, including all full-time, part-time and temporary workers, consisted of approximately 102,300 individuals, 79,000 in the United States and 23,300 internationally. We have built a high-performance culture that we had approximately 83,400 associates. We are working to build a high performance culture thatbelieve enhances our ability to deliver on our commitments and guides us to address the challenges of today. We believe that our culture allows us to attract and retain talented and experienced individuals to support the communities we serve. Our
associates actively participate through associate engagement surveys and online feedback toolstools. We leverage and we leverage thesemonitor associate feedback tools and engagement surveys to monitor and take action on responses.
Inclusion & Diversity
The diversity of our associates is central to achieving key strategies and improving performance. We believestrive to maintain a diverse and inclusive workforce comprised of a vast array of backgrounds, life experiences and cultures, which we believe enables a deeper connection with our members, allowing us to better serve our members and communities, and drives greater business results. We honor the diversity of our associates—in gender, race/ethnicity, age, gender identity, sexual orientation, socio-economic status, language, nationality, abilities and life experiences. As of December 31, 2020,2022, our U.S. associate population was approximately 76%77% female and 48%51% racially and ethnically diverse, while 65% of our managers are female and 36% are racially or ethnically diverse.
Fair Pay
Elevance Health is committed to a fair pay workplace. We were in the first cohort of companies certified by the Fair Pay Workplace (“FPW”), an independent certification that takes a holistic approach to pay equity, partnering to design an annual pay equity action plan that includes a perpetual review of all positions, new hires and promotions to effect meaningful and measurable change. This independent certification is based on a set of publicly available rules and standards and the endorsed methodology of a group of leading experts from forward-thinking corporations, academia, human resources, data science and the legal field. After partnering with and overseeing our review process, FPW has validated our analysis of our associate population, which found that pay for females is within 1% of their male counterparts and pay for people of color is equal to their white counterparts, after taking into account neutral job related factors.
Talent Development
Growing and developing our talent internally is key to our succession plans and our ability to lead at our best every day. To inspire a high-performance culture and promote talent excellence, we offer individual, career and leadership development
opportunities, encouraging associates to continually learn and grow. We offer various instructor-led and virtual instructor-led programs and maintain a vast curriculum of relevant, on-demand learning and development resources.
Health & Wellbeing
We have the privilege of touching the lives of millions of people each day, and for us, this startsstarting with the health of our own associates. To improve the health and wellbeing of our associates, we offer a comprehensive compensation package, including competitive salaries, a 401(k) plan and medical, dental, vision and disability coverage. In addition, we offer our associates wellness and behavioral programs and tools to help them get and stay healthy and more easily manage their work and personal lives.
Information About Our Executive Officers
The following sets forth certain information regarding our executive officers and Chief Accounting Officer as of February 1, 2023.
| | | | | | | | | | | | | | |
| Name | | Age | | Position |
| Gail K. Boudreaux | | 62 | | President and Chief Executive Officer |
| John E. Gallina | | 63 | | Executive Vice President and Chief Financial Officer |
| Peter D. Haytaian | | 53 | | Executive Vice President and President, Carelon and CarelonRx |
| Charles M. Kendrick, Jr. | | 57 | | Executive Vice President and President, Commercial & Specialty Business Division |
| Gloria M. McCarthy | | 70 | | Executive Vice President and Chief Administrative Officer |
| Felicia F. Norwood | | 63 | | Executive Vice President and President, Government Business Division |
| Blair W. Todt | | 55 | | Executive Vice President and Chief Legal Officer |
| Ronald W. Penczek | | 58 | | Chief Accounting Officer and Controller |
Ms. Boudreaux has served as our President and Chief Executive Officer and a Director of the Company since November 2017. Prior to joining us, she served as Chief Executive Officer of GKB Global Health, LLC (healthcare consulting firm) from 2015 to November 2017. Prior thereto, Ms. Boudreaux was Executive Vice President of UnitedHealth Group Incorporated (diversified healthcare company) from 2008 to 2015, including roles as Chief Executive Officer of UnitedHealthCare (managed healthcare company), a subsidiary of UnitedHealth Group Incorporated from 2011 to 2014 and President of the Commercial Business of UnitedHealthCare from 2008 to 2011. Before joining United HealthCare, she worked at Health Care Service Corporation (“HCSC”) (health insurance company) as Executive Vice President of External Operations from 2005 to 2008 and President of Blue Cross and Blue Shield of Illinois from 2002 to 2005. Before joining HCSC, Ms. Boudreaux held various positions at Aetna, Inc. (“Aetna”) (managed healthcare company), including Senior Vice President, Group Insurance.
COVID-19 ResponseMr. Gallina has served as our Executive Vice President and Chief Financial Officer since 2016. Mr. Gallina joined Elevance Health in 1994 and has held a variety of leadership roles across the organization. Prior to his current role, Mr. Gallina served as Elevance Health’s Chief Financial Officer for the Commercial & Specialty Business Division from 2015 to 2016, and as Senior Vice President and Chief Accounting Officer from 2013 to 2015. Other leadership positions held during his tenure include Senior Vice President, Chief Accounting Officer and Chief Risk Officer from 2011 to 2013, while also holding the title of Controller from 2011 to 2013. Before joining the Company, Mr. Gallina spent 12 years with Coopers & Lybrand in various positions, including as an Audit Senior Manager.
We moved swiftlyMr. Haytaian has served as our Executive Vice President and President of Carelon (formerly known as our Diversified Business Group) and CarelonRx (formerly known as IngenioRx) since October 2021. Prior to his current role, Mr. Haytaian served as Executive Vice President and President of our Commercial & Specialty Business Division beginning in April 2018. From June 2014 until April 2018, Mr. Haytaian served as our Executive Vice President and President of the Government Business Division. Mr. Haytaian joined the Company in 2012 with our acquisition of Amerigroup Corporation (“Amerigroup”) and served as President of our Medicaid business from 2013 until 2014. From 2005 to 2013, Mr. Haytaian
held several leadership positions with Amerigroup, including serving as Chief Executive Officer of the North Region for Amerigroup’s Medicaid business from 2012 until 2013. Mr. Haytaian has extensive experience leading Medicare and Medicaid programs with Amerigroup and, prior thereto, with Oxford Health Plans, Inc.
Mr. Kendrick has served as Executive Vice President and President of our Commercial & Specialty Business Division since October 2021. From January 2021 until October 2021, Mr. Kendrick served as President of our Commercial Business West Markets (California, Colorado, Indiana, Kentucky, Missouri, Nevada, Ohio and Wisconsin). Mr. Kendrick joined us in 1995, and has held numerous leadership roles across the organization, including serving as President, Anthem National Accounts/Central Markets from 2015 until January 2021 and President of National Accounts and General Manager for Anthem Blue Cross and Blue Shield of Georgia from 2010 until 2015.
Ms. McCarthy has served as our Executive Vice President and Chief Administrative Officer since 2013. She was Executive Vice President of Enterprise Execution and Efficiency from 2012 to 2013. Prior to that appointment, she served as Senior Vice President for Operational Excellence from 2008 to 2012, as Senior Vice President of Service Operations from 2006 to 2008 and as Senior Vice President and Chief Operating Officer of our East Region from 2005 to 2006. Prior to our acquisition of WellChoice, Inc. (“WellChoice”) in 2005, Ms. McCarthy served as Executive Vice President and Chief Operating Officer of WellChoice.
Ms. Norwood has served as our Executive Vice President and President of the Government Business Division since June 2018. Prior to joining us, she was Director of The Department of Healthcare and Family Services for the State of Illinois from 2015 to June 2018. Prior to that appointment, Ms. Norwood held a variety of leadership roles at Aetna, with her most recent role as President of the Mid-America Region for Aetna from 2010 until 2013.
Mr. Todt has served as our Executive Vice President and Chief Legal Officer since November 2020 and our interim head of human resources and global security and safety team since January 2022. Prior to joining us, Mr. Todt served as Senior Vice President, Legal, Compliance & Business Performance and Chief Legal Officer of HCSC from 2016 to July 2020. Prior to joining HCSC, Mr. Todt held a variety of leadership roles at WellCare Health Plans, Inc. (health insurance company), with his most recent role as Senior Vice President, Chief Legal and Administrative Officer and Secretary from 2010 until 2016.
Mr. Penczek has served as our Controller since November 2015 and as our Chief Accounting Officer since December 2015. He served as our Vice President and Controller from 2013 to 2015. Prior to that appointment, Mr. Penczek served as Vice President and Assistant Controller from 2008 to 2013 and in various other roles in our responsefinance department from 2006 until 2008. Before joining us in 2005, Mr. Penczek was a Staff Vice President with CNA Insurance from 2000 to the COVID-19 pandemic2005 and had various positions with PricewaterhouseCoopers LLP from 1992 to promote the safety of our associates and best serve our members and communities. In March of 2020, we implemented business continuity plans, transitioning the majority of our associates to remote work environments, while maintaining service operations. We have provided our associates with additional benefits, support and resources to help them manage the complexities of working from home and handling caregiver and family needs. In addition to their current benefits, we are providing up to 80 hours of COVID-related additional paid time off for associates to use when they are unable to work due to quarantine or illness or to provide care to a family member, and we provided a one-month premium holiday and added an extra paid day off2000, including as a “Wellness Holiday” on December 31, 2020. In addition to our associate assistance program, we provide materials and behavioral health resources to our associates that address important emotional health issues.
Available Information
We are a large accelerated filer (as defined in Rule 12b-2 of the Securities Exchange Act of 1934, as amended (the “Exchange Act”)) and are required, pursuant to Item 101 of Regulation S-K, to provide certain information regarding our website and the availability of certain documents filed with or furnished to the U.S. Securities and Exchange Commission (“SEC”). The SEC maintains a website that contains reports, proxy and information statements and other information regarding issuers at www.sec.gov. Our website is www.antheminc.comwww.elevancehealth.com. We have included our website address throughout this Annual Report on Form 10-K as a textual reference only. The information contained on, or accessible through, our website is not incorporated into this Annual Report on Form 10-K. We make available through our website, free of charge, by mail or through our website, our Annual Report on Form 10-K, Quarterly Reports on Form 10-Q, Current Reports on Form 8-K, and amendments to those reports filed or furnished pursuant to Section 13(a) or 15(d) of the Exchange Act as soon as reasonably practicable after we electronically file such material with or furnish it to the SEC. We also include on our website our Corporate Governance Guidelines, our Code of Conduct and the charter of each standing committee of our Board of Directors. In addition, we intend to disclose on our website any amendments to, or waivers from, our Code of Conduct that are required to be publicly disclosed pursuant to rules of the SEC and the New York Stock Exchange (“NYSE”). Anthem,Elevance Health, Inc. is an Indiana corporation incorporated on July 17, 2001.
ITEM 1A. RISK FACTORS.
In evaluating our business, the risks described below, as well as the other information contained in this Annual Report on Form 10-K, should be carefully considered. Any one or more of such risks could materially and adversely affect our business, financial condition, results of operations and stock price and could cause our actual results of operations and financial condition to vary materially from past or anticipated future results of operations and financial condition. Additional risks and uncertainties not presently known to us or that we currently believe to be immaterial may also adversely affect us.
BUSINESS RISKS
The outbreak of the COVID-19 pandemic and measures taken to prevent its spread are adversely affecting our business in a number of ways, and we are unable to predict the full extent of those impacts on our business, cash flows, financial condition and results of operations, but the impact could be material.
The COVID-19 pandemic is evolving, and the impact of COVID-19, and the actions taken to contain its spread or address its impact, could have a material adverse effect on our operations and financial results in the future. We continue to closely monitor developments related to the COVID-19 pandemic to assess its ongoing impact on our business. The extent of this impact will depend on future developments, which are highly uncertain and cannot be predicted at this time, including, but not limited to, the transmission rate, duration and spread of the outbreak, its severity, the extent and effectiveness of the actions taken to contain the spread of the virus and address its impacts, and how quickly and to what extent normal economic and operating conditions can resume. Factors that could negatively impact our ability to operate successfully during or following the COVID-19 pandemic, or that could otherwise significantly adversely impact and disrupt our business, cash flows, financial condition and results of operations include, but are not limited to, the following:
•Continued increases in healthcare costs due to higher utilization rates of medical facilities and services, medical expenses and other increases in associated hospital and pharmaceutical costs. We continue to offer our members expanded benefit coverage, such as providing full coverage for COVID-19 testing and treatment and governmental action has required, and may continue to require, us to provide additional coverage.
•Decreased predictability of Medicare and Medicaid rates due to changes in utilization of medical facilities and services, medical expenses, and other costs as a result of the impact of COVID-19. We experienced rate adjustments from certain state Medicaid regulators in 2020 in response to decreased utilization of medical facilities and services, and we may experience further adjustments in the future with regard to current and prior year rates.
•Increased estimation uncertainty on our claims liability due to the impact of COVID-19 on healthcare utilization and medical claims submission.
•A reduction in enrollment in our health benefits and PBM products and services, or a continued change in membership mix to less profitable lines of business, as a result of reductions in workforce by existing customers and other impacts of an economic downturn.
•Cash flow volatility or shortfalls caused by an increase in delayed, delinquent or non-collectable payments from customers and government payers.
•Reductions in our operating effectiveness as our employees work from home or otherwise are impacted by COVID-19. The majority of our workforce continues to work remotely in an effort to mitigate the spread of COVID-19, which may exacerbate certain risks to our business, including an increased demand for information technology resources, increased risk of phishing and other cybersecurity attacks, and increased risk of unauthorized dissemination of sensitive personal information or proprietary or confidential information about us, our members or other third parties.
•Disruptions in our normal business operations due to disruptions in public and private infrastructure, including communications, financial services and supply chains.
•Loss of functionality due to the disruption of services provided to us by third-party vendors, including as a result of financial difficulties experienced by such vendors and the impact of vendor employees working from home or otherwise being impacted by COVID-19.
•A decrease in the value of our investments, which may result in losses charged to income.
•Increased cost of capital and limited ability to access the capital markets due to disruption and volatility in global financial markets or a downgrade in our credit rating.
If we fail to appropriately predict, price for and manage healthcare costs, the profitability of our products and services could decline, which could materially adversely affect our business, cash flows, financial condition and results of operations.
Our profitability depends in large part on accurately predicting and pricing healthcare costs and on our ability to manage future healthcare costs through medical management, product design, negotiation of favorable provider contracts and underwriting criteria. Total healthcare costs are affected by the type, number and cost of individual services rendered, the cost of each service and the type of service rendered. Numerous factors affecting the cost of healthcare costs may adversely affect our ability to predict and manage healthcare costs, as well asand may impact our business, cash flows, financial condition and results of operations. These factors include, among others, changes in healthcare practices, demographic characteristics including the aging population, medical cost inflation, the introductionincreased labor costs, evolution of new technologies, drugs and treatments, increased cost of individual services, increases in theincreased number and cost and number of prescription drugs, clusters of high cost cases, increased use of services, including due to natural catastrophes or otherresulting from pandemics, large-scale medical emergencies, epidemics or pandemics such as COVID-19, new treatment guidelines,increasing natural disasters in connection with climate change and other public health crises, new mandated benefits (such as the expansion of essential benefits coverage)and treatment guidelines and changes to other regulations impacting our business, such as the health plan price transparency regulations issued in October 2020 by the U.S. Departments of Health and Human Services, Labor and Treasury (the “Health Plan Transparency Rule”) and the Appropriations Act.business.
Relatively smallSlight differences between predicted and actual medical costs or utilization rates as a percentage of premium revenues can result in significant changes in our results of operations. Generally, our premiums on Commercial policies and Medicaid contracts are fixed for a 12-month period and are determined based on data from several months prior to the commencement of the premium period. Our revenue onfrom Medicare policies is based on bids submitted to CMS six months prior to the start of the contract year. CMS has explicit gain and loss margin requirements within the bids, as well as contract-specific federal MLR annual requirements. Accordingly, the costs we incur in excess of our benefit cost projections generally are notcannot be recovered in the contract year through higher premiums. Existing Medicaid contract rates are often established by the applicable state, and our actual costs may exceed those rates. Although we base our Commercial premiums, our Medicare and Medicaid bids, and our acceptance of state-established Medicaid rates on our estimates of future medical costs over the fixed contract period, manyMany factors, including those discussed above, may cause actual costs to exceed those estimated and reflected in our Commercial premiums and Medicare and Medicaid bids.
Although federal and state premium and risk adjustment mechanisms could help offset healthcarehealth benefit costs in excess ofabove our projections if ourthe assumptions utilized in settingwe use to set our premium rates are significantly different than actual results, our results of operations and financial condition could still be adversely affected. The reserves that we establish for health insurance policy benefits and other contractual rights and benefits are based uponon assumptions concerning a number of factors, including trends in healthcare costs, expenses, general economic conditions and other factors. To the extent the actual claims experience is unfavorable as compared to our underlying assumptions, our incurred losses would increase and future earnings could be adversely affected.
In addition to the challenge of managing healthcare costs, we face pressure to contain premium rates. Our customers may renegotiate their contracts to seek to contain their costs or may move to a competitor to obtain more favorable premiums. Further, federal and state regulatory agencies may restrict or prevent entirely our ability to implement changes in premium rates. A limitation on our ability to increase or maintain our premium or reimbursement levels or a significant loss of membership resulting from our need to increase or maintain premium or reimbursement levels could adversely affect our business, cash flows, financial condition and results of operations.
We continue to evaluate our experience in the Public Exchange markets. Based on the viability of the Public Exchanges and availability of federal subsidies, we have made adjustments to our premium rates and geographic participation, including a modest expansion in the Public Exchange markets in 2022, and further expansion in a limited number of additional counties in 2023. Any variation from our expectations regarding acuity, enrollment levels, adverse selection, or other assumptions utilized in setting premium rates could have a material adverse effect on our results of operations, financial position, and cash flows, and may require further adjustments to our rates and participation in Public Exchanges going forward.
A significant reduction in the enrollment in our health benefits programs or PBM products or services, particularly in states where we have large regional concentrations, could have an adverse effect on our business, cash flows, financial condition and results of operations.
A significant reduction in the number of enrollees in our health benefits programs or PBM products or services could adversely affect our business, cash flows, financial condition and results of operations. Factors that could contribute to a reduction in enrollment include: reductions in workforce by existing customers; the end of the temporary suspension of eligibility recertification for Medicaid recipients in response to the COVID-19 pandemic, which will likely result in a reduction in our Medicaid membership; a general economic upturn that results in fewer individuals being eligible for Medicaid programs; a general economic downturn that results in business failures and high unemployment rates, as has been experienced as a result of the COVID-19 pandemic;rates; employers no longer offering certain healthcare coverage as an employee benefit or electing to offer coverage on a voluntary, employee-funded basis; participation on public exchanges;Public Exchanges; federal and state regulatory changes; failure to obtain new customers or retain existing
customers; premium increases and benefit changes; our exit from a specific market; negative publicity and news coverage; and failure to attain or maintain nationally recognized accreditations.
The states in which we operate that havewith the largest concentrations of revenues include California, Florida, Georgia, Indiana,Virginia, Ohio, New York, Ohio,Indiana, Texas, Florida and Virginia.Georgia. Due to this concentration of business in these states, we are exposed to potential losses resulting from the risk of state-specific or regional economic downturns impacting these states. If any such negative economic conditions do not improve, we may experience a reduction in existing and new business, which could have a material adverse effect on our business, cash flows, financial condition and results of operations.
A cyber attackcyber-attack or other privacy or data security incident could result in an unauthorized disclosure of sensitive or confidential information, cause a loss of data, disrupt a large amount of our operations, give rise to remediation or other expenses, expose us to liability under federal, state and stateinternational laws, and subject us to litigation and investigations, which could have an adverse effect on our business, cash flows, financial condition and results of operations.
As part of our normal operations, we collect, store, process, retain and retainanalyze certain sensitive and confidential information.information, including protected personal information subject to privacy, security and data breach notification requirements. Some of the data we process, store and transmit is outside of the U.S. due to the structure of our information technology systems and our internal business operations. We are subject to a variety of continuously evolving federal, state and international laws and rules regarding the use and disclosure of certain sensitive or confidential information, including HIPAA,that depending on the specific business and intended data use, include without limitation, HIPAA's privacy and security rules, HIPAA's HITECH Act,rule, the Gramm-Leach-Bliley Act, GDPR and numerous state laws governing personal information.information, including the California Consumer Privacy Act, as amended by the California Privacy Rights Act effective on January 1, 2023. Our facilities and systems, and those of our third-party service providers, are regularly the target of, and may be vulnerable to, cyber attacks,cyber-attacks, security breaches, acts of vandalism, computer viruses, misplaced or lost data, programming and/or human errors, negligent or wrongful conduct by employees or others with permitted access to our systems and information, or other threats.
We have been, and may in the future be subject to litigation and governmental investigations related to cyber attacks and security breaches, which could divert the attention of management from the operation of our business, result in reputational damage and have a material adverse impact on our business, cash flows, financial condition and results of operations. While we have contingency plans and insurance coverage for potential liabilities of this nature, they may not be sufficient to cover all claims and liabilities.
We cannot ensure that we will be able to identify, prevent or contain the effects of cyber attackscyber-attacks or other cybersecurity risks that bypass our security measures or disrupt our information technology systems or business. We have security technologies, processes and procedures in place to protect against cybersecurity risks and security breaches. However, hardware,Hardware, software or applications we develop or procure from third parties may contain defects in design, manufacturer defects or other problems that could unexpectedly compromise information security. In addition, because the techniques used to obtain unauthorized access, disable, disrupt or degrade service or sabotage systems change frequently, are becoming increasingly sophisticated, and may not immediately produce signs of intrusion, we may be unable to anticipate these techniques, timely discover or counter them or implement adequate preventative measures. Viruses, worms or other malicious software programs may be used to attack our systems or otherwise exploit any security vulnerabilities and such security attackswhich may cause system disruptions or shutdowns, or may cause personal, information or proprietary or confidential information to be disclosed, misappropriated or compromised. As a result, cybersecuritycyber-security and the continued development and enhancement of our controls, processes and practices designed to protect our systems, computers, software, data and networks from attack, damage and unauthorized access remain a priority for us.
We have been, and may in the future be, subject to litigation and governmental investigations related to cyber-attacks and security breaches. Any such future litigation or governmental investigation could divert the attention of management from the operation of our business, result in reputational damage and have a material adverse impact on our business, cash
flows, financial condition, and results of operations. Moreover, our programs to detect, contain, and respond to data security incidents as well as contingency plans and insurance coverage for potential liabilities of this nature may not be sufficient to cover all claims and liabilities.
Noncompliance with any privacy, security or securitydata protection laws and regulations, or any security breach, cyber attackcyber-attack or cybersecuritycyber-security breach, and any incident involving the misappropriation, theft, loss or other unauthorized disclosure or use of, or access to, sensitive or confidential information, whether by us or by one of our third-party service providers, could require us to expend significant resources to continue to modify or enhance our protective measures and to remediate any damage. In addition, this could negatively affect our operations, cause system disruptions, damage our reputation, cause membership losses and contract breaches, and could also result in regulatory enforcement actions, material fines and penalties, litigation or other actions that could have a material adverse effect on our business, cash flows, financial condition and results of operations.
We are subject to risks associated with pandemics, like the COVID-19 pandemic, as well as other extreme events, large-scale medical emergencies and public health crises, which could have a material adverse effect on our business, results of operations, and financial condition and financial performance.
The COVID-19 pandemic continues to impact our business, providers, customers and communities. A new pandemic or other large-scale medical emergency or public health crisis, referred to collectively as “public health crises,” may cause illness, death, quarantines, business and school shutdowns, reductions in business activity, travel and financial transactions, unemployment, inflation, labor shortages, supply chain interruptions and overall economic and financial market instability. The following are some of the risks that we experienced, and are likely to continue experiencing, as a result of the COVID-19 pandemic and that we could experience as a result of future public health crises, all of which could have a material adverse effect on our business, cash flows, financial condition and results of operations:
•Increased healthcare costs due to higher utilization rates of medical facilities and services and behavioral health services, increased labor costs resulting from labor shortages and increases in medical expenses and associated hospital and pharmaceutical costs, including testing, treatment and the administration of vaccines and other therapeutics and costs due to care deferred during the public health crisis, which may lead to additional care resulting from missed treatments.
•Increased estimation uncertainty on our claims liability, as well as decreased predictability of Medicare and Medicaid rates due to changes in utilization of medical facilities and services, medical expenses and other costs. We experienced rate adjustments from certain Medicaid regulators in 2022 in response to decreased utilization.
•A reduction in enrollment in our health benefits, products and services or a change in membership mix to less profitable lines of business by existing customers due to reductions in workforce and other impacts of an economic downturn.
•Cash flow volatility or shortfalls caused by delayed, delinquent or non-collectable payments.
If the COVID-19 pandemic continues for a prolonged period, or if any future public health crisis occurs and continues for a prolonged period, these risks could be exacerbated, and cause further impact to our business and operations.
Additionally, other extreme events such as natural disasters, war, terrorism and civil unrest could create public health crises or otherwise have a material adverse effect on our business, cash flows, financial condition and results of operations. Natural disasters, such as wildfires, hurricanes and snow and ice storms, have impacted and may in the future impact our customers, employees, facilities and third-party vendors located in the affected area. In the event of a public health crises, we may need to make temporary policy changes, such as waiving various medical requirements, assisting with replacement medications, transferring prescriptions and expanding our help line. Furthermore, climate change could result in certain types of natural disasters occurring more frequently or with more intense effects, which could have a long-term impact on general economic conditions and the healthcare and pharmacy industry in particular.
There are various risks associated with participating in MedicaidMedicare and MedicareMedicaid programs, including dependence upon government funding and the timing of payments, compliance with government contracts and increased regulatory oversight.
We contract with various federal and state agencies, including CMS, to provide managed healthcare services, such as Medicare Advantage, Medicare Part D, Medicare Supplement, Medicaid, TANF, SPD, LTSS, CHIP, ACA-related Medicaid expansion programs and various specialty programs.programs, products and services. We also provide various administrative services for several other entities
offering medical and/or prescription drug plans to their Medicaid or Medicare eligible members, through our affiliated companies, and we offer
employer group waiver plans which provide medical and/or prescription drug coverage to retirees. We are also participatingparticipate in programs in several states for the care of dual-eligible members. Regulatory reform initiatives or changes in existing laws or regulations applicable to these programs, or their interpretations, are difficult to predict and could have a material adverse effect on our business, cash flows, financial condition and results of operations.
Revenues from the Medicare and Medicaid programs are dependent, in whole or in part, upon annual funding from the federal government and/or applicable state governments, and base premium rates paid by each state or federal agency differ depending upon a combination of factors such as defined upper payment limits, a member’s health status, age, gender, county or region, benefit mix, member eligibility category and risk scores. Future rates may be affected by continued government efforts to contain costs as well asand federal and state budgetary constraints, and certainconstraints. Certain state contracts are subject to cancellation in the event of the unavailability of state funds. Additionally, ongoing CMS system changes related to the data it uses to calculate risk scores in the Medicare Advantage program may impact our federal funding. If theThe federal government or any state in which we operate were tocould decrease rates paid to us, pay us less than the amount necessary to keep pace with our cost trends, cancel our contracts retroactively or seek an adjustment to previously negotiated rates, it could have a material adverse effect on our business, cash flows, financial condition and results of operations.rates. In addition, various states’ MMPsMedicare-Medicaid plans are still subject to uncertainty surrounding payment rates and other requirements, which could affect where we seek to participate in these programs. An unexpected reduction in payments, inadequate government funding or significantly delayed payments for these programs may adversely affect our business, cash flows, financial condition and results of operations.
Other potential risks associated with Medicare Advantage and Medicare Part D plans include increased medical or pharmaceutical costs, data corrections identified as a result of ongoing auditing and monitoring activities, potential uncollectability of receivables resulting from processing and/or verifying enrollment, inadequacy of underwriting assumptions, inability to receive and process correct information (including inability due to systems issues by the federal government, the applicable state government or us), uncollectability of premiums from members and limited enrollment periods. Actual results may be materially different than our assumptions and estimates and could have a material adverse effect on our business, financial condition and results of operations. Finally, there is the possibility that the Medicare Advantage program could be significantly impacted by any future modification, repeal or replacement of the ACA.
Our contracts with CMS and state governmental agencies contain certain provisions regarding data submission, risk adjustment, provider network and directory maintenance, quality measures, claims payment, timely and accurate processing of appeals and grievances, oversight of service providers, encounter data, continuity of care, call center performance and other requirements specific to federal and state program regulations. We have been subject in the past, and may again be in the future, to administrative actions, fines, penalties, liquidated damages or retrospective adjustments in payments made to our health plans as a result of a failure to comply with those requirements, which has impacted and in the future could impact our profitability. Due to decreased utilization of medical facilities and services as a result of the COVID-19 pandemic, we experienced retroactive rate adjustments by certain state Medicaid agencies, and rate adjustments may continue in the future. As members have accessed care during the COVID-19 pandemic, we have experienced increased difficulty obtaining provider information required by CMS and state governmental agencies and, as a result, may have difficulty meeting these quality measures. In addition, we could be required to file a corrective plan of action with additional penalties for noncompliance, which could have a negative impact on future membership enrollment levels. Further, our existing CMS or state Medicaid contracts have not always been renewed, we have not always been awarded new contracts as a result of the competitive procurement process, and in some cases we have lost members under existing contracts as a result of a post-award challenge by unsuccessful bidders, each of which could take place again in the future and have a material adverse effect on our business, cash flows, financial condition and results of operations.
Further, the Star Rating System utilized by CMS to evaluate Medicare Advantage Plans may have a significant effect on our revenue, as higher-rated plans tend to experience increased enrollment and plans with a Star rating of 4.0 or higher are eligible for quality-based bonus payments and plans with a Star rating of 5.0 can market to and enroll members year-round. If we do not maintain or continue to improve our Star ratings, fail to meet or exceed our competitors’ Star ratings, or if quality-based bonus payments are reduced or eliminated, we may experience a negative impact on our revenues and the benefits that our plans can offer, which could materially and adversely affect the marketability of our plans, our membership levels, results of operations, financial condition and cash flows. Similarly, if we fail to meet or exceed any performance standards imposed by state Medicaid programs in which we participate, we may not receive performance-based bonus payments or may incur penalties.
In addition, our failure to comply with federal and state healthcare laws and regulations applicable to our participation in Medicaid and Medicare programs, including those directed at preventing fraud, abuse and discrimination, in government-funded programs, could result in investigations, litigation, fines, restrictions on, or exclusions from, program participation, or the imposition of corporate
integrity agreements or other agreements with a federal or state governmental agency, any of which could adversely impact our business, cash flows, financial condition and results of operations.
We are periodically subject to government audits, including CMS Risk Adjustment Data Validation (“RADV”)RADV audits of our Medicare Advantage Plans to validate diagnostic data, patient claims and financial reporting, and audits of our Medicare Part D plans by the Medicare Part D Recovery Audit Contractor (“RAC”), as well as state Medicaid RAC programs authorized by the ACA.programs. These audits could result in significant adjustments in payments made to our health plans, which could adversely affect our financial condition and results of operations. If we fail to report and correct errors discovered through our own auditing procedures or during a RADV or RAC audit, or otherwise fail to comply with applicable laws and regulations, we could be subject to fines, civil penalties or other sanctions, which could have a material adverse effect on our ability to participate in these programs, and on our financial condition, cash flows and results of operations.
Our Medicare and Medicaid contracts are also subject to various MLR rules, including minimum MLR thresholds, rebate requirements and audits, which could adversely affect our membership and revenues if any of our state Medicare or Medicaid plans do not meet an applicable minimum MLR threshold. If a Medicare Advantage, MMP or Medicare Part D contract pays minimum MLR rebates for three consecutive years, it will become ineligible to participate in open enrollment.enroll new members. If a Medicare Advantage or Medicare Part D contract pays such rebates for five consecutive years, it will be terminated by CMS.
A change in our healthcare product mix may impact our profitability.
Our healthcare products that involve greater potential risk generally tend to be more profitable than administrative services products and those healthcare products where the employer groups assume the underwriting risks. Individuals and small employer groups are more likely to purchase our higher-risk healthcare products because such purchasers are generally unable or unwilling to bear greater liability for healthcare expenditures. Typically, government-sponsored programs also involve our higher-risk healthcare products. A shift of enrollees from more profitable products to less profitable products could have a material adverse effect on our cash flows, financial condition and results of operations.
If we fail to develop and maintain satisfactory relationships with hospitals, physicians, PBM service providers and other healthcare providers, our business, cash flows, financial condition and results of operations may be adversely affected.
Our profitability is dependent in part upon our ability to contract on favorable terms with hospitals, physicians, PBM service providers and supply chain partners and other healthcare providers. Physicians, hospitals and other healthcare providersThese partners may elect not to contract with us, and the failure to secure or maintain cost-effective healthcare provider contracts on competitive terms may result in a loss of membership or higher medical costs, which could adversely affect our business. In addition, consolidation among healthcare providers, ACOAccountable Care Organization practice management companies, and other organizational structures that physicians, hospitals and other care providers choose, as well as the ability of larger employers to contract directly with providers, may change the way that these providers interact with us and may change the competitive landscape. Such organizations or groups of physicians may compete directly with us, which may impact our relationship with these providers or affect the way that we price our products and estimate our costs andcosts. Such competition may require us to incur costs to change our operations, which could adversely affect our business, cash flows, financial condition, and results of operations. In addition, price transparency initiatives, such as the Health Plan Transparency Rule, may impact our ability to obtain or maintain favorable contract terms. For example, beginning in 2021, hospitals will bewere required to publish online payer-specific negotiated charges for each item or servicesservice the hospital provides.
Our inability to contract with providers, or if providers attempt to use their market position to negotiate more favorable contracts or place us at a competitive disadvantage, or the inability of providers to provide adequate care, could adversely affect our business. In addition, we do not have contracts with all providers that render services to our members and, as a result, may not have a pre-established agreement about the amount of compensation those out-of-network providers will accept for the services they render,render. State and federal laws, such as the No Surprises Act, define the compensation that must be paid to out-of-network providers in certain scenarios, and related litigation has lessened the weight of the Qualifying Payment Amount during independent dispute resolution processes, which canmay result in an increase in rates we must pay to out-of-network providers. Both our lack of contracts with certain providers and the development of new federal and state laws could result in significant litigation or arbitration proceedings, or provider attempts to obtain payment from our members for the difference between the amount we have paid and the amount they have charged.charged, or other increases in rates paid to out-of-network providers.
We are dependent on the success of our relationships with third parties for various services and functions.
We contract with various third parties to perform certain functions and services and provide us with certain information technology systems. Certain of these third parties provide us with significant portions of our business infrastructure and operating requirements. For example, a single vendor providescan provide to us with a wide range of technology infrastructure services, includingsuch as end user (help desk and field support), data center, mainframe, storage and database services cloud infrastructure and multi-cloud management services, and we are subject to the risks of any operational failure, termination or other restraints in thissuch an arrangement. We could become overly dependent on key vendors, which could cause us to lose core competencies. A termination of our agreements with, or disruption in the performance of, one or more of these service providers could result in service disruptions or unavailability, reduced service quality and effectiveness, increased or duplicative costs or an inability to meet our obligations to our customers. In addition, we may also have to seek alternative service providers, which may be unavailable or only available on less favorable contract terms. Any of these outcomes could adversely affect our business, reputation, cash flows, financial condition and operating results.
Our PBM services business in particular would be adversely affected if we are unable to contract on favorable terms with third-party vendors, including pharmaceutical manufacturers. We delegate certain PBM administrative functions, such as claims processing and prescription fulfillment, to CVS Health pursuant to the CVS PBM Agreement. If CVS Health fails to provide PBM services as contractually required, we may not be able to meet the full demands of our customers, which could have a material adverse effect on our business, reputation and results of operations. For additional information on the CVS PBM Agreement, see “Business — Product and Service Descriptions,” in Part I, Item 1 of this Annual Report on Form 10-K.
The failure to effectively maintain and upgrade our information systems, or the availability and integrity of our data, could adversely affect our business.
Our business depends significantly on effective information systems, and we have many different information systems for our various businesses, including those that we have acquired as a result of our merger and acquisition activities. Our information systems require an ongoing investment, commitment of significant resources to maintain and enhance existing systems, and developdevelopment of new systems in order to keep pace with continuing changes in information processing technology, emerging cybersecuritycyber-security risks, and threats, changing customer preferences, evolving industry and regulatory standards and legal requirements, including as a result of the ACA, the Health Plan Transparency Rule, the 2021 Appropriations Act and proposed federal data interoperability regulations. In addition, we may from time to time obtain significant portions of our systems-related or other services or facilities from independent third parties, which may make our operations vulnerable if such third parties fail to perform adequately.
Failure to adequately implement, consolidate, integrate, streamline, maintain and maintainupgrade effective and efficient information systems with sufficiently advanced technological capabilities or our failure to efficiently and effectively consolidate our information systems to eliminate redundant or obsolete applications, could result in investigations, audits, fines and penalties, competitive and cost disadvantages to us compared to our competitors, and a diversion ofcould divert management’s time, and could have a material adverse effect on our business, financial condition and results of operations. Failure or disruption of our performance of, or our ability to perform, key business functions, including as a result of the unavailability or cyber-attack of our information technology systems or those of third parties (including cloud service providers), could decrease response times, lower levels of service satisfaction and harm our reputation. Our systems interface with and depend on third-party systems and we could experience service denials if demand for such service exceeds capacity or these systems fail or experience interruption. Despite our adoption and continued enhancement of business continuity and disaster recovery strategies, there is no guarantee that such efforts will be effective, which could interrupt the functionality of our information technology systems or those of third parties. Our failure to implement adequate business continuity and disaster recovery strategies could significantly reduce our ability to provide products and services to our customers and clients, which could have a material adverse effect on our business and results of operations.
The volume of health care data generated and the uses of this data, including electronic health records, are rapidly expanding. Our ability to develop, implement, price, support new and existing products and services, provide service to our customers in an efficient and uninterrupted fashion, and report on our operations depends on the integrity of this data and our information systems. In addition, connectivity amongst technologies is becoming increasingly important, with recent trends bringing greater consumer engagement in healthcare; therefore, the pace at which our customers will need enhanced technologies with sophisticated applications for mobile interfaces will continue to expand. If the information systems we rely upon to run our business were found to be inaccurate or unreliable or if we fail to adequately maintain our information systems, security controls and data integrity effectively, we could experience problems in determining medical cost estimates
and establishing appropriate pricing and reserves, have disputes with customers and providers, face regulatory problems, including sanctions and penalties, incur increases in operating expenses or suffer other adverse consequences, including a decrease in membership.
Large-scale medical emergencies may have a material adverse effect on our business, cash flows, financial condition and results of operations.
Natural disasters, war, terrorism, political events, global climate change and other similar occurrences could create large-scale medical emergencies or otherwise have a material adverse effect on our business, cash flows, financial condition and results of operations. Large-scale medical emergencies can take many forms and can cause widespread illness and death and have other far-reaching impact. For example, the ongoing COVID-19 global pandemic has caused illness, deaths, quarantines, business and school shutdowns, reductions in business activity, travel and financial transactions, unemployment, labor shortages, supply chain interruptions and overall economic and financial market instability. In addition, federal and state law enforcement officials have issued warnings about potential terrorist activity involving biological and other weapons, and natural disasters such as hurricanes and the potential for a widespread pandemic of influenza or other illness coupled with the lack of availability of appropriate preventative medicines could have a significant impact on the health of the population
of widespread areas. If the United States were to experience widespread bioterrorism or other attacks, large-scale natural disasters in our concentrated coverage areas or an epidemic or pandemic such as the ongoing COVID-19 pandemic, our covered medical expenses could rise, our operations could be interrupted and we could experience a material adverse effect on our business, cash flows, financial condition and results of operations or, in the event of extreme circumstances, our viability could be threatened. Furthermore, global climate change could result in certain types of natural disasters occurring more frequently or with more intense effects, and may have a long-term effect on general economic conditions and the healthcare or pharmacy industry in particular, which could adversely affect our business and financial results. For additional information, see the risk factor above describing the impact of the COVID-19 pandemic on our business, cash flows, financial condition and results of operations.
LEGAL, REGULATORY AND PUBLIC POLICY RISKS
We are subject to significant government regulation, and changes or proposed changes in the regulation of our business by federal and state regulators may adversely affect our business, cash flows, financial condition and results of operations and the market price of our securities.
We are subject to significant state and federal regulation associated with many aspects of our business, including, but not limited to, licensing, premiums, marketing activities, provider contracting, access and payment standards, and corporate governance and financial reporting matters, as described in greater detail in Part I, Item 1, “Business—Regulation” in this Annual Report on Form 10-K. Further, the integration into our business of entities that we acquire, or the expansion of our business into new areas,businesses or jurisdictions, may affect the way in which existing laws and rules apply to us, including by subjecting us to laws and rules that did not previously apply to us.
Changes into existing laws, rules and regulatoryregulations or judicial interpretation, application or futureenforcement thereof, or development of new laws, rules, regulatory interpretations or judgments could force us to change how we conduct our business, affect the products and services we offer (and where we offer them), restrict revenue and enrollment growth, increase our costs, including operating, healthcare technology and administrative costs, restrict our ability to obtain new product approvals and implement changes in premium rates, and require enhancements to our compliance infrastructure and internal controls environment, which could adversely impact our business and results of operations. In addition, legislative and/or regulatory policies or proposals that seek to manage the healthcare industry or otherwise impact our business may cause the market price of our securities to decrease, even if such policies or proposals never become effective. In particular, further regulations and modifications to the ACA and federal and state laws and regulations stemming from the ACA could impact the market for our products, federal government funding for various ACA programs, the regulations applicable to us and the fees and taxes payable by us and otherwise affect our business and future operations, some of which may adversely affect our financial condition and results of operations.
We are required to obtain and maintain insurance and other regulatory approvals to market certain of our products and services, to increase prices for certain regulated products and services and to consummate some of our acquisitions and dispositions. Delays in obtaining or failure to obtain or maintain these approvals, as well as future regulatory action by state or federal authorities, could have a material adverse effect on the profitability or marketability of our health benefits or managed care products or on our business, financial condition, and results of operations. For example, requirements in the Health Plan Transparency Rule and the 2021 Appropriations Act, includingsuch as the price comparison tool, and other requirements have the potential to increase healthcare costs and our operating costs in order to comply and also may impact provider negotiations and market pricing. In addition, changes in government regulations or policies that apply to government-sponsored programs such as Medicare and Medicaid including, among other things, reimbursement levels, eligibility and recertification requirements, benefit coverage requirements and additional governmental participation, could also adversely affect our business, cash flows, financial condition, and results of operations. The annual recertification process for Medicaid recipients was temporarily suspended in response to the COVID-19 pandemic; however, the 2023 Appropriations Act decoupled Medicaid redeterminations from the COVID-19 public health emergency, and states may begin removing ineligible beneficiaries from their Medicaid programs starting April 1, 2023. Where states allow certain programs to expire or have not opted for Medicaid expansion under the ACA, we could experience reduced Medicaid enrollment and reduced growth opportunities. If future modifications to laws and regulations significantly reduce Medicaid enrollment, our Medicaid business will be negatively impacted.
We have experienced past assessments in the past under state or federal insolvency or guaranty association laws applicable to insurance companies, HMOs and other payers, and may experience assessments in the future if, for example, premiums established by other companies for their health insurance products, including certain long-term care products, are inadequate to cover their costs. Any such assessment could expose us to the risk of paying a portion of an impaired or insolvent insurance company’s claims through state guaranty associations. We are not currently able to estimate our potential financial obligations, losses or the availability of offsets associated with potential guaranty association assessments; however, any significant increase in guaranty association assessments could have a material adverse effect on our business, cash flows, financial condition, and results of operations.
We expect state legislatures will continue to focus on healthcare delivery and financing issues, including actions to reduce or limit increases to premium payments, provider billing protections, greater access to care and broader reforms of theirstate health insurance markets. State ballot initiatives cancould also be put to voters that would substantiallycould materially impair our operating environment. If enacted into law, these state proposals and actions could have a material adverse impact on our business, cash flows, operations or financial condition.
Additionally, from time to time,in the past, Congress has considered, and may consider in the future, various forms of managed care reform legislation which, if adopted, could fundamentally alter the treatment of coverage decisions under ERISA and other laws and could increase our costs, expose us to expanded liability or require us to revise the ways in which we conduct business. There have been legislative attempts to limit ERISA’s preemptive effect on state laws and litigants’ ability to seek damages beyond the benefits offered under their plans. If adopted, such limitations could increase our liability exposure, permit greater state regulation of our operations, and expand the scope of damages, including punitive damages, litigants could be awarded.
The ongoing changes to the ACA and related laws and regulations could adversely affect our business, cash flows, financial condition and results of operations.
The ongoing changes in federal and state laws and regulations stemming from the ACA, including the steps that have been taken to amend, repeal and limit the scope and application of the ACA, continue to represent significant challenges to the U.S. healthcare system. We are unable to predict how these events will ultimately be resolved, what impact the 2020 U.S. Presidential and Senate elections may have, and what the ultimate impact may be on our business, including, but not limited to, our products, services, processes and technology, and on our relationships with current and future customers and healthcare providers. The legal challenges regarding the ACA, including a federal district court decision invalidating the ACA in its entirety, which was argued before the U.S. Supreme Court in November 2020 and has been stayed pending the U.S. Supreme Court’s decision, continue to contribute to this uncertainty. Further regulations and modifications to the ACA at the federal or state level, including a judicial invalidation of the ACA, could significantly impact the market for our products, the regulations applicable to us and the fees and taxes payable by us and otherwise have significant effects on our business and future operations, some of which may adversely affect our results of operations and financial condition.
In general, the risk pool for the Individual market, which includes public exchange markets, has become less healthy since its inception in 2014 and continues to exhibit risk volatility. In addition, insurers have faced uncertainties related to federal government funding for various ACA programs. Based on our experience in public exchange markets to date, we have made adjustments to our premium rates and geographic participation, and will continue to evaluate the performance of our public exchange plans, the future viability of the public exchanges and availability of federal subsidies, and may make further adjustments to our rates and participation going forward. These factors may have a material adverse effect on our results of operations if premiums are not adequate or do not appropriately reflect the acuity of these individuals. Any variation from our expectations regarding acuity, enrollment levels, adverse selection, or other assumptions utilized in setting premium rates could have a material adverse effect on our results of operations, financial position, and cash flows.
For additional information related to the ACA, see Part I, Item 1 “Business” and Part II, Item 7 “Management’s Discussion and Analysis of Financial Condition and Results of Operations” of this Annual Report on Form 10-K.
We are subject to various risks associated with our international operations.
As we expand and operate our business outside of the U.S., we are presented with different challenges, including challenges in adapting to new markets, languages, business, labor and cultural practices and regulatory environments. Adapting to these challenges could require us to devote significant senior management attention and other resources. If we are unable to successfully manage our international operations, our business, cash flows, financial condition and results of operations could be adversely affected. In the future, we may acquire or operate new businesses outside of the U.S., increasing our exposure to these risks.
Certain of our subsidiaries that provide services to some of our health plans operate internationally and are subject to regulation in the jurisdictions in which they are organized or conduct business related to, among other things, local and cross border taxation, intellectual property, investment, management control, labor, anti-fraud, anti-corruption and privacy and data protection, regulations.which vary by jurisdiction. In addition, we are subject to U.S. laws that regulate the conduct and activities of U.S.-based businesses operating abroad, such as the Foreign Corrupt Practices Act. Violations of these laws and regulations could result in fines, criminal sanctions against us, our officers or employees, restrictions or outright prohibitions on the conduct of our business and significant reputational harm.harm and could adversely affect our ability to market our products and services, which may have a material adverse effect on our business, financial condition and results of operations.
We face risks related to litigation.
We are, and may in the future be, a party to a variety of legal actions that may affect our business, such as administrative charges before government agencies, employment and employment discrimination-related suits, employee benefit claims, breach of contract actions, tort claims and intellectual property-related litigation. In addition, because of the nature of our
business, we are subject to a variety of legal actions relating to our business operations, including the design, administration and offering of our products and services. These could include claims relating to the denial or limitation of healthcarehealth benefits; federal and state false claims act laws; dispensing of drugs associated with our PBM business; professional liability claims arising out of the delivery of healthcare and related services to the public; development or application of medical policies and coverage and clinical guidelines; medical malpractice actions; product liability claims; allegations of anti-competitive and unfair business activities; provider disputes over reimbursement and contracts; provider tiering programs; narrow networks; termination of provider contracts; the recovery of overpayments from providers; self-fundedfee-based business; disputes over co-payment calculations; reimbursement of out-of-network claims; the failure to disclose certain business practices; the failure to comply with various state or federal laws, including but not limited to, ERISA and the Mental Health Parity Act; and customer audits and contract performance, including government contracts. These actions or proceedings could result in substantial costs to us, require our officersmanagement to spend substantial time focused on the litigation, and result in negative media attention, and may adversely affect our business, reputation, financial condition, results of operations and cash flows.
We are also involved in, or may in the future be party to, pending or threatened litigation of the character incidental to the business we transact or arising out of our operations, including, but not limited to, breaches of security and violations of privacy requirements, shareholder actions, compliance with federal and state laws and regulations (including qui tam or “whistleblower” actions), or sales and acquisitions of businesses or assets (including as a result of the now terminated Agreement and Plan of Merger between us and Cigna Corporation, or as more fully described under Note 14, “Commitments and Contingencies - Litigation and Regulatory Proceedings - Cigna Corporation Merger Litigation,” of the Notes to Consolidated Financial Statements included in Part II, Item 8 of this Annual Report on Form 10-K).assets. From time to time, we are involved as a party in various governmental investigations, audits, reviews and administrative proceedings, including challenges relating to the award of government contracts. These investigations, audits and reviews include routine and special investigations by various state
insurance departments, various federal regulators including CMS and the HHS Office of Inspector General, state attorneys general, the Department of Justice, and various offices of the U.S. Attorney General. Following an investigation, we may be subject to civil or criminal fines, penalties, and other sanctions if we are determined to be in violation of applicable laws or regulations. Liabilities that may result from these actions could have a material adverse effect on our cash flows, results of operations and financial condition.
Recent court decisions and legislative activity may increase our exposure for any of these types of claims. In some cases, substantial non-economic (including injunctive relief), treble or punitive damages may be sought. Although we maintain insurance coverage for some of theseOur international footprint also subjects us to additional potential liabilities, somedisputes or differing interpretations related to contractual rights, tax positions, and regulatory oversight. Some liabilities and damages may not be covered by the insurance we carry, insurers may dispute coverage, or the amount of insurance may not be enough to cover the damages awarded. In addition, insurance coverage for all or certain forms of liability may become unavailable or prohibitively expensive in the future. Any adverse judgment against us resulting in such damage awards could result in negative publicity and have an adverse effect on our cash flows, results of operations and financial condition.
There are various risks associated with providing healthcare and other diversified products and services.
We continue to evolve our business to offer products and services beyond traditional health insurance, including digital health technology, pharmacy, behavioral and clinical care services, which subjects us to litigation and regulatory risks that are different from our traditional product and services offerings and may materially affect our exposure to other risks.
The direct provision of healthcare services by certain of our subsidiaries involves risks of additional litigation arising from medical malpractice actions based on our treatment decisions or brought against us or our associates for alleged malpractice or professional liability claims arising out of the delivery of healthcare and related services. In addition, liability may arise from maintaining healthcare premises that serve the public. Behavioral health services may also raise the risk profile of our business given the critical and sensitive nature of the services provided. In addition, we are, to a certain extent, self-insured with regard to litigation risks, including claims of medical malpractice against our affiliated physicians and us, and it is possible that the level of actual losses will significantly exceed the liabilities recorded for our estimates of the probable costs resulting from self-insured matters. The defense of any actions may result in significant expenses, and if we fail to maintain adequate insurance coverage for these liabilities, or if such insurance is not available, the resulting costs could adversely affect our business, cash flows, financial condition and results of operations. As we become more involved in direct care delivery and the provision of other services, such as crisis management services, there will be an increased possibility of litigation.
Additionally, many states in which certain of our subsidiaries operate limit the practice of medicine to licensed individuals or professional organizations comprised of licensed individuals. Business corporations generally may not exercise control over the medical decisions of physicians, and we are not licensed to practice medicine. Rules and regulations relating to the practice of medicine, fee-splitting between physicians and referral sources, and similar issues vary from state to state. Further, certain federalstate, and state laws, including those covering our Medicare and Medicaid plans, prohibit the offer, payment, solicitation or receipt of any form of remuneration to induce, or in return for, the referral of patient care opportunities and also generally prohibit physicians from making referrals to any entity providing certain designated health services if the referring physician or related person has an ownership or financial interest in the entity. Any enforcement
actions by governmental officials alleging non-compliance with these rules and regulations could adversely affect our business, cash flows, financial condition and results of operations. Further, in certain states we are required to use professional corporations that are not affiliates, which exposes us to risk in the event the physician owners of those professional corporations take actions that are in breach of the contractual obligations that exist between us.
Our PBM services business and related operations are subject to a number of risks and uncertainties that are in addition to those we face in our core healthcare business.
We provide PBM services through our IngenioRxCarelonRx business and we are responsible to regulators and our customers for the delivery of those PBM services that we contract to provide. Our PBM services business is subject to the risks inherent in the dispensing, packaging, fulfillment and distribution of pharmaceuticals and other healthcare products, including exposure to liabilities and reputational harm related to purported dispensing and other operational errors by us or our PBM services suppliers. Any failure by us or one of our PBM services suppliers to adhere to the laws and regulations applicable to the dispensing of pharmaceuticals could subject our PBM business to civil and criminal penalties.
Our PBM services business is subject to federal and state laws and regulations that govern its relationships with pharmaceutical manufacturers, physicians, pharmacies and customers, including without limitation, federal and state anti-kickback laws, beneficiary inducement laws, consumer protection laws, ERISA, HIPAA and laws related to the operation of internet and mail-service pharmacies, as well as an increasing number of licensure, registration and other laws and accreditation standards that impact the business practices of a PBM services business. In addition, the PBM services business
and the practice of pharmacy isare subject to federal and state laws and regulation,regulations, including those of state boards of pharmacy, individual state-controlled substance authorities, the U.S. Drug Enforcement Agency and the U.S. Food and Drug Administration. Also, we and our third-party vendors are subject to registration requirements and state and federal laws concerning labeling, packaging, advertising, handling and adulteration of prescription drugs and dispensing of controlled substances. Noncompliance with applicable laws and regulations by us or our third-party vendors could have material adverse effects on our business, results of operations, financial condition, liquidity and reputation.
Federal and state legislatures and regulators also regularly consider new laws and regulations and changes to existing regulations and policies for the industry that could materially affect current industry practices and our business, including the regulation implemented by HHS in November 2020 related to drug manufacturer rebates, andspread pricing contract arrangements, the pricing of pharmaceuticals, the 2021 Appropriations Act and potential new regulations regarding rebates, fees from pharmaceutical companies, the development and use of formularies and other utilization management tools, the use of average wholesale prices or other pricing benchmarks, pricing for specialty pharmaceuticals, limited access to networks and pharmacy network reimbursement methodologies. In Decembermethodologies and reporting requirements. Recent case law, such as the 2020 the U.S. Supreme Court let standreinstatement of an Arkansas law regulating PBMs, thatas well as industry publications like the 2021 NAIC white paper on the topic, may be a precursor toincrease and impact greater state regulation of PBMs.
We are a party to license agreements with the BCBSA that entitle us to the exclusive and, in certain areas, non-exclusive use of the BCBS names and marks in our geographic territories. The termination of these license agreements or changes in the terms and conditions of these license agreements could adversely affect our business, cash flows, financial condition and results of operations.
Our license agreements with the BCBSA contain certain requirements and restrictions regarding our operations and our use of the BCBS names and marks, and failure to comply with those requirements could result in a termination of the license agreements. The license agreements may be modified by the BCBSA, which could have a material adverse effect on our future expansion plans or results of operations. Further, BCBS licensees have certain requirements to perform administrative services for members of other BCBS licensees. As of December 31, 2020,2022, we provided services to approximately 3233 million Blue Cross and/or Blue Shield enrollees. If we or another BCBS licensee are not in compliance with all legal requirements or are unable to perform administrative services as required, this could have an adverse effect on our members and our ability to maintain our licenses, which could have a material adverse effect on our business, cash flows, financial condition and results of operations.
Upon the occurrence of an event causing termination of the license agreements, we would no longer have the right to use the BCBS names and marks or to sell BCBS health insurance products and services in one or more of our service areas. Furthermore, the BCBSA would be free to issue a license to use the BCBS names and marks in these service areas to another entity. Our existing BCBS members would be provided with instructions for obtaining alternative products and services licensed by the BCBSA. We believe that the BCBS names and marks are valuable identifiers of our products and services in the marketplace.
Upon termination of either license agreement, the BCBSA would have the right to impose a “Re-establishment Fee” upon us, which would be used in part to fund the establishment of a replacement Blue Cross and/or Blue Shield licensee in the vacated service area. The fee is set at $98.33 per licensed enrollee. If the Re-establishment Fee was applied to our total Blue Cross and/or Blue Shield enrollees of approximately 3233 million as of December 31, 2020,2022, we would be assessed approximately $3 billion by the BCBSA. As a result, termination of the license agreements would have a material adverse effect on our business, cash flows, financial condition and results of operations.
For more information on the BCBSA license agreements, including requirements, restrictions and termination events set forth in these license agreements, see Part I, Item 1, “Business — BCBSA Licenses” of this Annual Report on Form 10-K.
Indiana law, other applicable laws, our articles of incorporation and bylaws, and provisions of our BCBSA license agreements may prevent or discourage takeovers and business combinations that our shareholders might consider to be in their best interest.
Indiana law, other applicable laws and regulations and provisions in our articles of incorporation and bylaws may delay, defer, prevent or render more difficult a takeover attempt that our shareholders might consider to be in their best interests. For instance, they may prevent our shareholders from receiving the benefit from any premium to the market price of our common
stock offered by a bidder in a takeover context or adversely affect the price that some investors are willing to pay for our stock.
The insurance holding company system acts and certain health statutes of the states in which our insurance company or HMO subsidiaries are regulated restrict the ability of any person to obtain control of an insurance company or HMO without prior regulatory approval. Further, the Indiana Business Corporation Law contains business combination provisions that, in general, prohibit for five years any business combination with a beneficial owner of 10% or more of our common stock unless the holder’s acquisition of the stock was approved in advance by our Board of Directors.
Our articles of incorporation and bylaws contain provisions that could have anti-takeover effects and may delay, defer or prevent a takeover attempt that our shareholders might consider to be in their best interests. Our articles of incorporation provide that no person may beneficially own shares of voting capital stock in excess ofbeyond specified ownership limits, except with the prior approval of a majority of the “continuing directors.” The ownership limits, which may not be exceeded without the prior approval of the BCBSA, are the following: (1) for any institutional investor (as defined in our articles of incorporation), one share less than 10% of our outstanding voting securities; (2) for any non-institutional investor (as defined in our articles of incorporation), one share less than 5% of our outstanding voting securities; and (3) for any person, one share less than the number of shares of our common stock or other equity securities (or a combination thereof) representing a 20% ownership interest in us.
In addition, our articles of incorporation and bylaws: divide our Board of Directors into three classes serving staggered three-year terms (which is required by our license agreementagreements with the BCBSA); permit our Board of Directors to determine the terms of and issue one or more series of preferred stock without further action by shareholders; restrict the maximum number of directors and the ability to increase that number; limit the ability of shareholders to remove directors; impose restrictions on shareholders’ ability to fill vacancies on our Board of Directors; impose advance notice requirements for shareholder proposals and nominations of directors to be considered at meetings of shareholders; prohibit shareholders from amending certain provisions of our bylaws; and impose restrictions on who may call a special meeting of shareholders.
The health benefits industry is subject to negative publicity, which could adversely affect our business, cash flows, financial condition and results of operations.
The health benefits industry is subject to negative publicity, which can arise from, among other things, increases in premium rates, industry consolidation, cost of care initiatives and debate around existing or proposed legislation. Negative publicity may result in increased regulation and legislative review of industry practices, which may further increase our costs of doing business and adversely affect our profitability by limiting our ability to market or provide our products and services, requiring us to change our products and services, or increasing the regulatory oversight under which we operate. In addition, any negative publicity concerning the BCBSA or other BCBSA licensees may adversely affect us and the sale of our health benefits products and services. Negative public perception or publicity of the health benefits industry in general, the BCBSA, other BCBSA licensees, or us or our key vendors in particular, could adversely affect our business, cash flows, financial condition and results of operations.
STRATEGIC RISKS
We face competition in many of our markets, and if we fail to adequately adapt to changes in our industry and develop and implement strategic growth opportunities, our ability to compete and grow may be adversely affected.
As a health benefits company, we operate in a highly competitive environment and in an industry that is subject to significant changes from and competition due to legislative reform, business consolidations, new strategic alliances, new market entrants, aggressive marketing practices, technological advancements and changing market practices such as increasing usage of telehealth. We also will have tomust respond to pricing and other actions taken by existing competitors and potentially disruptive new entrants in the public exchangesPublic Exchanges and in our other lines of business. These factors have produced and will likely continue to produce significant pressures on our profitability.profitability and membership. Furthermore, decisions to buy our products and services are increasingly made or influenced by consumers, through means such as direct purchasing (for example, Medicare Advantage plans) and insurance exchanges that allow individual choice, or by large employers that may increasingly have the ability to contract directly with providers. This createsTo compete effectively under these unique market pressures and in order to compete effectively in the consumer-driven marketplace, we will be required to develop and deliver innovative and potentially disruptive products and services to satisfy evolving market demands.
In addition, the PBM industry is highly competitive, and IngenioRxCarelonRx is subject to competition from national, regional and local PBMs, other insurers, health plans, large retail pharmacy chains, large retail stores, supermarkets, other mail order and web pharmacies, discount cards and specialty pharmacies. Strong competition within the PBM business has generated greater demand for lower product and service pricing, increased revenue sharing and enhanced product and service offerings. Our inability to maintain positive trends, contract on favorable terms with pharmaceutical manufacturers for, among other things, rebates, discounts and administrative fees or a failure to identify and implement new ways to mitigate pricing pressures, could negatively impact our ability to attract or retain customers, negatively impact our margins and have a material adverse effect on our business and results of operations. In addition, legislative reforms such as the regulation recently issued by HHS in November 2020 related to rebates and the 2021 Appropriations Act, which requires reporting of plan spending, the cost of plan pharmacy benefits, enrollee premiums and any manufacturer rebates received by the plan or issuer, may adversely affect our competitive position, cash flows, financial condition and results of operations.
In order to profitably grow our business in the future, we need to not only grow our profitable medical membership, but also continue to diversify our sources of revenue and earnings, including through the increased sale of our stand-alone PBM and other Carelon services, specialty products, such as dental, vision and other supplemental products, expansion of products, expansion of our non-insurance assets and establishment of new cost of care solutions, including innovations in PBM and health services. If we are unable to acquire or develop and successfully manage new opportunities that further our strategic objectives and differentiate our products and services from our competitors, our ability to profitably grow our business could be adversely affected.
We are currently dependent on the non-exclusive services of independent agents and brokers in the marketing of our healthcare products, particularly with respect to individuals, seniors and localcertain group customers. We face intense competition for the services and allegiance of these independent agents and brokers, who may also market the products of our competitors. Our relationship with our brokers and independent agents could be adversely impacted by changes in our business practices to address legislative changes, including potential reductions in commissions and consulting fees paid to agents and brokers. We cannot ensure that we will be able to compete successfully against current and future competitors for these services or that competitive pressures faced by us will not materially and adversely affect our business, cash flows, financial condition and results of operations.
For additional information, see “Business — Competition,”Competition” in Part I, Item 1 of this Annual Report on Form 10-K.
We have built a significant portion of our current business through mergers and acquisitions, joint ventures, and strategic alliances and investments, and although we expect to pursue such opportunities in the future.future, we are subject to risks resulting from such business combinations.
The following are some of the risks associated with mergers, acquisitions, divestitures, joint ventures and strategic alliances and investments, referred to collectively as business combinations, that could have a material adverse effect on our business, cash flows, financial condition and results of operations:
•some of the business combinations may not achieve anticipated revenues, earnings or cash flow, business opportunities, synergies, growth prospects andor other anticipated benefits;
•we may assume liabilities that were not disclosed to us, or which were underestimated;underestimated, and which could lead to legal challenges, investigations and enforcement actions, and we may not be able to adequately recover from sellers or insurance carriers for such assumed liabilities;
•we may experience difficulties in integrating business combinations, including into our internal control environment and culture, be unable to integrate business combinations successfully or as quickly as expected and be unable to realize anticipated economic, operational and other benefits in a timely manner or at all;
•business combinations and proposed business combinations that are not completed could disrupt our ongoing business, lead to the incurrence of significant fees, distract management, result in the loss of key employees, divert resources, result in tax costs or inefficiencies and make it difficult to maintain our current business standards, controls, information technology systems, policies and procedures;
•we may finance future business combinations by issuing common stock for some or all of the purchase price, which could dilute the ownership interests of our shareholders;
•we may compete with other firms, some of which may have greater financial and other resources, to acquire attractive companies;
•we may experience disputes with or competition from our partners or former partners in our strategic alliances, investments and joint ventures, which could result in litigation or a loss of business; and
•future business combinations may make it difficult to comply with the requirements of the BCBSA and lead to an increaseda risk that our BCBSA license agreements may be terminated.
We face intense competition to attract and retain employees. Further, managing key executive transition, succession and retention is critical to our success.
Our success depends on our ability to attract, develop and retain qualified employees, including those with diverse backgrounds, experience and skill sets, to integrate employees who have joined us through acquisitions.operate and expand our business. We face intense competition for qualifiedexperienced and highly skilled employees, and there canwe may be no assurance that we will be ableunable to attract and retain such employees or that such competition among potential employers will notmay result in increasing salaries. Adverse changes to our corporate culture could harm our business operations and our ability to retain key employees and executives. An inability to retain existing employees or attract additional employees could have a material adverse effect on our business, cash flows, financial condition and results of operations.
We would be adversely affectedIn addition, if we failare unable to adequately plan forattract, retain and effectively manage the succession ofplans for key employees and executives, including our President and Chief Executive Officer, our business, results of operations and other senior management or retainfuture performance could be adversely affected. We may have difficulty in replacing key executives. Whileexecutives because of the limited number of qualified individuals with the breadth of skills and experience required to operate and successfully expand our business. The succession plans we have succession plans in place for members of our senior management and employment arrangements with certain key executives these plans and arrangements do not guarantee that the services of our senior executives will continue to be available to us or that we will be able to attract, transition and retain suitable successors.
FINANCIAL RISKS
As a holding company, we are dependentRestrictions on dividendsour ability to obtain funds from our subsidiaries. These dividends are necessary to pay our outstanding indebtedness. Our regulated subsidiaries are subjectcould limit our ability to state regulations, including restrictions on the paymentrepurchase shares, pay dividends and meet our obligations and materially adversely affect our business, cash flows, financial condition and results of dividends, maintenance of minimum levels of capital and restrictions on investment portfolios.operations.
As a holding company, we are dependent on dividends and administrative expense reimbursements from our subsidiaries. Our regulated subsidiaries are not obligated to make funds available to us, and creditors of our subsidiaries will have a superior claim to certain of our subsidiaries’ assets. Furthermore, amongAmong other restrictions, state insurance and HMO laws may restrict the ability of most of our regulated subsidiaries to pay dividends. In some states, we have made special undertakings that may further limit the ability of our regulated subsidiaries to pay dividends. In addition, our subsidiaries’ ability to make any payments to us will also depend on their earnings, the terms of their indebtedness, business and tax considerations and other legal restrictions. Our ability to repurchase shares, or pay dividends in the future to our shareholders and meet our obligations, including paying operating expenses and debt service on our outstanding and future indebtedness, will depend upon the receipt of dividends from our subsidiaries. An inability of our subsidiaries to pay dividends in the future in an amount sufficient for us to meet our financial obligations may materially adversely affect our business, cash flows, financial condition and results of operations.
MostIn addition, most of our regulated subsidiaries are subject to RBC standards or other forms of minimum capital requirements imposed by their states of domicileand periodic financial reporting that require them to report their results of risk-based capital calculations to the departments of insurance and the NAIC. Failure to maintain thethese minimum RBC standards could subject our regulated subsidiaries to corrective action, including state supervision or liquidation. Changes to the existing RBC standards and the
NAIC’s December 2020 adoption of an RBC requirement at the holding company level, which requires submission of the first report in May 2023, could further restrict our or our regulated subsidiaries’ ability to pay dividends and adversely affect our business. In addition, as discussed in more detail above, weWe are also a party to license agreements with the BCBSA which contain certain requirements and restrictions regarding our operations, includingadditional minimum capital and liquidity requirements. Changes to existing minimum capital requirements which could further restrict the ability of our regulated subsidiaries to pay dividends.dividends and adversely affect our business.
Our regulated subsidiaries are subject to state laws and regulations that require diversification of their investment portfolios and limit the amount of investments in certain riskier investment categories, such as below-investment-grade fixed maturity securities, mortgage loans, real estate and equity investments, which could generate higher returns on their investments.categories. Failure to comply with these laws and regulations might cause investments exceeding regulatory limitations to be treated as non-admitted assets for purposes of measuring statutory surplus and risk-based capital, and in some instances, require the sale of those investments.
We have substantial indebtedness outstanding and may incur additional indebtedness in the future, which could adversely affect our ability to pursue desirable business opportunities and to react to changes in the economy or our industry, and exposes us to interest rate risk to the extent of our variable rate indebtedness.industry.
Our debt service obligations require us to use a portion of our cash flow to pay interest and principal on debt instead of for other corporate purposes, including funding future expansion. We are exposed to interest rate risk to the extent of our variable rate indebtedness. Increases in interest rates have increased our cost of borrowing, and volatility in U.S. and global financial markets could impact our access to, or further increase the cost of, financing. If our cash flow and capital resources are insufficient to service our debt obligations, we may be forced to seek extraordinary dividends from our subsidiaries, sell
assets, seek additional equity or debt capital or restructure our debt. However, these measures might be unsuccessful or inadequate to meet scheduled debt service obligations or may not be available on commercially reasonable terms.
We may also incur future debt obligations that might subject us to restrictive covenants that could affect our financial and operational flexibility. Our breach or failure to comply with any of these covenants could result in a default under our credit facilities or other indebtedness. If we default under our credit agreement, the lenders could cease to make further extensions of credit or cause all of our outstanding debt obligations under our credit agreement to become immediately due and payable, together with accrued and unpaid interest. If the indebtedness under our notes or our credit agreement or our other indebtedness is accelerated, we may be unable to repay or finance the amounts due, on commercially reasonable terms, or at all.
A downgrade in our credit ratings could have an adverse effect on our business, cash flows, financial condition and results of operations.
Claims-paying ability, as well as financial strength and debt ratings by nationally recognized statistical rating organizations are important factors in establishing the competitive position of insurance companies and health benefits companies. We believe our strong credit ratings are an important factor in marketing our products to customers. In addition, if our credit ratings are downgraded or placed under review, our business, cash flows, financial condition and results of operations could be adversely impacted by limitations on future borrowings and a potential increase in our borrowing costs. Each of the ratings organizations reviews our ratings periodically, and there can be no assurance that our current ratings will be maintained in the future.
The value of our intangible assets may become impaired.
As of December 31, 2020,2022, we had $31$35 billion of goodwill and other intangible assets, representing 36%34% of our total consolidated assets. In accordance with applicable accounting standards, we periodically evaluate our goodwill and other intangible assets for potential impairment, using assumptions and judgments regarding the estimated fair value of our reporting units. Estimated fair values might be significantly different if other reasonable assumptions and estimates were to be used. If estimated fair values are less than the carrying values of goodwill and other intangible assets with indefinite lives in future impairment tests, or if significant impairment indicators are noted relative to other intangible assets subject to amortization, we may be required to record impairment losses against future income.
The value we place on intangible assets may be adversely impacted if existing or future business combinations fail to perform in a manner consistent with our assumptions. In addition, from time to time we divest businesses, and any such divestiture could result in significant asset impairment and disposition charges, including those related to goodwill and other intangible assets. In addition,Further, the estimated value of our reporting units may be impacted as a resultbecause of business decisions we
make associated with any future changes to laws and regulations, which could unfavorably affect the carrying value of certain goodwill and other intangible assets and result in impairment charges in future periods. Any future evaluations requiring an impairment of our goodwill and other intangible assets could materially affect our results of operations and shareholders’ equity which could, in turn, negatively impact our debt ratings or potentially impact our compliance with existing debt covenants.
The value of our investments is influenced by varying economic and market conditions, and a decrease in value may result in a loss charged to income.
We maintain a significant investment portfolio of cash equivalents and short-term and long-term investments in a variety of securities, which are subject to general credit, liquidity, market and interest rate risks. As a result, we may experience a reduction in value or loss of our investments, which may have a negative adverse effect on our results of operations, liquidity and financial condition. Changes in the economic environment, including periods of increased volatility in the securities markets such as those experienced in 2020 related to the ongoingconnection with COVID-19 pandemic,and recent increases in inflation and interest rates, can increase the difficulty of assessing investment impairment and increase the risk of potential impairment of these assets. There is continuing risk that declines in the fair value of our investments may occur and material impairments may be charged to income in future periods, resulting in realizedrecognized losses.
GENERAL RISKS
Changes in tax laws and regulations could have a material adverse effect on our business, cash flow, financial condition and results of operations. In addition, we may not be able to realize the value of our deferred tax assets.
Changes in tax laws and regulations , including a potential increase in U.S. corporate tax rates or changes in the deductibility of expenses, or changes in the interpretation of tax laws and regulations by federal and/or state authorities, could have a material impact on the future value of our deferred tax assets and deferred tax liabilities, could result in significant one-time charges in the current or future taxable years and could increase our future U.S. tax expense. In addition, we are regularly audited by federal and other tax authorities. Although we believe our tax positions comply with applicable tax law, the final determination of audits and any related litigation in the jurisdictions where we are subject to taxation could be materially different from our historical income provisions and accruals. These changes could have a material adverse effect on our business, cash flow, financial condition and results of operations.
In addition, any future increase in our valuation allowance with regard to our deferred tax assets would result in additional income tax expense and a decrease in shareholders’ equity, which could materially affect our financial position and results of operations in the period in which the increase occurs. A material decrease in shareholders’ equity could, in turn, negatively impact our debt ratings or potentially impact our compliance with existing debt covenants.
We also face other risks that could adversely affect our business, financial condition or results of operations, which include:
•adverse securities and credit market conditions, which could impact our ability to meet liquidity needs;
•any requirement to restate financial results in the event of inappropriate application of accounting principles;
•changes in tax laws and regulations or changes in the interpretation of tax laws and regulations by governmental authorities that could impact the future value of our deferred tax assets and deferred tax liabilities, or result in significant one-time charges in the current or future taxable years;
•a significant failure of our internal control over financial reporting;
•failure of our prevention and control systems related to employee compliance with internal policies, including data security;security and data privacy;
•provider fraud that is not prevented or detected and impacts our medical costs or those of self-insured customers;
•failure to protect our proprietary information;information and other sensitive data; and
•failure of our corporate governance policies or procedures.
ITEM 1B. UNRESOLVED SEC STAFF COMMENTS.
None.
ITEM 2. PROPERTIES.
We lease our principal executive offices located at 220 Virginia Avenue, Indianapolis, Indiana. In addition to this location, we have operating facilities located in each state where we operate as licensees of the BCBSA, in each state where Amerigroup conducts business and in certain other states and countries where our other subsidiaries operate. A majority of these locations are also leased properties. Our facilities support our various business segments. We modified certain of our workforce practices in 2020 in response to the COVID-19 pandemic, including having the majority of our workforce work remotely. In the third quarter of 2020, our management introduced enterprise-wide initiatives to streamline our operations and optimize our business, including a reduction of our office space footprint. In 2021 and 2022, we identified additional reductions of office space. We believe that our properties are adequate and suitable for our business as presently conducted; however, we are continuing to evaluate our real estate strategy as it relatesin response to the impact of the COVID-19 pandemic and the changing needs of a moreour in-office, hybrid and remote workforce.
ITEM 3. LEGAL PROCEEDINGS.
For information regarding our legal proceedings, see Note 14, “Commitments and Contingencies - Litigation and Regulatory Proceedings,” of the Notes to Consolidated Financial Statements included in Part II, Item 8 of this Annual Report on Form 10-K, which information is incorporated herein by reference.
ITEM 4. MINE SAFETY DISCLOSURES.
Not applicable.
PART II
ITEM 5. MARKET FOR REGISTRANT’S COMMON EQUITY, RELATED STOCKHOLDER MATTERS AND ISSUER PURCHASES OF EQUITY SECURITIES.
Market Information
Our common stock, par value $0.01 per share, is listed on the NYSE under the symbol “ANTM.“ELV.”
Holders
As of February 4, 2021,1, 2023, there were 55,76450,958 shareholders of record of our common stock.
Securities Authorized for Issuance under Equity Compensation Plans
The information required by this Item concerning securities authorized for issuance under our equity compensation plans is set forth in Part III, Item 12, “Security Ownership of Certain Beneficial Owners and Management and Related Stockholder Matters” in this Annual Report on Form 10-K.
Issuer Purchases of Equity Securities
The following table presents information related to our repurchases of common stock for the periods indicated (in millions, except share and per share data):
| | | | | | | | | | | | | | | | | | | | | | | | | | | | | |
| Period | | | Total Number of Shares Purchased1 | | Average Price Paid per Share | | Total Number of Shares Purchased as Part of Publicly Announced Programs2 | | Approximate Dollar Value of Shares that May Yet Be Purchased Under the Programs |
| | | | | | | | |
| October 1, 2020 to October 31, 2020 | | 1,236,624 | | | $ | 288.64 | | | 1,234,200 | | | $ | 2,093 | |
| November 1, 2020 to November 30, 2020 | | 1,483,621 | | | 310.05 | | | 1,481,675 | | | 1,634 | |
| December 1, 2020 to December 31, 2020 | | 1,744,143 | | | 314.04 | | | 1,725,700 | | | 1,092 | |
| | | 4,464,388 | | | | | 4,441,575 | | | |
| | | | | | | | | |
| | | | | | | | | | | | | | | | | | | | | | | | | | | | | |
| Period | | | Total Number of Shares Purchased1 | | Average Price Paid per Share | | Total Number of Shares Purchased as Part of Publicly Announced Programs2 | | Approximate Dollar Value of Shares that May Yet Be Purchased Under the Programs |
| | | | | | | | |
| October 1, 2022 to October 31, 2022 | | 432,338 | | | $ | 481.70 | | | 431,325 | | | $ | 2,236 | |
| November 1, 2022 to November 30, 2022 | | 434,076 | | | 503.80 | | | 433,418 | | | 2,017 | |
| December 1, 2022 to December 31, 2022 | | 278,961 | | | 511.26 | | | 276,308 | | | 1,876 | |
| | | 1,145,375 | | | | | 1,141,051 | | | |
| | | | | | | | | |
1Total number of shares purchased includes 22,8134,324 shares delivered to or withheld by us in connection with employee payroll tax withholding upon exercise or vesting of stock awards. Stock grants to employees and directors and stock issued for stock option plans and stock purchase plans in the consolidated statements of shareholders’ equity are shown net of these shares purchased.
2Represents the number of shares repurchased through the common stock repurchase program authorized by our Board of Directors, which the Board evaluates periodically. During the year ended December 31, 2020,2022, we repurchased 9,429,0674,834,939 shares at an aggregate cost of $2,700$2,316 under the program, including the cost of options to purchase shares. The Board of Directors has authorized our common stock repurchase program since 2003. On January 26, 2021,24, 2023, our Audit Committee, pursuant to authorization granted by the Board of Directors, authorized a $5,000 increase to our common stock repurchase program. No duration has been placed on our common stock repurchase program, and we reserve the right to discontinue the program at any time.
Performance Graph
The following Performance Graph and related information compares the cumulative total return to shareholders of our common stock for the period from December 31, 20152017 through December 31, 2020,2022, with the cumulative total return over such period of (i) the Standard & Poor’s 500 Stock Index (the “S&P 500 Index”) and (ii) the Standard and Poor’s 500 Health Care Index (the “S&P 500 Health Care Index”). We have also included the Standard & Poor’s Managed Health Care Index (the “S&P Managed Health Care Index”). that we have compared ourselves to in prior years. We believe the S&P 500 Health Care Index provides for a more meaningful comparison as it contains a more comprehensive list of companies in the healthcare industry than the previous S&P Managed Health Care Index. The graph assumes an investment of $100 on December 31, 20152017 in each of our common stock the S&P 500 Index and the S&P Managed Health Care Indexthese indices (and the reinvestment of all dividends).
The comparisons shown in the graph below are based on historical data, and we caution that the stock price performance shown in the graph below is not indicative of, and is not intended to forecast, the potential future performance of our common stock. Information used in the graph was obtained from S&P Global Market Intelligence, a source believed to be reliable, but we are not responsible for any errors or omissions in such information. The following graph and related information shall not be deemed “soliciting materials” or to be “filed” with the SEC, nor shall such information be incorporated by reference into any future filing under the Exchange Act, except to the extent that we specifically incorporate it by reference into such filing.
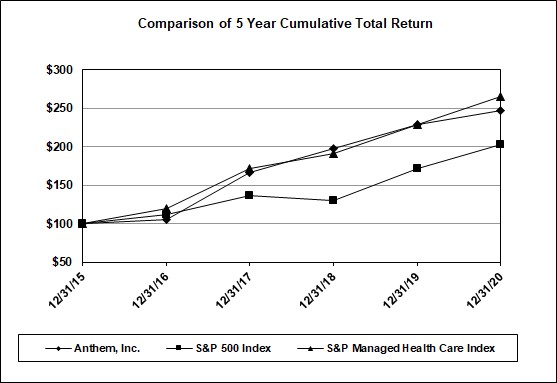
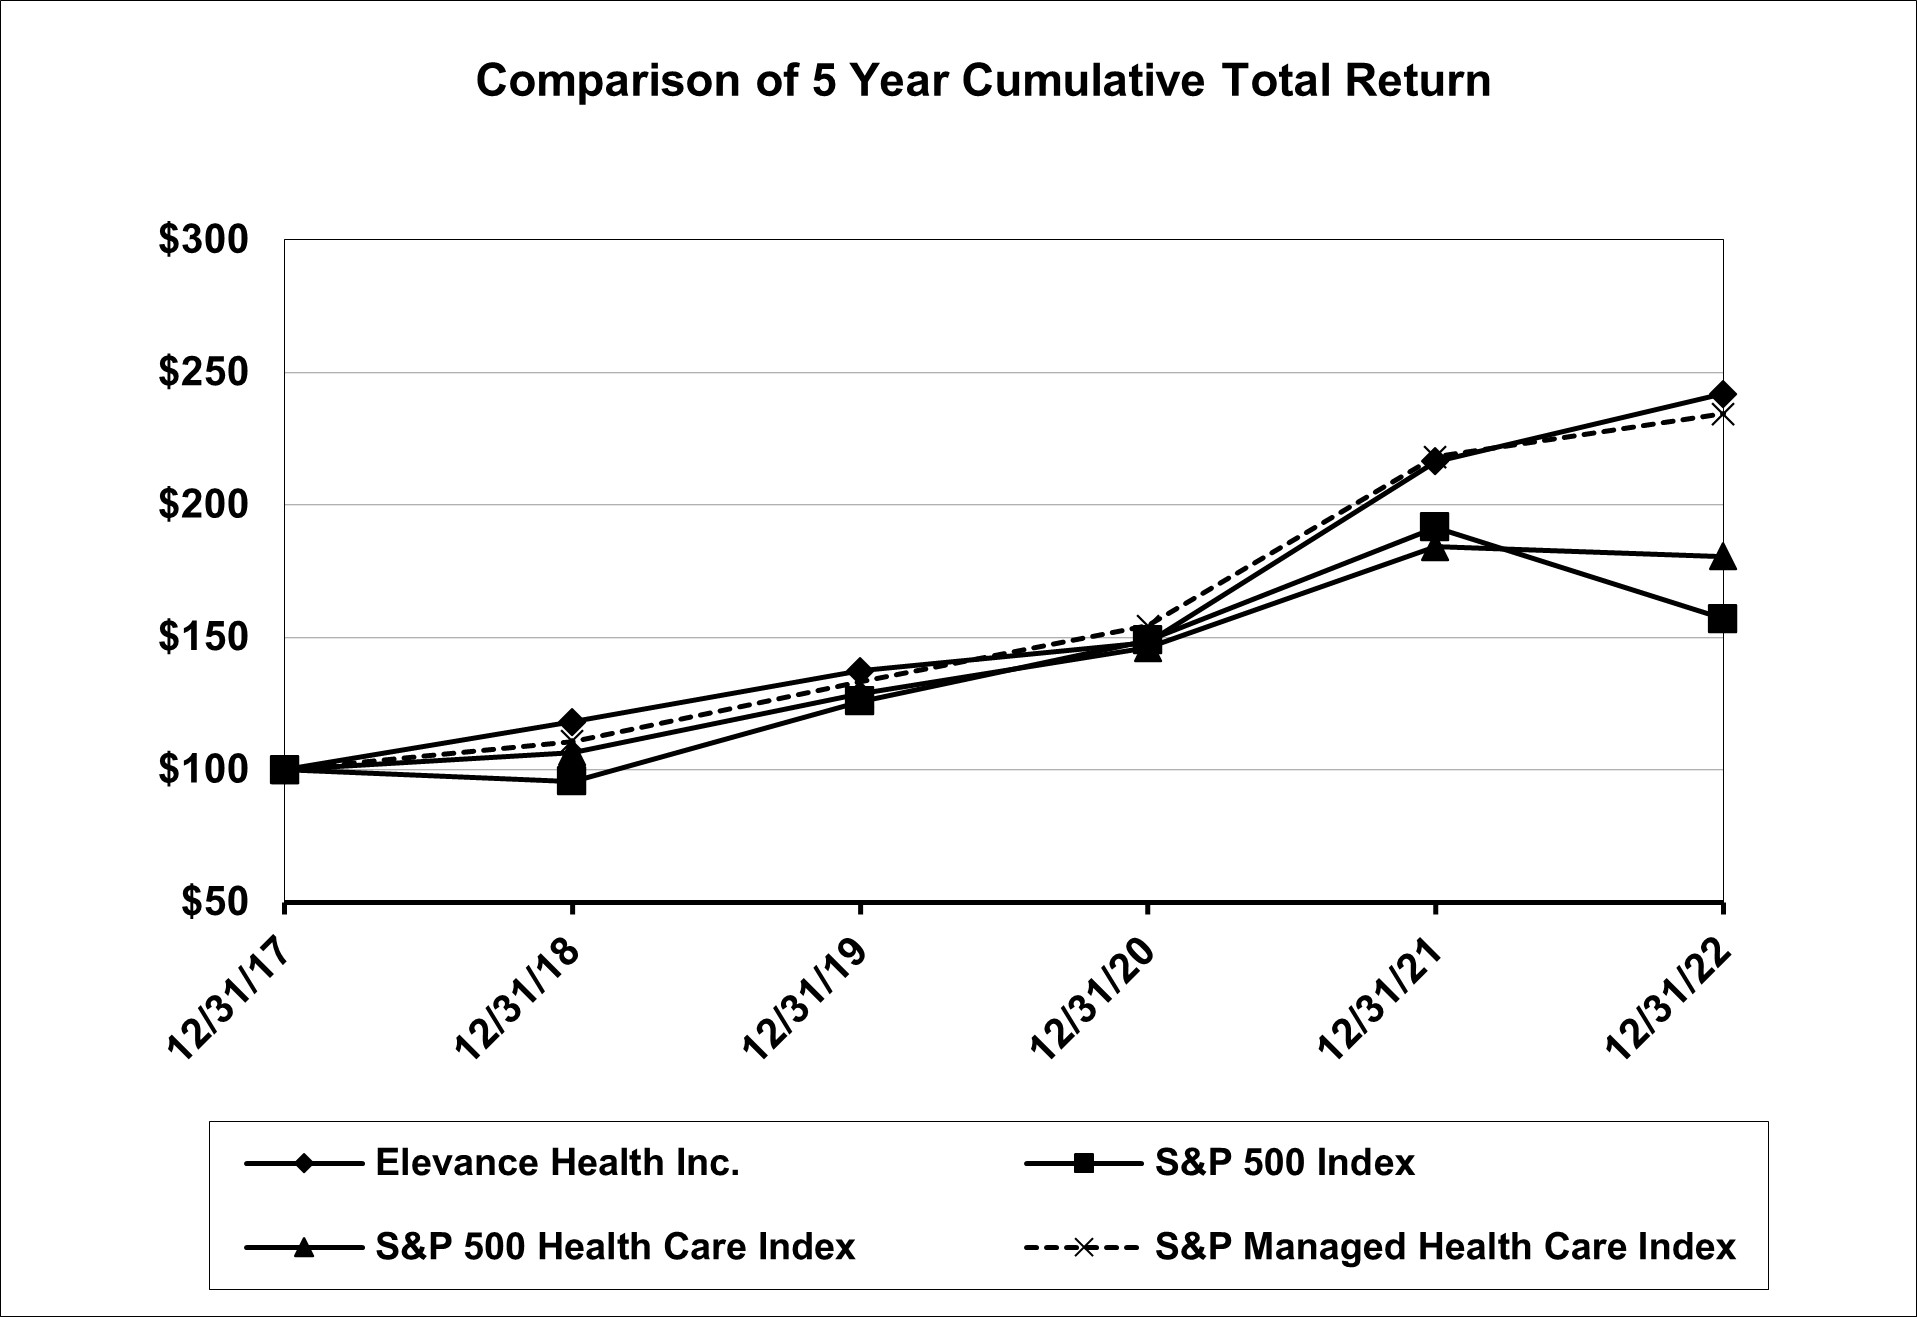
| | | | | December 31, | | | December 31, |
| | | | 2015 | | 2016 | | 2017 | | 2018 | | 2019 | | 2020 | | | 2017 | | 2018 | | 2019 | | 2020 | | 2021 | | 2022 |
| Anthem, Inc. | $ | 100 | | | $ | 105 | | | $ | 167 | | | $ | 197 | | | $ | 229 | | | $ | 247 | | |
| Elevance Health, Inc. | | Elevance Health, Inc. | $ | 100 | | | $ | 118 | | | $ | 137 | | | $ | 148 | | | $ | 216 | | | $ | 242 | |
| S&P 500 Index | S&P 500 Index | 100 | | | 112 | | | 136 | | | 130 | | | 171 | | | 203 | | S&P 500 Index | 100 | | | 96 | | | 126 | | | 149 | | | 192 | | | 157 | |
| S&P 500 Health Care Index | | S&P 500 Health Care Index | 100 | | | 106 | | | 129 | | | 146 | | | 184 | | | 180 | |
| S&P Managed Health Care Index | S&P Managed Health Care Index | 100 | | | 120 | | | 172 | | | 191 | | | 229 | | | 266 | | S&P Managed Health Care Index | 100 | | | 111 | | | 133 | | | 154 | | | 218 | | | 234 | |
|
Based upon an initial investment of $100 on December 31, 20152017 with dividends reinvested.
ITEM 6. SELECTED FINANCIAL DATA.
The table below provides selected consolidated financial data of Anthem. The information has been derived from our consolidated financial statements for each of the years in the five-year period ended December 31, 2020. You should read this selected consolidated financial data in conjunction with the audited consolidated financial statements and notes as of and for the year ended December 31, 2020 included in Part II, Item 8 “Financial Statements and Supplementary Data,” and Part II, Item 7 “Management’s Discussion and Analysis of Financial Condition and Results of Operations” included in this Annual Report on Form 10-K.
| | | | | | | | | | | | | | | | | | | | | | | | | | | | | | | | |
| | | As of and for the Years Ended December 31 |
| | | 2020 1 | | 2019 | | 2018 1 | | 2017 1 | | 2016 |
| (in millions, except where indicated and except per share data) | | | | | | | | | |
| Income Statement Data | | | | | | | | | |
Total operating revenue2 | $ | 120,808 | | | $ | 103,141 | | | $ | 91,341 | | | $ | 89,061 | | | $ | 84,194 | |
| Total revenues | 121,867 | | | 104,213 | | | 92,105 | | | 90,040 | | | 84,863 | |
| | | | | | | | | |
| Net income | 4,572 | | | 4,807 | | | 3,750 | | | 3,843 | | | 2,470 | |
| Per Share Data | | | | | | | | | |
| Basic net income per share | $ | 18.23 | | | $ | 18.81 | | | $ | 14.53 | | | $ | 14.70 | | | $ | 9.39 | |
| Diluted net income per share | 17.98 | | | 18.47 | | | 14.19 | | | 14.35 | | | 9.21 | |
| Dividends per share | 3.80 | | | 3.20 | | | 3.00 | | | 2.70 | | | 2.60 | |
| Other Data (unaudited) | | | | | | | | | |
Benefit expense ratio3 | 84.6 | % | | 86.8 | % | | 84.2 | % | | 86.4 | % | | 84.8 | % |
Selling, general and administrative expense ratio4 | 14.4 | % | | 13.0 | % | | 15.3 | % | | 14.2 | % | | 14.9 | % |
| Income before income tax expense as a percentage of total revenues | 5.1 | % | | 5.7 | % | | 5.5 | % | | 4.4 | % | | 5.4 | % |
| Net income as a percentage of total revenues | 3.8 | % | | 4.6 | % | | 4.1 | % | | 4.3 | % | | 2.9 | % |
Medical membership (in thousands) | 42,925 | | | 41,000 | | | 39,938 | | | 40,299 | | | 39,940 | |
| Balance Sheet Data | | | | | | | | | |
Cash and investments5 | $ | 31,295 | | | $ | 26,127 | | | $ | 22,639 | | | $ | 25,179 | | | $ | 23,263 | |
| Total assets | 86,615 | | | 77,453 | | | 71,571 | | | 70,540 | | | 65,083 | |
| Long-term debt, less current portion | 19,335 | | | 17,787 | | | 17,217 | | | 17,382 | | | 14,359 | |
| Total liabilities | 53,416 | | | 45,725 | | | 43,030 | | | 44,037 | | | 39,982 | |
| Total shareholders’ equity | 33,199 | | | 31,728 | | | 28,541 | | | 26,503 | | | 25,101 | |
| | | | | | | | | | |
1The net assets of and results of operations for Beacon, America’s 1st Choice and HealthSun are included from their respective acquisition dates of February 28, 2020, February 15, 2018 and December 21, 2017, respectively.
2Operating revenue is obtained by adding premiums, product revenue, and administrative fees and other revenue.
3The benefit expense ratio represents benefit expenses as a percentage of premium revenue.
4The selling, general and administrative expense ratio represents selling, general and administrative expenses as a percentage of total operating revenue.
5Cash and investments is obtained by adding cash and cash equivalents, current and long-term fixed maturity securities and equity securities.
ITEM 7. MANAGEMENT’S DISCUSSION AND ANALYSIS OF FINANCIAL CONDITION AND RESULTS OF OPERATIONS.
(In Millions, Except Per Share Data or As Otherwise Stated Herein)
On May 18, 2022, our shareholders approved a proposal to amend our amended and restated articles of incorporation to change our name from Anthem, Inc. to Elevance Health, Inc. This amendment and name change went into effect on June 27, 2022. We began operating as Elevance Health, Inc. and trading under our new ticker symbol “ELV” on June 28, 2022. References to the terms “we,” “our,” “us,” “Elevance Health” or the “Company” used throughout this Management’s Discussion and Analysis of Financial Condition and Results of Operations (“MD&A”), should be read in conjunction with our audited consolidated financial statements included in Part II, Item 8 of this Annual Report on Form 10-K. References to the terms “we,” “our,” “us,” “Anthem” or the “Company” used throughout this MD&A refer to Anthem,Elevance Health, Inc., an Indiana corporation, and, unless the context otherwise requires, its direct and indirect subsidiaries. References to the “states” include the District of Columbia and Puerto Rico, unless the context otherwise requires.
This MD&A should be read in conjunction with our audited consolidated financial statements included in Part II, Item 8 of this Annual Report on Form 10-K.
This section of this Annual Report on Form 10-K generally discusses 20202022 and 20192021 items and year-over-year comparisons between 20202022 and 2019.2021. A detailed discussion of 20182020 items and year-over-year comparisons between 20192021 and 20182020 that are not included in this Annual Report on Form 10-K can be found in “Management’s Discussion and Analysis of Financial Condition and Results of Operations” in Part II, Item 7 of our Annual Report on Form 10-K for the year ended December 31, 2019.2021.
Overview
Elevance Health is a health company with the purpose of improving the health of humanity. We are one of the largest health benefits companiesinsurers in the United States in terms of medical membership, serving approximately 4347.5 million medical members through our affiliated health plans as of December 31, 2020.2022. We are an independent licensee of the Blue Cross and Blue Shield Association (“BCBSA”), an association of independent health benefit plans. We serve our members as the Blue Cross licensee for California and as the Blue Cross and Blue Shield (“BCBS”) licensee for Colorado, Connecticut, Georgia, Indiana, Kentucky, Maine, Missouri (excluding 30 counties in the Kansas City area), Nevada, New Hampshire, New York (in the New York City metropolitan area and upstate New York), Ohio, Virginia (excluding the Northern Virginia suburbs of Washington, D.C.) and Wisconsin. In a majority of these service areas, we do business as Anthem Blue Cross, Anthem Blue Cross and Blue Shield, and Empire Blue Cross Blue Shield or Empire Blue Cross. In addition, we conduct business through arrangements with other BCBS licensees as well as other strategic partners. Through our subsidiaries, we also serve customers in numerous states across the country as AIM Specialty Health, Amerigroup, Aspire Health, Beacon, CareMore, Freedom Health, HealthLink, HealthSun, MMM, Optimum HealthCare,Healthcare, Simply Healthcare, Unicare and/or UniCare. Also, in the second quarter of 2019, we began providingWellpoint. We offer pharmacy benefits management (“PBM”) services through our CarelonRx, Inc. (“CarelonRx”) subsidiary, which was known as IngenioRx, subsidiary.Inc. prior to January 1, 2023. We are licensed to conduct insurance operations in all 50 states, and the District of Columbia and Puerto Rico through our subsidiaries.
We manageAs part of our name change to Elevance Health, in June 2022, we announced that over the next several years we will organize our brand portfolio into the following core go-to-market brands:
•Anthem Blue Cross/Anthem Blue Cross and Blue Shield — represents our existing Anthem-branded and affiliated Blue Cross and/or Blue Shield licensed plans;
•Wellpoint — we intend to unite select non-BCBSA licensed Medicare, Medicaid and Commercial plans under the Wellpoint name; and
•Carelon — this brand brings together our healthcare-related services and capabilities, including our formerly named Diversified Business Group and IngenioRx businesses, under a single brand name.
In 2022, we managed our operations by customer type through four reportable segments: Commercial & Specialty Business, Government Business, IngenioRxCarelonRx (formerly known as IngenioRx) and Other. In 2019, IngenioRx wasAs we continue our journey to evolve our business from a traditional health insurance company into a lifetime, trusted health partner, we are evaluating and making changes to how we manage our business. This included a review of the products in each of our operating segments, which resulted in restructurings between some of our operating segments. Therefore, our reportable segment presentation in 2023
and its composition will reflect how we began managing our operations and monitoring performance, aligning strategies and allocating resources on January 1, 2023. As a result of these changes, beginning with our Quarterly Report on Form 10-Q for the first quarter of 2023, we will report our results in the following four reportable segments: (i) Health Benefits, which will combine our existing Commercial & Specialty Business and Government Business segments; (ii) our existing CarelonRx segment; (iii) Carelon Services (our former Diversified Business Group), which will be carved out from our existing Other segment; and (iv) Corporate and Other, which will include businesses that do not individually meet the quantitative thresholds for an operating segment, as well as corporate expenses not allocated to our other reportable segment. Amounts for 2019 have been reclassifiedsegments. We expect to reclassify previously reported information to conform to the current year presentationnew presentation.
Our results of operations discussed throughout this MD&A are determined in accordance with generally accepted accounting principles (“GAAP”). We also calculate operating gain and operating margin to further aid investors in understanding and analyzing our core operating results. Operating gain is calculated as total operating revenue less benefit expense, cost of products sold and selling, general and administrative expense. Operating margin is calculated as operating gain divided by operating revenue. Our definition of operating gain and operating margin may not be comparable to similarly titled measures reported by other companies. We use these measures as a basis for evaluating segment performance, allocating resources, forecasting future operating periods and setting incentive compensation targets. This information is not intended to be considered in isolation or as a substitute for income before income tax expense, net income or fully-diluted earnings per share (“EPS”) prepared in accordance with GAAP. For additional details on operating gain, see our “Reportable Segments Results of Operations” discussion included in this MD&A. For a reconciliation of reportable segments for comparability.segment operating revenue to the amounts of total revenue included in the consolidated statements of income and a reconciliation of reportable segment operating gain to income before income tax expense, see Note 20, “Segment Information,” of the Notes to Consolidated Financial Statements included in Part II, Item 8 of this Annual Report on Form 10-K.
Our operating revenue consists of premiums, product revenue, and administrative fees and other revenue. Premium revenue is generated from fully-insuredrisk-based contracts where we indemnify our policyholders against costs for covered health and life insurance benefits. Product revenue represents services performed by IngenioRxCarelonRx for unaffiliated PBM customers and includes ingredient costs (net of any rebates or discounts), including co-payments made by or on behalf of the customer, and administrative fees. Unaffiliated PBM customers include our self-fundedfee-based groups that contract with IngenioRxCarelonRx for PBM services and external customers outside of the health plans we own. Administrative fees and other revenue come from fees from our self-fundedfee-based customers for the processing of transactions or network discount savings realized, revenues from our Medicare processing business and revenues from other health-related businesses, including diseasecare management programs and miscellaneous other income.
Our benefit expense primarily includes costs of care for health services consumed by our fully-insuredrisk-based members, such as outpatient care, inpatient hospital care, professional services (primarily physician care) and pharmacy benefit costs. All four components are affected both by unit costs and utilization rates. Unit costs include the cost of outpatient medical procedures per visit, inpatient hospital care per admission, physician fees per office visit and prescription drug prices. Utilization rates represent the volume of consumption of health services and typically vary with the age and health status of our members and their social and lifestyle choices, along with clinical protocols and medical practice patterns in each of our markets. A portion of benefit expense recognized in each reporting period consists of actuarial estimates of claims incurred but not yet paid by
us. Any changes in these estimates are recorded in the period the need for such an adjustment arises. While we offer a diversified mix of managed care products and services through our managed care plans, our aggregate cost of care can fluctuate based on a change in the overall mix of these products and services. Our managed care plans include: Preferred Provider Organizations; Health Maintenance Organizations (“HMOs”);Organizations; Point-of-Service plans; traditional indemnity plans and other hybrid plans, including Consumer-Driven Health Plans; and hospital only and limited benefit products.
We classify certain quality improvement costs as benefit expense. Quality improvement activities are those designed to improve member health outcomes, prevent hospital readmissions and improve patient safety. They also include expenses for wellness and health promotion provided to our members. These quality improvement costs may be comprised of expenses incurred for: (i) medical management, including care coordination and case management; (ii) health and wellness, including disease management services for such conditions as diabetes, high-risk pregnancies, congestive heart failure and asthma management and wellness initiatives like weight-loss programs and smoking cessation treatments; and (iii) clinical health policy, such as identification and use of best clinical practices to avoid harm, identifying clinical errors and safety concerns, and identifying potential adverse drug interactions.
Our cost of products sold represents the cost of pharmaceuticals dispensed by IngenioRxCarelonRx for our unaffiliated PBM customers (net of rebates or discounts), including any co-payments made by or on behalf of the customer, per-claim administrative fees for prescription fulfillment and certain direct costs related to sales and administration of customer contracts.
Our selling, general and administrative expenses consist of fixed and variable costs. Examples of fixed costs are depreciation, amortization and certain facilities expenses. Certain variable costs, such as premium taxes, vary directly with premium volume. Commission expense generally varies with premium or membership volume. Other variable costs, such as salaries and benefits, do not vary directly with changes in premium but are more aligned with changes in membership. The acquisition or loss of a significant block of business would likely impact staffing levels and thus, associated compensation expense. Other variable costs include professional and consulting expenses and advertising. Other factors can impact our administrative cost structure, including systems efficiencies, inflation and changes in productivity.
Our results of operations depend in large part on our ability to accurately predict and effectively manage healthcare costs through effective contracting with providers of care to our members, product pricing, medical management and health and wellness programs, innovative product design and our ability to maintain or achieve improvement in our CMSCenters for Medicare and Medicaid Services Star ratings. Several economic factors related to healthcare costs, such as regulatory mandates of coverage as well as direct-to-consumer advertising by providers and pharmaceutical companies, have a direct impact on the volume of care consumed by our members. The potential effect of escalating healthcare costs, any changes in our ability to negotiate competitive rates with our providers and any regulatory or market-driven restrictions on our ability to obtain adequate premium rates to offset overall inflation in healthcare costs, including increases in unit costs and utilization resulting from the aging of the population and other demographics, the impact of epidemics and pandemics, as well as advances in medical technology, may impose further risks to our ability to profitably underwrite our business and may have a material adverse impact on our results of operations.
We intend to expand through a combination of organic growth, strategic acquisitions and efficient use of capital in both existing and new markets. Our growth strategy is designed to enable us to take advantage of additional economies of scale, as well as provide us access to new and evolving technologies and products. In addition, we believe geographic and product diversity reduces our exposure to local or regional regulatory, economic and competitive pressures and provides us with increased opportunities for growth. We use our subsidiary CarelonRx (formerly IngenioRx) to market and offer PBM services, and we expect CarelonRx to continue to improve our ability to integrate pharmacy benefits within our medical and specialty platform. We continued growing our government-sponsored business through organic growth and the acquisitions of MMM Holdings, LLC (“MMM”) in 2021 and Integra MLTC, Inc. (“Integra”) in 2022. In all other markets, we intend to maintain our position by delivering excellent service, offering competitively priced products, providing access to high-quality provider networks and effectively capitalizing on the brand strength of the Blue Cross and Blue Shield names and marks.
For additional information about our business and reportable segments, see Part I, Item 1, “Business” and Note 20, “Segment Information” of the Notes to Consolidated Financial Statements included in Part II, Item 8 of this Annual Report on Form 10-K.
COVID-19
In March 2020, the World Health Organization declared the outbreak of a novel strain of coronavirus (“COVID-19”) a global health pandemic. At the onset of the pandemic, to prevent its spread, most states issued shelter-in-place or stay-at-home orders, which generally required the businesses not considered essential to close their physical offices. While these orders were largely lifted during the second quarter of 2020, many states and local authorities continued to impose certain restrictions on the conduct of businesses and individuals.
The COVID-19 pandemic continues to evolve, and the virus and mitigation efforts have continued to impact the global economy, cause market instability, increase unemployment and putputting pressure on the healthcare system. The COVID-19 pandemicsystem, and it has impacted, and willmay continue to impact, our membership, and benefit expense and has influenced and will likely continue to influence member behavior, impacting how members access healthcare services. Although increased unemployment caused by the COVID-19 pandemic resulted in a decline in our Local Group membership, our Medicaid
membership grew as a resultbehavior. The full extent of the temporary suspension of eligibility recertification efforts in response to the COVID-19 pandemic. While reduced or cancelled utilization of non-COVID-19 health services by our members decreased our claim costs overall in 2020, in the second half of 2020 utilization of such services began to rebound, and non-COVID-19 claim costs began to normalize as the shelter-in-place, stay-at-home orders and other restrictions on the conduct of businesses were lifted. Our expenses in 2020 included additional costs to cover COVID-19 related testing, treatment, expanded coverage of insurance benefits, waivers for cost-sharing and actions to support our providers. Furthermore, our expenses associated with COVID-19, including testing and treatment and the actions taken to support our members in response to the pandemic, accelerated in the fourth quarter of 2020 and exceeded the benefit we experienced during the quarter from the lower volume of healthcare claims attributable to decreased utilization of non-COVID-19 health services.
We remain focused on increasing access and coverage for our members and made several changes to our membership benefits and business operations, adopted tools and policies to assist consumers and care providers and provided support to our associates and our local communities, which were discussed in Part I, Item 1, “Business — COVID-19,” of this Annual Report on Form 10-K. Further, during 2020 we proactively took several actions to preserve our liquidity and financial flexibility and minimize the effectsimpact of the COVID-19 pandemic including:
•Borrowing under our senior revolving credit facility in March 2020, which was repaid in April 2020;
•Delaying certain tax payments as permitted by the IRS and the Coronavirus Aid, Relief, and Economic Security Act (the “CARES Act”); and
•Temporarily suspending our share repurchase activity in March 2020, which was resumed in late June 2020.
The COVID-19 pandemic has created unique and unprecedented challenges, and although it has impacted and will likely continue to impact our membership and benefit expense, it did not have a material adverse effect on our reported results in 2020. However, this may change in the future as the COVID-19 pandemic is evolving, and the extent of its impact will depend on future developments, which are highlyremain uncertain and cannot be predicted at this time. We will continue to monitor the COVID-19 pandemic as well as resulting legislative and regulatory changes that may impactto manage our response and assess and mitigate potential adverse impacts to our business. For additional discussion regarding the impact of and our risks and trends related to the COVID-19 pandemic, see “Business Trends” and our other risk factors, see Part I, Item 1A, “Risk Factors” in this Annual Report on Form 10-K and “Business Trends” in this MD&A.10-K.
Business Trends
The Patient Protection and Affordable Care Act andIn 2022, we made the Health Care and Education Reconciliation Act of 2010, as amended (collectively,decision to modestly expand our participation in the “ACA”Individual state- or federally-facilitated marketplaces (the “Public Exchange”), has changed and may continue to make broad-based changes to the U.S. healthcare system. We expect the ACA will continue to impact our business model and strategy. Also, the legal challenges regarding the ACA, including for 2023 after also expanding in 2022. As a federal district court decision invalidating the ACA, which was argued before the U.S. Supreme Court in November 2020 and has been stayed pending the U.S. Supreme Court’s decision, could significantly disrupt our business. We currently offerresult, for 2023 we are offering Individual ACA-compliantPublic Exchange products in 103138 of the 143 rating regions in which we operate. operate, in comparison to 122 of 143 rating regions in 2022.Our strategy has been, and will continue to be, to only participate in rating regions where we have an appropriate level
of confidence that these markets are on a path toward sustainability, including, but not limited to, factors such as expected financial performance, regulatory environment and underlying market characteristics. Changes to our business environment are likely to continue as elected officials at the national and state levels continue to enact, and both elected officials and candidates for election continue to propose, significant modifications to existing laws and regulations, including changes to taxes and fees. In addition, the continuing growth in our government-sponsored business exposes us to increased regulatory oversight.
In the second quarter of 2019, we began using IngenioRx to marketOur CarelonRx subsidiary markets and offeroffers PBM services to our affiliated health plan customers throughout the country, as well as to customers outside of the health plans we own. Our comprehensive PBM services portfolio includes features such as formulary management, pharmacy networks, a prescription drug database, member services and mail order capabilities. IngenioRxCarelonRx delegates certain PBM administrative functions, such as claims processing and prescription fulfillment, to CaremarkPCS Health, L.L.C., which is a subsidiary of CVS Health Corporation, pursuant to a five-year agreement.agreement that is set to terminate on December 31, 2024. With IngenioRx,CarelonRx, we retain the responsibilities for clinical and formulary strategy and development, member and employer experiences, operations, sales, marketing, account management and retail network strategy. From December 2009 through December 2019, we delegated certain PBM functions and administrative services to Express Scripts, Inc. (“Express Scripts”). We began transitioning existing members from Express Scripts to IngenioRx in the second quarter of 2019, and completed the transition of all of our members by January 1, 2020.
Pricing Trends: We strive to price our healthcarehealth benefit products consistent with anticipated underlying medical cost trends. We continue to closely monitor the COVID-19 pandemic (including new COVID-19 variants, which may be more contagious or severe, or less responsive to treatment or vaccines) and the impacts it may have on our pricing, such as surges
in COVID-19 related hospitalizations, infection rates, and the cost of COVID-19 vaccines.vaccines, testing and treatment and the return of non-COVID-19 healthcare utilization to our estimate of normal levels, based on historical utilization patterns. We frequently make adjustments to respond to legislative and regulatory changes as well as pricing and other actions taken by existing competitors and new market entrants. Product pricing in our Commercial & Specialty Business segment including our Individual and Small Group lines of business, remains competitive. Revenues from the Medicare and Medicaid programs are dependent, in whole or in part, upon annual funding from the federal government and/or applicable state governments. The ACAPatient Protection and Affordable Care Act (the “ACA”) imposed an annual Health Insurance Provider Fee (“HIP Fee”) on health insurers that write certain types of health insurance on U.S. risks. We priced our affected products to cover the impact of the HIP Fee when it was in effect. The HIP Fee was suspended for 2019, was resumedin effect for 2020 and has beenbut was permanently repealed beginning in 2021.
Medical Cost Trends: Our medical cost trends are primarily driven by increases in the utilization of services across all provider types and the unit cost increases of these services. We work to mitigate these trends through various medical management programs such as utilization management,care and condition management, program integrity and specialty pharmacy management and utilization management, as well as benefit design changes. There are many drivers of medical cost trends that can cause variance from our estimates, such as changes in the level and mix of services utilized, regulatory changes, aging of the population, health status and other demographic characteristics of our members, epidemics, pandemics, advances in medical technology, new high cost prescription drugs, provider contracting inflation, labor costs and healthcare provider or member fraud. Our underlying Local Group medical cost trends reflect
At its onset, the “allowed amount,” or contractual rate, paid to providers.
The COVID-19 pandemic has caused a decrease in utilization of non-COVID-19 health services, which decreased our claim costs in 2020. WhileAs the pandemic continued through 2021, our non-COVID-19 healthcare utilization experience gradually increased and largely normalized, and our COVID-19 related healthcare expenses increased as new variants (Delta and Omicron) emerged and vaccinations and boosters became available.
The Omicron variant increased confirmed COVID-19 cases to significant levels at the end of such services began2021 and the beginning of 2022. The COVID-19 surge quickly declined during the first quarter of 2022, with COVID-19 inpatient hospitalizations, provider-based tests, visits and vaccinations all decreasing to rebound and claimlower levels by the end of the first half of 2022; concurrently, non-COVID-19 healthcare utilization recovered from lower levels earlier in the year. Omicron sub-variant viruses as well as costs began to normalizeassociated with updated bivalent vaccinations drove modest increases in COVID-19 related healthcare expenses in the second half of 2020, further increases2022, but the expected paid claims impact for the second half of 2022 are significantly lower than the winter surge experienced in each of the utilization of such services may increase our claim costs in the future and affect our medical cost trends. Our expenses in 2020 include additional costs to cover COVID-19 related testing, treatment, expanded benefits coverage and waivers for cost-sharing. In response to the current crisis, we expanded coverage for certain members in our affiliated health plans for testing and treatment related to a COVID-19 diagnosis. Governmental action has required us to provide full coverage for COVID-19 testing to our members, and future governmental action could require us to provide additional coverage, including, for example, vaccines. Increased member demand for care, along with continued COVID-19 care, testing and vaccination costs, are expected to result in increased future medical costs.prior two years. The continuedongoing cost and volume of covered services related to the COVID-19 pandemic and a future shift of government supplied vaccinations and treatments to privatized, full cost price points may have a materialan adverse effect on our future claim costs. We continue to closely monitor the COVID-19 pandemic and its impacts on our business, financial condition, results of operations and medical cost trends.
For additional discussion regarding business trends, see Part I, Item 1, “Business” of this Annual Report on Form 10-K.
Regulatory Trends and Uncertainties
FederalWith the declaration of COVID-19 as a public health emergency (“PHE”), the federal and state legislation has beengovernments enacted, and is likely tomay continue to be enacted,enact, legislation and regulations in response to the COVID-19 pandemic that hashave had, and we expect will continue to have, a significant impact on health benefits, consumer eligibility for public programs and our cash flows for all of our lines of business includingand which have introduced increased uncertainty around our cost structure. These actions, which are or have been in effect for various durations, provide, among other things: mandates to waive cost-sharing onfor COVID-19 testing, treatmentvaccines and related services; financial support to healthcare providers; and mandates related to prior authorizations, payment levels to providers, consumer enrollment windows and telehealth services. The federal government enactedBiden administration renewed the Coronavirus PreparednessPHE on January 11, 2023 and Response Supplemental Appropriations Act,has indicated that they intend for the Families First Coronavirus Response Act and the CARES Act in March 2020, the Paycheck Protection Program and Health Care Enhancement Act in April 2020 andPHE to expire on May 11, 2023.
Under the Consolidated Appropriations Act of 20212023 (the “2023 Appropriations Act”), Congress decoupled Medicaid eligibility recertification from the PHE. As a result, states may begin removing ineligible beneficiaries from their Medicaid programs starting April 1, 2023. When recertifications resume, we expect a decline in our Medicaid membership. At the same time, we expect growth in our Commercial risk-based and fee-based plans and Medicare, including through the Public Exchanges, as members exiting Medicaid in our 14 Commercial states seek coverage elsewhere.
The Inflation Reduction Act of 2022, which was signed into law in August 2022, contains a variety of provisions that impact our business including an extension of the American Rescue Plan Act of 2021's enhanced Premium Tax Credits (“PTC”) through 2025; imposing a new corporate alternative minimum tax; providing a one percent excise tax on repurchases of stock made after December 2020 (the “Appropriations Act”31, 2022; allowing the Centers for Medicare and Medicaid Services (“CMS”). These acts provide, among other things, prohibitions to negotiate prices on prior authorizationa limited set of prescription drugs in Medicare Parts B and cost-sharing for certain itemsD beginning in 2026; instituting caps on insulin cost sharing in Medicare Parts B and services related to COVID-19 tests, reforms including waiving Medicare originating site restrictions for qualified providers providing telehealth services, financial support to healthcare providers, including expansionD; redesigning of the Medicare accelerated payment programPart D benefit; adding a requirement that drug manufacturers pay rebates if prices increase beyond inflation; and delaying the implementation of the Trump Administration Medicare drug rebate rule to all providers receiving Medicare payments,2032. The extension of the enhanced PTC will likely allow for growth in Individual exchange market enrollment as Medicaid eligibility recertifications resume, supporting continuity of coverage for more people.
The Consolidated Appropriations Act of 2021 (the “2021 Appropriations Act”) has impacted and funding to replenish and administer small business loan programs to help small businesses keep their workers employed and healthcare benefits covered in the group market.
The Appropriations Act contains a number of provisions thatfuture may have a material effect upon our business, including procedures and coverage requirements related to surprise medical bills and new mandates for continuity of care for certain patients, price comparison tools, disclosure of broker compensation, mental health parity reporting and reporting on pharmacy benefits and drug costs. The various health plan-related requirements of the 2021 Appropriations Act will go into effect on January 1,applicable to us have varying effective dates, some of which were effective in December 2021 and during 2022, and our first report on pharmacy benefits and drug costs is due December 27, 2021.
Regulatory changesothers of which have also been enacted, and are likely to continue to be enacted, atextended into 2023 since the state and federal level in response toenactment of the COVID-19 pandemic. Those changes, which could have a significant impact on health benefits, consumer
eligibility for public programs, and our cash flows, include mandated expansion of premium payment terms including the time period for which claims can be denied for lack of payment, mandates related to prior authorizations and payment levels to providers, additional consumer enrollment windows, and an increased ability to provide services through telehealth. We are providing extensions to premium payment terms in certain situations and working closely with state regulators that are mandating or requesting such relief.2021 Appropriations Act.
The health plan price transparency regulations issued in October 2020 by the U.S. Departments of Health and Human Services, Labor and Treasury required us to begin disclosing in July 2022, on a monthly basis, detailed pricing information regarding negotiated rates for all covered items and services between the plan or issuer and in-network providers and historical payments to, and billed charges from, out-of-network providers. Additionally, beginning in 2023, we are now required to make available to members personalized out-of-pocket cost information and the underlying negotiated rates for 500 covered healthcare items and services, including prescription drugs. In 2024, this requirement will expand to all items and services.
Since its enactment in 2010, the ACA presented us with new growth opportunities, but alsohas introduced new risks, regulatory challenges and uncertainties, has impacted our business model and strategy and has required changes in the way our products are designed, underwritten, priced, distributed and administered. ChangesWe expect the ACA will continue to significantly impact our business environmentand results of operations, including pricing, minimum medical loss ratios and the geographies in which our products are likelyavailable. We also expect further and ongoing regulatory guidance on a number of issues related to continue as elected officials at the nationalMedicare, including evolving methodology for ratings and state levels continue to enact, and both elected officials and candidates for election continue to propose, significant modifications to existing laws and regulations, includingquality bonus payments. CMS also frequently proposes changes to taxes and fees. In addition, the legal challenges regarding the ACA, including a federal district court decision invalidating the ACA in its entirety, which was argued before the U.S. Supreme Court in November 2020 and has been stayed pending the U.S. Supreme Court’s decision, continue to contribute to this uncertainty. In a separate development, in April 2020, the U.S. Supreme Court ruledprogram that the federal government is required to pay health insurance companies for amounts owed, as calculatedaudits data submitted under the risk corridor program of the ACA. In June 2020, the U.S. Court of Federal Claims entered a final judgment stipulatingadjustment programs in ways that we are entitled to reimbursement for risk corridor amountscould increase financial recoveries from 2014, 2015 and 2016. At the end of December 2020, the U.S. Department of Health and Human Services (“HHS”) issued final guidance on how to treat the risk corridor recoveries that we expect to receive. Based on the guidance from HHS, we revised previously filed minimum medical loss ratio (“MLR”) reports and recognized the net premium impact of the risk corridor recoveries in the fourth quarter of 2020.plans. We will continue to evaluate the impact of the ACA as any further developments or judicial rulings occur.
The annual HIP Fee, which has been permanently eliminated beginning in 2021, was allocated to health insurers based on the ratio of the amount of an insurer’s net premium revenues written during the preceding calendar year to the amount of health insurance premium for all U.S. health risk for those certain lines of business written during the preceding calendar year. The HIP Fee was non-deductible for federal income tax purposes. Our affected products were priced to cover the increased selling, general and administrative and income tax expenses associated with the HIP Fee when applicable. The HIP Fee was suspended for 2019. For 2020, the HIP Fee resumed and the total amount due from allocations to health insurers was $15,523. For the year ended December 31, 2020, we recognized $1,570 as selling, general and administrative expense related to the HIP Fee. There was no corresponding expense for 2019 due to the suspension of the HIP Fee for 2019. The HIP Fee has been permanently eliminated beginning in 2021.
As a result of the ACA, the HHS issued MLR regulations that require us to meet minimum MLR thresholds of 85% for Large Group and 80% for Small Group and Individual lines of business. Plans that do not meet the minimum thresholds have to pay a MLR rebate. For purposes of determining MLR rebates, HHS has defined the types of costs that should be included in the MLR rebate calculation. However, certain components of the MLR calculation as defined by HHS cannot be classified consistently under U.S. generally accepted accounting principles (“GAAP”). While considered benefit expense or a reduction of premium revenue by HHS, certain of these costs are classified as other types of expense, such as selling, general and administrative expense or income tax expense, in our GAAP basis financial statements. Accordingly, the benefit expense ratio determined using our consolidated GAAP operating results is not comparable to the MLR calculated under HHS regulations.
The ACA also imposed a separate minimum MLR threshold of 85% for Medicare Advantage and Medicare Part D prescription drug plans (“Medicare Part D”). Medicare Advantage or Medicare Part D plans that do not meet this threshold have to pay an MLR rebate. If a plan’s MLR is below 85% for three consecutive years, enrollment is restricted. A Medicare Advantage or Medicare Part D plan contract will be terminated if the plan’s MLR is below 85% for five consecutive years.
For additional discussion regarding regulatory trends and uncertainties, and risk factors that could cause actual results to differ materially from those contained in forward-looking statements made in this Annual Report on Form 10-K, see Part I, Item 1, “Business — Regulation”Regulation” and Part I, Item 1A, “Risk Factors.”
Other Significant Items
Business and Operational Matters
As mentioned above, we began operating as Elevance Health on June 28, 2022. This name change is intended to better reflect our business and our journey from a traditional health benefits organization to a lifetime, trusted health partner. Elevance Health supports health at every stage, offering health plans and clinical, behavioral, pharmacy and complex-care solutions that promote whole health.
On February 2, 2021,January 23, 2023, we announced our entrance into an agreement to acquire Louisiana Health Service & Indemnity Company, d/b/a Blue Cross and Blue Shield of Louisiana, an independent licensee of the BCBSA that provides healthcare plans to the Individual, Group, Medicaid and Medicare markets, primarily in the State of Louisiana. This acquisition aligns with our vision to be an innovative, valuable, and inclusive healthcare partner by providing care management programs that improve the lives of the people we serve. The acquisition is expected to close by the end of the fourth quarter of 2023 and is subject to standard closing conditions and customary approvals.
On November 9, 2022, we announced our entrance into an agreement with InnovaCare Health, L.P.CarepathRx Aggregator, LLC to acquire its Puerto Rico-based subsidiaries, including MMM Holdings,specialty pharmacy division, which includes BioPlus Parent, LLC (“MMM”BioPlus”) and subsidiaries. BioPlus is one of the largest independent specialty pharmacy organizations in the United States and seeks to connect payors and providers of specialty pharmaceuticals to meet the medication therapy needs of patients with complex medical conditions. This acquisition aligns with our vision to be an innovative, valuable and inclusive healthcare partner by providing care management programs that improve the lives of the people we serve. The acquisition closed on February 15, 2023, and initial purchase accounting has not been finalized.
On May 5, 2022, we completed our acquisition of Integra. Integra is a managed long-term care plan that serves New York state Medicaid members, enabling adults with long-term care needs and disabilities to live safely and independently in their own homes.
On June 29, 2021, we completed our acquisition of MMM, including its Medicare Advantage plan, MMM Healthcare, LLC, Medicaid plan and other affiliated companies. MMM is ana Puerto Rico-based integrated healthcare organization and seeks to provide its Medicare Advantage and Medicaid members with a whole health experience through its network of specialized clinics and wholly owned independent physician associations. This acquisition aligns with our vision to be an innovative, valuable and inclusive healthcare partner by providing care management programs that improve the lives of the people we serve. The
On April 28, 2021, we completed our acquisition of myNEXUS, Inc. (“myNEXUS”). myNEXUS is expecteda comprehensive home-based nursing management company for payors and, at the time of acquisition, delivered integrated clinical support services for Medicare Advantage members across twenty states. This acquisition aligns with our strategy to closemanage integrated, whole person multi-site care and support by providing national, large-scale expertise to manage nursing services in the endhome and facilitate transitions of care.
For additional information, see Note 3, “Business Acquisitions,” of the second quarterNotes to Consolidated Financial Statements included in Part II, Item 8 of 2021 and is subject to standard closing conditions and customary approvals.this Annual Report on Form 10-K.
In 2020, we introduced enterprise-wide initiatives to optimize our business and as a result, recorded a charge of $653 in selling, general and administrative expenses. We believe these initiatives largely represent the next step forward in our progression towards becoming a more agile organization, including process automation and a reduction in our office space footprint. In the fourth quarters of 2022 and 2021, we identified additional office space reductions and related fixed asset impairments due to the continuing COVID-19 pandemic and recorded net charges of $39 and $202, respectively, in selling, general and administrative expenses. For additional information, see Note 4, “Business Optimization Initiatives” and Note 18, “Leases,” of the Notes to Consolidated Financial Statements included in Part II, Item 8 of this Annual Report on Form 10-K.
On February 28, 2020, we completed our acquisition of Beacon Health Options, Inc. (“Beacon”), the largest independently held behavioral health organization in the country. At the time of acquisition, Beacon served more than thirty-four million individuals across all fifty states. This acquisition aligned with our strategy to diversify into health services and deliver both integrated solutions and care delivery models that personalize care for people with complex and chronic conditions. For additional information, see Note 3, “Business Acquisitions,” of the Notes to Consolidated Financial Statements included in Part II, Item 8 of this Annual Report on Form 10-K.
In February 2018, we completed our acquisition of Freedom Health, Inc., Optimum HealthCare, Inc., America’s 1st Choice of South Carolina, Inc. and related entities. This Medicare Advantage organization offers HMO products, including Chronic Special Needs Plans and Dual-Eligible Special Needs Plans, under its Freedom Health and Optimum HealthCare brands in Florida and its America’s 1st Choice of South Carolina brand in South Carolina. This acquisition aligned with our plans for continued growth in the Medicare Advantage and Special Needs populations.
Other significant transactions in recent years that have impacted or will impact our capital structure or that have influenced or will influence how we conduct our business operations include our Board of Directors’ declarations of dividends on our common stock, repurchases of our common stock, debt repurchases and new debt issuances (2020 and prior). For additional information regarding these transactions, see Note 13, “Debt” and Note 15, “Capital Stock,” of the Notes to Consolidated Financial Statements included in Part II, Item 8 of this Annual Report on Form 10-K.
Litigation Matters
In the consolidated multi-district proceeding in the United States District Court for the Northern District of Alabama (the “Court”) captioned In re Blue Cross Blue Shield Antitrust Litigation (“BCBSA Litigation”), the Blue Cross Blue Shield Association (the “BCBSA”),BCBSA and Blue Cross and/or Blue Shield licensees, including us (the “Blue plans”) havepreviously approved a settlement agreement and release (the “Subscriber Settlement Agreement”) with the
plaintiffs representing a putative nationwide class of health plan subscribers.subscribers (the “Subscriber Settlement Agreement”), which agreement required the Court’s approval to become effective. Generally, the lawsuits in the BCBSA Litigation challenge elements of the licensing agreements between the BCBSA and the independently owned and operated Blue plans. The cases were brought by two putative nationwide classes of plaintiffs, health plan subscribers and providers, and theproviders. The Subscriber Settlement Agreement applies only to the putative subscriber class. No settlement agreement has been reached with the provider plaintiffs at this time, and theThe defendants continue to contest the consolidated cases brought by the provider plaintiffs.
If approved by the Court, the Subscriber Settlement Agreement will require the defendants to make a monetary settlement payment, our portion of which is estimated to be $594, and will contain certain non-monetary terms including (i) eliminating the “national best efforts” rule in the BCBSA license agreements (which rule limits the percentage of non-Blue revenue permitted for each Blue plan) and (ii) allowing for some large national employers with self-funded benefit plans to request a bid for insurance coverage from a second Blue plan in addition to the local Blue plan. We recognized our estimated payment obligation of $548, net of third-party insurance coverage received as of December 31, 2020.
On November 30, 2020,In August 2022, the Court issued ana final order preliminarily approving the Subscriber Settlement Agreement following which members of the Subscriber class were provided notice of the Settlement Agreement and an opportunity to opt out of the class. All terms of(the “Final Approval Order”). In compliance with the Subscriber Settlement Agreement, are subject to final approvalthe Company paid $506 into an escrow account in September 2022, for an aggregate and full settlement payment by the Court before they become effective. Objections toCompany of $596, which was previously accrued in 2020. Four notices of appeal of the settlement as well as the deadline for those that wish to opt-out from the settlement must be submitted by July 28, 2021. Claims must beFinal Approval Order were filed by November 5, 2021. A final approval hearing has been scheduledthe September 2022 appeal deadline. Those appeals are proceeding in the United States Court of Appeals for October 20, 2021. If the Court grants approval ofEleventh Circuit. In the Subscriber Settlement Agreement, and afterevent all appellate rights have expired or have beenare exhausted in a manner that affirms the Court’s final order and judgment,Final Approval Order, the defendants’ payment and non-monetary obligations under the Subscriber Settlement Agreement will become effective.effective and the funds held in escrow will be distributed in accordance with the Subscriber Settlement Agreement. For additional information regarding this lawsuit,the BCBSA Litigation, see Note 14, “Commitments and Contingencies -– Litigation and Regulatory Proceedings – Blue Cross Blue Shield Antitrust Litigation,” of the Notes to Consolidated Financial Statements included in Part II, Item 8 of this Annual Report on Form 10-K.
In August 2020, the Delaware Court of Chancery ruled that neither we nor Cigna Corporation could collect damages in connection with the now terminated Agreement and Plan of Merger, between us and Cigna Corporation. Cigna filed a notice of appeal in November 2020 challenging the trial court’s opinion that Anthem did not owe Cigna a termination fee. Cigna filed its appellate brief in December 2020, and we filed a response in January 2021. For additional information, see Note 14, “Commitments and Contingencies - Litigation and Regulatory Proceedings - Cigna Corporation Merger Litigation,” of the Notes to Consolidated Financial Statements included in Part II, Item 8 of this Annual Report on Form 10-K.
In January 2019, we exercised our contractual right to terminate our PBM Agreement with Express Scripts (the “ESI PBM Agreement”) and we completed the transition of our members from Express Scripts to IngenioRx by January 1, 2020. Notwithstanding our termination of the ESI PBM Agreement, the litigation between us and Express Scripts regarding the ESI PBM Agreement continues. For additional information regarding this lawsuit, see Note 14, “Commitments and Contingencies - Litigation and Regulatory Proceedings - Express Scripts, Inc. Pharmacy Benefit Management Litigation,” of the Notes to Consolidated Financial Statements included in Part II, Item 8 of this Annual Report on Form 10-K.
Selected Operating Performance
During the year ended December 31, 2020,2022, total medical membership increased by 1.9,2.2 million, or 4.7%4.8%. Our medical membership grew in both our Government Business and Commercial & Specialty Business segments. The increase in medical membership was driven primarily by organic growth in our Government Business segment wasprimarily driven by organic growth in our Medicaid business due to the continued temporary suspension of Medicaid eligibility recertification efforts in our markets in response toduring the COVID-19 pandemic, as well as acquisitions, andorganic growth in our Medicare business. The increase in medical membership in our Commercial & Specialty Business segment, was primarily driven by growthand in particular in our self-funded business, partially offset by declines in our fully-insured Local Group membership due to negative in-group changes as a result of increased unemployment caused by the COVID-19 pandemic.fee-based membership.
Operating revenue for the year ended December 31, 20202022 was $120,808,$155,660, an increase of $17,667,$18,717, or 17.1%13.7%, from the year ended December 31, 2019.2021. The increase in operating revenue was primarily driven by higher premium revenue in our GovernmentMedicaid business due to organic membership growth from the continued temporary suspension of Medicaid eligibility recertification during the COVID-19 pandemic, the acquisition of Integra in the second quarter of 2022 and the acquisition of Ohio Medicaid members through the purchase of a Medicaid contract in the first quarter of 2022. Membership growth in our Medicare Advantage and Commercial & Specialty Business segment,risk-based businesses, as well as premium rate increases to cover medical cost trends, also generated higher premium revenue. Finally, the increase in operating revenue was further attributable to increased pharmacy product revenue related to the launch of IngenioRx.in our CarelonRx segment, resulting from growth in membership and higher script volume.
Net income for the year ended December 31, 20202022 was $4,572,$6,019, a decrease of $235,$76, or 4.9%1.2%, from the year ended December 31, 2019.2021. The decrease in net income was a result of lower operating resultsprimarily due to realized losses on financial instruments in our Commercial & Specialty Business segment, which was largely driven by costs associated with actions taken2022, as compared to support our membersgains in 2021, and providersincreased intangible amortization in response to the COVID-19 pandemic and costs for COVID-19 related care, as well as our estimated payment obligation2022 related to recent acquisitions and the BCBSA Litigation and expenses relatedrebranding of our products, as we expect to retire certain trade names in the future. These items were partially offset by operating gain increases in all of our business optimization initiatives recognized in 2020, higher income tax expense, and a decrease in net earnings from investment activities. These decreases in net income were largely offset by higher operating results in our IngenioRx and Government Business segments.
Our fully-diluted shareholders' earnings per share (“EPS”) for the year ended December 31, 2020 were $17.98, a decrease2022 was $24.81, an increase of $0.49,$0.08, or 2.7%0.3%, from the year ended December 31, 2019.2021. Our diluted shares for the year ended December 31, 20202022 were 254.3,242.8, a decrease of 6.0,4.0, or 2.3%1.6%, compared to the year ended December 31, 2019.2021. The decreaseincrease in EPS resulted from lower average shares outstanding in 2022, partially offset by the decrease in net income, partially offset by the impact of a lower number of shares outstanding in 2020.
Operating cash flow for the year ended December 31, 20202022 was $10,688,$8,399, or approximately 2.31.4 times net income. Operating cash flow for the year ended December 31, 20192021 was $6,061,$8,364, or approximately 1.31.4 times net income. The slight increase in operating cash flow was primarily due to higher net income in 2022, when adjusted for the impact of investment losses and gains, partially offset by the timing of working capital changes. The increase was further due to membership growth in our Government Business segment and higher net income in 2020, excluding the non-cash impact of accrued expenses related to our business optimization initiativeschanges and the BCBSA Litigation.
Our results of operations discussed throughout this MD&A are determined in accordance with GAAP. We also calculate operating gain to further aid investors in understanding and analyzing our core operating results. We define operating revenue as premium income, product revenue and administrative fees and other revenue. Operating gain is calculated as total operating revenue less benefit expense, cost of products sold and selling, general and administrative expense. We use these measures as a basis for evaluating segment performance, allocating resources, forecasting future operating periods and setting incentive compensation targets. This information is not intended to be considered in isolation or as a substitute for income before income tax expense, net income or EPS prepared in accordance with GAAP, and may not be comparable to similarly titled measures reported by other companies. For additional details on operating gain, see our “Reportable Segments Results of Operations” discussion included in this MD&A. For a reconciliation of reportable segment operating revenuepayment pursuant to the amounts of total revenue includedSubscriber Settlement Agreement made in the consolidated statements of income and a reconciliation of reportable segment operating gain to income before income tax expense, see Note 20, “Segment Information,” of the Notes to Consolidated Financial Statements included in Part II, Item 8 of this Annual Report on Form 10-K.September 2022.
We intend to expand through a combination of organic growth, strategic acquisitions and efficient use of capital in both existing and new markets. Our growth strategy is designed to enable us to take advantage of additional economies of scale, as well as providing us access to new and evolving technologies and products. In addition, we believe geographic and product diversity reduces our exposure to local or regional regulatory, economic and competitive pressures and provides us with increased opportunities for growth. In 2019, we began using IngenioRx to market and offer PBM services, and we expect IngenioRx to improve our ability to integrate pharmacy benefits within our medical and specialty platform. In 2020, we continued growing our government-sponsored business. In all other markets, we intend to maintain our position by delivering excellent service, offering competitively priced products, providing access to high-quality provider networks and effectively capitalizing on the brand strength of the Blue Cross and Blue Shield names and marks.
Membership
Our medical membership includes seven differentthe following customer types: LocalIndividual, Group Individual, National Accounts,risk-based, Group fee-based, BlueCard®, Medicare, Medicaid and our Federal Employees Health Benefits (“FEHB”) Program. BCBS-branded business generally refersWe refer to members in our service areas licensed by the BCBSA.BCBSA as our BCBS-branded, or Anthem BCBS, business. Non-BCBS-branded business refers to members in our non-BCBS-branded, or Wellpoint plans, which include Amerigroup, Freedom Health, HealthSun, MMM, Optimum HealthCareHealthcare and Simply Healthcare plans, as well as Beacon, HealthLink and UniCare members. In addition to the above medical membership, we also serve customers who purchase one or more of our other products or services that are often ancillary to our health business.
•Individual consists of individual customers under age 65 and their covered dependents. Individual policies are generally sold through independent agents and brokers, retail partnerships, our in-house sales force or via the Public Exchanges. Individual business is sold on a risk-based basis. We offer on-exchange products through Public Exchanges and off-exchange products. Federal premium subsidies are available only for certain Public Exchange Individual products. Unsubsidized Individual customers are generally more sensitive to product pricing and, to a lesser extent, the configuration of the network and the efficiency of administration. Customer turnover is generally higher with Individual as compared to Group risk-based. Individual business accounted for 1.7%, 1.7% and 1.6% of our medical members at December 31, 2022, 2021 and 2020, respectively.
•Group risk-based consists of employer customers who purchase products on a full-risk basis, which are products for which we charge a premium and indemnify our policyholders against costs for health benefits. Group risk-based accounts include Local Group customers and National Accounts. Local Group consists of those employer customers with less than 5% of eligible employees located outside of the headquarter state, as well as customers with more than 5% of eligible employees located outside of the headquarter state with up to 5,000 eligible employees. In addition, Local Group includes Student Health and UniCare members. Local Group accounts are generally sold through brokers or consultants who work with industry specialists from our in-house sales force and are offered both on and off the public exchanges. Local Group insurance premiums may be based on claims incurred by the group or sold on a self-insured basis. The customer’s buying decision is typically based upon the size and breadth of our networks, customer service, the quality of our medical management services, the administrative cost included in our quoted price, our financial stability, our reputation and our ability to effectively service large complex accounts. Local Group accounted for 36.4%, 38.2% and 39.4% of our medical members at December 31, 2020, 2019 and 2018, respectively.
•Individual consists of individual customers under age 65 and their covered dependents. Individual policies are generally sold through independent agents and brokers, retail partnerships, our in-house sales force or via the exchanges. Individual business is sold on a fully-insured basis. We offer on-exchange products through public exchanges and off-exchange products. Federal premium subsidies are available only for certain public exchange Individual products. Unsubsidized Individual customers are generally more sensitive to product pricing and, to a lesser extent, the configuration of the network and the efficiency of administration. Customer turnover is generally
higher with Individual as compared to Local Group. Individual business accounted for 1.6%, 1.7% and 1.6% of our medical members at December 31, 2020, 2019 and 2018, respectively.
•National Accounts generally consist of multi-state employer groups primarily headquartered in an AnthemElevance Health service area with at least 5% of the eligible employees located outside of the headquarter state and with more than 5,000 eligible employees. Some exceptions are allowed based on broker and consultant relationships. Service area is defined asGroup risk-based accounts are generally sold through brokers or consultants who work with industry specialists from our in-house sales force and are offered both on and off the geographic area in which we are licensedPublic Exchanges. Group risk-based accounted for 8.4%, 8.8% and 8.9% of our medical members at December 31, 2022, 2021 and 2020, respectively.
•Group fee-based customers represent employer groups, Local Group, including UniCare members, and National Accounts, who purchase fee-based products and elect to sell BCBS products. National Accountsretain most or all of the financial risk associated with their employees’ healthcare costs. Some fee-based customers choose to purchase stop loss coverage to limit their retained risk. Group fee-based accounts are generally sold through independent brokers or consultants retained by the customer working with our in-house sales force. We believe we have an advantage when competingGroup fee-based accounted for very large National Accounts due to the size42.4%, 42.7% and breadth of our networks and our ability to access the national provider networks of other BCBS companies at their competitive local market rates. National Accounts represented 18.0%, 18.5% and 19.0%45.5% of our medical members at December 31, 2020, 20192022, 2021 and 2018,2020, respectively.
•BlueCard® host customers represent enrollees of Blue Cross and/or Blue Shield plans not owned by AnthemElevance Health who receive healthcare services in our BCBSA licensed markets. BlueCard® membership consists of estimated host members using the national BlueCard® program. Host members are generally members who reside in or travel to a state in which an AnthemElevance Health subsidiary is the Blue Cross and/or Blue Shield licensee and who are covered under an employer-sponsored health plan issued by a non-Anthemnon-Elevance Health controlled BCBSA licensee (the “home plan”). We perform certain functions, including claims pricing and administration, for BlueCard® members, for which we receive administrative fees from the BlueCard® members’ home plans. Other administrative functions, including maintenance of enrollment information and customer service, are performed by the home plan. Host members are computed using, among other things, the average number of BlueCard® claims received per month. BlueCard® host membership accounted for 14.1%13.6%, 14.8%13.6% and 14.6%14.1% of our medical members at December 31, 2020, 20192022, 2021 and 2018,2020, respectively.
•Medicare customers are Medicare-eligible individual members age 65 and over who have enrolled in Medicare Supplement plans; Medicare Advantage, including Special Needs Plans (“SNPs”), also known as Medicare Advantage SNPs; Medicare Part D; and dual-eligible programs through Medicare-Medicaid Plans (“MMPs”).; Medicare Supplement plans typically pay the difference between healthcare costs incurred by a beneficiaryplans; and amounts paid by Medicare.Medicare Part D Prescription Drug Plans (“Medicare Part D”). Medicare Advantage plans provide Medicare beneficiaries with a managed care alternative to traditional Medicare and often include a Medicare Part D benefit. In addition, our
Medicare Advantage SNPs provide tailored benefits to special needs individuals who are institutionalized or have severe or disabling chronic conditions and to dual-eligible customers, who are low-income seniors and persons under age 65 with disabilities. Medicare Advantage SNPs are coordinated care plans specifically designed to provide targeted care, covering all the healthcare services considered medically necessary for members and often providing professional care coordination services, with personal guidance and programs that help members maintain their health. Medicare Advantage membership also includes Medicare Advantage members in our Group Retiree Solutions business who are related to National Accounts, retired members of Local GroupCommercial accounts or retired members of groups who are not affiliated with our Commercial accounts who have selected a Medicare Advantage product through us. Medicare Supplement plans typically pay the difference between healthcare costs incurred by a beneficiary and amounts paid by Medicare. Medicare Part D offers a prescription drug plan to Medicare and MMP beneficiaries. MMP, which was established as a result of the passage of the ACA, is a demonstration program focused on serving members who are dually eligible for Medicaid and Medicare. Medicare Supplement and Medicare Advantage products are marketed in the same manner, primarily through independent agents and brokers. Medicare program business accounted for 5.5%6.2%, 5.2%6.2% and 4.6%5.5% of our medical members at December 31, 2022, 2021 and 2020, 2019 and 2018, respectively.
•Medicaid membership represents eligible members who receive healthcarehealth benefits through publicly funded healthcare programs, including Medicaid, ACA-related Medicaid expansion programs, Temporary Assistance for Needy Families, programs for seniors and people with disabilities, Children’s Health Insurance Programs, and specialty programs such as those focused on long-term services and support, HIV/AIDS, foster care, behavioral health and/or substance abuse disorders, and intellectual disabilities or developmental disabilities, among others. Total Medicaid program business accounted for 20.6%24.3%, 17.7%23.4% and 16.8%20.6% of our medical members at December 31, 2022, 2021 and 2020, 2019 and 2018, respectively.
•FEHB members consist of United States government employees and their dependents who receive health benefits within our geographic markets through our participation in the national contract between the BCBSA and the U.S. Office of Personnel Management. FEHB business accounted for 3.4%, 3.6% and 3.8% of our medical members at December 31, 2022, 2021 and 2020, and 3.9% at both December 31, 2019 and 2018.respectively.
In addition to reporting our medical membership by customer type, we report by funding arrangement according to the level of risk that we assume in the product contract. Our two principal funding arrangement categories are fully-insured and self-funded. Fully-insured products are products in which we indemnify our policyholders against costs for health benefits. Self-funded products are offered to customers, generally larger employers, who elect to retain most or all of the financial risk associated with their employees’ healthcare costs. Some self-funded customers choose to purchase stop loss coverage to limit their retained risk.
The following table presents our medical membership by reportable segment and customer type funding arrangement and reportable segment as of December 31, 2020, 20192022, 2021 and 2018.2020. Also included below is other membership by product. At this time, the following table does not include membership resulting from our acquisition of Beacon. The medical membership and other membership presented are unaudited and in certain instances include estimates of the number of members represented by each contract at the end of the period.
| | | | | | | | | | | | | | | | | | | | | | | | | | | | | | | | | | | | | | | | | | | | |
| | | December 31 | | 2020 vs. 2019 | | 2019 vs. 2018 |
| (In thousands) | 2020 | | 2019 | | 2018 | | Change | | % Change | | Change | | % Change |
| Medical Membership | | | | | | | | | | | | | |
| Customer Type | | | | | | | | | | | | | |
| Local Group | 15,614 | | | 15,682 | | | 15,733 | | | (68) | | | (0.4) | % | | (51) | | | (0.3) | % |
| Individual | 680 | | | 684 | | | 655 | | | (4) | | | (0.6) | % | | 29 | | | 4.4 | % |
| National: | | | | | | | | | | | | | |
| National Accounts | 7,736 | | | 7,596 | | | 7,588 | | | 140 | | | 1.8 | % | | 8 | | | 0.1 | % |
BlueCard® | 6,059 | | | 6,060 | | | 5,838 | | | (1) | | | — | % | | 222 | | | 3.8 | % |
| Total National | 13,795 | | | 13,656 | | | 13,426 | | | 139 | | | 1.0 | % | | 230 | | | 1.7 | % |
| Medicare: | | | | | | | | | | | | | |
| Medicare Advantage | 1,428 | | | 1,214 | | | 1,006 | | | 214 | | | 17.6 | % | | 208 | | | 20.7 | % |
| Medicare Supplement | 933 | | | 905 | | | 846 | | | 28 | | | 3.1 | % | | 59 | | | 7.0 | % |
| Total Medicare | 2,361 | | | 2,119 | | | 1,852 | | | 242 | | | 11.4 | % | | 267 | | | 14.4 | % |
| Medicaid | 8,852 | | | 7,265 | | | 6,716 | | | 1,587 | | | 21.8 | % | | 549 | | | 8.2 | % |
| FEHB | 1,623 | | | 1,594 | | | 1,556 | | | 29 | | | 1.8 | % | | 38 | | | 2.4 | % |
| Total Medical Membership by Customer Type | 42,925 | | | 41,000 | | | 39,938 | | | 1,925 | | | 4.7 | % | | 1,062 | | | 2.7 | % |
| Funding Arrangement | | | | | | | | | | | | | |
| Self-Funded | 25,629 | | | 25,418 | | | 25,287 | | | 211 | | | 0.8 | % | | 131 | | | 0.5 | % |
| Fully-Insured | 17,296 | | | 15,582 | | | 14,651 | | | 1,714 | | | 11.0 | % | | 931 | | | 6.4 | % |
| Total Medical Membership by Funding Arrangement | 42,925 | | | 41,000 | | | 39,938 | | | 1,925 | | | 4.7 | % | | 1,062 | | | 2.7 | % |
| Reportable Segment | | | | | | | | | | | | | |
| Commercial & Specialty Business | 30,089 | | | 30,022 | | | 29,814 | | | 67 | | | 0.2 | % | | 208 | | | 0.7 | % |
| Government Business | 12,836 | | | 10,978 | | | 10,124 | | | 1,858 | | | 16.9 | % | | 854 | | | 8.4 | % |
| Total Medical Membership by Reportable Segment | 42,925 | | | 41,000 | | | 39,938 | | | 1,925 | | | 4.7 | % | | 1,062 | | | 2.7 | % |
| Other Membership | | | | | | | | | | | | | |
| Life and Disability Members | 5,064 | | | 5,259 | | | 4,795 | | | (195) | | | (3.7) | % | | 464 | | | 9.7 | % |
| Dental Members | 6,385 | | | 6,263 | | | 5,807 | | | 122 | | | 1.9 | % | | 456 | | | 7.9 | % |
| Dental Administration Members | 1,316 | | | 5,516 | | | 5,327 | | | (4,200) | | | (76.1) | % | | 189 | | | 3.5 | % |
| Vision Members | 7,536 | | | 7,261 | | | 6,946 | | | 275 | | | 3.8 | % | | 315 | | | 4.5 | % |
| Medicare Part D Standalone Members | 413 | | | 283 | | | 309 | | | 130 | | | 45.9 | % | | (26) | | | (8.4) | % |
| | | | | | | | | | | | | | |
| | | | | | | | | | | | | | | | | | | | | | | | | | | | | | | | | | | | | | | | | |
| | December 31 | | 2022 vs. 2021 | | 2021 vs. 2020 |
| (In thousands) | 2022 | | 2021 | | 2020 | | Change | | % Change | | Change | | % Change |
| Medical Membership | | | | | | | | | | | | | |
| Commercial & Specialty Business: | | | | | | | | | | | | | |
| Individual | 789 | | | 759 | | | 680 | | | 30 | | | 4.0 | % | | 79 | | | 11.6 | % |
| Group Risk-Based | 3,988 | | | 4,006 | | | 3,799 | | | (18) | | | (0.4) | % | | 207 | | | 5.4 | % |
| Commercial Risk-Based | 4,777 | | | 4,765 | | | 4,479 | | | 12 | | | 0.3 | % | | 286 | | | 6.4 | % |
BlueCard® | 6,462 | | | 6,178 | | | 6,059 | | | 284 | | | 4.6 | % | | 119 | | | 2.0 | % |
| Group Fee-Based | 20,174 | | | 19,395 | | | 19,551 | | | 779 | | | 4.0 | % | | (156) | | | (0.8) | % |
| Commercial Fee-Based | 26,636 | | | 25,573 | | | 25,610 | | | 1,063 | | | 4.2 | % | | (37) | | | (0.1) | % |
| Total Commercial & Specialty Business | 31,413 | | | 30,338 | | | 30,089 | | | 1,075 | | | 3.5 | % | | 249 | | | 0.8 | % |
| Government Business: | | | | | | | | | | | | | |
| Medicare Advantage | 1,977 | | | 1,859 | | | 1,428 | | | 118 | | | 6.3 | % | | 431 | | | 30.2 | % |
| Medicare Supplement | 947 | | | 952 | | | 933 | | | (5) | | | (0.5) | % | | 19 | | | 2.0 | % |
| Total Medicare | 2,924 | | | 2,811 | | | 2,361 | | | 113 | | | 4.0 | % | | 450 | | | 19.1 | % |
| Medicaid | 11,571 | | | 10,600 | | | 8,852 | | | 971 | | | 9.2 | % | | 1,748 | | | 19.7 | % |
| Federal Employees Health Benefits | 1,623 | | | 1,625 | | | 1,623 | | | (2) | | | (0.1) | % | | 2 | | | 0.1 | % |
| Total Government Business | 16,118 | | | 15,036 | | | 12,836 | | | 1,082 | | | 7.2 | % | | 2,200 | | | 17.1 | % |
| Total Medical Membership | 47,531 | | | 45,374 | | | 42,925 | | | 2,157 | | | 4.8 | % | | 2,449 | | | 5.7 | % |
| Other Membership | | | | | | | | | | | | | |
| Life and Disability Members | 4,834 | | | 4,782 | | | 5,064 | | | 52 | | | 1.1 | % | | (282) | | | (5.6) | % |
| Dental Members | 6,692 | | | 6,674 | | | 6,385 | | | 18 | | | 0.3 | % | | 289 | | | 4.5 | % |
| Dental Administration Members | 1,586 | | | 1,491 | | | 1,316 | | | 95 | | | 6.4 | % | | 175 | | | 13.3 | % |
| Vision Members | 9,813 | | | 8,031 | | | 7,536 | | | 1,782 | | | 22.2 | % | | 495 | | | 6.6 | % |
| Medicare Part D Standalone Members | 271 | | | 438 | | | 413 | | | (167) | | | (38.1) | % | | 25 | | | 6.1 | % |
| | | | | | | | | | | | | |
December 31, 20202022 Compared to December 31, 20192021
Medical Membership
Medical Membership
Total medical membership grewincreased in both our Government Business and Commercial & Specialty Business segments as well as by funding arrangement. Fully-insured membership increased primarily due to organic growth. Our Government Business segment’s organic growth was primarily driven by the continued temporary suspension of Medicaid eligibility recertification during the COVID-19 pandemic. In addition, Medicaid membership was positively impacted by the acquisition of Ohio Medicaid members through the purchase of a Medicaid contract in our Medicaidthe first quarter of 2022 and the acquisition of Integra in the second quarter of 2022. Medicare businesses, partially offset by membership decreases in our fully-insured Local Group business. Local Group membership decreasedAdvantage organic growth due to negativesales exceeding lapses also contributed to the overall Government Business segment growth. Our Commercial & Specialty Business segment growth included Group fee-based membership increases due to sales exceeding lapses and positive in-group changes as a result ofchanges. BlueCard® membership increased unemployment caused by the COVID-19 pandemic,due to membership activity at other BCBSA plans whose members reside in or travel to our licensed areas. Individual membership increased due to our Public Exchange expansion in 2022.
which was partially offset by sales exceeding lapses. Self-funded medical membership increased primarily as a result of membership increases in our National Accounts business driven by our acquisition of a third-party administrator. Medicaid membership increased primarily due to organic growth in existing markets due to the temporary suspension of eligibility recertification during the COVID-19 pandemic as well as our acquisition of Medicaid plans in Missouri and Nebraska in 2020. Medicare membership increased primarily due to higher sales.
Other Membership
Our other membership can be impacted by changes in our medical membership, as our medical members often purchase our other products that are ancillary to our health business. Life and disability membership decreasedincreased primarily due to higher lapsesnew sales of disability products, partially offset by declines in our fully-insured Local Group business.life membership. Dental membership increased primarily due to new sales and growth in our National AccountsGroup risk-based accounts and membership growthpenetration increases in our FEHB program, as well as new sales in our Individual product offerings.partially offset by the loss of a significant Group fee-based account. Dental administration membership decreasedincreased primarily due to increased sales to other BCBS plans associated with the FEHB program. Vision membership increased primarily due to the lapselaunch of a large dental administration services contract. Vision membership increased due to higher salesnew entry-level vision product in our Group markets. Medicare and Local Group businesses.Part D Standalone membership declined as we discontinued certain legacy products.
Consolidated Results of Operations
Our consolidated summarized results of operations and other information for the years ended December 31, 2020, 20192022, 2021 and 20182020 are as follows:
| | | | | | | Change | | | | | Change |
| | | | Years Ended December 31 | | 2020 vs. 2019 | | 2019 vs. 2018 | | | Years Ended December 31 | | 2022 vs. 2021 | | 2021 vs. 2020 |
| | | | 2020 | | 2019 | | 2018 | | $ | | % | | $ | | % | | | 2022 | | 2021 | | 2020 | | $ | | % | | $ | | % |
| Total operating revenue | Total operating revenue | $ | 120,808 | | | $ | 103,141 | | | $ | 91,341 | | | $ | 17,667 | | | 17.1 | % | | $ | 11,800 | | | 12.9 | % | Total operating revenue | $ | 155,660 | | | $ | 136,943 | | | $ | 120,808 | | | $ | 18,717 | | | 13.7 | % | | $ | 16,135 | | | 13.4 | % |
| Net investment income | Net investment income | 877 | | | 1,005 | | | 970 | | | (128) | | | (12.7) | % | | 35 | | | 3.6 | % | Net investment income | 1,485 | | | 1,378 | | | 877 | | | 107 | | | 7.8 | % | | 501 | | | 57.1 | % |
| Net realized gains (losses) on financial instruments | 182 | | | 67 | | | (206) | | | 115 | | | (171.6) | % | | 273 | | | (132.5) | % | |
| Net (losses) gains on financial instruments | | Net (losses) gains on financial instruments | (550) | | | 318 | | | 182 | | | (868) | | | (273.0) | % | | 136 | | | 74.7 | % |
| Total revenues | Total revenues | 121,867 | | | 104,213 | | | 92,105 | | | 17,654 | | | 16.9 | % | | 12,108 | | | 13.1 | % | Total revenues | 156,595 | | | 138,639 | | | 121,867 | | | 17,956 | | | 13.0 | % | | 16,772 | | | 13.8 | % |
| Benefit expense | Benefit expense | 88,045 | | | 81,786 | | | 71,895 | | | 6,259 | | | 7.7 | % | | 9,891 | | | 13.8 | % | Benefit expense | 116,487 | | | 102,645 | | | 88,045 | | | 13,842 | | | 13.5 | % | | 14,600 | | | 16.6 | % |
| Cost of products sold | Cost of products sold | 8,953 | | | 1,992 | | | — | | | 6,961 | | | 349.4 | % | | 1,992 | | | NM | Cost of products sold | 13,035 | | | 10,895 | | | 8,953 | | | 2,140 | | | 19.6 | % | | 1,942 | | | 21.7 | % |
| Selling, general and administrative expense | Selling, general and administrative expense | 17,450 | | | 13,364 | | | 14,020 | | | 4,086 | | | 30.6 | % | | (656) | | | (4.7) | % | Selling, general and administrative expense | 17,686 | | | 15,914 | | | 17,450 | | | 1,772 | | | 11.1 | % | | (1,536) | | | (8.8) | % |
Other expense1 | Other expense1 | 1,181 | | | 1,086 | | | 1,122 | | | 95 | | | 8.7 | % | | (36) | | | (3.2) | % | Other expense1 | 1,618 | | | 1,260 | | | 1,181 | | | 358 | | | 28.4 | % | | 79 | | | 6.7 | % |
| Total expenses | Total expenses | 115,629 | | | 98,228 | | | 87,037 | | | 17,401 | | | 17.7 | % | | 11,191 | | | 12.9 | % | Total expenses | 148,826 | | | 130,714 | | | 115,629 | | | 18,112 | | | 13.9 | % | | 15,085 | | | 13.0 | % |
| Income before income tax expense | Income before income tax expense | 6,238 | | | 5,985 | | | 5,068 | | | 253 | | | 4.2 | % | | 917 | | | 18.1 | % | Income before income tax expense | 7,769 | | | 7,925 | | | 6,238 | | | (156) | | | (2.0) | % | | 1,687 | | | 27.0 | % |
| Income tax expense | Income tax expense | 1,666 | | | 1,178 | | | 1,318 | | | 488 | | | 41.4 | % | | (140) | | | (10.6) | % | Income tax expense | 1,750 | | | 1,830 | | | 1,666 | | | (80) | | | (4.4) | % | | 164 | | | 9.8 | % |
| | Net income | Net income | $ | 4,572 | | | $ | 4,807 | | | $ | 3,750 | | | $ | (235) | | | (4.9) | % | | $ | 1,057 | | | 28.2 | % | Net income | 6,019 | | | 6,095 | | | 4,572 | | | (76) | | | (1.2) | % | | 1,523 | | | 33.3 | % |
| Net loss attributable to noncontrolling interests | | Net loss attributable to noncontrolling interests | 6 | | | 9 | | | — | | | (3) | | | (33.3) | % | | 9 | | | — | % |
| Shareholders’ net income | | Shareholders’ net income | $ | 6,025 | | | $ | 6,104 | | | $ | 4,572 | | | $ | (79) | | | (1.3) | % | | $ | 1,532 | | | 33.5 | % |
| | Average diluted shares outstanding | Average diluted shares outstanding | 254.3 | | | 260.3 | | | 264.2 | | | (6.0) | | | (2.3) | % | | (3.9) | | | (1.5) | % | Average diluted shares outstanding | 242.8 | | | 246.8 | | | 254.3 | | | (4.0) | | | (1.6) | % | | (7.5) | | | (2.9) | % |
| | Diluted net income per share | $ | 17.98 | | | $ | 18.47 | | | $ | 14.19 | | | $ | (0.49) | | | (2.7) | % | | $ | 4.28 | | | 30.2 | % | |
| Diluted shareholders' net income per share | | Diluted shareholders' net income per share | $ | 24.81 | | | $ | 24.73 | | | $ | 17.98 | | | $ | 0.08 | | | 0.3 | % | | $ | 6.75 | | | 37.5 | % |
| Effective tax rate | Effective tax rate | 26.7 | % | | 19.7 | % | | 26.0 | % | | 700bp3 | | (630)bp3 | Effective tax rate | 22.5 | % | | 23.1 | % | | 26.7 | % | | (60)bp3 | | (360)bp3 |
Benefit expense ratio2 | Benefit expense ratio2 | 84.6 | % | | 86.8 | % | | 84.2 | % | | (220)bp3 | | 260bp3 | Benefit expense ratio2 | 87.4 | % | | 87.5 | % | | 84.6 | % | | (10)bp3 | | 290bp3 |
Selling, general and administrative expense ratio4 | Selling, general and administrative expense ratio4 | 14.4 | % | | 13.0 | % | | 15.3 | % | | 140bp3 | | (230)bp3 | Selling, general and administrative expense ratio4 | 11.4 | % | | 11.6 | % | | 14.4 | % | | (20)bp3 | | (280)bp3 |
| Income before income tax expense as a percentage of total revenues | Income before income tax expense as a percentage of total revenues | 5.1 | % | | 5.7 | % | | 5.5 | % | | (60)bp3 | | 20bp3 | Income before income tax expense as a percentage of total revenues | 5.0 | % | | 5.7 | % | | 5.1 | % | | (70)bp3 | | 60bp3 |
| Net income as a percentage of total revenues | 3.8 | % | | 4.6 | % | | 4.1 | % | | (80)bp3 | | 50bp3 | |
| Shareholders’ net income as a percentage of total revenues | | Shareholders’ net income as a percentage of total revenues | 3.8 | % | | 4.4 | % | | 3.8 | % | | (60)bp3 | | 60bp3 |
|
Certain of the following definitions are also applicable to all other results of operations tables in this discussion:
NM Not meaningful.
1Includes interest expense, amortization of other intangible assets and loss on extinguishment of debt.
2Benefit expense ratio represents benefit expense as a percentage of premium revenue. Premiums for the years ended December 31, 2022, 2021 and 2020 2019were $133,229, $117,373 and 2018 were $104,109, $94,173 and $85,421, respectively. Premiums are included in total operating revenue presented above.
3bp = basis point; one hundred basis points = 1%.
4Selling, general and administrative expense ratio represents selling, general and administrative expense as a percentage of total operating revenue.
Year Ended December 31, 20202022 Compared to the Year Ended December 31, 20192021
Total operating revenue increased primarily as a result of higher premium revenue in our Medicaid business due mainly to organic membership growth from the continued temporary suspension of Medicaid eligibility recertification during the COVID-19 pandemic, the acquisition of Integra in the second quarter of 2022 and the acquisition of Ohio Medicaid members through the purchase of a Medicaid contract in the first quarter of 2022. Membership growth in our GovernmentMedicare Advantage and our Commercial & Specialty Business segment related to our Medicaid and Medicarerisk-based businesses, andas well as premium rate increases designed to cover medical cost trends also generated higher premium revenue. Finally, the impact of the HIP Fee reinstatement for 2020. The increase in operating revenue was further attributable to an increase inincreased pharmacy product revenue as we completed the transition of all ofin our unaffiliated PBM customersCarelonRx segment, resulting from growth in membership and higher script volume.
Net investment income increased primarily due to IngenioRx between the second quarter of 2019 and January 1, 2020. The increase in operating revenue washigher income from fixed maturity securities, partially offset by a decreasereduced investment income from alternative investments.
We had net losses on financial instruments in premiums2022, as compared to net gains in our Commercial & Specialty Business segment related to fully-insured membership declines2021, as a result of increased unemployment caused bynet losses on the COVID-19 pandemic.
Net investment income decreased primarily due to losses fromsale of fixed maturity securities, reduced gains on the sale of equity securities and lower net gains on other invested assets and lower yields on our short term investments. Theassets. These losses on our other invested assets were primarily due to losses from energy sector private equity funds recognized in 2020 as a result of a decrease in the worldwide demand for energy due to the COVID-19 pandemic.
Net realized gains on financial instruments increased primarily due to the changes in the fair values of our investments in equity securities. This increase was partially offset by a decrease in net realized gainslower mark-to-market losses on sales of equity securities.securities still held.
Benefit expense increased primarily due to increasedhealthcare costs as a result ofassociated with organic membership growth in our Medicaid and Medicare membershipbusinesses and overall cost trends acrossthe acquisition of MMM in the second quarter of 2021. Membership growth and higher healthcare costs in our businesses including increased expenseCommercial risk-based business, the acquisition of Integra in the second quarter of 2022 and the acquisition of Ohio Medicaid members through the purchase of a Medicaid contract in the first quarter of 2022 also contributed to cover COVID-19 related costs such as testing, treatment, expanded coverage of insurance benefits, waivers for cost-sharing and actions taken to support our members in response to the pandemic. These increases were partially offset by the lower volume of healthcare claims experienced resulting from decreased utilization of non-COVID-19 health services during the COVID-19 pandemic.higher benefit expense.
Our benefit expense ratio decreased slightly primarily due to the COVID-19 impactrealignment during 2022 of lower utilization rates of healthcare benefits, andcertain quality improvement costs, from benefit expenses to a lesser extent, the HIP Fee reinstatement for 2020. These decreases wereadministrative expenses, due to regulatory clarification. This decline was partially offset by increased benefit costs associated with actions taken to support our members in response to the pandemic and COVID-19 related care. The decreases were further offset by the impact of retroactive rate adjustmentscontinued membership increases in our Medicaid business and premium credits provided in response toGovernment Business segment, which has a higher benefit expense ratio than our Commercial & Specialty Business segment.
Cost of products sold reflects the COVID-19 pandemic tocost of pharmaceuticals dispensed by CarelonRx for our members enrolled in select Individual plans and fully-insured employerunaffiliated PBM customers.
Cost of products sold increased as we completed the transition of all of our unaffiliated PBM customers to IngenioRx between the second quarter of 2019, when it began its operations, and January 1, 2020.corresponding pharmacy product revenues increased.
Selling, general and administrative expense increased primarily due to the reinstatement of the HIP Fee for 2020 and increased spendcosts to support membership growth inand from our businesses. The increase was further due to the recognition of expenses related to ouracquisitions, partially offset by lower business optimization initiatives and the BCBSA Litigation during 2020.charges in 2022 as compared to 2021.
Our selling, general and administrative expense ratio increaseddecreased primarily due to operating revenue growth in 2022 and lower business optimization charges in 2022 as a result of the higher selling, general and administrative expenses discussed above,compared to 2021, partially offset by increased costs to support membership growth and the growthimpact of the realignment of certain quality improvement costs described above.
Other expense increased primarily due to additional amortization of intangible assets related to recent acquisitions and the rebranding of our products. The amortization period of certain intangible assets was shortened to align with anticipated dates the new branding will take place. In addition, certain indefinite-lived intangible assets have been reclassified as definite-lived, and therefore, are now being amortized. For additional information regarding intangible asset amortization, see Note 10, "Goodwill and Other Intangible Assets" of the Notes to Consolidated Financial Statements included in operating revenue.Part II, Item 8, of this Annual Report on Form 10-K.
Our effective income tax rate increaseddecreased primarily due to the reinstatementimpact of the non-tax deductible HIP Fee for 2020.geographic changes in our mix of earnings in 2022.
Our shareholders' net income as a percentage of total revenuerevenues decreased in 2022 as compared to 2021 as a result of all the factors discussed above.
Reportable Segments Results of Operations
Beginning in 2020, IngenioRx met the quantitative thresholds for a reportable segment and the results of our operations are now described through four reportable segments: Commercial & Specialty Business, Government Business, IngenioRx and Other. We use operating gain to evaluate the performance of our reportable segments. Operating gain is calculated as total operating revenue less benefit expense, cost of products sold and selling, general and administrative expense. It does not include net investment income, net realized gains (losses) on financial instruments, interest expense, amortization of other intangible assets, loss on extinguishment of debt or income taxes, as these items are managed in a corporate shared service environment and are not the responsibility of operating segment management.
The discussion of segment results presented below is based on operating gain, as described above, and operating margin, which is calculated as operating gain divided by operating revenue. Our definition of operating gain and operating margin may not be comparable to similarly titled measures reported by other companies. We use these measures as a basis for evaluating segment performance, allocating resources, forecasting future operating periods and setting incentive compensation targets. This information is not intended to be considered in isolation or as a substitute for income before income tax expense, net income or EPS, prepared in accordance with GAAP. For our 2019 segment reporting, operating gain generated from IngenioRx activities were allocated and included in our Commercial & Specialty Business and Government Business based upon their utilization of those services, which aligns with the method by which we assessed the 2019 operating performance of our reportable segments. Beginning January 1, 2020, we are managing the operating performance of each of our segments on a standalone basis. Prior year 2019 allocations were not restated to conform to the 2020 presentation; however, operating margins for IngenioRx were approximately 8% in 2019. For additional information, see Note 20, “Segment Information,” of the Notes to Consolidated Financial Statements included in Part II, Item 8 of this Annual Report on Form 10-K.
The following table presents a summary of our reportable segment financial information for the years ended December 31, 2020, 20192022, 2021 and 2018:
| | | | | | | | | | | | | | | | | | | | | | | | | | | | | | | | | | | | | | | | | | | | | | | |
| | | | | | | | | | Change |
| | | | Years Ended December 31 | | 2020 vs. 2019 | | 2019 vs. 2018 |
| | | | 2020 | | 2019 | | 2018 | | $ | | % | | $ | | % |
| Operating Revenue | | | | | | | | | | | | | |
| Commercial & Specialty Business | $ | 36,699 | | | $ | 37,421 | | | $ | 35,782 | | | $ | (722) | | | (1.9) | % | | $ | 1,639 | | | 4.6 | % |
| Government Business | 71,572 | | | 62,632 | | | 55,348 | | | 8,940 | | | 14.3 | % | | 7,284 | | | 13.2 | % |
| IngenioRx | | 21,911 | | | 5,402 | | | — | | | 16,509 | | | 305.6 | % | | 5,402 | | | NM |
| Other | 6,057 | | | 2,293 | | | 1,519 | | | 3,764 | | | 164.2 | % | | 774 | | | 51.0 | % |
| Eliminations | (15,431) | | | (4,607) | | | (1,308) | | | (10,824) | | | 234.9 | % | | (3,299) | | | 252.2 | % |
| Total operating revenue | $ | 120,808 | | | $ | 103,141 | | | $ | 91,341 | | | $ | 17,667 | | | 17.1 | % | | $ | 11,800 | | | 12.9 | % |
| | | | | | | | | | | | | |
| Operating Gain (Loss) | | | | | | | | | | | | | |
Commercial & Specialty Business1 | $ | 2,681 | | | $ | 4,032 | | | $ | 3,600 | | | (1,351) | | | (33.5) | % | | 432 | | | 12.0 | % |
Government Business2 | 2,444 | | | 2,056 | | | 1,928 | | | 388 | | | 18.9 | % | | 128 | | | 6.6 | % |
IngenioRx3 | 1,361 | | | — | | | — | | | 1,361 | | | NM | | — | | | NM |
Other4 | (126) | | | (89) | | | (102) | | | (37) | | | 41.6 | % | | 13 | | | (12.7) | % |
| | | | | | | | | | | | | |
| Operating Margin | | | | | | | | | | | | | |
| Commercial & Specialty Business | 7.3 | | | 10.8 | % | | 10.1 | % | | | | (350)bp5 | | | | 70bp5 |
| Government Business | 3.4 | | | 3.3 | % | | 3.5 | % | | | | 10bp5 | | | | (20)bp5 |
| IngenioRx | 6.2 | | | — | % | | NM | | | | NM | | | | NM |
| | | | | | | | | | | | | | | |
| | | | | | | | | | | | | | | | | | | | | | | | | | | | | | | | | | | | | | | | | | | | | | | |
| | | | | | | | | | Change |
| | | | Years Ended December 31 | | 2022 vs. 2021 | | 2021 vs. 2020 |
| | | | 2022 | | 2021 | | 2020 | | $ | | % | | $ | | % |
| Operating Revenue | | | | | | | | | | | | | |
| Commercial & Specialty Business | $ | 41,674 | | | $ | 38,809 | | | $ | 36,699 | | | $ | 2,865 | | | 7.4 | % | | $ | 2,110 | | | 5.7 | % |
| Government Business | 96,810 | | | 82,919 | | | 71,572 | | | 13,891 | | | 16.8 | % | | 11,347 | | | 15.9 | % |
| CarelonRx | | 28,526 | | | 25,431 | | | 21,911 | | | 3,095 | | | 12.2 | % | | 3,520 | | | 16.1 | % |
| Other | 13,294 | | | 10,250 | | | 6,057 | | | 3,044 | | | 29.7 | % | | 4,193 | | | 69.2 | % |
| Eliminations | (24,644) | | | (20,466) | | | (15,431) | | | (4,178) | | | 20.4 | % | | (5,035) | | | 32.6 | % |
| Total operating revenue | $ | 155,660 | | | $ | 136,943 | | | $ | 120,808 | | | $ | 18,717 | | | 13.7 | % | | $ | 16,135 | | | 13.4 | % |
| | | | | | | | | | | | | |
| Operating Gain (Loss) | | | | | | | | | | | | | |
Commercial & Specialty Business1 | $ | 2,933 | | | $ | 2,753 | | | $ | 2,681 | | | $ | 180 | | | 6.5 | % | | $ | 72 | | | 2.7 | % |
Government Business2 | 3,297 | | | 3,061 | | | 2,444 | | | 236 | | | 7.7 | % | | 617 | | | 25.2 | % |
CarelonRx3 | 1,868 | | | 1,684 | | | 1,361 | | | 184 | | | 10.9 | % | | 323 | | | 23.7 | % |
Other4 | 354 | | | (9) | | | (126) | | | 363 | | | NM | | 117 | | | NM |
| | | | | | | | | | | | | |
| Operating Margin | | | | | | | | | | | | | |
| Commercial & Specialty Business | 7.0 | % | | 7.1 | % | | 7.3 | % | | | | (10)bp5 | | | | (20)bp5 |
| Government Business | 3.4 | % | | 3.7 | % | | 3.4 | % | | | | (30)bp5 | | | | 30bp5 |
| CarelonRx | 6.5 | % | | 6.6 | % | | 6.2 | % | | | | (10)bp5 | | | | 40bp5 |
| | | | | | | | | | | | | | | |
NM Not meaningful.
1Includes expenses of $524$20 for the BCBSA Litigation andbusiness optimization initiatives in 2022; $106 for business optimization initiatives in 2021; $311 for business optimization initiatives recognizedand $524 for the BCBSA Litigation in 2020.
2 Includes expenses of $16 for business optimization initiatives in 2022; $47 for business optimization initiatives in 2021; $205 for business optimization initiatives and $24 for the BCBSA Litigation recognized in 2020.
3 Includes expenses of $2 for business optimization initiatives in 2021; $4 for business optimization initiatives recognized in 2020.
4 Includes expenses of $3 for business optimization initiatives in 2022; $32 for business optimization initiatives in 2021; $133 for business optimization initiatives recognized in 2020.
5 bp = basis point; one hundred basis points = 1%.
Year Ended December 31, 20202022 Compared to the Year Ended December 31, 20192021
Commercial & Specialty Business
Operating revenue decreasedincreased primarily due to fully-insuredhigher premiums in our Commercial risk-based business due to membership declines as a result of increased unemployment caused by the COVID-19 pandemic. The decrease in operating revenue was further attributable to the absence of pharmacy
administrative fee revenue that is now being recognized within the IngenioRx segment and the impact ofgrowth, premium credits provided to certain members in response to the COVID-19 pandemic. These decreases were partially offset by higher premium revenue resulting from rate increases designedin our Commercial risk-based business to cover the impact of the HIP Fee reinstatement for 2020.medical cost trends and increased administrative fees in our Commercial fee-based business.
The decreaseincrease in operating gain was primarily driven by costs associated with actions takendue to supportimproved medical underwriting performance in our membersCommercial risk-based business and providers in response to the pandemic and COVID-19 related care, as well as expenses for the BCBSA Litigation andreduced business optimization initiatives recognizedcharges in 2020. The decrease was further attributable2022 as compared to the shift of pharmacy earnings to our IngenioRx segment and the impact of premium credits provided to certain members in response to the COVID-19 pandemic. The decrease was2021. These items were partially offset by the impact of the lower volume of healthcare claims attributableincreased costs to decreased utilization of non-COVID-19 health services during the COVID-19 pandemic.support membership growth.
Government Business
Operating revenue increased primarily due to higher premium revenue as a result of membership growth in our Medicaid business, driven byincluding due to organic membership growth from the continued temporary suspension of Medicaid eligibility recertification effortsduring the
COVID-19 pandemic, the acquisition of MMM at the end of the second quarter of 2021, the acquisition of Integra during the COVID-19 pandemic, acquisitionssecond quarter of 2022 and new expansions, as well as membershipthe acquisition of Ohio Medicaid members through the purchase of a Medicaid contract in the first quarter of 2022. Membership growth and premium rate increases to cover medical cost trends in our Medicare business. The increase inAdvantage business also contributed to higher premium revenue was further attributable to the HIP Fee reinstatement for 2020.revenue.
The increase in operating gain was primarily driven by premium rate increases to cover medical cost trends in our Medicare business, organic membership growth in our Medicaid business from the lower volumecontinued suspension of healthcare claims attributable to decreased utilization of non-COVID-19 health serviceseligibility recertifications during the COVID-19 pandemic. The increase waspandemic and the acquisition of MMM in the second quarter of 2021. These increases were partially offset by costs associated with actions takenadditional administrative spend to support the growth in our membersGovernment business.
CarelonRx
Operating revenue increased as a result of growth in response to the pandemic and COVID-19 related care and retroactive rate adjustmentsmembership and higher experience-rated refunds in our Medicaid business. script volume.
The increase in operating gain was further offset by increased spend to support growth and expenses for business optimization initiatives recognized in 2020.
IngenioRx
Operating revenue and operating gain increased asprimarily a result of the transition of our existinghigher script volume, driven by growth in integrated medical and pharmacy members in 2022 and favorable out-of-period adjustments to IngenioRx, which commenced its operations duringfee-based revenue in the second quarterhalf of 2019. Operating revenue represents product revenues from services performed for our fully-insured affiliated health plans and self-funded customers and external customers outside of the health plans we own. Product revenues and cost of goods sold for our fully-insured affiliated health plan customers are eliminated in consolidation. Operating gain represents operating revenue less cost of products sold and selling, general and administrative expenses.2022.
Other
Operating revenue increased primarily due to our acquisition of Beacon in February 2020 and higher administrative fees and other revenue fromfor expanded services performed by DBGCarelon Services for our Commercial & Specialty Business segment in certain markets.2022 and the acquisition of myNEXUS in the second quarter of 2021. These increases were partially offset by the reduction of external revenue due to the loss of a behavioral health contract in 2022.
The increase in operating lossgain was driven by improved performance in Carelon Services, the acquisition of myNEXUS in the second quarter of 2021, and a decline in unallocated corporate expenses recognized for our business optimization initiatives.in 2022.
Critical Accounting Policies and Estimates
We prepare our consolidated financial statements in conformity with GAAP. Application of GAAP requires management to make estimates and assumptions that affect the amounts reported in our consolidated financial statements and accompanying notes and within this MD&A. We consider our most important accounting policies that require significant estimates and management judgment to be those policies with respect to liabilities for medical claims payable, income taxes, goodwill and other intangible assets, investments and retirement benefits, which are discussed below. Our other significant accounting policies are summarized in Note 2, “Basis of Presentation and Significant Accounting Policies,” of the Notes to Consolidated Financial Statements included in Part II, Item 8 of this Annual Report on Form 10-K.
We continually evaluate the accounting policies and estimates used to prepare the consolidated financial statements. In general, our estimates are based on historical experience, evaluation of current trends, information from third-party professionals and various other assumptions that we believe to be reasonable under the known facts and circumstances. Estimates can require a significant amount of judgment, and a different set of assumptions could result in material changes to our reported results.
Medical Claims Payable
The most subjective accounting estimate in our consolidated financial statements is our liability for medical claims payable. At December 31, 2020,2022, this liability was $11,359$15,596 and represented 21%23% of our total consolidated liabilities. We record this liability and the corresponding benefit expense for incurred but not paid claims, including the estimated costs of processing such claims. Incurred but not paid claims include (1) an estimate for claims that are incurred but not reported, as well as claims reported to us but not yet processed through our systems, which approximated 96%94%, or $10,925,$14,736, of our total medical claims liability as of December 31, 2020;2022; and (2) claims reported to us and processed through our systems but not yet paid, which approximated 4%6%, or $434,$860, of the total medical claims payable as of December 31, 2020.2022. The level of claims payable processed through our systems but not yet paid may fluctuate from one period-end to the next, from approximately 1% to 5%6% of our total medical claims liability, due to timing of when claim payments are made.
Liabilities for both claims incurred but not reported and reported but not yet processed through our systems are determined in the aggregate, employing actuarial methods that are commonly used by health insurance actuaries and meet Actuarial Standards of Practice. Our reserving practice for claim liabilities is to consistently recognize the appropriate amount of reserve within a level of confidence required by Actuarial Standards of Practice require that the claim liabilities be appropriate under moderately adverse circumstances.Practice. We determine the amount of the liability for incurred but not paid claims by following a detailed actuarial process that uses both historical claim payment patterns as well as emerging medical cost trends to project our best estimate of claim liabilities. Under this process, historical paid claims data is formatted into “claim triangles,” which compare claim incurred dates to the dates of claim payments. This information is analyzed to create “completion factors” that represent the average percentage of total incurred claims that have been paid through a given date after being incurred. Completion factors are applied to claims paid through the period-end date to estimate the ultimate claim expense incurred for the period. Actuarial estimates of incurred but not paid claim liabilities are then determined by subtracting the actual paid claims from the estimate of the ultimate incurred claims.
For the most recent incurred months (typically the most recent two months), the percentage of claims paid for claims incurred in those months is generally low. This makes the completion factor methodology less reliable for such months. Therefore, incurred claims for recent months are not projected from historical completion and payment patterns; rather, they are projected by estimating the claims expense for those months based on recent claims expense levels and healthcare trend levels (“trend factors”).
Because the reserve methodology is based upon historical information, it must be adjusted for known or suspected operational and environmental changes. These adjustments are made by our actuaries based on their knowledge and their estimate of emerging impacts to benefit costs and payment speed. Circumstances to be considered in developing our best estimate of reserves include changes in utilization levels, unit costs, mix of business, benefit plan designs, provider reimbursement levels, processing system conversions and changes, claim inventory levels, claim processing patterns, claim submission patterns and operational changes resulting from business combinations. A comparison of prior period liabilities to re-estimated claim liabilities based on subsequent claims development is also considered in making the liability determination. In our comparison to prior periods, the methods and assumptions are not changed as reserves are recalculated; rather, the availability of additional paid claims information drives changes in the re-estimate of the unpaid claim liability. To the extent appropriate, changes in such development are recorded as a change to current period benefit expense. The impact from COVID-19 on healthcare utilization and medical claims submission patterns hasWe had increased estimation uncertainty on our incurred but not reported liability at December 31, 2020.2022 and December 31, 2021. Slowdowns in claims submission patterns and increases in utilization levels for COVID-19 testing and treatment during the fourth quarter of 2020 are the primary factors that lead to the increased estimation uncertainty.
We regularly review and set assumptions regarding cost trends and utilization when initially establishing claim liabilities. We continually monitor and adjust the claims liability and benefit expense based on subsequent paid claims activity. If it is determined that our assumptions regarding cost trends and utilization are materially different than actual results, our income statement and financial position could be impacted in future periods. Adjustments of prior year estimates may result in additional benefit expense or a reduction of benefit expense in the period an adjustment is made. Further, due to the considerable variability of healthcare costs, adjustments to claim liabilities occur each period and are sometimes significant as compared to the net income recorded in that period. Prior period development is recognized immediately upon the actuary’s judgment that a portion of the prior period liability is no longer needed or that an additional liability should have been accrued. That determination is made when sufficient information is available to ascertain that the re-estimate of the liability is reasonable.
WhileAlthough there are many factors that are used as a part of the estimation of our medical claims payable liability, the two key assumptions having the most significant impact on our incurred but not paid claims liability as of December 31, 20202022 were the completion and trend factors. As discussed above, these two key assumptions can be influenced by utilization levels, unit costs, mix of business, benefit plan designs, provider reimbursement levels, processing system conversions and changes, claim inventory levels, claim processing patterns, claim submission patterns and operational changes resulting from business combinations.
There is variation in the reasonable choice of completion factors by duration for durations of three months through twelve months where the completion factors have the most significant impact. As previously discussed, completion factors tend to be less reliable for the most recent months and therefore are not specifically utilized for months one and two. In our analysis for the claim liabilities at December 31, 2020,2022, the variability in months three to five was estimated to be between 40
and 90 basis points, while months six through twelve have much lower estimated variability ranging from 0 to 30 basis points.
The difference in completion factor assumptions assuming moderately adverse experience, results in variability of 2%, or approximately $204,$266, in the December 31, 20202022 incurred but not paid claims liability, depending on the completion factors chosen. It is important to note that the completion factor methodology inherently assumes that historical completion rates will be reflective of the current period. However, it is possible that the actual completion rates for the current period will develop differently from historical patterns and therefore could fall outside the possible variations described herein.
The other major assumption used in the establishment of the December 31, 20202022 incurred but not paid claim liability was the trend factors. In our analysis for the period ended December 31, 2020,2022, there was a 320310 basis point differential in the high and low trend factors assuming moderately adverse experience.factors. This range of trend factors would imply variability of 4%3%, or approximately $427,$522, in the incurred but not paid claims liability, depending upon the trend factors used. Because historical trend factors are often not representative of current claim trends, the trend experience for the most recent six to nine months, plus knowledge of recent events likely affecting current trends, have been taken into consideration in establishing the incurred but not paid claims liability at December 31, 2020.2022. The COVID-19 pandemic continues to have a significantan impact on 2020claim costs for recent dates of service. Our expenses associated with COVID-19 accelerated in the fourth quarter of 2020 and exceeded the benefit from lower volume of healthcare claims attributable to decreased utilization of non-COVID-19 health services.service, which could have an influence on our trend factors. We will continue to monitor emerging experience in order to better understand the possible implications to our reserves.
See Note 12, “Medical Claims Payable,” of the Notes to Consolidated Financial Statements included in Part II, Item 8 of this Annual Report on Form 10-K, for a reconciliation of the beginning and ending balance for medical claims payable for the years ended December 31, 2020, 20192022, 2021 and 2018.2020. Components of the total incurred claims for each year include amounts accrued for current year estimated claims expense as well as adjustments to prior year estimated accruals. In Note 12, “Medical Claims Payable,” the line labeled “Net incurred medical claims: Prior years redundancies” accounts for those adjustments made to prior year estimates. The impact of any reduction of “Net incurred medical claims: Prior years redundancies” may be offset as we establish the estimate of “Net incurred medical claims: Current year.” Our reserving practice is to consistently recognize the actuarial best estimate of our ultimate liability for our claims. When we recognize a release of the redundancy, we disclose the amount that is not in the ordinary course of business, if material.
The ratio of current year medical claims paid as a percent of current year net medical claims incurred was 87.3% for 2022, 87.8% for 2021 and 87.7% for 2020, 89.3% for 2019 and 90.2% for 2018.2020. This ratio serves as an indicator of claims processing speed whereby 20202022 claims were processed at a slightly slower speed than in 20192021 and 2018.2020.
We calculate the percentage of prior year redundancies in the current year as a percent of prior year net incurred claims payable less prior year redundancies in the current year in order to demonstrate the development of the prior year reserves. For the year ended December 31, 2022, this metric was 7.0%, largely driven by favorable trend factor development at the end of 2021. For the year ended December 31, 2021, this metric was 18.1%, reflecting the estimation uncertainty due to COVID-19 at the end of 2020, and was largely driven by favorable trend factor development at the end of 2020 as well as favorable completion factor development from 2020. For the year ended December 31, 2020, this metric was 8.0%, largely driven by favorable trend factor development at the end of 2019 as well as favorable completion factor development from 2019. For the year ended December 31, 2019, this metric was 7.4%, largely driven by favorable trend factor development at the end of 2018 as well as favorable completion factor development from 2018. For the year ended December 31, 2018, this metric was 13.7%, largely driven by favorable trend factor development at the end of 2017 as well as favorable completion factor development from 2017.
We calculate the percentage of prior year redundancies in the current year as a percent of prior year net incurred medical claims to indicate the percentage of redundancy included in the preceding year calculation of current year net incurred
medical claims. We believe this calculation supports the reasonableness of our prior year estimate of incurred medical claims and the consistency in our methodology. For the year ended December 31, 2020,2022, this metric was 0.8%0.9%, which was calculated using the redundancy of $637.$869. This metric was 0.7%2.0% for 20192021 and 1.3%0.8% for 2018.2020. We believe these metrics demonstrate an appropriate levelsupport the reasonableness of reserve conservatism.our estimates. The 2021 metric was impacted by the estimation uncertainty due to COVID-19.
The following table shows the variance between total net incurred medical claims as reported in Note 12, “Medical Claims Payable,” of the Notes to Consolidated Financial Statements included in Part II, Item 8 of this Annual Report on Form 10-K, for each of 20192021 and 20182020 and the incurred claims for such years had it been determined retrospectively (computed as
the difference between “net incurred medical claims – current year” for the year shown and “net incurred medical claims – prior years redundancies” for the immediately following year):
| | | | Years Ended December 31 | | Years Ended December 31 |
| | | 2019 | | 2018 | | 2021 | | 2020 |
| Total net incurred medical claims, as reported | Total net incurred medical claims, as reported | $ | 78,195 | | | $ | 68,651 | | Total net incurred medical claims, as reported | $ | 98,737 | | | $ | 84,457 | |
| Retrospective basis, as described above | Retrospective basis, as described above | 78,058 | | | 69,081 | | Retrospective basis, as described above | 99,571 | | | 83,391 | |
| Variance | Variance | $ | 137 | | | $ | (430) | | Variance | $ | (834) | | | $ | 1,066 | |
| Variance to total net incurred medical claims, as reported | Variance to total net incurred medical claims, as reported | 0.2 | % | | (0.6) | % | Variance to total net incurred medical claims, as reported | (0.8) | % | | 1.3 | % |
Given that our business is primarily short tailed (which means that medical claims are generally paid within twelve months of the member receiving service from the provider), the variance to total net incurred medical claims, as reported above, is used to assess the reasonableness of our estimate of ultimate incurred medical claims for a given calendar year with the benefit of one year of experience. We expect that substantially all of the development of the 20202022 estimate of medical claims payable will be known during 2021.2023.
The 20192021 variance to total net incurred medical claims, as reported of 0.2%(0.8)% was greaterless than the 20182020 percentage of (0.6)%1.3%. This was primarily driven by the fact that the change in the prior year redundancy reported for 20202021 as compared to 20192020 was greaterless than the change in the prior year redundancy reported for 20192020 as compared to 2018.2019.
Income Taxes
We account for income taxes in accordance with the Financial Accounting Standards Board (“FASB”) guidance, which requires, among other things, the separate recognition of deferred tax assets and deferred tax liabilities. Such deferred tax assets and deferred tax liabilities represent the tax effect of temporary differences between financial reporting and tax reporting measured at tax rates enacted at the time the deferred tax asset or liability is recorded. A valuation allowance must be established for deferred tax assets if it is “more likely than not” that all or a portion may be unrealized. Our judgment is required in determining an appropriate valuation allowance.
At each financial reporting date, we assess the adequacy of the valuation allowance by evaluating each of our deferred tax assets based on the following:
•the types of temporary differences that created the deferred tax asset;
•the amount of taxes paid in prior periods and available for a carry-back claim;
•the tax rate at which the deferred tax assets will likely be utilized in the future;
•the forecasted future taxable income, and therefore, likely future deduction of the deferred tax item;
•the implementation of tax planning strategies to recover those deferred tax assets; and
•any significant other issues impacting the likely realization of the benefit of the temporary differences.
Although realization is not assured, we believe it is more likely than not that the deferred tax assets will be realized.
We, like other companies, frequently face challenges from tax authorities regarding the amount of taxes due. These challenges include questions regarding the timing and amount of deductions that we have taken on our tax returns. In evaluating any additional tax liability associated with various positions taken in our tax return filings, we record additional liabilities for potential adverse tax outcomes. Based on our evaluation of our tax positions, we believe we have appropriately accrued for uncertain tax benefits, as required by the applicable guidance. To the extent we prevail in matters we have accrued for, our future effective tax rate would be reduced and net income would increase. If we are required to pay more
than accrued, our future effective tax rate would increase and net income would decrease. Our effective tax rate and net income in any given future period could be materially impacted.
In the ordinary course of business, we are regularly audited by federal and other tax authorities, and from time to time, these audits result in proposed assessments. We believe our tax positions comply with applicable tax law, and we intend to defend our positions vigorously through the federal, state and local, and foreign appeals processes. We believe we have
adequately provided for any reasonably foreseeable outcome related to these matters. Accordingly, although their ultimate resolution may require additional tax payments, we do not anticipate any material impact on our results of operations or financial condition from these matters.
For additional information, see Note 8, “Income Taxes,” of the Notes to Consolidated Financial Statements included in Part II, Item 8 of this Annual Report on Form 10-K.
Goodwill and Other Intangible Assets
Our consolidated goodwill at December 31, 20202022 was $21,691$24,383 and other intangible assets were $9,405.$10,315. The sum of goodwill and other intangible assets represented 35.9%33.8% of our total consolidated assets and 93.7%95.6% of our consolidated shareholders’ equity at December 31, 2020.2022.
We follow FASB guidance for business combinations and goodwill and other intangible assets, which specifies the types of acquired intangible assets that are required to be recognized and reported separately from goodwill. Under the guidance, goodwill and other intangible assets (with indefinite lives) are not amortized but are tested for impairment at least annually. Furthermore, goodwill and other intangible assets are allocated to reporting units for purposes of the annual impairment test. Our impairment tests require us to make assumptions and judgments regarding the estimated fair value of our reporting units, which include goodwill and other intangible assets. In addition, certain other intangible assets with indefinite lives, such as trademarks, are also tested separately.
We complete our annual impairment tests of existing goodwill and other intangible assets with indefinite lives during the fourth quarter of each year. These tests involve the use of estimates related to the fair value of goodwill at the reporting unit level and other intangible assets with indefinite lives, and require a significant degree of management judgment and the use of subjective assumptions. Certain interim impairment tests are also performed when potential impairment indicators exist or changes in our business or other triggering events occur. We have the option of first performing a qualitative assessment for each reporting unit to determine whether it is more likely than not that the fair value of a reporting unit is less than its carrying amount, which is an indication that our goodwill may be impaired. These qualitative impairment tests include assessing events and factors that could affect the fair value of the indefinite-lived intangible assets. Our procedures include assessing our financial performance, macroeconomic conditions, industry and market considerations, various asset specific factors and entity specific events. If we determine that a reporting unit’s goodwill may be impaired after utilizing these qualitative impairment analysis procedures, we are required to perform a quantitative impairment test.
Our quantitative impairment test utilizes the projected income and market valuation approaches for goodwill and the projected income approach for our indefinite lived intangible assets. Use of the projected income and market valuation approaches for our goodwill impairment test reflects our view that both valuation methodologies provide a reasonable estimate of fair value. The projected income approach is developed using assumptions about future revenue, expenses and net income derived from our internal planning process. These estimated future cash flows are then discounted. Our assumed discount rate is based on our industry’s weighted-average cost of capital. Market valuations are based on observed multiples of certain measures including revenue; earnings before interest, taxes, depreciation and amortization; and book value of invested capital (debt and equity) and include market comparisons to publicly traded companies in our industry.
We did not incur any impairment losses as a result of our 20202022 annual impairment tests, as it was determined that it is more likely than not that the estimated fair values of our reporting units were substantially in excess of the carrying values as of December 31, 2020.2022. Additionally, we do not believe that the estimated fair values of our reporting units are at risk of becoming impaired in the next twelve months.
If estimated fair values are less than the carrying values of goodwill and other intangibles with indefinite lives in future annual impairment tests, or if significant impairment indicators are noted relative to other intangible assets subject to amortization, we may be required to record impairment losses against future income.
For additional information, see Note 3, “Business Acquisitions” and Note 10, “Goodwill and Other Intangible Assets,” of the Notes to Consolidated Financial Statements included in Part II, Item 8 of this Annual Report on Form 10-K.
Investments
Current and long-term marketable investment securities were $25,554$27,657 at December 31, 20202022 and represented 29.5%26.9% of our total consolidated assets at December 31, 2020.2022. We classify fixed maturity securities in our investment portfolio as “available-for-sale” and report those securities at fair value. Certain fixed maturity securities are available to support current operations and, accordingly, we classify such investments as current assets without regard to their contractual maturity. Investments used to satisfy contractual, regulatory or other requirements are classified as long-term, without regard to contractual maturity.
Our impairment review is subjective and requires a high degree of judgment. We conduct this review on a quarterly basis, using both qualitative and quantitative factors. Such factors considered include the extent to which a security’s market value has been less than its cost, the reasons for the decline in value (i.e., credit event compared to liquidity, general credit spread widening, currency exchange rate or interest rate factors), financial condition and near term prospects of the issuer, including the credit ratings and changes in the credit ratings of the issuer, recommendations of investment advisors, and forecasts of economic, market or industry trends.
Prior to 2020, our fixed maturity securities were evaluated for other-than-temporary impairment where credit-related impairments were presented within the other-than-temporary impairment losses recognized in our consolidated statements of income with an adjustment to the security’s amortized cost basis. Effective January 1, 2020, ifIf a fixed maturity security is in an unrealized loss position and we have the intent to sell the fixed maturity security, or it is more likely than not that we will have to sell the fixed maturity security before recovery of its amortized cost basis, we write down the fixed maturity security’s cost basis to fair value and record an impairment loss in our consolidated statements of income. For impaired fixed maturity securities that we do not intend to sell or if it is more likely than not that we will not have to sell such securities, but we expect that we will not fully recover the amortized cost basis, we recognize the credit component of the impairment as an allowance for credit loss in our consolidated balance sheets and record an impairment loss in our consolidated statements of income. The non-credit component of the impairment is recognized in accumulated other comprehensive (loss) income. Furthermore, unrealized losses entirely caused by non-credit-related factors related to fixed maturity securities for which we expect to fully recover the amortized cost basis continue to be recognized in accumulated other comprehensive (loss) income.
The credit component of an impairment is determined primarily by comparing the net present value of projected future cash flows with the amortized cost basis of the fixed maturity security. The net present value is calculated by discounting our best estimate of projected future cash flows at the effective interest rate implicit in the fixed maturity security at the date of purchase. For mortgage-backed and asset-backed securities, cash flow estimates are based on assumptions regarding the underlying collateral, including prepayment speeds, vintage, type of underlying asset, geographic concentrations, default rates, recoveries and changes in value. For all other securities, cash flow estimates are driven by assumptions regarding probability of default, including changes in credit ratings and estimates regarding timing and amount of recoveries associated with a default.
We have a committee of accounting and investment associates and management that is responsible for managing the impairment review process. We believe that we have adequately reviewed our investment securities for impairment and that our investment securities are carried at fair value. We have established an allowance for credit loss and recorded credit loss expense as a reflection of our expected impairment losses. Given the inherent uncertainty of changes in market conditions and the significant judgments involved, there is continuing risk that declines in fair value may occur and additional impairment losses on investments may be recorded in future periods.
In addition to marketable investment securities, we held additional long-term investments of $4,285,$5,685, or 4.9%5.5% of total consolidated assets, at December 31, 2020.2022. These long-term investments consisted primarily of certain other equity investments, the cash surrender value of corporate-owned life insurance policies and real estate.mortgage loans. Due to their less liquid nature, these investments are classified as long-term.
The COVID-19 pandemic and efforts to prevent its spread have significantly impacted the global economy, causing market instability and declines in the fair value of our investment holdings in the energy sector and consumer-driven
industries such as travel, entertainment and retail. While the markets have stabilized since the onset of the COVID-19 pandemic, the extent and length of the recovery remain uncertain. Further, the energy sector and consumer-driven industries remain distressed. Given this market uncertainty, there is a risk that our investments that have declined may not recover in future periods.
Through our investing activities, we are exposed to financial market risks, including those resulting from changes in interest rates and changes in equity market valuations. We manage market risks through our investment policy, which establishes credit quality limits and limits on investments in individual issuers. Ineffective management of these risks could have an impact on our future results of operations and financial condition. Our investment portfolio includes fixed maturity securities with a fair value of $23,995$26,704 at December 31, 2020.2022. The weighted-average credit rating of these securities was “A” as of December 31, 2020.2022. Included in this balance are investments in fixed maturity securities of states, municipalities and political subdivisions of $1,010$890 that are guaranteed by third parties. With the exception of twenty-one16 securities with a fair value of $34, $9,
these securities are all investment-grade and carry a weighted-average credit rating of “AA” as of December 31, 2020.2022. The securities are guaranteed by a number of different guarantors, and we do not have any material exposure to any single guarantor, neither indirectly through the guarantees, nor directly through investment in the guarantor. Further, due to the high underlying credit rating of the issuers, the weighted-average credit rating of the fixed maturity securities without a guarantee, for which such information is available, was “A” as of December 31, 2020.2022.
Fair values of fixed maturity and equity securities are based on quoted market prices, where available. These fair values are obtained primarily from third-party pricing services, which generally use Level I or Level II inputs for the determination of fair value in accordance with FASB guidance for fair value measurements and disclosures. We have controls in place to review the pricing services’ qualifications and procedures used to determine fair values. In addition, we periodically review the pricing services’ pricing methodologies, data sources and pricing inputs to ensure the fair values obtained are reasonable.
We obtain quoted market prices for each security from the pricing services, which are derived through recently reported trades for identical or similar securities, making adjustments through the reporting date based upon available market observable information. For securities not actively traded, the pricing services may use quoted market prices of comparable instruments or discounted cash flow analyses, incorporating inputs that are currently observable in the markets for similar securities. Inputs that are often used in these valuation methodologies include, but are not limited to, broker quotes, benchmark yields, credit spreads, default rates and prepayment speeds. As we are responsible for the determination of fair value, we perform analysis on the prices received from the pricing services to determine whether the prices are reasonable estimates of fair value. Our analysis includes procedures such as a review of month-to-month price fluctuations and price comparisons to secondary pricing services. There were no adjustments to quoted market prices obtained from the pricing services during the years ended December 31, 20202022 and 2019.2021.
In certain circumstances, it may not be possible to derive pricing model inputs from observable market activity, and therefore, such inputs are estimated internally. Such securities are designated Level III in accordance with FASB guidance. Securities designated Level III at December 31, 20202022 totaled $392$581 and represented approximately 1.3%1.7% of our total assets measured at fair value on a recurring basis. Our Level III securities primarily consisted of certain corporate securities and equity securities for which observable inputs were not always available and the fair values of these securities were estimated using inputs including, but not limited to, prepayment speeds, credit spreads, default rates and benchmark yields.
For additional information, see Part II, Item 7A, “Quantitative and Qualitative Disclosures about Market Risk,” and Note 2, “Basis of Presentation and Significant Accounting Policies,” Note 5, “Investments,” and Note 7, “Fair Value,” of the Notes to Consolidated Financial Statements included in Part II, Item 8 of this Annual Report on Form 10-K.
Retirement Benefits
Pension Benefits
We sponsor defined benefit pension plans for some of our employees. These plans are accounted for in accordance with FASB guidance for retirement benefits, which requires that amounts recognized in financial statements be determined on an actuarial basis. As permitted by the guidance, we calculate the value of plan assets as described below. Further, the difference between our expected rate of return and the actual performance of plan assets, as well as certain changes in pension liabilities, are amortized over future periods.
An important factor in determining our pension expense is the assumption for expected long-term return on plan assets. As of our December 31, 20202022 measurement date, we selected a weighted-average long-term rate of return on plan assets of 6.72%6.58%. We use a total portfolio return analysis in the development of our assumption. Factors such as past market performance, the long-term relationship between fixed maturity and equity securities, interest rates, inflation and asset allocations are considered in the assumption. The assumption includes an estimate of the additional return expected from active management of the investment portfolio. Peer data and an average of historical returns are also reviewed for appropriateness of the selected assumption. We believe our assumption of future returns is reasonable. However, if we lower our expected long-term return on plan assets, future contributions to the pension plan and pension expense would likely increase.
This assumed long-term rate of return on assets is applied to a calculated value of plan assets, which recognizes changes in the fair value of plan assets in a systematic manner over three years, producing the expected return on plan assets that is
included in the determination of pension expense. We apply a corridor approach to amortize unrecognized actuarial gains or losses. Under this approach, only accumulated net actuarial gains or losses in excess of 10% of the greater of the projected benefit obligation or the fair value of plan assets are amortized over the average remaining service or lifetime of the workforce as a component of pension expense. The net deferral of past asset gains or losses affects the calculated value of plan assets and, ultimately, future pension expense.
The discount rate reflects the current rate at which the pension liabilities could be effectively settled at the end of the year based on our most recent measurement date. We use the annual spot rate approach for setting our discount rate. Under the spot rate approach, individual spot rates from a full yield curve of published rates are used to discount each plan’s cash flows to determine the plan’s obligation. At the December 31, 20202022 measurement date, the weighted-average discount rate under the annual spot rate approach was 2.24%5.18%, compared to 3.11%2.70% at the December 31, 20192021 measurement date. The net effect of changes in the discount rate, as well as the net effect of other changes in actuarial assumptions and experience, have been deferred and amortized as a component of pension expense in accordance with FASB guidance.
In managing the plan assets, our objective is to be a responsible fiduciary while minimizing financial risk. Plan assets include a diversified mix of equity securities, investment grade fixed maturity securities and other types of investments across a range of sectors and levels of capitalization to maximize long-term return for a prudent level of risk. In addition to producing a reasonable return, the investment strategy seeks to minimize the volatility in our expense and cash flow.
Effective January 1, 2019, we curtailed the benefits under the Anthem Cash Balance Plan B pension plan. All grandfathered participants no longer have pay credits added to their accounts, but continue to earn interest on existing account balances. Participants continue to earn years of pension service for vesting purposes.
Other Postretirement Benefits
We provide mostsome associates with certain medical, vision and dental benefits upon retirement. We use various actuarial assumptions, including a discount rate and the expected trend in healthcare costs, to estimate the costs and benefit obligations for our retiree benefits.
At our December 31, 20202022 measurement date, the selected discount rate for all plans was 1.99%5.12%, compared to a discount rate of 2.93%2.49% at the December 31, 20192021 measurement rate. We developed this rate using the annual spot rate approach as described above.
The assumed healthcare cost trend rates used to measure the expected cost of pre-Medicare (those who are not currently eligible for Medicare benefits) other benefits at our December 31, 20202022 measurement date was 7.00%8.00% for 20212023 with a gradual decline to 4.50% by the year 2033.2035. The assumed healthcare cost trend rates used to measure the expected cost of post-Medicare (those who are currently eligible for Medicare benefits) other benefits at our December 31, 20202022 measurement date was 5.50%6.50% for 20212023 with a gradual decline to 4.50% by the year 2033.2035. These estimated trend rates are subject to change in the future.
For additional information regarding our retirement benefits, see Note 11, “Retirement Benefits,” of the Notes to Consolidated Financial Statements included in Part II, Item 8 of this Annual Report on Form 10-K.
New Accounting Pronouncements
For information regarding new accounting pronouncements that were issued or became effective during the year ended December 31, 20202022 that had, or are expected to have, a material impact on our financial position, results of operations or financial statement disclosures, see the “Recently Adopted Accounting Guidance” and “Recent Accounting Guidance Not Yet Adopted” sections of Note 2, “Basis of Presentation and Significant Accounting Policies,” of the Notes to Consolidated Financial Statements included in Part II, Item 8 of this Annual Report on Form 10-K.
Liquidity and Capital Resources
Introduction
Our cash receipts result primarily from premiums, product revenue, administrative fees and other revenue, investment income, proceeds from the sale or maturity of our investment securities, proceeds from borrowings, and proceeds from the issuance of common stock under our employee stock plans. Cash disbursements result mainly from claims payments, administrative expenses, taxes, purchases of investment securities, interest expense, payments on borrowings, acquisitions, capital expenditures, repurchases of our debt securities and common stock and the payment of cash dividends. Cash outflows
fluctuate with the amount and timing of settlement of these transactions. Any future decline in our profitability would likely have an unfavorable impact on our liquidity.
The COVID-19 pandemic and the related mitigation efforts have significantly impacted the economy, causing market instability and increasing unemployment in the United States. While the full impact of COVID-19 on our business remains uncertain, it could have a material adverse effect on our claim payments, collection of our premiums, product or administrative fee revenues, our investments and our ability to access credit. Additional discussion regarding the impact of COVID-19 can be found elsewhere in this MD&A.
We manage our cash, investments and capital structure so we are able to meet the short-term and long-term obligations of our business while maintaining financial flexibility and liquidity. We forecast, analyze and monitor our cash flows to enable investment and financing within the overall constraints of our financial strategy.
To preserve our liquidity and financial flexibility and to minimize the effects of the COVID-19 pandemic, we proactively took several actions during 2020, including borrowing under our senior revolving credit facility in March 2020, which was repaid in April 2020; delaying certain tax payments as permitted by the IRS and the CARES Act; and temporarily suspending our share repurchase activity in March 2020, which was resumed in late June 2020. We may take additional actions going forward to maximize our liquidity, including increasing our borrowings from existing or new Federal Home Loan Bank memberships and other available borrowings. We will continue to monitor the market conditions and seek to act in a prudent manner.
A substantial portion of the assets held by our regulated subsidiaries are in the form of cash and cash equivalents and investments. After considering expected cash flows from operating activities, we generally invest cash that exceeds our near term obligations in longer term marketable fixed maturity securities to improve our overall investment income returns. Our investment strategy is to make investments consistent with insurance statutes and other regulatory requirements, while preserving our asset base. Our investments are generally available-for-sale to meet liquidity and other needs. Our subsidiaries pay out excess capital annually in the form of dividends to their respective parent companies for general corporate use, as permitted by applicable regulations.
The availability of financing in the form of debt or equity is influenced by many factors, including our profitability, operating cash flows, debt levels, debt ratings, contractual restrictions, regulatory requirements and market conditions. The securities and credit markets have in the past experienced higher than normal volatility, although current market conditions are more stable.volatility. Interest rates on fixed debt income securities increased in 2022 and may continue to do so in 2023, which could increase our borrowing costs if we elect to issue debt. During recent years, the federal government and various governmental agencies have taken a number of steps to strengthen the regulation of the financial services market. In addition, governments around the world have developed their own plans to provide stability and security in the credit markets and to ensure adequate capital in certain financial institutions. Further, in response to the COVID-19 pandemic, the federal government has established a number of programs to provide liquidity to the financial system that provides lending to states, municipalities, and eligible businesses.
A summary of our major sources and uses of cash and cash equivalents for the years ended December 31,
2020, 20192022, 2021 and
20182020 is as follows:
| | | | | | | | | | | | | | | | | | | | | | | | | | | | | |
| | Years Ended December 31 | | $ Change |
| | 2022 | | 2021 | | 2020 | | 2022 vs. 2021 | | 2021 vs. 2020 |
| Sources of Cash: | | | | | | | | | |
| Net cash provided by operating activities | $ | 8,399 | | | $ | 8,364 | | | $ | 10,688 | | | $ | 35 | | | $ | (2,324) | |
| | | | | | | | | |
| | | | | | | | | |
| Issuances of commercial paper and short- and long-term debt, net of repayments | 862 | | | 2,719 | | | — | | | (1,857) | | | 2,719 | |
| Issuances of common stock under employee stock plans | 182 | | | 203 | | | 176 | | | (21) | | | 27 | |
| Other sources of cash, net | 762 | | | — | | | 315 | | | 762 | | | (315) | |
| Total sources of cash | 10,205 | | | 11,286 | | | 11,179 | | | (1,081) | | | 107 | |
| Uses of Cash: | | | | | | | | | |
| Purchases of investments, net of proceeds from sales, maturities, calls and redemptions | (2,338) | | | (4,056) | | | (3,433) | | | 1,718 | | | (623) | |
| Repurchase and retirement of common stock | (2,316) | | | (1,900) | | | (2,700) | | | (416) | | | 800 | |
| Purchases of subsidiaries, net of cash acquired | (649) | | | (3,476) | | | (1,976) | | | 2,827 | | | (1,500) | |
| Purchases of property and equipment | (1,152) | | | (1,087) | | | (1,021) | | | (65) | | | (66) | |
| Repayments of commercial paper and short- and long-term debt, net of issuances | — | | | — | | | (298) | | | — | | | 298 | |
| Cash dividends | (1,229) | | | (1,104) | | | (954) | | | (125) | | | (150) | |
| Other uses of cash, net | — | | | (514) | | | — | | | 514 | | | (514) | |
| Total uses of cash | (7,684) | | | (12,137) | | | (10,382) | | | 4,453 | | | (1,755) | |
| Effect of foreign exchange rates on cash and cash equivalents | (14) | | | (10) | | | 7 | | | (4) | | | (17) | |
| Net increase (decrease) in cash and cash equivalents | $ | 2,507 | | | $ | (861) | | | $ | 804 | | | $ | 3,368 | | | $ | (1,665) | |
| | | | | | | | | | | | | | | | | | | | | | | | | | | | | |
| | Years Ended December 31 | | $ Change |
| | 2020 | | 2019 | | 2018 | | 2020 vs. 2019 | | 2019 vs. 2018 |
| Sources of Cash: | | | | | | | | | |
| Net cash provided by operating activities | $ | 10,688 | | | $ | 6,061 | | | $ | 3,827 | | | $ | 4,627 | | | $ | 2,234 | |
| Proceeds from sales, maturities, calls and redemptions of investments, net of purchases | — | | | — | | | 1,929 | | | — | | | (1,929) | |
| Issuance of common stock under Equity Units stock purchase contracts | — | | | — | | | 1,250 | | | — | | | (1,250) | |
| Issuances of commercial paper and short- and long-term debt, net of repayments | — | | | 608 | | | — | | | (608) | | | 608 | |
| Issuances of common stock under employee stock plans | 176 | | | 187 | | | 173 | | | (11) | | | 14 | |
| Other sources of cash, net | 315 | | | — | | | — | | | 315 | | | — | |
| Total sources of cash | 11,179 | | | 6,856 | | | 7,179 | | | 4,323 | | | (323) | |
| Uses of Cash: | | | | | | | | | |
| Purchases of investments, net of proceeds from sales, maturities, calls and redemptions | (3,433) | | | (1,919) | | | — | | | (1,514) | | | (1,919) | |
| Repurchase and retirement of common stock | (2,700) | | | (1,701) | | | (1,685) | | | (999) | | | (16) | |
| Purchases of subsidiaries, net of cash acquired | (1,976) | | | — | | | (1,760) | | | (1,976) | | | 1,760 | |
| Purchases of property and equipment | (1,021) | | | (1,077) | | | (1,208) | | | 56 | | | 131 | |
| Repayments of commercial paper and short- and long-term debt, net of issuances | (298) | | | — | | | (1,086) | | | (298) | | | 1,086 | |
| Cash dividends | (954) | | | (818) | | | (776) | | | (136) | | | (42) | |
| Other uses of cash, net | — | | | (338) | | | (337) | | | 338 | | | (1) | |
| Total uses of cash | (10,382) | | | (5,853) | | | (6,852) | | | (4,529) | | | 999 | |
| Effect of foreign exchange rates on cash and cash equivalents | 7 | | | — | | | (2) | | | 7 | | | 2 | |
| Net increase in cash and cash equivalents | $ | 804 | | | $ | 1,003 | | | $ | 325 | | | $ | (199) | | | $ | 678 | |
Liquidity—Year Ended December 31, 20202022 Compared to Year Ended December 31, 20192021
The slight increase in cash provided by operating activities was primarily due to higher net income in 2022, when adjusted for the impact of investment losses and gains, partially offset by the timing of working capital changes. The increase was further due to membership growth in our Government Business segment and higher net income in 2020, excluding the non-cash impact of accrued expenses related to our business optimization initiativeschanges and the BCBSA Litigation.payment pursuant to the Subscriber Settlement Agreement made in September 2022.
Other significant changes in sources and uses of cash year-over-year included increases inlower amounts used for purchases of subsidiaries, net of cash acquired and reduced cash used for acquisitions, net purchases of investments, net of proceeds from sales, maturities, calls and redemptions. These decreased uses of cash usedwere partially offset by reduced net proceeds received from the issuance of commercial paper and short-term and long-term debt and increased use of cash for repurchase and retirement of common stock.share repurchases.
Financial Condition
We maintained a strong financial condition and liquidity position, with consolidated cash, cash equivalents and investments in fixed maturity and equity securities of $31,295$35,044 at December 31, 2020.2022. Since December 31, 2019,2021, total cash, cash equivalents and investments in fixed maturity and equity securities increased by $5,168,$1,384, primarily due to cash generated from operations. This increase was partially offset by cash used for acquisitions, common stock repurchases, acquisitions, purchases of property and equipment and cash dividends paid to shareholders.
Many of our subsidiaries are subject to various government regulations that restrict the timing and amount of dividends and other distributions that may be paid to their respective parent companies. Certain accounting practices prescribed by insurance regulatory authorities, or statutory accounting practices, differ from GAAP. Changes that occur in statutory accounting practices, if any, or other regulatory requirements, could impact our subsidiaries’ future dividend capacity. In addition, we have agreed to certain
undertakings to regulatory authorities, including the requirement to maintain certain capital levels in certain of our subsidiaries.
At December 31, 2020,2022, we held $1,747$1,209 of cash, cash equivalents and investments at the parent company, which are available for general corporate use, including investment in our businesses, acquisitions, potential future common stock repurchases and dividends to shareholders, repurchases of debt securities and debt and interest payments.
Debt
Periodically, we access capital markets and issue debt (“Notes”) for long-term borrowing purposes, for example, to refinance debt, to finance acquisitions or for share repurchases. Certain of these Notes may have a call feature that allows us to redeem the Notes at any time at our option and/or a put feature that allows a Note holder to redeem the Notes upon the occurrence of both a change in control event and a downgrade of the Notes below an investment grade rating. For more information on our debt, including redemptions and issuances, see Note 13, “Debt” of the Notes to Consolidated Financial Statements included in Part II, Item 8 of this Annual Report on Form 10-K.
We calculate our consolidated debt-to-capital ratio, a non-GAAP measure, from the amounts presented on our audited consolidated balance sheets included in Part II, Item 8 of this Annual Report on Form 10-K. Our debt-to-capital ratio is calculated as total debt divided by total debt plus total shareholders’ equity. Total debt is the sum of short-term borrowings, current portion of long-term debt and long-term debt, less current portion, and lease liabilities.portion. We believe our debt-to-capital ratio assists investors and rating agencies in measuring our overall leverage and additional borrowing capacity. In addition, our bank covenants include a maximum debt-to-capital ratio that we cannot and did not exceed. Our debt-to-capital ratio may not be comparable to similarly titled measures reported by other companies. Our consolidated debt-to-capital ratio was 38.7%39.9% and 39.5%38.9% as of December 31, 20202022 and 2019,2021, respectively.
Our senior debt is rated “A” by S&P Global Ratings, “BBB” by Fitch Ratings, Inc., “Baa2” by Moody’s Investor Service, Inc. and “bbb+” by AM Best Company, Inc. We intend to maintain our senior debt investment grade ratings. If our credit ratings are downgraded, our business, liquidity, financial condition and results of operations could be adversely impacted by limitations on future borrowings and a potential increase in our borrowing costs.
Future Sources and Uses of LiquidityCapital Resources
We have a shelf registration statement on file with the SECSecurities and Exchange Commission to register an unlimited amount of any combination of debt or equity securities in one or more offerings. Specific information regarding terms and securities being offered will be provided at the time of an offering. Proceeds from future offerings are expected to be used for
general corporate purposes, including, but not limited to, the repayment of debt, investments in or extensions of credit to our subsidiaries and the financing of possible acquisitions or business expansions.
We have a senior revolving credit facility (the “5-Year Facility”) with a group of lenders for general corporate purposes. In June 2019,April 2022, we amended and restated the credit agreement for the 5-Year Facility to, among other things, extend the maturity date of the 5-Year Facility from August 2020 to June 2024 to April 2027 and decreaseincrease the amount of credit available under the 5-Year Facility from $3,500$2,500 to $2,500. In June 2019,$4,000. Also in April 2022, concurrently with the amendment and restatement of the 5-Year Facility, we also entered into aterminated our 364-day senior revolving credit facility (the “364-Day Facility”) with a group of lenders for general corporate purposes, which providesthat provided for credit in the amount of $1,000. In May 2020, we amended and extended the 364-Day Facility,$1,000, which now matureswas scheduled to mature in June 2021.2022. Our ability to borrow under these credit facilitiesthe 5-Year Facility is subject to compliance with certain covenants.covenants, including covenants requiring us to maintain a defined debt-to-capital ratio of not more than 60%, subject to increase in certain circumstances set forth in the credit agreement for the 5-Year Facility. We do not believe the restrictions contained in theseour 5-Year Facility covenants materially affect our financial or operating flexibility. As of December 31, 2020,2022, we were in compliance with all of our debt covenants.covenants under the 5-Year Facility. There were no amounts outstanding under the 5-Year Facility or the 364-Day Facility at December 31, 2020.2022.
Through certain subsidiaries, we have entered into multiple 364-day lines of credit (the “Subsidiary Credit Facilities”) with separate lenders for general corporate purposes. The Subsidiary Credit Facilities provide combined credit up to $300.$200. Our ability to borrow under the Subsidiary Credit Facilities is subject to compliance with certain covenants. At December 31, 2020,2022, we had no outstanding borrowings under the Subsidiary Credit Facilities.
We have a $3,500an authorized commercial paper program of up to $4,000, the proceeds of which may be used for general corporate purposes. In July 2022, we increased the amount available under the commercial paper program from $3,500 to $4,000. Should commercial paper issuance bebecome unavailable, we have the ability to use a combination of cash on hand and/or our two senior revolving credit facilities,5-Year Facility, which provideprovides for combined credit in the amount of $3,500,$4,000, to redeem any outstanding commercial
paper upon maturity. At December 31, 2022, we had $0 outstanding under our commercial paper program.
While there is no assurance in the current economic environment, we believe the lenders participating in our credit facilities,5-Year Facility and Subsidiary Credit Facilities, if market conditions allow, would be willing to provide financing in accordance with their legal obligations. At December 31, 2020, we had $250 outstanding under our commercial paper program.
We are a member, through certain subsidiaries, of the Federal Home Loan Bank of Indianapolis, the Federal Home Loan Bank of Cincinnati, the Federal Home Loan Bank of Atlanta and the Federal Home Loan Bank of New York collectively (the(collectively the “FHLBs”). As a member, we have the ability to obtain short-term cash advances, subject to certain minimum collateral requirements. At December 31, 2020,2022, we had no$265 of outstanding short-term borrowings from the FHLBs.
As discussed in “Financial Condition” above, many of our subsidiaries are subject to various government regulations that restrict the timing and amount of dividends and other distributions that may be paid. Based upon these requirements, we currently estimate that approximately $2,505$3,500 of dividends will be paid to the parent companyus by our subsidiaries during 2021.2023. During 2020,2022, we received $3,618$3,097 of dividends from our subsidiaries.
We regularly review the appropriate use of capital, including acquisitions, common stock and debt security repurchases and dividends to shareholders. The declaration and payment of any dividends or repurchases of our common stock or debt is at the discretion of our Board of Directors and depends upon our financial condition, results of operations, future liquidity needs, regulatory and capital requirements and other factors deemed relevant by our Board of Directors.
On January 26, 2021, our Audit Committee declared a quarterly cash dividend to shareholders of $1.13 per share on the outstanding shares of our common stock. This quarterly dividend is payable on March 25, 2021 to the shareholders of record as of March 10, 2021.
Under our Board of Directors’ authorization, we maintain a common stock repurchase program. As of December 31, 2020, we had Board authorization of $1,092 to repurchase our common stock. On January 26, 2021, our Audit Committee, pursuant to authorization granted by the Board of Directors, authorized a $5,000 increase to our common stock repurchase program.
For additional information regarding our sources and uses of capital, see Note 5, “Investments,” Note 6, “Derivative Financial Instruments,” Note 13, “Debt” and Note 15, “Capital Stock–Use of Capital–Dividends and Stock Repurchase Program” of the Notes to Consolidated Financial Statements included in Part II, Item 8 of this Annual Report on Form 10-K.
Contractual Obligations and Commitments
Our estimated contractual obligations and commitments as of December 31, 2020 are as follows:
| | | | | | | | | | | | | | | | | | | | | | | | | | | | | | | | |
| | | | | Payments Due by Period |
| Total | | Less than
1 Year | | 1-3 Years | | 3-5 Years | | More than
5 Years |
| On-Balance Sheet: | | | | | | | | | |
Debt1 | $ | 31,066 | | | $ | 1,679 | | | $ | 3,953 | | | $ | 17,641 | | | $ | 7,793 | |
Operating leases, including imputed interest2 | 982 | | | 197 | | | 336 | | | 213 | | | 236 | |
Investment commitments3 | 20 | | | 11 | | | 7 | | | 1 | | | 1 | |
Other long-term liabilities4 | 716 | | | 9 | | | 284 | | | 281 | | | 142 | |
| Off-Balance Sheet: | | | | | | | | | |
Purchase obligations5 | 5,761 | | | 975 | | | 3,143 | | | 1,523 | | | 120 | |
Operating leases, including imputed interest2 | 139 | | | 6 | | | 24 | | | 24 | | | 85 | |
Investment commitments6 | 1,320 | | | 270 | | | 448 | | | 61 | | | 541 | |
| Total contractual obligations and commitments | $ | 40,004 | | | $ | 3,147 | | | $ | 8,195 | | | $ | 19,744 | | | $ | 8,918 | |
| | | | | | | | | | |
1Includes estimated interest expense.
2See Note 18, “Leases,” of the Notes to Consolidated Financial Statements, included in Part II, Item 8 of this Annual Report on Form 10-K.
3Represents low income housing tax credits.
4Primarily consists of reserves for future policy benefits, projected other postretirement benefits, deferred compensation, supplemental executive retirement plan liabilities and certain other miscellaneous long-term obligations. Estimated future payments for funded pension benefits have been excluded from this table, as we had no funding requirements under ERISA at December 31, 2020 as a result of the value of the assets in the plans.
5Includes estimated payments for future services under contractual arrangements from third-party service contracts.
6Includes unfunded capital commitments for alternative investments.
The above table does not contain $282 of gross liabilities for uncertain tax positions and interest for which we cannot reasonably estimate the timing of the resolutions with the respective taxing authorities. For further information, see Note 8, “Income Taxes,” of the Notes to Consolidated Financial Statements included in Part II, Item 8 of this Annual Report on Form 10-K.
In addition to regulations regarding the contractual obligationstiming and commitments discussed above, we have a varietyamount of other contractual agreements related to acquiring materials and services used individends, our operations. However, we do not believe these other agreements contain material noncancelable commitments.
We believe that funds from future operating cash flows, cash and investments and funds available under our senior revolving credit facilities and/or from public or private financing sources will be sufficient for future operations and commitments, and for capital acquisitions and other strategic transactions.
Off-Balance Sheet Arrangements
We do not have any off-balance sheet derivative instruments, guarantee transactions, agreements or other contractual arrangements or any indemnification agreements that will require funding in future periods. We have not transferred assets to an unconsolidated entity that serves as credit, liquidity or market risk support to such entity. We do not hold any variable interest in an unconsolidated entity where such entity provides us with financing, liquidity, market risk or credit risk support.
Risk-Based Capital
Our regulated subsidiaries’ states of domicile have statutory risk-based capital (“RBC”) requirements for health and other insurance companies and HMOshealth maintenance organizations largely based on the National Association of Insurance Commissioners (“NAIC”) Risk-Based Capital (RBC) For Health Organizations Model Act (“RBC Model Act”). These RBC requirements are intended to measure capital adequacy, taking into account the risk characteristics of an insurer’s investments and products. The NAIC sets forth the formula for calculating the RBC requirements, which are designed to take into account asset risks, insurance risks, interest rate risks and other relevant risks with respect to an individual insurance company’s business. In general, under the RBC Model Act, an insurance company must submit a report of its RBC level to the state insurance department or insurance commissioner, as appropriate, at the end of each calendar year. Our regulated subsidiaries’ respective RBC levels as of December 31, 2020,2022, which was the most recent date for which reporting was required, were in excess of all applicable mandatory RBC requirements. In addition to exceeding these RBC requirements, we are in compliance with the liquidity and capital requirements for a licensee of the BCBSA and with the tangible net worth requirements applicable to certain of our California subsidiaries.
For additional information, see Note 22, “Statutory Information,” of the Notes to Consolidated Financial Statements included in Part II, Item 8 of this Annual Report on Form 10-K.
Future Sources and Uses of Liquidity
Short-Term Liquidity Requirements
As previously described, our cash disbursements result mainly from claims payments, administrative expenses, taxes, purchases of investment securities, interest expense, payments on borrowings, acquisitions, capital expenditures, repurchases of our debt securities and common stock and the payment of cash dividends. We believe cash on hand, operating cash receipts, investments and amounts available under our commercial paper program, our 5-Year Facility and our Subsidiary Credit Facilities and borrowings available from the FHLBs will be adequate to fund our expected cash disbursements over the next twelve months.
Long-Term Liquidity Requirements
As of December 31, 2022, our long-term cash disbursements required under various contractual obligations and commitments were:
•Debt and interest expense: Future debt and estimated interest payments were $25,804, with $2,674 due within the next twelve months. For additional information, see Note 13 “Debt” of the Notes to Consolidated Financial Statements included in Part II, Item 8 of this Annual Report on Form 10-K.
•Operating leases: We lease office space and certain computer equipment, for which the future estimated payments were $1,028, with $206 due within the next twelve months. For additional information, see Note 18 “Leases” of the Notes to Consolidated Financial Statements included in Part II, Item 8 of this Annual Report on Form 10-K.
•Other liabilities: These liabilities primarily consist of future policy reserves, projected other postretirement benefits, deferred compensation, supplemental executive retirement plan liabilities and certain other miscellaneous long-term obligations. Amounts due within twelve months were $26, with $1,040 due in future periods. Estimated future payments for funded pension benefits have been excluded from these numbers, as we had no funding requirements under the Employee Retirement Income Security Act of 1974, as amended, at December 31, 2022, as a result of the value of the assets in the plans. In addition, gross liabilities for uncertain tax positions and interest for which we cannot reasonably estimate the timing of the resolutions with the respective taxing authorities have not been included. For further information, see Note 8, “Income Taxes,” of the Notes to Consolidated Financial Statements included in Part II, Item 8 of this Annual Report on Form 10-K.
•Purchase obligations: These obligations include estimated payments for future services under contractual arrangements from third-party service vendors. Amounts due within the next twelve months for these purchase obligations were $1,124, while longer term payments were $2,927. For further information, see Note 14, “Commitments and Contingencies,” of the Notes to Consolidated Financial Statements included in Part II, Item 8 of this Annual Report on Form 10-K.
•Investment commitments: These include unfunded capital commitments for alternative investments and low-income housing tax credits. Estimated amounts due were $1,504, including $314 due within the next twelve months.
In addition to the contractual obligations and commitments discussed above, we have a variety of other contractual agreements related to acquiring materials and services used in our operations. However, we do not believe these other agreements contain material noncancelable commitments.
We regularly review the appropriate use of capital, including acquisitions, common stock and debt security repurchases and dividends to shareholders. The declaration and payment of any dividends or repurchases of our common stock or debt is at the discretion of our Board of Directors and depends upon our financial condition, results of operations, future liquidity needs, regulatory and capital requirements and other factors deemed relevant by our Board of Directors.
On January 24, 2023, our Audit Committee declared a quarterly cash dividend to shareholders of $1.48 per share on the outstanding shares of our common stock. This quarterly dividend is payable on March 24, 2023 to the shareholders of record as of March 10, 2023.
Under our Board of Directors’ authorization, we maintain a common stock repurchase program. As of December 31, 2022, we had Board authorization of $1,876 to repurchase our common stock. On January 24, 2023, our Audit Committee,
pursuant to authorization granted by the Board of Directors, authorized a $5,000 increase to our common stock repurchase program. No duration has been placed on our common stock repurchase program, and we reserve the right to discontinue the program at any time. We intend to utilize this authorization over a multi-year period, subject to market and industry conditions.
We believe that funds from future operating cash flows, cash and investments and funds available under our credit facilities and/or from public or private financing sources will be sufficient for future operations and commitments, and for capital acquisitions and other strategic transactions.
We do not have any off-balance sheet derivative instruments, guarantee transactions, agreements or other contractual arrangements or any indemnification agreements that will require funding in future periods. We have not transferred assets to an unconsolidated entity that serves as credit, liquidity or market risk support to such entity. We do not hold any variable interest in an unconsolidated entity where such entity provides us with financing, liquidity, market risk or credit risk support. See Note 2 “Subsidiary Transactions” of the Notes to Condensed Financial Statements included in Part IV, Item 15 of this Annual Report on Form 10-K for additional detail on the Elevance Health, Inc. parent guarantees of certain subsidiaries.
ITEM 7A. QUANTITATIVE AND QUALITATIVE DISCLOSURES ABOUT MARKET RISK.
(In Millions, Except As Otherwise Stated Herein)
As a result of our investing and borrowing activities, we are exposed to financial market risks, including those resulting from changes in interest rates and changes in market valuations. Potential impacts discussed below are based upon sensitivity analyses performed on our financial position as of December 31, 2020.2022. Actual results could vary from these estimates. Our primary objectives with our investment portfolio are to provide safety and preservation of capital, sufficient liquidity to meet cash flow requirements, the integration of investment strategy with the business operations and an attainment of a competitive after-tax total return.
Investments
Our investment portfolio is exposed to three primary sources of risk: credit quality risk, interest rate risk and market valuation risk.
The primary risks associated with our fixed maturity securities, which are classified as available-for-sale, are credit quality risk and interest rate risk. Credit quality risk is defined as the risk of a credit event, such as a ratings downgrade or default, to an individual fixed maturity security and the potential loss attributable to that event. Credit quality risk is managed through our investment policy, which establishes credit quality limitations on the overall portfolio as well as diversification and percentage limits on securities of individual issuers. The result is a well-diversified portfolio of fixed maturity securities, with an average credit rating of approximately “A.” Interest rate risk is defined as the potential for economic losses on fixed maturity securities due to a change in market interest rates. Our fixed maturity portfolio is invested primarily in U.S. government securities, corporate bonds, asset-backed bonds, mortgage-related securities and municipal bonds, all of which have exposure to changes in the level of market interest rates. Interest rate risk is managed by maintaining asset duration within a band based upon our liabilities, operating performance and liquidity needs. Additionally, we have the capability of holding any security to maturity, which would allow us to realize full par value.
Investments in fixed maturity securities include corporate securities, which account for 45.4%46.9% of our total fixed maturity securities at December 31, 20202022 and are subject to credit/default risk. In a declining economic environment, corporate yields will usually increase, prompted by concern over the ability of corporations to make interest payments, thus causing a decrease in the price of corporate securities, and the decline in value of the corporate fixed maturity portfolio. We manage this risk through fundamental credit analysis, diversification of issuers and industries and an average credit rating of our corporate fixed maturity portfolio of approximately “BBB.”
Market risk for fixed maturity securities is addressed by actively managing the duration, allocation and diversification of our investment portfolio. We have evaluated the impact on the fixed maturity portfolio’s fair value considering an immediate 100 basis point change in interest rates. A 100 basis point increase in interest rates would result in an approximate $998$1,088 decrease in fair value, whereas a 100 basis point decrease in interest rates would result in an approximate $1,039$1,154 increase in fair value. While we classify our fixed maturity securities as “available-for-sale” for accounting purposes, we believe our
cash flows and the duration of our portfolio should allow us to hold securities to maturity, thereby avoiding the recognition of losses should interest rates rise significantly.
Our equity portfolio is comprised of large capitalization and small capitalization domestic equities, foreign equities, exchange-traded funds and index mutual funds. Our equity portfolio is subject to the volatility inherent in the stock market, driven by concerns over economic conditions, earnings and sales growth, inflation, and consumer confidence. These systemic risks cannot be managed through diversification alone. However, more routine risks, such as stock/industry specific risks, are managed by investing in a diversified equity portfolio.
Our other invested assets, reported within our long-term investments, are primarily subject to private market exposures, including private equity real estate, and private credit investments. These investments are also indirectly subject to market valuation risk, as public market valuations will form a basis for valuations for these investments. Given their illiquid nature, we focus on appropriate sizing of these investments relative to our liquidity needs and risk tolerance. Our risk tolerance is formed by the level of illiquidity and short-term price movements from market valuation risk we are willing to accept relative to the higher long-term expected returns over the life of these investments.
As of December 31, 2020, 6.1%2022, 3.4% of our marketable investments were equity securities. An immediate 10% decrease in each equity investment’s value, arising from market movement, would result in a fair value decrease of $156.$95. Alternatively, an immediate 10% increase in each equity investment’s value, attributable to the same factor, would result in a fair value increase of $156.$95.
For additional information regarding our investments, see Note 5, “Investments,” of the Notes to Consolidated Financial Statements included in Part II, Item 8 and “Critical Accounting Policies and Estimates - Investments” within Part II, Item 7 “Management’s Discussion and Analysis of Financial Condition and Results of Operations” included in this Annual Report on Form 10-K.
Long-Term Debt
Our total long-term debt at December 31, 20202022 consisted of senior unsecured notes, convertible debentures, commercial paper and subordinated surplus notes issued by one of our insurance subsidiaries. At December 31, 2020,2022, the carrying value and estimated fair value of our long-term debt was $20,035$23,849 and $24,269,$22,324 respectively. This debt is subject to interest rate risk, as these instruments have fixed interest rates and the fair value is affected by changes in market interest rates. Should interest rates increase or decrease in the future, the estimated fair value of our fixed rate debt would decrease or increase accordingly.
For additional information regarding our long-term debt, see Note 7, “Fair Value” and Note 13, “Debt,” of the Notes to Consolidated Financial Statements included in Part II, Item 8 of this Annual Report on Form 10-K.
Derivatives
We have exposure to economic losses due to interest rate risk arising from changes in the level or volatility of interest rates. We attempt to mitigate our exposure to interest rate risk through the use of derivative financial instruments. These strategies include the use of interest rate swaps and forward contracts, which are used to lock-in interest rates or to hedge (on an economic basis) interest rate risks associated with variable rate debt. We have used these types of instruments as designated hedges against specific liabilities.
Changes in interest rates will affect the estimated fair value of these derivatives. As of December 31, 2020,2022, we recorded a net assetliability of $37,$57, the estimated fair value of the swaps at that date. We have evaluated the impact on the interest rate swaps’ fair value considering an immediate 100 basis point change in interest rates. A 100 basis point increase in interest rates would result in an approximate $18$39 decrease in fair value, whereas a 100 basis point decrease in interest rates would result in an approximate $18$39 increase in fair value.
For additional information regarding our derivatives, see Note 6, “Derivative Financial Instruments” of the Notes to Consolidated Financial Statements included in Part II, Item 8 of this Annual Report on Form 10-K.
ITEM 8. FINANCIAL STATEMENTS AND SUPPLEMENTARY DATA.
ANTHEM, INC.Elevance Health, Inc.
CONSOLIDATED FINANCIAL STATEMENTS
Years ended December 31, 2020, 20192022, 2021 and 20182020
Contents
| | | | | |
| Report of Independent Registered Public Accounting Firm (PCAOB ID:42) | |
| |
| Audited Consolidated Financial Statements: | |
| Consolidated Balance Sheets | |
| Consolidated Statements of Income | |
| Consolidated Statements of Comprehensive Income | |
| Consolidated Statements of Cash Flows | |
| Consolidated Statements of Shareholders’ Equity | |
| Notes to Consolidated Financial Statements | |
Report of Independent Registered
Public Accounting Firm
To the Shareholders and the Board of Directors of Anthem,Elevance Health, Inc.
Opinion on the Financial Statements
We have audited the accompanying consolidated balance sheets of Anthem,Elevance Health, Inc. (the Company) as of December 31, 20202022 and 2019,2021, the related consolidated statements of income, comprehensive income, shareholders’ equity, and cash flows for each of the three years in the period ended December 31, 2020,2022, and the related notes and financial statement schedule listed in the Index at Item 15(c) (collectively referred to as the “consolidated financial statements”). In our opinion, the consolidated financial statements present fairly, in all material respects, the financial position of the Company at December 31, 20202022 and 2019,2021, and the results of its operations and its cash flows for each of the three years in the period ended December 31, 2020,2022, in conformity with U.S. generally accepted accounting principles.
We also have audited, in accordance with the standards of the Public Company Accounting Oversight Board (United States) (PCAOB), the Company’s internal control over financial reporting as of December 31, 2020,2022, based on criteria established in Internal Control—IntegratedControl-Integrated Framework issued by the Committee of Sponsoring Organizations of the Treadway Commission (2013 framework), and our report dated February 18, 202115, 2023 expressed an unqualified opinion thereon.
Basis for Opinion
These financial statements are the responsibility of the Company’s management. Our responsibility is to express an opinion on the Company’s financial statements based on our audits. We are a public accounting firm registered with the PCAOB and are required to be independent with respect to the Company in accordance with the U.S. federal securities laws and the applicable rules and regulations of the Securities and Exchange Commission and the PCAOB.
We conducted our audits in accordance with the standards of the PCAOB. Those standards require that we plan and perform the audit to obtain reasonable assurance about whether the financial statements are free of material misstatement, whether due to error or fraud. Our audits included performing procedures to assess the risks of material misstatement of the financial statements, whether due to error or fraud, and performing procedures that respond to those risks. Such procedures included examining, on a test basis, evidence regarding the amounts and disclosures in the financial statements. Our audits also included evaluating the accounting principles used and significant estimates made by management, as well as evaluating the overall presentation of the financial statements. We believe that our audits provide a reasonable basis for our opinion.
Critical Audit Matter
The critical audit matter communicated below is a matter arising from the current period audit of the financial statements that was communicated or required to be communicated to the audit committee and that: (1) relates to accounts or disclosures that are material to the financial statements and (2) involved our especially challenging, subjective, or complex judgments. The communication of the critical audit matter does not alter in any way our opinion on the consolidated financial statements, taken as a whole, and we are not, by communicating the critical audit matter below, providing a separate opinion on the critical audit matter or on the account or disclosures to which it relates.
| | | | | | | | |
| Valuation of Incurred but Not Paid Claims |
| | |
| Description of the Matter | | Medical claims payable was $11,359$15,596 million at December 31, 2020,2022, a significant portion of which related to the Company’s estimate for claims that are incurred but not paid. As discussed in Note 2 to the consolidated financial statements, the Company’s liability for incurred but not paid claims is determined using actuarial methods that include a number of factors and assumptions, including completion factors, which represent the average percentage of total incurred claims that have been paid through a given date after being incurred based on historical paid claims data, and trend factors, which represent an estimate of claims expense based on recent claims expense levels and healthcare cost levels. There is significant uncertainty inherent in determining management’s best estimate of completion and trend factors, which are used to calculate actuarial estimates of incurred but not paid claims. |
| | Auditing management’s estimate of incurred but not paid claims was complex and required the involvement of our actuarial specialists due to the highly judgmental nature of the completion and trend factor assumptions used in the valuation process. The significant judgment was primarily due to the sensitivity of management’s best estimate of completion and trend factor assumptions, which have a significant impact on the valuation of incurred but not paid claims. |
| | |
| How We Addressed the Matter in Our Audit | | We obtained an understanding, evaluated the design and tested the operating effectiveness of controls over the Company’s actuarial process for estimating the liability for incurred but not paid claims. These audit procedures included among others, testing management review controls over completion and trend factor assumptions and the review and approval processes that management has in place for estimating the liability for incurred but not paid claims. |
| | To test the Company’s liability for incurred but not paid claims, our audit procedures included, among others, testing the completeness and accuracy of the underlying claims and membership data recorded in the source claims processing and disbursement systems to the data used by management in developing completion and trend factor assumptions and agreeing a sample of incurred and paid claims to source documentation. With the support of actuarial specialists, we analyzed the Company’s completion and trend factor assumptions based on historical claim experience and emerging cost trends, and independently calculated a range of reasonable reserve estimates for comparison to management’s best estimate of the liability for incurred but not paid claims. Additionally, we performed a review of the prior period liabilities for incurred but not paid claims to subsequent claims development. |
/s/ ERNSTErnst & YOUNGYoung LLP
We have served as the Company’s auditor since 1944.
Indianapolis, Indiana
February 18, 202115, 2023
Anthem,Elevance Health, Inc.
Consolidated Balance Sheets
| | | | | | | | | | | |
| December 31,
2020 | | December 31,
2019 |
| (In millions, except share data) | | | |
| Assets | | | |
| Current assets: | | | |
| Cash and cash equivalents | $ | 5,741 | | | $ | 4,937 | |
| Fixed maturity securities, current (amortized cost of $22,222 and $19,021; allowance for credit losses of $7 and $0) | 23,433 | | | 19,676 | |
| Equity securities | 1,559 | | | 1,009 | |
| | | |
| | | |
| Premium receivables | 5,279 | | | 5,014 | |
| Self-funded receivables | 2,849 | | | 2,570 | |
| Other receivables | 2,830 | | | 2,807 | |
| | | |
| | | |
| Other current assets | 4,060 | | | 3,020 | |
| | | |
| Total current assets | 45,751 | | | 39,033 | |
| Long-term investments: | | | |
| Fixed maturity securities (amortized cost of $532 and $487; allowance for credit losses of $0 and $0) | 562 | | | 505 | |
| | | |
| Other invested assets | 4,285 | | | 4,258 | |
| Property and equipment, net | 3,483 | | | 3,133 | |
| Goodwill | 21,691 | | | 20,500 | |
| Other intangible assets | 9,405 | | | 8,674 | |
| Other noncurrent assets | 1,438 | | | 1,350 | |
| Total assets | $ | 86,615 | | | $ | 77,453 | |
| | | |
| Liabilities and shareholders’ equity | | | |
| Liabilities | | | |
| Current liabilities: | | | |
| Medical claims payable | $ | 11,359 | | | $ | 8,842 | |
| | | |
| Other policyholder liabilities | 4,590 | | | 3,050 | |
| Unearned income | 1,259 | | | 1,017 | |
| Accounts payable and accrued expenses | 5,493 | | | 4,198 | |
| | | |
| | | |
| Short-term borrowings | 0 | | | 700 | |
| Current portion of long-term debt | 700 | | | 1,598 | |
| Other current liabilities | 6,052 | | | 4,127 | |
| | | |
| Total current liabilities | 29,453 | | | 23,532 | |
| Long-term debt, less current portion | 19,335 | | | 17,787 | |
| Reserves for future policy benefits | 794 | | | 759 | |
| Deferred tax liabilities, net | 2,019 | | | 2,227 | |
| Other noncurrent liabilities | 1,815 | | | 1,420 | |
| Total liabilities | 53,416 | | | 45,725 | |
| | | |
| Commitments and contingencies—Note 14 | 0 | | 0 |
| Shareholders’ equity | | | |
| Preferred stock, without par value, shares authorized - 100,000,000; shares issued and outstanding - none | 0 | | | 0 | |
| Common stock, par value $0.01, shares authorized - 900,000,000; shares issued and outstanding - 245,401,430 and 252,922,161 | 3 | | | 3 | |
| Additional paid-in capital | 9,244 | | | 9,448 | |
| Retained earnings | 23,802 | | | 22,573 | |
| Accumulated other comprehensive income (loss) | 150 | | | (296) | |
| Total shareholders’ equity | 33,199 | | | 31,728 | |
| Total liabilities and shareholders’ equity | $ | 86,615 | | | $ | 77,453 | |
| | | | | | | | | | | |
| December 31,
2022 | | December 31,
2021 |
| (In millions, except share data) | | | |
| Assets | | | |
| Current assets: | | | |
| Cash and cash equivalents | $ | 7,387 | | | $ | 4,880 | |
| Fixed maturity securities (amortized cost of $28,226 and $25,641; allowance for credit losses of $9 and $6) | 25,952 | | | 26,267 | |
| Equity securities | 953 | | | 1,881 | |
| | | |
| | | |
| Premium receivables | 7,083 | | | 5,681 | |
| Self-funded receivables | 4,663 | | | 4,010 | |
| Other receivables | 4,298 | | | 3,749 | |
| | | |
| | | |
| Other current assets | 5,281 | | | 4,654 | |
| | | |
| Total current assets | 55,617 | | | 51,122 | |
| Long-term investments: | | | |
| Fixed maturity securities (amortized cost of $789 and $616; allowance for credit losses of $0 and $0) | 752 | | | 632 | |
| Other invested assets | 5,685 | | | 5,225 | |
| Property and equipment, net | 4,316 | | | 3,919 | |
| Goodwill | 24,383 | | | 24,228 | |
| Other intangible assets | 10,315 | | | 10,615 | |
| Other noncurrent assets | 1,704 | | | 1,719 | |
| Total assets | $ | 102,772 | | | $ | 97,460 | |
| | | |
| Liabilities and equity | | | |
| Liabilities | | | |
| Current liabilities: | | | |
| Medical claims payable | $ | 15,596 | | | $ | 13,518 | |
| | | |
| Other policyholder liabilities | 5,933 | | | 5,521 | |
| Unearned income | 1,112 | | | 1,153 | |
| Accounts payable and accrued expenses | 5,607 | | | 4,970 | |
| | | |
| | | |
| Short-term borrowings | 265 | | | 275 | |
| Current portion of long-term debt | 1,500 | | | 1,599 | |
| Other current liabilities | 9,683 | | | 7,849 | |
| | | |
| Total current liabilities | 39,696 | | | 34,885 | |
| Long-term debt, less current portion | 22,349 | | | 21,157 | |
| Reserves for future policy benefits | 737 | | | 802 | |
| Deferred tax liabilities, net | 2,034 | | | 2,805 | |
| Other noncurrent liabilities | 1,562 | | | 1,683 | |
| Total liabilities | 66,378 | | | 61,332 | |
| Commitments and Contingencies—Note 14 | | | |
| Shareholders’ equity | | | |
| Preferred stock, without par value, shares authorized - 100,000,000; shares issued and outstanding - none | — | | | — | |
| Common stock, par value $0.01, shares authorized - 900,000,000; shares issued and outstanding - 237,958,067 and 241,770,746 | 2 | | | 2 | |
| Additional paid-in capital | 9,084 | | | 9,148 | |
| Retained earnings | 29,724 | | | 27,088 | |
| Accumulated other comprehensive loss | (2,503) | | | (178) | |
| Total shareholders’ equity | 36,307 | | | 36,060 | |
| Noncontrolling interests | 87 | | | 68 | |
| Total equity | 36,394 | | | 36,128 | |
| Total liabilities and equity | $ | 102,772 | | | $ | 97,460 | |
See accompanying notes.
Anthem,Elevance Health, Inc.
Consolidated Statements of Income
| | | | | | | | | | | | | | | | | |
| | Years Ended December 31 |
| (In millions, except per share data) | 2020 | | 2019 | | 2018 |
| Revenues | | | | | |
| Premiums | $ | 104,109 | | | $ | 94,173 | | | $ | 85,421 | |
| Product revenue | 10,384 | | | 2,760 | | | 0 | |
| Administrative fees and other revenue | 6,315 | | | 6,208 | | | 5,920 | |
| Total operating revenue | 120,808 | | | 103,141 | | | 91,341 | |
| Net investment income | 877 | | | 1,005 | | | 970 | |
| Net realized gains (losses) on financial instruments | 182 | | | 67 | | | (206) | |
| | | | | |
| | | | | |
| | | | | |
| | | | | |
| Total revenues | 121,867 | | | 104,213 | | | 92,105 | |
| Expenses | | | | | |
| Benefit expense | 88,045 | | | 81,786 | | | 71,895 | |
| Cost of products sold | 8,953 | | | 1,992 | | | 0 | |
| Selling, general and administrative expense | 17,450 | | | 13,364 | | | 14,020 | |
| Interest expense | 784 | | | 746 | | | 753 | |
| Amortization of other intangible assets | 361 | | | 338 | | | 358 | |
| Loss on extinguishment of debt | 36 | | | 2 | | | 11 | |
| Total expenses | 115,629 | | | 98,228 | | | 87,037 | |
| Income before income tax expense | 6,238 | | | 5,985 | | | 5,068 | |
| Income tax expense | 1,666 | | | 1,178 | | | 1,318 | |
| | | | | |
| | | | | |
| Net income | $ | 4,572 | | | $ | 4,807 | | | $ | 3,750 | |
| Net income per share | | | | | |
| | | | | |
| | | | | |
| Basic | $ | 18.23 | | | $ | 18.81 | | | $ | 14.53 | |
| | | | | |
| | | | | |
| | | | | |
| Diluted | $ | 17.98 | | | $ | 18.47 | | | $ | 14.19 | |
| Dividends per share | $ | 3.80 | | | $ | 3.20 | | | $ | 3.00 | |
| | | | | | | | | | | | | | | | | |
| | Years Ended December 31 |
| (In millions, except per share data) | 2022 | | 2021 | | 2020 |
| Revenues | | | | | |
| Premiums | $ | 133,229 | | | $ | 117,373 | | | $ | 104,109 | |
| Product revenue | 14,978 | | | 12,657 | | | 10,384 | |
| Administrative fees and other revenue | 7,453 | | | 6,913 | | | 6,315 | |
| Total operating revenue | 155,660 | | | 136,943 | | | 120,808 | |
| Net investment income | 1,485 | | | 1,378 | | | 877 | |
| Net (losses) gains on financial instruments | (550) | | | 318 | | | 182 | |
| | | | | |
| | | | | |
| | | | | |
| | | | | |
| Total revenues | 156,595 | | | 138,639 | | | 121,867 | |
| Expenses | | | | | |
| Benefit expense | 116,487 | | | 102,645 | | | 88,045 | |
| Cost of products sold | 13,035 | | | 10,895 | | | 8,953 | |
| Selling, general and administrative expense | 17,686 | | | 15,914 | | | 17,450 | |
| Interest expense | 851 | | | 798 | | | 784 | |
| Amortization of other intangible assets | 767 | | | 441 | | | 361 | |
| Loss on extinguishment of debt | — | | | 21 | | | 36 | |
| Total expenses | 148,826 | | | 130,714 | | | 115,629 | |
| Income before income tax expense | 7,769 | | | 7,925 | | | 6,238 | |
| Income tax expense | 1,750 | | | 1,830 | | | 1,666 | |
| | | | | |
| | | | | |
| Net income | 6,019 | | | 6,095 | | | 4,572 | |
| Net loss attributable to noncontrolling interests | 6 | | | 9 | | | — | |
| Shareholders’ net income | $ | 6,025 | | | $ | 6,104 | | | $ | 4,572 | |
| Shareholders’ net income per share | | | | | |
| | | | | |
| | | | | |
| Basic | $ | 25.10 | | | $ | 25.04 | | | $ | 18.23 | |
| | | | | |
| | | | | |
| | | | | |
| Diluted | $ | 24.81 | | | $ | 24.73 | | | $ | 17.98 | |
| Dividends per share | $ | 5.12 | | | $ | 4.52 | | | $ | 3.80 | |
See accompanying notes.
Anthem,Elevance Health, Inc.
Consolidated Statements of Comprehensive Income
| | | | | Years Ended December 31 | | Years Ended December 31 |
| (In millions) | (In millions) | | 2020 | | 2019 | | 2018 | (In millions) | 2022 | | 2021 | | 2020 |
| Net income | Net income | | $ | 4,572 | | | $ | 4,807 | | | $ | 3,750 | | Net income | $ | 6,019 | | | $ | 6,095 | | | $ | 4,572 | |
| Other comprehensive income (loss), net of tax: | | |
| Other comprehensive (loss) income, net of tax: | | Other comprehensive (loss) income, net of tax: | |
| Change in net unrealized gains/losses on investments | Change in net unrealized gains/losses on investments | | 428 | | | 680 | | | (418) | | Change in net unrealized gains/losses on investments | (2,260) | | | (457) | | | 428 | |
| Change in non-credit component of impairment losses on investments | Change in non-credit component of impairment losses on investments | | 0 | | | 0 | | | (2) | | Change in non-credit component of impairment losses on investments | (3) | | | 2 | | | — | |
| Change in net unrealized gains/losses on cash flow hedges | Change in net unrealized gains/losses on cash flow hedges | | 12 | | | (16) | | | 37 | | Change in net unrealized gains/losses on cash flow hedges | 10 | | | 11 | | | 12 | |
| Change in net periodic pension and postretirement costs | Change in net periodic pension and postretirement costs | | (1) | | | 26 | | | (90) | | Change in net periodic pension and postretirement costs | (70) | | | 123 | | | (1) | |
| Foreign currency translation adjustments | Foreign currency translation adjustments | | 7 | | | 0 | | | (1) | | Foreign currency translation adjustments | (13) | | | (9) | | | 7 | |
| Other comprehensive income (loss) | | 446 | | | 690 | | | (474) | | |
| Total comprehensive income | | $ | 5,018 | | | $ | 5,497 | | | $ | 3,276 | | |
| Other comprehensive (loss) income | | Other comprehensive (loss) income | (2,336) | | | (330) | | | 446 | |
| Net loss attributable to noncontrolling interests | | Net loss attributable to noncontrolling interests | 6 | | | 9 | | | — | |
| Other comprehensive loss attributable to noncontrolling interests | | Other comprehensive loss attributable to noncontrolling interests | 11 | | | 2 | | | — | |
| Total shareholders’ comprehensive income | | Total shareholders’ comprehensive income | $ | 3,700 | | | $ | 5,776 | | | $ | 5,018 | |
See accompanying notes.
Anthem,Elevance Health, Inc.
Consolidated Statements of Cash Flows
| | | | Years Ended December 31 | | Years Ended December 31 |
| (In millions) | (In millions) | 2020 | | 2019 | | 2018 | (In millions) | 2022 | | 2021 | | 2020 |
| Operating activities | Operating activities | | | | | | Operating activities | | | | | |
| Net income | Net income | $ | 4,572 | | | $ | 4,807 | | | $ | 3,750 | | Net income | $ | 6,019 | | | $ | 6,095 | | | $ | 4,572 | |
| Adjustments to reconcile net income to net cash provided by operating activities: | Adjustments to reconcile net income to net cash provided by operating activities: | | Adjustments to reconcile net income to net cash provided by operating activities: | |
| Net realized (gains) losses on financial instruments | (182) | | | (67) | | | 206 | | |
| Net losses (gains) on financial instruments | | Net losses (gains) on financial instruments | 550 | | | (318) | | | (182) | |
| Equity in net earnings of other invested assets | | Equity in net earnings of other invested assets | (293) | | | (562) | | | (51) | |
| Depreciation and amortization | Depreciation and amortization | 1,154 | | | 1,133 | | | 1,132 | | Depreciation and amortization | 1,675 | | | 1,302 | | | 1,154 | |
| | Deferred income taxes | Deferred income taxes | (540) | | | 81 | | | 91 | | Deferred income taxes | (76) | | | 326 | | | (540) | |
| Impairment of property and equipment | Impairment of property and equipment | 198 | | | 0 | | | 0 | | Impairment of property and equipment | 7 | | | 73 | | | 198 | |
| Share-based compensation | Share-based compensation | 283 | | | 294 | | | 226 | | Share-based compensation | 264 | | | 255 | | | 283 | |
| Changes in operating assets and liabilities: | Changes in operating assets and liabilities: | | Changes in operating assets and liabilities: | |
| Receivables, net | Receivables, net | (256) | | | (1,053) | | | (695) | | Receivables, net | (2,510) | | | (2,138) | | | (256) | |
| Other invested assets | Other invested assets | (32) | | | (48) | | | (1) | | Other invested assets | 11 | | | (70) | | | (32) | |
| Other assets | Other assets | (283) | | | (170) | | | (26) | | Other assets | 120 | | | 37 | | | (283) | |
| Policy liabilities | Policy liabilities | 3,528 | | | 1,826 | | | (1,059) | | Policy liabilities | 2,254 | | | 2,597 | | | 3,528 | |
| Unearned income | Unearned income | 202 | | | 115 | | | (36) | | Unearned income | (42) | | | (113) | | | 202 | |
| Accounts payable and other liabilities | Accounts payable and other liabilities | 1,978 | | | (445) | | | 97 | | Accounts payable and other liabilities | 824 | | | 719 | | | 1,978 | |
| Income taxes | Income taxes | 72 | | | (325) | | | 323 | | Income taxes | (338) | | | 140 | | | 72 | |
| Other, net | Other, net | (6) | | | (87) | | | (181) | | Other, net | (66) | | | 21 | | | 45 | |
| Net cash provided by operating activities | Net cash provided by operating activities | 10,688 | | | 6,061 | | | 3,827 | | Net cash provided by operating activities | 8,399 | | | 8,364 | | | 10,688 | |
| Investing activities | Investing activities | | Investing activities | |
| Purchases of investments | Purchases of investments | (19,492) | | | (22,954) | | | (9,671) | | Purchases of investments | (24,946) | | | (18,669) | | | (19,492) | |
| Proceeds from sale of investments | Proceeds from sale of investments | 11,318 | | | 18,598 | | | 9,662 | | Proceeds from sale of investments | 11,988 | | | 10,269 | | | 11,318 | |
| Maturities, calls and redemptions from investments | Maturities, calls and redemptions from investments | 4,741 | | | 2,437 | | | 1,938 | | Maturities, calls and redemptions from investments | 10,620 | | | 4,344 | | | 4,741 | |
| | Changes in securities lending collateral | Changes in securities lending collateral | (849) | | | 254 | | | (149) | | Changes in securities lending collateral | (301) | | | (956) | | | (849) | |
| Purchases of subsidiaries, net of cash acquired | Purchases of subsidiaries, net of cash acquired | (1,976) | | | 0 | | | (1,760) | | Purchases of subsidiaries, net of cash acquired | (649) | | | (3,476) | | | (1,976) | |
| Purchases of property and equipment | Purchases of property and equipment | (1,021) | | | (1,077) | | | (1,208) | | Purchases of property and equipment | (1,152) | | | (1,087) | | | (1,021) | |
| Other, net | Other, net | (45) | | | (50) | | | (71) | | Other, net | (120) | | | (63) | | | (45) | |
| Net cash used in investing activities | Net cash used in investing activities | (7,324) | | | (2,792) | | | (1,259) | | Net cash used in investing activities | (4,560) | | | (9,638) | | | (7,324) | |
| Financing activities | Financing activities | | Financing activities | |
| Net repayments of commercial paper borrowings | (150) | | | (297) | | | (107) | | |
| Net (repayments of) proceeds from commercial paper borrowings | | Net (repayments of) proceeds from commercial paper borrowings | (300) | | | 50 | | | (150) | |
| Proceeds from long-term borrowings | Proceeds from long-term borrowings | 2,484 | | | 2,473 | | | 835 | | Proceeds from long-term borrowings | 3,071 | | | 3,462 | | | 2,484 | |
| Repayments of long-term borrowings | Repayments of long-term borrowings | (1,932) | | | (1,123) | | | (1,684) | | Repayments of long-term borrowings | (1,899) | | | (1,068) | | | (1,932) | |
| Proceeds from short-term borrowings | Proceeds from short-term borrowings | 970 | | | 7,590 | | | 9,120 | | Proceeds from short-term borrowings | 1,365 | | | 1,325 | | | 970 | |
| Repayments of short-term borrowings | Repayments of short-term borrowings | (1,670) | | | (8,035) | | | (9,250) | | Repayments of short-term borrowings | (1,375) | | | (1,050) | | | (1,670) | |
| Changes in securities lending payable | Changes in securities lending payable | 849 | | | (254) | | | 150 | | Changes in securities lending payable | 302 | | | 956 | | | 849 | |
| Proceeds from issuance of common stock under Equity Units stock purchase contracts | 0 | | | 0 | | | 1,250 | | |
| Changes in bank overdrafts | | Changes in bank overdrafts | 933 | | | (376) | | | 486 | |
| Repurchase and retirement of common stock | Repurchase and retirement of common stock | (2,700) | | | (1,701) | | | (1,685) | | Repurchase and retirement of common stock | (2,316) | | | (1,900) | | | (2,700) | |
| Cash dividends | Cash dividends | (954) | | | (818) | | | (776) | | Cash dividends | (1,229) | | | (1,104) | | | (954) | |
| Proceeds from issuance of common stock under employee stock plans | Proceeds from issuance of common stock under employee stock plans | 176 | | | 187 | | | 173 | | Proceeds from issuance of common stock under employee stock plans | 182 | | | 203 | | | 176 | |
| Taxes paid through withholding of common stock under employee stock plans | Taxes paid through withholding of common stock under employee stock plans | (128) | | | (84) | | | (81) | | Taxes paid through withholding of common stock under employee stock plans | (93) | | | (102) | | | (128) | |
| Other, net | Other, net | 488 | | | (204) | | | (186) | | Other, net | 41 | | | 27 | | | 2 | |
| Net cash used in financing activities | (2,567) | | | (2,266) | | | (2,241) | | |
| Net cash (used in) provided by financing activities | | Net cash (used in) provided by financing activities | (1,318) | | | 423 | | | (2,567) | |
| Effect of foreign exchange rates on cash and cash equivalents | Effect of foreign exchange rates on cash and cash equivalents | 7 | | | 0 | | | (2) | | Effect of foreign exchange rates on cash and cash equivalents | (14) | | | (10) | | | 7 | |
| Change in cash and cash equivalents | Change in cash and cash equivalents | 804 | | | 1,003 | | | 325 | | Change in cash and cash equivalents | 2,507 | | | (861) | | | 804 | |
| Cash and cash equivalents at beginning of year | Cash and cash equivalents at beginning of year | 4,937 | | | 3,934 | | | 3,609 | | Cash and cash equivalents at beginning of year | 4,880 | | | 5,741 | | | 4,937 | |
| Cash and cash equivalents at end of year | Cash and cash equivalents at end of year | $ | 5,741 | | | $ | 4,937 | | | $ | 3,934 | | Cash and cash equivalents at end of year | $ | 7,387 | | | $ | 4,880 | | | $ | 5,741 | |
See accompanying notes.
Anthem,Elevance Health, Inc.
Consolidated Statements of Shareholders’ Equity
| | | | | | | | | | | | | | | | | | | | | | | | | | | | | | | | | | | |
| | Common Stock | | Additional
Paid-in
Capital | | | | Accumulated
Other
Comprehensive
Income (Loss) | | Total
Shareholders’
Equity |
| (In millions) | Number
of Shares | | Par
Value | | | Retained
Earnings | | |
| January 1, 2018 | 256.1 | | | $ | 3 | | | $ | 8,547 | | | $ | 18,374 | | | $ | (421) | | | $ | 26,503 | |
| Net income | — | | | — | | | — | | | 3,750 | | | — | | | 3,750 | |
| Other comprehensive loss | — | | | — | | | — | | | — | | | (474) | | | (474) | |
| Issuance of common stock under Equity Units stock purchase contracts | 6.0 | | | — | | | 1,250 | | | — | | | — | | | 1,250 | |
| Premiums for and settlement of equity options | — | | | — | | | 1 | | | — | | | — | | | 1 | |
| Repurchase and retirement of common stock | (6.8) | | | — | | | (243) | | | (1,442) | | | — | | | (1,685) | |
| Dividends and dividend equivalents | — | | | — | | | — | | | (785) | | | — | | | (785) | |
| Issuance of common stock under employee stock plans, net of related tax benefits | 2.1 | | | — | | | 318 | | | — | | | — | | | 318 | |
| Convertible debenture conversions | — | | | — | | | (337) | | | — | | | — | | | (337) | |
| Adoption of Accounting Standards Update No. 2018-02 | — | | | — | | | — | | | 91 | | | (91) | | | — | |
| December 31, 2018 | 257.4 | | | 3 | | | 9,536 | | | 19,988 | | | (986) | | | 28,541 | |
| Adoption of Accounting Standards Update No. 2016-02 | — | | | — | | | — | | | 26 | | | — | | | 26 | |
| January 1, 2019 | 257.4 | | | 3 | | | 9,536 | | | 20,014 | | | (986) | | | 28,567 | |
| Net income | — | | | — | | | — | | | 4,807 | | | — | | | 4,807 | |
| Other comprehensive income | — | | | — | | | — | | | — | | | 690 | | | 690 | |
| | | | | | | | | | | |
| | | | | | | | | | | |
| Repurchase and retirement of common stock | (6.3) | | | — | | | (275) | | | (1,426) | | | — | | | (1,701) | |
| Dividends and dividend equivalents | — | | | — | | | — | | | (822) | | | — | | | (822) | |
| Issuance of common stock under employee stock plans, net of related tax benefits | 1.8 | | | — | | | 396 | | | — | | | — | | | 396 | |
| Convertible debenture conversions | — | | | — | | | (209) | | | — | | | — | | | (209) | |
| December 31, 2019 | 252.9 | | | 3 | | | 9,448 | | | 22,573 | | | (296) | | | 31,728 | |
| Adoption of Accounting Standards Update No. 2016-13 (Note 2) | — | | | — | | | — | | | (35) | | | — | | | (35) | |
| January 1, 2020 | 252.9 | | | 3 | | | 9,448 | | | 22,538 | | | (296) | | | 31,693 | |
| Net income | — | | | — | | | — | | | 4,572 | | | — | | | 4,572 | |
| Other comprehensive income | — | | | — | | | — | | | — | | | 446 | | | 446 | |
| | | | | | | | | | | |
| | | | | | | | | | | |
| Repurchase and retirement of common stock | (9.4) | | | — | | | (353) | | | (2,347) | | | — | | | (2,700) | |
| Dividends and dividend equivalents | — | | | — | | | — | | | (961) | | | — | | | (961) | |
| Issuance of common stock under employee stock plans, net of related tax benefits | 1.9 | | | — | | | 330 | | | — | | | — | | | 330 | |
| Convertible debenture repurchases and conversions | — | | | — | | | (181) | | | — | | | — | | | (181) | |
| December 31, 2020 | 245.4 | | | $ | 3 | | | $ | 9,244 | | | $ | 23,802 | | | $ | 150 | | | $ | 33,199 | |
| | | | | | | | | | | | | | | | | | | | | | | | | | | | | | | | | | | | | | | | | | | |
| Total Shareholders’ Equity | | | | | | |
| | Common Stock | | Additional
Paid-in
Capital | | | | Accumulated
Other
Comprehensive
(Loss) Income | | Noncontrolling Interests | | Total
Equity | | |
| (In millions) | Number
of Shares | | Par
Value | | | Retained
Earnings | | | | | |
| January 1, 2020 | 252.9 | | | $ | 3 | | | $ | 9,448 | | | $ | 22,538 | | | $ | (296) | | | $ | — | | | $ | 31,693 | | | |
| Net income | — | | | — | | | — | | | 4,572 | | | — | | | — | | | 4,572 | | | |
| Other comprehensive income | — | | | — | | | — | | | — | | | 446 | | | — | | | 446 | | | |
| Repurchase and retirement of common stock | (9.4) | | | — | | | (353) | | | (2,347) | | | — | | | — | | | (2,700) | | | |
| Dividends and dividend equivalents | — | | | — | | | — | | | (961) | | | — | | | — | | | (961) | | | |
| Issuance of common stock under employee stock plans, net of related tax benefits | 1.9 | | | — | | | 330 | | | — | | | — | | | — | | | 330 | | | |
| Convertible debenture repurchases and conversions | — | | | — | | | (181) | | | — | | | — | | | — | | | (181) | | | |
| December 31, 2020 | 245.4 | | | 3 | | | 9,244 | | | 23,802 | | | 150 | | | — | | | 33,199 | | | |
| Net income | — | | | — | | | — | | | 6,104 | | | — | | | (9) | | | 6,095 | | | |
| Other comprehensive loss | — | | | — | | | — | | | — | | | (328) | | | (2) | | | (330) | | | |
| Accumulated noncontrolling interest | — | | | — | | | — | | | — | | | — | | | 79 | | | 79 | | | |
| Repurchase and retirement of common stock | (5.1) | | | (1) | | | (192) | | | (1,707) | | | — | | | — | | | (1,900) | | | |
| Dividends and dividend equivalents | — | | | — | | | — | | | (1,111) | | | — | | | — | | | (1,111) | | | |
| Issuance of common stock under employee stock plans, net of related tax benefits | 1.5 | | | — | | | 355 | | | — | | | — | | | — | | | 355 | | | |
| Convertible debenture repurchases and conversions | — | | | — | | | (259) | | | — | | | — | | | — | | | (259) | | | |
| December 31, 2021 | 241.8 | | | 2 | | | 9,148 | | | 27,088 | | | (178) | | | 68 | | | 36,128 | | | |
| Adoption of Accounting Standards Update 2020-06 (Note 2) | — | | | — | | | — | | | (23) | | | — | | | — | | | (23) | | | |
| January 1, 2022 | 241.8 | | | 2 | | | 9,148 | | | 27,065 | | | (178) | | | 68 | | | 36,105 | | | |
| Net income | — | | | — | | | — | | | 6,025 | | | — | | | (6) | | | 6,019 | | | |
| Other comprehensive loss | — | | | — | | | — | | | — | | | (2,325) | | | (11) | | | (2,336) | | | |
| Noncontrolling interests adjustment | — | | | — | | | — | | | — | | | — | | | 36 | | | 36 | | | |
| Repurchase and retirement of common stock | (4.8) | | | — | | | (184) | | | (2,132) | | | — | | | — | | | (2,316) | | | |
| Dividends and dividend equivalents | — | | | — | | | — | | | (1,234) | | | — | | | — | | | (1,234) | | | |
| Issuance of common stock under employee stock plans, net of related tax benefits | 1.0 | | | — | | | 352 | | | — | | | — | | | — | | | 352 | | | |
| Convertible debenture repurchases and conversions | — | | | — | | | (232) | | | — | | | — | | | — | | | (232) | | | |
| December 31, 2022 | 238.0 | | | $ | 2 | | | $ | 9,084 | | | $ | 29,724 | | | $ | (2,503) | | | $ | 87 | | | $ | 36,394 | | | |
See accompanying notes.
Anthem,Elevance Health, Inc.
Notes to Consolidated Financial Statements
December 31, 20202022
(In Millions, Except Per Share Data or As Otherwise Stated Herein)
1. Organization
On May 18, 2022, our shareholders approved a proposal to amend our amended and restated articles of incorporation to change our name from Anthem, Inc. to Elevance Health, Inc. This amendment and name change went into effect on June 27, 2022. We began operating as Elevance Health, Inc. and trading under our new ticker symbol “ELV” on June 28, 2022. References to the terms “we,” “our,” “us” or “Anthem”“Elevance Health” used throughout these Notes to Consolidated Financial Statements refer to Anthem,Elevance Health, Inc., an Indiana corporation, and unless the context otherwise requires, its direct and indirect subsidiaries. References to the “states” include the District of Columbia and Puerto Rico, unless the context otherwise requires.
Elevance Health is a health company with the purpose of improving the health of humanity. We are one of the largest health benefits companiesinsurers in the United States in terms of medical membership, serving approximately 4347.5 million medical members through our affiliated health plans as of December 31, 2020.2022. We offer a broad spectrum of network-based managed care risk-based plans to LargeIndividual, Group, Small Group, Individual, Medicaid and Medicare markets. Our managed care plans include: Preferred Provider Organizations (“PPOs”); Health Maintenance Organizations (“HMOs”); Point-of-Service plans; traditional indemnity plans and other hybrid plans, including Consumer-Driven Health Plans; and hospital only and limited benefit products. In addition, we provide a broad array of managed care services to self-fundedfee-based customers, including claims processing, stop loss insurance, actuarial services, provider network access, medical cost management, diseasecare management and wellness programs, actuarial services and other administrative services. We provide an array of specialty and other insurance products and services such as pharmacy benefits management (“PBM”), dental, vision, life and disability insurance benefits, radiology benefit management and analytics-driven personal healthcare. We also provide services to the federal government in connection with our Federal Health Products & Services business, which administers the Federal Employees Health Benefits (“FEHB”) Program. We provide an array of specialty services both to customers of our subsidiary health plans and also unaffiliated health plans, including pharmacy benefit management (“PBM”) services and dental, vision, life, disability and supplemental health insurance benefits, as well as integrated health services.
We are an independent licensee of the Blue Cross and Blue Shield Association (“BCBSA”), an association of independent health benefit plans. We serve our members as the Blue Cross licensee for California and as the Blue Cross and Blue Shield (“BCBS”) licensee for Colorado, Connecticut, Georgia, Indiana, Kentucky, Maine, Missouri (excluding 30 counties in the Kansas City area), Nevada, New Hampshire, New York (in the New York City metropolitan area and upstate New York), Ohio, Virginia (excluding the Northern Virginia suburbs of Washington, D.C.) and Wisconsin. In a majority of these service areas, we do business as Anthem Blue Cross, Anthem Blue Cross and Blue Shield, and Empire Blue Cross Blue Shield or Empire Blue Cross. We also conduct business through arrangements with other BCBS licensees as well as other strategic partners. Through our subsidiaries, we also serve customers in numerous states across the country as AIM Specialty Health, Amerigroup, Aspire Health, Beacon, CareMore, Freedom Health, HealthLink, HealthSun, MMM, Optimum HealthCare,Healthcare, Simply Healthcare, UniCare and/or UniCare. Also, in the second quarter of 2019, we began providingWellpoint. We offer PBM services through our CarelonRx, Inc. (“CarelonRx”) subsidiary, which was named IngenioRx, subsidiary.Inc. prior to January 1, 2023. We are licensed to conduct insurance operations in all 50 states, and the District of Columbia and Puerto Rico through our subsidiaries.
As part of our name change to Elevance Health, in June 2022, we announced that over the next several years we will organize our brand portfolio into the following core go-to-market brands:
•Anthem Blue Cross/Anthem Blue Cross and Blue Shield — represents our existing Anthem-branded and affiliated Blue Cross and/or Blue Shield licensed plans;
•Wellpoint — we intend to unite select non-BCBSA licensed Medicare, Medicaid and Commercial plans under the Wellpoint name; and
•Carelon — this brand brings together our healthcare-related services and capabilities, including our formerly named Diversified Business Group and IngenioRx businesses, under a single brand name.
There were no changes made to our segments in 2022 associated with this branding strategy. Through December 31, 2022, we managed our operations by customer types through four reportable segments: Commercial & Specialty Business, Government Business, CarelonRx (formerly known as IngenioRx) and Other. Our branding strategy reflects the evolution of
our business from a traditional health insurance company into a lifetime, trusted health partner, and given this evolution we are in the process of reviewing and modifying how we will manage our business in the future. For additional discussion, including the changes to our reportable segments for 2023, see Note 20, “Segment Information.”
2. Basis of Presentation and Significant Accounting Policies
Basis of Presentation: The accompanying consolidated financial statements include the accounts of AnthemElevance Health and its subsidiaries and have been prepared in conformity with U.S. generally accepted accounting principles (“GAAP”). All significant intercompany accounts and transactions have been eliminated in consolidation.
Certain of our subsidiaries operate outside of the United States and have functional currencies other than the U.S. dollar (“USD”). We translate the assets and liabilities of those subsidiaries to USD using the exchange rate in effect at the end of the period. We translate the revenues and expenses of those subsidiaries to USD using the average exchange rates in effect during the period. The net effect of these translation adjustments is included in “Foreign currency translation adjustments” in our consolidated statements of comprehensive income.
Reclassifications: Certain prior year amounts have been reclassified to conform to the current year presentation.
Anthem, Inc.
Notes to Consolidated Financial Statements (continued)
Use of Estimates: The preparation of consolidated financial statements in conformity with GAAP requires us to make estimates and assumptions that affect the amounts reported in our consolidated financial statements and accompanying notes. Our most significant estimate relates to estimates and judgments for medical claims payable. Actual results could differ from those estimates.
Cash and Cash Equivalents: Cash and cash equivalents includes available cash and all highly liquid investments with maturities of three months or less when purchased. We control a number of bank accounts that are used exclusively to hold customer funds for the administration of customer benefits, and we have cash and cash equivalents on deposit to meet certain regulatory requirements. These amounts totaled $170$258 and $215$173 at December 31, 20202022 and 2019,2021, respectively, and are included in the cash and cash equivalents line on our consolidated balance sheets.
Investments: We classify fixed maturity securities in our investment portfolio as “available-for-sale” and report those securities at fair value. Certain fixed maturity securities are available to support current operations and, accordingly, we classify such investments as current assets without regard to their contractual maturity. Investments used to satisfy contractual, regulatory or other requirements are classified as long-term, without regard to contractual maturity.
Prior to 2020, our fixed maturity securities were evaluated for other-than-temporary impairment where credit-related impairments were presented within the other-than-temporary impairment losses recognized in our consolidated statements of income with an adjustment to the security’s amortized cost basis. Effective January 1, 2020, ifIf a fixed maturity security is in an unrealized loss position and we have the intent to sell the fixed maturity security, or it is more likely than not that we will have to sell the fixed maturity security before recovery of its amortized cost basis, we write down the fixed maturity security’s cost basis to fair value and record an impairment loss in our consolidated statements of income. For impaired fixed maturity securities that we do not intend to sell or if it is more likely than not that we will not have to sell such securities, but we expect that we will not fully recover the amortized cost basis, we recognize the credit component of the impairment as an allowance for credit loss in our consolidated balance sheets and record an impairment loss in our consolidated statements of income. The non-credit component of the impairment is recognized in accumulated other comprehensive income.loss. Furthermore, unrealized losses entirely caused by non-credit-related factors related to fixed maturity securities for which we expect to fully recover the amortized cost basis continue to be recognized in accumulated other comprehensive income.loss.
The credit component of an impairment is determined primarily by comparing the net present value of projected future cash flows with the amortized cost basis of the fixed maturity security. The net present value is calculated by discounting our best estimate of projected future cash flows at the effective interest rate implicit in the fixed maturity security at the date of purchase. For mortgage-backed and asset-backed securities, cash flow estimates are based on assumptions regarding the underlying collateral, including prepayment speeds, vintage, type of underlying asset, geographic concentrations, default rates, recoveries and changes in value. For all other securities, cash flow estimates are driven by assumptions regarding probability of default, including changes in credit ratings and estimates regarding timing and amount of recoveries associated with a default.
For asset-backed securities included in fixed maturity securities, we recognize income using an effective yield based on anticipated prepayments and the estimated economic life of the securities. When estimates of prepayments change, the
Elevance Health, Inc.
Notes to Consolidated Financial Statements (continued)
effective yield is recalculated to reflect actual payments to date and anticipated future payments. The net investment in the securities is adjusted to the amount that would have existed had the new effective yield been applied since the purchase date of the securities. Such adjustments are reported within net investment income.
In accordance with the Financial Accounting Standards Board (“FASB”) guidance, theThe changes in fair value of our marketable equity securities are recognized in our results of operations within net realized gains and losses on financial instruments. Certain marketable equity securities are held to satisfy contractual obligations, and are reported under the caption “Other invested assets” in our consolidated balance sheets.
We have corporate-owned life insurance policies on certain participants in our deferred compensation plans and other members of management. The cash surrender value of the corporate-owned life insurance policies is reported under the caption “Other invested assets” in our consolidated balance sheets.
We use the equity method of accounting for investments in companies in which our ownership interest may enable us to influence the operating or financial decisions of the investee company. Our proportionate share of equity in net income of these unconsolidated affiliates is reported within net investment income. The equity method investments are reported under the caption “Other invested assets” in our consolidated balance sheets.
Anthem, Inc.
Notes to Consolidated Financial Statements (continued)
Investment income is recorded when earned. All securities sold resulting in investment realized gains and losses are recorded on the trade date. Realized gains and losses are determined on the basis of the cost or amortized cost of the specific securities sold.
We participate in securities lending programs whereby marketable securities in our investment portfolio are transferred to independent brokers or dealers in exchange for cash and securities collateral. Under FASBFinancial Accounting Standards Board (“FASB”) guidance related to accounting for transfers and servicing of financial assets and extinguishments of liabilities, we recognize the collateral as an asset, which is reported as securities lending collateralin other current assets on our consolidated balance sheets, and we record a corresponding liability for the obligation to return the collateral to the borrower, which is reported as securities lending payable.in other current liabilities. The securities on loan are reported in the applicable investment category on our consolidated balance sheets. Unrealized gains or losses on securities lending collateral are included in accumulated other comprehensive income as a separate component of shareholders’ equity. The market value of loaned securities and that of the collateral pledged can fluctuate in non-synchronized fashions. To the extent the loaned securities’ value appreciates faster or depreciates slower than the value of the collateral pledged, we are exposed to the risk of the shortfall. As a primary mitigating mechanism, the loaned securities and collateral pledged are marked to market on a daily basis and the shortfall, if any, is collected accordingly. Secondarily, the collateral level is set at 102% of the value of the loaned securities, which provides a cushion before any shortfall arises. The investment of the cash collateral is subject to market risk, which is managed by limiting the investments to higher quality and shorter duration instruments.
Receivables: Receivables are reported net of amounts for expected credit losses. The allowance for doubtful accounts is based on historical collection trends, future forecasts and our judgment regarding the ability to collect specific accounts.
Premium receivables include the uncollected amounts from insured groups, individuals and government programs. Premium receivables are reported net of an allowance for doubtful accounts of $146$152 and $237$142 at December 31, 20202022 and 2019,2021, respectively.
Self-funded receivables include administrative fees, claims and other amounts due from self-fundedfee-based customers. Self-funded receivables are reported net of an allowance for doubtful accounts of $54$68 and $46$50 at December 31, 20202022 and 2019,2021, respectively.
Other receivables include pharmacy rebates, provider advances, claims recoveries, reinsurance receivables, proceeds due from brokers on investment trades, other government receivablesaccrued investment income and other miscellaneous amounts due to us. These receivables are reported net of an allowance for doubtful accounts of $374$744 and $242$648 at December 31, 20202022 and 2019,2021, respectively.
Income Taxes: We file a consolidated U.S. federal income tax return. Deferred income tax assets and liabilities are recognized for temporary differences between the financial statement and tax return basis of assets and liabilities based on enacted tax rates and laws.laws and are reported net on our consolidated balance sheets. The deferred tax benefits of the deferred tax assets are recognized to the extent realization of such benefits is more likely than not. Deferred income tax expense or benefit generally represents the net change in deferred income tax assets and liabilities during the year, excluding the impact
Elevance Health, Inc.
Notes to Consolidated Financial Statements (continued)
from amounts initially recorded for business combinations, if any, and amounts recorded to accumulated other comprehensive income. Current income tax expense represents the tax consequences of revenues and expenses currently taxable or deductible on various income tax returns for the year reported.
The Internal Revenue Code subjects a U.S. shareholder to tax on Global Intangible Low-Taxed Income (“GILTI”) earned by certain foreign subsidiaries. We have elected to account for GILTI tax in the year the tax is incurred.
The Inflation Reduction Act of 2022 includes a provision that imposes a new corporate alternative minimum tax (the “Corporate AMT”) that became effective for us beginning January 1, 2023. We have elected to account for the effects of the Corporate AMT on deferred tax assets and carryforwards and tax credits in the period they arise. Additionally, the Inflation Reduction Act of 2022 imposes an excise tax on the fair market value of net stock repurchases made after December 31, 2022. We do not believe the Corporate AMT will have a material impact on our consolidated financial position, results of operations, cash flows or related disclosures.
We account for income tax contingencies in accordance with FASB guidance that contains a model to address uncertainty in tax positions and clarifies the accounting for income taxes by prescribing a minimum recognition threshold, which all income tax positions must achieve before being recognized in the financial statements.
Property and Equipment: Property and equipment is recorded at cost, net of accumulated depreciation. Depreciation is computed principally by the straight-line method over estimated useful lives ranging from fifteen to thirty-ninethirty years for buildings and improvements, three to five years for computer equipment and software, and the lesser of the remaining life of the building lease, if any, or seven years for furniture and other equipment. Leasehold improvements are depreciated over the term of the related lease. Certain costs related to the development or purchase of internal-use software are capitalized and amortized over estimated useful lives ranging from fivethree to ten years.
Goodwill and Other Intangible Assets: FASB guidance requires business combinations to be accounted for using the acquisition method of accounting, and it also specifies the types of acquired intangible assets that are required to be
Anthem, Inc.
Notes to Consolidated Financial Statements (continued)
recognized and reported separately from goodwill. Goodwill represents the excess of the cost of acquisition over the fair value of net assets acquired. Other intangible assets represent the values assigned to customer relationships, provider and hospital networks, Blue Cross and Blue Shield and other trademarks, licenses and other agreements, such as non-compete.non-compete agreements. Goodwill and other intangible assets are allocated to reportable segments based on the relative fair value of the components of the businesses acquired.
Goodwill and other intangible assets with indefinite lives are not amortized but are tested for impairment at least annually. Goodwill and other intangible assets are allocated to reporting units for purposes of the annual goodwill impairment test. Other intangible assets with indefinite lives, such as trademarks, are tested for impairment separately. We complete our annual impairment tests of existing goodwill and other intangible assets with indefinite lives during the fourth quarter of each year. Our impairment tests require us to make assumptions and judgments regarding the estimated fair value of our reporting units, including goodwill and other intangible assets with indefinite lives. Certain interim impairment tests are also performed when potential impairment indicators exist or changes in our business or other triggering events occur.
FASB guidance allows for qualitative assessments of whether it is more likely than not that the fair value of a reporting unit is less than its carrying amount for purposes of a goodwill impairment analysis and whether it is more likely than not that an indefinite-lived intangible asset is impaired for purposes of an indefinite-lived intangible asset impairment analysis. Estimated fair values developed based on our assumptions and judgments might be different if other reasonable assumptions and estimates were to be used. Qualitative analysis involves assessing situations and developments that could affect key drivers used to evaluate whether the fair value of our goodwill and indefinite-lived intangible assets are impaired. Our procedures include assessing our financial performance, macroeconomic conditions, industry and market considerations, various asset specific factors, and entity specific events.
Quantitative analysis must be performed if qualitative analyses are not conclusive. Entities also have the option to bypass the assessment of qualitative factors and proceed directly to performing quantitative analyses. Fair value for purposes of a quantitative goodwill impairment test is calculated using a blend of the projected income and market valuation approaches. The projected income approach is developed using assumptions about future revenue, expenses and net income derived from our internal planning process. Our assumed discount rate is based on our industry’s weighted-average cost of capital and reflects volatility associated with the cost of equity capital. Market valuations include market comparisons to publicly traded
Elevance Health, Inc.
Notes to Consolidated Financial Statements (continued)
companies in our industry and are based on observed multiples of certain measures including revenue; earnings before interest, taxes, depreciation and amortization (“EBITDA”); and book value of invested capital.
A goodwill impairment loss is recognized to the extent that the carrying amount exceeds the asset’s fair value. This determination is made at the reporting unit level and consists of one step. Thea one-step test comparing the fair value of a reporting unit, is determined and comparedincluding goodwill, to its carrying amount. If the carrying amount of a reporting unit exceeds its fair value, an impairment loss is recognized. This goodwill impairment loss is equal to the excess of the reporting unit’s carrying amount over its fair value.
Fair value for purposes of a quantitative impairment test for indefinite-lived intangible assets is estimated using a projected income approach. We recognize an impairment loss when the estimated fair value of indefinite-lived intangible assets is less than the carrying value. If significant impairment indicators are noted relative to other intangible assets subject to amortization, we may be required to record impairment losses against future income.
Derivative Financial Instruments: We primarily invest in the following types of derivative financial instruments: interest rate swaps, futures, forward contracts, put and call options, collars, swaptions, embedded derivatives and warrants. Derivatives embedded within non-derivative instruments, such as options embedded in convertible fixed maturity securities, are bifurcated from the host instrument when the embedded derivative is not clearly and closely related to the host instrument. Our use of derivatives is limited by statutes and regulations promulgated by the various regulatory bodies to which we are subject, and by our own derivative policy. Our derivative use is generally limited to hedging purposes, on an economic basis, and we generally do not use derivative instruments for speculative purposes.
We have exposure to economic losses due to interest rate risk arising from changes in the level or volatility of interest rates. We attempt to mitigate our exposure to interest rate risk through active portfolio management, including rebalancing our existing portfolios of assets and liabilities, as well as changing the characteristics of investments to be purchased or sold in the future. In addition, derivative financial instruments are used to modify the interest rate exposure of certain liabilities or forecasted transactions. These strategies include the use of interest rate swaps and forward contracts, which are used to lock-
Anthem, Inc.
Notes to Consolidated Financial Statements (continued)
inlock-in interest rates or to hedge, on an economic basis, interest rate risks associated with variable rate debt. We have used these types of instruments as designated hedges against specific liabilities.
All investments in derivatives are recorded as assets or liabilities at fair value. If certain correlation, hedge effectiveness and risk reduction criteria are met, a derivative may be specifically designated as a hedge of exposure to changes in fair value or cash flow. The accounting for changes in the fair value of a derivative depends on the intended use of the derivative and the nature of any hedge designation thereon. Amounts excluded from the assessment of hedge effectiveness, if any, are reported in results of operations immediately. If the derivative is not designated as a hedge, the gain or loss resulting from the change in the fair value of the derivative is recognized in results of operations in the period of change. Cash flows associated with the settlement of non-designated derivatives are shown on a net basis in investing activity in our consolidated statements of cash flow.
From time to time, we may also purchase derivatives to hedge, on an economic basis, our exposure to foreign currency exchange fluctuations associated with the operations of certain of our subsidiaries. We generally use futures or forward contracts for these transactions. We generally do not designate these contracts as hedges and, accordingly, the changes in fair value of these derivatives are recognized in results of operations immediately.
Credit exposure associated with non-performance by the counterparties to derivative instruments is generally limited to the uncollateralized fair value of the asset related to instruments recognized in the consolidated balance sheets. We attempt to mitigate the risk of non-performance by selecting counterparties with high credit ratings and monitoring their creditworthiness and by diversifying derivatives among multiple counterparties. At December 31, 2020,2022, we believe there were no material concentrations of credit risk with any individual counterparty.
We generally enter into master netting agreements, which reduce credit risk by permitting net settlement of transactions with the same counterparty. Certain of our derivative agreements also contain credit support provisions that require us or the counterparty to post collateral if there are declines in the derivative fair value or our credit rating. The derivative assets and derivative liabilities are reported at their fair values net of collateral and netting by the counterparty.
Retirement Benefits: We recognize the funded status of pension and other postretirement benefit plans on the consolidated balance sheets based on fiscal-year-end measurements of plan assets and benefit obligations. Prepaid pension
Elevance Health, Inc.
Notes to Consolidated Financial Statements (continued)
benefits represent prepaid costs related to defined benefit pension plans and are reported with other noncurrent assets. Postretirement benefits represent outstanding obligations for retiree medical, life, vision and dental benefits. Liabilities for pension and other postretirement benefits are reported with noncurrent assets, current liabilities and noncurrent liabilities based on the amount by which the actuarial present value of benefits payable in the next twelve months included in the benefit obligation exceeds the fair value of plan assets.
We determine the expected return on plan assets using the calculated value of plan assets, which recognizes changes in the fair value of plan assets in a systematic manner over three years. We apply a corridor approach to amortize unrecognized actuarial gains or losses. Under this approach, only accumulated net actuarial gains or losses in excess of 10% of the greater of the projected benefit obligation or the fair value of plan assets are amortized over the average remaining service or lifetime of the workforce as a component of net periodic benefit cost.
The discount rate reflects the current rate at which the pension liabilities could be effectively settled at the end of the year based on our most recent measurement date. We use the annual spot rate approach for setting our discount rate. Under the spot rate approach, individual spot rates from a full yield curve of published rates are used to discount each plan’s cash flows to determine the plan’s obligations.
The assumed healthcare cost trend rates used to measure the expected cost of other postretirement benefits are based on an initial assumed healthcare cost trend rate declining to an ultimate healthcare cost trend rate over a select number of years.
Medical Claims Payable: Liabilities for medical claims payable include estimated provisions for incurred but not paid claims on an undiscounted basis, as well as estimated provisions for expenses related to the processing of claims. Incurred but not paid claims include (1) an estimate for claims that are incurred but not reported, as well as claims reported to us but not yet processed through our systems; and (2) claims reported to us and processed through our systems but not yet paid.
Anthem, Inc.
Notes to Consolidated Financial Statements (continued)
Liabilities for both claims incurred but not reported and reported but not yet processed through our systems are determined in the aggregate, employing actuarial methods that are commonly used by health insurance actuaries and meet Actuarial Standards of Practice. Our reserving practice for claim liabilities is to consistently recognize the appropriate amount of reserve within a level of confidence required by Actuarial Standards of Practice require that the claim liabilities be appropriate under moderately adverse circumstances.Practice. We determine the amount of the liability for incurred but not paid claims by following a detailed actuarial process that uses both historical claim payment patterns as well as emerging medical cost trends to project our best estimate of claim liabilities. Under this process, historical paid claims data is formatted into “claim triangles,” which compare claim incurred dates to the dates of claim payments. This information is analyzed to create “completion factors” that represent the average percentage of total incurred claims that have been paid through a given date after being incurred. Completion factors are applied to claims paid through the period-end date to estimate the ultimate claim expense incurred for the period. Actuarial estimates of incurred but not paid claim liabilities are then determined by subtracting the actual paid claims from the estimate of the ultimate incurred claims.
For the most recent incurred months (typically the most recent two months), the percentage of claims paid for claims incurred in those months is generally low. This makes the completion factor methodology less reliable for such months. Therefore, incurred claims for recent months are not projected from historical completion and payment patterns; rather, they are projected by estimating the claims expense for those months based on recent claims expense levels and healthcare trend levels (“trend factors”).
We regularly review and set assumptions regarding cost trends and utilization when initially establishing claim liabilities. We continually monitor and adjust the claims liability and benefit expense based on subsequent paid claims activity. If it is determined that our assumptions regarding cost trends and utilization are materially different than actual results, our income statement and financial position could be impacted in future periods.
Premium deficiencies are recognized when it is probable that expected claims and administrative expenses will exceed future premiums on existing medical insurance contracts without consideration of investment income. Determination of premium deficiencies for longer duration life and disability contracts includes consideration of investment income. For purposes of premium deficiencies, contracts are deemed to be either short or long duration and are grouped in a manner consistent with our method of acquiring, servicing and measuring the profitability of such contracts. Once established, premium deficiencies are released commensurate with actual claims experience over the remaining life of the contract. No premium deficiencies were established at December 31, 20202022 or 2019.2021.
Elevance Health, Inc.
Notes to Consolidated Financial Statements (continued)
Benefit expense includes incurred medical claims as well as quality improvement expenses for our fully-insuredrisk-based members. Quality improvement activities are those designed to improve member health outcomes, prevent hospital readmissions and improve patient safety. They also include expenses for wellness and health promotion provided to our members.
Reserves for Future Policy Benefits: Reserves for future policy benefits include liabilities for life and long-term disability insurance policy benefits based upon interest, mortality and morbidity assumptions from published actuarial tables, modified based upon our experience. Future policy benefits also include liabilities for insurance policies for which some of the premiums received in earlier years are intended to pay anticipated benefits to be incurred in future years. Future policy benefits are continually monitored and reviewed, and when reserves are adjusted, differences are reflected in benefit expense.
The current portion of reserves for future policy benefits relates to the portion of such reserves that we expect to pay within one year. We believe that our liabilities for future policy benefits, along with future premiums received, are adequate to satisfy our ultimate benefit liability; however, these estimates are inherently subject to a number of variable circumstances. Consequently, the actual results could differ materially from the amounts recorded in our consolidated financial statements.
Other Policyholder Liabilities: Other policyholder liabilities include rate stabilization reserves associated with retrospectively rated insurance contracts and certain case-specific reserves. Other policyholder liabilities also include liabilities for premium refunds based upon the minimum medical loss ratio (“MLR”), the relative health risk of members, and other contractual or regulatory requirements. Rate stabilization reserves represent accumulated premiums that exceed what customers owe us based on actual claim experience. The timing of payment of these retrospectively rated refunds is based on the contractual terms with our customers and can vary from period to period based on the specific contractual requirements.
We are required to meet certain minimum MLR thresholds prescribed by the Patient Protection and Affordable Care Act and the Health Care and Education Reconciliation Act of 2010, as amended (collectively the “ACA”). If we do not meet or
Anthem, Inc.
Notes to Consolidated Financial Statements (continued)
exceed the minimum MLR thresholds specified by the ACA, we are required to pay rebates to certain customers. Minimum MLR rebates are calculated by subsidiary, state and applicable line of business (Large Group, Small Group, Individual and Medicare) in accordance with regulations issued by the Department of Health and Human Services (“HHS”). Such calculations are made using estimated calendar year medical loss expense and premiums, as defined by HHS.
We follow HHS guidelines for determining the types of expenses that may be included in our minimum MLR rebate calculations, which differ from benefit expense and premiums as reported in our consolidated financial statements prepared in conformity with GAAP. Certain amounts reported as expense in our consolidated GAAP financial statements may be reported as a reduction of premiums in accordance with HHS regulations. In addition, profit amounts included in our payments to third-party administrative service providers are recorded as benefit expense in our consolidated GAAP financial statements, while HHS does not allow for the inclusion of these expenses within the medical loss expense for purposes of calculating minimum MLR.
Reserves for Future Policy Benefits: Reserves for future policy benefits include liabilities for life and long-term disability insurance policy benefits based upon interest, mortality and morbidity assumptions from published actuarial tables, modified based upon our experience. Future policy benefits also include liabilities for insurance policies for which some of the premiums received in earlier years are intended to pay anticipated benefits to be incurred in future years. Future policy benefits are continually monitored and reviewed, and when reserves are adjusted, differences are reflected in benefit expense.
We believe that our liabilities for future policy benefits, along with future premiums received, are adequate to satisfy our ultimate benefit liability; however, these estimates are inherently subject to a number of variable circumstances. Consequently, the actual results could differ materially from the amounts recorded in our consolidated financial statements.
Revenue Recognition: Premiums for fully-insuredrisk-based contracts are recognized as revenue over the period insurance coverage is provided, and, if applicable, net of amounts recognized for MLR rebates, risk adjustment, reinsurance and risk corridor under contractual premium stabilization arrangements, the ACA or other regulatory requirements. Premiums may also include performance incentives and penalties, which are recognized based on contractual terms. We estimate amounts receivable and payable under these contractual terms, and to the extent that such estimated amounts vary from the final amounts paid, the adjustments are included in earnings in the period of final settlement. Premium payments from contracted government agencies are based on eligibility lists produced by the government agencies. Premiums related to the unexpired contractual coverage periods are reflected in the accompanying consolidated balance sheets as unearned income. Premiums include revenue adjustments for retrospectively rated contracts where revenue is based on the estimated loss experience of the contract. Premium rates for certain lines of business are subject to approval by the Department of Insurance of each respective state. Additionally, delays in annual premium rate changes from contracted government agencies require that we defer the recognition of any increases to the period in which the premium rates become final. The value of the impact can be significant in the period in which it is recognized depending on the magnitude of the premium rate increase, the membership to which it applies and the length of the delay between the effective date of the rate increase and the final contract date. Premium rate decreases are recognized in the period the change in premium rate becomes effective and the change in the rate is known, which may be prior to the period when the contract amendment affecting the rate is finalized.
Administrative fees and other revenue include revenue from certain group contracts that provide for the group to be at risk for all, or with supplemental insurance arrangements, a portion, of their claims experience. We charge these self-funded fee-based
Elevance Health, Inc.
Notes to Consolidated Financial Statements (continued)
groups an administrative fee, which is based on the number of members in a group orand the group’s claim experience. In addition, administrative fees and other revenue include amounts received for the administration of Medicare, or certain other government programs. Underprograms, and administrative services arrangements of our self-fundedCarelon (Diversified Business Group) subsidiaries, now known as Carelon. Generally, these fee-based arrangements include services which constitute a single suite of services provided and for which consideration is based upon an agreed-upon rate, regardless of the amount of services provided in a given period. As with premiums, these fee-based arrangements may include terms with retroactive rate or membership adjustments, performance incentives and penalties, each of which is a form of variable consideration within the transaction price. As such, these fee-based arrangements contain a single performance obligation that constitutes a series, and revenue is recognized over time as administrativethe services are performed. All benefit payments under these programs are excluded from benefit expense.
The determination of whether services are distinct performance obligations that should be accounted for separately or combined as one unit of accounting may require significant judgment. The estimation of variable consideration to be recognized requires significant judgment in the determination of the level of achievement of performance incentives, service level achievements subject to performance penalties, and the completion level of tasks subject to implementation fees.
Product revenue includes revenue for services performed by our IngenioRxCarelonRx PBM for unaffiliated PBM customers. Unaffiliated PBM customers include our self-fundedfee-based groups that have contracted with IngenioRxCarelonRx for PBM services and beginning on January 1, 2020, third-party health plans. Product revenues and costs of goods sold for our affiliated health plans are eliminated in consolidation. Product revenue for PBM services is recognized using the gross method at the negotiated contract price when IngenioRxCarelonRx has concluded that it is the principal and it controls the services before prescription drugs are transferred to the customer. IngenioRxCarelonRx determined it is the principal due to its contractual rights to design and develop a listing of prescription drugs offered to the customer (formulary management); its control over establishing the pharmacy network available to the customer to have its prescription fulfilled (network management); and its discretion over establishing the pricing for prescription drugs. Overall, control over these activities indicate IngenioRxCarelonRx is primarily responsible for fulfilling the promise to provide PBM services. Product revenue includes ingredient costs (net of any rebates or discounts), including any co-payments made by or on behalf of the customer, and administrative fees. IngenioRxCarelonRx recognizes revenue when control of the prescription drugs is transferred to customers, in an amount it expects to be entitled to in exchange for the products or services provided.
For our non-fully-insurednon-risk-based contracts, we had no material contract assets, contract liabilities or deferred contract costs recorded on our consolidated balance sheet at December 31, 2020.2022. Revenue recognized in 20202022 and 20192021 from performance obligations related to prior years, such as due to changes in transaction price, was not material. For contracts that have an original expected duration of greater than one year, revenue expected to be recognized in future periods related to unfulfilled contractual performance obligations and contracts with variable consideration related to undelivered performance obligations is not material.
Anthem, Inc.
Notes to Consolidated Financial Statements (continued)
Cost of Products Sold: IngenioRx’sCarelonRx’s cost of products sold includes the cost of prescription drugs dispensed to unaffiliated PBM customers (net of rebates or discounts). This cost includes any co-payments made by or on behalf of the customer. Cost of products sold also includes per-claim administrative fees for prescription fulfillment by its vendor and certain IngenioRxCarelonRx direct costs related to sales and administration of customer contracts.
Share-Based Compensation: Our current compensation philosophy provides for share-based compensation, including stock options, restricted stock awards and an employee stock purchase plan. Stock options are granted for a fixed number of shares with an exercise price at least equal to the fair value of the shares at the date of the grant. Restricted stock awards are issued at the fair value of the stock on the grant date. The employee stock purchase plan allows for a purchase price per share which is 90% of the fair value of a share of common stock on the lower of the first or last trading day of the plan quarter. The employee stock purchase plan discount is recognized as compensation expense based on GAAP guidance. All other share-based payments to employees are recognized as compensation expense in our consolidated statements of income based on their fair values. Additionally, excess tax benefits, which result from actual tax benefits realized when awards vest or options are exercised exceeding deferred tax benefits previously recognized based on grant date fair value, are recognized as tax benefits in the income statement. Our share-based employee compensation plans and assumptions are described in Note 15, “Capital Stock.”consolidated statements of income.
Advertising and Marketing Costs: We use print, broadcast and other advertising to promote our products and to develop our corporate image. We market our products through direct marketing activities and an extensive network of independent
Elevance Health, Inc.
Notes to Consolidated Financial Statements (continued)
agents, brokers and retail partnerships for Individual and Medicare customers, and for certain Local Group risk-based customers with a smaller employee base. Products for National Accounts and Local Group risk-based customers with a larger employee base are generally sold through independent brokers or consultants retained by the customer who work with industry specialists from our in-house sales force. In the Individual and Small Group markets, we offer products through state or federally facilitated marketplaces, or public exchanges,Public Exchanges, and off-exchange products. The cost of advertising and marketing for product promotion is expensed as incurred, while advertising and marketing costs associated with our corporate image are expensed when first aired. Total advertising and marketing expense was $558, $467$511, $588 and $385$558 for the years ended December 31, 2022, 2021 and 2020, 2019 and 2018, respectively.
Health Insurance Provider Fee: The ACA imposed an annual Health Insurance Provider Fee (“HIP Fee”) on health insurers that writewrote certain types of health insurance on U.S. risks, which has beenwas permanently repealed effective January 1, 2021. The HIP Fee was allocated to health insurers based on the ratio of the amount of an insurer’s net premium revenues written during the preceding calendar year to the amount of health insurance premium for all U.S. health risk for those certain lines of business written during the preceding calendar year. We recorded our estimated liability for the HIP Fee in full at the beginning of the year with a corresponding deferred asset that was amortized on a straight-line basis to selling, general and administrative expense. The final calculation and payment of the annual HIP Fee was due by September 30th of each fee year. The HIP Fee was non-deductible for federal income tax purposes. Our affected products were priced to cover the increased selling, general and administrative and income tax expenses associated with the HIP Fee when it was in effect. The total amount due from allocations to health insurers was $14,300 for 2018. The HIP Fee was suspended for 2019, resumed and increased to $15,523 for 2020 and has beenwas permanently eliminated beginning in 2021. For the yearsyear ended December 31, 2020, and 2018, we recognized $1,570 and $1,544, respectively, as selling, general and administrative expense related to the HIP Fee. There was no corresponding expense for 2019 due to the suspension of the HIP Fee for 2019.
Leases: We lease office space and certain computer and related equipment under noncancelable operating leases. We determine whether an arrangement is or contains a lease at its inception. We recognize lease liabilities based on the present value of the minimum lease payments not yet paid by using the lease term, any amounts probable of being owed under any residual value guarantees and the discount rate determined at lease commencement. As our leases do not generally provide an implicit rate, we use our incremental secured borrowing rate commensurate with the underlying lease terms to determine the present value of our lease payments. Our lease liabilities may include amounts for options to extend or terminate a lease when it is reasonably certain that we will exercise that option. We recognize operating right-of-use (“ROU”) assets at an amount equal to the lease liability adjusted for prepaid or accrued rent, the remaining balance of any lease incentives and unamortized initial direct costs.
The operating lease liabilities are reported in other current liabilities and other noncurrent liabilities and the related ROU assets are reported in other noncurrent assets on our consolidated balance sheets. Lease expense for our operating leases is calculated on a straight-line basis over the lease term and is reported in selling, general and administrative expense on our
Anthem, Inc.
Notes to Consolidated Financial Statements (continued)
consolidated statements of income. For our office space leases, we account for the lease and non-lease components (such as common area maintenance) as a single lease component. We also do not recognize a lease liability or ROU asset for our office space leases whose lease terms, at commencement, are twelve months or less and that do not include a purchase option or option to extend that we are reasonably certain to exercise.
We assess our ROU assets for impairment when there are indicators of impairment and compare the carrying amount of the ROU asset to its estimated undiscounted future cash flows. If the estimated undiscounted future cash flows are less than the carrying amount of the ROU asset, an impairment calculation is performed. An impairment loss is recorded for the difference of the ROU asset’s carrying value that exceeds its estimated discounted cash flows. During the years ended December 31, 2022, 2021 and 2020, we recorded $34, $136 and $258, respectively, for impairment and abandonment of ROU assets. See Note 18, “Leases” for additional information about the ROU asset impairment and abandonment charges.
Earnings per Share: Earnings per share amounts, on a basic and diluted basis, have been calculated based upon the weighted-average common shares outstanding for the period.
Basic earnings per share excludes dilution and is computed by dividing income available to common shareholders by the weighted-average number of common shares outstanding for the period. Diluted earnings per share may include the dilutive effect of stock options, restricted stock and convertible debentures, and Equity Units, using the treasury stock method. See Note 13, “Debt,” for a description of our Equity Units. The treasury stock method assumes exercise of stock options and vesting of restricted stock, with the assumed proceeds used to purchase common stock at the average market price for the period. The difference between the number of shares assumed issued and the number of shares assumed purchased represents the dilutive shares.
Recently Adopted Accounting Guidance: TheIn January 2021, the FASB issued Accounting Standards Update No. 2021-01, Reference Rate Reform (Topic 848) (“ASU 2021-01”). The amendments in January 2021, and Accounting Standards Update No. 2020-04, Reference Rate Reform (Topic 848): Facilitation of the Effects of Reference Rate Reform on Financial Reporting (“ASU 2020-04”) in March 2020. ASU 2021-01 and ASU 2020-04 provide optional expedients and exceptions for applying GAAP to contract modifications and hedging relationships, subject to meeting certain criteria, that reference the London Interbank Offered Rate (“LIBOR”) or another reference rate expected to be discontinued because of the
Elevance Health, Inc.
Notes to Consolidated Financial Statements (continued)
reference rate reform. The provisions must be applied at a Topic, Subtopic, or Industry Subtopic level for all transactions other than derivatives, which may be applied at a hedging relationship level. We adopted ASU 2021-01 on January 7, 2021, and ASU 2020-04 on November 2, 2020, and the adoptions did not have an impact on our consolidated financial position, results of operations or cash flows.
In November 2019, the FASB issued Accounting Standards Update No. 2019-11, Codification Improvements to Topic 326, Financial Instruments—Credit Losses. In May 2019, the FASB issued Accounting Standards Update No. 2019-05, Financial Instruments—Credit Losses (Topic 326): Targeted Transition Relief. In April 2019, the FASB issued Accounting Standards Update No. 2019-04, Codification Improvements to Topic 326, Financial Instruments—Credit Losses, Topic 815, Derivatives and Hedging, and Topic 825, Financial Instruments. In November 2018, the FASB issued Accounting Standards Update No. 2018-19, Codification Improvements to Topic 326, Financial Instruments—Credit Losses. These updates provide an option to irrevocably elect to measure certain individual financial assets at fair value instead of amortized cost and provide additional clarification and implementation guidance on certain aspects of the previously issued Accounting Standards Update No. 2016-13, Financial Instruments—Credit Losses (Topic 326): Measurement of Credit Losses on Financial Instruments (“ASU 2016-13") and have the same effective date and transition requirements as ASU 2016-13. ASU 2016-13 introduces a current expected credit loss model for measuring expected credit losses for certain types of financial instruments held at the reporting date based on historical experience, current conditions and reasonable supportable forecasts. ASU 2016-13 replaces the incurred loss model for measuring expected credit losses, requires expected losses on available-for-sale debt securities to be recognized through an allowance for credit losses rather than as reductions in the amortized cost of the securities and provides for additional disclosure requirements. ASU 2016-13 requires a cumulative-effect adjustment to the opening balance of retained earnings on the balance sheet at the date of adoption and a prospective transition approach for debt securities for which an other-than-temporary impairment had been recognized before the adoption date. The effect of a prospective transition approach is to maintain the same amortized cost basis before and after the date of adoption. We adopted ASU 2016-13 on January 1, 2020, and recognized a cumulative-effect adjustment of $35 to our opening retained earnings for credit related allowances on receivables. The adoption did not have an impact on our consolidated statements of income or cash flows.
Anthem, Inc.
Notes to Consolidated Financial Statements (continued)
In August 2018, the FASB issued Accounting Standards Update No. 2018-15, Intangibles—Goodwill and Other—Internal-Use Software (Subtopic 350-40): Customer’s Accounting for Implementation Costs Incurred in a Cloud Computing Arrangement that is a Service Contract (“ASU 2018-15”). The amendments in ASU 2018-15 require implementation costs incurred by customers in cloud computing arrangements to be deferred and recognized over the term of the arrangement, if those costs would be capitalized by the customer in a software licensing arrangement under the internal-use software guidance. The amendments also require an entity to disclose the nature of its hosting arrangements and adhere to certain presentation requirements in its balance sheet, income statement and statement of cash flows. We adopted ASU 2018-15 on January 1, 2020 using a prospective approach for all implementation costs incurred after the date of adoption, and the adoption did not have an impact on our consolidated financial position, results of operations or cash flows.
In August 2018, the FASB issued Accounting Standards Update No. 2018-14, Compensation—Retirement Benefits - Defined Benefit Plans—General (Subtopic 715-20): Disclosure Framework—Changes to the Disclosure Requirements for Defined Benefit Plans (“ASU 2018-14”). The amendments in ASU 2018-14 eliminate, add, and modify certain disclosure requirements for employers that sponsor defined benefit pension or other postretirement plans. We adopted the disclosure requirements of ASU 2018-14 on December 31, 2020, and the adoption did not have an impact on our consolidated financial position, results of operations or cash flows.
In August 2018, the FASB issued Accounting Standards Update No. 2018-13, Fair Value Measurement (Topic 820): Disclosure Framework—Changes to the Disclosure Requirements for Fair Value Measurement (“ASU 2018-13”). The amendments in ASU 2018-13 eliminate, add, and modify certain disclosure requirements for fair value measurements. The amendments became effective for interim and annual periods beginning after December 15, 2019, with early adoption permitted for either the entirety of ASU 2018-13 or only the provisions that eliminate or modify disclosure requirements. We early adopted the provisions that eliminate and modify disclosure requirements, on a retrospective basis, effective in our 2018 Annual Report on Form 10-K. We adopted the new disclosure requirements on January 1, 2020, on a prospective basis.
In January 2017, the FASB issued Accounting Standards Update No. 2017-04, Intangibles - Goodwill and Other (Topic 350): Simplifying the Test for Goodwill Impairment (“ASU 2017-04”). This update removes Step 2 of the goodwill impairment test under the then-existing guidance, which required a hypothetical purchase price allocation. The new guidance requires an impairment charge to be recognized for the amount by which the carrying amount exceeds the reporting unit’s fair value. We adopted ASU 2017-04 on January 1, 2020, and the adoption did not have an impact on our consolidated financial position, results of operations or cash flows.
Recent Accounting Guidance Not Yet Adopted: In November 2020, the FASB issued Accounting Standards Update No. 2020-11, Financial Services—Insurance (Topic 944): Effective Date and Early Application (“ASU 2020-11”). The amendments in ASU 2020-11 make changes to the effective date and early application of Accounting Standards Update No. 2018-12, Financial Services—Insurance (Topic 944): Targeted Improvements to the Accounting for Long-Duration Contracts (“ASU 2018-12”) which was issued in November 2018. The amendments in ASU 2020-11 have extended the original effective date by one year and now the amendments are required for our interim and annual reporting periods beginning after December 15, 2022. The amendments in ASU 2018-12 make changes to a variety of areas to simplify or improve the existing recognition, measurement, presentation and disclosure requirements for long-duration contracts issued by an insurance entity. The amendments require insurers to annually review the assumptions they make about their policyholders and update the liabilities for future policy benefits if the assumptions change. The amendments also simplify the amortization of deferred contract acquisition costs and add new disclosure requirements about the assumptions insurers use to measure their liabilities and how they may affect future cash flows. The amendments related to the liability for future policy benefits for traditional and limited-payment contracts and deferred acquisition costs are to be applied to contracts in force as of the beginning of the earliest period presented, with an option to apply such amendments retrospectively with a cumulative-effect adjustment to the opening balance of retained earnings as of the earliest period presented. The amendments for market risk benefits are to be applied retrospectively. We are currently evaluating the effects the adoption of ASU 2020-11 and ASU 2018-12 will have on our consolidated financial position, results of operations, cash flows, and related disclosures.
In October 2020, the FASB issued Accounting Standards Update No. 2020-08, Codification Improvements to Subtopic 310-20, Receivables—Nonrefundable Fees and Other Costs(“ (“ASU 2020-08”). The amendments in ASU 2020-08 clarify when an entity should assess whether a callable debt security is within the scope of accounting guidance, which impacts the amortization period for nonrefundable fees and other costs. ASU 2020-08 isbecame effective for interim and annual reporting periods beginning
Anthem, Inc.
Notes to Consolidated Financial Statements (continued)
after December 15, 2020, with early adoption permitted. Upon adoption, the2020. The amendments are to bewere applied on a prospective basis as of the beginning of the period of adoption for existing or newly purchased callable debt securities. We adopted ASU 2020-08 on January 1, 2021, and the adoption did not have an impact on our consolidated financial position, results of operations or cash flows.
In August 2020, the FASB issued Accounting Standards Update No. 2020-06, Debt—Debt with Conversion and Other Options (Subtopic 470-20) and Derivatives and Hedging—Contracts in Entity’s Own Equity (Subtopic 815-40): Accounting for Convertible Instruments and Contracts in an Entity’s Own Equity (“ASU 2020-06”). The amendments eliminate two of the three accounting models that require separate accounting for convertible features of debt securities, simplify the contract settlement assessment for equity classification, require the use of the if-converted method for all convertible instruments in the diluted earnings per share calculation and expand disclosure requirements. The amendments arebecame effective for our annual and interim reporting periods beginning after December 15, 2021, with early adoption permitted for reporting periods beginning after December 15, 2020. The guidance can be applied2021. We adopted ASU 2020-06 on a full retrospective basis to all periods presented or aJanuary 1, 2022 using the modified retrospective basis withtransition method, which resulted in an increase to our reported debt outstanding of $31, a cumulative effect adjustmentdecrease to theour deferred tax liabilities of $8, and a corresponding cumulative-effect reduction to our opening balance of retained earnings duringof $23, eliminating the periodbifurcation of adoption. We are currently evaluating the effects theembedded conversion option; these amounts were not material to our overall consolidated financial position. The adoption of ASU 2020-06 willdid not have an impact on our results of operations or our consolidated financial statements and disclosures.cash flows. Use of the if-converted method did not have an impact on our overall earnings per share calculation.
In December 2019, the FASB issued Accounting Standards Update No. 2019-12, Income Taxes (Topic 740): Simplifying the Accounting for Income Taxes(“ (“ASU 2019-12”). The amendments in ASU 2019-12 remove certain exceptions to the general principles in Accounting Standards Codification Topic 740. The amendments also clarify and amend existing guidance to improve consistent application. The amendments arebecame effective for our annual reporting periods beginning after December 15, 2020, with early adoption permitted.2020. The transition method (retrospective, modified retrospective, or prospective basis) related to the amendments depends on the applicable guidance, and all amendments for which there is no transition guidance specified are to be applied on a prospective basis. We adopted ASU 2019-12 on January 1, 2021, and the adoption did not have an impact on our consolidated financial position, results of operations or cash flows.
Recent Accounting Guidance Not Yet Adopted: In November 2020, the FASB issued Accounting Standards Update No. 2020-11, Financial Services—Insurance (Topic 944): Effective Date and Early Application (“ASU 2020-11”). The amendments in ASU 2020-11 make changes to the effective date and early application of Accounting Standards Update No. 2018-12, Financial Services—Insurance (Topic 944): Targeted Improvements to the Accounting for Long-Duration Contracts (“ASU 2018-12”), which was issued in November 2018. The amendments in ASU 2020-11 extended the original effective date by one year, with the amendments required for our interim and annual reporting periods beginning after December 15, 2022. This standard requires the Company to review cash flow assumptions for its long-duration insurance contracts at least annually and recognize the effect of changes in future cash flow assumptions in net income. This standard also requires the Company to update discount rate assumptions quarterly and recognize the effect of changes in these assumptions in other comprehensive income. The rate used to discount the Company’s reserves for future policy benefits will be based on an estimate of the yield for an upper-medium grade fixed-income instrument with a duration profile matching that of the Company’s liabilities. In addition, this standard changes the amortization method for deferred acquisition costs. The Company adopted the new standard on January 1, 2023, using the modified retrospective transition method for changes to the liability for future policy benefits and deferred acquisition costs as of the earliest period presented, January 1, 2021. The adoption did not have a material impact on our consolidated financial position, results of operations, cash flows, or related disclosures.
There were no other new accounting pronouncements that were issued or became effective during the year ended December 31, 20202022 that had, or are expected to have, a material impact on our financial position, results of operations, cash flows or financial statement disclosures.
Elevance Health, Inc.
Notes to Consolidated Financial Statements (continued)
3. Business Acquisitions
Pending AcquisitionCompleted Acquisitions
During the year ended December 31, 2022, we completed business combinations for total cash consideration of approximately $752. These acquisitions included Integra MLTC, Inc. (“Integra”), acquired May 2022, which is a managed long-term care plan that serves New York state Medicaid members, enabling adults with long-term care needs and disabilities to live safely and independently in their own homes. The purchase prices for all business combinations were allocated to the tangible and intangible net assets acquired based on management’s initial estimates of their fair values, of which $89 was allocated to finite-lived intangible assets, $250 to indefinite-lived intangible assets, and $145 to goodwill. The intangible assets and goodwill acquired were assigned to our Government Business reportable segment. The majority of goodwill is deductible for income tax purposes. As of December 31, 2022, the initial accounting for the acquisitions completed in 2022 had not been finalized. Any subsequent adjustments made to the assets acquired or liabilities assumed during the measurement period will be recorded as an adjustment to goodwill. The proforma effects of these acquisitions for prior periods were not material to our consolidated results of operations.
During the year ended December 31, 2021, we completed business combinations for total cash consideration of approximately $4,021. These acquisitions included myNEXUS, Inc. (“myNEXUS”), acquired April 2021, a comprehensive home-based nursing management company for payors, and MMM Holdings, LLC (“MMM”), acquired June 2021, including its Medicare Advantage plan, Medicaid plan, and Affiliatesother affiliated companies. The purchase prices for all business combinations were allocated to the tangible and intangible net assets acquired based on management’s final estimates of their fair values, of which $1,577 was allocated to finite-lived intangible assets, $20 to indefinite-lived intangible assets, and $2,531 to goodwill, including measurement period adjustments of $10 during the year ended December 31, 2022. Of these amounts, $795 was allocated to our Other reportable segment and $3,333 to our Government Business reportable segment.The majority of goodwill is not deductible for income tax purposes.
Acquired tangible assets (liabilities) at the acquisition date were:
| | | | | | | | | | | |
| 2022 | | 2021 |
| Cash, cash equivalents and short-term investments | $ | 170 | | | $ | 808 | |
| Accounts receivable and other current assets | 240 | | | 295 | |
| Property, equipment and other long-term assets | 109 | | | 102 | |
| Medical claims and other policyholder liabilities payable | (185) | | | (571) | |
| Accounts payable and other current liabilities | (20) | | | (179) | |
| Other long-term liabilities | (15) | | | (6) | |
| Deferred tax liabilities | (32) | | | (556) | |
| Total net tangible assets | $ | 267 | | | $ | (107) | |
The preliminary purchase price allocations for the various business combinations are subject to adjustment as valuation analyses, primarily related to intangible assets and contingent and tax liabilities, are finalized.
Elevance Health, Inc.
Notes to Consolidated Financial Statements (continued)
Acquisition date fair values and weighted-average useful lives assigned to intangible assets include:
| | | | | | | | | | | | | | | | | | | | | | | |
| 2022 | | 2021 |
| Fair Value | | Weighted Average Useful Life | | Fair Value | | Weighted Average Useful Life |
| Customer-related | $ | 85 | | | 10 years | | $ | 1,313 | | | 13 years |
| Provider and hospital relationships | 2 | | | 15 years | | 240 | | | 14 years |
| Other | 2 | | | 0.5 years | | 24 | | | 13 years |
| State Medicaid licenses | 250 | | | Indefinite | | 20 | | | Indefinite |
| Total intangible assets | $ | 339 | | | | | $ | 1,597 | | | |
The results of operations and financial condition of acquired entities have been included in our consolidated results and the results of the corresponding operating segment as of the date of acquisition. Through December 31, 2022, the impact of the acquired entities on revenue and net earnings was not material. Unaudited pro forma revenues for the years ended December 31, 2022 and 2021 as if the acquisitions had occurred on January 1, 2021 were immaterial for both periods. The pro forma effects of the acquisitions on net earnings were immaterial for both years.
Pending Acquisitions
Louisiana Health Service & Indemnity Company (d/b/a Blue Cross and Blue Shield of Louisiana)
On February 2, 2021,January 23, 2023, we announced our entrance into an agreement with InnovaCare Health, L.P. to acquire its Puerto Rico-based subsidiaries, including MMM Holdings, LLC (“MMM”)Louisiana Health Service & Indemnity Company, d/b/a Blue Cross and itsBlue Shield of Louisiana, an independent licensee of the BCBSA that provides healthcare plans to the Individual, Group, Medicaid and Medicare Advantage plan MMM Healthcare, LLC, Medicaid plan and other affiliated companies. MMM is an integrated healthcare organization and seeks to provide its Medicare Advantage and Medicaid members with a whole health experience through its networkmarkets, primarily in the State of specialized clinics and wholly owned independent physician associations.Louisiana. This acquisition aligns with our vision to be an innovative, valuable and inclusive healthcare partner by providing care management programs that improve the lives of the people we serve. The acquisition is expected to close by the end of the secondfourth quarter of 20212023 and is subject to standard closing conditions and customary approvals.
Beacon Health Options, Inc.BioPlus Parent, LLC
On February 28, 2020,November 9, 2022, we completedannounced our acquisitionentrance into an agreement with CarepathRx Aggregator, LLC to acquire its specialty pharmacy division, which includes BioPlus Parent, LLC (“BioPlus”) and subsidiaries. BioPlus is one of Beacon Health Options, Inc. (“Beacon”) the largest independently held behavioral health organizationindependent specialty pharmacy organizations in the country. AtUnited States and seeks to connect payors and providers of specialty pharmaceuticals to meet the timemedication therapy needs of acquisition, Beacon served more than thirty-four million individuals across all fifty states.patients with complex medical conditions. This acquisition alignedaligns with our strategyvision to diversify into health servicesbe an innovative, valuable and deliver both integrated solutions andinclusive healthcare partner by providing care delivery modelsmanagement programs that personalize care for people with complex and chronic conditions.
In accordance with FASB accounting guidance for business combinations,improve the consideration transferred was allocated to the preliminary fair value of Beacon’s assets acquired and liabilities assumed, including identifiable intangible assets. The excesslives of the consideration transferred over the preliminary fair value of net assets acquired resulted in preliminary goodwill of $1,072 at December 31, 2020, all of whichpeople we serve. The acquisition was allocated to our Other segment. Preliminary goodwill recognized fromcompleted on February 15, 2023, and initial purchase accounting for the acquisition of Beacon primarilyhas not been finalized.
4. Business Optimization Initiatives
We believe that our properties are adequate and suitable for our business as presently conducted; however, we are continuing to evaluate our real estate strategy as it relates to the future economic benefits arising fromchanging needs of a more hybrid remote workforce. As a result, during 2022, we identified additional reductions of office space and recorded a net charge of $39 in selling, general and administrative expenses. This charge includes $34 for impairment and abandonment of operating-lease related ROU assets and $7 for impairment and abandonment of property and equipment. In addition, we released $2 of employee termination costs, as reflected in the table below. The net charges recognized in the Commercial & Specialty Business, Government Business, CarelonRx and Other segments in 2022, were $20, $16, $0 and $3, respectively. See Note 20, “Segment Information” for a discussion of our segments.
During 2021, we identified reductions of office space and recorded a charge of $202 in selling, general and administrative expenses. This charge included $136 for impairment and abandonment of operating-lease related ROU assets acquired and is consistent with$66 for impairment and abandonment of property and equipment. The charges recognized in the Commercial & Specialty Business, Government Business, CarelonRx and Other segments in 2021, were $108, $60, $1 and $33, respectively.
Anthem,Elevance Health, Inc.
Notes to Consolidated Financial Statements (continued)
our stated intentions and strategy. As of December 31, 2020, the initial accounting for the acquisition has not been finalized. Any additional payments or receipts of cash resulting from contractual purchase price adjustments or any subsequent adjustments made to the assets acquired or liabilities assumed during the measurement period will continue to be recorded as an adjustment to goodwill.
The preliminary fair value of the net assets acquired from Beacon includes $752 of other intangible assets at December 31, 2020, which primarily consist of finite-lived customer relationships with amortization periods ranging from 9 to 21 years. The results of operations of Beacon are included in our consolidated financial statements within our Other segment for the period following February 28, 2020. The pro forma effects of this acquisition for prior periods were not material to our consolidated results of operations.
4. Business Optimization Initiatives
During 2020, our management introduced enterprise-wide initiatives to optimize our business and, as a result, we recorded a charge of $653$653 in selling, general and administrative expenses. This charge includesincluded $258 for impairment and abandonment of operating-lease related right-of-useROU assets, $198 for impairment and abandonment of property and equipment and $197 for future payments for employee termination costs in connection with the repositioning and reskilling of our workforce. The charges recognized in the Commercial & Specialty Business, Government Business, IngenioRxCarelonRx and Other segments in 2020, were $311, $205, $4 and $133, respectively. See also Note 20, “Segment Information”. We expect most of the employee termination costs to be paid by the end of 2021. We believe these initiatives largely represent the next step forward in our progression towards becoming a more agile organization, including process automation and a reduction in our office space footprint.
A summary of the employee termination costs activity for the year ended December 31, 20202022 and ending balance at December 31, 2022, related to the liability for employee termination costs previously incurred in 2020, is as follows:
| | | | | | | | | | | | | | | | | | | | | | | | | | | | | |
| Commercial & Specialty Business | | Government Business | | IngenioRx | | Other | | Total |
| 2020 Business Optimization Initiatives | | | | | | | | | |
| Employee termination costs: | | | | | | | | | |
| Costs incurred in 2020 | $ | 96 | | | $ | 92 | | | $ | 1 | | | $ | 8 | | | $ | 197 | |
| Payments made in 2020 | (4) | | | (4) | | | 0 | | | (2) | | | (10) | |
| Total liabilities for employee termination costs ending balance at December 31, 2020 | $ | 92 | | | $ | 88 | | | $ | 1 | | | $ | 6 | | | $ | 187 | |
| | | | | | | | | |
| | | | | | | | | | | | | | | | | | | | | | | | | | | | | |
| Commercial & Specialty Business | | Government Business | | CarelonRx | | Other | | Total |
| 2020 Business Optimization Initiatives | | | | | | | | | |
| | | | | | | | | |
| Liabilities for employee termination costs at January 1, 2022 | $ | 61 | | | $ | 57 | | | $ | 1 | | | $ | 3 | | | $ | 122 | |
| Payments | (20) | | | (18) | | | — | | | (1) | | | (39) | |
| Releases | — | | | — | | | — | | | (2) | | | (2) | |
| Total liabilities for employee termination costs ending balance at December 31, 2022 | $ | 41 | | | $ | 39 | | | $ | 1 | | | $ | — | | | $ | 81 | |
Anthem,Elevance Health, Inc.
Notes to Consolidated Financial Statements (continued)
5. Investments
Certain prior year residential and commercial mortgage-backed securities have been reclassified throughout this Note 5 and Note 7, “Fair Value” to conform to the current year presentation.
A summary of current and long-term fixed maturity securities, available-for-sale, at December 31, 20202022 and 20192021 is as follows: | | | | | | | | | | | | | | | | | | | | | | | | | | | | | |
| Cost or
Amortized
Cost | | Gross
Unrealized
Gains | | Gross
Unrealized
Losses | | Allowance For Credit Losses | | Estimated
Fair Value |
| | | | | |
| December 31, 2022 | | | | | | | | | |
| Fixed maturity securities: | | | | | | | | | |
| United States Government securities | $ | 1,502 | | | $ | 2 | | | $ | (103) | | | $ | — | | | $ | 1,401 | |
| Government sponsored securities | 82 | | | 1 | | | (5) | | | — | | | 78 | |
| Foreign government securities | 321 | | | 1 | | | (46) | | | (2) | | | 274 | |
| States, municipalities and political subdivisions, tax-exempt | 4,389 | | | 19 | | | (265) | | | — | | | 4,143 | |
| Corporate securities | 13,721 | | | 31 | | | (1,218) | | | (5) | | | 12,529 | |
| Residential mortgage-backed securities | 2,978 | | | 9 | | | (324) | | | — | | | 2,663 | |
| Commercial mortgage-backed securities | 2,055 | | | 1 | | | (176) | | | (2) | | | 1,878 | |
| Other asset-backed securities | 3,967 | | | 12 | | | (241) | | | — | | | 3,738 | |
| Total fixed maturity securities | $ | 29,015 | | | $ | 76 | | | $ | (2,378) | | | $ | (9) | | | $ | 26,704 | |
| | | | | | | | | |
| | | | | | | | | |
| December 31, 2021 | | | | | | | | | |
| Fixed maturity securities: | | | | | | | | | |
| United States Government securities | $ | 1,443 | | | $ | 7 | | | $ | (18) | | | $ | — | | | $ | 1,432 | |
| Government sponsored securities | 65 | | | 4 | | | (1) | | | — | | | 68 | |
| Foreign government securities | 353 | | | 7 | | | (13) | | | — | | | 347 | |
| States, municipalities and political subdivisions, tax-exempt | 5,321 | | | 310 | | | (10) | | | — | | | 5,621 | |
| Corporate securities | 12,044 | | | 401 | | | (78) | | | (4) | | | 12,363 | |
| Residential mortgage-backed securities | 2,492 | | | 48 | | | (22) | | | — | | | 2,518 | |
| Commercial mortgage-backed securities | 1,632 | | | 29 | | | (16) | | | (2) | | | 1,643 | |
| Other asset-backed securities | 2,907 | | | 24 | | | (24) | | | — | | | 2,907 | |
| Total fixed maturity securities | $ | 26,257 | | | $ | 830 | | | $ | (182) | | | $ | (6) | | | $ | 26,899 | |
| | | | | | | | | |
| | | | | | | | | |
| | | | | | | | | | | | | | | | | | | | | | | | | | | | | | | | | | | | | | | | | |
| | | | | | | | | | | Non-Credit
Component of
Impairment Recognized in
Accumulated
Other
Comprehensive
Loss |
| Cost or
Amortized
Cost | | Gross
Unrealized
Gains | | Gross Unrealized Losses | | Allowance For Credit Losses | | Estimated
Fair Value | |
| | | | Less than
12 Months | | 12 Months
or Greater | | | |
| December 31, 2020: | | | | | | | | | | | | | |
| Fixed maturity securities: | | | | | | | | | | | | | |
| United States Government securities | $ | 765 | | | $ | 11 | | | $ | (2) | | | $ | 0 | | | $ | 0 | | | $ | 774 | | | $ | 0 | |
| Government sponsored securities | 63 | | | 6 | | | 0 | | | 0 | | | 0 | | | 69 | | | 0 | |
| Foreign government securities | 290 | | | 17 | | | (2) | | | 0 | | | 0 | | | 305 | | | 0 | |
| States, municipalities and political subdivisions, tax-exempt | 5,185 | | | 395 | | | (1) | | | 0 | | | 0 | | | 5,579 | | | 0 | |
| Corporate securities | 10,233 | | | 697 | | | (20) | | | (11) | | | (7) | | | 10,892 | | | (1) | |
| Residential mortgage-backed securities | 4,208 | | | 154 | | | (8) | | | (9) | | | 0 | | | 4,345 | | | (2) | |
| Commercial mortgage-backed securities | 73 | | | 3 | | | (1) | | | (3) | | | 0 | | | 72 | | | 0 | |
| Other securities | 1,937 | | | 33 | | | (5) | | | (6) | | | 0 | | | 1,959 | | | 0 | |
| Total fixed maturity securities | $ | 22,754 | | | $ | 1,316 | | | $ | (39) | | | $ | (29) | | | $ | (7) | | | $ | 23,995 | | | $ | (3) | |
| | | | | | | | | | | | | |
| | | | | | | | | | | | | |
| December 31, 2019 | | | | | | | | | | | | | |
| Fixed maturity securities: | | | | | | | | | | | | | |
| United States Government securities | $ | 524 | | | $ | 4 | | | $ | (3) | | | $ | 0 | | | $ | 0 | | | $ | 525 | | | $ | 0 | |
| Government sponsored securities | 136 | | | 5 | | | 0 | | | 0 | | | 0 | | | 141 | | | 0 | |
| States, municipalities and political subdivisions, tax-exempt | 4,592 | | | 262 | | | (3) | | | 0 | | | 0 | | | 4,851 | | | 0 | |
| Corporate securities | 8,870 | | | 339 | | | (9) | | | (15) | | | 0 | | | 9,185 | | | (3) | |
| Residential mortgage-backed securities | 3,654 | | | 87 | | | (6) | | | (3) | | | 0 | | | 3,732 | | | 0 | |
| Commercial mortgage-backed securities | 84 | | | 2 | | | 0 | | | 0 | | | 0 | | | 86 | | | 0 | |
| Other securities | 1,648 | | | 21 | | | (3) | | | (5) | | | 0 | | | 1,661 | | | 0 | |
| Total fixed maturity securities | $ | 19,508 | | | $ | 720 | | | $ | (24) | | | $ | (23) | | | $ | 0 | | | $ | 20,181 | | | $ | (3) | |
| | | | | | | | | | | | | |
| | | | | | | | | | | | | |
Anthem,Elevance Health, Inc.
Notes to Consolidated Financial Statements (continued)
For fixed maturity securities in an unrealized loss position at December 31, 20202022 and 2019,2021, the following table summarizes the aggregate fair values and gross unrealized losses by length of time those securities have continuously been in an unrealized loss position. | | | | | | | | | | | | | | | | | | | | | | | | | | | | | | | | | | | |
| | Less than 12 Months | | 12 Months or Greater |
| | Number of
Securities | | Estimated
Fair Value | | Gross
Unrealized
Loss | | Number of
Securities | | Estimated
Fair Value | | Gross
Unrealized
Loss |
| (Securities are whole amounts) | | | | | | | | | | | |
| December 31, 2022 | | | | | | | | | | | |
| Fixed maturity securities: | | | | | | | | | | | |
| United States Government securities | 61 | | | $ | 701 | | | $ | (40) | | | 38 | | | $ | 442 | | | $ | (63) | |
| Government sponsored securities | 39 | | | 73 | | | (4) | | | 6 | | | 5 | | | (1) | |
| Foreign government securities | 150 | | | 100 | | | (10) | | | 198 | | | 142 | | | (36) | |
| States, municipalities and political subdivisions, tax-exempt | 1,398 | | | 2,615 | | | (147) | | | 396 | | | 652 | | | (118) | |
| Corporate securities | 3,551 | | | 7,826 | | | (549) | | | 2,204 | | | 3,521 | | | (669) | |
| | | | | | | | | | | |
| Residential mortgage-backed securities | 1,341 | | | 1,435 | | | (121) | | | 496 | | | 982 | | | (203) | |
| Commercial mortgage-backed securities | 457 | | | 1,082 | | | (76) | | | 324 | | | 719 | | | (100) | |
| Other asset-backed securities | 784 | | | 2,203 | | | (124) | | | 398 | | | 1,074 | | | (117) | |
| Total fixed maturity securities | 7,781 | | | $ | 16,035 | | | $ | (1,071) | | | 4,060 | | | $ | 7,537 | | | $ | (1,307) | |
| | | | | | | | | | | |
| | | | | | | | | | | |
| December 31, 2021 | | | | | | | | | | | |
| Fixed maturity securities: | | | | | | | | | | | |
| United States Government securities | 51 | | | $ | 990 | | | $ | (11) | | | 27 | | | $ | 176 | | | $ | (7) | |
| Government sponsored securities | — | | | — | | | — | | | 1 | | | 1 | | | (1) | |
| Foreign government securities | 188 | | | 143 | | | (8) | | | 68 | | | 41 | | | (5) | |
| States, municipalities and political subdivisions, tax-exempt | 281 | | | 634 | | | (9) | | | 8 | | | 16 | | | (1) | |
| Corporate securities | 1,846 | | | 3,310 | | | (57) | | | 403 | | | 485 | | | (21) | |
| Residential mortgage-backed securities | 422 | | | 1,295 | | | (19) | | | 63 | | | 44 | | | (3) | |
| Commercial mortgage-backed securities | 272 | | | 676 | | | (8) | | | 66 | | | 137 | | | (8) | |
| Other asset-backed securities | 511 | | | 1,707 | | | (19) | | | 50 | | | 85 | | | (5) | |
| Total fixed maturity securities | 3,571 | | | $ | 8,755 | | | $ | (131) | | | 686 | | | $ | 985 | | | $ | (51) | |
| | | | | | | | | | | |
| | | | | | | | | | | |
| | | | | | | | | | | | | | | | | | | | | | | | | | | | | | | | | | | |
| | Less than 12 Months | | 12 Months or Greater |
| | Number of
Securities | | Estimated
Fair Value | | Gross
Unrealized
Loss | | Number of
Securities | | Estimated
Fair Value | | Gross
Unrealized
Loss |
| (Securities are whole amounts) | | | | | | | | | | | |
| December 31, 2020: | | | | | | | | | | | |
| Fixed maturity securities: | | | | | | | | | | | |
| United States Government securities | 27 | | | $ | 301 | | | $ | (2) | | | 0 | | | $ | 0 | | | $ | 0 | |
| Government sponsored securities | 0 | | | 0 | | | 0 | | | 1 | | | 0 | | | 0 | |
| Foreign government securities | 55 | | | 35 | | | (2) | | | 9 | | | 4 | | | 0 | |
| States, municipalities and political subdivisions, tax-exempt | 36 | | | 57 | | | (1) | | | 1 | | | 3 | | | 0 | |
| Corporate securities | 646 | | | 765 | | | (20) | | | 150 | | | 169 | | | (11) | |
| Residential mortgage-backed securities | 224 | | | 442 | | | (8) | | | 90 | | | 110 | | | (9) | |
| Commercial mortgage-backed securities | 6 | | | 16 | | | (1) | | | 3 | | | 4 | | | (3) | |
| Other securities | 207 | | | 509 | | | (5) | | | 79 | | | 179 | | | (6) | |
| Total fixed maturity securities | 1,201 | | | $ | 2,125 | | | $ | (39) | | | 333 | | | $ | 469 | | | $ | (29) | |
| | | | | | | | | | | |
| | | | | | | | | | | |
| December 31, 2019 | | | | | | | | | | | |
| Fixed maturity securities: | | | | | | | | | | | |
| United States Government securities | 27 | | | $ | 250 | | | $ | (3) | | | 2 | | | $ | 1 | | | $ | 0 | |
| Government sponsored securities | 14 | | | 12 | | | 0 | | | 3 | | | 1 | | | 0 | |
| States, municipalities and political subdivisions, tax-exempt | 114 | | | 306 | | | (3) | | | 14 | | | 11 | | | 0 | |
| Corporate securities | 386 | | | 558 | | | (9) | | | 224 | | | 286 | | | (15) | |
| Residential mortgage-backed securities | 321 | | | 635 | | | (6) | | | 189 | | | 237 | | | (3) | |
| Commercial mortgage-backed securities | 1 | | | 3 | | | 0 | | | 4 | | | 8 | | | 0 | |
| Other securities | 166 | | | 415 | | | (3) | | | 113 | | | 358 | | | (5) | |
| Total fixed maturity securities | 1,029 | | | $ | 2,179 | | | $ | (24) | | | 549 | | | $ | 902 | | | $ | (23) | |
| | | | | | | | | | | |
| | | | | | | | | | | |
Below are discussions by security type for unrealized losses and credit losses as of December 31, 2020:
Corporate securities: An allowance for credit losses on certain retail, travel and entertainment, energy, and basic materials sector fixed maturity corporate securities has been determined based on qualitative and quantitative factors including credit rating, decline in fair value and industry condition along with other available market data. With multiple risk factors present, these securities were reviewed for expected future cash flow to determine the portion of unrealized losses that were credit related and to record an allowance for credit losses. Unrealized losses on our other corporate securities were largely due to market conditions relating to the COVID-19 pandemic; however, qualitative factors did not indicate a credit loss as of December 31, 2020. We do not intend to sell these investments and it is likely we will not have to sell these investments prior to maturity or recovery of amortized cost.
As for the remaining securities shown in the table above unrealized losses on these securities have not been recognized into income because, as of December 31, 2022, we do not intend to sell these investments and it is likely that we will not be required to sell these investments prior to their anticipated recovery. The declinedeclines in fair values are largely due to increasing interest rates driven by the higher rate of inflation and other market conditions.
Allowances for credit losses have been recorded in the amounts of $9 and $6 at December 31, 2022 and 2021, respectively, for declines in fair value is largely due to unfavorable changes in interest ratesthe credit quality characteristics that impact our assessment of collectability of principal and other market conditions. We have evaluated these securities for any change in credit rating and have determined that no allowance is necessary. The fair value is expected to recover as the securities approach maturity.interest.
Anthem,Elevance Health, Inc.
Notes to Consolidated Financial Statements (continued)
The table below presents a roll-forward by major security type of the allowance for credit losses on fixed maturity securities available-for-sale held at period end for the year ended December 31, 2020:
| | | | | | | | | | | | | | | | | | | | | | | | | | | |
| Year Ended December 31, 2020 | | | | Corporate Securities | | | | Foreign Government Securities | | Total |
| Allowance for credit losses: | | | | | | | | | | |
| Beginning balance | | | | $ | 0 | | | | | $ | 0 | | | $ | 0 | |
| Additions for securities for which no previous expected credit losses were recognized | | | | 64 | | | | | 1 | | | 65 | |
| | | | | | | | | | | |
| Securities sold during the period | | | | (17) | | | | | (1) | | | (18) | |
| | | | | | | | | | | |
| Decreases to the allowance for credit losses on securities | | | | (40) | | | | | 0 | | | (40) | |
| | | | | | | | | | | |
| | | | | | | | | | | |
| Total allowance for credit losses | | | | $ | 7 | | | | | $ | 0 | | | $ | 7 | |
The amortized cost and fair value of fixed maturity securities at December 31, 2020,2022, by contractual maturity, are shown below. Expected maturities may differ from contractual maturities because the issuers of the securities may have the right to prepay obligations.
| | | Amortized
Cost | | Estimated
Fair Value | | Amortized
Cost | | Estimated
Fair Value |
| Due in one year or less | Due in one year or less | $ | 592 | | | $ | 595 | | Due in one year or less | $ | 726 | | | $ | 720 | |
| Due after one year through five years | Due after one year through five years | 5,981 | | | 6,261 | | Due after one year through five years | 7,489 | | | 7,095 | |
| Due after five years through ten years | Due after five years through ten years | 6,874 | | | 7,296 | | Due after five years through ten years | 9,512 | | | 8,703 | |
| Due after ten years | Due after ten years | 5,026 | | | 5,426 | | Due after ten years | 6,255 | | | 5,645 | |
| Mortgage-backed securities | Mortgage-backed securities | 4,281 | | | 4,417 | | Mortgage-backed securities | 5,033 | | | 4,541 | |
| Total fixed maturity securities | Total fixed maturity securities | $ | 22,754 | | | $ | 23,995 | | Total fixed maturity securities | $ | 29,015 | | | $ | 26,704 | |
Equity Securities
A summary of current equity securities at December 31, 20202022 and 20192021 is as follows:
| | | | | | | | | | | |
| December 31, 2020 | | December 31, 2019 |
| Equity Securities: | | | |
| Exchange traded funds | $ | 1,154 | | | $ | 44 | |
| Fixed maturity mutual funds | 144 | | | 643 | |
| Common equity securities | 201 | | | 237 | |
| Private equity securities | 60 | | | 85 | |
| Total | $ | 1,559 | | | $ | 1,009 | |
Anthem, Inc.
Notes to Consolidated Financial Statements (continued)
| | | | | | | | | | | |
| December 31, 2022 | | December 31, 2021 |
| Equity Securities: | | | |
| Exchange traded funds | $ | 822 | | | $ | 1,750 | |
| | | |
| Common equity securities | 43 | | | 42 | |
| Private equity securities | 88 | | | 89 | |
| Total | $ | 953 | | | $ | 1,881 | |
Investment Income
The major categories of net investment income for the years ended December 31, 2020, 20192022, 2021 and 20182020 are as follows:
| | | | | | | | | | | | | | | | | |
| 2020 | | 2019 | | 2018 |
| Fixed maturity securities | $ | 725 | | | $ | 721 | | | $ | 681 | |
| Equity securities | 71 | | | 100 | | | 86 | |
| Cash equivalents | 28 | | | 64 | | | 51 | |
| Other | 91 | | | 149 | | | 193 | |
| Investment income | 915 | | | 1,034 | | | 1,011 | |
| Investment expense | (38) | | | (29) | | | (41) | |
| Net investment income | $ | 877 | | | $ | 1,005 | | | $ | 970 | |
Investment Gains
Net realized investment gains/losses and the net change in unrealized appreciation/depreciation on investments for the years ended December 31, 2020, 2019 and 2018 are as follows:
| | | | | | | | | | | | | | | | | |
| 2020 | | 2019 | | 2018 |
| Net realized gains (losses): | | | | | |
| Fixed maturity securities: | | | | | |
| Gross realized gains from sales | $ | 175 | | | $ | 125 | | | $ | 85 | |
| Gross realized losses from sales | (105) | | | (59) | | | (116) | |
| Impairment losses recognized in income | (7) | | | (13) | | | (9) | |
| Net realized gains (losses) from sales of fixed maturity securities | 63 | | | 53 | | | (40) | |
| Equity securities: | | | | | |
| Gross realized gains | 269 | | | 147 | | | 77 | |
| Gross realized losses | (75) | | | (84) | | | (276) | |
| Net realized gains (losses) on equity securities | 194 | | | 63 | | | (199) | |
| Other investments: | | | | | |
| Gross realized gains from sales | 18 | | | 3 | | | 27 | |
| Gross realized losses from sales | 0 | | | (1) | | | 0 | |
| Impairment losses recognized in income | (91) | | | (34) | | | (17) | |
| Net realized gains (losses) from sales of other investments | (73) | | | (32) | | | 10 | |
| Net realized gains (losses) on investments | 184 | | | 84 | | | (229) | |
| | | | | |
| Change in net unrealized gains (losses) on investments: | | | | | |
| Fixed maturity securities | 575 | | | 874 | | | (529) | |
| Equity securities | 0 | | | 0 | | | 0 | |
| Other investments | (5) | | | 0 | | | 5 | |
| Total change in net unrealized gains (losses) on investments | 570 | | | 874 | | | (524) | |
| Deferred income tax (expense) benefit | (142) | | | (194) | | | 106 | |
| Change in net unrealized gains (losses) on investments | 428 | | | 680 | | | (418) | |
| | | | | |
| Net realized gains (losses) on investments and change in net unrealized gains (losses) on investments | $ | 612 | | | $ | 764 | | | $ | (647) | |
| | | | | | | | | | | | | | | | | |
| 2022 | | 2021 | | 2020 |
| Fixed maturity securities | $ | 971 | | | $ | 755 | | | $ | 725 | |
| Equity securities | 48 | | | 43 | | | 71 | |
| Cash equivalents | 77 | | | 5 | | | 28 | |
| Other invested assets | 432 | | | 616 | | | 91 | |
| Investment income | 1,528 | | | 1,419 | | | 915 | |
| Investment expenses | (43) | | | (41) | | | (38) | |
| Net investment income | $ | 1,485 | | | $ | 1,378 | | | $ | 877 | |
Anthem,Elevance Health, Inc.
Notes to Consolidated Financial Statements (continued)
TheInvestment (Losses) Gains
Net investment (losses) gains and losses related to equity securities for the years ended December 31, 20202022, 2021 and 20192020 are as follows:
| | | | | | | | | | | | | | | | | | | | |
| | 2020 | | 2019 | | 2018 |
| Net realized gains (losses) recognized on equity securities | | $ | 194 | | | $ | 63 | | | $ | (199) | |
| Less: Net realized (gains) losses recognized on equity securities sold during the period | | (61) | | | (39) | | | 57 | |
| Unrealized gains (losses) recognized in income on equity securities still held at December 31 | | $ | 133 | | | $ | 24 | | | $ | (142) | |
| | | | | | | | | | | | | | | | | |
| 2022 | | 2021 | | 2020 |
| Net gains (losses): | | | | | |
| Fixed maturity securities: | | | | | |
| Gross realized gains from sales | $ | 52 | | | $ | 170 | | | $ | 175 | |
| Gross realized losses from sales | (469) | | | (44) | | | (105) | |
| Impairment (losses) recoveries recognized in income | (31) | | | 1 | | | (7) | |
| Net realized gains on fixed maturity securities | (448) | | | 127 | | | 63 | |
| Equity securities: | | | | | |
| Unrealized (losses) gains recognized on equity securities still held | (78) | | | 2 | | | 133 | |
| Net realized (losses) gains recognized on equity securities sold | (102) | | | (73) | | | 61 | |
| Net (losses) gains on equity securities | (180) | | | (71) | | | 194 | |
| Other investments: | | | | | |
| Gross gains | 96 | | | 293 | | | 18 | |
| Gross losses | (64) | | | (22) | | | — | |
| Impairment losses recognized in income | (34) | | | (16) | | | (91) | |
| Net (losses) gains on other investments | (2) | | | 255 | | | (73) | |
| Net (losses) gains on investments | $ | (630) | | | $ | 311 | | | $ | 184 | |
| | | | | |
| | | | | |
| | | | | |
| | | | | |
| | | | | |
| | | | | |
| | | | | |
| | | | | |
| | | | | |
| | | | | |
A primary objective in the management of our fixed maturity and equity portfolios is to maximize total return relative to underlying liabilities and respective liquidity needs. In achieving this goal, assets may be sold to take advantage of market conditions or other investment opportunities as well as tax considerations. Sales will generally produce realized gains and losses. In the ordinary course of business, we may sell securities at a loss for a number of reasons, including, but not limited to: (i) changes in the investment environment; (ii) expectations that the fair value could deteriorate further; (iii) desire to reduce exposure to an issuer or an industry; (iv) changes in credit quality; or (v) changes in expected cash flow.
ProceedsTotal proceeds from sales, maturities, calls or redemptions of fixed maturity securities was $22,048, $10,565 and the related gross realized gains and gross realized losses$11,122 for the years ended December 31, are as follows:2022, 2021 and 2020, respectively.
| | | | | | | | | | | | | | | | | |
| 2020 | | 2019 | | 2018 |
| Proceeds | $ | 11,122 | | | $ | 8,351 | | | $ | 8,380 | |
| Gross realized gains | 175 | | | 125 | | | 85 | |
| Gross realized losses | (105) | | | (59) | | | (116) | |
A significant judgment in the valuation of investments is the determination of when a credit loss has occurred. We follow a consistent and systematic process for recognizing impairments on securities that sustain credit declines in value. We have established a committee responsible for the impairment review process. The decision to impair a security incorporates both quantitative criteria and qualitative information. The impairment review process considers a number of factors including, but not limited to: (i) the extent to which the fair value is less than book value, (ii) the financial condition and near term prospects of the issuer, (iii) our intent and ability to retain impaired investments for a period of time sufficient to allow for any anticipated recovery in fair value, (iv) our intent to sell or the likelihood that we will need to sell a fixed maturity security before recovery of its amortized cost basis, (v) whether the debtor is current on interest and principal payments, (vi) the reasons for the decline in value (i.e., credit event compared to liquidity, general credit spread widening, currency exchange rate or interest rate factors) and (vii) general market conditions and industry or sector specific factors. When a decision has been made to sell an impaired security or it is more likely than not that the impaired security will be required to be disposed of prior to recovery of its cost basis, the security is written down to fair value at the reporting date. For all other impaired securities, that areif the impairment is deemed to be credit impaired,related, an allowance is created.
Investment securities are exposed to various risks, such as interest rate, market and credit. Due to the level of risk associated with certain investment securities and the level of uncertainty related to changes in the value of investment securities, it is possible that changes in these risk factors in the near term could have a material adverse impact on our results of operations or shareholders’ equity.
Elevance Health, Inc.
Notes to Consolidated Financial Statements (continued)
At December 31, 20202022 and 2019,2021, there were no individual investments that exceeded 10% of shareholders’ equity.
At December 31, 20202022 and 2019,2021, there were 3eight and zero,two, respectively, fixed maturity investments that did not produce income during the years then ended.
As of December 31, 20202022 and 2019,2021, we had committed approximately $1,320$1,504 and $999,$1,558, respectively, to future capital calls from various third-party investments in exchange for an ownership interest in the related entities.
As of December 31, 2022 and 2021, we had committed approximately $185 and $329, respectively, to future investments in rated notes.
At December 31, 20202022 and 2019,2021, securities with carrying values of approximately $562$752 and $505,$632, respectively, were deposited by our insurance subsidiaries under requirements of regulatory authorities.
Anthem, Inc.Accrued Investment Income
Notes to Consolidated Financial Statements (continued)Accrued investment income totaled $245 and $205 at December 31, 2022 and 2021, respectively. We recognize accrued investment income under the caption “Other receivables” on our consolidated balance sheets.
Securities Lending Programs
The fair value of the collateral received at the time of the securities lending transactions amounted to $1,199$2,457 and $351$2,155 at December 31, 20202022 and 2019,2021, respectively. The value of the collateral represented 102% and 103% of the market value of the securities on loan at each of December 31, 20202022 and 2019, respectively.2021.
We recognize the collateral as an asset under the caption “Other current assets” in our consolidated balance sheets, and we recognize a corresponding liability for the obligation to return the collateral to the borrower under the caption “Other current liabilities.” The securities on loan are reported in the applicable investment category on our consolidated balance sheets.
At December 31, 2022 and 2021, the remaining contractual maturities of our securities lending transactions at December 31, 2020 is as follows:included overnight and continuous transactions of cash for $2,221 and $1,874, respectively, United States Government securities for $224 and $281, respectively, and residential mortgage-backed securities for $12 and $0, respectively.
| | | | | | | | | | | | | |
| Overnight and Continuous
| | | | | | | | |
Securities lending transactions | | | | | | | | | |
Cash | $ | 1,056 | | | | | | | | | |
United States Government securities | 143 | | | | | | | | | |
| | | | | | | | | |
Total | $ | 1,199 | | | | | | | | | |
Anthem,Elevance Health, Inc.
Notes to Consolidated Financial Statements (continued)
6. Derivative Financial Instruments
We primarily invest in the following types of derivative financial instruments: interest rate swaps, futures, forward contracts, put and call options, collars, swaptions, embedded derivatives and warrants. We also enter into master netting agreements which reduce credit risk by permitting net settlement of transactions. At December 31, 20202022 and 2019,2021, we had received collateral of $37$57 and $22,$18, respectively, related to our derivative financial instruments.
A summary of the aggregate contractual or notional amounts and estimated fair values related to derivative financial instruments at December 31, 20202022 and 20192021 is as follows:
| | | | Contractual/
Notional
Amount | | Balance Sheet Location | | Estimated Fair Value | | Contractual/
Notional
Amount | | Balance Sheet Location | | Estimated Fair Value |
| Asset | | (Liability) | | Asset | | (Liability) |
| December 31, 2020 | | | | | | | | |
| December 31, 2022 | | December 31, 2022 | | | | | | | |
| Hedging instruments | Hedging instruments | | Hedging instruments | |
| Interest rate swaps - fixed to floating | Interest rate swaps - fixed to floating | $ | 575 | | | Other assets/other liabilities | | $ | 37 | | | $ | 0 | | Interest rate swaps - fixed to floating | $ | 1,125 | | | Other assets/other liabilities | | $ | 3 | | | $ | (60) | |
| | | Non-hedging instruments | Non-hedging instruments | | Non-hedging instruments | |
| Derivatives embedded in convertible fixed maturity securities | | Derivatives embedded in convertible fixed maturity securities | 18 | | | Fixed Maturity Securities | | 4 | | | — | |
| Interest rate swaps | Interest rate swaps | 27 | | | Equity securities | | 0 | | | 0 | | Interest rate swaps | 5 | | | Equity securities/other assets/other liabilities | | — | | | — | |
| | Options | | Options | — | | | Other assets/other liabilities | | 1 | | | — | |
| Collars | | Collars | 19 | | | Equity securities | | 23 | | | (9) | |
| Futures | Futures | 183 | | | Equity securities | | 6 | | | (5) | | Futures | 358 | | | Equity securities | | 2 | | | (2) | |
| Subtotal non-hedging | Subtotal non-hedging | 210 | | | Subtotal non-hedging | | 6 | | | (5) | | Subtotal non-hedging | 400 | | | Subtotal non-hedging | | 30 | | | (11) | |
| Total derivatives | Total derivatives | $ | 785 | | | Total derivatives | | 43 | | | (5) | | Total derivatives | $ | 1,525 | | | Total derivatives | | 33 | | | (71) | |
| | | | Amounts netted | | 0 | | | 0 | | | | | Amounts netted | | (12) | | | 12 | |
| | Net derivatives | | $ | 43 | | | $ | (5) | | | Net derivatives | | $ | 21 | | | $ | (59) | |
| | December 31, 2019 | | |
| December 31, 2021 | | December 31, 2021 | |
| Hedging instruments | Hedging instruments | | Hedging instruments | |
| Interest rate swaps - fixed to floating | Interest rate swaps - fixed to floating | $ | 1,200 | | | Other assets/other liabilities | | $ | 22 | | | $ | (1) | | Interest rate swaps - fixed to floating | $ | 825 | | | Other assets/other liabilities | | $ | 23 | | | $ | (5) | |
| | Non-hedging instruments | Non-hedging instruments | | Non-hedging instruments | |
| Interest rate swaps | Interest rate swaps | 1 | | | Equity securities | | 0 | | | 0 | | Interest rate swaps | 119 | | | Equity securities/other assets/other liabilities | | — | | | (5) | |
| | Options | | Options | 100 | | | Other assets/other liabilities | | — | | | — | |
| Collars | | Collars | 19 | | | Equity securities | | 21 | | | (17) | |
| Futures | Futures | 134 | | | Equity securities | | 1 | | | 0 | | Futures | 344 | | | Equity securities | | 3 | | | (2) | |
| Subtotal non-hedging | Subtotal non-hedging | 135 | | | Subtotal non-hedging | | 1 | | | 0 | | Subtotal non-hedging | 582 | | | Subtotal non-hedging | | 24 | | | (24) | |
| Total derivatives | Total derivatives | $ | 1,335 | | | Total derivatives | | 23 | | | (1) | | Total derivatives | $ | 1,407 | | | Total derivatives | | 47 | | | (29) | |
| | | | Amounts netted | | (1) | | | 1 | | | | | Amounts netted | | (21) | | | 21 | |
| | Net derivatives | | $ | 22 | | | $ | 0 | | | Net derivatives | | $ | 26 | | | $ | (8) | |
Anthem,Elevance Health, Inc.
Notes to Consolidated Financial Statements (continued)
Fair Value Hedges
We have entered into various interest rate swap contracts to convert a portion of our interest rate exposure on our long-term debt from fixed rates to floating rates. The floating rates payable on all of our fair value hedges are benchmarked to the LIBOR.LIBOR or the Secured Overnight Financing Rate. A summary of our outstanding fair value hedges at December 31, 20202022 and 20192021 is as follows:
| | Type of Fair Value Hedges | Type of Fair Value Hedges | | Year
Entered
Into | | Outstanding Notional Amount | | Interest Rate
Received | | Expiration Date | Type of Fair Value Hedges | | Year
Entered
Into | | Outstanding Notional Amount | | Interest Rate
Received | | Expiration Date |
| 2020 | | 2019 | | | 2022 | | 2021 | |
| Interest rate swap | Interest rate swap | | 2020 | | $ | 75 | | | $ | 0 | | | 4.101 | | % | | September 1, 2027 | Interest rate swap | | 2022 | | $ | 150 | | | $ | — | | | 5.500 | | % | | April 15, 2032 |
| Interest rate swap | Interest rate swap | | 2018 | | 50 | | | 50 | | | 4.101 | | | September 1, 2027 | Interest rate swap | | 2022 | | 75 | | | — | | | 4.101 | | | September 1, 2027 |
| Interest rate swap | Interest rate swap | | 2018 | | 450 | | | 450 | | | 3.300 | | | January 15, 2023 | Interest rate swap | | 2022 | | 75 | | | — | | | 2.250 | | | November 15, 2029 |
| Interest rate swap | Interest rate swap | | 2018 | | 0 | | | 90 | | | 4.350 | | | August 15, 2020 | Interest rate swap | | 2021 | | 150 | | | 150 | | | 2.550 | | | September 15, 2030 |
| Interest rate swap | Interest rate swap | | 2017 | | 0 | | | 50 | | | 4.350 | | | August 15, 2020 | Interest rate swap | | 2021 | | 100 | | | 100 | | | 2.250 | | | November 15, 2029 |
| Interest rate swap | Interest rate swap | | 2015 | | 0 | | | 200 | | | 4.350 | | | August 15, 2020 | Interest rate swap | | 2020 | | 75 | | | 75 | | | 4.101 | | | September 1, 2027 |
| Interest rate swap | Interest rate swap | | 2014 | | 0 | | | 150 | | | 4.350 | | | August 15, 2020 | Interest rate swap | | 2018 | | 50 | | | 50 | | | 4.101 | | | September 1, 2027 |
| Interest rate swap | Interest rate swap | | 2013 | | 0 | | | 10 | | | 4.350 | | | August 15, 2020 | Interest rate swap | | 2018 | | 450 | | | 450 | | | 3.300 | | | January 15, 2023 |
| Interest rate swap | | 2012 | | 0 | | | 200 | | | 4.350 | | | August 15, 2020 | |
| Total notional amount outstanding | Total notional amount outstanding | | $ | 575 | | | $ | 1,200 | | | Total notional amount outstanding | | $ | 1,125 | | | $ | 825 | | |
The following amounts were recorded on our consolidated balance sheets related to cumulative basis adjustments for fair value hedges at December 31, 20202022 and 2019:
| | | | | | | | | | | | | | | | | | | | | | | | | | |
| Balance Sheet Classification in Which Hedged Item is Included | | Carrying Amount of Hedged Liability | | Cumulative Amount of Fair Value Hedging Adjustment Included in the Carrying Amount of the Hedged Liability |
| 2020 | | 2019 | | 2020 | | 2019 |
| Current portion of long term-debt | | $ | 700 | | | $ | 1,598 | | | $ | 37 | | | $ | 22 | |
| Long-term debt | | 19,335 | | | 17,787 | | | 0 | | | (1) | |
| | | | | | | | | | | | | | | | | | | | | | | | | | |
| Balance Sheet Classification in Which Hedged Item is Included | | Carrying Amount of Hedged Liability | | Cumulative Amount of Fair Value Hedging Adjustment Included in the Carrying Amount of the Hedged Liability |
| 2022 | | 2021 | | 2022 | | 2021 |
| Long-term debt | | $ | 22,349 | | | $ | 21,157 | | | $ | (57) | | | $ | 18 | |
Cash Flow Hedges
We have entered into a series of forward starting pay fixed interest rate swaps with the objective of eliminating the variability of cash flows in the interest payments on future financings that were anticipated at the time of entering into the swaps. During 2020,2022 and 2021, swaps in the notional amount of $725$700 and $450, respectively, were terminated. All swaps have expired or were terminated as of December 31, 2020.
The unrecognized loss for all expired and terminated cash flow hedges included in accumulated other comprehensive income (loss),loss, net of tax, was $250$229 and $262$239 at December 31, 20202022 and 2019,2021, respectively. As of December 31, 2020,2022, the total amount of amortization over the next twelve months for all cash flow hedges is estimated to increase interest expense by approximately $14.$13. No amounts were excluded from effectiveness testing.
Anthem, Inc.
Notes to Consolidated Financial Statements (continued)
A summary of the effect of cash flow hedges in accumulated other comprehensive income (loss) for the years ended December 31, 2020, 2019 and 2018 is as follows:
| | | | | | | | | | | | | | | | | | | | |
| | Hedge
Loss
Recognized
in Other
Comprehensive
Income (Loss) | | Income Statement
Location of
Loss
Reclassification
from Accumulated
Other Comprehensive
Income (Loss) | | Hedge Loss
Reclassified from
Accumulated
Other
Comprehensive
Income (Loss) |
| Type of Cash Flow Hedge | | | |
| Year ended December 31, 2020 | | | | | | |
| Forward starting pay fixed swaps | | $ | 0 | | | Interest expense | | $ | (15) | |
| | | | | | |
| Year ended December 31, 2019 | | | | | | |
| Forward starting pay fixed swaps | | (35) | | | Interest expense | | (15) | |
| | | | | | |
| Year ended December 31, 2018 | | | | | | |
| Forward starting pay fixed swaps | | (33) | | | Interest expense | | (14) | |
Income Statement Relationship of Fair Value and Cash Flow Hedging
A summary of the relationship between the effects of fair value and cash flow hedges on the total amount of income and expense presented in our consolidated statements of income for the years ended December 31, 2020, 2019 and 2018 is as follows:
| | | | | | | | | | | | | | | | | | | | | | | | | | | | | | | | | | | |
| Classification and Amount of Gain (Loss) Recognized in Income on Fair Value and Cash Flow Hedging Relationships |
| 2020 | | 2019 | | 2018 |
| Net Realized Gains (Losses) on Financial Instruments | | Interest Expense | | Net Realized Gains (Losses) on Financial Instruments | | Interest Expense | | Net Realized Gains (Losses) on Financial Instruments | | Interest Expense |
| Total amount of income or expense in the income statement in which the effects of fair value or cash flow hedges are recorded | $ | 182 | | | $ | (784) | | | $ | 67 | | | $ | (746) | | | $ | (206) | | | $ | (753) | |
| | | | | | | | | | | |
| Gain (loss) on fair value hedging relationships: | | | | | | | | | | | |
| Interest rate swaps: | | | | | | | | | | | |
| Hedged items | — | | | (15) | | | — | | | 2 | | | — | | | 0 | |
| Derivatives designated as hedging instruments | — | | | 15 | | | — | | | (2) | | | — | | | 0 | |
| | | | | | | | | | | |
| Loss on cash flow hedging relationships: | | | | | | | | | | | |
| Forward starting pay fixed swaps: | | | | | | | | | | | |
| Amount of loss reclassified from accumulated other comprehensive loss into net income | — | | | (15) | | | — | | | (15) | | | — | | | (14) | |
| | | | | | | | | | | |
Anthem,Elevance Health, Inc.
Notes to Consolidated Financial Statements (continued)
Non-Hedging Derivatives
A summary of the effect of non-hedging derivatives on our consolidated statements of income for the years ended December 31, 2020, 20192022, 2021 and 20182020 is as follows:
| | | | | | | | | | | | | | |
| Type of Non-hedging Derivatives | | Income Statement Location of
Gain (Loss) Recognized | | Derivative
(Loss) Gain (Loss)
Recognized |
| Year ended December 31, 2022 | | | | |
| Derivatives embedded in convertible securities | | Net (losses) gains on financial instruments | | $ | (3) | |
| Interest rate swaps | | Net (losses) gains on financial instruments | | (4) | |
| Options (including swaptions) | | Net (losses) gains on financial instruments | | 13 | |
| Collars | | Net (losses) gains on financial instruments | | 10 | |
| Futures | | Net (losses) gains on financial instruments | | 64 | |
| Total | | | | $ | 80 | |
| Year ended December 31, 2021 | | | | |
| Interest rate swaps | | Net (losses) gains on financial instruments | | $ | (4) | |
| Collars | | Net (losses) gains on financial instruments | | 4 | |
| Futures | | Net (losses) gains on financial instruments | | 7 | |
| Total | | | | $ | 7 | |
| Year ended December 31, 2020 | | | | |
| | | | |
| Interest rate swaps | | Net realized(losses) gains (losses) on financial instruments | | $ | (1) | |
| Options | | Net realized(losses) gains (losses) on financial instruments | | (5) | |
| Futures | | Net realized(losses) gains (losses) on financial instruments | | 4 | |
| | | | |
Total | | | | $ | (2) | |
Year ended December 31, 2019 | | | | |
Interest rate swaps | | Net realized gains (losses) on financial instruments | | $ | 1 | |
Options | | Net realized gains (losses) on financial instruments | | (8) | |
Futures | | Net realized gains (losses) on financial instruments | | (10) | |
Total | | | | $ | (17) | |
Year ended December 31, 2018 | | | | |
| | | | |
Interest rate swaps | | Net realized gains (losses) on financial instruments | | $ | 14 | |
Options | | Net realized gains (losses) on financial instruments | | 1 | |
Futures | | Net realized gains (losses) on financial instruments | | 8 | |
| Total | | | | $ | 23 (2) | |
7. Fair Value
Assets and liabilities recorded at fair value in the consolidated balance sheets are categorized based upon the level of judgment associated with the inputs used to measure their fair value. Level inputs, as defined by FASB guidance for fair value measurements and disclosures, are as follows:
| | | | | | | | |
| Level Input: | | Input Definition: |
| Level I | | Inputs are unadjusted, quoted prices for identical assets or liabilities in active markets at the measurement date. |
| Level II | | Inputs other than quoted prices included in Level I that are observable for the asset or liability through corroboration with market data at the measurement date. |
| Level III | | Unobservable inputs that reflect management’s best estimate of what market participants would use in pricing the asset or liability at the measurement date. |
The following methods, assumptions and inputs were used to determine the fair value of each class of the following assets and liabilities recorded at fair value in the consolidated balance sheets:
Cash equivalents: Cash equivalents primarily consist of highly rated money market funds with maturities of three months or less, and are purchased daily at par value with specified yield rates. Due to the high ratings and short-term nature of the funds, we designate all cash equivalents as Level I.
Fixed maturity securities, available-for-sale: Fair values of available-for-sale fixed maturity securities are based on quoted market prices, where available. These fair values are obtained primarily from third-party pricing services, which generally use Level I or Level II inputs for the determination of fair value to facilitate fair value measurements and disclosures. Level II securities primarily include corporate securities, securities from states, municipalities and political
Elevance Health, Inc.
Notes to Consolidated Financial Statements (continued)
subdivisions, mortgage-backed securities, United States Government securities, foreign government securities, and certain other asset-backed securities. For securities not actively traded, the pricing services may use quoted market prices of
Anthem, Inc.
Notes to Consolidated Financial Statements (continued)
comparable instruments or discounted cash flow analyses, incorporating inputs that are currently observable in the markets for similar securities. We have controls in place to review the pricing services’ qualifications and procedures used to determine fair values. In addition, we periodically review the pricing services’ pricing methodologies, data sources and pricing inputs to ensure the fair values obtained are reasonable. Inputs that are often used in the valuation methodologies include, but are not limited to, broker quotes, benchmark yields, credit spreads, default rates and prepayment speeds. We also have certain fixed maturity securities, primarily collateralized loan obligation securities and corporate debt securities, that are designated Level III securities. For these securities, the valuation methodologies may incorporate broker quotes or discounted cash flow analyses using assumptions for inputs such as expected cash flows, benchmark yields, credit spreads, default rates and prepayment speeds that are not observable in the markets.
Equity securities: Fair values of equity securities are generally designated as Level I and are based on quoted market prices. For certain equity securities, quoted market prices for the identical security are not always available, and the fair value is estimated by reference to similar securities for which quoted prices are available. These securities are designated Level II. We also have certain equity securities, including private equity securities, for which the fair value is estimated based on each security’s current condition and future cash flow projections. Such securities are designated Level III. The fair values of these private equity securities are generally based on either broker quotes or discounted cash flow projections using assumptions for inputs such as the weighted-average cost of capital, long-term revenue growth rates and earnings before interest, taxes, depreciation and amortization, and/or revenue multiples that are not observable in the markets.
Securities lending collateral: Fair values of securities lending collateral are based on quoted market prices, where available. These fair values are obtained primarily from third-party pricing services, which generally use Level I or Level II inputs for the determination of fair value, to facilitate fair value measurements and disclosures.
Derivatives: Fair values are based on the quoted market prices by the financial institution that is the counterparty to the derivative transaction. We independently verify prices provided by the counterparties using valuation models that incorporate market observable inputs for similar derivative transactions. Derivatives are designated as Level II securities. Derivatives presented within the fair value hierarchy table below are presented on a gross basis and not on a master netting basis by counterparty.
In addition, the following methods and assumptions were used to determine the fair value of each class of pension benefit plan assets and other benefit plan assets not defined above (see Note 11, “Retirement Benefits,” for fair values of benefit plan assets):
Mutual funds: Fair values are based on quoted market prices, which represent the net asset value (“NAV”) of the shares held.
Partnership investments: Fair values are estimated based on the plan’s proportionate share of the undistributed partners’ capital as reported in audited financial statements of the partnership. In accordance with FASB guidance, certain investments that are measured at fair value using the NAV per share as a practical expedient or the fair value measurement alternative have been classified in the fair value hierarchy. The fair value amounts presented are intended to permit reconciliation of the fair value hierarchy to the total investments of the master trust.
Commingled fund: Fair value is based on NAV per fund share, primarily derived from the quoted prices in active markets on the underlying equity securities.
Contract with insurance company: Fair value of the contract in the insurance company general investment account is determined by the insurance company based on the fair value of the underlying investments of the account.
Investment in DOL 103-12 trust: Fair value is based on the plan’s proportionate share of the fair value of investments held by the trust, qualified as a Department of Labor Regulation 2520.103-12 entity (“DOL 103-12 trust”) as reported in the audited financial statements of the trust, where the trustee applies fair value measurements to the underlying investments of the trust.
Life insurance contracts: Fair value is based on the cash surrender value of the policies as reported by the insurer.
Anthem,Elevance Health, Inc.
Notes to Consolidated Financial Statements (continued)
A summary of fair value measurements by level for assets and liabilities measured at fair value on a recurring basis at December 31, 20202022 and 20192021 is as follows:
| | | | | | | | | | | | | | | | | | | | | | | |
| Level I | | Level II | | Level III | | Total |
| December 31, 2020 | | | | | | | |
| Assets: | | | | | | | |
| Cash equivalents | $ | 3,163 | | | $ | 0 | | | $ | 0 | | | $ | 3,163 | |
| Fixed maturity securities, available-for-sale: | | | | | | | |
| United States Government securities | 0 | | | 774 | | | 0 | | | 774 | |
| Government sponsored securities | 0 | | | 69 | | | 0 | | | 69 | |
| Foreign government securities | 0 | | | 305 | | | 0 | | | 305 | |
| States, municipalities and political subdivisions, tax-exempt | 0 | | | 5,579 | | | 0 | | | 5,579 | |
| Corporate securities | 0 | | | 10,567 | | | 325 | | | 10,892 | |
| Residential mortgage-backed securities | 0 | | | 4,343 | | | 2 | | | 4,345 | |
| Commercial mortgage-backed securities | 0 | | | 72 | | | 0 | | | 72 | |
| Other securities | 0 | | | 1,954 | | | 5 | | | 1,959 | |
| Total fixed maturity securities, available-for-sale | 0 | | | 23,663 | | | 332 | | | 23,995 | |
| Equity securities: | | | | | | | |
| Exchange traded funds | 1,154 | | | 0 | | | 0 | | | 1,154 | |
| Fixed maturity mutual funds | 0 | | | 144 | | | 0 | | | 144 | |
| Common equity securities | 171 | | | 30 | | | 0 | | | 201 | |
| Private equity securities | 0 | | | 0 | | | 60 | | | 60 | |
| Total equity securities | 1,325 | | | 174 | | | 60 | | | 1,559 | |
| | | | | | | |
| Securities lending collateral | 0 | | | 1,199 | | | 0 | | | 1,199 | |
| Derivatives | 0 | | | 43 | | | 0 | | | 43 | |
| Total assets | $ | 4,488 | | | $ | 25,079 | | | $ | 392 | | | $ | 29,959 | |
| Liabilities: | | | | | | | |
| Derivatives | $ | 0 | | | $ | (5) | | | $ | 0 | | | $ | (5) | |
| Total liabilities | $ | 0 | | | $ | (5) | | | $ | 0 | | | $ | (5) | |
| | | | | | | |
| December 31, 2019 | | | | | | | |
| Assets: | | | | | | | |
| Cash equivalents | $ | 2,015 | | | $ | 0 | | | $ | 0 | | | $ | 2,015 | |
| Fixed maturity securities, available-for-sale: | | | | | | | |
| United States Government securities | 0 | | | 525 | | | 0 | | | 525 | |
| Government sponsored securities | 0 | | | 141 | | | 0 | | | 141 | |
| States, municipalities and political subdivisions, tax-exempt | 0 | | | 4,851 | | | 0 | | | 4,851 | |
| Corporate securities | 0 | | | 8,882 | | | 303 | | | 9,185 | |
| Residential mortgage-backed securities | 0 | | | 3,730 | | | 2 | | | 3,732 | |
| Commercial mortgage-backed securities | 0 | | | 86 | | | 0 | | | 86 | |
| Other securities | 0 | | | 1,654 | | | 7 | | | 1,661 | |
| Total fixed maturity securities, available-for-sale | 0 | | | 19,869 | | | 312 | | | 20,181 | |
| Equity securities: | | | | | | | |
| Exchange traded funds | 44 | | | 0 | | | 0 | | | 44 | |
| Fixed maturity mutual funds | 0 | | | 643 | | | 0 | | | 643 | |
| Common equity securities | 206 | | | 31 | | | 0 | | | 237 | |
| Private equity securities | 0 | | | 0 | | | 85 | | | 85 | |
| Total equity securities | 250 | | | 674 | | | 85 | | | 1,009 | |
| | | | | | | |
| Securities lending collateral | 0 | | | 353 | | | 0 | | | 353 | |
| Derivatives | 0 | | | 23 | | | 0 | | | 23 | |
| Total assets | $ | 2,265 | | | $ | 20,919 | | | $ | 397 | | | $ | 23,581 | |
| Liabilities: | | | | | | | |
| Derivatives | $ | 0 | | | $ | (1) | | | $ | 0 | | | $ | (1) | |
| Total liabilities | $ | 0 | | | $ | (1) | | | $ | 0 | | | $ | (1) | |
| | | | | | | | | | | | | | | | | | | | | | | |
| Level I | | Level II | | Level III | | Total |
| December 31, 2022 | | | | | | | |
| Assets: | | | | | | | |
| Cash equivalents | $ | 3,567 | | | $ | — | | | $ | — | | | $ | 3,567 | |
| Fixed maturity securities, available-for-sale: | | | | | | | |
| United States Government securities | — | | | 1,401 | | | — | | | 1,401 | |
| Government sponsored securities | — | | | 78 | | | — | | | 78 | |
| Foreign government securities | — | | | 274 | | | — | | | 274 | |
| States, municipalities and political subdivisions, tax-exempt | — | | | 4,143 | | | — | | | 4,143 | |
| Corporate securities | — | | | 12,392 | | | 137 | | | 12,529 | |
| Residential mortgage-backed securities | — | | | 2,663 | | | — | | | 2,663 | |
| Commercial mortgage-backed securities | — | | | 1,878 | | | — | | | 1,878 | |
| Other asset-backed securities | — | | | 3,382 | | | 356 | | | 3,738 | |
| Total fixed maturity securities, available-for-sale | — | | | 26,211 | | | 493 | | | 26,704 | |
| Equity securities: | | | | | | | |
| Exchange traded funds | 822 | | | — | | | — | | | 822 | |
| Common equity securities | 2 | | | 41 | | | — | | | 43 | |
| Private equity securities | — | | | — | | | 88 | | | 88 | |
| Total equity securities | 824 | | | 41 | | | 88 | | | 953 | |
| Other invested assets - common equity securities | 103 | | | — | | | — | | | 103 | |
| Securities lending collateral | — | | | 2,457 | | | — | | | 2,457 | |
| Derivatives - other assets | — | | | 3 | | | — | | | 3 | |
| Total assets | $ | 4,494 | | | $ | 28,712 | | | $ | 581 | | | $ | 33,787 | |
| Liabilities: | | | | | | | |
| Derivatives - other liabilities | $ | — | | | $ | (60) | | | $ | — | | | $ | (60) | |
| Total liabilities | $ | — | | | $ | (60) | | | $ | — | | | $ | (60) | |
| | | | | | | |
| December 31, 2021 | | | | | | | |
| Assets: | | | | | | | |
| Cash equivalents | $ | 2,415 | | | $ | — | | | $ | — | | | $ | 2,415 | |
| Fixed maturity securities, available-for-sale: | | | | | | | |
| United States Government securities | — | | | 1,432 | | | — | | | 1,432 | |
| Government sponsored securities | — | | | 68 | | | — | | | 68 | |
| Foreign government securities | — | | | 347 | | | — | | | 347 | |
| States, municipalities and political subdivisions, tax-exempt | — | | | 5,621 | | | — | | | 5,621 | |
| Corporate securities | — | | | 12,027 | | | 336 | | | 12,363 | |
| Residential mortgage-backed securities | — | | | 2,513 | | | 5 | | | 2,518 | |
| Commercial mortgage-backed securities | — | | | 1,643 | | | — | | | 1,643 | |
| Other asset-backed securities | — | | | 2,888 | | | 19 | | | 2,907 | |
| Total fixed maturity securities, available-for-sale | — | | | 26,539 | | | 360 | | | 26,899 | |
| Equity securities: | | | | | | | |
| Exchange traded funds | 1,750 | | | — | | | — | | | 1,750 | |
| Common equity securities | 8 | | | 34 | | | — | | | 42 | |
| Private equity securities | — | | | — | | | 89 | | | 89 | |
| Total equity securities | 1,758 | | | 34 | | | 89 | | | 1,881 | |
| Other invested assets - common equity securities | 138 | | | — | | | — | | | 138 | |
| Securities lending collateral | — | | | 2,155 | | | — | | | 2,155 | |
| Derivatives - other assets | — | | | 19 | | | — | | | 19 | |
| Total assets | $ | 4,311 | | | $ | 28,747 | | | $ | 449 | | | $ | 33,507 | |
| Liabilities: | | | | | | | |
| Derivatives - other liabilities | $ | — | | | $ | (1) | | | $ | — | | | $ | (1) | |
| Total liabilities | $ | — | | | $ | (1) | | | $ | — | | | $ | (1) | |
Anthem,Elevance Health, Inc.
Notes to Consolidated Financial Statements (continued)
A reconciliation of the beginning and ending balances of assets measured at fair value on a recurring basis using Level III inputs for the years ended December 31, 2020, 20192022, 2021 and 20182020 is as follows:
| | | | Corporate
Securities | | Residential
Mortgage-
backed
Securities | | | Other Asset-Backed Securities | | Equity
Securities | | Total |
| Year ended December 31, 2022 | | Year ended December 31, 2022 | | | | | | | | | | |
| Beginning balance at January 1, 2022 | | Beginning balance at January 1, 2022 | $ | 336 | | | $ | 5 | | | | $ | 19 | | | $ | 89 | | | $ | 449 | |
| Total gains (losses): | | Total gains (losses): | | | |
| Recognized in net income | | Recognized in net income | — | | | — | | | | (1) | | | — | | | (1) | |
| Recognized in accumulated other comprehensive income | | Recognized in accumulated other comprehensive income | (1) | | | — | | | | (16) | | | — | | | (17) | |
| Purchases | | Purchases | 56 | | | — | | | | 370 | | | 17 | | | 443 | |
| Sales | | Sales | (210) | | | — | | | | (14) | | | (18) | | | (242) | |
| Settlements | | Settlements | (41) | | | — | | | | — | | | — | | | (41) | |
| Transfers into Level III | | Transfers into Level III | 9 | | | — | | | | — | | | — | | | 9 | |
| Transfers out of Level III | | Transfers out of Level III | (12) | | | (5) | | | | (2) | | | — | | | (19) | |
| Ending balance at December 31, 2022 | | Ending balance at December 31, 2022 | $ | 137 | | | $ | — | | | | $ | 356 | | | $ | 88 | | | $ | 581 | |
| Change in unrealized gains or losses included in net income related to assets still held at December 31, 2022 | | Change in unrealized gains or losses included in net income related to assets still held at December 31, 2022 | $ | — | | | $ | — | | | | $ | — | | | $ | — | | | $ | — | |
| | Year ended December 31, 2021 | | Year ended December 31, 2021 | | | |
| Beginning balance at January 1, 2021 | | Beginning balance at January 1, 2021 | $ | 325 | | | $ | 2 | | | | $ | 5 | | | $ | 60 | | | $ | 392 | |
| Total gains (losses): | | Total gains (losses): | | | |
| Recognized in net income | | Recognized in net income | 2 | | | — | | | | — | | | 17 | | | 19 | |
| Recognized in accumulated other comprehensive income | | Recognized in accumulated other comprehensive income | 3 | | | — | | | | — | | | — | | | 3 | |
| Purchases | | Purchases | 179 | | | 4 | | | | 17 | | | 16 | | | 216 | |
| Sales | | Sales | (18) | | | — | | | | — | | | (4) | | | (22) | |
| Settlements | | Settlements | (157) | | | — | | | | — | | | — | | | (157) | |
| Transfers into Level III | | Transfers into Level III | 3 | | | — | | | | — | | | — | | | 3 | |
| Transfers out of Level III | | Transfers out of Level III | (1) | | | (1) | | | | (3) | | | — | | | (5) | |
| Ending balance at December 31, 2021 | | Ending balance at December 31, 2021 | $ | 336 | | | $ | 5 | | | | $ | 19 | | | $ | 89 | | | $ | 449 | |
| Change in unrealized gains or losses included in net income related to assets still held at December 31, 2021 | | Change in unrealized gains or losses included in net income related to assets still held at December 31, 2021 | $ | — | | | $ | — | | | | $ | — | | | $ | 18 | | | $ | 18 | |
| | Corporate
Securities | | Residential
Mortgage-
backed
Securities | | | Other
Securities | | Equity
Securities | | Total | | | | | | | | | | | |
| Year ended December 31, 2020 | Year ended December 31, 2020 | | | | | | | | | | | Year ended December 31, 2020 | | | |
| Beginning balance at January 1, 2020 | Beginning balance at January 1, 2020 | $ | 303 | | | $ | 2 | | | | $ | 7 | | | $ | 85 | | | $ | 397 | | Beginning balance at January 1, 2020 | $ | 303 | | | $ | 2 | | | | $ | 7 | | | $ | 85 | | | $ | 397 | |
| Total gains (losses): | Total gains (losses): | | | | Total gains (losses): | | | |
| Recognized in net income | Recognized in net income | (3) | | | 0 | | | | 0 | | | (19) | | | (22) | | Recognized in net income | (3) | | | — | | | | — | | | (19) | | | (22) | |
| Recognized in accumulated other comprehensive income | Recognized in accumulated other comprehensive income | (5) | | | 0 | | | | 0 | | | 0 | | | (5) | | Recognized in accumulated other comprehensive income | (5) | | | — | | | | — | | | — | | | (5) | |
| Purchases | Purchases | 85 | | | 0 | | | | 0 | | | 16 | | | 101 | | Purchases | 85 | | | — | | | | — | | | 16 | | | 101 | |
| Sales | Sales | (19) | | | 0 | | | | 0 | | | (22) | | | (41) | | Sales | (19) | | | — | | | | — | | | (22) | | | (41) | |
| Settlements | Settlements | (44) | | | 0 | | | | (2) | | | 0 | | | (46) | | Settlements | (44) | | | — | | | | (2) | | | — | | | (46) | |
| Transfers into Level III | Transfers into Level III | 10 | | | 0 | | | | 0 | | | 0 | | | 10 | | Transfers into Level III | 10 | | | — | | | | — | | | — | | | 10 | |
| Transfers out of Level III | Transfers out of Level III | (2) | | | 0 | | | | 0 | | | 0 | | | (2) | | Transfers out of Level III | (2) | | | — | | | | — | | | — | | | (2) | |
| Ending balance at December 31, 2020 | Ending balance at December 31, 2020 | $ | 325 | | | $ | 2 | | | | $ | 5 | | | $ | 60 | | | $ | 392 | | Ending balance at December 31, 2020 | $ | 325 | | | $ | 2 | | | | $ | 5 | | | $ | 60 | | | $ | 392 | |
| Change in unrealized gains or losses included in net income related to assets still held at December 31, 2020 | Change in unrealized gains or losses included in net income related to assets still held at December 31, 2020 | $ | 0 | | | $ | 0 | | | | $ | 0 | | | $ | (19) | | | $ | (19) | | Change in unrealized gains or losses included in net income related to assets still held at December 31, 2020 | $ | — | | | $ | — | | | | $ | — | | | $ | (19) | | | $ | (19) | |
| | Year ended December 31, 2019 | | | | |
| Beginning balance at January 1, 2019 | $ | 287 | | | $ | 6 | | | | $ | 17 | | | $ | 313 | | | $ | 623 | | |
| Total gains (losses): | | | | |
| Recognized in net income | (7) | | | 0 | | | | 0 | | | (6) | | | (13) | | |
| Recognized in accumulated other comprehensive loss | 3 | | | 0 | | | | 0 | | | 0 | | | 3 | | |
| Purchases | 122 | | | 0 | | | | 2 | | | 65 | | | 189 | | |
| Sales | (22) | | | 0 | | | | 0 | | | (79) | | | (101) | | |
| Settlements | (71) | | | (2) | | | | (6) | | | 0 | | | (79) | | |
| Transfers into Level III | 0 | | | 0 | | | | 3 | | | 2 | | | 5 | | |
| Transfers out of Level III | (9) | | | (2) | | | | (9) | | | (210) | | | (230) | | |
| Ending balance at December 31, 2019 | $ | 303 | | | $ | 2 | | | | $ | 7 | | | $ | 85 | | | $ | 397 | | |
| Change in unrealized gains or losses included in net income related to assets still held at December 31, 2019 | $ | 0 | | | $ | 0 | | | | $ | 0 | | | $ | 6 | | | $ | 6 | | |
| | Year ended December 31, 2018 | | | | |
| Beginning balance at January 1, 2018 | $ | 229 | | | $ | 5 | | | | $ | 16 | | | $ | 287 | | | $ | 537 | | |
| Total gains (losses): | | | | |
| Recognized in net income | 1 | | | 0 | | | | 0 | | | (229) | | | (228) | | |
| Recognized in accumulated other comprehensive loss | (5) | | | 0 | | | | 0 | | | 0 | | | (5) | | |
| Purchases | 120 | | | 2 | | | | 18 | | | 290 | | | 430 | | |
| Sales | (33) | | | 0 | | | | (1) | | | (35) | | | (69) | | |
| Settlements | (88) | | | (1) | | | | (10) | | | 0 | | | (99) | | |
| Transfers into Level III | 65 | | | 0 | | | | 9 | | | 0 | | | 74 | | |
| Transfers out of Level III | (2) | | | 0 | | | | (15) | | | 0 | | | (17) | | |
| Ending balance at December 31, 2018 | $ | 287 | | | $ | 6 | | | | $ | 17 | | | $ | 313 | | | $ | 623 | | |
| Change in unrealized gains or losses included in net income related to assets still held at December 31, 2018 | $ | 0 | | | $ | 0 | | | | $ | 0 | | | $ | 30 | | | $ | 30 | | |
There were no individually material transfers into or out of Level III during the years ended December 31, 2020, 20192022, 2021 or 2018.2020.
Certain assets and liabilities are measured at fair value on a nonrecurring basis; that is, the instruments are not measured at fair value on an ongoing basis but are subject to fair value adjustments only in certain circumstances. As disclosed in Note 3, “Business Acquisitions,” we completed our acquisition of Beacon on February 28, 2020.Integra in 2022 and the acquisitions of myNEXUS and MMM
Elevance Health, Inc.
Notes to Consolidated Financial Statements (continued)
during 2021. The preliminary values of net assets acquired in our acquisitionacquisitions of BeaconIntegra, myNEXUS, and MMM and resulting goodwill and other intangible assets were recorded at fair
Anthem, Inc.
Notes to Consolidated Financial Statements (continued)
value primarily using Level III inputs. The majority of Beacon’s assets acquired and liabilities assumed were recorded at their carrying values as of the respective date of acquisition, as their carrying values approximated their fair values due to their short-term nature. The preliminary fair values of goodwill and other intangible assets acquired in our acquisitionacquisitions of BeaconIntegra, myNEXUS and MMM were internally estimated based on the income approach. The income approach estimates fair value based on the present value of the cash flows that the assets could be expected to generate in the future. We developed internal estimates for the expected cash flows and discount rate in the present value calculation. Other than the assets acquired and liabilities assumed in our acquisitionacquisitions of BeaconIntegra, myNEXUS and MMM described above, there were no material assets or liabilities measured at fair value on a nonrecurring basis during the years ended December 31, 20202022 or 2019.2021.
Our valuation policy is determined by members of our treasury and accounting departments. Whenever possible, our policy is to obtain quoted market prices in active markets to estimate fair values for recognition and disclosure purposes. Where quoted market prices in active markets are not available, fair values are estimated using discounted cash flow analyses, broker quotes, unobservable inputs or other valuation techniques. These techniques are significantly affected by our assumptions, including discount rates and estimates of future cash flows. The use of assumptions for unobservable inputs for the determination of fair value involves a level of judgment and uncertainty. Changes in assumptions that reasonably could have been different at the reporting date may result in a higher or lower determination of fair value. Changes in fair value measurements, if significant, may affect performance of cash flows.
Potential taxes and other transaction costs are not considered in estimating fair values. Our valuation policy is generally to obtain quoted prices for each security from third-party pricing services, which are derived through recently reported trades for identical or similar securities making adjustments through the reporting date based upon available market observable information. As we are responsible for the determination of fair value, we perform analysis on the prices received from the pricing services to determine whether the prices are reasonable estimates of fair value. This analysis is performed by our internal treasury personnel who are familiar with our investment portfolios, the pricing services engaged and the valuation techniques and inputs used. Our analysis includes procedures such as a review of month-to-month price fluctuations and price comparisons to secondary pricing services. There were no adjustments to quoted market prices obtained from the pricing services during the years ended December 31, 2020, 20192022, 2021 or 2018.2020.
In addition to the preceding disclosures on assets recorded at fair value in the consolidated balance sheets, FASB guidance also requires the disclosure of fair values for certain other financial instruments for which it is practicable to estimate fair value, whether or not such values are recognized in the consolidated balance sheets.
Non-financial instruments such as real estate, property and equipment, other current assets, deferred income taxes, intangible assets and certain financial instruments, such as policy liabilities, are excluded from the fair value disclosures. Therefore, the fair value amounts cannot be aggregated to determine our underlying economic value.
The carrying amounts reported in the consolidated balance sheets for cash, accrued investment income, premium receivables, self-funded receivables, other receivables, income taxes receivable, unearned income, accounts payable and accrued expenses, security trades pending payable, securities lending payable and certain other current liabilities approximate fair value because of the short-term nature of these items. These assets and liabilities are not listed in the table below.
The following methods and assumptions were used to estimate the fair value of each class of financial instrument that is recorded at its carrying value on the consolidated balance sheets:
Other invested assets: Other invested assetassets primarily include our investments in limited partnerships, joint ventures and other non-controlled corporations and mortgage loans, as well as the cash surrender value of corporate-owned life insurance policies. Investments in limited partnerships, joint ventures and other non-controlled corporations are carried at our share in the entities’ undistributed earnings, which approximates fair value. Mortgage loans are carried at amortized cost, which approximates fair value. The carrying value of corporate-owned life insurance policies represents the cash surrender value as reported by the respective insurer, which approximates fair value.
Short-term borrowings: The fair value of our short-term borrowings is based on quoted market prices for the same or similar debt, or if no quoted market prices were available, on the current market interest rates estimated to be available to us for debt of similar terms and remaining maturities.
Elevance Health, Inc.
Notes to Consolidated Financial Statements (continued)
Long-term debt—commercial paper: The carrying amount for commercial paper approximates fair value, as the underlying instruments have variable interest rates at market value.
Anthem, Inc.
Notes to Consolidated Financial Statements (continued)
Long-term debt—senior unsecured notes and surplus notes: The fair values of our notes are based on quoted market prices in active markets for the same or similar debt, or, if no quoted market prices are available, on the current market observable rates estimated to be available to us for debt of similar terms and remaining maturities.
Long-term debt—convertible debentures: The fair value of our convertible debentures is based on the quoted market price in the active private market in which the convertible debentures trade.
A summary of the estimated fair values by level of each class of financial instrument that is recorded at its carrying value on our consolidated balance sheets at December 31, 20202022 and 20192021 is as follows:
| | | | Carrying
Value | | Estimated Fair Value | | Carrying
Value | | Estimated Fair Value |
| | | Level I | | Level II | | Level III | | Total | | Level I | | Level II | | Level III | | Total |
| December 31, 2020 | | | | | | | | | | |
| December 31, 2022 | | December 31, 2022 | | | | | | | | | |
| Assets: | Assets: | | Assets: | |
| Other invested assets | Other invested assets | $ | 4,285 | | | $ | 0 | | | $ | 0 | | | $ | 4,285 | | | $ | 4,285 | | Other invested assets | $ | 5,582 | | | $ | — | | | $ | — | | | $ | 5,582 | | | $ | 5,582 | |
| Liabilities: | Liabilities: | | Liabilities: | |
| Debt: | Debt: | | Debt: | |
| Short-term borrowings | | Short-term borrowings | 265 | | | — | | | 265 | | | — | | | 265 | |
| | Commercial paper | 250 | | | 0 | | | 250 | | | 0 | | | 250 | | |
| Notes | Notes | 19,677 | | | 0 | | | 23,307 | | | 0 | | | 23,307 | | Notes | 23,786 | | | — | | | 21,861 | | | — | | | 21,861 | |
| Convertible debentures | Convertible debentures | 108 | | | 0 | | | 712 | | | 0 | | | 712 | | Convertible debentures | 63 | | | — | | | 463 | | | — | | | 463 | |
| | December 31, 2019 | | |
| December 31, 2021 | | December 31, 2021 | |
| Assets: | Assets: | | Assets: | |
| Other invested assets | Other invested assets | $ | 4,258 | | | $ | 0 | | | $ | 0 | | | $ | 4,258 | | | $ | 4,258 | | Other invested assets | $ | 5,087 | | | $ | — | | | $ | — | | | $ | 5,087 | | | $ | 5,087 | |
| Liabilities: | Liabilities: | | Liabilities: | |
| Debt: | Debt: | | Debt: | |
| Short-term borrowings | Short-term borrowings | 700 | | | 0 | | | 700 | | | 0 | | | 700 | | Short-term borrowings | 275 | | | — | | | 275 | | | — | | | 275 | |
| Commercial paper | Commercial paper | 400 | | | 0 | | | 400 | | | 0 | | | 400 | | Commercial paper | 300 | | | — | | | 300 | | | — | | | 300 | |
| Notes | Notes | 18,840 | | | 0 | | | 20,470 | | | 0 | | | 20,470 | | Notes | 22,384 | | | — | | | 25,150 | | | — | | | 25,150 | |
| Convertible debentures | Convertible debentures | 145 | | | 0 | | | 904 | | | 0 | | | 904 | | Convertible debentures | 72 | | | — | | | 687 | | | — | | | 687 | |
Anthem,Elevance Health, Inc.
Notes to Consolidated Financial Statements (continued)
8. Income Taxes
The components of deferred income taxes at December 31, 20202022 and 20192021 are as follows:
| | | 2020 | | 2019 | | 2022 | | 2021 |
| Deferred income tax assets: | Deferred income tax assets: | | | | Deferred income tax assets: | | | |
| | Accrued expenses | Accrued expenses | $ | 588 | | | $ | 331 | | Accrued expenses | $ | 379 | | | $ | 511 | |
| | Bad debt reserves | Bad debt reserves | 143 | | | 89 | | Bad debt reserves | 301 | | | 246 | |
| Insurance reserves | Insurance reserves | 187 | | | 139 | | Insurance reserves | 147 | | | 156 | |
| | Lease liabilities | Lease liabilities | 204 | | | 180 | | Lease liabilities | 200 | | | 216 | |
| Retirement liabilities | Retirement liabilities | 205 | | | 216 | | Retirement liabilities | 173 | | | 170 | |
| Deferred compensation | Deferred compensation | 31 | | | 28 | | Deferred compensation | 34 | | | 35 | |
| Federal and state operating loss carryforwards | Federal and state operating loss carryforwards | 274 | | | 124 | | Federal and state operating loss carryforwards | 208 | | | 201 | |
| Investment basis | | Investment basis | 340 | | | — | |
| Other | Other | 113 | | | 71 | | Other | 267 | | | 207 | |
| Subtotal | Subtotal | 1,745 | | | 1,178 | | Subtotal | 2,049 | | | 1,742 | |
| Less: valuation allowance | Less: valuation allowance | (84) | | | (45) | | Less: valuation allowance | (203) | | | (212) | |
| Total deferred income tax assets | Total deferred income tax assets | 1,661 | | | 1,133 | | Total deferred income tax assets | 1,846 | | | 1,530 | |
| Deferred income tax liabilities: | | |
| Federal and state intangible assets | 2,073 | | | 1,999 | | |
| | U.S. federal and state intangible assets | | U.S. federal and state intangible assets | 2,059 | | | 2,071 | |
| Foreign (including Puerto Rico) intangible assets | | Foreign (including Puerto Rico) intangible assets | 380 | | | 452 | |
| Capitalized software | Capitalized software | 670 | | | 554 | | Capitalized software | 601 | | | 777 | |
| Depreciation and amortization | Depreciation and amortization | 37 | | | 62 | | Depreciation and amortization | 62 | | | 45 | |
| Investment basis | Investment basis | 407 | | | 230 | | Investment basis | — | | | 295 | |
| | Retirement assets | Retirement assets | 260 | | | 249 | | Retirement assets | 317 | | | 314 | |
| | Lease right-of-use asset | Lease right-of-use asset | 131 | | | 164 | | Lease right-of-use asset | 123 | | | 126 | |
| Prepaid expenses | Prepaid expenses | 102 | | | 102 | | Prepaid expenses | 201 | | | 152 | |
| | Total deferred income tax liabilities | Total deferred income tax liabilities | 3,680 | | | 3,360 | | Total deferred income tax liabilities | 3,743 | | | 4,232 | |
| Net deferred income tax liabilities | Net deferred income tax liabilities | $ | 2,019 | | | $ | 2,227 | | Net deferred income tax liabilities | $ | 1,897 | | | $ | 2,702 | |
InWe recognized $137 and $103 of deferred tax asset under the table above, certain amounts for the year endedcaption “Other noncurrent assets” at December 31, 2019 have been reclassified from a net to gross presentation to more fully reflect2022 and 2021, respectively. We recognized $2,034 and $2,805 of deferred tax liability under the federalcaption “Deferred tax liabilities, net” at December 31, 2022 and state tax effects by type of temporary difference. This reclassification does not impact amounts presented in the financial statements.2021.
As of December 31, 2020, the Company’s2022, we have established U.S. deferred taxes for undistributed earnings from certain non-U.S. subsidiaries, which are intended to be indefinitely reinvestedincluded in non-U.S. operations, and therefore no U.S. deferred taxes have been recorded.the Investment basis component above, consistent with prior years.
Significant components of the provision for income taxes for the years ended December 31, 2020, 20192022, 2021 and 20182020 consist of the following:
| | | 2020 | | 2019 | | 2018 | | 2022 | | 2021 | | 2020 |
| Current tax expense: | Current tax expense: | | | | | | Current tax expense: | | | | | |
| Federal | Federal | $ | 1,731 | | | $ | 1,019 | | | $ | 1,128 | | Federal | $ | 1,469 | | | $ | 1,467 | | | $ | 1,724 | |
| Foreign (including Puerto Rico) | | Foreign (including Puerto Rico) | 98 | | | 18 | | | 7 | |
| State and local | State and local | 461 | | | 84 | | | 78 | | State and local | 179 | | | 165 | | | 461 | |
| Total current tax expense | Total current tax expense | 2,192 | | | 1,103 | | | 1,206 | | Total current tax expense | 1,746 | | | 1,650 | | | 2,192 | |
| Deferred tax (benefit) expense | (526) | | | 75 | | | 112 | | |
| Deferred tax expense (benefit) | | Deferred tax expense (benefit) | 4 | | | 180 | | | (526) | |
| Total income tax expense | Total income tax expense | $ | 1,666 | | | $ | 1,178 | | | $ | 1,318 | | Total income tax expense | $ | 1,750 | | | $ | 1,830 | | | $ | 1,666 | |
Anthem,Elevance Health, Inc.
Notes to Consolidated Financial Statements (continued)
State and local current tax expense is reported gross of federal benefit in the preceding table, and includes amounts related to audit settlements, uncertain tax positions, state tax credits and true up of prior years’ tax. Such items are included on a net of federal tax basis in multiple lines in the following rate reconciliation table on a net of federal tax basis.table.
A reconciliation of income tax expense recorded in the consolidated statements of income and amounts computed at the statutory federal income tax rate for the years ended December 31, 2020, 20192022, 2021 and 20182020 is as follows:
| | | | 2020 | | 2019 | | 2018 | | 2022 | | 2021 | | 2020 |
| | | Amount | | Percent | | Amount | | Percent | | Amount | | Percent | | Amount | | Percent | | Amount | | Percent | | Amount | | Percent |
| Amount at statutory rate | Amount at statutory rate | $ | 1,310 | | | 21.0 | % | | $ | 1,257 | | | 21.0 | % | | $ | 1,064 | | | 21.0 | % | Amount at statutory rate | $ | 1,631 | | | 21.0 | % | | $ | 1,664 | | | 21.0 | % | | $ | 1,310 | | | 21.0 | % |
| State and local income taxes net of federal tax expense/benefit | State and local income taxes net of federal tax expense/benefit | 235 | | | 3.8 | | | 138 | | | 2.3 | | | 63 | | | 1.2 | | State and local income taxes net of federal tax expense/benefit | 238 | | | 3.0 | | | 258 | | | 3.3 | | | 235 | | | 3.8 | |
| Tax exempt interest and dividends received deduction | Tax exempt interest and dividends received deduction | (22) | | | (0.4) | | | (24) | | | (0.4) | | | (27) | | | (0.5) | | Tax exempt interest and dividends received deduction | (19) | | | (0.2) | | | (22) | | | (0.3) | | | (22) | | | (0.4) | |
| HIP fee | HIP fee | 330 | | | 5.3 | | | 0 | | | 0 | | | 324 | | | 6.4 | | HIP fee | — | | | — | | | — | | | — | | | 330 | | | 5.3 | |
| Basis adjustments from recent acquisitions | Basis adjustments from recent acquisitions | (110) | | | (1.8) | | | 0 | | | 0 | | | (28) | | | (0.6) | | Basis adjustments from recent acquisitions | — | | | — | | | — | | | — | | | (110) | | | (1.8) | |
| Tax Cuts and Jobs Act | 0 | | | 0 | | | 0 | | | 0 | | | (28) | | | (0.6) | | |
| Other, net | Other, net | (77) | | | (1.2) | | | (193) | | | (3.2) | | | (50) | | | (0.9) | | Other, net | (100) | | | (1.3) | | | (70) | | | (0.9) | | | (77) | | | (1.2) | |
| Total income tax expense | Total income tax expense | $ | 1,666 | | | 26.7 | % | | $ | 1,178 | | | 19.7 | % | | $ | 1,318 | | | 26.0 | % | Total income tax expense | $ | 1,750 | | | 22.5 | % | | $ | 1,830 | | | 23.1 | % | | $ | 1,666 | | | 26.7 | % |
During the year ended December 31, 2022, we recognized income tax expense of $1,750, or $7.21 per diluted share. The decrease in effective income tax rate is primarily due to the impact of geographic changes in the mix of 2022 earnings.
During the year ended December 31, 2021, we recognized income tax expense of $1,830, or $7.41 per diluted share. The HIP Fee payment was eliminated beginning in 2021.
During the year ended December 31, 2020, we recognized income tax expense of $1,666, or $6.55 per diluted share, which included income tax expense of $330, or $1.30 per diluted share, as a result of the non-tax deductibility of the HIP Fee payment, which was reinstated for 2020.
During the year ended December 31, 2019, we recognized income tax expense of $1,178, or $4.53 per diluted share. The HIP Fee payment was suspended for 2019.
During the year ended December 31, 2018, we recognized income tax expense of $324, or $1.23 per diluted share, as a result of the non-tax deductibility of the HIP Fee payment.
On December 22, 2017, the federal government enacted the Tax Cuts and Jobs Act, which contains significant changes to corporate taxation, including, but not limited to, reducing the U.S. federal corporate income tax rate from 35% to 21% and modifying or limiting many business deductions. At December 31, 2018, we completed our accounting for the tax effects of enactment of the Tax Cuts and Jobs Act and there was no material change to our 2017 provisional amount. In addition we reclassified, for our interim and annual reporting periods beginning on January 1, 2018, $91 of stranded tax effects from accumulated other comprehensive loss to retained earnings on our consolidated balance sheets.
The change in the carrying amount of gross unrecognized tax benefits from uncertain tax positions for the years ended December 31, 20202022 and 20192021 is as follows:
| | | 2020 | | 2019 | | 2022 | | 2021 |
| Balance at January 1 | Balance at January 1 | $ | 146 | | | $ | 241 | | Balance at January 1 | $ | 271 | | | $ | 249 | |
| Additions based on: | Additions based on: | | Additions based on: | |
| Tax positions related to current year | Tax positions related to current year | 76 | | | 1 | | Tax positions related to current year | 22 | | | 10 | |
| Tax positions related to prior years | Tax positions related to prior years | 40 | | | 0 | | Tax positions related to prior years | 57 | | | 17 | |
| Reductions based on: | Reductions based on: | | Reductions based on: | |
| | Tax positions related to prior years | Tax positions related to prior years | (13) | | | (63) | | Tax positions related to prior years | (1) | | | (5) | |
| Settlements with taxing authorities | 0 | | | (33) | | |
| | Balance at December 31 | Balance at December 31 | $ | 249 | | | $ | 146 | | Balance at December 31 | $ | 349 | | | $ | 271 | |
The table above excludes interest, net of related tax benefits, which is treated as income tax expense (benefit) under our accounting policy. The interest is included in the amounts described in the following paragraph.
Anthem, Inc.
Notes to Consolidated Financial Statements (continued)
The amount of unrecognized tax benefits that would impact our effective tax rate in future periods, if recognized, was $227$328 and $140$250 at December 31, 20202022 and 2019,2021, respectively. Also included in the table above, at December 31, 2020,2022, is $2 that would be recognized as an adjustment to additional paid-in capital, which would not affect our effective tax rate. In addition to the contingent liabilities included in the table above, during 2017 we filed protective state income tax refund claims of approximately $310.$92 and $310 for 2022 and 2017, respectively. There were no equivalent protective state income tax refund claims filed in 2021, 2020, 2019 or 2018.
For the year ended December 31, 2020, we recognized a net interest expense of $7.
Elevance Health, Inc.
Notes to Consolidated Financial Statements (continued)
For the years ended December 31, 20192022, 2021 and 2018,2020 we recognized a net interest (benefit) expense of $(11)$13, $9 and $15,$7, respectively. We had accrued approximately $33$55 and $26$42 for the payment of interest at December 31, 20202022 and 2019,2021, respectively.
As of December 31, 2020,2022, as further described below, certain tax years remain open to examination by the Internal Revenue Service (“IRS”) and various state, local and localforeign authorities. As a result of these examinations and discussions with taxing agencies, we have recorded amounts for uncertain tax positions. It is anticipated that the amount of unrecognized tax benefits will change in the next twelve months due to possible settlements of audits and changes in temporary items. However, the ultimate resolution of these items is dependent on the completion of negotiations with various taxing authorities. While it is difficult to determine when other tax settlements will actually occur, it is reasonably possible that one could occur in the next twelve months and our unrecognized tax benefits could changebe reduced within a range of approximately ($15)$33 to ($147).$143.
We are a member of the IRS Compliance Assurance Process (“CAP”). The objective of CAP is to reduce taxpayer burden and uncertainty while assuring the IRS of the accuracy of tax returns prior to filing, thereby reducing or eliminating the need for post-filing examinations.
As of December 31, 2020,2022, the IRS examination of our 20202022 and 20192021 tax years continues to be in process.
In certain states, we pay premium taxes in lieu of state income taxes. Premium taxes are reported in selling, general and administrative expense.
At December 31, 2020,2022, we had federal net operating loss carryforwards of $40$160 that will expire beginning 20332032 through 20372042 and $7$109 that have an indefinite carryforward period; stateperiod. State net operating loss carryforwards expire beginning 20222023 through 2040,2042, with some having an indefinite carryforward period.
Income taxes receivable totaled $440 and $173 at December 31, 2022 and 2021, respectively. We recognize the income tax receivable as an asset under the caption “Other current assets” in our consolidated balance sheets.
During 2020, 20192022, 2021 and 2018,2020, federal income taxes paid totaled $1,790, $1,403$1,594, $1,299 and $738,$1,790, respectively.
9. Property and Equipment
A summary of property and equipment at December 31, 20202022 and 20192021 is as follows:
| | | 2020 | | 2019 | | 2022 | | 2021 |
| Computer software, purchased and internally developed | Computer software, purchased and internally developed | $ | 5,247 | | | $ | 4,314 | | Computer software, purchased and internally developed | $ | 5,604 | | | $ | 6,115 | |
| Computer equipment, furniture and other equipment | Computer equipment, furniture and other equipment | 1,218 | | | 1,264 | | Computer equipment, furniture and other equipment | 828 | | | 1,314 | |
| Leasehold improvements | Leasehold improvements | 671 | | | 715 | | Leasehold improvements | 648 | | | 641 | |
| Building and improvements | Building and improvements | 174 | | | 169 | | Building and improvements | 38 | | | 172 | |
| Land and improvements | Land and improvements | 17 | | | 17 | | Land and improvements | 1 | | | 17 | |
| Property and equipment, gross | Property and equipment, gross | 7,327 | | | 6,479 | | Property and equipment, gross | 7,119 | | | 8,259 | |
| Accumulated depreciation and amortization | Accumulated depreciation and amortization | (3,844) | | | (3,346) | | Accumulated depreciation and amortization | (2,803) | | | (4,340) | |
| Property and equipment, net | Property and equipment, net | $ | 3,483 | | | $ | 3,133 | | Property and equipment, net | $ | 4,316 | | | $ | 3,919 | |
Depreciation expense for 2022, 2021 and 2020 2019was $123, $136 and 2018 was $176, $147 and $124, respectively. Amortization expense on computer software and leasehold improvements for 2022, 2021 and 2020 2019was $661, $532 and 2018 was $462, $528 and $528, respectively, which includes amortization expense on computer software, both purchased and internally developed, for 2022, 2021 and 2020 2019of $599, $485 and 2018 of $412, $450 and $465, respectively. Capitalized costs related to the internal development of software of $4,783$5,354 and $3,939$5,626 at December 31, 20202022 and 2019,2021, respectively, are reported with computer software.
Impairment of property and equipment for the years ended December 31, 2022, 2021 and 2020 was $7, $73, and $198, respectively, which is included in selling, general and administrative expenses and primarily related to our activities disclosed in Note 4, “Business Optimization Initiatives.”
Anthem,Elevance Health, Inc.
Notes to Consolidated Financial Statements (continued)
Our activities as disclosed in Note 4, “Business Optimization Initiatives”, include impairment of property and equipment. We recorded an impairment charge of $198 for property and equipment in 2020 which is in selling, general and administrative expenses.
10. Goodwill and Other Intangible Assets
A summary of the change in the carrying amount of goodwill for our segments (see Note 20, “Segment Information”) for 20202022 and 20192021 is as follows:
| | | | | | | | | | | | | | | | | | | | | | | | | | | | | |
| Commercial
and Specialty
Business | | Government
Business | | IngenioRx | | Other | | Total |
| Balance as of January 1, 2019 | $ | 11,551 | | | $ | 8,953 | | | $ | 0 | | | $ | 0 | | | $ | 20,504 | |
| | | | | | | | | |
| Adjustments | 0 | | | (674) | | | 0 | | | 670 | | | (4) | |
| Balance as of December 31, 2019 | 11,551 | | | 8,279 | | | 0 | | | 670 | | | 20,500 | |
| Acquisitions and adjustments | 42 | | | 52 | | | 48 | | | 1,049 | | | 1,191 | |
| Balance as of December 31, 2020 | $ | 11,593 | | | $ | 8,331 | | | $ | 48 | | | $ | 1,719 | | | $ | 21,691 | |
| Accumulated impairment as of December 31, 2020 | $ | (41) | | | $ | 0 | | | $ | 0 | | | $ | 0 | | | $ | (41) | |
Goodwill adjustments in 2019 include certain reclassifications made for changes in segment reporting. For additional information, see Note 20, “Segment Information”. | | | | | | | | | | | | | | | | | | | | | | | | | | | | | |
| Commercial
& Specialty
Business | | Government
Business | | CarelonRx | | Other | | Total |
| Balance as of January 1, 2021 | $ | 11,593 | | | $ | 8,331 | | | $ | 48 | | | $ | 1,719 | | | $ | 21,691 | |
| | | | | | | | | |
| Acquisitions and adjustments | — | | | 2,018 | | | 11 | | | 508 | | | 2,537 | |
| Balance as of December 31, 2021 | 11,593 | | | 10,349 | | | 59 | | | 2,227 | | | 24,228 | |
| Acquisitions and adjustments | 18 | | | 128 | | | — | | | 9 | | | 155 | |
| Balance as of December 31, 2022 | $ | 11,611 | | | $ | 10,477 | | | $ | 59 | | | $ | 2,236 | | | $ | 24,383 | |
| Accumulated impairment as of December 31, 2022 | $ | — | | | $ | — | | | $ | — | | | $ | — | | | $ | — | |
As required by FASB guidance, we completed annual impairment tests of existing goodwill and other intangible assets with indefinite lives during 2020, 20192022, 2021 and 2018.2020. We perform these annual impairment tests during the fourth quarter. FASB guidance also requires interim impairment testing to be performed when potential impairment indicators exist. These tests involve the use of estimates related to the fair value of goodwill and intangible assets with indefinite lives and require a significant degree of management judgment and the use of subjective assumptions. Qualitative testing procedures include assessing our financial performance, macroeconomic conditions, industry and market considerations, various asset specific factors and entity specific events. For quantitative testing, the fair values are estimated using the projected income and market valuation approaches, incorporating Level III internal estimates for inputs, including, but not limited to, revenue projections, income projections, cash flows and discount rates. We did not incur any impairment losses in 2020, 20192022, 2021 or 2018,2020, as the estimated fair values of our reporting units were substantially in excess of their carrying values.
The components of other intangible assets as of December 31, 20202022 and 20192021 are as follows:
| | | | 2020 | | 2019 | | 2022 | | 2021 |
Gross
Carrying
Amount | | Accumulated
Amortization | | Net
Carrying
Amount | | Gross
Carrying
Amount | | Accumulated
Amortization | | Net
Carrying
Amount | Gross
Carrying
Amount | | Accumulated
Amortization | | Net
Carrying
Amount | | Gross
Carrying
Amount | | Accumulated
Amortization | | Net
Carrying
Amount |
| Intangible assets with finite lives: | Intangible assets with finite lives: | | | | | | | | | | | | Intangible assets with finite lives: | | | | | | | | | | | |
| Customer relationships | Customer relationships | $ | 5,180 | | | $ | (3,766) | | | $ | 1,414 | | | $ | 4,500 | | | $ | (3,469) | | | $ | 1,031 | | Customer relationships | $ | 5,791 | | | $ | (3,693) | | | $ | 2,098 | | | $ | 5,598 | | | $ | (3,236) | | | $ | 2,362 | |
| Provider and hospital relationships | Provider and hospital relationships | 323 | | | (114) | | | 209 | | | 228 | | | (98) | | | 130 | | Provider and hospital relationships | 326 | | | (146) | | | 180 | | | 324 | | | (129) | | | 195 | |
| Other | Other | 444 | | | (177) | | | 267 | | | 352 | | | (129) | | | 223 | | Other | 1,010 | | | (440) | | | 570 | | | 610 | | | (141) | | | 469 | |
| Total | Total | 5,947 | | | (4,057) | | | 1,890 | | | 5,080 | | | (3,696) | | | 1,384 | | Total | 7,127 | | | (4,279) | | | 2,848 | | | 6,532 | | | (3,506) | | | 3,026 | |
| Intangible assets with indefinite lives: | Intangible assets with indefinite lives: | | Intangible assets with indefinite lives: | |
| Blue Cross and Blue Shield and other trademarks | Blue Cross and Blue Shield and other trademarks | 6,299 | | | — | | | 6,299 | | | 6,299 | | | — | | | 6,299 | | Blue Cross and Blue Shield and other trademarks | 5,991 | | | — | | | 5,991 | | | 6,299 | | | — | | | 6,299 | |
| State Medicaid licenses | State Medicaid licenses | 1,216 | | | — | | | 1,216 | | | 991 | | | — | | | 991 | | State Medicaid licenses | 1,476 | | | — | | | 1,476 | | | 1,290 | | | — | | | 1,290 | |
| Total | Total | 7,515 | | | — | | | 7,515 | | | 7,290 | | | — | | | 7,290 | | Total | 7,467 | | | — | | | 7,467 | | | 7,589 | | | — | | | 7,589 | |
| Other intangible assets | Other intangible assets | $ | 13,462 | | | $ | (4,057) | | | $ | 9,405 | | | $ | 12,370 | | | $ | (3,696) | | | $ | 8,674 | | Other intangible assets | $ | 14,594 | | | $ | (4,279) | | | $ | 10,315 | | | $ | 14,121 | | | $ | (3,506) | | | $ | 10,615 | |
Anthem, Inc.
Notes to Consolidated Financial Statements (continued)
Intangible assets, along with the related accumulated amortization, are removed from the table above at the end of the fiscal year in which they become fully amortized.As of December 31, 2020,2022, the estimated amortization expense for each of the five succeeding years is as follows: 2021, $324; 2022, $271; 2023, $233;$806; 2024, $196;$370; 2025, $311; 2026, $258; and 2025, $159.2027, $221.
Elevance Health, Inc.
Notes to Consolidated Financial Statements (continued)
11. Retirement Benefits
We sponsor various non-contributory employee defined benefit plans through certain subsidiaries.
The AnthemElevance Health Cash Balance Plan A and(formerly the Anthem Cash Balance Plan A) and the Elevance Health Cash Balance Plan B (formerly the Anthem Cash Balance Plan B) are cash balance pension plans covering certain eligible employees of the affiliated companies that participate in these plans. Effective January 1, 2006, benefits were curtailed, with the result that most participants stopped accruing benefits but continue to earn interest on benefits accrued prior to the curtailment. Certain participants subject to collective bargaining and certain other participants who met grandfathering rules continued to accrue benefits. Participants who did not receive credits and/or benefit accruals were included in the AnthemElevance Health Cash Balance Plan A, while employees who were still receiving credits and/or benefits participated in the AnthemElevance Health Cash Balance Plan B. Effective January 1, 2019, benefits under the AnthemElevance Health Cash Balance Plan B were curtailed. All grandfathered participants no longer have pay credits added to their accounts but continue to earn interest on existing account balances. Participants continue to earn years of pension service for vesting purposes. Several pension plans acquired through various corporate mergers and acquisitions were merged into these plans in prior years.
The Employees’ Retirement Plan of Blue Cross of California (the “BCC Plan”) is a defined benefit pension plan that covers eligible employees of Blue Cross of California who are covered by a collective bargaining agreement. Effective January 1, 2007, benefits were curtailed under the BCC Plan with the result that no Blue Cross of California employees hired or rehired after December 31, 2006 are eligible to participate in the BCC Plan.
All of the plans’ assets consist primarily of equity securities, fixed maturity securities, investment funds and cash. The funding policies for all plans are to contribute amounts at least sufficient to meet the minimum funding requirements set forth in the Employee Retirement Income Security Act of 1974, as amended (“ERISA”), as further amended by the Pension Protection Act of 2006, and in accordance with income tax regulations, plus such additional amounts as are necessary to provide assets sufficient to meet the benefits to be paid to plan participants.
The following tables disclose consolidated “pension benefits,” which include the defined benefit pension plans described above, and consolidated “other benefits,” which include postretirement health and welfare benefits including medical, vision and dental benefits offered to certain employees. Calculations were computed using assumptions at the December 31 measurement dates.
The reconciliation of the benefit obligation is as follows:
| | | | Pension Benefits | | Other Benefits | | Pension Benefits | | Other Benefits |
| | | 2020 | | 2019 | | 2020 | | 2019 | | 2022 | | 2021 | | 2022 | | 2021 |
| Benefit obligation at beginning of year | Benefit obligation at beginning of year | $ | 1,880 | | | $ | 1,743 | | | $ | 423 | | | $ | 431 | | Benefit obligation at beginning of year | $ | 1,859 | | | $ | 2,009 | | | $ | 343 | | | $ | 399 | |
| Service cost | Service cost | 0 | | | 0 | | | 1 | | | 1 | | Service cost | — | | | — | | | — | | | 1 | |
| Interest cost | Interest cost | 47 | | | 62 | | | 10 | | | 15 | | Interest cost | 52 | | | 34 | | | 7 | | | 5 | |
| Plan participant contributions | Plan participant contributions | 0 | | | 0 | | | 18 | | | 17 | | Plan participant contributions | — | | | — | | | 17 | | | 17 | |
| Actuarial loss (gain) | 219 | | | 200 | | | (15) | | | 5 | | |
| Actuarial (gain) loss | | Actuarial (gain) loss | (362) | | | (33) | | | (54) | | | (31) | |
| Settlements | Settlements | (80) | | | (35) | | | 0 | | | 0 | | Settlements | (74) | | | (90) | | | — | | | — | |
| Benefits paid | Benefits paid | (57) | | | (90) | | | (38) | | | (46) | | Benefits paid | (60) | | | (61) | | | (36) | | | (48) | |
| Benefit obligation at end of year | Benefit obligation at end of year | $ | 2,009 | | | $ | 1,880 | | | $ | 399 | | | $ | 423 | | Benefit obligation at end of year | $ | 1,415 | | | $ | 1,859 | | | $ | 277 | | | $ | 343 | |
Anthem,Elevance Health, Inc.
Notes to Consolidated Financial Statements (continued)
The changes in the fair value of plan assets are as follows:
| | | | Pension Benefits | | Other Benefits | | Pension Benefits | | Other Benefits |
| | | 2020 | | 2019 | | 2020 | | 2019 | | 2022 | | 2021 | | 2022 | | 2021 |
| Fair value of plan assets at beginning of year | Fair value of plan assets at beginning of year | $ | 2,026 | | | $ | 1,818 | | | $ | 367 | | | $ | 336 | | Fair value of plan assets at beginning of year | $ | 2,216 | | | $ | 2,186 | | | $ | 371 | | | $ | 391 | |
| Actual return on plan assets | Actual return on plan assets | 290 | | | 329 | | | 33 | | | 55 | | Actual return on plan assets | (352) | | | 174 | | | (61) | | | 33 | |
| Employer contributions | Employer contributions | 7 | | | 4 | | | 11 | | | 5 | | Employer contributions | 4 | | | 7 | | | — | | | — | |
| Plan participant contributions | Plan participant contributions | 0 | | | 0 | | | 18 | | | 17 | | Plan participant contributions | — | | | — | | | 17 | | | 17 | |
| Settlements | Settlements | (80) | | | (35) | | | 0 | | | 0 | | Settlements | (74) | | | (90) | | | — | | | (29) | |
| Benefits paid | Benefits paid | (57) | | | (90) | | | (38) | | | (46) | | Benefits paid | (60) | | | (61) | | | (28) | | | (41) | |
| Fair value of plan assets at end of year | Fair value of plan assets at end of year | $ | 2,186 | | | $ | 2,026 | | | $ | 391 | | | $ | 367 | | Fair value of plan assets at end of year | $ | 1,734 | | | $ | 2,216 | | | $ | 299 | | | $ | 371 | |
The net amount included in the consolidated balance sheets is as follows:
| | | | Pension Benefits | | Other Benefits | | Pension Benefits | | Other Benefits |
| | | 2020 | | 2019 | | 2020 | | 2019 | | 2022 | | 2021 | | 2022 | | 2021 |
| Noncurrent assets | Noncurrent assets | $ | 248 | | | $ | 212 | | | $ | 0 | | | $ | 0 | | Noncurrent assets | $ | 363 | | | $ | 415 | | | $ | 22 | | | $ | 28 | |
| Current liabilities | Current liabilities | (6) | | | (6) | | | 0 | | | 0 | | Current liabilities | (6) | | | (6) | | | — | | | — | |
| Noncurrent liabilities | Noncurrent liabilities | (65) | | | (60) | | | (8) | | | (56) | | Noncurrent liabilities | (38) | | | (52) | | | — | | | — | |
| Net amount at December 31 | Net amount at December 31 | $ | 177 | | | $ | 146 | | | $ | (8) | | | $ | (56) | | Net amount at December 31 | $ | 319 | | | $ | 357 | | | $ | 22 | | | $ | 28 | |
The net amounts included in accumulated other comprehensive income (loss) that have not been recognized as components of net periodic benefit costs are as follows:
| | | | | | | | | | | | | | | | | | | | | | | |
| | Pension Benefits | | Other Benefits |
| | 2020 | | 2019 | | 2020 | | 2019 |
| Net actuarial loss | $ | 749 | | | $ | 734 | | | $ | 3 | | | $ | 25 | |
| Prior service cost (credit) | 0 | | | 1 | | | (12) | | | (19) | |
| Net amount before tax at December 31 | $ | 749 | | | $ | 735 | | | $ | (9) | | | $ | 6 | |
| | | | | | | | | | | | | | | | | | | | | | | |
| | Pension Benefits | | Other Benefits |
| | 2022 | | 2021 | | 2022 | | 2021 |
| Net actuarial (loss) gain | $ | (672) | | | $ | (625) | | | $ | 5 | | | $ | 36 | |
| Prior service credit | — | | | — | | | 3 | | | 8 | |
| Net amount before tax at December 31 | $ | (672) | | | $ | (625) | | | $ | 8 | | | $ | 44 | |
The accumulated benefit obligation for the defined benefit pension plans was $2,007$1,413 and $1,878$1,857 at December 31, 20202022 and 2019,2021, respectively.
As of December 31, 2020,2022, certain pension plans had accumulated benefit obligations in excess of plan assets. Such plans had accumulated benefit obligation and fair value of plan assets of $111$44 and $42,$0, respectively. For those sameIn addition, certain plans thehad projected benefit obligation was alsoobligations in excess of plan assets. Such plans had projected benefit obligation and fair value of plan assets of $113$44 and $42,$0, respectively.
The weighted-average assumptions used in calculating the benefit obligations for all plans are as follows:
| | | | Pension Benefits | | Other Benefits | | Pension Benefits | | Other Benefits |
| | | 2020 | | 2019 | | 2020 | | 2019 | | 2022 | | 2021 | | 2022 | | 2021 |
| Discount rate | Discount rate | 2.24 | % | | 3.11 | % | | 1.99 | % | | 2.93 | % | Discount rate | 5.18 | % | | 2.70 | % | | 5.12 | % | | 2.49 | % |
| Rate of compensation increase | Rate of compensation increase | 3.00 | % | | 3.00 | % | | 3.00 | % | | 3.00 | % | Rate of compensation increase | 3.00 | % | | 3.00 | % | | 3.00 | % | | 3.00 | % |
| Expected rate of return on plan assets | Expected rate of return on plan assets | 6.72 | % | | 7.33 | % | | 6.60 | % | | 7.00 | % | Expected rate of return on plan assets | 6.58 | % | | 5.02 | % | | 6.57 | % | | 6.43 | % |
| Interest crediting rate | Interest crediting rate | 3.82 | % | | 3.82 | % | | 0.87 | % | | 1.81 | % | Interest crediting rate | 4.25 | % | | 3.82 | % | | 3.89 | % | | 1.56 | % |
Anthem,Elevance Health, Inc.
Notes to Consolidated Financial Statements (continued)
The components of net periodic benefit credit included in the consolidated statements of income are as follows:
| | | 2020 | | 2019 | | 2018 | | 2022 | | 2021 | | 2020 |
| Pension Benefits | Pension Benefits | | | | | | Pension Benefits | | | | | |
| Service cost | $ | 0 | | | $ | 0 | | | $ | 8 | | |
| Interest cost | Interest cost | 47 | | | 62 | | | 55 | | Interest cost | $ | 52 | | | $ | 34 | | | $ | 47 | |
| Expected return on assets | Expected return on assets | (138) | | | (138) | | | (147) | | Expected return on assets | (101) | | | (134) | | | (138) | |
| Recognized actuarial loss | Recognized actuarial loss | 24 | | | 17 | | | 22 | | Recognized actuarial loss | 16 | | | 25 | | | 24 | |
| | Settlement loss | Settlement loss | 29 | | | 9 | | | 5 | | Settlement loss | 28 | | | 26 | | | 29 | |
| Net periodic benefit credit | Net periodic benefit credit | $ | (38) | | | $ | (50) | | | $ | (57) | | Net periodic benefit credit | $ | (5) | | | $ | (49) | | | $ | (38) | |
| | Other Benefits | Other Benefits | | Other Benefits | |
| Service cost | Service cost | $ | 1 | | | $ | 1 | | | $ | 1 | | Service cost | $ | — | | | $ | 1 | | | $ | 1 | |
| Interest cost | Interest cost | 10 | | | 15 | | | 15 | | Interest cost | 7 | | | 5 | | | 10 | |
| Expected return on assets | Expected return on assets | (25) | | | (22) | | | (24) | | Expected return on assets | (26) | | | (26) | | | (25) | |
| Recognized actuarial loss | 0 | | | 2 | | | 3 | | |
| Amortization of prior service credit | Amortization of prior service credit | (7) | | | (12) | | | (12) | | Amortization of prior service credit | (4) | | | (4) | | | (7) | |
| Net periodic benefit credit | Net periodic benefit credit | $ | (21) | | | $ | (16) | | | $ | (17) | | Net periodic benefit credit | $ | (23) | | | $ | (24) | | | $ | (21) | |
During the years ended December 31, 2020, 20192022, 2021 and 2018,2020, we incurred total settlement losses of $29, $9$28, $26 and $5,$29, respectively, as lump-sum payments exceeded the service cost and interest cost components of net periodic benefit cost for certain of our plans.
The weighted-average assumptions used in calculating the net periodic benefit cost for all plans are as follows:
| | | 2020 | | 2019 | | 2018 | | 2022 | | 2021 | | 2020 |
| Pension Benefits | Pension Benefits | | | | | | Pension Benefits | | | | | |
| Discount rate | Discount rate | 3.11 | % | | 4.15 | % | | 3.44 | % | Discount rate | 2.70 | % | | 2.24 | % | | 3.11 | % |
| Rate of compensation increase | Rate of compensation increase | 3.00 | % | | 3.00 | % | | 3.00 | % | Rate of compensation increase | 3.00 | % | | 3.00 | % | | 3.00 | % |
| Expected rate of return on plan assets | Expected rate of return on plan assets | 7.33 | % | | 7.44 | % | | 7.83 | % | Expected rate of return on plan assets | 5.02 | % | | 6.72 | % | | 7.33 | % |
| Interest crediting rate | Interest crediting rate | 3.82 | % | | 3.83 | % | | 3.82 | % | Interest crediting rate | 3.82 | % | | 3.82 | % | | 3.82 | % |
| | Other Benefits | Other Benefits | | Other Benefits | |
| Discount rate | Discount rate | 2.93 | % | | 4.04 | % | | 3.42 | % | Discount rate | 2.49 | % | | 1.99 | % | | 2.93 | % |
| Rate of compensation increase | Rate of compensation increase | 3.00 | % | | 3.00 | % | | 3.00 | % | Rate of compensation increase | 3.00 | % | | 3.00 | % | | 3.00 | % |
| Expected rate of return on plan assets | Expected rate of return on plan assets | 7.00 | % | | 7.00 | % | | 7.00 | % | Expected rate of return on plan assets | 6.43 | % | | 6.60 | % | | 7.00 | % |
| Interest crediting rate | Interest crediting rate | 1.81 | % | | 3.12 | % | | 2.35 | % | Interest crediting rate | 1.56 | % | | 0.87 | % | | 1.81 | % |
The assumed healthcare cost trend rates used to measure the expected cost of pre-Medicare (those who are not currently eligible for Medicare benefits) other benefits at our December 31, 20202022 measurement date was 7.00%8.00% for 20212023, with a gradual decline to 4.50% by the year 2033.2035. The assumed healthcare cost trend rates used to measure the expected cost of post-Medicare (those who are currently eligible for Medicare benefits) other benefits at our December 31, 20202022 measurement date was 5.50%6.50% for 20212023, with a gradual decline to 4.50% by the year 2033.2035. These estimated trend rates are subject to change in the future.
Plan assets include a diversified mix of equity securities, investment grade fixed maturity securities and other types of investments across a range of sectors and levels of capitalization to maximize long-term return for a prudent level of risk. The weighted-average target allocation for pension benefit plan assets is 44%37% equity securities, 48%58% fixed maturity securities, and 8%5% to all other types of investments. Equity securities primarily include a mix of domestic securities, foreign securities and
Anthem, Inc.
Notes to Consolidated Financial Statements (continued)
mutual funds invested in equities. Fixed maturity securities primarily include treasury securities, corporate bonds and asset-backed investments issued by corporations and the U.S. government. Other types of investments primarily include insurance contracts
Elevance Health, Inc.
Notes to Consolidated Financial Statements (continued)
designed specifically for employee benefit plans, and a commingled fund comprised primarily of equity securities. As of December 31, 2020, there were no significant concentrations of investments in the pension benefit assets or other benefit assets. No plan assets were invested in Anthem common stock.securities and certain partnership interests.
The partnerships hold various types of underlying assets such as real estate and investments in oil and gas companies. Generally, the partnership interests are not redeemable and are transferable only with the consent of the general partner. Unfunded commitments related to all partnership interests totaled approximately $3$2 and $29$3 at December 31, 20202022 and 2019,2021, respectively.
As of December 31, 2022, there were no significant concentrations of investments in the pension benefit assets or other benefit assets. No plan assets were invested in Elevance Health common stock.
Pension benefit assets and other benefit assets recorded at fair value are categorized based upon the level of judgment associated with the inputs used to measure their fair value.
Anthem,Elevance Health, Inc.
Notes to Consolidated Financial Statements (continued)
The fair values of our pension benefit assets and other benefit assets by asset category and level inputs at December 31, 2020,2022, excluding cash, investment income receivable and amounts due to/from brokers, resulting in a net asset of $64,$36, and excluding estimated claims settlements to be paid from other benefit assets of ($17), are as follows (see Note 7, “Fair Value,” for additional information regarding the definition of level inputs):
| | | Level I | | Level II | | Level III | | Total | | Level I | | Level II | | Level III | | Total |
| December 31, 2020 | | | | | | | | |
| December 31, 2022 | | December 31, 2022 | | | | | | | |
| Pension Benefit Assets: | Pension Benefit Assets: | | Pension Benefit Assets: | |
| Equity securities: | Equity securities: | | Equity securities: | |
| U.S. securities | U.S. securities | $ | 710 | | | $ | 0 | | | $ | 0 | | | $ | 710 | | U.S. securities | $ | 489 | | | $ | — | | | $ | — | | | $ | 489 | |
| Foreign securities | Foreign securities | 238 | | | 0 | | | 0 | | | 238 | | Foreign securities | 145 | | | — | | | — | | | 145 | |
| Mutual funds | Mutual funds | 42 | | | 0 | | | 0 | | | 42 | | Mutual funds | 39 | | | — | | | — | | | 39 | |
| Fixed maturity securities: | Fixed maturity securities: | | Fixed maturity securities: | |
| Government securities | Government securities | 0 | | | 237 | | | 0 | | | 237 | | Government securities | — | | | 247 | | | — | | | 247 | |
| Corporate securities | Corporate securities | 0 | | | 394 | | | 0 | | | 394 | | Corporate securities | — | | | 275 | | | — | | | 275 | |
| Asset-backed securities | Asset-backed securities | 0 | | | 137 | | | 0 | | | 137 | | Asset-backed securities | — | | | 185 | | | — | | | 185 | |
| Other types of investments: | Other types of investments: | | Other types of investments: | |
| | Commingled fund | Commingled fund | 0 | | | 112 | | | 0 | | | 112 | | Commingled fund | — | | | 93 | | | — | | | 93 | |
| Insurance company contracts | Insurance company contracts | 0 | | | 0 | | | 189 | | | 189 | | Insurance company contracts | — | | | — | | | 154 | | | 154 | |
| | Total pension benefit assets at fair value | Total pension benefit assets at fair value | $ | 990 | | | $ | 880 | | | $ | 189 | | | 2,059 | | Total pension benefit assets at fair value | $ | 673 | | | $ | 800 | | | $ | 154 | | | 1,627 | |
| Partnership investments | Partnership investments | | | | | | | 74 | | Partnership investments | | | | | | | 71 | |
| Total pension benefit assets | Total pension benefit assets | | $ | 2,133 | | Total pension benefit assets | | $ | 1,698 | |
| | Other Benefit Assets: | Other Benefit Assets: | | Other Benefit Assets: | |
| Equity securities: | Equity securities: | | Equity securities: | |
| U.S. securities | U.S. securities | $ | 9 | | | $ | 0 | | | $ | 0 | | | $ | 9 | | U.S. securities | $ | 7 | | | $ | — | | | $ | — | | | $ | 7 | |
| Foreign securities | Foreign securities | 3 | | | 0 | | | 0 | | | 3 | | Foreign securities | 1 | | | — | | | — | | | 1 | |
| Mutual funds | Mutual funds | 23 | | | 0 | | | 0 | | | 23 | | Mutual funds | 17 | | | — | | | — | | | 17 | |
| Fixed maturity securities: | Fixed maturity securities: | | Fixed maturity securities: | |
| Government securities | Government securities | 0 | | | 2 | | | 0 | | | 2 | | Government securities | — | | | 3 | | | — | | | 3 | |
| Corporate securities | Corporate securities | 0 | | | 4 | | | 0 | | | 4 | | Corporate securities | — | | | 3 | | | — | | | 3 | |
| Asset-backed securities | Asset-backed securities | 0 | | | 3 | | | 0 | | | 3 | | Asset-backed securities | — | | | 3 | | | — | | | 3 | |
| Other types of investments: | Other types of investments: | | Other types of investments: | |
| | Commingled fund | Commingled fund | 0 | | | 2 | | | 0 | | | 2 | | Commingled fund | — | | | 2 | | | — | | | 2 | |
| Life insurance contracts | Life insurance contracts | 0 | | | 0 | | | 323 | | | 323 | | Life insurance contracts | — | | | — | | | 270 | | | 270 | |
| Investment in DOL 103-12 trust | Investment in DOL 103-12 trust | 0 | | | 11 | | | 0 | | | 11 | | Investment in DOL 103-12 trust | — | | | 10 | | | — | | | 10 | |
| Total other benefit assets | Total other benefit assets | $ | 35 | | | $ | 22 | | | $ | 323 | | | $ | 380 | | Total other benefit assets | $ | 25 | | | $ | 21 | | | $ | 270 | | | $ | 316 | |
Anthem,Elevance Health, Inc.
Notes to Consolidated Financial Statements (continued)
The fair values of our pension benefit assets and other benefit assets by asset category and level inputs at December 31, 2019,2021, excluding cash, investment income receivable and amounts due to/from brokers, resulting in a net asset of $64,$48, and excluding estimated claims settlements to be paid from other benefit assets of ($29), are as follows:
| | | | | | | | | | | | | | | | | | | | | | | |
| Level I | | Level II | | Level III | | Total |
| December 31, 2019 | | | | | | | |
| Pension Benefit Assets: | | | | | | | |
| Equity securities: | | | | | | | |
| U.S. securities | $ | 626 | | | $ | 0 | | | $ | 0 | | | $ | 626 | |
| Foreign securities | 197 | | | 0 | | | 0 | | | 197 | |
| Mutual funds | 38 | | | 0 | | | 0 | | | 38 | |
| Fixed maturity securities: | | | | | | | |
| Government securities | 0 | | | 252 | | | 0 | | | 252 | |
| Corporate securities | 0 | | | 339 | | | 0 | | | 339 | |
| Asset-backed securities | 0 | | | 163 | | | 0 | | | 163 | |
| Other types of investments: | | | | | | | |
| | | | | | | |
| | | | | | | |
| Insurance company contracts | 0 | | | 0 | | | 175 | | | 175 | |
| Commingled fund | 0 | | | 136 | | | 0 | | | 136 | |
| Total pension benefit assets at fair value | $ | 861 | | | $ | 890 | | | $ | 175 | | | 1,926 | |
| Partnership investments | | | | | | | 52 | |
| Total pension benefit assets | | | | | | | $ | 1,978 | |
| | | | | | | |
| Other Benefit Assets: | | | | | | | |
| Equity securities: | | | | | | | |
| U.S. securities | $ | 8 | | | $ | 0 | | | $ | 0 | | | $ | 8 | |
| Foreign securities | 2 | | | 0 | | | 0 | | | 2 | |
| Mutual funds | 25 | | | 0 | | | 0 | | | 25 | |
| Fixed maturity securities: | | | | | | | |
| Government securities | 0 | | | 2 | | | 0 | | | 2 | |
| Corporate securities | 0 | | | 4 | | | 0 | | | 4 | |
| Asset-backed securities | 0 | | | 3 | | | 0 | | | 3 | |
| Other types of investments: | | | | | | | |
| | | | | | | |
| | | | | | | |
| Life insurance contracts | 0 | | | 0 | | | 294 | | | 294 | |
| Investment in DOL 103-12 trust | 0 | | | 12 | | | 0 | | | 12 | |
| Commingled fund | 0 | | | 1 | | | 0 | | | 1 | |
| Total other benefit assets at fair value | $ | 35 | | | $ | 22 | | | $ | 294 | | | $ | 351 | |
| | | | | | | | | | | | | | | | | | | | | | | |
| Level I | | Level II | | Level III | | Total |
| December 31, 2021 | | | | | | | |
| Pension Benefit Assets: | | | | | | | |
| Equity securities: | | | | | | | |
| U.S. securities | $ | 682 | | | $ | — | | | $ | — | | | $ | 682 | |
| Foreign securities | 204 | | | — | | | — | | | 204 | |
| Mutual funds | 49 | | | — | | | — | | | 49 | |
| Fixed maturity securities: | | | | | | | |
| Government securities | — | | | 395 | | | — | | | 395 | |
| Corporate securities | — | | | 379 | | | — | | | 379 | |
| Asset-backed securities | — | | | 98 | | | — | | | 98 | |
| Other types of investments: | | | | | | | |
| | | | | | | |
| Commingled fund | — | | | 106 | | | — | | | 106 | |
| Insurance company contracts | — | | | — | | | 179 | | | 179 | |
| | | | | | | |
| Total pension benefit assets at fair value | $ | 935 | | | $ | 978 | | | $ | 179 | | | 2,092 | |
| Partnership investments | | | | | | | 78 | |
| Total pension benefit assets | | | | | | | $ | 2,170 | |
| | | | | | | |
| Other Benefit Assets: | | | | | | | |
| Equity securities: | | | | | | | |
| U.S. securities | $ | 10 | | | $ | — | | | $ | — | | | $ | 10 | |
| Foreign securities | 2 | | | — | | | — | | | 2 | |
| Mutual funds | 24 | | | — | | | — | | | 24 | |
| Fixed maturity securities: | | | | | | | |
| Government securities | — | | | 4 | | | — | | | 4 | |
| Corporate securities | — | | | 4 | | | — | | | 4 | |
| Asset-backed securities | — | | | 3 | | | — | | | 3 | |
| Other types of investments: | | | | | | | |
| Commingled fund | — | | | 2 | | | — | | | 2 | |
| Life insurance contracts | — | | | — | | | 338 | | | 338 | |
| Investment in DOL 103-12 trust | — | | | 11 | | | — | | | 11 | |
| Total other benefit assets | $ | 36 | | | $ | 24 | | | $ | 338 | | | $ | 398 | |
Anthem,Elevance Health, Inc.
Notes to Consolidated Financial Statements (continued)
A reconciliation of the beginning and ending balances of plan assets measured at fair value using Level III inputs for the years ended December 31, 2020, 20192022, 2021 and 20182020 is as follows:
| | | | | | | | | | | | | | | | | | | | | |
| | | | | Insurance
Company
Contracts | | Life
Insurance
Contracts | | Total |
| Year ended December 31, 2020 | | | | | | | | | |
| Beginning balance at January 1, 2020 | | | | | $ | 175 | | | $ | 294 | | | $ | 469 | |
| Actual return on plan assets relating to assets still held at the reporting date | | | | | 7 | | | 29 | | | 36 | |
| Purchases | | | | | 15 | | | 0 | | | 15 | |
| Sales | | | | | (8) | | | 0 | | | (8) | |
| | | | | | | | | |
| Ending balance at December 31, 2020 | | | | | $ | 189 | | | $ | 323 | | | $ | 512 | |
| | | | | | | | | |
| Year ended December 31, 2019 | | | | | | | | | |
| Beginning balance at January 1, 2019 | | | | | $ | 166 | | | $ | 249 | | | $ | 415 | |
| Actual return on plan assets relating to assets still held at the reporting date | | | | | 12 | | | 45 | | | 57 | |
| Purchases | | | | | 6 | | | 0 | | | 6 | |
| Sales | | | | | (9) | | | 0 | | | (9) | |
| | | | | | | | | |
| Ending balance at December 31, 2019 | | | | | $ | 175 | | | $ | 294 | | | $ | 469 | |
| | | | | | | | | |
| Year ended December 31, 2018 | | | | | | | | | |
| Beginning balance at January 1, 2018 | | | | | $ | 173 | | | $ | 269 | | | $ | 442 | |
| Actual return on plan assets relating to assets still held at the reporting date | | | | | (7) | | | (15) | | | (22) | |
| Purchases | | | | | 8 | | | 0 | | | 8 | |
| Sales | | | | | (8) | | | (5) | | | (13) | |
| Ending balance at December 31, 2018 | | | | | $ | 166 | | | $ | 249 | | | $ | 415 | |
| | | | | | | | | | | | | | | | | | | | | |
| | | | | Insurance
Company
Contracts | | Life
Insurance
Contracts | | Total |
| Year ended December 31, 2022 | | | | | | | | | |
| Beginning balance at January 1, 2022 | | | | | $ | 179 | | | $ | 338 | | | $ | 517 | |
| Actual return on plan assets relating to assets still held at the reporting date | | | | | (22) | | | (53) | | | (75) | |
| Purchases | | | | | 9 | | | — | | | 9 | |
| Sales | | | | | (12) | | | (15) | | | (27) | |
| | | | | | | | | |
| Ending balance at December 31, 2022 | | | | | $ | 154 | | | $ | 270 | | | $ | 424 | |
| | | | | | | | | |
| Year ended December 31, 2021 | | | | | | | | | |
| Beginning balance at January 1, 2021 | | | | | $ | 189 | | | $ | 323 | | | $ | 512 | |
| Actual return on plan assets relating to assets still held at the reporting date | | | | | (6) | | | 26 | | | 20 | |
| Purchases | | | | | 5 | | | — | | | 5 | |
| Sales | | | | | (9) | | | (11) | | | (20) | |
| | | | | | | | | |
| Ending balance at December 31, 2021 | | | | | $ | 179 | | | $ | 338 | | | $ | 517 | |
| | | | | | | | | |
| Year ended December 31, 2020 | | | | | | | | | |
| Beginning balance at January 1, 2020 | | | | | $ | 175 | | | $ | 294 | | | $ | 469 | |
| Actual return on plan assets relating to assets still held at the reporting date | | | | | 7 | | | 29 | | | 36 | |
| Purchases | | | | | 15 | | | — | | | 15 | |
| Sales | | | | | (8) | | | — | | | (8) | |
| Ending balance at December 31, 2020 | | | | | $ | 189 | | | $ | 323 | | | $ | 512 | |
There were no other transfers into or out of Level III during the years ended December 31, 2020, 20192022, 2021 or 2018.2020.
Our current funding strategy is to fund an amount at least equal to the minimum required funding as determined under ERISA with consideration of maximum tax deductible amounts. We may elect to make discretionary contributions up to the maximum amount deductible for income tax purposes. For the years ended December 31, 2020, 20192022, 2021 and 2018,2020, no material contributions were necessary to meet ERISA required funding levels. However, during each of the years ended December 31, 2020, 20192022, 2021 and 2018,2020, we made tax deductible discretionary contributions to the pension benefit plans of $4, $7, $4, and $4.$7, respectively. Employer contributions to other benefit plans represent discretionary contributions and do not include payments to retirees for current benefits.
Our estimated future payments for pension benefits and postretirementother benefits, which reflect expected future service, as appropriate, are as follows:
| | | Pension
Benefits | | Other
Benefits | | Pension
Benefits | | Other
Benefits |
| 2021 | $ | 131 | | | $ | 35 | | |
| 2022 | 128 | | | 34 | | |
| 2023 | 2023 | 126 | | | 32 | | 2023 | $ | 125 | | | $ | 32 | |
| 2024 | 2024 | 121 | | | 31 | | 2024 | 120 | | | 30 | |
| 2025 | 2025 | 119 | | | 30 | | 2025 | 118 | | | 29 | |
| 2026 - 2030 | 552 | | | 125 | | |
| 2026 | | 2026 | 116 | | | 28 | |
| 2027 | | 2027 | 113 | | | 27 | |
| 2028 - 2032 | | 2028 - 2032 | 526 | | | 110 | |
Anthem,Elevance Health, Inc.
Notes to Consolidated Financial Statements (continued)
In addition to the defined benefit plans, we maintain the Elevance Health 401(k) Plan (formerly the Anthem 401(k) Plan,Plan), which is a qualified defined contribution plan covering substantially all employees. Voluntary employee contributions are matched by us subject to certain limitations. Contributions made by us totaled $275, $241 and $221 $201during 2022, 2021 and $211 during 2020, 2019 and 2018, respectively. Contributions in 2018 include approximately $58 for a one time contribution made to employees following the enactment of the Tax Cuts and Jobs Act.
12. Medical Claims Payable
A reconciliation of the beginning and ending balances for medical claims payable, by segment (see Note 20, “Segment Information”), for the year ended December 31, 20202022 is as follows:
| | | Commercial
& Specialty
Business | | Government
Business | | Other | | Total | | Commercial
& Specialty
Business | | Government
Business | | Other | | Total |
| Gross medical claims payable, beginning of year | Gross medical claims payable, beginning of year | $ | 3,039 | | | $ | 5,608 | | | $ | 0 | | | $ | 8,647 | | Gross medical claims payable, beginning of year | $ | 3,847 | | | $ | 9,157 | | | $ | 278 | | | $ | 13,282 | |
| Ceded medical claims payable, beginning of year | Ceded medical claims payable, beginning of year | (14) | | | (19) | | | 0 | | | (33) | | Ceded medical claims payable, beginning of year | (13) | | | (8) | | | — | | | (21) | |
| Net medical claims payable, beginning of year | Net medical claims payable, beginning of year | 3,025 | | | 5,589 | | | 0 | | | 8,614 | | Net medical claims payable, beginning of year | 3,834 | | | 9,149 | | | 278 | | | 13,261 | |
| Business combinations and purchase adjustments | Business combinations and purchase adjustments | 0 | | | 141 | | | 198 | | | 339 | | Business combinations and purchase adjustments | 3 | | | 130 | | | — | | | 133 | |
| Net incurred medical claims: | Net incurred medical claims: | | Net incurred medical claims: | |
| Current year | Current year | 24,894 | | | 58,912 | | | 1,288 | | | 85,094 | | Current year | 30,067 | | | 81,795 | | | 1,552 | | | 113,414 | |
| Prior years redundancies | Prior years redundancies | (375) | | | (262) | | | 0 | | | (637) | | Prior years redundancies | (154) | | | (630) | | | (85) | | | (869) | |
| Total net incurred medical claims | Total net incurred medical claims | 24,519 | | | 58,650 | | | 1,288 | | | 84,457 | | Total net incurred medical claims | 29,913 | | | 81,165 | | | 1,467 | | | 112,545 | |
| Net payments attributable to: | Net payments attributable to: | | | | | | | | Net payments attributable to: | | | | | | | |
| Current year medical claims | Current year medical claims | 21,736 | | | 51,602 | | | 1,291 | | | 74,629 | | Current year medical claims | 26,274 | | | 71,463 | | | 1,260 | | | 98,997 | |
| Prior years medical claims | Prior years medical claims | 2,527 | | | 5,165 | | | 0 | | | 7,692 | | Prior years medical claims | 3,362 | | | 8,052 | | | 186 | | | 11,600 | |
| Total net payments | Total net payments | 24,263 | | | 56,767 | | | 1,291 | | | 82,321 | | Total net payments | 29,636 | | | 79,515 | | | 1,446 | | | 110,597 | |
| Net medical claims payable, end of year | Net medical claims payable, end of year | 3,281 | | | 7,613 | | | 195 | | | 11,089 | | Net medical claims payable, end of year | 4,114 | | | 10,929 | | | 299 | | | 15,342 | |
| Ceded medical claims payable, end of year | Ceded medical claims payable, end of year | 13 | | | 33 | | | 0 | | | 46 | | Ceded medical claims payable, end of year | 5 | | | 1 | | | — | | | 6 | |
| Gross medical claims payable, end of year | Gross medical claims payable, end of year | $ | 3,294 | | | $ | 7,646 | | | $ | 195 | | | $ | 11,135 | | Gross medical claims payable, end of year | $ | 4,119 | | | $ | 10,930 | | | $ | 299 | | | $ | 15,348 | |
Activity in our Other segment resulted from our acquisition of Beacon.
Anthem,Elevance Health, Inc.
Notes to Consolidated Financial Statements (continued)
A reconciliation of the beginning and ending balances for medical claims payable, by segment, for the year ended December 31, 20192021 is as follows:
| | | Commercial
& Specialty
Business | | Government
Business | | | Total | | Commercial
& Specialty
Business | | Government
Business | | Other | | Total |
| Gross medical claims payable, beginning of year | Gross medical claims payable, beginning of year | $ | 2,586 | | | $ | 4,680 | | | | $ | 7,266 | | Gross medical claims payable, beginning of year | $ | 3,294 | | | $ | 7,646 | | | $ | 195 | | | $ | 11,135 | |
| Ceded medical claims payable, beginning of year | Ceded medical claims payable, beginning of year | (10) | | | (24) | | | | (34) | | Ceded medical claims payable, beginning of year | (13) | | | (33) | | | — | | | (46) | |
| Net medical claims payable, beginning of year | Net medical claims payable, beginning of year | 2,576 | | | 4,656 | | | | 7,232 | | Net medical claims payable, beginning of year | 3,281 | | | 7,613 | | | 195 | | | 11,089 | |
| | Business combinations and purchase adjustments | | Business combinations and purchase adjustments | — | | | 375 | | | 45 | | | 420 | |
| Net incurred medical claims: | Net incurred medical claims: | | | | Net incurred medical claims: | |
| Current year | Current year | 25,942 | | | 52,753 | | | | 78,695 | | Current year | 28,132 | | | 70,670 | | | 1,638 | | | 100,440 | |
| Prior years redundancies | Prior years redundancies | (190) | | | (310) | | | | (500) | | Prior years redundancies | (465) | | | (1,222) | | | (16) | | | (1,703) | |
| Total net incurred medical claims | Total net incurred medical claims | 25,752 | | | 52,443 | | | | 78,195 | | Total net incurred medical claims | 27,667 | | | 69,448 | | | 1,622 | | | 98,737 | |
| Net payments attributable to: | Net payments attributable to: | | | | | | | Net payments attributable to: | | | | | | | |
| Current year medical claims | Current year medical claims | 23,026 | | | 47,268 | | | | 70,294 | | Current year medical claims | 24,502 | | | 62,233 | | | 1,421 | | | 88,156 | |
| Prior years medical claims | Prior years medical claims | 2,277 | | | 4,242 | | | | 6,519 | | Prior years medical claims | 2,612 | | | 6,054 | | | 163 | | | 8,829 | |
| Total net payments | Total net payments | 25,303 | | | 51,510 | | | | 76,813 | | Total net payments | 27,114 | | | 68,287 | | | 1,584 | | | 96,985 | |
| Net medical claims payable, end of year | Net medical claims payable, end of year | 3,025 | | | 5,589 | | | | 8,614 | | Net medical claims payable, end of year | 3,834 | | | 9,149 | | | 278 | | | 13,261 | |
| Ceded medical claims payable, end of year | Ceded medical claims payable, end of year | 14 | | | 19 | | | | 33 | | Ceded medical claims payable, end of year | 13 | | | 8 | | | — | | | 21 | |
| Gross medical claims payable, end of year | Gross medical claims payable, end of year | $ | 3,039 | | | $ | 5,608 | | | | $ | 8,647 | | Gross medical claims payable, end of year | $ | 3,847 | | | $ | 9,157 | | | $ | 278 | | | $ | 13,282 | |
A reconciliation of the beginning and ending balances for medical claims payable, by segment, for the year ended December 31, 20182020 is as follows:
| | | Commercial
& Specialty
Business | | Government
Business | | | Total | | Commercial
& Specialty
Business | | Government
Business | | Other | | Total |
| Gross medical claims payable, beginning of year | Gross medical claims payable, beginning of year | $ | 3,383 | | | $ | 4,431 | | | | $ | 7,814 | | Gross medical claims payable, beginning of year | $ | 3,039 | | | $ | 5,608 | | | $ | — | | | $ | 8,647 | |
| Ceded medical claims payable, beginning of year | Ceded medical claims payable, beginning of year | (78) | | | (27) | | | | (105) | | Ceded medical claims payable, beginning of year | (14) | | | (19) | | | — | | | (33) | |
| Net medical claims payable, beginning of year | Net medical claims payable, beginning of year | 3,305 | | | 4,404 | | | | 7,709 | | Net medical claims payable, beginning of year | 3,025 | | | 5,589 | | | — | | | 8,614 | |
| Business combinations and purchase adjustments | Business combinations and purchase adjustments | — | | | 199 | | | | 199 | | Business combinations and purchase adjustments | — | | | 141 | | | 198 | | | 339 | |
| Net incurred medical claims: | Net incurred medical claims: | | | | Net incurred medical claims: | |
| Current year | Current year | 24,094 | | | 45,487 | | | | 69,581 | | Current year | 24,894 | | | 58,912 | | | 1,288 | | | 85,094 | |
| Prior years redundancies | Prior years redundancies | (456) | | | (474) | | | | (930) | | Prior years redundancies | (375) | | | (262) | | | — | | | (637) | |
| Total net incurred medical claims | Total net incurred medical claims | 23,638 | | | 45,013 | | | | 68,651 | | Total net incurred medical claims | 24,519 | | | 58,650 | | | 1,288 | | | 84,457 | |
| Net payments attributable to: | Net payments attributable to: | | | | | | | Net payments attributable to: | | | | | | | |
| Current year medical claims | Current year medical claims | 21,633 | | | 41,115 | | | | 62,748 | | Current year medical claims | 21,736 | | | 51,602 | | | 1,291 | | | 74,629 | |
| Prior years medical claims | Prior years medical claims | 2,734 | | | 3,845 | | | | 6,579 | | Prior years medical claims | 2,527 | | | 5,165 | | | — | | | 7,692 | |
| Total net payments | Total net payments | 24,367 | | | 44,960 | | | | 69,327 | | Total net payments | 24,263 | | | 56,767 | | | 1,291 | | | 82,321 | |
| Net medical claims payable, end of year | Net medical claims payable, end of year | 2,576 | | | 4,656 | | | | 7,232 | | Net medical claims payable, end of year | 3,281 | | | 7,613 | | | 195 | | | 11,089 | |
| Ceded medical claims payable, end of year | Ceded medical claims payable, end of year | 10 | | | 24 | | | | 34 | | Ceded medical claims payable, end of year | 13 | | | 33 | | | — | | | 46 | |
| Gross medical claims payable, end of year | Gross medical claims payable, end of year | $ | 2,586 | | | $ | 4,680 | | | | $ | 7,266 | | Gross medical claims payable, end of year | $ | 3,294 | | | $ | 7,646 | | | $ | 195 | | | $ | 11,135 | |
Amounts incurred related to prior years vary from previously estimated liabilities as the claims are ultimately settled. Liabilities at any period-end are continually reviewed and re-estimated as information regarding actual claims payments, or runout, becomes known. This information is compared to the originally established year end liability. Negative amounts reported for incurred medical claims related to prior years result from claims being settled for amounts less than originally
Elevance Health, Inc.
Notes to Consolidated Financial Statements (continued)
estimated. The prior year redundancy of $637$869 shown above for the year ended December 31, 20202022 represents an estimate
Anthem, Inc.
Notes to Consolidated Financial Statements (continued)
based on paid claim activity from January 1, 20202022 to December 31, 2020.2022. Medical claim liabilities are usually described as having a “short tail,” which means that they are generally paid within twelve months of the member receiving service from the provider. Accordingly, the majority of the $637$869 redundancy relates to claims incurred in calendar year 2019.2021.
The following table provides a summary of the two key assumptions having the most significant impact on our incurred but not paid liability estimates for the years ended December 31, 2020, 20192022, 2021 and 2018,2020, which are the completion and trend factors. These two key assumptions can be influenced by utilization levels, unit costs, mix of business, benefit plan designs, provider reimbursement levels, processing system conversions and changes, claim inventory levels, claim processing patterns, claim submission patterns and operational changes resulting from business combinations. The impact from COVID-19 on healthcare utilization and medical claims submission patterns hasWe had increased estimation uncertainty on our incurred but not reported liability at December 31, 2020.2022 and December 31, 2021. Slowdowns in claims submission patterns and increases in utilization levels for COVID-19 testing and treatment during the fourth quarter of 2020 are the primary factors that lead to the increased estimation uncertainty.
| | | | Favorable Developments
by Changes in Key Assumptions | | Favorable Developments
by Changes in Key Assumptions |
| | | 2020 | | 2019 | | 2018 | | 2022 | | 2021 | | 2020 |
| Assumed trend factors | Assumed trend factors | $ | (599) | | | $ | (325) | | | $ | (515) | | Assumed trend factors | $ | (859) | | | $ | (1,429) | | | $ | (599) | |
| Assumed completion factors | Assumed completion factors | (38) | | | (175) | | | (415) | | Assumed completion factors | (10) | | | (274) | | | (38) | |
| Total | Total | $ | (637) | | | $ | (500) | | | $ | (930) | | Total | $ | (869) | | | $ | (1,703) | | | $ | (637) | |
The favorable development recognized in 2022 resulted primarily from trend factors in late 2021 developing more favorably than originally expected as well as a smaller contribution from completion factor development.
The favorable development recognized in 2021 resulted primarily from trend factors in late 2020 developing more favorably than originally expected as well as a smaller but significant contribution from completion factor development.
The favorable development recognized in 2020 resulted primarily from trend factors in late 2019 developing more favorably than originally expected as well as a smaller contribution from completion factor development.
The favorable development recognized in 2019 resulted primarily from trend in late 2018 developing more favorably than originally expected as well as a smaller but significant contribution from completion factor development.
The favorable development recognized in 2018 resulted from trend and completion factors developing more favorably than originally expected.
The reconciliation of net incurred medical claims to benefit expense included in the consolidated statements of income is as follows:
| | | Years Ended December 31 | | Years Ended December 31 |
| | 2020 | | 2019 | | 2018 | | 2022 | | 2021 | | 2020 |
| Net incurred medical claims: | Net incurred medical claims: | | | | | | | Net incurred medical claims: | | | | | | |
| Commercial & Specialty Business | Commercial & Specialty Business | | $ | 24,519 | | | $ | 25,752 | | | $ | 23,638 | | Commercial & Specialty Business | | $ | 29,913 | | | $ | 27,667 | | | $ | 24,519 | |
| Government Business | Government Business | | 58,650 | | | 52,443 | | | 45,013 | | Government Business | | 81,165 | | | 69,448 | | | 58,650 | |
| Other | Other | | 1,288 | | | 0 | | | 0 | | Other | | 1,467 | | | 1,622 | | | 1,288 | |
| Total net incurred medical claims | Total net incurred medical claims | | 84,457 | | | 78,195 | | | 68,651 | | Total net incurred medical claims | | 112,545 | | | 98,737 | | | 84,457 | |
| Quality improvement and other claims expense | Quality improvement and other claims expense | | 3,588 | | | 3,591 | | | 3,244 | | Quality improvement and other claims expense | | 3,942 | | | 3,908 | | | 3,588 | |
| Benefit expense | Benefit expense | | $ | 88,045 | | | $ | 81,786 | | | $ | 71,895 | | Benefit expense | | $ | 116,487 | | | $ | 102,645 | | | $ | 88,045 | |
Anthem,Elevance Health, Inc.
Notes to Consolidated Financial Statements (continued)
Incurred claims development, net of reinsurance, for the Commercial & Specialty Business for the years ended December 31, 2020, 20192022, 2021 and 20182020 is as follows:
| | Commercial & Specialty Business | Commercial & Specialty Business | | Cumulative Incurred Claims and Allocated Claim Adjustment Expenses, Net of Reinsurance | Commercial & Specialty Business | | Cumulative Incurred Claims and Allocated Claim Adjustment Expenses, Net of Reinsurance |
| | | 2018 | | 2019 | | | | 2020 | | 2021 | |
| Claim Years | Claim Years | | (Unaudited) | | (Unaudited) | | 2020 | Claim Years | | (Unaudited) | | (Unaudited) | | 2022 |
| 2018 & Prior | | $ | 26,943 | | | $ | 26,753 | | | $ | 26,747 | | |
| 2019 | | 25,942 | | | 25,572 | | |
| 2020 | | 24,894 | | |
| 2020 & Prior | | 2020 & Prior | | $ | 27,545 | | | $ | 27,080 | | | $ | 27,101 | |
| 2021 | | 2021 | | 28,132 | | | 27,957 | |
| 2022 | | 2022 | | 30,070 | |
| Total | Total | | $ | 77,213 | | Total | | $ | 85,128 | |
Paid claims development, net of reinsurance, for the Commercial & Specialty Business for the years ended December 31, 2020, 20192022, 2021 and 20182020 is as follows:
| | Commercial & Specialty Business | Commercial & Specialty Business | | Cumulative Paid Claims and Allocated Claim Adjustment Expenses, Net of Reinsurance | Commercial & Specialty Business | | Cumulative Paid Claims and Allocated Claim Adjustment Expenses, Net of Reinsurance |
| | | 2018 | | 2019 | | | | 2020 | | 2021 | |
| Claim Years | Claim Years | | (Unaudited) | | (Unaudited) | | 2020 | Claim Years | | (Unaudited) | | (Unaudited) | | 2022 |
| 2018 & Prior | | $ | 24,367 | | | $ | 26,643 | | | $ | 26,721 | | |
| 2019 | | 23,026 | | | 25,475 | | |
| 2020 | | 21,736 | | |
| 2020 & Prior | | 2020 & Prior | | $ | 24,263 | | | $ | 26,876 | | | $ | 27,049 | |
| 2021 | | 2021 | | 24,502 | | | 27,691 | |
| 2022 | | 2022 | | 26,274 | |
| Total | Total | | $ | 73,932 | | Total | | $ | 81,014 | |
At December 31, 2020,2022, the total of incurred but not reported liabilities plus expected development on reported claims for the Commercial & Specialty Business was $26, $97$52, $266 and $3,158$3,796 for the claim years 20182020 and prior, 20192021 and 2020,2022, respectively.
At December 31, 2020,2022, the cumulative number of reported claims for the Commercial & Specialty Business was 93,80, 87 and 7481 for the claim years 20182020 and prior, 20192021 and 2020,2022, respectively.
Incurred claims development, net of reinsurance, for the Government Business as of and for the years ended December 31, 2020, 20192022, 2021 and 20182020 is as follows:
| | Government Business | Government Business | | Cumulative Incurred Claims and Allocated Claim Adjustment Expenses, Net of Reinsurance | Government Business | | Cumulative Incurred Claims and Allocated Claim Adjustment Expenses, Net of Reinsurance |
| | | 2018 | | 2019 | | | | 2020 | | 2021 | |
| Claim Years | Claim Years | | (Unaudited) | | (Unaudited) | | 2020 | Claim Years | | (Unaudited) | | (Unaudited) | | 2022 |
| 2018 & Prior | | $ | 49,616 | | | $ | 49,306 | | | $ | 49,278 | | |
| 2019 | | 52,753 | | | 52,518 | | |
| 2020 | | 59,053 | | |
| 2020 & Prior | | 2020 & Prior | | $ | 64,379 | | | $ | 63,158 | | | $ | 63,123 | |
| 2021 | | 2021 | | 71,045 | | | 70,450 | |
| 2022 | | 2022 | | 81,925 | |
| Total | Total | | $ | 160,849 | | Total | | $ | 215,498 | |
Anthem,Elevance Health, Inc.
Notes to Consolidated Financial Statements (continued)
Paid claims development, net of reinsurance, for the Government Business as of and for the years ended December 31, 2020, 20192022, 2021 and 20182020 is as follows:
| | Government Business | Government Business | | Cumulative Paid Claims and Allocated Claim Adjustment Expenses, Net of Reinsurance | Government Business | | Cumulative Paid Claims and Allocated Claim Adjustment Expenses, Net of Reinsurance |
| | | 2018 | | 2019 | | | | 2020 | | 2021 | |
| Claim Years | Claim Years | | (Unaudited) | | (Unaudited) | | 2020 | Claim Years | | (Unaudited) | | (Unaudited) | | 2022 |
| 2018 & Prior | | $ | 44,959 | | | $ | 49,201 | | | $ | 49,231 | | |
| 2019 | | 47,269 | | | 52,403 | | |
| 2020 | | 51,602 | | |
| 2020 & Prior | | 2020 & Prior | | $ | 56,767 | | | $ | 62,821 | | | $ | 62,981 | |
| 2021 | | 2021 | | 62,233 | | | 70,125 | |
| 2022 | | 2022 | | 71,463 | |
| Total | Total | | $ | 153,236 | | Total | | $ | 204,569 | |
At December 31, 2020,2022, the total of incurred but not reported liabilities plus expected development on reported claims for the Government Business was $47, $115$142, $325 and $7,451$10,462 for the claim years 20182020 and prior, 20192021 and 2020,2022, respectively.
At December 31, 2020,2022, the cumulative number of reported claims for the Government Business was 225, 241251, 325 and 236298 for the claim years 20182020 and prior, 20192021 and 2020,2022, respectively.
Incurred claims development, net of reinsurance, for Other as of and for the years ended December 31, 2020, 20192022, 2021 and 20182020 is as follows:
| | Other | Other | | Cumulative Incurred Claims and Allocated Claim Adjustment Expenses, Net of Reinsurance | Other | | Cumulative Incurred Claims and Allocated Claim Adjustment Expenses, Net of Reinsurance |
| | | 2018 | | 2019 | | | | 2020 | | 2021 | |
| Claim Years | Claim Years | | (Unaudited) | | (Unaudited) | | 2020 | Claim Years | | (Unaudited) | | (Unaudited) | | 2022 |
| 2018 & Prior | | $ | 0 | | | $ | 0 | | | $ | 0 | | |
| 2019 | | 0 | | | 0 | | |
| 2020 | | 1,486 | | |
| 2020 & Prior | | 2020 & Prior | | $ | 1,486 | | | $ | 1,470 | | | $ | 1,459 | |
| 2021 | | 2021 | | 1,683 | | | 1,609 | |
| 2022 | | 2022 | | 1,552 | |
| Total | Total | | $ | 1,486 | | Total | | $ | 4,620 | |
Paid claims development, net of reinsurance, for Other as of and for the years ended December 31, 2020, 20192022, 2021 and 20182020 is as follows:
| | Other | Other | | Cumulative Paid Claims and Allocated Claim Adjustment Expenses, Net of Reinsurance | Other | | Cumulative Paid Claims and Allocated Claim Adjustment Expenses, Net of Reinsurance |
| | | 2018 | | 2019 | | | | 2020 | | 2021 | |
| Claim Years | Claim Years | | (Unaudited) | | (Unaudited) | | 2020 | Claim Years | | (Unaudited) | | (Unaudited) | | 2022 |
| 2018 & Prior | | $ | 0 | | | $ | 0 | | | $ | 0 | | |
| 2019 | | 0 | | | 0 | | |
| 2020 | | 1,291 | | |
| 2020 & Prior | | 2020 & Prior | | $ | 1,292 | | | $ | 1,454 | | | $ | 1,458 | |
| 2021 | | 2021 | | 1,421 | | | 1,603 | |
| 2022 | | 2022 | | 1,260 | |
| Total | Total | | $ | 1,291 | | Total | | $ | 4,321 | |
At December 31, 2020,2022, the total of incurred but not reported liabilities plus expected development on reported claims for Other was $0, $0$1, $6 and $195$292 for the claim years 20182020 and prior, 20192021 and 2020,2022, respectively.
At December 31, 2020,2022, the cumulative number of reported claims for Other was $0, $0,29, 28, and $2725 for the claim years 20182020 and prior, 20192021 and 2020,2022, respectively.
The information about incurred claims development, paid claims development and cumulative number of reported claims for the years ended December 31, 20182020 and 20192021 for our Commercial & Specialty Business, Government Business and Other is unaudited and presented as supplementary information.
The cumulative number of reported claims for each claim year for our Commercial & Specialty Business, Government Business and Other have been developed using historical data captured by our claim payment systems. The provided claim
Anthem,Elevance Health, Inc.
Notes to Consolidated Financial Statements (continued)
amounts are not a precise tool for understanding utilization of medical services. They could be impacted by a variety of factors, including changes in provider billing practices, provider reimbursement arrangements, mix of services, benefit design or processing systems. The cumulative number of reported claims has been provided to comply with FASB accounting standards and is not used by management in its claims analysis. Our cumulative number of reported claims may not be comparable to similar measures reported by other health benefits companies.
The reconciliation of the Commercial & Specialty Business, Government Business and Other incurred and paid claims development information for the three years ended December 31, 2020,2022, reflected in the tables above, to the consolidated ending balance for medical claims payable included in the consolidated balance sheet, as of December 31, 2020,2022, is as follows:
| | | Commercial
& Specialty
Business | | Government
Business | | Other | | Total | | Commercial
& Specialty
Business | | Government
Business | | Other | | Total |
| Cumulative incurred claims and allocated claim adjustment expenses, net of reinsurance | Cumulative incurred claims and allocated claim adjustment expenses, net of reinsurance | $ | 77,213 | | | $ | 160,849 | | | $ | 1,486 | | | $ | 239,548 | | Cumulative incurred claims and allocated claim adjustment expenses, net of reinsurance | $ | 85,128 | | | $ | 215,498 | | | $ | 4,620 | | | $ | 305,246 | |
| Less: Cumulative paid claims and allocated claim adjustment expenses, net of reinsurance | Less: Cumulative paid claims and allocated claim adjustment expenses, net of reinsurance | 73,932 | | | 153,236 | | | 1,291 | | | 228,459 | | Less: Cumulative paid claims and allocated claim adjustment expenses, net of reinsurance | 81,014 | | | 204,569 | | | 4,321 | | | 289,904 | |
| Net medical claims payable, end of year | Net medical claims payable, end of year | 3,281 | | | 7,613 | | | 195 | | | 11,089 | | Net medical claims payable, end of year | 4,114 | | | 10,929 | | | 299 | | | 15,342 | |
| Ceded medical claims payable, end of year | Ceded medical claims payable, end of year | 13 | | | 33 | | | 0 | | | 46 | | Ceded medical claims payable, end of year | 5 | | | 1 | | | — | | | 6 | |
| Insurance lines other than short duration | Insurance lines other than short duration | — | | | 224 | | | 0 | | | 224 | | Insurance lines other than short duration | — | | | 248 | | | — | | | 248 | |
| Gross medical claims payable, end of year | Gross medical claims payable, end of year | $ | 3,294 | | | $ | 7,870 | | | $ | 195 | | | $ | 11,359 | | Gross medical claims payable, end of year | $ | 4,119 | | | $ | 11,178 | | | $ | 299 | | | $ | 15,596 | |
13. Debt
Short-term Borrowings
We are a member, through certain subsidiaries, of the Federal Home Loan Bank of Indianapolis, the Federal Home Loan Bank of Cincinnati, the Federal Home Loan Bank of Atlanta and the Federal Home Loan Bank of New York (collectively, the “FHLBs”). As a member we have the ability to obtain short-term cash advances, subject to certain minimum collateral requirements. At December 31, 20202022 and 2019, $02021, $265 and $650,$275, respectively, were outstanding under our short-term FHLB borrowings. Outstanding short-term FHLB borrowings at December 31, 20192022 had fixed interest rates of 1.664%4.240%.
Through certain subsidiaries, we have entered into multiple 364-day lines of credit (the “Subsidiary Credit Facilities”) with separate lenders for general corporate purposes. The Subsidiary Credit Facilities provide combined credit of up to $300.$200. The interest rate on each line of credit is based on the LIBOR rate plus a predetermined rate. Our ability to borrow under the lines of credit is subject to compliance with certain covenants. At each of December 31, 20202022 and 2019,2021, $0 and $50, respectively, werewas outstanding under our Subsidiary Credit Facilities.
Anthem,Elevance Health, Inc.
Notes to Consolidated Financial Statements (continued)
Long-term Debt
The carrying value of our long-term debt at December 31, 20202022 and 20192021 consists of the following:
| | | 2020 | | 2019 | | 2022 | | 2021 |
| Senior unsecured notes: | Senior unsecured notes: | | | | Senior unsecured notes: | | | |
| 2.500%, due 2020 | $ | 0 | | | $ | 899 | | |
| 4.350%, due 2020 | 0 | | | 699 | | |
| 3.700%, due 2021 | 700 | | | 699 | | |
| 2.950%, due 2022 | 2.950%, due 2022 | 749 | | | 747 | | 2.950%, due 2022 | $ | — | | | $ | 749 | |
| 3.125%, due 2022 | 3.125%, due 2022 | 848 | | | 847 | | 3.125%, due 2022 | — | | | 850 | |
| 3.300%, due 2023 | 3.300%, due 2023 | 1,027 | | | 1,013 | | 3.300%, due 2023 | 1,000 | | | 1,014 | |
| 0.450%, due 2023 | | 0.450%, due 2023 | 500 | | | 499 | |
| 3.350%, due 2024 | 3.350%, due 2024 | 847 | | | 846 | | 3.350%, due 2024 | 849 | | | 848 | |
| 3.500%, due 2024 | 3.500%, due 2024 | 796 | | | 795 | | 3.500%, due 2024 | 798 | | | 797 | |
| 2.375%, due 2025 | 2.375%, due 2025 | 1,253 | | | 845 | | 2.375%, due 2025 | 1,252 | | | 1,253 | |
| 5.350%, due 2025 | | 5.350%, due 2025 | 398 | | | — | |
| 1.500%, due 2026 | | 1.500%, due 2026 | 746 | | | 745 | |
| 3.650%, due 2027 | 3.650%, due 2027 | 1,591 | | | 1,590 | | 3.650%, due 2027 | 1,592 | | | 1,592 | |
| 4.101%, due 2028 | 4.101%, due 2028 | 1,257 | | | 1,253 | | 4.101%, due 2028 | 1,234 | | | 1,251 | |
| 2.875%, due 2029 | 2.875%, due 2029 | 819 | | | 819 | | 2.875%, due 2029 | 820 | | | 820 | |
| 2.250%, due 2030 | 2.250%, due 2030 | 1,089 | | | 0 | | 2.250%, due 2030 | 1,071 | | | 1,089 | |
| 2.550%, due 2031 | | 2.550%, due 2031 | 968 | | | 992 | |
| 4.100%, due 2032 | | 4.100%, due 2032 | 595 | | | — | |
| 5.500%, due 2032 | | 5.500%, due 2032 | 644 | | | — | |
| 5.950%, due 2034 | 5.950%, due 2034 | 334 | | | 334 | | 5.950%, due 2034 | 334 | | | 334 | |
| 5.850%, due 2036 | 5.850%, due 2036 | 396 | | | 396 | | 5.850%, due 2036 | 396 | | | 396 | |
| 6.375%, due 2037 | 6.375%, due 2037 | 366 | | | 366 | | 6.375%, due 2037 | 364 | | | 364 | |
| 5.800%, due 2040 | 5.800%, due 2040 | 114 | | | 124 | | 5.800%, due 2040 | 114 | | | 114 | |
| 4.625%, due 2042 | 4.625%, due 2042 | 873 | | | 888 | | 4.625%, due 2042 | 859 | | | 859 | |
| 4.650%, due 2043 | 4.650%, due 2043 | 978 | | | 987 | | 4.650%, due 2043 | 974 | | | 974 | |
| 4.650%, due 2044 | 4.650%, due 2044 | 779 | | | 792 | | 4.650%, due 2044 | 767 | | | 767 | |
| 5.100%, due 2044 | 5.100%, due 2044 | 565 | | | 594 | | 5.100%, due 2044 | 548 | | | 548 | |
| 4.375%, due 2047 | 4.375%, due 2047 | 1,387 | | | 1,386 | | 4.375%, due 2047 | 1,388 | | | 1,387 | |
| 4.550%, due 2048 | 4.550%, due 2048 | 839 | | | 838 | | 4.550%, due 2048 | 840 | | | 839 | |
| 3.700%, due 2049 | 3.700%, due 2049 | 811 | | | 811 | | 3.700%, due 2049 | 812 | | | 812 | |
| 3.125%, due 2050 | 3.125%, due 2050 | 987 | | | 0 | | 3.125%, due 2050 | 988 | | | 987 | |
| 3.600%, due 2051 | | 3.600%, due 2051 | 1,233 | | | 1,232 | |
| 4.550%, due 2052 | | 4.550%, due 2052 | 689 | | | — | |
| 6.100%, due 2052 | | 6.100%, due 2052 | 741 | | | — | |
| 4.850%, due 2054 | 4.850%, due 2054 | 247 | | | 247 | | 4.850%, due 2054 | 247 | | | 247 | |
| Surplus note: | Surplus note: | | Surplus note: | |
| 9.000%, due 2027 | 9.000%, due 2027 | 25 | | | 25 | | 9.000%, due 2027 | 25 | | | 25 | |
| Senior convertible debentures: | Senior convertible debentures: | | Senior convertible debentures: | |
| 2.750%, due 2042 | 2.750%, due 2042 | 108 | | | 145 | | 2.750%, due 2042 | 63 | | | 72 | |
| Variable rate debt: | Variable rate debt: | | Variable rate debt: | |
| Commercial paper program | Commercial paper program | 250 | | | 400 | | Commercial paper program | — | | | 300 | |
| Total long-term debt | Total long-term debt | 20,035 | | | 19,385 | | Total long-term debt | 23,849 | | | 22,756 | |
| Current portion of long-term debt | Current portion of long-term debt | (700) | | | (1,598) | | Current portion of long-term debt | (1,500) | | | (1,599) | |
| Long-term debt, less current portion | Long-term debt, less current portion | $ | 19,335 | | | $ | 17,787 | | Long-term debt, less current portion | $ | 22,349 | | | $ | 21,157 | |
Elevance Health, Inc.
Notes to Consolidated Financial Statements (continued)
All debt is a direct obligation of Anthem,Elevance Health, Inc., except for the surplus note, the FHLB borrowings and the Subsidiary Credit Facilities.
Anthem, Inc.
Notes to Consolidated Financial Statements (continued)
We generally issue senior unsecured notes (“Notes”) for long-term borrowing purposes. Certain of these Notes may have a call feature that allows us to redeem the Notes at any time at our option and/or a put feature that allows a Note holder to redeem the Notes upon the occurrence of both a change in control event and a downgrade of the Notes below an investment grade rating.
On February 8, 2023, we issued $500 aggregate principal amount of 4.900% Notes due 2026 (the “2026 Notes”), $1,000 aggregate principal amount of 4.750% Notes due 2033 (the “2033 Notes”), and $1,100 aggregate principal amount of 5.125% Notes due 2053 (the “2053 Notes”) under our shelf registration statement. Interest on the 2026 Notes is payable semi-annually in arrears on February 8 and August 8 of each year, commencing August 8, 2023. Interest on the 2033 Notes and 2053 Notes is payable semi-annually in arrears on February 15 and August 15 of each year, commencing August 15, 2023. We intend to use the proceeds for working capital and general corporate purposes, including, but not limited to, the funding of acquisitions, repayment of short-term and long-term debt and the repurchase of our common stock pursuant to our share repurchase program.
On December 1, 2022, we repaid, at maturity, the $750 outstanding balance of our 2.950% senior unsecured notes.
On November 4, 2022, we issued $400 aggregate principal amount of 5.350% Notes due 2025, $650 aggregate principal amount of 5.500% Notes due 2032 and $750 aggregate principal amount of 6.100% Notes due 2052 under our shelf registration statement. Interest on these notes is payable semi-annually in arrears on April 15 and October 15 of each year, commencing April 15, 2023. We used the net proceeds for working capital and general corporate purposes, such as the funding of acquisitions, repayment of short-term and long-term debt and the repurchase of our common stock pursuant to our share repurchase program.
On May 16, 2022, we repaid, at maturity, the $850 outstanding balance of our 3.125% senior unsecured notes.
On April 29, 2022, we issued $600 aggregate principal amount of 4.100% Notes due 2032 and $700 aggregate principal amount of 4.550% Notes due 2052 under our shelf registration statement. Interest on these notes is payable semi-annually in arrears on May 15 and November 15 of each year, commencing November 15, 2022. We used the net proceeds for working capital and general corporate purposes, such as the funding of acquisitions, repayment of short-term and long-term debt and the repurchase of our common stock pursuant to our share repurchase program.
On May 15, 2021, we redeemed the $700 outstanding principal balance of our 3.700% Notes due August 15, 2021 at a redemption price equal to 100% of the aggregate principal amount of the notes being redeemed, plus accrued and unpaid interest.
On March 17, 2021, we issued $500 aggregate principal amount of 0.450% Notes due 2023, $750 aggregate principal amount of 1.500% Notes due 2026, $1,000 aggregate principal amount of 2.550% Notes due 2031 and $1,250 aggregate principal amount of 3.600% Notes due 2051 under our shelf registration statement. Interest on these notes is payable semiannually in arrears on March 15 and September 15 of each year, commencing September 15, 2021. We used the net proceeds for working capital and general corporate purposes, such as the funding of acquisitions, repayment of short-term and long-term debt and the repurchase of our common stock pursuant to our share repurchase program.
Additionally, during the year ended December 31, 2021, we repurchased $52 of outstanding principal amount of certain other senior unsecured notes, plus applicable premium for early redemption plus accrued and unpaid interest, for cash totaling $67. We recognized a loss on extinguishment of debt of $15 for the repurchase of these notes.
On November 23, 2020, we repaid, at maturity, the $900 outstanding balance of our 2.500% senior unsecured notes. On August 17, 2020, we repaid, at maturity, the $700 outstanding balance of our 4.350% senior unsecured notes.
Additionally, during the year ended December 31, 2020, we repurchased $79 of outstanding principal amount of certain other senior unsecured notes, plus applicable premium for early redemption plus accrued and unpaid interest, for cash totaling $109. We recognized a loss on extinguishment of debt of $30 for the repurchase of these notes.
Elevance Health, Inc.
Notes to Consolidated Financial Statements (continued)
On May 5, 2020, we issued $400 aggregate principal amount of additional senior notes pursuant to a reopening of our existing 2.375% Notes due 2025 (the “2025 Notes”), $1,100 aggregate principal amount of 2.250% Notes due 2030 (the “2030 Notes”), and $1,000 aggregate principal amount of 3.125% Notes due 2050 (the “2050 Notes”) under our shelf registration statement. The 2025 Notes constitute an additional issuance of our 2.375% notes due 2025, of which $850 aggregate principal amount was issued on September 9, 2019. Interest on the 2025 Notes is deemed to have accrued from January 15, 2020 and is payable semi-annually in arrears on January 15 and July 15 of each year, commencing July 15, 2020. Interest on the 2030 Notes and 2050 Notes is payable semi-annually in arrears on May 15 and November 15 of each year, commencing November 15, 2020. The proceeds were used for working capital and general corporate purposes, including, but not limited to,such as the funding of acquisitions, repayment of short-term and long-term debt repurchase of our common stock pursuant to our share repurchase program and to fund acquisitions.
On September 9, 2019, we issued $850 aggregate principal amount of the 2025 Notes, $825 aggregate principal amount of 2.875% Notes due 2029 (the “2029 Notes”), and $825 aggregate principal amount of 3.700% Notes due 2049 (the “2049 Notes”) under our shelf registration statement. Interest on the 2025 Notes is payable semi-annually in arrears on January 15 and July 15 of each year, commencing January 15, 2020. Interest on the 2029 Notes and the 2049 Notes is payable semi-annually in arrears on March 15 and September 15 each year, commencing March 15, 2020. The proceeds were used for working capital and general corporate purposes, including, but not limited to, the repurchase of our common stock pursuant to our share repurchase program, repayment of short-term and long-term debt and to fund acquisitions.
On August 15, 2019, we repaid, at maturity, the $850 outstanding balance of our 2.250% senior unsecured notes.
On July 16, 2018, we repaid, at maturity, the $650 outstanding balance of our 2.300% senior unsecured notes. On January 15, 2018, we repaid, at maturity, the $625 outstanding balance of our 1.875% senior unsecured notes.
On May 1, 2018, we settled our Equity Units stock purchase contracts at a settlement rate of 0.2412 shares of our common stock, using a market value formula set forth in the Equity Units purchase contracts. This resulted in the issuance of approximately 6 shares. We had issued 25 Equity Units on May 12, 2015, pursuant to an underwriting agreement dated May 6, 2015, in an aggregate principal amount of $1,250. Each Equity Unit had a stated amount of $50 (whole dollars) and consisted of a purchase contract obligating the holder to purchase a certain number of shares of our common stock on May 1, 2018, subject to earlier termination or settlement, for a price in cash of $50 (whole dollars); and a 5% undivided beneficial ownership interest in $1,000 (whole dollars) principal amount of our 1.900% remarketable subordinated notes (“RSNs”), due 2028. On March 2, 2018, we remarketed the RSNs and used the proceeds to purchase U.S. Treasury securities that were pledged to secure the stock purchase obligations of the holders of the Equity Units. The purchasers of the RSNs transferred the RSNs to us in exchange for $1,250 principal amount of our 4.101% senior notes due 2028 (the “2028 Notes”), and a cash payment of $4. We canceled the RSNs upon receipt and recognized a loss on extinguishment of debt of $18. At the remarketing, we also issued $850 aggregate principal amount of 4.550% notes due 2048 (the “2048 Notes”) under our shelf registration statement. We used the proceeds from the 2048 Notes for working capital and general corporate purposes. Interest on the 2028 Notes and the 2048 Notes is payable semi-annually in arrears on March 1 and September 1 of each year, commencing on September 1, 2018.program.
The surplus note is an unsecured obligation of Anthem Insurance Companies, Inc. (“Anthem Insurance”), a wholly owned subsidiary, and is subordinate in right of payment to all of Anthem Insurance’s existing and future indebtedness. Any payment of interest or principal on the surplus note may be made only with the prior approval of the Indiana Department of
Anthem, Inc.
Notes to Consolidated Financial Statements (continued)
Insurance (“IDOI”) and only out of capital and surplus funds of Anthem Insurance that the IDOI determines to be available for the payment under Indiana insurance laws.
We have a senior revolving credit facility (the “5-Year Facility”) with a group of lenders for general corporate purposes. TheOn April 18, 2022, we amended and restated the credit agreement for the 5-Year Facility providesto, among other things, extend the maturity date of the 5-Year Facility from June 2024 to April 2027 and increase the amount of credit upavailable under the 5-Year Facility from $2,500 to $2,500$4,000. Also on April 18, 2022, concurrently with the amendment and maturesrestatement of the 5-Year Facility, we terminated our 364-day senior revolving credit facility that provided for credit in the amount of $1,000, which was scheduled to mature in June 2024. We also have a2022 (the “2021 364-Day Facility”). In June 2021, we terminated our 364-day senior revolving credit facility (the “364-Day“prior 364-Day Facility”), which was scheduled to mature in June 2021, and entered into the 2021 364-Day Facility with a group of lenders for general corporate purposes, which provides for credit in the amount of $1,000. In May 2020, we amended and extended the 364-Day Facility, which now matures in June 2021.purposes. Our ability to borrow under these credit facilitiesthe 5-Year Facility is subject to compliance with certain covenants, including covenants requiring us to maintain a defined debt-to-capital ratio of not more than 60%, subject to increase in certain circumstances set forth in the applicable credit agreement.agreement for the 5-Year Facility. As of December 31, 2020,2022, our debt-to-capital ratio, as defined and calculated under the credit facilities,5-Year Facility, was 37.6%39.9%. We do not believe the restrictions contained in any of our credit facility5-Year Facility covenants materially affect our financial or operating flexibility. As of December 31, 2020,2022, we were in compliance with all of theour debt covenants under these credit facilities.the 5-Year Facility. There were no amounts outstanding under the 5-Year Facility, the 2021 364-Day Facility or the prior 364-Day Facility at any time during the years ended December 31, 20202022 or the year ended December 31, 2019. At December 31, 2020 and December 31, 2019, there were no amounts outstanding under our 5-Year Facility.2021.
We have an authorized commercial paper program of up to $3,500,$4,000, the proceeds of which may be used for general corporate purposes. In July 2022, we increased the amount available under the commercial paper program from $3,500 to $4,000. At December 31, 2020,2022, we had $250$0 outstanding under our commercial paper program. At December 31, 2021, we had $300 outstanding under our commercial paper program with a weighted-average interest rate of 0.1600%. At December 31, 2019, we had $400 outstanding under our commercial paper program with a weighted-average interest rate of 1.8528%0.150%. Commercial paper borrowings have been classified as long-term debt at December 31, 20202022 and 2019,2021, as our general practice and intent is to replace short-term commercial paper outstanding at expiration with additional short-term commercial paper for an uninterrupted period extending for more than one year, and we have the ability to redeem our commercial paper with borrowings under the senior revolving credit facilities described above.
Convertible Debentures
On October 9, 2012, we issued $1,500 of senior convertible debentures (the “Debentures”) in a private offering to qualified institutional buyers pursuant to Rule 144A under the Securities Act of 1933, as amended (the “Securities Act”). The Debentures are governed by an indenture dated as of October 9, 2012 between us and The Bank of New York Mellon Trust Company, N.A., as trustee (the “Indenture”). The Debentures bear interest at a rate of 2.750% per year, payable semi-annually in arrears in cash on April 15 and October 15 of each year, and mature on October 15, 2042, unless earlier redeemed, repurchased or converted into shares of common stock at the applicable conversion rate. The Debentures also have a contingent interest feature that will requirerequires us to pay additional interest based on certain thresholds and for certain events, as defined in the Indenture, beginning on October 15, 2022. As of October 15, 2022, one of these events had occurred and contingent interest began accruing on the Debentures at a rate of 0.50% of the average trading price of a Debenture for the ten consecutive trading days ended October 14, 2022. Contingent interest will be payable on April 15, 2023, to holders of the Debentures as of the April 1, 2023 record date.
Elevance Health, Inc.
Notes to Consolidated Financial Statements (continued)
Holders may convert their Debentures at their option prior to the close of business on the business day immediately preceding April 15, 2042, only under the following circumstances: (1) during any fiscal quarter if the last reported sale price of our common stock for at least 20 trading days during a period of 30 consecutive trading days ending on the last trading day of the preceding fiscal quarter is greater than or equal to 130% of the applicable conversion price on each applicable trading day; (2) during the five business day period after any 10 consecutive trading day period (the “measurement period”) in which the trading price per $1,000 (whole dollars) principal amount of Debentures for each trading day of that measurement period was less than 98% of the product of the last reported sale price of our common stock and the applicable conversion rate on each such day; (3) if we call any or all of the Debentures for redemption, at any time prior to the close of business on the third scheduled tradingbusiness day prior toimmediately preceding the redemption date; or (4) upon the occurrence of specified corporate events, as defined in the Indenture. On and after April 15, 2042 and until the close of business on the third scheduled trading day immediately preceding the Debentures’ maturity date of October 15, 2042, holders may convert their Debentures into common stock at any time irrespective of the preceding circumstances. The Debentures are redeemable at our option at any time on or after October 20, 2022, upon the occurrence of certain events, as defined in the Indenture.
On February 13, 2023, we delivered notice to redeem all of the outstanding Debentures. The Debentures will be redeemed on March 15, 2023 at a redemption price equal to 100% of the principal amount of the Debentures plus accrued and unpaid interest to, but excluding, the date of redemption.
Upon conversion of the Debentures, we will deliver cash up to the aggregate principal amount of the Debentures converted. With respect to any conversion obligation in excess of the aggregate principal amount of the Debentures converted, we have the option to settle the excess with cash, shares of our common stock or a combination thereof based on a daily conversion value, determined in accordance with the Indenture. The initial conversion rate for the Debentures was 13.2319 shares of our common stock per Debenture, which represented a 25% conversion premium based on the closing price of $60.46 per share of our common stock on October 2, 2012 (the date the Debentures’ terms were finalized) and is equivalent to an initial conversion price of $75.575 per share of our common stock.
Anthem, Inc.
NotesDuring the year ended December 31, 2022, $41 aggregate principal amount of the Debentures was surrendered for conversion by certain holders in accordance with the terms and provisions of the Indenture. We elected to Consolidated Financial Statements (continued)
settle the excess of the principal amount of the conversion with cash for total payments of $299. During the year ended December 31, 2021, $54 aggregate principal amount of the Debentures was surrendered for conversion by certain holders in accordance with the terms and provisions of the Indenture. We elected to settle the excess of the principal amount of the conversions with cash for total payments of $302. We recognized a loss on the extinguishment of debt related to the Debentures of $6, based on the fair values of the debt on the conversion settlement dates. During the year ended December 31, 2020, $56 aggregate principal amount of the Debentures was surrendered for conversion by certain holders in accordance with the terms and provisions of the Indenture. We elected to settle the excess of the principal amount of the conversions with cash for total payments of $222. We recognized a loss on the extinguishment of debt related to the Debentures of $6, based on the fair values of the debt on the conversion settlement dates. During the year ended December 31, 2019, we repurchased $15 of the aggregate principal balance of the Debentures. In addition, $57 aggregate principal amount of the Debentures was surrendered for conversion by certain holders in accordance with the terms and provisions of the Indenture. We elected to settle the excess of the principal amount of the repurchases and conversions with cash for total payments of $273. We recognized a loss on the extinguishment of debt related to the Debentures of $2. During the year ended December 31, 2018, $109 aggregate principal amount of the Debentures was surrendered for conversion. We elected to settle the excess of the principal amount of the conversions with cash for total payments of $402. We recognized a gain on the extinguishment of debt related to the Debentures of $7.
As of December 31, 2020,2022, our common stock was last traded at a price of $321.09$512.97 per share. If the remaining Debentures had been converted or matured at December 31, 2020,2022, we would have been obligated to pay the principal of the Debentures plus an amount in cash or shares equal to $560.$402. The Debentures and underlying shares of our common stock have not been and will not be registered under the Securities Act, or any state securities laws, and may not be offered or sold in the United States absent registration or an applicable exemption from registration requirements.
We have accounted for the Debentures in accordance with the FASB cash conversion guidance in FASB guidance for debt with conversion and other options.options at the time of issue. As a result, the value of the embedded conversion option, net of deferred taxes and equity issuance costs, has beenwas bifurcated from its debt host and recorded as a component of additional paid-in capital in our consolidated balance sheets.sheets.We adopted ASU 2020-06 on January 1, 2022 using the modified retrospective transition method, which resulted in an increase to our reported debt outstanding of $31, a decrease of our deferred tax liabilities of $8 and a corresponding cumulative-effect reduction to our opening retained earnings of $23, eliminating the bifurcation of the embedded conversion option.
Elevance Health, Inc.
Notes to Consolidated Financial Statements (continued)
The following table summarizes, at December 31, 2020,2022, the related balances, conversion rate and conversion price of the Debentures:
| | | | | |
| Outstanding principal amount | $ | 15963 | |
Unamortized debt discount | $ | 49 | |
| Net debt carrying amount | $ | 10863 | |
Equity component carrying amount | $ | 58 | |
| Conversion rate (shares of common stock per $1,000 of principal amount) | 14.080814.3238 | |
| Effective conversion price (per $1,000 of principal amount) | $ | 71.018769.8139 | |
The remaining amortization period of the unamortized debt discount as of December 31, 2020 is approximately 22 years. The unamortized discount will be amortized into interest expense using the effective interest method based on an effective interest rate of 5.130%, which represents the market interest rate for a comparable debt instrument that does not have a conversion feature. During the years ended December 31, 2020, 20192022, 2021 and 2018,2020, we recognized $6, $9$2, $4 and $12,$6, respectively, of interest expense related to the Debentures, of which $5, $7$2, $3 and $10,$5, respectively, represented interest expense recognized at the stated interest rate of 2.750% and $0, $1 $2 and $2,$1, respectively, represented interest expense resulting from amortization of the debt discount.
Total interestInterest paid on our total outstanding debt during 2022, 2021 and 2020 2019was $878, $822, and 2018 was $794, $755, and $728, respectively.
We were in compliance with all applicable covenants under all of our outstanding debt agreements at December 31, 20202022 and 2019.2021.
Future maturities of all long-term debt outstanding at December 31, 20202022 are as follows: 2021, $950; 2022, $1,597; 2023, $1,027;$1,500; 2024, $1,643;$1,647; 2025, $1,253$1,650; 2026, $746; 2027, $1,592 and thereafter, $13,565.
14. Commitments and Contingencies
Litigation and Regulatory Proceedings
In the ordinary course of business, we are defendants in, or parties to, a number of pending or threatened legal actions or proceedings. To the extent a plaintiff or plaintiffs in the following cases have specified in their complaint or in other court
Anthem, Inc.
Notes to Consolidated Financial Statements (continued)
filings the amount of damages being sought, we have noted those alleged damages in the descriptions below. With respect to the cases described below, we contest liability and/or the amount of damages in each matter and believe we have meritorious defenses.
Where available information indicates that it is probable that a loss has been incurred as of the date of the consolidated financial statements and we can reasonably estimate the amount of that loss, we accrue the estimated loss by a charge to income. In many proceedings, however, it is difficult to determine whether any loss is probable or reasonably possible. In addition, even where loss is possible or an exposure to loss exists in excess of the liability already accrued with respect to a previously identified loss contingency, it is not always possible to reasonably estimate the amount of the possible loss or range of loss.
With respect to many of the proceedings to which we are a party, we cannot provide an estimate of the possible losses, or the range of possible losses in excess of the amount, if any, accrued, for various reasons, including but not limited to some or all of the following: (i) there are novel or unsettled legal issues presented, (ii) the proceedings are in early stages, (iii) there is uncertainty as to the likelihood of a class being certified or decertified or the ultimate size and scope of the class, (iv) there is uncertainty as to the outcome of pending appeals or motions, (v) there are significant factual issues to be resolved, and/or (vi) in many cases, the plaintiffs have not specified damages in their complaint or in court filings. For those legal proceedings where a loss is probable, or reasonably possible, and for which it is possible to reasonably estimate the amount of the possible loss or range of losses, we currently believe that the range of possible losses, in excess of established reserves is, in the aggregate, from $0 to approximately $250 at December 31, 2020.2022. This estimated aggregate range of reasonably possible losses is based upon currently available information taking into account our best estimate of such losses for which such an estimate can be made.
Blue Cross Blue Shield Antitrust Litigation
We are a defendant in multiple lawsuits that were initially filed in 2012 against the BCBSA and Blue Cross and/or Blue Shield licensees (the “Blue plans”) across the country. Cases filed in twenty-eight states were consolidated into a single, multi-district proceeding captioned In re Blue Cross Blue Shield Antitrust Litigation that is pending in the United StatesU.S. District Court for the Northern District of Alabama (the “Court”). Generally, the suits allege that the BCBSA and the Blue plans have
Elevance Health, Inc.
Notes to Consolidated Financial Statements (continued)
conspired to horizontally allocate geographic markets through license agreements, best efforts rules that limit the percentage of non-Blue revenue of each plan, restrictions on acquisitions, rules governing the BlueCard® and National Accounts programs and other arrangements in violation of the Sherman Antitrust Act (“Sherman Act”) and related state laws. The cases were brought by two putative nationwide classes of plaintiffs, health plan subscribers and providers.
In response toApril 2018, the Court issued an order on the parties’ cross motions for partial summary judgment, by plaintiffs and defendants, the Court issued an order in April 2018 determining that the defendants’ aggregation of geographic market allocations and output restrictions are to be analyzed under a per se standard of review, and the BlueCard® program and other alleged Section 1 Sherman Act violations are to be analyzed under the rule of reason standard of review. The Court also found that there remain genuine issues of material fact asWith respect to whether the defendants operate as a single entity with regard to the enforcement of the Blue Cross Blue Shield trademarks.trademarks, the Court found that summary judgment was not appropriate due to the existence of genuine issues of material fact. In April 2019, the plaintiffs filed their motions for class certification, in conjunction with their supporting expert reports, and thewhich defendants filed their motions to exclude plaintiffs’ experts, as well as their opposition to plaintiffs’ motions for class certification, in July 2019.opposed.
The BCBSA and Blue plans have approved a settlement agreement and release with the subscriber plaintiffs (the “Subscriber Settlement Agreement”) with, which agreement required the subscriber plaintiffs. If approved by the Court, theCourt’s approval to become effective. The Subscriber Settlement Agreement will requirerequires the defendants to make a monetary settlement payment our portion of which is estimated to be $594, and will containcontains certain terms imposing non-monetary termsobligations including (i) eliminating the “national best efforts” rule in the BCBSA license agreements (which rule limits the percentage of non-Blue revenue permitted for each Blue plan) and (ii) allowing for some large national employers with self-funded benefit plans to request a bid for insurance coverage from a second Blue plan in addition to the local Blue plan. We recognized our estimated payment obligation of $548, net of third party insurance coverage received as of December 31, 2020.
OnIn November 30, 2020, the Court issued an order preliminarily approving the Subscriber Settlement Agreement, following which members of the Subscribersubscriber class were provided notice of the Subscriber Settlement Agreement and an opportunity to opt out of the class. All termsA small number of subscribers submitted valid opt-outs by the July 2021 opt-out deadline. A fairness hearing was held in October 2021 and the Court took the request for final approval under advisement. In February 2022, the Court ordered the issuance of a supplemental notice to self-funded account class members. The notice process was completed in March 2022.
In August 2022, the Court issued a final order approving the Subscriber Settlement Agreement are subject(the “Final Approval Order”). The Court amended its Final Approval Order in September 2022, further clarifying the injunctive relief that may be available to final approval bysubscribers who submitted valid opt-outs. In September 2022, an objector filed a motion to amend the Final Approval Order, which the Court before they
Anthem, Inc.
Notes to Consolidated Financial Statements (continued)
become effective. Objections to the settlement as well as the deadline for those that wish to opt-out from the settlement must be submitted by July 28, 2021. Claims must be filed by November 5, 2021. A final approval hearing has been scheduled for October 20, 2021. If the Court grants approval ofdenied. In compliance with the Subscriber Settlement Agreement, the Company paid $506 into an escrow account in September 2022, for an aggregate and afterfull settlement payment by the Company of $596, which was previously accrued in 2020.
Four notices of appeal of the Final Approval Order were filed by the September 2022 appeal deadline. Those appeals are proceeding in the United States Court of Appeals for the Eleventh Circuit. In the event that all appellate rights have expired or have beenare exhausted in a manner that affirms the Court’s final order and judgment,Final Approval Order, the defendants’ payment and non-monetary obligations under the Subscriber Settlement Agreement will become effective.effective and the funds held in escrow will be distributed in accordance with the Subscriber Settlement Agreement.
InIn October 2020, after the Court lifted the stay as to the provider litigation, provider plaintiffs filed a renewed motion for class certification, which defendants opposed. In March 2021, the Court issued an order terminating the pending motion for class certification until the Court determines the standard of review applicable to the providers’ claims. In May 2021, the defendants and provider plaintiffs filed renewed standard of review motions. In June 2021, the parties filed summary judgment motions not critically dependent on class certification. In February 2022, the Court issued orders (i) granting certain defendants’ motion for partial summary judgment against the provider plaintiffs who had previously released claims against such defendants, filedand (ii) granting the provider plaintiffs’ motion for partial summary judgment, holding that Ohio v. American Express Co. does not affect the standard of review in this case. In August 2022, the Court issued orders (i) granting in part the defendants’ motion regarding the antitrust standard of review, holding that for the period of time after the elimination of the “national best efforts” rule, the rule of reason applies to the provider plaintiffs’ market allocation conspiracy claims, and (ii) denying the provider plaintiffs’ motion for partial summary judgment on the standard of review, reaffirming its prior holding that the providers’ group boycott claims are subject to the rule of reason. In November 2022, the Court issued an oppositionorder requiring the parties to that motion.submit supplemental briefs on certain questions related to providers’ renewed motion for class certification. We intend to continue to vigorously defend the provider suit;litigation, which we believe is without merit; however, its ultimate outcome cannot be presently determined.
Elevance Health, Inc.
Notes to Consolidated Financial Statements (continued)
A number of follow-on cases involving entities that opted out of the Subscriber Settlement Agreement have been filed. Those actions are: Alaska Air Group, Inc., et al. v. Anthem, Inc., et al., No. 2:21-cv-01209-AMM (N.D. Ala.); JetBlue Airways Corp., et al. v. Anthem, Inc., et al., No. 2:22-cv-00558-GMB (N.D. Ala.); Metropolitan Transportation Authority v. Blue Cross and Blue Shield of Alabama et al., No. 2:22-cv-00265-RDP (N.D. Ala.); Bed Bath & Beyond Inc. v. Anthem, Inc., No. 2:22-cv-01256-SGC (N.D. Ala.); Hoover, et al. v. Blue Cross Blue Shield Association, et al., No. 2:22-cv-00261-RDP (N.D. Ala.); and VHS Liquidating Trust v. Blue Cross of California, et al., No. RG21106600 (Cal. Super.). We intend to continue to vigorously defend these follow-on cases, which we believe are without merit; however, their ultimate outcome cannot be presently determined.
Blue Cross of California Taxation Litigation
In July 2013, our California affiliate Blue Cross of California (doing business as Anthem Blue Cross) (“BCC”) was named as a defendant in a California taxpayer action filed in Los Angeles County Superior Court (the “Superior Court”) captioned Michael D. Myers v. State Board of Equalization, et al. This action was brought under a California statute that permits an individual taxpayer to sue a governmental agency when the taxpayer believes the agency has failed to enforce governing law. Plaintiff contends that BCC, a licensed Health Care Service Plan, is an “insurer” for purposes of taxation despite acknowledging it is not an “insurer” under regulatory law. At the time, under California law, “insurers” were required to pay a gross premiums tax (“GPT”) calculated as 2.35% on gross premiums. As a licensed Health Care Service Plan, BCC has paid the California Corporate Franchise Tax (“CFT”), the tax paid by California businesses generally. Plaintiff contends that BCC must pay the GPT rather than the CFT and seeks a writ of mandate directing the taxing agencies to collect the GPT and an order requiring BCC to pay GPT back taxes, interest, and penalties for the eight-year period prior to the filing of the complaint.
Because the GPT is constitutionally imposed in lieu of certain other taxes, BCC has filed protective tax refund claims with the City of Los Angeles, the California Department of Health Care Services and the Franchise Tax Board to protect its rights to recover certain taxes previously paid should BCC eventually be determined to be subject to the GPT for the tax periods at issue in the litigation.
In March 2018, the Superior Court denied BCC'sBCC’s motion for judgment on the pleadings and similar motions brought by other entities. BCC filed a motion for summary judgment with the Superior Court, which was heard in October 2020. In December 2020, the Superior Court granted BCC'sBCC’s motion for summary judgment, dismissing the plaintiff'splaintiff’s lawsuit. In November 2021, the plaintiff appealed the summary judgment order. BCC’s responding brief was filed in March 2022 and Plaintiff’s reply was filed in May 2022. We estimate that the appeal will be heard in March 2023. We intend to vigorously defend anythe appeal of this lawsuit.
Express Scripts, Inc. Pharmacy Benefit Management Litigation
In March 2016, we filed a lawsuit against Express Scripts, Inc. (“Express Scripts”), our vendor at the time for PBM services, captioned Anthem, Inc. v. Express Scripts, Inc., in the U.S. District Court for the Southern District of New York.York (the “District Court”). The lawsuit seeks to recover over $14,800 in damages for pharmacy pricing that is higher than competitive benchmark pricing under the agreement between the parties (the “ESI PBM Agreement”), over $158 in damages related to operational breaches, as well as various declarations under the ESI PBM Agreement, including that Express Scripts: (i) breached its obligation to negotiate in good faith and to agree in writing to new pricing terms; (ii) was required to provide competitive benchmark pricing to us through the term of the ESI PBM Agreement; (iii) has breached the ESI PBM Agreement; and (iv) is required under the ESI PBM Agreement to provide post-termination services, at competitive benchmark pricing, for one year following any termination.
Express Scripts has disputed our contractual claims and is seeking declaratory judgments: (i) regarding the timing of the periodic pricing review under the ESI PBM Agreement, and (ii) that it has no obligation to ensure that we receive any specific level of pricing, that we have no contractual right to any change in pricing under the ESI PBM Agreement and that its sole obligation is to negotiate proposed pricing terms in good faith. In the alternative, Express Scripts claims that we have been unjustly enriched by its payment of $4,675 at the time we entered into the ESI PBM Agreement. In March 2017, the courtDistrict Court granted our motion to dismiss Express Scripts’ counterclaims for (i) breach of the implied covenant of good faith and fair dealing, and (ii) unjust enrichment with prejudice. TheAfter such ruling, Express Scripts’ only remaining claims arewere for breach of contract and declaratory relief. Rebuttal expert reports were submitted in October 2020, discovery must be completed in AprilIn August 2021, and motionsExpress Scripts filed a motion for summary judgment, must bewhich we opposed. In March 2022, the District Court granted in part and denied in part Express Scripts’ motion for summary
Elevance Health, Inc.
Notes to Consolidated Financial Statements (continued)
judgment. The District Court dismissed our declaratory judgment claim, our breach of contract claim for failure to prove damages and most of our operational breach claims. As a result of the summary judgment decision, the only remaining claims as of the filing of this Annual Report on Form 10-K are (i) our operational breach claim based on Express Scripts’ prior authorization processes and (ii) Express Scripts’ counterclaim for breach of the market check provision of the ESI PBM Agreement. Express Scripts filed a second motion for summary judgment in May 2021.June 2022, challenging our remaining operational breach claims, which we opposed in July 2022. We intend to appeal the earlier summary judgment decision at the appropriate time, vigorously pursue our claims and defend against any counterclaims, which we believe are without merit; however, the ultimate outcome of this litigation cannot be presently determined.
Anthem, Inc.
Notes to Consolidated Financial Statements (continued)
In re Express Scripts/Anthem ERISA Litigation
We are a defendant in a class action lawsuit that was initially filed in June 2016 against Anthem, Inc. and Express Scripts, which has been consolidated into a single multi-district lawsuit captioned In Re Express Scripts/Anthem ERISA Litigation, in the U.S. District Court for the Southern District of New York. The consolidated complaint was filed by plaintiffs against Express Scripts and us on behalf of all persons who are participants in or beneficiaries of any ERISA or non-ERISA healthcare plan from December 1, 2009 to December 31, 2019 in which we provided prescription drug benefits through the ESI PBM Agreement and paid a percentage based co-insurance payment in the course of using that prescription drug benefit. The plaintiffs allege that we breached our duties, either under ERISA or with respect to the implied covenant of good faith and fair dealing implied in the health plans, (i) by failing to adequately monitor Express Scripts’ pricing under the ESI PBM Agreement, (ii) by placing our own pecuniary interest above the best interests of our insureds by allegedly agreeing to higher pricing in the ESI PBM Agreement in exchange for the purchase price for our NextRx PBM business, and (iii) with respect to the non-ERISA members, by negotiating and entering into the ESI PBM Agreement that was allegedly detrimental to the interests of such non-ERISA members. Plaintiffs seek to hold us and Express Scripts jointly and severally liable and to recover all losses suffered by the proposed class, equitable relief, disgorgement of alleged ill-gotten gains, injunctive relief, attorney’s fees and costs and interest.
In April 2017, we filed a motion to dismiss the claims brought against us, and it was granted, without prejudice, in January 2018. Plaintiffs filed a notice of appeal with the United States Court of Appeals for the Second Circuit (the “Second Circuit”), which was heard in October 2018. In December 2020, the Second Circuit affirmed the trial court's decision dismissing the ERISA complaint. Plaintiffs have filed a Petition for Rehearing and Rehearing En Banc. We intend to vigorously defend this suit; however, its ultimate outcome cannot be presently determined.
Cigna Corporation Merger Litigation
In July 2015, we and Cigna Corporation (“Cigna”) announced that we entered into the Cigna Agreement and Plan of Merger (“Cigna Merger Agreement”) pursuant to which we would acquire all outstanding shares of Cigna. In July 2016, the U.S. Department of Justice (“DOJ”) along with certain state attorneys general, filed a civil antitrust lawsuit in the U.S. District Court for the District of Columbia (“District Court”) seeking to block the merger. In February 2017, Cigna purported to terminate the Cigna Merger Agreement and commenced litigation against us in the Delaware Court of Chancery (“Delaware Court”) seeking damages, including the $1,850 termination fee pursuant to the terms of the Cigna Merger Agreement, and a declaratory judgment that its purported termination of the Cigna Merger Agreement was lawful, among other claims, which is captioned Cigna Corp. v. Anthem Inc.
Also in February 2017, we initiated our own litigation against Cigna in the Delaware Court seeking a temporary restraining order to enjoin Cigna from terminating the Cigna Merger Agreement, specific performance compelling Cigna to comply with the Cigna Merger Agreement and damages, which is captioned Anthem Inc. v. Cigna Corp. In April 2017, the U.S. Circuit Court of Appeals for the District of Columbia affirmed the ruling of the District Court, which blocked the merger. In May 2017, after the Delaware Court denied our motion to enjoin Cigna from terminating the Cigna Merger Agreement, we delivered to Cigna a notice terminating the Cigna Merger Agreement.
In the Delaware Court litigation, trial commenced in late February 2019 and concluded in March 2019. The Delaware Court held closing arguments in November 2019 and took the matter under consideration. In August 2020, the Delaware Court issued an opinion finding that neither party was owed damages and that we did not owe Cigna the $1,850 termination fee. The Delaware Court issued an order implementing its opinion in October 2020. Cigna filed its notice of appeal in November 2020 challenging the Court's decision that Anthem did not owe Cigna a termination fee. Cigna filed its appellate brief in December 2020, and we filed our response in January 2021. We believe Cigna’s allegations are without merit and we intend to vigorously defend against Cigna’s allegations; however, the ultimate outcome of the appeal of this litigation with Cigna cannot be presently determined.
In October 2018, a shareholder filed a derivative lawsuit in the State of Indiana Marion County Superior Court, captioned Henry Bittmann, Derivatively, et al. v. Joseph R Swedish, et al., purportedly on behalf of us and our shareholders against certain current and former directors and officers alleging breaches of fiduciary duties, unjust enrichment and corporate waste associated with the Cigna Merger Agreement. This case has been stayed at the request of the parties pending
Anthem, Inc.
Notes to Consolidated Financial Statements (continued)
the outcome of our litigation with Cigna in the Delaware Court. This lawsuit’s ultimate outcome cannot be presently determined.
Medicare Risk Adjustment Litigation
In March 2020, the DOJU.S. Department of Justice (“DOJ”) filed a civil lawsuit against Elevance Health, Inc. (f/k/a Anthem, Inc.) in the U.S. District Court for the Southern District of New York (the “New York District Court”) in a case captioned United States v. Anthem, Inc. The DOJ’s suit alleges, among other things, that we falsely certified the accuracy of the diagnosis data we submitted to the Centers for Medicare and Medicaid Services (“CMS”) for risk-adjustment purposes under Medicare Part C and knowingly failed to delete inaccurate diagnosis codes. The DOJ further alleges that, as a result of these purported acts, we caused CMS to calculate the risk-adjustment payments based on inaccurate diagnosis information, which enabled us to obtain unspecified amounts of payments in Medicare funds in violation of the False Claims Act. The DOJ filed an amended complaint in July 2020, alleging the same causes of action but revising some of its factual allegations. In September 2020, we filed a motion to transfer the lawsuit to the Southern District of Ohio, a motion to dismiss part of the lawsuit, and a motion to strike certain allegations in the amended complaint. TheIn an opinion and order issued October 3, 2022, the New York District Court denied our motions, are fully briefed and no decision has been rendered.the case will now proceed in that court. In November 2022, we filed an answer. We intend to continue to vigorously defend this suit;suit, which we believe is without merit; however, the ultimate outcome cannot be presently determined.
Investigations of CareMore and HealthSun
With the assistance of outside counsel, we are conducting investigations of risk-adjustment practices involving data submitted to CMS (unrelated to our retrospective chart review program) at CareMore Health Plans, Inc. (“CareMore”), one of our California subsidiaries, and HealthSun Health Plans, Inc. (“HealthSun”), one of our Florida subsidiaries. Our CareMore investigation has resulted in the termination of CareMore’s relationship with one contracted provider in California. Our HealthSun investigation focuseshas focused on risk adjustment practices initiated prior to our acquisition of HealthSun in December 2017 that continued after the acquisition. We have voluntarily self-disclosed the existence of both of our investigations to CMS and the Criminal Divisionand Civil Divisions of the DOJ, which then initiated an investigation.DOJ. We are cooperating with the government'songoing investigations of the Criminal and Civil Divisions of the DOJ related to these risk adjustment practices, and have entered into a tolling agreement with the Civil Division of the DOJ related to its investigation. We are in the process of analyzing the scope of potential data corrections to be submitted to CMS and have begun to submit data corrections to CMS. We have also asserted indemnity claims for escrowed funds under the HealthSun purchase agreement for, among other things, breach of healthcare and financial representation provisions, based on the conduct discovered during our investigation. We are in active litigation with two groups of sellers regarding partWhile certain elements of the escrowed fundsescrow claims were resolved in cases captioned Shareholder Representative Services, LLC v. ATH Holding Company, LLCthe fourth quarters of 2021 and Highland Acquisition Holdings, LLC and LPPAS Representative, LLC v. ATH Holding Company, LLC, both pending2022, litigation in the Delaware Court.
Cyber Attack Regulatory Proceedings and Litigation
In February 2015, we reported that we were the targetCourt of a sophisticated external cyber attack during which the attackers gained unauthorized access to certain of our information technology systems and obtained personal information related to many individuals and employees. To date, there is no evidence that credit card or medical information was accessed or obtained. Upon discovery of the cyber attack, we took immediate action to remediate the security vulnerability and have continued to implement security enhancements since this incident.
Federal and state agencies have investigated eventsChancery related to the cyber attack, including how it occurred, its consequences and our responses. In September 2020, we entered into a settlement to resolve the investigation by a multi-state group of attorneys general, which was the final outstanding matter related to the 2015 cyber attack. We have undertaken commitments that align with our ongoing and consistent focus to protect information in addition to a monetary payment of $39, which was fully accrued in a prior period.
We have contingency plans and insurance coverageremaining indemnity claims for certain expenses and potential liabilities of this nature and will pursue coverage for all applicable losses; however, the ultimate outcome of our pursuit of insurance coverage cannot be presently determined.escrowed funds remains ongoing.
Other Contingencies
From time to time, we and certain of our subsidiaries are parties to various legal proceedings, many of which involve claims for coverage encountered in the ordinary course of business. We, like HMOsHealth Maintenance Organizations (“HMOs”) and health insurers generally, exclude certain healthcare and other services from coverage under our HMO, PPOPreferred Provider Organizations and other plans. We are, in the ordinary course of
Anthem, Inc.
Notes to Consolidated Financial Statements (continued)
business, subject to the claims of our enrollees arising out of decisions to restrict or deny reimbursement for uncovered services. The loss of even one such claim, if it results in a significant punitive damage award, could have a material adverse effect on us. In addition, the risk of potential liability under punitive damage theories may increase significantly the difficulty of obtaining reasonable reimbursement of coverage claims.
In addition to the lawsuits described above, we are also involved in other pending and threatened litigation of the character incidental to our business and are from time to time involved as a party in various governmental investigations,
Elevance Health, Inc.
Notes to Consolidated Financial Statements (continued)
audits, reviews and administrative proceedings. These investigations, audits, reviews and administrative proceedings include routine and special inquiries by state insurance departments, state attorneys general, the U.S. Attorney General and subcommittees of the U.S. Congress. Such investigations, audits, reviews and administrative proceedings could result in the imposition of civil or criminal fines, penalties, other sanctions and additional rules, regulations or other restrictions on our business operations. Any liability that may result from any one of these actions, or in the aggregate, could have a material adverse effect on our consolidated financial position or results of operations.
Contractual Obligations and Commitments
In March 2020, we entered into an agreement with a vendor for information technology infrastructure and related management and support services through June 2025. The new agreement supersedes certain prior agreements for such services and includes provisions for additional services not provided under those agreements. Our remaining commitment under this agreement at December 31, 20202022 is approximately $1,426.$761. We will have the ability to terminate the agreement upon the occurrence of certain events, subject to early termination fees.
Beginning inIn the second quarter of 2019, we began using our pharmacy benefits manager CarelonRx, formerly known as IngenioRx, Inc. (“IngenioRx”) to market and offer PBM services to our fully-insured and self-funded affiliated health plan customers, as well as to external customers outside of the health plans we own. The comprehensive prescription benefits managementPBM services portfolio includes, but is not limited to, formulary management, pharmacy networks, prescription drug database, member services and mail order capabilities. Also in the second quarter of 2019, IngenioRx began delegatingCarelonRx delegates certain PBM administrative functions, such as claims processing and prescription fulfillment, to CaremarkPCS Health, L.L.C., which is a subsidiary of CVS Health Corporation, pursuant to a five-year agreement.agreement, which is set to terminate on December 31, 2024. With IngenioRx,CarelonRx, we retain the responsibilities for clinical and formulary strategy and development, member and employer experiences, operations, sales, marketing, account management and retail network strategy.
Vulnerability from Concentrations
Financial instruments that potentially subject us to concentrations of credit risk consist primarily of cash equivalents, investment securities, premium receivables and instruments held through hedging activities. All investment securities are managed by professional investment managers within policies authorized by our Board of Directors. Such policies limit the amounts that may be invested in any one issuer and prescribe certain investee company criteria. Concentrations of credit risk with respect to premium receivables are limited due to the large number of employer groups that constitute our customer base in the states in which we conduct business. As of December 31, 2020,2022, there were no significant concentrations of financial instruments in a single investee, industry or geographic location.
15. Capital Stock
Stock Incentive Plans
Our Board of Directors has adopted the 2017 Elevance Health Incentive Compensation Plan, formerly known as the 2017 Anthem Incentive Compensation Plan (“2017 Incentive Plan”), which has been approved by our shareholders. The term of the 2017 Incentive Plan is such that no awards may be granted on or after May 18, 2027. The 2017 Incentive Plan gives authority to the Compensation Committee of the Board of Directors to make incentive awards to our non-employee directors, employees and consultants, consisting of stock options, stock, restricted stock, restricted stock units, cash-based awards, stock appreciation rights, performance shares and performance units. The 2017 Incentive Plan limits the number of available shares for issuance to 37.5 shares, subject to adjustment as set forth in the 2017 Incentive Plan.
Anthem, Inc.
Notes to Consolidated Financial Statements (continued)
Stock options are granted for a fixed number of shares with an exercise price at least equal to the fair value of the shares at the grant date. Stock options vest over three years in equal annual installments and generally have a term of ten years from the grant date.
Certain option grants contain provisions whereby the employee continues to vest in the award subsequent to termination due to retirement. Our attribution method for newly granted awards considers all vesting and other provisions, including retirement eligibility, in determining the requisite service period over which the fair value of the awards will be recognized.
Awards of restricted stock or restricted stock units are issued at the fair value of the stock on the grant date and may also include one or more performance measures that must be met for the award to vest. For restricted stock or restricted stock
Elevance Health, Inc.
Notes to Consolidated Financial Statements (continued)
units without performance measures, the restrictions lapse in three equal annual installments. Restricted stock or restricted stock units with performance measures vest in three year installments. Performance units issued in 2022 will vest in 2025, based on certain revenue and earnings targets over the three year period of 2022 to 2024. Performance units issued in 2021 will vest in 2024, based on certain revenue and earnings targets over the three year period of 2021 to 2023. Performance units issued in 2020 will vest in 2023, based on certain revenue and earnings targets over the three year period of 2020 to 2022. Performance units issued in 2019 will vest in 2022, based on certain revenue and earnings targets over the three year period of 2019 to 2021. Performance units issued in 2018 will vest in 2021, based on certain revenue and earnings targets over the three year period of 2018 to 2020.
For the years ended December 31, 2020, 20192022, 2021 and 2018,2020, we recognized share-based compensation expense of $283, $294$264, $255 and $226,$283, respectively, as well as related tax benefits of $74, $78$66, $65 and $61,$74, respectively.
A summary of stock option activity for the year ended December 31, 20202022 is as follows:
| | | Number of
Shares | | Weighted-Average
Option Price per
Share | | Weighted-Average
Remaining
Contractual Life
(Years) | | Aggregate
Intrinsic
Value | | Number of
Shares | | Weighted-Average
Option Price
per Share | | Weighted-Average
Remaining
Contractual Life
(Years) | | Aggregate
Intrinsic
Value |
| Outstanding at January 1, 2020 | 3.1 | | | $ | 190.28 | | | | | | |
| Outstanding at January 1, 2022 | | Outstanding at January 1, 2022 | 2.9 | | | $ | 255.50 | | | | | |
| Granted | Granted | 1.0 | | | 271.61 | | | Granted | 0.5 | | | 452.67 | | |
| Exercised | Exercised | (0.9) | | | 136.89 | | | Exercised | (0.5) | | | 242.79 | | |
| Forfeited or expired | Forfeited or expired | (0.1) | | | 273.91 | | | Forfeited or expired | (0.1) | | | 339.20 | | |
| Outstanding at December 31, 2020 | 3.1 | | | 230.00 | | | 6.75 | | $ | 280 | | |
| Exercisable at December 31, 2020 | 1.6 | | | 185.08 | | | 5.37 | | $ | 217 | | |
| Outstanding at December 31, 2022 | | Outstanding at December 31, 2022 | 2.8 | | | 293.28 | | | 6.35 | | $ | 622 | |
| Exercisable at December 31, 2022 | | Exercisable at December 31, 2022 | 1.6 | | | 239.89 | | | 5.14 | | $ | 448 | |
The intrinsic value of options exercised during the years ended December 31, 2020, 20192022, 2021 and 20182020 amounted to $147, $188$120, $121 and $172,$147, respectively. We recognized tax benefits of $40, $52$31, $32 and $47$40 during the years ended December 31, 2020, 20192022, 2021 and 2018,2020, respectively, from option exercises and disqualifying dispositions. During the years ended December 31, 2020, 20192022, 2021 and 2018,2020, we received cash of $129, $143$120, $148 and $141,$129, respectively, from exercises of stock options.
The total fair value of restricted stock awards that vested during the years ended December 31, 2022, 2021 and 2020 2019was $261, $287 and 2018 was $335, $245 and $237, respectively.
A summary of the status of nonvested restricted stock activity, including restricted stock units and performance units, for the year ended December 31, 20202022 is as follows:
| | | | | | | | | | | |
| Restricted
Stock Shares
and Units | | Weighted-Average
Grant Date
Fair Value
per Share |
| Nonvested at January 1, 2020 | 1.4 | | | $ | 242.54 | |
| Granted | 1.3 | | | 272.37 | |
| Vested | (1.3) | | | 196.25 | |
| Forfeited | (0.1) | | | 272.50 | |
| Nonvested at December 31, 2020 | 1.3 | | | 272.51 | |
Anthem, Inc.
Notes to Consolidated Financial Statements (continued)
| | | | | | | | | | | |
| Restricted
Stock Shares
and Units | | Weighted-Average
Grant Date
Fair Value
per Share |
| Nonvested at January 1, 2022 | 1.3 | | | $ | 299.65 | |
| Granted | 0.6 | | | 453.70 | |
| Vested | (0.6) | | | 301.89 | |
| Forfeited | (0.1) | | | 347.73 | |
| Nonvested at December 31, 2022 | 1.2 | | | 357.21 | |
During the year ended December 31, 2020,2022, we granted approximately 0.30.2 restricted stock units that are contingent upon us achieving certain revenue and earningearnings targets over the three year period of 20202022 to 2022.2024. These grants have been included in the activity shown above, but will be subject to adjustment at the end of 2022,2024, based on results in the three year period.
As of December 31, 2020,2022, the total remaining unrecognized compensation expense related to nonvested stock options and restricted stock, including restricted stock units and performance units, amounted to $30$35 and $154,$176, respectively, which will be amortized over the weighted-average remaining requisite service periods of 119 months and 1312 months, respectively.
As of December 31, 2020,2022, there were approximately 19.514.0 shares of common stock available for future grants under the 2017 Incentive Plan.
Elevance Health, Inc.
Notes to Consolidated Financial Statements (continued)
Fair Value
We use a binomial lattice valuation model to estimate the fair value of all stock options granted. Expected volatility assumptions used in the binomial lattice model are based on an analysis of implied volatilitiesvolatility of publicly traded options on our stock and historical volatility of our stock price. The risk-free interest rate is derived from the U.S. Treasury strip rates at the time of the grant. The expected term of the options was derived from the outputs of the binomial lattice model, which incorporates post-vesting forfeiture assumptions based on an analysis of historical data. The dividend yield was based on our estimate of future dividend yields. Similar groups of employees that have dissimilar exercise behavior are considered separately for valuation purposes. We utilize the multiple-grant approach for recognizing compensation expense associated with each separately vesting portion of the share-based award.
The following weighted-average assumptions were used to estimate the fair values of options granted during the years ended December 31, 2020, 20192022, 2021 and 2018:2020:
| | | 2020 | | 2019 | | 2018 | | 2022 | | 2021 | | 2020 |
| Risk-free interest rate | Risk-free interest rate | 1.30 | % | | 2.69 | % | | 2.90 | % | Risk-free interest rate | 1.97 | % | | 1.44 | % | | 1.30 | % |
| Volatility factor | Volatility factor | 26.00 | % | | 25.00 | % | | 30.00 | % | Volatility factor | 29.00 | % | | 30.00 | % | | 26.00 | % |
| Dividend yield (annual) | Dividend yield (annual) | 1.40 | % | | 1.00 | % | | 1.30 | % | Dividend yield (annual) | 1.10 | % | | 1.50 | % | | 1.40 | % |
| Weighted-average expected life (years) | Weighted-average expected life (years) | 4.30 | | 4.40 | | 3.70 | Weighted-average expected life (years) | 5.10 | | 5.50 | | 4.30 |
The following weighted-average fair values were determined for the years ending December 31, 2020, 20192022, 2021 and 2018:2020:
| | | 2020 | | 2019 | | 2018 | | 2022 | | 2021 | | 2020 |
| Options granted during the year | Options granted during the year | $ | 54.05 | | | $ | 68.66 | | | $ | 55.48 | | Options granted during the year | $ | 116.92 | | | $ | 79.91 | | | $ | 54.05 | |
| Restricted stock awards granted during the year | Restricted stock awards granted during the year | 272.37 | | | 305.88 | | | 233.73 | | Restricted stock awards granted during the year | 453.70 | | | 317.70 | | | 272.37 | |
The binomial lattice option-pricing model requires the input of highly subjective assumptions including the expected stock price volatility. Because our stock option grants have characteristics significantly different from those of traded options, and because changes in the subjective input assumptions can materially affect the fair value estimate, in our opinion, existing models do not necessarily provide a reliable single measure of the fair value of our stock option grants.
Employee Stock Purchase Plan
We have registered 14.0 shares of common stock for the Employee Stock Purchase Plan (the “Stock Purchase Plan”), which is intended to provide a means to encourage and assist employees in acquiring a stock ownership interest in Anthem.Elevance Health. Pursuant to the terms of the Stock Purchase Plan, an eligible employee is permitted to purchase no more than $25,000 (actual dollars) worth of stock in any calendar year, based on the fair value of the stock at the end of each plan quarter. Employees become participants by electing payroll deductions from 1% to 15% of gross compensation. Once purchased, the stock is accumulated in the employee’s investment account. The Stock Purchase Plan allows participants to purchase shares of our common stock at a discounted price per share of 90% of the fair value of a share of common stock on the lower of the first or last trading day of the plan quarter purchase period. The Stock Purchase Plan discount was recognized as compensation expense for the year ended December 31, 2020,2022, based on GAAP guidance. There were 0.2 shares issued duringDuring the yearyears ended December 31, 2020.2022, 2021 and 2020, we issued 0.1, 0.1 and 0.2 shares, respectively, under the Stock Purchase Plan, and we received cash of $62, $55 and $47, respectively, for such shares. As of December 31, 2020, 4.62022, 4.3 shares were available for issuance under the Stock Purchase Plan.
Anthem, Inc.
Notes to Consolidated Financial Statements (continued)
Use of Capital and Stock Repurchase Program
We regularly review the appropriate use of capital, including acquisitions, common stock and debt security repurchases and dividends to shareholders. The declaration and payment of any dividends or repurchases of our common stock or debt is at the discretion of our Board of Directors and depends upon our financial condition, results of operations, future liquidity needs, regulatory and capital requirements and other factors deemed relevant by our Board of Directors.
Elevance Health, Inc.
Notes to Consolidated Financial Statements (continued)
A summary of the cash dividend activity for the years ended December 31, 20202022 and 20192021 is as follows:
| | | | | | | | | | | | | | | | | | | | | | | | | | |
| Declaration Date | | Record Date | | Payment Date | | Cash Dividend per
Share | | Total |
| Year ended December 31, 2020 | | | | | | |
| January 28, 2020 | | March 16, 2020 | | March 27, 2020 | | $ | 0.95 | | | $ | 240 | |
| April 28, 2020 | | June 10, 2020 | | June 25, 2020 | | 0.95 | | | 242 | |
| July 28, 2020 | | September 10, 2020 | | September 25, 2020 | | 0.95 | | | 238 | |
| October 27, 2020 | | December 7, 2020 | | December 22, 2020 | | 0.95 | | | 234 | |
| | | | | | | | |
| Year ended December 31, 2019 | | | | | | |
| January 29, 2019 | | March 18, 2019 | | March 29, 2019 | | $ | 0.80 | | | $ | 206 | |
| April 23, 2019 | | June 10, 2019 | | June 25, 2019 | | 0.80 | | | 206 | |
| July 23, 2019 | | September 10, 2019 | | September 25, 2019 | | 0.80 | | | 204 | |
| October 22, 2019 | | December 5, 2019 | | December 20, 2019 | | 0.80 | | | 202 | |
| | | | | | | | | | | | | | | | | | | | | | | | | | |
| Declaration Date | | Record Date | | Payment Date | | Cash Dividend
per Share | | Total |
| Year ended December 31, 2022 | | | | | | |
| January 25, 2022 | | March 10, 2022 | | March 25, 2022 | | $ | 1.28 | | | $ | 309 | |
| April 19, 2022 | | June 10, 2022 | | June 24, 2022 | | 1.28 | | | 309 | |
| July 19, 2022 | | September 9, 2022 | | September 23, 2022 | | 1.28 | | | 306 | |
| October 18, 2022 | | December 5, 2022 | | December 21, 2022 | | 1.28 | | | 305 | |
| | | | | | | | |
| Year ended December 31, 2021 | | | | | | |
| January 26, 2021 | | March 10, 2021 | | March 25, 2021 | | $ | 1.13 | | | $ | 277 | |
| April 20, 2021 | | June 10, 2021 | | June 25, 2021 | | 1.13 | | | 278 | |
| July 20, 2021 | | September 10, 2021 | | September 24, 2021 | | 1.13 | | | 276 | |
| October 19, 2021 | | December 3, 2021 | | December 21, 2021 | | 1.13 | | | 273 | |
On January 26, 2021,24, 2023, our Audit Committee declared a quarterly cash dividend to shareholders of $1.13$1.48 per share on the outstanding shares of our common stock. This quarterly dividend is payable on March 25, 202124, 2023 to the shareholders of record as of March 10, 2021.2023.
Under our Board of Directors’ authorization, we maintain a common stock repurchase program. On January 26, 2021, our Audit Committee, pursuant to authorization granted by the Board of Directors, authorized a $5,000 increase to our common stock repurchase program. On January 24, 2023, our Audit Committee, pursuant to authorization granted by the Board of Directors, authorized a $5,000 increase to our common stock repurchase program. No duration has been placed on our common stock repurchase program, and we reserve the right to discontinue the program at any time. We intend to utilize this authorization over a multi-year period, subject to market and industry conditions. Repurchases may be made from time to time at prevailing market prices, subject to certain restrictions on volume, pricing and timing. The repurchases are effectedaffected from time to time in the open market, through negotiated transactions, including accelerated share repurchase agreements, and through plans designed to comply with Rule 10b5-1 under the Securities Exchange Act of 1934, as amended. Our stock repurchase program is discretionary, as we are under no obligation to repurchase shares. We repurchase shares under the program when we believe it is a prudent use of capital. The excess cost of the repurchased shares over par value is charged on a pro rata basis to additional paid-in capital and retained earnings. We temporarily suspended our share repurchase program in March 2020 as a precautionary measure in light of the COVID-19 pandemic, but resumed the program in late June 2020 after market conditions improved.
A summary of common stock repurchases for the years ended December 31, 20202022 and 20192021 is as follows:
| | | | | Years Ended December 31 | | | | Years Ended December 31 |
| | | 2020 | | 2019 | | 2022 | | 2021 |
| Shares repurchased | Shares repurchased | | | 9.4 | | | 6.3 | | Shares repurchased | | 4.8 | | | 5.1 | |
| Average price per share | Average price per share | | | $ | 286.35 | | | $ | 268.65 | | Average price per share | | | $ | 478.99 | | | $ | 371.46 | |
| Aggregate cost | Aggregate cost | | | $ | 2,700 | | | $ | 1,701 | | Aggregate cost | | | $ | 2,316 | | | $ | 1,900 | |
| Authorization remaining at end of year | Authorization remaining at end of year | | | $ | 1,092 | | | $ | 3,792 | | Authorization remaining at end of year | | | $ | 1,876 | | | $ | 4,192 | |
We expect to utilize the remaining authorized amount over a multi-year period, subject to market and industry conditions.
For additional information regarding the use of capital for debt security repurchases, see Note 13, “Debt.”
Anthem,Elevance Health, Inc.
Notes to Consolidated Financial Statements (continued)
16. Accumulated Other Comprehensive (Loss) Income
A reconciliation of the components of accumulated other comprehensive (loss) income (loss) at December 31, 20202022, 2021, and 20192020 is as follows:
| | | | | | | | | | | |
| 2020 | | 2019 |
| Investments: | | | |
| Gross unrealized gains | $ | 1,316 | | | $ | 720 | |
| Gross unrealized losses | (65) | | | (44) | |
| Net pretax unrealized gains | 1,251 | | | 676 | |
| Deferred tax liability | (302) | | | (155) | |
| Net unrealized gains on investments | 949 | | | 521 | |
| Non-credit components of impairments on investments: | | | |
| Gross unrealized losses | (3) | | | (3) | |
| Deferred tax asset | 1 | | | 1 | |
| Net unrealized non-credit component of impairments on investments | (2) | | | (2) | |
| Cash flow hedges: | | | |
| Gross unrealized losses | (316) | | | (331) | |
| Deferred tax asset | 66 | | | 69 | |
| Net unrealized losses on cash flow hedges | (250) | | | (262) | |
| Defined benefit pension plans: | | | |
| Deferred net actuarial loss | (749) | | | (734) | |
| Deferred prior service cost | 0 | | | (1) | |
| Deferred tax asset | 190 | | | 188 | |
| Net unrecognized periodic benefit costs for defined benefit pension plans | (559) | | | (547) | |
| Postretirement benefit plans: | | | |
| Deferred net actuarial loss | (3) | | | (25) | |
| Deferred prior service credits | 12 | | | 19 | |
| Deferred tax (liability) asset | (2) | | | 2 | |
| Net unrecognized periodic benefit credit (costs) for postretirement benefit plans | 7 | | | (4) | |
| Foreign currency translation adjustments: | | | |
| Gross unrealized gains (losses) | 6 | | | (3) | |
| Deferred tax (liability) asset | (1) | | | 1 | |
| Net unrealized gains (losses) on foreign currency translation adjustments | 5 | | | (2) | |
| Accumulated other comprehensive income (loss) | $ | 150 | | | $ | (296) | |
| | | | | | | | | | | | | | | | | |
| 2022 | | 2021 | | 2020 |
| Net unrealized investment gains: | | | | | |
| Beginning of year balance | $ | 492 | | | $ | 949 | | | $ | 521 | |
| Other comprehensive (loss) income before reclassifications, net of tax benefit (expense) of $926, $121, and $(160), respectively | (2,614) | | | (357) | | | 478 | |
| Amounts reclassified from accumulated other comprehensive income, net of tax benefit (expense) of $(94), $27, and $(13), respectively | 354 | | | (100) | | | (50) | |
| Other comprehensive (loss) income | (2,260) | | | (457) | | | 428 | |
| End of year balance | (1,768) | | | 492 | | | 949 | |
| | | | | |
| Non-credit components of impairments on investments: | | | | | |
| Beginning of year balance | — | | | (2) | | | (2) | |
| Other comprehensive income, net of tax (expense) benefit of $0, $(1),and $0, respectively | (3) | | | 2 | | | — | |
| End of year balance | (3) | | | — | | | (2) | |
| | | | | |
| Net cash flow hedges: | | | | | |
| Beginning of year balance | (239) | | | (250) | | | (262) | |
| Other comprehensive income, net of tax expense of $(6), $(3), and $(3), respectively | 10 | | | 11 | | | 12 | |
| End of year balance | (229) | | | (239) | | | (250) | |
| | | | | |
| Pension and other postretirement benefits: | | | | | |
| Beginning of year balance | (429) | | | (552) | | | (551) | |
| Other comprehensive income (loss), net of tax expense of $(23), $(36), and $(2), respectively | (70) | | | 123 | | | (1) | |
| End of year balance | (499) | | | (429) | | | (552) | |
| | | | | |
| Foreign currency translation adjustments: | | | | | |
| Beginning of year balance | (4) | | | 5 | | | (2) | |
| Other comprehensive (loss) income, net of tax benefit (expense) of $6, $2, and $(2) | (13) | | | (9) | | | 7 | |
| End of year balance | (17) | | | (4) | | | 5 | |
| | | | | |
| Total: | | | | | |
| Total beginning of year accumulated other comprehensive (loss) income | (178) | | | 150 | | | (296) | |
| Total other comprehensive (loss) income, net of tax benefit (expense) of $809, $110, and $(154), respectively | (2,336) | | | (330) | | | 446 | |
| Total other comprehensive loss attributable to noncontrolling interests, net of tax (expense) benefit of $(3), $1, and $0, respectively | 11 | | | 2 | | | — | |
| Total end of year accumulated other comprehensive (loss) income | $ | (2,503) | | | $ | (178) | | | $ | 150 | |
Anthem,Elevance Health, Inc.
Notes to Consolidated Financial Statements (continued)
Other comprehensive income (loss) reclassification adjustments for the years ended December 31, 2020, 2019 and 2018 are as follows:
| | | | | | | | | | | | | | | | | |
| 2020 | | 2019 | | 2018 |
| Investments: | | | | | |
| Net holding gain (loss) on investment securities arising during the period, net of tax (expense) benefit of $(160), $(198), and $133, respectively | $ | 478 | | | $ | 695 | | | $ | (465) | |
| Reclassification adjustment for net realized (gain) loss on investment securities, net of tax expense (benefit) of $13, $4, and $(13), respectively | (50) | | | (15) | | | 47 | |
| Total reclassification adjustment on investments | 428 | | | 680 | | | (418) | |
| Non-credit component of impairments on investments: | | | | | |
| Non-credit component of impairments on investments, net of tax benefit of $0, $0, and $1, respectively | 0 | | | 0 | | | (2) | |
| Cash flow hedges: | | | | | |
| Holding gain (loss), net of tax (expense) benefit of $(3), $4, and $(10), respectively | 12 | | | (16) | | | 37 | |
| Other: | | | | | |
| Net change in unrecognized periodic benefit costs for defined benefit pension and postretirement benefit plans, net of tax (expense) benefit of $(2), $(9), and $29, respectively | (1) | | | 26 | | | (90) | |
| Foreign currency translation adjustment, net of tax expense of $2, $0, and $0, respectively | 7 | | | 0 | | | (1) | |
| Net gain (loss) recognized in other comprehensive income (loss), net of tax (expense) benefit of $(154), $(199), and $140, respectively | $ | 446 | | | $ | 690 | | | $ | (474) | |
17. Reinsurance
We reinsure certain risks with other companies and assume risk from other companies. We remain primarily liable to policyholders under ceded insurance contracts and are contingently liable for amounts recoverable from reinsurers in the event that such reinsurers do not meet their contractual obligations.
A summary of direct, assumed and ceded premiums written and earned for the years ended December 31, 2020, 20192022, 2021 and 20182020 is as follows:
| | | | 2020 | | 2019 | | 2018 | |
| Written | | Earned | | Written | | Earned | | Written | | Earned | | | 2022 | | | 2021 | | | 2020 |
| Direct | Direct | $ | 102,479 | | | $ | 100,832 | | | $ | 91,579 | | | $ | 91,131 | | | $ | 83,652 | | | $ | 84,030 | | Direct | | $ | 128,867 | | | $ | 113,149 | | | $ | 100,832 |
| Assumed | Assumed | 3,326 | | | 3,356 | | | 3,196 | | | 3,087 | | | 1,447 | | | 1,442 | | Assumed | | 4,426 | | | 4,298 | | | 3,356 |
| Ceded | Ceded | (79) | | | (79) | | | (45) | | | (45) | | | (51) | | | (51) | | Ceded | | (64) | | | (74) | | | (79) |
| Net premiums | Net premiums | $ | 105,726 | | | $ | 104,109 | | | $ | 94,730 | | | $ | 94,173 | | | $ | 85,048 | | | $ | 85,421 | | Net premiums | | $ | 133,229 | | | $ | 117,373 | | | $ | 104,109 |
| Percentage—assumed to net premiums | Percentage—assumed to net premiums | 3.1 | % | | 3.2 | % | | 3.4 | % | | 3.3 | % | | 1.7 | % | | 1.7 | % | Percentage—assumed to net premiums | | 3.3 | % | | | 3.7 | % | | | 3.2 | % |
The table above includes certain reclassificationsdifference between directwritten premiums and assumedearned premiums for 2019 and 2018. These reclassifications did not impact any amountsis immaterial in each of the years presented in the consolidated financial statements.
Anthem, Inc.
Notes to Consolidated Financial Statements (continued)
above.A summary of net premiums written and earned by segment (see Note 20, “Segment Information”) for the years ended December 31, 2020, 20192022, 2021 and 20182020 is as follows:
| | | | 2020 | | 2019 | | 2018 | |
| Written | | Earned | | Written | | Earned | | Written | | Earned | | | 2022 | | | 2021 | | | 2020 |
| Reportable segments: | Reportable segments: | | | | | | | | | | | | Reportable segments: | | | | | | | | |
| Commercial & Specialty Business | Commercial & Specialty Business | $ | 31,745 | | | $ | 31,471 | | | $ | 32,113 | | | $ | 31,944 | | | $ | 30,661 | | | $ | 30,532 | | Commercial & Specialty Business | | $ | 35,633 | | | | $ | 33,209 | | | | $ | 31,471 | |
| Government Business | Government Business | 72,308 | | | 71,188 | | | 62,617 | | | 62,229 | | | 54,387 | | | 54,889 | | Government Business | | 96,323 | | | | 82,520 | | | | 71,188 | |
| Other | Other | 1,673 | | | 1,450 | | | — | | | — | | | — | | | — | | Other | | 1,273 | | | | 1,644 | | | | 1,450 | |
| Net premiums | Net premiums | $ | 105,726 | | | $ | 104,109 | | | $ | 94,730 | | | $ | 94,173 | | | $ | 85,048 | | | $ | 85,421 | | Net premiums | | $ | 133,229 | | | | $ | 117,373 | | | | $ | 104,109 | |
The effect of reinsurance on benefit expense for the years ended December 31, 2020, 20192022, 2021 and 20182020 is as follows:
| | | | | | | | | | | | | | | | | |
| 2020 | | 2019 | | 2018 |
| Direct | $ | 85,168 | | | $ | 79,110 | | | $ | 70,789 | |
| Assumed | 2,967 | | | 2,733 | | | 1,179 | |
| Ceded | (90) | | | (57) | | | (73) | |
| Net benefit expense | $ | 88,045 | | | $ | 81,786 | | | $ | 71,895 | |
The effect of reinsurance on certain assets and liabilities at December 31, 2020 and 2019 is as follows:
| | | | | | | | | | | |
| 2020 | | 2019 |
| Policy liabilities, assumed | $ | 490 | | | $ | 471 | |
| Unearned income, assumed | 85 | | | 114 | |
| Premiums payable, ceded | 12 | | | 11 | |
| Premiums receivable, assumed | 347 | | | 324 | |
| | | | | | | | | | | | | | | | | |
| 2022 | | 2021 | | 2020 |
| Direct | $ | 112,809 | | | $ | 99,007 | | | $ | 85,168 | |
| Assumed | 3,730 | | | 3,719 | | | 2,967 | |
| Ceded | (52) | | | (81) | | | (90) | |
| Net benefit expense | $ | 116,487 | | | $ | 102,645 | | | $ | 88,045 | |
18. Leases
We lease office space and certain computer and related equipment using noncancelable operating leases. Our leases have remaining lease terms of 1 year to 1412 years.
The information related to our leases is as follows:
| | | | | | | | | | | | | | | | | |
| Balance Sheet Location | | December 31, 2020 | | December 31, 2019 |
| Operating Leases | | | | | |
| Right-of-use assets | Other noncurrent assets | | $ | 646 | | | $ | 575 | |
| Lease liabilities, current | Other current liabilities | | 110 | | | 158 | |
| Lease liabilities, noncurrent | Other noncurrent liabilities | | 847 | | | 482 | |
| | | | | | | | | | | | | | | | | | |
| | | | Years Ended December 31 |
| | | | 2020 | | 2019 |
| Lease Expense | | | | | |
| Operating lease expense | | | $ | 438 | | $ | 198 | |
| Short-term lease expense | | | 50 | | 46 | |
| Sublease income | | | (9) | | (16) | |
| Total lease expense | | | $ | 479 | | $ | 228 | |
| | | | | | |
| | | | | |
| | | | | |
| | | | | |
| | | | | |
| | | | | |
Lease expense for 2018 was $207. | | | | | | | | | | | | | | | | | |
| Balance Sheet Location | | December 31, 2022 | | December 31, 2021 |
| Operating Leases | | | | | |
| ROU assets | Other noncurrent assets | | $ | 604 | | | $ | 628 | |
| Lease liabilities, current | Other current liabilities | | 181 | | | 133 | |
| Lease liabilities, noncurrent | Other noncurrent liabilities | | 751 | | | 864 | |
Anthem,Elevance Health, Inc.
Notes to Consolidated Financial Statements (continued)
| | | | | | | | | | | | | | | | | |
| Years Ended December 31 |
| 2022 | | 2021 | | 2020 |
| Lease Expense | | | | | |
| Operating lease expense | $ | 143 | | $ | 261 | | | $ | 438 | |
| Short-term and variable lease expense | 35 | | 45 | | | 50 | |
| Sublease income | (3) | | (4) | | | (9) | |
| Total lease expense | $ | 175 | | $ | 302 | | | $ | 479 | |
| | | | | |
| | | | | |
| | | | | |
| | | | | |
| | | | | |
| | | | | |
Our activities as disclosed in Note 4, “Business Optimization Initiatives”,Initiatives,” include reducing our office space footprint. As a result, we performed an interim impairment test during the years ended December 31, 2022, 2021 and 2020, and recorded an impairment chargecharges of $34, $136 and $258, respectively, for affected right-of-useimpairment and abandonment of ROU assets in 2020 which isare included in the operating lease expense shown above.
| | | | | Years Ended December 31 | | | | Years Ended December 31 |
| | | | 2020 | | 2019 | | | | 2022 | | 2021 |
| | | Other information | Other information | | | | | | Other information | | | | | |
| Operating cash paid for amounts included in the measurement of lease liabilities, operating leases | Operating cash paid for amounts included in the measurement of lease liabilities, operating leases | | | $ | 207 | | $ | 176 | Operating cash paid for amounts included in the measurement of lease liabilities, operating leases | | | $ | 204 | | $ | 198 |
| Right-of-use assets obtained in exchange for new lease liabilities, operating leases | | | $ | 384 | | $ | 112 | |
| ROU assets obtained in exchange for new lease liabilities, operating leases | | ROU assets obtained in exchange for new lease liabilities, operating leases | | | $ | 113 | | $ | 334 |
| Weighted average remaining lease term in years, operating leases | Weighted average remaining lease term in years, operating leases | | | 7 | | 6 | Weighted average remaining lease term in years, operating leases | | | 7 | | 7 |
| Weighted average discount rate, operating leases | Weighted average discount rate, operating leases | | | 3.21 | % | | 4.09 | % | Weighted average discount rate, operating leases | | | 2.98 | % | | 2.69 | % |
At December 31, 2020,2022, future lease payments for noncancelable operating leases with initial or remaining terms of one year or more are as follows:
| | | | | |
| 2021 | $ | 197 | |
| 2022 | 180 | |
| 2023 | 156 | |
| 2024 | 125 | |
| 2025 | 88 | |
| Thereafter | 236 | |
| Total future minimum payments | $ | 982 | |
| Less imputed interest | (25) | |
| Total lease liabilities | $ | 957 | |
As of December 31, 2020, we have additional operating leases for building spaces that have not yet commenced, and some building spaces are being constructed by the lessors and their agents. These leases have terms of up to 12 years and are expected to commence on various dates during 2021 when the construction is complete and we take possession of the buildings. The undiscounted lease payments for these leases, which are not included in the tables above, aggregate $139. | | | | | |
| 2023 | $ | 206 | |
| 2024 | 179 | |
| 2025 | 145 | |
| 2026 | 111 | |
| 2027 | 77 | |
| Thereafter | 310 | |
| Total future minimum payments | 1,028 | |
| Less imputed interest | (96) | |
| Total lease liabilities | $ | 932 | |
19. Earnings per Share
The denominator for basic and diluted earnings per share at December 31, 2020, 20192022, 2021 and 20182020 is as follows:
| | | 2020 | | 2019 | | 2018 | | 2022 | | 2021 | | 2020 |
| Denominator for basic earnings per share—weighted-average shares | Denominator for basic earnings per share—weighted-average shares | 250.8 | | | 255.5 | | | 258.1 | | Denominator for basic earnings per share—weighted-average shares | 240.0 | | | 243.8 | | | 250.8 | |
| Effect of dilutive securities—employee stock options, non-vested restricted stock awards, convertible debentures and equity units | Effect of dilutive securities—employee stock options, non-vested restricted stock awards, convertible debentures and equity units | 3.5 | | | 4.8 | | | 6.1 | | Effect of dilutive securities—employee stock options, non-vested restricted stock awards, convertible debentures and equity units | 2.8 | | | 3.0 | | | 3.5 | |
| Denominator for diluted earnings per share | Denominator for diluted earnings per share | 254.3 | | | 260.3 | | | 264.2 | | Denominator for diluted earnings per share | 242.8 | | | 246.8 | | | 254.3 | |
During the years ended December 31, 2020, 20192022, 2021 and 2018,2020, weighted-average shares related to certain stock options of 1.2, 0.60.4, 0.2 and 0.3,1.2, respectively, were excluded from the denominator for diluted earnings per share because the stock options were anti-dilutive. The Equity Unit purchase contracts were settled in May 2018, and approximately 6.0 shares of our common stock were issued and included in the basic earnings per share calculation.
Elevance Health, Inc.
Notes to Consolidated Financial Statements (continued)
During the years ended December 31, 2020, 20192022, 2021 and 2018,2020, we issued approximately 0.2, 0.3 0.2 and 0.3 restricted stock units, respectively, of which vesting was contingent upon us meeting certain earnings targets. Contingent restricted stock units are excluded from the denominator for diluted earnings per share and are included only if and when the contingency is met. The 2022 contingent restricted stock units are being measured over the three year period of 2022 through 2024, the 2021 contingent restricted stock units are being measured over the three year period of 2021 through 2023 and the 2020 contingent restricted stock units are being measured over the three year period of 2020 through 2022, the 2019 contingent restricted stock units are being measured over the three year period of 2019 through 2021 and the 2018 contingent restricted stock units are being measured over the three year period of 2018 through 2020.2022. Contingent restricted stock units generally vest in March of the year following each measurement period.
Anthem, Inc.
Notes to Consolidated Financial Statements (continued)
20. Segment Information
Beginning in 2020, IngenioRx meets the quantitative threshold for a reportable segment based on the FASB guidance. The results ofThrough December 31, 2022, we managed and presented our operations are now described through 4four reportable segments: Commercial & Specialty Business, Government Business, IngenioRxCarelonRx (formerly known as IngenioRx) and Other.
Our Commercial & Specialty Business segment includesoffers plans and services to our LocalIndividual, Group National Accounts, Individualrisk-based, Group fee-based and Specialty businesses. Business units in theBlueCard® members. The Commercial & Specialty Business segment offer fully-insuredoffers health products; provideproducts on a full-risk basis; provides a broad array of administrative managed care services to self-funded customers including claims processing, stop loss insurance, provider network access, medical cost management, disease management, wellness programs, underwriting, actuarial servicesour fee-based customers; and other administrative services; and provide an arrayprovides a variety of specialty and other insurance products and services such as dental, vision, life, disability and disabilitysupplemental health insurance benefits.
Our Government Business segment includes our Medicare and Medicaid businesses, National Government Services (“NGS”) and services provided to the federal government in connection with the FEHB program. Our Medicare business includes services such as Medicare Supplement plans; Medicare Advantage, including Special Needs Plans; Medicare Part D; and dual-eligible programs through Medicare-Medicaid Plans. Medicare Advantage membership also includes Medicare Advantage members in our Group Retiree Solutions business who are related to National Accounts, retired members of Local Group accounts, or retired members of groups who are not affiliated with our Commercial accounts who have selected a Medicare Advantage product through us. Our Medicaid business includes our managed care alternatives through publicly funded healthcare programs, including Medicaid, ACA-related Medicaid expansion programs, Temporary Assistance for Needy Families programs, programs for seniors and people with disabilities, Children’s Health Insurance Programs, and specialty programs such as those focused on long-term services and support, HIV/AIDS, foster care, behavioral health and/or substance abuse disorders, and intellectual disabilities or developmental disabilities. NGS acts as a Medicare contractor for the federal government in several regions across the nation.business.
Our IngenioRxCarelonRx segment includes our PBM business, which began its operations during the second quarter of 2019. IngenioRxbusiness. CarelonRx markets and offers PBM services to our affiliated health plan customers, as well as to external customers outside of the health plans we own. IngenioRxCarelonRx has a comprehensive PBM services portfolio, which includes services such as formulary management, pharmacy networks, prescription drug database, member services and mail order capabilities. In 2019, IngenioRx was included in our Other reportable segment. Amounts for 2019 have been reclassified to conform to the current year presentation for comparability.
Our Other segment includes our Diversified Business Group, (“DBG”),now known as Carelon Services, which is our integrated health services business focused on lowering the cost and improving the quality of healthcare by enabling and creating new care delivery and payment models, with a special emphasis on serving those with complex and chronic conditions. This segment also includes certain eliminations and corporate expenses not allocated to our other reportable segments. Also,
As discussed in Note 1 “Organization”, we will be organizing our brand portfolio into three core go-to-market brands over the next several years. As we continue our journey to evolve our business from a traditional health insurance company into a lifetime, trusted health partner, we are evaluating and making changes to how we manage our business. This included a review of the products in each of our operating segments, which resulted in restructurings between some of our operating segments. Therefore, our reportable segment presentation in 2023 and its composition will reflect how we began managing our operations and monitoring performance, aligning strategies and allocating resources on January 1, 2023. As a result of these changes, beginning with our Quarterly Report on February 28, 2020,Form 10-Q for the first quarter of 2023, we will report our results in the following four reportable segments: (i) Health Benefits, which will combine our existing Commercial & Specialty Business and Government Business segments; (ii) our existing CarelonRx segment; (iii) Carelon Services (our former Diversified Business Group), which will be carved out from our existing Other segment; and (iv) Corporate and Other, which will include businesses that do not individually meet the quantitative thresholds for an operating segment, includes Beacon.as well as corporate expenses not allocated to our other reportable segments. We expect to reclassify previously reported information to conform to the new presentation.
We define operating revenues to include premium income, product revenue and administrative fees and other revenues. Operating revenues are derived from premiums and fees received, primarily from the sale and administration of health benefit products.and pharmacy products and services. Operating gain is calculated as total operating revenue less benefit expense, cost of products sold and selling, general and administrative expense.
Affiliated revenues represent revenues or costs for services provided to our subsidiaries by CarelonRx and Carelon Services, as well as certain back-office services provided by our international businesses, and are recorded at cost or management’s estimate of fair market value. These affiliated revenues are eliminated in consolidation. For segment reporting, we present all capitation risk arrangements on a gross basis; therefore, eliminations also include adjustments for capitated risk arrangements that are recognized on a net basis under GAAP.
Elevance Health, Inc.
Notes to Consolidated Financial Statements (continued)
Through our participation in various federal government programs, we generated approximately 20.3%, 20.7% and 19.8%28% of our total consolidated revenues from agencies of the U.S. government for each of the years ended December 31, 2020, 2019,2022, 2021, and 2018, respectively. These2020. The majority of these revenues are contained in theour Government Business segment. An immaterial amount of our total consolidated revenues is derived from activities outside of the U.S. and Puerto Rico.
The accounting policies of the segments are consistent with those described in the summary of significant accounting policies in Note 2, “Basis of Presentation and Significant Accounting Policies,” except that certain shared administrative expenses for each segmentall capitation risk arrangements are recognizedreported on a pro rata allocatedgross basis which in the aggregate approximates the consolidated expense. Any difference between the allocated expenses and actual consolidated expense iswith an adjustment included in other expenses not allocated to reportable segments. Affiliated revenues represent revenues or costeliminations for services provided by IngenioRx and DBG to our subsidiaries,capitated risk arrangements that are recorded at cost or management’s estimate of fair market value, and are eliminated in consolidation.presented on a net basis under GAAP. We evaluate performance of the reportable segments based on operating gain or loss as defined above. We evaluate net investment income, net realized gains (losses) on financial instruments, interest expense, amortization expense, gain or loss on extinguishment of debt, income taxes and assets and liabilities on a consolidated basis, as these items are managed in a corporate shared service environment and are not the responsibility of segment operating management.
Anthem, Inc.
Notes to Consolidated Financial Statements (continued)
For our 2019 segment reporting, operating gain generated from IngenioRx activities were allocated and included in our Commercial & Specialty Business and Government Business based upon their utilization of those services, which aligns with the method by which we assessed the 2019 operating performance of our reportable segments. Beginning January 1, 2020, we are managing the operating performance of each of our segments on a standalone basis. Prior year 2019 allocations were not restated to conform to the 2020 presentation; however, operating margins for IngenioRx were approximately 8% in 2019.
Financial data by reportable segment for the years ended December 31, 2020, 20192022, 2021 and 20182020 is as follows:
| | | Commercial & Specialty Business | | Government Business | | IngenioRx | | Other | | Eliminations | | Total | | Commercial & Specialty Business | | Government Business | | CarelonRx | | Other | | Eliminations | | Total |
| Year ended December 31, 2022 | | Year ended December 31, 2022 | | | | | | | | | |
| Operating revenue - unaffiliated | | Operating revenue - unaffiliated | $ | 41,674 | | | $ | 96,810 | | | 14,974 | | | $ | 2,202 | | | $ | — | | | $ | 155,660 | |
| Operating revenue - affiliated | | Operating revenue - affiliated | — | | | — | | | 13,552 | | | 11,092 | | | (24,644) | | | — | |
| Operating gain | | Operating gain | 2,933 | | | 3,297 | | | 1,868 | | | 354 | | | — | | | 8,452 | |
| Depreciation and amortization of property and equipment | | Depreciation and amortization of property and equipment | — | | | — | | | — | | | 784 | | | — | | | 784 | |
| Year ended December 31, 2021 | | Year ended December 31, 2021 | |
| Operating revenue - unaffiliated | | Operating revenue - unaffiliated | $ | 38,809 | | | $ | 82,919 | | | 12,655 | | | $ | 2,560 | | | $ | — | | | $ | 136,943 | |
| Operating revenue - affiliated | | Operating revenue - affiliated | — | | | — | | | 12,776 | | | 7,690 | | | (20,466) | | | — | |
| Operating gain (loss) | | Operating gain (loss) | 2,753 | | | 3,061 | | | 1,684 | | | (9) | | | — | | | 7,489 | |
| Depreciation and amortization of property and equipment | | Depreciation and amortization of property and equipment | — | | | — | | | — | | | 668 | | | — | | | 668 | |
| Year ended December 31, 2020 | Year ended December 31, 2020 | | | | | | | | | | Year ended December 31, 2020 | |
| Operating revenue - unaffiliated | Operating revenue - unaffiliated | $ | 36,699 | | | $ | 71,572 | | | 10,384 | | | $ | 2,153 | | | $ | — | | | $ | 120,808 | | Operating revenue - unaffiliated | $ | 36,699 | | | $ | 71,572 | | | 10,384 | | | $ | 2,153 | | | $ | — | | | $ | 120,808 | |
| Operating revenue - affiliated | Operating revenue - affiliated | — | | | — | | | 11,527 | | | 3,904 | | | (15,431) | | | — | | Operating revenue - affiliated | — | | | — | | | 11,527 | | | 3,904 | | | (15,431) | | | — | |
| Operating gain (loss) | Operating gain (loss) | 2,681 | | | 2,444 | | | 1,361 | | | (126) | | | — | | | 6,360 | | Operating gain (loss) | 2,681 | | | 2,444 | | | 1,361 | | | (126) | | | — | | | 6,360 | |
| Depreciation and amortization of property and equipment | Depreciation and amortization of property and equipment | 0 | | | 0 | | | — | | | 638 | | | — | | | 638 | | Depreciation and amortization of property and equipment | — | | | — | | | — | | | 638 | | | — | | | 638 | |
| Year ended December 31, 2019 | | |
| Operating revenue - unaffiliated | $ | 37,421 | | | $ | 62,632 | | | 2,007 | | | $ | 1,081 | | | $ | — | | | $ | 103,141 | | |
| Operating revenue - affiliated | — | | | — | | | 3,395 | | | 1,212 | | | (4,607) | | | — | | |
| Operating gain (loss) | 4,032 | | | 2,056 | | | — | | | (89) | | | — | | | 5,999 | | |
| Depreciation and amortization of property and equipment | 0 | | | 0 | | | — | | | 675 | | | — | | | 675 | | |
| Year ended December 31, 2018 | | |
| Operating revenue - unaffiliated | $ | 35,782 | | | $ | 55,348 | | | — | | | $ | 211 | | | $ | — | | | $ | 91,341 | | |
| Operating revenue - affiliated | — | | | — | | | — | | | 1,308 | | | (1,308) | | | — | | |
| Operating gain (loss) | 3,600 | | | 1,928 | | | — | | | (102) | | | — | | | 5,426 | | |
| Depreciation and amortization of property and equipment | 0 | | | 0 | | | — | | | 652 | | | — | | | 652 | | |
Anthem,Elevance Health, Inc.
Notes to Consolidated Financial Statements (continued)
The major product revenues for each of the reportable segments for the years ended December 31, 2020, 20192022, 2021 and 20182020 are as follows:
| | | 2020 | | 2019 | | 2018 | | 2022 | | 2021 | | 2020 |
| Commercial & Specialty Business | Commercial & Specialty Business | | | | | | Commercial & Specialty Business | | | | | |
| Managed care products | Managed care products | $ | 29,815 | | | $ | 30,311 | | | $ | 29,012 | | Managed care products | $ | 33,927 | | | $ | 31,564 | | | $ | 29,815 | |
| Managed care services | Managed care services | 5,296 | | | 5,451 | | | 5,218 | | Managed care services | 6,152 | | | 5,711 | | | 5,296 | |
| Dental/Vision products and services | Dental/Vision products and services | 1,231 | | | 1,302 | | | 1,220 | | Dental/Vision products and services | 1,434 | | | 1,363 | | | 1,231 | |
| Other | Other | 357 | | | 357 | | | 332 | | Other | 161 | | | 171 | | | 357 | |
| Total Commercial & Specialty Business | Total Commercial & Specialty Business | 36,699 | | | 37,421 | | | 35,782 | | Total Commercial & Specialty Business | 41,674 | | | 38,809 | | | 36,699 | |
| Government Business | Government Business | | Government Business | |
| Managed care products | Managed care products | 71,188 | | | 62,229 | | | 54,889 | | Managed care products | 96,322 | | | 82,519 | | | 71,188 | |
| Managed care services | Managed care services | 384 | | | 403 | | | 459 | | Managed care services | 488 | | | 400 | | | 384 | |
| Total Government Business | Total Government Business | 71,572 | | | 62,632 | | | 55,348 | | Total Government Business | 96,810 | | | 82,919 | | | 71,572 | |
| IngenioRx | | |
| CarelonRx | | CarelonRx | |
| Pharmacy products and services | Pharmacy products and services | 21,911 | | | 5,402 | | | 0 | | Pharmacy products and services | 28,526 | | | 25,431 | | | 21,911 | |
| Other | Other | | Other | |
| Integrated health services | Integrated health services | 5,787 | | | 2,149 | | | 1,489 | | Integrated health services | 12,274 | | | 9,645 | | | 5,787 | |
| Other | Other | 270 | | | 144 | | | 30 | | Other | 1,020 | | | 605 | | | 270 | |
| Total Other Business | Total Other Business | 6,057 | | | 2,293 | | | 1,519 | | Total Other Business | 13,294 | | | 10,250 | | | 6,057 | |
| Eliminations | Eliminations | | Eliminations | |
| Eliminations | Eliminations | (15,431) | | | (4,607) | | | (1,308) | | Eliminations | (24,644) | | | (20,466) | | | (15,431) | |
| Total product revenues | Total product revenues | $ | 120,808 | | | $ | 103,141 | | | $ | 91,341 | | Total product revenues | $ | 155,660 | | | $ | 136,943 | | | $ | 120,808 | |
The classification between managed care products and managed care services in the above table primarily distinguishes between the levels of risk assumed. Managed care products represent insurance products where we bear the insurance risk, whereas managed care services represent fee-based product offerings where we provide claims adjudication and other administrative services to the customer, but the customer principally bears the insurance risk.
Asset, liability and equity details by reportable segment have not been disclosed, as we do not internally report such information.
A reconciliation of reportable segments’ operating revenue to the amounts of total revenues included in our consolidated statements of income for the years ended December 31, 2020, 20192022, 2021 and 20182020 is as follows:
| | | 2020 | | 2019 | | 2018 | | 2022 | | 2021 | | 2020 |
| Reportable segments operating revenues | $ | 120,808 | | | $ | 103,141 | | | $ | 91,341 | | |
| Reportable segments’ operating revenues | | Reportable segments’ operating revenues | $ | 155,660 | | | $ | 136,943 | | | $ | 120,808 | |
| Net investment income | Net investment income | 877 | | | 1,005 | | | 970 | | Net investment income | 1,485 | | | 1,378 | | | 877 | |
| Net realized gains (losses) on financial instruments | 182 | | | 67 | | | (206) | | |
| Net (losses) gains on financial instruments | | Net (losses) gains on financial instruments | (550) | | | 318 | | | 182 | |
| Total revenues | Total revenues | $ | 121,867 | | | $ | 104,213 | | | $ | 92,105 | | Total revenues | $ | 156,595 | | | $ | 138,639 | | | $ | 121,867 | |
Anthem,Elevance Health, Inc.
Notes to Consolidated Financial Statements (continued)
A reconciliation of reportable segments’ operating gain to income before income tax expense included in our consolidated statements of income for the years ended December 31, 2020, 20192022, 2021 and 20182020 is as follows:
| | | | | | | | | | | | | | | | | |
| 2020 | | 2019 | | 2018 |
| Reportable segments operating gain | $ | 6,360 | | | $ | 5,999 | | | $ | 5,426 | |
| Net investment income | 877 | | | 1,005 | | | 970 | |
| Net realized gains (losses) on financial instruments | 182 | | | 67 | | | (206) | |
| Interest expense | (784) | | | (746) | | | (753) | |
| Amortization of other intangible assets | (361) | | | (338) | | | (358) | |
| Loss on extinguishment of debt | (36) | | | (2) | | | (11) | |
| Income before income tax expense | $ | 6,238 | | | $ | 5,985 | | | $ | 5,068 | |
| | | | | | | | | | | | | | | | | |
| 2022 | | 2021 | | 2020 |
| Income before income tax expense | $ | 7,769 | | | $ | 7,925 | | | $ | 6,238 | |
| Net investment income | (1,485) | | | (1,378) | | | (877) | |
| Net losses (gains) on financial instruments | 550 | | | (318) | | | (182) | |
| Interest expense | 851 | | | 798 | | | 784 | |
| Amortization of other intangible assets | 767 | | | 441 | | | 361 | |
| Loss on extinguishment of debt | — | | | 21 | | | 36 | |
| Reportable segments’ operating gain | $ | 8,452 | | | $ | 7,489 | | | $ | 6,360 | |
21. Related Party Transactions
We have a 19.50% equity investment in National Accounts Service Company, LLC (“NASCO”) which processes National Accounts claims and provides other administrative services for us and certain other BCBS plans. Administrative expenses incurred related to NASCO services totaled $58, $78 and $79, for the years ended December 31, 2020, 2019 and 2018, respectively. Amounts due to NASCO were $5 and $4 at December 31, 2020 and 2019, respectively.
We have an equity investment in APC Passe, LLC, which offers Medicaid products in Arkansas. During the years ended December 31, 20202022, 2021 and 2019,2020, in the normal course of business, we assumed premiums of $446$501, $462 and $408,$446, respectively, from APC Passe, LLC, which is included in our total assumed premiums (see Note 17, “Reinsurance”). Amounts due to APC Passe, LLC were $115 and $162 at December 31, 2020 and 2019, respectively.
22. Statutory Information
The majority of our insurance and HMO subsidiaries report their accounts in conformity with accounting practices prescribed or permitted by state insurance regulatory authorities, commonly referred to as statutory accounting, which vary in certain respects from GAAP. However, certain of our insurance and HMO subsidiaries, including BCC, Blue Cross of California Partnership Plan, Inc., Golden West Health Plan, Inc., Beacon Health Options of California, Inc. and CareMore Health Plan are regulated by the California Department of Managed Health Care (“DMHC”) and report their accounts in conformity with GAAP (these entities are collectively referred to as the “DMHC regulated entities”). Typical differences of GAAP reporting as compared to statutory reporting are the recognition of all assets including those that are non-admitted for statutory purposes and recognition of all deferred tax assets without regard to statutory limits. The National Association of Insurance Commissioners (“NAIC”) developed a codified version of the statutory accounting principles, designed to foster more consistency among the states for accounting guidelines and reporting. Prescribed statutory accounting practices are set forth in a variety of publications of the NAIC as well as state laws, regulations and general administrative rules.
Our ability to pay dividends and credit obligations is significantly dependent on receipt of dividends from our subsidiaries. The payment of dividends to us by our insurance and HMO subsidiaries without prior approval of the insurance departments of each subsidiary’s domiciliary jurisdiction is limited by formula. Dividends in excess of these amounts are subject to prior approval by the respective state insurance departments or the DMHC.
Our statutory basis insurance and HMO subsidiaries are subject to risk-based capital (“RBC”) requirements. RBC is a method developed by the NAIC to determine the minimum amount of statutory capital appropriate for an insurance company or HMO to support its overall business operations in consideration of its size and risk profile. The formula for determining the amount of RBC specifies various factors, weighted based on the perceived degree of risk, which are applied to certain financial balances and financial activity. Below minimum RBC requirements are classified within certain levels, each of which requires specified corrective action. Additionally, the DMHC regulated entities are subject to capital and solvency requirements as prescribed by the DMHC. As of December 31, 20202022 and 2019,2021, all of our regulated subsidiaries exceeded the minimum applicable mandatory RBC requirements and/or capital and solvency requirements of their applicable governmental regulator.
The statutory RBC necessary to satisfy regulatory requirements of our statutory basis insurance and HMO subsidiaries was approximately $5,800$7,900 and $5,500$6,962 as of December 31, 20202022 and 2019,2021, respectively. The tangible net
Anthem, Inc.
Notes to Consolidated Financial Statements (continued)
equity required for the DMHC regulated entities was approximately $600$710 and $610$690 as of December 31, 20202022 and 2019,2021, respectively.
Statutory-basis capital and surplus of our insurance and HMO subsidiaries and capital and surplus of our other regulated subsidiaries, excluding the DMHC regulated entities, was $13,717$19,048 and $13,044$16,178 at December 31, 20202022 and 2019, respectively. Statutory-basis net income of our insurance and HMO subsidiaries and net income of our other regulated subsidiaries, excluding the DMHC regulated entities, was $3,170, $3,840 and $3,412 for 2020, 2019 and 2018,2021, respectively. GAAP equity of the DMHC regulated entities was $3,851$3,795 and $3,359$3,886 at December 31, 20202022 and 2019,2021, respectively. GAAP net income
Our ability to pay dividends and credit obligations is significantly dependent on receipt of dividends from our subsidiaries. The payment of dividends to us by our insurance and HMO subsidiaries without prior approval of the DMHC regulated entities was $753, $878insurance departments of each subsidiary’s domiciliary jurisdiction is limited by formula. Dividends in excess of these amounts are subject to prior approval by the respective state insurance departments or the DMHC. During 2022, our insurance and $789 forHMO
Elevance Health, Inc.
Notes to Consolidated Financial Statements (continued)
subsidiaries paid aggregate cash dividends of $3,097 to the years ended December 31, 2020, 2019 and 2018, respectively.
23. Selected Quarterly Financial Data (Unaudited)
Selected quarterly financial data is as follows:
| | | | | | | | | | | | | | | | | | | | | | | |
| | For the Quarter Ended |
| | March 31 | | June 30 | | September 30 | | December 31 |
| 2020 | | | | | | | |
| Total revenues | $ | 29,621 | | | $ | 29,264 | | | $ | 31,158 | | | $ | 31,824 | |
| Income before income tax expense | 2,089 | | | 3,149 | | | 389 | | | 611 | |
| Net income | 1,523 | | | 2,276 | | | 222 | | | 551 | |
| | | | | | | |
| Basic net income per share | $ | 6.03 | | | $ | 9.02 | | | $ | 0.88 | | | $ | 2.23 | |
| Diluted net income per share | 5.94 | | | 8.91 | | | 0.87 | | | 2.19 | |
| | | | | | | |
| 2019 | | | | | | | |
| Total revenues | $ | 24,666 | | | $ | 25,466 | | | $ | 26,674 | | | $ | 27,407 | |
| Income before income tax expense | 1,945 | | | 1,453 | | | 1,489 | | | 1,098 | |
| Net income | 1,551 | | | 1,139 | | | 1,183 | | | 934 | |
| | | | | | | |
| Basic net income per share | $ | 6.03 | | | $ | 4.44 | | | $ | 4.64 | | | $ | 3.69 | |
| Diluted net income per share | 5.91 | | | 4.36 | | | 4.55 | | | 3.62 | |
ITEM 9. CHANGES IN AND DISAGREEMENTS WITH ACCOUNTANTS ON ACCOUNTING AND FINANCIAL DISCLOSURE.
There have been no changes in or disagreements with our independent registered public accounting firm on accounting or financial disclosures.
ITEM 9A. CONTROLS AND PROCEDURES.
Evaluation of Disclosure Controls and Procedures
We carried out an evaluation as of December 31, 2020,2022, under the supervision and with the participation of our management, including our Chief Executive Officer and Chief Financial Officer, of the effectiveness of the design and operation of our disclosure controls and procedures as defined in Rule 13a-15(e) of the Exchange Act. Based upon that evaluation, our Chief Executive Officer and Chief Financial Officer concluded that our disclosure controls and procedures are effective in timely alerting them to material information relating to us (including our consolidated subsidiaries) required to be disclosed in our reports under the Exchange Act. In addition, based on that evaluation, our Chief Executive Officer and Chief Financial Officer concluded that our disclosure controls and procedures were effective in ensuring that information required to be disclosed by us in the reports that we file or submit under the Exchange Act is accumulated and communicated to our management, including our Chief Executive Officer and Chief Financial Officer, as appropriate to allow timely decisions regarding required disclosures.
Management’s Report on Internal Control over Financial Reporting
Management, under the supervision and with the participation of the principal executive officer and principal financial officer, of Anthem,Elevance Health, Inc. (the “Company”) is responsible for establishing and maintaining effective internal control over financial reporting (“Internal Control”), as such term is defined in the Exchange Act. The Company’s Internal Control is designed to provide reasonable assurance regarding the reliability of the Company’s financial reporting and the preparation of financial statements for external reporting purposes in accordance with U.S. generally accepted accounting principles (“GAAP”).GAAP. The Company’s Internal Control includes those policies and procedures that (i) pertain to the maintenance of records that in reasonable detail accurately and fairly reflect the transactions and dispositions of the assets of the Company; (ii) provide reasonable assurance that transactions are recorded as necessary to permit preparation of financial statements in accordance with GAAP, and that receipts and expenditures of the Company are being made only in accordance with authorizations of management and directors of the Company; and (iii) provide reasonable assurance regarding prevention or timely detection of unauthorized acquisition, use or disposition of the Company’s assets that could have a material effect on the financial statements.
Because of inherent limitations in any Internal Control, no matter how well designed, misstatements due to error or fraud may occur and not be detected. Accordingly, even effective Internal Control can provide only reasonable assurance regarding the reliability of financial reporting and the preparation of financial statements for external purposes in accordance with GAAP.
Management, under the supervision and with the participation of the principal executive officer and principal financial officer, assessed the effectiveness of the Company’s Internal Control as of December 31, 2020.2022. Management’s assessment was based on criteria established in Internal Control—Integrated Framework (2013) issued by the Committee of Sponsoring Organizations of the Treadway Commission.
The Company completed its acquisition of Beacon Health Options, Inc. on February 28, 2020. As permitted by the U.S. Securities and Exchange Commission, management's assessment as of December 31, 2020 did not include the Internal Control of Beacon Health Options, Inc., which is included in the Company's consolidated financial statements as of December 31, 2020. Such operations of Beacon Health Options, Inc. constituted 3% and 6% of the Company's total assets and net assets, respectively, as of December 31, 2020, and 2% and 0% of the Company's total revenues and net income for the year then ended.
Based on management’s assessment, which excluded an assessment of Internal Control of Beacon Health Options, Inc., management has concluded that the Company’s Internal Control was effective as of December 31, 20202022 to provide reasonable assurance regarding the reliability of financial reporting and the preparation of financial statements for external reporting purposes in accordance with GAAP.
Ernst & Young LLP, the Company’s independent registered public accounting firm, has audited the consolidated financial statements of the Company for the year ended December 31, 2020,2022, and has also issued an audit report dated February 18, 2021,15, 2023, on the effectiveness of the Company’s Internal Control as of December 31, 2020,2022, which is included in this Annual Report on Form 10-K.
| | | | | | | | |
/S/ GAIL K. BOUDREAUX | | /S/ JOHN E. GALLINA |
| President and Chief Executive Officer | | Executive Vice President and Chief Financial Officer |
Changes in Internal Control Over Financial Reporting
There have been no changes in our internal control over financial reporting that occurred during the three months ended December 31, 20202022 that have materially affected, or are reasonably likely to materially affect, our internal control over financial reporting.
Report of Independent Registered Public Accounting Firm
To the Shareholders and the Board of Directors of Anthem,Elevance Health, Inc.
Opinion on Internal Control Over Financial Reporting
We have audited Anthem,Elevance Health, Inc.’s internal control over financial reporting as of December 31, 2020,2022, based on criteria established in Internal Control–Integrated Framework issued by the Committee of Sponsoring Organizations of the Treadway Commission (2013 framework) (the COSO criteria). In our opinion, Anthem,Elevance Health, Inc. (the Company) maintained, in all material respects, effective internal control over financial reporting as of December 31, 2020,2022, based on the COSO criteria.
As indicated in the accompanying Management’s Report on Internal Control Over Financial Reporting, management’s assessment of and conclusion on the effectiveness of internal control over financial reporting did not include the internal controls of Beacon Health Options, Inc., which is included in the 2020 consolidated financial statements of the Company and constituted 3% and 6% of total and net assets, respectively, as of December 31, 2020 and 2% and 0% of revenues and net income, respectively, for the year then ended. Our audit of internal control over financial reporting of the Company also did not include an evaluation of the internal control over financial reporting of Beacon Health Options, Inc.
We also have audited, in accordance with the standards of the Public Company Accounting Oversight Board (United States) (PCAOB), the consolidated balance sheets of Anthem,Elevance Health, Inc. as of December 31, 20202022 and 2019,2021, the related consolidated statements of income, comprehensive income, shareholders’ equity and cash flows for each of the three years in the period ended December 31, 2020,2022, and the related notes and financial statement schedule listed in the Index at Item 15(c) and our report dated February 18, 202115, 2023 expressed an unqualified opinion thereon.
Basis for Opinion
The Company’s management is responsible for maintaining effective internal control over financial reporting and for its assessment of the effectiveness of internal control over financial reporting included in the accompanying Management’s Report on Internal Control Over Financial Reporting. Our responsibility is to express an opinion on the Company’s internal control over financial reporting based on our audit. We are a public accounting firm registered with the PCAOB and are required to be independent with respect to the Company in accordance with the U.S. federal securities laws and the applicable rules and regulations of the Securities and Exchange Commission and the PCAOB.
We conducted our audit in accordance with the standards of the PCAOB. Those standards require that we plan and perform the audit to obtain reasonable assurance about whether effective internal control over financial reporting was maintained in all material respects.
Our audit included obtaining an understanding of internal control over financial reporting, assessing the risk that a material weakness exists, testing and evaluating the design and operating effectiveness of internal control based on the assessed risk, and performing such other procedures as we considered necessary in the circumstances. We believe that our audit provides a reasonable basis for our opinion.
Definition and Limitations of Internal Control Over Financial Reporting
A company’s internal control over financial reporting is a process designed to provide reasonable assurance regarding the reliability of financial reporting and the preparation of financial statements for external purposes in accordance with generally accepted accounting principles. A company’s internal control over financial reporting includes those policies and procedures that (1) pertain to the maintenance of records that, in reasonable detail, accurately and fairly reflect the transactions and dispositions of the assets of the company; (2) provide reasonable assurance that transactions are recorded as necessary to permit preparation of financial statements in accordance with generally accepted accounting principles, and that receipts and expenditures of the company are being made only in accordance with authorizations of management and directors of the company; and (3) provide reasonable assurance regarding prevention or timely detection of unauthorized acquisition, use, or disposition of the company’s assets that could have a material effect on the financial statements.
Because of its inherent limitations, internal control over financial reporting may not prevent or detect misstatements. Also, projections of any evaluation of effectiveness to future periods are subject to the risk that controls may become inadequate because of changes in conditions, or that the degree of compliance with the policies or procedures may deteriorate.
/s/ ERNSTErnst & YOUNGYoung LLP
Indianapolis, Indiana
February 18, 202115, 2023
ITEM 9B. OTHER INFORMATION.
None.
ITEM 9C. DISCLOSURE REGARDING FOREIGN JURISDICTIONS THAT PREVENT INSPECTIONS.
None.
PART III
ITEM 10. DIRECTORS, EXECUTIVE OFFICERS AND CORPORATE GOVERNANCE.
The information required by this Item concerning our Executive Officers is included in Part I, Item 1, “Business - Information about our Executive Officers.” The information required by this Item concerning our Directors and nominees for Director, information about our Audit Committee members and financial expert(s) and concerning, disclosure of any delinquent filers under Section 16(a) of the Exchange Act and our Code of Conduct is incorporated herein by reference from our definitive Proxy Statement for our 20212023 Annual Meeting of Shareholders, which will be filed with the SEC pursuant to Regulation 14A within 120 days after the end of our last fiscal year.
ITEM 11. EXECUTIVE COMPENSATION.
The information required by this Item concerning remuneration of our Executive Officers and Directors, material transactions involving such Executive Officers and Directors and Compensation Committee interlocks, as well as the Compensation and Talent Committee Report and the CEO Pay Ratio disclosurepay ratio are incorporated herein by reference from our definitive Proxy Statement for our 20212023 Annual Meeting of Shareholders, which will be filed with the SEC pursuant to Regulation 14A within 120 days after the end of our last fiscal year.
ITEM 12. SECURITY OWNERSHIP OF CERTAIN BENEFICIAL OWNERS AND MANAGEMENT AND RELATED STOCKHOLDER MATTERS.
Securities Authorized for Issuance under Equity Compensation Plans
Securities authorized for issuance under our equity compensation plans as of December 31, 20202022 are as follows:
| Plan Category1 | Plan Category1 | Number of securities to be issued upon exercise of outstanding options, warrants and rights2 (a) | Weighted-average exercise price of outstanding options, warrants and rights3 (b) | Number of securities remaining available for future issuance under equity compensation plans (excluding securities reflected in column (a))4 (c) | Plan Category1 | Number of securities to be issued upon exercise of outstanding options, warrants and rights2 (a) | Weighted-average exercise price of outstanding options, warrants and rights3 (b) | Number of securities remaining available for future issuance under equity compensation plans (excluding securities reflected in column (a))4 (c) |
| Equity compensation plans approved by shareholders as of December 31, 2020 | 5,367,044 | $230.00 | 24,139,655 | |
| Equity compensation plans approved by shareholders as of December 31, 2022 | | Equity compensation plans approved by shareholders as of December 31, 2022 | 4,621,939 | $293.28 | 18,352,576 |
| |
1We have no equity compensation plans pursuant to which awards may be granted in the future that have not been approved by shareholders.
2Includes shares that may be issued under the Elevance Health Incentive Compensation Plan (formerly the Anthem Incentive Compensation PlanPlan) and the Anthem 2017 Elevance Health Incentive Compensation Plan pursuant to the following outstanding awards: 3,071,7762,831,989 stock options, 625,254526,536 unvested restricted stock units, and 1,670,0141,263,414 performance stock units (assuming that the outstanding performance stock units are earned at the maximum award level).
3Represents the weighted average exercise price of outstanding stock options. Does not take into consideration outstanding restricted stock units or performance stock units, which, once vested, may be converted into shares of our common stock on a one-for-one basis upon distribution at no additional cost.
4Excludes securities reflected in the first column, “Number of securities to be issued upon exercise of outstanding options, warrants and rights”. Includes 19,498,78214,026,920 shares of common stock available for issuance as stock options, restricted stock awards, performance stock awards, performance awards and stock appreciation rights under the Anthem 2017 Elevance Health Incentive Compensation Plan at December 31, 2020.2022. Includes 4,640,8734,325,656 shares of common stock available for issuance under the Stock Purchase Plan at December 31, 2020.2022.
The information required by this Item concerning the stock ownership of management and five percent beneficial owners is incorporated herein by reference from our definitive Proxy Statement for our 20212023 Annual Meeting of Shareholders, which will be filed with the SEC pursuant to Regulation 14A within 120 days after the end of our last fiscal year.
ITEM 13. CERTAIN RELATIONSHIPS AND RELATED TRANSACTIONS, AND DIRECTOR INDEPENDENCE.
The information required by this Item concerning certain relationships and related person transactions and directorDirector independence is incorporated herein by reference from our definitive Proxy Statement for our 20212023 Annual Meeting of Shareholders, which will be filed with the SEC pursuant to Regulation 14A within 120 days after the end of our last fiscal year.
ITEM 14. PRINCIPAL ACCOUNTANT FEES AND SERVICES.
The information required by this Item concerning principal accountant fees and services is incorporated herein by reference from our definitive Proxy Statement for our 20212023 Annual Meeting of Shareholders, which will be filed with the SEC pursuant to Regulation 14A within 120 days after the end of our last fiscal year.
PART IV
ITEM 15. EXHIBITS AND FINANCIAL STATEMENT SCHEDULES.
(a) 1. Financial Statements:
The following consolidated financial statements of the Company are set forth in Part II, Item 8:
Report of Independent Registered Public Accounting Firm
Consolidated Balance Sheets as of December 31, 20202022 and 20192021
Consolidated Statements of Income for the years ended December 31, 2020, 2019,2022, 2021, and 20182020
Consolidated Statements of Comprehensive Income for the years ended December 31, 2020, 2019,2022, 2021, and 20182020
Consolidated Statements of Cash Flows for the years ended December 31, 2022, 2021 and 2020
Consolidated Statements of Shareholders’ Equity for the years ended December 31, 2020, 20192022, 2021 and 2018
Consolidated Statements of Cash Flows for the years ended December 31, 2020 2019 and 2018
Notes to Consolidated Financial Statements
2. Financial Statement Schedule:
The following financial statement schedule of the Company is included in Item 15(c):
Schedule II—Condensed Financial Information of Registrant (Parent Company Only).
All other schedules for which provision is made in the applicable accounting regulations of the SEC are not required under the related instructions, are inapplicable, or the required information is included in the consolidated financial statements, and therefore, have been omitted.
3. Exhibits required to be filed as part of this report:
| | | | | | | | | | | | | | |
Exhibit Number | | Exhibit | |
| | | | |
| 3.1 | | | |
| | | | |
| 3.2 | | | |
| | | | |
| 4.1 | | |
| | | |
4.2 | | | |
| | | | |
4.34.2 | | | |
| | | | |
| | (a) | | |
| | | | |
| | (b) | | |
| | | | |
| | (c) | |
| | |
| | (d) | |
| | | | | | | | | | | |
Exhibit
Number
| | Exhibit |
| | | |
| | |
| | (e) | |
| | |
| | (f)(d) | | |
| | | |
| | (g)(e) | | |
| | | |
| | | | | | | | | | | | | | |
Exhibit Number | | Exhibit | |
| | | | |
| | (h)(f) | | |
| | | |
| | (i)(g) | | |
| | | | |
| | (j)(h) | | |
| | | | |
| | (k)(i) | | |
| | | | |
| | (l)(j) | | |
| | | | |
4.44.3 | | | |
| | | | |
4.54.4 | | | |
| | | | |
4.64.5 | | | |
| | | | |
| | (a) | |
| | | |
| | (b) | | |
| | | | |
| | (c)(b) | | |
| | | | |
| | (d)(c) | | |
| | | | |
| | (e)(d) | | |
| | | | |
| | (f)(e) | | |
| | | | |
| | (g)(f) | | |
| | | | |
| | (h)(g) | | |
| | | | |
| | (i)(h) | |
| | | |
| | | | | | | | | | | |
Exhibit
Number
| | Exhibit |
| | | |
| | (j)(i) | | |
| | | | |
| | (k)(j) | | |
| | | | |
| | (k) | | |
| | | | |
| | (l) | | |
| | | | |
| | | | | | | | | | | | | | |
Exhibit Number | | Exhibit | |
| | | | |
| | (m) | | |
| | | | |
| | (n) | | |
| | | | |
| | (o) | | |
| | | | |
| | (p) | | |
| | | | |
| | (q) | | |
| | | | |
| | (r) | | |
| | | | |
| | (s) | | |
| | | | |
| | (t) | | |
| | | | |
| | (u) | | |
| | | | |
| | (v) | | |
| | | | |
4.74.6 | | Upon the request of the Securities and Exchange Commission, the Company will furnish copies of any other instruments defining the rights of holders of long-term debt of the Company or its subsidiaries. | |
| | | | |
4.84.7 | | | |
| | | | |
| 10.1 | * | | |
| | | | |
| | (a) | |
| | | |
| | (b) | | |
| | | | |
| | (c)
(b) | | |
| | | | |
| | (d)(c) | | |
| | | | |
| | (e)(d) | |
| | | |
| | (f) | |
| | |
| 10.2 | | * | | |
| | | |
| | (a) | | |
| | | |
| | (b) | |
| | |
| | (c) | |
| | |
| | (d) | |
| | | |
| | (e) | |
| | | |
| | | | | | | | | | | | | | |
Exhibit Number | | Exhibit | |
| | | | |
| | (f) | |
| | | |
| | (g)(c) | | |
| | | | |
| | (h)(d) | | |
| | | | |
| | (i)(e) | | |
| | | | |
| | (j)(f) | | |
| | | | |
| | (k)(g) | | |
| | | | |
| | (l)(h) | | |
| | | | |
| | (i) | | |
| | | | |
| | (j) | | |
| | | | |
| | (k) | | |
| | | | |
| | (l) | | |
| | | | |
| | (m) | | |
| | | | |
| | (n) | | |
| | | | |
| 10.3 | | * | | |
| | |
| 10.4 | * | |
| |
| | (a) | |
| | |
| | (b) | |
| | | |
| | (c) | |
| | |
| 10.5 | * | | |
| | |
| 10.6 | * | | |
| | |
| | | | | | | | | | | | | | |
Exhibit Number | | Exhibit | |
| | | | |
| 10.7 | * | | |
| | |
| 10.8 | * | | |
| | |
| 10.9 | * | (a) | |
| | |
| | | | | | | | | | | |
Exhibit
Number
| | Exhibit |
| | | |
| | (b) | | |
| | | | |
| | (c) | | |
| | | | |
| 10.10 | * | | |
| | | | |
| 10.11 | | | |
| | |
| 10.12 | | | |
| | | |
| 21 | | | |
| | |
| 23 | | | |
| | |
| 31.1 | | | |
| | |
| 31.2 | | | |
| | |
| 32.1 | | | |
| | |
| 32.2 | | | |
| | |
| 101 | | | The following materials from Anthem,Elevance Health, Inc.’s Annual Report on Form 10-K for the year ended December 31, 2020,2022, formatted in Inline XBRL (Inline Extensible Business Reporting Language): (i) the Consolidated Balance Sheets; (ii) the Consolidated Statements of Income; (iii) the Consolidated Statements of Comprehensive Income; (iv) the Consolidated Statements of Cash Flows; (v) the Consolidated Statements of Shareholders’ Equity; (vi) the Notes to Consolidated Financial Statements and (vii) Financial Statement Schedule II. The instance document does not appear in the Interactive Data File because its XBRL tags are embedded within the Inline XBRL document. | |
| | | | |
| 104 | | | Cover Page Interactive Data File formatted in Inline XBRL and contained in Exhibit 101. | |
| | | | |
| | | | |
| | | | |
| * | | Indicates management contracts or compensatory plans or arrangements. | |
(b) Exhibits
The response to this portion of Item 15 is set forth in paragraph (a) 3 above.
(c) Financial Statement Schedule
Schedule II—Condensed Financial Information of Registrant (Parent Company Only).
ITEM 16. FORM 10-K SUMMARY.
None.
Schedule II—Condensed Financial Information of Registrant
Anthem,Elevance Health, Inc. (Parent Company Only)
Balance Sheets
| | (In millions, except share data) | (In millions, except share data) | December 31,
2020 | | December 31,
2019 | (In millions, except share data) | December 31,
2022 | | December 31,
2021 |
| Assets | Assets | | | | Assets | | | |
| Current assets: | Current assets: | | Current assets: | |
| Cash and cash equivalents | Cash and cash equivalents | $ | 700 | | | $ | 1,818 | | Cash and cash equivalents | $ | 942 | | | $ | 630 | |
| Fixed maturity securities, current (amortized cost of $594 and $592; allowance for credit losses of $0 and $0) | 608 | | | 602 | | |
| Fixed maturity securities (amortized cost of $175 and $512; allowance for credit losses of $0 and $1) | | Fixed maturity securities (amortized cost of $175 and $512; allowance for credit losses of $0 and $1) | 163 | | | 515 | |
| Equity securities | Equity securities | 439 | | | 253 | | Equity securities | 104 | | | 49 | |
| | Other receivables | Other receivables | 41 | | | 92 | | Other receivables | 55 | | | 40 | |
| | Net due from subsidiaries | Net due from subsidiaries | 0 | | | 602 | | Net due from subsidiaries | — | | | 446 | |
| | Other current assets | Other current assets | 800 | | | 653 | | Other current assets | 721 | | | 655 | |
| Total current assets | Total current assets | 2,588 | | | 4,020 | | Total current assets | 1,985 | | | 2,335 | |
| | Other invested assets | Other invested assets | 664 | | | 657 | | Other invested assets | 783 | | | 808 | |
| Property and equipment, net | Property and equipment, net | 209 | | | 170 | | Property and equipment, net | 187 | | | 207 | |
| Deferred tax assets, net | Deferred tax assets, net | 391 | | | 216 | | Deferred tax assets, net | 313 | | | 77 | |
| Investments in subsidiaries | Investments in subsidiaries | 51,739 | | | 47,423 | | Investments in subsidiaries | 59,042 | | | 56,375 | |
| Other noncurrent assets | Other noncurrent assets | 211 | | | 263 | | Other noncurrent assets | 240 | | | 265 | |
| Total assets | Total assets | $ | 55,802 | | | $ | 52,749 | | Total assets | $ | 62,550 | | | $ | 60,067 | |
| Liabilities and shareholders’ equity | Liabilities and shareholders’ equity | | | | Liabilities and shareholders’ equity | | | |
| Liabilities | Liabilities | | Liabilities | |
| Current liabilities: | Current liabilities: | | Current liabilities: | |
| Accounts payable and accrued expenses | Accounts payable and accrued expenses | $ | 429 | | | $ | 887 | | Accounts payable and accrued expenses | $ | 894 | | | $ | 559 | |
| | Net due to subsidiaries | Net due to subsidiaries | 1,239 | | | 0 | | Net due to subsidiaries | 789 | | | — | |
| Current portion of long-term debt | Current portion of long-term debt | 700 | | | 1,598 | | Current portion of long-term debt | 1,500 | | | 1,599 | |
| Other current liabilities | Other current liabilities | 494 | | | 263 | | Other current liabilities | 361 | | | 344 | |
| Total current liabilities | Total current liabilities | 2,862 | | | 2,748 | | Total current liabilities | 3,544 | | | 2,502 | |
| Long-term debt, less current portion | Long-term debt, less current portion | 19,310 | | | 17,762 | | Long-term debt, less current portion | 22,324 | | | 21,132 | |
| | Other noncurrent liabilities | Other noncurrent liabilities | 431 | | | 511 | | Other noncurrent liabilities | 375 | | | 373 | |
| Total liabilities | Total liabilities | 22,603 | | | 21,021 | | Total liabilities | 26,243 | | | 24,007 | |
| Commitments and contingencies—Note 5 | Commitments and contingencies—Note 5 | 0 | | 0 | Commitments and contingencies—Note 5 | | | |
| Shareholders’ equity | Shareholders’ equity | | Shareholders’ equity | |
| Preferred stock, without par value, shares authorized - 100,000,000; shares issued and outstanding - none | Preferred stock, without par value, shares authorized - 100,000,000; shares issued and outstanding - none | 0 | | | 0 | | Preferred stock, without par value, shares authorized - 100,000,000; shares issued and outstanding - none | — | | | — | |
| Common stock, par value $0.01, shares authorized - 900,000,000; shares issued and outstanding - 245,401,430 and 252,922,161 | 3 | | | 3 | | |
| Common stock, par value $0.01, shares authorized - 900,000,000; shares issued and outstanding - 237,958,067 and 241,770,746 | | Common stock, par value $0.01, shares authorized - 900,000,000; shares issued and outstanding - 237,958,067 and 241,770,746 | 2 | | | 2 | |
| Additional paid-in capital | Additional paid-in capital | 9,244 | | | 9,448 | | Additional paid-in capital | 9,084 | | | 9,148 | |
| Retained earnings | Retained earnings | 23,802 | | | 22,573 | | Retained earnings | 29,724 | | | 27,088 | |
| Accumulated other comprehensive income (loss) | 150 | | | (296) | | |
| Accumulated other comprehensive (loss) income | | Accumulated other comprehensive (loss) income | (2,503) | | | (178) | |
| Total shareholders’ equity | Total shareholders’ equity | 33,199 | | | 31,728 | | Total shareholders’ equity | 36,307 | | | 36,060 | |
| Total liabilities and shareholders’ equity | Total liabilities and shareholders’ equity | $ | 55,802 | | | $ | 52,749 | | Total liabilities and shareholders’ equity | $ | 62,550 | | | $ | 60,067 | |
See accompanying notes.
Anthem,Elevance Health, Inc. (Parent Company Only)
Statements of Income
| | | Years ended December 31 | | Years ended December 31 |
| (In millions) | (In millions) | 2020 | | 2019 | | 2018 | (In millions) | 2022 | | 2021 | | 2020 |
| Revenues | Revenues | | | | | | Revenues | | | | | |
| Net investment income | Net investment income | $ | 65 | | | $ | 81 | | | $ | 39 | | Net investment income | $ | 4 | | | $ | 6 | | | $ | 65 | |
| Net realized gains (losses) on financial instruments | 28 | | | (85) | | | (61) | | |
| Net gains on financial instruments | | Net gains on financial instruments | 2 | | | 6 | | | 28 | |
| | Administrative fees and other revenue | Administrative fees and other revenue | 22 | | | 22 | | | 2 | | Administrative fees and other revenue | 7 | | | 24 | | | 22 | |
| Total revenues (losses) | 115 | | | 18 | | | (20) | | |
| Total revenues | | Total revenues | 13 | | | 36 | | | 115 | |
| Expenses | Expenses | | Expenses | |
| General and administrative expense | General and administrative expense | 169 | | | 88 | | | 86 | | General and administrative expense | 188 | | | 119 | | | 169 | |
| Interest expense | Interest expense | 779 | | | 723 | | | 723 | | Interest expense | 845 | | | 794 | | | 779 | |
| Loss on extinguishment of debt | Loss on extinguishment of debt | 36 | | | 2 | | | 11 | | Loss on extinguishment of debt | — | | | 21 | | | 36 | |
| Total expenses | Total expenses | 984 | | | 813 | | | 820 | | Total expenses | 1,033 | | | 934 | | | 984 | |
| Loss before income tax credits and equity in net income of subsidiaries | Loss before income tax credits and equity in net income of subsidiaries | (869) | | | (795) | | | (840) | | Loss before income tax credits and equity in net income of subsidiaries | (1,020) | | | (898) | | | (869) | |
| Income tax credits | Income tax credits | (386) | | | (251) | | | (238) | | Income tax credits | (461) | | | (244) | | | (386) | |
| Equity in net income of subsidiaries | Equity in net income of subsidiaries | 5,055 | | | 5,351 | | | 4,352 | | Equity in net income of subsidiaries | 6,584 | | | 6,758 | | | 5,055 | |
| Net income | $ | 4,572 | | | $ | 4,807 | | | $ | 3,750 | | |
| Shareholders’ net income | | Shareholders’ net income | $ | 6,025 | | | $ | 6,104 | | | $ | 4,572 | |
See accompanying notes.
Anthem,Elevance Health, Inc. (Parent Company Only)
Statements of Comprehensive Income
| | | Years ended December 31 | | Years ended December 31 |
| (in millions) | (in millions) | 2020 | | 2019 | | 2018 | (in millions) | 2022 | | 2021 | | 2020 |
| Net income | $ | 4,572 | | | $ | 4,807 | | | $ | 3,750 | | |
| Other comprehensive income, net of tax: | | |
| Shareholders' net income | | Shareholders' net income | $ | 6,025 | | | $ | 6,104 | | | $ | 4,572 | |
| Other comprehensive (loss) income, net of tax: | | Other comprehensive (loss) income, net of tax: | |
| Change in net unrealized gains/losses on investments | Change in net unrealized gains/losses on investments | 428 | | | 680 | | | (418) | | Change in net unrealized gains/losses on investments | (2,249) | | | (455) | | | 428 | |
| Change in non-credit component of impairment losses on investments | Change in non-credit component of impairment losses on investments | 0 | | | 0 | | | (2) | | Change in non-credit component of impairment losses on investments | (3) | | | 2 | | | — | |
| Change in net unrealized gains/losses on cash flow hedges | Change in net unrealized gains/losses on cash flow hedges | 12 | | | (16) | | | 37 | | Change in net unrealized gains/losses on cash flow hedges | 10 | | | 11 | | | 12 | |
| Change in net periodic pension and postretirement costs | Change in net periodic pension and postretirement costs | (1) | | | 26 | | | (90) | | Change in net periodic pension and postretirement costs | (70) | | | 123 | | | (1) | |
| Foreign currency translation adjustments | Foreign currency translation adjustments | 7 | | | 0 | | | (1) | | Foreign currency translation adjustments | (13) | | | (9) | | | 7 | |
| Other comprehensive income (loss) | 446 | | | 690 | | | (474) | | |
| Total comprehensive income | $ | 5,018 | | | $ | 5,497 | | | $ | 3,276 | | |
| Other comprehensive (loss) income | | Other comprehensive (loss) income | (2,325) | | | (328) | | | 446 | |
| Total shareholders’ comprehensive income | | Total shareholders’ comprehensive income | $ | 3,700 | | | $ | 5,776 | | | $ | 5,018 | |
See accompanying notes.
Anthem,Elevance Health, Inc. (Parent Company Only)
Statements of Cash Flows
| | | Years ended December 31 | | Years ended December 31 |
| (In millions) | (In millions) | 2020 | | 2019 | | 2018 | (In millions) | 2022 | | 2021 | | 2020 |
| Operating activities | | | | | | |
| Net income | $ | 4,572 | | | $ | 4,807 | | | $ | 3,750 | | |
| Adjustments to reconcile net income to net cash provided by operating activities: | | |
| Undistributed earnings of subsidiaries | (1,418) | | | (1,561) | | | (744) | | |
| Net realized (gains) losses on financial instruments | (28) | | | 85 | | | 61 | | |
| | Deferred income taxes | (178) | | | 2 | | | (43) | | |
| Impairment of property and equipment | 10 | | | 0 | | | 0 | | |
| Depreciation and amortization | 96 | | | 106 | | | 113 | | |
| | Share-based compensation | 283 | | | 294 | | | 226 | | |
| | Changes in operating assets and liabilities: | | |
| Receivables, net | 53 | | | 41 | | | (73) | | |
| Other invested assets | (27) | | | 6 | | | (5) | | |
| Other assets | 33 | | | (235) | | | (225) | | |
| Amounts due to/(from) subsidiaries | 1,841 | | | (432) | | | 2,259 | | |
| Accounts payable and other liabilities | (554) | | | (422) | | | 457 | | |
| | Income taxes | 87 | | | (282) | | | 187 | | |
| Other, net | 40 | | | 2 | | | 12 | | |
| | Net cash provided by operating activities | Net cash provided by operating activities | 4,810 | | | 2,411 | | | 5,975 | | Net cash provided by operating activities | $ | 1,447 | | | $ | 2,038 | | | $ | 4,810 | |
| Investing activities | Investing activities | | Investing activities | |
| Purchases of investments | Purchases of investments | (2,729) | | | (9,682) | | | (800) | | Purchases of investments | (367) | | | (2,059) | | | (2,729) | |
| Proceeds from sales, maturities, calls and redemptions of investments | Proceeds from sales, maturities, calls and redemptions of investments | 2,593 | | | 9,457 | | | 1,865 | | Proceeds from sales, maturities, calls and redemptions of investments | 618 | | | 2,449 | | | 2,593 | |
| | Repayment (issuance) of note to subsidiary | | Repayment (issuance) of note to subsidiary | 1,500 | | | (1,500) | | | — | |
| Capitalization of subsidiaries | Capitalization of subsidiaries | (2,460) | | | (232) | | | (4,379) | | Capitalization of subsidiaries | (411) | | | (807) | | | (2,460) | |
| Changes in securities lending collateral | Changes in securities lending collateral | (234) | | | 18 | | | (21) | | Changes in securities lending collateral | 36 | | | 173 | | | (234) | |
| | Purchases of property and equipment, net of sales | Purchases of property and equipment, net of sales | (107) | | | (54) | | | (137) | | Purchases of property and equipment, net of sales | (47) | | | (77) | | | (107) | |
| Other, net | Other, net | 11 | | | 0 | | | 4 | | Other, net | — | | | — | | | 11 | |
| Net cash used in investing activities | (2,926) | | | (493) | | | (3,468) | | |
| Net cash provided by (used in) investing activities | | Net cash provided by (used in) investing activities | 1,329 | | | (1,821) | | | (2,926) | |
| Financing activities | Financing activities | | Financing activities | |
| Net repayments of commercial paper borrowings | (150) | | | (297) | | | (107) | | |
| Net (repayments of) proceeds from commercial paper borrowings | | Net (repayments of) proceeds from commercial paper borrowings | (300) | | | 50 | | | (150) | |
| Proceeds from long-term borrowings | Proceeds from long-term borrowings | 2,484 | | | 2,473 | | | 835 | | Proceeds from long-term borrowings | 3,071 | | | 3,462 | | | 2,484 | |
| Repayments of long-term borrowings | Repayments of long-term borrowings | (1,932) | | | (1,123) | | | (1,684) | | Repayments of long-term borrowings | (1,899) | | | (1,068) | | | (1,932) | |
| Changes in securities lending payable | Changes in securities lending payable | 234 | | | (18) | | | 21 | | Changes in securities lending payable | (36) | | | (173) | | | 234 | |
| | Proceeds from issuance of common stock under Equity Units stock purchase contracts | 0 | | | 0 | | | 1,250 | | |
| | Repurchase and retirement of common stock | Repurchase and retirement of common stock | (2,700) | | | (1,701) | | | (1,685) | | Repurchase and retirement of common stock | (2,316) | | | (1,900) | | | (2,700) | |
| | Cash dividends | Cash dividends | (1,000) | | | (856) | | | (812) | | Cash dividends | (1,290) | | | (1,158) | | | (1,000) | |
| Proceeds from issuance of common stock under employee stock plans | Proceeds from issuance of common stock under employee stock plans | 176 | | | 187 | | | 173 | | Proceeds from issuance of common stock under employee stock plans | 182 | | | 203 | | | 176 | |
| Taxes paid through withholding of common stock under employee stock plans | Taxes paid through withholding of common stock under employee stock plans | (128) | | | (84) | | | (81) | | Taxes paid through withholding of common stock under employee stock plans | (93) | | | (102) | | | (128) | |
| Other, net | Other, net | 14 | | | 29 | | | (83) | | Other, net | 217 | | | 399 | | | 14 | |
| Net cash used in financing activities | Net cash used in financing activities | (3,002) | | | (1,390) | | | (2,173) | | Net cash used in financing activities | (2,464) | | | (287) | | | (3,002) | |
| Change in cash and cash equivalents | Change in cash and cash equivalents | (1,118) | | | 528 | | | 334 | | Change in cash and cash equivalents | 312 | | | (70) | | | (1,118) | |
| Cash and cash equivalents at beginning of year | Cash and cash equivalents at beginning of year | 1,818 | | | 1,290 | | | 956 | | Cash and cash equivalents at beginning of year | 630 | | | 700 | | | 1,818 | |
| Cash and cash equivalents at end of year | Cash and cash equivalents at end of year | $ | 700 | | | $ | 1,818 | | | $ | 1,290 | | Cash and cash equivalents at end of year | $ | 942 | | | $ | 630 | | | $ | 700 | |
See accompanying notes.
Anthem,Elevance Health, Inc.
(Parent Company Only)
Notes to Condensed Financial Statements
December 31, 20202022
(In Millions, Except Per Share Data)
1. Basis of Presentation and Significant Accounting Policies
In the parent company only financial statements of Anthem,Elevance Health, Inc. (“Anthem”Elevance Health”) Anthem’s, Elevance Health’s investment in subsidiaries is stated at cost plus equity in undistributed earnings of the subsidiaries. Anthem’sElevance Health’s share of net income of its unconsolidated subsidiaries is included in income using the equity method of accounting.
Certain amounts presented in the parent company only financial statements are eliminated in the consolidated financial statements of Anthem.Elevance Health.
Anthem’sElevance Health’s parent company only financial statements should be read in conjunction with Anthem’sElevance Health’s audited consolidated financial statements and the accompanying notes included in Part II, Item 8 of this Annual Report on Form 10-K.
2. Subsidiary Transactions
Dividends from Subsidiaries
AnthemElevance Health received cash dividends from subsidiaries of $3,097, $3,134 and $3,618 $3,790during 2022, 2021 and $3,606 during 2020, 2019 and 2018, respectively.
Dividends to Subsidiaries
Certain subsidiaries of AnthemElevance Health own shares of AnthemElevance Health common stock. AnthemElevance Health paid cash dividends to subsidiaries related to these shares of common stock in the amount of $61, $54 and $46 $38during 2022, 2021 and $36 during 2020, 2019 and 2018, respectively.
Investments in Subsidiaries
Capital contributions to subsidiaries were $411, $3,271 and $2,460 $232during 2022, 2021 and $4,379 during 2020, 2019 and 2018, respectively.
Amounts Due toFrom and FromTo Subsidiaries
At December 31, 20202022 and 2019, Anthem2021, Elevance Health reported amounts due to and(to) from subsidiaries of $1,239$(789) and $602,$446, respectively. The amounts due (to) and from subsidiaries primarily include amounts for allocated administrative expenses or daily cash management activities. These items are routinely settled, and as such, are classified as current assetsliabilities or liabilities.assets.
In June 2021 Elevance Health entered into a short-term loan agreement with a subsidiary for the amount of $1,500, which is also included in amounts due from subsidiaries at December 31, 2021. This loan was repaid in February 2022.
Guarantees on Behalf of Subsidiaries
AnthemElevance Health guarantees contractual or financial obligations or solvency requirements for certain of its subsidiaries. These guarantees approximated $538$550 at December 31, 2020.2022. There were no payments made on these guarantees in 2020.
3. Derivative Financial Instruments
The information regarding derivative financial instruments contained in Note 6, “Derivative Financial Instruments,” of the Notes to Consolidated Financial Statements of AnthemElevance Health and its subsidiaries, included in Part II, Item 8 of this Annual Report on Form 10-K, is incorporated herein by reference.
4. Long-Term Debt
The information regarding long-term debt contained in Note 13, “Debt,” of the Notes to Consolidated Financial Statements of AnthemElevance Health and its subsidiaries, included in Part II, Item 8 of this Annual Report on Form 10-K, is incorporated herein by reference.
5. Commitments and Contingencies
The information regarding commitments and contingencies contained in Note 14, “Commitments and Contingencies,” of the Notes to Consolidated Financial Statements of AnthemElevance Health and its subsidiaries, included in Part II, Item 8 of this Annual Report on Form 10-K, is incorporated herein by reference.
6. Capital Stock
The information regarding capital stock contained in Note 15, “Capital Stock,” of the Notes to Consolidated Financial Statements of AnthemElevance Health and its subsidiaries, included in Part II, Item 8 of this Annual Report on Form 10-K, is incorporated herein by reference.
7. Leases
Beginning in 2019, certain of our leases, including the lease for our principal executive offices located at 220 Virginia Avenue, Indianapolis, Indiana, are obligations of Anthem, Inc. (Parent Company). At December 31, 2020, these leases had an aggregate right-of-use asset of $95, a lease liability balance of $98, operating lease expense of $15 and future lease payments as follows: 2021, $21; 2022, $19; 2023, $16; 2024, $13; 2025, $11; and thereafter $59. At December 31, 2019, the aggregate right-of-use asset balance was $39, the lease liability balance was $40, and the operating lease expense recognized in 2019 was $7. All other information regarding leases is contained in Note 18, “Leases,” of the Notes to Consolidated Financial Statements of Anthem and its subsidiaries, included in Part II, Item 8 of this Annual Report on Form 10-K. Our activities as disclosed in Note 4, “Business Optimization Initiatives” of the Notes to Consolidated Financial Statements of Anthem and its subsidiaries, included in Part II, Item 8 of this Annual Report on Form 10-K, include reducing our office space footprint. As a result, we performed an interim impairment test and recorded an impairment charge of $1 for affected right-of-use assets in 2020 which is included in the operating lease expense shown above.
8. Property and Equipment
The information regarding property and equipment contained in Note 9, “Property and Equipment,” of the Notes to Consolidated Financial Statements of Anthem and its subsidiaries, included in Part II, Item 8 of this Annual Report on Form 10-K, is incorporated herein by reference. Our activities as disclosed in Note 4, “Business Optimization Initiatives” of the Notes to Consolidated Financial Statements of Anthem and its subsidiaries, included in Part II, Item 8 of this Annual Report on Form 10-K, include impairment and abandonment of property and equipment. We recorded an impairment charge of $10 for property and equipment which is included in general and administrative expenses.
SIGNATURES
Pursuant to the requirements of Section 13 or 15(d) of the Securities Exchange Act of 1934, the registrant has duly caused this report to be signed on its behalf by the undersigned, thereunto duly authorized.
| | | | | |
ANTHEM,ELEVANCE HEALTH, INC.
|
| |
| By: | /s/ GAIL K. BOUDREAUX |
| Gail K. Boudreaux
President and Chief Executive Officer |
Dated: February 18, 202115, 2023
Pursuant to the requirements of the Securities Exchange Act of 1934, this report has been signed below by the following persons on behalf of the registrant and in the capacities and on the dates indicated.
| | | | | | | | | | | |
| Signature | | Title | Date |
| /s/ GAIL K. BOUDREAUX | | President and Chief Executive Officer, Director
(Principal Executive Officer) | February 18, 202115, 2023 |
| Gail K. Boudreaux | | | |
| /s/ JOHN E. GALLINA | | Executive Vice President and Chief Financial Officer (Principal Financial Officer) | February 18, 202115, 2023 |
| John E. Gallina | | | |
| /s/ RONALD W. PENCZEK | | Senior Vice President and Chief Accounting Officer and Controller (Principal Accounting Officer) | February 18, 202115, 2023 |
| Ronald W. Penczek | | | |
| /s/ ELIZABETH E. TALLETT | | Chair of the Board | February 18, 202115, 2023 |
| Elizabeth E. Tallett | | | |
| /s/ R. KERRY CLARK | | Director | February 18, 202115, 2023 |
| R. Kerry Clark | | | |
| /s/ SUSAN D. DEVORE | | Director | February 15, 2023 |
| Susan D. DeVore | | | |
| /s/ ROBERT L. DIXON, JR. | | Director | February 18, 202115, 2023 |
| Robert L. Dixon, Jr. | | | |
| /s/ LEWIS HAY III | | Director | February 18, 202115, 2023 |
| Lewis Hay III | | | |
/s/ JULIE A. HILL | | Director | February 18, 2021 |
Julie A. Hill | | | |
| /s/ BAHIJA JALLAL | | Director | February 18, 202115, 2023 |
| Bahija Jallal | | | |
| /s/ ANTONIO F. NERI | | Director | February 18, 202115, 2023 |
| Antonio F. Neri | | | |
| /s/ RAMIRO G. PERU | | Director | February 18, 202115, 2023 |
| Ramiro G. Peru | | | |
| /s/ RYAN M. SCHNEIDER | | Director | February 18, 202115, 2023 |
| Ryan M. Schneider | | | |
| /s/ DEANNA D. STRABLE | | Director | February 15, 2023 |
| Deanna D. Strable | | | |