Table of Contents

UNITED STATES
SECURITIES AND EXCHANGE COMMISSION
Washington, D.C. 20549
                    
FORM 10-K
                    
xAnnual report pursuant to Section 13 or 15(d) of the Securities Exchange Act of 1934.
For the fiscal year endedDecember 31, 20172020
oTransition report pursuant to Section 13 or 15(d) of the Securities Exchange Act of 1934.
Commission file number 000-50254
LAKE AREA CORN PROCESSORS, LLC
(Exact name of registrant as specified in its charter)
South Dakota46-0460790
(State or other jurisdiction of

incorporation or organization)
(I.R.S. Employer Identification No.)
46269 SD Highway 34
P.O. Box 100
Wentworth, South Dakota
57075
(Address of principal executive offices)(Zip Code)
(605) 483-2676
(Registrant's telephone number, including area code)
Securities registered pursuant to Section 12(b) of the Act: None
Securities registered pursuant to Section 12(g) of the Act: Membership Units

46269 SD Highway 34, P.O. Box 100, Wentworth, South Dakota 57057
(Address of principal executive offices)

(605) 483-2676
(Registrant's telephone number, including area code)

Securities registered pursuant to Section 12(b) of the Act: None
Title of each classTrading Symbol(s)Name of each exchange on which registered

Securities registered pursuant to Section 12(g) of the Act: Membership Units

Indicate by check mark if the registrant is a well-known seasoned issuer, as defined in Rule 405 of the Securities Act.
o Yes x No


Indicate by check mark if the registrant is not required to file reports pursuant to Section 13 or Section 15(d) of the Act.
o Yes x No


Indicate by check mark whether the registrant: (1) has filed all reports required to be filed by Section 13 or 15(d) of the Securities Exchange Act of 1934 during the preceding 12 months (or for such shorter period that the registrant was required to file such reports), and (2) has been subject to such filing requirements for the past 90 days.        x Yes o No


Indicate by check mark whether the registrant has submitted electronically and posted on its corporate Website, if any, every Interactive Data File required to be submitted and posted pursuant to Rule 405 of Regulation S-T (§232.405 of this chapter) during the preceding 12 months (or for such shorter period that the registrant was required to submit and post such files).x Yes o No
x Yes    o No


Indicate by check mark if disclosure of delinquent filers pursuant to Item 405 of Regulation S-K (§229.405 of this chapter) is not contained herein, and will not be contained, to the best of registrant's knowledge, in definitive proxy or information statements incorporated by reference in Part III of this Form 10-K or any amendment to this Form 10-K. x


Indicate by check mark whether the registrant is a large accelerated filer, an accelerated filer, a non-accelerated filer, or a smaller reporting company or an emerging growth company. See the definitions of "large accelerated filer," "accelerated filer"filer," "smaller reporting company" and "smaller reporting"emerging growth company" in Rule 12b-2 of the Exchange Act.
Large accelerated fileroAccelerated filero
Non-accelerated filerxSmaller Reporting Companyo
Large accelerated filer o
Emerging Growth Company
Accelerated filer o
Non-accelerated filer x
Smaller Reporting Company o
(Do not check if a smaller reporting company)


If an emerging growth company, indicate by check mark if the registrant has elected not to use the extended transition period for complying with an new or revised financial accounting standards provided pursuant to Section 13(a) of the Exchange Act.

o

Indicate by check mark whether the registrant has filed a report on and attestation to its management's assessment of the effectiveness of its internal control over financial reporting under Section 404(b) of the Sarbanes-Oxley Act (15 U.S.C. 7262(b)) by the registered public accounting firm that prepared or issued its audit report.                    o

Indicate by check mark whether the registrant is a shell company (as defined in Rule 12b-2 of the Act).      o Yes x No


As of June 30, 2017,2020, the last day of the registrant's most recently completed second fiscal quarter, the aggregate market value of the registrant's membership units held by non-affiliates of the registrant was $14,311,625$14,306,375 computed by reference to the most recent public offering price on Form S-4.
 
As of March 2, 2018,12, 2021, there were 29,620,000 membership units of the registrant outstanding.


DOCUMENTS INCORPORATED BY REFERENCE


The registrant has incorporated by reference into Part III of this Annual Report on Form 10-K portions of its definitive information statement to be filed with the Securities and Exchange Commission within 120 days after the close of the fiscal year covered by this Annual Report (December(December 31, 2017)2020). This information statement is referred to in this report as the20182021 Information Statement.


INDEX


2

CAUTIONARY STATEMENTS REGARDING FORWARD-LOOKING STATEMENTS


This annual report contains historical information, as well as forward-looking statements that involve known and unknown risks and relate to future events, our future financial performance, or our expected future operations and actions. In some cases, you can identify forward-looking statements by terms such as "may," "will," "should," "expect," "plan," "anticipate," "believe," "estimate," "future," "intend," "could," "hope," "predict," "target," "potential," or "continue" or the negative of these terms or other similar expressions. These forward-looking statements are only our predictions based upon current information and involve numerous assumptions, risks and uncertainties. Our actual results or actions may differ materially from these forward-looking statements for many reasons, including the reasons described in this report. While it is impossible to identify all such factors, factors that could cause actual results to differ materially from those estimated by us include:


A slowdown in global and regional economic activity, demand for our products and the potential for labor shortages and shipping disruptions resulting from pandemics including COVID-19;
Reductions in the corn-based ethanol use requirement in the Federal Renewable Fuels Standard;
The impact of small refinery exemptions from the RFS which have reduced ethanol demand;
Oversupply in the ethanol industry resulting in lower market ethanol prices;
Negative operating margins which result from lower ethanol prices;
Lower ethanol prices due to the Chinese and Brazilian ethanol tariffs;
Lower distillers grains prices due to the Chinese antidumpinganti-dumping and countervailing duty tariffs;
Lower gasoline prices may negatively impact ethanol prices which could hurt our profitability;
Availability and costs of raw materials, particularly corn and natural gas;
Changes in the price and market for ethanol, distillers grains and corn oil;
Our ability to maintain liquidity and maintain our risk management positions;
Changes in the availability and cost of credit;
Changes and advances in ethanol production technology;
The effectiveness of our risk management strategy to offset increases in the price of our raw materials and decreases in the prices of our products;
Overcapacity within the ethanol industry causing supply to exceed demand;
Our ability to market and our reliance on third parties to market our products;
The decrease or elimination of governmental incentives which support the ethanol industry;
Changes in the weather or general economic conditions impacting the availability and price of corn;
Our ability to generate free cash flow to invest in our business and service our debt;
Changes in plant production capacity or technical difficulties in operating the plant;
Changes in our business strategy, capital improvements or development plans;
Our ability to retain key employees and maintain labor relations;
Our liability resulting from potential litigation;
Competition from alternative fuels and alternative fuel additives; and
Other factors described elsewhere in this report.


The cautionary statements referred to in this section also should be considered in connection with any subsequent written or oral forward-looking statements that may be issued by us or persons acting on our behalf. We undertake no duty to update these forward-looking statements, even though our situation may change in the future. Furthermore, we cannot guarantee future results, events, levels of activity, performance, or achievements. We caution you not to put undue reliance on any forward-looking statements, which speak only as of the date of this report.  You should read this report and the documents that we reference in this report and have filed as exhibits completely and with the understanding that our actual future results may be materially different from what we currently expect.  We qualify all of our forward-looking statements by these cautionary statements.

3


PART I


ITEM 1.BUSINESS.


Overview


Lake Area Corn Processors, LLC is a South Dakota limited liability company that owns and manages an ethanol plant that has a nameplate production capacity of 4090 million gallons of ethanol per year through its wholly-owned subsidiary Dakota Ethanol, L.L.C. The ethanol plant producerscurrently produces at rates in excess of 5090 million gallons of ethanol per year. The ethanol plant is located near Wentworth, South Dakota. Lake Area Corn Processors, LLC is referred to in this report as "LACP," the "Company," "we," or "us." Dakota Ethanol, L.L.C. is referred to in this report as "Dakota Ethanol" or the "ethanol plant."


Since September 4, 2001, we have been engaged in the production of ethanol and distillers grains. Fuel grade ethanol is our primary product accounting for the majority of our revenue.  We also sell distillers grains and corn oil, the principal co-products of the ethanol production process.


The ethanol industry experienced industry-wide record low ethanol prices throughout most of 2018 and 2019 due to reduced demand and high industry inventory levels. This continued into 2020 and the situation was compounded by the crisis associated with the 2019 novel coronavirus disease (“COVID-19”). In response to these unfavorable operating conditions and a slowdown in global and regional economic activity and a disruption in transportation fuel demand resulting from the COVID-19 pandemic, we reduced our ethanol production rate early in 2020 which impacted our total ethanol production for our 2020 fiscal year.

General Development of Business


LACP was formed as a South Dakota cooperative on May 25, 1999. On August 20, 2002, our members approved a plan to reorganize into a South Dakota limited liability company. The reorganization became effective on August 31, 2002, and the assets and liabilities of the cooperative were transferred to the newly formed limited liability company. Following the reorganization, our legal name was changed to Lake Area Corn Processors, LLC.


Our ownership of Dakota Ethanol represents our primary asset and source of revenue. Since we operate Dakota Ethanol as a wholly-owned subsidiary, all net income generated by Dakota Ethanol is passed to LACP. We make distributions of the income received from Dakota Ethanol to our unit holders in proportion to the number of units held by each member comparedmember.

We entered into a loan agreement with the Small Business Association through First State Bank, Gothenburg, NE on April 4, 2020 for $760,400 as part of the Paycheck Protection Program under Division A, Title I of the Coronavirus Aid, Relief and Economic Security Act (CARES Act). The loan matures in January 2023 and has an interest rate of 1%. Proceeds of the loan are restricted for use towards payroll costs and other allowable uses such as covered utilities for incurred before December 31, 2020 under the Paycheck Protection Program Rules. Provisions of the agreement allow for a portion of the loan to be forgiven if certain qualifications are met. We applied for forgiveness of this loan. The Paycheck Protection Program Flexibility Act, which was put into effect on June 5, 2020, may effect the units held byterms of our members generally.loan.


On July 11, 2017,June 5, 2020, we madeentered into a $10 million investment in Ring-neck Energy & Feed, LLC. Ring-neck Energy & Feed, LLC plans to construct an ethanol plant in Onida, South Dakota. We have the right to appoint a member of Ring-neck Energy & Feed, LLC's board of managers.

On August 1, 2017, we executed an amendmentThird Amendment to our credit agreement with Farm Credit Services of America, PCA and Farm Credit Services of America, FLCA (collectively "FCSA"("Farm Credit") (the "Third Amendment"). Under the Third Amendment, the available credit under the revolving operating note was reduced to create$2,000,000 and the available credit on the reducing revolving note was increased to $48,000,000. The working capital covenant was reduced to $11,000,000 and the net worth covenant was reduced to $18,000,0000. The next measurement date for the debt service coverage ratio was deferred until December 31, 2021. The annual installment on the term note for 2020 was deferred until maturity in 2025. The interest rates were unchanged.    

    During our 2019 fiscal year, we completed a new $8 million term loan which we used to finance a portion of our investment in Ring-neck Energy & Feed, LLC. We agreed to make annual principal payments of $1 million plus accrued interest starting on August 1, 2018 and annually thereafter until the maturity date on August 1, 2025.

Subsequently, on February 6, 2018, we executed an Amended and Restated Credit Agreement (the "Amended and Restated Credit Agreement") with FCSA. Pursuant to the Amended and Restated Credit Agreement, we increased our total credit availability to $40 million to support our plant expansion project. Further, the maturity date of this increased credit availability under our Amended and Restated Credit Agreement was extended to January 1, 2026. Until February 1, 2023, interest will accrue pursuant to the Credit Agreement on our increased credit availability at the one month London Interbank Offered Rate ("LIBOR") plus 3.25% per year. We agreed to pay a fee of 0.50% on the unused portion of the increased credit availability.  

We are moving forward with plans to expandproject which expanded our production capacity to approximately 90 million gallons of ethanol per year. The cost of the expansion is expected towas approximately $36 million. As a result of the plant expansion project, results of prior years may be approximately $33 million. We commenced the project in December 2017 and we anticipate that the expansion will be complete during our second quarter of 2019.materially different from future years.

During our 2017 fiscal year, we paid a total of $5,924,000 in distributions to our members or approximately $0.20 per membership unit.


Financial Information


Please refer to "Item 7 - Management's Discussion and Analysis of Financial Condition and Results of Operations" for information regarding our results of operations and "Item 8 - Financial Statements and Supplementary Data" for our audited consolidated financial statements.

4


Principal Products


The principal products produced at the ethanol plant are fuel grade ethanol, distillers grains and corn oil. The table below shows the approximate percentage of our total revenue which is attributed to each of our primary products for each of our last three fiscal years.
ProductFiscal Year 2020Fiscal Year 2019Fiscal Year 2018
Ethanol76%78%77%
Distillers Grains20%18%20%
Corn Oil4%4%3%
Product Fiscal Year 2017 Fiscal Year 2016 Fiscal Year 2015
Ethanol 79% 78% 76%
Distillers Grains 17% 18% 20%
Corn Oil 4% 3% 3%


Ethanol


Ethanol is ethyl alcohol, a fuel component made primarily from corn and various other grains. Ethanol is primarily used as: (i) an octane enhancer in fuels; (ii) an oxygenated fuel additive for the purpose of reducing ozone and carbon monoxide vehicle emissions; and (iii) a non-petroleum-based gasoline substitute. Ethanol produced in the United States is primarily used for blending

with unleaded gasoline and other fuel products. Ethanol blended fuel is typically designated in the marketplace according to the percentage of the fuel that is ethanol, with the most common fuel blend being E10, which includes 10% ethanol. The United States Environmental Protection Agency ("EPA") has approved the use of gasoline blends that contain 15% ethanol, or E15, for use in all vehicles manufactured in model year 2001 and later. In addition, flexible fuel vehicles can use gasoline blends that contain up to 85% ethanol called E85.


An ethanol plant is essentially a fermentation plant. Ground corn and water are mixed with enzymes and yeast to produce a substance called "beer," which contains approximately 15% alcohol, 11% solids and 74% water. The "beer" is boiled to separate the water, resulting in ethyl alcohol, which is then dehydrated to increase the alcohol content. This product is then mixed with a certified denaturant, such as gasoline, to make the product unfit for human consumption which allows it to be sold commercially.


Distillers Grains


A principal co-product of the ethanol production process is distillers grains, a high protein, high-energy animal feed supplement primarily marketed to the dairy and beef industry. We primarily produce distillers grains in two forms, modified/wet distillers grains and dried distillers grains. Modified/wet distillers grains have a higher moisture content than dried distillers grains. Our modified/wet distillers grains are sold primarily in our local market because they have a shorter shelf life and are more expensive to transport than dried distillers grains.


Corn Oil


We separate a portion of the corn oil contained in our distillers grains which we market separately from our distillers grains. The corn oil that we produce is not food grade corn oil and therefore cannot be used for human consumption. The primary uses for the corn oil that we produce are animal feed, industrial uses and biodiesel production.


Principal Product Markets


Ethanol


The primary market for our ethanol is the domestic fuel blending market. However the ethanol industry has focused on increasing ethanol exports. According to the U.S. Energy Information Administration, Brazil, Canada, India and Mexico were top destinations for ethanol exports in recent years2020. However, overall exports of ethanol for this period decreased compared to the same period last year due to escalating trade barriers and the impacts of COVID-19. Tariffs implemented by Brazil and China on ethanol imported from the United States has experienced increasedreduced export demand from these markets. Trade barriers with key markets may continue to take a toll on ethanol exports. This increase inexport demand negatively effecting domestic ethanol exports follows a conscious effort by the United States ethanol industry to expand ethanol exports along with lower ethanol prices which encouraged exports. During 2017, the primary export markets served by the United States ethanol industry were Canada, Brazil, India, China, South Korea, the Philippines and Peru. However, ethanolprices. Ethanol export demand is more unpredictable than domestic demand and tends to fluctuate throughout the year as it is subject to monetary and political forces in other nations. BothAn example of this, the imposition of a tax on imported ethanol by Brazil and China, each a major sourcehas created uncertainty as to the viability of export demand in the past, have instituted tariffs onthat market for ethanol produced in the United States during 2017. The imposition of these tariffs have resulted in a decline in demand from these top importers requiringand has required the United States producers to seek out alternative markets.

In 2011, the European Union launched anti-dumping and anti-subsidy investigations related toother markets for their products. While Brazil still imports a significant amount of ethanol exports from the United States. In August 2012, the European Union concluded the anti-subsidy investigation and decided not to impose a tariff related to the anti-subsidy portion of the investigation. However, the European Union decided to impose a tariff on ethanol imported from the United States, based on the anti-dumping portionthese imports could be higher without these trade barriers.
5


Export demand has negatively impacted ethanol exports to the European Union, other countries have increased their ethanol imports. Further, some ethanol exports to the European Union have continued despite the tariffalso decreased due to the relatively lower price of ethanol produceddisruption in global fuel demand resulting from travel restrictions in response to the United States.COVID-19 pandemic. Restricted travel, new lockdown measures and slow economic growth continue to have a negative effect on global fuel consumption and it is unknown when such demand will recover as reopening efforts continue to evolve.

Ethanol is generally blended with gasoline before it is sold to the end consumer. Therefore, the primary purchasers of ethanol are fuel blending companies which mix the ethanol we produce with gasoline. As discussed below in the section entitled "Distribution of Principal Products," we have a third party marketer that sells all of our ethanol. Our ethanol marketer makes substantially all decisions regarding where our ethanol is sold.


Distillers Grains


Distillers grains are primarily used as animal feed. Distillers grains are typically fed to animals instead of other traditional animal feeds such as corn and soybean meal. Distillers grains exports have increased in recent years as distillers grains have become a more accepted animal feed. Currently, the United States ethanol industry exports a significant amount of distiller grains. During 2017,According to the U.S. Grains Council, during the 2019/2020 marketing year, the largest importers of United States distiller grains were Mexico, Turkey,China, Canada, Japan, Colombia and South Korea, Thailand, China and Canada. Korea.

During 2016, China began an anti-dumping and countervailing duty investigation related to distillers grains imported from the United States which contributed to a decline in distillers grains shipped to China. In September 2016, China issued a preliminary ruling on the anti-dumping investigation imposing an immediate duty on distillers grains that are produced in the United States.

In addition, China implemented an anti-subsidy duty as of September 30, 2016. In January 2017, the Chinese finalized the anti-dumping and anti-subsidy duties at rates higher than the preliminary rates set in September 2016.duties.  The anti-dumping duties range from 42.2% to 53.7%, an increase fromand the preliminary duty of 33.8% issued in September 2016. The final anti-subsidy tariffs range from 11.2% to 12%, up from 10% to 10.7% issued in September 2016.. The trade actions taken by the Chinese have resulted in further declines in distillers grains demand and prices. The significant reduction in distillers grains exports to China requires United States distillers grains producers to seek out alternative markets.


We anticipate that the vast majority of our distillers grains will continue to be sold in the domestic market due to our plant's location. Further, management anticipates that we will continue to sell a large proportion of our distillers grains in the modified/wet form which is marketed locally.


Corn Oil


The primary markets for corn oil are the industrial chemicals market, animal feeding market and the biodiesel production market. Corn oil demand was higher during 2017 due to increased biodiesel production. ThisThe biodiesel blenders' tax credit expired at the end of 2016.2017. However, in early 2018on December 20, 2019, the biodiesel blenders' tax credit was reinstated retroactively for 20172018 and 2019 after it expired at the end of 2016, but no2017, and a forward looking extension was included so this may not provide support for corn oil prices during our 2018 fiscal year.the years 2020, 2021, and 2022. Since corn oil can be used as a feedstock to produce biodiesel, when biodiesel production increases it has a positive impact on corn oil prices. Further,However, additional corn oil supply has continued to enter the market which has negatively impacted corn oil prices. The market for corn oil is expected to continue to shift as changes in supply and demand of corn oil interact. Our corn oil is primarily marketed in the United States and we do not expect that significant exports of corn oil will occur in the near future.


Distribution of Principal Products


Ethanol Distribution


We have an ethanol marketing agreement with RPMG, Inc. ("RPMG"), a professional third party marketer, which is the sole marketer of our ethanol. We are an equity owner of Renewable Products Marketing Group, LLC ("RPMG, LLC"), the parent company of RPMG, which allows us to realize favorable marketing fees in the sale of our ethanol, distillers grains and corn oil. Our ethanol marketing agreement provides that we can sell our ethanol either through an index arrangement or at a fixed price agreed to between us and RPMG. The term of our ethanol marketing agreement is perpetual, until it is terminated according to the terms of the agreement. The primary reasons our ethanol marketing agreement would terminate are if we cease to be an owner of RPMG, LLC, if there is a breach of our ethanol marketing agreement which is not cured, or if we give advance notice to RPMG that we wish to terminate our ethanol marketing agreement. Notwithstanding our right to terminate our ethanol marketing agreement, we may be obligated to continue to market our ethanol through RPMG for a period of time after termination. Further, following termination we agreed to accept an assignment of certain railcar leases which RPMG has secured to service our ethanol sales. If our ethanol marketing agreement is terminated, it would trigger a redemption by RPMG, LLC of our ownership interest in RPMG, LLC.


6

Distillers Grains Distribution


Other than the distillers grains that we market locally without a third party marketer, our distillers grains are marketed by RPMG. Our distillers grains marketing agreement with RPMG automatically renews for additional one-year terms unless notice of termination is given as provided by the distillers grains marketing agreement. We pay RPMG a commission based on each ton of distillers grains sold by RPMG.


We market a portion of our distillers grains to our local market without the use of an external marketer. Currently, we market approximately 65%62%, based on volume, of our distillers grains internally. Shipments of these products are made to local markets by truck. This has allowed us to sell less distillers grains in the form of dried distillers grains which has decreased our natural gas usage and improved our margins from the sale of distillers grains.


Corn Oil Distribution


We market all of our corn oil through RPMG. Our corn oil marketing agreement automatically renews for additional one year terms unless either party gives 180 days notice that the agreement will not be renewed. We pay RPMG a commission based on each pound of our corn oil that is sold by RPMG.


New Products and Services


We did not introduce any new products or services during our20172020 fiscal year.


Patents, Trademarks, Licenses, Franchises and Concessions


We do not currently hold any patents, trademarks, franchises or concessions. We were granted a license by Broin and Associates, Inc. ("Broin"), the company that designed and built the ethanol plant, to use certain ethanol production technology necessary to operate our ethanol plant. The cost of the license granted by Broin was included in the amount we paid Broin to design and build our ethanol plant.


Sources and Availability of Raw Materials


Corn Feedstock Supply


The major raw material required for our ethanol plant to produce ethanol, distillers grains and corn oil is corn.  The plant operates at a rate in excess of its nameplate capacity of 4090 million gallons of ethanol per year, producingyear. We anticipate using approximately 51 million gallons of ethanol annually from approximately 1831 million bushels of corn.  The area surrounding the ethanol plant currentlyusually provides an ample supply of corn to meet and exceed our raw material requirements for the production capacity of the plant.


Corn prices have been volatile in recent years due to changes in corn demand as well as yield and production fluctuations that have had a significant impact on corn prices. CornHigh corn prices were lower during our 2017 fiscal year as a result of five consecutive years of favorable corn crops which has increased the amount of corn available to us. As a result of these favorable corn crops, we have not had difficulty securing the corn we need to operate the ethanol plant at prices that have allowed us to operate profitably. However, as we experienced during 2012, an unfavorable corn crop can have a significant negative impacteffect on our profitability.operating margins unless the price of ethanol and distillers grains out paces rising corn prices. We could experience a drought or other unfavorable weather conditionconditions during our 20182021 fiscal year which could impact the price we pay for corn and could negatively impact the availability of corn near our plant. If we experience a localized shortage of corn, we may be forced to purchase corn from producers who arelocated farther away from our ethanol plant which can increase our transportation costs. In addition, if new corn customers enter the market, it can increase demand for corn which could result in higher corn prices. Since corn is the primary raw material we use to produce our products, the availability and cost of corn can have a significant impact on the profitability of our operations.


Corn is supplied to us primarily from our members who are local agricultural producers and from purchases of corn on the open market. We anticipate purchasing corn from third parties should our members fail to supply us with enough corn to operate the ethanol plant at capacity. We do not anticipate experiencing difficulty purchasing the corn we require to operate the ethanol plant.


We have an agreement with John Stewart & Associates ("JSA") to provide us with consulting services related to our risk management strategy. We pay JSA a fee of $2,500 per month to assist us in making risk management decisions regarding our commodity purchases. The agreement renews on a month-to-month basis.


7

Natural Gas


Natural gas is an important input to our manufacturing process.  We purchase our natural gas on the open market and the price for our natural gas is based on market rates. We have a contract with Northern Natural Gas for the interstate transportation of our natural gas. We contract with NorthWestern Energy for the local transportation of our natural gas. Both contracts expire in 2018.2028. We have had no interruptions or shortages in the supply of natural gas to the plant since operations commenced in 2001. We anticipate that we will be able to purchase sufficient natural gas to continue to operate the ethanol plant during our 20182021 fiscal year.


Electricity


Electricity is necessary for lighting and powering much of the machinery and equipment used in the production process. We contract with Sioux Valley Energy, Inc. to provide all of the electric power and energy requirements for the ethanol plant. We have had no interruptions or shortages in the supply of electricity to the plant since operations commenced in 2001.


Water


Water is a necessary part of the ethanol production process. It is used in the fermentation process and to produce steam for the cooking, evaporation, and distillation processes. We contract with Big Sioux Community Water System, Inc. to meet our water requirements. Our current agreement with Big Sioux is for a five-year term commencingwas modified in December 2014February 2020 and is renewable for additional five year terms.expires in 2025. Since our operations commenced in September 2001, we have had no interruption in the supply of water and all of our requirements have been met.


Seasonal Factors in Business


We experience some seasonality of demand for our ethanol, distillers grains and corn oil. Since ethanol is predominantly blended with gasoline for use in automobiles, ethanol demand tends to shift in relation to gasoline demand. As a result, we experience some seasonality of demand for ethanol in the summer months related to increased driving and, as a result, increased gasoline demand. In addition, we experience some increased ethanol demand during holiday seasons related to increased gasoline demand. We also experience decreased distillers grains demand during the summer months due to natural depletion in the size of herds at cattle feed lots. Further, we expect some seasonality of demand for our corn oil since the biodiesel industry is a major corn oil user and biodiesel plants typically reduce production during the winter months. We experience some seasonality in the price we pay for natural gas with premium pricing during the winter months. This increase in natural gas prices coincides with increased natural gas demand for heating needs in the winter months.


Working Capital


We primarily use our working capital for purchases of raw materials necessary to operate the ethanol plant, for payments on our credit facilities, for distributions to our members and for capital expenditures to maintain and upgrade the ethanol plant. Our primary sources of working capital are income from our operations and investments as well as our revolving lines of credit with our primary lender, FCSA.Farm Credit. For our 20182021 fiscal year, we anticipate using cash from our operations and our credit facilities for our plant expansion project and to maintain our current plant infrastructure. Management believes that our current sources of working capital are sufficient to sustain our operations for our 20182021 fiscal year and beyond.


Dependence on One or a Few Major Customers


As discussed above, we have entered into marketing agreements with RPMG to market our ethanol, distillers grains and corn oil. Therefore, we rely on RPMG to market almost all of our products, except for the modified/wet distillers grains that we market locally. Our financial success will be highly dependent on RPMG's ability to market our products at competitive prices. Any loss of RPMG as our marketing agent or any lack of performance under these agreements or inability to secure competitive prices could have a significant negative impact on our revenues. While we believe we can secure new marketers if RPMG were to fail, we may not be able to secure such new marketers at rates which are competitive with RPMG's.


8

Our Competition


Ethanol Competition


We are in direct competition with numerous ethanol producers in the sale of our products and with respect to raw material purchases related to those products. Many of the ethanol producers with which we compete have greater resources than we do. While management believes we are a lower cost producer of ethanol, larger ethanol producers may be able to take advantage of economies of scale due to their larger size and increased bargaining power with both ethanol, distillers grains and corn oil customers and raw material suppliers. As of January 23, 2018,December 31, 2020, the Renewable Fuels Association estimates that there are213 210 ethanol production facilities in the United States with capacity to produce approximately 16.217.6 billiongallons of ethanol per year. According to RFA estimates, approximately 3%of the ethanol production capacity in the United States was not operating as ofJanuary 23, 2018. The largest ethanol producers include Archer Daniels Midland, Flint Hills Resources, Green Plains Renewable Energy, POET Biorefining, and Valero Renewable Fuels, each of which is capable of producing significantly more ethanol than we produce.


The following table identifies the largest ethanol producers in the United States along with their production capacities.


U.S. FUEL ETHANOL PRODUCTION CAPACITY
BY TOP PRODUCERS
Producers of Approximately 700800
million gallons per year (MMgy) or more
CompanyCurrent Capacity
(MMgy)
Percent of Total
Archer Daniels Midland1,7169.8%
POET Biorefining1,80510.3%
Green Plains Renewable Energy1,1286.4%
Valero Renewable Fuels1,7309.8%
Flint Hills Resources8404.8%
Company 
Current Capacity
(MMgy)
 Percent of Total
Archer Daniels Midland 1,716 11%
POET Biorefining 1,629 10%
Green Plains Renewable Energy 1,475 9%
Valero Renewable Fuels 1,400 9%
Flint Hills Resources 840 5%
        Updated: December 31, 2020
Updated: January 23, 2018


The products that we produce are commodities. Since our products are commodities, there are typically no significant differences between the products we produce and the products of our competitors that would allow us to distinguish our products in the market. As a result, competition in the ethanol industry is primarily based on price and consistent fuel quality.


We have experienced increased competition from oil companies that have purchased ethanol production facilities. These oil companies are required to blend a certain amount of ethanol each year. Therefore, the oil companies may be able to operate their ethanol production facilities at times when it is unprofitable for us to operate our ethanol plant. Further, some ethanol producers own multiple ethanol plants which may allow them to compete more effectively by providing them flexibility to run certain production facilities while they have other facilities shut down. Finally some ethanol producers who own ethanol plants in geographically diverse areas of the United States may spread the risk they encounter related to feedstock prices due to localized corn shortages or poor growing conditions.


We anticipate increased competition from renewable fuels that do not use corn as the feedstock. Many of the current ethanol production incentives are designed to encourage the production of renewable fuels using raw materials other than corn. One type of ethanol production feedstock that is being explored is cellulose. Cellulose is the main component of plant cell walls and is the most common organic compound on earth. Cellulose is found in wood chips, corn stalks, rice straw, amongst other common plants. Cellulosic ethanol is ethanol produced from cellulose. There are several commercial scale cellulosic ethanol production facilities either in production or in the construction phase. If this technology can be profitably employed on a commercial scale, it could potentially lead to ethanol that is less expensive to produce than corn based ethanol, especially when corn prices are high. Cellulosic ethanol may also capture more government subsidies and assistance than corn based ethanol. This could decrease demand for our product or result in competitive disadvantages for our ethanol production process.

A number of automotive, industrial and power generation manufacturers are developing alternative clean power systems using fuel cells, plug-in hybrids, electric cars or clean burning gaseous fuels. Electric car technology has recently grown in popularity, especially in urban areas, and continues to represent a source of competition for the ethanol industry. While there are currently a limited number of vehicle recharging stations, making electric cars not feasible for all consumers, there has been increased focus on developingdevelopment of these recharging stations to make electric carwhich is making this technology more widely available in the future.available. Additional competition from these other sources of alternative energy, particularly in the automobile market, could reduce the demand for ethanol, which would negatively impact our profitability.


In addition to domestic producers of ethanol, we face competition from ethanol produced in foreign countries, particularly Brazil. Ethanol imports have been lower in recent years and ethanol exports have been higher. As of May 1, 2013, Brazil increased its domestic ethanol use requirement from 20% to 25% which decreased the amount of ethanol available in Brazil for export. Further, in August 2017, Brazil instituted a quota and tariff on ethanol produced in the United States and exported to Brazil which reduced exports to Brazil. Brazil increased the quota during our 2019 fiscal year which resulted in additional demand from Brazil, however, without this quota and tariff, Brazilian exports likely would have been higher. In December 2020, the Brazilian quota expired so all ethanol produced in the United States and exported to Brazil is now subject
9

to Brazil's import tariff. In the future, we may experience increased ethanol imports from Brazil which could put negative pressure on domestic ethanol prices and result in excess ethanol supply in the United States.

Competition among ethanol producers may continue to increase as gasoline demand decreases due to more fuel efficient vehicles being produced. If the concentration of ethanol used in most gasoline does not increase and gasoline demand is lower due to increased fuel efficiency by the vehicles operated in the United States, competition may increase among ethanol producers to supply the ethanol market.
Distillers Grains Competition


Our ethanol plant competes with other ethanol producers in the production and sales of distillers grains. Distillers grains are primarily used as an animal feed supplement which replaces corn and soybean meal. As a result, we believe that distillers grains prices are positively impacted by increases in corn and soybean prices. In addition, in recent years the United States ethanol industry has increased exports of distillers grains which management believes has positively impacted demand and prices for distillers grains in the United States. In the event these distillers grains exports decrease, including as a result of the Chinese tariffs which have significantly reduced export demand for distillers grains, it could lead to an oversupply of distillers grains in the United States. An oversupply of distillers grains could result in increased competition among ethanol producers for sales of distillers grains which could negatively impact market distillers grains prices in the United States.


Corn Oil Competition


We compete with many ethanol producers for the sale of corn oil. Many ethanol producers have installed the equipment necessary to separate corn oil from the distillers grains they produce which has increased competition for corn oil sales and has resulted in lower market corn oil prices.sales.

Research and Development

We do not conduct any research and development activities associated with the development of new technologies for use in producing ethanol, distillers grains or corn oil. However, we continually work to develop new methods of operating our ethanol plant more efficiently.


Governmental Regulation


Federal Ethanol Supports


The ethanol industry is dependent on several economic incentives to produce ethanol, the most significant of which is the Federal Renewable Fuels Standard (the "RFS"). The RFS requires that in each year, a certain amount of renewable fuels must be used in the United States. The RFS is a national program that does not require that any renewable fuels be used in any particular area or state, allowing refiners to use renewable fuel blends in those areas where it is most cost-effective. The RFS statutory volume requirement increases incrementally each year until the United States is required to use 36 billion gallons of renewable fuels by 2022. Starting in 2009, the RFS required that a portion of the RFS must be met by certain "advanced" renewable fuels. These advanced renewable fuels include ethanol that is not made from corn, such as cellulosic ethanol and biomass based biodiesel. The use of these advanced renewable fuels increases each year as a percentage of the total renewable fuels required to be used in the United States.


The United States Environmental Protection Agency (the "EPA") has the authority to waive the RFS statutory volume requirement, in whole or in part, provided one of the following two conditions have been met: (1) there is inadequate domestic renewable fuel supply; or (2) implementation of the requirement would severely harm the economy or environment of a state, region or the United States. Annually,Recently, the EPA is supposedhas been granting small refinery exemptions from the RFS while not using its authority to passwaive the RFS statutory volume requirements. These small refinery exemptions created unallocated gallons reducing the corn-based conventional biofuel RFS requirements by 2.25 billion gallons in 2018 and 2 billion gallons in 2019. These small refinery exemptions have had a rule that establishes the number of gallons of different types of renewable fuels that must be usedsignificant negative impact on domestic demand for ethanol and have resulted in negative operating margins in the United States which is called the renewable volume obligations.ethanol industry.


The RFS statutory Renewable Volume Obligation (RVO) for all renewable fuels for 2017 was 24 billion gallons, of which corn-based ethanol could meet 15 billion gallons of the RVO. However, the EPA rule decreased the total RVO to 19.28 billion gallons and maintained the 15 billion gallon corn-based ethanol limit.    On November 30, 2017,2018, the final RVO for 20182019 was set at 19.29 billion gallons and the corn-based ethanol RVO was set at 15 billion gallons.

In February 2010, However, the EPA issued new regulations governing the RFS. These new regulations are called RFS2. The most controversial part of RFS2 involves what is commonly referred to as the lifecycle analysis of greenhouse gas emissions. Specifically,did not address small refinery exemptions in its 2019 RVO release. In addition, the EPA adopted rules to determinedid not address the reallocation of 500 million gallons from the 2016 RVO which renewable fuels provided sufficient reductionswas ordered by a federal court in greenhouse gases, compared to conventional gasoline, to qualify undera recent lawsuit. In June 2019, the RFS program. RFS2 establishes a tiered approach, where regular renewable fuels are required to accomplish a 20% greenhouse gas reduction compared to gasoline, advanced biofuelsEPA proposed an RVO of 20.04 billion gallons and biomass-based biodiesel must accomplish a 50% reduction in greenhouse gases,the corn-based ethanol RVO was set at 15 billion gallons. On December 19, 2019, the final RVO for 2020 was set at 20.09 billion gallons and cellulosic biofuels must accomplish a 60% reduction in greenhouse gases. Any fuels that fail to meet this standard cannot be used by fuel blenders to satisfy their obligations under the RFS program.corn-based ethanol RVO was set at 15 billion gallons. The scientific method of calculating these greenhouse gas reductionsEPA has not yet established the RVO for 2021. The ethanol industry has been a contentious issue. Many in the ethanol industry were concerned that corn based ethanol would not meet the 20% greenhouse gas reduction requirement based on certain parts of the environmental impact model that many in the ethanol industry believed was scientifically suspect. However, RFS2 as adopted bypushing the EPA provides that corn-based ethanol from modern ethanol production processes does meetto reverse the definitioneffects of a renewable fuel underthese small refinery waivers which we believe are the RFS program. Our ethanol plant was grandfathered into the RFS due to the fact that it was constructed prior to the effective date of the lifecycle greenhouse gas requirement and is not required to prove compliance with the lifecycle greenhouse gas reductions. Many in the ethanol industry are concerned that certain provisions of RFS2 as adopted may disproportionately benefit ethanol produced from sugarcane which could make sugarcane based ethanol, which is primarily produced in Brazil, more competitive in the United States ethanol market. If this were to occur, it could reduce demandreason for the poor operating margins during 2018 and 2019. In January 2020, the Tenth Circuit Court of Appeals ruled that small refinery exemptions may only be granted to refineries that had secured them continuously each year since 2010. Consistent with this ruling, in September 2020, the EPA denied certain small refinery exemption petitions filed by oil refineries in 2020 seeking retroactive relief from their ethanol that we produce.use requirements for prior years.

10


Most ethanol that is used in the United States is sold in a blend called E10. E10 is a blend of 10% ethanol and 90% gasoline. E10 is approved for use in all standard vehicles. Estimates indicate that gasoline demand in the United States is approximately 140143 billion gallons per year. Assuming that all gasoline in the United States is blended at a rate of 10% ethanol and 90% gasoline, the maximum demand for ethanol is 14.014.3 billion gallons per year. This is commonly referred to as the "blend wall," which represents a theoretical limit where more ethanol cannot be blended into the national gasoline pool. This is a theoretical

limit because it is believed that it would not be possible to blend ethanol into every gallon of gasoline that is being used in the United States and it discounts the use of higher percentage blends such as E15 or E85. These higher percentage blends may lead to additional ethanol demand if they become more widely available and accepted by the market.


Many in the ethanol industry believe that it will be impossible to meet the RFS requirement in future years without an increase in the percentage of ethanol that can be blended with gasoline for use in standard (non-flex fuel) vehicles. The EPA has approved the use of E15, gasoline which is blended at a rate of 15% ethanol and 85% gasoline, in vehicles manufactured in the model year 2001 and later. However, there are still state hurdles that need to be addressed in some states before E15 will become more widely available. Many states still have regulatory issues that prevent the sale of E15. Sales of E15 may be limited because it is not approved for use in all vehicles, the EPA requires a label that management believes may discourage consumers from using E15, and retailers may choose not to sell E15 due to concerns regarding liability. In addition, different gasoline blendstocks may be required at certain times of the year in order to use E15 due to federal regulations related to fuel evaporative emissions which may limit E15 sales in these markets. As a result, the approval of E15 by the EPA has not had an immediate impact on ethanol demand in the United States. In June 2019, the Trump Administration approved the use of E15 year-round which has somewhat expanded the use of E15.


In May 2020, the United States Department of Agriculture ("USDA") announced the Higher Blends Infrastructure Incentive Program which consists of up to $100 million in funding for grants to be used to increase the availability of higher blends of ethanol and biodiesel fuels. Funds may be awarded to retailers such as fueling stations and convenience stores to assist in the cost of installation or upgrading of fuel pumps and other infrastructure. In October 2020, the USDA announced the first round of awards to recipients of $22 million worth of grants. Recently the USDA closed on an additional $30 million worth of grants in a second round of funding.

Effect of Governmental Regulation


The government's regulation of the environment changes constantly. We are subject to extensive air, water and other environmental regulations and we have been required to obtain a number of environmental permits to construct and operate the ethanol plant. It is possible that more stringent federal or state environmental rules or regulations could be adopted, which could increase our operating costs and expenses. It also is possible that federal or state environmental rules or regulations could be adopted that could have an adverse effect on the use of ethanol. Plant operations are governed by the Occupational Safety and Health Administration ("OSHA"). OSHA regulations may change such that the costs of operating the ethanol plant may increase. Any of these regulatory factors may result in higher costs or other adverse conditions effecting our operations, cash flows and financial performance.


We have obtained all of the necessary permits to operate the ethanol plant. During our20172020 fiscal year, our costs of environmental compliance were approximately $166,000.$219,000. We anticipate that our environmental compliance costs will be approximately $292,000$230,000 during our2018 2021 fiscal year. Although we have been successful in obtaining all of the permits currently required, any retroactive change in environmental regulations, either at the federal or state level, could require us to obtain additional or new permits or spend considerable resources in complying with such regulations.


In late 2009, California passed a Low Carbon Fuels Standard ("LCFS"). The California LCFS requires that renewable fuels used in California must accomplish certain reductions in greenhouse gases which is measured using a lifecycle analysis, similar to the RFS. The LCFS could have a negative impact on demand for corn-based ethanol and result in decreased ethanol prices affecting our ability to operate profitably.


The European Union concluded an anti-dumping investigation related to ethanol produced in the United States and exported to Europe. As a result of this investigation, the European Union imposed a tariff on ethanol which is produced in the United States and exported to Europe. This tariff resulted in decreased exports of ethanol to Europe which negatively impacted the market price of ethanol in the United States. The anti-dumping tariff is scheduled to expire in 2018 which may result in additional exports to the European Union during our 2018 fiscal year. However, the decision to remove the tariff is under review.

In August 2017, Brazil instituted an import quota for ethanol produced in the United States and exported to Brazil, along with a 20% tariff on ethanol imports in excess of the quota. The quota expired in December 2020 so all U.S. ethanol exports to Brazil are now subject to the tariff. This tariff and quota have reduced exports of ethanol to Brazil and may continue to negatively impact ethanol exports from the United States. Any reduction in ethanol exports could negatively impact market ethanol prices in the United States. RecentlyIn addition, the Chinese government increased the tariff on United States ethanol imports into China from 30% to 45% and ultimately to 70%. Due to other recent tariff activity between the United States and China, management does not expect these Chinese tariffs to be removed in the near term. Both China and Brazil announced ithave been major
11

sources of import demand for United States ethanol and distillers grains. These trade actions may remove this tariff.result in negative operating margins for United States ethanol producers.


We are subject to environmental oversight by the EPA. There is always a risk that the EPA may enforce certain rules and regulations differently than South Dakota's environmental administrators. South Dakota or EPA rules are subject to change, and any such changes could result in greater regulatory burdens on plant operations. We could also be subject to environmental or nuisance claims from adjacent property owners or residents in the area arising from possible foul smells or other air or water discharges from the ethanol plant. Such claims may result in an adverse result in court if we are deemed to engage in a nuisance that substantially impairs the fair use and enjoyment of property.


Employees


As ofDecember 31, 2017,2020, we had a total of 3943 full-time employees. We do not expect to hire a significantthe number of employees to materially change in the next 12 months.


Financial Information about Geographic Areas

All of our operations are domiciled in the United States. All of the products sold to our customers for fiscal years 2017, 2016 and 2015 were produced in the United States and all of our long-lived assets are domiciled in the United States. We have engaged a third-party professional marketer that decides where the majority of our products are marketed and we have limited control over the marketing decisions made by our third-party professional marketer. Therefore, some of our products may be sold outside of the United States based on decisions made by our marketer.

ITEM 1A.    RISK FACTORS.


You should carefully read and consider the risks and uncertainties below and the other information contained in this report. The risks and uncertainties described below are not the only ones we may face. The following risks, together with additional risks and uncertainties not currently known to us or that we currently deem immaterial could impair our financial condition and results of operation.


Risks Relating to Our Business


We are subject to global and regional economic downturns and related risks and the effects of COVID-19 or another pandemic may materially and adversely affect demand and the market price for our products. The level of demand for our products is affected by global and regional demographic and macroeconomic conditions. A significant downturn in global economic growth, or recessionary conditions in major geographic regions for prolonged periods, may lead to reduced demand for our products, which could have a negative effect on the market price of our products. In December 2019, a novel coronavirus surfaced in Wuhan, China (“COVID-19”). The spread of COVID-19 worldwide has resulted in businesses suspending or substantially curtailing global operations and travel, quarantines, and an overall substantial slowdown of economic activity. Transportation fuels in particular, including ethanol, have experienced significant price declines and reduced demand. The effects of COVID-19 have and may continue to materially and adversely affect the market price for our products, our business, results of operations and liquidity.

COVID-19 or another pandemic may negatively impact our ability to operate our business which could decrease or eliminate the value of our units. COVID-19 has resulted in significant uncertainty in many areas of our business. We do not know how long these conditions will last. This uncertainty is expected to negatively impact our operations. We may experience labor shortages if our employees are unable or unwilling to come to work. If our suppliers cannot deliver the supplies we need to operate our business or if we are unable to ship our products due to trucking or rail shipping disruptions, we may be forced to suspend operations or reduce production. If we are unable to operate the ethanol plant at capacity, it may result in unfavorable operating results. Any shut down of operations or reduction in production, especially for an extended period of time, could reduce or eliminate the value of our units.

The EPA issued small refinery exemption waivers to the RFS requirement which has resulted in demand destruction and negatively impacted profitability in the ethanol industry. During 2019, the ethanol industry learned that the EPA has been issuing small refinery waivers to the ethanol use requirements in the RFS. In previous years, when the EPA issued small refinery exemption waivers, the EPA reallocated the waived gallons to other refiners. The EPA under the Trump Administration was granting significantly more waivers than in the past and was not reallocating the waived gallons to other refiners. These actions have resulted in demand destruction in 2019 and 2020 which led to reduced market ethanol prices and negative operating margins in the ethanol industry. This reduction in ethanol demand has negatively impacted the profitability of our operations. In January 2020, the Tenth Circuit Court of Appeals ruled that small refinery exemptions may only be granted to refineries that had secured them continuously each year since 2010. Consistent with this ruling, in September 2020, the EPA denied certain small refinery exemption petitions filed by oil refineries in 2020 seeking retroactive relief from their ethanol use requirements for prior years. These small refinery exemption waivers have impacted the ethanol industry which could reduce or eliminate the value of our units.

12

The spread between ethanol and corn prices can vary significantly which can negatively impact our financial condition. Our only source of revenue comes from sales of our ethanol, distillers grains and corn oil. The primary raw materials we use to produce our ethanol, distillers grains and corn oil are corn and natural gas. In order to operate the ethanol plant profitably, we must maintain a positive spread between the revenue we receive from sales of our products and our corn and natural gas costs. This spread between the market price of our products and our raw material costs has been volatile in the past. If we were to experience a period of time where this spread is negative, and the negative margins continue for an extended period of time, it may prevent us from profitably operating the ethanol plant which could decrease the value of our units.


Decreasing gasoline prices may lower ethanol prices which could negatively impact our ability to operate profitably. In recent years,Recently, the price of ethanol has been less than the price of gasoline which increased ethanol demand. However, in recent years, at times gasoline prices have decreased significantly which have reduced the spread between the price of gasoline and the price of ethanol. ThisWhen it occurs, this trend has negatively impacted ethanol prices. If this trend continues for a significant period of time, it could hurt our ability to profitably operate the ethanol plant which could decrease the value of our units.


Distillers grains demand and prices may be negatively impacted by the Chinese antidumping and countervailing duty investigation. China was historically the world's largest importer of distillers grains produced in the United States. On January 12, 2016, the Chinese government announced that it would commence an anti-dumping and countervailing duty investigation related to distillers grains imported from the United States. On September 23, 2016, the Chinese instituted a preliminary anti-dumping duty of 33% in response to this investigation and an anti-subsidy duty on September 30, 2016 of approximately 10%. In January 2017, the Chinese finalized the anti-dumping and anti-subsidy duties at rates higher than the preliminary rates set in September 2016.  The anti-dumping duties range from 42.2% to 53.7%, an increase from the preliminary duty of 33.8% issued in September 2016. The final anti-subsidy tariffs range from 11.2% to 12%, up from 10% to 10.7% issued in September 2016. Both during the investigation and after the announcement of the duty, distillers grains demand and prices have been negatively impacted. While we expect China to continue to import some distillers grains, we do not anticipate that the imports will be at the same level as previous years which could continue to negatively impact market distillers grains demand and prices. This reduction in demand along with lower domestic corn prices could negatively impact our ability to profitably operate the ethanol plant.

A reduction in ethanol exports to Brazil due to the imposition by the Brazilian government of a tariff on U.S. ethanol could have a negative impact on ethanol prices. Brazil has historically been a top destination for ethanol produced in the United States. However, in 2017, Brazil imposed a 20% tariff on ethanol which is produced in the United States and exported to Brazil. This tariff has resulted in a decline in demand for ethanol from Brazil and could negatively impact the market price of ethanol in the United States and our ability to profitably operate the ethanol plant.

We may be forced to reduce production or cease production altogether if we are unable to secure the corn we require to operate the ethanol plant. We require a significant amount of corn to operate the ethanol plant at capacity. In recent years, other than in our 2019 fiscal year, the supply of corn in the market has been higher and we have not had difficulty securing the corn we require at prices that allow us to operate profitably. However, poor weather conditions can have a significant impact on corn production. If the corn crop harvested in future years is smaller than we have recently experienced, it is possible that we could experience corn shortages in the future which could negatively impact our ability to operate the ethanol plant. We may also experience a shortage of corn in our local market which may not increase national corn prices but may require us to increase our corn basis in order to attract corn which can impact our overall corn costs. If we are unable to secure the corn we require to continue to operate the ethanol plant, or we

are unable to secure corn at prices that allow us to operate profitably, we may have to reduce production or cease operating altogether which may negatively impact the value of our units.


Our revenue will be greatly affected by the price at which we can sell our ethanol, distillers grains and corn oil. Our ability to generate revenue is dependent on our ability to sell the ethanol, distillers grains and corn oil that we produce. Ethanol, distillers grains and corn oil prices can be volatile as a result of a number of factors. These factors include overall supply and demand, the market price of corn, the market price of gasoline, levels of government support, general economic conditions and the availability and price of competing products. Ethanol, distillers grains and corn oil prices tend to fluctuate based on changes in energy prices and other commodity prices, such as corn and soybean meal. Exports of our products and the various trade actions taken by China and Brazil have impacted the market prices for our products. If we experience lower prices for our products for a significant period of time, the value of our units may be negatively affected.


Our business is not diversified. Our success depends primarily on our ability to profitably operate our ethanol plant. We do not have any other lines of business or any other significant source of revenue if we are unable to operate our ethanol plant and manufacture ethanol, distillers grains and corn oil. If economic or political factors adversely affect the market for ethanol, distillers grains and corn oil, we may not be able to continue our operations. Our business would also be significantly harmed if our ethanol plant could not operate at full capacity for any extended period of time, which could reduce or eliminate the value of our units.


Our inability to secure credit facilities we may require in the future may negatively impact our liquidity. While we do not currently require more financing than we have, in the future we may need additional financing. If we require financing in the future and we are unable to secure such financing, or we are unable to secure the financing we require on reasonable terms, it may have a negative impact on our liquidity which could negatively impact the value of our units.


Our product marketer may fail to market our products at competitive prices which may cause us to operate unprofitably.RPMG is the sole marketer of all of our ethanol, corn oil and some of our distillers grains, and we rely heavily on its marketing efforts to successfully sell our products. Because RPMG sells ethanol, corn oil and distillers grains for a number of other producers, we have limited control over its sales efforts. Our financial performance is dependent upon the financial health of RPMG as most of our revenue is attributable to RPMG's sales. If RPMG breaches our marketing agreements or it cannot market all of the ethanol, corn oil and distillers grains we produce, we may not have any readily available means to sell our ethanol, corn oil and distillers grains and our financial performance could be negatively affected. While we market a portion of our distillers grains internally to local consumers, we do not anticipate that we would have the ability to sell all of the distillers grains, corn oil and ethanol we produce ourselves. If our agreements with RPMG terminate, we may seek other arrangements to sell our ethanol, corn oil and distillers grains, including selling our own products, but we may not be able to achieve results comparable to those achieved by RPMG which could harm our financial performance. Switching marketers may negatively impact our cash flow and our ability to continue to operate the ethanol plant. If we are unable to sell all of our ethanol, distillers grain and corn oil at prices that allow us to operate profitably, it may decrease the value of our units.

13


We engage in hedging transactions which involve risks that could harm our business. We are exposed to market risk from changes in commodity prices. Exposure to commodity price risk results from our dependence on corn and natural gas in the ethanol production process. We seek to minimize the risks from fluctuations in the prices of corn, natural gas and ethanol through the use of hedging instruments. These hedging instruments can be risky and can negatively impact our liquidity. In times when commodity prices are volatile, we may be required to use significant amounts of cash to make margin calls as a result of our hedging positions. The effectiveness of our hedging strategies is dependent on the price of corn, natural gas and ethanol and our ability to sell sufficient products to use all of the corn and natural gas for which we have futures contracts. Our hedging activities may not successfully reduce the risk caused by price fluctuation which may leave us vulnerable to corn and natural gas prices. We may choose not to engage in hedging transactions in the future and our operations and financial conditions may be adversely affected during periods in which corn and/or natural gas prices increase. These hedging transactions could impact our ability to profitably operate the ethanol plant and negatively impact our liquidity.


We may incur casualty losses that are not covered by insurance which could negatively impact the value of our units. We have purchased insurance which we believe adequately covers our potential losses from foreseeable risks. However, there are risks that we may encounter for which there is no insurance or for which insurance is not available on terms that are acceptable to us. If we experience a loss which materially impairs our ability to operate the ethanol plant which is not covered by insurance, the value of our units could be reduced or eliminated.


Our operations may be negatively impacted by natural disasters, severe weather conditions, and other unforeseen plant shutdowns which can negatively impact our operations. Our operations may be negatively impacted by events outside of our control such as natural disasters, severe weather, strikes, train derailments and other unforeseen events which may negatively

impact our operations. If we experience any of these unforeseen circumstances which negatively impact our operations, it may affect our cash flow and negatively impact the value of our business.


We depend on our management and key employees, and the loss of these relationships could negatively impact our ability to operate profitably. We are highly dependent on our management team to operate our ethanol plant. We may not be able to replace these individuals should thethey decide to cease their employment with us, or if they become unavailable for any other reason. While we seek to compensate our management and key employees in a manner that will encourage them to continue their employment with us, they may choose to seek other employment. Any loss of these managers or key employees may prevent us from operating the ethanol plant profitably and could decrease the value of our units.


We may violate the terms of our loan agreements and financial covenants which could result in our lender demanding immediate repayment of our loans. We have a credit facility with Farm Credit Services of America ("FCSA").Credit. Our credit agreements with FCSAFarm Credit include various financial loan covenants. We are currently in compliance with all of our financial loan covenants. Current management projections indicate that we will be in compliance with our loan covenants for at least the next 12 months. However, unforeseen circumstances may develop which could result in us violating our loan covenants. If we violate the terms of our loan agreements, FCSA,Farm Credit, our primary lender, could deem us in default of our loans and require us to immediately repay any outstanding balance of our loans. If we do not have the funds available to repay the loans and we cannot find another source of financing, we may fail which could decrease the value of our units.


Risks Related to Ethanol Industry


Excess ethanol supply in the market could put negative pressure on the price of ethanol which could lead to tight operating margins and may impact our ability to operate profitably. In the past the ethanol industry has confronted market conditions where ethanol supply exceeded demand which led to unfavorable operating conditions. Most recently, in 2012, profitability in the ethanol industry was reduced due to increased ethanol imports from Brazil at a time when gasoline demand in the United States was lower and domestic ethanol supplies were higher. This disconnect between ethanol supply and demand resulted in lower ethanol prices at a time when corn prices were higher which led to unfavorable operating conditions. We may experience periods of time when ethanol supply exceeds demand which could negatively impact our profitability. During 2020 we experienced excess ethanol supply compared to demand which negatively impacted profitability in the industry. The United States benefited from additional exports of ethanol in recent years which may not continue to occur during our 20182021 fiscal year. We may experience periods of ethanol supply and demand imbalance during our 20182021 fiscal year. If we experience excess ethanol supply, either due to increased ethanol production or lower gasolinedomestic or foreign demand, it could negatively impact the price of ethanol which could hurt our ability to profitably operate the ethanol plant.


Demand for ethanol may not increase past current levels unless higher percentage blends of ethanol are more widely used. Currently, ethanol is primarily blended with gasoline for use in standard (non-flex fuel) vehicles to create a blend which is 10% ethanol and 90% gasoline. Estimates indicate that approximately 140143 billion gallons of gasoline are sold in the
14

United States each year. Assuming that all gasoline in the United States is blended at a rate of 10% ethanol and 90% gasoline, the maximum domestic demand for ethanol is 14.014.3 billion gallons. This is commonly referred to as the "blend wall," which represents a theoretical limit where more ethanol cannot be blended into the national gasoline pool. Many in the ethanol industry believe that the ethanol industry has reached this blend wall. In order to expand demand for ethanol, higher percentage blends of ethanol must be utilized in standard vehicles. Such higher percentage blends of ethanol are a contentious issue. Automobile manufacturers and environmental groups have fought against higher percentage ethanol blends. The EPA approved the use of E15 for standard (non-flex fuel) vehicles produced in the model year 2001 and later. The fact that E15 has not been approved for use in all vehicles and the labeling requirements associated with E15 may lead to gasoline retailers refusing to carry E15. In addition, restrictions on the evaporative emissions of E15 during the summer months can limit the availability of E15 in some markets. Without an increase in the allowable percentage blends of ethanol that can be used in all vehicles, demand for ethanol may not continue to increase which could decrease the selling price of ethanol and could result in our inability to operate the ethanol plant profitably, which could reduce or eliminate the value of our units.


Technology advances in the commercialization of cellulosic ethanol may decrease demand for corn-based ethanol which may negatively affect our profitability. The current trend in ethanol production research is to develop an efficient method of producing ethanol from cellulose-based biomass, such as agricultural waste, forest residue, municipal solid waste, and energy crops. This trend is driven by the fact that cellulose-based biomass is generally cheaper than corn, and producing ethanol from cellulose-based biomass would create opportunities to produce ethanol in areas of the country which are unable to grow corn. The Energy Independence and Security Act of 2007 and the 2008 Farm Bill offer strong incentives to develop commercial scale cellulosic ethanol. The RFS requires that 16 billion gallons per year of advanced bio-fuels must be consumed in the United States by 2022. Additionally, state and federal grants have been awarded to several companies which are seeking to develop commercial scale cellulosic ethanol plants. This has encouraged innovation and has led to several companies that are either in the process of building or have completed and are operating commercial scale cellulosic ethanol plants. If an efficient method of producing

ethanol from cellulose-based biomass is developed, we may not be able to compete effectively. If we are unable to produce ethanol as cost-effectively as cellulose-based producers, our ability to generate revenue and our financial condition will be negatively impacted.

Changes and advances in ethanol production technology could require us to incur costs to update our plant or could otherwise hinder our ability to compete in the ethanol industry or operate profitably.  Advances and changes in the technology of ethanol production are expected to occur.  Such advances and changes may make the ethanol production technology installed in our plant less desirable or obsolete.  These advances could also allow our competitors to produce ethanol at a lower cost than we are able.  If we are unable to adopt or incorporate technological advances, our ethanol production methods and processes could be less efficient than our competitors, which could cause our plant to become uncompetitive or completely obsolete.  If our competitors develop, obtain or license technology that is superior to ours or that makes our technology obsolete, we may be required to incur significant costs to enhance or acquire new technology so that our ethanol production remains competitive.  Alternatively, we may be required to seek third-party licenses, which could also result in significant expenditures.  These third-party licenses may not be available or, once obtained, they may not continue to be available on commercially reasonable terms.  These costs could negatively impact our financial performance by increasing our operating costs and reducing our net income.


Decreases in ethanol demand may result in excess production capacity in our industry. The supply of domestically produced ethanol is at an all-time high. According to the Renewable Fuels Association, as of January 23, 2018,December 31, 2020, there are 213210 ethanol plants in the United States with capacity to produceproduct approximately 16.217.6 billion gallons of ethanol per year. Excess ethanol production capacity may have an adverse impact on our results of operations, cash flows and general financial condition. According to the Renewable Fuels Association, approximately 3% of the ethanol production capacity in the United States was idled as of January 23, 2018. Further, ethanol demand may be negatively impacted by reductions in the RFS. While the United States is currently exporting ethanol which has generally resulted in increased ethanol demand, these ethanol exports may not continue. If ethanol demand does not grow at the same pace as increases in supply, we expect the selling price of ethanol to decline. If excess capacity in the ethanol industry continues to occur, the market price of ethanol may decline to a level that is inadequate to generate sufficient cash flow to cover our costs, which could negatively affect our profitability.


We operate in an intensely competitive industry and compete with larger, better financed companies which could impact our ability to operate profitably.  There is significant competition among ethanol producers. There are numerous producer-owned and privately-owned ethanol plants operating throughout the Midwest and elsewhere in the United States.  We also face competition from ethanol producers located outside of the United States. The largest ethanol producers include Archer Daniels Midland, Flint Hills Resources, Green Plains Renewable Energy, POET Biorefining, and Valero Renewable Fuels, each of which is capable of producing significantly more ethanol than we produce. Further, many believe that there will be consolidation occurring in the ethanol industry which will likely lead to a few companies that control a significant portion of the United States ethanol production market. We may not be able to compete with these larger producers. These larger ethanol producers may be able to affect the ethanol market in ways that are not beneficial to us which could negatively impact our financial performance and the value of our units.


Competition from the advancement of alternative fuels and other technologies may lessen demand for ethanol. Alternative fuels, gasoline oxygenates and ethanol production methods are continually under development. A number of automotive, industrial and power generation manufacturers are developing alternative clean power systems using fuel cells, plug-in hybrids, and electric cars or clean burning gaseous fuels. Like ethanol, these emerging technologies offer an option to address worldwide energy costs, the long-term availability of petroleum reserves and environmental concerns. If these alternative technologies continue to expand and gain broad acceptance and become readily available to consumers for motor vehicle use, we may not be able to compete effectively. This additional competition could reduce the demand for ethanol, resulting in lower ethanol prices that might adversely affect our results of operations and financial condition.


Consumer resistance to the use of ethanol based on the belief that ethanol is expensive, adds to air pollution, harms engines and/or takes more energy to produce than it contributes or based on perceived issues related to the use of corn as the feedstock to produce ethanol may affect demand for ethanol.  Certain individuals believe that the use of ethanol will have a negative impact on gasoline prices at the pump. Some also believe that ethanol adds to air pollution and harms car and truck
15

engines. Still other consumers believe that the process of producing ethanol actually uses more fossil energy, such as oil and natural gas, than the amount of energy that is produced. Further, some consumers object to the fact that ethanol is produced using corn as the feedstock which these consumers perceive as negatively impacting food prices. These consumer beliefs could potentially be wide-spread and may be increasing as a result of recent efforts to increase the allowable percentage of ethanol that may be blended for use in vehicles. If consumers choose not to buy ethanol based on these beliefs, it would affect demand for the ethanol we produce which could negatively affect our profitability and financial condition.


If exports of ethanol are reduced, including as a result of the imposition byof tariffs on U.S. ethanol, ethanol prices may be negatively impacted. The United States ethanol industry was supported during our 20172020 fiscal year with exports of ethanol, which has generally over the recent years increased demand for our ethanol. Management believes these additional exports of ethanol were due to lower market ethanol prices in the United States and increased global demand for ethanol. However, these ethanol exports may not continue. In 2012, the European Union concluded an anti-dumping investigation related to ethanol produced in the United States and exported to Europe. As a result of this investigation, the European Union has imposed a tariff on ethanol which is produced in the United States and exported to Europe. Further, in 2017 both Brazil and China implemented tariffs on ethanol produced in the United States. These tariffs have resulted in decreased demand for ethanol from these countries which has negatively impacted ethanol prices in the United States. Any decrease in ethanol prices or demand may negatively impact our ability to profitably operate the ethanol plant.


    Distillers grains demand and prices may continue to be negatively impacted by the Chinese antidumping and countervailing duty investigation. China was historically the world's largest importer of distillers grains produced in the United States. On January 12, 2016, the Chinese government announced that it would commence an anti-dumping and countervailing duty investigation related to distillers grains imported from the United States. In January 2017, the Chinese set the final anti-dumping duties from 42.2% to 53.7%, and set the final anti-subsidy tariffs from 11.2% to 12%. Both during the investigation and after the announcement of the duty, distillers grains demand and prices have been negatively impacted. While we expect China to continue to import some distillers grains, due to continued trade disputes and tensions between the United States and China, management does not expect these tariffs to be removed in the near term which could continue to negatively impact market distillers grains demand and prices. This reduction in demand along with lower domestic corn prices could negatively impact our ability to profitably operate the ethanol plant.

    A reduction in ethanol exports to Brazil due to the imposition by the Brazilian government of a tariff on U.S. ethanol could have a negative impact on ethanol prices. Brazil has historically been a top destination for ethanol produced in the United States. However, in 2017, Brazil imposed a 20% tariff on ethanol which is produced in the United States and exported to Brazil. This tariff has resulted in a decline in demand for ethanol from Brazil. The effect of the tariff had been mitigated somewhat by the adoption of a rate tariff quota that allowed 750 million liters of ethanol annually to be allowed into Brazil before the tariff applies. However, this rate tariff quota expired on December 14, 2020, so all of the ethanol exports to Brazil is now subject to the 20% tariff. This tariff has negatively impacted ethanol demand and prices in the United States, and could negatively impact our ability to profitably operate the ethanol plant.

Overcapacity within the ethanol industry could cause an oversupply of ethanol and a decline in ethanol prices. Excess ethanol production capacity could have an adverse impact on our results of operations, cash flows and general financial condition. If demand for ethanol does not grow at the same pace as increases in supply, we would expect the price of ethanol to decline. If excess capacity in the ethanol industry occurs, the market price of ethanol may decline to a level that is inadequate to generate sufficient cash flow to cover our costs which could reduce the value of our units.


Many ethanol producers are expanding their production capacity which could lead to an oversupply of ethanol in the United States. Recently, many ethanol producers have commenced projects to expand their ethanol production capacities. These expansions could result in a significant increase in the supply of ethanol in the United States. Currently, ethanol prices are supported by ethanol exports which may not continue at their current levels. While many in the ethanol industry are working to increase the amount of ethanol that is used domestically, specifically in the form of E15, which contains 15% ethanol as compared to the 10% ethanol which is used in most current blends, adoption of E15 has not been as rapid as most ethanol producers would like. Also, the additional ethanol capacity which is being constructed may exceed current domestic and export demand. An oversupply of ethanol negatively impacts domestic ethanol prices which could negatively impact our ability to profitably operate the ethanol plant.


We made significant investments in Guardian Hankinson, LLC and Ring-neck Energy & Feed, LLC which may fail. In December 2013, we made a $12 million investment in Guardian Hankinson, LLC, an entity that owns an ethanol plant in North Dakota. In addition, in July 2017, we made a $10 million investment in Ring-neck Energy & Feed, LLC. Both of these companies will face many of the same risks that we face in operating our ethanol plant. Further, we have limited control over the management decisions made by Guardian Hankinson, LLC and Ring-neck Energy & Feed, LLC. If Guardian Hankinson, LLC or Ring-neck Energy & Feed, LLC is ultimately unsuccessful, it could negatively impact the return we receive on our investment which could negatively impact our financial performance and the value of our units.

16


    Failures of our information technology infrastructure could have a material adverse effect on operations.  We utilize various software applications and other information technology that are critically important to our business operations. We rely on information technology networks and systems, including the Internet, to process, transmit and store electronic and financial information, to manage a variety of business processes and activities, including production, manufacturing, financial, logistics, sales, marketing and administrative functions. We depend on our information technology infrastructure to communicate internally and externally with employees, customers, suppliers and others. We also use information technology networks and systems to comply with regulatory, legal and tax requirements. These information technology systems, some of which are managed by third parties, may be susceptible to damage, disruptions or shutdowns due to failures during the process of upgrading or replacing software, databases or components thereof, power outages, hardware failures, computer viruses and ransomware attacks by computer hackers or other cybersecurity risks, telecommunication failures, user errors, natural disasters, terrorist attacks or other catastrophic events. If any of our significant information technology systems suffer severe damage, disruption or shutdown, and our disaster recovery and business continuity plans do not effectively resolve the issues in a timely manner, our product sales, financial condition and results of operations may be materially and adversely affected.                           

    A cyber attack or other information security breach could have a material adverse effect on our operations and result in financial losses. We are regularly the target of attempted cyber and other security threats and must continuously monitor and develop our information technology networks and infrastructure to prevent, detect, address and mitigate the risk of unauthorized access, misuse, computer viruses and ransomware as well as other events that could have a security impact.  If we are unable to prevent cyber attacks and other information security breaches, we may encounter significant disruptions in our operations which could adversely impact our business, financial condition and results of operations or result in the unauthorized disclosure of confidential information. Such breaches may also harm our reputation, result in financial losses or subject us to litigation or other costs or penalties.

Risks Related to Regulation and Governmental Action


Government incentives for ethanol production may be reduced or eliminated in the future, which could hinder our ability to operate at a profit.The ethanol industry is assisted by various federal and state ethanol incentives, includingthe most important of which is the RFS set forth in the Energy Policy Act of 2005. The RFS helps support a market for ethanol that might disappear without this incentive. The United States Environmental Protection Agency ("EPA")EPA has the authority to waive the RFS statutory volume requirement, in whole or in part, provided certain conditions have been met. Annually, the EPA is supposed to pass a rule that establishes the number of gallons of different types of renewable fuels that must be used in the United States which is called the renewable volume obligations. In the past, the EPA has set the renewable volume obligations below the statutory volume requirements. On November 30, 2017,December 19, 2019, the EPA released its final rule and set the 20182020 total volume obligation at 19.2920.09 billion gallons of which 15.0 billion gallons could be met by corn-based ethanol. The EPA has not yet set the RVO for 2021. If the EPA were to significantly reduce the volume requirements under the RFS or if the RFS were to be otherwise reduced or eliminated by the exercise of the EPA waiver authority or by Congress in the future, the market price and demand for ethanol could decrease which will negatively impact our financial performance.


The California Low Carbon Fuel Standard may decrease demand for corn-based ethanol which could negatively impact our profitability. California passed a Low Carbon Fuels Standard ("LCFS") which requires that renewable fuels used in California must accomplish certain reductions in greenhouse gases which reductions are measured using a lifecycle analysis. Management believes that these regulations could preclude corn-based ethanol produced in the Midwest from being used in California. California represents a significant ethanol demand market. If the ethanol industry is unable to supply corn-based ethanol to California, it could significantly reduce demand for the ethanol we produce. This could result in a reduction of our revenues and negatively impact our ability to profitably operate the ethanol plant.


Recently passed taxTax reform legislation could impact our members. On December 22, 2017, President Trump signed the Tax Cuts and Jobs Act (the "Tax Reform Act"), which amends certain provisions of the Internal Revenue Code of 1986, as amended (the "Code"). The Tax Reform Act has wide ranging impacts, including changes to the taxation of limited liabilities companies such as the Company. The Tax Reform Act includes changes to U.S. federal tax rates, limits the deductibility of interest and allows for the expensing of capital expenditures. The impact of this tax reform on the Company and its members is uncertain but the effect of the Tax Reform Act and any implementing regulations and interpretations could adversely affect our business and financial condition and require that we restructure the Company.


Changes in environmental regulations or violations of these regulations could be expensive and reduce our profitability.  We are subject to extensive air, water and other environmental laws and regulations. In addition, some of these laws require our plant to operate under a number of environmental permits. These laws, regulations and permits can often require expensive pollution control equipment or operational changes to limit actual or potential impacts to the environment. A
17

violation of these laws and regulations or permit conditions can result in substantial fines, damages, criminal sanctions, permit revocations and/or plant shutdowns. In the future, we may be subject to legal actions brought by environmental advocacy groups and other parties for actual or alleged violations of environmental laws or our permits. Additionally, any changes in environmental laws and regulations, both at the federal and state level, could require us to spend considerable resources in order to comply with future environmental regulations. The expense of compliance could be significant enough to reduce our profitability and negatively affect our financial condition.


Carbon dioxide may be regulated in the future by the EPA as an air pollutant requiring us to obtain additional permits and install additional environmental mitigation equipment, which could adversely affect our financial performance. In 2007, the Supreme Court decided a case in which it ruled that carbon dioxide is an air pollutant under the Clean Air Act for motor vehicle emissions. In 2011 the EPA issued a tailoring rule that deferred greenhouse gas regulations for ethanol plants until July of 2014. However, in July of 2013 the D.C. Circuit issued an opinion vacating the EPA's deferral of those regulations for biogenic sources, including ethanol plants. On June 23, 2014 the U.S. Supreme Court affirmed in part and reversed in part the D.C. Circuit’s decision. For plants that already hold PSD permits the court generally affirmed the EPA's ability to regulate greenhouse gas regulations. Our plant produces a significant amount of carbon dioxide. While there are currently no regulations restricting carbon dioxide emissions, if the EPA or the State of South Dakota were to regulate carbon dioxide emissions by plants such as ours, we may have to apply for additional permits or we may be required to install carbon dioxide mitigation equipment or take other as yet unknown steps to comply with these potential regulations. Compliance with any future regulation of carbon dioxide, if it occurs, could be costly and may prevent us from operating the ethanol plant profitably which could decrease or eliminate the value of our units.


    Government policies and regulations, particularly those affecting the agricultural sector and related industries, could adversely affect our operations and profitability.  Agricultural commodity production and trade flows are significantly affected by government policies and regulations.  Governmental policies affecting the agricultural industry, such as taxes, trade tariffs, duties, subsidies, import and export restrictions on commodities and commodity products, can influence industry profitability, the planting of certain crops, the location and size of crop production, whether unprocessed or processed commodity products are traded, and the volume and types of imports and exports.  In addition, international trade disputes can adversely affect trade flows by limiting or disrupting trade between countries or regions. Future governmental policies, regulations or actions affecting our industry may adversely affect the supply of, demand for and prices of our products, restrict our ability to do business and cause our financial results to suffer. We may experience negative impacts of higher ethanol tariffs and other disruptions to international agricultural trade. In April of 2018, the Chinese government increased the tariff on United States ethanol imports into China from 30% to 45% and ultimately 70%.  We cannot estimate the exact effect this tariff increase will have on the overall domestic ethanol market.  However, the increased tariff is expected to reduce overall United States ethanol export demand, which could have a negative effect on domestic ethanol prices.

ITEM 2.     PROPERTIES.


We own Dakota Ethanol as a wholly-owned subsidiary. The ethanol plant is located on Dakota Ethanol's 210-acre rural site near Wentworth, South Dakota. All of our operations occur at our plant in Wentworth, South Dakota.


All of Dakota Ethanol's tangible and intangible property, real and personal, serves as the collateral for debt financing with FCSA described below under "Item 7 - Management's Discussion and Analysis of Financial Condition and Results of Operations - Indebtedness."


ITEM 3.     LEGAL PROCEEDINGS.


From time to time in the ordinary course of business, Dakota Ethanol or Lake Area Corn Processors may be named as a defendant in legal proceedings related to various issues, including, worker's compensation claims, tort claims, or contractual disputes. We are not currently involved in any material legal proceedings, directly or indirectly, and we are not aware of any claims pending or threatened against us or any of the managers that could result in the commencement of material legal proceedings.


ITEM 4.     MINE SAFETY DISCLOSURESDISCLOSURES.


None.


18

PART II


ITEM 5.     MARKET FOR REGISTRANT'S COMMON EQUITY, RELATED MEMBER MATTERS AND ISSUER PURCHASES OF EQUITY SECURITIES.


Recent Sales of Unregistered Equity Securities


None.


Market Information


There is no public trading market for our units. Our units may only be transferred in accordance with our Capital Units Transfer System, which provides for transfers by gift to family members, upon death, and through a qualified matching service, subject to approval by our board of managers. Our qualified matching service is operated through Variable Investment Advisors, Inc., a registered broker-dealer based in Sioux Falls, South Dakota. Variable Investment Advisor's Alternative Trading System may be accessed at www.agstocktrade.com. The matching service consists of an electronic bulletin board that provides information to prospective sellers and buyers of our units. We do not receive any compensation relating to the matching service. We have no role in effecting the transactions beyond approval, as required under our operating agreement, and the issuance of new certificates. So long as we remain a publicly reporting company, information about us will be publicly available through the SEC's filing system.


Unit Holders


As of March 2, 2018,12, 2021, we had 29,620,000 membership units issued and outstanding and a total of approximately 1,069 unit holders.


Bid and Asked Prices


The following table contains historical information concerning completed unit transactions that occurred during our last two fiscal years. Our bulletin board trading system does not track bid and asked prices and therefore we only have information concerning completed unit transactions.
Quarter Low Price High Price Average Price 
Number of
Units Traded
First Quarter 2016 $2.87
 $3.80
 $3.27
 23,500
Second Quarter 2016 2.79
 3.00
 2.88
 64,500
Third Quarter 2016 4.00
 4.00
 4.00
 2,000
Fourth Quarter 2016 3.05
 4.15
 3.77
 19,000
First Quarter 2017 3.95
 4.15
 4.01
 28,000
Second Quarter 2017 3.86
 4.10
 3.89
 45,000
Third Quarter 2017 3.50
 3.51
 3.51
 20,000
Fourth Quarter 2017 3.39
 3.50
 3.45
 12,500
QuarterLow PriceHigh PriceAverage PriceNumber of
Units Traded
First Quarter 2019$3.09 $3.25 $3.15 $23,000 
Second Quarter 20193.00 3.10 3.02 54,500 
Third Quarter 20192.75 2.80 2.79 31,500 
Fourth Quarter 20192.40 2.50 2.43 29,000 
First Quarter 20202.10 2.34 2.16 59,000 
Second Quarter 2020— — — — 
Third Quarter 20201.50 1.51 1.50 45,000 
Fourth Quarter 20201.57 1.63 1.61 90,000 
 
Distributions


Under the terms of our Third Amended and Restated Operating Agreement, we are required to make distributions to our members and may not retain more than $200,000 of net cash from operations, unless: (1) a 75% super-majority of our    Our board of managers decides otherwise; (2) it would violate or cause a default underhas complete discretion over the termstiming and amount of any debt financing or other credit facilities; or (3) it is otherwise prohibited by law. Our ability to make distributions to our members is dependent upon the distributions made to us by Dakota Ethanol. All net income generated from plant operations is distributed by Dakota Ethanol to us since Dakota Ethanol is our wholly-owned subsidiary. We distribute the net income received from Dakota Ethanol to our unit holders subject to certain restrictions in proportionour credit agreements and our operating agreement. Our expectations with respect to the number of units held by each unit holder. A unit holder's distribution percentage is determined by dividing the number of units owned by such unit holder by the total number of units outstanding. We anticipate continuing to monitor our financial performance and projected financial performance and we expectability to make future distributions at such timesare discussed further in "Item 7. Management's Discussion and in such amounts as will allow us to continue to profitably operate the ethanol plant, maintain compliance with ourAnalysis of Financial Condition and Results of Operations." Distributions are restricted by certain loan covenants and maintainin our liquidity.credit agreements with Farm Credit.


19

2017 Distributions


2016 Distributions

Our board of managers declared three distributions during our 2016 fiscal year. Two distributions were for $0.10 per membership unit and the third was for $0.20 per membership unit for a total of $0.40 per membership unit during our 2016 fiscal year. Our distributions were declared and paid in May, July and November 2016. The total amount of the distributions we paid was $11,848,000.

Performance Graph


The following graph shows a comparison of cumulative total member return since December 31, 2012,2015, calculated on a dividend reinvested basis, for the Company, the NASDAQ Composite Index (the "NASDAQ Market Index") and an index of other companies that have the same SIC code as the Company (the "SIC Code Index"). The graph assumes $100 was invested in each of our units, the NASDAQ Market Index, and the SIC Code Index on December 31, 2012.2015. Data points on the graph are annual. Note that historic unit price performance is not necessarily indicative of future unit price performance. The data for this performance graph was compiled for us by Zacks Investment Research, Inc.


lacp-20201231_g1.jpg

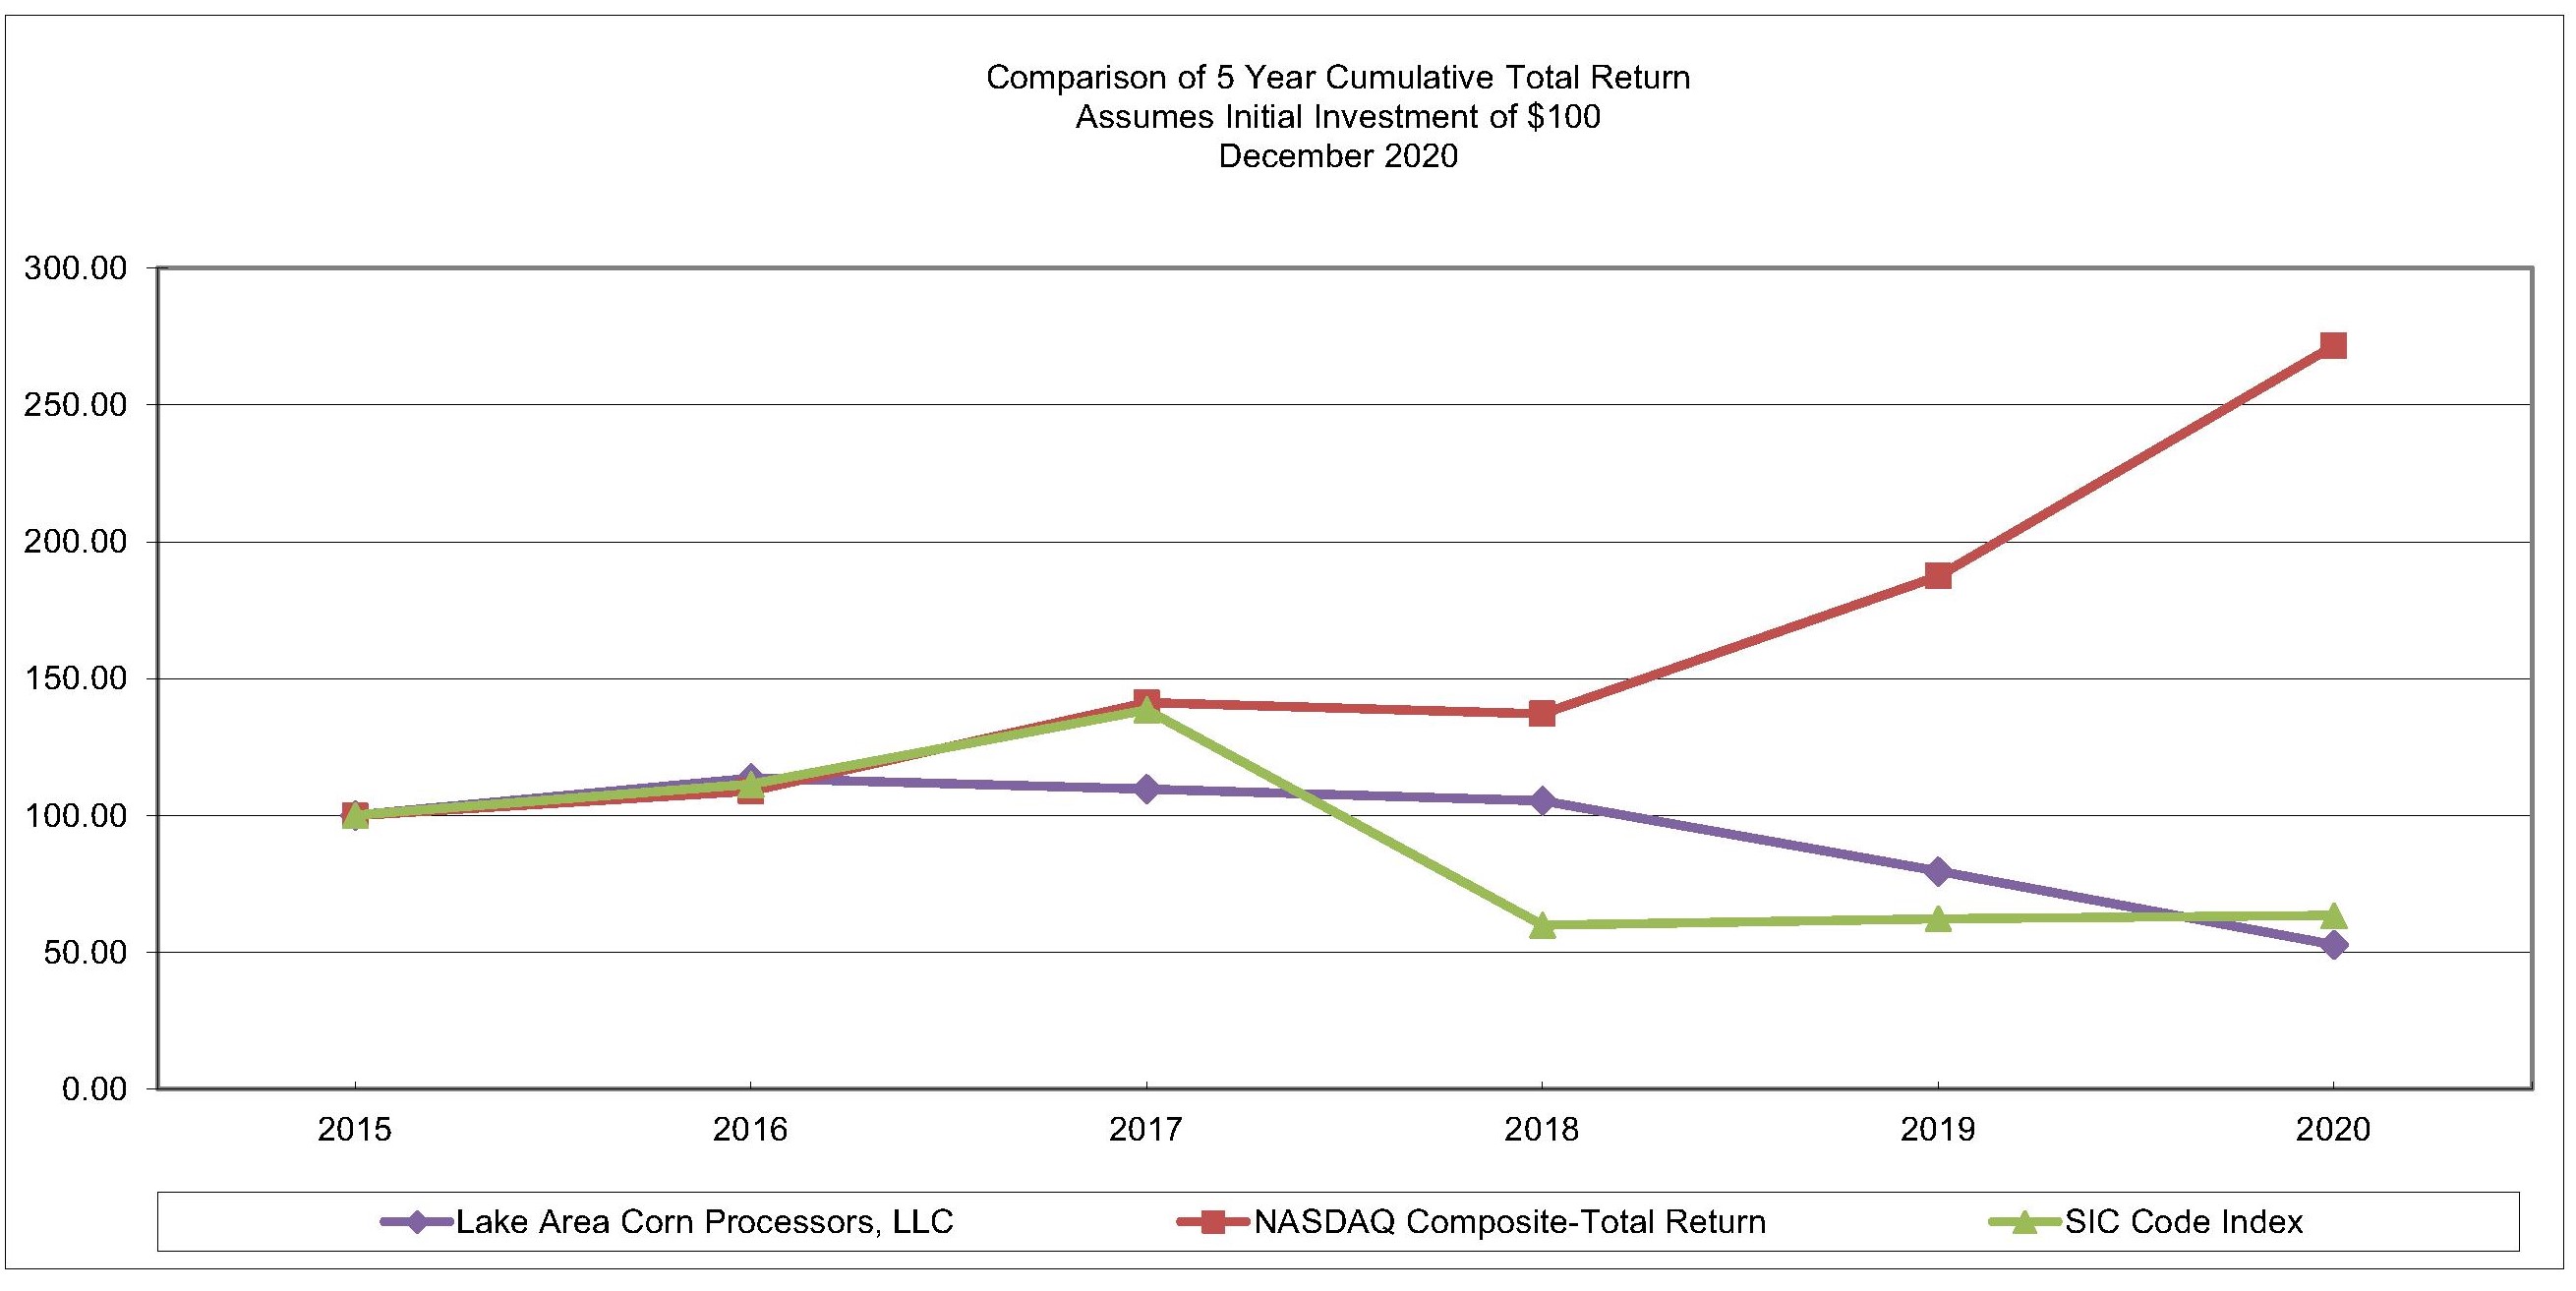
Pursuant to the rules and regulations of the Securities and Exchange Commission, the performance graph and the information set forth therein shall not be deemed to be filed for purposes of Section 18 of the Securities Exchange Act of 1934, and shall not be deemed to be incorporated by reference in any filing under the Securities Act of 1933, as amended, or the Exchange Act, except as shall be expressly set forth by specific reference in such a filing.


ITEM 6.     SELECTED FINANCIAL DATADATA.


The following table sets forth selected consolidated financial data, which is derived from our audited financial statements for the periods indicated. The selected consolidated balance sheet financial data as of December 31, 2015, 20142018, 2017 and 20132016 and the selected consolidated income statement data and other financial data for the years ended December 31, 20142017 and 20132016 have been derived from our audited consolidated financial statements that are not included in this Form 10-K. The selected consolidated balance sheet financial data as of December 31, 20172020and 20162019 and the selected consolidated income statement data and other

financial data for each of the years in the three year period ended December 31, 20172020 have been derived from the audited Consolidated Financial Statements included elsewhere in this Form 10-K. You should read the following table in conjunction with (i) the consolidated financial statements and accompanying notes included elsewhere in this Form 10-K; (ii) "Item 7 - Management's Discussion and Analysis of Financial Condition and Results of Operations"; and (iii) "Item 1A - Risk Factors"found elsewhere in this Form 10-K. Among other things, those items include more detailed information regarding the basis of presentation for the following consolidated financial data.
20

Statement of Operations Data: 2017 2016 2015 2014 2013Statement of Operations Data:20202019201820172016
Revenues $84,821,788
 $88,812,550
 $88,997,947
 $124,469,094
 $145,412,968
Revenues$130,521,814 $115,986,821 $74,703,630 $84,821,788 $88,812,550 
Cost of Revenues 76,253,945
 76,097,861
 81,445,770
 89,068,125
 129,091,165
Cost of Revenues124,493,268 114,687,231 68,619,694 76,253,945 76,097,861 
Gross Profit 8,567,843
 12,714,689
 7,552,177
 35,400,969
 16,321,803
Gross Profit6,028,546 1,299,590 6,083,936 8,567,843 12,714,689 
Operating Expense 3,717,291
 3,642,087
 1,827,789
 3,550,980
 3,511,026
Operating Expense4,418,074 4,060,343 3,837,659 3,717,291 3,642,087 
Income From Operations 4,850,552
 9,072,602
 5,724,388
 31,849,989
 12,810,777
Income (Loss) From OperationsIncome (Loss) From Operations1,610,472 (2,760,753)2,246,277 4,850,552 9,072,602 
Other Income (Expense) 1,534,531
 2,332,606
 2,929,142
 7,957,330
 494,070
Other Income (Expense)(554,833)(1,063,431)470,310 1,534,531 2,332,606 
Net Income $6,385,083
 $11,405,208
 $8,653,530
 $39,807,319
 $13,304,847
Net Income (Loss)Net Income (Loss)$1,055,639 $(3,824,184)$2,716,587 $6,385,083 $11,405,208 
Capital Units Outstanding 29,620,000
 29,620,000
 29,620,000
 29,620,000
 29,620,000
Capital Units Outstanding29,620,000 29,620,000 29,620,000 29,620,000 29,620,000 
Net Income Per Capital Unit $0.22
 $0.39
 $0.29
 $1.34
 $0.45
Net Income (Loss) Per Capital UnitNet Income (Loss) Per Capital Unit$0.04 $(0.13)$0.09 $0.22 $0.39 
Cash Distributions per Capital Unit $0.20
 $0.40
 $0.30
 $1.00
 $0.20
Cash Distributions per Capital Unit$— $— $0.10 $0.20 $0.40 
          
Balance Sheet Data: 2017 2016 2015 2014 2013Balance Sheet Data:20202019201820172016
Working Capital $6,131,109
 $11,313,046
 $8,443,572
 $6,634,185
 $17,836,992
Working Capital$12,348,891 $8,323,445 $72,709 $6,131,109 $11,313,046 
Net Property, Plant & Equipment 39,968,930
 34,824,202
 34,184,059
 28,349,272
 22,958,064
Net Property, Plant & Equipment61,367,497 66,707,481 63,748,268 39,968,930 34,824,202 
Total Assets 84,072,240
 78,116,089
 79,746,514
 78,574,975
 82,577,805
Total Assets121,857,947 119,810,318 102,866,072 84,072,240 78,116,089 
Long-Term Obligations 6,983,944
 26,556
 106,475
 226,940
 9,170,592
Long-Term Obligations35,561,237 37,993,208 23,593,368 6,983,944 26,556 
Members' Equity 68,282,537
 67,821,454
 68,264,246
 68,600,228
 58,455,182
Members' Equity65,268,579 64,212,940 68,037,124 68,282,537 67,821,454 
Book Value Per Capital Unit $2.31
 $2.29
 $2.30
 $2.32
 $1.97
Book Value Per Capital Unit$2.20 $2.17 $2.30 $2.31 $2.29 


21

Table of Contents
ITEM 7.     MANAGEMENT'S DISCUSSION AND ANALYSIS OF FINANCIAL CONDITION AND RESULTS OF OPERATIONSOPERATIONS.
 
Results of Operations


Comparison of the Fiscal Years Ended December 31, 20172020 and 20162019


The following table shows the results of our operations and the percentage of revenues, cost of revenues, operating expenses and other items to total revenues in our consolidated statements of operations for the fiscal years ended December 31, 20172020 and 2016:2019:
20202019
Income Statement DataAmount%Amount%
Revenue$130,521,814 100.0 $115,986,821 100.0 
Cost of Revenues124,493,268 95.4 114,687,231 98.9 
Gross Profit6,028,546 4.6 1,299,590 1.1 
Operating Expense4,418,074 3.4 4,060,343 3.5 
Income (Loss) from Operations1,610,472 1.2 (2,760,753)(2.4)
Other Income (Expense)(554,833)(0.4)(1,063,431)(0.9)
Net Income (Loss)$1,055,639 0.8 $(3,824,184)(3.3)
  2017 2016
Income Statement Data Amount % Amount %
Revenue $84,821,788
 100.0
 $88,812,550
 100.0
         
Cost of Revenues 76,253,945
 89.9
 76,097,861
 85.7
         
Gross Profit 8,567,843
 10.1
 12,714,689
 14.3
         
Operating Expense 3,717,291
 4.4
 3,642,087
 4.1
         
Income from Operations 4,850,552
 5.7
 9,072,602
 10.2
         
Other Income 1,534,531
 1.8
 2,332,606
 2.6
         
Net Income $6,385,083
 7.5
 $11,405,208
 12.8


Revenues
Revenues

Revenue from ethanol sales decreasedincreased by approximately 3%9.6% during our 20172020 fiscal year compared to the same period of 2016.2019. Revenue from distillers grains sales decreasedincreased by approximately 12%20.4% during our 20172020 fiscal year compared to the same period of 2016.2019. Revenue from corn oil sales increased by approximately 8%35.6% during our 20172020 fiscal year compared to the same period of 2016.2019.


Ethanol


Our ethanol revenue decreasedincreased by approximately $1.9 million9.6% during our 20172020 fiscal year compared to our 20162019 fiscal year, a decrease of approximately 3%.year. This decreaseincrease in ethanol revenue was due to increased gallons of ethanol produced and sold due to our plant expansion project partially offset by a lower average price we received per gallon of ethanol sold. The average price we received for our ethanol during our 2020 fiscal year was approximately 8.2% lower compared to our 2019 fiscal year. Management attributes this decrease in the average price we received for our ethanol of approximately $0.03 per gallon alongof ethanol with decreased gasoline demand due to travel restrictions from the COVID-19 pandemic. Since ethanol is typically blended with gasoline, when gasoline demand is lower, it has a corresponding impact on ethanol demand. As a result, we experienced a significant decrease in the total gallons of ethanol we sold. Management attributes this decrease in ethanol prices with increased ethanol supply in the market which was not met with corresponding increases in demand during our 2017 fiscal year. Ethanol in recent years has sold at a discount compared to gasoline prices which has made ethanol an attractive fuel for blending with gasoline and has increased export demand for ethanol. Ethanol provides additional octane to fuels and the lower price of ethanol positively impacts the overall cost of ethanol blended fuels. Management expects continued loweraverage ethanol prices during our 2018first and second quarters of our 2020 fiscal year. Ethanol prices rebounded during our third and fourth quarters of our 2020 fiscal year. Ethanol exports were also lower during our 2020 fiscal year duecompared to anticipated increases in marketour 2019 fiscal year as the COVID-19 pandemic had an impact on gasoline and ethanol supply. Ifdemand globally. Management expects ethanol exports increaseprices to remain lower during our 20182021 fiscal year the supply andas gasoline demand balance maywill continue to be more favorable.negatively impacted by COVID-19. However, export demand for ethanol is less certain compared to domestic demand. As a result, if ethanol demand decreases in the future, it could negatively impact the price we receive for our ethanol. In addition, gasoline prices have been increasing recently which management believes will positively impact ethanol prices. Ifthat as the spread between the price of ethanol and the price of gasoline increases during our 2017 fiscal year,COVID-19 vaccine is administered, it may lead to additional domesticresult in increased travel which may have a positive impact on ethanol demand which could positively impact prices.


Ethanol sales volumes were lowergreater during our 20172020 fiscal year compared to the same period of 20162019 due to increased inventory during our 2017plant expansion project, which was operational for our entire 2020 fiscal year, partially offset by an increase inlower ethanol productionsales during our 2017 fiscal year comparedfirst and second quarters of 2020 due to our 2016 fiscal year. Ourthe COVID-19 pandemic. The total gallons of ethanol we sold during our 20172020 fiscal year was comparableapproximately 19.4% greater compared to the same period of 2016, with a decrease of approximately 71,000 gallons.2019. Management anticipates increased ethanol production and sales during our 20182021 fiscal year compared to our 20172020 fiscal year dueprovided ethanol demand is higher during our 2021 fiscal year compared to efficiency improvementsour 2020 fiscal year. Further, management anticipates that we have madewill continue to the plant.work to maximize our production following completion of our plant expansion project.


22

Table of Contents
Distillers Grains


Our total distillers grains revenue decreasedincreased by approximately 20.4% for our 20172020 fiscal year compared to the same period of 2016.2019. The increase in revenue from distillers grains was primarily due to increased tons of distillers grains sold during our 2020 fiscal year. For our 20172020 fiscal year,, we sold approximately 35%38.1% of our total distillers grains, by volume, in the dried form and approximately 65%61.9% of our total distillers grains in the modified/wet form. For our 20162019 fiscal year, we sold approximately 36%25.9% of our total distillers grains, by volume, in the dried form and approximately 64%74.1% of our total distillers grains in the modified/wet form. The average price we received for our driedmodified/wet distillers grains was approximately 12%1.3% less duringfor our 20172020 fiscal year compared to the same period of 2016, a decrease2019. Due to our plant expansion project, the supply of approximately $14 per ton. Management attributes this decrease in driedmodified/wet distillers grains prices with significantly decreased export demand from China duringin our 2017 fiscal year along with lower corn and soybean prices. Since distillers grains are typically used as a feed substitute for corn and soybean meal, asmarket is higher which has had an impact on the prices of corn and soybeans decrease, the price of distillers grains typically also decreases. In recent years, China has imported a significant amount of distillers grains from the United States. However, at the request of Chinese distillers grains producers, China commenced an anti-dumping and countervailing duty investigation against the United States during 2016. In September 2016, the Chinese implemented a preliminary anti-subsidy duty of between 10% and 10.7% in addition to a preliminary anti-dumping duty of 33.8%. Further, in January 2017, China finalized the duties to between 11.2% and 12% for the anti-subsidy duty and between 42.2% and 53.7% for the anti-dumping duty. As a result, distillers grains exports decreased sharply during our 2017 fiscal year which significantly impacted distillers grains prices. The average price we received for our modified/wet distillers grains. Modified/wet distillers grains have a shorter shelf life and are more expensive to transport compared to dried distillers grains. As a result, they are only sold in our local market.

The average price we received for our dried distillers grains was approximately 13% less for0.4% greater during our 20172020 fiscal year compared to the same period of 2016,2019. Management attributes this increase in dried distillers grains prices with lower distillers grains production in the United States due to reduced ethanol demand. This reduction in distillers grains production reduced the supply of distillers grains in the market which had a decrease of approximately $16 per dry equivalent ton.positive impact on prices.


Management anticipates continued lowexpects that distillers grains prices may be higher during our 2021 fiscal year due to anticipated higher corn prices during our 2021 fiscal year which typically has a positive impact on distillers grains prices. Further, if China and the United States reach an agreement on trade disputes which have occurred in recent years, it may have a positive impact on distillers grains prices and lower export demand fordemand.

     Management anticipates increased distillers grains untilproduction during our 2021 fiscal year compared to our 2020 fiscal year due to anticipated increased overall production at the Chinese increase their imports. However, the low price of distillers grains has resulted in increased exportethanol plant provided ethanol demand to other countries and may be positively impacting domestic distillers grains demand.remains steady during our 2021 fiscal year.
    
Corn Oil


Our total corn oil revenue increased by approximately 8%35.6% during our 20172020 fiscal year compared to the same period of 2016.2019. Our total pounds of corn oil sold increased by approximately 8%27.4% during our 20172020 fiscal year compared to the same period of 2016, an increase of approximately 854,000 pounds,2019, primarily due to decreased downtime onincreased production due to our extraction equipmentplant expansion project. Management anticipates increased corn oil production during our 20172021 fiscal year compared to our 20162020 fiscal year. Management anticipates relatively stable corn oilyear due to anticipated increased production provided ethanol demand remains at current levels allowing us to operate the ethanol plant at capacity during our 20182021 fiscal year compared to our 2017 fiscal year, depending on the amount of oil in the corn harvested in the fall of 2017.year.


The average price we received for our corn oil was comparable inapproximately 6.4% greater during our 20172020 fiscal year and compared to the same period of 2016.2019. Management expectsbelieves that corn oil prices were higher due to remain lowerless total industry-wide ethanol production during our 20182020 fiscal year unlesswhich reduced the volume of corn oil in the market. In addition, corn oil demand remained favorable due to demand from the biodiesel industry which uses corn oil as a feedstock to produce biodiesel. The biodiesel blenders' tax credit is extended for 2018. If not, biodiesel production may be lower which may negatively impactwas reinstated through 2022 so we expect that corn oil demand and prices.will remain higher through 2022.


Government Incentives

We did not receive any revenue from the State of South Dakota during our 2017 fiscal year compared to approximately $378,000 during the same period of 2016 due to the end of our eligibility for this state ethanol production incentive.

Cost of Revenues


The primary raw materials we use to produce ethanol, distillers grains and corn oil are corn and natural gas.


Corn


Our cost of revenues relating to corn was approximately 3% less8.1% greater for our 20172020 fiscal year compared to the same period of 2016.2019. Our average cost per bushel of corn decreased by approximately 2%10.0% for our 20172020 fiscal year compared to our 20162019 fiscal year.year. Management attributes the decrease in corn prices to several years of largedecreased corn crops and additional corn carryoverdemand from the 2016 corn crop. This increase in corn supply resulted inethanol industry. Corn demand was lower marketdue to decreased ethanol demand during the COVID-19 pandemic. Management anticipates corn prices will be higher during our 2017 fiscal year. Management anticipates relatively stable corn prices during our 20182021 fiscal year due to stronganticipated higher corn supplies and anticipated stable corn demand.demand from the ethanol industry.


We used approximately 2% fewer19.9% more bushels of corn during our 20172020 fiscal year compared to the same period of 20162019 due to improved corn toincreased overall production at the ethanol yieldsplant during our 20172020 fiscal year due to running the plant slower and a new yeast we used which improved our operating efficiency.year. Management expects our corn consumption will be consistent inhigher during our 20182021 fiscal year compared to our 20172020 fiscal year.


Natural Gas

Our cost of revenues related to natural gas increased by approximately $489,000, an increase of approximately 12%, for our 2017 fiscal year compared to our 2016 fiscal year. This increase was due primarily to an anticipated increase in market natural gas pricesethanol production during our 20172021 fiscal year compared provided ethanol demand returns to the same period of 2016. Natural gas prices rose due to increased demand. Additionally, we experienced a spike in natural gas prices in December 2017 due to the colder weather. Our average cost per MMBtu of natural gasmore normal levels during our 20172021 fiscal year was approximately 19% greater compared to the cost for our 2016 fiscal year. Management anticipates stable natural gas prices during 2018 due to adequate supplies.


We used approximately 6% less MMBtus
23

Table of natural gas during our 2017 fiscal year compared to the same period of 2016 due to producing less dried distillers grain and more modified distillers grains. Management anticipates that our natural gas consumption during our 2018 fiscal year will be comparable to our consumption during our 2017 fiscal year.Contents

We experienced approximately $815,000$1,627,000 of combined realized and unrealized loss for our 20172020 fiscal year related to our corn derivative instruments which increased our cost of goods sold. By comparison, Wewe experienced approximately $167,000$906,000 of combined realized and unrealized gainsloss for our 20162019 fiscal year related to our corn derivative instruments which decreasedincreased our cost of goods sold.sold We recognize the gains or losses that result from the changes in the value of our derivative instruments from corn in cost of goods sold as the changes occur.  As corn prices fluctuate, the value of our derivative instruments are impacted, which affects our financial performance.


Natural Gas

Our cost of revenues related to natural gas increased by approximately 10.8% for our 2020 fiscal year compared to our 2019 fiscal year. This increase was due to increased consumption due to our plant expansion project, partially offset by lower natural gas costs per MMBtu during our 2020 fiscal year compared to the same period of 2019. Natural gas prices were lower during our 2020 fiscal year compared to the same period of 2019 primarily because of decreased natural gas demand and lower energy prices generally during 2020 which decreased natural gas prices during that period of time. Our average cost per MMBtu of natural gas during our 2020 fiscal year was approximately 6.7% less compared to the cost for our 2019 fiscal year. Management anticipates higher natural gas costs per MMBtu during 2021 due to cold weather during the first quarter of our 2021 fiscal year.

We used approximately 18.6% more MMBtus of natural gas during our 2020 fiscal year compared to the same period of 2019 due to increased overall production due to our plant expansion project. Management anticipates that our natural gas consumption during our 2021 fiscal year will increase due to expected increased production during our 2021 fiscal year provided we can operate the ethanol plant at capacity during our 2021 fiscal year.

Operating Expense


Our operating expenses were higher for our 20172020 fiscal year compared to the same period of 20162019 due primarily to increased costs relating to recruiting efforts to fill vacant staff positions within our Company.professional fees and property insurance premiums.


Other Income and Expense


Our interest and other income was highergreater during our 20172020 fiscal year compared to our 20162019 fiscal year due to higher cash on handadditional dividend income from our lender during the 20172020 period. Our equity in the net income of our investments was lowerhigher during our 20172020 fiscal year compared to our 20162019 fiscal year due to lessincreased profitability in the ethanol industry which negatively impacts the income generated by our investments. Our net income of investments was also lowerWe had significantly more interest expense during our 2020 fiscal year compared to our 2019 fiscal year due to a write-downborrowing for our plant expansion project. During the time the expansion was under construction, interest was capitalized. When the expansion became operational, subsequent interest was expensed to our statement of the valueoperations.

Results of our investment in Prairie Gold Venture Partners as it was deemed impaired.Operations


Comparison of the Fiscal Years Ended December 31, 20162019 and 20152018


The following table shows the results of our operations and the percentage of revenues, cost of revenues, operating expenses and other items to total revenues in our consolidated statements of operations for the fiscal years ended December 31, 20162019 and 2015:2018:
24

Table of Contents
 2016 201520192018
Income Statement Data Amount % Amount %Income Statement DataAmount%Amount%
Revenue $88,812,550
 100.0
 $88,997,947
 100.0
Revenue$115,986,821 100.0 $74,703,630 100.0 
        
Cost of Revenues 76,097,861
 85.7
 81,445,770
 91.5
Cost of Revenues114,687,231 98.9 68,619,694 91.9 
        
Gross Profit 12,714,689
 14.3
 7,552,177
 8.5
Gross Profit1,299,590 1.1 6,083,936 8.1 
        
Operating Expense 3,642,087
 4.1
 1,827,789
 2.1
Operating Expense4,060,343 3.5 3,837,659 5.1 
        
Income from Operations 9,072,602
 10.2
 5,724,388
 6.4
Income (Loss) from OperationsIncome (Loss) from Operations(2,760,753)(2.4)2,246,277 3.0 
        
Other Income 2,332,606
 2.6
 2,929,142
 3.3
Other Income (Expense)Other Income (Expense)(1,063,431)(0.9)470,310 0.6 
        
Net Income $11,405,208
 12.8
 $8,653,530
 9.7
Net Income (Loss)Net Income (Loss)$(3,824,184)(3.3)$2,716,587 3.6 


Revenues
Revenues

Revenue from ethanol sales increased by approximately 3%56.7% during our 20162019 fiscal year compared to the same period of 2015.2018. Revenue from dried distillers grains sales decreasedincreased by approximately 10%97.4% during our 20162019 fiscal year compared to the same period of 2015.2018. Revenue from corn oilmodified distillers grains sales decreasedincreased by approximately 4%32.7% during our 20162019 fiscal year compared to the same period of 2015.2018. Revenue from corn oil sales increased by approximately 88.4% during our 2019 fiscal year compared to the same period of 2018.


Ethanol


Our ethanol revenue increased by approximately $1.8$32.7 million during our 20162019 fiscal year compared to our 20152018 fiscal year, an increase of approximately 3%56.7%. This increase in ethanol revenue was due to increased gallons of ethanol produced and sold due to our plant expansion project along with an increase in the average price we received for our ethanol. The average price we received for our ethanol ofduring our 2019 fiscal year was approximately $0.02 per gallon along with an$0.06 higher compared to our 2018 fiscal year. Management attributes this increase in the total gallonsaverage price we received per gallon of ethanol we sold. Ethanol in recent years has sold at a discountwith fewer small refinery waiver exemptions which were allowed by the EPA during our 2019 fiscal year compared to gasoline prices which has made ethanol an attractive fuel for blending with gasoline and has increased export demand for ethanol. Ethanol provides additional octaneour 2018 fiscal year. Also, due to fuels and the lower price of ethanol positively impacts the overall cost of ethanol blended fuels. The RFS requires the EPA to establish renewable volume obligations (RVO) for various types of renewable fuels on an annual basis. In recent years, the EPA proposed RVOs for corn-based ethanol which were less than the statutory requirementsunfavorable operating margins in the RFS. Further, the preliminary RVO for corn-based ethanol for 2017 was less than the statutory requirement. However, when the final RVO was releasedindustry, some ethanol producers reduced production or ceased production altogether which resulted in late 2016, the RVO for corn-baseda drop in ethanol was set at the statutory limit. While the RVO for 2017 was a positive step, it came latesupply in the market. This decrease in ethanol supply provided some price support for the ethanol we produced. Ethanol exports were lower during our 2019 fiscal year and as a result may not havecompared to our 2018 fiscal year which had a significantnegative impact on market ethanol prices during our 2016 fiscal year.demand. The ethanol industry depends on ethanol exports which are more volatile than domestic demand.


Ethanol sales volumes were highergreater during our 20162019 fiscal year compared to the same period of 20152018 due to a reduction in inventoryour plant expansion project which was operational during our 2016 fiscal year partially offset by a slight decrease in ethanol production during our 2016 fiscal year compared to our 20152019 fiscal year. Our total gallons of ethanol sold during our 20162019 fiscal year was approximately 1%49.2% greater than duringcompared to the same period of 2015,2018, an increase of approximately 602,00022,793,000 gallons.


Distillers Grains


Our total distillers grains revenue decreasedincreased for our 20162019 fiscal year compared to the same period of 2015.2018. The increase in revenue was due to increased average prices we received for our distillers grains along with increased production due to our plant expansion project. For both our 2016 fiscal year and 20152019 fiscal year, we sold approximately 36%25.9% of our total distillers grains, by volume, in the dried form and approximately 64%74.1% of our total distillers grains in the modified/wet form. For our 2018 fiscal year, we sold approximately 17.0% of our total distillers grains, by volume, in the dried form and approximately 83.0% of our total distillers grains in the modified/wet form. The average price we received for our dried distillers grains was approximately 12%8.1% less during our 20162019 fiscal year compared to the same period of 2015,2018, a decrease of approximately $15$11 per ton. Management attributes this decrease in dried distillers grains prices with significantly decreasedthe impact of our plant expansion on available buyers of our dried distillers grains. When we increased the amount of dried distillers grains we were selling following the plant expansion, the price our customers were willing to pay was lower. In addition, export demand from Chinawas not as strong during our 20162019 fiscal year along with lower corn and soybean prices. Sincefor dried distillers grains are typically used aswhich had a feed substitute for corn and soybean meal, as the prices of corn and soybeans decrease, the price of distillers grains typically also decreases. negative impact on prices.

The average price we received for our modified/wet distillers grains was approximately 6% less5.6% greater for our 20162019 fiscal year compared to the same period of 2015, a decrease2018, an increase of approximately $8$7 per dry equivalent ton. Since demand for
25

Table of Contents
modified/wet distillers grains is a more local market, it is not as impacted by export demand as compared to dried distillers grains.
    
Corn Oil


Our total corn oil revenue decreasedincreased by approximately 4%88.4% during our 20162019 fiscal year compared to the same period of 2015.2018. Our total pounds of corn oil sold decreasedincreased by approximately 10%87.6% during our 20162019 fiscal year compared to the same period of 2015, a decrease2018, an increase of approximately 1,162,0008,612,000 pounds, primarily due to decreased corn oil yield from the corn we used during our 2016 fiscal year comparedincreased production due to our 2015 fiscal year.

plant expansion project. The average price we received for our corn oil increased by approximately 7% forwas comparable during our 20162019 fiscal year compared toand the same period of 2015, an increase of approximately $0.02 per pound. The biodiesel blenders' tax credit was reinstated for 2016 which had a positive impact on biodiesel production. Since corn oil can be used as a feedstock to produce biodiesel, when biodiesel production increases it has a positive impact on corn oil prices.2018.


Government Incentives

We received less revenue from the State of South Dakota during our 2016 fiscal year compared to the same period of 2015 due to the end of our eligibility for this state ethanol production incentive. We received approximately $378,000 in incentive revenue during our 2016 fiscal year and approximately $417,000 during our 2015 fiscal year.
Cost of Revenues


The primary raw materials we use to produce ethanol, and distillers grains and corn oil are corn and natural gas.


Corn


Our cost of revenues relating to corn was approximately 7% less83.2% greater for our 20162019 fiscal year compared to the same period of 2015.2018. Our average cost per bushel of corn decreasedincreased by approximately 7%22.8% for our 20162019 fiscal year compared to our 20152018 fiscal year. Management attributes the decreaseincrease in corn prices to unfavorable weather conditions and late planting during the 2019 growing season along with several yearslate harvest. In addition, there were fewer acres planted with corn during 2019 which impacted the size of largethe corn cropsharvest. These unfavorable weather conditions and additional corn carryover from the 2015 corn crop. This increase in corn supplyfewer planted acres resulted in lower marketless corn pricesharvested during our 2016 fiscal year.2019 which had an impact on prices.


We used a comparable volumeapproximately 49.2% more bushels of corn during our 20162019 fiscal year compared to the same period of 20152018 due to improved corn toincreased overall production at the ethanol yieldsplant during our 20162019 fiscal year.


We experienced approximately $906,000 of combined realized and unrealized loss for our 2019 fiscal year related to our corn derivative instruments which increased our cost of goods sold. By comparison, we experienced approximately $550,000 of combined realized and unrealized gain for our 2018 fiscal year related to our corn derivative instruments which decreased our cost of goods sold.

Natural Gas


Our cost of revenues related to natural gas decreasedincreased by approximately $560,000, a decrease$1,085,000, an increase of approximately 12%28.9%, for our 20162019 fiscal year compared to our 20152018 fiscal year. This decreaseincrease was due to a decrease inincreased consumption due to our plant expansion project, partially offset by lower market natural gas pricescosts per MMBtu during our 20162019 fiscal year compared to the same period of 2015. During2018. Natural gas prices were lower during our 20162019 fiscal year we experiencedcompared to the same period of 2018 primarily because of strong natural gas supplies and relatively stablesupply during 2019 which decreased natural gas demand which positively impacted our natural gas costs.prices during that period of time. Our average cost per MMBtu of natural gas during our 20162019 fiscal year was approximately 13%13.9% less compared to the pricecost for our 20152018 fiscal year.


We used approximately 1%49.8% more MMBtus of natural gas during our 20162019 fiscal year compared to the same period of 20152018 due to increased sales volumes which increased our natural gas needs.

We experienced approximately $167,000 of combined realized and unrealized gains for our 2016 fiscal year relatedoverall production due to our corn and natural gas derivative instruments which decreased our cost of goods sold. By comparison, We experienced approximately $331,000 of combined realized and unrealized gains for our 2015 fiscal year related to our corn and natural gas derivative instruments which decreased our cost of goods sold.plant expansion project.


Operating Expense


Our operating expenses were higher for our 20162019 fiscal year compared to the same period of 20152018 due primarily to propertyincreased wages and casualty insurance proceeds we received duringbenefits for our 2015 fiscal year which decreased our operating expenses. The insurance proceeds in excess oflarger staff due to the loss equaled approximately $1.8 million in 2015.plant expansion project.


Other Income and Expense


Our interest and other income was lowergreater during our 20162019 fiscal year compared to our 20152018 fiscal year due to decreased cash on handadditional dividend income from our lender during the 2016 period. In addition, our other income was lower during our 2016 fiscal year compared to our 2015 fiscal year due to approximately $600,000 in business interruption insurance proceeds which were included in our other income for the 20152019 period. Our equity in the net income of our investments was higherlower during our 20162019 fiscal year compared to our 20152018 fiscal year due to more income being generated by our investments which areless profitability in the ethanol industry and are directionally consistent withwhich negatively impacts the income generated by our performanceinvestments. We had significantly more interest expense during our 2019 fiscal year compared to our 2018 fiscal year due to borrowing for our plant expansion project. During the 2016 period.time the expansion was under construction, interest was capitalized. When the expansion became operational, subsequent interest was expensed to our statement of operations.

26

Table of Contents

Changes in Financial Condition for the Fiscal Year Ended December 31, 20172020 compared to the Fiscal Year Ended December 31, 2016.2019.


Current Assets


We had lessmore cash and cash equivalents at December 31, 20172020 compared to December 31, 2016,2019, primarily due to decreasedincreased deferred payment corn liability along with increased net income generated, increased capital spending and our investment in Ring-neck Energy & Feed, LLC during our 20172020 fiscal year. We had fewermore accounts receivable at December 31, 2017,2020, compared to December 31, 2016,2019, due to lower ethanolour increased sales volumes. We had decreased inventory values at December 31, 2017. We had less inventory at December 31, 2017,2020, compared to December 31, 2016,2019, due primarily to having less corn inventory at December 31, 2017. The volume of corn on hand at the endtiming of our 2017 fiscal year was less than the end and shipments of our 2016 fiscal year which impacts the value of our corn inventory.products. The value of our derivative financial instruments was lessgreater at December 31, 20172020 compared to December 31, 2016,2019, primarily because we had lessmore unrealized gains on our futuresforward corn positions along with lessmore cash in our margin account as of December 31, 20172020 compared to December 31, 2016.2019. We had more prepaid expenses at December 31, 2020 compared to December 31, 2019 due to insurance premium increases during our 2020 fiscal year.


Property and Equipment


The value of our property and equipment was higherlower at December 31, 20172020 compared to December 31, 20162019 due to plant improvementthe net effect of our capital projects which were in progress during our 20172020 fiscal year. This increase in the value of our property and equipment was partiallyyear, offset by the regular depreciation of our assets during our 20172020 fiscal year.


Other Assets


The value of our investments was higherless at December 31, 2017,2020, compared to December 31, 2016,2019, mainly due to distributions in excess of earnings from our investment in Ring-neck Energy & Feed, LLC.investments during the 2020 fiscal year.


Current Liabilities


At December 31, 2017,2020, we had fewer checks which were issued in excess of the amount of cash we had in our bank accounts, compared to at December 31, 2016,2019, due to the timing of transfers between our accounts. Any checks which are presented for payment in excess of the balances in our bank accounts are paid from our revolving lines of credit. Our accounts payable was lowerhigher at December 31, 2017,2020, compared to December 31, 2016,2019, due to decreasedincreased corn payables at the end of our 20172020 fiscal year. We had less accrued liabilities at December 31, 2017,2020, compared to December 31, 20162019 due to decreased payroll accruals due toless interest payable at the timingend of payroll.the 2020 fiscal year. The liability on our balance sheet related to our derivative instruments was lowerless at December 31, 2017,2020, compared to December 31, 2016,2019, due to having lessfewer unrealized losses on our forward corn purchases at December 31, 2017,2020, compared to at December 31, 2016.2019. The current portion of our long-term debt payments was greater at December 31, 2020 and at December 31, 2019 due to the current portion of the Paycheck Protection Program Loan we received in 2020.


Long-Term Liabilities


Our long-term liabilities were higherless at December 31, 2017,2020, compared to December 31, 2016,2019, due to thepayments we made on our long-term debt we incurred to purchase an investment in Ring-neck Energy & Feed, LLC during our 20172020 fiscal year.


Liquidity and Capital Resources


Our main sources of liquidity are cash from our continuing operations, distributions we receive from our investments and amounts we have available to draw on our revolving credit facilities. Taking into account the Amended and Restated Credit Agreement we executed on February 6, 2018, managementManagement does not anticipate that we will need to raise additional debt or equity financing in the next twelve months and management believes that our current sources of liquidity will be sufficient to continue our operations during that time period. We anticipate that any the capital expenditures we undertake related to our expansion project will be paid out of cash from operations and existing loans, but will not require any additional debt or equity financing.


Currently, we have two revolving loans which allow us to borrow funds for working capital. These two revolving loans are described in greater detail below in the section entitled "Item 7 - Management's Discussion and Analysis of Financial Condition and Results of Operations - Indebtedness." As of December 31, 2017,2020, we had $1,000$30,000,000 outstanding and $12,546,000$18,000,000 available to be drawn on these revolving loans. Management anticipates that this is sufficient to maintain our liquidity and continue our operations.

The following table shows cash flows for the fiscal years ended December 31, 2017 and 2016:
27

  Fiscal Years Ended December 31
  2017 2016
Net cash provided by operating activities $11,567,864
 $15,679,756
Net cash (used in) investing activities (18,134,893) (2,680,173)
Net cash provided by (used in) financing activities 1,676,653
 (11,335,414)

Cash Flow From Operations. Our operating activities generated less cash during our fiscal year ended December 31, 2017, compared to the same periodTable of 2016, primarily due to having less net income during the 2017 period along with decreased distributions from our investments.Contents

Cash Flow From Investing Activities. Our investing activities used more cash during our fiscal year ended December 31, 2017, compared to the same period of 2016, primarily due to our investment in Ring-neck Energy & Feed, LLC along with capital costs we incurred related to our expansion project.


Cash Flow From Financing Activities. Our financing activities provided more cash during our fiscal year ended December 31, 2017, compared to the same period of 2016, primarily due to the proceeds from borrowing we incurred during the 2017 period along with decreased distributions to our members.

The following table shows cash flows for the fiscal years ended December 31, 20162020 and 2015:2019:
Fiscal Years Ended December 31
20202019
Net cash provided by operating activities$9,238,635 $7,517,770 
Net cash used in investing activities(359,221)(9,700,103)
Net cash (used in) provided by financing activities(3,065,256)13,308,049 
  Fiscal Years Ended December 31
  2016 2015
Net cash provided by operating activities $15,679,756
 $19,475,629
Net cash (used in) investing activities (2,680,173) (8,409,309)
Net cash (used in) financing activities (11,335,414) (8,841,537)


Cash Flow From Operations. Our operating activities generated more cash during our fiscal year ended December 31, 2020, compared to the same period of 2019, primarily due to having more net income during the 2020 period.

Cash Flow From Investing Activities. Our investing activities used less cash during our fiscal year ended December 31, 2020, compared to the same period of 2019, primarily because we had less capital expenses during the 2020 period compared to the 2019 period.

Cash Flow From Financing Activities. Our financing activities provided less cash during our fiscal year ended December 31, 2020, compared to the same period of 2019, primarily due to net payments on borrowings during the 2020 period compared to net proceeds from borrowings during the same period of 2019.

The following table shows cash flows for the fiscal years ended December 31, 2019 and 2018:
Fiscal Years Ended December 31
20192018
Net cash provided by operating activities$7,517,770 $7,804,468 
Net cash used in investing activities(9,700,103)(26,323,269)
Net cash provided by financing activities13,308,049 15,113,779 

Cash Flow From Operations. Our operating activities generated less cash during our fiscal year ended December 31, 2016,2019, compared to the same period of 2015,2018, primarily due to the net effect of decreased distributions in excess of earnings from our investments offset by increasedhaving less net income during the 20162019 period which was partially offset by an increase in accounts payable which had a positive impact on cash during the 2019 period.


Cash Flow From Investing Activities. Our investing activities used less cash during our fiscal year ended December 31, 2016,2019, compared to the same period of 2015,2018, primarily duebecause we had less capital expenses related to our expansion project during the 2019 period compared to the net effect of less capital purchases during our 2016 fiscal year, partially offset by greater insurance proceeds we received during our 2015 fiscal year due to storm damage at the ethanol plant.2018 period.


Cash Flow From Financing Activities. Our financing activities used moreprovided less cash during our fiscal year ended December 31, 2016,2019, compared to the same period of 2015,2018, primarily due to increasedfewer net proceeds from borrowing we incurred during the 2019 period offset by decreased distributions to our members during our 2016 fiscal year compared to our 2015 fiscal year.members.


Indebtedness
 
We entered intomaintain a comprehensive credit facility with Farm Credit Services of America, PCA and Farm Credit Services of America, FLCA (collectively "FCSA"). We have a $10$2 million revolving operating line of credit (the "Operating Line") and, a $15$48 million reducing revolving loan (the "Reducing Revolving Loan") and a $8 million term loan (the "2017 Term Loan"). All of our assets, including the ethanol plant and equipment, its accounts receivable and inventory, serve as collateral for our loans with FCSA.


Operating Line

On AugustOctober 21, 2019, Dakota Ethanol amended the revolving promissory note from Farm Credit Services of America (FCSA) in the amount up to $10,000,000 or the amount available in accordance with the borrowing base calculation, whichever is less. On June 5, 2020, the available balance of the Operating Line was reduced to $2,000,000. Interest on the outstanding principal balance will accrue at 300 basis points above the 1 2017, we executed an amendmentmonth LIBOR rate and is not subject to our credit agreement to create a new $8 million term loan which we used to financefloor. The rate was 3.15% at December 31, 2020. There is a non-use fee of 0.25% on the unused portion of our investment in Ring-neck Energy & Feed, LLC. Subsequently,the $2,000,000 availability. The note is collateralized by substantially all assets of the Company. The note expires on November 1, 2021. On December 31,
28

Table of Contents
2020, Dakota Ethanol had $0 outstanding and $0 available to be drawn on the revolving promissory note under the borrowing base calculation.

Reducing Revolving Loan
    On February 6, 2018, weDakota Ethanol executed an Amended and Restated Credit Agreement (the "Amended and Restated Credit Agreement")a reducing revolving promissory note from FCSA in the amount up to $40,000,000 or the amount available in accordance with FCSA. Pursuant to the Amended and Restated Credit Agreement, we increased our total credit availability to $40 million to support our expansion project. Further, the maturity date of this increased creditborrowing availability under our Amended and Restated Credit Agreementthe credit agreement. The available balance of the Reducing Revolving Loan was extendedincreased to $48,000,000 on June 5, 2020. The amount Dakota Ethanol can borrow on the note decreases by $1,750,000 semi-annually starting on July 1, 2021 until the maximum balance reaches $32,250,000 on July 1, 2025. The note matures on January 1, 2026. Until February 1, 2023, interest on the outstanding principal balance will accrue pursuantat 325 basis points above the 1 month LIBOR rate until February 1, 2023 and increases to the Credit Agreement on our increased credit availability350 basis points thereafter until maturity. The rate was 3.40% at the one month London Interbank Offered Rate ("LIBOR") plus 3.25% per year. We agreed to payDecember 31, 2020. The note contains a non-use fee of 0.50% on the unused portion of the increased credit availability.  

Operating Line

The Operating Line was renewed on November 1, 2016. The Operating Line's maturity date is November 1, 2018. The total amount that we can draw on the Operating Line is restricted by a formula based on the amount of inventory, receivables and equity we have in certain CBOT futures positions. Interest on the Operating Line accrues at the one month LIBOR plus 300 basis points. There is a fee of 0.25% on the portion of the Operating Line that we are not using, which is billed quarterly. The interest rate for this loan atnote. On December 31, 2017 was 4.35%. As of December 31, 2017, we2020, Dakota Ethanol had $0$30,000,000 outstanding on the Operating Line and approximately $2 million$18,000,000 available to be drawn taking into account the borrowing base calculation.

Reducing Revolving Loan

We have a $15 million Reducing Revolving Loan. Interest accrues on the Reducing Revolving Loan at a rate of 325 basis points in excess of the one-month LIBOR and we agreed to pay a fee of 50 basis points for any unused amount of the Reducing Revolving Loan. The amount we can borrow on the Reducing Revolving Loan decreases by $750,000 semi-annually starting on April 1, 2015 until the maximum balance reaches $7.5 million on October 1, 2019. The Reducing Revolving Loan matures on October 1, 2024. The interest rate for this loan at December 31, 2017 was 4.60%. As of December 31, 2017, we had $1,000 outstanding on the Operating Line and $10,499,000 available to be drawn.note.


2017 Term Loan


On August 1, 2017, Dakota Ethanol executed a term note with FCSA in the amount of $8,000,000.$8 million. Dakota Ethanol agreed to make monthly interest payments starting September 1, 2017 and annual principal payments of $1,000,000 starting on August 1, 2018. The notes matures on August 1, 2025. The payment due on August 1, 2020 was deferred to August 1, 2025. Interest on the outstanding principal balance will accrue at 325 basis points above the 1 month LIBOR rate until February 1, 2023 and is not subjectincreases to a floor.350 basis points thereafter until maturity. The rate was 4.60%3.40% at December 31, 2017.2020. On December 31, 2017,2020, Dakota Ethanol had $8,000,000$6,000,000 outstanding on the note.


2020 Loans

We entered into a loan agreement with the Small Business Association through First State Bank, Gothenburg, NE on April 4, 2020 for $760,400 as part of the Paycheck Protection Program under Division A, Title I of the Coronavirus Aid, Relief and Economic Security Act (CARES Act). The loan matures in January 2023 and has an interest rate of 1.0%. Proceeds of the loan are restricted for use towards payroll costs and other allowable uses such as covered utilities for an eight-week period following the loan under the Paycheck Protection Program Rules. Provisions of the agreement allow for a portion of the loan to be forgiven if certain qualifications are met. We applied for the loan to be forgiven during June of 2020. We are currently awaiting approval of the application. The Paycheck Protection Program Flexibility Act, which was put into effect on June 5, 2020, may effect the terms of our loan.

The Company also received an Economic Injury Disaster Loan (EIDL) in the amount of $10,000 in June 2020. Repayment of the loan will begin in June 2021 and has a 30 year term at 3.75% interest.

Covenants


Our credit facilities with FCSA are subject to various loan covenants. If we fail to comply with these loan covenants, FCSA can declare us to be in default of our loans. The material loan covenants applicable to our credit facilities are our working capital covenant, local net worth covenant and our debt service coverage ratio. We are required to maintain working capital (current assets minus current liabilities plus availability on our revolving loan) of at least $6$11.0 million. We are required to maintain local net worth (total assets minus total liabilities minus the value of certain investments) of at least $18 million. We are required to maintain a debt service coverage ratio of at least 1.25:1.00. InDakota Ethanol is also restricted from making distributions to Lake Area Corn Processors without the Amended and Restated Credit Agreement, we agreed to increase our working capital covenant to $13.5 million and our local net worth requirement to $28 million.consent of the lender.


As of December 31, 2017,2020, we were in compliance with our financial covenants under the FCSA loans. Management's current financial projections indicate that we will be in compliance with our financial covenants for the next 12 months and we expect to remain in compliance thereafter. Management does not believe that it is reasonably likely that we will fall out of compliance with our material loan covenants in the next 12 months. If we fail to comply with the terms of our credit agreements with FCSA, and FCSA refuses to waive the non-compliance, FCSA may require us to immediately repay all amounts outstanding on our loans.


County Bond Obligation

29

We have a long-term debt obligation on a portion
Table of a tax increment revenue bond series issued by Lake County, South Dakota of which we were the recipient of the proceeds. Taxes levied on our property are used for paying the debt service on the bonds. We are obligated to pay any shortfall in debt service on the bonds should the property taxes collected not be sufficient to pay the entire debt service. The interest rate on the bonds is 7.75% annually.  The bonds require semi-annual payments of interest on December 1 and June 1, in addition to a payment of principal on December 1 of each year. While our obligation under the guarantee is expected to continue until maturity in 2018, such obligation may cease at some point in time if the property on which the plant is located appreciates in value to the extent that Lake County is able to collect a sufficient amount in taxes to cover the principal and interest payments on the taxable bonds. Our estimated liability related to this bond was approximately $10,000 as of December 31, 2017. The guarantee liability is included in other liabilities on the balance sheet.Contents

Contractual Cash Obligations


In addition to our debt obligations, we have certain other contractual cash obligations and commitments.  The following table provides information regarding our consolidated contractual obligations and commitments as of December 31, 2017:2020:
Payments Due By Period
Contractual Cash Obligations Total Less than One Year One to Three Years Three to Five Years After Five Years
      
Long-Term Debt Obligations $42,581,626  $2,441,398  $4,915,087  $5,208,287  $30,016,854 
Purchase Obligations 24,092,515 22,706,515 369,600 369,600 646,800 
Other Liabilities4,000 4,000 — — — 
Total Contractual Cash Obligations $66,678,141  $25,151,913  $5,284,687  $5,577,887  $30,663,654 
  Payments Due By Period
Contractual Cash Obligations Total Less than One Year One to Three Years Three to Five Years After Five Years
           
Long-Term Debt Obligations $8,001,000
 $1,000,000
 $2,000,000
 $2,000,000
 $3,001,000
Estimated Interest on Long-Term Debt 1,533,336
 352,667
 567,334
 383,334
 230,001
Operating Lease Obligations 


Purchase Obligations 8,886,822
 8,886,822


Other Liabilities 25,556
 13,556
 8,000
 4,000
 
Total Contractual Cash Obligations $18,446,714
 $10,253,045
 $2,575,334
 $2,387,334
 $3,231,001


Application of Critical Accounting Policies


Management uses estimates and assumptions in preparing our consolidated financial statements in accordance with generally accepted accounting principles. These estimates and assumptions affect the reported amounts of assets and liabilities,

the disclosure of contingent assets and liabilities, and the reported revenues and expenses. Of the significant accounting policies described in the notes to our consolidated financial statements, we believe that the following are the most critical:


Derivative Instruments


We enter into short-term forward grain, option and futures contracts as a means of securing corn and natural gas for the ethanol plant and managing exposure to changes in commodity and energy prices. We enter into short-term forward, option and futures contracts for sales of ethanol to manage exposure to changes in commodity prices. All of our derivatives are designated as non-hedge derivatives, and accordingly are recorded at fair value with changes in fair value recognized in net income. Although the contracts are considered economic hedges of specified risks, they are not designated as nor accounted for as hedging instruments.


As part of our trading activity, we use futures and option contracts offered through regulated commodity exchanges to reduce our risk and we are exposed to risk of loss in the market value of inventories. To reduce that risk, we generally take positions using cash and futures contracts and options.


Unrealized gains and losses related to derivative contracts for corn and natural gas purchases are included as a component of cost of revenues and derivative contracts related to ethanol sales are included as a component of revenues in the accompanying financial statements. The fair values of derivative contracts are presented on the accompanying balance sheets as derivative financial instruments.


Goodwill


Annually, as well as when an event triggering impairment may have occurred, the Company performs an impairment test on goodwill. The Company performs a quantitative analysis that tests for impairment. The second step, if necessary, measures the impairment. During the first quarter of 2020 a triggering event was determined to have occurred and an impairment test was performed as of March 31, 2020. The Company determined there was no impairment at that time. The Company performs the annual analysis on December 31 of each fiscal year. The Company determined that there was no impairment of goodwill at December 31, 20172020 and 2016.2019.


Inventory Valuation


Inventories are generally valued using methods which approximate the lower of cost (first-in, first-out) or net realizable value. In the valuation of inventories and purchase commitments, net realizable value is based on estimated selling prices in the ordinary course of business less reasonably predictable costs of completion, disposal and transportation.


30

Table of Contents
Revenue Recognition


    The Company generally recognizes revenue at a point in time when performance obligations are satisfied. Revenue from the production of ethanol and related products is recorded when titlecontrol transfers to customers. Generally, ethanol and related products are shipped FOB shipping point, based on written contract terms between Dakota Ethanol and its customers. Collectability of revenue is reasonably assured based on historical evidence of collectability between Dakota Ethanol and its customers. Interest income is recognized as earned.


Shipping costs incurred by the Company in the sale of ethanol, dried distillers grains and corn oil are not specifically identifiable and as a result, revenue from the sale of those products is recorded based on the net selling price reported to the Company from the marketer.


Off-Balance Sheet Arrangements


We do not have any off-balance sheet arrangements.


ITEM 7A.     QUANTITATIVE AND QUALITATIVE DISCLOSURES ABOUT MARKET RISKRISK.


We are exposed to the impact of market fluctuations associated with commodity prices and interest rates as discussed below.  We have no exposure to foreign currency risk as all of our business is conducted in U.S. Dollars. We use derivative financial instruments as part of an overall strategy to manage market risk. We use cash, futures and option contracts to hedge changes to the commodity prices of corn and natural gas. We do not enter into these derivative financial instruments for trading or speculative purposes, nor do we designate these contracts as hedges for accounting purposes.


Interest Rate Risk


We are exposed to market risk from changes in interest rates. Exposure to interest rate risk results primarily from holding loans which bear variable interest rates. As of December 31, 2017,2020, we had $8,001,000$36,000,000 outstanding on our variable interest rate loans with interest accruing at a rate of 4.60%3.40%. Our variable interest rates are calculated by adding a set basis to LIBOR. If we were to experience a 10% increase in LIBOR, the annual effect such change would have on our statement of operations, based on the amount we had outstanding on our variable interest rate loans as of December 31, 2017,2020, would be approximately $11,000.$5,400.


Commodity Price Risk


We are exposed to market risk from changes in commodity prices.  Exposure to commodity price risk results from our dependence on corn and natural gas in the ethanol production process.  We seek to minimize the risks from fluctuations in the prices of corn and natural gas through the use of hedging instruments.  In practice, as markets move, we actively manage our risk and adjust hedging strategies as appropriate.  Although we believe our hedge positions accomplish an economic hedge against our future purchases, they are not designated as such for hedge accounting purposes, which would match the gain or loss on our hedge positions to the specific commodity purchase being hedged.  We are marking to market our hedge positions, which means as the current market price of our hedge positions changes, the gains and losses are immediately recognized in our cost of revenues.


The immediate recognition of hedging gains and losses can cause net income to be volatile from quarter to quarter due to the timing of the change in value of the derivative instruments relative to the cost and use of the commodity being hedged.  We recorded an increase to our cost of revenues of approximately $815,000$1,627,000 related to derivative instruments for our fiscal year ended December 31, 2017.2020. We recorded a decreasean increase to our cost of revenues of approximately $167,000$906,000 related to derivative instruments for the fiscal year ended December 31, 2016.2019. There are several variables that could affect the extent to which our derivative instruments are impacted by price fluctuations in the cost of corn or natural gas.  However, it is likely that commodity cash prices will have the greatest impact on the derivatives instruments with delivery dates nearest the current cash price.
  
As of December 31, 2017,2020, we were committed to purchasing approximately 2.55.2 million bushels of corn with an average price of $3.30$4.19 per bushel. These corn purchases represent approximately 14%17% of our expected corn usage for the next 12 months. As corn prices move in reaction to market trends and information, our statement of operations will be affected depending on the impact such market movements have on the value of our derivative instruments. Depending on market movements, crop prospects and weather, these price protection positions may cause immediate adverse effects to our financial results, but are designed to produce long-term positive growth for us.

31

Table of Contents

    We have 289,000 bushels of corn inventory delivered under delayed-pricing contracts. The contracts have various pricing deadlines through October 29, 2021. We are subject to risk of changes in the corn market until they are priced.

As of December 31, 2017,2020, we were committed to purchasing approximately 40,000301,000 MMBtus of natural gas with an average price of $3.10$2.90 per MMBtu. Under these arrangements, the Company assumeswe assume the risk of a price decrease in the market price of natural gas between the time the price is fixed and the time the natural gas is delivered. The Company accountsWe account for these transactions as normal purchases, and accordingly, does not mark these transactions to market. The natural gas purchases represent approximately 3%15% of the projected annual plant requirements.


As of December 31, 2017, the Company is2020, we are committed to selling approximately 38,000 dry equivalent tons of distillers grains with an average price of $101$148 per ton.  The distillers grains sales represent approximately 26%18% of the projected annual plant production.


As of December 31, 2017, the Company is2020, we are committed to selling approximately 770,0001,681,000 pounds of distillers corn oil with an average price of $0.24$0.36 per pound.  The distillers corn oil sales represent approximately 7% of the projected annual plant production.


The Company does    We do not have any firm-priced sales commitments for ethanol as of December 31, 2017.2020.


A sensitivity analysis has been prepared to estimate our exposure to ethanol, corn and natural gas price risk. Market risk related to these factors is estimated as the potential change in income resulting from a hypothetical 10% adverse change in the average cost of our corn and natural gas prices and average ethanol price as of December 31, 2017,2020, net of the forward and future contracts used to hedge our market risk for corn and natural gas usage requirements. The volumes are based on our expected use and sale of these commodities for a one year period from December 31, 2017.2020. The results of this analysis, which may differ from actual results, are as follows:
 

Estimated Volume Requirements for the next 12 months (net of forward and futures contracts)Unit of MeasureHypothetical Adverse Change in PriceApproximate Adverse Change to Income
Ethanol92,000,000 Gallons10 %$11,710,362 
Corn27,299,311 Bushels10 %$12,257,390 
Natural Gas1,769,000 MMBTU10 %$449,149 
 Estimated Volume Requirements for the next 12 months (net of forward and futures contracts) Unit of Measure Hypothetical Adverse Change in Price Approximate Adverse Change to Income
Ethanol52,500,000
 Gallons 10% $6,352,500
Corn16,275,632
 Bushels 10% $4,898,965
Natural Gas1,141,250
 MMBTU 10% $1,029,408


For comparison purposes, our sensitivity analysis for our 20162019 fiscal year is set forth below.
Estimated Volume Requirements for the next 12 months (net of forward and futures contracts)Unit of MeasureHypothetical Adverse Change in PriceApproximate Adverse Change to Income
Ethanol92,000,000 Gallons10 %$11,132,000 
Corn25,568,666 Bushels10 %$9,946,211 
Natural Gas1,284,296 MMBTU10 %$346,760 

32
 Estimated Volume Requirements for the next 12 months (net of forward and futures contracts) Unit of Measure Hypothetical Adverse Change in Price Approximate Adverse Change to Income
Ethanol52,500,000
 Gallons 10% $8,190,000
Corn16,539,575
 Bushels 10% $4,994,952
Natural Gas1,181,250
 MMBTU 10% $429,975


Table of Contents

ITEM 8.     FINANCIAL STATEMENTS AND SUPPLEMENTARY DATADATA.


REPORT OF INDEPENDENT REGISTERED PUBLIC ACCOUNTING FIRM


To the Members and the Board of Managers of Lake Area Corn Processors, LLC


Opinion on the Financial Statements
We have audited the accompanying consolidated balance sheets of Lake Area Corn Processors, LLC and its subsidiary (the Company) as of December 31, 20172020 and 2016,2019, the related consolidated statements of operations, changes in members’ equity and cash flows for each of the three years in the period ended December 31, 2017,2020, and the related notes to the consolidated financial statements (collectively, the financial statements). In our opinion, the financial statements present fairly, in all material respects, the financial position of the Company as of December 31, 20172020 and 2016,2019, and the results of its operations and its cash flows for each of the three years in the period ended December 31, 2017,2020, in conformity with accounting principles generally accepted in the United States of America.


Basis for Opinion
These financial statements are the responsibility of the Company’s management. Our responsibility is to express an opinion on the Company’s financial statements based on our audits. We are a public accounting firm registered with the Public Company Accounting Oversight Board (United States) (PCAOB) and are required to be independent with respect to the Company in accordance with U.S. federal securities laws and the applicable rules and regulations of the Securities and Exchange Commission and the PCAOB.


We conducted our audits in accordance with the standards of the PCAOB. Those standards require that we plan and perform the audit to obtain reasonable assurance about whether the financial statements are free of material misstatement, whether due to error or fraud. The Company is not required to have, nor were we engaged to perform, an audit of its internal control over financial reporting. As part of our audits we are required to obtain an understanding of internal control over financial reporting but not for the purpose of expressing an opinion on the effectiveness of the Company's internal control over financial reporting. Accordingly, we express no such opinion.


Our audits included performing procedures to assess the risks of material misstatement of the financial statements, whether due to error or fraud, and performing procedures that respond to those risks. Such procedures included examining, on a test basis, evidence regarding the amounts and disclosures in the financial statements. Our audits also included evaluating the accounting principles used and significant estimates made by management, as well as evaluating the overall presentation of the financial statements. We believe that our audits provide a reasonable basis for our opinion.


Critical Audit Matter
The critical audit matter communicated below is a matter arising from the current period audit of the financial statements that was communicated or required to be communicated to the audit committee and that: (1) relates to accounts or disclosures that are material to the financial statements and (2) involved our especially challenging, subjective, or complex judgments. The communication of critical audit matters does not alter in any way our opinion on the financial statements, taken as a whole, and we are not, by communicating the critical audit matter below, providing a separate opinion on the critical audit matter or on the accounts or disclosures to which it relates.

Valuation of Goodwill
As reflected on the Company's balance sheet at December 31, 2020, the Company has goodwill of $10,395,766. As disclosed in Note 2 to the financial statements, the Company tests goodwill for impairment annually on December 31, as well as on an interim date if an event occurs or circumstances exist that may indicate impairment. A goodwill impairment loss is recorded if the fair value is below the carrying value of the applicable reporting unit. The Company performed goodwill impairment tests at March 31, 2020 and December 31, 2020, using a quantitative evaluation based on a discounted cash flow valuation model. The March 31, 2020, impairment test was the result of the circumstances that existed within the industry due to impacts of the COVID-19 pandemic. The impairment tests require management to make assumptions when estimating the fair value of the reporting unit, including projections of gross margin per gallon of ethanol produced, plant production levels, and the discount rate.

We identified the valuation of goodwill as a critical audit matter because of certain significant assumptions management makes in determining the fair value of the reporting unit, including projections of gross margin per gallon of ethanol produced, plant production levels, and the discount rate. The significant judgments made by management resulted in a high degree of auditor
33

judgment and an increased audit effort in performing procedures, including the use of a valuation specialist, and evaluating evidence obtained related to the significant assumptions used by management.

Our audit procedures related to the Company’s valuation of goodwill included the following, among others:

We tested the completeness, accuracy, and relevance of the underlying data used in developing management's estimates by comparing to source documentation and published market data.
We evaluated management’s assumptions for consistency with evidence obtained in other areas of the audit.
We evaluated the reasonableness of the methods and significant assumptions used in developing management’s estimates, including the projections of gross margin per gallon of ethanol produced, plant production levels, and the discount rate by:
Testing the reasonableness of management’s projected gross margin per gallon of ethanol produced by comparing to historical performance and published market data for the Company’s primary products and inputs.
Testing the reasonableness of management’s projected production levels by comparing to historical performance and recent production levels that have occurred subsequent to the Company’s 2019 expansion.
Utilizing an internal valuation specialist to evaluate the reasonableness of the discount rates and testing the relevance and reliability of source information underlying the determination of the discount rates, testing the mathematical accuracy of the calculation, and developing a range of independent estimates and comparing those to the discount rates selected by management.

/s/ RSM US LLP


We have served as the Company's auditor since 2007.


Des Moines, Iowa
March 2, 201812, 2021


34

LAKE AREA CORN PROCESSORS, LLC
Consolidated Balance Sheets


December 31, 2020December 31, 2019
 ASSETS
CURRENT ASSETS
Cash and cash equivalents$18,637,811 $12,823,653 
Accounts receivable585,054 684,866 
Accounts receivable (related party)1,633,760 891,227 
Inventory9,768,916 10,543,422 
Derivative financial instruments2,074,010 505,025 
Prepaid expenses677,471 479,422 
Total current assets33,377,022 25,927,615 
PROPERTY AND EQUIPMENT
Land874,473 874,473 
Land improvements8,631,224 8,631,224 
Buildings9,316,576 9,316,576 
Equipment95,867,639 95,395,121 
Construction in progress6,303 150,925 
114,696,215 114,368,319 
Less accumulated depreciation(53,328,718)(47,660,838)
Net property and equipment61,367,497 66,707,481 
OTHER ASSETS
Goodwill10,395,766 10,395,766 
Investments16,636,367 16,682,169 
Other81,295 97,287 
Total other assets27,113,428 27,175,222 
TOTAL ASSETS$121,857,947 $119,810,318 
 December 31, 2017 December 31, 2016
 ASSETS   
    
CURRENT ASSETS   
Cash and cash equivalents$5,102,959
 $9,993,335
Accounts receivable3,186,530
 4,054,667
Other receivables38,704
 25,216
Inventory5,526,094
 6,212,619
Derivative financial instruments862,840
 1,057,465
Prepaid expenses219,741
 237,823
Total current assets14,936,868
 21,581,125
    
PROPERTY AND EQUIPMENT   
Land874,473
 874,473
Land improvements8,558,720
 9,449,920
Buildings8,955,206
 8,955,206
Equipment53,060,482
 52,614,358
Construction in progress8,475,840
 
 79,924,721
 71,893,957
Less accumulated depreciation(39,955,791) (37,069,755)
Net property and equipment39,968,930
 34,824,202
    
OTHER ASSETS   
Goodwill10,395,766
 10,395,766
Investments18,739,259
 11,192,032
Other31,417
 122,964
Total other assets29,166,442
 21,710,762
    
TOTAL ASSETS$84,072,240
 $78,116,089


See Notes to Consolidated Financial Statements

35


Table of Contents


LAKE AREA CORN PROCESSORS, LLC
Consolidated Balance Sheets


December 31, 2020December 31, 2019
LIABILITIES AND MEMBERS’ EQUITY
CURRENT LIABILITIES
Outstanding checks in excess of bank balance$319,608 $1,155,264 
Accounts payable18,526,170 13,812,388 
Accrued liabilities732,544 933,668 
Derivative financial instruments244,181 698,850 
Current portion of notes payable1,201,628 1,000,000 
Other4,000 4,000 
Total current liabilities21,028,131 17,604,170 
LONG-TERM LIABILITIES
Notes payable35,561,237 37,989,208 
Other4,000 
Total long-term liabilities35,561,237 37,993,208 
COMMITMENTS AND CONTINGENCIES (Note 10)00
MEMBERS' EQUITY (29,620,000 units issued and outstanding)65,268,579 64,212,940 
TOTAL LIABILITIES AND MEMBERS' EQUITY$121,857,947 $119,810,318 


December 31, 2017
December 31, 2016
LIABILITIES AND MEMBERS’ EQUITY


CURRENT LIABILITIES


Outstanding checks in excess of bank balance$674,936

$1,035,671
Accounts payable6,123,995

7,670,550
Accrued liabilities582,487

592,749
Derivative financial instruments410,785

827,786
Current portion of notes payable1,000,000


Other13,556

141,323
Total current liabilities8,805,759

10,268,079


LONG-TERM LIABILITIES


Notes payable6,971,944

1,000
Other12,000
 25,556
Total long-term liabilities6,983,944

26,556


COMMITMENTS AND CONTINGENCIES


MEMBERS' EQUITY (29,620,000 units issued and outstanding)68,282,537

67,821,454


TOTAL LIABILITIES AND MEMBERS' EQUITY$84,072,240

$78,116,089


See Notes to Consolidated Financial Statements


36

LAKE AREA CORN PROCESSORS, LLC
Consolidated Statements of Operations
Year Ended
December 31, 2020
Year Ended
December 31, 2019
Year Ended
December 31, 2018
REVENUES$130,521,814 $115,986,821 $74,703,630 
COSTS OF REVENUES124,493,268 114,687,231 68,619,694 
GROSS PROFIT6,028,546 1,299,590 6,083,936 
OPERATING EXPENSES4,418,074 4,060,343 3,837,659 
INCOME (LOSS) FROM OPERATIONS1,610,472 (2,760,753)2,246,277 
OTHER INCOME (EXPENSE)
Interest and other income495,474 180,801 67,042 
Equity in net income (loss) of investments343,728 (60,908)403,268 
Interest expense(1,394,035)(1,183,324)
Total other income (expense)(554,833)(1,063,431)470,310 
NET INCOME (LOSS)$1,055,639 $(3,824,184)$2,716,587 
BASIC AND DILUTED EARNINGS (LOSS) PER UNIT$0.04 $(0.13)$0.09 
WEIGHTED AVERAGE NUMBER OF UNITS OUTSTANDING29,620,000 29,620,000 29,620,000 
 Year Ended
December 31, 2017
 Year Ended
December 31, 2016
 Year Ended
December 31, 2015
     
REVENUES$84,821,788
 $88,812,550
 $88,997,947
     
COSTS OF REVENUES76,253,945
 76,097,861
 81,445,770
     
GROSS PROFIT8,567,843
 12,714,689
 7,552,177
     
OPERATING EXPENSES3,717,291
 3,642,087
 1,827,789
     
INCOME FROM OPERATIONS4,850,552
 9,072,602
 5,724,388
     
OTHER INCOME (EXPENSE)    
Interest and other income77,033
 40,367
 117,471
Business interruption claims recovery
 
 617,771
Equity in net income of investments1,459,806
 2,293,928
 2,195,535
Interest expense(2,308) (1,689) (1,635)
Total other income (expense)1,534,531
 2,332,606
 2,929,142
     
NET INCOME$6,385,083
 $11,405,208
 $8,653,530
     
BASIC AND DILUTED EARNINGS PER UNIT$0.22
 $0.39
 $0.29
     
WEIGHTED AVERAGE NUMBER OF UNITS OUTSTANDING FOR THE CALCULATION OF BASIC & DILUTED EARNINGS PER UNIT29,620,000
 29,620,000
 29,620,000


See Notes to Consolidated Financial Statements


37

LAKE AREA CORN PROCESSORS, LLC
Consolidated Statements of Changes in Members' Equity
Years Ended December 31, 2017, 20162020, 2019 and 20152018


Members'
Equity
Balance, December 31, 2017$68,282,537 
Net income2,716,587 
Distributions ($.10 per capital unit)(2,962,000)
Balance, December 31, 201868,037,124 
Net (loss)(3,824,184)
Balance, December 31, 201964,212,940 
Net income1,055,639 
Balance, December 31, 2020$65,268,579 
  Members'
  Equity
Balance, December 31, 2014 $68,600,228
Net income 8,653,530
Distributions paid ($.30 per capital unit) (8,989,512)
   
Balance, December 31, 2015 68,264,246
Net income 11,405,208
Distributions paid ($.40 per capital unit) (11,848,000)
   
Balance, December 31, 2016 67,821,454
Net income 6,385,083
Distributions paid ($.20 per capital unit) (5,924,000)
   
Balance, December 31, 2017 $68,282,537


See Notes to Consolidated Financial Statements


38

LAKE AREA CORN PROCESSORS, LLC
Consolidated Statements of Cash Flows

December 31, 2017 December 31, 2016 December 31, 2015


OPERATING ACTIVITIES
 
  
Net income$6,385,083
 $11,405,208
 $8,653,530
Adjustments to reconcile net income to cash provided by operating activities
 
  
Depreciation and amortization2,977,582
 3,375,012
 3,373,935
Distributions in excess of earnings from investments2,598,644
 4,032,960
 8,004,464
(Gain) on insurance proceeds for damage to equipment
 
 (2,818,955)
Loss on disposal of property and equipment
 
 849,734
(Increase) decrease in
 
  
Receivables816,730
 (2,432,676) 759,945
Inventory686,526
 1,352,871
 (1,458,844)
Prepaid expenses18,080
 43,732
 24,796
Derivative financial instruments(222,375) (160,259) (59,474)
Increase (decrease) in


Accounts payable(1,550,377) (2,017,964) 2,211,376
Accrued and other liabilities(142,029) 80,872
 (64,878)
NET CASH PROVIDED BY OPERATING ACTIVITIES11,567,864
 15,679,756
 19,475,629


INVESTING ACTIVITIES     
Insurance proceeds received for damage to equipment
 1,318,955
 1,500,000
Purchase of property and equipment(7,989,022) (3,999,128) (9,894,309)
Purchase of investments(10,145,871) 
 (15,000)
NET CASH (USED IN) INVESTING ACTIVITIES(18,134,893) (2,680,173) (8,409,309)


FINANCING ACTIVITIES
 
  
Increase (decrease) in outstanding checks in excess of bank balance(360,736) 558,505
 230,319
Proceeds from issuance of notes payable8,000,000
 
 
Payments for long-term debt(38,611) (45,919) (82,344)
Distributions to members(5,924,000) (11,848,000) (8,989,512)
NET CASH PROVIDED BY (USED IN) FINANCING ACTIVITIES1,676,653
 (11,335,414) (8,841,537)


NET INCREASE (DECREASE) IN CASH AND CASH EQUIVALENTS(4,890,376) 1,664,169
 2,224,783


CASH AND CASH EQUIVALENTS AT BEGINNING OF PERIOD9,993,335
 8,329,166
 6,104,383


CASH AND CASH EQUIVALENTS AT END OF PERIOD$5,102,959
 $9,993,335
 $8,329,166


SUPPLEMENTAL DISCLOSURES OF CASH FLOW INFORMATION
 
  
Cash paid during the period for interest, net of capitalized interest of $116,650, $2,940 and $6,175 in 2017, 2016 and 2015, respectively$2,317
 $1,687
 $1,689
Capital expenditures in accounts payable111,390
 69,647
 52,989
      
Year Ended December 31, 2020Year Ended December 31, 2019Year Ended December 31, 2018
OPERATING ACTIVITIES
Net income (loss)$1,055,639 $(3,824,184)$2,716,587 
Adjustments to reconcile net income (loss) to net cash provided by operating activities
Depreciation and amortization5,718,454 4,965,966 3,173,391 
Distributions in excess of earnings from investments45,803 1,252,223 1,848,747 
Loss on disposal of property and equipment38,088 
(Increase) decrease in
Receivables(642,721)(347,041)1,996,181 
Inventory774,506 (2,981,920)(2,035,408)
Prepaid expenses(198,049)(213,629)(46,050)
Derivative financial instruments(2,023,655)379,355 266,524 
Increase (decrease) in
Accounts payable4,713,782 8,123,326 (323,542)
Accrued and other liabilities(205,124)163,674 169,950 
NET CASH PROVIDED BY OPERATING ACTIVITIES9,238,635 7,517,770 7,804,468 
INVESTING ACTIVITIES
Purchase of property and equipment(359,221)(9,066,179)(25,913,312)
Purchase of investments(633,924)(409,957)
NET CASH USED IN INVESTING ACTIVITIES(359,221)(9,700,103)(26,323,269)
FINANCING ACTIVITIES
Increase (decrease) in outstanding checks in excess of bank balance(835,656)(1,091,951)1,572,279 
Borrowings on notes payable60,770,400 85,500,000 26,873,268 
Payments on notes payable(63,000,000)(71,100,000)(10,274,268)
Financing costs paid(95,500)
Distributions to members(2,962,000)
NET CASH PROVIDED BY (USED IN) FINANCING ACTIVITIES(3,065,256)13,308,049 15,113,779 
NET INCREASE (DECREASE) IN CASH AND CASH EQUIVALENTS5,814,158 11,125,716 (3,405,022)
CASH AND CASH EQUIVALENTS AT BEGINNING OF PERIOD12,823,653 1,697,937 5,102,959 
CASH AND CASH EQUIVALENTS AT END OF PERIOD$18,637,811 $12,823,653 $1,697,937 
SUPPLEMENTAL DISCLOSURES OF CASH FLOW INFORMATION
Cash paid during the period for interest, net of capitalized interest of $148; $831,170; and $518,703 in 2020, 2019 and 2018, respectively$1,510,468 $835,236 $
Capital expenditures in accounts payable1,160,834 
See Notes to Consolidated Financial Statements

39
37

LAKE AREA CORN PROCESSORS, LLC
NOTES TO CONSOLIDATED FINANCIAL STATEMENTS
DECEMBER 31, 2017, 20162020, 2019 AND 20152018    


NOTE 1     .- NATURE OF OPERATIONS


Principal Business Activity


Lake Area Corn Processors, LLC and subsidiary (the Company) is a South Dakota limited liability company.


The Company owns and manages Dakota Ethanol, LLC (Dakota Ethanol), a 40 million-gallon90 million-gallon (annual nameplate capacity) ethanol plant located near Wentworth, South Dakota. Dakota Ethanol sells ethanol and related products to customers located primarily in North America.


In addition, the Company has investment interests in six5 companies in related industries. See note 45 for further details.


NOTE 2.2 - SUMMARY OF SIGNIFICANT ACCOUNTING POLICIES


Principles of Consolidation


The consolidated financial statements of the Company include the accounts of its wholly owned subsidiary, Dakota Ethanol. All significant inter-company transactions and balances have been eliminated in consolidation.


Revenue Recognition


The Company has adopted the guidance of ASC Topic 606, Revenue from Contracts with Customers (Topic 606). Topic 606 requires the productionCompany to recognize revenue to depict the transfer of ethanolpromised goods or services to customers in an amount that reflects the consideration to which the entity expects to be entitled in exchange for those goods or services. The guidance requires the Company to apply the following steps: (1) identify the contract with a customer; (2) identify the performance obligations in the contract; (3) determine the transaction price; (4) allocate the transaction price to the performance obligations in the contract; and related products(5) recognize revenue when, or as, the Company satisfies a performance obligation. The Company generally recognizes revenue at a point in time. The Company’s contracts with customers have one performance obligation and a contract duration of one year or less.

The following is recordeda description of principal activities from which we generate revenue. Revenues from contracts with customers are recognized when title transferscontrol of the promised goods or services are transferred to customers.our customers, in an amount that reflects the consideration that we expect to receive in exchange for those goods or services. Generally, ethanol and related products are shipped FOB shipping point and control of the goods transfers to customers when the goods are loaded into trucks or when rail cars are shipped. Consideration is based on written contract terms between Dakotapredetermined contractual prices or on current market prices.

Sales of Ethanol and its
Sales of Distillers Grains
Sales of Distillers Corn Oil

Disaggregation of Revenue:

All revenue recognized in the income statement is considered to be revenue from contracts with customers. CollectabilityThe following table depicts the disaggregation of revenue is reasonably assuredaccording to product line:
202020192018
Revenues ethanol$99,077,363 $90,415,936 $57,705,675 
Revenues distillers grains25,519,999 21,200,904 14,677,962 
Revenues distillers corn oil5,924,452 4,369,981 2,319,993 
$130,521,814 $115,986,821 $74,703,630 

40

Table of Contents
LAKE AREA CORN PROCESSORS, LLC
NOTES TO CONSOLIDATED FINANCIAL STATEMENTS
DECEMBER 31, 2020, 2019 AND 2018    


Contract Assets and Contract Liabilities:

The Company has no significant contract assets or contract liabilities from contracts with customers.

The Company receives payments from customers based on historical evidenceupon contractual billing schedules; accounts receivable are recorded when the right to consideration becomes unconditional. Contract liabilities include payments received in advance of collectability between Dakota Ethanolperformance under the contract, and its customers. Interest income isare realized with the associated revenue recognized as earned.under the contract.


Shipping Costs

Shipping costs incurred by the Company in the sale of ethanol, dried distillersdistiller's grains and corn oil are not specifically identifiable and as a result, revenue from the sale of those products is recorded based on the net selling price reported to the Company from the marketer.


When the Company performs shipping and handling activities after the transfer of control to the customers (e.g., when control transfers prior to delivery), they are considered as fulfillment activities, and accordingly, the costs are accrued for when the related revenue is recognized.

Cost of Revenues


The primary components of cost of revenues from the production of ethanol and related co-productco-products are corn expense, energy expense (natural gas and electricity), raw materials expense (chemicals and denaturant), and direct labor costs.


Shipping costs on modified and wet distillersdistiller's grains are included in cost of revenues.


Inventory Valuation


Inventories are generally valued using methods which approximate the lower of cost (first-in, first-out) or net realizable value. In the valuation of inventories, and purchase commitments, net realizable value is based on estimated selling prices in the ordinary course of business less reasonably predictable costs of completion, disposal and transportation.


Cash and Cash Equivalents


Cash and cash equivalents consist of demand accounts and other accounts with original maturities of three months or less that provide withdrawal privileges.


Receivables and Credit Policies


Accounts receivable are uncollateralized customer obligations due under normal trade terms requiring payment within fifteen days from the invoice date. Unpaid accounts receivable with invoice dates over thirty days old bear interest at 1.5% per month. Accounts receivable are stated at the amount billed to the customer. Payments of accounts receivable are allocated to the specific invoices identified on the customer’s remittance advice or, if unspecified, are applied to the earliest unpaid invoices.


38

LAKE AREA CORN PROCESSORS, LLC
NOTES TO CONSOLIDATED FINANCIAL STATEMENTS
DECEMBER 31, 2017, 2016 AND 2015    


The carrying amount of trade receivables is reduced by a valuation allowance that reflects management’s best estimate of the amounts that will not be collected. Management regularly reviews trade receivable balances and based on an assessment of current creditworthiness, estimates the portion, if any, of the balance that will not be collected. The valuation allowance was $2,131$0 and $51,791$0 as of December 31, 20172020 and 20162019 respectively.


Investment in commodities contracts, derivative instruments and hedging activities


The Company is exposed to certain risks related to our ongoing business operations.  The primary risks that the Company manages by using forward contracts or derivative instruments are price risk on anticipated purchases of corn and natural gas and the sale of ethanol, distillers grains and distillers corn oil.
 
The Company is subject to market risk with respect to the price and availability of corn, the principal raw material the Company uses to produce ethanol and ethanol by-products.  In general, rising corn prices result in lower profit margins and, therefore,
41

Table of Contents
LAKE AREA CORN PROCESSORS, LLC
NOTES TO CONSOLIDATED FINANCIAL STATEMENTS
DECEMBER 31, 2020, 2019 AND 2018    


represent unfavorable market conditions.  This is especially true when market conditions do not allow us to pass along increased corn costs to our customers.  The availability and price of corn is subject to wide fluctuations due to unpredictable factors such as weather conditions, farmer planting decisions, governmental policies with respect to agriculture and international trade and global demand and supply.


Certain contracts that literally meet the definition of a derivative may be exempted from derivative accounting as normal purchases or normal sales.  Normal purchases and normal sales are contracts that provide for the purchase or sale of something other than a financial instrument or derivative instrument that will be delivered in quantities expected to be used or sold over a reasonable period in the normal course of business.  Contracts that meet the requirements of normal purchases or sales are documented as normal and exempted from the accounting and reporting requirements of derivative accounting.


The Company does not apply the normal purchase and sales exemption for forward corn purchase contracts. As of December 31, 2017,2020, the Company is committed to purchasing approximately 2.55.2 million bushels of corn on a forward contract basis with an average price of $3.30$4.19 per bushel. The total corn purchase contracts represent 14%17% of the projected annual plant corn usage.


The Company has 289,000 bushels of corn inventory delivered under delayed-pricing contracts. The contracts have various pricing deadlines through October 29, 2021. The Company is subject to risk of changes in the corn market until they are priced.

The Company enters into firm-price purchase commitments with natural gas suppliers under which the Company agrees to buy natural gas at a price set in advance of the actual delivery.  Under these arrangements, the Company assumes the risk of a price decrease in the market price of natural gas between the time the price is fixed and the time the natural gas is delivered.  At December 31, 2017,2020, the Company is committed to purchasing approximately 40,000 MMBtus301,000 MMBtu's of natural gas with an average price of $3.10$2.90 per MMBtu. The Company accounts for these transactions as normal purchases, and accordingly, does not mark these transactions to market. The natural gas purchases represent approximately 3%15% of the projected annual plant requirements.


The Company enters into firm-price sales commitments with distillers grains customers under which the Company agrees to sell distillers grains at a price set in advance of the actual delivery.  Under these arrangements, the Company assumes the risk of a price increase in the market price of distillers grain between the time the price is fixed and the time the distillers grains are delivered.  At December 31, 2017,2020, the Company is committed to selling approximately 38,000 dry equivalent tons of distillers grains with an average price of $101$148 per ton.  The Company accounts for these transactions as normal sales, and accordingly, does not mark these transactions to market. The distillers grains sales represent approximately 26%18% of the projected annual plant production.


The Company enters into firm-price sales commitments with distillers corn oil customers under which the Company agrees to sell distillers corn oil at a price set in advance of the actual delivery.  Under these arrangements, the Company assumes the risk of a price increase in the market price of distillers corn oil between the time thethis price is fixed and the time the distillers corn oil is delivered.  At December 31, 2017,2020, the Company is committed to selling approximately 770,0001,681,000 pounds of distillers corn oil with an average price of $0.24$0.36 per pound.  The Company accounts for these transactions as normal sales, and accordingly, does not mark these transactions to market. The distillers corn oil sales represent approximately 7% of the projected annual plant production.


The Company does not have any firm-priced sales commitments for ethanol as of December 31, 2017.2020.


The Company enters into short-term forward, option and futures contracts for ethanol, corn and natural gas as a means of managing exposure to changes in commodity and energy prices. All contracts of the Company's derivativesCompany are designated as non-hedge derivatives

39

LAKE AREA CORN PROCESSORS, LLC
NOTES TO CONSOLIDATED FINANCIAL STATEMENTS
DECEMBER 31, 2017, 2016 AND 2015    


and accordingly are recorded at fair value with changes in fair valuebeing recognized in net income.income, or are designated as normal purchases and normal sales and are evaluated for inherent losses. Although the contracts are considered economic hedges of specified risks, they are not designated as and accounted for as hedging instruments.


As part of our trading activity, Thethe Company uses futures and option contracts offered through regulated commodity exchanges to reduce risk of loss in the market value of inventories and purchase commitments. To reduce that risk, the Company generally takes positions using forward and futures contracts and options.


42

Table of Contents
LAKE AREA CORN PROCESSORS, LLC
NOTES TO CONSOLIDATED FINANCIAL STATEMENTS
DECEMBER 31, 2020, 2019 AND 2018    


Derivatives not designated as hedging instruments at December 31, 20172020 and December 31, 20162019 were as follows:


  Balance Sheet Classification December 31, 2017 December 31, 2016
       
Forward contracts in gain position   $3,856
 $6,491
Futures contracts in gain position   119,825
 246,900
Futures contracts in loss position   (1,363) (12,575)
     Total forward and futures contracts   122,318
 240,816
Cash held by broker   740,522
 816,649
   Current Assets $862,840
 $1,057,465
       
Forward contracts in loss position  (Current Liabilities) $(410,785) $(827,786)
       

Balance Sheet ClassificationDecember 31, 2020December 31, 2019
Corn forward contracts in gain position$1,742,054 $160,687 
Futures and options contracts in gain position33,338 
Futures and options contracts in loss position(1,799,688)(1,500)
Total forward, futures and options contracts(57,634)192,525 
Cash held by broker2,131,644 312,500 
 Current Assets$2,074,010 $505,025 
Corn forward contracts in loss position Current Liabilities$(244,181)$(698,850)
Futures and options contracts and cash held by broker are all with one party and the right of offset exists. Therefore, on the balance sheet, these items are netted in one balance regardless of position.


Forward contracts are with multiple parties and the right of offset does not exist. Therefore, these contracts are reported at the gross amounts on the balance sheet.


Realized and unrealized gains and losses related to derivative contracts related to corn and natural gas purchases are included as a component of cost of revenues and derivative contracts related to ethanol sales are included as a component of revenues in the accompanying financial statements.


 Statement of OperationsYears Ended December 31,
Classification202020192018
Net realized and unrealized gains (losses) related to purchase contracts:
Futures and options contractsCost of Revenues$(1,211,861)$(8,631)$1,544,635 
Forward contractsCost of Revenues(415,420)(897,283)(994,854)
   Statement of Operations Years Ended December 31,
  Classification 2017 2016 2015
Net realized and unrealized gains (losses) related to purchase contracts:        
Futures contracts Cost of Revenues $608,250
 $1,874,523
 $1,325,265
Forward contracts Cost of Revenues (1,423,330) (1,707,414) (994,242)


Investments


The Company has investment interests in six5 companies in related industries. All of these interests are at ownership shares less than 20%. These investments are flow-through entities. Per ASC 323-30-S99-1, they are being accounted for by the equity method of accounting under which the Company’s share of net income is recognized as income in the Company’s statements of operations and added to the investment account.  Distributions or dividends received from the investments are treated as a reduction of the investment account. The Company consistently follows the practice of recognizing the net income based on the most recent reliable data. 


40

LAKE AREA CORN PROCESSORS, LLC
NOTES TO CONSOLIDATED FINANCIAL STATEMENTS
DECEMBER 31, 2017, 2016 AND 2015    


Use of Estimates


The preparation of financial statements in conformity with accounting principles generally accepted in the United States of America requires management to make estimates and assumptions that affect the reported amount of assets and liabilities and disclosure of contingent assets and liabilities at the date of the financial statements and revenues and expenses during the reporting period. Actual results could differ from those estimates. Significant estimates include the fair value of derivative financial instruments, lower of cost or net realizable value accounting for inventory and forward purchase contracts and goodwill impairment evaluation.

43

Table of Contents
LAKE AREA CORN PROCESSORS, LLC
NOTES TO CONSOLIDATED FINANCIAL STATEMENTS
DECEMBER 31, 2020, 2019 AND 2018    


Concentrations of Credit Risk


The Company’s cash balances are maintained in bank depositories and regularly exceed federally insured limits. The Company has not experienced any losses in connection with these balances.


Property and Equipment


Property and equipment is stated at cost. Significant additions and betterments are capitalized, while expenditures for maintenance, repairs and minor renewals are charged to operations when incurred. Depreciation on assets placed in service is computed using the straight-line method over estimated useful lives as follows:


Land improvements    20-40 years
MinimumMaximum
Land improvements20 years40 years
Equipment5 years20 years
Buildings15 years40 years
Equipment    5-20 years

Buildings    15-40 years

Equipment relates to two general categories: mechanical equipment and administrative and maintenance equipment. Mechanical equipment generally relates to equipment for handling inventories and the production of ethanol and related products, with useful lives of 15 to 20 years, including boilers, cooling towers, grain bins, centrifuges, conveyors, fermentation tanks, pumps and drying equipment. Administrative and maintenance equipment is equipment with useful lives of 5 to 15 years, including vehicles, computer systems, security equipment, testing devices and shop equipment.


The Company reviews its property and equipment for impairment whenever events indicate that the carrying amount of an asset group may not be recoverable. An impairment loss is recorded when the sum of the undiscounted future cash flows is less than the carrying amount of the asset group. An impairment loss is measured as the amount by which the carrying amount of the asset group exceeds its fair value. During the first quarter of 2020, the COVID-19 pandemic represented a change in circumstance that indicated the carrying value of property and equipment may not be recoverable. The Company calculated the undiscounted future cash flows of the property and equipment and determined them to be recoverable. Accordingly, no impairment was recorded. No indicators of impairment were identified at December 31, 20172020 and 2016.2019.


Goodwill


Annually, as well as when an event triggering impairment may have occurred, the Company performs an impairment test on goodwill. The Company performs a quantitative analysis that tests for impairment. The second step, if necessary, measures the impairment. During the first quarter of 2020 a triggering event was determined to have occurred and an impairment test was performed as of March 31, 2020. The Company determined there was no impairment at that time. The Company performs the annual analysis on December 31 of each fiscal year. The Company determined that there was no0 impairment of goodwill at December 31, 20172020 and 2016.2019.


Earnings Per Unit


For purposes of calculating basic earnings per unit, units issued are considered outstanding on the effective date of issuance. Diluted earnings per unit are calculated by including dilutive potential equity units in the denominator. There were no dilutive equity units for the years ending December 31, 2017, 2016,2020, 2019, and 2015.2018.


Income Taxes


The Company is taxed as a limited liability company under the Internal Revenue Code. The income of the Company flows through to the members to be taxed at the member level rather than the corporate level. Accordingly, the Company has no tax liability.

41

LAKE AREA CORN PROCESSORS, LLC
NOTES TO CONSOLIDATED FINANCIAL STATEMENTS
DECEMBER 31, 2017, 2016 AND 2015    


Management has evaluated the Company’s tax positions under the Financial Accounting Standards Board issued guidance on accounting for uncertainty in income taxes and concluded that the Company had taken no uncertain tax positions that require adjustment to the financial statements to comply with the provisions of this guidance. Generally, the Company is no longer subject to income tax examinations by the U.S. federal, state or local authorities for the years before 2014.2016.


44

Table of Contents
LAKE AREA CORN PROCESSORS, LLC
NOTES TO CONSOLIDATED FINANCIAL STATEMENTS
DECEMBER 31, 2020, 2019 AND 2018    


Environmental Liabilities


The Company’s operations are subject to environmental laws and regulations adopted by various governmental authorities in the jurisdictions in which it operates. These laws require the Company to investigate and remediate the effects of the release or disposal of materials at its locations. Accordingly, the Company has adopted policies, practices and procedures in the areas of pollution control, occupational health and the production, handling, storage and use of hazardous materials to prevent material environmental or other damage, and to limit the financial liability which could result from such events. Environmental liabilities are recorded when the Company’s liability is probable and the costs can be reasonably estimated.


Reporting Segment

Operating Segment

The Company uses the “management approach”segments are defined as components of an enterprise for reportingwhich separate financial information about segments in annual and interim financial statements. The management approach is based on the wayavailable that is evaluated regularly by the chief operating decision-maker organizes segments within a company fordecision maker or decision making operating decisionsgroup in deciding how to allocate resources and in assessing performance. Reportable segments are based on products and services, geography, legal structure, management structure and any other manner in which management disaggregates a company. Based on the “management approach” model, theThe Company has determined that its business is comprised of a singleit has six operating segment.segments that give rise to two reportable segments. See "Note 3 - Segments" in our Notes to Consolidated Financial Statements included elsewhere in this report for financial information about our segment reporting.


Recently Issued Accounting Pronouncements

In May 2014, the Financial Accounting Standards Board (FASB) issued Accounting Standards Update (ASU) 2014-09, "Revenue from Contracts with Customers (Topic 606)" (ASU 2014-09). ASU 2014-09 requires an entity to recognize the amount of revenue to which it expects to be entitled for the transfer of promised goods or services to customers. The updated standard will replace most existing revenue recognition guidance in U.S. Generally Accepted Accounting Principles (GAAP) when it becomes effective and permits the use of either a full retrospective or retrospective with cumulative effect transition method. The updated standard becomes effective for the Company in the first quarter of fiscal year 2018. The Company has completed a comparison of the current revenue recognition policies to the ASU 2014-09 requirements for each of the Company’s major revenue categories. Results indicate that the guidance will not materially change the amount or timing of revenues recognized by the Company. The Company will adopt ASU 2014-09 using the retrospective with cumulative effect transition method. The Company expects to have enhanced disclosures but does not expect this standard to have a material impact on the Company's consolidated financial statements.

In February 2016, FASB issued ASU No. 2016-02, "Leases (Topic 842)” (ASU 2016-02). ASU 2016-02 requires the recognition of lease assets and lease liabilities by lessees for all leases greater than one year in duration and classified as operating leases under previous GAAP. ASU 2016-02 is effective for fiscal years beginning after December 15, 2018, and for interim periods within that fiscal year. The Company does not expect this standard to have a material impact on the Company's consolidated financial statements.


In January 2017, FASB issued ASU No. 2017-04, “Intangibles-Goodwill"Intangibles-Goodwill and Other (Topic 350)" (ASU 2017-04). ASU 2107-042017-04 simplifies the test for goodwill impairment. It eliminates the two-step process of assessing goodwill impairment and replaces it with one step which compares the fair value of the reporting unit with its carrying amount. An impairment charge is recognized for the amount by which the carrying value exceeds the fair value up to the amount of the goodwill attributed to the reporting unit. ASU 2017-04 is effective for fiscal years beginning after December 15, 2019, and for interim periods within that fiscal year. The Company does not expectadopted ASU 2017-04 for the fiscal year 2020. The Company found it preferable to adopt ASU 2017-04 because the benefits of this standard to haveusers of the financial statements will outweigh the costs of following the pre-existing guidance. The standard has not had a material impact on the Company's consolidated financial statements.


In August 2018, FASB issued ASU No. 2018-13, "Fair Value Measurement (Topic 820): Disclosure Framework - Changes to the Disclosure Requirements for Fair Value Measurement" (ASU 2018-13). ASU 2018-13 improves the effectiveness of the fair value disclosures in the financial statements. It adds, removes and modifies various disclosure requirements relating to the fair value hierarchy. ASU 2018-13 is effective for fiscal years beginning after December 15, 2019, and for interim periods within that fiscal year. The Company adopted ASU 2018-13 for the fiscal year 2020. The standard has not had a material impact on the Company's consolidated financial statements.

Risks and Uncertainties


The Company has certain risks and uncertainties that it will experience during volatile market conditions, which can have a severe impact on operations. The Company's revenues are derived from the sale and distribution of ethanol and distiller grains to customers

42

LAKE AREA CORN PROCESSORS, LLC
NOTES TO CONSOLIDATED FINANCIAL STATEMENTS
DECEMBER 31, 2017, 2016 AND 2015    


primarily located in the United States. Corn for the production process is supplied to the plant primarily from local agricultural producers and from purchases on the open market. For the twelve months ended December 31, 2017,2020, ethanol sales averaged approximately 79%76% of total revenues, while approximately 17%20% of revenues were generated from the sale of distillerdistillers grains and 4% of revenues were generated from the sale of corn oil. For the twelve months ended December 31, 2017,2020, corn costs averaged approximately 71%77% of cost of goods sold.


The Company's operating and financial performance is largely driven by the prices at which it sells ethanol and the net expense of corn. The price of ethanol is influenced by factors such as supply and demand, weather, government policies and programs, and unleaded gasoline and the petroleum markets. Excess ethanol supply in the market, in particular, puts downward pressure on the price of ethanol. The Company's largest cost of production is corn. The cost of corn is generally impacted by factors such as supply and demand, weather, and government policies and programs. The Company's risk management program is used to protect against the price volatility of these commodities.


45

Table of Contents
LAKE AREA CORN PROCESSORS, LLC
NOTES TO CONSOLIDATED FINANCIAL STATEMENTS
DECEMBER 31, 2020, 2019 AND 2018    


On January 30, 2020, the World Health Organization declared the coronavirus outbreak (COVID-19) a “Public Health Emergency of International Concern” and on March 11, 2020, declared COVID-19 a pandemic. The impact of COVID-19 negatively impacted the Company’s operations, suppliers or other vendors, and customer base. Gasoline demand has been reduced in the United States which temporarily forced the Company to reduce ethanol production in 2020. Any quarantines, labor shortages or other disruptions to the Company’s operations, or those of their customers, may adversely impact the Company’s revenues, ability to provide its services and operating results. In addition, a significant outbreak of epidemic, pandemic or contagious diseases in the human population could result in a widespread health crisis that could adversely affect the economies and financial markets of many countries, including the geographical area in which the Company operates, resulting in an economic downturn that could affect demand for its goods and services. The extent to which the coronavirus impacts the Company’s long-term results will depend on future developments, which are highly uncertain and cannot be predicted, including new information which may emerge concerning the severity of the coronavirus and actions taken to contain the coronavirus or its impact, among others.

NOTE 3.3 - SEGMENTS

The Company reports its financial and operating performance in 2 segments: (1) production, which includes the manufacture and marketing of fuel-grade ethanol and co-products of the ethanol production process and (2) ethanol producing equity method investments, which consists of the aggregation of the Company's two equity method operating segments of investment in Guardian Hankinson, LLC and investment in Ring-neck Energy & Feed, LLC. The Company discloses its other identified operating segments in an all other category, which consists of the Company's investments in RPMG, LLC, Lawrenceville Tank, LLC, and Guardian Energy Management, LLC.

The Company’s two reportable segments have been identified based on their unique characteristics. Our production segment is the Company’s ethanol plant that is operated in a manner chosen by our chief decision making team. The ethanol producing equity method segment are aggregated operating segments investments that have exceeded the quantitative thresholds for reportable segments which have similar economic characteristics but our chief decision making team does not have input into the daily operations of those entities. The all other category is comprised of investments that fall below the quantitative thresholds for reporting segments and the Company's chief decision making team has no input into their daily operations. Production includes the core operating drivers of the Company’s consolidated financial statements which consist of the production and sale of ethanol and its co-products. Ethanol producing equity method investments derive their revenues from the production and sale of ethanol and its co-products. The all other category receives its revenues from marketing fees, management fees, and storage fees. The reconciliation item is necessary due to reportable segments not being consolidated in the financial statements, but rather are reflected as equity method investments.

The Company re-evaluated its reported segments during the year and identified two reporting segments in accordance with that review. The segments were identified using standards under ASC 280-10-50. They each engage in business activities, the operating results are reviewed by the Company’s chief operating decision maker, and discrete financial information is available for each segment.

The following tables set forth certain financial data for the Company's operating segments:

Year EndedYear EndedYear Ended
December 31, 2020December 31, 2019December 31, 2018
Net Sales
Production$130,521,814 $115,986,821 $74,703,630 
Ethanol Producing Equity Method Investments325,954,417 321,321,517 242,531,567 
All Other14,200,489 19,180,356 17,077,039 
Total470,676,720 456,488,694 334,312,236 
Reconciliation(340,154,906)(340,501,873)(259,608,606)
Consolidated$130,521,814 $115,986,821 $74,703,630 
Gross Profit
Production$6,028,546 $1,299,590 $6,083,936 
46

Table of Contents
LAKE AREA CORN PROCESSORS, LLC
NOTES TO CONSOLIDATED FINANCIAL STATEMENTS
DECEMBER 31, 2020, 2019 AND 2018    


Ethanol Producing Equity Method Investments11,976,243 12,354,418 8,798,849 
All Other8,840,138 13,024,964 10,986,461 
Total26,844,927 26,678,972 25,869,246 
Reconciliation(20,816,381)(25,379,382)(19,785,310)
Consolidated$6,028,546 $1,299,590 $6,083,936 
Net Income (Loss)
Production$1,055,639 $(3,824,184)$2,716,587 
Ethanol Producing Equity Method Investments307,019 (708,491)2,797,756 
All Other2,411,213 2,562,676 2,563,348 
Total3,773,871 (1,969,999)8,077,691 
Reconciliation(2,718,232)(1,854,185)(5,361,104)
Consolidated$1,055,639 $(3,824,184)$2,716,587 
Interest Income
Production$3,615 $11,876 $11,657 
Ethanol Producing Equity Method Investments21,902 23,104 89,190 
All Other2,395,057 2,810,198 2,639,671 
Total2,420,574 2,845,178 2,740,518 
Reconciliation(2,416,959)(2,833,302)(2,728,861)
Consolidated$3,615 $11,876 $11,657 
Interest Expense
Production$1,394,035 $1,183,324 $
Ethanol Producing Equity Method Investments4,276,226 5,673,185 3,530,500 
All Other2,469,656 3,337,002 2,120,931 
Total8,139,917 10,193,511 5,651,431 
Reconciliation(6,745,882)(9,010,187)(5,651,431)
Consolidated$1,394,035 $1,183,324 $
Depreciation and Amortization
Production$5,718,454 $4,965,966 $3,173,391 
Ethanol Producing Equity Method Investments26,742,646 23,314,542 18,486,710 
All Other235,325 871,269 990,583 
Total32,696,425 29,151,777 22,650,684 
Reconciliation(26,977,971)(24,185,811)(19,477,293)
Consolidated$5,718,454 $4,965,966 $3,173,391 
Expenditures for Additions to Long-lived Assets
Production$359,221 $9,066,179 $25,913,312 
Ethanol Producing Equity Method Investments2,431,446 22,592,254 89,378,887 
All Other47,650 50,176 14,800 
Total2,838,317 31,708,609 115,306,999 
Reconciliation(2,479,096)(22,642,430)(89,393,687)
Consolidated$359,221 $9,066,179 $25,913,312 


47

Table of Contents
LAKE AREA CORN PROCESSORS, LLC
NOTES TO CONSOLIDATED FINANCIAL STATEMENTS
DECEMBER 31, 2020, 2019 AND 2018    


December 31, 2020December 31, 2019
Total Assets
Production$121,857,947 $119,810,318 
Ethanol Producing Equity Method Investments244,353,900 259,662,054 
All Other175,909,073 186,431,339 
Total542,120,920 565,903,711 
Reconciliation(420,262,973)(446,093,393)
Consolidated$121,857,947 $119,810,318 
Equity Method Investments
Production$16,636,367 $16,682,169 
Ethanol Producing Equity Method Investments2,206,234 2,411,119 
All Other189,347 220,077 
Total19,031,948 19,313,365 
Reconciliation(2,395,581)(2,631,196)
Consolidated$16,636,367 $16,682,169 

NOTE 4 - INVENTORY


Inventory consisted of the following as of December 31, 20172020 and 2016:2019:


December 31, 2020December 31, 2019
Raw materials$5,096,067 $4,968,731 
Finished goods2,474,638 3,505,224 
Work in process1,090,893 952,319 
Parts inventory1,107,318 1,117,148 
$9,768,916 $10,543,422 
  December 31, 2017 December 31, 2016
Raw materials $2,466,493
 $3,217,822
Finished goods 1,193,552
 1,124,660
Work in process 516,362
 593,197
Parts inventory 1,349,687
 1,276,940
  $5,526,094
 $6,212,619
As of December 31, 2020 and December 31, 2019, the Company recorded a lower of cost or net realizable value write-down on corn inventory of approximately $0 and $424,000, ethanol inventory of approximately $0 and $167,000, distillers grains inventory of approximately $13,000 and $72,000, and corn oil inventory of approximately $0 and $0, respectively.


NOTE 4.5 - INVESTMENTS


Dakota Ethanol has a 7%5% investment interest in the Company’s ethanol marketer, Renewable Products Marketing Group, LLC (RPMG).  The net income which is reported in the Company’s income statement for RPMG is based on RPMG’s September 30, 2017, 20162020, 2019 and 20152018 audited results. The carrying amount of the Company’s investment was approximately $1,206,000$1,208,000 and $1,283,000$1,295,000 as of December 31, 20172020 and 2016,2019, respectively.


Dakota Ethanol has a 6% investment interest in Prairie Gold Venture Partnership, LLC (PGVP), a venture capital fund investing in cellulosic ethanol production.  The net income which is reported in the Company’s income statement for PGVP is based on PGVP’s June 30, 2017, 2016 and 2015 unaudited interim results. The carrying amount of the Company’s investment was approximately $0 and $308,000 as of December 31, 2017 and 2016, respectively. During 2017, Dakota Ethanol determined an other than temporary decline in value had occurred and wrote off the remaining $308,000 balance of the investment as it was considered impaired and worthless. This charge in included in the equity in net income of investments on the consolidated statements of operations for the year ended December 31, 2017.

Dakota Ethanol has a 10% investment interest in Lawrenceville Tanks, LLC (LT), a partnership to construct and operate an ethanol storage terminal in Georgia.  The net income which is reported in the Company’s income statement for LT is based on LT’s December 31, 2017, 20162020, 2019 and 20152018 unaudited results. The carrying amount of the Company’s investment was approximately $327,000$194,000 and $460,000$251,000 as of December 31, 20172020 and 20162019, respectively.


Lake Area Corn Processors has a 10% investment interest in Guardian Hankinson, LLC (GH), a partnership to operate an ethanol plant in North Dakota.  The net income which is reported in the Company’s income statement for GH is based on GH’s December 31, 2017, 20162020, 2019 and 20152018 audited results. The carrying amount of the Company’s investment was approximately $7,151,000$5,012,000 and $9,108,000$4,991,000 as of December 31, 20172020 and 20162019, respectively.


48

Table of Contents
LAKE AREA CORN PROCESSORS, LLC
NOTES TO CONSOLIDATED FINANCIAL STATEMENTS
DECEMBER 31, 2020, 2019 AND 2018    


Lake Area Corn Processors has a 17% investment interest in Guardian Energy Management, LLC (GEM), a partnership to provide management services to ethanol plants.  The net income which is reported in the Company’s income statement for GEM is based

43

LAKE AREA CORN PROCESSORS, LLC
NOTES TO CONSOLIDATED FINANCIAL STATEMENTS
DECEMBER 31, 2017, 2016 AND 2015    


on GEM’s December 31, 2017, 20162020, 2019 and 20152018 unaudited interim results. The carrying amount of the Company’s investment was approximately $33,000$90,000 and $33,000$53,000 as of December 31, 20172020 and 2016.2019, respectively.


Lake Area Corn Processors has an 11% investment interest in Ring-neck Energy & Feed, LLC (REF), a partnership to operate an ethanol plant in South Dakota.  The net income which is reported in the Company’s income statement for REF is based on REF’s December 31, 2017 unaudited interim2020 and 2019 audited results. The carrying amount of the Company’s investment was approximately $10,023,000$10,134,000 and $10,093,000 as of December 31, 2017. 2017 is2020 and 2019, respectively. REF commenced operations during the initial year for the investment in REF andsecond quarter of 2019. Prior to then, the ethanol plant is currentlywas under construction. The carrying amount of the investment exceeds the underlying equity in net assets by approximately $619,000.$1,057,000. The excess will beis comprised of a basis adjustment of approximately $434,000 and capitalized interest of $623,000. The excess is amortized over 10 years when the plant becomes operational.20 years. The amortization will beis recorded in equity in net income of investments.


Condensed, combined unaudited financial information of the Company's investments in RPMG, PGVP, LT, GH, GEM and REF are as follows:
Balance Sheet12/31/202012/31/201912/31/2018
Current assets$218,336,920 $219,618,012 $189,839,430 
Other assets201,926,053 226,475,381 234,748,455 
Current liabilities209,538,950 187,381,453 175,836,322 
Long-term liabilities48,854,217 95,219,540 78,589,892 
Member's equity161,869,806 163,492,402 170,161,671 
Revenue340,154,906 340,501,873 259,608,606 
Gross Profit20,816,381 25,379,382 19,785,310 
Net Income2,718,232 1,854,185 5,361,104 
Balance Sheet 12/31/2017 12/31/2016 12/31/2015
       
Current assets $212,154,680
 $178,539,108
 $157,550,341
Other assets 164,254,183
 151,378,628
 163,122,840
Current liabilities 131,152,747
 140,898,148
 115,222,336
Long-term liabilities 54,754,437
 49,924,355
 37,502,031
Member's equity 190,501,679
 139,095,233
 167,948,814
Revenue 255,154,945
 255,245,069
 259,096,005
Gross Profit 33,033,635
 42,635,837
 35,135,377
Net Income 19,482,340
 29,555,855
 25,650,869


The following table shows the condensed financial information of Guardian Hankinson; the earnings in which represents greater than 10% of the Company's net income for the year ended December 31, 2017.
Balance Sheet 12/31/2017 12/31/2016 12/31/2015
       
Current assets $22,771,808
 $31,337,860
 $30,957,066
Other assets 117,344,930
 133,415,881
 144,336,737
Current liabilities 17,619,748
 23,822,812
 21,819,143
Long-term liabilities 51,352,566
 49,856,355
 37,502,031
Members' equity 71,144,424
 91,074,574
 115,972,629
Revenue 239,421,949
 237,885,377
 240,928,085
Gross Profit 22,456,677
 30,731,135
 21,352,587
Net Income 17,422,533
 25,601,946
 19,838,398


44

LAKE AREA CORN PROCESSORS, LLC
NOTES TO CONSOLIDATED FINANCIAL STATEMENTS
DECEMBER 31, 2017, 2016 AND 2015    


The following table shows the condensed financial information of Ring-neck Energy & Feed; the investment in which represents greater than 10% of the Company's assets as of December 31, 2017.
Balance Sheet 12/31/2017
   
Current assets $50,000,088
Other assets 42,640,650
Current liabilities 4,716,781
Long-term liabilities 3,230,871
Members' equity 84,693,086
Revenue 
Gross Profit 
Net Income (253,522)

The Company recorded equity in net income of approximately $1,742,000, $2,561,000 and $1,984,000 from GH for the years ended December 31, 2017, 2016 and 2015 respectively. The Company recorded equity in net (loss) of approximately ($123,000) from REF for the year ended December 31, 2017. The Company recorded equity in net income (loss) of approximately $(160,000), $267,000$344,000, $(61,000) and $212,000$403,000 from our other investments for the years ended December 31, 2017, 20162020, 2019 and 20152018 respectively. The Company received distributions of approximately $390,000, $1,191,000 and $2,290,000 for our investments for the years ended December 31, 2020, 2019 and 2018 respectively. The Company has undistributed net earnings in investees of approximately $627,000$662,000 and $680,000$713,000 as of December 31, 20172020 and 2016,2019, respectively.

NOTE 5.6 - REVOLVING OPERATING NOTE


On November 1, 2016,February 6, 2018, Dakota Ethanol executed a revolving promissory note with Farm Credit Services of America (FCSA) in the amount up to $10,000,000 or the amount available in accordance with the borrowing base calculation.calculation, whichever is less. Dakota Ethanol amended the note agreement with FCSA in June of 2020. Under the amendment, the available credit under the revolving operating note was reduced to $2,000,000. Interest on the outstanding principal balances will accrue at 300 basis points above the 1 monthone-month LIBOR rate and is not subject to a floor. The rate was 4.35%3.15% at December 31, 2017.2020. There is a non-use fee of 0.25% on the unused portion of the $10,000,000$2,000,000 availability. The note is collateralized by substantially all assets of the Company. The note expires on November 1, 2019.2021. On December 31, 2017,2020, Dakota Ethanol had $00 outstanding and approximately $2,047,0000 available to be drawn on the revolving promissory note under the borrowing base.


NOTE 6.7 - LONG-TERM NOTES PAYABLE

On November 11, 2014, Dakota Ethanol executed a reducing revolving promissory note from FCSA in the amount of $15,000,000. The amount Dakota Ethanol can borrow on the note decreases by $750,000 semi-annually starting on April 1, 2015 until the maximum balance reaches $7.5 million on October 1, 2019. The note matures on October 1, 2024. Interest on the outstanding principal balance will accrue at 325 basis points above the 1 month LIBOR rate and is not subject to a floor. The rate was 4.60% at December 31, 2017. The note contains a non-use fee of 0.50% on the unused portion of the note. On December 31, 2017, Dakota Ethanol had $1,000 outstanding and $10,499,000 available to be drawn on the note.


On August 1, 2017, Dakota Ethanol executed a term note from FCSA in the amount of $8,000,000. Dakota Ethanol agreed to make monthly interest payments starting September 1, 2017 and annual principal payments of $1,000,000 starting on August 1, 2018. The payment on August 1, 2020 was deferred after the note was amended with FCSA and is now due on August 1, 2025. The notes matures on August 1, 2025. Interest on the outstanding principal balance will accrue at 325 basis points above the 1 monthone-month LIBOR rate until February 1, 2023 and is not subjectincreases to a floor.350 basis points thereafter until maturity. The rate was 4.60%3.40% at December 31, 2017.2020. On December 31, 2017,2020, Dakota Ethanol had $8,000,000$6,000,000 outstanding on the note.


49

Table of Contents
LAKE AREA CORN PROCESSORS, LLC
NOTES TO CONSOLIDATED FINANCIAL STATEMENTS
DECEMBER 31, 2020, 2019 AND 2018    


On February 6, 2018, Dakota Ethanol executed a reducing revolving promissory note from FCSA in the amount up to $40,000,000 or the amount available in accordance with the borrowing availability under the credit agreement. Dakota Ethanol amended the note agreement with FCSA in June of 2020. Under the amendment, the available credit on the reducing revolving note was increased to $48,000,000. The amount Dakota Ethanol can borrow on the note decreases by $1,750,000 semi-annually starting on July 1, 2021 until the maximum balance reaches $32,250,000 on July 1, 2025. The note matures on January 1, 2026. Interest on the outstanding principal balance will accrue at 325 basis points above the one-month LIBOR rate until February 1, 2023 and increases to 350 basis points thereafter until maturity. The rate was 3.40% at December 31, 2020. The note contains a non-use fee of 0.50% on the unused portion of the note. On December 31, 2020, Dakota Ethanol had $30,000,000 outstanding and $18,000,000 available to be drawn on the note.

As part of the note payable agreement, Dakota Ethanol is subject to certain restrictive covenants establishing financial reporting requirements, distribution and capital expenditure limits, minimum debt service coverage ratios, net worth and working capital requirements. Dakota Ethanol is also restricted from making distributions to Lake Area Corn Processors without the consent of the lender. The note is collateralized by substantially all assets of the Company. The note payable agreement was amended in June 2020 with modifications to the requirements. The working capital covenant was reduced to $11,000,000 and the net worth covenant was reduced to $18,000,000. The next measurement date for the debt service coverage ratio was deferred until December 31, 2021. Management's current financial projections indicate that we will be in compliance with our revised financial covenants for the next 12 months and we expect to remain in compliance thereafter.


The Company entered into a loan agreement with the Small Business Association through First State Bank, Gothenburg, NE on April 4, 2020 for $760,400 as part of the Paycheck Protection Program under Division A, Title I of the Coronavirus Aid, Relief and Economic Security Act (CARES Act). The loan matures in January 2023 and has an interest rate of 1%. Proceeds of the loan are restricted for use towards payroll costs and other allowable uses such as covered utilities for incurred before December 31, 2020 under the Paycheck Protection Program Rules. Provisions of the agreement allow for a portion of the loan to be forgiven if certain qualifications are met. The Company has applied for forgiveness of this loan. The Paycheck Protection Program Flexibility Act, which was put into effect on June 5, 2020, may effect the terms of our loan.

The Company also received an Economic Injury Disaster Loan (EIDL) in the amount of $10,000 in June 2020. Repayment of the loan will begin in June 2021 and has a 30 year term at 3.75% interest.

The balance of the notes payable as of December 31, 2020 and 2019 is as follows:
20202019
Note Payable - FCSA$36,000,000 $39,000,000 
Note Payable - Other770,400 
Less unamortized debt issuance costs(7,535)(10,792)
36,762,865 38,989,208 
Less current portion(1,201,628)(1,000,000)
$35,561,237 $37,989,208 

Principal maturities for the next five years are estimated as follows:
Years Ending December 31,Principal
2021$1,201,628 
20221,510,504 
20231,048,847 
20241,000,208 
20252,000,215 
thereafter30,008,998 
$36,770,400 
45
50

Table of Contents
LAKE AREA CORN PROCESSORS, LLC
NOTES TO CONSOLIDATED FINANCIAL STATEMENTS
DECEMBER 31, 2017, 20162020, 2019 AND 20152018    


The balances of the notes payable are as follows:

  December 31, 2017
 December 31, 2016*
     
Note Payable - FCSA $8,001,000
 $1,000
Less unamortized debt issuance costs

 (29,056) 
  7,971,944
 1,000
Less current portion (1,000,000) 
  $6,971,944
 $1,000
*Derived from audited financial statements    

Principal maturities for the next five years are estimated as follows:
   
Years Ending December 31, Principal
2018 $1,000,000
2019 1,000,000
2020 1,000,000
2021 1,000,000
2022 1,000,000
thereafter 3,001,000

NOTE 7.8 - EMPLOYEE BENEFIT PLANS


Dakota Ethanol maintains a 401(k) plan for the employees who meet the eligibility requirements set forth in the plan documents. Dakota Ethanol matches a percentage of the employees' contributed earnings. Employer contributions to the plan totaled approximately $104,000, $103,000$133,000, $123,000 and $103,000$113,000 for the years ended December 31, 2017, 20162020, 2019 and 2015,2018, respectively.


NOTE 9 - FAIR VALUE MEASUREMENTS

The Company complies with the fair value measurements and disclosures standard which defines fair value, establishes a framework for measuring fair value, and expands disclosure for those assets and liabilities carried on the balance sheet on a fair value basis.

The Company’s balance sheet contains derivative financial instruments that are recorded at fair value on a recurring basis. Fair value measurements and disclosures require that assets and liabilities carried at fair value be classified and disclosed according to the process for determining fair value. There are three levels of determining fair value.

Level 1 uses quoted market prices in active markets for identical assets or liabilities.

Level 2 uses observable market based inputs or unobservable inputs that are corroborated by market data.

Level 3 uses unobservable inputs that are not corroborated by market data.

A description of the valuation methodologies used for instruments measured at fair value, as well as the general classification of such instruments pursuant to the valuation hierarchy, is set forth below.

Derivative financial instruments. Commodity futures and options contracts are reported at fair value utilizing Level 1 inputs. For these contracts, the Company obtains fair value measurements from an independent pricing service. The fair value measurements consider observable data that may include dealer quotes and live trading levels from the CBOT and NYMEX markets. Over-the-counter commodity options contracts are reported at fair value utilizing Level 2 inputs. For these contracts, the Company obtains fair value measurements from an independent pricing service. The fair value measurements consider observable data that may include dealer quotes and live trading levels from the over-the-counter markets. Forward purchase contracts are reported at fair value utilizing Level 2 inputs. For these contracts, the Company obtains fair value measurements from local grain terminal bid values. The fair value measurements consider observable data that may include live trading bids from local elevators and processing plants which are based off the CBOT markets.

The following table summarizes financial assets and financial liabilities measured at fair value on a recurring basis as of December 31, 2020 and 2019, segregated by the level of the valuation inputs within the fair value hierarchy utilized to measure fair value:
51

Table of Contents
LAKE AREA CORN PROCESSORS, LLC
NOTES TO CONSOLIDATED FINANCIAL STATEMENTS
DECEMBER 31, 2020, 2019 AND 2018    


 Total Level 1 Level 2 Level 3
December 31, 2020
Assets:
Forward contracts$1,742,054 $$1,742,054 $
Liabilities:
Derivative financial instruments, futures and options contracts$1,799,688 $1,799,688 $$
Forward contracts244,181 244,181 
December 31, 2019
Assets:
Derivative financial instruments, futures and options contracts$33,338 $33,338 $$
Forward contracts160,687 160,687 
Liabilities:
Derivative financial instruments, futures and options contracts$1,500 $1,500 $$
Forward contracts698,850 698,850 

During the years ended December 31, 2020 and 2019, the Company did not make any changes between Level 1 and Level 2 assets and liabilities. As of December 31, 2020 and 2019, the Company did not have any Level 3 assets or liabilities.

Certain financial assets and financial liabilities are measured at fair value on a nonrecurring basis; that is, the instruments are not measured at fair value on an ongoing basis but are subject to fair value adjustments in certain circumstances (for example, when there is evidence of impairment). Financial assets and financial liabilities measured at fair value on a non-recurring basis were not significant at December 31, 2020 and 2019.

Disclosure requirements for fair value of financial instruments require disclosure of the fair value of financial assets and financial liabilities, including those financial assets and financial liabilities that are not measured and reported at fair value on a recurring basis or nonrecurring basis. The methodologies for estimating the fair value of financial assets and financial liabilities that are measured at fair value on a recurring or nonrecurring basis are discussed above.

The Company believes the carrying amount of cash and cash equivalents (level 1), accounts receivable (level 2), accounts payable and accruals (level 2) and short-term debt (level 2) approximates fair value.

The carrying amount of long-term obligations (level 3) at December 31, 2020 of $36,770,400 had an estimated fair value of approximately $36,770,400 based on estimated interest rates for comparable debt. The carrying amount of long-term obligations at December 31, 2019 of $39,000,000 had an estimated fair value of approximately $39,000,000.

NOTE 8.    FAIR VALUE MEASUREMENTS

The Company complies with the fair value measurements and disclosures standard which defines fair value, establishes a framework for measuring fair value, and expands disclosure for those assets and liabilities carried on the balance sheet on a fair value basis.

The Company’s balance sheet contains derivative financial instruments that are recorded at fair value on a recurring basis. Fair value measurements and disclosures require that assets and liabilities carried at fair value be classified and disclosed according to the process for determining fair value. There are three levels of determining fair value.

Level 1 uses quoted market prices in active markets for identical assets or liabilities.

Level 2 uses observable market based inputs or unobservable inputs that are corroborated by market data.

Level 3 uses unobservable inputs that are not corroborated by market data.

A description of the valuation methodologies used for instruments measured at fair value, as well as the general classification of such instruments pursuant to the valuation hierarchy, is set forth below.

Derivative financial instruments. Commodity futures and options contracts are reported at fair value utilizing Level 1 inputs. For these contracts, the Company obtains fair value measurements from an independent pricing service. The fair value measurements consider observable data that may include dealer quotes and live trading levels from the CBOT and NYMEX markets. Over-the-counter commodity options contracts are reported at fair value utilizing Level 2 inputs. For these contracts, the Company obtains fair value measurements from an independent pricing service. The fair value measurements consider observable data that may

46

LAKE AREA CORN PROCESSORS, LLC
NOTES TO CONSOLIDATED FINANCIAL STATEMENTS
DECEMBER 31, 2017, 2016 AND 2015    


include dealer quotes and live trading levels from the over-the-counter markets. Forward purchase contracts are reported at fair value utilizing Level 2 inputs. For these contracts, the Company obtains fair value measurements from local grain terminal bid values. The fair value measurements consider observable data that may include live trading bids from local elevators and processing plants which are based off the CBOT markets.

The following table summarizes financial assets and financial liabilities measured at fair value on a recurring basis as of December 31, 2017 and 2016, segregated by the level of the valuation inputs within the fair value hierarchy utilized to measure fair value:
   Total  Level 1  Level 2  Level 3
December 31, 2017        
         
Assets:        
Derivative financial instruments, futures contracts $119,825
 $119,825
 $
 $
forward contracts 3,856
 
 3,856
 
         
Liabilities:        
Derivative financial instruments, futures contracts $(1,363) $(1,363) $
 $
forward contracts (410,785) 
 (410,785) 
         
December 31, 2016        
         
Assets:        
Derivative financial instruments, futures contracts $246,900
 $246,900
 $
 $
forward contracts 6,491
 
 6,491
 
         
Liabilities:        
Derivative financial instruments, futures contracts $(12,575) $(12,575) $
 $
forward contracts (827,786) 
 (827,786) 

During the years ended December 31, 2017 and 2016, the Company did not make any changes between Level 1 and Level 2 assets and liabilities. As of December 31, 2017 and 2016, the Company did not have any Level 3 assets or liabilities.

Certain financial assets and financial liabilities are measured at fair value on a nonrecurring basis; that is, the instruments are not measured at fair value on an ongoing basis but are subject to fair value adjustments in certain circumstances (for example, when there is evidence of impairment). Financial assets and financial liabilities measured at fair value on a non-recurring basis were not significant at December 31, 2017 and 2016.

Disclosure requirements for fair value of financial instruments require disclosure of the fair value of financial assets and financial liabilities, including those financial assets and financial liabilities that are not measured and reported at fair value on a recurring basis or nonrecurring basis. The methodologies for estimating the fair value of financial assets and financial liabilities that are measured at fair value on a recurring or non recurring basis are discussed above. The methodologies for other financial assets and financial liabilities are discussed below.

The Company believes the carrying amount of cash and cash equivalents (level 1), accounts receivable (level 2), other receivables (level 2), accounts payable and accruals (level 2) and short-term debt (level 3) approximates fair value due to the short maturity of these instruments.

47

LAKE AREA CORN PROCESSORS, LLC
NOTES TO CONSOLIDATED FINANCIAL STATEMENTS
DECEMBER 31, 2017, 2016 AND 2015    


The carrying amount of long-term obligations (level 3) at December 31, 2017 of $8,001,000 had an estimated fair value of approximately $8,001,000 based on estimated interest rates for comparable debt. The carrying amount of long-term obligations at December 31, 2016 of $1,000 had an estimated fair value of approximately $1,000 based on estimated interest rates for comparable debt.

NOTE 9.10 - COMMITMENTS, CONTINGENCIES AND AGREEMENTS


Dakota Ethanol has entered into contracts and agreements regarding the operation of the ethanol plant as follows:


Natural Gas - The agreement providesagreements provide Dakota Ethanol with a fixed transportation rateand distribution services for natural gas for a ten-year term through August 2021,October 2028, and is renewable annually thereafter. Fees for the services are at tariff rates approved by regulatory agencies. The agreement does not require minimum purchases of natural gas during their initial term.


52

LAKE AREA CORN PROCESSORS, LLC
NOTES TO CONSOLIDATED FINANCIAL STATEMENTS
DECEMBER 31, 2020, 2019 AND 2018    


Electricity - The agreement provides Dakota Ethanol with electric service for a term of one year.through June 2029. The contract automatically renews unless prior notice of cancellation is given. The agreement sets rates for energy usage based on market rates and requires a minimum purchase of electricitycharge each month during the term of the agreement.


Expenses related to the agreementagreements for the purchase of electricity and natural gas were approximately $7,259,000, $6,510,000,$8,899,000, $8,157,000, and $7,013,000,$6,322,000, for the years ended December 31, 2017, 20162020, 2019 and 2015,2018, respectively.


Minimum annual payments during the term of the electricity agreement are as follows:

Years Ending December 31,Amount
2021$184,800
2022184,800
2023184,800
2024184,800
2025184,800
thereafter646,800

Years Ending December 31, Amount
2018 $584,280

Ethanol Fuel Marketing Agreement - Dakota Ethanol has an agreement with RPMG (a related party, see note 10)11), a joint venture of ethanol producers, for the sale, marketing, billing and receipt of payment and other administrative services for all ethanol produced by the plant. The agreement continues indefinitely unless terminated under terms set forth in the agreement.


DistillersDistiller's Grain Marketing Agreement - Dakota Ethanol has an agreement with RPMG (a related party, see note 10)11), for the marketing of all distillersdistiller's dried grains produced by the plant. The agreement expires on July 15, 2018 and is automatically renewed for successive one year termscontinues indefinitely unless terminated 180 days prior to expiration.under terms set forth in the agreement.


Corn Oil Marketing Agreement - Dakota Ethanol has an agreement with RPMG (a related party, see note 10)11), for the marketing of all corn oil produced by the plant. The agreement expires on August 11, 2018 and is automatically renewed for successive one year termscontinues indefinitely unless terminated 180 days prior to expiration.under terms set forth in the agreement.

During the years ended December 31, 2016 and 2015, Dakota Ethanol received an incentive payment from the State of South Dakota to produce ethanol. In accordance with the terms of this arrangement, revenue is recorded based on gallons of ethanol sold. Incentive revenue of $0, $378,307 and $416,667, was recorded for the years ended December 31, 2017, 2016 and 2015, respectively. Dakota Ethanol reached the lifetime maximum under the program during 2016 and will no longer receive funds under the program.


From time to time in the normal course of business, the Company can be subject to litigation based on its operations. There is no current litigation nor any litigation that is considered probable at this time.


NOTE 11 - RELATED PARTY TRANSACTIONS

Dakota Ethanol has a 5% interest in RPMG, and Dakota Ethanol has entered into marketing agreements for the exclusive rights to market, sell and distribute the entire ethanol, dried distiller's grains, and corn oil inventories produced by Dakota Ethanol.  The marketing fees are included in net revenues. Dakota Ethanol also purchases denaturant from RPMG. Amounts due from RPMG are presented as accounts receivable (related party) on the balance sheet.
Revenues and marketing fees related to the agreements are as follows:
53

Table of Contents
LAKE AREA CORN PROCESSORS, LLC
NOTES TO CONSOLIDATED FINANCIAL STATEMENTS
DECEMBER 31, 2020, 2019 AND 2018    


Years Ended December 31,
202020192018
Revenues ethanol$99,280,464 $90,555,111 $57,876,705 
Revenues distillers grains9,541,074 5,108,266 1,801,956 
Revenues corn oil5,969,230 4,406,438 2,334,245 
Marketing fees ethanol$203,101 $242,607 $254,555 
Marketing fees distillers grains68,354 36,935 12,294 
Marketing fees corn oil44,778 36,457 18,824 
Denaturant purchases1,503,071 918,071 755,521 
Amounts due to RPMG47,073 46,234 36,586 
The Company purchased corn and services from members of its Board of Directors that farm and operate local businesses. Corn purchases from these related parties during the fiscal years ended December 31, 2020, 2019 and 2018 totaled approximately $1,022,000, $1,084,000 and $604,000, respectively. As of December 31, 2020 and 2019, the Company did not have any outstanding obligations to these related parties.
NOTE 10.    RELATED PARTY TRANSACTIONS12 - CAPTIVE INSURANCE


Dakota Ethanol hasThe Company participates, along with other plants in the industry, in a 7% interestgroup captive insurance company (Captive). The Captive insures losses related to workman's compensation, commercial property and general liability. The Captive reinsures catastrophic losses for all participants, including the Company, in RPMG, and Dakota Ethanol has entered into marketing agreementsexcess of predetermined amounts. The Company's premiums are accrued by a charge to income for the exclusive rightsperiod to market, sellwhich the premium relates and distributeis remitted by the entire ethanol, dried distillers grains,Company's insurer to the captive reinsurer. These premiums are structured such that the Company has made a prepaid collateral deposit estimated for losses related to the above coverage. The Captive insurer has estimated and corn oil inventories producedcollected an amount in excess of the estimated losses but less than the catastrophic loss limit insured by Dakota Ethanol.the Captive. The marketing fees are includedCompany cannot be assessed over the amount in net revenues.the collateral fund.


48
54

Table of Contents
LAKE AREA CORN PROCESSORS, LLC
NOTES TO CONSOLIDATED FINANCIAL STATEMENTS
DECEMBER 31, 2017, 20162020, 2019 AND 20152018    


NOTE 13 - QUARTERLY FINANCIAL REPORTING (UNAUDITED)
Revenues and marketing fees related to the agreements
Summary quarterly results are as follows:
First QuarterSecond QuarterThird QuarterFourth Quarter
Year ended December 31, 2020
Total revenues$32,456,238 $25,424,832 $33,917,787 $38,722,957 
Gross profit (loss)(7,849,642)5,611,925 6,046,492 2,219,771 
Income (loss) from operations(9,189,480)4,666,216 5,054,469 1,079,267 
Net income (loss)(10,475,043)4,213,375 5,810,426 1,506,881 
Basic and diluted earnings (loss) per unit(0.35)0.14 0.20 0.05 
Year ended December 31, 2019
Total revenues$21,613,298 $26,096,989 $32,441,510 $35,835,024 
Gross profit (loss)2,450,262 1,298,964 (1,815,202)(634,434)
Income (loss) from operations1,440,935 372,585 (2,786,864)(1,787,409)
Net income (loss)1,790,204 (192,897)(3,599,789)(1,821,702)
Basic and diluted earnings (loss) per unit0.06 (0.01)(0.12)(0.06)
Year ended December 31, 2018
Total revenues$19,804,272 $20,077,335 $18,796,356 $16,025,667 
Gross profit2,612,121 2,065,457 718,120 688,238 
Income (loss) from operations1,628,878 1,073,009 (153,933)(301,677)
Net income (loss)1,876,697 1,466,978 (182,218)(444,870)
Basic and diluted earnings (loss) per unit0.06 0.05 (0.01)(0.01)


NOTE 14 - PARENT FINANCIAL STATEMENTS
  Years Ended December 31,
  2017 2016 2015
       
Revenues ethanol $67,186,350
 $69,398,350
 $67,581,517
Revenues distillers grains 4,225,707
 5,254,492
 6,205,391
Revenues corn oil 3,088,510
 2,860,912
 2,979,581
       
Marketing fees ethanol 249,645
 187,431
 168,796
Marketing fees distillers grains 31,993
 32,979
 35,289
Marketing fees corn oil 19,481
 18,239
 29,724
       
Accounts receivable balance at period end 2,749,502
 3,695,561
 939,705

The Company purchased cornfollowing financial information represents the unconsolidated financial statements of Lake Area Corn Processors, LLC as of December 31, 2020 and services from members of its Board of Directors that farm2019, and operate local businesses. The Company also purchased ingredients from RPMG. Purchases from these related parties duringfor the fiscal years ended December 31, 2017, 20162020, 2019 and 2015 totaled approximately $1,099,000, $1,890,000 and $1,694,000, respectively. As of December 31, 2017 and 2016, the amount we owed2018. The Company’s ability to related parties was approximately $45,000 and $40,000, respectively.
NOTE 11.    TIF BOND GUARANTEE

During December 2003,receive distributions from its wholly owned subsidiary, Dakota Ethanol, entered into an agreement to guarantee a bond issued by Lake County, South Dakota. The bond issue was in conjunction with the refunding of the tax increment financing (TIF) bond issued by Lake County in 2001, of which Dakota Ethanol was the recipient of the proceeds. During 2003, Lake County became aware that the taxes collectedLLC, is based on the incremental tax would not be sufficientterms and conditions set forth in the Third Amendment to coverits credit agreement with Farm Credit Services of America, PCA and Farm Credit Services of America, FLCA. Under the debt serviceThird Amendment, Dakota Ethanol is restricted from making distributions to the Company without the consent of the 2001 bond issue. Based on the aforementioned deficiency and changes in interest rate during Decemberlender.


55

The taxes levied on Dakota Ethanol's property will first go towards the semiannual debt service of the tax-exempt bonds and any remaining taxes will be used for the debt service of the taxable bonds. Dakota Ethanol guarantees any shortfall in debt service for the taxable bonds. The guarantee expires in December 2018.

The maximum amount of estimated future payments on the taxable bond debt service is $152,217 as of December 31, 2017. The carrying amount of the guarantee liability on Dakota Ethanol'sunconsolidated balance sheet at December 31, 2017 is$9,555, which represents the estimated shortfall between the taxable bond amount and the amount of taxes estimated to be collected on Dakota Ethanol's property.

Estimated maturities of the guarantee are as follows:

LAKE AREA CORN PROCESSORS, LLC
UNCONSOLIDATED BALANCE SHEETS
December 31, 2020December 31, 2019
ASSETS
CURRENT ASSETS
Cash and cash equivalents$58,505 $33,473 
Prepaid expenses24,542 17,084 
Total current assets83,047 50,557 
OTHER ASSETS
Goodwill10,395,766 10,395,766 
Investment in Dakota Ethanol39,554,776 38,630,542 
Investments - other15,234,990 15,136,075 
Total other assets65,185,532 64,162,383 
TOTAL ASSETS$65,268,579 $64,212,940 
LIABILITIES AND MEMBERS' EQUITY
CURRENT LIABILITIES
Total current liabilities
LONG-TERM LIABILITIES
Total long-term liabilities
MEMBERS' EQUITY (29,620,000 units issued and outstanding)65,268,579 64,212,940 
TOTAL LIABILITIES AND MEMBERS' EQUITY$65,268,579 $64,212,940 


56

Table of Contents
LAKE AREA CORN PROCESSORS, LLC
NOTES TO CONSOLIDATED FINANCIAL STATEMENTS
DECEMBER 31, 2020, 2019 AND 2018    


Years Ending December 31, Amount
2018 $9,555
The unconsolidated statement of operation is as follows:


Dakota Ethanol has no recourse to third parties or collateral held by third parties related to the guarantee.
LAKE AREA CORN PROCESSORS, LLC
UNCONSOLIDATED STATEMENTS OF OPERATIONS
Year EndedYear EndedYear Ended
December 31, 2020December 31, 2019December 31, 2018
EQUITY IN NET INCOME (LOSS) OF CONSOLIDATED SUBSIDIARY$1,073,965 $(3,298,638)$2,785,397 
OPERATING EXPENSES127,978 311,001 337,000 
INCOME (LOSS) FROM OPERATIONS945,987 (3,609,639)2,448,397 
OTHER INCOME (EXPENSE)
Interest and other income10,737 5,949 33 
Equity in net income (loss) of investments98,915 (220,494)268,157 
Total other income (expense)109,652 (214,545)268,190 
NET INCOME (LOSS)$1,055,639 $(3,824,184)$2,716,587 


57

Table of Contents
LAKE AREA CORN PROCESSORS, LLC
NOTES TO CONSOLIDATED FINANCIAL STATEMENTS
DECEMBER 31, 2020, 2019 AND 2018    


The unconsolidated statement of cash flows is as follows:

LAKE AREA CORN PROCESSORS, LLC
UNCONSOLIDATED STATEMENTS OF CASH FLOWS
Year EndedYear EndedYear Ended
December 31, 2020December 31, 2019December 31, 2018
OPERATING ACTIVITIES
Net income (loss)$1,055,639 $(3,824,184)$2,716,587 
Adjustments to reconcile net income (loss) to net cash provided by operating activities
Distributions in excess of earnings from investments(98,915)1,220,493 1,893,858 
Equity in (earnings) losses of consolidated subsidiary(1,073,965)3,298,638 (2,785,397)
(Increase) decrease in
Prepaid expenses(7,456)(275)
Increase (decrease) in
Accounts payable(42,227)
NET CASH PROVIDED BY (USED IN) OPERATING ACTIVITIES(124,697)694,672 1,782,821 
INVESTING ACTIVITIES
Distributions received from consolidated subsidiary100,000 750,000 2,000,000 
Investment in consolidated subsidiary(1,000,000)(1,100,000)
Purchase of investments(500,000)(10,000)
Other investing cash inflow (outflow)49,729 41,338 280,686 
NET CASH PROVIDED BY (USED IN) INVESTING ACTIVITIES149,729 (708,662)1,170,686 
FINANCING ACTIVITIES
Distributions to members(2,962,000)
NET CASH USED FOR FINANCING ACTIVITIES(2,962,000)
NET INCREASE (DECREASE) IN CASH AND CASH EQUIVALENTS25,032 (13,990)(8,493)
CASH AND CASH EQUIVALENTS AT BEGINNING OF PERIOD33,473 47,463 55,956 
CASH AND CASH EQUIVALENTS AT END OF PERIOD$58,505 $33,473 $47,463 
58

NOTE 12.    CAPTIVE INSURANCE

The Company participates, along with other plants in the industry, in a group captive insurance company (Captive). The Captive insures losses related to workman's compensation, commercial property and general liability. The Captive reinsures catastrophic losses for all participants, including the Company, in excess of predetermined amounts. The Company's premiums are accrued by a charge to income for the period to which the premium relates and is remitted by the Company's insurer to the captive reinsurer.

49

LAKE AREA CORN PROCESSORS, LLC
NOTES TO CONSOLIDATED FINANCIAL STATEMENTS
DECEMBER 31, 2017, 2016 AND 2015    


These premiums are structured such that the Company has made a prepaid collateral deposit estimated for losses related to the above coverage. The Captive insurer has estimated and collected an amount in excess of the estimated losses but less than the catastrophic loss limit insured by the Captive. The Company cannot be assessed over the amount in the collateral fund.

NOTE 13.    INSURANCE CLAIMS

Dakota Ethanol experienced property damage to grain handling equipment in June 2014. The damages were covered by property and business interruption insurance policies. The Company continued to use the equipment through May 2015, at which time the equipment was disposed of resulting in a loss of approximately $674,000. Insurance proceeds of $3,436,727, consisting of $2,818,955 from the property insurance claim and $617,771 from the business interruption claim were paid. The loss on disposal of damaged assets and property insurance proceeds are both recorded in operating expenses in the statements of operations.

NOTE 14 - COMMITMENTS

Dakota Ethanol has committed to a contract for the design and construction of a new regenerative thermal oxidizer (RTO) to replace its existing RTO. The value of the contract is approximately $4.6 million. There is approximately $1.7 million remaining as of December 31, 2017. The project is expected to be completed in the second quarter of 2018. The Company will pay for the project with cash flows from operations and the long-term revolving debt currently in place.

Dakota Ethanol entered into a design-build agreement with Nelson Engineering Co. for the design and construction of the plant expansion to increase its production capacity to approximately 90 million gallons of ethanol per year. The cost of the expansion is expected to be approximately $33 million. The Company has commenced engineering work with the contractor and has secured financing with its lender for the expansion project. The Company anticipates that the expansion will be complete during the Company's second quarter of 2019. The Company will pay for the project with cash flows from operations and the long-term revolving debt as amended on February 6, 2018.

NOTE 15.    QUARTERLY FINANCIAL REPORTING (UNAUDITED)

Summary quarterly results are as follows:
 First Quarter Second Quarter Third Quarter Fourth Quarter
Year ended December 31, 2017       
Total revenues$22,713,628
 $21,612,598
 $19,479,798
 $21,015,764
Gross profit2,220,455
 2,015,355
 1,968,680
 2,363,353
Income from operations1,213,883
 1,151,750
 1,134,221
 1,350,698
Net income1,610,424
 1,314,299
 1,815,347
 1,645,013
Basic and diluted earnings per unit0.05
 0.04
 0.06
 0.07
        
Year ended December 31, 2016       
Total revenues$21,623,796
 $21,944,230
 $20,983,806
 $24,260,718
Gross profit1,254,612
 2,839,644
 2,806,148
 5,814,285
Income from operations319,378
 1,979,265
 1,927,830
 4,846,129
Net income659,621
 2,529,919
 2,610,395
 5,605,273
Basic and diluted earnings per unit0.02
 0.09
 0.09
 0.19
        
Year ended December 31, 2015       
Total revenues$20,715,145
 $23,680,338
 $22,038,423
 $22,564,041
Gross profit709,131
 2,860,830
 2,221,102
 1,761,114
Income (loss) from operations(367,802) 2,816,205
 1,448,138
 1,827,847
Net income238,949
 4,572,389
 1,850,884
 1,991,308
Basic and diluted earnings per unit0.01
 0.15
 0.06
 0.07


50

LAKE AREA CORN PROCESSORS, LLC
NOTES TO CONSOLIDATED FINANCIAL STATEMENTS
DECEMBER 31, 2017, 2016 AND 2015    


NOTE 16.            SUBSEQUENT EVENTS

On February 6, 2018, Dakota Ethanol executed an Amended and Restated Credit Agreement (the "Credit Agreement") with FCSA. Pursuant to the Credit Agreement, Dakota Ethanol increased the total credit availability to $40 million. Further, the maturity date of this increased credit availability under the Credit Agreement was extended to January 1, 2026. Until February 1, 2023, interest will accrue pursuant to the Credit Agreement on the increased credit availability at the one month London Interbank Offered Rate ("LIBOR") plus 3.25% per year. The note contains a non-use fee of 0.50% on the unused portion of the note.

During February 2018, the Company declared a distribution to its members of $2,962,000, or $0.10 per capital unit, to unit holders of record as of January 1, 2018.


ITEM 9.     CHANGES IN AND DISAGREEMENTS WITH ACCOUNTANTS ON ACCOUNTING AND FINANCIAL DISCLOSURE.


None.


ITEM 9A.     CONTROLS AND PROCEDURES.


Disclosure Controls and Procedures


Our management, including our President and Chief Executive Officer (the principal executive officer), Scott Mundt, along with our Chief Financial Officer (the principal financial officer), Rob Buchholtz, have reviewed and evaluated the effectiveness of our disclosure controls and procedures (as defined in Rule 13a-15(e) and Rule 15d-15(e) under the Securities Exchange Act of 1934, as amended) as of December 31, 2017.2020.  Based on this review and evaluation, these officers have concluded that our disclosure controls and procedures are effective to ensure that information required to be disclosed in the reports that we file or submit under the Exchange Act is recorded, processed, summarized and reported within the time periods required by the forms and rules of the Securities and Exchange Commission; and to ensure that the information required to be disclosed by an issuer in the reports that it files or submits under the Exchange Act is accumulated and communicated to our management including our principal executive and principal financial officers, or persons performing similar functions, as appropriate to allow timely decisions regarding required disclosure.


Internal Control Over Financial Reporting


Inherent Limitations Over Internal Controls


Our internal control over financial reporting is designed to provide reasonable assurance regarding the reliability of financial reporting and the preparation of financial statements for external purposes in accordance with generally accepted accounting principles. Our internal control over financial reporting includes those policies and procedures that:
    (i)    pertain to the maintenance of records that, in reasonable detail, accurately and fairly reflect the transactions and dispositions of our assets;
    (ii)    provide reasonable assurance that transactions are recorded as necessary to permit preparation of financial statements in accordance with generally accepted accounting principles, and that our receipts and expenditures are being made only in accordance with authorizations of our management and directors; and
    (iii)    provide reasonable assurance regarding prevention or timely detection of unauthorized acquisition, use, or disposition of our assets that could have a material effect on the financial statements.


Management, including our Chief Executive Officer and Chief Financial Officer, does not expect that our internal controls will prevent or detect all errors and all fraud. A control system, no matter how well designed and operated, can provide only reasonable, not absolute, assurance that the objectives of the control system are met. Further, the design of a control system must reflect the fact that there are resource constraints, and the benefits of controls must be considered relative to their costs. Because of the inherent limitations in all control systems, no evaluation of internal controls can provide absolute assurance that all control issues and instances of fraud, if any, have been detected. Also, any evaluation of the effectiveness of controls in future periods is subject to the risk that those internal controls may become inadequate because of changes in business conditions, or that the degree of compliance with the policies or procedures may deteriorate.


Management's Annual Report on Internal Control Over Financial Reporting.


Our management is responsible for establishing and maintaining adequate internal control over financial reporting (as defined in Rule 13a-15(f) under the Securities Exchange Act of 1934, as amended). Management conducted an evaluation of the effectiveness of our internal control over financial reporting based on the criteria set forth in Internal Control-Integrated Framework issued by the Committee of Sponsoring Organizations of the Treadway Commission ("COSO") in 2013. Based on this evaluation, management has concluded that our internal control over financial reporting was effective as of December 31, 2017.2020.


59

This annual report does not include an attestation report of our registered public accounting firm regarding internal control over financial reporting. As we are a non-accelerated filer, management's report is not subject to attestation by our registered public accounting firm pursuant to Section 404(c) of the Sarbanes-Oxley Act of 2002 that permits us to provide only management's report in this annual report.


Changes in Internal Control Over Financial Reporting.


There were no changes in our internal control over financial reporting during the fourth quarter of our fiscal year ended December 31, 20172020 which were identified in connection with management's evaluation required by paragraph (d) of rules 13a-15 and 15d-15 under the Exchange Act that have materially affected, or are reasonably likely to materially affect, our internal control over financial reporting.


ITEM 9B.     OTHER INFORMATION.


None.


PART III


ITEM 10.     MANAGERS, EXECUTIVE OFFICERS AND CORPORATE GOVERNANCEGOVERNANCE.


The information required by this Item is incorporated by reference to the definitive information statement from our 20182021 annual meeting of members to be filed with the Securities and Exchange Commission within 120 days after our 20172020 fiscal year end on December 31, 2017.2020. This information statement is referred to in this report as the 20182021Information Statement.


ITEM 11.     EXECUTIVE COMPENSATION.


The information required by this Item is incorporated by reference to the 20182021 Information Statement.


ITEM 12.     SECURITY OWNERSHIP OF CERTAIN BENEFICIAL OWNERS AND MANAGEMENT AND RELATED MEMBER MATTERS.


The information required by this Item is incorporated by reference to the 20182021 Information Statement.


ITEM 13.     CERTAIN RELATIONSHIPS AND RELATED TRANSACTIONS, AND MANAGER INDEPENDENCE.


The information required by this Item is incorporated by reference to the 20182021Information Statement.


ITEM 14.     PRINCIPAL ACCOUNTING FEES AND SERVICES.


The information required by this Item is incorporated by reference to the 20182021Information Statement.


PART IV


ITEM 15.     EXHIBITS AND FINANCIAL STATEMENT SCHEDULES.


The following exhibits and financial statements are filed as part of, or are incorporated by reference into, this report:


(1)The financial statements appear beginning on page 32 of33 of this report.
 
(2)All supplemental schedules are omitted because of the absence of conditions under which they are required or because the information is shown in the Consolidated Financial Statements or notes thereto.
 
(3)The exhibits we have filed herewith or incorporated by reference herein are identified in the Exhibit Index set forth below.
60

 
The following exhibits are filed as part of this report. Exhibits previously filed are incorporated by reference, as noted.


Exhibit No.ExhibitFiled HerewithIncorporated by Reference
3.2
Filed as Exhibit 3.6 on the registrant's Form 10-K filed with the Commission on March 31, 2005 and incorporated by reference herein.
3.3
Filed as Exhibit 99.1 on the registrant's Form 8-K filed with the Commission on March 19, 2007 and incorporated by reference herein.
3.4
Filed as Exhibit 99.1 on the registrant's Form 8-K filed with the Commission on January 10, 2018 and incorporated by reference herein.
10.1
Filed as Exhibit 10.1 on the registrant's Form 10-Q filed with the Commission on August 14, 2008 and incorporated by reference herein.
10.2
Filed as Exhibit 10.1 on the registrant's Form 10-Q filed with the Commission on August 14, 2007 and incorporated by reference herein.
10.3
Filed as Exhibit 10.1 on the registrant's Form 10-K filed with the Commission on March 30, 2007.
10.4
Filed as Exhibit 10.1 on the registrant's Form 8-K filed with the Commission on December 2, 2005 and incorporated by reference herein.
10.5
Filed as Exhibit 10.1 on the registrant's Form 10-Q filed with the Commission on May 15, 2009 and incorporated by reference herein.
10.6
Filed as Exhibit 10.1 on the registrant's Form 10-Q filed with the Commission on August 12, 2009 and incorporated by reference herein.
10.7
Filed as Exhibit 10.2 on the registrant's Form 10-Q filed with the Commission on August 12, 2009 and incorporated by reference herein.
10.8
Filed as Exhibit 10.1 on the registrant's Form 10-Q filed with the Commission on August 13, 2010 and incorporated by reference herein.
10.9
Filed as Exhibit 10.2 on the registrant's Form 10-Q filed with the Commission on August 13, 2010 and incorporated by reference herein.
10.10
Filed as Exhibit 10.3 on the registrant's Form 10-Q filed with the Commission on August 13, 2010 and incorporated by reference herein.
10.11
Filed as Exhibit 10.22 on the registrant's Form 10-K filed with the Commission on March 30, 2011 and incorporated by reference herein.
61

10.12
Filed as Exhibit 10.1 on the registrant's Form 10-Q filed with the Commission on August 11, 2011 and incorporated by reference herein.
10.13
Filed as Exhibit 10.2 on the registrant's Form 10-Q filed with the Commission on August 11, 2011 and incorporated by reference herein.

10.14 
10.14
Filed as Exhibit 10.3 on the registrant's Form 10-Q filed with the Commission on August 11, 2011 and incorporated by reference herein.
10.15
Filed as Exhibit 10.1 on the registrant's Form 10-Q filed with the Commission on May 14, 2012 and incorporated by reference herein.
10.16
Filed as Exhibit 10.2 on the registrant's Form 10-Q filed with the Commission on May 14, 2012 and incorporated by reference herein.
10.17
Filed as Exhibit 10.3 on the registrant's Form 10-Q filed with the Commission on May 14, 2012 and incorporated by reference herein.
10.18
Filed as Exhibit 10.1 on the registrant's Form 10-Q filed with the Commission on November 13, 2012 and incorporated by reference herein.
10.19
Filed as Exhibit 10.1 on the registrant's Form 10-Q filed with the Commission on May 13, 2013 and incorporated by reference herein.
10.20
Filed as Exhibit 10.2 on the registrant's Form 10-Q filed with the Commission on May 13, 2013 and incorporated by reference herein.
10.21
Filed as Exhibit 10.1 on the registrant's Form 10-Q filed with the Commission on August 13, 2013 and incorporated by reference herein.
10.22
Filed as Exhibit 10.22 on the registrant's Form 10-K filed with the Commission on February 27, 2014 and incorporated by reference herein.
10.23
Filed as Exhibit 10.1 on the registrant's Form 10-Q filed with the Commission on November 13, 2014 and incorporated by reference herein.
10.24
Filed as Exhibit 10.24 on the registrant's Form 10-K filed with the Commission on February 26, 2015 and incorporated by reference herein.
10.25
Filed as Exhibit 10.1 on the registrant's Form 10-Q filed with the Commission on May 14, 2015 and incorporated by reference herein.
10.26
Filed as Exhibit 10.1 on the registrant's Form 10-Q filed with the Commission on November 14, 2016 and incorporated by reference herein.
62

10.27
Filed as Exhibit 10.1 on the registrant's Form 10-Q filed with the Commission on August 11, 2017 and incorporated by reference herein.
10.28
XFiled herewithas Exhibit 10.28 on the registrant's Form 10-K filed with the Commission on March 2, 2018 and incorporated by reference herein.
10.2810.29 
XFiled herewithas Exhibit 10.29 on the registrant's Form 10-K filed with the Commission on March 2, 2018 and incorporated by reference herein.
31.1
10.30
Filed as Exhibit 10.30 on the registrant's Form 10-K filed with the Commission on February 28, 2019 and incorporated by reference herein.
10.31 Filed as Exhibit 10.1 on the registrant's Form 10-Q filed with the Commission on November 14, 2019 and incorporated by reference herein.
10.32 Filed as Exhibit 10.1 on the registrant's Form 10-Q filed with the Commission on August 14, 2020 and incorporated by reference herein.
31.1 XFiled herewith
31.2
XFiled herewith

32.1 
32.1
XFiled herewith
32.2
XFiled herewith
101
The following financial information from Lake Area Corn Processors, LLC's Annual Report on Form 10-K for the fiscal year ended December 31, 2017,2020, formatted in XBRL (eXtensible Business Reporting Language): (i) Consolidated Balance Sheets as of December 31, 20172020 and December 31, 2016,2019, (ii) Consolidated Statements of Income for the fiscal years ended December 31, 2017, 20162020, 2019 and 2015,2018, (iii) Statement of Changes in Members' Equity, (iv) Consolidated Statements of Cash Flows for the fiscal years ended December 31, 2017, 20162020, 2019 and 2015,2018, and (v) the Notes to Consolidated Financial Statements.**
+ Confidential Treatment Requested
** Furnished herewith.


ITEM 16.     FORM 10-K SUMMARYSUMMARY.


None.


63

SIGNATURES


Pursuant to the requirements of Section 13 or 15(d) of the Securities Exchange Act of 1934, the registrant has duly caused this report to be signed on its behalf by the undersigned, thereunto duly authorized.


LAKE AREA CORN PROCESSORS, LLC
Date:March 2, 201812, 2021 /s/ Scott Mundt
Scott Mundt
President and Chief Executive Officer

(Principal Executive Officer)
Date:March 2, 201812, 2021 /s/ Rob Buchholtz
Rob Buchholtz
Chief Financial Officer

(Principal Financial and Accounting Officer)


64

Pursuant to the requirements of the Securities Exchange Act of 1934, this report has been signed below by the following persons on behalf of the registrant and in the capacities and on the dates indicated.


Date:March 12, 2021/s/ Ronald Alverson
Ronald Alverson, Manager
Date:March 2, 201812, 2021/s/ Ronald Alverson
Ronald Alverson, Manager
Date:March 2, 2018/s/ Todd Brown
Todd Brown, Manager
Date:March 2, 201812, 2021/s/ Randy Hansen
Randy Hansen, Manager
Date:March 2, 201812, 2021/s/ Rick Kasperson
Rick Kasperson, Manager
Date:March 2, 201812, 2021/s/ Marty Thompson
Marty Thompson, Manager
Date:March 2, 201812, 2021/s/ Wayne Backus
Wayne Backus, Manager
Date:March 2, 201812, 2021/s/ Dave Wolles
Dave Wolles, Manager


57
65