UNITED STATES
SECURITIES AND EXCHANGE COMMISSION
WASHINGTON, D.C. 20549
FORM 10-K
(Mark One)
xANNUAL REPORT PURSUANT TO SECTION 13 OR 15(d) OF THE SECURITIES EXCHANGE ACT OF 1934| x | ANNUAL REPORT PURSUANT TO SECTION 13 OR 15(d) OF THE |
| SECURITIES EXCHANGE ACT OF 1934 |
For the fiscal year ended December 31, 20082010
OR
oTRANSITION REPORT PURSUANT TO SECTION 13 OR 15(d) OF THE SECURITIES EXCHANGE ACT OF 1934| o | TRANSITION REPORT PURSUANT TO SECTION 13 OR 15(d) OF THE |
| SECURITIES EXCHANGE ACT OF 1934 |
Commission File Number 0-14306
CHINA CRESCENT ENTERPRISES, INC.
(Exact Name of Registrant as Specified in Its Charter)
| Nevada | 84-0928627 |
| (State or other jurisdiction of | (I.R.S. Employer |
| incorporation or organization) | Identification No.) |
14860 Montfort Drive, Suite 210, Dallas, TX 75254
(Address of principal executive offices)
(214) 722-3040
(Registrant’s telephone number, including area code)
NEWMARKET CHINA, INC.
(Former name, former address and former fiscal year, if changed since last report)
Indicate by check mark if the Registrant is a well-known seasoned issuer, as defined in Rule 405 of the Securities Act: Yes oNo þ
Indicate by check mark if the Registrant is not required to file reports pursuant to Section 13 or Section 15(d) of the Act: Yes oNo þ
Indicate by check mark whether the Registrant (1) has filed all reports required to be filed by Section 13 or 15(d) of the Securities Exchange Act of 1934 (the “Exchange Act”) during the preceding 12 months (or for such shorter period that the Registrant was required to file such reports) and (2) has been subject to such filing requirements for the past 90 days.
Yes þNo o
Indicate by check mark whether the registrant has submitted electronically and posted on its corporate web site, if any, every Interactive Data File required to be submitted and posted pursuant to Rule 405 of Regulation S-T during the preceding 12 months (or for such shorter period that the registrant was required to submit and post such files. Yes o No o
Indicate by check mark if disclosure of delinquent filers pursuant to Item 405 of Regulation S-K is not contained herein, and will not be contained, to the best of the registrant’s knowledge, in definitive proxy or information statements incorporated by reference in Part III of this Form 10-K or any amendment to this Form 10-K. o
Indicate by check mark whether the registrant is a large accelerated filer, an accelerated filer, a non-accelerated filer or a smaller reporting company. See the definitions of “large accelerated filer,” “accelerated filer” and “smaller reporting company” in Rule 12b-2 of the Exchange Act.
| | Large Accelerated Filer o | | Accelerated Filer o | |
| | Non-Accelerated Filer þo | | Smaller Reporting Company oþ | |
Indicate by check mark whether the Registrant is a shell company (as defined in Rule 12b-2 of the Exchange Act).
Yes oNo þ
Aggregate market value of the voting and non-voting common equity held by non-affiliates of the Registrant (assuming officers, directors and 10% stockholders are affiliates), based on the closing price of the Registrant’s common stock on June 30, 2008: $1,195,472
2010: $4,951,000
China Crescent Enterprises, Inc.
ANNUAL REPORT ON FORM 10-10-K
FOR THE FISCAL YEAR ENDED DECEMBER 31, 20082010
| |
| |
| 6 |
| 13 |
| 13 |
| 13 |
| 13 |
| | |
| |
| 14 |
| 14 |
| |
| 15 |
| 18 |
| 19 |
| |
| 19 |
| 19 |
| 20 |
| | |
| |
| 20 |
| 21 |
| 22 |
| 23 |
| 23 |
| | |
| |
| 24 |
| 25 |
| |
History of the Business
Intercell International Corporation (“Intercell”) was incorporated under the laws of Nevada in May 2000. Until October 2003, Intercell had no operations. In October 2003, Intercell acquired 60% membership interest in Brunetti DEC, LLC, a Colorado limited liability company (“Brunetti”) for a cash contribution. In January 2004, Intercell acquired the remaining 40% of Brunetti for andan additional cash contribution. In October 2004, the operations of Brunetti were discontinued and in March 2005, Brunetti filed a voluntary petition for relief in the United States Bankruptcy Court, District of Colorado under Chapter 7 of Title 7 of the U.S. Bankruptcy Code.
On March 16, 2005, Intercell filed a voluntary petition for relief in the United States Bankruptcy Court, District of Colorado under Chapter 11 of Title 11 of the U.S. Bankruptcy Code. On April 5, 2006, the United States Bankruptcy Court, District of Colorado dismissed the Chapter 11 proceedings.
In October 2006, Intercell executed an Agreement and Plan of Reorganization (the “Agreement”) with NewMarket China, Inc. (“NewMarket China”) a wholly-owned subsidiary of NewMarket Technology, Inc. (“NewMarket Technology”). The Agreement provided for Intercell to acquire from NewMarket Technology its subsidiary, NewMarket China, through the exchange of all of the issued and outstanding stock of NewMarket China, one thousand (1,000) shares held by NewMarket Technology, for two million (2,000,000) common shares of Intercell. As a result of the Agreement, NewMarket China became the wholly-owned subsidiary of Intercell.
In a separate agreement, NewMarket Technology agreed to purchase 250,000 shares of Series A Preferred Stock from Intercell for a $250,000 cash payment. The shares have a par value of $0.001 per share and a purchase price of $1.00 per share and bear no dividend. The shares are convertible into 60% of the issued and outstanding common stock of Intercell, any time after August 31, 2006.2007. The shares have a voting right equal to 60% of the issued and outstanding common stock of Intercell.
As part of the reorganization and acquisition of Intercell, on January 31, 2007, we changed the name of the company to NewMarket China, Inc. (the “Company”) and changed its trading symbol to “NMCH”. Additionally, we changed the Company’s fiscal year end from September 30th to December 31st. In June 2008, we changed the Company’s name to China Crescent Enterprises, Inc. and changed, subsequently changing its trading symbol to “CCSE”“CCTR”.
As a result of the acquisition of NewMarket China and the change in control of Intercell, the followingseveral changes were made to our management:management. In October 2006, John Verges was appointed as Chief Executive Officer (“CEO��) and Philip J. Rauch was appointed as Chief Financial Officer (“CFO”). Additionally, the existing directors of the Company resigned and Mr. Rauch was appointed to the Board of Directors along with Philip Verges and Bruce Noller, the CEO and Director of Operations of NewMarket Technology, respectively.
- | The Chief Executive Officer of the Company, Mr. Mark Richards, resigned on October 18, 2006. Mr. John T. Verges was appointed the Chief Executive Officer and President of the Company on October 18, 2006. |
Mr. Noller resigned from the Board on March 3, 2008 and was replaced by Mr. Paul Danner. Mr. John Verges resigned as Chief Executive Officer of the Company on June 2, 2008 and Mr. Danner was appointed as Chief Executive Officer of the Company effective July 1, 2008.
- | The Chief Financial Officer of the Company, Ms. Kristi J. Kampmann, resigned on October 18, 2006. Mr. Philip J. Rauch was appointed the Chief Financial Officer on October 18, 2006. |
In April 2009, we issued 750 shares of Series B Convertible Preferred Stock, $.001 par value, to The Huali Group in connection with the acquisition by our Clipper Technology, Ltd. subsidiary, of an additional 25% interest in Clipper-Huali, Ltd., bringing our total ownership in Clipper-Huali, Ltd. to 76%.
- | Messrs. Philip Verges, Bruce Noller and Philip J. Rauch were appointed Directors of the Company on October 18, 2006. |
In November 2009, we entered into an Equity Reorganization Agreement with NewMarket Technology under which NewMarket Technology exchanged its 250,000 shares of Series A Preferred Stock for the issuance of 10,000 shares of Series C Convertible Preferred Stock and 5,000 shares of Series D Preferred Stock.
- | Messrs. Mark Richards and Mallory Smith resigned as Directors of the Company on February 15, 2007. |
- | Mr. Paul Danner was appointed a Director of the Company on March 3, 2008. |
- | Mr. Bruce Noller resigned as a Director of the Company on March 3, 2008. |
- | Mr. John T. Verges resigned as Chief Executive Officer of the Company on June 2, 2008 and Mr. Paul Danner was appointed as Chief Executive Officer of the Company effective July 1, 2008. |
In December 2009, we acquired 100% of Shenzhen Nubao Technology Co., Ltd. (“Nubao”), an original design manufacturer (“ODM”) of wireless products, from China Radio Technology Co., Ltd. in exchange for a $300,000 note. Additionally, in December 2009 we acquired 100% of Dalian Aoyuan Electronic Technology Services Co., Ltd. (“DAETS”), a systems integration company, from Aoyuan Electronic Company, Ltd., in exchange for a $200,000 note.
Mr. Danner resigned as CEO and a Director of the Company on January 31, 2010, and Dr. James Jiang was appointed CEO of the Company effective February 1, 2010.
In March 2010, we executed a non-binding letter of intent (the “Fonix LOI”) under which CLPTEC, our wholly-owned subsidiary based in Shanghai, China, would acquire 100% of Shanghai Gaozhi Software Systems, Ltd. (“Gaozhi”), a telecommunications software developer, from Fonix Corporation (“Fonix”) in exchange for the issuance of a newly authorized series of preferred stock, the terms and conditions of which were subject to negotiation. The transaction was subject to the parties successfully entering into a definitive agreement which we originally projected would occur in the third quarter of 2010.
Simultaneous with the execution of the Fonix LOI, we planned to enter into a one-year management agreement with Fonix under which CLPTEC would assist in the management of Gaozhi until the execution of a definitive agreement between the parties for the acquisition of Gaozhi by CLPTEC. In August 2010 it became apparent the parties would be unable to negotiate a mutually satisfactory definitive agreement regarding the intended transaction, therefore all aforementioned relationships between CLPTEC and Fonix were subsequently terminated.
Business of China Crescent Enterprises, Inc.
Our headquarters is located in Dallas, Texas but our primary operations are currently in The People’s Republic of China (“China” or “PRC”). To date, the majority of our sales haverevenue has been derived from the resale of information technology products, andas well as providing certain technology-related services sold within mainland China, however,China. Through a recent acquisition the Company has expanded into the original design manufacturing (ODM) market. An ODM designs and manufactures products which are specified and eventually branded by another firm for sale. Such ODM companies allow the brand firm to produce (either as a supplement or solely) without having to engage in the organization or running of a factory. ODM's typically handle production for multiple clients, often providing a large portion of overall production. A primary attribute of this business model is that the ODM owns and/or designs in-house the products that are branded by the buying firm which is in contrast to a contract manufacturer (CM). This business model is often employed in international trade, where a local ODM is used to produce goods for a foreign company which benefits from some advantage in the transaction, such as low labor inputs, transport links or proximity to markets. ODM manufacturing may also exploredbe utilized when local ownership laws prohibit direct ownership of assets by foreigners, allowing a local firm to produce for a brand company for either the domestic market or export.
Beyond the recent inclusion of our ODM business, the Company also continues to explore the possibility of establishing worldwide business relationships with U.S. based customers that may include:involve:
- | outsourcing- | Outsourcing of software development in China;China |
- | exploration of- | Expansion within the Chinese marketplace;marketplace |
- | localization- | Localization of products and/or services;services |
- | identification- | Identification of complimentary products in China;China |
| - | Export of products manufactured in China |
We provide these products and services through our subsidiaries partnerships and relationships,partnerships, as discussed below.
Clipper Technology, Inc.Ltd. (“CLPTEC”). CLPTEC, is one of our subsidiaries, and it is a Wholly Owned Foreign Entity (W.O.F.E.) registered in Shanghai, China.China, is our main operating subsidiary. Chinese companies must be registered in the specific market space they intend to operate within.in. CLPTEC’s corporate charter in China allows itthe Company to provide consulting, development, implementation, and maintenance of technology systems which include both software and hardware peripherals for computing, communication, and data exchanges related to general business applications as well as the specialty fields of medical, security, military and homeland defense applications. CLPTEC may also engage in the prototype development of security systems as well as OEMoriginal equipment manufacturing (“OEM”) sourcing for production of hardware related to the above business activities.
Clipper Huali Co., LTDLtd. (“Clipper Huali”). Clipper Huali was originally formed as a collaborative business enterpriseventure between CLPTEC and a consortium of Chinese technology firms called The Huali Group, Ltd. (“Huali”). Such ventures in China are required to be registered companies. In 2006, CLPTEC and Huali formalized our business relationship with the formation of Clipper Huali. Clipper Huali is registered in the City of Ningbo, China, located just south of Shanghai on the opposite side of the Hangzhou Bay. By virtue of its registration as an independent firm, Clipper Huali is a now a majority-owned subsidiary of CLPTEC and iswas initially owned 51% by CLPTEC and 49% by Huali. Clipper Huali is engaged in the distributiona value-added reseller of IT products including notebook &and desktop computers, printers, servers networkand networking equipment LCD projectors and digital cameras from a number of global brand partners including Dell, HP, IBM, Cisco, Sony, Epson, Canon and Sanyo. The company is also an authorized reseller of operating system,systems, database, middleware and application software from Microsoft, Red Hat, Oracle, Sybase, IBM, BEA, Veritas and others. In March 2009, we announced that CLPTEC acquired an additional 25% interest in Clipper Huali from Huali in exchange for the issuance of 750 shares of Series B Convertible Preferred Stock of the Company, bringing itsCLPTEC’s total ownership in Clipper Huali to 76% and reducing Huali’s ownership interest to 24%.
Gaozhi Science and Technology Development, LTD.Ltd. (“Gaozhi”). In 2006, CLPTEC has formed a strategic partnership with Gaozhi to develop and distribute high technology products and services. Our primary office in mainland China is co-located withinlocated in the same building as Gaozhi. Gaozhi is a well established and highly respected firmtechnology company in China, particularly in the City of Shanghai.Shanghai, China. Gaozhi operates withinin many high technology market spacesmarkets including the manufacture of Mobile Communication Vehicles, Low Energy Intelligent Lighting Products, Satellite Data Communications, Telecommunications Software,mobile communication vehicles, low-energy intelligent lighting products, satellite data communications, telecommunications software, and IP Television. By virtue of the opportunities in these market spaces, wetelevision. We have partnered with Gaozhi to develop foreign sales for several of Gaozhi’s products and services.
Shanghai Multimedia Industry AssociationDalian Aoyuan Electronic Technology Services Co., Ltd. (“SMIA”DAETS”). We have formed a business development relationship with the SMIA. The SMIADAETS is a municipal organization operatedwholly-owned subsidiary that was acquired by CLPTEC in December 2009 from Aoyuan Electronic Company, Ltd., located in Dalian, China. Established in March 1995, Aoyuan is one of the Shanghai City Government. Its mission is to develop the multimedia software industry in the City of Shanghai. The SMIA has formed an association comprised of approximately 148 Shanghai-based multimedia companies. These firms currently operatetop 500 computer hardware suppliers in China and are working to expand their businesses to include foreign customersis listed as one of the “Top 100 Northeast Regional Computer Suppliers” by First Chinese Computer Vendors. In 2004, Aoyuan was awarded “Best IT Distributor of Northeast China” and received ISO9001 certification by SGS in the United States, Western EuropeKingdom. Aoyuan’s staff operate several business segments, including computer software and beyond. We have developed contractual working agreementshardware sales, system integration, IT consulting services, IT product promotion and IT retail sales.
Shenzhen Nubao Technology Co. Ltd. (“Nubao”). Nubao is a wholly-owned subsidiary acquired by CLPTEC in December 2009 from China Radio Technology Co., Ltd., an original design manufacturer located in Shenzhen, China. Nubao designs and manufactures a wide range of custom wireless products specified by customers worldwide, with severalthe company’s primary product focus on wireless communication terminals (GSM, GSM/GPRS modules, GPS modules, GPS trackers, and personal navigation devices). The core research and development staff of Nubao averages more than five years of professional experience, and provides customers with industrial design (ID), mechanical design (MD), hardware design (HW), software design (SW), manufacturing, test and evaluation (T&E), and quality assurance (QA) services covering the SMIA member companies, and are jointly working with those companies to develop multimedia software sales in the United States.full range of wireless communication solutions for intelligent terminals.
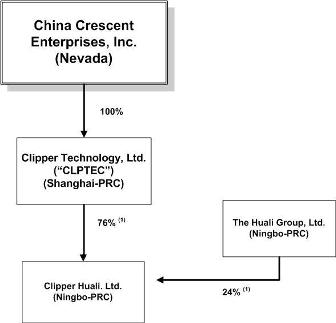
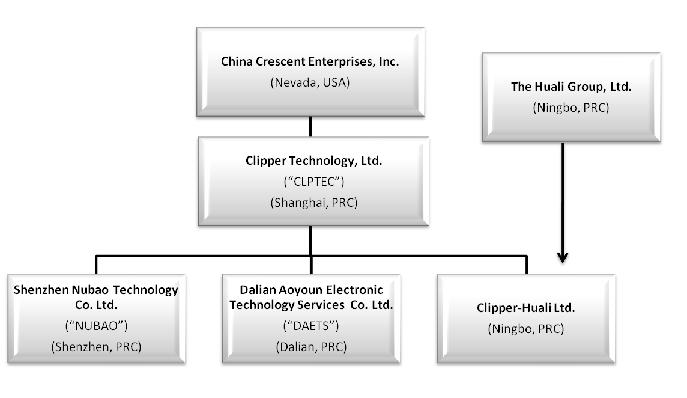
The following chart reflects our current organizational structure as of the date of this report:
(1) These ownership percentages reflect the recent acquisition by CLPTEC of an additional 25% of Clipper Huali in March 2009.
Employees
As of December 31, 2008,2010, we had approximately 250315 employees, of which 240223 employees work for Clipper Huali.Clipper-Huali, 45 employees work for Nubao, 42 employees work for DAETS and three employees work for CLPTEC. Our employees are not represented by a labor union or subject to any collective bargaining agreement that may stem from such unions. Our Chinese subsidiaries are subject to Chinese labor laws that give labor a comparatively minor level of group power. We believe our relations with our employees are satisfactory and do not present any undue organizational risk.
This Annual Report contains forward-looking statements that involve risks and uncertainties that could cause our actual results to differ materially from those discussed in this Annual Report. These risks and uncertainties include the following:
Risks Related to Our Company
While we have been profitable for the year over the last threefour years, profits have been small and we have incurredcannot be certain that we will not incur monthly andand/or quarterly operating losses from time to time in each of the last three years.future.
We cannot be certain that we can sustain or increase profitability on a quarterly or annual basis in the future. If we are unable to remain profitable, our liquidity could be materially harmed.
We cannot predict our future results because our business has a limited operating history, particularly in its current form.
Given our limited operating history, it will be difficult to predict our future results. You should consider the uncertainties that we may encounter as an early stagea technology company in a new and rapidly evolving market. These uncertainties include:
o .......market acceptance of our products or services; | - | Market acceptance of our products or services |
| - | Consumer demand for, and acceptance of, our products, services and follow-on products |
| - | Our ability to create user-friendly applications |
| - | Our unproven and evolving business model |
o .......consumer demand for, and acceptance of, our products, services and follow-on products;
o .......our ability to create user-friendly applications; and
o .......our unproven and evolving business model.
We have a limited operating history. We will need to achieve greater revenues, better margins, and/or reduce operating expenses in order to maintain profitability. There can be no assurance that we will be successful in increasing revenues, or generating acceptable margins or, if we do, that operation of our business will be a profitable business enterprise.and reducing operating expenses. We may have to seek additional outside sources of capital for our business. There can be no assurance that we will be able to obtain such capital on favorable terms and conditions or at all. If this occurs the market price of our common stock could suffer.
Our quarterly and annual sales and financial results have varied significantly in the past, and we expect to experience fluctuations in the future, which meanmeans that period-to-period comparisons are not necessarily meaningful or indicative of future performance.
Our sales and operating results have varied, and These fluctuations may continuebe attributed to vary, significantly from year to year and from quarter to quarter as a result of a variety ofseveral factors, including the introduction of new products by competitors, pricing pressures, the timing of the completion and/or the cancellation of projects, the evolving and unpredictable nature of the markets in which our products and services are sold and economic conditions generallyin general or in certain geographic areas in which our customers do business. Furthermore, we may be unable to control spending in a timely manner to compensate for any unexpected revenue shortfall. Accordingly, we cannot assure yougive any assurances that sales and net income, if any, in any particular quarter will not be lower than sales and net income, if any, in a preceding or comparable quarter or quarters. In addition, sales and net income, if any, in any particular quarter are not likely to be indicative of the results of operations for any other quarter or for the full year. The trading prices of our securities may fluctuate significantly in response to variations in our quarterly or annual results of operations.
We may not be able to sustain or accelerate growth, or sustain or accelerate recurring revenue from our business.
There can be no assurance that demand for our services and products will increase or be sustained, or that our current or future products will have market acceptance in that product category. Our acquisition costs per customer are high due to the significant costs associated with sales, research and development and marketing. To the extent we do not achieve growth and this cost per customer is not reduced, it will be difficult for us to generate meaningful revenue at acceptable margins or achieve profitability. To the extent that our business model is not successful, because market acceptance does not develop as expected, or other competing technologies evolve in connection with the changing market or for any other reason, we might have future unexpected declines in revenue.
Rapid technological change could render our products and services obsolete.
The IT services industry is characterized by rapid technological innovation, sudden changes in user and customer requirements and preferences, frequent new product and service introductions and the emergence of new industry standards and practices. Each of these characteristics could render our services, products, intellectual property and systems obsolete. The rapid evolution of our market requires that we continually improve continually the performance, features and reliability of our products and services, particularly in response to competitive offerings. Our success also will depend, in part, on our ability:
- | to- | To develop or license new products, services and technologytechnologies that address the varied needs of our customers and prospective customers |
- | to- | To respond to technological advances and emerging industry standards and practices on a cost-effective and timely basis |
If we are unable, for technical, financial, legal or other reasons, to adapt in a timely manner to changing market conditions or user preferences, we could lose customers, which would cause a decrease in our revenue.
From time to time, we evaluate the various components of our portfolio of businesses and may, as a result, decide to acquire or divest businesses or enter into joint ventures or strategic alliances. These acquisitions, divestitures, joint ventures and alliances affect our costs, revenues, profitability and financial position. We may also consider the acquisition of specific assets or businesses that fall outside our traditional lines of business if we deem such properties sufficiently attractive. If we fail to manage the risks associated with acquisitions, divestitures, joint ventures or other alliances, our business, financial condition, and results of operations could be materially and adversely affected.
Divestitures have inherent risks, including possible delays in closing transactions (including potential difficulties in obtaining regulatory approvals), the risk of lower-than-expected sales proceeds for the divested business, unexpected costs associated with the separation of the business to be sold, and potential post-closing claims for indemnification. In addition, adverse economic or market conditions may result in fewer potential bidders and unsuccessful sales efforts. Expected cost savings, which are offset by revenue losses from divested businesses, may also be difficult to achieve or maximize due to our fixed cost structure.
Acquisitions also involve risks, including difficulties in integrating acquired operations, diversions of management resources, debt incurred in financing these acquisitions (including the related possible reduction in our credit ratings and increase in our cost of borrowing), differing levels of management and internal control effectiveness at the acquired entities and other unanticipated problems and liabilities. Competition for certain types of acquisitions is significant. Even if successfully negotiated, closed and integrated, certain acquisitions or investments may prove not to advance our business strategy and may fall short of expected return on investment targets.
We may be unable to obtain additional capital if needed to grow our business, which would adversely impact our business. If we raise additional financing, shareholders may suffer significant dilution.
Although weWe anticipate that our current cash and cash flow from operations will be sufficient to satisfy our working capital and ordinary course capital expenditure needs over the next 12 months,months. However, if our revenues do not continue to grow to cover our expenses, we will need to seek additional investment from our parent company or a third party to finance our growth plans as we have done in the past. We cannot be certain that financing from our parent company or third parties will be available on acceptable terms to us or at all. Our future capital requirements will depend upon several factors, including the rate of market acceptance of our products and services, our ability to expand our customer base and our level of expenditures for sales and marketing. If our capital requirements vary materially from those currently planned, we may require additional financing sooner than anticipated. If we cannot raise funds on acceptable terms, we may not be able to develop our products and services, take advantage of future opportunities or respond to competitive pressures or unanticipated requirements, any of which could have a material adverse effect on our ability to grow our business. Further,Furthermore, if we issue equity securities, shareholders will experience dilution of their ownership percentage, and the new equity securities may have rights, preferences or privileges senior to those of our common stock.
Certain of ourdirect market competitors have significantly greater financial, technical, marketing and other resources than we do and may be able to respond more quickly to new or emerging technologies and changes in customer requirements. Additional competition could result in price reductions, reduced margins and loss of market. We cannot guarantee that we will be able to compete successfully against future competitors or that future competitive pressures will not materially and adversely affect our business, financial condition and results of operations.
Our success depends in large part on the continued service of our management and other key personnel and our ability to continue to attract, motivate and retain highly qualified employees. If one or more of our key employees leaves the Company, we will have to find a replacement with the combination of skills and attributes necessary to execute our strategy. Because competition from other technology companies for skilled employees is intense, and the process of finding qualified individuals can be lengthy and expensive, we believe that the loss of services of key personnel could negatively affect our business, financial condition and results of operations.
The recentongoing worldwide credit crisis and turmoil in the global financial system may have an adverse impact on our business and our financial condition, and we may face challenges if conditions in the financial markets do not improve. Our ability to access the capital markets may be restricted at a time when we would like, or need, to raise capital, which could have an impact on our flexibility to react to changing economic and business conditions. In addition, thesecurrent economic conditions also impact levels of government and consumer spending, which have recently deteriorated significantly and may remain depressed for the foreseeable future. It is uncertain how long the global crisis in the financial services and credit markets will continue and how much of an impact it will have on the global economy in general or the Chinese economy in particular.
A prolonged economic downturn could reduce our customer base and demand for our products. Our success significantly depends upon the growth of demand of our products from a growing customer base. If demand for our products and services fluctuates as a result ofdo not grow, or if prevailing economic conditions locally, nationally or otherwise,internationally are unfavorable, our business may not succeed. A prolonged economic downturn would likely contribute to the deterioration of the demand for our products and services, which in turn would hurt our business. A prolonged economic downturn could, therefore, result in reduced revenue, andreduced gross margin or losses that could be harmed.materially and adversely affect our business.
In August 2006, six Chinese regulatory agencies promulgated the Regulation on Mergers and Acquisitions of Domestic Companies by Foreign Investors, which became effective Inin September 2006 (the “M&A Rule”). According to the M&A Rule, a “Round-trip Investment” is defined as having taken place when a Chinese business that is owned by Chinese individual(s) is sold to a non-Chinese entity that is established or controlled, directly or indirectly, by those same Chinese individual(s). Under the M&A Rules, any Round-trip Investment must be approved by China’s Ministry of Commerce (“MOFCOM”), and any indirect arrangement or series of arrangements which achieves the same end result without the approval of MOFCOM is a violation of Chinese law. The M&A Rule establishes additional procedures and requirements that could make some acquisitions of Chinese companies by foreign investors more time-consuming and complex, including requirements in some instances that the MOFCOM be notified in advance of any change-of-control transaction and in some situations,and/or require approval of the MOFCOM when a foreign investor takes control of a Chinese domestic enterprise. In the future, we may grow our business in part by acquiring complementary businesses. The M&A Rule also requires MOFCOM anti-trust review of any change-of-control transactions involving certain types of foreign acquirers. Complying with the requirements of the M&A Rule to complete such transactions could be time-consuming, and any required approval processes, including obtaining approval from the MOFCOM, may delay or inhibit our ability to complete such transactions, which could affect our ability to expand our business or maintain our market share.
Risks Related to Doing Business in China
Recently, U.S. public companies that have substantially all of their operations in China, particularly companies like ours that have completed so-called reverse merger transactions, have been the subject of intense scrutiny, criticism and negative publicity by investors, financial commentators and regulatory agencies, such as the United States Securities and Exchange Commission (“SEC”). Much of the scrutiny, criticism and negative publicity has centered around financial and accounting irregularities and mistakes, a lack of effective internal controls over financial accounting, inadequate corporate governance policies or a lack of adherence thereto and, in many cases, allegations of fraud. As a result of such scrutiny, criticism and negative publicity, the publicly traded stock of many U.S. listed China-based companies has sharply decreased in value and, in some cases, has become virtually worthless. Furthermore, many of these companies are conducting internal and external investigations into such allegations and in the interim are subject to trading halts, SEC investigative and enforcement actions and shareholder lawsuits. It is not clear what effect this sector-wide scrutiny, criticism and negative publicity will have on our company, our business and our stock price. If we become the subject of any unfavorable allegations, whether such allegations are proven to be true or untrue, we will have to expend significant resources to investigate such allegations and/or defend our company. Such a development would be costly and time consuming and would distract our management from growing our company. If such allegations are not proven to be groundless, our company and business operations will be severely harmed and your investment in our stock could be rendered worthless.
Changes in Chinese laws and regulations, or their interpretation, or the imposition of confiscatory taxation, restrictions on currency conversion, imports and sources of supply, devaluations of currency or the nationalization or other expropriation of private enterprises could have a material adverse effect on our business, results of operations and financial condition. Under ourits current leadership, the Chinese government has been pursuing economic reform policies that encourage private economic activity and greater economic decentralization. There is no assurance, however, that the Chinese government will continue to pursue these policies, or that it will not significantly alter these policies from time to time without notice.
Substantially all of our sales are generated from China. We anticipate that sales of our products in China will continue to represent a substantial majority of our total sales in the near future. Any significant decline in the condition of the Chinese economy could adversely affect demand for our products, among other things, which in turn would have a material adverse effect on our business and financial condition.
The Chinese government has enacted some laws and regulations dealing with matters such as corporate organization and governance, foreign investment, commerce, taxation and trade. However, their experience in implementing, interpreting and enforcing these laws and regulations is limited, and our ability to enforce commercial claims or to resolve commercial disputes is unpredictable. If ourwe undertake new business ventures that are unsuccessful, or other adverse circumstances arise from these transactions, we face the risk that the parties toassociated with these ventures may seek ways to terminate the transactions, or may hinder or prevent us from accessing important information regarding the financial and business operations of these acquired companies. The resolution of these matters may be subject to the exercise of considerable discretion by agencies of the Chinese government, and forces unrelated to the legal merits of a particular matter or dispute may influence their determination.determination, all of which we have no control over. Any rights we may have to specific performance, or to seek an injunction under Chinese law, in either of these cases, are severely limited, and without a means of recourse by virtue of the Chinese legal system, we may be unable to prevent these situations from occurring. The occurrence of any such events could have a material adverse effect on our business, financial condition and results of operations.
Substantially all of our revenues arehave been generated fromby operating companies that report to our Chinese subsidiary, CLPTEC. However, Chinese regulations restrict the ability of CLPTEC to make dividends and other payments to its parent company. Chinese legal restrictions permit payments of dividends by CLPTEC only out of its accumulated after-tax profits, if any, determined in accordance with Chinese accounting standards and regulations. Any limitations on the ability of CLPTEC to transfer funds to us could materially and adversely limit our ability to grow, make investments or acquisitions that could be beneficial to our business, pay dividends and otherwise fund and conduct our business.
We are required to comply with the United States Foreign Corrupt Practices Act, which prohibits U.S. companies from engaging in bribery or other prohibited payments to foreign officials for the purpose of obtaining or retaining business. Foreign companies, including some of our competitors, are not subject to these prohibitions. Corruption, extortion, bribery, pay-offs, theft and other fraudulent practices occur from time-to-time in mainland China. If our competitors engage in these practices, they may receive preferential treatment from personnel of some companies, giving our competitors an advantage in securing business or from government officials who might give them priority in obtaining new licenses, which would put us at a disadvantage. Although we inform our personnel that such practices are illegal, we cannot assure you that our employees or other agents will not engage in such conduct for which we might be held responsible. If our employees or other agents are found to have engaged in such practices, we could suffer severe penalties.
China has only recently has permitted provincial and local economic autonomy and private economic activities, and, as a result, we are dependent on our relationship with the local government in the province in which we operate our business. Chinese government has exercised and continues to exercise substantial control over virtually every sector of the Chinese economy through regulation and state ownership. Our ability to operate in China may be harmed by changes in its laws and regulations, including those relating to taxation, environmental regulations, land use rights, property and other matters. We believe that our operations in China are in material compliance with all applicable legal and regulatory requirements. However, the central or local governments of these jurisdictions may impose new, stricter regulations or interpretations of existing regulations that would require additional expenditures and efforts on our part to ensure our compliance with such regulations or interpretations. Accordingly, government actions in the future, including any decision not to continue to support recent economic reforms and to return to a more centrally planned economy or regional or local variations in the implementation of economic policies, could have a significant effect on economic conditions in China or particular regions thereof, and could require us to divest ourselves of any interest we then hold in Chinese properties.
Changes in China's political or economic situation could harm us and our operating results. Economic reforms adopted by the Chinese government have had a positive effect on the economic development of the country, but the government could change these economic reforms or any of the legal systems at any time. This could either benefit or damage our operations and profitability. Some of the things that could have this effect are:
| ● | Level of government involvement in the economy |
| ● | Control of foreign exchange |
| ● | Methods of allocating resources |
| ● | Balance of payments position |
| ● | International trade restrictions |
| ● | International conflict |
The Chinese economy differs from the economies of most countries belonging to the Organization for Economic Cooperation and Development, or OECD, in many ways. For example, state-owned enterprises still constitute a large portion of the Chinese economy, and weak corporate governance and lack of a flexible currency exchange policy still prevail in China. As a result of these differences, we may not develop in the same way or at the same rate as might be expected if the Chinese economy was similar to those of OECD member countries.
In recent years, the Chinese economy has experienced periods of rapid expansion and high rates of inflation. During the past ten years, the rate of inflation in China has been as high as 20.7% and as low as (2.2)%-2.2%. These factors have led to the adoption by Chinese government from time to time, ofadopt various corrective measures which they implement at will, designed to restrict the availability of credit or regulate growth and contain inflation. While inflation has been more moderate since 1995, high inflation may in the future may cause Chinese government to impose controls on credit and/or prices, or to take other action, which could inhibit economic activity in China, and thereby harm the market for our products.
China historically has been deficient in Western style management and financial reporting concepts and practices, as well as in modern banking, computer and other control systems. We may have difficulty in hiring and retaining a sufficient number of qualified employees to work in China. As a result of these factors, we may experience difficulty in establishing management, legal and financial controls, collecting financial data and preparing financial statements, books of account and corporate records and instituting business practices that meet Western standards.
Uncertainties with respect to the Chinese legal system could limit the legal protections available to you and us. We may have difficulty establishing adequate management, legal and financial controlsconduct substantially all of our business through our subsidiaries in China. Our subsidiaries are generally subject to laws and regulations applicable to foreign investments in China and, in particular, laws applicable to foreign-invested enterprises. The Chinese legal system is based on written statutes, and prior court decisions may be cited for reference but have limited precedential value. Since 1979, a series of new laws and regulations have significantly enhanced the protections afforded to various forms of foreign investments in China. However, since the Chinese legal system continues to evolve rapidly, the interpretations of many laws, regulations, and rules are not always uniform, and enforcement of these laws, regulations, and rules involve uncertainties, which may limit legal protections available to you and us. In addition, any litigation in China may be protracted and result in substantial costs and diversion of resources and management attention. As a result, it may be difficult for investors to effect service of process in the United States or to enforce a judgment obtained in the United States against our Chinese operations and subsidiaries.
Risks Related to Currency Exchange Between the Chinese Renminbi and United States Dollars
It is possible that the Chinese government could adopt a more flexible currency policy, which could result in more significant fluctuation of RMB against the U.S. dollar. We can offer no assurance that RMB will be stable against the U.S. dollar or any other foreign currency.
The income statements appearing elsewhere herein are translated into U.S. dollars at the average exchange rates in each applicable period. To the extent the U.S. dollar strengthens against foreign currencies, the translation of these foreign currencies denominated transactions will result in reduced revenue, operating expenses and net income for our international operations. Similarly, to the extent the U.S. dollar weakens against foreign currencies, the translation of these foreign currency denominated transactions will result in increased revenue, operating expenses and net income for our international operations. We are also exposed to foreign exchange rate fluctuations as we convert the financial statements of CLPTEC and Clipper Hualiour subsidiaries into U.S. dollars in consolidation. If there is a change in foreign currency exchange rates, the conversion of the foreign subsidiaries’ financial statements into U.S. dollars will lead to a translation gain or loss which is recorded as a component of other comprehensive income. In addition, we may have certain assets and liabilities that are denominated in currencies other than the relevant entity’s functional currency. Changes in the functional currency value of these assets and liabilities create fluctuations that will lead to a transaction gain or loss. We have not entered into agreements or purchased instruments to hedge our exchange rate risks, although we may do so in the future. The availability and effectiveness of any hedging transaction may be limited and we may not be able to successfully hedge our exchange rate risks.
Although Chinese governmental policies were introduced in 1996 to allow the convertibility of RMB into foreign currency for current account items, conversion of RMB into foreign exchange for capital items, such as foreign direct investment, loans or securities, requires the approval of the State Administration of Foreign Exchange, or SAFE, which is under the authority of the People’s Bank of China. TheseHowever, these approvals however, do not guarantee the availability of foreign currency conversion. We cannot be sure that we will be able to obtain all required conversion approvals for our operations or that Chinese regulatory authoritiesauthority will not impose greater restrictions on the convertibility of RMB in the future. Because a significant amount of our future revenue may be in the form of RMB, our inability to obtain the requisite approvals or any future restrictions on currency exchanges could limit our ability to utilize revenue generated in RMB to fund potential business activities outside of China, or to repay foreign currency obligations, including our debt obligations, which would have a material adverse effect on our financial condition and results of operations.
Risks Related to Our Industry
DeteriorationIn addition to the current global financial crises, deterioration of the IT services industry could lead to further reductions in capital spending budgets by our customers, which could further adversely affect our revenues, gross margins and income.
Our revenues and gross margins will depend significantly on the overall demand for IT products and services. Reduced capital spending budgets by our customers caused by the ongoing industry downturn have led to continued soft demand for our products and services, which has resulted in, and may continue to result in, decreased revenues, earnings levels or growth rates. The global economy in general, and the technology market in particular, has weakened and market conditions continue to be challenging. As a result, individuals and companies are delaying or reducing expenditures. We have observed effects of the global economic downturn in many areas of our business. In addition, the technology industry has experienced significant consolidation, and this trend is expected to continue. It is possible that we and one or more of our competitors each supply products to the companies that have merged or will merge. This consolidation could result in further delays in purchasing decisions by merged companies or in us playing a decreased role in the supply of products to the merged companies. Further delays or reductions in spending could have a material adverse effect on demand for our products and services and, consequently, our results of operations, prospects and stock price.
Risks Related to Our Capital Stock
The public market for our common stock may be volatile.volatile and you could lose all or part of your investment.
ThereIn the recent past, stocks, specifically those traded on the over-the counter (“OTC”) markets, generally have experienced high levels of volatility. Our common stock is currently only a limited publictraded on the OTC market under the symbol “CCTR” and is not eligible for trading on any national or regional securities exchange or the Nasdaq National Market. A more active trading market for our common stock which is listed on the OTC Bulletin Board under the symbol “CCSE”.may never develop, or if such a market develops, it may not be sustained.
The market price of our common stock has been and is likely to continue to be significantly affected by various factors, including:including those described in this “Risk Factors” section, many of which are beyond our control and may not be related to our operating performance. These fluctuations could cause you to lose all or part of your investment in our common stock as you may be unable to sell your shares at or above the price you paid. Factors that could cause fluctuations in the trading price or our stock include but are not limited to:
- | general- | Price and volume fluctuations in the overall stock market conditionsfrom time to time |
| - | Significant volatility in the market prices and market conditions affectingtrading volume of technology stocks in particular |
- | actual- | Actual or anticipated fluctuations in our quarterly or annual operating results |
- | - | Actual or anticipated changes in the expectations of investors or the recommendations of any securities analysts who follow our stock |
| - | The public’s reaction to our press releases, other public announcements relatingand filings |
| - | Litigation involving the Company, our industry or both or investigations by regulators into our operations or those of our competitors |
| - | New laws or regulations or new interpretations of existing laws or regulations applicable to contracts, investments, acquisitions, divestituresour business or operations |
- | discontinued- | Changes in accounting standards policies, guidelines, interpretations or principles |
| - | Discontinued operations, layoffs or corporate actions |
- | - | General economic conditions or industry conditions or trends |
- | limited public float,- | Limited market making activity and research coverage |
The stock markets, especially
In the over-the-counter markets,past, many companies that have experienced significant price and volume fluctuations that have affected the market prices of many technology companies' stocks. These fluctuations have often been unrelated or disproportionate to operating performance. These broad market or technology sector fluctuations may adversely affectvolatility in the market price of their stock have become subject to securities class action litigation. We may be the target of this type of litigation in the future. Securities litigation against us could result in substantial costs and divert our common stock. General economic, political and market conditions such as recessions and interest rate fluctuations may also have an adverse effect on the market price ofmanagement’s attention from other business concerns, which could seriously harm our common stock. In addition, the market price of our common stock has also been and is likely to continue to be affected by expectations of analysts and investors.business.
The U.S. Securities and Exchange Commission (the ‘SEC”)SEC has adopted regulations which generally define a “penny stock” to be an equity security that has a market price of less than $5.00 per share, subject to specific exemptions. The market price of our Common Stockcommon stock is less than $5.00 per share and therefore is a “penny stock” and is subject to the “penny stock” rules of the SEC. The trading market in our securities is limited which makes transactions in our stock cumbersome and may reduce the value of an investment in our common stock.” Brokers and dealers effecting transactions in “penny stock” must disclose certain information concerning the transaction, obtain a written agreement from the purchaser and determine that the purchaser is reasonably suitable to purchase the securities. These rules may restrict the ability of brokers or dealers to sell our Common Stockcommon stock and may affect your ability to sell shares.
Our stock is controlled by a single majority shareholder for the foreseeable future andwho as a result, will be able to control our overall direction. This majority shareholder could conceivably control the outcome of matters requiring stockholder approval and could be able to elect all of our directors. Such control, which may have the effect of delaying, deferring or preventing a change of control, is likely to continue for the foreseeable future and significantly diminishes control and influence which existing and future stockholders may have in theour Company.
We may be the subject of securities class action litigation due to future stock price volatility.
Shareholder interest in theour Company may be substantially diluted as a result of the sale of additional securities to fund our plan of operation.
Our preferred stock has certain preferences over our common stock with regard to liquidation, dividends and election of directors.
Our issued and outstanding preferred stock holds a preference in liquidation over our common stock. AllCertain classes of our outstanding Preferred Stock ispreferred stock are subject to conversion into common stock upon the occurrence of certain enumerated events and contain provisions that may limit our ability to raise additional capital if needed. In addition, any such conversion will dilute our existing and future common stockholders.
Our ability to issue additional preferred stock or other convertible securities may adversely affect the rights of our common stockholders and may make takeovers more difficult, possibly preventing you from obtaining optimal share price.
Our Articles of Incorporation authorize the issuance of shares of "blank check" preferred stock, which would have the designations, rights and preferences as may be determined from time to time by the board of directors. Accordingly, the board of directors is empowered, without shareholder approval (but subject to applicable government regulatory restrictions), to issue additional preferred stock with dividend, liquidation, conversion, voting or other rights that could adversely affect the voting power or other rights of the holders of the common stock. In the event of an issuance, the preferred stock could be used, under certain circumstances, as a method of discouraging, delaying or preventing a change in control of the Company. We have also historically used securities that are convertible into common stock as a currency to finance acquisitions and may continue to do so in the future.
Not applicable.
Principal Executive Offices
Our principal executive offices are located at 14860 Montfort Drive, Suite 210, Dallas, Texas 75254. We moved to these offices during the fall of 2006. NewMarket Technology, Inc., our majority stockholder, leases the space.
CLPTEC’s offices are located at No. 123 Qinjiang Road, Shanghai, 200233, People’s Republic of China. The offices are leased from Gaozhi, a strategic partner, on a month-to-month basis. Rent paymentsThe annual rent expense for the Shanghai office totaledyear ended December 31, 2010 was approximately $6,335 in 2008.$7,000.
On March 1, 2005, Brunetti filed a voluntary petition for relief in the United States Bankruptcy Court, District of Colorado under Chapter 7 of Title 7 of the U.S. Bankruptcy Code.
On March 16, 2005, the Company filed a voluntary petition for relief in the United States Bankruptcy Court, District of Colorado under Chapter 11 of Title 11 of the U.S. Bankruptcy Code. On April 5, 2006, the United States Bankruptcy Court, District of Colorado dismissed the Chapter 11 proceedings.None.
ITEM 4. SUBMISSION OF MATTERS TO A VOTE OF SECURITY HOLDERS(REMOVED AND RESERVED)
There were no meetings of the security holders during the period covered by this report.
| MARKET FOR COMMON EQUITY AND RELATED STOCKHOLDER MATTERS |
Price Range of Common StockMarket Information
Our common stock is presently traded on the over-the-counter market on the OTC Bulletin Board maintained by the National Association of Securities Dealers,OTC Markets Group, Inc. (the “NASD") The NASDunder the symbol for our common stock is “CCSE”.“CCTR.” The following table sets forthsummarizes the range of high and low bid quotationsprices for our common stock of each full quarterly period duringof the fiscal yearcalendar quarters of 2010 and 2009:
| | | 2010 | | | 2009 | |
| | | High | | | Low | | | High | | | Low | |
| First Quarter | | | 0.023 | | | | 0.011 | | | | 0.375 | | | | 0.115 | |
| Second Quarter | | | 0.03 | | | | 0.0071 | | | | 0.225 | | | | 0.029 | |
| Third Quarter | | | 0.0085 | | | | 0.0054 | | | | 0.075 | | | | 0.020 | |
| Fourth Quarter | | | 0.0069 | | | | 0.0015 | | | | 0.060 | | | | 0.020 | |
Our common stock is subject to rules adopted by the SEC regulating broker dealer practices in connection with transactions in "penny stocks." Those disclosure rules applicable to "penny stocks" require a broker dealer, prior to a transaction in a "penny stock" not otherwise exempt from the rules, to deliver a standardized disclosure document prepared by the SEC. That disclosure document advises an investor that investment in "penny stocks" can be very risky and that the investor's salesperson or equivalent periodbroker is not an impartial advisor, but rather paid to sell the shares. The disclosure contains further warnings for the fiscal periods indicated below.investor to exercise caution in connection with an investment in "penny stocks," to independently investigate the security, as well as the salesperson the investor is working with and to understand the risky nature of an investment in this security. The quotations were obtained frombroker dealer must also provide the customer with certain other information published byand must make a special written determination that the NASD"penny stock" is a suitable investment for the purchaser, and reflect interdealerreceive the purchaser's written agreement to the transaction. Further, the rules require that, following the proposed transaction, the broker provide the customer with monthly account statements containing market information about the prices without retail mark-up, mark-down or commission andof the securities. These disclosure requirements may not necessarily represent actual transactions.
| 2007 Fiscal Year | | |
| | | |
| First Quarter | 0.24 | 0.16 |
| Second Quarter | 0.29 | 0.12 |
| Third Quarter | 0.26 | 0.12 |
| Fourth Quarter | 0.20 | 0.10 |
| 2008 Fiscal Year | | |
| | | |
| First Quarter | 0.15 | 0.057 |
| Second Quarter | 0.113 | 0.03 |
| Third Quarter | 0.039 | 0.014 |
| Fourth Quarter | 0.017 | 0.004 |
Number of Shareholders
As ofAt December 31, 2008,2010, there were approximately 615620 stockholders of record of our common stock. Based upon information provided to usThis number does not include an indeterminate number of shareholders whose shares are held by persons holding securities for the benefitbrokers in “street name.”
Issuer Purchases of others, it is estimated that weEquity Securities
We have in excess of 3,600 beneficial ownersmade no repurchases of our common stock as of that date.
equity securities in the fiscal year ended December 31, 2010.
Dividend Policy
While there currently are no restrictions prohibiting us from paying dividends to our shareholders, weWe have not paiddeclared any cash dividends on our common stock in the past and do not anticipate paying anyduring our fiscal years ended on December 31, 2010 or 2009. Our Board of Directors has made no determination to date to declare cash dividends induring the foreseeable future. Earnings, if any,future, but is not likely to do so. There are expectedno restrictions on our ability to be retained to fund future operations of the Company. There can be no assurance that we will pay dividends at any time in the future.dividends.
The following selected financial data is derived from the consolidated financial statements of the Company. The data should be read in conjunction with the consolidated financial statements, related notes, and other financial information included herein. The information presented below is in thousands, except per share amounts.
| | | Year ended December 31, | |
| | | 2008 | | | 2007 | | | 2006 | |
| | | | | | | | | | |
| SELECTED STATEMENT OF OPERATIONS DATA | | | | | | | | | |
| Revenues | | $ | 41,878 | | | $ | 40,007 | | | $ | 29,510 | |
| Income from operations | | | | | | | | | | | | |
| Net income | | | 638 | | | | 438 | | | | 245 | |
| Net income per weighted avg. common share-basic | | $ | 0.02 | | | $ | 0.02 | | | $ | 0.01 | |
| | | | | | | | | | | | | |
| SELECTED BALANCE SHEET DATA | | | | | | | | | | | | |
| Cash | | $ | 2,600 | | | $ | 1,489 | | | $ | 1,168 | |
| Working capital | | | 6,124 | | | | 3,461 | | | | 1,833 | |
| Total assets | | | 10,346 | | | | 7,209 | | | | 4,724 | |
| Total liabilities | | | 4,277 | | | | 3,650 | | | | 2,495 | |
| Stockholders' equity | | | 4,456 | | | | 2,560 | | | | 1,650 | |
ITEM 7. MANAGEMENT’S DISCUSSION AND ANALYSIS OF FINANCIAL CONDITION AND RESULTS OF OPERATIONS | MANAGEMENT’S DISCUSSION AND ANALYSIS OF FINANCIAL CONDITION AND RESULTS OF OPERATIONS |
Forward-Looking Statements:Statements
Some statements contained in “Management’s Discussion and Analysis of Financial Condition and Results of Operations” constitute “forward-looking statements” within the meaning of the Private Securities Litigation Reform Act of 1995. Forward-looking statements include the words “may,” “estimate,” “intend,” “continue,” “believe,” “expect,” or “anticipate” and other similar words. These forward-looking statements generally relate to plans and objectives for future operations and are based upon management’s reasonable estimates of future results or trends. Although we believe that the plans and objectives reflected in or suggested by such forward-looking statements are reasonable, such plans or objectives may not be achieved. Actual results could differ materially from those projected in the forward-looking statements as a result of a number of risks and uncertainties, including: (a) lack of demand for our products and services; (b) competitive products and pricing; (c) limited amount of resources devoted to advertising; (d) lack of demand for our products and services being purchased via the Internet; and (e) other factors that may negatively affect our operating results. Statements made herein are as of the date of the filing of this Form 10-K with the Securities and Exchange CommissionSEC and should not be relied upon as of any subsequent date. We expressly disclaim any obligation to update any information or forward-looking statements contained in this Form 10-K, except as may otherwise be required by applicable law.
Overview
We sell information technology products and services and provide systems integration services in mainland China through our wholly-owned foreign entity, Clipper Technology, Ltd. The majority of our sales are concentrated in and around the cities of Shanghai, Ningbo, Hangzhou, Dalian, and HangzhouShenzhen in China.
In June 2008,December 2009, we changed theacquired 100% of Shenzhen Nubao Technology Co., Ltd. (“Nubao”), an Original Design Manufacturer of wireless products, from China Radio Technology Co., Ltd. in exchange for a $300,000 note. Additionally, in December 2009 we acquired 100% of Dalian Aoyuan Electronic Technology Services Co., Ltd. (“DAETS”), a systems integration company, from Aoyuan Electronic Company, name from NewMarket China, Inc. to China Crescent Enterprises, Inc. Ltd., in exchange for a $200,000 note.
In July 2008,February 2010, Paul K. Danner resigned as President and Chief Executive Officer of the Company and Dr. James Jiang was appointed President and Chief Executive Officer of the Company.
2008 ComparedIn March 2010, we executed a non-binding letter of intent (the “Fonix LOI”) under which CLPTEC, our wholly-owned subsidiary based in Shanghai, China, would acquire 100% of Shanghai Gaozhi Software Systems, Ltd. (“Gaozhi”), a telecommunications software developer, from Fonix Corporation (“Fonix”) in exchange for the issuance of a newly authorized series of preferred stock, the terms and conditions of which were subject to 2007negotiation. The transaction was subject to the parties successfully entering into a definitive agreement which we originally projected would occur in the third quarter of 2010. Simultaneous with the execution of the Fonix LOI, we planned to enter into a one-year management agreement with Fonix under which CLPTEC would assist in the management of Gaozhi until the execution of a definitive agreement between the parties for the acquisition of Gaozhi by CLPTEC. In August 2010 it became apparent the parties would be unable to negotiate a mutually satisfactory definitive agreement regarding the intended transaction, therefore all aforementioned relationships between CLPTEC and Fonix were subsequently terminated.
Through our Nubao subsidiary, in February 2010 we entered into a non-binding letter of intent (“LOI”) with an undisclosed Japanese technology company to develop and potentially provide 10,000 custom Wi-Fi devices. In conjunction with the LOI, the Japanese firm placed a $1.6 million purchase order with Nubao for 100 sets of the device as part of a pilot program. Although the pilot program has been completed, the long-term status of project remains uncertain. In light of the earthquake, tsunami and associated events that have taken place in Japan in March 2011, the likelihood and timing of a follow on order is less certain.
Results of Operations
Fiscal Years Ended December 31, 2010 and 2009
Revenue increased 5%71% from $40,007,006$45,628,397 for the year ended December 31, 20072009 to $41,877,584$78,187,546 for the year ended December 31, 2008.2010. This was dueincrease is primarily attributable to increased sales of computer hardwarerevenue from our Nubao and DAETS subsidiaries which were acquired in the Hangzhou region. Year over yearfourth quarter of 2009. Year-over-year systems integration sales from our Clipper-Huali subsidiary in the Ningbo and Shanghai regions werewas essentially even. CostHistorically, we have reported a disproportionate percentage increase in revenue in the fourth quarter of sales increased 3% from $38,211,067our fiscal year compared to earlier quarters. This was the case again for the year ended December 31, 20072010. However, the comparative increase in gross profit was approximately 17% less than the growth in revenue. This was attributable to $39,538,508(i) a lower gross margin associated with the fulfillment of a specific contract for our Nubao subsidiary, and; (ii) a government mandate in the fourth quarter of 2010 to accelerate the completion and billing on all government-related contracts which resulted in a higher percentage of lower margin, government-related revenue associated with our Clipper-Huali and DAETS subsidiaries. Cost of sales increased 72% from $41,578,424 for the year ended December 31, 2008.2009 to $71,635,967 for the year ended December 31, 2010. This increase was primarily due to the corresponding increase in sales volume.sales. Cost of sales as a percentage of sales was approximately 94%92% and 96%91% for the years ended December 31, 20082010 and 2007,2009, respectively. We plan to continue to pursue strategies to reduce the overall cost of sales as a percentage of sales as the Company grows. Management intends to leverage the increased purchasing volume to improve purchasing contracts and reduce overall cost of sales.
General and administrative expenses for the year ended December 31, 20082010 were $1,064,491$2,019,376 compared to $1,085,982$1,138,739 for the year ended December 31, 2007, a decrease2009, an increase of 2%77%. The decreaseincrease is primarily attributable to decreased administrative headcount in the Shanghai region.costs associated with our new Dalian and Shenzhen subsidiaries.
For the year ended December 31, 2008,2010, we recognized net income of $638,319$4,201,431 after accounting for the minoritynon-controlling interest in a consolidated subsidiary, compared to net income of $437,824$2,182,620 for the year ended December 31, 2007,2009, a 46%92% increase. The increase in net income is attributable to (i) an increase in overall sales; (ii) a decrease in general and administrative expenses for the year; and (iii) a decrease in cost of sales as a percentage of sales.our gross margin remained approximately the same; and (ii) an increase in other income compared to the previous year. Comprehensive income for the year ended December 31, 20082010 was $1,131,931$4,434,924 compared to comprehensive income of $909,771$2,101,432 for the year ended December 31, 2007,2009, a 24%111% increase. Comprehensive income includes foreign currency translation adjustments and gains or losses on investment securities held.
2007 Compared to 2006
In October 2006, the Company executed an Agreement and Plan of Reorganization (“the Agreement”) with NewMarket China, Inc. (“NewMarket China” or “the Company”), a wholly-owned subsidiary of NewMarket Technology, Inc. (“NewMarket Technology”). The Agreement, provided for Intercell to acquire from NewMarket Technology its subsidiary, NewMarket China through the exchange of all of the issued and outstanding stock of NewMarket China, one thousand (1,000) shares held by NewMarket Technology for two million (2,000,000) restricted common shares of Intercell. As a result of the Agreement, NewMarket China became the wholly-owned subsidiary of Intercell.
As a result of the Agreement and subsequent reorganization, we had revenue of $40,007,006 and $29,509,968 for the years ended December 31, 2007 and 2006, respectively. Cost of sales was $38,211,067 and $28,237,125 years ended December 31, 2007 and 2006, respectively. The gross margin was $1,795,939 and $1,272,843 for the years ended December 31, 2007 and 2006, respectively. Gross margin as a percentage of sales was 4.5% for the year ended December 31, 2007. The increase in revenue and corresponding increase in cost of sales from 2006 to 2007 was attributable to the expansion of our sales efforts into the city of Hangzhou, China. Hangzhou is capital of Zhejiang province with a population of approximately 6.4 million.
Liquidity and Capital Resources
Cash Flow Activities
Our cash balance at December 31, 2008 increased $1,111,724,2010 decreased $1,827,649, from $1,488,774$3,977,382 as of December 31, 2007,2009, to $2,600,498.$2,149,733. The increasedecrease was the result of cash used in investing activities of $3,300,000 and cash used in operating activities of $729,881,$2,797,926 offset by cash provided by financing activities of $1,301,615$2,577,525 and the effect of exchange rates on cash of $539,990.$1,692,752. Operating activities for the year ended December 31, 20082010, exclusive of changes in operating assets and liabilities provided $1,267,937,$4,225,035, as well as a decrease in inventory of $778,030 and an increase in accrued expenses $81,226,accounts payable of $17,609, offset by an increase in inventoryaccounts receivable of $161,810,$6,490,133, an increase in accounts receivabledeposits and other assets of $1,425,883$1,162,536 and a decrease in accounts payableaccrued expenses of $491,351.$165,931.
LiquidityFinancing Activities
AsIn recent years, we have funded our working capital requirements principally through borrowings under bank lines of December 31, 2008, we own 23,245 sharescredit, term loans, and issuances of common stock of Vyta Corp (“Vyta”). We have classified our investment in Vyta as availableexchange for sale securities in which unrealized gains (losses) are recorded to shareholders’ equity. At December 31, 2008, 2008, all 23,245 shares of Vyta Corp common stock are tradable, and based upon the closing price of $0.05 per share, the market value of the Vyta common shares at December 31, 2008 was $1,162.
debt. To the extent our operations are not sufficient to fund our capital requirements, we may enter into aadditional revolving loan agreementagreements with a financial institution, or attempt to raise additional capital through the sale of additional common or preferred stock or through the issuance of additional debt. To the extent that we raise additional capital or settle existing liabilities through the sale or issuance of equity or convertible debt securities, the ownership interest of our existing stockholders will be diluted, and the terms may include liquidation or other preferences that adversely affect the rights of our stockholders. Debt financing, if available, may involve agreements that include covenants limiting or restricting our ability to take specific actions, such as incurring debt, making capital expenditures or declaring dividends. The current financing environment in the United States is exceptionally challenging and we can provide no assurances that we could raise capital either for operations or to finance an acquisition.
Critical Accounting Policies and Estimates
The preparation of financial statements in conformity with accounting principles generally accepted in the United States requires our management to make assumptions, estimates and judgments that affect the amounts reported in the financial statements, including the notes thereto, and related disclosures of commitments and contingencies, if any. We consider our critical accounting policies to be those that require the more significant judgments and estimates in the preparation of financial statements, including the following:
Principles of Consolidation
The consolidated financial statements include the accounts of the Company, it'sour wholly-owned subsidiaries CLPTEC, Nubao and DAETS and our majority-owned subsidiary Clipper Technology, Ltd. (“CLPTEC”) and it’s indirectly owned subsidiary Clipper-Huali, Ltd. (“Clipper Huali”).Huali. All material intercompany accounts, transactions and profits have been eliminated in consolidation.
Use of Estimates
The preparation of financial statements in conformity with accounting principles generally accepted in the United States of America requires management to make estimates and assumptions that affect the reported amounts of assets and liabilities and disclosure of contingent assets and liabilities at the date of the financial statements and the reported amounts of revenues and expenses during the reporting period. Actual results could differ from those estimates.
Fair Value of Financial Instruments
We follow paragraph 825-10-50-10 of the FASB Accounting Standards Codification (“ASC”) for disclosures about fair value of our financial instruments and paragraph 820-10-35-37 of the FASB Accounting Standards Codification to measure the fair value of our financial instruments. Our financial instruments consist of cash and cash equivalents, trade receivables, prepaid expenses, payables and accrued expenses. The carrying amounts of the Company’s financial assets and liabilities approximate their fair values because of the short maturity of these instruments.Accounts Receivable
Receivables were carried at their estimated collectible amounts. Accounts were periodically evaluated for collectability based on past credit history with customers and their current financial condition and were written off when deemed to be uncollectible. An allowance for doubtful accounts was recorded when management determined the collection was unlikely.
Property and Equipment
Property and equipment are recorded at cost, less accumulated depreciation. Depreciation is provided for using straight-line methods over the estimated useful lives of the respective assets, usually three to seven years.
Stock-Based Compensation
SFAS No. 123, “Accounting for Stock Based Compensation”, defines a fair-value-based methodWe recognize the cost of accounting for stock-based employee compensation plans and transactionsawards in which an entity issues its equity instruments to acquire goods or services from non-employees, and encourages but does not require companies to record compensation cost for stock-based employee compensation plans at fair value.
The Company has chosen to account for employee stock-based compensation usingoperations on a straight-line basis over the intrinsic value method prescribed in Accounting Principles Board Opinion No. 25 (“APB No. 25”), Accounting for Stock Issued to Employees, and related interpretations. Accordingly, employee compensation cost for stock options is measured as the excess, if any,vesting period (if any) of the awards. We measure and recognize compensation expense for all stock-based payment awards made to employees and directors. The compensation expense for our stock-based payments is based on an estimated fair value at the time of the Company’sgrant. We estimate the fair value of stock atbased payment awards on the date of the grant overusing an option pricing model. These option pricing models involve a number of assumptions, including the amount an employee must payexpected lives of stock options, the volatility of the market price of our common stock and interest rates. We are using the Black-Scholes option pricing model. Stock based compensation expense recognized during the period is based on the value of the portion of stock-based payment awards that are ultimately expected to acquirevest. Changes in our assumptions can materially affect the stock.
In December 2004,estimate of the FASB issued SFAS No. 123(R), “Share-Based Payment”, which addressesfair value of stock-based payments and the accounting for share-based payment transactions. SFAS No. 123(R) eliminates the ability to account for share-based compensation transactions using APB 25, and generally requires instead that such transactions be accounted andrelated amount recognized in the statement of operations based on their fair value. SFAS No. 123(R) will be effective for the Company beginning with the first fiscal quarter of the fiscal year ended June 30, 2007. Depending upon the number of and terms of options that may be granted in future periods, the implementation of this standard could have a significant impact on the Company’sour consolidated financial position and results of operations in future periods.statements.
Valuation of Long-Lived Assets
In accordance with SFAS No. 144, "Accounting for the Impairment or Disposal of Long-Lived Assets", weWe periodically evaluate long-lived assets for impairment whenever events or changes in circumstances indicate that the carrying value of an asset may not be recoverable. If the estimated future cash flows (undiscounted and without interest charges) from the use of an asset were less than the carrying value, a write-down would be recorded to reduce the related asset to its estimated fair value. We do not believe that there has been any impairment to long-lived assets as of December 31, 2008.2010.
Statement of Cash Flows
In accordance with SFAS No. 95, "StatementASC 230-10, Statement of Cash Flows"Flows, cash flows from our operations are based upon the local currencies. As a result, amounts related to assets and liabilities reported on the statement of cash flows will not necessarily agree with changes in the corresponding balances on the balance sheet.
Translation Adjustment
The Chinese Renminbi ("RMB"), the national currency of the China, is the primary currency of the economic environment in which our operations are conducted. We use the United States dollar ("U.S. dollars") for financial reporting purposes.
In accordance with SFAS No. 52, “ASC 830-10, Foreign Currency Translation,Matters”, our results of operations and cash flows are translated at the average exchange rates during the period, assets and liabilities are translated at the exchange rates at the balance sheet dates, and equity is translated at the historical exchange rates. As a result, amounts related to assets and liabilities reported on the consolidated statements of cash flows will not necessarily agree with changes in the corresponding balances on the consolidated balance sheets.
Comprehensive Income
Comprehensive income includes accumulated foreign currency translation gains and losses and any accumulated gains or losses attributable to securities held for investment purposes. We have reported the components of comprehensive income on our statements of stockholders’ equity.
Effects of Inflation
Inflation and changing prices have not had a material effect on our business and we do not expect that inflation or changing prices will materially affect our business in the foreseeable future. However, our management will closely monitor the price change and continually maintain effective cost control in operations
Off-Balance Sheet Arrangements
We do not have any off-balance sheet arrangements as defined in Regulation S-K Item 303(a)(4).
Recent Accounting Pronouncements
(See “Recently Issued Accounting Pronouncements” in Note 2 of Notes to the Consolidated Financial Statements.)
ITEM 7A. QUANTITATIVE AND QUALITATIVE DISCLOSURES ABOUT MARKET RISK
Exchange Rate Risk
While our reporting currency is the U.S. dollar, the majority of our consolidated revenues and consolidated costs and expenses are denominated in foreign currency, specifically the Chinese Renminbi (“RMB”)RMB. The majority of our assets are denominated in RMB. As a result, we are exposed to foreign exchange risk as our revenues and results of operations may be affected by fluctuations in the exchange rate between U.S. dollars and the Chinese currencies. If the Chinese currency depreciates against the U.S. dollar, the value of a portion of our revenues, earnings and assets as expressed in our U.S. dollar financial statements will decline. We have not entered into any hedging transactions in an effort to reduce our exposure to foreign exchange risk.
ITEM 8. FINANCIAL STATEMENTS AND SUPPLEMENTARY DATA
The full text of our audited consolidated financial statements as of December 31, 20082010 and 20072009 begins on page F-1 of this annual report.
ITEM 9. CHANGES IN AND DISAGREEMENTS WITH ACCOUNTANTS ON ACCOUNTING AND FINANCIAL DISLCOSURE | CHANGES IN AND DISAGREEMENTS WITH ACCOUNTANTS ON ACCOUNTING AND FINANCIAL DISLCOSURE |
None.
Management’s Report on Internal Control Over Financial Reporting
(a) Evaluation of Disclosure Controls and Procedures
We maintainManagement of the Company with the participation of the Chief Executive Officer and Chief Financial Officer, conducted an evaluation of the effectiveness of the Company’s disclosure controls and procedures that(as such term is defined in Rule 13a-15(e) and Rule 15d-15(e) under the Securities Exchange Act of 1934) pursuant to Rile 13a-15 under the Exchange Act. The Company’s disclosure controls and procedures are designed to ensure that information required to be disclosed by the Company in the reports that we fileit files or submitsubmits under the Exchange Act is recorded, processed, summarized and reported within the time periods specified in the SEC’s rules and forms,on a timely basis and that such information is accumulated and communicated to our management, including ourthe Chief Executive Officer, and Chief Financial Officer as appropriate,and the Company’s Board of Directors, to allow timely decisions regarding required disclosure.
We carried out an evaluation, under the supervision and with the participation of our management, including our Chief Executive Officer and Chief Financial Officer, of the effectiveness of the design and operation of our disclosure controls and procedures (as defined in Rules 13a-15(e) and 15d-15(e) under the Exchange Act) as of the end of our most recent fiscal year. Based upon thisthat evaluation, ourthe Chief Executive Officer and Chief Financial Officer concluded that ourthe Company’s disclosure controls and procedures were effective as of December 31, 2008.2010.
(b) Management’s Annual Report on Internal Control Overover Financial Reporting
Our management is responsible for establishing and maintaining adequate internal control over financial reposting and the assessment of the effectiveness of internal control over financial reporting. As defined by the SEC, internal control over financial reporting as definedis a process designed by, or under the supervision of our principal executive officer and principal financial officer and implemented by our Board of Directors, management and other personnel, to provide reasonable assurance regarding the reliability of financial reporting and the preparation of our financial statements in Exchange Act Rule 13a-15(f). Ouraccordance with U.S. generally accepted accounting principles.
Because of its inherent limitations, internal control over financial reporting may not prevent or detect misstatements. Also, projections of any evaluation of effectiveness to future periods are subject to the risk that controls may become inadequate because of changes in conditions, or that the degree of compliance with the policies or procedures may deteriorate.
It should be noted that the Company’s management, including the Chief Executive Officer and Chief Financial Officer, do not expect that the Company’s internal controls will necessarily prevent all errors or fraud. A control system, no matter how well conceived or operated, can only provide reasonable, not absolute, assurance that the objectives of the control system are met, Further, the design of a control system must reflect the fact that there are resource constraints, and the benefits of controls must be considered relative to their costs.
As of December 31, 2010, we conducted an evaluation of the effectiveness of our internal controlcontrols over financial reporting based on the frameworkcriteria established in Internal Control—Integrated Framework“Internal Control-Integrated Framework” issued by the Committee of Sponsoring Organizations of the Treadway Commission.Commission, or the COSO Framework. Management’s assessment included an evaluation of the design of our internal control over financial reporting and testing of the operational effectiveness of those controls.
A material weakness is defined within the Public Company Accounting Oversight Board’s Auditing Standard No. 5 as a deficiency, or a combination of deficiencies, in internal control over financial reporting, such that there is a reasonable possibility that a material misstatement of the Company’s annual or interim financial statements will not be prevented or detected on a timely basis. Based onupon this evaluation, ourassessment, management concluded that our internal control over financial reporting was effective as of December 31, 2008. 2010.
This Annual Report on Form 10-Kannual report does not include an attestation report of ourthe Company’s independent registered public accounting firm regarding internal control over financial reporting. Management’s reportThe Company’s internal controls over financial reporting was not subject to attestation by ourthe Company’s independent registered public accounting firm pursuant to temporary rules of the Securities and Exchange CommissionSEC that permit usthe Company to provide only management’s report in this Annual Report on Form 10-K.annual report.
(c) Changes in Internal Control Overover Financial Reporting
No changeThere were no changes in our internal control over financial reporting (as defined in Rules 13a-15(f) and 15d-15(f) under the Exchange Act)that occurred during the fourthlast fiscal quarter of 2008 that hashave materially affected, or isare reasonably likely to materially affect, our internal control over financial reporting.
None.
ITEM 10. DIRECTORS, EXECUTIVE OFFICERS AND OFFICERS OF THE COMPANYCORPORATE GOVERNANCE
The following table sets forth information with respect to the sole executive officers and directors of the Company as of March 31, 2009:2011:
| Name and Age | Position | Date of Appointment |
| | | |
John T. Verges (40)James Jiang, PhD (57) | President & Chief Executive Officer | October 18, 2006 to JuneFebruary 1, 2008 |
| | 2010 |
Paul K. Danner (51)(53) | President & Chief Executive Officer, Director | JuneJuly 1, 2008 |
| | to February 1, 2010 |
Philip J. Rauch (48)(50) | Chief Financial Officer, Director | October 18, 2006 |
| | |
Philip Verges (43)(45) | DirectorChairman | October 18, 2006 |
| | |
Bruce Noller (51) | Director | October 18, 2006 to
March 3, 2008
|
Committees of the Board of Directors
We presently do not have an audit committee, compensation committee, nominating committee, an executive committee of itsour board of directors, stock plan committee or any other committees.
Biographical Information on Officers and Directors
John T. Verges.James Jiang, PhD. Mr. VergesDr. James Jiang was appointed Chief Executive Officer of the Company on February 1, 2010. Dr, Jiang was previously the Managing Director of Clipper Technology, Ltd., a wholly-owned subsidiary of the Company. Dr. Jiang has over 18 years of senior executive management experience in the information technology and wireless industries. His management resume includes posts with various multinational firms including British Telecom Laboratory, Telular Corp, Singapore Technologies and GaozhiSoft, Inc. Dr. Jiang has extensive knowledge of GSM/GPRS systems and architecture, 3G wireless communications and Internet technologies. In 1996, he developed and launched AirTrak, China's first e-commerce service to deliver commerce information from the Internet via a wireless network, and was the Chief Executive OfficerArchitect of a dynamic web content cache engine and President of the Company from October 2006 through June 2008. Mr. Vergesmobile application platform. Dr. Jiang holds two patents in Viterbi Decoding and Dynamic Contents Extraction, and is a Bachelor of Science in Management Information Systems from the University of Texas at Dallas where he graduated Summa Cum Laude. In addition, he later earned a Masters of Business Administration in Finance from the University of Texas at Dallas, graduating with high honors. Mr. Verges served on active duty in the United States Navy for five years as a Naval Officer and Aviator. After completing his active duty commitment, Mr. Verges remained on reserve status for ten additional years and worked in the private sector with several large and small emerging technology firms.World Bank Scholar.
Paul K. Danner. On March 3, 2008, Mr. Danner was appointed to the Board of Directors of the Company. He was electedappointed President &and Chief Executive Officer of the Company by the Board of Directors effective July 1, 2008. He resigned as Chief Executive Officer effective February 1, 2010. Mr. Danner previously served as the Chairman and Chief Executive Officer of Paragon Financial Corporation.Corp., a financial services firm from 2001 to 2007since June 2002 . He held various other positions with that company including as Chief Executive Officer during two separate occasions. From 1998 to 20002001 Mr. Danner was employed in various roles at MyTurn.com, Inc., including as Chief Executive Officer. From 1996 to 1997 Mr. Danner was the managing partner of Technology Ventures, a consulting firm. From 1985 to 19971996 he held various executive-level and sales & marketing positions with a number of technology companies including NEC Technologies and Control Data Corporation. Mr. Danner previously served on active duty with the United States Navy where he flew the F-14 Tomcat. He is currently affiliated withrecently retired from the United States Navy Reserve where he holdsafter 30 years of total service with the rank of Captain and serves as the Director, Strategic Communications for the Naval Air Systems Command Reserve Program. Mr. Danner earned a Bachelor of Science degree in Business Finance from Colorado State University in 1979, and a Master of Business Administration degree from Old Dominion University in 1996.Captain.
Philip J. Rauch. On October 18, 2006, Mr. Rauch was appointed the Chief Financial Officer and a Director of the Company. Mr. Rauch is the Chief Financial Officer and a Director of NewMarket Technology, Inc., athe majority stockholder of the Company. Mr. Rauch holds a Bachelor of Science in Economics degree with honors from the University of Pennsylvania Wharton School of Business, with a concentration in finance and accounting. From February 2004 to February 2007, Mr. Rauch served as the Chief Operating and Financial Officer of Defense Technology Systems, Inc. Beginning in 1997, Mr. Rauch served in a senior capacity at AboveNet, Inc. (formerly Metromedia Fiber Network, Inc.) as Vice President, Business Operations, and later as Controller. From 1993 to 1997, Mr. Rauch was Vice President and Chief Financial Officer of Columbus Construction. From 1989 to 1993, he was Vice President and Chief Financial Officer of F. Garofalo Electric Co., an engineering and construction company.
Philip Verges.Verges. On October 18, 2006, Mr. Verges was appointed to the Board of Directors of the Company. Mr. Verges is the Chief Executive Officer and Chairman of NewMarket Technology, Inc., the majority shareholder of the Company. Mr. Verges is a 1988 graduate of the United States Military Academy. His studies at West Point centered on national security. Mr. Verges served with distinction as a U.S. Army Captain in a wide variety of important engagements to include research and development of counterterrorism communication technologies and practices. Mr. Verges' early career after the Army includes time in the Computer Sciences Research and Development Department of General Motors as well as experience teaching systems engineering methodology and programming to Electronic Data Systems ("EDS") employees from 1991 to 1995.employees. Mr. Verges' first business start-up experience was at EDS in a new division concentrating on call center technology in financial institutions. Later in 1995, he added to his start-up experience at a $30 million technology services business with the responsibility to open a new geographic region with a Greenfield operation. Mr. Verges founded NewMarket Technology in 1997.
Bruce Noller. Mr. Bruce Noller served as a director of the Company from October 18, 2006 through March 3, 2008. Mr. Noller is currently the President of Managed Services at NewMarket Technology, Inc. Prior to becoming part of NewMarket Technology senior management, Mr. Noller was the President of Noller & Associates, Inc., Mr. Noller brings to the Board over 25 years of Financial, Operational and Marketing experience. Before he founded his own firm in 1994, he served as Vice President for Integrated Control Systems, a worldwide management consulting firm. During that time, Mr. Noller proposed and oversaw engagements with a variety of industries including healthcare, distribution, manufacturing, retail, banking, insurance, mining and telecommunications. Mr. Noller has International management consulting experience in Singapore, Malaysia, China, Canada, Latin America and Europe.
Section 16(a) Beneficial Ownership Reporting Compliance
Section 16(a) of the Securities Exchange Act of 1934 requires that our executive officers, directors and 10% stockholders file reports of securities ownership and changes in ownership with the Securities and Exchange Commission. Officers, directors and 10% owners also are required to furnish us with copies of all Section 16(a) forms they file.
Based solely on our review ofDuring the copies of the Section 16(a) forms received by us, or written representations from certain reporting persons, we believe that, during the last fiscal year all Section 16(a) filing requirements applicable ourended 2010, the following officers and directors and greater than 10%, beneficial owners were complied with.failed to file their Form 3 by the due that thereof: James Jiang.
Code of Ethics
We haveOur Board of Directors has adopted a corporate codeCode of ethics that applies to our chief executive officerBusiness Conduct and our chief financial officer.Ethics. A copy of the code of ethics is filed as an exhibit to this Form 10-K. We believe our code of ethics is reasonably designed to deter wrongdoing and promote honest and ethical conduct; provide full, fair, accurate, timely and understandable disclosure in public reports; comply with applicable laws; ensure prompt internal reporting of code violations; and provide accountability for adherence to the code.
ThisThe following table summarizessets forth the before-tax compensation forearned by our named Executive Officers during the Chief Executive Officerlast two fiscal years and Chief Financial Officerother officers who were our only executive officersreceived compensation in excess of $100,000 during any of the last two fiscal 2008.years. In accordance with Item 402(a)(5), we have omitted certain columns from the table required by Item 402(c).
| | Annual Compensation Long Term Compensation | | |
| | | Awards Payouts
| | | | | | | | | | | | Name and Principal Position | Year | | Salary $ | | | Stock Grant $ | | | Total $ | | | | | | | | | | | | | | | James Jiang, PhD, | 2010 | | $ | 90,300 | | | $ | - | | | $ | 90,300 | | | President & CEO (1) | 2009 | | $ | - | | | $ | - | | | $ | - | | | Paul K. Danner, | 2010 | | $ | 12,500 | | | $ | - | | | $ | 12,500 | | | President & CEO (2) | 2009 | | $ | 150,000 | | | $ | - | | | $ | 150,000 | | | Philip J. Rauch, CFO | 2010 | | $ | 75,000 | | | $ | - | | | $ | 75,000 | | | | 2009 | | $ | 75,00 | | | $ | - | | | $ | 75,000 | |
| | | |
| | | | | | |
Name & Principal
Position
| Year | Salary
($)
| Bonus
($)
| Other Annual Compensation
($)
| Restricted
Stock Awards ($)
| Securities
Underlying
Options (#)
| LTIP
Payouts
($)
| All Other
Compensation
($)
|
John T. Verges
President & CEO(1)
| 2007
2008
| $100,000
$50,000
| $-0-
$-0-
| $-0-
$-0-
| -0-
-0-
| -0-
-0-
| -0-
-0-
| -0-
-0-
|
| | | | | | | | |
Paul K. Danner
President & CEO(2)
| 2007
2008
| $ -0-
$ 87,500
| $-0-
$-0-
| $-0-
$-0-
| -0-
-0-
| -0-
-0-
| -0-
-0-
| -0-
-0-
|
| | | | | | | | |
Philip J. Rauch
CFO
| 2007
2008
| $ 50,000
$ 50,000
| $-0-
$-0-
| $-0-
$-0-
| -0-
-0-
| -0-
-0-
| -0-
-0-
| -0-
-0-
|
(1) Mr. Verges resigned as President and Chief Executive Officer in June 2008.
(2) Mr. DannerDr. Jiang was appointed President and Chief Executive Officer effective JulyFebruary 1, 2008.2010.
(2) Mr. Danner resigned as President and Chief Executive Officer effective February 1, 2010.
The foregoing compensation table does not include certain fringe benefits made available on a nondiscriminatory basis to all our employees such as group health insurance, dental insurance, long-term disability insurance, vacation and sick leave. In addition, we make available certain non-monetary benefits to our executive officers with a view to acquiring and retaining qualified personnel and facilitating job performance. We consider such benefits to be ordinary and incidental business costs and expenses. The aggregate value of such benefits in the case of each executive officer listed in the above table, which cannot be precisely ascertained but which is less than 10% of the cash compensation paid to each such executive officer, is not included in such table.
Option/SAR Grants
NoWe did not grant any stock options were grantedor stock appreciation rights to our named executive officers in the last fiscal year.. We did not make any award to any named executive officer under any long-term incentive plan in the last fiscal year. We did not reprice any options or stock appreciation rights during the last fiscal years endedyear. Our executive officers did not have any unexercised options, stock that was not vested or equity incentive plan awards as of December 31, 2008 and 2007.
Aggregated Option/SAR Exercises in Last Fiscal Year
No options were exercised during the fiscal years ended December 31, 2008 and 2007.2010.
Employment Agreements
We do not have any employment agreements in place with our officers at this time.officers.
Director Compensation
We do not provide for any compensation to members of our Board of Directors.
ITEM 12. SECURITY OWNERSHIP OF CERTAIN BENEFICIAL OWNERS AND MANAGEMENT
The following table sets forth as of December 31, 2008,2010, certain information regarding beneficial ownership of the common stock held by each person known by us to own beneficially more than 5% of the common stock, each of our directors, each of the executive officers named in the Summary Compensation Table, and all of our executive officers and directors as a group.
| Name of Beneficial Owner | | Number of Shares of Common Stock | | | % of Common Stock Issued and Outstanding (1) | | | Number of Shares of Series D Preferred Stock (2) | | | % of Series D Preferred Stock Issued and Outstanding | | | % of All Voting Shares (3) | |
| | | | | | | | | | | | | | | | |
All current officers and directors (4) | | | 0 | | | | 0 | % | | | 0 | | | | 0 | % | | | 0 | % |
NewMarket Technology, Inc. (5) | | | 25,000,000 | (6) | | | 2 | % | | | 5,000 | (7) | | | 100 | % | | | 53 | % |
| (1) | Based on 1,493,641,196 shares of common stock outstanding on December 31, 2010 and the conversion of 10,000 shares of Series C Convertible Preferred shares into 25,000,000 shares of the common stock of the Company. |
| (2) | Based on 5,000 shares of Series D Preferred Super Majority Voting Stock issued and outstanding, which are deemed to be the equivalent of 51% of all shares of common stock represented at and entitled to vote at any shareholder meeting of the Company. |
| (3) | Based on 1,493,641,196 shares of common stock outstanding on December 31, 2010, the conversion of 10,000 Series C Convertible Preferred shares eligible for conversion and the Series D Preferred Stock being able to vote 51% of all shares of common stock issued and outstanding. |
| (4) | Messrs. Jiang, Rauch and Verges, the Company’s officers and directors, do not own any common stock or options exercisable into the common stock of the Company as of December 31, 2010. This does not include shares of the Company held by NewMarket Technology, Inc., which Messrs. Verges and Rauch are officers and directors of. |
| (5) | NewMarket Technology, Inc.’s address is 14860 Montfort Drive, Suite 210, Dallas, Texas 75254. |
| (6) | NewMarket Technology, Inc. is the holder of all 10,000 outstanding shares of the Company’s Series C Convertible Preferred Shares, which are eligible for conversion into 25,000,000 shares of the common stock of the Company. The shares held by NewMarket Technology, Inc. are voted by Mr. Bruce Noller, the Chief Executive Officer of NewMarket Technology, Inc. |
| (7) | NewMarket Technology is the holder of all 5,000 outstanding shares of the Company’s Series D Convertible Preferred Shares, (with a voting equivalent to 51% of the issued and outstanding common shares) which provides for the holder of the Series D Preferred Shares to vote as a majority of the total issued and outstanding common stock of the Company. The shares held by NewMarket Technology, Inc. are voted by Mr. Bruce Noller, the Chief Executive Officer of NewMarket Technology, Inc. |
| Name and Address of Beneficial Owner | | Number of Shares | | % of Outstanding(3) |
| | | | | | | |
NewMarket Technology, Inc. 14860 Montfort Drive, Suite 210 Dallas, TX 75254 | | | 106,481,993 | (1) | | | 61.1 | % |
| | | | | | | | | |
All officers and directors as a group (4 persons) | | | 0 | (2) | | | 0.0 | % |
(1) Includes 250,000 shares of our Series A Preferred Stock. The shares have a par value of $0.001 per share and a purchase price of $1.00 per share and bear no dividend. The shares are convertible into 60% of the issued and outstanding common stock of the Company, any time after August 31, 2007. At December 31, 2008, these shares would be convertible into 104,481,993 common shares.
(2) Messrs. Danner, Rauch and Verges, our officers and directors, do not own any common stock, options or warrants exercisable into the common stock of the Company on December 31, 2008. This does not include shares of the Company held by NewMarket Technology, Inc., which Messrs. Verges and Rauch are officers of.
(3) Based on 69,654,662 shares of common stock issued and outstanding on December 31, 2008 and assuming the conversion of the 250,000 shares of Series A Preferred Stock into 104,481,993 shares of common stock, there would be 174,136,655 shares outstanding.
ITEM 13. CERTAIN RELATIONSHIPS AND RELATED TRANSACTIONS, AND DIRECTOR INDEPENDENCE
Certain Relationships and Related Transactions
In October 2006, NewMarket China, Inc.the Company, at the time a wholly-owned subsidiary of NewMarket Technology, Inc. executed an Agreement and Plan of Reorganization (“the Agreement”(the “Agreement”) with the Intercell International Corporation (“Intercell”). The Agreement provided for all of the issued and outstanding stock of NewMarket China, Inc.,the Company, one thousand (1,000) shares held by NewMarket Technology, to be exchanged for two million (2,000,000) restricted common shares of Intercell. As a result of the Agreement, NewMarket Chinawe became the wholly-owned subsidiary of Intercell.
In a separate agreement, NewMarket Technology agreed to purchase 250,000 shares of a Series A Preferred Stock from Intercell for $250,000. The shares have a par value of $0.001 per share and a purchase price of $1.00 per share and bear no dividend. The shares are convertible into 60% of the issued and outstanding common stock of the Company, any time after August 31, 2007. The shares have a voting right equal to 60% of our issued and outstanding common stock. In November 2009, we entered into an Equity Reorganization Agreement with NewMarket Technology under which NewMarket Technology exchanged its 250,000 shares of Series A Preferred Stock for the issuance of 10,000 shares of Series C Convertible Preferred Stock and 5,000 shares of Series D Preferred Stock of the Company.
Director Independence
The Board of Directors currently consists of two directors. The Company’s board of directors has determined that there were no “independent” directors during 2010 as such term is defined by a national securities exchange or an inter-dealer quotation system.
ITEM 14. PRINCIPAL ACCOUNTANT FEES AND SERVICES
Summarized below is the aggregate amount of various professional fees billed by our principal accountants, Pollard-Kelley Auditing Services Inc. (“PKASI”)Hamilton, PC in 20082010 and 2007:2009, respectively:
| | | | | | | |
| | | 2008 | | | 2007 | |
| | | | | | | |
| | | | | | | |
| Audit fees | | $ | 31,796 | | | $ | 18,000 | |
| Tax fees | | | 0 | | | | 0 | |
| | | | | | | | | |
| Total: | | $ | 31,796 | | | $ | 18,000 | |
| | | 2010 | | | 2009 | |
| | | | | | | | | |
| Audit fees | | $ | 33,500 | | | $ | 20,000 | |
| Audit-related fees | | | | | | | | |
| Tax fees | | | 0 | | | | 0 | |
| All other fees | | | 0 | | | | 0 | |
| Total: | | $ | 33,500 | | | $ | 20,000 | |
ITEM 15. EXHIBITS AND FINANCIAL STATEMENT SCHEDULES
(a) Financial Statements
The following financial statements of the Company and the related report of Independent Registered Public Accounting Firm thereon are set forth immediately following the Index of Financial Statements which appears on page F-1 of this report:
Report of Independent Registered Public Accounting Firm Report
Consolidated Balance Sheets as of December 31, 20082010 and 20072009
Consolidated Statements of Operations for the years ended December 31, 2008, 20072010 and 20062009
Consolidated Statements of Stockholders' Equity for the years ended December 31, 2008, 20072010 and 20062009
Consolidated Statements of Cash Flows for the years ended December 31, 2008, 20072010 and 20062009
Notes to Consolidated Financial Statements
(b) Financial Statement Schedules
All schedules are omitted as the required information is inapplicable or the information is presented in the consolidated financial statements or related notes.
(c) Exhibits
| Exhibit No. | Description |
| | | |
| 22 | Agreement for Purchase of Ownership Interest, dated |
| | October 20, 2003, by and between Brunetti DEC, LLC and the Company. |
| 4.15 | Certificate of Designation of Series A Convertible Preferred Stock |
| 4.27 | Certificate of Designation of Series B Convertible Preferred Stock |
| 4.38 | Certificate of Designation of Series C Convertible Preferred Stock |
| 4.48 | Certificate of Designation of Series D Convertible Preferred Stock |
| 10.11 | 1995 Compensatory Stock Option Plan. |
| 10.43 | Code of Ethics |
| 10.54 | Agreement and Plan or Reorganization between Intercell International Corp., NewMarket China, Inc. and NewMarket Technology, Inc., dated August 7, 2007. |
| 10.65 | Stock Purchase Agreement between Intercell International Corp. and NewMarket Technology, Inc. dated August 21, 2007. |
| 10.78 | Equity Reorganization Agreement By and Between China Crescent Enterprises, Inc. and NewMarket Technology, Inc., dated November 16, 2009. |
| 216 | List of Subsidiaries of Intercell International Corporation |
| 31* | Certifications pursuant to Section 302 of the Sarbanes-Oxley Act |
| 32* | Certifications pursuant to Section 906 of the Sarbanes-Oxley Act |
| | |
*Filed herewith. |
| | |
1. | Incorporated by reference to the Company's Registration Statement on Form S-8, Registration No. 333-67742, and effective August 16, 2001. |
2. | Current Report on Form 8-K, dated October 20, 2003. |
3. | Form 10-KSB for the fiscal year ended September 30, 2003. |
4. | Current Report on Form 8-K, dated August 11, 2007. |
5. | Current Report on Form 8-K, dated August 24, 2007. |
6. 6.
| Form 10-KSB for the fiscal year ended December 31, 2006. |
| 7. | Current Report on Form 8-K, dated March 31, 2009 |
| 8. | Form 10-K for the fiscal year ended December 31, 2009 |
In accordance withPursuant to the requirements of Section 13 or Section 15(d) of the Securities Exchange Act of 1934, the Registrant has duly caused this report to be signed on its behalf by the undersigned, thereunto duly authorized.
China Crescent Enterprises, Inc.
(Registrant)
Date: March 31, 2009April 15, 2011 | |
| | | |
| | | | |
| By: | By: /s/ Paul K. Danner | /s/ James Jiang | |
| | Paul K. Danner | | |
| | President and | Chief Executive Officer | |
| | | | |
| | | |
Date: March 31, 2009April 15, 2011 | |
| | | |
| | | | |
| By: | By: /s/ | /s/ Philip J. Rauch | |
| | Philip J. Rauch | |
| | | Chief Financial Officer | |
| | (principal financial and accounting officer) | |
In accordance withPursuant to the requirements of the Securities Exchange Act of 1934, this report has been signed below by the following persons on behalf of the registrant and in the capacities and on the dates indicated.
/s/ Paul K. DannerJames Jiang | | President and | March 31, 2009April 15, 2011 |
Paul K. Danner James Jiang, PhD | | Chief Executive Officer | |
| | | |
| /s/ Philip J. Rauch | | Chief Financial Officer and | March 31, 2009April 15, 2011 |
| Philip J. Rauch | | Director | |
| | | |
| /s/ Philip M. Verges | Director | March 31, 2009Chairman of the Board | April 15, 2011 |
| Philip M. Verges | | | |
REPORT OF INDEPENDENT REGISTERED PUBLIC ACCOUNTING FIRM
The Board of Directors and Stockholders of
China Crescent Enterprises, Inc. and Subsidiaries
Dallas, Texas
We have audited the accompanying consolidated balance sheetsheets of China Crescent Enterprises, Inc. and subsidiaries as of December 31, 20082010 and 2007,2009, and the related consolidated statements of operations and comprehensive income, stockholders’ equity and cash flows for each of the two years then ended.in the period ended December 31, 2010. These consolidated financial statements are the responsibility of the Company’s management. Our responsibility is to express an opinion on these financial statements based on our audit.
We conducted our audit in accordance with standards of the Public Company Accounting Oversight Board (United States). Those standards require that we plan and perform the audit to obtain reasonable assurance about whether the financial statements are free of material misstatement. The Company is not required to have, nor were we engaged to perform, an audit of its internal control over financial reporting. Our audit included consideration of internal control over financial reporting as a basis for designing audit procedures that are appropriate in the circumstances, but not for the purpose of expressing an opinion on the effectiveness of the Company’s internal control over financial reporting. Accordingly, we express no such opinion. An audit also includes examining, on a test basis, evidence supporting the amounts and disclosures in the financial statements. An audit also includesstatements, assessing the accounting principles used and significant estimates made by management, as well as evaluating the overall presentation of the financial statement presentation.statements. We believe that our audits provide a reasonable basis for our opinion.
In our opinion, the consolidated financial statements referred to above present fairly, in all material respects, the financial position of China Crescent Enterprises, Inc. and subsidiaries as of December 31, 20082010 and 2007,2009, and the results of operations and cash flows for each of the two years then ended in the period ended December 31, 2010, in conformity with accounting principles generally accepted in the United States of America.
| | /s/ Pollard-Kelley Auditing Services, Inc.Hamilton, PC | |
| | Pollard-Kelley Auditing Services, Inc.Hamilton, PC | |
Independence, Ohio
March 30, 2009
Denver, Colorado
April 15, 2011
|
| Consolidated Balance Sheet |
| | | | | | | |
| ASSETS | | December 31, 2008 | | | December 31, 2007 | |
| CURRENT ASSETS | | | | | | |
| Cash and cash equivalents | | $ | 2,600,498 | | | $ | 1,488,774 | |
| Accounts receivable | | | 4,238,294 | | | | 3,674,523 | |
| Inventory | | | 1,858,233 | | | | 1,582,734 | |
| Supplier advances and prepaid expenses | | | 787,149 | | | | 305,723 | |
| Advances to affiliate | | | 687,567 | | | | - | |
| Assets of discontinued operations | | | 9,377 | | | | 9,377 | |
| Other current assets | | | 68,840 | | | | 49,804 | |
| Total current assets | | | 10,249,958 | | | | 7,110,935 | |
| | | | | | | | | |
| PROPERTY AND EQUIPMENT, NET | | | 93,185 | | | | 95,171 | |
| INTANGIBLE ASSETS | | | 2,993 | | | | 3,167 | |
| | | | | | | | | |
| Total assets | | $ | 10,346,136 | | | $ | 7,209,273 | |
| | | | | | | | | |
| | | | | | | | | |
| LIABILITIES, STOCKHOLDERS' EQUITY AND MINORITY INTEREST | | | | | |
| CURRENT LIABILITIES | | | | | | | | |
| Accounts payable | | $ | 1,573,643 | | | $ | 2,057,733 | |
| Short-term borrowing | | | 1,798,542 | | | | 584,046 | |
| Accrued expenses and other liabilities | | | 445,258 | | | | 365,468 | |
| Advances from affiliate | | | - | | | | 334,124 | |
| Liabilities of discontinued operations | | | 308,683 | | | | 308,683 | |
| Total current liabilities | | | 4,126,126 | | | | 3,650,054 | |
| | | | | | | | | |
| Long-term debt | | | 151,041 | | | | 0 | |
| | | | | | | | | |
| Total liabilities | | | 4,277,167 | | | | 3,650,054 | |
| | | | | | | | | |
| Minority interest in subsidiaries | | | 1,612,763 | | | | 999,444 | |
| | | | | | | | | |
| | | | | | | | | |
| STOCKHOLDERS' EQUITY | | | | | | | | |
| Common stock; $.001 par value; 200,000,000 shares authorized; | | | | | | | | |
| 69,654,662 and 26,754,662 shares issued and outstanding | | | | | | | | |
| at December 31, 2008 and 2007, respectively | | | 69,654 | | | | 26,754 | |
| Preferred stock; $.001 par value; 20,000,000 shares authorized; | | | | | | | | |
| 250,000 shares Series A issued and outstanding | | | | | | | | |
| at December 31, 2008 and 2007, respectively | | | 250 | | | | 250 | |
| Additional paid-in capital | | | 2,173,110 | | | | 1,451,510 | |
| Accumulated comprehensive income | | | 820,699 | | | | 327,087 | |
| Retained earnings | | | 1,392,493 | | | | 754,174 | |
| Total stockholders' equity | | | 4,456,206 | | | | 2,559,775 | |
| | | | | | | | | |
| Total liabilities and stockholders' equity | | $ | 10,346,136 | | | $ | 7,209,273 | |
| | | | | | | | | |
| See accompanying notes to consolidated financial statements. | | | | | | | | |
|
| Consolidated Statement of Operations |
| Year ended December 31, |
| | | | | | | | | | |
| | | 2008 | | | 2007 | | | 2006 | |
| REVENUE | | $ | 41,877,584 | | | $ | 40,007,006 | | | $ | 29,509,968 | |
| | | | | | | | | | | | | |
| COST OF SALES | | | 39,538,508 | | | | 38,211,067 | | �� | | 28,237,125 | |
| | | | | | | | | | | | | |
| Gross Margin | | | 2,339,076 | | | | 1,795,939 | | | | 1,272,843 | |
| | | | | | | | | | | | | |
| OPERATING EXPENSES | | | | | | | | | | | | |
| Selling, general and administrative expenses | | | 1,064,491 | | | | 1,085,982 | | | | 714,678 | |
| Depreciation and amortization | | | 16,332 | | | | 38,900 | | | | 28,414 | |
| Total expenses | | | 1,080,823 | | | | 1,124,882 | | | | 743,092 | |
| | | | | | | | | | | | | |
| Income from operations | | | 1,258,253 | | | | 671,057 | | | | 529,751 | |
| | | | | | | | | | | | | |
| OTHER INCOME (EXPENSE) | | | | | | | | | | | | |
| Gain on sale of fixed assets | | | - | | | | 303,631 | | | | - | |
| Interest income | | | 463 | | | | 8 | | | | 20,076 | |
| Interest expense | | | (193,095 | ) | | | (57,996 | ) | | | (80,645 | ) |
| Other income | | | 233,280 | | | | 82,799 | | | | 91,592 | |
| Other expense | | | (6,694 | ) | | | (8,827 | ) | | | (19,137 | ) |
| Total other income (expense) | | | 33,954 | | | | 319,615 | | | | 11,886 | |
| | | | | | | | | | | | | |
| Net income before income tax (credit) and | | | | | | | | | | | | |
| minority interest | | | 1,292,207 | | | | 990,672 | | | | 541,637 | |
| Foreign income tax | | | (40,602 | ) | | | (132,202 | ) | | | (51,700 | ) |
| Minority interest in consolidated subsidiary | | | (613,286 | ) | | | (420,646 | ) | | | (245,008 | ) |
| | | | | | | | | | | | | |
| Net income | | | 638,319 | | | | 437,824 | | | | 244,929 | |
| Other comprehensive income (loss) | | | | | | | | | | | | |
| (Loss) on investment security | | | (4,184 | ) | | | (1,109 | ) | | | - | |
| Foreign currency translation gain (loss) | | | 497,796 | | | | 473,056 | | | | (114,214 | ) |
| | | | | | | | | | | | | |
| Comprehensive income | | $ | 1,131,931 | | | $ | 909,771 | | | $ | 130,715 | |
| | | | | | | | | | | | | |
| Income per weighted-average common share-basic | | $ | 0.02 | | | $ | 0.02 | | | $ | 0.01 | |
| Income per weighted-average common share-diluted | | $ | 0.01 | | | $ | 0.01 | | | $ | 0.00 | |
| | | | | | | | | | | | | |
| Number of weighted average common shares o/s-basic | | | 39,187,237 | | | | 22,619,875 | | | | 24,180,479 | |
| Number of weighted average common shares o/s-diluted | | | 97,968,093 | | | | 70,463,479 | | | | 66,371,198 | |
| | | | | | | | | | | | | |
| See accompanying notes to consolidated financial statements. | | | | | | | | | | | | |
| China Crescent Enterprises, Inc. | |
| Consolidated Balance Sheet | |
| | | | | | | |
| ASSETS | | December 31, 2010 | | | December 31, 2009 | |
| CURRENT ASSETS | | | | | | |
| Cash and cash equivalents | | $ | 2,149,733 | | | $ | 3,977,382 | |
| Accounts receivable | | | 13,441,035 | | | | 6,950,902 | |
| Inventory | | | 1,973,101 | | | | 2,751,131 | |
| Supplier advances and prepaid expenses | | | 2,951,443 | | | | 1,804,015 | |
| Advances to affiliate | | | 5,300,000 | | | | 2,000,000 | |
| Assets of discontinued operations | | | 9,377 | | | | 9,377 | |
| Other current assets | | | 162,721 | | | | 147,613 | |
| Total current assets | | | 25,987,410 | | | | 17,640,420 | |
| | | | | | | | | |
| PROPERTY AND EQUIPMENT, NET | | | 168,869 | | | | 160,907 | |
| GOODWILL | | | 1,820,267 | | | | - | |
| INTANGIBLE ASSETS | | | 2,201 | | | | 2,597 | |
| | | | | | | | | |
| Total assets | | $ | 27,978,747 | | | $ | 17,803,924 | |
| | | | | | | | | |
| | | | | | | | | |
| LIABILITIES AND EQUITY | | | | | | | | |
| CURRENT LIABILITIES | | | | | | | | |
| Accounts payable | | $ | 1,222,225 | | | $ | 1,204,616 | |
| Short-term borrowing | | | 3,648,199 | | | | 1,897,069 | |
| Accrued expenses and other liabilities | | | 762,592 | | | | 563,661 | |
| Liabilities of discontinued operations | | | 215,243 | | | | 308,683 | |
| Total current liabilities | | | 5,848,259 | | | | 3,974,029 | |
| | | | | | | | | |
| Long-term debt | | | 386,414 | | | | 500,000 | |
| | | | | | | | | |
| Total liabilities | | | 6,234,673 | | | | 4,474,029 | |
| | | | | | | | | |
| | | | | | | | | |
| EQUITY | | | | | | | | |
| Common stock; $.001 par value; 3,000,000,000 shares authorized; | | | | | | | | |
| 1,493,641,196 and 234,370,600 shares issued and outstanding | | | | | | | | |
| at December 31, 2010 and 2009, respectively | | | 1,493,641 | | | | 234,371 | |
| Preferred stock; $.001 par value; 20,000,000 shares authorized; | | | | | | | | |
| Series C 10,000 and 10,000; Series D 5,000 and 5,000 shares | | | | | | | | |
| issued and outstanding at December 31, 2010 and | | | | | | | | |
| December 31, 2009, respectively | | | 15 | | | | 15 | |
| Additional paid-in capital | | | 8,680,611 | | | | 5,950,581 | |
| Accumulated comprehensive income | | | 973,004 | | | | 739,511 | |
| Retained earnings | | | 7,956,899 | | | | 3,755,468 | |
| Total China Crescent Enterprises, Inc. stockholders' equity | | | 19,104,170 | | | | 10,679,946 | |
| Noncontrolling interest | | | 2,639,904 | | | | 2,649,949 | |
| Total equity | | | 21,744,074 | | | | 13,329,895 | |
| | | | | | | | | |
| | | | | | | | | |
| Total liabilities and equity | | $ | 27,978,747 | | | $ | 17,803,924 | |
| | | | | | | | | |
| See accompanying notes to consolidated financial statements. | | | | | | | | |
|
| Consolidated Statement of Stockholders' Equity |
| | | | | | | | | | | | | | | | | | | | | | | | | |
| | | | | | | | | | | | | | | Additional | | | Accumulated | | | Retained | | | Total | |
| | | Number of Shares | | | Par Value of Stock | | | Paid-In | | | Comprehensive | | | Earnings/ | | | Stockholders' | |
| | | Preferred | | | Common | | | Preferred | | | Common | | | Capital | | | Income/(Loss) | | | (Accum. Deficit) | | | Equity | |
BEGINNING BALANCE, December 31, 2005 | | | - | | | | 23,836,323 | | | $ | - | | | $ | 23,836 | | | $ | 38,743,834 | | | $ | 18,892 | | | $ | (39,121,430 | ) | | $ | (334,868 | ) |
| Contribution of officer services | | | | | | | | | | | | | | | | | | | 6,000 | | | | | | | | | | | | 6,000 | |
| Sale of convertible preferred stock for cash | | | 250,000 | | | | | | | | 250 | | | | | | | | 249,750 | | | | | | | | | | | | 250,000 | |
| Issuance of shares for purchase of subsidiary | | | | | | | 2,000,000 | | | | | | | | 2,000 | | | | | | | | | | | | | | | | 2,000 | |
| Issuance of shares due to warrant exercise | | | | | | | 107,110 | | | | | | | | 107 | | | | | | | | | | | | | | | | 107 | |
| Other comprehensive income (loss) | | | | | | | | | | | | | | | | | | | | | | | (114,214 | ) | | | | | | | (114,214 | ) |
| Net income | | | | | | | | | | | | | | | | | | | | | | | | | | | 244,929 | | | | 244,929 | |
| Adjustments due to reorganization | | | | | | | | | | | | | | | | | | | (37,547,263 | ) | | | (49,538 | ) | | | 39,192,851 | | | | 1,596,050 | |
BALANCE, December 31, 2006 | | | 250,000 | | | | 25,943,433 | | | | 250 | | | | 25,943 | | | | 1,452,321 | | | | (144,860 | ) | | | 316,350 | | | | 1,650,004 | |
| Issuance of shares due to warrant exercise | | | | | | | 811,229 | | | | | | | | 811 | | | | (811 | ) | | | | | | | | | | | - | |
| Other comprehensive income | | | | | | | | | | | | | | | | | | | | | | | 471,947 | | | | | | | | 471,947 | |
| Net income | | | | | | | | | | | | | | | | | | | | | | | | | | | 437,824 | | | | 437,824 | |
BALANCE, December 31, 2007 | | | 250,000 | | | | 26,754,662 | | | | 250 | | | | 26,754 | | | | 1,451,510 | | | | 327,087 | | | | 754,174 | | | | 2,559,775 | |
| Issuance of shares for exchange of debt | | | | | | | 42,900,000 | | | | | | | | 42,900 | | | | 721,600 | | | | | | | | | | | | 764,500 | |
| Other comprehensive income | | | | | | | | | | | | | | | | | | | | | | | 493,612 | | | | | | | | 493,612 | |
| Net income | | | | | | | | | | | | | | | | | | | | | | | | | | | 638,319 | | | | 638,319 | |
ENDING BALANCE, December 31, 2008 | | | 250,000 | | | | 69,654,662 | | | $ | 250 | | | $ | 69,654 | | | $ | 2,173,110 | | | $ | 820,699 | | | $ | 1,392,493 | | | $ | 4,456,206 | |
| | | | | | | | | | | | | | | | | | | | | | | | | | | | | | | | | |
| See accompanying notes to consolidated financial statements. | | | | | | | | | | | | | | | | | |
|
Consolidated Statement of Cash Flows |
Year ended December 31, |
| China Crescent Enterprises, Inc. | |
| Consolidated Statement of Operations | |
| Year ended December 31, | |
| | | | | | | |
| | | 2010 | | | 2009 | |
| REVENUE | | $ | 78,187,546 | | | $ | 45,628,397 | |
| | | | | | | | | |
| COST OF SALES | | | 71,635,967 | | | | 41,578,424 | |
| | | | | | | | | |
| Gross Margin | | | 6,551,579 | | | | 4,049,973 | |
| | | | | | | | | |
| OPERATING EXPENSES | | | | | | | | |
| Selling, general and administrative expenses | | | 2,019,376 | | | | 1,138,739 | |
| Depreciation and amortization | | | 33,649 | | | | 21,448 | |
| Total expenses | | | 2,053,025 | | | | 1,160,187 | |
| | | | | | | | | |
| Income from operations | | | 4,498,554 | | | | 2,889,786 | |
| | | | | | | | | |
| OTHER INCOME (EXPENSE) | | | | | | | | |
| Gain on sale of fixed assets | | | - | | | | - | |
| Interest income | | | - | | | | - | |
| Interest expense | | | (149,468 | ) | | | (191,717 | ) |
| Other income | | | 379,581 | | | | 102,687 | |
| Other expense | | | (11,878 | ) | | | (7,453 | ) |
| Total other income (expense) | | | 218,235 | | | | (96,483 | ) |
| | | | | | | | | |
| Net income before income tax (credit) and | | | | | | | | |
| minority interest | | | 4,716,789 | | | | 2,793,303 | |
| Foreign income tax | | | (525,403 | ) | | | (73,497 | ) |
| Minority interest in consolidated subsidiary | | | 10,045 | | | | (537,186 | ) |
| | | | | | | | | |
| Net income | | | 4,201,431 | | | | 2,182,620 | |
| Other comprehensive income | | | | | | | | |
| Gain (loss) on investment security | | | - | | | | 8,368 | |
| Foreign currency translation gain (loss) | | | 233,493 | | | | (89,556 | ) |
| | | | | | | | | |
| Comprehensive income | | $ | 4,434,924 | | | $ | 2,101,432 | |
| | | | | | | | | |
| Income per weighted-average common share-basic | | $ | 0.01 | | | $ | 0.03 | |
| Income per weighted-average common share-diluted | | $ | 0.01 | | | $ | 0.03 | |
| | | | | | | | | |
| Number of weighted average common shares o/s-basic | | | 625,826,320 | | | | 76,465,837 | |
| Number of weighted average common shares o/s-diluted | | | 725,359,016 | | | | 101,465,837 | |
| | | | | | | | | |
| See accompanying notes to consolidated financial statements. | | | | | | | | |
| | | 2008 | | | 2007 | |
| CASH FLOWS FROM OPERATING ACTIVITIES: | | | | | | |
| Net Income | | $ | 638,319 | | | $ | 437,824 | |
| Adjustments to reconcile net earnings to net cash | | | | | | | | |
| provided (used) by operating activities: | | | | | | | | |
| Minority interest in consolidated subsidiary | | | 613,286 | | | | 420,646 | |
| Depreciation | | | 16,332 | | | | 38,900 | |
| Gain on sale of fixed assets | | | - | | | | (303,631 | ) |
| Forgiveness of debt | | | - | | | | - | |
| Changes in operating assets and liabilities: | | | | | | | | |
| (Increase) decrease in accounts receivable | | | (957,274 | ) | | | (1,010,760 | ) |
| (Increase) decrease in deposits and other assets | | | (468,609 | ) | | | 163,716 | |
| (Increase) decrease in inventory | | | (161,810 | ) | | | (650,812 | ) |
| Increase (decrease) in accounts payable | | | (491,351 | ) | | | 1,299,415 | |
| Increase (decrease) in accrued expenses and other payables | | | 81,226 | | | | 445,127 | |
| Net cash provided/(used) by operating activities | | | (729,881 | ) | | | 840,425 | |
| | | | | | | | | |
| CASH FLOWS FROM INVESTING ACTIVITIES: | | | | | | | | |
| Purchase of property and equipment | | | - | | | | (16,616 | ) |
| Sale of property and equipment | | | - | | | | 17,467 | |
| Net cash provided by investing activities | | | - | | | | 851 | |
| | | | | | | | | |
| CASH FLOWS FROM FINANCING ACTIVITIES: | | | | | | | | |
| Proceeds from short-term borrowings | | | 1,153,200 | | | | - | |
| Proceeds from long-term debt | | | 148,415 | | | | - | |
| Payments on short-term borrowings | | | - | | | | (740,317 | ) |
| Payments on long-term debt | | | - | | | | - | |
| Proceeds from sale of convertible preferred stock | | | - | | | | - | |
| Net cash provided/(used) by financing activities | | | 1,301,615 | | | | (740,317 | ) |
| | | | | | | | | |
| Cash acquired from reorganization | | | - | | | | - | |
| Effect of exchange rates on cash | | | 539,990 | | | | 219,471 | |
| | | | | | | | | |
| Net increase in cash and equivalents | | | 1,111,724 | | | | 320,430 | |
| | | | | | | | | |
CASH, beginning of period | | | 1,488,774 | | | | 1,168,344 | |
| | | | | | | | | |
CASH, end of period | | $ | 2,600,498 | | | $ | 1,488,774 | |
| | | | | | | | | |
| SUPPLEMENTAL DISCLOSURE OF CASH FLOW INFORMATION | | | | | |
| | | | | | | | | |
| Non-Cash Financing Activities: | | | | | | | | |
| Common stock issued to settle debt | | | | | | $ | - | |
| | | | | | | | | |
| | | | | | | | | |
| See accompanying notes to consolidated financial statements. | | | | | | | | |
| China Crescent Enterprises, Inc. | |
| Consolidated Statement of Stockholders' Equity | |
| | | | | | | | | | | | | | | | | | | | | | | | | |
| | | | | | | | | | | | | | | Additional | | | Accumulated | | | | | | Total | |
| | | Number of Shares | | | Par Value of Stock | | | Paid-In | | | Comprehensive | | | Retained | | | Stockholders' | |
| | | Preferred | | | Common | | | Preferred | | | Common | | | Capital | | | Income/(Loss) | | | Earnings | | | Equity | |
BEGINNING BALANCE, December 31, 2008 | | | 250,000 | | | | 2,786,186 | | | $ | 250 | | | $ | 2,786 | | | $ | 2,239,978 | | | $ | 820,699 | | | $ | 1,392,493 | | | $ | 4,456,205 | |
| Issuance of preferred shares for purchase of | | | | | | | | | | | | | | | | | | | | | | | | | | | | | | | | |
| additional interest in subsidiary | | | 750 | | | | | | | | 1 | | | | | | | | 749,999 | | | | | | | | 180,355 | | | | 930,355 | |
| Conversion of Series B preferred stock | | | (750 | ) | | | 81,027,024 | | | | (1 | ) | | | 81,027 | | | | (81,026 | ) | | | | | | | | | | | - | |
| Exchange of Series A preferred stock for | | | | | | | | | | | | | | | | | | | | | | | | | | | | | | | - | |
| issuance of Series C & D preferred stock | | | (235,000 | ) | | | | | | | (235 | ) | | | | | | | 235 | | | | | | | | | | | | - | |
| Conversion of note payable | | | | | | | 21,649,669 | | | | | | | | 21,650 | | | | 228,222 | | | | | | | | | | | | 249,872 | |
| Issuance of shares in exchange for debt | | | | | | | 128,907,721 | | | | | | | | 128,908 | | | | 2,813,173 | | | | | | | | | | | | 2,942,081 | |
| Other comprehensive income | | | | | | | | | | | | | | | | | | | | | | | (81,188 | ) | | | | | | | (81,188 | ) |
| Net income | | | | | | | | | | | | | | | | | | | | | | | | | | | 2,182,620 | | | | 2,182,620 | |
BALANCE, December 31, 2009 | | | 15,000 | | | | 234,370,600 | | | | 15 | | | | 234,371 | | | | 5,950,581 | | | | 739,511 | | | | 3,755,468 | | | | 10,679,945 | |
| Issuance of shares in exchange for debt | | | | | | | 301,153,509 | | | | | | | | 301,154 | | | | 824,392 | | | | | | | | | | | | 1,125,546 | |
| Conversion of note payable | | | | | | | 640,551,688 | | | | | | | | 640,551 | | | | 1,264,111 | | | | | | | | | | | | 1,904,662 | |
| Common stock issued in exchange for trade payables | | | | | | | 317,565,399 | | | | | | | | 317,565 | | | | 641,527 | | | | | | | | | | | | 959,092 | |
| Other comprehensive income | | | | | | | | | | | | | | | | | | | | | | | 233,493 | | | | | | | | 233,493 | |
| Net income | | | | | | | | | | | | | | | | | | | | | | | | | | | 4,201,431 | | | | 4,201,431 | |
ENDING BALANCE, December 31, 2010 | | | 15,000 | | | | 1,493,641,196 | | | $ | 15 | | | $ | 1,493,641 | | | $ | 8,680,611 | | | $ | 973,004 | | | $ | 7,956,899 | | | $ | 19,104,169 | |
| | | | | | | | | | | | | | | | | | | | | | | | | | | | | | | | | |
| | | | | | | | | | | | | | | | | | | | | | | | | | | | | | | | | |
| See accompanying notes to consolidated financial statements. | | | | | | | | | | | | |
| China Crescent Enterprises, Inc. | |
| Consolidated Statement of Cash Flows | |
| Year ended December 31, | |
| | | | | | | |
| | | | | | | |
| | | 2010 | | | 2009 | |
| CASH FLOWS FROM OPERATING ACTIVITIES: | | | | | | |
| Net Income | | $ | 4,201,431 | | | $ | 2,182,620 | |
| Adjustments to reconcile net earnings to net cash | | | | | | | | |
| provided (used) by operating activities: | | | | | | | | |
| Non-controlling interest in consolidated subsidiary | | | (10,045 | ) | | | 537,186 | |
| Depreciation | | | 33,649 | | | | 21,448 | |
| Gain on sale of fixed assets | | | - | | | | - | |
| Changes in operating assets and liabilities: | | | | | | | | |
| (Increase) decrease in accounts receivable | | | (6,490,133 | ) | | | (2,054,206 | ) |
| (Increase) decrease in deposits and other assets | | | (1,162,536 | ) | | | (1,064,832 | ) |
| (Increase) decrease in inventory | | | 778,030 | | | | (792,898 | ) |
| Increase (decrease) in accounts payable | | | 17,609 | | | | (375,770 | ) |
| Increase (decrease) in accrued expenses and other payables | | | (165,931 | ) | | | 119,330 | |
| Net cash used in operating activities | | | (2,797,926 | ) | | | (1,427,122 | ) |
| | | | | | | | | |
| CASH FLOWS FROM INVESTING ACTIVITIES: | | | | | | | | |
| Advances to affiliate | | | (3,300,000 | ) | | | - | |
| Purchase of retained earnings | | | - | | | | 180,355 | |
| Sale of property and equipment | | | - | | | | 52,681 | |
| Net cash provided/(used) by investing activities | | | (3,300,000 | ) | | | 233,036 | |
| | | | | | | | | |
| CASH FLOWS FROM FINANCING ACTIVITIES: | | | | | | | | |
| Proceeds from short-term borrowings | | | 816,881 | | | | 500,000 | |
| Proceeds from long-term debt | | | 1,760,644 | | | | 500,000 | |
| Payments on short-term borrowings | | | - | | | | - | |
| Payments on long-term debt | | | - | | | | - | |
| Proceeds from sale of convertible preferred stock | | | - | | | | - | |
| Net cash provided by financing activities | | | 2,577,525 | | | | 1,000,000 | |
| | | | | | | | | |
| Effect of exchange rates on cash | | | 1,692,752 | | | | 1,570,970 | |
| | | | | | | | | |
| Net increase/(decrease) in cash and equivalents | | | (1,827,649 | ) | | | 1,376,884 | |
| | | | | | | | | |
CASH, beginning of period | | | 3,977,382 | | | | 2,600,498 | |
| | | | | | | | | |
CASH, end of period | | $ | 2,149,733 | | | $ | 3,977,382 | |
| | | | | | | | | |
| SUPPLEMENTAL DISCLOSURE OF CASH FLOW INFORMATION | | | | | |
| | | | | | | | | |
| Non-Cash Financing Activities: | | | | | | | | |
| Common stock issued to settle debt | | $ | 3,989,300 | | | $ | 2,942,081 | |
| | | | | | | | | |
| | | | | | | | | |
| See accompanying notes to consolidated financial statements. | | | | | | | | |
CHINA CRESCENT ENTERPRISES, INC. AND SUBSIDIARIES
Notes to Consolidated Financial StatementsNOTES TO THE CONSOLIDATED FINANCIAL STATEMENTS
DecemberDECEMBER 31, 20082010
1.NOTE 1 - NATURE OF OPERATION:
Intercell International Corporation (“Intercell”) was incorporated under the laws of Nevada in May 2000. Until October 2003, the Company had no operations. In October 2003, the Company acquired 60% membership interest in Brunetti DEC, LLC, a Colorado limited liability company (“Brunetti”) for a cash contribution. In January 2004, Intercell acquired the remaining 40% of Brunetti for and additional cash contribution. In October 2004, the operations of Brunetti were discontinued and in March 2005, Brunetti filed a voluntary petition for relief in the United States Bankruptcy Court, District of Colorado under Chapter 7 of Title 7 of the U.S. Bankruptcy Code.
On March 16, 2005, Intercell filed a voluntary petition for relief in the United States Bankruptcy Court, District of Colorado under Chapter 11 of Title 11 of the U.S. Bankruptcy Code. On April 5, 2006, the United States Bankruptcy Court, District of Colorado dismissed the Chapter 11 proceedings.
In October 2006, Intercell executed an Agreement and Plan of Reorganization (“the Agreement”) with NewMarket China, Inc. (“NewMarket China”) a wholly-owned subsidiary of NewMarket Technology, Inc. (“NewMarket Technology”). The Agreement provided for Intercell to acquire from NewMarket Technology its subsidiary, NewMarket China, through the exchange of all of the issued and outstanding stock of NewMarket China, one thousand (1,000) shares held by NewMarket Technology for two million (2,000,000) restricted common shares of Intercell. As a result of the Agreement, NewMarket China became the wholly-owned subsidiary of Intercell.
As part of the reorganization and acquisition of Intercell, on January 31, 2007, Intercell changed its name to NewMarket China, Inc. Additionally, the Company changed its fiscal year end from September 30th to December 31st. In June 2008, the Company’s name was changed to China Crescent Enterprises, Inc. (theand subsidiaries (“China Crescent” or the “Company”).
The Company’s headquarters is located in Dallas, Texas but the Company’s primary operations are currently in The People’s Republic of China (“China”).systems integration and wireless equipment manufacturing company. To date, the majority of the Company’s sales have been information technology products and services sold within mainland China through its wholly-owned foreign subsidiary, Clipper Technology, Ltd. (“CLPTEC”). located in Shanghai, China, and its majority-owned subsidiary Clipper Huali, Ltd. (“Clipper Huali”) located in Ningbo, China. In the fourth quarter of 2009, the Company acquired Dalian Aoyuan Electronic Technology Services Co., Ltd. (“DAETS”), a systems integration company located in Dalian, China and Shenzhen Nubao Technology Co., Ltd. (“Nubao”), a wireless equipment manufacturer located in Shenzhen, China. The Company’s headquarters is located in Dallas, Texas.
2.The Company is a majority-owned subsidiary of NewMarket Technology, Inc. (“NewMarket”), a Dallas, Texas based systems integration company.
NOTE 2 - SUMMARY OF SIGNIFICANT ACCOUNTING POLICIES:
BASIS OF PRESENTATIONBasis of Presentation
The accompanying consolidated financial statements have been prepared by management in conformity with accounting principles generally accepted in the United States (“U.S. GAAP”), and include all assets, liabilities, revenues and expenses of the Company, its wholly-owned subsidiary Brunetti, and its Chinese wholly-owned foreign entity, CLPTEC and CLPTEC’s subsidiaries, Clipper Technology, Inc. (“CLPTEC”).Huali, DAETS and Newbao. All significant intercompany accounts and transactions have been eliminated in consolidation.
USE OF ESTIMATESUse of Estimates
The preparation of consolidated financial statements in conformity with accounting principles generally accepted in the United States of America requires management to make estimates and assumptions that affect the reported amounts of assets and liabilities and disclosure of contingent assets and liabilities at the date of the consolidated financial statements and reported amounts of revenues and expenses during the reporting periods. Actual results could differ from those estimates.
FAIR VALUE OF FINANCIAL INSTRUMENTSFair Value of Financial Instruments
The fair values of the Company’s cash and cash equivalents, accounts receivable, accounts payable, and lines of credit approximate their carrying amounts due to the short maturities of these instruments.
CASH AND CASH EQUIVALENTSCash and Cash Equivalents
The Company considers all highly liquid investments with an original maturity of three months or less and money market instruments to be cash equivalents.
INVENTORYAccounts Receivable and Allowance for Doubtful Accounts
Trade accounts receivable are recorded at the invoiced amount and do not bear interest. The Company evaluates the collectability of its accounts receivable based on a combination of factors. Collection risks are mitigated by (i) sales to well-established companies and governmental agencies (ii) ongoing credit evaluation of its customers; and (iii) frequent contact by the Company with its customers which enables the Company to monitor changes in business operations and to respond accordingly. The Company recognizes allowances for doubtful accounts based on the length of time the receivables are outstanding, the current business environment and historical experience.
Inventory
Inventory, which consists primarily of finished goods, is stated at the lower of cost or market. Cost is determined using the weighted average method.
AVAILABLE FOR SALE SECURITIES
Available for sale securities consist of 23,245 shares of common stock of Vyta Corp (“Vyta”) (see Note 5). These securities are carried at fair value ($1,162 at December 31, 2008) based upon quoted market prices. Unrealized gains and losses are computed onWhen products have been delivered, but the average cost basis and are reportedproduct revenue associated with the arrangement has been deferred as a separate componentresult of comprehensive loss, included as a separate item in stockholders’ equity.not meeting the revenue recognition criteria. The Company reported an increase inincludes the unrealized loss on available for sale securitiescosts for the year-ended December 31, 2008delivered items in inventory until recognition of $4,184. Realized gains, realized losses,the related revenue occurs.
Property and declines in value, judged to be other-than temporary, are included in other income (expense).
PROPERTY AND EQUIPMENTEquipment
Property and equipment are stated at cost. Depreciation is provided by use of the straight-line method over the estimated useful lives of the related assets, which range from five to seven years.
REVENUE RECOGNITIONLong-Lived Assets and Other Intangible Assets
Long-lived assets, such as property, plant and equipment and certain identifiable intangible assets to be held and used are reviewed for impairment whenever events or changes in circumstances indicate that the carrying value of such assets may not be recoverable. Determination of recoverability is based on an estimate of undiscounted future cash flows resulting from the use of the asset and its eventual disposition. Measurement of any impairment loss for long-lived assets that management expects to hold and use is based on the fair value of the asset.
Revenue Recognition
The Company is engaged in the business of resale of computer hardware, and software and IT consulting services, and wireless equipment manufacturing in China. Revenue from product sales, which accounts for the substantial majority of revenue, is recognized upon delivery. IT Consulting services are invoiced under a time and materials contract. Revenue is recognized as time is spent on hourly rates, which are negotiated with the customer, plus the cost of any allowable material costs and out-of-pocket expenses.
FOREIGN CURRENCY TRANSACTION AND TRANSLATION GAINS (LOSSES)Foreign Currency Transaction and Translation Gains (Losses)
The principal operations of the Company are located in China. The Company invoices its customers in RMB, the local currency is the functional currency. Accordingly, gains and iflosses from the Company payment istranslation of the financial statements of the foreign subsidiaries are reported as a component of accumulated comprehensive income as a separate component of stockholders’ equity. Assets and liabilities denominated in acurrencies other that the U.S. dollar are remeasured into U.S. dollars at current exchange rates for monetary assets and liabilities, and historical exchange rates for nonmonetary assets and liabilities. Net revenue, cost of sales and expenses are remeasured at average exchange rates in effect during each reporting period, and net revenue, cost of sales and expenses related to the previously reported periods are remeasured at historical exchange rates. The Company includes gains and losses from foreign currency the Company translates the payment and records a foreign currency transaction gain or loss in accordance with Statement of Financial Accounting Standards (“SFAS”) 52, “Foreign Currency Translation”.net earnings.
DERIVATIVE INSTRUMENTSDerivative Instruments
SFAS No. 133, “Accounting for Derivative InstrumentsASC 815-10, Derivatives and Hedging Activities”, as amended, and Emerging Issues Task Force (“EITF”) Issue 00-19, ‘‘Accounting for Derivative Financial Instruments Indexed To, and Potentially Settled in, a Company's Own Stock’’, establishes accounting and reporting standards requiring that every derivative instrument be recorded in the balance sheet as either an asset or liability measured at fair value, and that changes in fair value be recognized currently in earnings (loss) unless specific hedge accounting criteria are met. The value of derivatives as of December 31, 2010 and 2009 was $0 and $0, respectively.
STOCK-BASED COMPENSATIONStock-Based Compensation
Beginning October 1, 2006,The Company recognizes the Company adopted the provisionscost of and accounts for stock-based compensation plans and awards in accordance with the Financial Accounting Standards Board's ("FASB") Statement of Financial Accounting Standards No. 123 - revised 2004 ("SFAS 123(R)") “Share-Based Payment" which replaced Statement of Financial Accounting Standards No. 123("SFAS 123"), "Accounting for Stock-Based Compensation" and supersedes APB Opinion No. 25 ("APB 25"), Accounting for Stock Issued to Employees". Under the fair value recognition provisions of this statement, stock-based compensation cost is measured at the grant date based on the fair value of the award and is recognized as expenseoperations on a straight-line basis over the requisite servicerespective vesting period which is(if applicable) of the vesting period.awards. The Company electedmeasures and recognizes compensation expense for all stock-based awards made to employees and directors. The compensation expense for the modified-prospective method, under which prior periods are not revised for comparative purposes. The valuation provisions of SFAS 123® apply to new grants and to grants that were outstanding asCompany’s stock-based payments is based on estimated fair values at the time of the effective date and are subsequently modified. There were no options granted during the years ended December 31, 2008 and 2007, and all options granted prior to the adoption of SFAS 123(R) and outstanding during the periods presented were fully-vested.grant.
The Company has a stock option plan which permitestimates the grantfair value of shares to attract, retain and motivate employees, directors and consultants. Options are generally granted with an exercise price equal to the Company's market price of its common stockstock-based awards on the date of the grant using an options pricing model. These option pricing models involve a number of assumptions, including the expected lives of stock options, the volatility of the market price of our common stock and interest rates. The Company is using the Black-Scholes option pricing model.
Intangibles
ASC 350-10, Intangibles-Goodwill and Other, requires that goodwill and intangible assets with vesting rates,indefinite useful lives no longer be amortized, but instead tested for impairment at least annually in accordance with the provision of ASC 350. This standard also requires that intangible assets with definite useful lives be amortized over their respective estimated useful lives to their estimated residual values, and reviewed for impairment.
During the year-ended December 31, 2010, the Company recognized goodwill of $1,820,267 as determineda result of contribution of additional paid-in-capital to certain operating subsidiaries and the restructuring of certain assets and liabilities of those subsidiaries. This action did not result in any change in the Company’s ownership position of these subsidiaries.
Net Income (Loss) Per Share
Basic net income (loss) per share is computed by dividing the net income (loss) for the period by the Boardweighted-average number of Directors. No options were granted during the year ended December 31, 2008 and all options granted prior to the adoption of SFAS 123(R)common shares outstanding during the periods presented are fully vested.
INCOME (LOSS) PER SHARE
SFAS No. 128, “Earnings Per Share”, requires dual presentation of basic and diluted earningsperiod presented. Diluted net income (loss) per share (EPS) with a reconciliation offor the numerator and denominator of the basic EPS computation to the numerator and denominator of the diluted EPS computation. Basic EPS excludes dilution. Diluted EPS reflects the potential dilution that could occur if securities or other contracts to issue common stock were exercised or converted into common stock or resulted in the issuance of common stock that then shared in the earnings of the entity.
Basic earnings per share areperiod is computed by dividing net income (loss) for the period by the weighted average number of common shares outstanding during the period, presented. Diluted earnings per share are computed using the weighted average number ofincreased by potentially dilutive common shares (“dilutive securities”) that were outstanding during the periods plusperiod. Dilutive securities include options granted pursuant to the effect of dilutive securities outstanding during the periods.Company’s stock option plan, stock warrants and convertible debt and convertible preferred stock.
INCOME TAXESIncome Taxes
Income taxes are accounted for byusing the asset and liability method. A deferred tax asset or liability is recorded for all temporary differences between financial and tax reporting. Temporary differences are the differences between the reported amounts of assets and liabilities and their tax basis. Deferred tax assets are reduced by a valuation allowance when, in the opinion of management, it is more likely than not that some portion or all of the deferred tax assets will not be realized. Deferred tax assets and liabilities are recognizedadjusted for the futureeffect of changes in tax consequences attributablelaws and rates on the date of enactment.
Comprehensive Income (Loss)
Comprehensive income (loss) is defined as the change in equity of a business enterprise during a period from transactions and other events and circumstances from non-owner sources. For the Company, comprehensive income (loss) consists of its net income (loss), the change in the currency translation adjustment and the change in unrealized gain (loss) on certain available-for-sale securities.
Recently Issued Accounting Pronouncements
In January 2010, the FASB issued ASU 2010-06, Improving Disclosures about Fair Value Measurements. ASU 2010-06 amends FASB Accounting Standards Codification Topic 820, Fair Value Measurements and Disclosures (“ASC 820-10”), to differences between the financial statement carrying amounts of existingrequire additional disclosures regarding fair value measurements. The amended guidance requires entities to disclose additional information regarding assets and liabilities and their respective tax bases and operating loss and tax credit carry forwards. Deferred tax assets and liabilitiesthat are measured using enacted tax rates expected to apply to taxable income intransferred between levels of the years in which those temporary differences are expected to be recovered or settled. The effect on deferred tax assets and liabilities of a change in tax rates is recognized in income (loss) in the period that includes the enactment date. A valuation allowance is established when necessary to reduce deferred tax assets to amounts expected to be realized.
COMPREHENSIVE INCOME
SFAS No. 130, “Reporting Comprehensive Income”, requires the reporting and display of comprehensive income and its components. SFAS No. 130 requires unrealized gains and losses on the Company’s available for sale securities to be included in comprehensive income as well as gains or losses due to foreign currency translation adjustments.
RECENTLY ISSUED ACCOUNTING PRONOUNCEMENTS
In September 2006, the Financial Accounting Standards Board (“FASB”) issued SFAS No. 157, “Fair Value Measurements”. This Statement defines fair value establishes a framework for measuring fair value and expands disclosure of fair value measurements. SFAS No. 157 applies under other accounting pronouncements that require or permit fair value measurements and accordingly, does not require any new fair value measurements. SFAS No. 157hierarchy. This guidance is effective for financial statements issued for fiscal yearsannual reporting periods beginning after NovemberDecember 15, 2006.2009, except for Level 3 reconciliation disclosures which are effective for annual periods beginning after December 15, 2010. The Company does not expect the adoption of SFAS 157 is not expectedthis guidance to have a material effectimpact on the Company’sits financial position, results of operations or cash flows.statements.
In September 2006,July 2010, the Securities and Exchange Commission (“SEC”)FASB issued Staff Accounting Bulletin (SAB) No. 108 in order to eliminateASU 2010-20, Disclosures about the diversityCredit Quality of practice surrounding how public companies quantify financial statement misstatements. In SAB 108, the SEC staff established an approach that requires quantification of financial statement misstatements based on the effects of the misstatements on each of the Company’s financial statementsFinancing Receivables and the related financial statement disclosures. SABAllowance for Credit Losses. ASU No. 108 is effective for2010-20 requires companies that hold financing receivables, which include loans, lease receivables, and the Company for its current fiscal year.other long-term receivables to provide more information in their disclosures about the credit quality of their financing receivables and the credit reserves held against them. The adoption of SAB No. 108this ASU did not have ana material impact on the Company’s consolidated financial statements.
In February 2007,December 2010, the FASB issued SFAS No. 159, “The Fair Value OptionASU 2010-28 which amends “Intangibles- Goodwill and Other” (Topic 350). The ASU modifies Step 1 of the goodwill impairment test for Financial Assets and Financial Liabilities—Including an amendmentreporting units with zero or negative carrying amounts. For those reporting entities, they are required to perform Step 2 of FASB Statement No. 115”. This Statement permits entities to choose to measure many financial instruments and certain other items at fair value.the goodwill impairment test if it is more likely than not that a goodwill impairment exists. An entity should consider whether there are any adverse qualitative factors indicating that impairment may exist. The objective is to improve financial reporting by providing entities with the opportunity to mitigate volatility in reported earnings caused by measuring related assets and liabilities differently without having to apply complex hedge accounting provisions. This Statement is expected to expand the use of fair value measurement, which isqualitative factors are consistent with the Board’s long-term measurement objectivesexisting guidance in Topic 350, which requires that goodwill of a reporting unit be tested for accountingimpairment between annual tests if an event occurs or circumstances changes that would more likely than not reduce the faire value of a reporting unit below its carrying amount. ASU 2010-28 is effective for fiscal years, and interim periods within those years beginning after December 15, 2010. Early adoption is not permitted. The Company is currently evaluating the impact of this ASU; however, the Company does not expect the adoption of this ASU will have a material impact on its consolidated financial instruments. SFAS No. 159 is effectivestatements.
In December 2010, the FASB issued ASU 2010-29 which address diversity in practice about the interpretation of the pro forma revenue and earnings disclosure requirements for business combinations (Topic 805). This ASU specifies that if a public entity presents comparative financial statements, the entity should disclose revenue and earnings of the combined entity as though the business combination(s) that occurred during the current year had occurred as of the beginning of an entity’s first fiscal year that begins after November 15, 2007. Early adoption is permitted asthe comparable prior annual reporting period only. This ASU also expands the supplemental pro forma disclosures under Topic 805 to include a description of the beginning of a fiscal year that begins on or before November 15, 2007, provided the entity also elects to apply the provisions of SFAS No. 157. The Company is in the process of evaluating the impact that the adoption of SFAS No. 159 will have on its consolidated results of operations and financial condition.
In December 2007, the FASB issued SFAS No. 141 (revised 2007), “Business Combinations”, which replaces FASB Statement No. 141. FAS 141R establishes principles and requirements for how an acquirer recognizes and measures in its financial statements the identifiable assets acquired, the liabilities assumed, any non controlling interest in the acquiree and the goodwill acquired. The Statement also establishes disclosure requirements which will enable users to evaluate the nature and financial effectsamount of material, nonrecurring pro forma adjustments directly attributable to the business combination. SFAS 141R will be applicablecombination included in the reported pro forma revenue and earnings. ASU 2010-29 is effective prospectively tofor business combinations for which the acquisition date is on or after January 1, 2009. SFAS 141R wouldthe beginning of the first annual reporting period beginning on or after December 15, 2010. Early adoption is permitted. The Company is currently evaluating the impact of this ASU and expected the adoption of this ASU will have an impact on accounting for anyits future business acquired after the effective date of this pronouncement.combinations
In December 2007, the FASB issued SFAS No. 160, “Noncontrolling Interests in Consolidated Financial Statement—amendments of ARB No. 51”. SFAS 160 states that accounting and reporting for minority interests will be recharacterized as non-controlling interests and classified as a component of equity. The Statement also establishes reporting requirements that provide sufficient disclosures that clearly identify and distinguish between the interests of the parent and the interests of the non-controlling owners. SFAS 160 applies to all entities that prepare consolidated financial statements, except not-for-profit organizations, but will affect only those entities that have an outstanding non-controlling interest in one or more subsidiaries or that deconsolidate a subsidiary. This statement is effective as of the beginning of an entity’s first fiscal year beginning after December 15, 2008. The adoption of SFAS 160 would have an impact on the presentation and disclosure of the non-controlling interest of any wholly-owned businesses acquired in the future.
In March 2008, the FASB issued SFAS 161, “Disclosures about Derivative Instruments and Hedging Activities, an Amendment of SFAS 133” (“SFAS 161”). SFAS 161 amends and expands the disclosure requirements of SFAS 133 with the intent to provide users of financial statements with an enhanced understanding of how and why an entity uses derivative instruments, how derivative instruments and related hedged items are accounted for under SFAS 133 and its related interpretations, and how derivative instruments and related hedged items affect an entity’s financial position, financial performance, and cash flows. SFAS 161 is effective for financial statements issued for fiscal years and interim periods beginning after November 15, 2008. The Company believes that the future requirements of SFAS 161 will not have a material effect on its consolidated financial statements.
In May 2008, the FASB issued SFAS 162, “The Hierarchy of Generally Accepted Accounting Principles” (“SFAS 162”) which provides a consistent framework for determining what accounting principles should be used when preparing financial statements under generally accepted accounting principles in the U.S. SFAS 162 is effective 60 days following the SEC’s approval of the Public Company Accounting Oversight Board (“PCAOB”) amendments to AU Section 411, “The Meaning of Present Fairly in Conformity With Generally Accepted Accounting Principles.” The adoption of SFAS 162 is not expected to have an impact on the Company’s results of operations or financial condition.
3. REORGANIZATION:
In October 2006, the Intercell executed an Agreement and Plan of Reorganization (“the Agreement”) with NewMarket China, Inc. (“NewMarket China” or the “Company”), a wholly-owned subsidiary of NewMarket Technology, Inc. (“NewMarket Technology”). The Agreement, provided for Intercell to acquire from NewMarket Technology its subsidiary, NewMarket China through the exchange of all of the issued and outstanding stock of NewMarket China, one thousand (1,000) shares held by NewMarket Technology for two million (2,000,000) common shares of Intercell. As a result of the Agreement, NewMarket China became the wholly-owned subsidiary of Intercell.
In a separate agreement, NewMarket Technology agreed to purchase 250,000 shares of a Series A Preferred Stock from Intercell for $250,000. The shares have a par value of $0.001 per share and a purchase price of $1.00 per share and bear no dividend. The shares are convertible into 60% of the issued and outstanding common stock of the Company, any time after August 31, 2006. The shares have a voting right equal to 60% of the issued and outstanding common stock of the Company.
As a result of this reorganization, the Company’s stockholders’ equity has been adjusted to reflect the effect of this transaction.
4.NOTE 3 - DISCONTINUED OPERATIONS:
BRUNETTI ACQUISITIONBrunetti Acquisition
On October 20, 2003, the Company acquired a controlling 60% equity interest in Brunetti in exchange for a $700,000 cash contribution to Brunetti. On January 30, 2004, the Company acquired the remaining 40% equity interest in Brunetti in exchange for a $300,000 cash contribution to Brunetti.
On October 11, 2004, the Company discontinued the operations of Brunetti and implemented steps to liquidate the assets of Brunetti. On March 1, 2005, Brunetti filed a voluntary petition for relief in the United States Bankruptcy Court, District of Colorado under Chapter 7 of Title 7 of the U.S. Bankruptcy Code.
At December 31, 2008,2010, the carrying values of Brunetti’s assets and liabilities (presented as assets and liabilities of discontinued operations) are as follows:
| Cash | | $ | 9,377 | |
Total assets (all current) | | $ | 9,377 | |
| | | | | |
| Accounts payable | | $ | 179,473 | |
| Related party payable | | | 25,035 | |
| Line of credit | | | 10,735 | |
| Accrued payroll | | | 93,440 | |
Total liabilities (all current) | | $ | 308,683 | |
| Cash | | $ | 9,377 | |
Total assets (all current) | | $ | 9,377 | |
| | | | | |
| Accounts payable | | $ | 179,473 | |
| Related party payable | | | 25,035 | |
| Line of credit | | | 10,735 | |
Total liabilities (all current) | | $ | 215,243 | |
Brunetti reported no revenues or income during the year ended December 31, 2008.2010. Revenues attributable to Brunetti operations for the year ended December 31, 20082010 and 20072009 reported in discontinued operations, were $0 and $0, respectively Operations related to Brunetti resulted in net income during the year ended December 31, 20082010 and 20072009 of $0 and $0, respectively. Brunetti did not incur any income taxes during these periods.
5. INVESTMENT IN VYTA CORP. AND RELATED TRANSACTIONS:NOTE 4 - NON-CONTROLLING INTEREST:
AtNon-controlling interest represents the minority stockholder’s proportionate share of equity in our Clipper-Huali subsidiary. As of December 31, 2006,2010, we owned 76% of the Company owns 23,245 sharescapital stock of Vyta common stock. Beginning October 21, 2003, based on factors which indicatedClipper-Huali, representing voting control and a majority interest. Our controlling ownership interest requires that Clipper-Huali’s operations be included in the Company didCondensed Consolidated Financial Statements contained herein. The 24% equity interest that is not haveowned by us is shown as “Non-controlling interest in consolidated subsidiary” in the ability to exercise significant influence,Consolidated Statement of Operations and the Company changed its methodConsolidated Balance Sheet. As of accounting for the Vyta Corp shares (except for those which are subject to underlying warrants, which are carried at cost) to the method of accounting prescribed by SFAS No. 115, “Accounting for Certain Investments in Debt and Equity Securities”. The Company has classified its investment in these Vyta Corp shares as available for sale securities, in which unrealized gains (losses) are computed on the average cost basis, and are recorded in other comprehensive income (loss). At December 31, 2008, all 23,245 shares of Vyta were available for sale and had2010, The Huali Group, Ltd., our minority interest partner, held a fair market$2,639,904 interest in the net asset value of $1,162. The Company reported an increase in the unrealized loss on available for sale securities of $4,184 during the year ended December 31, 2008. The Company did not sell any available for sale securities during the year ended December 31, 2008.our Clipper-Huali subsidiary.
6.NOTE 5 - NOTES PAYABLE AND CREDIT FACILITIES:
REVOLVING LINE OF CREDIT
As of December 31, 2008, the Company had a revolving line of credit with a financial institution in China:
| | | | | Annual | | | | Amount | |
| | | Credit | | Interest | | Due | | Outstanding | |
| Institution | | Line | | Rate | | Date | | at 12/31/08 | |
| | | | | | | | | | |
| Development Bank of Ningbo | | $ | 151,041 | | 1.7 | % | 4/24/09 | | $ | 151,041 | |
| | | | | | | | | | | | |
| | | | | | | | | | | | |
| Total: | | $ | 151,041 | | | | | | $ | 151,041 | |
NOTES PAYABLE
As of December 31, 2008,2010, the CompanyCompany’s Clipper-Huali subsidiary had severalan unsecured promissory notesnote outstanding with two differenta financial institutionsinstitution in China:
| | | Annual | | | | Principal | |
| | | Interest | | Maturity | | Outstanding | |
| Institution | | Rate | | Date | | at 12/31/10 | |
| | | | | | | | |
| Shanghai Pudong Development Bank | | | (1 | ) | 6/21/14 | | $ | 386,414 | |
| | Annual | | Amount |
| | Interest | Maturity | Outstanding |
| Institution | Rate | Date | at 12/31/08 |
| | | | |
| Shanghai Pudong Development Bank | 6.39% | 5/03/09 | $ 67,482 |
| Shanghai Pudong Development Bank | 8.02% | 11/18/09 | $ 264,060 |
| Guangdong Development Bank | (1) | 2/23/09 | $ 440,100 |
| Guangdong Development Bank | (1) | 5/20/09 | $ 440,100 |
| Guangdong Development Bank | (1) | 3/8/09 | $ 586,800 |
| | | | |
| | | | |
| Total: | | | $ 1,798,542 |
| | (1) | The interest rate for these notes arethis note is variable based on an official government rate. At December 31, 2008,2010, the annual interest rate was approximately 7.2%5%. |
As of December 31, 2010, the Company had four unsecured promissory notes outstanding with three different investors:
| | | | Annual | | | | Principal | |
| | | | Interest | | Maturity | | Outstanding | |
| Note | | | Rate | | Date | | at 12/31/10 | |
| | | | | | | | | |
| | 1 | | | | 10% | | 7/7/11 | | $ | 37,500 | |
| | 2 | | | | 10% | | 7/7/11 | | $ | 37,500 | |
| | 3 | | | | 8% | | 6/15/11 | | $ | 436,987 | |
| | 4 | | | | 8% | | 6/15/11 | | $ | 210,000 | |
7.CONVERTIBLE DEBT
As of December 31, 2010, the Company had two unsecured convertible promissory notes outstanding with an investor:
| | | | Annual | | | | Principal | |
| | | | Interest | | Maturity | | Outstanding | |
| Note | | | Rate | | Date | | at 12/31/10 | |
| | | | | | | | | |
| | 1 | | | | 5% | | 7/7/11 | | $ | 95,000 | |
| | 2 | | | | 5% | | 7/7/11 | | $ | 117,262 | |
The notes are convertible into shares of common stock of the Company at the lowest closing price of the stock during the ten trading days prior and including the date of conversion. The holder of the notes can only convert a portion of the principal such that at no time does their beneficial ownership exceed 4.99% of the outstanding shares of common stock. At December 31, 2010, such a conversion would have represented 74,532,696 shares of common stock.
LINES OF CREDIT
As of December 31, 2010, the Company’s Clipper-Huali subsidiary had several revolving lines of credit outstanding with two financial institutions in China. These credit lines are secured by the outstanding accounts receivable and inventory of this subsidiary.
| | | Annual | | | | Amount | |
| | | Interest | | Maturity | | Outstanding | |
| Institution | | Rate | | Date | | at 12/31/10 | |
| | | | | | | | |
| Shanghai Pudong Development Bank | | | 5.58% | | 11/27/11 | | $ | 1,466,920 | |
| Shanghai Pudong Development Bank | | | 5.31% | | 11/27/11 | | $ | 953,646 | |
| Bank of Ningbo | | | 5.31% | | 6/24/11 | | $ | 293,384 | |
| | | | | | | | | | |
| | | | | | | | | | |
| Total: | | | | | | | $ | 2,713,950 | |
NOTE 6 - STOCKHOLDERS’ EQUITY:
PREFERRED STOCKPreferred Stock
The Company has authorized 20,000,000 shares of $0.001 par value preferred stock. The rights and privileges of the preferred stock are to be determined by the Board of Directors prior to issuance.
During the year ended December 31, 2006, the Company issued 250,000 shares of its Series A Preferred Stock in exchange for $250,000 (see Note 3). The funds were put into escrow, with an unrelated third party escrow agent, with the express purpose to be used to negotiate and purchase the outstanding debt of not only the Company, but also its subsidiary, Brunetti. At December 31, 2008, approximately $58,617 worth the debt of Brunetti had been purchased.$250,000. The shares havehad a par value of $0.001 per share and a purchase price of $1.00 per share and bear no dividend. The shares arewere convertible into 60% of the issued and outstanding common stock of the Company, any time after August 31, 2007. The shares havehad a voting right equal to 60% of the issued and outstanding common stock of the Company. There are no outstanding shares of Series A Preferred Stock as of December 31, 2010 (see below).
In April 2009, the Company issued 750 shares of Series B Convertible Preferred Stock, $.001 par value, to The Huali Group in connection with the acquisition by CLPTEC of an additional 25% interest in Clipper-Huali, Ltd. (“Clipper-Huali”), bringing its total ownership in Clipper-Huali to 76%. In the fourth quarter of 2009, all 750 shares of Series B Convertible Preferred Stock were converted into a total of 81,027,024 shares of the common stock of the Company.
There wereIn November 2009, pursuant to the terms of the Equity Reorganization Agreement between the Company and NewMarket, NewMarket agreed to exchange all 250,000 outstanding shares of Series A Preferred Stock to the Company in exchange for the issuance of 10,000 shares of Series C Convertible Preferred Stock and 5,000 shares of Series D Preferred Stock. The Series C Convertible Preferred Stock bears no issuancesdividend and is convertible into 25 million shares of preferredcommon stock duringof the year ended December 31, 2008.Company upon the effectiveness of a registration statement with the Securities and Exchange Commission. The Series D Preferred Stock bears no dividend and the holders have voting rights at all times equal to 51% of the total outstanding shares of the common stock of the Company.
COMMON STOCKCommon Stock
The Company has authorized 200,000,0003,000,000,000 shares of $0.001 par value common stock. The Company had 69,654,6621,493,641,196 shares of common stock issued and outstanding at December 31, 2008. 2010. In October 2010, the Company filed a Definitive Information Statement on Schedule 14C indicating that the Board of Directors had authorized and amendment to the Company’s Articles of Incorporation to increase the number of authorized common shares from one billion (1,000,000,000) to three billion (3,000,000,000). This action was passed by written consent of the Company’s majority shareholder and was effective on November 15, 2010.
During the year ended December 31, 2008,2010, the Company issued 42,900,0001,259,270,596 shares of common stock for the following:
· | In March 2008, the Company issued 5,760,000● | 301,153,509 shares of common stock were issued pursuant to an agreementvarious agreements to exchange approximately $288,000 of$1,125,546 in short-term debt for equity. |
· | In June 2008, the Company issued 4,750,000● | 640,551,688 shares of common stock were issued pursuant to an agreementthe conversion of notes payable into equity. |
| ● | 317,565,399 shares of common stock were issued pursuant to various agreements to exchange approximately $142,500 of debt$959,092 in trade payables for equity. |
· | In September 2008, the Company issued 9,550,000 shares of common stock pursuant to an agreement to exchange approximately $191,000 of debt for equity. |
· | In October 2008, the Company issued 4,700,000 shares of common stock pursuant to an agreement to exchange approximately $37,600 of debt for equity. |
· | In November 2008, the Company issued 10,800,000 shares of common stock pursuant to an agreement to exchange approximately $54,000 of debt for equity. |
· | In December 2008, the Company issued 7,340,000 shares of common stock pursuant to an agreement to exchange approximately $51,400 of debt for equity. |
8.NOTE 7 - STOCK OPTIONS AND WARRANTS:
STOCK OPTIONSStock Options
The Company had established a Compensatory Stock Option Plan (the “1995 Plan”) and had reserved 10,000,000 shares of common stock for issuance under the Option Plan. Incentive stock options can be granted under the Option Plan at prices not less than 110% of the fair market value of the stock at the date of grant, and nonqualified options can be granted at not less than 50% of the stock’s fair market value at the date of grant or the date the exercise price of any such option is modified. Vesting provisions are determined by the board of directors. All stock options expire 10 years from the date of grant.
A summary of the status of the 1995 Plan is as follows:
| | | December 31, | |
| | | 2010 | | | 2009 | |
| | | Shares | | | Weighted Average Exercise Price | | | Shares | | | Weighted Average Exercise Price | |
Outstanding at beginning of Year | | | 190,000 | | | $ | 10.86 | | | | 190,000 | | | $ | 10.86 | |
| Granted | | | - | | | | - | | | | - | | | | - | |
| Cancelled | | | - | | | | - | | | | - | | | | - | |
| Expired | | | - | | | | - | | | | - | | | | - | |
| Exercised | | | - | | | | - | | | - | | | - | |
| Outstanding at end of year | | | 190,000 | | | $ | 10.86 | | | | 190,000 | | | $ | 10.86 | |
| | | | | | | | | | | | | | | | | |
Options exercisable at end of Year | | | 190,000 | | | $ | 10.86 | | | | 190,000 | | | $ | 10.86 | |
| | | December 31, | |
| | | 2008 | | | 2007 | |
| | | Shares | | | Weighted Average Exercise Price | | | Shares | | | Weighted Average Exercise Price | |
| Outstanding at beginning of Year | | | 4,762,500 | | | $ | 0.44 | | | | 4,839,550 | | | $ | 1.26 | |
| Granted | | | - | | | | - | | | | - | | | | - | |
| Cancelled | | | - | | | | - | | | | - | | | | - | |
| Expired | | | (12,500 | ) | | | - | | | | ( 77,050 | ) | | | - | |
| Exercised | | | - | | | | - | | | | - | | | | - | |
| Outstanding at end of year | | | 4,750,000 | | | $ | 0.43 | | | | 4,762,500 | | | $ | 0.44 | |
| | | | | | | | | | | | | | | | | |
| Options exercisable at end of Year | | | 4,750,000 | | | $ | 0.43 | | | | 4,762,500 | | | $ | 0.44 | |
The following table summarizes information about stock options outstanding as of December 31, 2008:2010:
| Options Outstanding | | Options Exercisable | |
Range of Exercise Prices | | | Number of Options | | Remaining Contractual Life | | Weighted Average Exercise Price | | | Number of Options | | | Exercise Price | |
| $ | 0.41-0.51 | | | | 4,750,000 | | 5-6 years | | $ | 0.43 | | | | 4,750,000 | | | $ | 0.41-0.51 | |
| | | | | | 4,750,000 | | | | | | | | | 4,750,500 | | | | | |
| Options Outstanding | | Options Exercisable | |
Range of Exercise Prices | | | Number of Options | | Remaining Contractual Life | | Weighted Average Exercise Price | | | Number of Options | | | Exercise Price | |
| | $3.50-12.75 | | | | 190,000 | | 3-4 years | | $ | 10.86 | | | | 190,000 | | | | $3.50-12.75 | |
In August 2008, the Company established a new Stock Option and Award Plan (the “2008 Plan”) and has reserved 10,000,000400,000 shares of common stock for issuance under the 2008 Plan. Under the 2008 Plan, incentive stock options are granted at prices not less than 100% of the fair market value of the stock at the date of grant, and nonqualified options are granted at prices determined by the Board of Directors. Vesting provisions are determined by the Board of Directors. There have been no grants made under the 2008 Plan as of December 31, 2008.2010.
2008 TransactionsStock Warrants
At December 31, 2010, there were no warrants to purchase common stock were outstanding.
During the year ended December 31, 2008, options2009, warrants to purchase up to 12,500700,000 shares of common stock expired.
2007 Transactions
During the year ended December 31, 2007, options to purchase up to 77,050 shares of common stock expired.
WARRANTS
At December 31, 2008, the following warrants to purchase common stock were outstanding:
Number of common shares covered by warrants | | Exercise Price | | Expiration Date |
| | | | | | |
| | 700,000 | | | 0.25 | February 2009 |
| | 700,000 | | | | | |
During the year ended December 31, 2008, warrants to purchase up to 3,222,734 shares of common stock expired.
During the year ended December 31, 2007, warrants to purchase 1,787,266 shares of common stock were exercised under a cashless exercise provision for 811,229 shares of common stock. The warrants had an exercise price of $0.10 per share.
9.NOTE 8 - INCOME TAXES:
The Company did not incur a domestic income tax expense for the years ended December 31, 20082010 and 2007.2009.
As of December 31, 2008,2010, the Company has net domestic operating loss carry forwards of approximately $3.4 million which expire between 20082011 and 2026. The Company's net operating loss carry forwards may be subject to annual limitations, which could reduce or defer the utilization of the losses as a result of an ownership change as defined in Section 382 of the Internal Revenue Code. The Company is currently examining the effects of the reorganization on the net operating loss carry forwards (see Note 3).
10.NOTE 9 - EARNINGS PER SHARE:
The Company calculates its basicBasic and diluted earningsnet income (loss) per share in accordance with SFAS No. 128, “Earnings per Share”. Basic earnings per share(“EPS”) is calculatedcomputed by dividing net income (loss) (the numerator) by the weighted average number of common shares outstanding for(the denominator), during the period. Diluted EPS gives effect to potentially dilutive common shares outstanding during the period, except in periods where it is anti-dilutive.
The following table provides a reconciliation of the numerators and denominators used in calculating basic and diluted earnings per share is calculated by adjustingfor the weighted average outstanding shares to assume conversion of all potentially dilutive warrants, options and convertible securities such as convertible preferred stock or convertible notes if applicable.periods presented below (in thousands, except per share data):
| | | Year ended December 31, | | | Year ended December 31, | |
| | | 2008 | | | 2007 | | | 2010 | | | 2009 | |
| | | | | | | | | | | | | |
| Net income, as reported | | $ | 638,319 | | | $ | 437,824 | | | $ | 4,201,431 | | | $ | 2,182,620 | |
| Basic earnings per share: | | | | | | | | | | | | | | | | |
| Basic weighted average shares outstanding | | 39,187,237 | | | 22,619,875 | | | | 625,826,320 | | | | 76,465,837 | |
| Basic earnings per common share | | $ | 0.02 | | | $ | 0.02 | | | $ | 0.01 | | | $ | 0.03 | |
| Diluted earnings per share: | | | | | | | | | | | | | | | | |
| Basic weighted average shares outstanding | | 39,187,237 | | | 22,619,875 | | | | 625,826,320 | | | | 76,465,837 | |
| Effective of dilutive instruments | | | 58,780,856 | | | | 47,843,604 | | | | 99,532,696 | | | | 25,000,000 | |
| Diluted weighted average shares outstanding | | 97,968,093 | | | 70,463,479 | | | | 725,359,016 | | | | 101,465,837 | |
| Diluted earnings per common share | | $ | 0.01 | | | $ | 0.01 | | | $ | 0.01 | | | $ | 0.02 | |
NOTE 10 – FAIR VALUE MEASUREMENT
11.The Company has adopted the provisions of ASC 820-10, Fair Value Measurements and Disclosures, with respect to its non-financial assets and liabilities effective January 1, 2009. The adoption of ASC 820-10 did not have a material impact on the Company’s consolidated financial statements.
NOTE 11 - OTHER COMPREHENSIVE INCOME:
Balances of related after-tax components comprising accumulated other comprehensive income, included in stockholders’ equity, at December 31, 20082010 was as follows:
| | | Foreign Currency | | | (Loss) on | |
| | | Translation Adjustment | | | Investment Security | |
| | | | | | | |
| Balance at January 1, 2007 | | $ | (141,785 | ) | | $ | (3,075 | ) |
| Change for the year ended December 31, 2007 | | | 473,056 | | | | (1,109 | ) |
| Balance at January 1, 2008 | | | 331,271 | | | | (4,184 | ) |
| Change for the year ended December 31, 2008 | | | 497,796 | | | | (4,184 | ) |
| Balance at December 31, 2008 | | $ | 829,067 | | | $ | (8,368 | ) |
| | | Foreign Currency | | | Gain (Loss) on | |
| | | Translation Adjustment | | | Investment Security | |
| | | | | | | |
| Balance at December 31, 2008 | | $ | 829,067 | | | $ | (8,368 | ) |
| Change for the year ended December 31, 2009 | | | (89,556 | ) | | | 8,368 | |
| Balance at December 31, 2009 | | | 739,511 | | | | - | |
| Change for the year ended December 31, 2010 | | | 233,493 | | | | - | |
| Balance at December 31, 2010 | | $ | 973,004 | | | $ | - | |
12.
NOTE 12 - SEGMENT INFORMATION:
SFAS No. 131, “Disclosures about SegmentsOperating segments are defined as components of an Enterprise” requires companies to reportenterprise about which separate financial information aboutis available, where the chief operating segmentsdecision-maker evaluates regularly in interimdetermining allocation of resources and annual financial statements. It also requires segment disclosures about products and services and major customers.assessing performance. The Company has determined that it does not have any separately reportable operating segments.segments and therefore operates and evaluates its business as one reporting unit.
13.NOTE 13 - COMMITMENTS AND CONTINGENCIES:
Office Leases
The principal executive office of the Company is located at 14860 Montfort Drive, Suite 210, Dallas, Texas 75254. The Company moved to these offices during the fall of 2006. NewMarket Technology, the majority stockholder of the Company, leases the space.
CLPTEC’s offices are located at No. 123 Qinjiang Road, Shanghai, 200233, Peoples Republic of China. The offices are leased from Gaozhi Science and Technology Development, Ltd., a strategic partner, on a month-to-month basis. The rent expense for the year ended December 31, 20082010 was approximately $6,336.$7,000.
Litigation
From time to time, the Company is involved in various claims and legal actions arising in the ordinary course of business. Although the amount of any liability that could arise with respect to currently pending actions cannot be accurately predicted, in the opinion of management, the ultimate disposition of these matters will not have a material adverse effect on the Company's consolidated financial position, results of operations, or liquidity.
14. SELECTED QUARTERLY FINANCIAL DATA (UNAUDITED):
The following interim financial information presents the 2008 and 2007 results of operations on a quarterly basis (in thousands, except per share amounts):
| | | First | | | Second | | | Third | | | Fourth | |
| | | Quarter | | | Quarter | | | Quarter | | | Quarter | |
| | | | | | | | | | | | | |
| 2008: | | | | | | | | | | | | |
| Revenues | | $ | 8,516 | | | $ | 10,675 | | | $ | 11,145 | | | $ | 11,542 | |
| Operating income | | | 162 | | | | 521 | | | | 360 | | | | 215 | |
| Net income | | | 97 | | | | 265 | | | | 155 | | | | 121 | |
| Income per share, basic | | $ | 0.00 | | | $ | 0.01 | | | $ | 0.01 | | | $ | 0.00 | |
| Income per share, diluted | | $ | 0.00 | | | $ | 0.01 | | | $ | 0.00 | | | $ | 0.00 | |
| | | | | | | | | | | | | | | | | |
| 2007: | | | | | | | | | | | | | | | | |
| Revenues | | $ | 7,080 | | | $ | 10,190 | | | $ | 10,652 | | | $ | 12,085 | |
| Operating income (loss) | | | (31 | ) | | | 41 | | | | 138 | | | | 523 | |
| Net income | | | (17 | ) | | | (5 | ) | | | 58 | | | | 402 | |
| Income per share, basic | | $ | 0.00 | | | $ | 0.00 | | | $ | 0.00 | | | $ | 0.02 | |
| Income per share, diluted | | $ | 0.00 | | | $ | 0.00 | | | $ | 0.00 | | | $ | 0.01 | |
15.NOTE 14 – SUBSEQUENT EVENTS (UNAUDITED):
In March 2009,The Company evaluates subsequent events for purposes of recognition or disclosure in the Company announcedfinancial statements through the date that CLPTEC acquired an additional 25% interest in Clipper Huali from Huali in exchange for the financial statements are issued. There were no reportable subsequent events as of the date of issuance of 750 shares of Series B Convertible Preferred Stock, $.001 par value, $1,000 per share stated value, bringing its total ownership in Clipper Huali to 76% and reducing Huali’s ownership interest to 24%.this report.
In March 2009, the Company filed a Definitive Information Statement on Schedule 14C indicating that the Company had authorized a reverse split of the common stock issued and outstanding on a one new share for twenty-five old shares basis. Additionally, the Company’s Articles of Incorporation were to be amended to increase the number of authorized common shares from two hundred million (200,000,000) to one billion (1,000,000,000). These actions will be effective on or about April 14, 2009.F-16