UNITED STATES
SECURITIES AND EXCHANGE COMMISSION
Washington, D.C.DC 20549
_______________
FORM 10-K
|
| |
| (Mark One) | |
| R | Annual report pursuant to Section 13 or 15(d) of the Securities Exchange Act of 1934 |
| | |
| | For the fiscal year ended December 31, 20092011 |
| | |
| or |
| | |
£o | Transition report pursuant to Section 13 or 15(d) of the Securities Exchange Act of 1934 |
| | |
| | For the transition period from __________ to __________ |
| | |
| | Commission file number 1-3950 |
Ford Motor Company
(Exact name of Registrant as specified in its charter)
|
| |
| Delaware | 38-0549190 |
| (State of incorporation) | (I.R.S. employer identification no.Employer Identification No.) |
| | |
| One American Road, Dearborn, Michigan | 48126 |
| (Address of principal executive offices) | (Zip code)Code) |
313-322-3000
(Registrant’s telephone number, including area code)
Securities registered pursuant to Section 12(b) of the Act:
|
| | |
| Title of each class | | Name of each exchange on which registered *registered* |
| Common Stock, par value $.01 per share | | New York Stock Exchange |
| | |
| 7.50% Notes Due June 10, 2043 | | New York Stock Exchange |
| | |
Ford Motor Company Capital Trust II | | New York Stock Exchange |
6.50% Cumulative Convertible Trust Preferred | | |
Securities, liquidation preference $50 per share | | |
__________
* | * In addition, shares of Common Stock of Ford are listed on certain stock exchanges in Europe. |
Securities registered pursuant to Section 12(g) of the Act: None.
Indicate by check mark if the registrant is a well-known seasoned issuer, as defined in Rule 405 of the Securities Act. Yes R No £o
Indicate by check mark if the registrant is not required to file reports pursuant to sectionSection 13 or Section 15(d) of the Act.
Yes £o No R
Indicate by check mark if the registrant (1) has filed all reports required to be filed by Section 13 or 15(d) of the Securities Exchange Act of 1934 during the preceding 12 months (or for such shorter period that the registrant was required to file such reports), and (2) has been subject to such filing requirements for the past 90 days. Yes R No £o
Indicate by check mark whether the registrant has submitted electronically and posted on its corporate Web site, if any, every Interactive Data File required to be submitted and posted pursuant to Rule 405 of Regulation S-T (§232.405 of this chapter) during the preceding 12 months (or for such shorter period that the registrant was required to submit and post such files). Yes R No £o
Indicate by check mark if disclosure of delinquent filers pursuant to Item 405 of Regulation S-K (§229.405 of this chapter) is not contained herein, and will not be contained, to the best of registrant’s knowledge, in definitive proxy or information statements incorporated by reference in Part III of this Form 10-K or any amendment to this Form 10-K. R
Indicate by check mark whether the registrant is a large accelerated filer, an accelerated filer, a non-accelerated filer, or a non-accelerated filer.smaller reporting company. See definitiondefinitions of "large accelerated filer," "accelerated filer," and large accelerated filer""smaller reporting company" in Rule 12b-2 of the Exchange Act. Large accelerated filer R Accelerated filer £o Non-accelerated filer £o
Indicate by check mark whether the registrant is a shell company (as defined in Rule 12b-2 of the Act). Yes £o No R
As of June 30, 2009,2011, Ford had outstanding 3,149,667,0033,728,794,458 shares of Common Stock and 70,852,076 shares of Class B Stock. Based on the New York Stock Exchange Composite Transaction closing price of the Common Stock on that date ($6.0713.79 per share), the aggregate market value of such Common Stock was $19,118,478,708.$51,420,075,576. Although there is no quoted market for our Class B Stock, shares of Class B Stock may be converted at any time into an equal number of shares of Common Stock for the purpose of effecting the sale or other disposition of such shares of Common Stock. The shares of Common Stock and Class B Stock outstanding at June 30, 20092011 included shares owned by persons who may be deemed to be "affiliates" of Ford. We do not believe, however, that any such person should be considered to be an affiliate. For information concerning ownership of outstanding Common Stock and Class B Stock, see the Proxy Statement for Ford’sFord's Annual Meeting of Stockholders currently scheduled to be held on May 13, 201010, 2012 (our "Proxy Statement"), which is incorporated by reference under various Items of this Report as indicated below.
As of February 12, 2010,13, 2012, Ford had outstanding 3,297,413,6053,729,894,765 shares of Common Stock and 70,852,076 shares of Class B Stock. Based on the New York Stock Exchange Composite Transaction closing price of the Common Stock on that date ($11.1212.54 per share), the aggregate market value of such Common Stock was $36,667,239,288.$46,772,880,353.
DOCUMENTS INCORPORATED BY REFERENCE
|
| | |
| Document | | Where Incorporated |
| Proxy Statement* | | Part III (Items 10, 11, 12, 13 and 14) |
__________
| |
| * | As stated under various Items of this Report, only certain specified portions of such document are incorporated by reference in this Report. |
Exhibit Index begins on page 90.
FORD MOTOR COMPANY
ANNUAL REPORT ON FORM 10-K
For the Year Ended December 31, 2011
|
| | | |
| Table of Contents | | Page |
| | | |
| | | |
| | | |
| | | |
| | | |
| | | |
| | | |
| | | |
| Item 1A | | | |
| Item 1B | | | |
| Item 2 | | | |
| Item 3 | | | |
| Item 4 | Mine Safety Disclosures | | |
| Item 4A | | | |
| | | |
| Item 5 | | | |
| Item 6 | | | |
| Item 7 | | | |
| | | |
| | | |
| | | |
| | | |
| | | |
| | | |
| | | |
| | | |
| | | |
| Item 7A | | | |
| | | |
| | | |
| | | |
| Item 8 | | | |
| Item 9 | | | |
| Item 9A | | | |
| Item 9B | | | |
| | | |
| Item 10 | | | |
| Item 11 | | | |
| Item 12 | | | |
| Item 13 | | | |
| Item 14 | | | |
| | | |
|
| | | |
| | | |
| Table of Contents | | |
| (continued) | | |
| | | |
| Item 15 | | | |
| | | |
| | | |
| | | |
| | | |
| | | |
| | | |
| | | |
| | | |
| | | |
| | | |
| | | |
| | | |
| | | |
| | | |
| | | |
| | | |
| | | |
| | | |
| | | |
| | | |
| | | |
| | | |
| | | |
| | | |
| | | |
| | | |
| | | |
| | | |
| | | |
| | | |
PART II.
ITEM 1.Business
Ford Motor Company (referred to herein as "Ford", the "Company", "we", "our" or "us") was incorporated in Delaware in 1919. We acquired the business of a Michigan company, also known as Ford Motor Company, thatwhich had been incorporated in 1903 to produce and sell automobiles designed and engineered by Henry Ford. We are one of the world’s largest producers of cars and trucks. We and our subsidiaries also engage in other businesses, including financing vehicles.
In addition to the information about Ford and itsour subsidiaries contained in this Annual Report on Form 10-K for the year ended December 31, 20092011 ("20092011 Form 10-K Report" or "Report"), extensive information about our Company can be found at www.ford.comwww.corporate.ford.com, including information about our management team, our brands and products, and our corporate governance principles.
The corporate governance information on our website includes our Corporate Governance Principles, Code of Ethics for Senior Financial Personnel, Code of Ethics for the Board of Directors, Standards of Corporate Conduct for all employees, and the Charters for each of the Committees of our Board of Directors. In addition, any amendments to our Code of Ethics or waivers granted to our directors and executive officers will be posted in this area of our website. All of these documents may be accessed by logging ontogoing to our corporate website and clicking on "Investors,"Our Company," then "Company Information,"Corporate Governance," and then "Corporate Governance Policies," or may be obtained free of charge by writing to our Shareholder Relations Department, Ford Motor Company, One American Road, P.O. Box 1899, Dearborn, Michigan 48126-1899.
In addition, all of our recent periodic report filings with the Securities and Exchange Commission ("SEC") pursuant to Section 13(a) or 15(d) of the Securities Exchange Act of 1934, as amended, are available free of charge through our website. This includes recent Annual Reports on Form 10-K, Quarterly Reports on Form 10-Q, and Current Reports on Form 8-K, as well as any amendments to those Reports. Recent Section 16 filings made with the SEC by the Company or any of itsour executive officers or directors with respect to our Common Stock also are made available free of charge through our website. We post each of these documents on our website as soon as reasonably practicable after it is electronically filed with the SEC.
To access our SEC reports or amendments or the Section 16 filings, log ontogo to our corporate website and click "Investors,"Our Company," then "Company Reports,"Investor Relations," and then "View"Reports and SEC Filings," which links to a list of reports filed with the SEC. Our reports filed with the SEC may also be found on the SEC's website at www.sec.gov.
The foregoing information regarding our website and its content is for convenience only. The content of our website isonly and not deemed to be incorporated by reference into this Report nor should it be deemed to have been filed with the SEC.
ITEM 1. Business (continued)
OVERVIEW
Segments. We review and present our business results in two sectors: Automotive and Financial Services. Within these sectors, our business is divided into reportable segments based uponon the organizational structure that we use to evaluate performance and make decisions on resource allocation, as well as availability and materiality of separate financial results consistent with that structure.
OurThe reportable segments within our Automotive and Financial Services segments as ofsectors at December 31, 2009 are2011 were as described in the table below:
|
| | |
| Business Sector | Reportable Segments* (a) | Description |
| | | |
| Automotive: | Ford North America | Primarily includes the sale of Ford, LincolnFord- and Mercury brandLincoln-brand vehicles and related service parts in North America (the United States, Canada and Mexico), together with the associated costs to design, develop, manufacture, distribute and service these vehicles and parts, as well as, for periods prior to January 1, 2010, the sale of Mazda6 vehicles produced by our consolidated subsidiary AutoAlliance International, Inc. ("AAI"). |
| | parts. (b) |
| | Ford South America | Primarily includes the sale of Ford-brand vehicles and related service parts in South America, together with the associated costs to design, develop, manufacture, distribute and service these vehicles and parts. |
| | | |
| Ford Europe | Primarily includes the sale of Ford-brand vehicles and related service parts in Europe, Turkey and Russia, together with the associated costs to design, develop, manufacture, distribute and service these vehicles and parts. |
| | | |
| Ford Asia Pacific Africa | Primarily includes the sale of Ford-brand vehicles and related service parts in the Asia Pacific region and South Africa, together with the associated costs to design, develop, manufacture, distribute and service these vehicles and parts. |
| | |
| Volvo | Primarily includes the sale of Volvo-brand vehicles and related service parts throughout the world (including Europe, North and South America, and Asia Pacific Africa), together with the associated costs to design, develop, manufacture and service these vehicles and parts.
|
| | |
| Financial Services: | Ford Motor Credit Company | Primarily includes vehicle-related financing, leasing, and insurance. |
| | | |
| Other Financial Services | Includes a variety of businesses including holding companies and real estate, and the financing and leasing of some Volvo vehicles in Europe.estate. |
__________
* | |
| (a) | We have experienced a number of changes to our reportable segments in recent years, including:including the following: |
§ | As first reported in our Quarterly Report on Form 10-Q for
|
| ▪ | We discontinued the period ended March 31, 2009, Volvo currently is held for sale.Mercury brand as of the end of 2010. |
§ | |
| ▪ | We sold our Volvo operations on August 2, 2010. |
| |
| ▪ | During the fourth quarter of 2008, we sold a portion of our equity in Mazda Motor Corporation ("Mazda"), reducing our ownership percentage from approximately 33.4% at the time of sale to about 11% ownership currently. Asshortly thereafter. Through a result, beginningsubsequent sale in the fourth quarter of 2010, we further reduced our ownership to about 3.5%. Beginning with the fourth quarter of 2008, we accounthave accounted for our interest in Mazda as a marketable security and no longer report Mazda(instead of as an operating segment.segment). |
§ | As reported in our Quarterly Report on Form 10-Q for the period ended June 30, 2008, we
|
| ▪ | We sold our Jaguar Land Rover operations on June 2, 2008. |
§ | As reported in our Quarterly Report on Form 10-Q for the period ended June 30, 2007, we
|
| ▪ | We sold Aston Martin on May 31, 2007. |
| |
| (b) | For periods prior to January 1, 2009, this segment also included the sale of Mazda6 vehicles produced by our then-consolidated affiliate AutoAlliance International, Inc. ("AAI"). |
We provide financial information (such as revenue, income, and assets) for each business sector and reportable segment in three areas of this Report: (1) "Item 6. Selected Financial Data;" (2) "Item 7. Management’sManagement's Discussion and Analysis of Financial Condition and Results of Operations" ("Item 7"); and (3) Note 2827 of the Notes to the Financial Statements located at the end of this Report. Financial information relating to certain geographic areas is included in Note 2928 of the Notes to the Financial Statements.
ITEM 1. Business (continued)
AUTOMOTIVE SECTOR
General
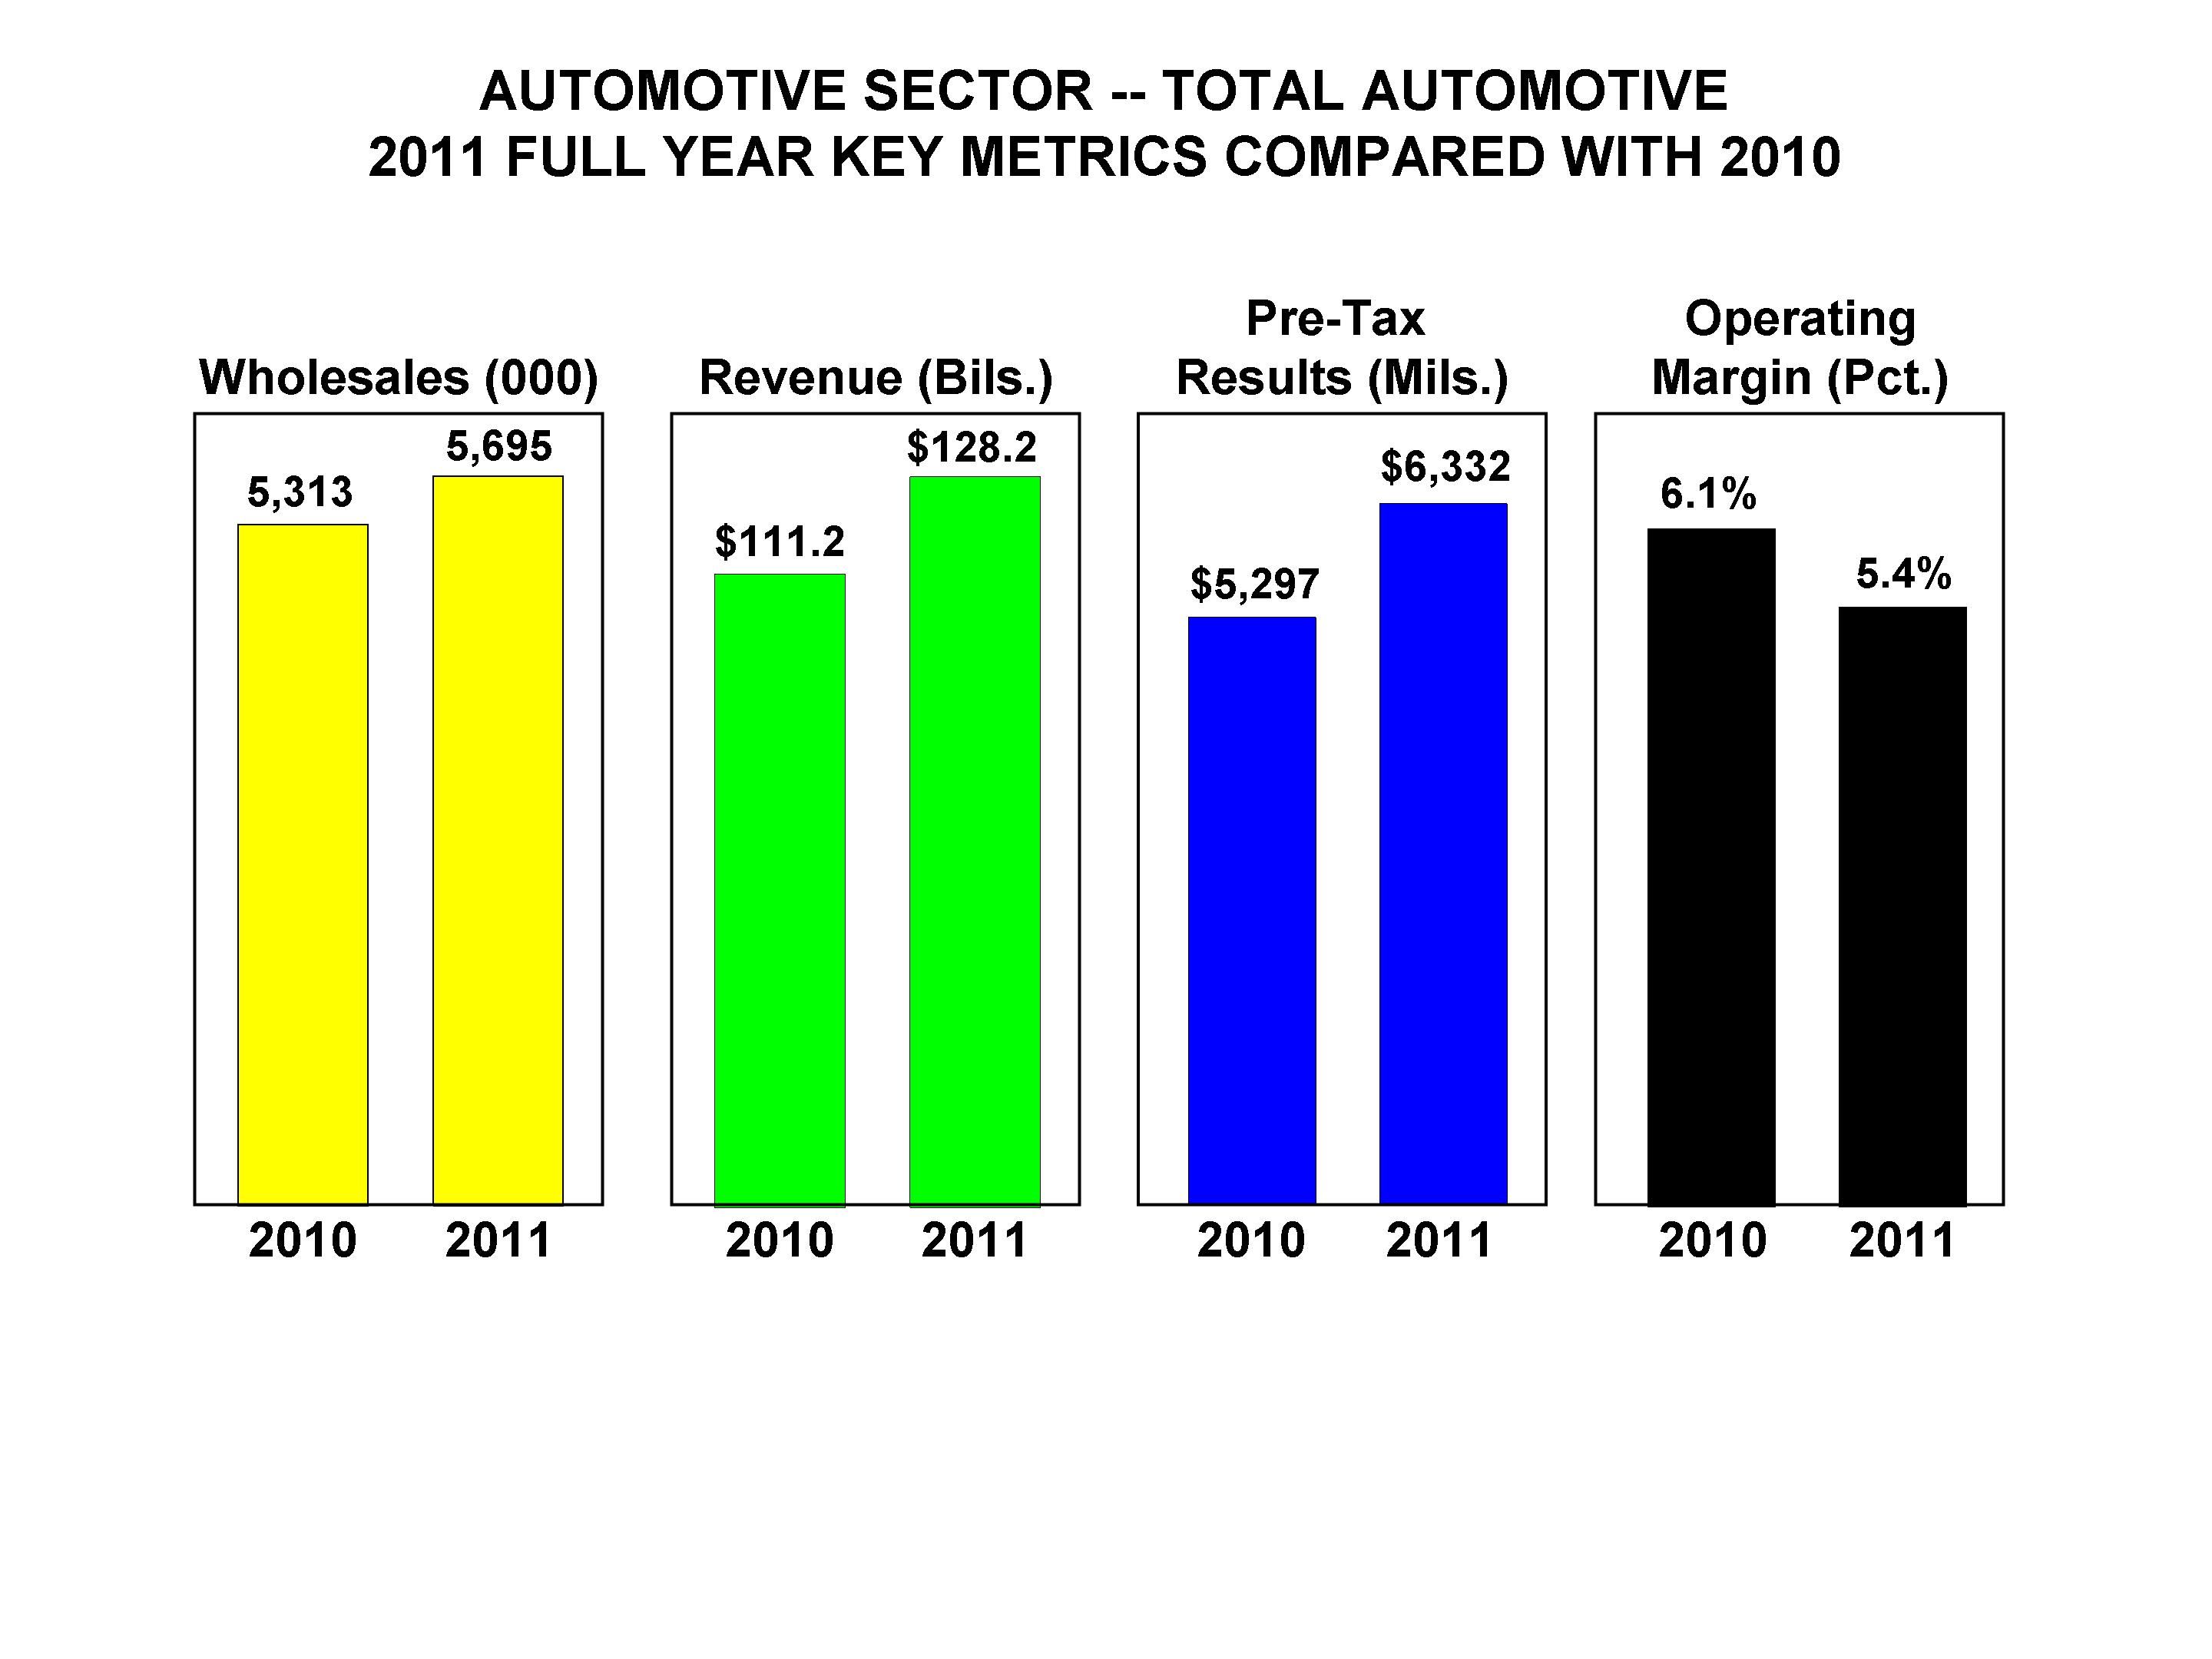
We sell carsOur vehicle brands are Ford and trucks throughout the world.Lincoln. In 2009, our total ongoing Automotive operations (including unconsolidated affiliates in China)2011, we sold approximately 4,817,0005,695,000 vehicles at wholesale throughout the world. See Item 7 for additional discussion of our calculation of wholesale unit volumes.
As of December 31, 2009, our vehicle brands included Ford, Mercury, Lincoln, and Volvo, although Volvo is held for sale. Substantially all of our cars, trucks and parts are marketed through retail dealers in North America, and through distributors and dealers (collectively, "dealerships") outside of North America, the substantial majority of which are independently owned. At December 31, 2009,2011, the approximate number of dealerships worldwide distributing our vehicle brands was as follows:
|
| |
| Brand | Number of Dealerships at December 31, 2009*2011 | | |
Ford | | | 11,682 | 10,653 |
Mercury
Ford-Lincoln (combined) | | | 1,780 | 907 |
Lincoln | | | 1,376 | 230 |
Volvo
Total | | | 2,269 | |
__________
* | Because many of these dealerships distribute more than one of our brands from the same sales location, a single dealership may be counted under more than one brand.11,790 |
In addition to the products we sell to our dealerships for retail sale, we also sell cars and trucks to our dealerships for sale to fleet customers, including daily rental car companies, commercial fleet customers, leasingdaily rental car companies, and governments. We do not depend on any single customer or small group of customers to the extent that the loss of such customer or group of customers would have a material adverse effect on our business.
Through our dealer network and other channels, we provide retail customers with a wide range of after-sale vehicle services and products, including maintenance and light repair, heavy repair, collision repair, vehicle accessories and extended service warranty.contracts. In North America, we market these products and services under several brands, including GenuineFord Service, Lincoln Service, Ford Custom Accessories™, Ford and Lincoln-Mercury Parts and ServiceSM, Ford Custom AccessoriesTM, FordLincoln Extended Service PlanSM,Plans, and MotorcraftSM.
The worldwide automotive industry, Ford included, is affected significantly by general economic conditions, (amongamong other factors)factors, over which we have little control. This is especially so because vehicles are durable goods, which provide consumers latitude in determining whether and when to replace an existing vehicle. The decision whether to purchase a vehicle may be affected significantly by slowing economic growth, geo-politicalgeopolitical events, and other factors (including the cost of purchasing and operating cars and trucks and the availability and cost of credit and fuel). As we recently have seen in the United States and Europe, in particular, the number of cars and trucks sold may vary substantially from year to year. Further, the automotive industry is a highly competitive cyclical business that has a wide and growing variety of product offerings from a growing number of manufacturers.
Our wholesale unit volumes vary with the level of total industry demand and our share of that industry demand. In the short term, our wholesale unit volumes also are influenced by the level of dealer inventory. Our share is influenced by how our products are perceived in comparison to those offered by other manufacturers based on many factors, including price, quality, styling, reliability, safety, fuel efficiency, functionality, and reputation. Our share also is affected by the timing and frequency of new model introductions. Our ability to satisfy changing consumer preferences with respect to type or size of vehicle, as well as design and performance characteristics, impacts our sales and earnings significantly.
ITEM 1. Business (continued)
TheAs with other manufacturers, the profitability of our business is affected by many factors, including:
§ | |
| ▪ | Wholesale unit volumes;volumes |
§ | |
| ▪ | Margin of profit on each vehicle sold;sold - which in turn is affected by many factors, including:such as: |
Market factors - volume and mix of vehicles and options sold, and net pricing (reflecting, among other factors, incentive programs)
Costs of components and raw materials necessary for production of vehicles
Costs for customer warranty claims and additional service actions
Costs for safety, emissions and fuel economy technology and equipment
· | Mix of vehicles and options sold; |
· ▪ | Costs of components and raw materials necessary for production of vehicles; |
· | Level of "incentives" (e.g., price discounts) and other marketing costs; |
· | Costs for customer warranty claims and additional service actions; and |
· | Costs for safety, emissions and fuel economy technology and equipment; and |
§ | As with other manufacturers, aA high proportion of relatively fixed structural costs, including labor costs, which meanso that small changes in wholesale unit volumes can significantly affect overall profitability.profitability |
ITEM 1. Business (continued)
Our industry continues to face a very competitive pricing environment, driven in part by industry excess capacity.capacity, particularly in mature markets such as North America and Europe. For the past several decades, manufacturers typically have given price discounts and other marketing incentives to maintain market share and production levels. A discussion of our strategies to compete in this pricing environment is set forth in the "Overview" section in Item 7.
Competitive Position. The worldwide automotive industry consists of many producers, with no single dominant producer. Certain manufacturers, however, account for the major percentage of total sales within particular countries, especially their countries of origin. Detailed information regarding our competitive position in the principal markets where we compete may be found below as part of the overall discussion of the automotive industry in those markets.Key competitors with global presence include Fiat-Chrysler, General Motors Company, Honda Motor Company, Hyundai-Kia Automotive Group, PSA Peugeot Citroen, Renault-Nissan B.V., Suzuki Motor Corporation, Toyota Motor Corporation, and Volkswagen AG Group.
Seasonality. We generally record the sale of a vehicle (and recognize sales proceeds in revenue) when it is produced and shipped or delivered to our customer (i.e., the dealership). See the "Overview" section in Item 7 for additional discussion of revenue recognition practices.
We manage our vehicle production schedule based on a number of factors, including retail sales (i.e., units sold by our dealerships to their customers at retail) and dealer stock levels (i.e., the number of units held in inventory by our dealerships for sale to retail and fleettheir customers). In the past, we have experienced some seasonal fluctuation in the business, with production in many markets tending to be higher in the first half of the year to meet demand in the spring and summer (typically the strongest sales months of the year). Third quarter production has tended to be the lowest. As a result, operating results for the third quarter typically have been less favorable than other quarters.
Raw Materials. We purchase a wide variety of raw materials from numerous suppliers around the world for use in production of our vehicles. These materials include ferrous metals (e.g., steel and iron castings), non-ferrous metals (e.g., aluminum), precious metals (e.g., palladium), ferrous metals (e.g., steel and iron castings), energy (e.g., natural gas), and plastics/resins (e.g., polypropylene). We believe that we have adequate supplies or sources of availability of the raw materials necessary to meet our needs. There always are always risks and uncertainties however, with respect to the supply of raw materials, thathowever, which could impact availability in sufficient quantities to meet our needs. See the "Overview" section of Item 7 for a discussion of commodity and energy price trends, and "Item 7A. Quantitative and Qualitative Disclosures About Market Risk" ("Item 7A") for a discussion of commodity price risks.
Backlog Orders. We generally produce and ship our products on average within approximately 20 days after an order is deemed to become firm. Therefore, no significant amount of backlog orders accumulates during any period.
Intellectual Property. We own or hold licenses to use numerous patents, copyrights, and trademarks on a global basis. Our policy is to protect our competitive position by, among other methods, filing U.S. and international patent applications to protect technology and improvements that we consider important to the development of our business. We have generated a large number of patents, and expect this portfolio to continue to grow as we actively pursue additional technological innovation. We currently have approximately 15,90017,660 active patents and pending patent applications globally, with an average age for patents in our active patent portfolio of just over 5under five and a half years. In addition to this intellectual property, we also rely on our proprietary knowledge and ongoing technological innovation to develop and maintain our competitive position. Although we believe that these patents, patent applications, and know-how, in the aggregate, are important to the conduct of our business, and we obtain licenses to use certain intellectual property owned by others, none is individually considered material to our business. We also own numerous trademarks and service marks that contribute to the identity and recognition of our Company and its products and services globally. Certain of these marks are integral to the conduct of our business, a loss of any of which could have a material adverse effect on our business.
ITEM 1. Business (continued)
Warranty Coverage and Additional Service Actions. We currently provide warranties on vehicles we sell. Warranties are offered for specific periods of time and/or mileage, and vary depending upon the type of product, usage of the product and the geographic location of its sale. Types of warranty coverage offered include base coverage (e.g., "bumper-to-bumper" coverage in the United States on Ford-brand vehicles for 36 months or 36,000 miles, whichever occurs first), safety restraint coverage, and corrosion coverage. Beginning with 2007 model-year passenger cars and light trucks, Ford extended the powertrain warranty coverage offered on Ford, Lincoln and Mercury vehicles sold in the United States, Canada, and select U.S. export markets (e.g., powertrain coverage for certain vehicles sold in the United States from three years or 36,000 miles to five years or 60,000 miles on Ford and Mercury brands, and from four years or 50,000 miles to six years or 70,000 miles on the Lincoln brand). In compliance with regulatory requirements, we also provide emissions-defects and emissions-performance warranty coverage. Pursuant to these warranties, Fordwe will repair, replace, or adjust all parts on a vehicle that are defective in factory-supplied materials or workmanship during the specified warranty period.
In addition to the costs associated with the warranty coverage provided on our vehicles, we also incur costs as a result of additional service actions not covered by our warranties, including product recalls and customer satisfaction actions.
Estimated warranty and service action costs for each vehicle sold by us are accrued for at the time of sale. Accruals for estimated warranty and service action costs are based on historical experience and subject to adjustment from time to time depending on actual experience. Warranty accrual adjustments required when actual warranty claim experience differs from our estimates may have a material impact on our results.
For additional information with respect to costs forregarding warranty and additional service actions,related costs, see "Critical Accounting Estimates" in Item 7 as well asand Note 3130 of the Notes to the Financial Statements.
ITEM 1. Business (continued)
Industry Sales Volume
Industry sales volume is an internal estimate based on publicly-available data collected from various government, private, and public sources around the globe. The following chart shows industry sales volume for the United States,last five years for certain key markets in each region, and for the marketstotal we track in Europe,within each of our Ford North America, Ford South America, Ford Europe, and Ford Asia Pacific Africa for the last five yearsregions (in millions of units):
| | | | |
| | | | | | | | | | | | | | | | |
| | | | |
United States | | | 10.6 | | | | 13.5 | | | | 16.5 | | | | 17.1 | | | | 17.5 | |
Europe | | | 15.8 | | | | 16.6 | | | | 18.0 | | | | 17.8 | | | | 17.6 | |
South America | | | 4.2 | | | | 4.3 | | | | 4.1 | | | | 3.2 | | | | 2.7 | |
Asia Pacific Africa | | | 24.5 | | | | 20.9 | | | | 20.4 | | | | 18.6 | | | | 17.3 | |
|
| | | | | | | | | | | | | | |
| | Industry Sales Volume (a) |
| | 2011 | | 2010 | | 2009 | | 2008 | | 2007 |
| United States | 13.0 |
| | 11.8 |
| | 10.6 |
| | 13.5 |
| | 16.5 |
|
| Canada | 1.6 |
| | 1.6 |
| | 1.5 |
| | 1.7 |
| | 1.7 |
|
| Mexico | 0.9 |
| | 0.8 |
| | 0.8 |
| | 1.1 |
| | 1.1 |
|
| Ford North America | 15.5 |
| | 14.2 |
| | 12.9 |
| | 16.3 |
| | 19.3 |
|
| | | | | | | | | | |
| Brazil | 3.6 |
| | 3.5 |
| | 3.1 |
| | 2.8 |
| | 2.5 |
|
| Argentina | 0.8 |
| | 0.7 |
| | 0.5 |
| | 0.6 |
| | 0.6 |
|
| Ford South America (b) | 5.4 |
| | 5.0 |
| | 4.2 |
| | 4.3 |
| | 4.1 |
|
| | | | | | | | | | |
| Britain | 2.2 |
| | 2.3 |
| | 2.2 |
| | 2.5 |
| | 2.8 |
|
| Germany | 3.5 |
| | 3.2 |
| | 4.0 |
| | 3.4 |
| | 3.5 |
|
| Ford Europe (c) | 15.3 |
| | 15.3 |
| | 15.9 |
| | 16.6 |
| | 18.0 |
|
| | | | | | | | | | |
| Turkey | 0.9 |
| | 0.8 |
| | 0.6 |
| | 0.5 |
| | 0.6 |
|
| Russia | 2.7 |
| | 2.0 |
| | 1.5 |
| | 3.1 |
| | 2.7 |
|
| | | | | | | | | | |
| China | 18.4 |
| | 18.3 |
| | 14.1 |
| | 9.9 |
| | 9.1 |
|
| India | 3.3 |
| | 3.1 |
| | 2.3 |
| | 2.0 |
| | 2.0 |
|
| Australia | 1.0 |
| | 1.0 |
| | 0.9 |
| | 1.0 |
| | 1.1 |
|
| South Africa | 0.5 |
| | 0.4 |
| | 0.4 |
| | 0.5 |
| | 0.6 |
|
| ASEAN (d) | 2.6 |
| | 2.4 |
| | 1.9 |
| | 2.0 |
| | 1.8 |
|
| Ford Asia Pacific Africa (e) | 30.4 |
| | 30.7 |
| | 24.5 |
| | 20.9 |
| | 20.4 |
|
________________________
* | |
| (a) | Throughout this section,Report, industry sales volume includesand wholesale unit volumes include sales of medium and heavy trucks. See discussion of each |
| |
| (b) | Ford South America industry sales volume and market belowshare are based, in part, on estimated vehicle registrations for definition of the six markets we track.track in the region (i.e., Argentina, Brazil, Chile, Colombia, Ecuador, and Venezuela). |
| |
| (c) | Ford Europe industry sales volume and market share are based, in part, on estimated vehicle registrations for the 19 markets we track (i.e., Austria, Belgium, Britain, Czech Republic, Denmark, Finland, France, Germany, Greece, Hungary, Ireland, Italy, Netherlands, Norway, Poland, Portugal, Spain, Sweden, and Switzerland); sales of Ford-brand vehicles in Turkey and Russia by our unconsolidated affiliates Ford Otomotiv Sanayi Anonim Sirketi ("Ford Otosan") and Ford Sollers Netherlands B.V. ("FordSollers"), respectively, contribute to Ford Europe's wholesale unit volumes, but are not reflected in industry sales volume or market share for the region. |
| |
| (d) | ASEAN includes Indonesia, Malaysia, Philippines, Thailand, and Vietnam. |
| |
| (e) | Ford Asia Pacific Africa industry sales volume and market share are based, in part, on estimated vehicle sales for the 12 markets we track (i.e., Australia, China, Japan, India, Indonesia, Malaysia, New Zealand, Philippines, South Africa, Taiwan, Thailand, and Vietnam); market share data for 2008 to the present include local-brand vehicles produced by our Chinese joint venture Jiangling Motors Corporation, Ltd. ("JMC"). |
U.S. and European industry sales volume declined in 2009 compared with 2008, reflecting weak economic conditions in both markets. The decline in Europe was more modest because the impact of the economic slowdown was offset somewhat by substantial government-sponsored vehicle scrappage program incentives. Asia Pacific Africa industry sales increased in 2009 as compared to 2008, largely driven by growth in China.
United States
Industry Sales Data. The following table shows U.S. industry sales of cars and trucks (in millions of units):
| | | U.S. Industry Sales |
| | | Years Ended December 31, |
| | | | | | | | | | | | | | | |
| | | |
Cars | | | 5.6 | | | | 7.1 | | | | 7.9 | | | | 8.1 | | | | 7.9 | |
Trucks | | | 5.0 | | | | 6.4 | | | | 8.6 | | | | 9.0 | | | | 9.6 | |
ITEM 1. Business (continued)
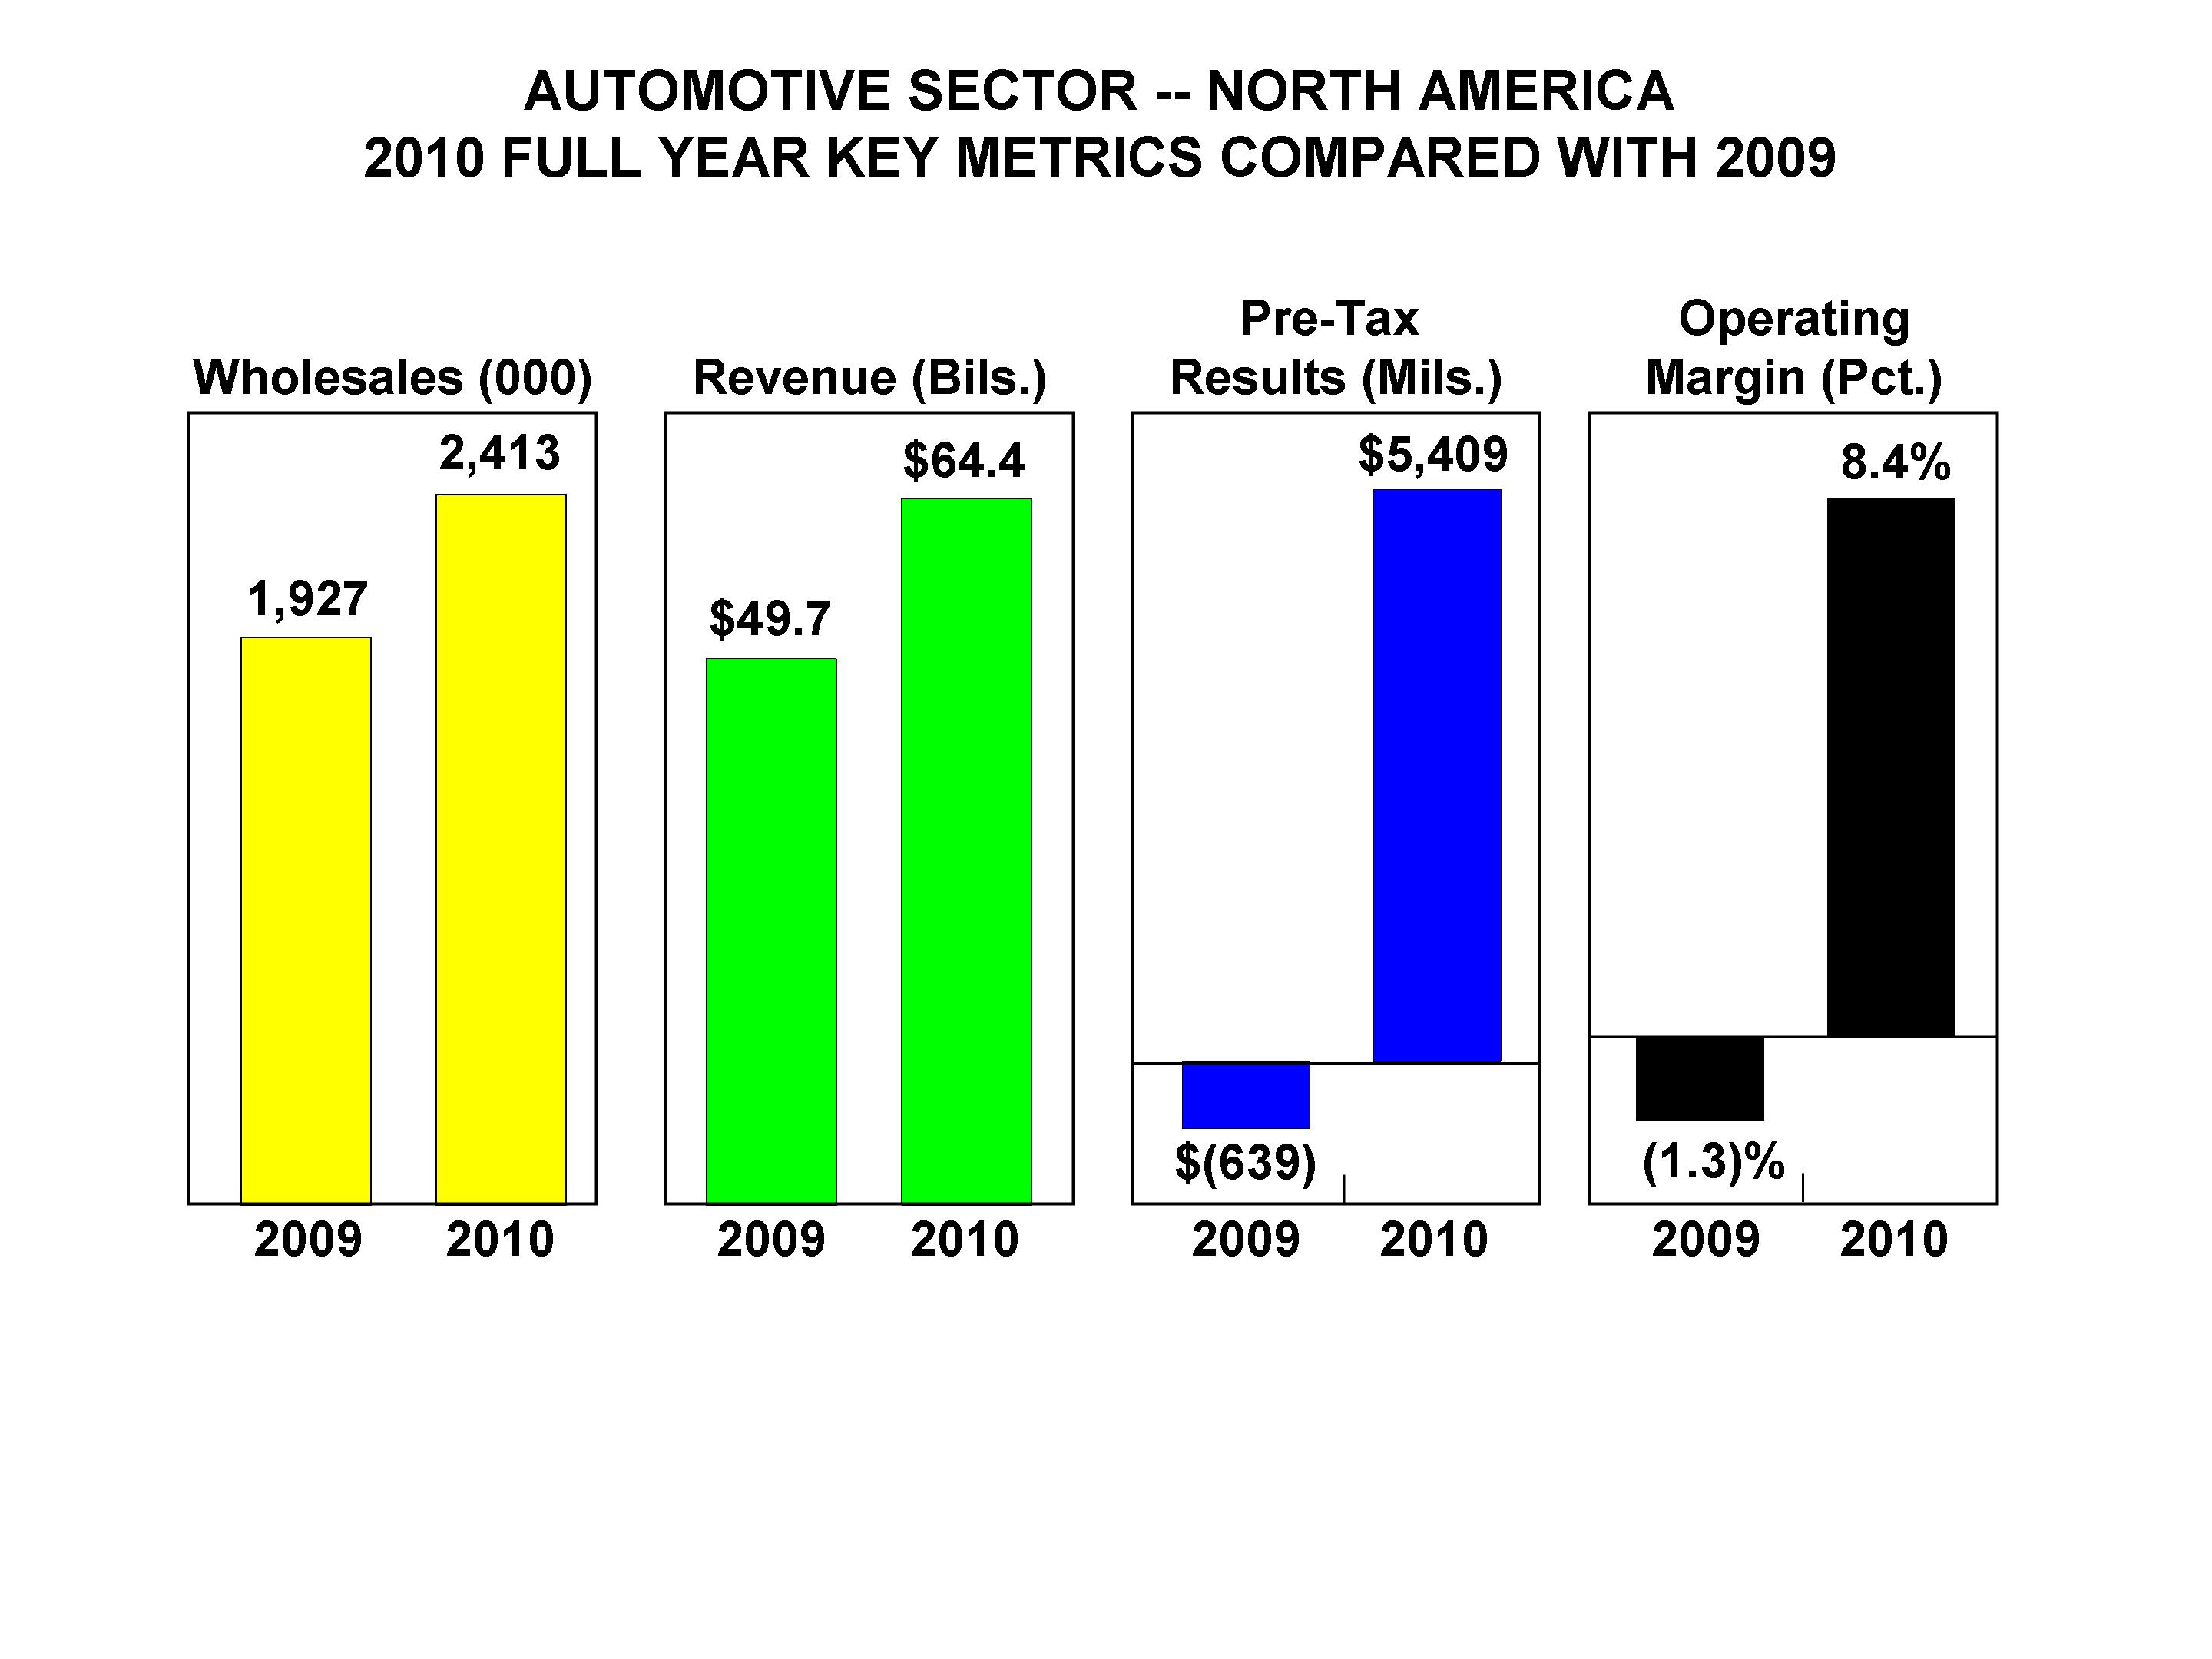
We classify cars by small, medium, large, and premium segments, and trucks by compact pickup, bus/van (including minivans), full-size pickup, crossover utility vehicles ("CUVs") and traditional sport utility vehicles ("SUVs"), and medium/heavy segments. We refer to CUVs, which are based on car platforms, and SUVs, which are based on truck platforms, collectively as "utilities" or "utility vehicles." In the tables, we have classified all of our luxury cars as "premium," regardless of size. Annually, we review various factors to determine the appropriate classification of vehicle segments and the vehicles within those segments, and this review occasionally results in a change of classification for certain vehicles.Ford North America
The following tables show our wholesales and market share by market in North America:
|
| | | | | | | | | | | | | | |
| | Wholesales (a) |
| | (in thousands) |
| | 2011 | | 2010 | | 2009 | | 2008 | | 2007 |
| United States | 2,224 |
| | 1,947 |
| | 1,563 |
| | 1,825 |
| | 2,363 |
|
| Canada | 273 |
| | 278 |
| | 223 |
| | 198 |
| | 243 |
|
| Mexico | 88 |
| | 88 |
| | 80 |
| | 134 |
| | 140 |
|
| Ford North America (b) | 2,686 |
| | 2,413 |
| | 1,927 |
| | 2,329 |
| | 2,890 |
|
______________
(a) Throughout this Report, wholesale unit volumes include all Ford-badged units (whether produced by Ford or by an unconsolidated affiliate), units manufactured by Ford that are sold to other manufacturers and units distributed for other manufacturers, and JMC-brand vehicles. Revenue from certain vehicles in wholesale unit volumes (specifically, Ford-badged vehicles produced and distributed by our unconsolidated affiliates, and JMC-brand vehicles) are not included in our revenue. Vehicles sold to daily rental car companies that are subject to a guaranteed repurchase option, as well as other sales of finished vehicles for which the proportionrecognition of U.S. car and truckrevenue is deferred (e.g., consignments), are included in wholesale unit sales by segment for the industry (including domestic and foreign-based manufacturers) and for Ford:volumes.
| | | U.S. Industry Vehicle Mix of Sales by Segment | |
| | | Years Ended December 31, | |
| | | | | | | | | | | | | | | | |
| CARS | | | | | | | | | | | | | | | |
Small | | | 23.7 | % | | | 22.9 | % | | | 19.8 | % | | | 19.0 | % | | | 17.1 | % |
Medium | | | 16.1 | | | | 15.5 | | | | 13.6 | | | | 13.1 | | | | 13.1 | |
Large | | | 5.4 | | | | 6.1 | | | | 7.0 | | | | 7.5 | | | | 7.4 | |
Premium | | | 7.3 | | | | 7.8 | | | | 7.8 | | | | 7.6 | | | | 7.8 | |
Total U.S. Industry Car Sales | | | 52.5 | | | | 52.3 | | | | 48.2 | | | | 47.2 | | | | 45.4 | |
| TRUCKS | | | | | | | | | | | | | | | | | | | | |
Compact Pickup | | | 2.6 | | | | 2.8 | | | | 3.2 | | | | 3.5 | | | | 3.9 | |
Bus/Van | | | 5.5 | | | | 6.1 | | | | 6.6 | | | | 7.8 | | | | 8.1 | |
Full-Size Pickup | | | 10.8 | | | | 11.9 | | | | 13.5 | | | | 13.3 | | | | 14.6 | |
Utilities | | | 27.1 | | | | 24.9 | | | | 26.5 | | | | 25.2 | | | | 25.5 | |
Medium/Heavy | | | 1.5 | | | | 2.0 | | | | 2.0 | | | | 3.0 | | | | 2.5 | |
Total U.S. Industry Truck Sales | | | 47.5 | | | | 47.7 | | | | 51.8 | | | | 52.8 | | | | 54.6 | |
Total U.S. Industry Vehicle Sales | | | 100.0 | % | | | 100.0 | % | | | 100.0 | % | | | 100.0 | % | | | 100.0 | % |
| | | Ford U.S. Vehicle Mix of Sales by Segment* | |
| | | Years Ended December 31, | |
| | | | | | | | | | | | | | | | |
| CARS | | | | | | | | | | | | | | | |
Small | | | 14.0 | % | | | 15.0 | % | | | 12.8 | % | | | 12.5 | % | | | 11.6 | % |
Medium | | | 12.8 | | | | 9.3 | | | | 7.8 | | | | 12.9 | | | | 8.2 | |
Large | | | 6.8 | | | | 7.7 | | | | 8.4 | | | | 8.2 | | | | 8.9 | |
Premium | | | 3.1 | | | | 3.1 | | | | 2.5 | | | | 3.1 | | | | 2.8 | |
Total Ford U.S. Car Sales | | | 36.7 | | | | 35.1 | | | | 31.5 | | | | 36.7 | | | | 31.5 | |
| TRUCKS | | | | | | | | | | | | | | | | | | | | |
Compact Pickup | | | 3.4 | | | | 3.4 | | | | 3.0 | | | | 3.4 | | | | 4.1 | |
Bus/Van | | | 5.8 | | | | 6.5 | | | | 7.2 | | | | 8.6 | | | | 8.9 | |
Full-Size Pickup | | | 25.6 | | | | 27.2 | | | | 29.1 | | | | 29.6 | | | | 30.7 | |
Utilities | | | 28.2 | | | | 27.4 | | | | 28.6 | | | | 21.1 | | | | 24.3 | |
Medium/Heavy | | | 0.3 | | | | 0.4 | | | | 0.6 | | | | 0.6 | | | | 0.5 | |
Total Ford U.S. Truck Sales | | | 63.3 | | | | 64.9 | | | | 68.5 | | | | 63.3 | | | | 68.5 | |
Total Ford U.S. Vehicle Sales | | | 100.0 | % | | | 100.0 | % | | | 100.0 | % | | | 100.0 | % | | | 100.0 | % |
__________
* | These data |
| (b) | Throughout this Report, regional wholesale unit volumes include sales of Ford, Lincoln, and Mercury vehicles.wholesales to various export markets. |
|
| | | | | | | | | | | | | | |
| | Market Share (a) |
| | 2011 | | 2010 | | 2009 | | 2008 | | 2007 |
| United States | 16.5 | % | | 16.4 | % | | 15.3 | % | | 14.2 | % | | 14.6 | % |
| Canada | 17.1 | % | | 16.9 | % | | 15.2 | % | | 12.6 | % | | 13.3 | % |
| Mexico | 9.4 | % | | 10.5 | % | | 11.8 | % | | 12.1 | % | | 13.3 | % |
As the tables above indicate, the shift from cars to trucks that began______________
(a) Throughout this Report, market share represents reported retail sales of our brands as a percent of total industry sales volume in the 1980s startedrelevant market (as opposed to reverse in 2005. Priorwholesale unit volumes reflecting sales directly by us to 2005, the proportion of trucks sold in the industry and by Ford had been increasing, reflecting higher sales of SUVs and full-size pickups. In recent years, the percentage of cars sold in the overallour customers, generally our dealers); market and by Ford has trended higher, primarily due to a shift in consumer preferences to smaller, more fuel-efficient vehicles. In 2009, overall changes in our U.S. vehicle mix generally followed the overall direction of U.S. industry trends. Our year-over-year growth in car mix, however, outpaced the industry, primarily fueled by the strength of our medium-car mix and sales led by our redesigned Ford Fusion, Fusion Hybrid, Mercury Milan and Milan Hybrid.share data also exclude Volvo.
United States. Market Share Data.The competitive environment in the United States has intensified and is expected to continuecontinues to intensify as Japanese and Koreanforeign manufacturers increase imports to the United States and increase production capacity in North America. Our principal competitorsOverall, we see a long-term industry trend toward smaller and more fuel-efficient vehicles, and we believe the long-term trend of growth in the United States include General Motors Company ("General Motors"), Chrysler Group LLC ("Chrysler"), Toyota Motor Corporation ("Toyota"), Honda Motor Company ("Honda"), and Nissan Motor Company ("Nissan").U.S. small car segment remains intact. The following tables show U.S.small car and truck marketsegment has increased its share for Ford (Ford, Lincoln, and Mercury brand vehicles only) and for the other five leading vehicle manufacturers. The percentagesfrom 14% in each2004 to 20.6% in 2009 - one of the following tables represent percentagesmost significant segment shifts in the industry. Although small cars dipped to 18.8% of industry in 2010, the segment grew again in 2011, increasing to 19.1% of total industry. At the same time, our sales of small cars at Ford were up 25% in 2011, giving us 10% share of the combinedsmall car segment and truck industry:more than a full percentage point increase compared to 2010 - our best share in the U.S. small car segment since 2003.
ITEM 1. Business (continued)
| | | U.S. Car Market Shares (a) | |
| | | Years Ended December 31, | |
| | | | | | | | | | | | | | | | |
Ford | | | 5.5 | % | | | 5.0 | % | | | 4.6 | % | | | 5.8 | % | | | 5.4 | % |
General Motors | | | 9.1 | | | | 10.0 | | | | 9.8 | | | | 10.0 | | | | 10.2 | |
Chrysler | | | 2.5 | | | | 3.6 | | | | 4.2 | | | | 4.1 | | | | 4.0 | |
Toyota | | | 10.0 | | | | 10.0 | | | | 9.2 | | | | 8.6 | | | | 7.4 | |
Honda | | | 6.5 | | | | 6.6 | | | | 5.3 | | | | 4.9 | | | | 4.8 | |
Nissan | | | 4.8 | | | | 4.4 | | | | 3.8 | | | | 3.2 | | | | 3.3 | |
All Other (b) | | | 14.1 | | | | 12.7 | | | | 11.3 | | | | 10.6 | | | | 10.3 | |
Total U.S. Car Deliveries | | | 52.5 | % | | | 52.3 | % | | | 48.2 | % | | | 47.2 | % | | | 45.4 | % |
| | | U.S. Truck Market Shares (a) | |
| | | Years Ended December 31, | |
| | | | | | | | | | | | | | | | |
Ford | | | 9.8 | % | | | 9.2 | % | | | 10.0 | % | | | 10.2 | % | | | 11.6 | % |
General Motors | | | 10.6 | | | | 12.1 | | | | 13.6 | | | | 14.1 | | | | 15.6 | |
Chrysler | | | 6.3 | | | | 7.2 | | | | 8.4 | | | | 8.4 | | | | 9.2 | |
Toyota | | | 6.7 | | | | 6.4 | | | | 6.7 | | | | 6.3 | | | | 5.6 | |
Honda | | | 4.3 | | | | 4.0 | | | | 4.1 | | | | 3.9 | | | | 3.6 | |
Nissan | | | 2.5 | | | | 2.7 | | | | 2.7 | | | | 2.8 | | | | 2.9 | |
All Other (b) | | | 7.3 | | | | 6.1 | | | | 6.3 | | | | 7.1 | | | | 6.1 | |
Total U.S. Truck Deliveries | | | 47.5 | % | | | 47.7 | % | | | 51.8 | % | | | 52.8 | % | | | 54.6 | % |
| | U.S. Combined Car and Truck Market Shares (a) | |
| | | Years Ended December 31, | |
| | | | | | | | | | | | | | | | |
Ford | | | 15.3 | % | | | 14.2 | % | | | 14.6 | % | | | 16.0 | % | | | 17.0 | % |
General Motors | | | 19.7 | | | | 22.1 | | | | 23.4 | | | | 24.1 | | | | 25.8 | |
Chrysler | | | 8.8 | | | | 10.8 | | | | 12.6 | | | | 12.5 | | | | 13.2 | |
Toyota | | | 16.7 | | | | 16.4 | | | | 15.9 | | | | 14.9 | | | | 13.0 | |
Honda | | | 10.8 | | | | 10.6 | | | | 9.4 | | | | 8.8 | | | | 8.4 | |
Nissan | | | 7.3 | | | | 7.1 | | | | 6.5 | | | | 6.0 | | | | 6.2 | |
All Other (b) | | | 21.4 | | | | 18.8 | | | | 17.6 | | | | 17.7 | | | | 16.4 | |
Total U.S. Car and Truck Deliveries | | | 100.0 | % | | | 100.0 | % | | | 100.0 | % | | | 100.0 | % | | | 100.0 | % |
__________
(a) | All U.S. sales data are based on publicly available information from the media and trade publications. |
(b) | "All Other" primarily includes companies based in Korea, other Japanese manufacturers and various European manufacturers, and, with respect to the U.S. Truck Market Shares table and U.S. Combined Car and Truck Market Shares table, includes heavy truck manufacturers. |
Although the full-size pickup segment also has begun to grow in share of total industry again, we believe we will need to see a continued and sustainable recovery in the construction industry (including new housing starts) in order to see the full-size pickup segment increase significantly as a percentage of total industry sales. With the full-size pickup segment at 10.7% of industry in 2009, 11.6% in 2010, and unchanged in 2011, we believe the segment is still in its initial phase of a cyclical recovery. The peak year for full-size pickup trucks was 2004, with 14.7% of total industry. Within the full-size pickup truck segment, our F-Series retains strong market leadership.
Our improvementstrong U.S. vehicle sales in 2011 reflect our balanced portfolio of fuel-efficient vehicles. Our results marked the third consecutive year-over-year that our overall U.S. market share primarily ishas increased, with the result of several factors, including favorable acceptance ofimprovement driven in large measure by our redesigned products, product focus on industry growth segments,new Fiesta small car and customers' increasing awarenessEscape and acceptance of our commitment to leadership in quality, fuel efficiency, safety, smart technologies and value.Explorer utilities.
In addition to the Ford, Lincoln, and Mercury vehicles we sell in the U.S. market, we also sell a significant number of Volvo vehicles. Our market share for Volvo vehicles in the United States (which is reflected in "All Other" in the tables above) was approximately 0.6% in 2009, up 0.1 percentage points from 2008. This increase in market share primarily reflected the introduction of the new XC60 and improved sales of the V50.
Fleet Sales.The sales data and market share information provided above include both retail and fleet sales. Fleet sales includeincludes sales to commercial fleet customers, daily rental car companies, and governments; in general, fleet sales tend to be less profitable than retail sales. In 2011, fleet sales were 32% of our total sales; the majority was with commercial fleetand government customers, leasing companies,which are more profitable than daily rentals. In 2011, our daily rental business was 12% of total sales, lower than the industry average of 13%. As the leading manufacturer of commercial vehicles in the United States, commercial buyers are increasingly choosing Ford cars and governments.crossovers because of our improved resale values, and continue to favor Ford trucks and vans.
ITEM 1. Business (continued)
The table below shows our fleetCanada. Industry sales volume in Canada grew 3% in 2011 compared with the prior year. Within that total, truck sales increased by 1.6 percentage points to 56% of overall industry vehicle sales, while car sales decreased to 44% of industry sales volume. Our sales growth in the market earned Ford Canada the sales leadership title for the second year in a row. Strong sales in 2011 primarily reflected increased sales of cars, which gained 14% over the United States,prior year, in addition to our already strong truck sales performance. In 2011, Ford Canada earned segment leadership with Fusion, Mustang, Escape, Explorer, Ranger, F-150, and Super Duty.
Mexico. Industry sales volume in Mexico grew 10% during 2011. Segmentation shifts in the amount of those combinedindustry away from trucks and utilities and toward cars contributed to our share decline. Fleet sales also decreased in the last year as a percentageresult of our total U.S. car and truck sales for the last five years (in thousands):
| | | Ford Fleet Sales* | |
| | | Years Ended December 31, | |
| | | | | | | | | | | | | | | | |
Daily Rental Units | | | 205 | | | | 237 | | | | 304 | | | | 447 | | | | 440 | |
Commercial and Other Units | | | 156 | | | | 217 | | | | 268 | | | | 277 | | | | 256 | |
Government Units | | | 127 | | | | 153 | | | | 158 | | | | 162 | | | | 141 | |
Total Fleet Units | | | 488 | | | | 607 | | | | 730 | | | | 886 | | | | 837 | |
| | | | | | | | | | | | | | | | | | | | | |
Percent of Total U.S. Car and Truck Sales | | | 30 | % | | | 32 | % | | | 30 | % | | | 32 | % | | | 28 | % |
__________
* | These data include sales of Ford, Lincoln, and Mercury vehicles. |
Lower fleet sales in 2009 primarily reflected an overall industry decline in rental, commercial and government sectors. Although total fleet industry volume decreased for the year, we improved year-over-year fleet segment market share. We continue to maintain profitable government and commercial segment cutbacks. Our plans for near-term market share leadership over all brands.growth include new model launches - including in the fastest-growing segment, small cars.
Ford South America
As indicated, we track industry sales and market share for six markets in South America - Argentina, Brazil, Chile, Colombia, Ecuador, and Venezuela. Ford South America's wholesales are more inclusive, tracking Ford-brand vehicles in every market in the region. Brazil and Argentina are our highest-volume South American markets. In particular, Brazil's economy and demographics, with growing per capita income, low vehicle ownership rates, and a young population, have allowed its automotive market to more than double since 2002. These favorable factors are expected to continue to contribute to growth in vehicle sales in Brazil. The following tables show our wholesales and market share in the largest markets and in total:
|
| | | | | | | | | | | | | | |
| | Wholesales |
| | (in thousands) |
| | 2011 | | 2010 | | 2009 | | 2008 | | 2007 |
| Brazil | 346 |
| | 358 |
| | 336 |
| | 297 |
| | 258 |
|
| Argentina | 105 |
| | 85 |
| | 66 |
| | 77 |
| | 77 |
|
| Ford South America | 506 |
| | 489 |
| | 443 |
| | 435 |
| | 438 |
|
|
| | | | | | | | | | | | | | |
| | Market Share |
| | 2011 | | 2010 | | 2009 | | 2008 | | 2007 |
| Brazil | 9.8 | % | | 10.4 | % | | 10.3 | % | | 10.0 | % | | 10.8 | % |
| Argentina | 12.9 |
| | 12.4 |
| | 13.3 |
| | 12.4 |
| | 13.7 |
|
| Ford South America | 9.3 |
| | 9.8 |
| | 10.2 |
| | 9.7 |
| | 10.7 |
|
The competition in Brazil is intensifying, as a number of automotive manufacturers are bringing online substantial capacity increases in the market. The intensifying competitive environment is putting pressure on industry net pricing; our plans to leverage fully our One Ford plan, including the introduction of an all-new lineup of global products over the next two years, beginning in the second half of 2012, should benefit us in this market.
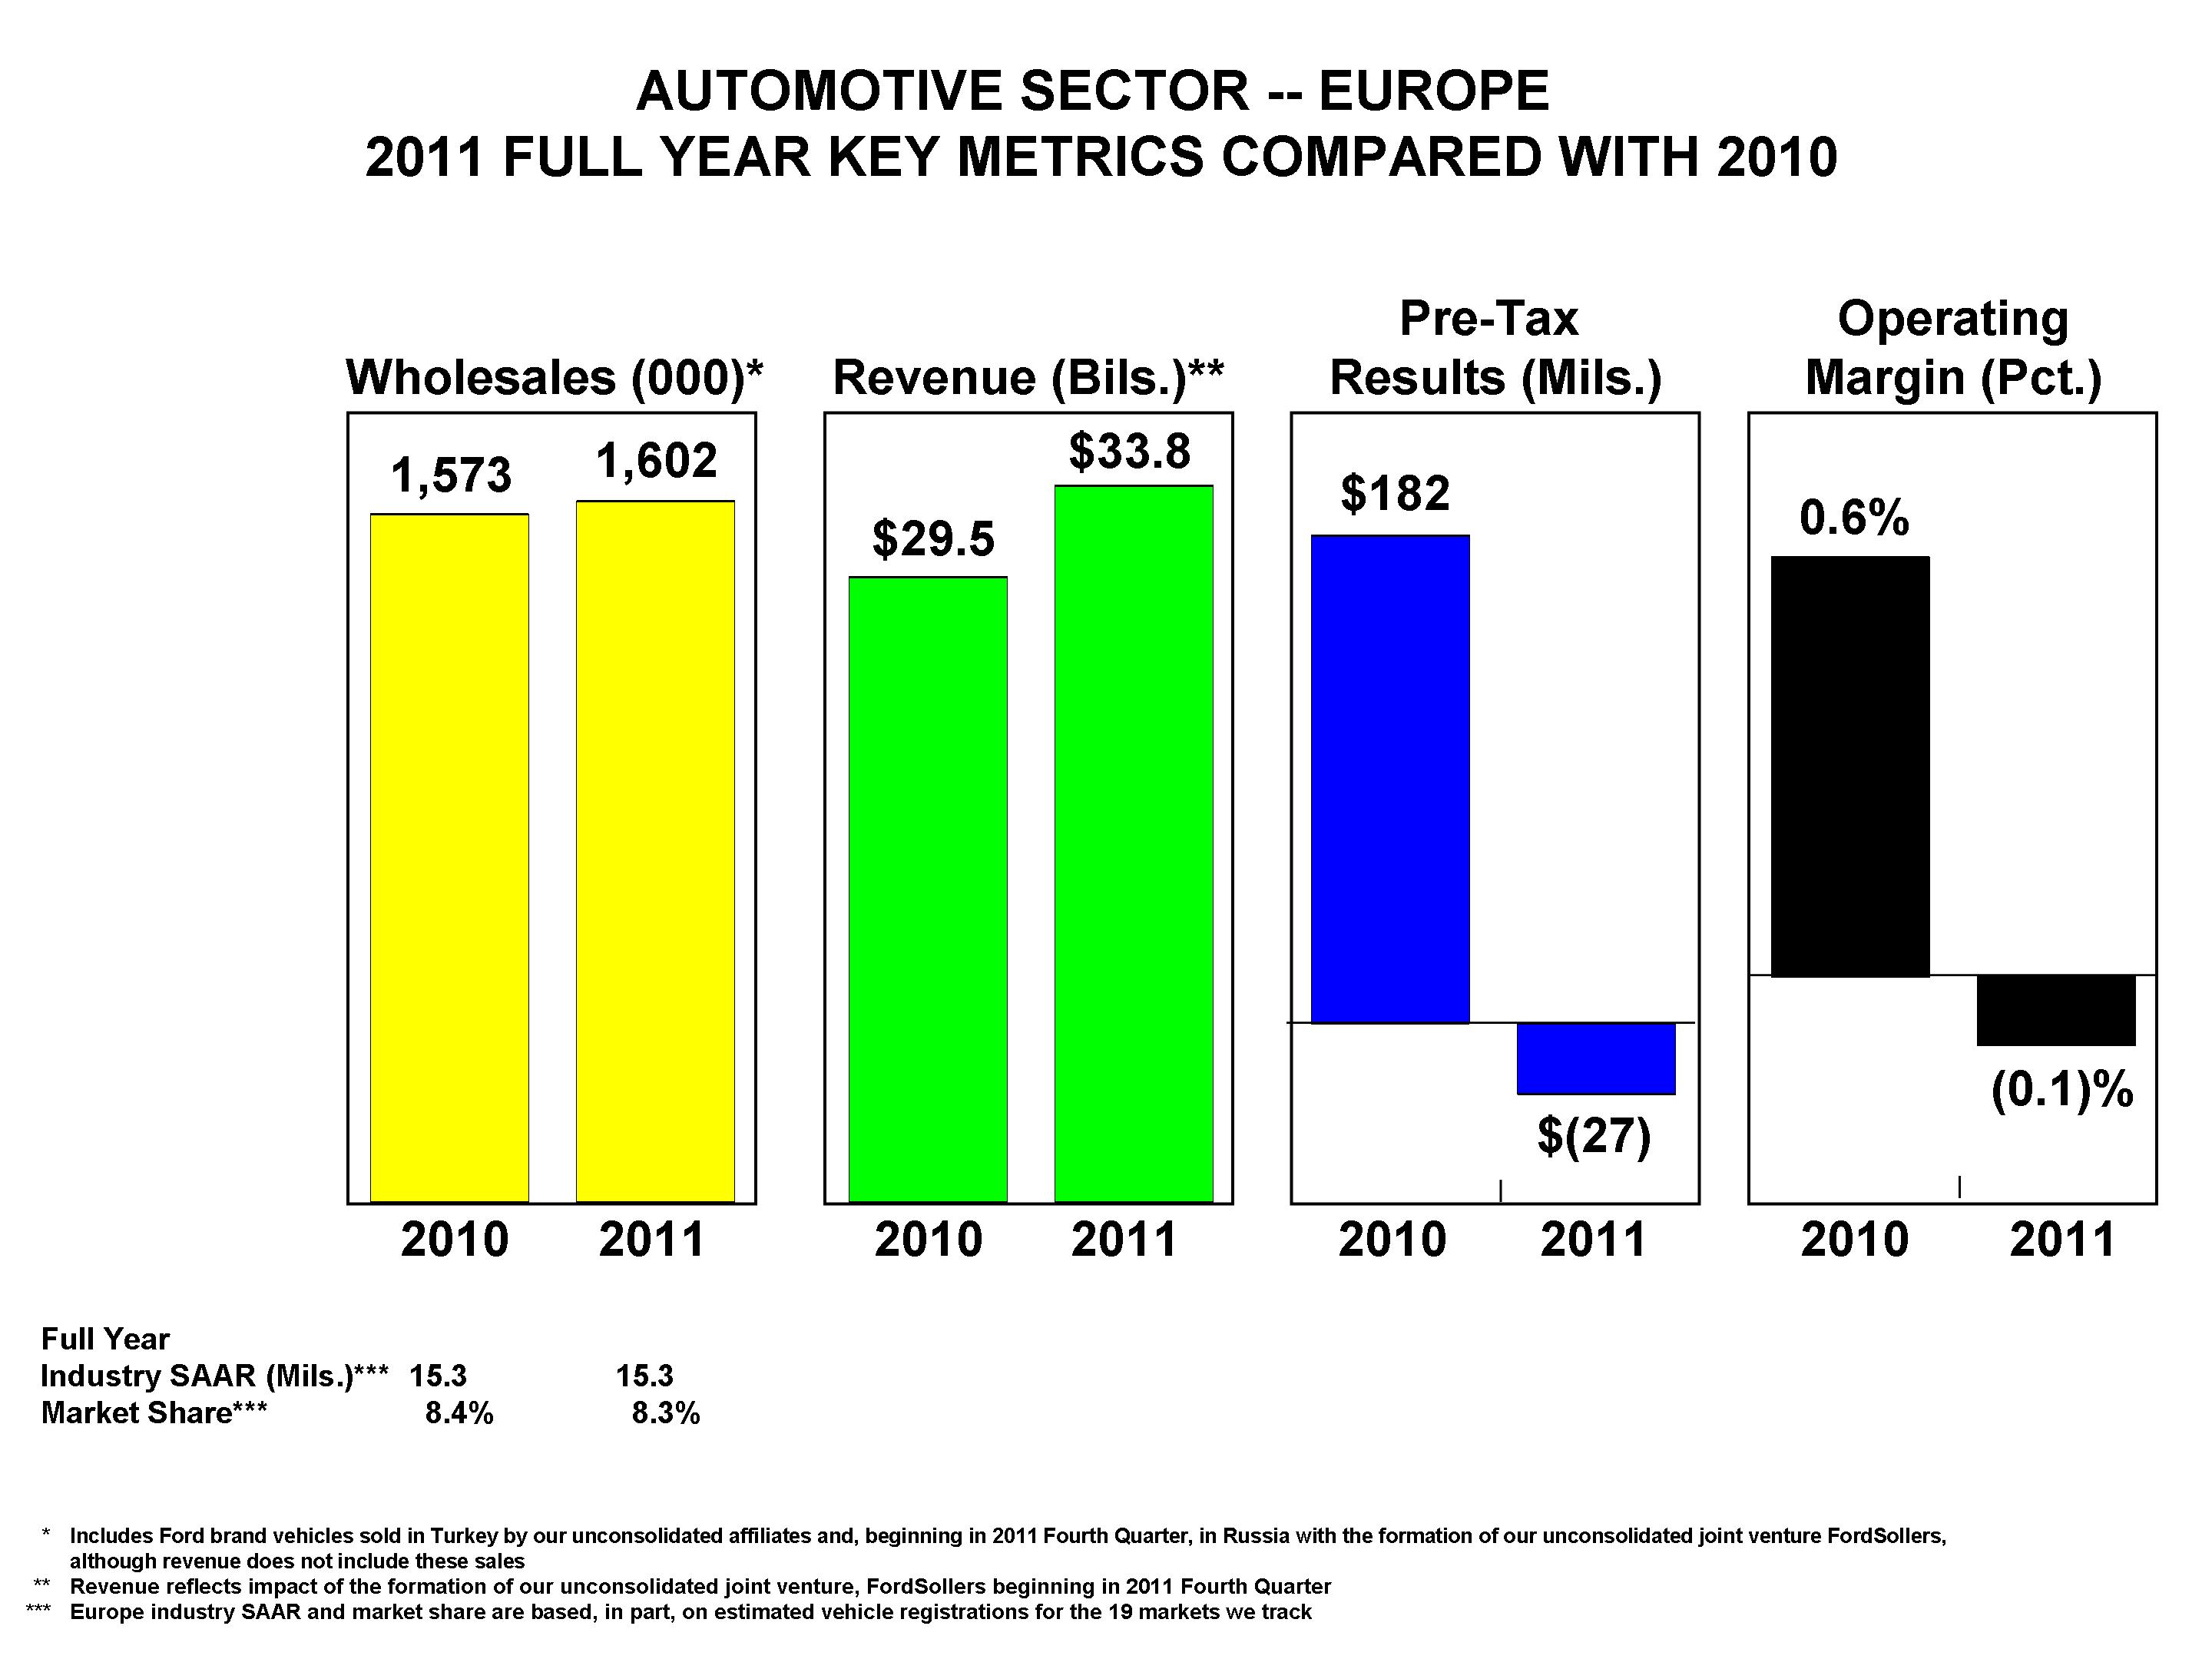
Ford Europe
Industry Sales Data
Market Share Information. Outside of the United States, Europe is our largest market for the sale of cars and trucks. The automotive industry in Europe is intensely competitive. Our principal competitors in Europe include General Motors, Volkswagen A.G. Group, PSA Group, Renault Group,competitive, and Fiat SpA. For the past 10 years, the top six manufacturers have collectively held between 70% and 77% of the total market. This competitive environment is expected to intensify further as Japanese and Korean manufacturers increase their production capacity in Europe,the region and as other manufacturers of premium brands (e.g., BMW, Mercedes-Benz and Audi) continue to broaden their product offerings.
For purposes of this discussion, 2009 market data are based on estimated registrations currently available; percentage change is measured from actual 2008 registrations. WeAs indicated, we track industry salesand market share in Europe for the following 19 markets: Britain, Germany, France, Italy, Spain, Austria, Belgium, Ireland, Netherlands, Portugal, Switzerland, Finland, Sweden, Denmark, Norway,Britain, Czech Republic, Denmark, Finland, France, Germany, Greece, Hungary, Ireland, Italy, Netherlands, Norway, Poland, Portugal, Spain, Sweden, and Poland. In 2009, vehicle manufacturers sold approximately 15.8 million carsSwitzerland. Ford Europe's wholesales are more inclusive, tracking Ford-brand vehicles in every market in the region, including those wholesales in Turkey and trucks in theseRussia from our unconsolidated affiliates, Ford Otosan and FordSollers.
|
| | | | | | | | | | | | | | |
| | Wholesales |
| | (in thousands) |
| | 2011 | | 2010 | | 2009 | | 2008 | | 2007 |
| Ford Europe | 1,602 |
| | 1,573 |
| | 1,568 |
| | 1,820 |
| | 1,918 |
|
|
| | | | | | | | | | | | | |
| | Market Share |
| | 2011 | | 2010 | | 2009 | | 2008 | | 2007 |
| Ford Europe | 8.3 | % | | 8.4 | % | | 9.1 | % | | 8.6%
| | 8.5 | % |
ITEM 1. Business (continued)
Within the 19 markets down 4.8% from 2008. Ford-brand combined car and truck market share in Europe in 2009 was approximately 9.1% (up 0.5 percentage points from the previous year); Volvo market share in Europe was 1.3% (about the same as in 2008).
we track, Britain and Germany are our highest-volume markets within Europe.markets. Any change in the British or German market has a significant effect on the results of Ford Europe. The following tables show our Ford Europe segment. The global economic crisis caused 2009 industrywholesales and market share for Britain and Germany (which are included within the 19 markets data above):
|
| | | | | | | | | | | | | | |
| | Wholesales |
| | (in thousands) |
| | 2011 | | 2010 | | 2009 | | 2008 | | 2007 |
| Britain | 342 |
| | 341 |
| | 354 |
| | 415 |
| | 414 |
|
| Germany | 250 |
| | 216 |
| | 286 |
| | 250 |
| | 230 |
|
|
| | | | | | | | | | | | | |
| | Market Share |
| | 2011 | | 2010 | | 2009 | | 2008 | | 2007 |
| Britain | 15.0 | % | | 15.0 | % | | 16.8%
| | 16.4 | % | | 15.9 | % |
| Germany | 7.4 |
| | 6.9 |
| | 7.6 | | 7.0 |
| | 6.7 |
|
Britain. Industry sales volume in Britain began to decline by 10.5% fromin 2008 levels (which were down considerably from 2007 levels,with the global financial crisis, and since 2003 has remained in the 2.2 million - 2.3 million unit range (compared with 2.8 million units in 2007).
Our market share remained steady in 2011 compared with the prior year, with Ford continuing as the economic crisis hit Britain earlier than many other European countries). Asmarket share leader in the Britain. Unusually high market share in 2009 was driven by the launch of the popular Ford Ka and Ford Fiesta small cars, coincident with the implementation of a result of government stimulusvehicle scrappage program designed to stimulate vehicle sales.
Germany. With 3.5 million new vehicle registrations in Germany, 20092011, Germany's industry sales volume there actually increasedgrew by 18.2%9.6% compared with 2008. Our Ford-brand combinedthe prior year. Germany was the only major market in Europe to experience an increase in industry sales volume in 2011, and remains the largest vehicle market in the European Union. In 2011, both passenger car and truck share in these markets in 2009commercial vehicle industry sales recovered along with the growing economy.
In 2011, Ford was 16.8% in Britain (up 0.4 percentage points from the previousfastest growing manufacturer (with vehicle unit sales up 17.6% compared with the prior year), and 7.6% in Germany (up 0.6increased market share by more than half of a percentage points frompoint primarily driven by the previous year).success of new Ford Focus, C-MAX, and S-MAX, as well as record sales of Ford Transit vehicles.
Turkey and Russia. Although not included in the results for the 19 European markets discussed above, several additional markets in the regionTurkey and Russia also contribute to our Ford Europe segment results. In 2009, Ford'sThe following tables show our wholesales and market share offor Turkey and Russia for the Turkish market increased by 0.4 percentage points to 15.1%, the eighth yearlast five years:
|
| | | | | | | | | | | | | | |
| | Wholesales |
| | (in thousands) |
| | 2011 | | 2010 | | 2009 | | 2008 | | 2007 |
| Turkey | 140 |
| | 130 |
| | 79 |
| | 78 |
| | 100 |
|
| Russia | 124 |
| | 93 |
| | 74 |
| | 183 |
| | 180 |
|
|
| | | | | | | | | | | | | | |
| | Market Share |
| | 2011 | | 2010 | | 2009 | | 2008 | | 2007 |
| Turkey | 15.8 | % | | 15.8 | % | | 15.1 | % | | 14.7 | % | | 16.8 | % |
| Russia | 4.3 |
| | 4.6 |
| | 5.5 |
| | 6.1 |
| | 6.5 |
|
Turkey. Industry growth slowed in a row that the Ford brand led the market in sales in Turkey. Industry sales volume in Russia decreased dramatically during 2009, shrinking by 1.6 million units or about half of its total volume2008 as a result of the economicglobal financial crisis. Beginning in 2009, industry vehicle sales accelerated due to government incentives put in place, with significant continuous increase in the last two years (from nearly 800,000 vehicle unit sales in 2010 to just over 900,000 vehicle unit sales in 2011). As shown above, our 2011 wholesales surpassed pre-crisis levels, and our market share has increased in recent years.
Russia. Following a 50% contraction in 2009 as a result of the impact of the global financial crisis reaching Russia, industry sales volume has returned almost to pre-crisis levels, with industry sales volume of 2.7 million units in 2011. Russia is the second-largest market for vehicle sales in Europe, and is expected to become the largest over the next several years. Our sales grew by 30% in 2011, led by strong sales of Ford-brand vehicles decreased by nearly 56% from 2008the new Focus and Transit. As previously reported, our Russian operations became part of the new FordSollers joint venture which began operations in October 2011. We expect this joint venture to about 82,000 unitscontribute to our ability to continue to grow profitably in 2009.this rapidly expanding market.
ITEM 1. Business (continued)
Motor Vehicle Distribution in Europe. In 2009, the European Commission abolished the 2002 the Commissionblock exemption law that had been specific to vehicle distribution agreements, and adopted instead a new generic regulation applying to all manufacturer-distributor relationships. The new law represents a marked improvement for manufacturers, and we have concluded new agreements with our dealers reflecting most of the European Union ("Commission") adopted a new regulatory schemeimprovements that changed the way motor vehicles are sold and repaired ("Block Exemption Regulation"). Pursuant to this regulation, manufacturers must operate either an "exclusive" distribution system – with exclusive dealer sales territories, but with the possibility of sales to any reseller (e.g., supermarket chains, internet agencies and other resellers not authorized by the manufacturer), who in turn could sell to end customers both within and outside of the dealer’s exclusive sales territory – or a "selective" distribution system.
ITEM 1. Business (continued)
We, like most other automotive manufacturers, elected to establish a "selective" distribution system, allowing us to restrict the dealer’s ability to sell our vehicles to unauthorized resellers. Under this "selective" system, we are entitled to determine the number of dealers we establish but, since October 2005, not their locations. Under either system permitted by the Block Exemption Regulation, the rules make it easier for a dealer to display and sell multiple brands in one store without the need to maintain separate facilities.
Under the Block Exemption Regulation, the Commission also adopted sweeping changes to the repair industry. Dealers no longer could be required by the manufacturer to perform repair work. Instead, dealers could subcontract repair work to independent repair shops that met reasonable criteria set by the manufacturer. These authorized repair facilities could perform warranty and recall work, in addition to other repair and maintenance work. While a manufacturer may continue to require the use of its parts in warranty and recall work, for all other repair work the repair facilities may use parts made by others that are of comparable quality. We have negotiated and implemented Dealer, Authorized Repairer and Spare Part Supply contractswill enter into effect on a country-by-country level and, therefore, the Block Exemption Regulation applies with respect to all of our dealers.
With these rules, the Commission intended to increase competition and narrow price differences from country to country. The Commission's Block Exemption Regulation continues to contribute to an increasingly competitive market for vehicles and parts, and to ongoing price convergence. This has contributed to an increase in marketing expenses, negatively affecting the profitability of Ford Europe and Volvo.
The current Block Exemption Regulation expires on May 31, 2010. In December 2009, the Commission launched a public review process for a revised Block Exemption Regulation and guidelines on motor vehicles sales and repair agreements. The Commission proposes to adopt a new block exemption for repair and maintenance services, in which area the Commission believes competition to be more limited. The Commission also proposes to adopt guidelines dealing with specific issues for both motor vehicle sales and repair. It is expected that the Commission will adopt final regulation in the spring of 2010.
Other Markets
Canada and Mexico. Canada and Mexico also are important markets for us. In Canada, industry sales volume for new cars and trucks in 2009 was approximately 1.48 million units, down 11% from 2008 levels; industry sales volume in Mexico for new cars and trucks in 2009 was approximately 770,000 units, down 28% from 2008. The decrease in industry sales volume in these markets reflected the impact of the global economic slowdown beginning in the fourth quarter of 2008. Our combined car and truck market share (including all of our brands sold in these markets) in 2009 was 15.2% for Canada (up 2.6 percentage points from a year ago), which represents our highest full-year share since 2001 and made Ford the number-one selling brand in Canada, and 11.8% in Mexico (down 0.3 percentage points from the previous year).June 1, 2013.
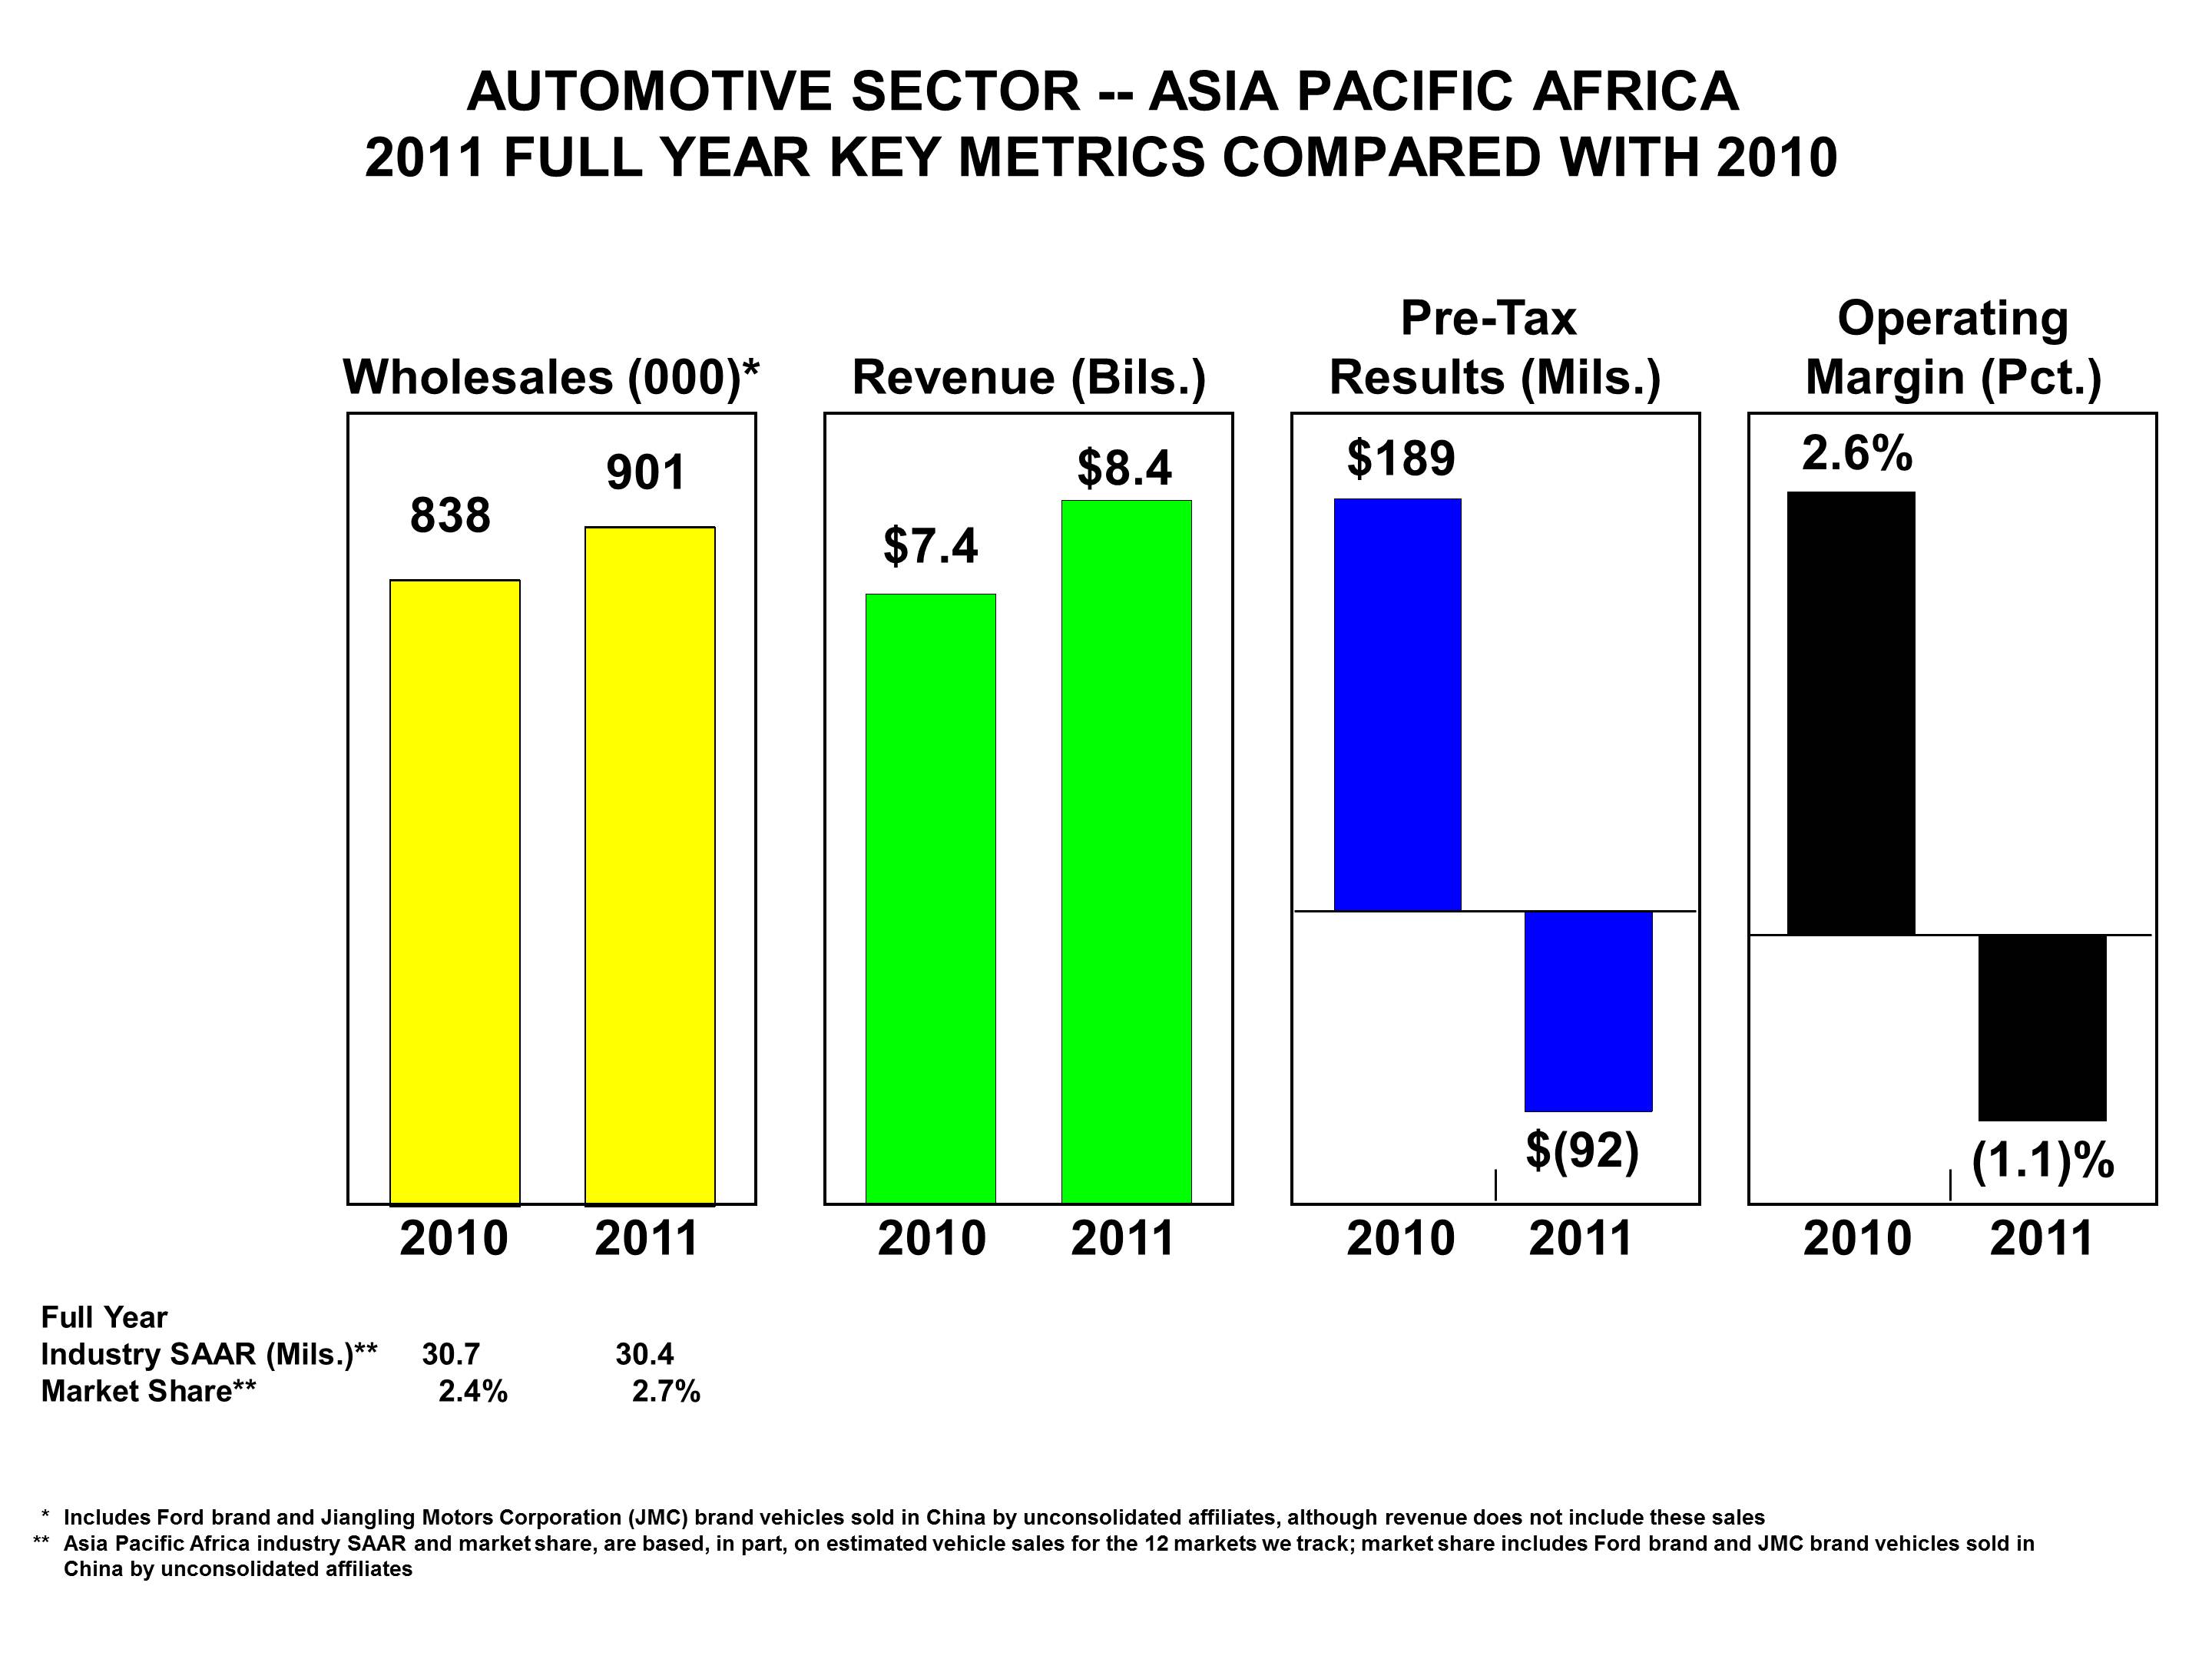
Ford Asia Pacific Africa
Ford Asia Pacific Africa industry sales and market share data focus on our 12 major markets in the region; wholesales are more inclusive, tracking every market in the region. Of the markets we track in this region, ASEAN, Australia, China, India, and South America. Brazil, Argentina, and VenezuelaAfrica are our principal markets in South America. Industry sales in 2009 were approximately 3.1 million units in Brazil (up 11.4% from 2008), 509,000 units in Argentina (down 15.3% from 2008), and 136,000 units in Venezuela (down 49.9% from 2008). Our combined car and truck share for Ford-brand vehicles in these markets was 10.3% in Brazil (up 0.3 percentage points from 2008), 13.3% in Argentina (up 0.9 percentage points from 2008), and 20.9% in Venezuela (up 5.2 percentage points from 2008). In Brazil, 2009 industry sales were strong in comparison to other markets in South America due to government stimulus actions taken in response to the global economic slowdown. We have announced plans for our largest-ever investment in Brazil operations in a five-year period, investing R$4 billion in 2011-2015 to accelerate delivery of more fuel-efficient, high-quality vehicles in Brazil.markets.
Asia Pacific Africa. Australia, China, India, South Africa, and Taiwan are our principal markets in this region. Industry sales in 2009 were approximately 940,000 units in Australia (down 7.4% from 2008), 14.1 million units in China (up 42.1% from 2008), 2.3 million units in India (up 12.2% from 2008), 350,000 units in South Africa (down 27.6% from 2008), and 290,000 units in Taiwan (up 28.4% from 2008). Our combined car and truck share in these markets (including sales of Ford-brand vehicles, and market share for certain unconsolidated affiliates particularly in China) was 10.3% in Australia (about the same as 2008), 1.9% in China (about the same as 2008), 1.3% in India (down 0.1 percentage points from 2008), 7.6% in South Africa (up 0.7 percentage points from 2008) and 6.1% in Taiwan (up 0.6 percentage points from 2008). We anticipate that the ongoing relaxation of import restrictions (including duty reductions) will continue to intensify competition in the region.
ITEM 1. Business (continued)
China and India are the key emerging markets that will continue to drive economic growth in the region. Small cars account for 60% of Asia Pacific Africa industry sales volume, and are anticipated to continue to benefit from government fiscal policy. In lineWe anticipate that the ongoing relaxation of import restrictions (including duty reductions) will continue to intensify competition in the region, particularly around small, ultra-affordable passenger cars. The highly successful launches of our all-new Figo and Fiesta demonstrate our ability to successfully compete in key growth segments. We anticipate further success with these trends,the introduction of the all-new EcoSport later in 2012.
The following tables show our manufacturing capacity investmentswholesales and market share for key markets and in both Thailandtotal for the last five years:
|
| | | | | | | | | | | | | | |
| | Wholesales |
| | (in thousands) |
| | 2011 | | 2010 | | 2009 | | 2008 | | 2007 |
| China | 519 |
| | 483 |
| | 345 |
| | 251 |
| | 203 |
|
| India | 96 |
| | 84 |
| | 30 |
| | 29 |
| | 39 |
|
| Australia | 83 |
| | 104 |
| | 92 |
| | 102 |
| | 108 |
|
| South Africa | 49 |
| | 45 |
| | 38 |
| | 51 |
| | 61 |
|
| ASEAN | 74 |
| | 51 |
| | 38 |
| | 36 |
| | 39 |
|
| Ford Asia Pacific Africa | 901 |
| | 838 |
| | 604 |
| | 532 |
| | 535 |
|
|
| | | | | | | | | | | | | | |
| | Market Share |
| | 2011 | | 2010 | | 2009 | | 2008 | | 2007 |
| China | 2.7 | % | | 2.5 | % | | 2.5 | % | | 2.6 | % | | 2.1 | % |
| India | 2.9 |
| | 2.6 |
| | 1.3 |
| | 1.4 |
| | 1.9 |
|
| Australia | 9.0 |
| | 9.2 |
| | 10.3 |
| | 10.3 |
| | 10.3 |
|
| South Africa | 8.4 |
| | 7.7 |
| | 7.6 |
| | 6.9 |
| | 7.6 |
|
| ASEAN | 2.7 |
| | 1.5 |
| | 1.6 |
| | 1.5 |
| | 2.0 |
|
| Ford Asia Pacific Africa | 2.7 |
| | 2.4 |
| | 2.3 |
| | 2.3 |
| | 2.3 |
|
China and India are nearing completion. At our joint venture assembly facilityburgeoning markets that are expected to continue to experience rapid and substantial growth in Rayong, Thailandthe next ten years, driving new economic growth in the Asia Pacific Africa region. Accordingly, we have invested $500 millionincreased and are planning to increase further our dealer networks and manufacturing capacity in an expansion for the production of small passenger cars. Inregion. We are building seven new plants - four in China, two in India, we have invested $500 million to significantly increase our presence through expansionand one in Thailand - as part of our currentplan to have production capacity of 2.3 million vehicles in the region by mid-decade. These new state-of-the-art highly-flexible manufacturing facilityfacilities will help us reach the goal of increasing worldwide sales to about 8 million vehicles per year by mid-decade.
In China, we also are significantly expanding our research and engineering center in Chennai to begin productionNanjing as part of our new Ford Figo,plan to accelerate our growth in China and construction of a fully-integrated and flexible engine manufacturing plant. As previously announced in September 2009, we also have broken ground on a new plant in Chongqing, China to meet anticipated demand and grow Ford-brand market share.the Asia Pacific Region.
ITEM 1. Business (continued)
FINANCIAL SERVICES SECTOR
Ford Motor Credit Company LLC
Our wholly-owned subsidiary Ford Motor Credit Company LLC ("Ford Credit") offers a wide variety of automotive financing products to and through automotive dealers throughout the world. The predominant share of Ford Credit’s business consists of financing our vehicles and supporting our dealers. Ford Credit’s primary financing products fall into the following three categories:Credit earns its revenue primarily from:
Retail financing. PurchasingPayments made under retail installment sale contracts and retail lease contracts from dealers, and offering financing to commercial customers – primarily vehicle leasing companies and fleet purchasers – to purchase or lease vehicle fleets;
Wholesale financing. Making loans to dealers to finance the purchase of vehicle inventory, also known as floorplan financing; and
Other financing. Making loans to dealers for working capital, improvements to dealership facilities, and to purchase or finance dealership real estate.
Ford Credit also services the finance receivables and leases that it originates and purchases, makes loans to our affiliates, purchases certain receivablespurchases;
Interest supplements and other support payments from us and our subsidiaries and provides insurance services related to its financing programs. Ford Credit’s revenues are earned primarily from payments made under retail installment sale contracts and retail leases (including interest supplements and other support payments it receives from us on special-rate financing programs),programs; and from payments
Payments made under wholesale and other dealer loan financing programs.
As a result of these financing activities, Ford Credit has a large portfolio of finance receivables and leases which it classifies into two segments – "consumer" and "non-consumer." Finance receivables and leases in the consumer segment relate to products offered to individuals and to businesses that finance the acquisition of vehicles from dealers for personal and commercial use. The financing products include retail installment sale contracts for new and used vehicles, and leases for new vehicles to retail customers, government entities, daily rental car companies, and fleet customers. Finance receivables in the non-consumer segment relate primarily to products offered to automotive dealers, including loans to finance the purchase of vehicle inventory (i.e., wholesale financing), for improvements to dealership facilities, for working capital, and for purchase of dealership real estate. Ford Credit also purchases receivables generated by us and our subsidiaries, primarily in connection with the sale of parts and accessories.
Ford Credit does business in all states in the United States and in all provinces in Canada through regional business centers. Outside of the United States, FCE Bank plc ("FCE") is Ford Credit’sCredit's largest operation.operation; Europe is FCE's primary business is to supportlargest market. Within Europe, FCE's largest and most profitable markets are Germany and the saleUnited Kingdom. About 70% of our vehiclesFCE's finance and lease receivables are from FCE's customers and Ford dealers in Europe through our dealer network. FCE offers a variety of retail, leasing and wholesale finance plans in most countries in which it operates; FCE does business inGermany, the United Kingdom, Germany, and most other European countries.France; about 17% are from FCE's customers and Ford Credit, through its subsidiaries, also operatesdealers in the Asia PacificItaly and Latin American regions. In addition,Spain; and about 2% are from FCE's customers and Ford dealers in Greece, Ireland, and Portugal. FCE, through its Worldwide Trade Financing division, also provides financing to dealers in countries where typically we have no established local presence.
Ford Credit's share of retail financing for new Ford Lincoln, and Mercury brandLincoln vehicles sold by dealers in the United States and new Ford-brandFord vehicles sold by dealers in Europe, as well as Ford Credit'sits share of wholesale financing for new Ford Lincoln and Mercury brandLincoln vehicles acquired by dealers in the United States (excluding fleet) and of new Ford-brandFord vehicles acquired by dealers in Europe were as follows during the last three years:were:
| | | United States | | Years Ended December 31, | | Years Ended December 31, |
Financing share – Ford, Lincoln, and Mercury | | | | | | | | | | |
| Financing share – Ford and Lincoln | | 2011 | | 2010 | | 2009 |
Retail installment and lease | | | 29 | % | | | 39 | % | | | 38 | % | 36 | % | | 32 | % | | 29 | % |
Wholesale | | | 79 | | | | 77 | | | | 78 | | 80 |
| | 81 |
| | 79 |
|
| Europe | | | | | | | | | | | | | |
| | |
| | |
|
| Financing share – Ford | | | | | | | | | | | | | |
| | |
| | |
|
Retail installment and lease | | | 28 | % | | | 28 | % | | | 26 | % | 29 | % | | 26 | % | | 28 | % |
Wholesale | | | 99 | | | | 98 | | | | 96 | | 99 |
| | 99 |
| | 99 |
|
See Item 7 and Notes 7, 8, and 9 of the Notes to the Financial Statements for a detailed discussion of Ford Credit's receivables, credit losses, allowance for credit losses, loss-to-receivables ratios, funding sources, and funding strategies. See Item 7A for a discussion of how Ford Credit manages its financial market risks.
ITEM 1. Business (continued)
We routinely sponsor special-rate financing programs available only throughspecial retail and lease incentives to dealers' customers who choose to finance or lease our vehicles from Ford Credit. PursuantIn order to these programs,compensate Ford Credit for the lower interest or lease rates offered to the retail customer, we make interest supplement or other support paymentspay the discounted value of the incentive directly to Ford Credit.Credit when it originates the retail finance or lease contract. These programs increase Ford Credit's financing volume and share of financing sales of our vehicles. See Note 12 of the Notes to the Financial Statements and Item 7 for more information about our accounting for these support payments.programs.
OnIn November 6, 2008, we and Ford Credit entered into an Amended and Restated Support Agreement (“Support Agreement”) (formerly known as the Amended and Restated Profit Maintenance Agreement). Pursuantwith Ford Credit, pursuant to the Support Agreement,which, if Ford Credit’sits managed leverage for a calendar quarter were to be higher than 11.5 to 1 (as reported in Ford Credit’s then-mostits most recent Form 10-Q Report or Form 10-K Report)periodic report), Ford Credit could require us to make or cause to be made a capital contribution to Ford Creditit in an amount sufficient to have caused such managed leverage to have been 11.5 to 1. A copy of the Support Agreement was filed as Exhibit 10 to our Quarterly Report on Form 10-Q for the period ended September 30, 2008. No capital contributions have been made to Ford Credit pursuant to the Support Agreement.this agreement. In addition, Ford Credit has an agreement to maintain FCE’sFCE's net worth in excess of $500 million. Nomillion; no payments have been made by Ford Credit to FCE pursuant to thethat agreement during the 2007 through 2009 periods.in 2001 - 2011.
ITEM 1. Business (continued)
GOVERNMENTAL STANDARDS
Many governmental standards and regulations relating to safety, fuel economy, emissions control, noise control, vehicle recycling, substances of concern, vehicle damage, and theft prevention are applicable to new motor vehicles, engines, and equipment manufactured for sale in the United States, Europe, and elsewhere. In addition, manufacturing and other automotive assembly facilities in the United States, Europe, and elsewhere are subject to stringent standards regulating air emissions, water discharges, and the handling and disposal of hazardous substances. The most significant of the standards and regulations affecting us are discussed below:
Mobile Source Emissions Control
U.S. Requirements –- Federal Emissions Standards. The federal Clean Air Act imposes stringent limits on the amount of regulated pollutants that lawfully may be emitted by new motor vehicles and engines produced for sale in the United States. The current ("Tier 2") emissions regulations promulgated by the U.S. Environmental Protection Agency ("EPA") set standards for cars and light trucks. The Tier 2 emissions standards also establish durability requirements for emissions components to 120,000 miles or 150,000 miles (depending on the specific standards to which the vehicle is certified). These standards present compliance challenges and make it difficult to utilize light-duty diesel technology, which in turn restricts one pathway for improving fuel economy for purposes of satisfying Corporate Average Fuel Economy ("CAFE") standards and upcoming federal greenhouse gas ("GHG") standards.
The EPA also has stringent emissions standards and requirements for EPA-defined "heavy-duty" vehicles and engines (generally, those vehicles with a gross vehicle weight rating of 8,500-14,0008,500 pounds to 14,000 pounds gross vehicle weight). These standards and requirements include stringent evaporative hydrocarbon standards for gasoline vehicles, and stringent exhaust emission standards for all vehicles. In order to meet the standards for heavy-duty diesel standards,trucks, Ford and most other manufacturers must employ after-treatment technologies, such as diesel particulate filters oruse selective catalytic reduction ("SCR") systems, which require periodic customer maintenance. These technologies add significant cost to the emissions control system, and present potential issues associated with consumer acceptance. The EPA has issued guidance regarding maintenance intervals and the warning systems that willmust be used to alert motorists to the need for maintenance of SCR systems, which are incorporated into some of our heavy-duty vehicles.systems. One heavy-duty engine manufacturer that does not rely on SCR technology is challenging EPA's 2010 model year heavy-duty standards and related SCR guidancehas filed two lawsuits in federal court. Shouldcourt challenging: 1) EPA's decision to certify vehicles with SCR systems, and 2) the appropriateness of EPA's certification test procedures for heavy-duty vehicles. The former suit was dismissed at the district court level but may be appealed; no ruling has been issued yet in the latter suit. The same manufacturer also has filed suit in California state court challenging the certification of SCR-equipped vehicles by the California Air Resources Board ("CARB"). The Engine Manufacturers Association, a trade association to which we belong, has intervened in that litigation leadon the side of CARB; the suit currently is in the discovery phase. If the courts direct EPA or CARB to tighteningreconsider certification of the EPA'svehicles with SCR guidance,systems, or a ruling that otherwise interferes withif agencies impose additional restrictions on our ability to use SCR technology, it could have an adverse effect on our ability to produce and sell heavy-duty diesel vehicles.
U.S. Requirements –- California and Other State Emissions Standards.Pursuant to the Clean Air Act, California may seek a waiver from the EPA to establish unique vehicle emissions control standards for motor vehicles;standards; each new or modified proposal requires a new waiver of preemption from the EPA. California has received a waiver from the EPA to establish its own unique emissions control standards for certain regulated pollutants. New vehicles and engines sold in California must be certified by the California Air Resources Board ("CARB").CARB; CARB's current low emissionlow-emission vehicle or "LEV("LEV II") emissions standards treat most light-duty trucks the same as passenger cars, and require both types of vehicles to meet stringent new emissions requirements. Like the EPA's Tier 2 emissions standards, CARB's LEV II vehicle emissions standards also present a difficult engineering challenge, and impose even greater barriers to the use of light-duty diesel technology.
ITEM 1. Business (continued)
Since 1990, thechallenge. The California program has includedincludes requirements for manufacturers to produce and deliver for sale zero-emission vehicles ("ZEVs"), which that emit no regulated pollutants. Initially, the goal of the ZEV mandate was to require the production and sale of battery-electric vehicles, which were the only vehicles capable of meeting the zero-emission requirements and of being produced in significant volumes. Such vehicles have had narrow consumer appeal due to their limited range, reduced functionality, and relatively high cost.
Over time, theThe current ZEV regulations have been modified several times to reflect the fact that the development of battery-electric technology progressed at a slower pace than anticipated by CARB. CARB has adopted amendments to the ZEV mandate that allow certain advanced-technology vehicles (e.g., hybrid electric vehicles or natural gas vehicles) with extremely low tailpipe emissions to qualify for ZEV credits. The rules also give some ZEV credits for so-called "partial zero-emission vehicles" ("PZEVs"), which can be internal combustion engine vehicles certified to very low tailpipe emissions and zero evaporative emissions. In response to a 2007 review of battery technology and other advanced vehicle technologies by a panel of independent experts, CARB finalized its most recent set of revisions to its ZEV regulations in February 2009, revising requirements for the 2012 model year and beyond. The current rules require increasing volumes of battery electricbattery-electric and other advanced technology vehicles with each passing model year. Ford plansWe plan to comply with the ZEV regulations through the sale of a variety of battery-electric vehicles, hybrid vehicles, plug-in hybrid vehicles, and PZEVs. Ford'sOur compliance plan entails significant costs, and has a variety of inherent risks, such as uncertain consumer demand for the vehicles andincluding potential component shortages that may make it difficult to produce vehicles in sufficient quantities.
In 2004, CARB enacted standards limiting emissions of GHGs (e.g., carbon dioxide) from all new motor vehicles. CARB asserts that its vehicle emissions regulations provide authority for it to adopt such standards. Because GHG emission standards are functionally equivalent to fuel economy standards, issues associated with motor vehicle GHG regulation are discussed more fully in the "Motor Vehicle Fuel Economy" section below.
The Clean Air Act also permits other states that do not meet National Ambient Air Quality Standards ("NAAQS") to adopt California's motor vehicle emissions standards no later than two years before the affected model year. In addition to California, thirteenfourteen states, primarily located in the Northeast and Northwest, have adopted the California standards for current and/or future model years (and eleven of these states also have adopted the ZEV requirements). These thirteen states, together with California, account for more than 30% of Ford'sour current U.S. light-duty vehicle sales volumevolume. It is possible that additional states may adopt the California standards in the United States. Other states are considering adoption of the California standards.future. The adoption of California standards by other states presents challenges for manufacturers, including the following:including: 1) managing fleet average emissions standards and ZEV mandate requirements on a state-by-state basis, which presents difficulties from the standpoint of planning and distribution; 2) market acceptance of some vehicles required by the ZEV program varies from state to state, depending on weather and other factors; and 3) the states adopting the California program have not adopted California's clean fuel regulations, which may impair the ability of vehicles in other states to meet California's in-use standards.
ITEM 1. Business (continued)
CARB has indicated that it is planning a complete overhaulin the process of revising its LEV and ZEV and GHG regulations; these changesregulations. In December 2011, CARB issued its proposed "LEV III" rules, setting standards for emissions of smog-forming pollutants (as well as greenhouse gases ("GHGs"), which are discussed in the "Motor Vehicle Fuel Economy" section below). The proposed new standards would begin to take effectphasing in the 2014-2015 model year time frame. CARB is expected to propose "LEV III" regulations in the spring of 2010 and finalize those rules by the spring of 2011. We anticipate that the LEV III rules will contain a host of new and more stringent requirements for tailpipe emissions, evaporative emissions, and component durability. Also in 2010, CARB is expected to propose modifications to its ZEV regulations that would integrate them with its GHG regulations to some extent. The ZEV program is expected to focus on requirements to produce ever-increasing numbers of vehicles using battery-electric, fuel cell, plug-in hybrid, and hydrogen internal combustion engine technologies. Under the new regulatory approach, manufacturers that produce higher numbers of vehicles specified as ZEVs may be allowed to meet less stringent fleet average GHG levels. The revised ZEV regulations would likely take effect beginning with the 2015 model year replacingand extend through the 2025 model year. The major elements of the LEV III program are new, more stringent tailpipe and evaporative emissions standards for light- and medium-duty vehicles; extended durability requirements; and changes to the certification test procedures, requiring manufacturers to certify vehicles on fuel containing 10% ethanol. CARB also issued proposed new ZEV regulations covering model years 2015 - 2025. The amendments for model years 2015 - 2017 represent relatively modest changes to existing rules for thatrequirements. For model years 2018 - 2025, CARB is proposing to require substantial annual increases in the production and sale of battery-electric, fuel cell, and plug-in hybrid vehicles. By the 2025 model year, and beyond.approximately 15% of a manufacturer's total California sales volume will need to be made up of such vehicles.
In general, complianceCompliance with the revised LEV III and ZEV regulations is likely towill require costly actions that could have a substantial adverse effect on our sales volume and profits, depending on such factors as the specific emission levels required in theprofits. The LEV III programproposal presents a significant engineering challenge for manufacturers, who will need to design new emissions after-treatment systems in order to comply. The proposed ZEV rules pose an even greater obstacle, requiring intensive planning efforts and large capital investments in order to deliver the required number of advanced-technology vehicles. We are concerned that the market and infrastructure in California may not support the large volumes of advanced-technology vehicles that manufacturers will be required byto produce, particularly in the 2018 - 2025 model years. We also are concerned about potential enforcement of the proposed ZEV mandate.mandate in other states that have adopted California's ZEV program, where the existence of a market for such vehicles is even less certain. We are not ableworking with CARB directly and through the Alliance of Automobile Manufacturers ("Alliance") in an effort to assesspromote regulations that are reasonable and technologically feasible, and we have submitted comments on the impact of these pending regulatory changes until specific proposalsproposed LEV III and ZEV rules. The industry also is negotiating with states that have been released.adopted California's ZEV rules in an effort to reach agreement on an alternative ZEV program for those states.
U.S. Requirements – Warranty, Recall, and On-Board Diagnostics. The Clean Air Act permits the EPA and CARB to require manufacturers to recall and repair non-conforming vehicles (which may be identified by testing or analysis done by the manufacturer, the EPA or CARB), and we may voluntarily stop shipment of or recall non-conforming vehicles. The costs of related repairs or inspections associated with such recalls, or a stop-shipment order, could be substantial.
ITEM 1. Business (continued)
Both CARB and the EPA also have adopted on-board diagnostic ("OBD") regulations, which require a vehicle to monitor its emissions control system and notify the vehicle operator (via the "check engine" light) of any malfunction. These regulations have become extremely complicated, and require substantial engineering resources to create compliant systems. CARB's OBD rules for vehicles under 14,000 pounds gross vehicle weight include a variety of requirements that phased in between the 2006 and 2010 model years. CARB also has adopted engine manufacturer diagnostic requirements for heavy-duty gasoline and diesel engines that apply to the 2007 to 2009 model years, and EPA has adopted light-duty and heavy-duty OBD requirements that generally align with CARB's; the EPA also accepts certification to CARB's OBD requirements.
The complexity of the OBD requirements and the difficulties of meeting all of the monitoring conditions and thresholds make OBD approval one of the most challenging aspects of certifying vehicles for emissions compliance. CARB regulations contemplate this difficulty, and, in certain instances, permit manufacturers to comply by paying per-vehicle penalties in lieu of meeting the full array of OBD monitoring requirements. In other cases, CARB regulations provide for automatic recalls of vehicles that fail to comply with specified core OBD requirements. Many states have implemented OBD tests as part of inspection and maintenance programs. Failure of in-service compliance tests could lead to vehicle recalls with substantial costs for related inspections or repairs. CARB is in the process of finalizing amendments to the OBD regulations for 2010-2017 model years; these rules will relax or defer some requirements in the earlier model years, while phasing in some additional requirements in the later model years. CARB also is required to undertake a biennial review of its OBD regulations for light-duty vehicles, and this will occur in 2010. Automobile manufacturers will make suggestions for streamlining and improving the regulations, but it also is possible that CARB may alter the rules in ways that make it more difficult for manufacturers to comply.
European Requirements. European Union ("EU") directives and related legislation limit the amount of regulated pollutants that may be emitted by new motor vehicles and engines sold in the EU. Stringent new emissions standards ("Stage IV Standards") were applied to new passenger car certifications beginning January 1,in 2005, and to new passenger car registrations beginning January 1,in 2006. The comparable light commercial truck Stage IV Standards went into effect for new certifications beginning January 1,in 2006, and for new registrations beginning January 1,in 2007. This directive on emissions also introduced OBDon-board diagnostic requirements, more stringent evaporative emissions requirements, and in-service compliance testing and recall provisions for emissions-related defects that occur in the first five years or 100,000 kilometers of vehicle life. Failure of in-service compliance tests could lead to vehicle recalls with substantial costs for related inspections or repairs.
In 2007, the Commission published a proposed law for Stage V/VI emissions that further restricted the amount of particulate and nitrogen oxide emissions from diesel engines, and tightened some regulations for gasoline engines. Stage V emissions requirements began in September 2009 for vehicle registrations starting in January 2011.2011; Stage VI requirements will apply from September 2014. Stage V particulate standards drove the deployment of particulate filters across diesels.diesels, and Stage VI further reducestightens the standard for oxides of nitrogen. This will drive the need for additional diesel exhaust aftertreatmentafter-treatment which will add cost and potentially impact the diesel CO2 advantage. These technology requirements add cost and further erode the fuel economy cost/benefit advantage of diesel vehicles.
Vehicles equipped with SCR systems require a driver inducement and warning system to prevent the vehicle being operated for a significant period of time if the reductant (urea) dosing tank is empty.maintenance or repair. The Stage V/VI emission legislation also mandated the internet provision of all repair information (not just emissions-related);, and provision of information also must be provided to diagnostic tool manufacturers. Some aspects of this regulatory scheme are still being finalized in an amendment package due for member state voting in early 2010.
ITEM 1. Business (continued)
Other National Requirements. Many countries, in an effort to address air quality concerns, are adopting previous versions of European or United Nations Economic Commission for Europe ("UN-ECE") mobile source emissions regulations. Some countries have adopted more advanced regulations based on the most recent version of European or U.S. regulations; for example, China plans to adopt the most recent European standards to be implemented starting from 2012 in large cities. Korea and Taiwan have adopted very stringent U.S.-based standards for gasoline vehicles, and European-based standards for diesel vehicles. Because fleet average requirements do not apply, some vehicle emissions control systems may have to be redesigned to meet the requirements in these markets. Furthermore, not all of these countries have adopted appropriate fuel quality standards to accompany the stringent emissions standards adopted. This could lead to compliance problems, particularly if OBDon-board diagnostic or in-use surveillance requirements are implemented. Japan has unique standards and test procedures, and implemented more stringent standards beginning in 2009. This may require unique emissions control systems be designed for the Japanese market. Canadian criteria emissions regulations are aligned with U.S. federal Tier 2 requirements.
ITEM 1. Business (continued)
In South America, Brazil, Argentina and Chile also are introducing more stringent emissions standards. Brazil approved Euro V emissions and on-board diagnostic standards for heavy trucks starting in 2012, and is developing2012; more stringent light vehicle limits startingcome into effect in 2013.2012. Argentina has approved Euro IV emissionsV standards starting in 2009, and Euro V infor 2012. Chile is proposingapproved a new decontamination plan for its metropolitan region with more stringent emission requirements based on U.S. or EU regulations.
Motor Vehicle Fuel QualityEconomy
There are ever-increasing demands from regulators, public interest groups, and Contentconsumers for improvements in motor vehicle fuel economy, for a variety of reasons including energy security and reduced GHG emissions. Our ability to comply with a given set of fuel economy standards (including GHG emissions standards, which are functionally equivalent to fuel economy standards) depends on a variety of factors, including: 1) prevailing economic conditions, including fluctuations in fuel prices; 2) alignment of standards with actual consumer demand for vehicles; and 3) adequate lead time to make necessary product changes. Consumer demand for vehicles tends to fluctuate based on a variety of external factors. Consumers are more likely to pay for vehicles with fuel-efficient technologies (such as hybrid-electric vehicles) when the economy is robust, and when fuel prices are relatively high. When the economy is in recession and/or fuel prices are relatively low, many consumers may put off new vehicle purchases altogether, and among those who do purchase vehicles, demand for higher-cost fuel technologies is not likely to be strong. If consumers demand vehicles that are relatively large, high-performance, and/or feature-laden, while regulatory standards require production of vehicles that are smaller and more economical, the mismatch of supply and demand would have an adverse effect on both regulatory compliance and our profitability. Moreover, if regulatory requirements call for rapid, substantial increases in fleet average fuel economy (or decreases in fleet average GHG emissions), we may not have adequate resources and time to make major product changes across most or all of our vehicle fleet (assuming the necessary technology can be developed).
U.S. Requirements. Requirements - Light Duty VehiclesCurrently,. Federal law requires that light-duty vehicles meet minimum corporate average fuel economy ("CAFE") standards set by the National Highway Traffic Safety Administration ("NHTSA"). A manufacturer is subject to potentially substantial civil penalties if it fails to meet the CAFE standard in any model year, after taking into account all available credits for the preceding three model years and expected credits for the five succeeding model years. The law requires NHTSA to promulgate and enforce separate CAFE standards applicable to each manufacturer's fleet of domestic passenger cars, imported passenger cars, and light trucks, respectively.
California also has asserted the right to regulate motor vehicle GHG emissions, and a 2007 U.S. Supreme Court decision paved the way for EPA to regulate motor vehicle GHG emissions under the Clean Air Act. The potential for three sets of overlapping and conflicting regulations allow conventional gasolineled to containthe establishment of the federal "One National Program," pursuant to which EPA and NHTSA have promulgated regulations establishing a harmonized national program of CAFE and GHG regulations for light-duty vehicles for the 2012 - 2016 model years. California has amended its regulations to provide that manufacturers who comply with "One National Program" regulations will be deemed to comply with the California GHG regulations. The 2012 - 2016 federal GHG and fuel economy standards are very challenging. They require new light-duty vehicles to ramp up to 10% ethanol ("E10"). an industry average fuel economy of approximately 35.5 mpg by the 2016 model year, which amounts to the steepest rate of increase in fuel economy standards since the inception of the CAFE program. CARB has adopted modifications to its GHG regulations consistent with these standards.
We and other manufacturers design gasoline-powered vehicles tobelieve that we will be able to run on E10 fuelcomply with the harmonized federal CAFE/GHG standards for the full useful life2012 - 2016 model years, as a result of the vehicle.aggressive actions to improve fuel economy that we built into our cycle plan, and through a variety of flexible compliance mechanisms. In 2008 and 2009, a coalition of ethanol producers filed a petitioncontrast, we had projected that we would be unable to comply with the EPA seeking approvalstate GHG standards that had been in place for an increasethe 2012 - 2016 period without undertaking costly product restrictions in some states. Key differences that enable us to project compliance with the national program include: 1) One National Program standards, although very stringent, do not ramp up as steeply as the state standards they are replacing; and 2) One National Program allows us to determine compliance based on nationwide sales rather than state-by-state sales. The ability to average across the nation eliminates state-to-state sales variability and is a critical element for us and for the automotive industry. The 2012-2016 model year One National Program rules currently are being challenged in federal court by entities concerned about the ramifications of these rules on stationary source regulation. The automotive industry has intervened in the amountlitigation in support of allowable ethanol content in gasoline to 15% ("E15"). Undermaintaining the Clean Air Act, the EPA may approve changes to gasoline only if it determines that the change will not cause or contribute to the failure of emission control devices or systems. The EPA has indicated that it is considering seriously this petition and may approve E15 fuel for use in automobiles manufactured as far back as the 2001 model year. It is not entirely clear how the EPA would implement and enforce such a decision. The automobile industry has concerns about the approval of E15 fuel for use in gasoline-powered vehicles, especially with respect to past model-year vehicles. Ethanol is more corrosive than pure gasoline, and fuel containing more than 10% ethanol may detrimentally affect vehicle durability if the vehicle's fuel system has not been designed to accommodate it. The addition of more ethanol to fuel has the potential to result in increased customer dissatisfaction and/or warranty claims for fuel system failures, OBD system warnings, and other problems. Older vehicles are likely to be more susceptible to such problems. We and others in the automobile industry have commented on the E15 petition, and we will continue to track this issue and provide relevant information to the EPA.
Biomass-based diesel fuel, known as "biodiesel," also is becoming more common in the United States. Biodiesel typically is a combination of petroleum-based diesel fuel and fuel derived from "biomass" (biological material from plant or animal sources). Biodiesel is approved by the EPA as well as a number of U.S. state agencies for use in motor vehicles. While diesel fuel containing 5% biomass-based fuel is now common, higher-concentration blends are becoming more common as well. The content and quality of biodiesel fuels varies considerably. Diesel fuel that contains higher concentrations of biomass-based fuels, and/or that contains lower-quality ingredients, can have adverse effects on the durability and performance of diesel engines and on the exhaust emissions from such engines.existing One National Program rules.
European Requirements.In general,November 2011, EPA and NHTSA jointly issued proposed rules to extend the useOne National Program framework through the 2025 model year. The proposed rules would require manufacturers to achieve, across the industry, a light-duty fleet average fuel economy of automotive fuel derived from biomass is increasing in the EU, primarily drivenapproximately 45 miles per gallon ("mpg") by the desire to reduce carbon emissions. Fuel content requirements have been amended to allow "B5" diesel (including up to2021 model year, and approximately 54.5 mpg by the 2025 model year, assuming all of the CO2 emissions reductions are achieved through the deployment of fuel economy technology. This represents a reduction of roughly 5% biomass-based fuel)per year in CO2 emissions from passenger cars for the 2017 - 2025 model years. For light trucks, the proposed standards represent a reduction in CO2 emissions of about 3.5% per year for model years 2017 - 2021, and "E5" gasoline (including up toabout 5% ethanol). France is moving forward with the introduction of "E10" gasoline (including up to 10% ethanol), and considering "B8" diesel (including up to 8% biomass-based fuel). In parallel, a renewable energy directive sets out long-term (i.e., 2020) targetsper year for renewable energy. Currently, the automotive industry and the oil industry are engaged in establishing a set of potential fuel scenarios and assessing most likely routes to success. In many other countries, fuel may contain biomass from locally-produced crops, with varying quality and stability; high-quality fuels are essential to support clean vehicles throughout their lifetime.model years 2022 - 2025. Each manufacturer's
ITEM 1. Business (continued)
specific task would depend on the mix of vehicles it sells. The proposed rules include the opportunity for manufacturers to earn credits for technologies that achieve real-world CO2 reductions, and fuel economy improvements that are not captured by EPA fuel economy test procedures. Manufacturers also can earn credits for GHG reductions not specifically tied to fuel economy, such as improvements in air conditioning systems. The proposal includes a mid-term evaluation process under which EPA and NHTSA will re-evaluate their standards for model year 2022 - 2025 by 2018 in order to ensure that those standards are feasible and optimal in light of intervening events. Ford and the Alliance have filed extensive comments on the proposal. EPA and NHTSA are expected to issue final rules in 2012, and shortly thereafter CARB is expected to modify its regulations to provide that compliance with the federal program satisfies compliance with California's requirements for the 2017 - 2025 model years.
While the proposed rules are challenging, we believe they are feasible in light of our product plans and projected market conditions. It is important that the final rules retain the key elements of the proposal, such as the compliance flexibilities and the mid-term review evaluation process. Provided the final rules are acceptable, we believe it is in our interest to continue with One National Program rather than re-engage in disputes with California (and other states that use the California standards) over the right to enforce state-specific GHG standards.Stationary Source Emissions Control
If the final rules promulgated by EPA and NHTSA deviate materially from the proposed rules, or if the agencies are forced to modify the rules as a result of litigation, it still is possible that the One National Program framework may not continue in the 2017 - 2025 model years. Under this scenario, there likely would be a return to conflicting state and federal regimes for regulating fuel economy and GHG emissions beginning with the 2017 model year. Compliance with both regimes would at best add enormous complexity to our planning processes, and at worst could be virtually impossible. If either of these regulatory regimes impose and enforce extreme fuel economy or GHG standards, we likely would be forced to take various actions that could have substantial adverse effects on our sales volume and profits. Such actions likely would include restricting offerings of selected engines and popular options; increasing market support programs for our most fuel-efficient cars and light trucks; and ultimately curtailing the production and sale of certain vehicles such as high-performance cars, utilities, and/or full-size light trucks, in order to maintain compliance. These actions might need to occur on a state-by-state basis, in response to the rules adopted by California and other states, or at the national level if the federal standards are excessively stringent.
U.S. Requirements.Requirements - Heavy-Duty Vehicles. The Clean Air Act requires theIn 2011, EPA to periodically review and update its NAAQS, and to designate whether counties or other local areas are in compliance with the new standards. If an area or county does not meet the new standards ("non-attainment areas"), the state must revise its implementation plans to achieve attainment. In 2006, the EPA issued aNHTSA promulgated final rule increasing the stringency of the NAAQS standard for fine particulate matter (particles 2.5 micrometers in diameter or less), while maintaining the existing standard for coarse particulate matter (particles between 2.5 and 10 micrometers in diameter). The EPA now is in the process of developing new NAAQS for fine particulate matter and ozone. The EPA estimates that the new standard will put approximately 124 counties into non-attainment status for fine particulate matter. Various parties have filed petitions for review of the final particulate matter rules in the U.S. Court of Appealsregulations imposing, for the District of Columbia Circuit, in most cases seeking more stringentfirst time, GHG and fuel economy standards for both fineon heavy-duty vehicles (generally, vehicles over 8,500 pounds gross vehicle weight rating). In our case, the standards primarily affect our heavy-duty pickup trucks and coarse particulate matter. In February 2009, the Court ordered thevans, plus vocational vehicles such as shuttle buses and delivery trucks. These standards will be challenging, but we believe we will be able to comply. EPA to reconsider the fine particulate standards. The EPA plansand NHTSA are expected to issue a new proposed fine particulate NAAQS standardround of standards for these vehicles covering the 2019 model year and beyond; as the standards increase in stringency, it may become more difficult to comply while continuing to offer a full lineup of heavy-duty trucks. The 2014 - 2018 heavy-duty GHG rules are being challenged in federal court by July 2010,entities other than truck and engine manufacturers. Remand or rejection by the court could have a final rule by April 2011. We expectsubstantial adverse impact on our future production and sale of heavy-duty vehicles, depending on the revised standards to be more stringent than the 2006 standard.court's specific order and agencies' response.
European Requirements.In MarchDecember 2008, the EPA promulgatedEU approved regulation of passenger car CO2 emissions beginning in 2012 which limits the industry fleet average to a maximum of 130 g/km, using a sliding scale based on vehicle weight. This regulation provides different targets for each manufacturer based on its respective average vehicle weight for its fleet of vehicles. Limited credits are available for CO2 off-cycle actions ("eco-innovations"), certain alternative fuels, and vehicles with CO2 emissions below 50 g/km. A penalty system will apply for manufacturers failing to meet targets, with fees ranging from €5 to €95 per vehicle per g/km shortfall in the years 2012 - 2018, and €95 per g/km shortfall beginning in 2019. Manufacturers will be permitted to use a pooling agreement between wholly-owned brands to share the burden. Further pooling agreements between different manufacturers also are possible, although it is not clear that these will be of much practical benefit under the regulations. For 2020, an industry target of 95 g/km has been set. This target will be further detailed in a review in 2013. Other non-EU European countries are likely to follow with similar regulations. For example, Switzerland is introducing similar rules, settingphasing-in beginning in July 2012 with the same targets, although the industry average emission target is significantly higher. We face the risk of advance premium payment requirements based on past performance beginning in the second half of 2012.
In separate legislation, so-called "complementary measures" have been mandated (for example, tire-related and gearshift indicator requirements), and more mandates are expected. These include requirements related to fuel economy indicators, and more-efficient low-CO2 mobile air conditioning systems. The EU Commission, Council and Parliament are close to formally approving a new ozone NAAQStarget for commercial light-duty vehicles to be at a level more stringent thanan industry average of 175 g/km (with phase-in from 2014 - 2017), and 147 g/km in 2020. This regulation also would provide different targets for each manufacturer based on its respective average vehicle weight in its fleet of vehicles. The final mass and CO2 requirements for so-called "multi-stage vehicles" (e.g., our Transit chassis cabs) are fully allocated to the previous standard. The EPA estimatesbase manufacturer (e.g., Ford)
ITEM 1. Business (continued)
so that as a result of the new standard, the number of counties out of attainmentbase manufacturer is fully responsible for the ozone NAAQS could triple. A number of states and environmental groups filed suit seeking to compel the EPA to issue an even more stringent ozone standard. The EPA agreed to reconsider the rule and issued a new proposed rule in January 2010. In the new proposal, the EPA is considering a primary NAAQS standard of 0.060 – 0.070 parts per million measured over eight hours (by comparison, the 2008 rule was set at 0.075 parts per million). Depending upon the standard that is ultimately chosen, approximately 76% to 96% of all areas would be in non-attainment. A final rule is expected later this year.
After issuanceCO2 performance of the final ozoneup-fitted vehicles. The EU proposal also includes a penalty system, "super-credits" for vehicles below 50 g/km, and particulate matter NAAQS and designation of non-attainment areas, areas that do not meetlimited credits for CO2 off-cycle actions ("eco-innovations"), pooling, etc., similar to the standards will need to revise their implementation plans to require additional emissions control equipment and impose more stringent permit requirements on facilities in those areas. The existence of additional non-attainment areas can lead to increased pressure for more stringent mobile source emissions standards as well. The cost of complying with the requirements necessary to help bring non-attainment areas into compliance with the revised NAAQS could be substantial.passenger car CO2 regulation.
Some European countries have implemented or are considering other initiatives for reducing CO2 vehicle emissions, including fiscal measures and CO2 labeling. For example, the United Kingdom, France, Germany, Spain, Portugal, and the Netherlands, among others, have introduced taxation based on CO2 emissions. The EPA proposed a new hourly NAAQS for oxides of nitrogen (as measured by ambient concentrations of nitrogen dioxide ("NOEU CO2")) in 2009, and adopted a final NAAQS in January 2010. The new rule will result in a substantial number of new non-attainment areas for oxides of nitrogen. The NAAQS also incorporated a plan for monitoring NO2 concentrations using a newly-developed roadside monitoring network. The roadside monitoring plan may tend requirements are likely to impose additional scrutiny on mobile sources of NO2 relative to other sources that contribute to overall ambient levels. The revised NAAQS for oxides of nitrogen may lead to additional NO2 standards for both stationary and mobile sources that could be costly and technologically challenging.trigger further measures.
Other National Requirements.The EPA also issued a final rule on September 22, 2009 establishing a nationalCanadian federal government has regulated vehicle GHG reporting system. Facilities with production processes that fall into certain industrial source categories, or that contain boilers and process heaters and emit 25,000 or more metric tons per year of GHGs, will be required to submit annual GHG emission reports toemissions under the EPA. Facilities subject to the rule were required to begin collecting data as of January 1, 2010, and submit an annual report for calendar year 2010 by March 31, 2011. Many of our facilities in the United States will be required to submit reports. Under the rule, we also will be required to report emissions of certain GHGs from heavy-duty engines and vehicles; these requirements phase inCanadian Environmental Protection Act, beginning with the 2011 model year.
On September 30,The standards track the new U.S. CAFE standards for the 2011 model year and U.S. EPA GHG regulations for the 2012 - 2016 model years. The Canadian federal government now has published a notice of intent to maintain alignment with U.S. EPA vehicle GHG standards for the 2017 - 2025 model years. In December 2009, Quebec also enacted province-specific regulations setting fleet average GHG standards for the EPA issued a proposed rule (the "PSD Tailoring Rule") that would define the circumstances under which certain GHGs would be regulated under the Clean Air Act's New Source Review2010 - Prevention of Significant Deterioration ("PSD") rules and Title V operating permits program. The proposed PSD Tailoring Rule was issued due to concerns that, once the EPA begins regulating GHGs from motor vehicles, GHGs will become regulated air pollutants under PSD and Title V, triggering permit requirements for many small sources not currently regulated under those programs. The PSD Tailoring Rule proposes to address this by setting a 25,000 ton per year GHG emission level as the threshold for inclusion in the PSD and Title V permit programs. The proposal does not specify what the best-available control technology would be for controlling GHG emissions, but indicates2016 model years effective January 2010. Now that the agency would evaluate this and other applicability issues duringCanadian federal regulation is in place, the first five years after issuance ofQuebec government has amended the final rule. After this five-year period, the EPA would consider lowering the applicability threshold.
ITEM 1. Business (continued)
Depending upon the scope of the final PSD Tailoring Rule, a large percentage of our facilities could be requiredQuebec regulation to obtain PSD and Title V permits for GHG emissions. These requirements could lead to the installation of additional pollution control equipment, potential delay in the issuance of permits due to changes at a facility, and increased operating costs.
European Requirements. In Europe, environmental legislation is driven by EU law, in most cases in the form of EU directives that must be converted into national legislation. All of our European plants are located in the EU region,recognize equivalency with the exceptionfederal standards; reporting of one in St. Petersburg, Russia and Ford Otomotiv Sanayi Anonim Sirketi ("Ford Otosan") in Turkey. One of the core EU directivesQuebec fleet performance still is the Directive on Integrated Pollution Prevention Control ("IPPC"). The IPPC regulates the permit process for facilities, and thus the allowed emissions from these facilities. As in the United States, engine testing, surface coating, casting operations, and boiler houses all fall under this regime. The Solvent Emission Directive which came into effect in October 2007 primarily affects vehicle manufacturing plants, which must upgrade their paint shops to meet the new requirements. The cost of complying with these requirements could be substantial.required.
The European Emission Trading Scheme requires large emittersSome Asian countries (such as China, Japan, India, South Korea, and Taiwan) also have adopted fuel efficiency or labeling targets. For example, Japan has fuel efficiency targets for 2015 that are more stringent than the 2010 targets, with incentives for early adoption. China implemented second-stage fuel economy targets from 2008, and is working on the third stage for 2012 phase-in. All of carbon dioxide withinthese fuel efficiency targets will impact the EU to monitor and annually report CO2 emissions, and each is obliged every year to return an amountcost of emission allowances to the government that is equivalent to its CO2 emissions in that year. The impact of this regulation on Ford Europe primarily involves our on-site combustion plants, and we expect that compliance with this regulation may be costly as the system foresees stringent CO2 emission reductions in progressive stages. Periodic emission reporting also is required of EU Member States, in most cases definedvehicle technology in the permits of the facility. The Release and Transfer Register requires more reporting regarding emissions into air, water and soil than its precursor. The information required by these reporting systems is publicly available on the Internet.future.
In South America, Brazil introduced a voluntary vehicle energy-efficiency labeling program, indicating fuel consumption rates for light vehicles with spark ignition engine. Chile also will adopt a fuel-consumption and emissions-labeling system. In general, fuel efficiency targets may impact the cost of technology of our models in the future.
Motor Vehicle Safety
U.S. Requirements. The National Traffic and Motor Vehicle Safety Act of 1966 (the "Safety Act") regulates motor vehicles and motor vehicle equipment in the United States in two primary ways. First, the Safety Act prohibits the sale in the United States of any new vehicle or equipment that does not conform to applicable motor vehicle safety standards established by the National Highway Traffic Safety Administration ("NHTSA").NHTSA. Meeting or exceeding many safety standards is costly, in part because the standards tend to conflict with the need to reduce vehicle weight in order to meet emissions and fuel economy standards. Second, the Safety Act requires that defects related to motor vehicle safety be remedied through safety recall campaigns. A manufacturer is obligated to recall vehicles if it determines that the vehicles do not comply with a safety standard. Should we or NHTSA determine that either a safety defect or a noncompliance exists with respect to any of our vehicles, the cost of such recall campaigns could be substantial. As of February 12, 2010, there were pending before NHTSA six investigations relating to alleged safety defects or potential compliance issues in our vehicles.
The Safe, Accountable, Flexible, and Efficient Transportation Equity Act: A Legacy for Users was signed into law in 2005; the Cameron Gulbransen Kids Transportation Safety Act of 2007 mandates that NHTSA enact regulations related to rearward visibility and brake-to-shift interlock, and mandates that NHTSA consider regulations related to automatic reversal functions on power windows. Both Acts establish substantive, safety-related rulemaking mandates for NHTSA that already have resulted in or will result in new regulations and product content requirements. In 2009, NHTSA published a final rule related to roof strength that increased the load requirements, added new performance requirements, and extended the rule's application to a wider range of vehicles. Also in 2009, NHTSA issued Notices of Proposed Rulemaking concerning ejection mitigation, automatic reversal function on power windows, and rear visibility (advance notice provided, with the final notice expected in the spring of 2010). In addition, the Department of Transportation has identified driver distraction as its top priority in 2010, and new regulatory activity in this area is anticipated. Each of these regulatory actions may add substantial cost to the design and development of new products, depending on the final rules adopted.
Foreign Requirements. Canada, the The EU and many countries in South America,around the Middle East, and Asia Pacific Africa markets alsoworld have established vehicle safety standards and regulations, applicable to motor vehicles, and are likely to adopt additional or more stringent requirements in the future. Recent examples of such legislation for the EU include the adoption and mandatory fitment requirement for the new UN-ECE regulation for tire-pressure monitoring systems ("TPMS"); this regulation differs from the North American regulation in that it addresses both safety and environmental aspects of TPMS. In addition, theThe European General Safety Regulation was introduced that replaces existing European Directives with UN-ECE regulations. These UN-ECE regulations, which will be will be required for the European Type Approval process. Some implementing measures are still under development and expected to be finalized by mid-2010; this includes new definitions for masses and dimensions, and for vehicle categories. EU regulators also are expected to focusfocusing on active safety features such as lane departure warning systems, electronic stability control, and automatic brake assist. These technologies have been implemented in Europe with final regulation and implementing measures having become available in late 2011. Globally, governments generally have been adopting EU-based regulations with minor variations to address local concerns. The difference between North American and EU-based regulations adds complexity and costs to the development of global platform vehicles; we continue to support efforts to harmonize regulations to reduce vehicle design complexity while providing a common level of safety performance.
ITEM 1. Business (continued)
Global Technical Regulations ("GTRs") developed under the auspices of the United Nations ("UN") continue to have increasing impact on automotive safety activities. The most recently adopted GTRs on Electronic Stability Control, Head Restraints, and Pedestrian Protection by the UN "World Forum for the Harmonisation of Vehicle Regulations" are now New recall requirements in different stages of national implementation. While global harmonization is fundamentally supported by the auto industry in order to reduce complexity, national implementation yet may introduce subtle differences into the system.
In the Asia Pacific Africa region, China is expected to focus on parts-markingalso may add substantial costs and anti-theft requirements. Countries within this region continue to adopt European requirements, with possible local modifications. Among other measures, Japanese regulators are pursuing accident avoidance measures for vulnerable road users.
South American countries are implementing requirements for features such as airbags, safety belts, and anti-lock braking systems ("ABS") consistent with U.S. and European requirements. Examples of more stringent safety requirements in South America include the approval in Brazil of more severe impact requirements, the mandatory use of front airbags and ABS, and the introduction of mandatory vehicle tracking and blocking systems. In Argentina, regulations will address mandatory front airbags and ABS.
Canadian safety legislation and regulations are similar to those in the United States, and the differences that do exist generally have not prevented the production of common product for both markets. Recent amendments to Canadian standards have incorporated UN-ECE standards as a compliance option, where equivalency exists.
For each of these markets, the possibility of more stringent or different requirements exists, and the cost to comply with new standards may be substantial.
Motor Vehicle Fuel Economy
There are ever-increasing demands from regulators, public interest groups, and consumers for improvements in motor vehicle fuel economy, for a variety of reasons. These include concerns over U.S. energy security, concerns over GHG emissions, and consumer preferences for more fuel-efficient vehicles. In recent years, we have made significant changes to our product cycle plan to improve the overall fuel economy of vehicles we produce in upcoming model years. These cycle plan changes involve both the deployment of various fuel-saving technologies, some of which have been announced publicly, and changes to the overall fleet mix of vehicles we offer, in response to a recent increase in demand for smaller vehicles. There are limits on our ability to achieve fuel economy improvements over a given time frame, however, primarily related to the cost and effectiveness of available technologies, consumer acceptance of new technologies and changes in vehicle mix, willingness of consumers to absorb the additional costs of new technologies, the appropriateness (or lack thereof) of certain technologies for use in particular vehicles, and the human, engineering and financial resources necessary to deploy new technologies across a wide range of products and powertrains in a short time.
Our ability to comply with a given set of fuel economy standards (including GHG emissions standards, which are functionally equivalent to fuel economy standards), depends on a variety of factors, including: 1) prevailing economic conditions, including fluctuations in fuel prices; 2) the alignment of the standards with actual consumer demand for vehicles; and 3) adequate lead time to make the necessary product changes. Consumer demand for vehicles tends to fluctuate based on a variety of external factors. Consumers are more likely to pay for vehicles with fuel-efficient technologies (such as hybrid-electric vehicles) when the economy is robust and fuel prices are relatively high. When the economy is in recession and/or fuel prices are relatively low, many consumers may put off new vehicle purchases altogether, and among those who do purchase new vehicles, demand for higher-cost technologies is not likely to be strong. If consumers demand vehicles that are relatively large, have high performance, and/or are feature-laden, while regulatory standards require the production of vehicles that are smaller and more economical, the mismatch of supply and demand would have an adverse effect on both regulatory compliance and our profitability. Moreover, if regulatory requirements call for rapid, substantial increases in fleet average fuel economy (or decreases in fleet average GHG emissions), we may not have adequate resources and time to make major product changes across most or all of our vehicle fleet (assuming the necessary technology can be developed).
ITEM 1. Business (continued)
U.S. Requirements – Federal Standards. Federal law requires that light-duty vehicles meet minimum corporate average fuel economy standards set by NHTSA. A manufacturer is subject to potentially substantial civil penalties if it fails to meet the CAFE standard in any model year, after taking into account all available credits for the preceding three model years and expected credits for the three succeeding model years.
Federal law established a passenger car CAFE standard of 27.5 miles per gallon for 1985 and later model years; light truck standards are set by NHTSA under a rulemaking process. In 2006, NHTSA issued a final rule changing the structure of the light-truck fuel economy standards for model year 2008 and beyond. The final rule employs a new "reformed" approach to fuel economy standards in which each manufacturer's CAFE obligation is based on the specific mix of vehicles it sells. A manufacturer's light truck CAFE is now calculated on a basis that relates fuel economy targets to vehicle size. These fuel economy targets become increasingly stringent with each new model year. Through 2010, manufacturers have the option of complying with the "reformed" program or an alternative set of "unreformed" standards promulgated by NHTSA. Beginning with the 2011 model year, all manufacturers must comply under the reformed program. Also in model year 2011 and beyond, the truck CAFE standards will apply for the first time to certain classes of heavier passenger vehicles (SUVs and passenger vans with a gross vehicle weight between 8,500 and 10,000 pounds, or with a gross vehicle weight below 8,500 pounds and a curb weight above 6,000 pounds).
In December 2007, Congress enacted new energy legislation restructuring the CAFE program and requiring NHTSA to set new CAFE standards beginning with the 2011 model year. The key features of the bill are as follows: 1) it maintains the current distinction between cars and trucks; 2) it requires NHTSA to set "reformed" CAFE standards for cars along the lines of the reformed truck standards described above; 3) it calls for NHTSA to set car and truck standards such that the combined fleet of cars and trucks in the United States achieves a 35 mile per gallon industry average by model year 2020; 4) it allows manufacturers to trade credits among their CAFE fleets; and 5) it retains CAFE credits for the manufacture of flexible-fuel vehicles, but phases them out by model year 2020. Domestic passenger cars also are subject to a minimum fleet average of the greater of 27.5 miles per gallon or 92% of NHTSA's projected fleet average fuel economy for domestic and imported passenger cars for that model year. In 2008, NHTSA issued a Notice of Proposed Rulemaking to establish CAFE standards for the 2011-2015 model years, but the Bush Administration decided not to promulgate a final rule, and it was left to the incoming Obama Administration to establish CAFE standards for these model years. In March 2009, NHTSA published a final rule setting CAFE standards for the 2011 model year, and indicated that it would address 2012-2016 model year CAFE standards in a separate rulemaking.
Pressure to increase CAFE standards stems in part from concerns about the impact of carbon dioxide and other GHG emissions on the global climate. In 1999, a petition was filed with the EPA requesting that it regulate carbon dioxide emissions from motor vehicles under the Clean Air Act. This is functionally equivalent to imposing fuel economy standards, because the amount of carbon dioxide emitted by a vehicle is directly proportional to the amount of fuel consumed. The EPA denied the petition on the grounds that the Clean Air Act does not authorize the EPA to regulate GHG emissions because they did not constitute "air pollutants," and only NHTSA is authorized to regulate fuel economy under the CAFE law. A number of states, cities, and environmental groups filed for review of the EPA's decision.
The matter was eventually brought before the U.S. Supreme Court, which ruled that GHGs did constitute "air pollutants" subject to regulation by the EPA pursuant to the Clean Air Act. Upon taking office, the Obama Administration indicated its intention to promulgate rules to control mobile source GHG emissions. Under the Clean Air Act, EPA must issue a determination that GHGs endanger the public health and welfare in order for EPA to finalize GHG regulations for both mobile and stationary sources. In December 2009, EPA issued its endangerment finding for GHGs. In early 2010, several industry groups filed a petition for review of the endangerment finding; nevertheless, EPA is proceeding with rulemaking activity to regulate GHGs.
As described more fully below, the Obama Administration has brokered an agreement in principle for a national program of mobile source CAFE and GHG regulation for light-duty vehicles for the 2012-2016 model years. Before describing this program, it is necessary to discuss the GHG standards for light-duty vehicles promulgated by California and other states.
To date, fuel economy regulations have applied primarily to light-duty vehicles. Energy legislation enacted in 2007 directed the National Academy of Sciences ("NAS") to undertake a study of the fuel efficiency of heavy-duty vehicles (vehicles with a gross vehicle weight rating over 8,500 pounds). Once the NAS study is completed, the law directs NHTSA to develop fuel efficiency regulations for these vehicles. Such regulations are unlikely to take effect before the 2016 model year. Separately, the EPA has begun work on the development of GHG standards for heavy-duty vehicles. The EPA has indicated that it will release a set of proposed rules in 2010, and the GHG standards for heavy-duty vehicles may take effect as early as the 2014 model year.
ITEM 1. Business (continued)
U.S. Requirements – California and Other State Standards. In July 2002, California enacted Assembly Bill 1493 ("AB 1493"), a law mandating that CARB promulgate GHG standards for light-duty vehicles beginning with model year 2009. In September 2004, CARB adopted California GHG emissions regulations applicable to 2009-2016 model-year cars and trucks, effectively imposing more stringent fuel economy standards than those set by NHTSA. These regulations imposed standards equivalent to a CAFE standard of more than 43 miles per gallon for passenger cars and small trucks, and approximately 27 miles per gallon for large light trucks and medium-duty passenger vehicles by model year 2016.
Whenever California adopts new or modified vehicle emissions standards, the state must apply to the EPA for a waiver of preemption of the new or modified standards under Section 209 of the Clean Air Act. After California's request for a waiver of its AB 1493 standards was initially denied in 2008, the Obama Administration granted the waiver in 2009. The grant of the waiver is being challenged in federal court by the National Automobile Dealers Association and the U.S. Chamber of Commerce. Under the Clean Air Act, other states may adopt and enforce emissions regulations for which California receives a waiver. The following states have adopted CARB's GHG standards: New York, Massachusetts, Maine, Vermont, Rhode Island, Connecticut, New Jersey, Pennsylvania, Oregon, Washington, Maryland, New Mexico, and Arizona. Several other states are known to be considering the adoption of such rules.
The prospect of state-by-state regulation of motor vehicle GHG emissions and fuel economy is very troubling to the automobile industry, which has significant concerns about an unwieldy patchwork of regulations and the likely need to implement product restrictions in some states in order to comply. Concerns about product restrictions were driven in part by the fact that the AB 1493 standards became increasingly more stringent as time passed, with especially steep increases in some model years. In 2004, the Alliance and other plaintiffs filed suit in federal district court in California, seeking to overturn the AB 1493 standards on the grounds that they are preempted by the federal CAFE law. Similar suits were filed in Vermont and Rhode Island challenging those states' adoption of California's AB 1493 rules. District Courts in California and Vermont ruled that the state GHG rules were not preempted; those decisions were appealed by the auto industry. The District Court in Rhode Island has not yet issued a ruling.
U.S. Requirements – "One National Standard" for Model Years 2012-2016. By early 2009, it had become apparent that the United States was headed toward a series of overlapping regulations aimed at motor vehicle fuel economy and GHGs. NHTSA was already setting federal CAFE standards, EPA was planning to regulate motor vehicle GHG emissions at the federal level, and California and other states were getting set to regulate motor vehicle emissions at the state level if and when a Clean Air Act waiver was granted. In order to avoid this confusing patchwork of regulations, President Obama announced in May 2009 an agreement in principle among the automobile industry, the federal government, and the state of California concerning motor vehicle GHG emissions and fuel economy regulations. Under the agreement in principle, California would enforce its GHG standards for the 2009-2011 model years, and defer to a set of federal standards for the 2012-2016 model years. With respect to the 2009-2011 model years, California agreed to modify its regulations so that: 1) manufacturers would be able to use federal test procedures to determine compliance with California's standards, and 2) compliance would be determined based on the fleet average emissions across all states that have adopted the California standards. With respect to the 2012-2016 model years, EPA and NHTSA agreed to conduct joint rulemaking to establish GHG standards and fuel economy standards that align with each other. California agreed to modify its regulations to provide that compliance with the 2012-2016 federal requirements will constitute compliance with the California regulations for California and any states that have adopted California requirements. Manufacturers also agreed to seek an immediate stay of pending litigation challenging EPA's waiver decision and the right of states to issue motor vehicle GHG standards. Assuming California and the federal government carry out their obligations under the agreement in principle, manufacturers agreed to dismiss the pending litigation.
Since the May 2009 announcement, various steps have been taken to implement the agreement in principle. The automobile industry sought and obtained a stay of the federal court litigation in California, Vermont, and Rhode Island, pending the issuance of final rules consistent with the agreement in principle. The EPA has issued a revised decision granting a Clean Air Act waiver for California's GHG regulations. The automotive industry has refrained from challenging that decision, although the waiver decision has been challenged by the National Automobile Dealers Association and the U.S. Chamber of Commerce. CARB has adopted some of the modifications to its regulations that will be required to implement the agreement in principle, with additional modifications expected in 2010. The EPA and NHTSA have promulgated a joint Notice of Proposed Rulemaking setting forth their proposal for harmonizing GHG and fuel economy standards for the 2012-2016 model years, and interested members of the public, including Ford and the Alliance, have filed comments on the proposed rules. The rules are expected to be finalized on or before April 1, 2010.
ITEM 1. Business (continued)
The agreement in principle would result in federal GHG and fuel economy standards that are very challenging. The proposed rules would require new light-duty vehicles to achieve an industry average fuel economy of approximately 35.5 miles per gallon by the 2016 model year. Assuming the agreement in principle is implemented as envisioned, we believe that we will be able to comply with the California GHG standards for the 2009-2011 period, and the harmonized federal CAFE/GHG standards for the 2012-2016 period, as a result of aggressive actions to improve fuel economy built into our cycle plan. In contrast, we were projecting that we would be unable to comply with the state GHG standards throughout the 2012-2016 period without undertaking costly product restrictions in some states. Key differences that enable us to project compliance with the national program include: 1) the national program standards, although very stringent, do not increase as steeply as the state standards they are replacing; and 2) the national program allows us to determine compliance based on nationwide sales rather than state-by-state sales. The ability to average across the nation eliminates state-to-state sales variability and is a critical element for Ford and the auto industry.
The agreement in principle does not address what will happen in the 2017 model year and beyond. California has already indicated that it will promulgate a new set of state-level GHG standards that will take effect beginning with the 2017 model year; we expect that a proposed rule will be issued in 2010. Moreover, there is no commitment that NHTSA and the EPA will continue to harmonize the federal CAFE and GHG standards in 2017 and beyond. Thus, it is possible that there will be a return to three different and conflicting regimes for regulating fuel economy and GHG emissions in 2017. Compliance with all three, or even two, of these regimes would at best add enormous complexity to our planning processes, and at worst be virtually impossible. If any of one these regulatory regimes, or a combination of them, impose and enforce extreme fuel economy or GHG standards, we likely would be forced to take various actions that could have substantial adverse effects on our sales volume and profits. Such actions likely would include restricting offerings of selected engines and popular options; increasing market support programs for our most fuel-efficient cars and light trucks; and ultimately curtailing the production and sale of certain vehicles such as family-size, luxury, and high-performance cars, utilities, and full-size light trucks, in order to maintain compliance. These actions might need to occur on a state-by-state basis, in response to the rules adopted by California and other states, or they may need to be taken at the national level if either the CAFE standards or the EPA GHG standards are excessively stringent. Therefore, we believe that for 2017 and beyond, it is essential to maintain a single national program that regulates motor vehicle GHGs and fuel economy in a harmonized and workable fashion. We will work toward legislative and regulatory solutions that would establish such a national program on a permanent basis.
In September 2006, California also enacted the Global Warming Solutions Act of 2006 (also known as Assembly Bill 32 ("AB 32")). This law mandates that statewide GHG emissions be capped at 1990 levels by the year 2020, which would represent a significant reduction from current levels. It also requires the monitoring and annual reporting of GHG emissions by all "significant" sources, and delegates authority to CARB to develop and implement GHG emissions reduction measures. AB 32 also provides that, if the AB 1493 standards do not take effect, CARB must implement alternative regulations to control mobile sources of GHG emissions to achieve equivalent or greater reductions than mandated by AB 1493. Although the full ramifications of AB 32 are not known, CARB has issued proposed rules under AB 32 that would require so-called "cool glazing" for automotive glass. The glazing requirements are intended to promote lower interior temperatures in vehicles, thereby reducing the air conditioning load and leading to fewer GHG emissions. The current proposal would require significant expenditures of resources to meet standards that would take effect beginning in the 2012 model year, and increase in stringency for the 2016 model year. We are evaluating our ability to comply with the proposed standards, and will comment on the proposal along with the rest of the automobile industry. CARB is expected to finalize its regulations in 2010.
European Requirements. In December 2008, the EU approved a regulation of passenger car carbon dioxide beginning in 2012 which limits the industry fleet average to a maximum of 130 g/km, using a sliding scale based on vehicle weight. This regulation provides different targets for each manufacturer based on its respective fleet of vehicles according to vehicle weight and carbon dioxide output. Limited credits are available for CO2 off-cycle actions ("eco-innovations"), certain alternative fuels, and vehicles with CO2 emissions below 50 g/km. For manufacturers failing to meet targets, a penalty system will apply with fees ranging from €3 to €95 per each g/km shortfall in the years 2012-18, and €95 for each g/km shortfall for 2019. Manufacturers would be permitted to use a pooling agreement between wholly-owned brands to share the burden. Further pooling agreements between different manufacturers are also possible, although it is not clear that they will be of much practical benefit under the regulations. For 2020, an industry target of 95 g/km has been set. This target will be further detailed in a review in 2013.global recall practice.
ITEM 1. Business (continued)
In separate legislation, so-called "complementary measures" are expected. These may include, for example, tire-related requirements and requirements related to gearshift indicators, fuel economy indicators, and more-efficient low-CO2 mobile air conditioning systems. These proposals are likely to be finalized in 2010. The Commission has proposed a target for commercial light duty vehicles to be at an industry average of 175 g/km (with phase-in 2014 – 2016), and potentially more stringent long-term targets (proposed to be at 135 g/km in 2020); several EU Members have raised concerns about these targets. The EU proposal also includes a penalty system, "super-credits" for vehicles below 50 g/km, and limited credits for CO2 off-cycle actions (“eco-innovations”).
Some European countries have implemented or are still considering other initiatives for reducing carbon dioxide emissions from motor vehicles, including fiscal measures. For example, the United Kingdom, France, Germany, Spain, Portugal, and the Netherlands among others have introduced taxation based on carbon dioxide emissions. The EU CO2 requirements are likely to trigger further measures.
Other National Requirements. Some Asian countries (such as China, Japan, India, South Korea, and Taiwan) also have adopted fuel efficiency or labeling targets. For example, Japan has fuel efficiency targets for 2015 which are even more stringent than the 2010 targets, with incentives for early adoption. China implemented second-stage fuel economy targets from 2008, and is working on the third stage for 2012 phase-in. All of these fuel efficiency targets will impact the cost of technology of our models in the future.
The Canadian federal government announced that vehicle GHG emissions will be regulated under the Canadian Environmental Protection Act, beginning with the 2011 model year. The standards will track the new U.S. CAFE standards for the 2011 model year and U.S. EPA GHG regulations for 2012 through 2016 model years. Several provinces, including British Columbia and Nova Scotia, have publicly announced an intention to impose GHG standards at the provincial level, likely modeled after California's AB 1493 approach. In December 2009, Quebec enacted province-specific regulations setting fleet average GHG standards for the 2010-2016 model years effective January 14, 2010. Although the announcement indicated that Quebec's standards are based on the California AB 1493 rules, there are a number of key differences. The Quebec program appears to define vehicle fleets differently than either the U.S. federal government or California, does not apply attribute-based standards, does not allow for alternative means of compliance (e.g., industry credit for new and advanced technologies), and does not take into account the fact that California has entered into an agreement in principle supporting "One National Program" in the United States for the 2012-2016 model years. If a manufacturer fails to meet the required fleet average standard, the provincial government has established a formula to determine the level of non-compliance within the fleet and impose a fee. We are analyzing the new regulations, and anticipate that some level of fees may be imposed under the regulations as written. Quebec recently indicated, however, that it will publish interpretation guidelines designed to clarify that the definition of vehicle fleets is intended to match California's, which would reduce significantly the potential for incurring fees under the new regulation. In addition, the provincial government has indicated that it will reevaluate the situation when the Canadian federal regulation is in place and, if the federal requirements are satisfactory, accept federal compliance as compliance with the Quebec requirements.
Chemical Regulation and Substance Restrictions
U.S. Requirements. Several states are considering moving beyond a substance-by-substance approach to managing substances of concern, and are moving towards adopting green chemistry legislation that give state governments broad regulatory authority to determine, prioritize, and manage toxic substances. In 2008, California became the first state to enact a broad Green Chemistry Program, which will commence regulations in 2011. This new law may impose new vehicle end-of-life responsibilities on vehicle manufacturers, and restrict, ban, or require labeling of certain substances. This broad authority to regulate substances could require changes in product chemistry, and greater complication of fleet mix. Other states, such as Maine, are considering so-called "product stewardship" bills that would require sellers of products to establish elaborate plans, approved by the state agency, to address life-cycle impacts of each product. These programs would impose extensive reporting and auditing requirements, along with penalties for non-compliance. If enacted, compliance with such legislation would be costly and resource-intensive.
ITEM 1. Business (continued)
European Requirements. The Commission has implemented its regulatory framework for a single system to register, evaluate, and authorize the use of chemicals with a production volume above one ton per year ("REACH"). The rules took effect on June 1, 2007, with a preparatory period through June 1, 2008 followed by a six-month registration phase. Compliance with the legislation is likely to be administratively burdensome for all entities in the supply chain, and research and development resources may be redirected from "market-driven" to "REACH-driven" activities. We and our suppliers have registered those chemicals that were identified to fall within this requirement. The regulation also will accelerate restriction or banning of certain chemicals and materials, which could increase the costs of certain products and processes used to manufacture vehicles and parts. We are implementing and ensuring compliance within Ford and our suppliers through a common strategy together with the global automotive industry.
The European End-of-Life Vehicle directive and EU Battery directive prohibit the use of the heavy metals lead, cadmium, hexavalent chromium, and mercury with limited exceptions that are regularly scrutinized. These regulations also include broad manufacturer responsibility for disposing of vehicle parts and substances, including taking vehicles back without charge for disposal and recycling requirements. This legislation has triggered similar regulatory actions around the globe, including, for example, in China, Korea, and possibly India in the near future. Other European regulatory developments will ban the use of refrigerants with a "global warming potential" higher than 150 on the European scale (which would include the refrigerant commonly in use) beginning in 2011 in new vehicle models and in 2017 for all new vehicles, which some other governments, such as Japan, have been closely monitoring and are likely to adopt in some form. This European restriction is expected to lead to a general change in refrigerants for future vehicles worldwide.
Regulations requiring a globally-harmonized system of classification and labeling of chemicals also took effect in January 2009. This regulation is the implementation of the UN regulation UN-GHS, and should harmonize the classification and labeling of chemicals worldwide with impact of existing storage facilities and labeling.
Pollution Control Costs
During the period 20102012 through 2014,2016, we expect to spend approximately $170about $160 million on our North Americanfacilities in the Americas and European facilitiesEurope to comply with stationary source air and water pollution and hazardous waste control standards that are now in effect or are scheduled to come into effect during this period. Of this total, we currently estimate spending approximately $29we will spend between $30 million in 2010 and $35 million in 2011. These amounts exclude projections for Volvo, which is held for sale.each of 2012 and 2013, respectively. Specific environmental expenses are difficult to isolate because expenditures may be made for more than one purpose, making precise classification difficult.
ITEM 1. Business (continued)
EMPLOYMENT DATA
The approximate number of individuals employed by us and entities that we consolidated (including entities that we did not control) as of December 31, 20092011 and 20082010 was as follows (in thousands):
| | | | | | | | | | 2011 | | 2010 |
| Automotive | | | | | | | | | |
|
Ford North America | | | 74 | | | | 79 | | 75 |
| | 75 |
|
Ford South America | | | 14 | | | | 15 | | 16 |
| | 15 |
|
Ford Europe | | | 66 | | | | 70 | | 47 |
| | 49 |
|
Ford Asia Pacific Africa | | | 15 | | | | 15 | | 19 |
| | 18 |
|
Volvo | | | 21 | | | | 24 | | |
| Financial Services | | | | | | | | | |
| | |
|
Ford Credit | | | 8 | | | | 10 | | 7 |
| | 7 |
|
Total | | | 198 | | | | 213 | | 164 |
| | 164 |
|
The year-over-year decreaseWhile our overall employment remained steady, Ford Europe experienced reductions related largely to the transfer of Russian operations to our FordSollers unconsolidated joint venture, offset partially by increases in employment levels primarily reflects our implementation of global personnel-reduction programs.emerging markets to support increased production.
Substantially all of the hourly employees in our Automotive operations are represented by unions and covered by collective bargaining agreements. In the United States, approximately 99% of these unionized hourly employees in our Automotive sector are represented by the International Union, United Automobile, Aerospace and Agricultural Implement Workers of America ("UAW" or "United Auto Workers"). Approximately two percent of our U.S. salaried employees are represented by unions. Most hourly employees and many non-management salaried employees of our subsidiaries outside of the United States also are represented by unions.
ITEM 1. Business (continued)
We haveIn 2011, we entered into a new four-year collective bargaining agreement with the UAW. The agreement covers approximately 41,000 employees, and maintains our progress on improving competitiveness in the United States. Excluding profit-sharing, compensation-related terms - including lump-sum payments (in lieu of general wage increases and cost of living increases) and continuation of an entry-level wage structure - are expected to increase U.S. hourly labor costs by less than 1% annually over the four-year contract period. We also expect this increase will be more than offset by more flexible work rules that will allow us to increase manufacturing utilization and efficiency.
In 2011, we also negotiated new collective bargaining agreements with the UAW,labor unions in Argentina, Brazil, France, Mexico, New Zealand, Russia, Taiwan, and Thailand.
In 2012, we will negotiate a new agreement in Canada with the National Automobile, Aerospace, Transportation and General Workers Union of Canada ("CAW"). In 2007, we negotiated with the UAW a transformational agreement, enabling us to improve our competitiveness and establishing a Voluntary Employee Benefit Association ("VEBA") trust ("UAW VEBA Trust") to fund our retiree health care obligations.
In March 2009, Ford-UAW membership ratified modifications to the existing collective bargaining agreement that significantly improved our competitiveness, saving us up to $500 million annually and bringing us near to competitive parity with the U.S. operations of foreign-owned automakers. The operational changes affected wage and benefit provisions, productivity, job security programs, and capacity actions, allowing us to increase manufacturing efficiency and flexibility. In addition, modifications to the UAW VEBA Trust allowed for smoothing of payment obligations and provided us the option to satisfy up to approximately 50% of our future payment obligations to the UAW VEBA Trust in Ford Common Stock; see "Liquidity and Capital Resources" in Item 7 and Note 18 of the Notes to the Financial Statements for additional discussion of the UAW VEBA Trust.
On November 1, 2009, the CAW announced that a majority of its members employed by Ford Canada had voted to ratify modifications to the terms of the existing collective bargaining agreement between Ford Canada and the CAW. The modifications are patterned off of the modifications agreed to by the CAW for its agreements with the Canadian operations of General Motors Company and Chrysler LLC and are expected to result in annual cost savings. The agreement also confirms the end of production at the St. Thomas Assembly Plant in 2011.
On November 2, 2009, the UAW announced that a majority of its members employed by Ford had voted against ratification of a tentative agreement that would have further modified the terms of the existing collective bargaining agreement between Ford and the UAW. These latest modifications were designed to closely match the modified collective bargaining agreements between the UAW and our domestic competitors, General Motors and Chrysler. Among the proposed modifications was a provision that would have precluded any strike action relating to improvements in wages and benefits during the negotiation of a new collective bargaining agreement upon expiration of the current agreement, and would have subjected disputes regarding improvements in wages and benefits to binding arbitration, to determine competitiveness based on wages and benefits paid by other automotive manufacturers operating in the United States.
Even with recent modifications, our agreements with the UAW and CAW provide for guaranteed wage and benefit levels for the term of the respective agreements, and a degree of employment security, subject to certain conditions. As a practical matter, these agreements may restrict our ability to close plants and divest businesses during the terms of the agreements. Our collective bargaining agreement with the UAW expires on September 14, 2011; our collective bargaining agreement with the CAW expires on September 14, 2012.
In 2009, we negotiated new collective bargaining agreements with, as well as labor unions in Argentina, Australia, Belgium, Brazil, Britain, France, Germany, Mexico, New Zealand, Russia, SpainRomania, Taiwan and Taiwan. We began negotiations in Thailand in the fourth quarter of 2009 and expect to complete the negotiations in 2010.Turkey.
Additionally, in 2010 we are or will be negotiating new collective bargaining agreements with labor unions in Australia, Brazil, France, Germany, Mexico, New Zealand, Russia, South Africa, Spain, Taiwan, Thailand and Venezuela.
ENGINEERING, RESEARCH, AND DEVELOPMENT
We engage in engineering, research, and development primarily to improve the performance (including fuel efficiency), safety, and customer satisfaction of our products, and to develop new products. We also have staffs of scientists who engage in basic research. We maintain extensive engineering, research, and design centers for these purposes, including large centers in Dearborn, Michigan; Dunton, England; Gothenburg, Sweden (part of our held-for-sale Volvo operations); and Aachen and Merkenich, Germany. Most of our engineering, research, and development relates to our Automotive sector. In general, our engineering activities that do not involve basic research or product development, such as manufacturing engineering, are excluded from our engineering,
Engineering, research, and development charges discussed below.expenses for 2011, 2010, and 2009 were $5.3 billion, $5 billion, and $4.7 billion, respectively (2009 data adjusted to reflect the impact of the accounting standard on consolidation of variable interest entities ("VIEs")).
We recorded $4.9 billion, $7.3 billion, and $7.5 billion of engineering, research, and development costs that we sponsored during 2009, 2008, and 2007 respectively. The decreased costs in 2009 compared with 2008 primarily reflect efficiencies in our global product development, manufacturing, and related processes, favorable currency exchange, and the non-recurrence of costs related to our former Jaguar Land Rover operations. Research and development costs sponsored by third parties during 2009 were not material.
We have listed below (not necessarily in order of importance or probability of occurrence) the most significant risk factors applicable to us:
Further declinesDecline in industry sales volume, particularly in the United States or Europe, due to financial crisis, deepening recession, geo-politicalgeopolitical events, or other factors. The global automotive industry is estimated to have shrunk to 64.3 million units in 2009, a year-over-year decline of about 4 million units. Beginning in In the fall of 2008, the global economy entered a financial crisis and severe recession, putting significant pressure on Fordus and on the automotive industry generally.generally. These economic conditions dramatically reduced automotive industry sales volume in the United States and Europe, in particular, and began to slow growth in other markets around the world. In the United States,U.S. automotive industry sales volume declined from 16.5 million units in 2007 to 13.5 million units in 2008 toand 10.6 million units in 2009.2009, before rebounding slightly to 11.8 million units in 2010 and 13 million units in 2011. For the 19 markets we track in Europe, automotive industry sales volume declined from 1818.1 million units in 2007 to 16.6 million units in 2008, to 15.815.9 million units in 2009. In the United States2009, and especially in Europe, 2009 industry sales volume benefited from government incentive programs that have expired or are expiring, and could lower demand temporarily. Our current planning assumptions for 2010 industry sales volume in the United States and for the 19 markets we track in Europe (which take into account our estimate of the impact of the 2009 government incentive programs) are a range of 11.5 million units to 12.515.3 million units in the United States2010 and 13.5 million units to 14.5 million units in Europe.2011.
Because we, like other manufacturers, have a high proportion of relatively fixed structural costs, relatively small changes in industry sales volume can have a substantial effect on our cash flow and profitability. If industry vehicle sales were to decline to levels significantly below our planning assumptions,assumption, particularly in the United States or Europe, due to financial crisis, deepening recession, geo-politicalgeopolitical events, or other factors, our financial condition and results of operations would be substantially adversely affected. For discussion of economic trends, see the "Overview" section of Item 7.
Decline in market share. share or failure to achieve growth.Between 1995 and 2008, our Our full-year U.S. market share declined each year. Recently, our full-year U.S. market share declinedyear between 1995 and 2008, declining from 18% into 14.2% from 2004 to 14.2% in 2008. Market share declines and resulting volume reductions in any of our major markets would have an adverse impact on our financial condition and results of operations. We are working through2008 alone. With our One Ford plan, to stabilize market share and reduce capacity over time, and increased full-yearwe have seen U.S. market share during 2009 to 15.3%, but we cannot guarantee that our efforts will be successfulgains in the long term. Declinelast three years. To maintain competitive economies of scale and grow our global market share, however, we also must grow our market share in fast-growing newly-developed and emerging markets, particularly in Asia Pacific, as well as maintain or grow market share in mature markets. Our market share in certain growing markets, such as China, is substantially lower than it is in our mature markets. A decline in our market share in mature markets, whether due to capacity constraints, competitive pressures, or other factors, or failure to achieve growth in newly-developed or emerging markets, could have a substantial adverse effect on our financial condition and results of operations.
Lower-than-anticipated market acceptance of new or existing products. Although we conduct extensive market research before launching new or refreshed vehicles, many factors both within and outside of our control affect the success of new or existing products in the marketplace. Offering highly desirable vehicles that customers want and value can mitigate the risks of increasing price competition and declining demand, but vehicles that are perceived to be less desirable (whether in terms of price, quality, styling, safety, overall value, fuel efficiency, or other attributes) can exacerbate these risks. For example, if a new model were to experience quality issues at the time of launch, the vehicle's perceived quality could be affected even after the issues had been corrected, resulting in lower sales volumes, market share, and profitability.
An increase in or accelerationMarket shift away from sales of market shiftlarger, more profitable vehicles beyond our current planning assumptions from sales of trucks, medium- and large-sized utilities, or other more profitable vehicles,assumption, particularly in the United States.Trucks and medium- and large-sized utilities historically have represented some of our most profitable vehicle segments, and the segments in which we have had our highest market share. In recent years, the general A shift in consumer preferences away from medium-larger, more profitable vehicles at levels beyond our current planning assumption could result in an immediate and large-sizedsubstantial adverse impact on our financial condition and results of operations. For example, when gasoline prices in the United States spiked to more than $4.00 per gallon in 2008 and the construction industry suddenly slowed, consumer preferences quickly and dramatically shifted away from larger, more profitable vehicles and into smaller vehicles. We estimate that shifting consumer preferences across all vehicle segments adversely impacted our Automotive operating pre-tax earnings and cash flow in 2008 by about $1.3 billion. Although we now have a more balanced portfolio of small, medium, and large, cars, utilities, and trucks adversely affected our overall market sharethat generally are more fuel efficient and profitability. A continuation or acceleration of this general shiftcontribute higher margins than in consumer preferences – or2008, and a similarlower cost structure, a shift in consumer preferences away from othersales of larger, more profitable vehicle sales – that isvehicles at levels greater than our current planning assumption - whether because of spiking fuel prices, declinesa decline in the construction industry, governmentalgovernment actions or incentives, or other reasons - still could have a substantial adverse effect on our financial condition and results of operations.
ITEM 1A. Risk Factors (continued)
A return to elevated gasoline prices, as well as the potential for volatileAn increase in or continued volatility of fuel prices, or reduced availability of fuel. A return to elevated gas An increase in fuel prices, as well as the potential forcontinued price volatility, in gas prices or reduced availability of fuel, particularly in the United States, could result in further weakening of demand for relatively more profitablemore-profitable large cars, utilities, and luxury car and truck models, and could increasetrucks, while increasing demand for relatively less profitableless-profitable small cars and trucks.vehicles. Continuation or acceleration of such a trend as well asbeyond our current planning assumption, or volatility in demand for theseacross segments, could have a substantial adverse effect on our financial condition and results of operations.
Item 1A. Risk Factors (continued)
Continued or increased price competition resulting from industry overcapacity,excess capacity, currency fluctuations, or other factors. The global automotive industry is intensely competitive, with manufacturing capacity far exceeding current demand. According to CSM Worldwide'sthe January 20102012 report issued by IHS Automotive, the global automotive industry is estimated to have had excess capacity of 2922 million units in 2009.2011. Industry overcapacity has resulted in many manufacturers offering marketing incentives on vehicles in an attempt to maintain and grow market share; these incentives historically have included a combination of subsidized financing or leasing programs, price rebates, and other incentives. As a result, we are not necessarily able to set our prices to offset higher costs of marketing incentives, commodity or other cost increases, or the impact of adverse currency fluctuations, particularly in either the U.S. orand European markets. While we and our domestic competitors have initiated plans to reduce capacity significantly, successful reductions may require further cooperationContinuation of organized labor, take several years to complete, or only partially address the industry's overcapacity problems, particularly in light of recent, dramatic decreases in industry sales volume. A continuation or increase inincreased excess capacity could have a substantial adverse effect on our financial condition and results of operations.
Adverse effects from the bankruptcy, insolvency, or government-funded restructuring of, change in ownership or control of, or alliances entered into by a major competitor. Prior to the government-funded bankruptcy of our domestic competitors General Motors and Chrysler, each of the domestic automakers had substantial "legacy" costs (principally related to employee benefits), as well as a substantial amount of debt. These conditions historically had put each of us at a competitive disadvantage to foreign competitors who began manufacturing in the United States more recently. The government-funded bankruptcy of our domestic competitors has allowed them to eliminate or substantially reduce contractual obligations, including significant amounts of debt, and avoid liabilities. The elimination or reduction of these obligations (including restructuring brands and dealer networks), combined with access to low-cost government funding, could have an adverse effect on our competitive position and results of operations.
A prolonged disruption of the debt and securitization markets. Government-sponsored securitization funding programs (e.g., the U.S. Federal Reserve's Commercial Paper Funding Facility and Term Asset-Backed Securities Loan Facility) intended to improve conditions in the credit markets are scheduled to expire in 2010. If, due to the expiration of such programs or otherwise, there is a prolonged disruption of the debt and securitization markets, Ford Credit would consider further reducing the amount of receivables it purchases or originates. A significant reduction in the amount of receivables Ford Credit purchases or originates would significantly reduce its ongoing profits, and could adversely affect its ability to support the sale of Ford vehicles. To the extent Ford Credit's ability to provide wholesale financing to our dealers or retail financing to those dealers' customers is limited, Ford's ability to sell vehicles would be adversely affected.
Fluctuations in foreign currency exchange rates, commodity prices, and interest rates. As a resource-intensive manufacturing operation, we are exposed to a variety of market and asset risks, including the effects of changes in foreign currency exchange rates, commodity prices, and interest rates. These risks affect our Automotive and Financial Services sectors. We monitor and manage these exposures as an integral part of our overall risk management program, which recognizes the unpredictability of markets and seeks to reduce the potentially adverse effects on our business. Nevertheless, changes in currency exchange rates, commodity prices, and interest rates cannot always be predicted or hedged. In addition, because of intense price competition and our high level of fixed costs, we may not be able to address such changes even if they are foreseeable. Further, our ability to obtain derivatives to manage financial market risk continues to be constrained. As a result, substantial unfavorable changes in foreign currency exchange rates, commodity prices, or interest rates could have a substantial adverse effect on our financial condition and results of operations. See Item 7A for additional discussion of currency, commodity price, and interest rate risks.
Adverse effects on our operations resulting from economic, geopolitical, or other events.With the increasing interconnectedness of global economic and financial systems, a financial crisis, natural disaster, geopolitical crisis, or other significant event in one area of the world can have an immediate and devastating impact on markets around the world. For example, the financial crisis that began in the United States in 2008 quickly spread to other markets; natural disasters in Japan and Thailand during 2011 caused production interruptions and delays not just in Asia Pacific but other regions around the world; and episodes of increased geopolitical tensions or acts of terrorism in the Middle East or elsewhere have at times caused adverse reactions that may spread to economies around the globe.
In 2012, concerns persist regarding the debt burden of certain of the countries that have adopted the euro currency ("Euro area countries") and the ability of these countries to meet future financial obligations, as well as concerns regarding the overall stability of the euro and the suitability of the euro as a single currency given the diverse economic and political circumstances of individual Euro area countries. If a country within the Euro area were to default on its debt or withdraw from the euro currency, or - in a more extreme circumstance - the euro currency were to be dissolved entirely, the impact on markets around the world, and on Ford's global business, could be immediate and significant. Such a scenario - or the perception that such a development is imminent - could adversely affect the value of our euro-denominated assets and obligations. In addition, such a development could cause financial and capital markets within and outside Europe to constrict, thereby negatively impacting our ability to finance our business, and also could cause a substantial dip in consumer confidence and spending that could negatively impact sales of vehicles. Any one of these impacts could have a substantial adverse effect on our financial condition and results of operations.
In addition, we are pursuing growth opportunities in a number of newly-developed and emerging markets. These investments may expose us to heightened risks of economic, geopolitical, or other events, including governmental takeover (i.e., nationalization) of our manufacturing facilities or intellectual property, restrictive exchange controls, disruption of operations as a result of systemic political or economic instability, outbreak of war or expansion of hostilities, and acts of terrorism, each of which could have a substantial adverse effect on our financial condition and results of operations.
Economic distress of suppliers that may require us to provide substantial financial support or take other measures to ensure supplies of components or materials and could increase our costs, affect our liquidity, or cause production constraints or disruptions. Our In recent years, the automotive industry is highly interdependent, with broad overlap of supplier and dealer networks among manufacturers, such that the uncontrolled bankruptcy or insolvency of a major competitor or major suppliers could threaten our supplier or dealer network and thus pose a threat to us as well. Even in the absence of such an event, our supply base has experienced increased economic distress due to the sudden and substantial drop in industry sales volumes that has affected all manufacturers.beginning in 2008. Dramatically lower industry sales volume made existing debt obligations and fixed cost levels difficult for many suppliers to manage.
ITEM 1A. Risk Factors (continued)
These factors have increasedmanage, increasing pressure on the supply base, and, asbase. As a result, suppliers not only have beenwere less willing to reduce prices, but some have requested direct or indirect price increases as well as new and shorter payment terms. Suppliers also are exiting certain lines of business or closing facilities, which results in additional costs associated with transitioning to new suppliers and which may cause supply disruptions that could interfere with our production during any such transitional period. In addition, in the pastAt times, we have taken and may continue to take actionshad to provide financial assistance to certainkey suppliers to ensure an uninterrupted supply of materials and components. In addition, where suppliers have exited certain lines of business or closed facilities due to the economic downturn or other reasons, we generally experience additional costs associated with transitioning to new suppliers. Each of these factors could have a substantial adverse effect on our financial condition and results of operations.
Item 1A. Risk Factors (continued)
Work stoppages at Ford or supplier facilities or other limitations on production (whether as a result of labor disputes, natural or man-made disasters, tight credit markets or other financial distress, production constraints or difficulties, or other factors). A work stoppage or other limitation on production could occur at Ford or supplier facilities for any number of reasons, including as a result of disputes under existing collective bargaining agreements with labor unions or in connection with negotiation of new collective bargaining agreements, or as a result of supplier financial distress or other production constraints or difficulties, or for other reasons. Recent examples of situations that have affected industry production to varying degrees include: supplier financial distress as production volumes decreased during the economic downturn in 2008 - 2009; capacity constraints as suppliers that restructured or downsized during the downturn work to satisfy growing industry volumes; short-term constraints on production as consumer preferences shift more fluidly across vehicle segments and features; and the impact on certain suppliers of natural disasters during 2011. As indicated, a work stoppage or other limitations on production at Ford or supplier facilities for any reason (including but not limited to labor disputes, natural or man-made disasters, tight credit markets or other financial distress, or production constraints or difficulties) could have a substantial adverse effect on our financial condition and results of operations.
Single-source supply of components or materials. Many components used in our vehicles are available only from a single supplier and cannot be re-sourced quickly or inexpensively re-sourced to another supplier due(due to long lead times, and new contractual commitments that may be required by another supplier in orderbefore ramping up to provide the components or materials.materials, etc.). In addition to the general risks described above regarding interruption of supplies, which are exacerbated in the case of single-source suppliers, the exclusive supplier of a key component potentially could exert significant bargaining power over price, quality, warranty claims, or other terms relating to a component.
Labor or other constraints on our ability to restructure our business.maintain competitive cost structure. Substantially all of the hourly employees in our Automotive operations in the United States and Canada are represented by unions and covered by collective bargaining agreements. WeAs indicated, we negotiated a new four-year agreement with the UAW in 2011, and will negotiate a new agreement with the UAW in 2007 and with the CAW in 2008, which expire in September 2011 and September 2012, respectively.2012. Although thesewe have negotiated transformational agreements were amended during 2009 to bring us much of the way to parity with our competitors,in recent years, the agreements still provide for guaranteed wage and benefit levels throughout their termsthe contract term and asome degree of employment security, subject to certain conditions. As a practical matter, these agreements may restrict our ability to close plants and divest businesses duringbusinesses. A substantial number of our employees in other regions are represented by unions or government councils, and legislation or custom promoting retention of manufacturing or other employment in the terms of the agreements. These and other provisions within the UAW and CAW agreementsstate, country, or region may impedeconstrain as a practical matter our ability to restructure our business successfully to compete more effectively in today's global marketplace. Additionally, the rejection by Ford-UAW membership of further modifications to the agreement in late 2009 may put us at a disadvantage to our domestic competitors during the next round of labor negotiations; see "Employment Data" in "Item 1. Business" ("Item 1") for additional discussion.sell or close manufacturing or other facilities.
Work stoppages at Ford or supplier facilities or other interruptions of production. A work stoppage or other interruption of production could occur at Ford or supplier facilities as a result of disputes under existing collective bargaining agreements with labor unions or in connection with negotiations of new collective bargaining agreements, as a result of supplier financial distress, or for other reasons. For example, many suppliers are experiencing financial distress due to decreasing production volume and increasing prices for raw materials, jeopardizing their ability to produce parts for us. A work stoppage or interruption of production at Ford or supplier facilities due to labor disputes, shortages of supplies, or any other reason (including but not limited to tight credit markets or other financial distress, natural or man-made disasters, or production difficulties) could substantially adversely affect our financial condition and results of operations.
Substantial pension and postretirement health care and life insurance liabilities impairing our liquidity or financial condition.We have two principal qualified defined benefit retirement plans in the United States. The Ford-UAW Retirement Plan coversStates that cover our hourly and salaried employees. We also provide pension benefits to non-U.S. employees represented by the UAW, and the General Retirement Plan covers substantially all other Ford employeesretirees, primarily in the United States hired on or before December 31, 2003. The hourly plan provides noncontributory benefits related to employee service. The salaried plan provides similar noncontributory benefits and contributory benefits related to pay and service.Europe. In addition, we and certain of our subsidiaries sponsor plans to provide other postretirement benefits ("OPEB") for retired employees primarily(primarily health care and life insurance benefits.benefits). See Note 1817 of the Notes to the Financial Statements for more information about these plans, including funded status. plans. These benefit plans impose significant liabilities on us whichthat are not fully funded and will require additional cash contributions, by us, which could impair our liquidity.
ITEM 1A. Risk Factors (continued)
Our U.S. defined benefit pension plans are subject to Title IV of the Employee Retirement Income Security Act of 1974 ("ERISA"). Under Title IV of ERISA, the Pension Benefit Guaranty Corporation ("PBGC") has the authority under certain circumstances or upon the occurrence of certain events to terminate an underfunded pension plan. One such circumstance is the occurrence of an event that unreasonably increases the risk of unreasonably large losses to the PBGC. Although we believe that it is not likelyunlikely that the PBGC would terminate any of our plans, in the event that our U.S. pension plans were terminated at a time when the liabilities of the plans exceeded the assets of the plans we would incur a liability to the PBGC that could be equal to the entire amount of the underfunding.
At December 31, 2011, our U.S. and worldwide (including U.S.) defined benefit pension plans were underfunded by a total of $9.4 billion and $15.4 billion, respectively. If our cash flows and capital resources were insufficient to fund our pension or postretirement health care and life insuranceOPEB obligations, we could be forced to reduce or delay investments and capital expenditures, suspend dividend payments, seek additional capital, or restructure or refinance our indebtedness. In addition, if our operating results and available cash were insufficient to meet our pension or postretirement health care and life insurance obligations, we could face substantial liquidity problems and might be required to dispose of material assets or operations to meet our pension or postretirement health care and life insurance obligations. We might not be able to consummate those dispositions or to obtain the proceeds that we could realize from them, and these proceeds might not be adequate to meet any pension and postretirement health care or life insurance obligations then due.
Worse-than-assumed economic and demographic experience for our postretirement benefit plans (e.g., discount rates or investment returns). The measurement of our obligations, costs, and liabilities associated with benefits pursuant to our postretirement benefit plans requires that we estimate the present valuesvalue of projected future payments to all participants. We use many assumptions in calculating these estimates, including assumptions related to discount rates, investment returns on designated plan assets, and demographic experience (e.g., mortality and retirement rates). To the extent actual results are less favorable than our assumptions, there could be a substantial adverse impact on our financial condition and results of operations. For additional discussion of our assumptions, see the "Critical Accounting Estimates" discussion in Item 7 and Note 1817 of the Notes to the Financial Statements.
Item 1A. Risk Factors (continued)
Restriction on use of tax attributes from tax law "ownership change." Section 382 of the U.S. Internal Revenue Code restricts the ability of a corporation that undergoes an ownership change to use its tax attributes, including net operating losses and tax credits ("Tax Attributes"). At December 31, 2009,2011 we had Tax Attributes that would offset $17$15.6 billion of taxable income (representing about $6 billion of our $17.5 billion in deferred tax assets subject to valuation allowance). Anincome. For these purposes, an ownership change occurs if 5 percent shareholders of an issuer's outstanding common stock, collectively, increase their ownership percentage by more than 50 percentage points over a rolling three-year period. Restructuring actions we took in 2009, including our exchange of Ford stockCommon Stock for convertible debt and our public issuance of additional Ford stock,Common Stock, contributed significantly to the collective increase in ownership by 5 percent shareholders. At present, 5 percent shareholders may have collectively increased their ownership in Ford by more than 30about 20 percentage points. In September 2009, we implemented a tax benefit preservation plan (the "Plan") to reduce the risk of an ownership change under Section 382. Under the Plan, shares held by any person who acquires, without the approval of our Board of Directors, beneficial ownership of 4.99% or more of Ford'sour outstanding Common Stock could be subject to significant dilution. Although the Plan presently is scheduled to expire in September 2012, we intend to extend the Plan.
The discovery of defects in vehicles resulting in delays in new model launches, recall campaigns, reputational damage, or increased warranty costs. Meeting or exceeding many government-mandated safety standards is costly and often technologically challenging, especially where standards may conflict with the need to reduce vehicle weight in order to meet government-mandated emissions and fuel-economy standards. Government safety standards also require manufacturers to remedy defects related to motor vehicle safety through safety recall campaigns, and a manufacturer is obligated to recall vehicles if it determines that theythe vehicles do not comply with a safety standard. Should we or government safety regulators determine that a safety or other defect or a noncompliance exists with respect to certain of our vehicles prior to the start of production, the launch of such vehicle could be delayed until such defect is remedied. The costs associated with any protracted delay in new model launches necessary to remedy such defect,defects, or the cost of recall campaigns or warranty costs to remedy such defects in vehicles that have been sold, could be substantial. Further, adverse publicity surrounding actual or alleged safety-related or other defects could damage our reputation and adversely affect sales of our products.
Increased safety, emissions, fuel economy, or other regulationregulations resulting in higher costs, cash expenditures, and/or sales restrictions. The worldwide automotive industry is governed by a substantial amount of governmentalgovernment regulation, which often differs by state, region, and country. GovernmentalGovernment regulation has arisen, and proposals for additional regulation are advanced, primarily out of concern for the environment (including concerns about the possibility of global climate change and its impact), vehicle safety, and energy independence. In addition, many governments regulate local product content and/or impose import requirements as a means of creating jobs, protecting domestic producers, and influencing theirthe balance of payments. In recent years, we have made significant changes to our product cycle plan to improve the overall fuel economy of vehicles we produce, thereby reducing their GHG emissions. There are limits on our ability to achieve fuel economy improvements over a given time frame,timeframe, however, primarily relating to the cost and effectiveness of available technologies, consumer acceptance of new technologies and changes in vehicle mix, willingness of consumers to absorb the additional costs of new technologies, the appropriateness (or lack thereof) of certain technologies for use in particular vehicles, and the human, engineering and financial resources necessary to deploy new technologies across a wide range of products and powertrains in a short time. The cost to comply with existing governmentalgovernment regulations is substantial, and future, additional regulations (already enacted, adopted or proposed) could have a substantial adverse impact on our financial condition and results of operations. For more discussion of the impact of such standards on our global business, see the "Governmental Standards" discussion in Item 1 above. In addition to governmental regulations, a number of influential organizations conduct public domain testing. Even as we continue to evolve our product line, aggressive changes in public domain testing requirements could have a negative influence on future sales.
ITEM 1A. Risk Factors (continued)
Unusual or significant litigation, or governmental investigations or adverse publicity arising out of alleged defects in our products, perceived environmental impacts, or otherwise. We spend substantial resources ensuring compliancethat we comply with governmental safety regulations, mobile and stationary source emissions regulations, and other standards. Compliance with governmental standards, however, does not necessarily prevent individual or class action lawsuits,actions, which can entail significant cost and risk. For example, the preemptive effect of the Federal Motor Vehicle Safety Standards is often a contested issue in litigation, and someIn certain circumstances, courts have permitted liability findingsmay permit tort claims even where our vehicles comply with federal law and/or other applicable law. Furthermore, simply responding to actual or threatened litigation or government investigations of our compliance with regulatory standards, whether related to our products or business or commercial relationships, may require significant expenditures of time and other resources,resources. Litigation also is inherently uncertain, and we could experience significant adverse results. In addition, adverse publicity surrounding an allegation of a defect, regulatory violation or other matter (with or without corresponding litigation or governmental investigation) may cause significant reputational harm.harm that could have a significant adverse effect on our sales.
Item 1A. Risk Factors (continued)
A change in our requirements for parts or materials where we have long-term supply arrangements that commitcommitting us to purchase minimum or fixed quantities of certain parts, or materials, or to pay a minimum amount to the seller ("take-or-pay" contracts). We have entered into a number of long-term supply contracts that require us to purchase a fixed quantity of parts to be used in the production of our vehicles. If our need for any of these parts were to lessen, we could still be required to purchase a specified quantity of the part or pay a minimum amount to the seller pursuant to the take-or-pay contract. We alsocontract, which could have entered into a small numbersubstantial adverse effect on our financial condition or results of long-term supply contracts for raw materials (for example, precious metals used in catalytic converters) that require us to purchase a fixed percentage of mine output. If our need for any of these raw materials were to lessen, or if a supplier's output of materials were to increase, we could be required to purchase more materials than we need.operations.
Adverse effects on our results from a decrease in or cessation or clawback of government incentives related to capital investments. We receive economic benefits from national, state and local governments related to investments we make aroundin various regions of the world. These benefits generally takeworld in the form of tax incentives propertydesigned to encourage manufacturers to establish, maintain or increase investment, workforce or production. These incentives may take various forms, including grants, loan subsidies, and tax abatements infrastructure development, subsidized training programs, and/or other operational grantscredits. The impact of these incentives can be significant in a particular market during a reporting period. For example, most of our manufacturing facilities in South America are located in Brazil, where the state or federal governments have historically offered, and continue to offer, significant incentives to manufacturers to encourage capital investment, increase manufacturing production, and create jobs. As a result, the amounts may be significant.performance of our South American operations has been impacted favorably by government incentives to a substantial extent as we have increased our investment and manufacturing presence in Brazil, and we expect this favorable impact to continue for the next several years. A decrease in, expiration without renewal of, or other cessation or clawback of such benefitsgovernment incentives for any of our business units, as a result of administrative decision or otherwise, could have a substantial adverse impact on our financial condition and results of operations, as well as our ability to fund new investments.
Adverse effects on our operations resulting from certain geo-political or other events. We conduct a significant portion of our business in countries outside of the United States, and are pursuing growth opportunities in a number of emerging markets. These activities expose us to, among other things, risks associated with geo-political events, such as: governmental takeover (i.e., nationalization) of our manufacturing facilities; disruption of operations in a particular country as a result of political or economic instability, outbreak of war or expansion of hostilities; or acts of terrorism. Such events could have a substantial adverse effect on our financial condition and results of operations.
Substantial levels of Automotive indebtedness adversely affecting our financial condition or preventing us from fulfilling our debt obligations (which may grow because we are able to incur substantially more debt, including additional secured debt). As a result of our 2006 and 2009 financing actions and our other debt, we are a highly leveraged company. Our significant Automotive debt service obligations could have important consequences, including the following: our high level of indebtedness could make it difficult for us to satisfy our obligations with respect to our outstanding indebtedness; our ability to obtain additional financing for working capital, capital expenditures, acquisitions, if any, or general corporate purposes may be impaired; we must use a substantial portion of our cash flow from operations to pay interest on our indebtedness, which may reduce the funds available to us for operations and other purposes below the levels of our competitors that have lower interest costs; and our high level of indebtedness makes us more vulnerable to economic downturns and adverse developments in our business. In addition, if we are unable to meet certain covenants of our secured credit facility established in December 2006 ("Credit Agreement") (e.g., if the borrowing base value of assets pledged does not exceed outstanding borrowings), we may be required to repay borrowings under the facility prior to their maturity.
ITEM 1A. Risk Factors (continued)
If our cash flow is worse than expected due to worsening of the economic recession, work stoppages, supply base disruptions, increased pension contributions, or other reasons, or if we are unable to find additional liquidity sources for these purposes, we may need to refinance or restructure all or a portion of our indebtedness on or before maturity, reduce or delay capital investments, or seek to raise additional capital. We may not be able to implement one or more of these alternatives on terms acceptable to us, or at all. The terms of our existing or future debt agreements may restrict us from pursuing some of these alternatives. Should our cash flow be worse than anticipated or we fail to achieve any of these alternatives, this could materially adversely affect our ability to repay our indebtedness and otherwise have a substantial adverse effect on our financial condition and results of operations. For further information on our liquidity and capital resources, including our Credit Agreement, see the discussion in Item 7 under the captions "Liquidity and Capital Resources" and "Overview," and in See Note 192 of the Notes to the Financial Statements.Statements for discussion of the accounting for government incentives, and "Item 3. Legal Proceedings" for discussion of administrative tax proceedings in Brazil.
Inherent limitations of internal controls impacting financial statements and safeguarding of assets. Our internal control over financial reporting and our operating internal controls may not prevent or detect misstatements or loss of assets because of inherent limitations, including the possibility of human error, the circumvention or overriding of controls, or fraud. Effective internal controls can provide only reasonable assurance with respect to financial statement accuracy and safeguarding of assets.
Cybersecurity risks to operational systems, security systems, or infrastructure owned by us or a third-party vendor, or at a supplier facility. Interruptions, outages, or breaches of operational systems (including business, financial, accounting, data processing, in-vehicle, or manufacturing processes), security systems, or infrastructure, as a result of cyber incidents, could materially disrupt critical operations, disclose confidential intellectual property, and/or give rise to allegations of or result in a breach of data privacy or other regulations within or outside the United States.
Failure of financial institutions to fulfill commitments under committed credit facilities. As discussed in "Liquidity and Capital Resources" within Item 7, when we drew the full amount of the revolving credit facility underUnder our secured Credit Agreement in Februarydated December 15, 2006, as amended and restated on November 24, 2009 the $890 million commitment of Lehman Commercial Paper Inc.and as further amended ("LCPI") was not fully funded as a result of LCPI having filed for protection under Chapter 11 of the U.S. Bankruptcy Code in October 2008. As permitted under our Credit Agreement,Agreement"), we are able to the extent weborrow, repay, amounts under our revolving credit facility, we canand then re-borrow those amountsup to $8.9 billion until the facility terminates. If the financial institutions that provide these or other committed credit facilities were to default on their obligation to fund the commitments, these facilities would not be available to us, which could substantially adversely affect our liquidity and financial condition. For discussion of our Credit Agreement, see "Liquidity and Capital Resources" in Item 7 and Note 1918 of the Notes to the Financial Statements.
Inability of Ford Credit to obtain competitive funding. Other institutions that provide automotive financing to certain of our competitors have access to relatively low-cost government-insured or other funding. For example, financial institutions with bank holding company status may have access to other lower cost sources of funding. Access by our competitors' dealers and customers to financing provided by financial institutions with relatively low-cost funding that is not available to Ford Credit could adversely affect Ford Credit's ability to support the sale of Ford vehicles at competitive cost and rates. This in turn would adversely affect the marketability of Ford vehicles in comparison to certain competitive brands.
Inability of Ford Credit to access debt, securitization, or derivative markets around the world at competitive rates or in sufficient amounts, due to credit rating downgrades, market volatility, market disruption, regulatory requirements, or other factorsfactors.. The lower In 2005 and 2006, the credit ratings assigned to Ford Credit over the past several years havewere lowered to below investment grade, which increased its unsecured borrowing costs and have causedrestricted its access to the unsecured debt markets to be more restricted.markets. In response, Ford Credit has increased its use of securitization transactions (including other structured financings) and other sources of liquidity.funding. Although Ford Credit’sCredit has experienced several credit rating upgrades in the past two years and its credit spreads have narrowed considerably, its credit ratings remain below investment grade and Ford Credit still utilizes asset-backed securitization transactions for a substantial amount of its funding.
Ford Credit's ability to obtain funding under its committed asset-backed liquidity programs and certain other asset-backed securitization transactions is subject to having a sufficient amount of assets eligible for these programs, as well as Ford Credit’sCredit's ability to obtain appropriate credit ratings and, for certain committed programs, derivatives to manage the interest rate risk. Over time, and particularly in the event of any credit rating downgrades, market volatility, market disruption, or other factors, Ford Credit may need to reduce the amount of receivables it purchases or originates.originates because of funding constraints. In addition, Ford Credit would need tomay reduce the amount of receivables it purchases or originates if there were a significant decline in the demand for the types of securities it offers or Ford Credit was unable to obtain derivatives to manage the interest rate risk associated with its securitization transactions. A significant reduction in the amount of
Item 1A. Risk Factors (continued)
receivables Ford Credit purchases or originates would significantly reduce its ongoing profits and could substantially adversely affect its ability to support the sale of Ford vehicles.
Higher-than-expected credit losses.losses, lower-than-anticipated residual values or higher-than-expected return volumes for leased vehicles. Credit risk is the possibility of loss from a customer's or dealer's failure to make payments according to contract terms. Credit risk (which is heavily dependent upon economic factors including unemployment, consumer debt service burden, personal income growth, dealer profitability, and used car prices) has a significant impact on Ford Credit's business. The level of credit losses Ford Credit may experience could exceed its expectations and adversely affect its financial condition and results of operations. For additional discussion regarding credit losses, seeIn addition, Ford Credit projects expected residual values (including residual value support payments from Ford) and return volumes for the vehicles it leases. Actual proceeds realized by Ford Credit upon the sale of returned leased vehicles at lease termination may be lower than the amount projected, which would reduce the profitability of the lease transaction. Among the factors that can affect the value of returned lease vehicles are the volume of vehicles returned, economic conditions, and quality or perceived quality, safety, fuel efficiency, or reliability of the vehicles. Actual return volumes may be higher than expected and can be influenced by contractual lease end values relative to auction values, marketing programs for new vehicles, and general economic conditions. Each of these factors, alone or in combination, has the potential to adversely affect Ford Credit's profitability if actual results were to differ significantly from Ford Credit's projections. See "Critical Accounting Estimates" disclosures in Item 7.7 for additional discussion.
ITEM 1A. Risk Factors (continued)
Increased competition from banks or other financial institutions seeking to increase their share of financing Ford vehicles. No single company is a dominant force in the automotive finance industry. Most of Ford Credit's bank competitors in the United States use credit aggregation systems that permit dealers to send, through standardized systems, retail credit applications to multiple finance sources to evaluate financing options offered by these finance sources. This process has resulted in greater competition based on financing rates. In addition, Ford Credit may face increased competition on wholesale financing for Ford dealers. Competition from such competitors with lower borrowing costs may increase, which could substantially adversely affect Ford Credit's profitability and the volume of its business.
Collection and servicing problems related to finance receivables and net investment in operating leases. After Ford Credit purchases retail installment sale contracts and leases from dealers and other customers, it manages or services the receivables. Any disruption of its servicing activity, due to inability to access or accurately maintain customer account records or otherwise, could have a significant negative impact on its ability to collect on those receivables and/or satisfy its customers.
Lower-than-anticipated residual values or higher-than-expected return volumes for leased vehicles. Ford Credit projects expected residual values (including residual value support payments from Ford) and return volumes of the vehicles it leases. Actual proceeds realized by Ford Credit upon the sale of returned leased vehicles at lease termination may be lower than the amount projected, which reduces the profitability of the lease transaction. Among the factors that can affect the value of returned lease vehicles are the volume of vehicles returned, economic conditions, and the quality or perceived quality, safety, fuel efficiency, or reliability of the vehicles. Actual return volumes may be higher than expected and can be influenced by contractual lease end values relative to auction values, marketing programs for new vehicles, and general economic conditions. All of these factors, alone or in combination, have the potential to adversely affect Ford Credit's profitability. For additional discussion of residual values, see the "Critical Accounting Estimates" disclosures in Item 7.
New or increased credit, consumer, or data protection or other regulations resulting in higher costs and/or additional financing restrictions. As a finance company, Ford Credit is highly regulated by governmental authorities in the locations wherein which it operates.operates, which can impose significant additional costs and/or restrictions on its business. In the United States, itsfor example, Ford Credit's operations are subject to regulation, supervision, and licensing under various federal, state, and local laws and regulations, including the federal Truth-in-Lending Act, Equal Credit Opportunity Act, and Fair Credit Reporting Act.
Congress also passed the Dodd-Frank Wall Street Reform and Consumer Protection Act ("Act") in 2010 to reform practices in the financial services industries, including automotive financing and securitizations. The Act directs federal agencies to adopt rules to regulate the consumer finance industry and the capital markets and, among other things, gives the new Consumer Financial Protection Bureau broad rule-making authority for a wide range of consumer protection laws that will regulate consumer finance businesses, such as Ford Credit's retail automotive financing business. The Act also creates an alternative liquidation framework under which the Federal Deposit Insurance Corporation ("FDIC") may be appointed as receiver of a non-bank financial company if the U.S. Treasury Secretary (in consultation with the President of the United States) determines that the company is in default or danger of default and the resolution of the company under other applicable law (e.g., U.S. bankruptcy law) would have serious adverse effects on the financial stability of the United States. The FDIC's powers under this framework may vary from those of a bankruptcy court under U.S. bankruptcy law, which could adversely impact securitization markets, including Ford Credit's funding activities, regardless of whether Ford Credit ever is determined to be subject to the Act's alternative liquidation framework.
Federal agencies are given significant discretion in drafting the rules and regulations necessary to implement the Act, and, consequently, the effects of the Act on the capital markets and the consumer finance industry may not be known for years. The Act and its implementing rules and regulations could impose additional costs on Ford Credit and adversely affect its ability to conduct its business.
In some countries outside the United States, Ford Credit's subsidiaries are regulated banking institutions and are required, among other things, to maintain minimum capital reserves. In many other locations, governmental authorities require companies to have licenses in order to conduct financing businesses. Efforts to comply with these laws and regulations impose significant costs on Ford Credit, and affect the conduct of its business. Additional regulation could add significant cost or operational constraints that might impair itsFord Credit's profitability.
Inability to implement our One Ford plan. As discussed in the "Overview" section in Item 7, we are taking actions to execute the four priorities of our One Ford plan and address the impact of current economic conditions, including the deteriorated credit market and automotive sales. To the extent that we are unable to implement necessary actions to execute our plan, our financial condition and results of operations would be substantially adversely affected.22
ITEM 1B. Unresolved Staff Comments
None to report.None.
ITEM 2. Properties
Our principal properties include manufacturing and assembly facilities, distribution centers, warehouses, sales or administrative offices, and engineering centers.
We own substantially all of our U.S. manufacturing and assembly facilities, although many of these properties have been pledged to secure indebtedness or other obligations. Our facilities are situated in various sections of the country and include assembly plants, engine plants, casting plants, metal stamping plants, transmission plants, and other component plants. About half of our distribution centers are leased (we own approximately 53%54% of the total square footage, and lease the balance). A substantial amount of our warehousing is provided by third-party providers under service contracts. Because the facilities provided pursuant to third-party service contracts need not be dedicated exclusively or even primarily to our use, these spaces are not included in the number of distribution centers/warehouses listed in the table below. AllThe majority of the warehouses that we operate are leased, although many of our manufacturing and assembly facilities contain some warehousing space. Substantially all of our sales offices are leased space. Approximately 98%99% of the total square footage of our engineering centers and our supplementary research and development space is owned by us. Many of the facilities, as well as most of the machinery and equipment, that we own and operate in the United States have been pledged to secure our obligations under the Credit Agreement. For discussion of the Credit Agreement, see "Liquidity and Capital Resources" in Item 7 and Note 1918 of the Notes to the Financial Statements.
In addition, we maintain and operate manufacturing plants, assembly facilities, parts distribution centers, and engineering centers outside of the United States. We own substantially all of our non-U.S. manufacturing plants, assembly facilities, and engineering centers. The majority of our parts distribution centers outside of the United States are either leased or provided by vendors under service contracts. As in the United States, space provided by vendors under service contracts need not be dedicated exclusively or even primarily to our use, and is not included in the number of distribution centers/warehouses listed in the table below.
The total number of plants, distribution centers/warehouses, engineering and research and development sites, and sales offices used by our Automotive segments as of December 31, 20092011 are shown in the table below:
| | Segment | | | | | Distribution Centers/Warehouses | | | Engineering, Research/Development | | | | | | Plants | | Distribution Centers/ Warehouses | | Engineering, Research/ Development | | Sales Offices |
Ford North America | | | 40 | (a) | | | 31 | | | | 53 | (b) | | | 58 | | | 35 | (a) | 30 | | 45 | | 60 |
Ford South America (b) | | | 7 | | | | 7 | | | | 3 | | | | 9 | | |
| Ford South America | | | 8 | | 3 | | 1 | | 8 |
Ford Europe | | | 20 | | | | 8 | | | | 5 | | | | 19 | | | 14 | | 7 | | 4 | | 25 |
Volvo | | | 8 | | | | 11 | | | | 2 | | | | 37 | (b) | |
Ford Asia Pacific Africa | | | 12 | | | | 2 | | | | 2 | | | | 13 | | | 12 | | 1 | | 6 | | 17 |
Total | | | 87 | | | | 59 | | | | 65 | | | | 136 | | | 69 | | 41 | | 56 | | 110 |
______________________
| |
| (a) | We have announced plans to close a number of North American facilities as part of our restructuring actions; facilities that have been closed to date are not included in the table. The table includes fivefour facilities operated by Automotive Components Holdings, LLC ("ACH"), which is controlled by us. We have been working to sell or close the majority of the 15 ACH component manufacturing plants; to date, we have sold five ACH plants and closed another five. We plan to close a sixth plantone of the remaining ACH plants in 2011.2012. We are exploring our options for the three remaining ACH plants (Milan,(i.e., Saline, Sandusky, and Sheldon Road, Saline and Sandusky)Road), and intend to transition these businesses to the supply base as soon as practicable. |
(b) | Increase compared with prior year reflects redefinition of site locations and improved data tracking, not increase in physical property. |
ITEM 2. Properties (continued)
Included in the number of plants shown above are several plants that are not operated directly by us, but rather by consolidated joint ventures that operate plants that support our Automotive sector. The new accounting standard related to the consolidation of variable interest entities is effective for us as of January 1, 2010, and will result in the deconsolidation of many of our consolidated joint ventures. As of December 31, 2009,2011, the significant consolidated joint ventures and the number of plants they own areeach owns is as follows:
Ford Lio Ho Motor Company Ltd. ("FLH") — a joint venture in Taiwan among Ford (70% partner), the Lio Ho Group (25% partner) and individual shareholders (5% ownership in aggregate) that assembles a variety of Ford and Mazda vehicles sourced from Ford as well as Mazda. In addition to domestic assembly, FLH also has local product development capability to modify vehicle designs for local needs, and imports Ford-brand built-up vehicles from Europe and the United States. This joint venture operates one plant.
Ford Vietnam LimitedAutoAlliance International, Inc. ("AAI") — a joint venture between Ford (75% partner) and Song Cong Diesel Limited Company (25% partner). Ford Vietnam Limited assembles and distributes a variety of Ford passenger and commercial vehicle models. This joint venture operates one plant.
ITEM 2. Properties (continued)
In addition to the plants that we operate directly or that are operated by consolidated joint ventures, additional plants that support our Automotive sector are operated by unconsolidated joint ventures of which we are a partner. These plants are not included in the number of plants shown in the table above. The most significant of these joint ventures are:
AAI — a 50/50 joint venture with Mazda (of which we own approximately 11%), whichthat operates as its principal business an automobile vehicle assembly plant in Flat Rock, Michigan. AAI currently produces the Mazda6 and Ford Mustang models. Ford suppliesWe supply all of the hourly and substantially all of the salaried laborpersonnel requirements to AAI, and AAI reimburses Fordus for the full costcost. Production of that labor.the Mazda6 at the AAI facility is scheduled to end later this year, while production of the Ford Fusion is scheduled to begin at this facility in 2013.
AutoAlliance (Thailand) Co., Ltd. ("AAT")First Aquitaine Industries SAS ("First Aquitaine" — a joint venture among Ford (50%), Mazda (45%) —and a Thai affiliate of Mazda's (5%) that owns and operates a transmissionmanufacturing plant in Bordeaux, France which manufactures automatic transmissionsRayong, Thailand. AAT produces Ford and Mazda products for domestic sale and export, the latter in both built-up and kit form with export of certain products to markets outside the Asia Pacific Africa region. Production includes the Ford Explorer,Everest sport utility vehicle and the Ford Ranger and Mustang vehicles. DuringMazda BT-50 pickup trucks. With the second quartercompletion of 2009, we transferred legal ownership of First Aquitaine to HZ Holding France. We also entered into a volume-dependent pricing agreement with the new owner to purchase transmissions through the endsignificant expansion of the product cycle.facility and implementation of new, highly flexible manufacturing equipment and processes, production now also includes the Ford Fiesta, Mazda2, and Mazda3 small passenger cars.
Blue Diamond Parts, LLC ("Blue Diamond Parts") — a joint venture between Ford (25% partner) and Navistar International Corporation (formerly known as International Truck and Engine Corporation) ("Navistar") (75% partner), in which the two partners share equal voting rights. Blue Diamond Parts manages sourcing, merchandising, and distribution of certain service parts for trucks sold in North America. We will continue to collaborate on this joint venture.
Blue Diamond Truck, S. de R.L. de C.V. ("Blue Diamond Truck") — a joint venture between Ford (25% partner) and Navistar (75% partner), in which the two partners share equal voting rights. Blue Diamond Truck develops and manufactures selected medium-duty commercial trucks in Mexico and sells the vehicles to Ford and Navistar for distribution. We have given notice that we are terminating the Blue Diamond Truck joint venture effective September 2014, and will in-source production of F-650/750 trucks to our Ohio Assembly Plant.
Changan Ford Mazda Automobile Corporation, Ltd. ("CFMA") — a joint venture among Ford (35% partner), Mazda (15% partner), and the Chongqing Changan Automobile Co., Ltd. ("Changan") (50% partner). Through its facilities in the Chinese cities of Chongqing and Nanjing, CFMA produces and distributes in China an expanding variety of Ford passenger car models, as well as Mazda and Volvo models.
Changan Ford Mazda Engine Company, Ltd. ("CFME") — a joint venture among Ford (25% partner), Mazda (25% partner), and the Chongqing Changan Automobile Co., Ltd (50% partner). CFME is located in Nanjing, and produces the Ford New I4 and Mazda BZ engines in support of the assembly of Ford- and Mazda-branded vehicles manufactured in China.
Ford Otosan — a joint venture in Turkey between Ford (41% partner), the Koc Group of Turkey (41% partner), and public investors (18%) that is a major supplier of the Ford Transit Connect vehicle and our sole distributor of Ford vehicles in Turkey. In addition, Ford Otosan makes the Ford Transit series and the Cargo truck for the Turkish and export markets, and certain engines and transmissions, most of which are under license. This joint venture owns and operates two plants, a parts distribution depot, and a Product Development Center in Turkey.
Ford Romania S.A. — we completed the acquisition of the Romanian company S.C. Automobile Craiova, S.A. ("ACSA"), and now have 100% ownership. Although we manage the day-to-day operations in Craiova, pursuant to the sale and purchase agreement the Romanian government maintains the ability to influence certain key decisions regarding the business until March 2012. We have been in discussions with the Romanian government to renegotiate some of the terms of the sale and purchase agreement, including an extension of the agreement to January 2013. We anticipate that we will consolidate the operations upon cessation of the government's control and participation pursuant to the sale and purchase agreement. This entity includes a vehicle assembly plant, an engine assembly plant, and the sales activities of Ford in Romania. In mid-2012, the plant will commence production of the all-new B-MAX for sale in Europe and the production of a new high-technology small 3-cylinder engine.
FordSollers — a new 50/50 joint venture between Ford and Sollers OJSC, which was launched on October 1, 2011. We contributed our operations in Russia, consisting primarily of a manufacturing plant and access to our Russian dealership network. Sollers OJSC contributed two production facilities and will support the
ITEM 2. Properties (continued)
joint venture through its manufacturing capabilities, knowledge of the Russian market, experience in distribution, and work with the Russian supply base. In addition, we granted to the joint venture an exclusive right to manufacture, assemble, and distribute certain Ford-brand vehicles in Russia through the licensing of certain trademarks and intellectual property rights. The joint venture primarily will be engaged in manufacturing a range of Ford passenger cars and light commercial vehicles. The application to the Russian government for this joint venture to participate in the new industrial assembly regime, which will qualify it for reduced import duties for parts imported into Russia, was approved on June 1, 2011.
Getrag Ford Transmissions GmbH ("Getrag Ford")— a 50/50 joint venture with Getrag Deutsche Venture GmbH and Co. KG, a German company, to which we transferred our European manual transmission operations, including plants, from Halewood, England; Cologne, Germany; and Bordeaux, France. In 2004, Volvo Car Corporation ("Volvo Cars") transferred its manual transmission business from its Köping, Sweden plant to Getrag Ford. In 2008, we added the Kechnec plant in Slovakia. Getrag Ford producesoperates these four plants, producing manual transmissions for Ford Europe and Volvo. We currently supply most of the hourly and salaried labor requirements of the operations transferred to this joint venture. Our employees who worked at the manual transmission operations transferred at the time of formation of the joint venture are assigned to the joint venture. Inventure; in the event of surplus labor at the joint venture, our employees assigned to Getrag Ford may return to Ford. Employees hired in the future to work in these operations will be employed directly by Getrag Ford. Getrag Ford reimburses us for the full cost of the hourly and salaried labor we supply. This joint venture operates four plants.
JMCGetrag All Wheel Drive AB — a joint venture in Sweden between Getrag Dana Holding GmbH (60% partner) and Volvo Cars (40% partner). In January 2004, Volvo Cars transferred to this joint venture its All Wheel Drive business and its plant in Köping, Sweden. The joint venture produces all-wheel drive components. As noted above, the manual transmission operations at the Köping plant were transferred to Getrag Ford. The hourly and salaried employees at the plant have become employees of the joint venture.
Tekfor Cologne GmbH ("Tekfor") — a 50/50 joint venture of Ford-Werke GmbH ("Ford-Werke") and Neumayer Tekfor Holding GmbH, a German company, to which joint venture Ford-Werke transferred the operations of the Ford forge in Cologne. The joint venture produces forged components, primarily for transmissions and chassis, for use in Ford vehicles and for sale to third parties. Those Ford employees who worked at the Cologne Forge Plant at the time of the formation of the joint venture are assigned to Tekfor by us and remain our employees. In the event of surplus labor at the joint venture, Ford employees assigned to Tekfor may return to Ford. New workers at the joint venture will be hired as employees of the joint venture. Tekfor reimburses us for the full cost of our employees assigned to the joint venture. This joint venture operates one plant.
Pininfarina Sverige, AB — a joint venture between Volvo Cars (40% partner) and Pininfarina, S.p.A. ("Pininfarina") (60% partner). In September 2003, Volvo Cars and Pininfarina established this joint venture for the engineering and manufacture of niche vehicles, starting with a new, small convertible (Volvo C70), which is distributed by Volvo. The joint venture began production of the new car at the Uddevalla Plant in Sweden, which was transferred from Volvo Cars to the joint venture in December 2005, and is the joint venture's only plant.
ITEM 2. Properties (continued)
Ford Vietnam Limited — a joint venture between Ford (75% partner) and Song Cong Diesel Limited Company (25% partner). Ford Vietnam Limited assembles and distributes several Ford vehicles in Vietnam, including Escape, Everest, Focus, Mondeo, Ranger and Transit models. This joint venture operates one plant.
Ford Lio Ho Motor Company Ltd. ("FLH") — a joint venture in Taiwan among Ford (70% partner), the Lio Ho Group (25% partner) and individual shareholders (5% ownership in aggregate) that assembles a variety of Ford and Mazda vehicles sourced from Ford as well as Mazda. In addition to domestic assembly, FLH also has local product development capability to modify vehicle designs for local needs, and imports Ford-brand built-up vehicles from Europe and the United States. This joint venture operates one plant.
In addition to the plants that we operate directly or that are operated by consolidated joint ventures, additional plants that support our Automotive sector are operated by unconsolidated joint ventures of which we are a partner. These plants are not included in the number of plants shown in the table above. The most significant of these joint ventures are:
AutoAlliance (Thailand) Co. Ltd. ("AAT") — a joint venture among Ford (50%), Mazda (45%) and a Thai affiliate of Mazda's (5%), which owns and operates a manufacturing plant in Rayong, Thailand. AAT produces the Ford Everest, Ford Ranger and Mazda B-Series pickup trucks for the Thai market and for export to over 100 countries worldwide (other than North America), in both built-up and kit form. AAT has announced plans to build a new, highly flexible passenger car plant that will utilize state-of-the-art manufacturing technologies and will produce both Ford and Mazda badged small cars beginning in 2010.
Blue Diamond Truck, S. de R.L. de C.V. ("Blue Diamond Truck") — a joint venture between Ford (25% partner) and Navistar International Corporation (formerly known as International Truck and Engine Corporation) (75% partner) ("Navistar"). Blue Diamond Truck develops and manufactures selected medium and light commercial trucks in Mexico and sells the vehicles to Ford and Navistar for their own independent distribution. Blue Diamond Truck manufactures Ford F-650/750 medium-duty commercial trucks that are sold in the United States and Canada and Navistar trucks that are sold in Mexico.
Tenedora Nemak, S.A. de C.V. — a joint venture between Ford (6.75% partner) and a subsidiary of Mexican conglomerate Alfa S.A. de C.V. (93.25% partner), which owns and operates, among other facilities, a portion of our former Canadian castings operations, and supplies engine blocks and heads to several of our engine plants. Ford supplies a portion of the hourly labor requirements for the Canadian plant, for which it is fully reimbursed by the joint venture.
Changan Ford Mazda Automobile Corporation, Ltd. ("CFMA") — a joint venture among Ford (35% partner), Mazda (15% partner), and the Chongqing Changan Automobile Co., Ltd. ("Changan") (50% partner). Through its facility in the Chinese cities of Chongqing and Nanjing, CFMA produces and distributes in China the Ford Mondeo, Focus, S-MAX and Fiesta, the Mazda2, the Mazda3, the Volvo S40 and the Volvo S80.
Changan Ford Mazda Engine Company, Ltd. ("CFME") — a joint venture among Ford (25% partner), Mazda (25% partner), and the Chongqing Changan Automobile Co., Ltd (50% partner). CFME is located in Nanjing, and produces the Ford New I4 and Mazda BZ engines in support of the assembly of Ford- and Mazda-branded vehicles manufactured in China.
Jiangling Motors Corporation, Ltd. ("JMC") — a publicly-traded company in China with Ford (30% shareholder) and Jiangxi Jiangling Holdings, Ltd. (41% shareholder) as its controlling shareholders. Jiangxi Jiangling Holdings, Ltd. is a 50/50 joint venture between Chongqing Changan Automobile Co., Ltd. and Jiangling Motors Company Group. The public investors of JMC own 29% of its outstanding shares. JMC assembles the Ford Transit van and other non-Ford-technology-based vehicles for distribution in China.
Tenedora Nemak, S.A. de C.V. — a joint venture between Ford (6.75% partner) and a subsidiary of Mexican conglomerate Alfa S.A. de C.V. (93.25% partner), which owns and operates, among other facilities, a portion of our former Canadian castings operations, and supplies engine blocks and heads to several of our engine plants. We currently supply a portion of the hourly labor requirements for the Canadian plant, for which it is fully reimbursed by the joint venture. Beginning mid-year, the joint venture will supply all of its hourly labor requirements.
The facilities owned or leased by us or our subsidiaries and joint ventures described above are, in the opinion of management, suitable and more than adequate for the manufacture and assembly of our products.
The furniture, equipment and other physical property owned by our Financial Services operations are not material in relation to their total assets.
ITEM 3.Legal Proceedings
Various legal actions, governmental investigations, proceedings,The litigation process is subject to many uncertainties, and claims are pending or may be instituted or asserted in the future against us and our subsidiaries, including butoutcome of individual litigated matters is not limited to those arising out of alleged defects in our products; governmental regulations covering safety, emissions, and fuel economy or other matters; government incentives related to capital investments; tax matters; financial services; employment-related matters; dealer, supplier, and other contractual relationships; intellectual property rights; product warranties; environmental matters; shareholder or investor matters; and financial reporting matters. Certainpredictable with assurance. See Note 30 of the pending legal actions are, or purportNotes to be, class actions. Somethe Financial Statements for discussion of the foregoing matters involve or may involve claims for compensatory, punitive, or antitrust or other multiplied damage claims in very large amounts, or demands for recall campaigns, environmental remediation programs, sanctions, loss of government incentives, assessments, or other relief that, if granted, would require very large expenditures. We regularly evaluate the expected outcome of product liability litigation and other legal proceedings. We have accrued expenses for probable losses on product liability matters, in the aggregate, based on an analysis of historical litigation payouts and trends. We also have accrued expenses for other legal proceedings where losses are deemed probable and reasonably estimable. These accruals are reflected in our financial statements.
contingencies.Following is a discussion of our significant pending legal proceedings:
PRODUCT LIABILITY MATTERS
We are a defendant in numerous actions in state and federal courts within and outside of the United States alleging damages from injuries resulting from (or aggravated by) alleged defects in our vehicle lines of various model years. In many, no dollar amount of damages is specified, or the specific amount alleged is the jurisdictional minimum. Our experience with litigation alleging a specific amount of damages suggests that such amounts, on average, bear little relation to the actual amount of damages, if any, that we will pay in resolving such matters. Any damages we pay in a negotiated settlement or as the result of a verdict generally have been, on average, substantially less than the amounts originally claimed.
Based on our knowledge of the facts and circumstances asserted, our historical experience with matters of a similar nature, and our assessment of the likelihood of prevailing and the severity of any potential loss, we establish litigation accruals. In addition to pending actions, we assess the likelihood of incidents that likely have occurred but not yet been reported to us; we also take into consideration specific matters that have been raised as claims but have not yet proceeded to litigation. Individual product liability matters which, if resolved unfavorably to the Company, likely would involve a significant cost would be described herein. Currently there are no such matters to report.
Item 3. Legal Proceedings (continued)
ASBESTOS MATTERS
Asbestos was used in some brakes, clutches, and other automotive components from the early 1900s. Along with other vehicle manufacturers, we have been the target of asbestos litigation and, as a result, are a defendant in various actions for injuries claimed to have resulted from alleged exposure to Ford parts and other products containing asbestos. Plaintiffs in these personal injury cases allege various health problems as a result of asbestos exposure, either from component parts found in older vehicles, insulation or other asbestos products in our facilities, or asbestos aboard our former maritime fleet. We believe that we are being targeted more aggressively targeted in asbestos suits because many previously targetedpreviously-targeted companies have filed for bankruptcy.
Most of the asbestos litigation we face involves individuals who claim to have worked on the brakes of our vehicles over the years. We are prepared to defend these cases, and believe that the scientific evidence confirms our long-standing position that there is no increased risk of asbestos-related disease as a result of exposure to the type of asbestos formerly used in the brakes on our vehicles.
The extent of our financial exposure to asbestos litigation remains very difficult to estimate.estimate and could include both compensatory and punitive damage awards. The majority of our asbestos cases do not specify a dollar amount for damages, anddamages; in many of the other cases the dollar amount specified is the jurisdictional minimum. Theminimum, and the vast majority of these cases involve multiple defendants, with the number in some cases exceeding one hundred. Many of these cases also involve multiple plaintiffs, and often we often are unable to tell from the pleadings which plaintiffs are making claims against us (as opposed to other defendants). Annual payout and defense costs may become substantialsignificant in the future.
ENVIRONMENTAL MATTERS
General.We have received notices under various federal and state environmental laws that we (along with others) are or may be a potentially responsible party for the costs associated with remediating numerous hazardous substance storage, recycling, or disposal sites in many states and, in some instances, for natural resource damages. We also may have been a generator of hazardous substances at a number of other sites. The amount of any such costs or damages for which we may be held responsible could be significant. The contingent losses that we expect to incur in connection with many of these sites have been accrued and those accruals are reflected in our financial statements. For many sites, however, the remediation costs and other damages for which we ultimately may be responsible are not reasonably estimable because of uncertainties with respect to factors such as our connection to the site or to materials there, the involvement of other potentially responsible parties, the application of laws and other standards or regulations, site conditions, and the nature and scope of investigations, studies, and remediation to be undertaken (including the technologies to be required and the extent, duration, and success of remediation). As a result, we are unable to determine or reasonably estimate the amount of costs or other damages for which we are potentially responsible in connection with these sites, although that total could be significant.
ITEM 3. Legal Proceedings (continued)
Following are individual environmental legal proceedings to which a governmental authority is a party and in which there is the possibility of monetary sanctions in excess of $100,000:
Edison Assembly Plant Concrete Disposal. During demolition of our Edison Assembly Plant, we discovered very low levels of contaminants in the concrete slab. The concrete was crushed and reused by several developers as fill material at ten different off-site locations. The New Jersey Department of Environmental Protection ("DEP") asserts that some of these locations may not have been authorized to receive the waste. In March 2006, the DEP ordered Ford, itsus, supplier MIG-Alberici, Inc., and the developer Edgewood Properties, Inc., to investigate, and, if appropriate, remove contaminated materials. We have substantially completed the work at a number of locations, and Edgewood is completing the investigation and remediation at several locations that it owns. We resolved the matter with DEP through an administrative consent order ("Order"), pursuant to which we paid approximately $460,000 for oversight costs, penalties, and environmental education projects, and donated emissions reduction credits to the State of New Jersey. After reviewing comments submitted by Edgewood, the DEP finalized the Order in February 2009. Edgewood has appealed the issuance of the Order to the Appellate Division of the New Jersey Superior Court. The New Jersey Attorney General's office has closed its investigation of us.
Sterling Axle Plant. The Michigan Department of Environmental Quality ("MDEQ") issued four Letters of Violation to the Sterling Axle Plant between April 17, 2008 and October 7, 2008 related to our self-report of several potential violations of air permits at this location. We promptly took steps to correct and prevent recurrence of the potential violations. We agreed with the MDEQ in 2009 to resolve the enforcement proceeding through a civil administrative settlement, which included a $129,920 penalty. In 2009, we learned that the U.S. Environmental Protection Agency and the U.S. Department of Justice had opened a criminal investigation into the potential violations. We are cooperating fully in the investigation, including disclosing additional potential violations that were discovered since the initial enforcement action.
Dearborn Research and Engineering Center. In August 2009, our Dearborn Research and Engineering Center ("R&E Center") received a notice of violation from the MDEQ alleging that the R&E Center exceeded fuel usage limitations at its engine test facility, and did not properly certify compliance with its air permit. MDEQ has commenced an administrative enforcement proceeding. We are working with MDEQ to resolve this matter, and have taken appropriate actions to address any violations.
CLASS ACTIONS
In light of the fact that very few of the purported class actions filed against us in the past ever have ever been certified by the courts as class actions, the actions listed below are those (i) that have been certified as a class action by a court of competent jurisdiction (and any additional purported class actions that raise allegations substantially similar to a certified case), and (ii) that, if resolved unfavorably to the Company, likely would likely involve a significant cost.
Canadian Export Antitrust Class Actions. Eighty-three purported class actions on behalf of all purchasers of new motor vehicles in the United States since January 1, 2001 have been filed in various state and federal courts against numerous defendants, including us. The federal and state complaints allege, among other things, that vehicle manufacturers, aided by dealer associations, conspired to prevent the sale to U.S. citizens of vehicles produced for the Canadian market and sold by dealers in Canada at lower prices than vehicles sold in the United States. The complaints seek injunctive relief under federal antitrust law and treble damages under federal and state antitrust laws. The federal court actions were consolidated for coordinated pretrial proceedings in the U.S. District Court for the District of Maine and have been dismissed. Cases remain pending in state courts in Arizona, California, Florida, Minnesota, New Mexico, Tennessee, and Wisconsin. AIn California, where a statewide class hashad been certified, in the California case; proceedings incourt recently granted Ford's motion for summary judgment; an appeal by the other state cases had been stayed pending resolution of the consolidated federal court action.plaintiffs is possible.
ITEMItem 3. Legal Proceedings (continued)
Medium/Heavy Truck Sales Procedure Class Action. This action pending in the Ohio state court system alleges that Ford breached its Sales and Service Agreement with Ford truck dealers by failing to publish to all Ford dealers all price concessions that were approved for any dealer. The trial court certified a nationwide class consisting of all Ford dealers who purchased from Ford any 600-series or higher truck from 1987 to 1997, and granted plaintiffs' motion for summary judgment on liability. In February 2011, the jury awarded $4.5 million in damages to the named plaintiff dealer, as previously reported. In June 2011, the trial court applied the jury's findings with regard to the named plaintiff to all dealers in the class, entering a judgment of approximately $2 billion in damages (comprised of about $800 million in damages, and $1.2 billion in pre-judgment interest). The trial court also denied our motion to decertify the class. We have appealed, and we believe the law supports our position.
OTHER MATTERS
ERISA Fiduciary Litigation. A purported class action lawsuit is pending in the U.S. District Court for the Eastern District of Michigan naming as defendants Ford Motor Company and several of our current or former employees and officers (Nowak, et al. v. Ford Motor Company, et al., along with three consolidated cases). The lawsuit alleges that the defendants violated the Employee Retirement Income Security Act (“ERISA”) by failing to prudently and loyally manage funds held in employee savings plans sponsored by Ford. Specifically, the plaintiffs allege (among other claims) that the defendants violated fiduciary duties owed to plan participants by continuing to offer Ford Common Stock as an investment option in the savings plans.
SEC Pension and Post-Employment Benefit Accounting Inquiry. On October 14, 2004, the Division of Enforcement of the Securities and Exchange Commission ("SEC") notified us that it was conducting an inquiry into the methodology used to account for pensions and other post-employment benefits. We were one of several companies to receive requests for information as part of this inquiry. We completed submission of all information requested to date as of April 2007.
Apartheid Litigation. Along with severaltwo other prominent multinational companies, we are a defendant in purported class action lawsuits seeking unspecified damages on behalf of South African citizens who suffered violence and oppression under South Africa's apartheid regime. The lawsuits allege that by doing business in South Africa, the defendant companies aided and abetted the apartheid regime and its human rights violations. These cases, collectively referred to as In re South African Apartheid Litigation, were initially filed in 2002 and 2003, and are being handled together as coordinated "multidistrict litigation" in the U.S. District Court for the Southern District of New York. The District Court dismissed these cases in 2004, but in 2007 the U.S. Court of Appeals for the Second Circuit reversed and remanded the cases to the District Court for further proceedings. Amended complaints were filed during 2008; motions to dismiss have been granted in part and denied in part, and the defendants’defendants' appeal to the U.S. Court of Appeals is pending.
Brazilian State Tax Matters. Two Brazilian states have levied tax assessments against Ford Brazil, claiming that certain state tax incentives from the state of Bahia did not receive formal approval from the organization of Brazilian state treasury offices. We have appealed the assessment to the administrative level in each state; if we do not prevail at the administrative level, we plan to appeal to the relevant state court, which likely would require us to post significant cash or other collateral in order to proceed. We also have been notified that a third state is beginning an audit relating to these incentives; under that state's system, we may need to post significant cash or other collateral at the beginning of the administrative process to challenge any assessment.
ITEM 4. Submission of Matters to a Vote of Security HoldersMine Safety Disclosures.
Not required.applicable.
ITEM 4A.Executive Officers of Ford
Our executive officers are as follows, along with each executive officer's position and their positions and agesage at February 1, 2010 are as follows:2012:
|
| | | | | | | |
| Name | | Name
Position | | | | Present Position
Held Since | | | |
| | | | | | | |
| William Clay Ford, Jr. (a) | | Executive Chairman and Chairman of the Board | | SeptemberSept. 2006 | | 54 | 52 | |
| | | | | | | |
|
| Alan Mulally (b) | | President and Chief Executive Officer | | SeptemberSept. 2006 | | 66 | 64 | |
| | | | | | | |
|
| Michael E. Bannister | | Executive Vice President – Chairman and Chief Executive Officer, Ford Motor Credit Company Co. | | OctoberOct. 2007 | | 62 | 60 | |
| | | | | | | |
|
| Lewis W. K. Booth (c) | | Executive Vice President and Chief Financial Officer | | NovemberNov. 2008 | | 63 | 61 | |
| | | | | | | |
|
| Mark Fields | | Executive Vice President – President, The Americas | | OctoberOct. 2005 | | 51 | 49 | |
| | | | | | | |
|
| John Fleming | | Executive Vice President – Global Manufacturing and Labor Affairs and Chairman, Ford Europe | | November 2008Dec. 2009 | | 61 | 59 | |
| | | | | | | |
|
| Tony Brown | | Group Vice President – Purchasing | | AprilApr. 2008 | | 55 | 53 |
|
| | | | | | | | |
Susan M. CischkeJames D. Farley, Jr. | | Group Vice President – Sustainability, EnvironmentGlobal Marketing, Sales and Safety EngineeringService | | April 2008 | | | 55 | |
| | | | | | | | |
James D. Farley | | Group Vice President – Sales, Global Marketing and Canada, Mexico & South America Operations
| | NovemberNov. 2007 | | 49 | 47 | |
| | | | | | | |
|
| Felicia Fields | | Group Vice President – Human Resources and Corporate Services | | AprilApr. 2008 | | 46 | 44 | |
| | | | | | | |
|
| Bennie Fowler | | Group Vice President – Quality | | AprilApr. 2008 | | 55 | 53 | |
| | | | | | | |
|
| Joseph R. Hinrichs | | Group Vice President – President, Asia Pacific and Africa | | DecemberDec. 2009 | | 45 | 43 | |
| | | | | | | |
|
| Derrick M. Kuzak (c) | | Group Vice President – Global Product Development | | DecemberDec. 2006 | | 60 | 58 | |
| | | | | | | |
|
| David G. Leitch | | Group Vice President and General Counsel | | AprilApr. 2005 | | 51 | 49 | |
| | | | | | | |
|
| J C. Mays | | Group Vice President and Chief Creative Officer – Design | | AugustAug. 2003 | | 57 | 55 |
|
| Stephen T. Odell | | Group Vice President, Chairman and CEO, Ford of Europe | | Aug. 2010 | | 56 | |
|
| Ziad S. Ojakli | | Group Vice President – Government and Community Relations | | JanuaryJan. 2004 | | 44 | 42 | |
| | | | | | | |
|
| Nick Smither | | Group Vice President – Chief Information TechnologyOfficer | | AprilApr. 2008 | | 53 | 51 | |
| | | | | | | |
|
| Bob Shanks (c) | | Vice President and Controller | | SeptemberSept. 2009 | | 59 | 57 |
|
______________________
| |
| (a) | Also a Director, Chair of the Office of the Chairman and Chief Executive, Chair of the Finance Committee and a member of the Sustainability Committee of the Board of Directors. |
| |
| (b) | Also a Director and member of the Office of the Chairman and Chief Executive and the Finance Committee of the Board of Directors. |
| |
| (c) | We made the following personnel announcements on February 9, 2012, with the changes effective April 1, 2012: |
| |
| ◦ | Mr. Booth has elected to retire, and will be succeeded as Executive Vice President and Chief Financial Officer by Mr. Shanks; |
| |
| ◦ | Mr. Kuzak has elected to retire, and will be succeeded as Group Vice President - Global Product Development by Raj Nair, currently the vice president of Engineering within Global Product Development; and |
| |
| ◦ | Mr. Shanks will be succeeded as Vice President and Controller by Stuart Rowley, currently the chief financial officer for Ford Europe. |
ITEM 4A. Executive Officers of Ford (continued)
AllWith the exceptions noted below, each of the officers listed above officers, except those noted below, havehas been employed by Ford or its subsidiaries in one or more capacities during the past five years. Described below are the recent positions (other than those with Ford or its subsidiaries) held by those officers who have not yet been with Ford or its subsidiaries for five years:
§ | Prior to joining Ford in November 2007, Mr. Farley was Group Vice President and General Manager of Lexus, responsible for all sales, marketing and customer satisfaction activities for Toyota’s luxury brand. Before leading Lexus, he served as group vice president of Toyota Division marketing and was responsible for all Toyota Division market planning, advertising, merchandising, sales promotion, incentives and InternetPrior to joining Ford in November 2007, Mr. Farley was Group Vice President and General Manager of Lexus, responsible for all sales, marketing and customer satisfaction activities for Toyota's luxury brand. Before leading Lexus, he served as group vice president of Toyota Division marketing and was responsible for all Toyota Division market planning, advertising, merchandising, sales promotion, incentives and internet activities. |
§ | Prior to joining Ford in September 2006, Mr. Mulally served as Executive Vice President of The Boeing Company, and President and Chief Executive Officer of Boeing Commercial Airplanes. Mr. Mulally also was a member of Boeing's Executive Council, and served as Boeing's senior executive in the Pacific Northwest. He was named Boeing's president of Commercial Airplanes in September 1998; the responsibility of chief executive officer for the business unit was added in March 2001. |
§ | Mr. Leitch served as the Deputy Assistant and Deputy Counsel to President George W. Bush from December 2002 to March 2005. From June 2001 until December 2002, he served as Chief Counsel for the Federal Aviation Administration, overseeing a staff of 290 in Washington and the agency's 11 regional offices. Prior to June 2001, Mr. Leitch was a partner at Hogan & Hartson LLP in Washington D.C., where his practice focused on appellate litigation in state and federal court. |
Under our By-Laws, theby-laws, executive officers are elected by the Board of Directors at the Annual Meetingan annual meeting of the Board of Directors held for this purpose. Each officer is elected to hold office until his or hera successor is chosen or as otherwise provided in the By-Laws.by-laws.
PART IIII.
ITEM 5.Market for Ford's Common Equity, Related Stockholder Matters and Issuer Purchases of Equity Securities
Our Common Stock is listed on the New York Stock Exchange in the United States, and on certain stock exchanges in Belgium France, Switzerland, and the United Kingdom.France.
The table below shows the high and low sales prices for our Common Stock and the dividends we paid per share of Common and Class B Stock for each quarterly period in 20082010 and 2009:2011:
| | | | | | | | | | 2010 | | 2011 |
Ford Common Stock price per share (a) | | | | | | | | | | | | | | | | | | | | | | | | | First Quarter | | Second Quarter | | Third Quarter | | Fourth Quarter | | First Quarter | | Second Quarter | | Third Quarter | | Fourth Quarter |
High | | $ | 6.94 | | | $ | 8.79 | | | $ | 6.33 | | | $ | 5.47 | | | $ | 2.99 | | | $ | 6.54 | | | $ | 8.86 | | | $ | 10.37 | | $ | 14.54 |
| | $ | 14.57 |
| | $ | 13.24 |
| | $ | 17.42 |
| | $ | 18.97 |
| | $ | 16.18 |
| | $ | 14.22 |
| | $ | 12.65 |
|
Low | | | 4.95 | | | | 4.46 | | | | 4.17 | | | | 1.01 | | | | 1.50 | | | | 2.40 | | | | 5.24 | | | | 6.61 | | 10.05 |
| | 9.75 |
| | 10.02 |
| | 12.12 |
| | 13.75 |
| | 12.65 |
| | 9.32 |
| | 9.05 |
|
| Dividends per share of Ford Common and Class B Stock (b) | | $ | 0.00 | | | $ | 0.00 | | | $ | 0.00 | | | $ | 0.00 | | | $ | 0.00 | | | $ | 0.00 | | | $ | 0.00 | | | $ | 0.00 | | $ | — |
| | $ | — |
| | $ | — |
| | $ | — |
| | $ | — |
| | $ | — |
| | $ | — |
| | $ | — |
|
__________
| |
| (a) | New York Stock Exchange composite interdayintraday prices as listed in the price history database available at www.NYSEnet.com. |
| |
| (b) | On December 15, 2006, we entered into a secured credit facility which contains a covenant prohibiting us from paying dividends (other than dividends payable solely in stock) on our CommonSee "Liquidity and Class B Stock, subject to certain limited exceptions. As a result, it is unlikely that we will pay any dividends Capital Resources"in the foreseeable future. SeeItem 7 and Note 1918 of the Notes to the Financial Statements for more information regarding certain limitations on our ability to pay dividends on our Common and Class B Stock under the secured credit facilityCredit Agreement. On December 8, 2011, our Board of Directors declared a dividend on our Common and related covenants.Class B Stock of $0.05 per share payable on March 1, 2012 to stockholders of record on January 31, 2012, which is within the limitations under the Credit Agreement. |
As of February 12, 2010,13, 2012, stockholders of record of Ford included 165,026158,445 holders of Common Stock (which number does not include 270 former128 holders of old Ford Common Stock who have not yet tendered their shares pursuant to our recapitalization, known as the Value Enhancement Plan, which became effective on August 9, 2000) and 8681 holders of Class B Stock.
During the fourth quarter of 2009,2011, we purchased shares of ourFord Common Stock as follows:
| Period | | Total Number of Shares Purchased (a) | | | Average Price Paid per Share | | | Total Number of Shares Purchased as Part of Publicly Announced Plans or Programs (b) | | | Maximum Number (or Approximate Dollar Value) of Shares that May Yet Be Purchased Under the Plans or Programs (b) | |
| Oct. 1, 2009 through Oct. 31, 2009 | | | — | | | $ | — | | | | — | | | | — | |
| Nov. 1, 2009 through Nov. 30, 2009 | | | — | | | | — | | | | — | | | | — | |
| Dec. 1, 2009 through Dec. 31, 2009 | | | 22,271 | | | | 10.00 | | | | — | | | | — | |
Total/Average | | | 22,271 | | | | 10.00 | | | | — | | | | — | |
|
| | | | | | | | | | | | | |
Period | | Total Number of Shares Purchased (a) | | Average Price Paid per Share | | Total Number of Shares Purchased as Part of Publicly- Announced Plans or Programs (b) | | Maximum Number (or Approximate Dollar Value) of Shares that May Yet Be Purchased Under the Plans or Programs (b) |
| October 1, 2011 through October 31, 2011 | | — |
| | $ | — |
| | — |
| | — |
|
| November 1, 2011 through November 30, 2011 | | — |
| | — |
| | — |
| | — |
|
| December 1, 2011 through December 31, 2011 | | 31,142 |
| | 10.85 |
| | — |
| | — |
|
| Total/Average | | 31,142 |
| | 10.85 |
| | — |
| | — |
|
__________
| |
| (a) | We presently have no publicly-announced repurchase program in place. Shares were acquired from our employees or directors in accordance with our various compensation plans as a result of share withholdings to pay: (i) income tax related to the lapse of restrictions on restricted stock or the issuance of unrestricted stock;stock; and (ii) the exercise price and related income taxes with respect to certain exercises of stock options.
|
| |
| (b) | No publicly announcedWe did not have a publicly-announced repurchase program in place.the fourth quarter of 2011. In 2012, we plan to commence a modest anti-dilutive share repurchase program for Common Stock in an amount up to an estimated $150 million to offset the dilutive effect of share-based compensation. |
For discussion of our outstanding convertible notes and warrants, convertible and exercisable into our Common Stock, see Note 24 of the Notes to the Financial Statements.
ITEM 6. Selected Financial Data
On January 1, 2010, we adopted the new accounting standard regarding consolidation of VIEs. We have applied the standard retrospectively to periods covered in this Report, and present prior-year financial statement data on a basis that is revised for the application of this standard. The following table sets forth selected financial data for each of the last five years (dollar amounts in millions, except for per share amounts).
|
| | | | | | | | | | | | | | | | | | | |
| SUMMARY OF OPERATIONS | 2011 | | 2010 | | 2009 | | 2008 | | 2007 |
| Total Company | | | | | | | | | |
| Sales and revenues | $ | 136,264 |
| | $ | 128,954 |
| | $ | 116,283 |
| | $ | 143,584 |
| | $ | 168,884 |
|
| | | | | | | | | | |
| Income/(Loss) before income taxes | $ | 8,681 |
| | $ | 7,149 |
| | $ | 2,599 |
| | $ | (14,895 | ) | | $ | (4,286 | ) |
| Provision for/(Benefit from) income taxes | (11,541 | ) | | 592 |
| | (113 | ) | | (62 | ) | | (1,467 | ) |
| Income/(Loss) from continuing operations | 20,222 |
| | 6,557 |
| | 2,712 |
| | (14,833 | ) | | (2,819 | ) |
| Income/(Loss) from discontinued operations | — |
| | — |
| | 5 |
| | 9 |
| | 41 |
|
| Income/(Loss) before cumulative effects of changes in accounting principles | 20,222 |
| | 6,557 |
| | 2,717 |
| | (14,824 | ) | | (2,778 | ) |
| Cumulative effects of changes in accounting principles | — |
| | — |
| | — |
| | — |
| | — |
|
| Net income/(loss) | 20,222 |
| | 6,557 |
| | 2,717 |
| | (14,824 | ) | | (2,778 | ) |
| Less: Income/(Loss) attributable to noncontrolling interests | 9 |
| | (4 | ) | | — |
| | (58 | ) | | 17 |
|
| Net income/(loss) attributable to Ford Motor Company | $ | 20,213 |
| | $ | 6,561 |
| | $ | 2,717 |
| | $ | (14,766 | ) | | $ | (2,795 | ) |
| | | | | | | | | | |
| Automotive Sector | |
| | |
| | |
| | |
| | |
|
| Sales | $ | 128,168 |
| | $ | 119,280 |
| | $ | 103,868 |
| | $ | 127,635 |
| | $ | 152,691 |
|
| Operating income/(loss) | 5,763 |
| | 5,789 |
| | (3,352 | ) | | (9,976 | ) | | (4,979 | ) |
| Income/(Loss) before income taxes | 6,250 |
| | 4,146 |
| | 785 |
| | (12,314 | ) | | (5,510 | ) |
| | | | | | | | | | |
| Financial Services Sector | |
| | |
| | |
| | |
| | |
|
| Revenues | $ | 8,096 |
| | $ | 9,674 |
| | $ | 12,415 |
| | $ | 15,949 |
| | $ | 16,193 |
|
| Income/(Loss) before income taxes | 2,431 |
| | 3,003 |
| | 1,814 |
| | (2,581 | ) | | 1,224 |
|
| | | | | | | | | | |
| Amounts Per Share Attributable to Ford Motor Company Common and Class B Stock |
| Basic: | |
| | |
| | |
| | |
| | |
|
| Income/(Loss) from continuing operations | $ | 5.33 |
| | $ | 1.90 |
| | $ | 0.91 |
| | $ | (6.50 | ) | | $ | (1.43 | ) |
| Income/(Loss) from discontinued operations | — |
| | — |
| | — |
| | — |
| | 0.02 |
|
| Cumulative effects of change in accounting principles | — |
| | — |
| | — |
| | — |
| | — |
|
| Net income/(loss) | $ | 5.33 |
| | $ | 1.90 |
| | $ | 0.91 |
| | $ | (6.50 | ) | | $ | (1.41 | ) |
| Diluted: | |
| | |
| | |
| | |
| | |
|
| Income/(Loss) from continuing operations | $ | 4.94 |
| | $ | 1.66 |
| | $ | 0.86 |
| | $ | (6.50 | ) | | $ | (1.43 | ) |
| Income/(Loss) from discontinued operations | — |
| | — |
| | — |
| | — |
| | 0.02 |
|
| Cumulative effects of change in accounting principles | — |
| | — |
| | — |
| | — |
| | — |
|
| Net income/(loss) | $ | 4.94 |
| | $ | 1.66 |
| | $ | 0.86 |
| | $ | (6.50 | ) | | $ | (1.41 | ) |
| Cash dividends | $ | 0.05 |
| | $ | — |
| | $ | — |
| | $ | — |
| | $ | — |
|
| | | | | | | | | | |
| Common Stock price range (NYSE Composite Intraday) | |
| | |
| | |
| | |
| | |
|
| High | $ | 18.97 |
| | $ | 17.42 |
| | $ | 10.37 |
| | $ | 8.79 |
| | $ | 9.70 |
|
| Low | 9.05 |
| | 9.75 |
| | 1.50 |
| | 1.01 |
| | 6.65 |
|
| Average number of shares of Ford Common and Class B Stock outstanding (in millions) | 3,793 |
| | 3,449 |
| | 2,992 |
| | 2,273 |
| | 1,979 |
|
| | | | | | | | | | |
| SECTOR BALANCE SHEET DATA AT YEAR-END | |
| | |
| | |
| | |
| | |
|
| Assets | |
| | |
| | |
| | |
| | |
|
| Automotive sector | $ | 78,786 |
| | $ | 64,606 |
| | $ | 79,118 |
| | $ | 71,556 |
| | $ | 115,484 |
|
| Financial Services sector | 101,574 |
| | 103,270 |
| | 119,112 |
| | 151,667 |
| | 169,261 |
|
| Intersector elimination | (1,112 | ) | | (2,083 | ) | | (3,224 | ) | | (2,535 | ) | | (2,023 | ) |
| Total assets | $ | 179,248 |
| | $ | 165,793 |
| | $ | 195,006 |
| | $ | 220,688 |
| | $ | 282,722 |
|
| | | | | | | | | | |
| Debt | |
| | |
| | |
| | |
| | |
|
| Automotive sector | $ | 13,094 |
| | $ | 19,077 |
| | $ | 33,610 |
| | $ | 23,319 |
| | $ | 24,190 |
|
| Financial Services sector | 86,595 |
| | 85,112 |
| | 98,671 |
| | 128,842 |
| | 141,833 |
|
| Intersector elimination (a) | (201 | ) | | (201 | ) | | (646 | ) | | (492 | ) | | — |
|
| Total debt | $ | 99,488 |
| | $ | 103,988 |
| | $ | 131,635 |
| | $ | 151,669 |
| | $ | 166,023 |
|
| | | | | | | | | | |
| Total Equity/(Deficit) | $ | 15,071 |
| | $ | (642 | ) | | $ | (7,782 | ) | | $ | (15,371 | ) | | $ | 7,771 |
|
| | | | | | | | | | | | | | | | |
| SUMMARY OF OPERATIONS | | | | | | | | | | | | | | | |
| Total Company | | | | | | | | | | | | | | | |
Sales and revenues | | $ | 118,308 | | | $ | 145,114 | | | $ | 170,572 | | | $ | 158,233 | | | $ | 174,365 | |
| | | | | | | | | | | | | | | | | | | | | |
Income/(Loss) before income taxes | | $ | 3,026 | | | $ | (14,498 | ) | | $ | (3,857 | ) | | $ | (15,079 | ) | | $ | 1,054 | |
Provision for/(Benefit from) income taxes | | | 69 | | | | 63 | | | | (1,333 | ) | | | (2,656 | ) | | | (855 | ) |
Income/(Loss) from continuing operations | | | 2,957 | | | | (14,561 | ) | | | (2,524 | ) | | | (12,423 | ) | | | 1,909 | |
Income/(Loss) from discontinued operations | | | 5 | | | | 9 | | | | 41 | | | | 16 | | | | 62 | |
| Income/(Loss) before cumulative effects of changes in accounting principles | | | 2,962 | | | | (14,552 | ) | | | (2,483 | ) | | | (12,407 | ) | | | 1,971 | |
Cumulative effects of changes in accounting principles | | | — | | | | — | | | | — | | | | — | | | | (251 | ) |
Net income/(loss) | | | 2,962 | | | | (14,552 | ) | | | (2,483 | ) | | | (12,407 | ) | | | 1,720 | |
| Less: Income/(Loss) attributable to noncontrolling interests | | | 245 | | | | 214 | | | | 312 | | | | 210 | | | | 280 | |
Net income/(loss) attributable to Ford Motor Company | | $ | 2,717 | | | $ | (14,766 | ) | | $ | (2,795 | ) | | $ | (12,617 | ) | | $ | 1,440 | |
| | | | | | | | | | | | | | | | | | | | | |
| Automotive Sector | | | | | | | | | | | | | | | | | | | | |
Sales | | $ | 105,893 | | | $ | 129,165 | | | $ | 154,379 | | | $ | 143,249 | | | $ | 153,413 | |
Operating income/(loss) | | | (2,706 | ) | | | (9,293 | ) | | | (4,268 | ) | | | (17,946 | ) | | | (4,211 | ) |
Income/(Loss) before income taxes | | | 1,212 | | | | (11,917 | ) | | | (5,081 | ) | | | (17,045 | ) | | | (3,899 | ) |
| | | | | | | | | | | | | | | | | | | | | |
| Financial Services Sector | | | | | | | | | | | | | | | | | | | | |
Revenues | | $ | 12,415 | | | $ | 15,949 | | | $ | 16,193 | | | $ | 14,984 | | | $ | 20,952 | |
Income/(Loss) before income taxes | | | 1,814 | | | | (2,581 | ) | | | 1,224 | | | | 1,966 | | | | 4,953 | |
| | | | | | | | | | | | | | | | | | | | | |
| Amounts Per Share Attributable to Ford Motor Company Common and Class B Stock | |
| Basic: | | | | | | | | | | | | | | | | | | | | |
Income/(Loss) from continuing operations | | $ | 0.91 | | | $ | (6.50 | ) | | $ | (1.43 | ) | | $ | (6.73 | ) | | $ | 0.88 | |
Income/(Loss) from discontinued operations | | | — | | | | — | | | | 0.02 | | | | 0.01 | | | | 0.04 | |
Cumulative effects of change in accounting principles | | | — | | | | — | | | | — | | | | — | | | | (0.14 | ) |
Net income/(loss) | | $ | 0.91 | | | $ | (6.50 | ) | | $ | (1.41 | ) | | $ | (6.72 | ) | | $ | 0.78 | |
| Diluted: | | | | | | | | | | | | | | | | | | | | |
Income/(Loss) from continuing operations | | $ | 0.86 | | | $ | (6.50 | ) | | $ | (1.43 | ) | | $ | (6.73 | ) | | $ | 0.86 | |
Income/(Loss) from discontinued operations | | | — | | | | — | | | | 0.02 | | | | 0.01 | | | | 0.03 | |
Cumulative effects of change in accounting principles | | | — | | | | — | | | | — | | | | — | | | | (0.12 | ) |
Net income/(loss) | | $ | 0.86 | | | $ | (6.50 | ) | | $ | (1.41 | ) | | $ | (6.72 | ) | | $ | 0.77 | |
Cash dividends | | $ | — | | | $ | — | | | $ | — | | | $ | 0.25 | | | $ | 0.40 | |
| | | | | | | | | | | | | | | | | | | | | |
| Common Stock price range (NYSE Composite Interday) | | | | | | | | | | | | | | | | | | | | |
High | | $ | 10.37 | | | $ | 8.79 | | | $ | 9.70 | | | $ | 9.48 | | | $ | 14.75 | |
Low | | | 1.50 | | | | 1.01 | | | | 6.65 | | | | 6.06 | | | | 7.57 | |
Average number of shares of Ford Common and Class B Stock outstanding (in millions) | | | 2,992 | | | | 2,273 | | | | 1,979 | | | | 1,879 | | | | 1,846 | |
| | | | | | | | | | | | | | | | | | | | | |
| SECTOR BALANCE SHEET DATA AT YEAR-END | | | | | | | | | | | | | | | | | | | | |
| Assets | | | | | | | | | | | | | | | | | | | | |
Automotive sector | | $ | 82,002 | | | $ | 73,815 | | | $ | 118,455 | | | $ | 122,597 | | | $ | 113,825 | |
Financial Services sector | | | 119,112 | | | | 151,667 | | | | 169,261 | | | | 169,691 | | | | 162,194 | |
Intersector elimination | | | (3,224 | ) | | | (2,535 | ) | | | (2,023 | ) | | | (1,467 | ) | | | (83 | ) |
Total assets | | $ | 197,890 | | | $ | 222,947 | | | $ | 285,693 | | | $ | 290,821 | | | $ | 275,936 | |
| | | | | | | | | | | | | | | | | | | | | |
| Debt | | | | | | | | | | | | | | | | | | | | |
Automotive sector | | $ | 34,416 | | | $ | 24,227 | | | $ | 25,185 | | | $ | 27,913 | | | $ | 17,848 | |
Financial Services sector | | | 98,671 | | | | 128,842 | | | | 141,833 | | | | 142,036 | | | | 135,400 | |
Intersector elimination * | | | (646 | ) | | | (492 | ) | | | — | | | | — | | | | — | |
Total debt | | $ | 132,441 | | | $ | 152,577 | | | $ | 167,018 | | | $ | 169,949 | | | $ | 153,248 | |
| | | | | | | | | | | | | | | | | | | | | |
Total Equity/(Deficit) | | $ | (6,515 | ) | | $ | (14,527 | ) | | $ | 8,783 | | | $ | (461 | ) | | $ | 14,565 | |
__________
* Debt related to Ford's acquisition of Ford Credit debt securities; see Note 1 of the Notes to the Financial Statements for additional detail.
| |
| (a) | Debt related to Ford's acquisition of Ford Credit debt securities; see Note 18 of the Notes to the Financial Statements for additional detail. |
ItemITEM 7. Management's Discussion and Analysis of Financial Condition and Results of Operations
OVERVIEW
OVERVIEW
Generation of Revenue Income and Cash
Our Automotive sector's revenue income, and cash areis generated primarily fromby sales of vehicles, parts, and accessories. Revenue is recorded when all risks and rewards of ownership are transferred to our customers (generally, our dealers and distributors (i.e., our customers)distributors). Vehicles we produce generallyFor the majority of sales, this occurs when products are subject to firm ordersshipped from our customers and are deemed sold (with the proceeds from such sale recognized in revenue) after they are produced and shipped or delivered to our customers.manufacturing facilities. This is not the case, however, with respect to vehicles produced for sale to daily rental car companies that are subject to a guaranteed repurchase option oroption. These vehicles produced for use in our own fleet (including management evaluation vehicles). Vehicles sold to daily rental car companies that are subject to a guaranteed repurchase option are accounted for as operating leases, with lease revenue and profits recognized over the term of the lease. When we sell the returned vehicle at auction, we recognize a gain or loss on the difference, if any, between actual auction value and the projected auction value. In addition, revenue for finished vehicles we sell to customers or vehicle modifiers on consignment is not recognized until the vehicle is sold to the ultimate customer. Therefore, except for the impact of the daily rental units sold subject to a guaranteed repurchase option, those units placed into our own fleet, and those units for which recognition of revenue is otherwise deferred, wholesale volumes to our customers and revenue from such sales are closely linked with our production.
Most of the vehicles sold by us to our dealers and distributors are financed at wholesale by Ford Credit. Upon Ford Credit originating the wholesale receivable related to a dealer's purchase of a vehicle, Ford Credit pays cash to the relevant legal entity in our Automotive sector in payment of the dealer's obligation for the purchase price of the vehicle. The dealer then pays the wholesale finance receivable to Ford Credit when it sells the vehicle to a retail customer.
Our Financial Services sector's revenue is generated primarily from interest on finance receivables, net of certain deferred origination costs that are included as a reduction of financing revenue, and such revenue is recognized over the term of the receivable using the interest method. Also, revenue from operating leases, net of certain deferred origination costs, is recognized on a straight-line basis over the term of the lease. Income is generated to the extent revenues exceed expenses, most of which are interest, depreciation, and operating expenses.
Transactions between our Automotive and Financial Services sectors occur in the ordinary course of business. For example, we offer special retail and lease incentives to dealers' customers who choose to finance or lease our vehicles from Ford Credit. The estimated cost for these incentives is recorded as revenue reduction to Automotive sales at the later of the date the related vehicle sales to our dealers are recorded or the date the incentive program is both approved and communicated. In order to compensate Ford Credit receivesfor the lower interest supplements and other support cost payments fromor lease rates offered to the Automotive sector in connection with special-rate vehicle financing and leasing programs thatretail customer, we sponsor.pay the discounted value of the incentive directly to Ford Credit records these payments as revenue, and, for contracts purchased prior to 2008, our Automotive sector madewhen it originates the related cash payments,retail finance or lease contract with the dealer's customer. Ford Credit recognizes the amount over the expected life of the related finance receivable or operating lease. Effective January 1, 2008, to reduce ongoing Automotive obligations to Ford Credit and to be consistent with general industry practice, we began paying interest supplements and residual value support to Ford Credit oncontracts as an upfront, lump-sum basis at the time Ford Credit purchases eligible contracts from dealers.element of financing revenue. See Note 1 of the Notes to the Financial Statements for a more detailed discussion of transactions and payments between our Automotive and Financial Services sectors. The
Costs and Expenses
Our statement of operations classifies our Automotive sector recordstotal costs and expenses into two categories: (i) cost of sales, and (ii) selling, administrative and other expenses. We include within cost of sales those costs related to the estimated costsdevelopment, manufacture, and distribution of marketing incentives, including dealerour vehicles, parts and retail customer cash payments (e.g., rebates) and costsaccessories. Specifically, we include in cost of special-rate financing and leasing programs, as a reduction to revenue. These reductions to revenue are accrued at the latersales each of the date thefollowing: material costs (including commodity costs); freight costs; warranty, product recall and customer satisfaction program costs; labor and other costs related vehicle sales to the dealerdevelopment and manufacture of our products; depreciation and amortization; and other associated costs. We include within selling, administrative and other expenses labor and other costs not directly related to the development and manufacture of our products, including such expenses as advertising and sales promotion costs.
Certain of our costs, such as material costs, generally vary directly with changes in volume and mix of production. In our industry, production volume often varies significantly from quarter to quarter and year to year. Quarterly production volumes experience seasonal shifts throughout the year (including peak retail sales seasons, and the impact on production of model changeover and new product launches). As we have seen in recent years, annual production volumes are recordedheavily impacted by external economic factors, including the pace of economic growth and factors such as the availability of consumer credit and cost of fuel.
Item 7. Management's Discussion and Analysis of Financial Condition and Results of Operations (continued)
As a result, we analyze the profit impact of certain cost changes holding constant present-year volume and mix and currency exchange, in order to evaluate our cost trends absent the impact of varying production and currency exchange levels. We analyze these cost changes in the following categories:
Material excluding commodity costs - primarily reflecting the change in cost of purchased parts used in the assembly of our vehicles.
Commodity costs - reflecting the change in cost for raw materials (such as steel, aluminum, and resins) used in the manufacture of our products.
Structural costs - reflecting the change in costs that generally do not have a directly proportionate relationship to our production volumes, such as labor costs, including pension and health care; other costs related to the development and manufacture of our vehicles; depreciation and amortization; and advertising and sales promotion costs.
Warranty and other costs - reflecting the change in cost related to warranty coverage, product recalls, and customer satisfaction actions, as well as the change in freight and other costs related to the distribution of our vehicles and support for the sale and distribution of parts and accessories.
While material (including commodity), freight, and warranty costs generally vary directly in proportion to production volume, elements within our structural costs category are impacted to differing degrees by changes in production volume. We also have varying degrees of discretion when it comes to controlling the different elements within our structural costs. For example, depreciation and amortization expense largely is associated with prior capital spending decisions. On the other hand, while labor costs do not vary directly with production volume, manufacturing labor costs may be impacted by changes in volume, for example when we increase overtime, add a production shift or atadd personnel to support volume increases. Other structural costs, such as advertising or engineering costs, are not necessarily impacted by production volume. Our structural costs generally are within our discretion, although to varying degrees, and can be adjusted over time in response to external factors.
We consider certain structural costs to be a direct investment in future growth and revenue. For example, increases in structural costs are necessary to grow our business and improve profitability as we expand around the dateworld, invest in new products and technologies, respond to increasing industry sales volume and grow our market share.
Automotive total costs and expenses for full-year 2011 was $122.4 billion. Material costs (including commodity costs) make up the incentive programlargest portion of our Automotive total costs and expenses, representing in 2011 about two-thirds of the total amount. Of the remaining balance of our Automotive costs and expenses, the largest piece is both approved and communicated.structural costs. Although material costs are our largest absolute cost, our margins can be affected significantly by changes in any category of costs.
Key Economic Factors and Trends Affecting the Automotive Industry
Global Economic and Financial Market Crisis.Conditions. Beginning in 2008, the The global economy enteredgrew by about 4% during 2010, as the economy began to emerge from deep recession. During 2011, global economic growth slowed to an estimated 3%, as the worsening debt crisis in Europe, regime changes in North Africa, natural disasters in Japan and Thailand, and moderating economic growth in several key newly-developed and emerging markets all contributed to slow growth. During 2012, global economic growth is expected to remain in the 3% range. The European debt crisis represents a period of verykey risk to economic growth. The current economic performance in many European countries, particularly Greece, Ireland, Italy, Portugal and Spain, is being hampered by excessive government debt levels and the resulting budget austerity measures that are contributing to weak economic growth. The European Union, the European Central Bank, and the International Monetary Fund have provided important support for many of these countries undergoing structural changes. During 2012, economic growth led byis likely to remain weak in these markets. The U.K. government has implemented budget cuts and the recessionhousing market is still working off its slump, which will continue to restrain economic conditions in the United States and followed by declines in other major markets around the world. The financial market crisis set off a series of events that generated conditions more severe than those experienced in several decades. The characteristics of the financial crisis were unique, in part due to the complex structure of housing-related securities that were at the epicenter of the financial market turmoil. A steep housing correction, especially in the U.S. and U.K. markets, along with downward valuations of mortgage-backed and related securities, combined to foster a crisis in confidence. Although several other factors contributed to current economic and financial conditions, the influence of these financial developments was very prominent. The interrelationships among financial markets worldwide ultimately resulted in a synchronous global economic downturn, the effects of which became evident in the fourth quarter of 2008 as major markets around the world all suffered setbacks.Kingdom.
Uncertainties associated with the European debt crisis and policy responses to it could impact global economic performance in 2012. Although housing is stabilizing in some of the worst hit markets, such as the United States, the prospect of a housing recovery is hampered by high foreclosure rates and excess housing stocks.
Global industry vehicle sales volume (including medium and heavy truck) is estimated to have increased to 76 million units in 2011, up more than 2 million units - or about 3% - from 2010 levels. In 2012, global industry sales are projected to be about 80 million units. In light of the volatile external environment, however, sales could range from 75 million units to 85 million units in 2012.
ITEMItem 7. Management's Discussion and Analysis of Financial Condition and Results of Operations (continued)
While the economic outlook is improving, it is rebounding from a very low base and with a range of possible outcomes due to the uncertain financial market environment and dependence upon ongoing policy responses. The consumer and commercial sectors of the global economy appear to be improving, although recovery remains fragile due to continuing tightness in the credit markets, weak labor markets in many countries, and uncertainty regarding the timing and magnitude by which governments and central banks will remove stimulus programs. Although the housing market is stabilizing in the worst hit markets, such as the United States, the United Kingdom, and Spain, challenges remain associated with rising foreclosure rates and excess housing stocks.
In 2009, global industry vehicle sales volume is estimated to have declined to about 64.3 million units, down about 4 million units or 6% from 2008 levels. Global industry sales volume is projected to increase from the depressed 2009 levels, to a range of 65 million units to 75 million units for 2010.
Excess Capacity. According to CSM Worldwide,IHS Automotive, an automotive research firm, in 2009 the estimated automotive industry global production capacity for light vehicles (about 86(which as of 2011 includes an expanded truck segment compared with previous years) of about 96 million units)units exceeded global production by about 2922 million units.units in 2011. In North America and Europe, the two regions where the majority of industry revenue and profits are earned, in the industry, excess capacity wasas a percent of production is an estimated 96% and 37%, respectively, with North America in particular driven up from recent rates of around 43% due to the industry conditions in that market last year.26%. According to production capacity data projected by CSM Worldwide,IHS Automotive, global excess capacity conditions could continue for several years at an average of 21about 24 million units per year during the 2010-2014 period.period from 2012 to 2016.
Pricing Pressure. Excess capacity, coupled with a proliferation of new products being introduced in key segments, by the industry, will keep pressure on manufacturers' ability to increase prices on their products.prices. In addition,North America, the incremental new U.S. manufacturing capacityindustry restructuring of the past few years has allowed manufacturers to better match production with demand, although Japanese and Korean manufacturers in recent yearsalso have capacity (located outside of the region) directed to North America. In the future, Chinese and Indian manufacturers are expected to enter U.S. and European markets, further intensifying competition. Although there has contributed, and is likely to continue to contribute, tobeen some firming of pricing pressure in the U.S. market. The reduction of realmarket, particularly in 2011, it seems likely that over the long term intense competition and apparent excess capacity will continue to put downward pressure on inflation-adjusted prices for similarly contentedsimilarly-contented vehicles in the United States has become more pronounced since the late 1990s, and we expect thatcontribute to a challenging pricing environment will continue for some time to come.
Consumer Spendingthe automotive industry. In Europe, the excess capacity situation was exacerbated by weakening demand and Credit. Limited ability to increase vehicle prices has been offsetthe lack of reductions in recent years, at least in part, by the long-term trend toward purchase of higher-end, more expensive vehicles and/or vehicles with more features. The current retrenchment in consumer spending is likely to dampenexisting capacity, such that trend in the near-term. Over the long term, spending on new vehiclesnegative pricing pressure is expected to resume its correlation with growth in per capita incomes. Emerging markets also will contribute an increasing share of global industry sales volume and revenue, as growth in wholesales (i.e., volume) will be greatest in emerging markets incontinue for the next decade. We believe, however, the mature automotive markets (e.g., North America, Western Europe, and Japan) will retain the largest share of global revenue over the coming decade.foreseeable future.
Commodity and Energy Price Increases. Commodity prices have resumed upward movement since early 2009. Despite weak demand conditions, oil prices increased from around $40 per barrel in January toan average of $80 per barrel in December of 2009. With2010 to about $100 a barrel in late 2011. Commodity prices have declined recently, but over the global economic outlook improving and financial investment returning to commodity and oil markets, we expect commodity and oillonger term prices to continue trending upward with potentially higher volatility. Higher fuel prices, combined with efforts to achieve environmental policy objectives, are likely to continuetrend higher given global demand growth.
Vehicle Profitability. Our financial results depend on the profitability of the vehicles we sell, which may vary significantly by vehicle line. In general, larger vehicles tend to generate demandcommand higher prices and be more profitable than smaller vehicles, both across and within vehicle segments. For example, in North America, our larger, more profitable vehicles had an average contribution margin that was about 130% of our total average contribution margin across all vehicles, compared with about 70% for our smaller vehicles. As we execute our One Ford plan, we are creating best-in-class vehicles on global platforms that contribute higher margins, and offering a more fuel-efficient vehicles.balanced portfolio of vehicles with which we aim to be among the leaders in fuel efficiency in every segment in which we compete.
Increasing Sales of Smaller Vehicles. Like other manufacturers, we are increasing our participation in newly-developed and emerging markets, such as Brazil, Russia, India, and China, in which vehicle sales are expected to increase at a faster rate than in most mature markets. The largest segments in these markets are small vehicles (i.e., Sub-B, B, and C segments). To increase our participation in these fast-growing markets, we are significantly increasing our production capacity, directly or through joint ventures. In addition, we expect that increased demand for smaller, more fuel-efficient vehicles will continue in the mature markets of North America and Europe and, consequently, we have seen and expect in the future strong demand in those markets for our small car offerings (including our new Ford Fiesta and Focus models that are based on global platforms). Although we expect positive contribution margins from higher small vehicle sales, one result of increased production of small vehicles may be that, over time, our average per unit margin decreases because small vehicles tend to have lower margins than medium and large vehicles.
Currency Exchange Rate Volatility. The European debt crisis has contributed to recent financial market volatility. Coupled with the ongoing deleveragingpolicy actions taken by central banks to support the financial system, exchange rates have remained volatile. Most recently, the euro currency value has fluctuated as progress toward a solution to the sovereign debt crisis remains highly uncertain. The high inflation in financialnewly-developed and emerging markets has generated significant volatility in currencies as well. Recently,and capital flight to perceived stable investments have started to erode the U.S. dollar has gainedstrength of some ground against the British poundlocal currencies. In most markets, exchange rates are market-determined, and euro.all are impacted by many different macroeconomic and policy factors. As a result, it is likely that exchange rates will remain volatile.
Other Economic Factors. The eventual implications of significant fiscal stimulus, including higher government deficits generatingand debt, with potentially higher long-term interest rates, could drive a higher cost of capital over our planning period. Higher interest rates and/or taxes to address the higher deficits also may also impede real GDP growth in gross domestic product and, therefore, vehicle sales over our planning period.
ITEMItem 7. Management's Discussion and Analysis of Financial Condition and Results of Operations (continued)
Trends and Strategies
We continue to monitor incipient signs of economic recovery following the recent global economic crisis that caused such a sudden and substantial decline in global automotive industry sales volume, and we remain firm in our belief that our continued focus on executing the four pillarskey priorities of our One Ford plan is the right strategyenables us to achievego further for our objectives.customers, dealers, suppliers, employees, shareholders, and other key constituencies:
· | Aggressively restructure to operate profitably at the current demand and changing model mix; |
· | Accelerate development of new products our customers want and value; |
· | Finance our plan and improve our balance sheet; and |
· | Work together effectively as one team, leveraging our global assets. |
Despite the external economic environment in recent years, we have made significant progress in transforming our business:business.
Aggressively Restructure to Operate Profitably
Brands. In recent years, we have eliminated a number of brands from our portfolio in order to devote fully our financial, product development, production, and marketing and sales and services resources toward further growing our core Ford brand and enhancing Lincoln. We have sold Aston Martin, Jaguar and Land Rover, and most recently Volvo. In addition to completing the sale of Volvo in the third quarter of 2010, we discontinued the Mercury brand at the end of 2010. We also reduced our stake in Mazda to 3.5 percent from 11 percent in the fourth quarter of 2010. All of these actions allow us to increase flexibility as we continue to pursue growth in key emerging markets, while also continuing our cooperation in areas of mutual benefit, such as key joint ventures and exchange of technology information.
Manufacturing. Our U.S.We are committed to maintaining an appropriate manufacturing footprint in markets around the world, both in the more mature markets in which we have an established presence, includes 10 vehicleand in fast-growing newly-developed and emerging markets. We also are committed to ensuring that our assembly plants have flexible body shops that allow us to respond quickly to changing consumer demands. We are making substantial investments in newly-developed and 23 powertrain, stamping,emerging markets over the next few years, including in China, Thailand, and componentsIndia, to increase our production capacity with flexible new manufacturing plants. We also are making substantial investments in North America, including efforts to ensure that nearly all of our U.S. assembly plants have flexible body shops by 2012. We also have converted onethree North American assembly plant, and are converting two additional assembly plants from production of large utilities and trucks to small car production to support what we believe is a permanent shift in consumer preferences to smaller, more fuel-efficient vehicles. In addition, nearly all of our U.S. assembly plants will have flexible body shops by 2012 to enable quick response to changing consumer demands, and nearly half of our transmission and engine plants will be flexible, capable of manufacturing various combinations of transmission and engine families. We have announced plans in North America to close three Ford plants and one ACH plant in the 2010 – 2011 period, as well as consolidating Wayne Assembly Plant into the Michigan Assembly Plant as part of our plan to expand North American production capacityincreasing demand for smaller, more fuel-efficient vehicles. We are exploring our options for our remaining ACH plants, and intend to transition these businesses to the supply base as soon as practicable.
Suppliers. We continue to work to strengthen our global supply base in the United States, which represents 80% of our North American purchases.base. As part of this process, we have been reducing the totalglobal number of production suppliers eligible for new product sourcing from 3,300 in 2004 to about 1,600 suppliers in 2009 and 1,500 suppliers in 2010. To date, we1,350 at year-end 2011. We have identified specific plans that will take us to about 850 suppliers in the near- to mid-term, with a further reduction to about 750 suppliers targeted. We believetargeted, and we are confident that our consolidation efforts at consolidation will result in more business fora stronger and healthier supply base. We also are working closely with our major suppliers which is increasingly important with the decline in industry sales volume.to address any near-term capacity constraints as we continue to ramp up production. In addition, our move to global vehicle platforms should increaseincreases our ability to source to common suppliers for the total global volume of vehicle components so thatresulting in a smaller number of suppliers will receivereceiving a greater volume of the purchases we make to support our global vehicle platforms.platforms and allowing us to gain greater economies of scale.
Ford and Lincoln DealershipsDealers. Our dealers are a source of strength in North America and around the world, especially in rural areas and small towns where they representrepresenting the face of Ford. At our current and expected future U.S. market share, however, we have too many dealers, particularly in metropolitan areas, which makes it difficultFord to sustainlocal communities. Our goal is to achieve a healthysustainable and profitable dealer base. To address this overcapacity, wenetwork by rightsizing the number of dealerships, identifying the right locations, and ensuring the appropriate branded facilities to satisfy current and future demand. We are workingadding dealerships rapidly in markets in our Asia Pacific Africa region where industry volume is growing at a rapid pace. Our total dealership network in China is about 400, and about 150 dealerships in India. We have plans to continue our expansion of these networks, in addition to the dealership networks in our growth markets of Brazil and Russia. We also continue to work with our dealers in effortsthe United States to downsize, consolidaterightsize the number of Ford and restructure our Ford, Lincoln and Mercury networkoutlets, particularly in our largest 130 metropolitan market areas in the United States to provide targeted average-year sales for Ford dealers of around 1,500 units and for Lincoln Mercury dealers of around 600 units. This should result in sustainable dealer profits.markets. As part of these efforts, we have reduced the number of dealersoutlets in our U.S. Ford and Lincoln and Mercury network in the United States has been reduced from about 4,400 at the end of 2005 to 3,800about 3,340 at the end of 2008,2011. We believe our U.S. dealers are positioned to profitably grow business in 2012, as they invest in their facilities, employees, and communities while continuously striving to 3,550 atimprove the endexperience of 2009. These efforts, which include funding dealer consolidations to enhance our representation inretail customers. As previously announced, we discontinued the marketplace, will continue in the future to reduce further our dealer network to match our salesMercury brand as of December 31, 2010, and dealer sales objectives.we have successfully resolved Mercury franchise agreements for 99% of Mercury franchise holders.
Product Development. In combination with the business improvements being achieved, our Our One Ford global product development system ("GPDS") allows usis fully operationalized, utilizing global platforms to realize efficiencies in capitaldeliver customer-focused programs rapidly and efficiently across multiple markets. Through our hub and spoke approach, one lead product development engineering costs, to increase revenue,center - the hub - is assigned for each global vehicle line, thereby ensuring global scale and in general, to bring to market a broad range of frequently-freshened, highly-acclaimed global vehicles that customers wantefficiency through common designs, parts, suppliers, and value. In addition, GPDS allows us to accelerate to market the number of new products designed to meet shifting consumer preferences, including, for example, preferences for smaller, more fuel-efficient vehicles. In 2010, globally we will deliver substantially more new or freshened product by volume than 2009, bringing to market an unprecedented volume of new products – with class-leading fuel economy, quality, safety and technology.manufacturing processes.
ITEMItem 7. Management's Discussion and Analysis of Financial Condition and Results of Operations (continued)
The hubs are supported by regional engineering centers - spokes - which also help deliver products tuned to local market customer preferences while maintaining global design DNA. Typical delivery metrics for global programs include 80% part commonality, 75% pre-sourcing to global suppliers, and 100% common manufacturing and assembly process.
Developments underway that underscore the progress of our One Ford global product development system implementation include, by mid-decade:
B-segment platform (Fiesta, B-MAX, EcoSport, etc.) providing an annual platform volume of greater than 2 million units with common design and manufacturing across applicable marketsC-segment platform (Focus, C-MAX, Escape, Kuga, etc.) leveraging greater than 2 million units annually with our widest range of regionally-tuned "top hats" across all global markets
Recently announced global CD-segment platform achieving ongoing annual volume of 1 million units, including Fusion and Mondeo, along with additional vehicles to be introduced over time
Compact truck (global Ranger pick-up) annual platform volume exceeding 275,000, and commercial van platform (E-Series and Transit) with annual volume exceeding 470,000
The efficiency and flexibility gains enabled by our One Ford Credit. During 2009,plan will allow us to increase our overall volume across all platforms threefold between 2010 and 2016. By 2013, more than 85% of our global volume will be on nine core platforms. Also by 2013, we will have common small- and medium-sized Ford Credit eliminated about 1,200 U.S. staffvehicles in North America, South America, Europe, and agency positions within its servicing, sales, and central operations. During 2010, Ford Credit plans to reduce its staffing by about 1,000 positions to improve its cost structure, in response to lower financing volumes resulting from lower automotive industry sales volumes and the transition of Jaguar, Land Rover, Mazda, and Volvo financing to other finance providers.
Asia Pacific Africa.
Accelerate Development of New Products Our Customers Want and Value
We are committed to introducing new products that consumers want and value, and we are receiving very positive reactions from consumers, media, and independent evaluators in response to the products we have introduced in 2009.recent years. We planwill continue to build on this strength in 2010. 2012 - beginning with the favorable reactions to our 2013 model year Ford Escape, introduced at the Los Angeles Auto Show in November 2011, followed by the 2013 model year Ford Fusion introduced at the 2012 North American International Auto Show ("NAIAS"), which won Autoweek magazine's best in show award.
Our global product strategy is to serve all meaningfulour key geographic markets with a complete family of productssmall, medium, and large, cars, utilities, and trucks that have best-in-class design and quality, green, safetyare environmentally responsible, and smart features.contain high-value feature content. The result of this strategy is to producea full-line of vehicles that:
· | haveHave bold, emotive exterior designs |
· | areAre great to sit in (with the comfort and convenience of a second home on wheels and exceptional quietness), |
· | provide best-in-classProvide fuel economy as a reason to buy |
· | areAre unmistakably a Ford or Lincoln in look, sound and feel and |
· | provide an exceptional value. |
Provide exceptional valueWe plan to continue leadership in delivering the freshest showrooms in all regions, achieving a global refresh rate of 1.7 times (ranging from 1.5 in Ford North America and Ford Europe to 2.2 in Ford South America) between 2011 and 2016 - all with benchmark product development efficiency.
With GPDSAdditionally, we have renewed our commitment to the Lincoln brand.We know that transitioning Lincoln to a world-class luxury brand requires a transformational shift in product execution and ownership experience. As evident in the Lincoln MKZ Concept revealed at the 2012 NAIAS, our globalLincoln product strategy we have a global product cycle plan, global product programs, global product "DNA" and a global product development organization. This allows us to simplify, commonize and, hence, reduce the number of vehicle platforms or architectures and parts, as well as to simplify vehicle ordering from the customer's perspective. For example, we have reduced the number of global nameplates from 97 in 2006 to 59 in 2008, with further reductions planned. In 2007, we had 27 different vehicle platforms, with 29% of our total production volume produced from core platforms. In 2012, we plan to have 15 different platforms, with 72% of our total production volume produced from core platforms. With our One Ford GPDS, we are working to make all small- and medium-sized Ford vehicles competing in global segments common in North America, South America, Europe and Asia Pacific Africa by 2013. This will include Fiesta- and Focus-sized small cars, Fusion- and Mondeo-sized mid-size cars and utilities, compact pick-ups, and commercial vans. For example, in 2012, we expect to produce more than 2 million vehicles from our global C-car (Focus-sized) platform and more than 1 million vehicles from our global B-car (Fiesta-sized) platform. The efficiencies resulting from our One Ford GPDS and global product strategies are demonstrated by a 60% reduction in engineering costs and a 40% reduction in capital costs from 2005 to 2008, per typical new vehicle, with ongoing improvements planned.deliver:
In addition to theseUniquely Lincoln vehicles, inside and out - built on our core platforms leveraging global scale and efficiencies our global product strategies allow us to increase revenue
Design excellence that is stunning and understated, with premium amenities offered on every nameplate
Product excellence that is enabled by making our vehicles and theirclass-leading technologies
The "right" balance of customer-relevant features more attractive to customers. With bold, emotive design, high levels of quality, fuel economy leadership, top safety ratings, innovative technology, greater feature content than competitive models and higher attractive series, we are able to reduce brand discount and increase revenue. In 2009, average per-unit revenue from our vehicles sold in North America increaseda unique experience that is guided by $3,300, from $22,800 in 2008 to $26,100 in 2009.Lincoln DNA
With the cost efficiencies and revenue increases thatStarting this year, we will have been and will in the future be realized from our One Ford GPDS and global product strategy, we believe we can achieve small-car profitability in the North American market as well as other markets, and improve the profitability of all our vehicle lines in all markets.seven new or significantly refreshed Lincoln products by 2015.
Following is a discussion of new or futureDeveloping products offered or to be offered byour customers want and value for Ford business units and a discussion of each ofLincoln demands consistent focus on the four pillars of our global product strategy:strategy - Drive Quality, Drive Green, Drive Safe, and Drive Smart.
Ford North America. Ford, Lincoln and Mercury brands collectively increased U.S. overall and retail market share 14 of the last 15 months as of December 2009, and posted the first full-year market share gain since 1995. Our new 2010 Fusion Hybrid was named Motor Trend magazine's Car of the Year and awarded the title of North American Car of the Year at the North American International Auto Show in January 2010. The Ford Fusion, the most fuel-efficient mid-size sedan sold in America, posted a full-year sales record in 2009 with 180,671 units sold. The new Ford Transit Connect was introduced in the second quarter of 2009 and was awarded the 2010 North American Truck of the Year at the North American International Auto Show. The 2011 Ford Fiesta was revealed in North America in the fourth quarter of 2009 as a new offering and will go on sale in the second quarter of 2010. The 2011 Ford Mustang debuted with a new family of V-6 and V-8 engines that deliver best-in-class performance and fuel economy and will arrive in dealerships in spring 2010. Further product introductions are planned, as we plan to substantially increase the amount of new vehicle introductions by volume versus 2009, an aggressive product introduction period. For 2010, these introductions include the all-new Ford Fiesta, Focus, Explorer, Super Duty, Edge, Transit Connect Electric, Lincoln MKX and an all-new small car for Mercury.
ITEMItem 7. Management's Discussion and Analysis of Financial Condition and Results of Operations (continued)
Ford Europe. Based on the strength of its product portfolio, Ford Europe improved its 2009 full-year market share to 9.1% in the 19 European markets we track, a 0.5 percentage point increase versus 2008 and its best market share since 1998. Fiesta was the second best-selling model in Europe in 2009, reaching its best full-year sales since 1996. One year after its debut, more than 600,000 customers have purchased the new Fiesta globally. In 2010, we will continue to build on our product momentum, entering one of the most prolific periods of new product and technology introductions in Ford Europe's history. With 6 vehicle product actions planned for 2010 – including the new Ford C-MAX and Grand C-MAX, and the freshened Ford Galaxy, S-MAX and Focus – Ford Europe is poised to build on the successful introductions of the Ford Ka and Ford Fiesta. An expanded range of fuel-efficient powertrains, including the new EcoBoost 2.0-liter and 1.6-liter engines and further improved TDCi diesel powertrains will be available across the range, together with new technologies and innovations.
Ford South America. We continue to launch new products to meet the needs of our customers in South America. In 2010, we are bringing a flex-fuel version of the European-based Ford Focus to Brazil; nine additional product introductions are planned for the region in 2010. As noted, we also are making our largest-ever investment in Brazil operations over a five-year period, investing R$4 billion in 2011–2015 to accelerate delivery of more fuel-efficient, high-quality vehicles.
Ford Asia Pacific Africa. In 2010, we will see the introduction in Asia Pacific Africa of the all-new Ford Fiesta five-door and four-door sedan built in Rayong, Thailand. The four-door Fiesta will join its five-door sibling in Australia, New Zealand, South Africa and Taiwan. The new Ford Figo will commence sales in the second quarter in India and later in the year in South Africa. Other product introductions in 2010 include updated core products in key Asia Pacific Africa markets, including China.
Drive Quality. Quality. We have made significant strides in recent years to improveachieve world class levels of quality through a renewed commitment that touches every aspect of the vehicle process – from design to manufacturing to product launch – so that quality is designed and built into every vehicle. These efforts have paid off with best-in-class initial quality in the United States according to internal and external quality surveys. We havedesirability. This has been accomplished by following an established, a global set of disciplined, standardized processes that are aimed at making us the world's leader in automotive quality. Through GPDS and a single,Via our common global management team, we are leveraging our assets by eliminating duplication, implementing best practices, and utilizing a systematic approach to quality, and utilizing common components for the advantage of scale. The newquality. This integrated approach can be seenis apparent in the newrecently-launched Ford Fiesta and Focus, which truly are global products earning high customer satisfaction levels. External inputs are confirming our first of this generation of global cars under our Oneinternal assessment, with the Fiesta labeled the most appealing sub-compact car in the JD Power and Associates APEAL study in 2011. The Ford plan. Selling one high-volume version of this vehicle helps us lower capital and engineering costs, reduce defects and improve overall craftsmanship. In North America, we expect to launch our all-new B- and C-carsF-150 won in its segment as well. The F-150 shines again with best-in-classthe best initial quality in 2010. Inits segment, while the 2009 J.D. Power Asia Pacific India Vehicle Dependability Study, our models ranked highestTaurus also received an award in the entry mid-size (Ford Ikon)JD Power and SUV (Ford Endeavor)Associates Initial Quality Study. For overall dependability, JD Power and Associates ranked the Fusion and Mustang, and the Lincoln MKZ and Navigator, as the most dependable vehicles in their respective segments. The Ikon also topped J.D. Power Asia Pacific 2009 Initial Quality Study for India. In South America, we are preparing to launchLincoln brand led all brands as the 2011 EcoSport developed using our extensive quality program based on owner surveys.most dependable sold in the United States. The cumulative effect of theseour disciplined global quality standards has been improved quality and owner satisfaction. WeFor example, our global repair rates at three months in service have decreased by over 56% since 2005. Going forward, we expect that our improved quality discipline willglobal processes to lead to continued improvement in long-term reliability.ongoing continuous improvement.
We are committed to providing leading edge technologies customers want and value, including MyFord Touch, which increasingly is playing a pivotal role in defining the future of automotive interiors and enhancing convenience, safety, and overall driving experience across a wide range of vehicles. Since MyFord Touch launched last fall, we have held four customer clinics in which hundreds of owners have spoken directly with Ford engineers about their experiences with the new technology. Owner feedback was clear and consistent, revealing that MyFord Touch was a key purchase factor. Our customers also highlighted that MyFord Touch could be faster and feature simpler graphics that are easier to use. While owners reported that they loved the system, there were distinct areas in which they wanted improvements. Earlier this year, we began delivering on their requests, starting with more detailed instructions and information on how best to utilize the capabilities of the system. Moreover, we have worked on a broad set of performance upgrades to the system for rollout in 2012 which will enhance the ownership experience based on customer feedback.
Drive Green. Our commitment to sustainability relies on a balanced approach, both in application of fuel economy technology as well as breadth of offerings. We are focusing on advancing conventional vehicle technology that touches millions of new vehicles each year and provides affordable fuel economy to the masses. At the same time, we are developing next-generation propulsion systems that represent an important part of the long-term future for the industry.
We remain committed to our goal to deliver best-in-classleadership or among the best-in-classbest fuel efficiency in every major new vehicle we produce. For example, the 2010 Ford Fusion and Ford Fusion Hybrid, launched last year, are the most fuel-efficient mid-size sedans in the market. The 2011 Ford Fiesta, whichlaunch. Nearly one-third of Ford's vehicle lines will be in showrooms this year, offersfeature a model rated at an EPA-estimated 30 miles per gallon city,with 40 miles per gallon highway. mpg or more in 2012 - a claim no other full-line automaker can match. Additionally, the 2013 model year Fusion is projected to deliver the best-in-class fuel economy in any of three powertrains -- gas, hybrid, and plug-in hybrid.
The implementation of our new EcoBoost® family of gasoline engines is well on its way, with the 3.5-liter engine now available in the Lincoln MKSestablished and MKTa major part of our sustainability strategy, delivering both exceptional fuel economy and the Ford Taurus SHO and Flex and the I-4 EcoBoost to be introduced in vehicles this year. We will continue to aggressively migrate this technology across our product lineup. By 2013, 90% of Ford's North America nameplates will offer this engine option.performance. By combining direct fuel-injection and turbo boosting,charging, the enginesEcoBoost engine can deliver up to 20% better fuel economy and up to 15% fewer CO2 emissions versus larger-displacement engines, without sacrificing driving performance. The 3.5-liter EcoBoost V6 engine was introduced in 2009 and now is available in the Lincoln MKS and MKT and the Ford Taurus SHO, Flex, F-150, and will be in the two new Police Interceptors. The F-150 V6 line-up has exceeded expectations with EcoBoost - a major reason V6 sales have grown to over 50% of F-150 retail sales.
We also are rolling outThe 2.0-liter I4 EcoBoost was launched in 2010 in Europe with five models slated to implement this technologythe Ford Mondeo, S-MAX, and Galaxy. In 2011, the 2.0-liter EcoBoost made its North American debut in the near-term, includingExplorer and Edge as well as Falcon in Australia, and is planned for the 2013 model year Focus ST, Escape, Fusion, and Taurus. The 2.0-liter Mondeo also was the first EcoBoost introduced in China, with follow-on introductions on the way. The 1.6-liter I4 EcoBoost launched in Europe in 2010 with the Focus, C-MAX, Grand C-MAX, Mondeo, S-MAX, and Galaxy and S-MAXis planned for Focus in 2010. The Ford Europe ECOnetic rangeAustralia, as well as Escape and Fusion in North America. Additionally, an all-new, fuel-efficient 1.0-liter I3 EcoBoost engine is planned to debut in the all-new EcoSport for India, and will be available in the B-MAX, C-MAX, and European Focus. In North America, over time we plan to triple the production of ultra-low CO2 models across all car segments (from BEcoBoost-equipped vehicles. By 2013, annual global production of EcoBoost vehicles is expected to CD), including commercial vehicle applications, started in 2008 with the Ford Focus ECOnetic, followed by the Fiesta and Transit ECOnetic. Recently, we unveiled the second-generation Focus ECOnetic with further advanced technology and reduced CO2 emissions (below 100 g/km of CO2). reach 1.5 million units.
In Asia Pacific Africa, we have committedEcoBoost - along with other innovative global technologies such as the advanced 6-speed PowerShift™ and automatic transmissions - is a major part of our plan to improvingdeliver fuel efficiency byimprovement of up to 20% across our product lineup by the end of 2012 – helped by the introduction of new models, as well as innovative Ford technologies such as Powershift transmissions and EcoBoost. As part of this commitment, we will launch EcoBoost-equipped vehicles in China, Australia, New Zealand and Taiwan in 2010. Alsocompared with 2008. For example, in Australia bywe introduced in 2011 we will introduce an advanced liquid-injection LPGpetroleum gas ("LPG") system for the Ford Falcon, providing customers with the most advanced LPG technology on the market.
ITEMItem 7. Management's Discussion and Analysis of Financial Condition and Results of Operations (continued)
We have developed a sustainability strategy that outlines future technology pathways for our vehicle production in the near-, mid- and long-term. Near-term, we have introduced EcoBoost, doubled the number and volume productionOur European ECOnetic® range of our hybridsultra-low CO2 diesel models across small to mid-size car and continue to implement fuel-saving technologies such as six-speed transmissions and electric power assist steering in the product lineup. We also have announced an aggressive electric vehicle strategy that will bring at least four new electric vehicles to market in the United States within the next three years. Late this year, the Ford Transit Connect Electric, a small, all-electric commercial van will be introduced to the market, aimed at commercial vehicle owners. Next year, we will begin production of a zero-emission Fordsegments continues to build on the success begun with the 2008 Focus Electric vehicle at our Michigan Assembly Plant.ECOnetic. In 2012, we will produce,launch the Focus ECOnetic with further advanced technology including stop-start capability to reduce CO2 emissions to a segment-leading 89 g/km, and the Fiesta ECOnetic at that same facility,87 g/km. In 2011, the next-generationMondeo ECOnetic provided customers with a mid-sized car with low CO2 emissions of 114 g/km.
In South America, we will transition our top hat and powertrain offerings to 100% global products within three years. For example, in 2012 we will launch a variety of engine technologies, including high-tech naturally-aspirated engines, 100% ethanol ("E100"), EcoBoost, and hybrid electric ("HEV"). Additionally, we will provide small, medium, and large diesel engines to improve fuel efficiency of our products.
We also are pursuing an aggressive electrification vehicle strategy called "Power of Choice." We are adding electric vehicle versions to existing, traditional vehicle lines, rather than creating one specific electric vehicle model. Our approach will enable us to offer a broad portfolio of electric vehicles at affordable prices, leveraging the efficiency of scale through the entire vehicle line. With Power of Choice, customers will be able to choose from a variety of electric powertrains, including:
Hybrid Electric Vehicles - powered in part by a battery and in part by an internal combustion engine, depending on driving conditions, with on-board charging of the battery (e.g., Ford Fusion Hybrid and Lincoln MKZ Hybrid currently available in North America)
Plug-in HEVs - similar to a hybrid vehicle, but with a larger battery to provide more electric power in more driving conditions, with the battery capable of being charged externally (e.g., Ford C-MAX Energi to be launched in North America in 2012 and plug-in hybrid.Europe in 2013, and Fusion Energi to be launched in North America in 2012)
Battery-Electric Vehicle ("BEV") - powered solely by battery, with no internal combustion engine, with the battery charged externally (e.g., Ford Transit Connect BEV launched in North America in 2010 and in Europe in 2011, and Focus Electric vehicle projects also are underwayBEV launched in GermanyNorth America in 2011 and the United Kingdom. to be launched in Europe in 2012).
We continue to engage in a number of collaborative agreements to address the many challenges that remain for electrified transportation including battery development, component standardization, cost, electric infrastructure, and connectivity to the national power grid. For example, we have signed a memorandum of understanding with Toyota to study potential collaboration to develop rear wheel drive truck and sport utility vehicle HEV technology. This collaboration is expected to enable a cost-efficient solution for maintaining our truck fuel economy leadership going forward.
Drive Safe.We are expandingbuilding on our heritagerecord of leading vehicle safety withhaving the most U.S. government 5-star rated vehicles by expanding both advanced crash protection and crash avoidance technology. We have the most U.S. government five-star rated vehicles and the most "Top Safety Picks" from the Insurance Institute of Highway Safety of any automaker. We are building onstrengthening our safety leadership by focusing on three key areas –- addressing driver behavior, enhancing crash protection even morefurther, and pioneering the next frontier of safety with "active"driver-assist crash-avoidance technologies. For example, we have introduced a new feature called MyKey®to help parents encourage their teenagers to drive more safely and more fuel efficiently,fuel-efficiently, and to increase safety belt usage. MyKey –- which debuted on the 2010 Ford Focus and is quickly becominghas become standard on many othermost Ford and Lincoln and Mercury models –- allows owners to program a key that can limit the vehicle's top speed, limit the audio volume, and mute the audio volume.if the front seat occupants are not buckled-up. We also began offeringare the leader in another dimension of driver behavior - enabling drivers to more safely operate vehicles during the recent years in which we've seen a sharp growth in the number of personal electronic devices (e.g., cell phones, MP3 players, etc.). Our SYNC system provides hands-free connectivity, with more than 4 million SYNC units on the road, and our 2nd generation of SYNC has added a "Do Not Disturb" feature that allows users to redirect incoming messages and calls directly to the customer's cellular mail box.
We also offer a new advanced crash-avoidance technology - Collision Warning with Brake Support - on certainseveral Ford and Lincoln vehicles in 2009, including the 2010 model-year Ford Taurus.Taurus, Edge, and Explorer, and Lincoln MKS, MKX, and MKT. This feature uses radar to detect slowing or stationary vehiclesmonitor traffic directly ahead, and warns the driver with an authoritative beep and a red warning light projected on the windshield.windshield if a collision threat is detected. The next-generation Fordall-new 2011 Explorer which goes into production in 2010, will debutalso debuted the auto industry's first-ever production use of inflatable seat belts, designed to provide additional protection for rear-seat occupants –- often children and older passengers who can be more vulnerable to head, chest, and neck injuries. We eventuallyThis technology was incorporated into the 2013 model year Ford Flex and Lincoln MKT, and we plan to offer inflatable seat belt technology onexpand further offerings to other vehicles globally.
In Europe, we plan to offer aOther global driver-assist features such as Blind Spot Information System™, Active Park Assist, and Adaptive Cruise Control have enjoyed strong customer demand and expanded vehicle applications. We also have begun offering the next suite of new safety features and driver assistance technology on vehicles sold in the region in 2010 and beyond, including our Blind Spot Information System, Speed Limiter, Active Park Assist, Torque Vectoring Control, Adaptive Cruise Control, Lane Departure Warning,technologies -- we will introduce Lane Keeping Aid Low Speed Collision Mitigation System, Traffic Sign Recognition System,and Driver Alert All-Seat Beltminderon the 2013 model year Lincoln MKS and Power Child Locks. Many of these safety features will become available with the introduction of the next-generation C-MAX, Grand C-MAX, FocusMKT, and freshened S-Max and Galaxy.
Drive Smart. We earned our second consecutive invitation to keynote the International Consumer Electronics Show, placing the Company among the world's leading electronics and technology innovators. At the show, our President and Chief Executive Officer Alan Mulally introduced MyFord TouchFord Flex, Explorer, Fusion, Mondeo and the next-generation of SYNC that will redefine the in-car experience with a simpler, safer and smarter way to connect drivers with available technology and their digital lives. MyFord Touch presents a holistic approach to accessing and personalizing vehicle settings and functions using a mix of graphic, touch, and voice user interfaces. MyFord Touch was recognized with CNET's "Best of CES" and Popular Mechanics' "Editor's Choice" awards at the show. MyFord and SYNC are both headed to the European market for upcoming products, including the Focus and C-MAX. Ford also is leading the way in leveraging the growing consumer trend of smartphone applications ("apps") with an innovative approach to control the applications through SYNC. Our application programming interface ("API") brings popular apps such as Pandora internet radio, Stitcher "smart" radio and the Twitter client OpenBeak into the car. These technologies not only provide greater connectivity to vehicle occupants, but importantly also help mitigate driver distraction risks by using the safer means of voice commands to control functions and programs.Europe.
ITEMItem 7. Management's Discussion and Analysis of Financial Condition and Results of Operations (continued)
The independent car safety organization Euro NCAP named the new Focus Europe's "Best in Class" small family car, while the Focus also became the industry's first vehicle to earn four Euro NCAP Advanced Technology Awards, being recognized for Active City Stop, Lane Keeping Aid, Driver Alert, and Forward Alert. Features such as Speed Limiter, Torque Vectoring Control, Traffic Sign Recognition System, All-Seat Beltminder®,and Power Child Locks also have been introduced in Europe on the Focus, C-MAX, Grand C-MAX, Mondeo, S-MAX, and Galaxy.
Drive Smart. We recently earned our fourth consecutive invitation to participate in the International Consumer Electronics Show ("CES"). At the 2011 show, Mr. Mulally introduced the Focus BEV and our entry into the growing smart phone-to-vehicle connectivity movement with MyFord Mobile™. MyFord Mobile provides BEV customers with unprecedented levels of mobile access to important elements of the BEV ownership experience like charge status, range, and route planning, and convenience features like remote locking and unlocking of doors. At the 2012 show, we introduced the Ford EVOS Concept to North America for the first time. The EVOS Concept showcases a dramatic four-door, four-seat fastback concept with state-of-the-art lithium-ion plug-in hybrid powertrain that previews our first truly global design language and a new vision for customer-focused intuitive technologies. Driver engagement technologies explore seamless enhancement of the driving experience and smart, electrified powertrain. Technologies use online data to check for potential travel routes and to set the most efficient braking, steering, and suspension settings with efficient and enjoyable powertrain settings, and to reserve a charging parking spot at the driver's destination. We built on our momentum by showcasing as well the Fusion Energi - a new plug-in hybrid that is expected to deliver more than 100 MPGe (miles per gallon equivalent) when driving on plug-in battery power - which was named "Official Car of CES."
Building upon our demonstrated strategy to democratize globally our technology, our new Hands Free Liftgate is being introduced on the all-new 2013 model year Escape, and will be rolled out to select vehicles over time. With the vehicle's key fob in a purse or pocket, the Hands Free Liftgate allows the owner simply to use his/her leg to motion under the liftgate to trigger the power liftgate to open. Parents and active people of all ages will find the feature especially useful. Additionally, the 2013 model year MKS introduces the Lincoln Drive Control system that allows the driver to modify the on-road "personality" of the vehicle, thereby delivering the ideal balance of smooth ride with confident handling. By moving the gear selector from Drive to Sport, the vehicle automatically changes shift performance, ride firmness, throttle response, shift schedule, steering response and traction control/electronic stability control parameters.
We also announced at CES our plan to create and open in the first quarter of 2012 our first dedicated research lab in California's Silicon Valley. This new lab will help us keep pace with consumer trends and aggressively prepare for the future by developing mobility solutions to harness the power of seamless connectivity, sensing systems, cloud computing, and clean technology, furthering our commitment to make technology affordable for millions of consumers.
Leveraging key new technologies across the four strategy pillars in multiple regions on global programs drives tremendous scale and efficiency savings that can be re-invested, allowing us to have the freshest showroom in the industry. In 2011, we launched 28 new or redesigned vehicles in key markets around the world, including the redesigned Focus globally; in North America, the 2.0-liter EcoBoost engine in the Ford Explorer and Edge, and the 3.5-liter EcoBoost in the F-150; in Europe, the new Transit Connect BEV and global Ranger; and in Asia Pacific Africa, the new Fiesta and global Ranger.
Our aggressive freshening cadence and relentless focus on efficiency is producing results that are greater than our major global full-line competitors. Our global programs continue to offer bold, emotive designs, high levels of quality, fuel economy leadership, top safety ratings, innovative technologies, and greater feature content than higher-series competitive offerings that also will allow us to reduce brand discounts and increase revenue across our portfolio. This overall combination of cost efficiency and revenue enhancement that is being realized from One Ford and our global product strategy will help us continue to profitably grow and "Go Further."
Item 7. Management's Discussion and Analysis of Financial Condition and Results of Operations (continued)
Finance Our Plan and ImproveStrengthen Our Balance Sheet
During 2009, we completed numerous financing transactions designed to provide additional Automotive liquidity and improve our balance sheet. These accomplishments include:
· | Negotiated with the UAW to amend the VEBA agreement to provide the option of paying up to approximately 50% of our VEBA obligations in Ford Common Stock, and to smooth payments over the 13-year payment term. |
· | Reduced Automotive debt by $10.1 billion principal amount, utilizing $2.6 billion in Automotive and Ford Credit cash and 468 million shares of Ford Common Stock, through a number of separate but related transactions, including a cash tender offer to repurchase outstanding debt securities, a cash tender offer to repurchase certain secured term loan debt, and an induced conversion offer with respect to our convertible debt securities maturing 2036. |
· | Raised $1.6 billion of equity in an underwritten public offering of Ford Common Stock. |
· | Raised $565 million with the completion of an equity distribution program begun in 2008, pursuant to which shares of Ford Common Stock were issued over time in market transactions. |
· | Entered into a U.S. Department of Energy ("DOE") loan agreement to provide us up to $5.9 billion in loans, at interest rates generally equivalent to a 10-year U.S. Treasury rate, under the DOE's Advanced Technology Vehicles Manufacturing Incentive Program (the "ATVM Program"). |
· | Issued $2.875 billion of 4.25% Senior Convertible Notes due 2016. |
· | Amended and extended the revolving credit facility under our secured Credit Agreement – reducing the amount of the revolving credit facility from $10.7 billion to $8.1 billion, extending the maturity date of $7.2 billion of that amount from December 2011 to November 2013 and establishing a new term loan in the amount of $724 million maturing in December 2013. |
· | Registered an additional $1 billion equity distribution program in November 2009 and commenced sales thereunder in December 2009. |
· | Completed the UAW VEBA transaction on December 31, 2009 by transferring assets, consisting of cash and marketable securities, notes and warrants valued at $14.8 billion, to the UAW VEBA Trust, thereby discharging our $13.6 billion of UAW retiree health care obligations. |
See "Liquidity and Capital Resources" and Note 19 of the Notes to the Financial Statements for additional discussion of financing activities, available liquidity and outstanding debt.
After completion of the important steps described above (discussed furtherAs discussed in more detail in "Liquidity and Capital Resources" and the Notes to the Financial Statements),below, during 2011 we ended 2009 with $34.4 billion ingenerated positive Automotive operating-related cash flow of $5.6 billion. We reduced Automotive debt which issubstantially in recent years, and significantly higher than that ofimproved our key competitors. As a result, we continue to pursue opportunities to improve our balance sheet – with a key priority being continuous improvement of the underlying business in order to generate operating profits and positive Automotive cash flow with which our debt can be paid down.net cash/(debt) position, as shown below (in billions):
|
| | | | | | | | | | | |
| | December 31, 2011 | | December 31, 2010 | | December 31, 2009 |
| Automotive gross cash | $ | 22.9 |
| | $ | 20.5 |
| | $ | 24.9 |
|
| Less debt: | | | | | |
| Revolving line of credit | — |
| | 0.8 |
| | 7.5 |
|
| VEBA debt | — |
| | — |
| | 7.0 |
|
| Unsecured convertible notes | 0.7 |
| | 0.7 |
| | 2.6 |
|
| Term loan | — |
| | 4.1 |
| | 5.3 |
|
| U.S. Dept. of Energy loans for advanced technology manufacturing/EXIM | 5.0 |
| | 3.0 |
| | 1.2 |
|
| All other debt | 7.4 |
| | 10.5 |
| | 10.0 |
|
| Total debt | 13.1 |
| | 19.1 |
| | 33.6 |
|
| Net cash/(debt) | $ | 9.8 |
| | $ | 1.4 |
| | $ | (8.7 | ) |
We believe that our stable management team, our strong supplier and dealer relationships, the positive acceptance of our products by customers, and our full pipeline of new products allow us to compete effectively in the global vehicle markets while we reduce our debt to a more competitive level.
Work Together Effectively as One Team
As part of the One Team approach, we have implemented a disciplined business plan process to regularly review our business environment, risks and opportunities, strategy, and plan, and to identify areas of our plan that need special attention while pursuing opportunities to improve our plan. Everyone is included and contributes, openness is encouraged, our leaders are responsible and accountable, we use facts and data to make our decisions, high performance teamwork is a performance criteria –- and we follow this process every week, every month, and every quarter, driving continuous improvement. We believe this process gives us a clear picture of our business in real time and the ability to respond quickly and decisively to new issues and changing conditions –- as we have done in the face of rapid changes in the market and business environment in 2009.the last few years. As needed, we convene daily management meetings to handle potentially acute situations, such as the aftermath of natural disasters in Asia Pacific. This allows us to ensure that we are vigorously managing daily developments and moving decisively in response to changing conditions.
In addition, we are partnering with and enlisting all of our stakeholders to help us execute our plan to deal with our business realities and create an exciting and viable Ford business going forward. We are reaching out and listening to customers, dealers, employees, the UAW, suppliers, investors, communities, retirees, and federal, state and local governments. Each of these constituencies is a critical part of the success of our business going forward. Realizing our goal of profitable growth for all is as important to these stakeholders as it is to our shareholders.
ITEMItem 7. Management's Discussion and Analysis of Financial Condition and Results of Operations (continued)
RESULTS OF OPERATIONS
FULL-YEAR 2009 RESULTS OF OPERATIONSTOTAL COMPANY
Our worldwide net income attributable to Ford Motor Company was $2.7$20.2 billion or $0.86 per share of Common and Class��B Stock in 2009, an improvement of $17.5 billion from a net loss attributable to Ford Motor Company of $14.8 billion or $6.50$4.94 per share of Common and Class B Stock in 2008.2011, an improvement of $13.6 billion from net income attributable to Ford Motor Company of $6.6 billion or $1.66 per share of Common and Class B Stock in 2010.
Results by business sectorTotal Company results are shown below (in millions):below:
|
| | | | | | | | | | | |
| | 2011 | | 2010 | | 2009 |
| | (Mils.) | | (Mils.) | | (Mils.) |
| Income/(Loss) | | | | | |
| Pre-tax results (excl. special items) | $ | 8,763 |
| | $ | 8,300 |
| | $ | 38 |
|
| Special items | (82 | ) | | (1,151 | ) | | 2,561 |
|
| Pre-tax results (incl. special items) | 8,681 |
| | 7,149 |
| | 2,599 |
|
| (Provision for)/Benefit from income taxes | 11,541 |
| | (592 | ) | | 113 |
|
| Income from continuing operations | 20,222 |
| | 6,557 |
| | 2,712 |
|
| Income/(Loss) from discontinued operations | — |
| | — |
| | 5 |
|
| Net income/(loss) | 20,222 |
| | 6,557 |
| | 2,717 |
|
| Less: Income/(Loss) attributable to noncontrolling interests | 9 |
| | (4 | ) | | — |
|
| Net income/(loss) attributable to Ford | $ | 20,213 |
| | $ | 6,561 |
| | $ | 2,717 |
|
| | | | | | | | | | |
| Income/(Loss) before income taxes | | | | | | | | | |
Automotive sector | | $ | 1,212 | | | $ | (11,917 | ) | | $ | (5,081 | ) |
Financial Services sector | | | 1,814 | | | | (2,581 | ) | | | 1,224 | |
Total Company | | | 3,026 | | | | (14,498 | ) | | | (3,857 | ) |
Provision for/(Benefit from) income taxes (b) | | | 69 | | | | 63 | | | | (1,333 | ) |
Income/(Loss) from continuing operations | | | 2,957 | | | | (14,561 | ) | | | (2,524 | ) |
Income/(Loss) from discontinued operations | | | 5 | | | | 9 | | | | 41 | |
Net income/(loss) | | | 2,962 | | | | (14,552 | ) | | | (2,483 | ) |
Less: Income/(Loss) attributable to noncontrolling interests (c) | | | 245 | | | | 214 | | | | 312 | |
Net income/(loss) attributable to Ford Motor Company (d) | | $ | 2,717 | | | $ | (14,766 | ) | | $ | (2,795 | ) |
__________
(a) | Adjusted for the effect of the change in the accounting standards for convertible debt instruments that, upon conversion, may be settled in cash; see Note 1 of the Notes to the Financial Statements for additional detail.
|
(b) | See Note 23 of the Notes to the Financial Statements for disclosure regarding 2009 effective tax rate. |
(c) | Formerly labeled "Minority interests in net income/(loss)," reflects new presentation under standard on accounting for noncontrolling interests, which was effective January 1, 2009. Primarily related to Ford Europe's consolidated 41% owned affiliate, Ford Otosan. The pre-tax results for Ford Otosan were $307 million, $531 million, and $551 million in 2009, 2008, and 2007, respectively. See "Item 2. Properties" for additional discussion of Ford Otosan. |
(d) | Formerly labeled "Net income/(loss)," reflects new presentation under the standard on accounting for noncontrolling interests, effective January 1, 2009.
|
Income/(Loss) before income taxes includes certain items ("special items") that we have grouped into "Personnel and Dealer-Related Items" and "Other Items" to provide useful information to investors about the nature of the special items. The first category includes items related to our efforts to match production capacity and cost structure to market demand and changing model mix and therefore helps investors track amounts related to those activities. The second category includes items that we do not generally consider to be indicative of our ongoing operating activities, and therefore allows investors analyzing our pre-tax results to identify certain infrequent significant items that they may wish to exclude when considering the trend of ongoing operating results.
As detailed in Note 27 of the Notes to the Financial Statements, we allocate all Automotive sector and Financial Services sector special items to a separate reconciling item, as opposed to allocating them among the operating segments and Other Automotive, reflecting the fact that management excludes these items from its review of operating segment results for purposes of measuring segment profitability and allocating resources among the segments.
ITEMItem 7. Management's Discussion and Analysis of Financial Condition and Results of Operations (continued)
The following table details Automotive sector special items in each category by segment or business unit (in millions):category:
|
| | | | | | | | | | | |
| | 2011 | | 2010 | | 2009 |
| | (Mils.) | | (Mils.) | | (Mils.) |
| Personnel and Dealer-Related Items | | | | | |
| Automotive Sector | | | | | |
| Personnel-reduction actions | $ | (269 | ) | | $ | (145 | ) | | $ | (663 | ) |
| Mercury discontinuation/Other dealer actions | (151 | ) | | (339 | ) | | (140 | ) |
| Job Security Benefits/Other | 93 |
| | 36 |
| | 40 |
|
| Retiree health care and related charges | — |
| | — |
| | (768 | ) |
| Total Personnel and Dealer-Related Items | (327 | ) | | (448 | ) | | (1,531 | ) |
| Other Items | |
| | |
| | |
|
| Automotive Sector | | | | | |
| Belgium pension settlement | (109 | ) | | — |
| | — |
|
| Debt reduction actions | (60 | ) | | (853 | ) | | 4,663 |
|
| Sale of Volvo and related charges (a) | 8 |
| | 179 |
| | (226 | ) |
| Gain on sale of Ford Russia operations | 401 |
| | — |
| | — |
|
| Other (including foreign currency translation impact) | 5 |
| | (29 | ) | | (374 | ) |
| Return on assets held in Temporary Asset Account ("TAA") | — |
| | — |
| | 110 |
|
| Total Other Items - Automotive sector | 245 |
| | (703 | ) | | 4,173 |
|
| Total Automotive sector | $ | (82 | ) | | $ | (1,151 | ) | | $ | 2,642 |
|
| Financial Services Sector | | | | | |
| DFO Partnership impairment | — |
| | — |
| | (132 | ) |
| Gain on purchase of Ford Holdings debt securities | — |
| | — |
| | 51 |
|
| Total Other Items - Financial Services sector | $ | — |
| | $ | — |
| | $ | (81 | ) |
| Total Special Items | $ | (82 | ) | | $ | (1,151 | ) | | $ | 2,561 |
|
| |
| (a) | Beginning in 2010, because Volvo's results were no longer indicative of our ongoing operations, we categorized Volvo's revenue and corresponding wholesales, costs, and expenses as special items. On August 2, 2010, we completed the sale of Volvo and related assets. Gains or losses and other costs related to the sale also are included in "Sale of Volvo and related charges." |
Personnel and Dealer-Related Items – Automotive Sector: | | | | | | | | | |
| Ford North America | | | | | | | | | |
Retiree health care and related charges | | $ | (768 | ) | | $ | 2,583 | | | $ | 1,332 | |
Personnel-reduction actions/Other | | | (358 | ) | | | (875 | ) | | | (829 | ) |
U.S. dealer actions (primarily dealership impairments) | | | (139 | ) | | | (219 | ) | | | — | |
Pension curtailment charges | | | — | | | | — | | | | (180 | ) |
Job Security Benefits/Transition Assistance Plan | | | 40 | | | | 346 | | | | 80 | |
Total Ford North America | | | (1,225 | ) | | | 1,835 | | | | 403 | |
| Ford South America | | | | | | | | | | | | |
Personnel-reduction actions | | | (20 | ) | | | — | | | | — | |
| Ford Europe | | | | | | | | | | | | |
Personnel-reduction actions/Other | | | (216 | ) | | | (82 | ) | | | (90 | ) |
| Ford Asia Pacific Africa | | | | | | | | | | | | |
Personnel-reduction actions/Other | | | (22 | ) | | | (137 | ) | | | (23 | ) |
| Volvo | | | | | | | | | | | | |
Personnel-reduction actions/Other | | | (54 | ) | | | (194 | ) | | | (63 | ) |
U.S. dealer actions | | | (1 | ) | | | (31 | ) | | | — | |
Total Volvo | | | (55 | ) | | | (225 | ) | | | (63 | ) |
| Other Automotive | | | | | | | | | | | | |
Return on assets held in Temporary Asset Account ("TAA") | | | 110 | | | | (509 | ) | | | — | |
| Total Personnel and Dealer-Related Items – Automotive sector | | | (1,428 | ) | | | 882 | | | | 227 | |
Other Items: | | | | | | | | | | | | |
| Automotive sector | | | | | | | | | | | | |
| Ford North America | | | | | | | | | | | | |
Fixed asset impairment charges | | | — | | | | (5,300 | ) | | | — | |
Gain/(Loss) on sale of ACH plants | | | — | | | | (324 | ) | | | 3 | |
Accelerated depreciation related to AAI acquisition of leased facility | | | — | | | | (306 | ) | | | — | |
Supplier settlement/Other | | | — | | | | (202 | ) | | | — | |
Ballard restructuring/Other | | | — | | | | (70 | ) | | | — | |
| Variable marketing – change in business practice * | | | — | | | | — | | | | (1,099 | ) |
Total Ford North America | | | — | | | | (6,202 | ) | | | (1,096 | ) |
| Ford Europe | | | | | | | | | | | | |
Investment impairment and related charges/Other | | | (96 | ) | | | — | | | | — | |
| Variable marketing – change in business practice * | | | — | | | | — | | | | (120 | ) |
Plant idling/closure | | | — | | | | — | | | | (43 | ) |
Total Ford Europe | | | (96 | ) | | | — | | | | (163 | ) |
| Ford Asia Pacific Africa | | | | | | | | | | | | |
| Variable marketing – change in business practice * | | | — | | | | — | | | | (15 | ) |
| Volvo | | | | | | | | | | | | |
Held-for-sale impairment | | | (650 | ) | | | — | | | | — | |
Goodwill impairment charges | | | — | | | | — | | | | (2,400 | ) |
| Variable marketing – change in business practice * | | | — | | | | — | | | | (87 | ) |
Held-for-sale cessation of depreciation and related charges/Other | | | 424 | | | | — | | | | (4 | ) |
Total Volvo | | | (226 | ) | | | — | | | | (2,491 | ) |
| Other Automotive | | | | | | | | | | | | |
| Liquidation of foreign subsidiary – foreign currency translation impact | | | (281 | ) | | | — | | | | — | |
Initial mark-to-market adjustment on Mazda marketable securities | | | — | | | | (80 | ) | | | — | |
Loss from conversion of convertible securities | | | — | | | | — | | | | (632 | ) |
Gain from debt securities exchanged for equity | | | — | | | | 141 | | | | 120 | |
Net gains from debt reduction actions | | | 4,663 | | | | — | | | | — | |
Total Other Automotive | | | 4,382 | | | | 61 | | | | (512 | ) |
| Mazda | | | | | | | | | | | | |
Loss on sale of Mazda shares | | | — | | | | (121 | ) | | | — | |
Impairment of dealer network goodwill | | | — | | | | (214 | ) | | | — | |
Total Mazda | | | — | | | | (335 | ) | | | — | |
| Jaguar Land Rover and Aston Martin | | | | | | | | | | | | |
Sale-related/Other | | | 3 | | | | 32 | | | | 178 | |
| Total Other Items – Automotive sector | | | 4,063 | | | | (6,444 | ) | | | (4,099 | ) |
| Financial Services sector | | | | | | | | | | | | |
DFO Partnership impairment/gain on sale | | | (132 | ) | | | — | | | | — | |
Ford Credit net operating lease impairment charge | | | — | | | | (2,086 | ) | | | — | |
Gain from purchase of Ford Holdings debt securities | | | 51 | | | | — | | | | — | |
| Total Other Items – Financial Services sector | | | (81 | ) | | | (2,086 | ) | | | — | |
Total | | $ | 2,554 | | | $ | (7,648 | ) | | $ | (3,872 | ) |
__________
* | Represents a one-time, non-cash charge related to a change in our business practice for offering and announcing retail variable marketing incentives to our dealers. See our Annual Report on Form 10-K for the year ended December 31, 2007 for discussion of this change in business practice. |
ITEM 7. Management's Discussion and Analysis of Financial Condition and Results of Operations (continued)
IncludedNot shown in Provision for/(Benefit from) income taxesthe table above are tax benefits of $14.2 billion, $134 million and $132 million $144 million,for 2011, 2010, and $1.5 billion for 2009, 2008, and 2007, respectively, that we consider to be special items. These primarily consist of the 2011 release of almost all of the valuation allowance against our net deferred tax assets, tax effects of the pre-tax special items listed above, and the impact of changes in tax ratelaws on deferred tax balances, and, in 2007, a $1.5 billion benefit reflecting the change in our deferred tax asset valuation allowance allocated to Income/(Loss) from continuing operations after taking into consideration income from Accumulated other comprehensive income/(loss) when determining whether sufficient future taxable income exists to realize deferred tax assets.balances.
Discussion of Automotive and Financial Services sector results of operations below is on a pre-tax basis. Discussion of overallbasis, and total Automotive cost changes, including structural cost changes (e.g., manufacturingsector results and engineering, pension and OPEB, overhead, etc.), is at constant exchange and excludestotal Financial Services sector results exclude special items and discontinued operations. In addition, costs that vary directly with volume, such as material, freight, and warranty costs, are measured at constant volume and mix.unless otherwise specifically noted.
AUTOMOTIVE SECTOR RESULTS OF OPERATIONS
2009 Compared with 2008
Details by segment or business unit of Income/(Loss) before income taxes are shown below (in millions), with Mazda and Jaguar Land Rover and Aston Martin separated out from "ongoing" subtotals:
| | | | | | | | | | |
Ford North America * | | $ | (1,649 | ) | | $ | (10,248 | ) | | $ | 8,599 | |
| | | | | | | | | | | | | |
Ford South America | | | 745 | | | | 1,230 | | | | (485 | ) |
| | | | | | | | | | | | | |
Ford Europe | | | (226 | ) | | | 970 | | | | (1,196 | ) |
| | | | | | | | | | | | | |
Ford Asia Pacific Africa | | | (97 | ) | | | (290 | ) | | | 193 | |
| | | | | | | | | | | | | |
Volvo | | | (934 | ) | | | (1,690 | ) | | | 756 | |
Total ongoing Automotive operations | | | (2,161 | ) | | | (10,028 | ) | | | 7,867 | |
| | | | | | | | | | | | | |
Other Automotive | | | 3,370 | | | | (1,816 | ) | | | 5,186 | |
Total ongoing Automotive | | | 1,209 | | | | (11,844 | ) | | | 13,053 | |
| | | | | | | | | | | | | |
Mazda | | | — | | | | (105 | ) | | | 105 | |
| | | | | | | | | | | | | |
Jaguar Land Rover and Aston Martin | | | 3 | | | | 32 | | | | (29 | ) |
Total Automotive sector | | $ | 1,212 | | | $ | (11,917 | ) | | $ | 13,129 | |
__________
* Includes the sales of Mazda6 by our consolidated subsidiary, AAI.
ITEMItem 7. Management's Discussion and Analysis of Financial Condition and Results of Operations (continued)
The chart below details 2011 pre-tax operating results by sector:
Total Company full-year 2011 pre-tax profit of $8.8 billion reflects strong results from both sectors. Compared with 2010, total Company full-year pre-tax operating profit improved, driven by a $1 billion improvement in the Automotive sector, with Financial Services delivering strong results, although lower than last year, as previously projected.
AUTOMOTIVE SECTOR
Details by segment ofIn general, we measure year-over-year change in Automotive revenues ("sales")pre-tax operating profit for our total Automotive sector (excluding special items) and wholesale unit volumes are shown below:reportable segments using the causal factors listed below, with revenue and cost variances calculated at present-year volume and mix and exchange:
| | | | | | Wholesales (b) (in thousands) | |
| | | | | | | | | | | | | | | | | | | |
Ford North America (c) | | $ | 50.5 | | | $ | 53.4 | | | $ | (2.9 | ) | (5 | )% | | | 1,959 | | | | 2,329 | | | | (370 | ) | (16 | )% |
| | | | | | | | | | | | | | | | | | | | | | | | | | | | | |
Ford South America | | | 8.0 | | | | 8.6 | | | | (0.6 | ) | (8 | ) | | | 443 | | | | 435 | | | | 8 | | 2 | |
| | | | | | | | | | | | | | | | | | | | | | | | | | | | | |
Ford Europe | | | 29.5 | | | | 39.0 | | | | (9.5 | ) | (24 | ) | | | 1,568 | | | | 1,820 | | | | (252 | ) | (14 | ) |
| | | | | | | | | | | | | | | | | | | | | | | | | | | | | |
Ford Asia Pacific Africa (d) | | | 5.5 | | | | 6.5 | | | | (1.0 | ) | (14 | ) | | | 523 | | | | 464 | | | | 59 | | 13 | |
| | | | | | | | | | | | | | | | | | | | | | | | | | | | | |
Volvo | | | 12.4 | | | | 14.7 | | | | (2.3 | ) | (15 | ) | | | 324 | | | | 359 | | | | (35 | ) | (10 | ) |
Total ongoing Automotive | | | 105.9 | | | | 122.2 | | | | (16.3 | ) | (13 | ) | | | 4,817 | | | | 5,407 | | | | (590 | ) | (11 | ) |
| | | | | | | | | | | | | | | | | | | | | | | | | | | | | |
Jaguar Land Rover and Aston Martin | | | — | | | | 7.0 | | | | (7.0 | ) | (100 | ) | | | — | | | | 125 | | | | (125 | ) | (100 | ) |
Total Automotive sector | | | 105.9 | | | $ | 129.2 | | | $ | (23.3 | ) | (18 | ) | | | 4,817 | | | | 5,532 | | | | (715 | ) | (13 | ) |
Market Factors:
__________
(a) | 2009 over/(under) 2008 sales percentages are computed using unrounded sales numbers. |
(b)▪ | Wholesale unitVolume and mix - Primarily measures profit variance from changes in wholesale volumes generally are reported on a where-sold basis,(at prior-year average margin per unit) driven by changes in industry volume, market share, and include all Ford-badged units and units manufactured by Ford that are sold to other manufacturers,dealer stocks, as well as units distributed for other manufacturers. Vehicles sold to daily rental car companies that are subject tothe profit variance resulting from changes in product mix, including mix among vehicle lines and mix of trim levels and options within a guaranteed repurchase option, as well as other sales of finished vehicles for which the recognition of revenue is deferred (e.g., consignments), are includedvehicle line.
|
| |
| ▪ | Net pricing - Primarily measures profit variance driven by changes in wholesale unit volumes. |
(c) | Includes sales of Mazda6 by our consolidated subsidiary, AAI. |
(d) | Included in wholesale unit volumes of Ford Asia Pacific Africa are Ford-badged vehicles sold in China by unconsolidated affiliates totaling about 264,000prices to dealers and 184,000 units in 2009marketing incentive programs such as rebate programs, low-rate financing offers, and 2008, respectively. Also included in the 184,000 units in 2008 are Ford-badged vehicles sold by unconsolidated affiliates in Malaysia during the first quarter. "Sales" above does not include revenue from these units.special lease offers.
|
Contribution costs - Primarily measures profit variance driven by per-unit changes in cost categories that typically vary with volume, such as material costs, warranty expense, and freight and duty costs.
Other costs - Primarily measures profit variance driven by absolute change in cost categories that typically do not have a directly proportionate relationship to production volume - mainly structural costs, such as labor costs including pension and health care ("manufacturing and engineering" and "pension/OPEB"), other costs related to development and manufacture of our vehicles ("overhead"), amortization and depreciation ("spending-related"), and advertising and sales promotions.
Exchange - Primarily measures profit variance driven by one or more of the following: (i) impact of gains or losses arising from transactions denominated in currencies other than the functional currency of the locations, (ii) effect of remeasuring income, assets, and liabilities of foreign subsidiaries using U.S. dollars as the functional currency, or (iii) results of our foreign currency hedging activities.
Net interest and other - Primarily measures profit variance driven by changes in our Automotive sector's centrally-managed net interest (primarily interest expense, interest income, and other adjustments) and related fair value market adjustments in our investment portfolio and marketable securities as well as other items not included in the causal factors defined above.
Details of Automotive sector market share for selected markets for 2009 and 2008, along with the level of dealer stocks as of December 31, 2009 and 2008, are shown below:
| | | | | | Dealer-Owned Stocks (a) (in thousands) | |
| | | | | | | | | | | | | | | | | | | |
United States (b) | | | 15.3 | % | | | 14.2 | % | | 1.1 pts. | | | | 382 | | | | 442 | | | | (60 | ) |
South America (b) (c) | | | 10.2 | | | | 9.7 | | | | 0.5 | | | | 53 | | | | 45 | | | | 8 | |
Europe (b) (d) | | | 9.1 | | | | 8.6 | | | | 0.5 | | | | 202 | | | | 282 | | | | (80 | ) |
Asia Pacific Africa (b) (e) (f) | | | 2.0 | | | | 2.0 | | | | — | | | | 33 | | | | 46 | | | | (13 | ) |
| Volvo – United States/Europe (d) | | | 0.6/1.3 | | | | 0.5/1.3 | | | | 0.1/— | | | | 12/31 | | | | 13/40 | | | | (1)/(9) | |
__________
(a) | Dealer-owned stocks represent our estimate of vehicles shipped to our customers (dealers) and not yet sold by the dealers to their retail customers. |
(b) | Includes only Ford and, in certain markets (primarily United States), Lincoln and Mercury brands. |
(c) | South America market share is based, in part, on estimated vehicle registrations for our six major markets (Argentina, Brazil, Chile, Colombia, Ecuador and Venezuela). |
(d) | Europe market share is based, in part, on estimated vehicle registrations for the 19 European markets we track (described in Item 1).
|
(e) | Asia Pacific Africa market share is based, in part, on estimated vehicle sales for our 12 major markets (Australia, China, Japan, India, Indonesia, Malaysia, New Zealand, Philippines, South Africa, Taiwan, Thailand and Vietnam). |
(f) | Dealer-owned stocks for Asia Pacific Africa include primarily Ford-brand vehicles as well as a small number of units distributed for other manufacturers. |
ITEMItem 7. Management's Discussion and Analysis of Financial Condition and Results of Operations (continued)
Overall Automotive Sector2011 Compared with 2010
Total Automotive.The improvement in results primarily reflects favorable cost changes ($5.8 billion), favorable net pricing ($5.5 billion), the non-recurrence of fixed asset impairment charges in Ford North America ($5.3 billion), net gains on debt reduction actions ($4.7 billion), and higher returns on the assets held in the TAA (about $900 million). These factors were offset partially by unfavorable volume and mix ($3.7 billion), higher retiree health care and related chargescharts below detail full-year key metrics and the non-recurrence of a retiree health care curtailment gain ($3.4 billion), and unfavorable changeschange in currency exchange ($2.1 billion). The favorable cost changes primarily reflect lower structural costs.
The decrease in revenue primarily reflects lower volumes, the non-recurrence of revenue at Jaguar Land Rover, and unfavorable changes in currency exchange, offset partiallyfull-year 2011 pre-tax operating results compared with full-year 2010 by favorable net pricing.
The table below details ourcausal factor. Automotive sector 2009 structural cost changes at constant exchange,operating margin is defined as Automotive pre-tax operating results, excluding special items and discontinued operations (in billions):Other Automotive, divided by Automotive revenue.
Explanation of Structural Cost Changes | | 2009 Better/(Worse) Than 2008 | |
| Manufacturing and engineering | Primarily hourly and salaried personnel reductions and efficiencies in our plants and processes | | $ | 2.7 | |
| Pension and OPEB | Primarily the effect of the UAW Retiree Health Care Settlement Agreement | | | 0.8 | |
| Advertising & sales promotions | Reduced costs | | | 0.6 | |
| Spending-related | Primarily lower depreciation and amortization related to the North America asset impairment at the end of second quarter 2008 | | | 0.6 | |
| Overhead | Primarily salaried personnel reductions | | | 0.4 | |
| | Total | | $ | 5.1 | |
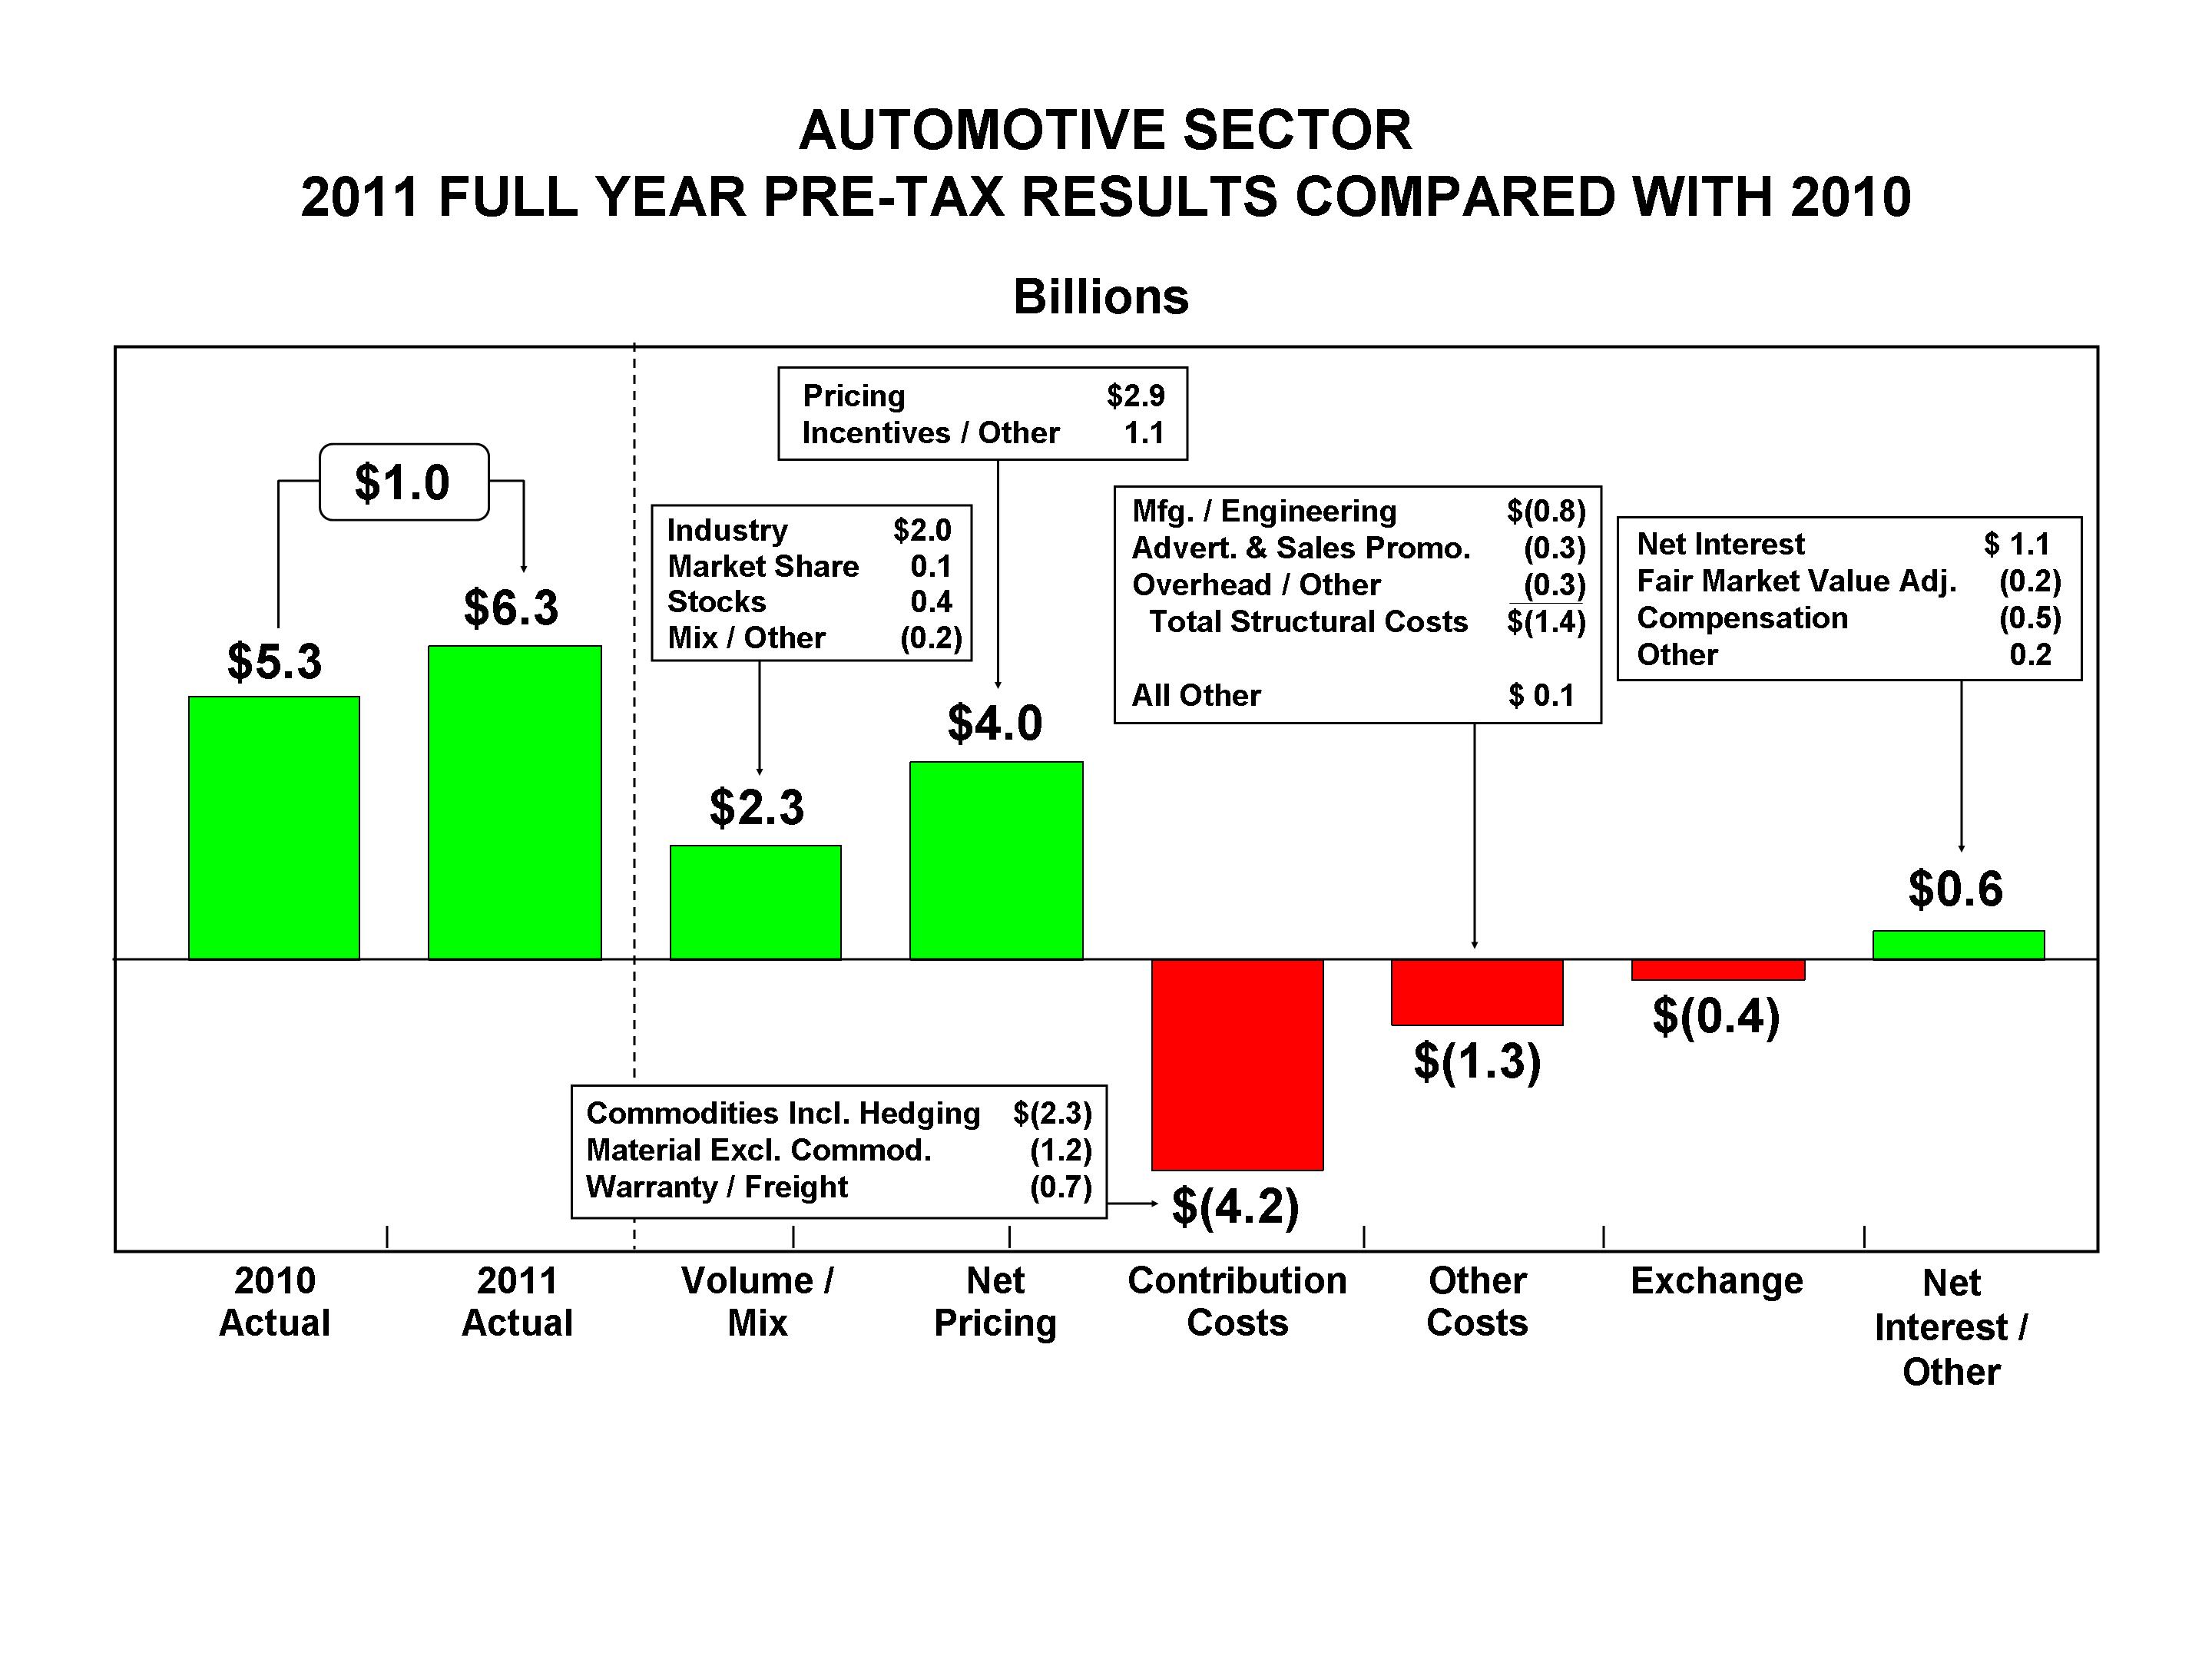
As shown above, full-year wholesale volume and revenue were higher than the year-ago period, but operating margin was down seven-tenths of a point; higher commodity costs reduced our margin by 1.8 points.
Ford North America Segment.Total Automotive pre-tax operating profit in 2011 was $6.3 billion, an increase of $1 billion from 2010. The improvementincrease in earnings is explained by strong performance in market factors, and lower interest expense net of interest income (due primarily reflects the non-recurrence of fixed asset impairment charges ($5.3 billion), favorable net pricing ($4 billion), favorable cost changes ($3.7 billion),to lower costs associated with personnel-reduction actions (about $500 million), and the non-recurrence of losses on the sale of ACH plants (about $300 million)debt levels). These factors areThis was offset partially by higher retiree health care and related charges and the non-recurrence of a retiree health care curtailment gain ($3.4 billion), unfavorable changes in currency exchange ($1.2 billion), and unfavorable volume and mix (including lower industry volume, offset partially by favorable mix andcontribution costs, higher market share) (about $900 million). The favorable net pricing primarily reflects the success of new products, selective top-line pricing, and a disciplined approach on incentives. The unfavorable changes in currency exchange primarily reflect the non-recurrence of favorable 2008 balance sheet valuations. The favorable cost changes primarily reflect lower structural costs (including lower manufacturingthe effect of higher volumes, new product launches, and engineering, pensioninvestments to support our future product, capacity, and OPEB, and spending-related costs) and lower net product costs.
Ford Southbrand-building plans), higher compensation costs in North America, Segment. The decrease in earnings primarily reflects unfavorable changes in currency exchange rates and unfavorable cost changes, offset partially by favorable net pricing. The unfavorable cost changes primarily reflect higher net product costs.exchange.
Ford Europe Segment. The decline in results primarily reflects unfavorable volume and mix (including lower industry volume and dealer stock, as well as unfavorable product mix due in part to government scrappage programs), unfavorable changes in currency exchange rates, lower earnings due to lower volumes at our consolidated joint ventures, higher costs associated with personnel-reduction actions, and an investment impairment. These factors are offset partially by favorable cost changes and favorable net pricing. The favorable cost changes primarily reflect lower structural costs (including lower manufacturing and engineering, advertising and sales promotions, and spending-related costs).
Ford Asia Pacific Africa Segment. The improvement in earnings is more than explained by favorable net pricing, favorable cost changes, lower costs associated with personnel-reduction actions, and favorable China joint venture profits, offset partially by unfavorable volume and mix and unfavorable changes in currency exchange rates. The favorable cost changes are more than explained by lower structural costs (including lower manufacturing and engineering, advertising and sales promotions, and overhead costs).
ITEMItem 7. Management's Discussion and Analysis of Financial Condition and Results of Operations (continued)
Total costs and expenses for our Automotive sector for 2011 and 2010 was $122.4 billion and $113.5 billion, respectively, a difference of $8.9 billion. An explanation of the change as reconciled to our income statement is shown below (in billions):
Volvo Segment. The improvement in earnings is more than explained by favorable cost changes, held-for-sale cessation of depreciation, favorable changes in currency exchange rates, and lower costs associated with personnel-reduction actions, offset partially by a held-for-sale impairment and unfavorable volume and mix. The favorable cost changes primarily reflect lower structural costs (including lower manufacturing and engineering, advertising and sales promotions, and overhead costs) and lower net product costs. |
| | | |
| | 2011 Better/(Worse) 2010 |
| Explanation of change: | |
| Volume and mix, exchange, and other | $ | (11.4 | ) |
| Contribution costs (a) | |
|
| Commodity costs (incl. hedging) | (2.3 | ) |
| Material costs excluding commodity costs | (1.2 | ) |
| Warranty/Freight | (0.7 | ) |
| Other costs (a) | |
|
| Structural costs | (1.4 | ) |
| Other | 0.1 |
|
| Special items (b) | 8.0 |
|
| Total | $ | (8.9 | ) |
_________
| |
| (a) | Our key cost change elements are measured primarily at present-year exchange; in addition, costs that vary directly with volume, such as material, freight and warranty costs, are measured at present-year volume and mix. Excludes special items. |
| |
| (b) | Special items primarily reflect the non-recurrence of Volvo costs and expenses in 2011. |
OtherResults by Automotive. The improvement in results is more than explained by net gains resulting from debt reduction actions and higher returns on the assets held in the TAA.
Mazda Segment. In the fourth quarter of 2008, we sold a significant portion of our investment in Mazda. Our remaining ownership interest is treated as a marketable security, with mark-to-market adjustments reported in Other Automotive.
Jaguar Land Rover and Aston Martin Segment. During the second quarter of 2008, we sold our Jaguar Land Rover operations. During the second quarter of 2007, we sold our Aston Martin operations.
2008 Compared with 2007
Details by segment or business unit of Income/(Loss) before income taxes are shown below (in millions), with Mazda and Jaguar Land Rover and Aston Martin separated out from "ongoing" subtotals:for 2011.
| | | | | | | | | | |
Ford North America * | | $ | (10,248 | ) | | $ | (4,139 | ) | | $ | (6,109 | ) |
| | | | | | | | | | | | | |
Ford South America | | | 1,230 | | | | 1,172 | | | | 58 | |
| | | | | | | | | | | | | |
Ford Europe | | | 970 | | | | 744 | | | | 226 | |
| | | | | | | | | | | | | |
Ford Asia Pacific Africa | | | (290 | ) | | | 2 | | | | (292 | ) |
| | | | | | | | | | | | | |
Volvo | | | (1,690 | ) | | | (2,718 | ) | | | 1,028 | |
Total ongoing Automotive operations | | | (10,028 | ) | | | (4,939 | ) | | | (5,089 | ) |
| | | | | | | | | | | | | |
Other Automotive | | | (1,816 | ) | | | (1,170 | ) | | | (646 | ) |
Total ongoing Automotive | | | (11,844 | ) | | | (6,109 | ) | | | (5,735 | ) |
| | | | | | | | | | | | | |
Mazda | | | (105 | ) | | | 182 | | | | (287 | ) |
| | | | | | | | | | | | | |
Jaguar Land Rover and Aston Martin | | | 32 | | | | 846 | | | | (814 | ) |
Total Automotive sector | | $ | (11,917 | ) | | $ | (5,081 | ) | | $ | (6,836 | ) |
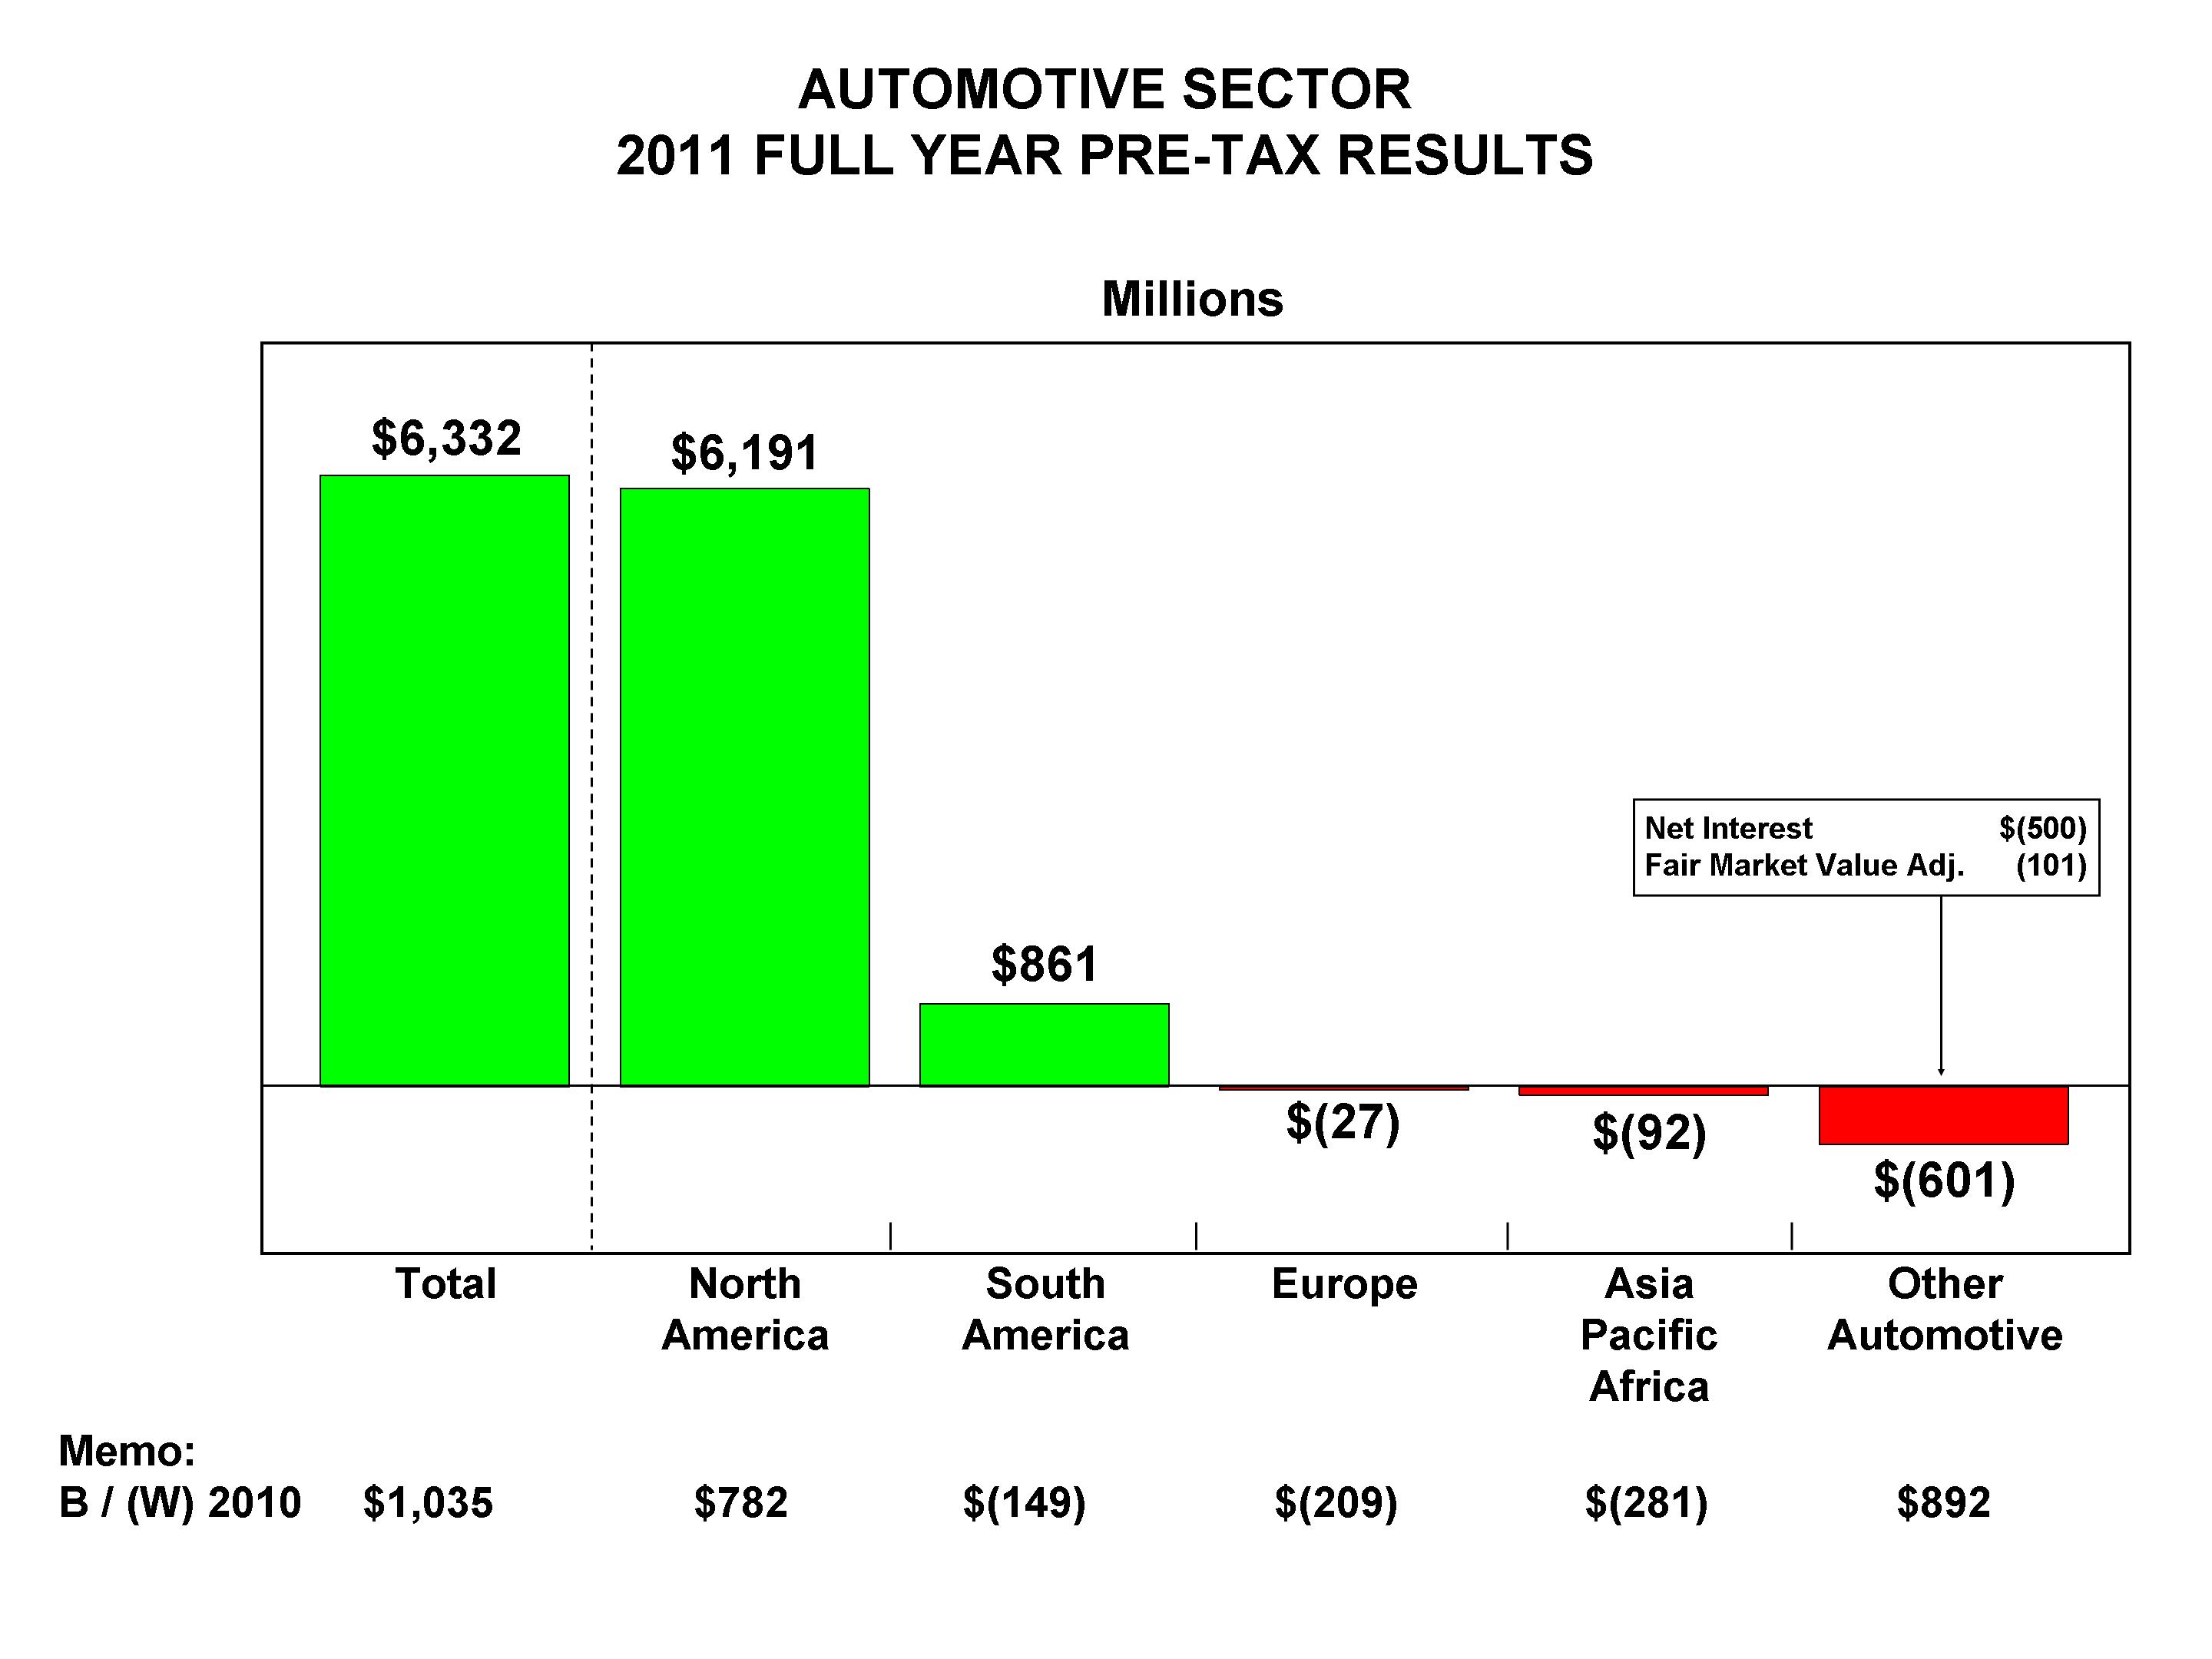
__________
* IncludesTotal Automotive pre-tax operating profit of $6.3 billion was led by a $6.2 billion profit from Ford North America. Ford South America earned a solid profit, while Ford Europe was about breakeven, incurring a small loss driven by the saleseconomic uncertainty in the region. Ford Asia Pacific Africa incurred a loss as well, more than explained by the impact of Mazda6 bythe Japan and Thailand natural disasters. The loss in Other Automotive was $601 million, reflecting higher interest expense net of interest income and unfavorable fair market valuation adjustments, mainly for our consolidated subsidiary, AAI.investment in Mazda.
For 2012, we expect interest expense net of interest income to be about the same as 2011. While interest expense will be reduced reflecting our lower debt levels, the effect of lower interest rates will be reduced interest income.
ITEMItem 7. Management's Discussion and Analysis of Financial Condition and Results of Operations (continued)
Ford North America Segment. The charts below detail key metrics and the change in 2011 pre-tax operating profit compared with 2010 by causal factor.
Details by segment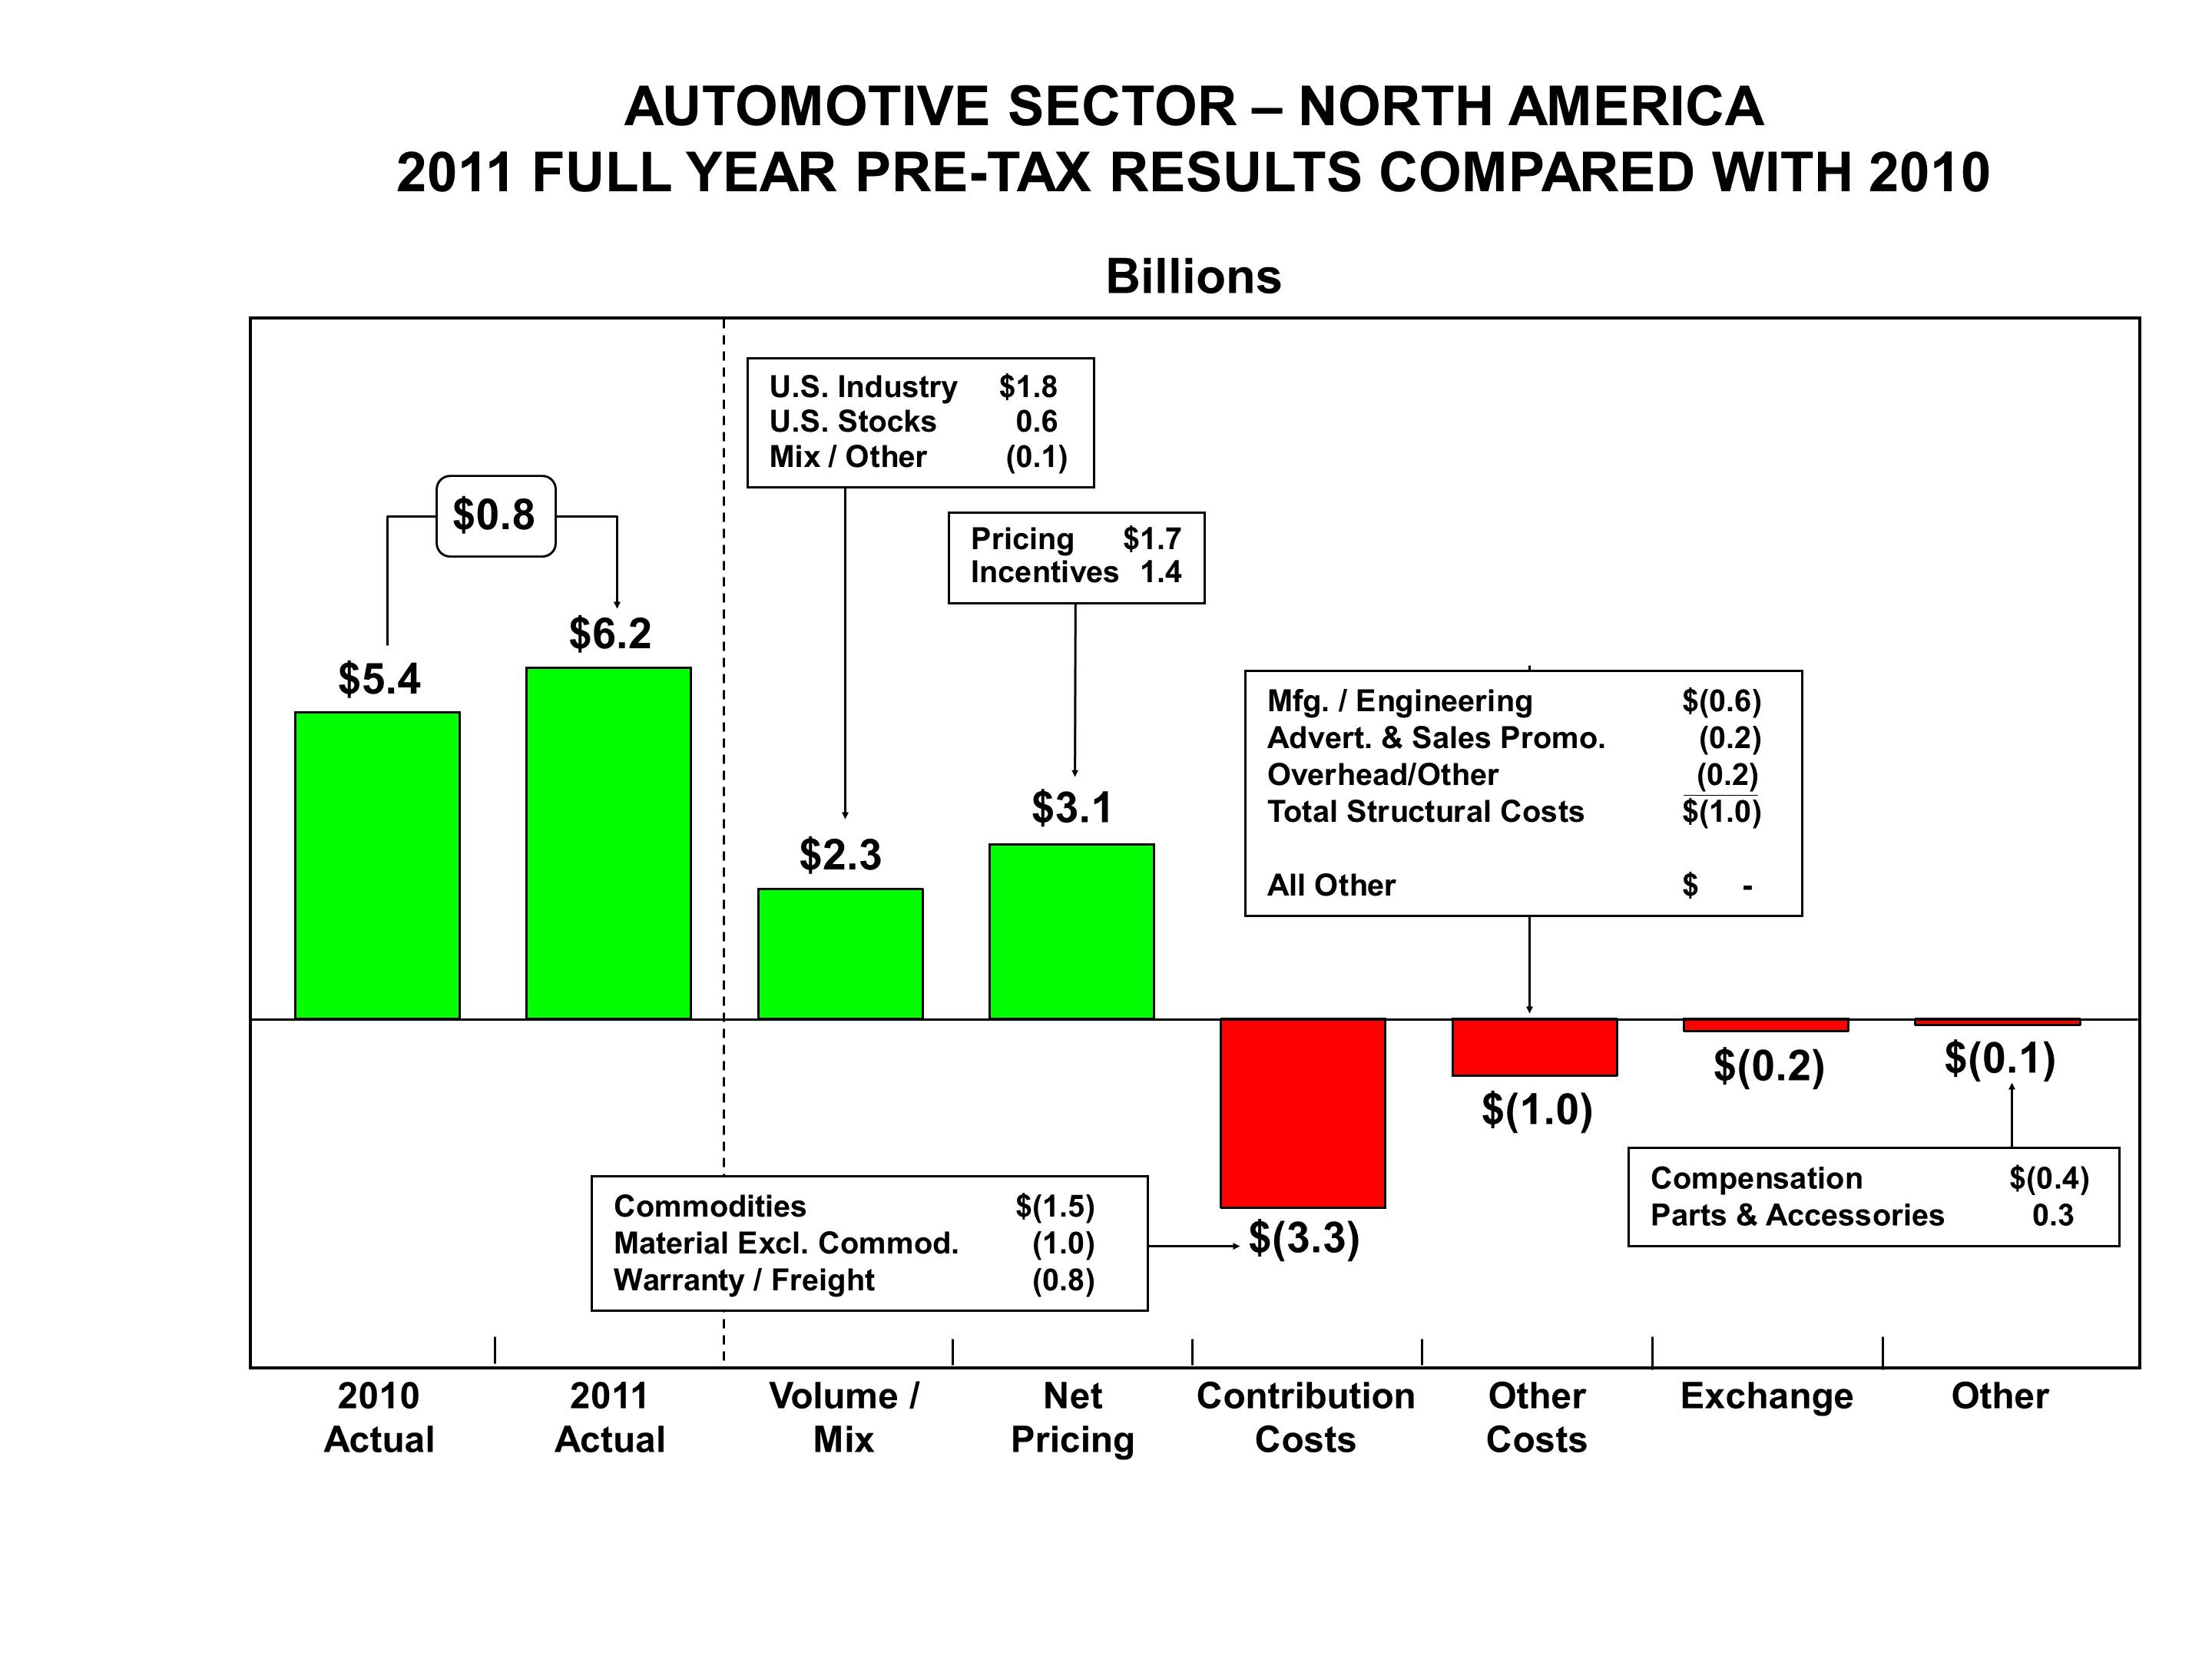
As shown above, full-year wholesale volume and revenue improved in 2011 compared with the prior year. Operating margin declined one-tenth of Automotive revenues ("sales") and wholesale unit volumes are shown below:a percentage point; this includes an adverse impact of 2 points due to higher commodity costs.
| | | | | | Wholesales (b) (in thousands) | |
| | | | | | | | | | | | | | | | | | | |
Ford North America (c) | | $ | 53.4 | | | $ | 70.4 | | | $ | (17.0 | ) | (24 | )% | | | 2,329 | | | | 2,890 | | | | (561 | ) | (19 | )% |
| | | | | | | | | | | | | | | | | | | | | | | | | | | | | |
Ford South America | | | 8.6 | | | | 7.6 | | | | 1.0 | | 14 | | | | 435 | | | | 438 | | | | (3 | ) | (1 | ) |
| | | | | | | | | | | | | | | | | | | | | | | | | | | | | |
Ford Europe | | | 39.0 | | | | 36.3 | | | | 2.7 | | 7 | | | | 1,820 | | | | 1,918 | | | | (98 | ) | (5 | ) |
| | | | | | | | | | | | | | | | | | | | | | | | | | | | | |
Ford Asia Pacific Africa (d) | | | 6.5 | | | | 7.0 | | | | (0.5 | ) | (8 | ) | | | 464 | | | | 535 | | | | (71 | ) | (13 | ) |
| | | | | | | | | | | | | | | | | | | | | | | | | | | | | |
Volvo | | | 14.7 | | | | 17.8 | | | | (3.1 | ) | (17 | ) | | | 359 | | | | 482 | | | | (123 | ) | (26 | ) |
Total ongoing Automotive | | | 122.2 | | | | 139.1 | | | | (16.9 | ) | (12 | ) | | | 5,407 | | | | 6,263 | | | | (856 | ) | (14 | ) |
| | | | | | | | | | | | | | | | | | | | | | | | | | | | | |
Jaguar Land Rover and Aston Martin | | | 7.0 | | | | 15.3 | | | | (8.3 | ) | (54 | ) | | | 125 | | | | 292 | | | | (167 | ) | (57 | ) |
Total Automotive sector | | $ | 129.2 | | | $ | 154.4 | | | $ | (25.2 | ) | (16 | ) | | | 5,532 | | | | 6,555 | | | | (1,023 | ) | (16 | ) |
__________
(a) | 2008 over/(under) 2007 sales percentages are computed using unrounded sales numbers. |
(b) | Wholesale unit volumes generally are reported on a where-sold basis, and include all Ford-badged units and units manufactured by Ford that are sold to other manufacturers, as well as units distributed for other manufacturers. Vehicles sold to daily rental car companies that are subject to a guaranteed repurchase option, as well as other sales of finished vehicles for which the recognition of revenue is deferred (e.g., consignments), are included in wholesale unit volumes.
|
(c) | Includes sales of Mazda6 by our consolidated subsidiary, AAI. |
(d) | Included in wholesale unit volumes of Ford Asia Pacific Africa are Ford-badged vehicles sold in China and through the first quarter of 2008 in Malaysia, by unconsolidated affiliates totaling about 184,000 and 205,000 units in 2008 and 2007, respectively. "Sales" above does not include revenue from these units.
|
DetailsAs we look ahead to 2012, we expect North America to continue to be the core of our Automotive sector market share for selected markets for 2008 and 2007, alongoperations, with the level of dealer stocks as of December 31, 2008 and 2007, are shown below:improved profitability compared with 2011.
| | | | | | Dealer-Owned Stocks (a) (in thousands) | |
| | | | | | | | | | | | | | | | | | | |
United States (b) | | | 14.2 | % | | | 14.6 | % | | (0.4) pts. | | | | 442 | | | | 533 | | | | (91 | ) |
South America (b) (c) | | | 9.7 | | | | 10.7 | | | | (1.0) | | | | 45 | | | | 34 | | | | 11 | |
Europe (b) (d) | | | 8.6 | | | | 8.6 | | | | — | | | | 282 | | | | 271 | | | | 11 | |
Asia Pacific Africa (b) (e) (f) | | | 2.0 | | | | 2.3 | | | | (0.3) | | | | 46 | | | | 58 | | | | (12 | ) |
| Volvo – United States/Europe (d) | | | 0.5/1.3 | | | | 0.6/1.5 | | | | (0.1)/(0.2) | | | | 13/40 | | | | 24/43 | | | | (11)/(3 | ) |
__________
(a) | Dealer-owned stocks represent our estimate of vehicles shipped to our customers (dealers) and not yet sold by the dealers to their retail customers. |
(b) | Includes only Ford and, in certain markets (primarily United States), Lincoln and Mercury brands. |
(c) | South America market share is based, in part, on estimated vehicle registrations for our six major markets (Argentina, Brazil, Chile, Colombia, Ecuador and Venezuela). |
(d) | Europe market share is based, in part, on estimated vehicle registrations for the 19 European markets we track (described in Item 1).
|
(e) | Asia Pacific Africa market share is based, in part, on estimated vehicle sales for our 12 major markets (Australia, China, Japan, India, Indonesia, Malaysia, New Zealand, Philippines, South Africa, Taiwan, Thailand and Vietnam). |
(f) | Dealer-owned stocks for Asia Pacific Africa include primarily Ford-brand vehicles as well as a small number of units distributed for other manufacturers. |
ITEMItem 7. Management's Discussion and Analysis of Financial Condition and Results of Operations (continued)
Ford South America Segment. The charts below detail key metrics and the change in 2011 pre-tax operating profit compared with 2010 by causal factor.
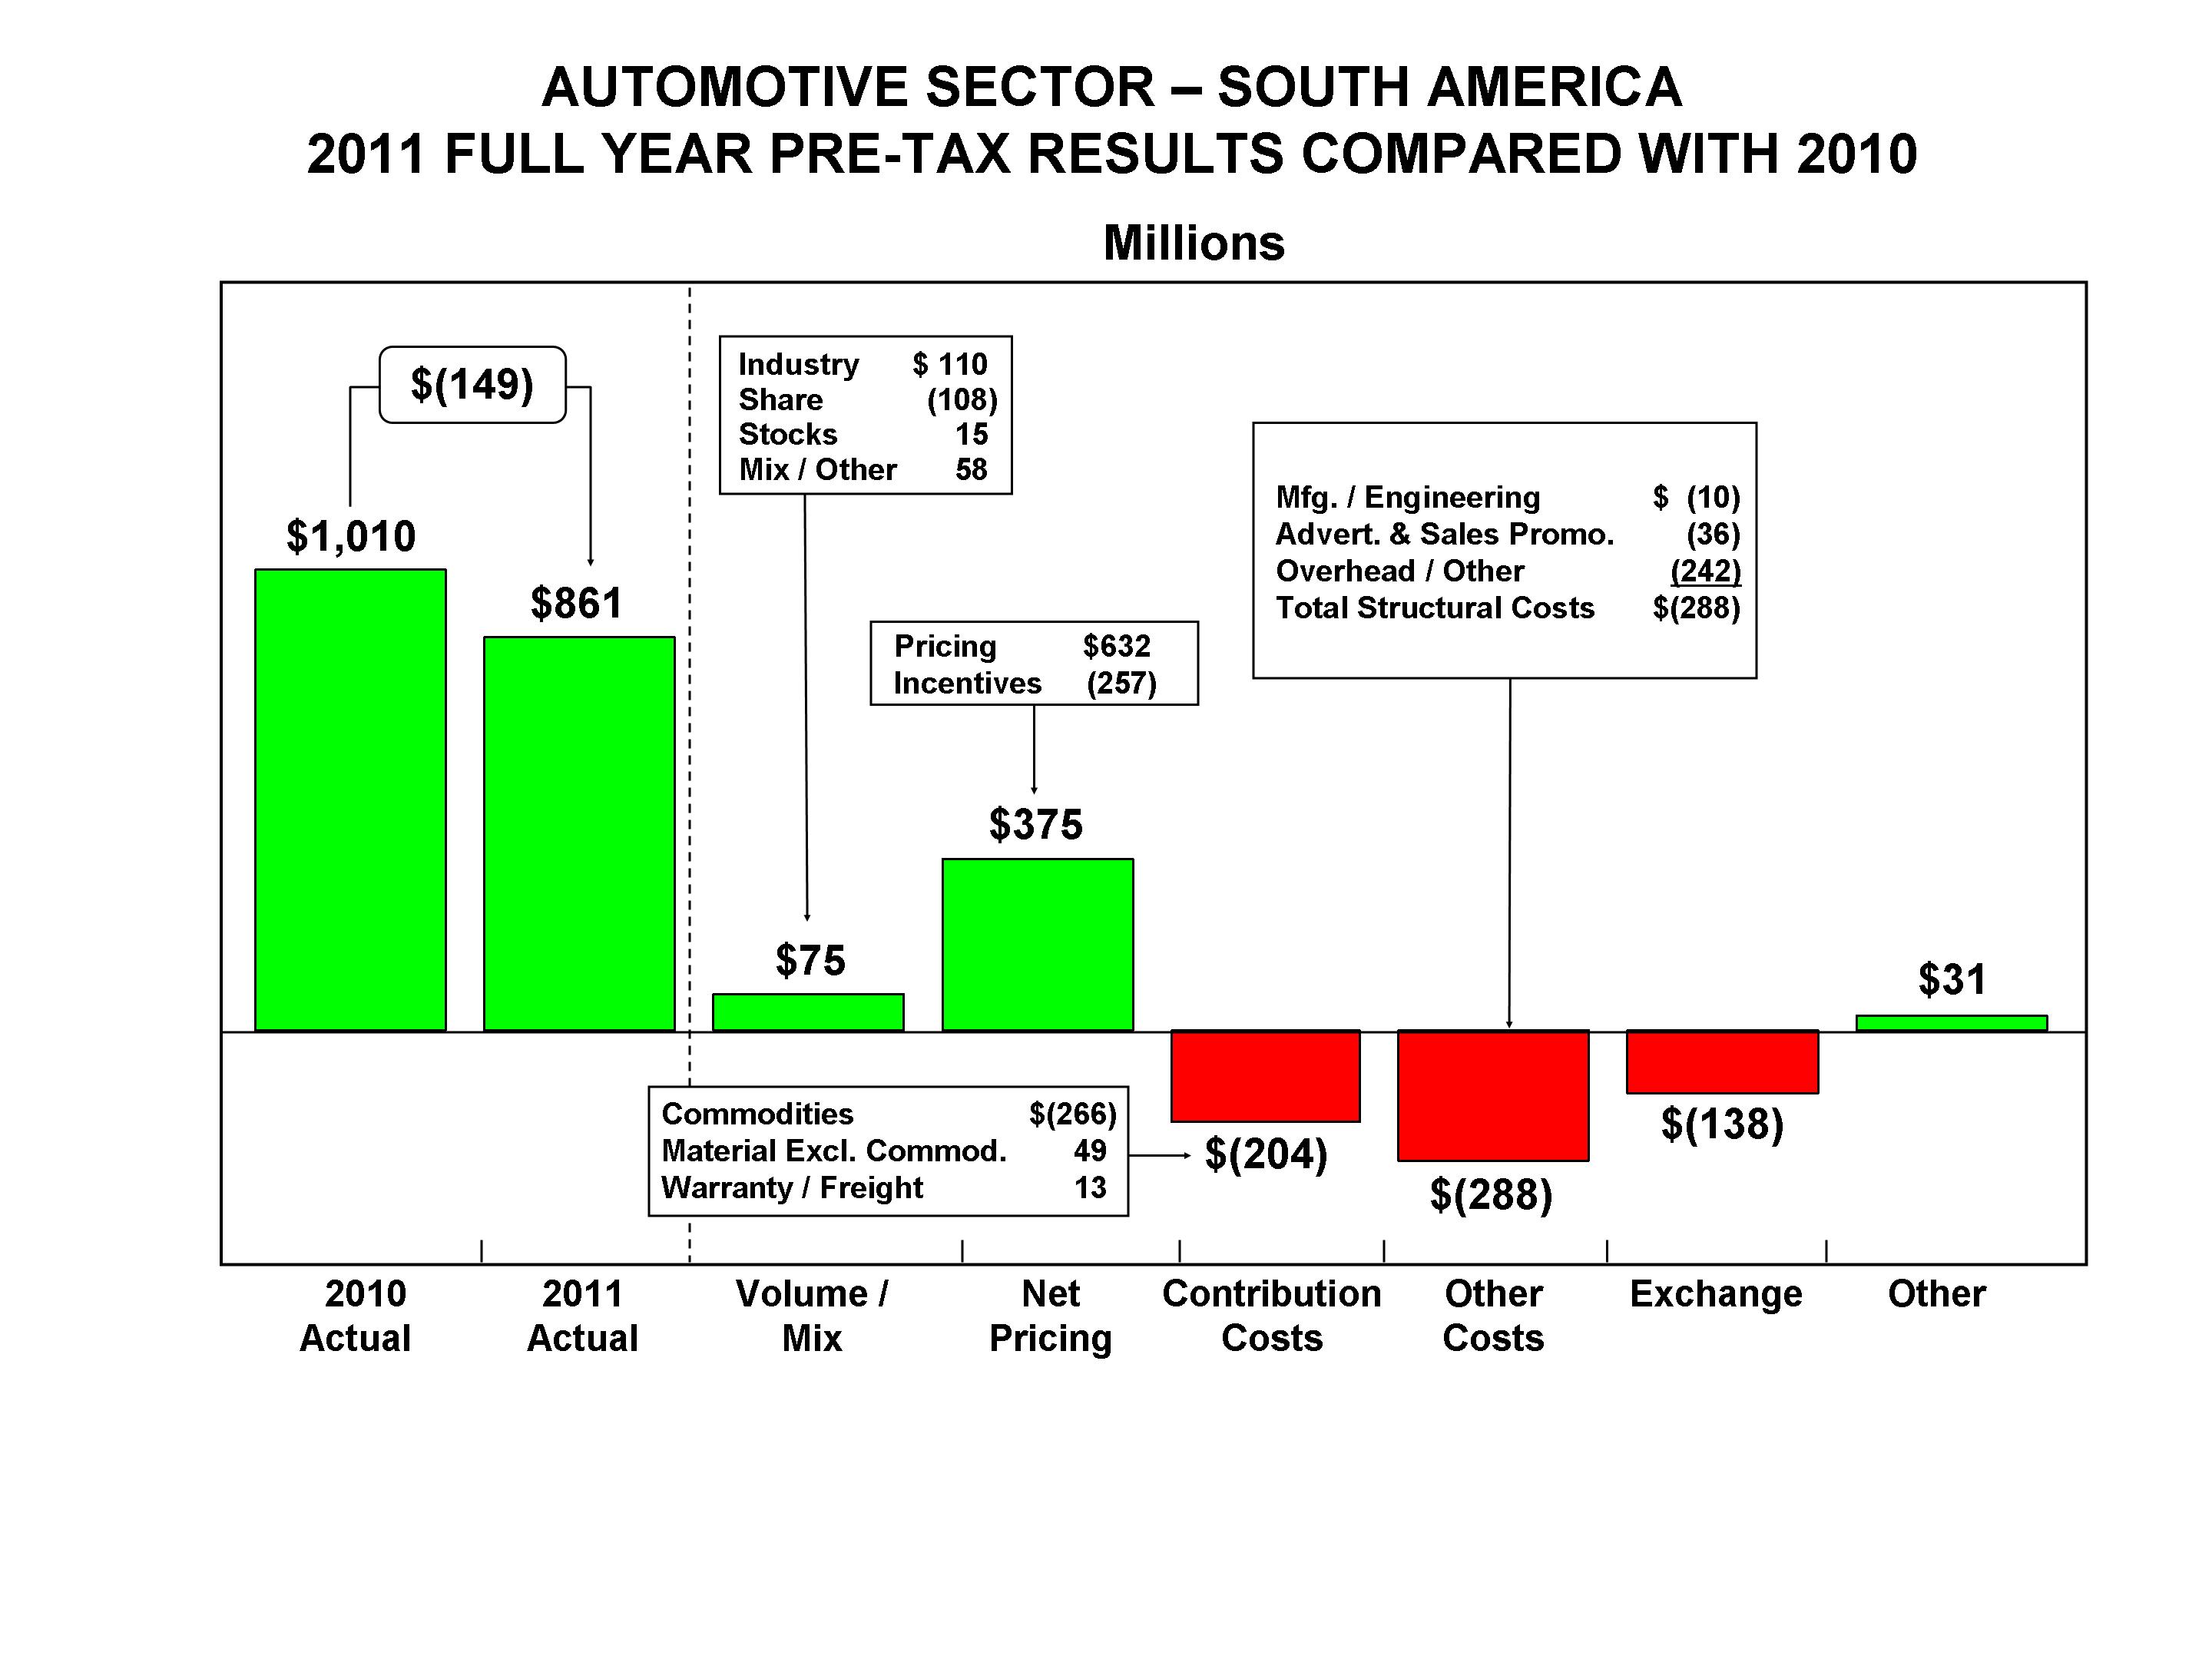
Overall Automotive SectorAs shown above, full-year wholesales and revenue increased compared with a year ago, while operating margin declined.
The decline in earnings primarily reflects unfavorable volume and mix ($6.9 billion), fixed asset impairment charges in Ford NorthSouth America ($5.3 billion), lower returns on our cash portfolio ($1 billion), lower returns on the assets held in the TAA (about $700 million), and unfavorable net pricing (about $700 million). These factors were offset partially by favorable cost changes ($4.3 billion), the non-recurrencereported a pre-tax operating profit of $861 million, compared with a goodwill impairment charge related to Volvo ($2.4 billion), and favorable retiree health care changes (primarily curtailment gains) ($1.3 billion). The favorable costs changes primarily reflect lower structural costs, offset partially by higher net product costs.
The decrease in revenue is more than explained by lower volumes and lower revenue for Jaguar Land Rover, offset partially by favorable changes in currency exchange.
The table below details our Automotive sector 2008 structural cost changes at constant exchange, excluding special items and discontinued operations (in billions):
Explanation of Structural Cost Changes | | 2008 Better/(Worse) Than 2007 | |
| Manufacturing and engineering | Primarily hourly and salaried personnel reductions and efficiencies in our plants and processes | | $ | 1.6 | |
| Pension and OPEB | Primarily the effect of the UAW Retiree Health Care Settlement Agreement | | | 1.2 | |
| Spending-related | Primarily lower depreciation and amortization related to the North America asset impairment at the end of second quarter 2008 | | | 1.3 | |
| Overhead | Primarily salaried personnel reductions | | | 1.0 | |
| Advertising & sales promotions | Reduced costs | | | 0.4 | |
| | Total | | $ | 5.5 | |
Ford North America Segment.profit of $1 billion a year ago. The decline in earnings is more than explained by unfavorable volume and mix ($5.4 billion)higher structural costs (driven primarily by local inflation), fixed asset impairment charges ($5.3 billion)higher contribution costs (more than explained by commodity costs), and unfavorable net pricing ($1.3 billion),exchange, offset partially by favorable cost changes ($3.5 billion), favorable retiree health care changes (primarily curtailment gains) ($1.3 billion), and the non-recurrence of a variable marketing charge related to a business practice change ($1.1 billion). The favorable cost changes are more than explained by lower structural costs (including lower manufacturing and engineering, spending-related, and pension and OPEB costs), offset partially by higher net product costs.
Ford South America Segment. The increase in earnings is more than explained by favorable net pricing, offset partially by unfavorable cost changes, unfavorable volume and mix, and unfavorable changes in currency exchange. The unfavorable cost changes are more than explained by higher net product costs.
Ford Europe Segment. The increase in earnings primarily reflects favorable cost changes, favorable net pricing and the non-recurrence of a variable marketing charge related to a business practice change, offset partially by unfavorable changes in currency exchange rates and unfavorable volume and mix. The favorable cost changes are more than explained by lower structural costs (including lower pension costs) and lower warranty-related costs.
Ford Asia Pacific Africa Segment. The declineLooking ahead, the competition in results primarily reflects unfavorable volumeSouth America is intensifying, with substantial capacity increases planned by a number of companies and mix, unfavorable changesnew entrants. Against this background, we expect our South American operations to continue to generate solid profitability for 2012, although somewhat lower than in currency exchange rates, and higher costs associated with personnel-reduction2011. We are continuing to work on actions offset partially by favorable cost changes and higher net pricing. The favorable cost changes are more than explained by lower structural costs (including lower overhead, spending-related, and advertising and sales promotions costs) and lower net product costs.
Volvo Segment. The improvement in earnings is more than explained by the non-recurrence of a goodwill impairment charge and favorable cost changes. These factors were offset partially by unfavorable volume and mix, mainlyto strengthen our competitiveness in the United States and Europe (largely due to lower industry sales volumes, lower market share, and unfavorable product mix), unfavorable net pricing, and unfavorable changes in currency exchange rates. The favorable cost changes primarily reflects lower structural costs (including lower manufacturing and engineering, overhead, and advertising and sales promotions costs), lower net product costs, and lower warranty-related costs.
Other Automotive. The decline in earnings primarily reflected lower returns onchanging environment. These actions include fully leveraging our cash portfolio and lower returns onOne Ford plan, including the assets heldintroduction of an all-new lineup of global products over the next two years, starting in the TAA. These factors were offset partially by the non-recurrencesecond half of the conversion of convertible securities, lower interest expense, and favorable mark-to-market adjustments for changes in currency exchange rates on intercompany loans.2012.
ITEMItem 7. Management's Discussion and Analysis of Financial Condition and Results of Operations (continued)
Ford Europe Segment.Mazda Segment. In The charts below detail key metrics and the fourth quarter of 2008, we sold a significant portion of our investmentchange in Mazda. Our remaining ownership interest is treated as marketable securities,2011 pre-tax operating profit compared with mark-to-market adjustments reported in Other Automotive.2010 by causal factor.
Jaguar Land Rover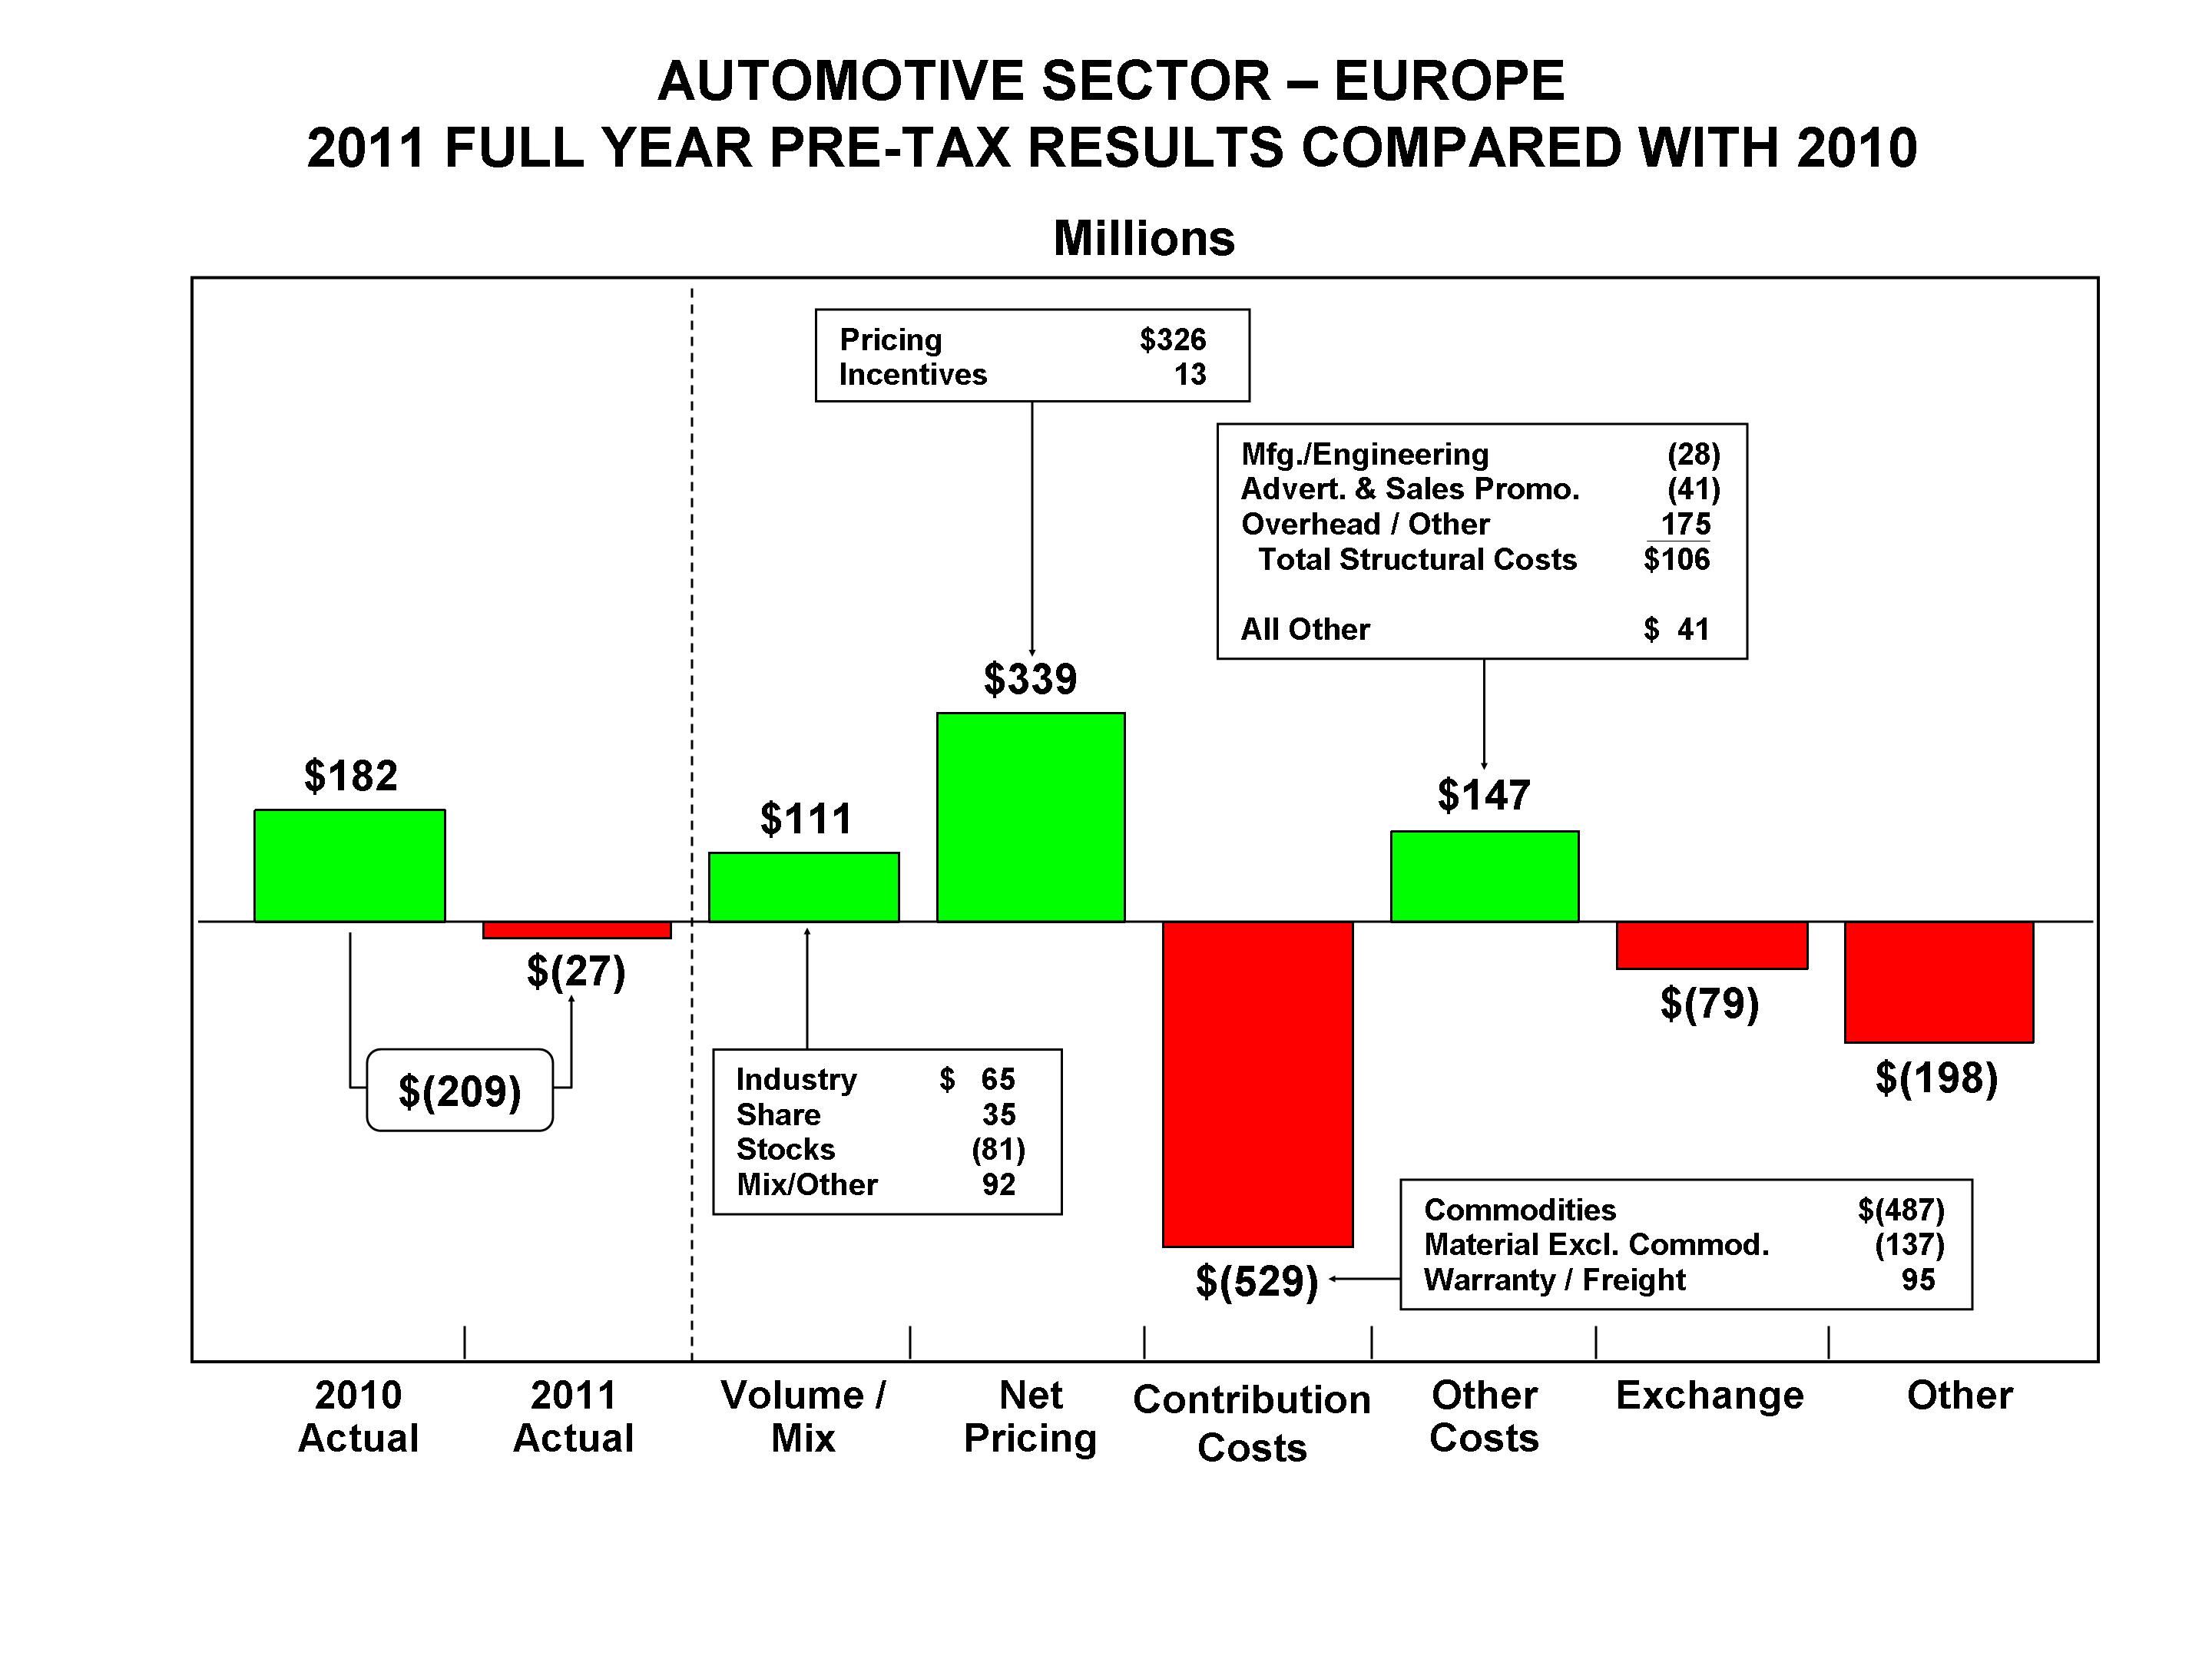
As shown above, full-year wholesale volume and Aston Martin Segment. Duringrevenue improved in 2011 compared with the second quarter of 2008, we sold our Jaguar Land Rover operations. During the second quarter of 2007, we sold our Aston Martin operations.
FINANCIAL SERVICES SECTOR RESULTS OF OPERATIONS
2009 Comparedprior year. Operating margin declined in 2011, with 2008
Details of thehigher commodity costs contributing a negative 1.5 points to Europe's full-year Financial Services sector Revenues and Income/(Loss) before income taxes for 2009 and 2008 are shown below:
| | | | | | Income/(Loss) Before Income Taxes (in millions) | |
| | | | | | | | | | | | | | | | | | | |
Ford Credit | | $ | 12.1 | | | $ | 15.7 | | | $ | (3.6 | ) | | $ | 2,001 | | | $ | (2,559 | ) | | $ | 4,560 | |
Other Financial Services | | | 0.3 | | | | 0.3 | | | | — | | | | (187 | ) | | | (22 | ) | | | (165 | ) |
Total | | $ | 12.4 | | | $ | 16.0 | | | $ | (3.6 | ) | | $ | 1,814 | | | $ | (2,581 | ) | | $ | 4,395 | |
Ford Credit
Europe reported a pre-tax operating loss of $27 million, compared with a profit of $182 million a year ago. The improvementdecline in pre-tax results primarily reflected the non-recurrence of the 2008 impairment charge to Ford Credit's North America operations operating lease portfolio for contracts terminating beginning third quarter of 2008 ($2.1 billion), lower depreciation expense for leased vehiclesis more than explained by higher commodity costs and lower residual losses on returned vehicles due to higher auction values ($1.9 billion), and a lower provision for credit losses primarily related to non-recurrence of higher severitymaterial costs excluding commodities, as well as unfavorable exchange. These costs were offset partially by higher repossessions (about $800 million).net pricing and favorable volume and mix. Other factors that explain the improvement in pre-tax results included the non-recurrence of net losses related to market valuation adjustments to derivatives, shown as unallocated risk managementreflects our continued investment in the table below ($367 million), net gains related to unhedged currency exposure primarily from cross-border intercompany lending (about $300 million),Craiova facility in Romania in preparation for the production volume ramp-up in 2012, as well as lower net operating costs (about $200 million),parts and higher financing margin primarily attributable to lower borrowing costs (about $100 million). These factors were offset partially by lower volume primarily reflecting lower industry volumes, lower dealer stocks, the impact of divestitures and alternative business arrangements, and changes in currency exchange rates (about $1 billion); the non-recurrence of the gain related to the sale of approximately half of Ford Credit's ownership interest in its Nordic operation (about $100 million), and a valuation allowance for Australian finance receivables sold in 2009 (about $50 million).
Results of Ford Credit's operations and unallocated risk management for 2009 and 2008 are shown below:
| | | | |
| | | | | | | | | | |
| Income/(Loss) before income taxes | | | | | | | | | |
North America operations | | $ | 1,905 | | | $ | (2,749 | ) | | $ | 4,654 | |
International operations | | | 46 | | | | 507 | | | | (461 | ) |
Unallocated risk management* | | | 50 | | | | (317 | ) | | | 367 | |
Income/(Loss) before income taxes | | | 2,001 | | | | (2,559 | ) | | | 4,560 | |
| Provision for/(Benefit from) income taxes and Gain on disposal of discontinued operations | | | 722 | | | | (1,023 | ) | | | 1,745 | |
Net income/(loss) | | $ | 1,279 | | | $ | (1,536 | ) | | $ | 2,815 | |
________
* Consists of gains and losses related to market valuation adjustments to derivatives primarily related to movements in interest rates.accessories profits.
The improvementexternal environment in Europe is uncertain and is likely to remain so for some time. Given the challenges in Europe, we will continue to review, take, and accelerate actions to strengthen and improve our business. This will include fully leveraging our One Ford Credit's North America operations pre-tax results primarily reflected non-recurrence of the impairment charge for operating leases, lower depreciation expense for leased vehiclesplan and lower residual losses on returned vehicles due to higher auction values, a lower provision for credit losses, net gains related to unhedged currency exposure from cross-border intercompany lending, higher financing margin, and lower operating costs. These factors were offset partially by lower volume. The decrease in Ford Credit's International operations pre-tax earnings primarily reflected lower volume, a higher provision for credit losses primarily reflecting losses in Spain and Germany, lower financing margin primarily in Mexico, non-recurrence of a gain related to the sale of approximately half of Ford Credit's ownership interest in its Nordic operations, and a valuation allowance for Australian finance receivables sold in 2009. These factors were offset partially by lower operating costs. The change in unallocated risk management income reflected the non-recurrence of net losses related to market valuation adjustments to derivatives primarily related to movements in interest rates.our global resources.
ITEMItem 7. Management's Discussion and Analysis of Financial Condition and Results of Operations (continued)
Ford Asia Pacific Africa Segment. The charts below detail key metrics and the change in 2011 pre-tax operating profit compared with 2010 by causal factor.
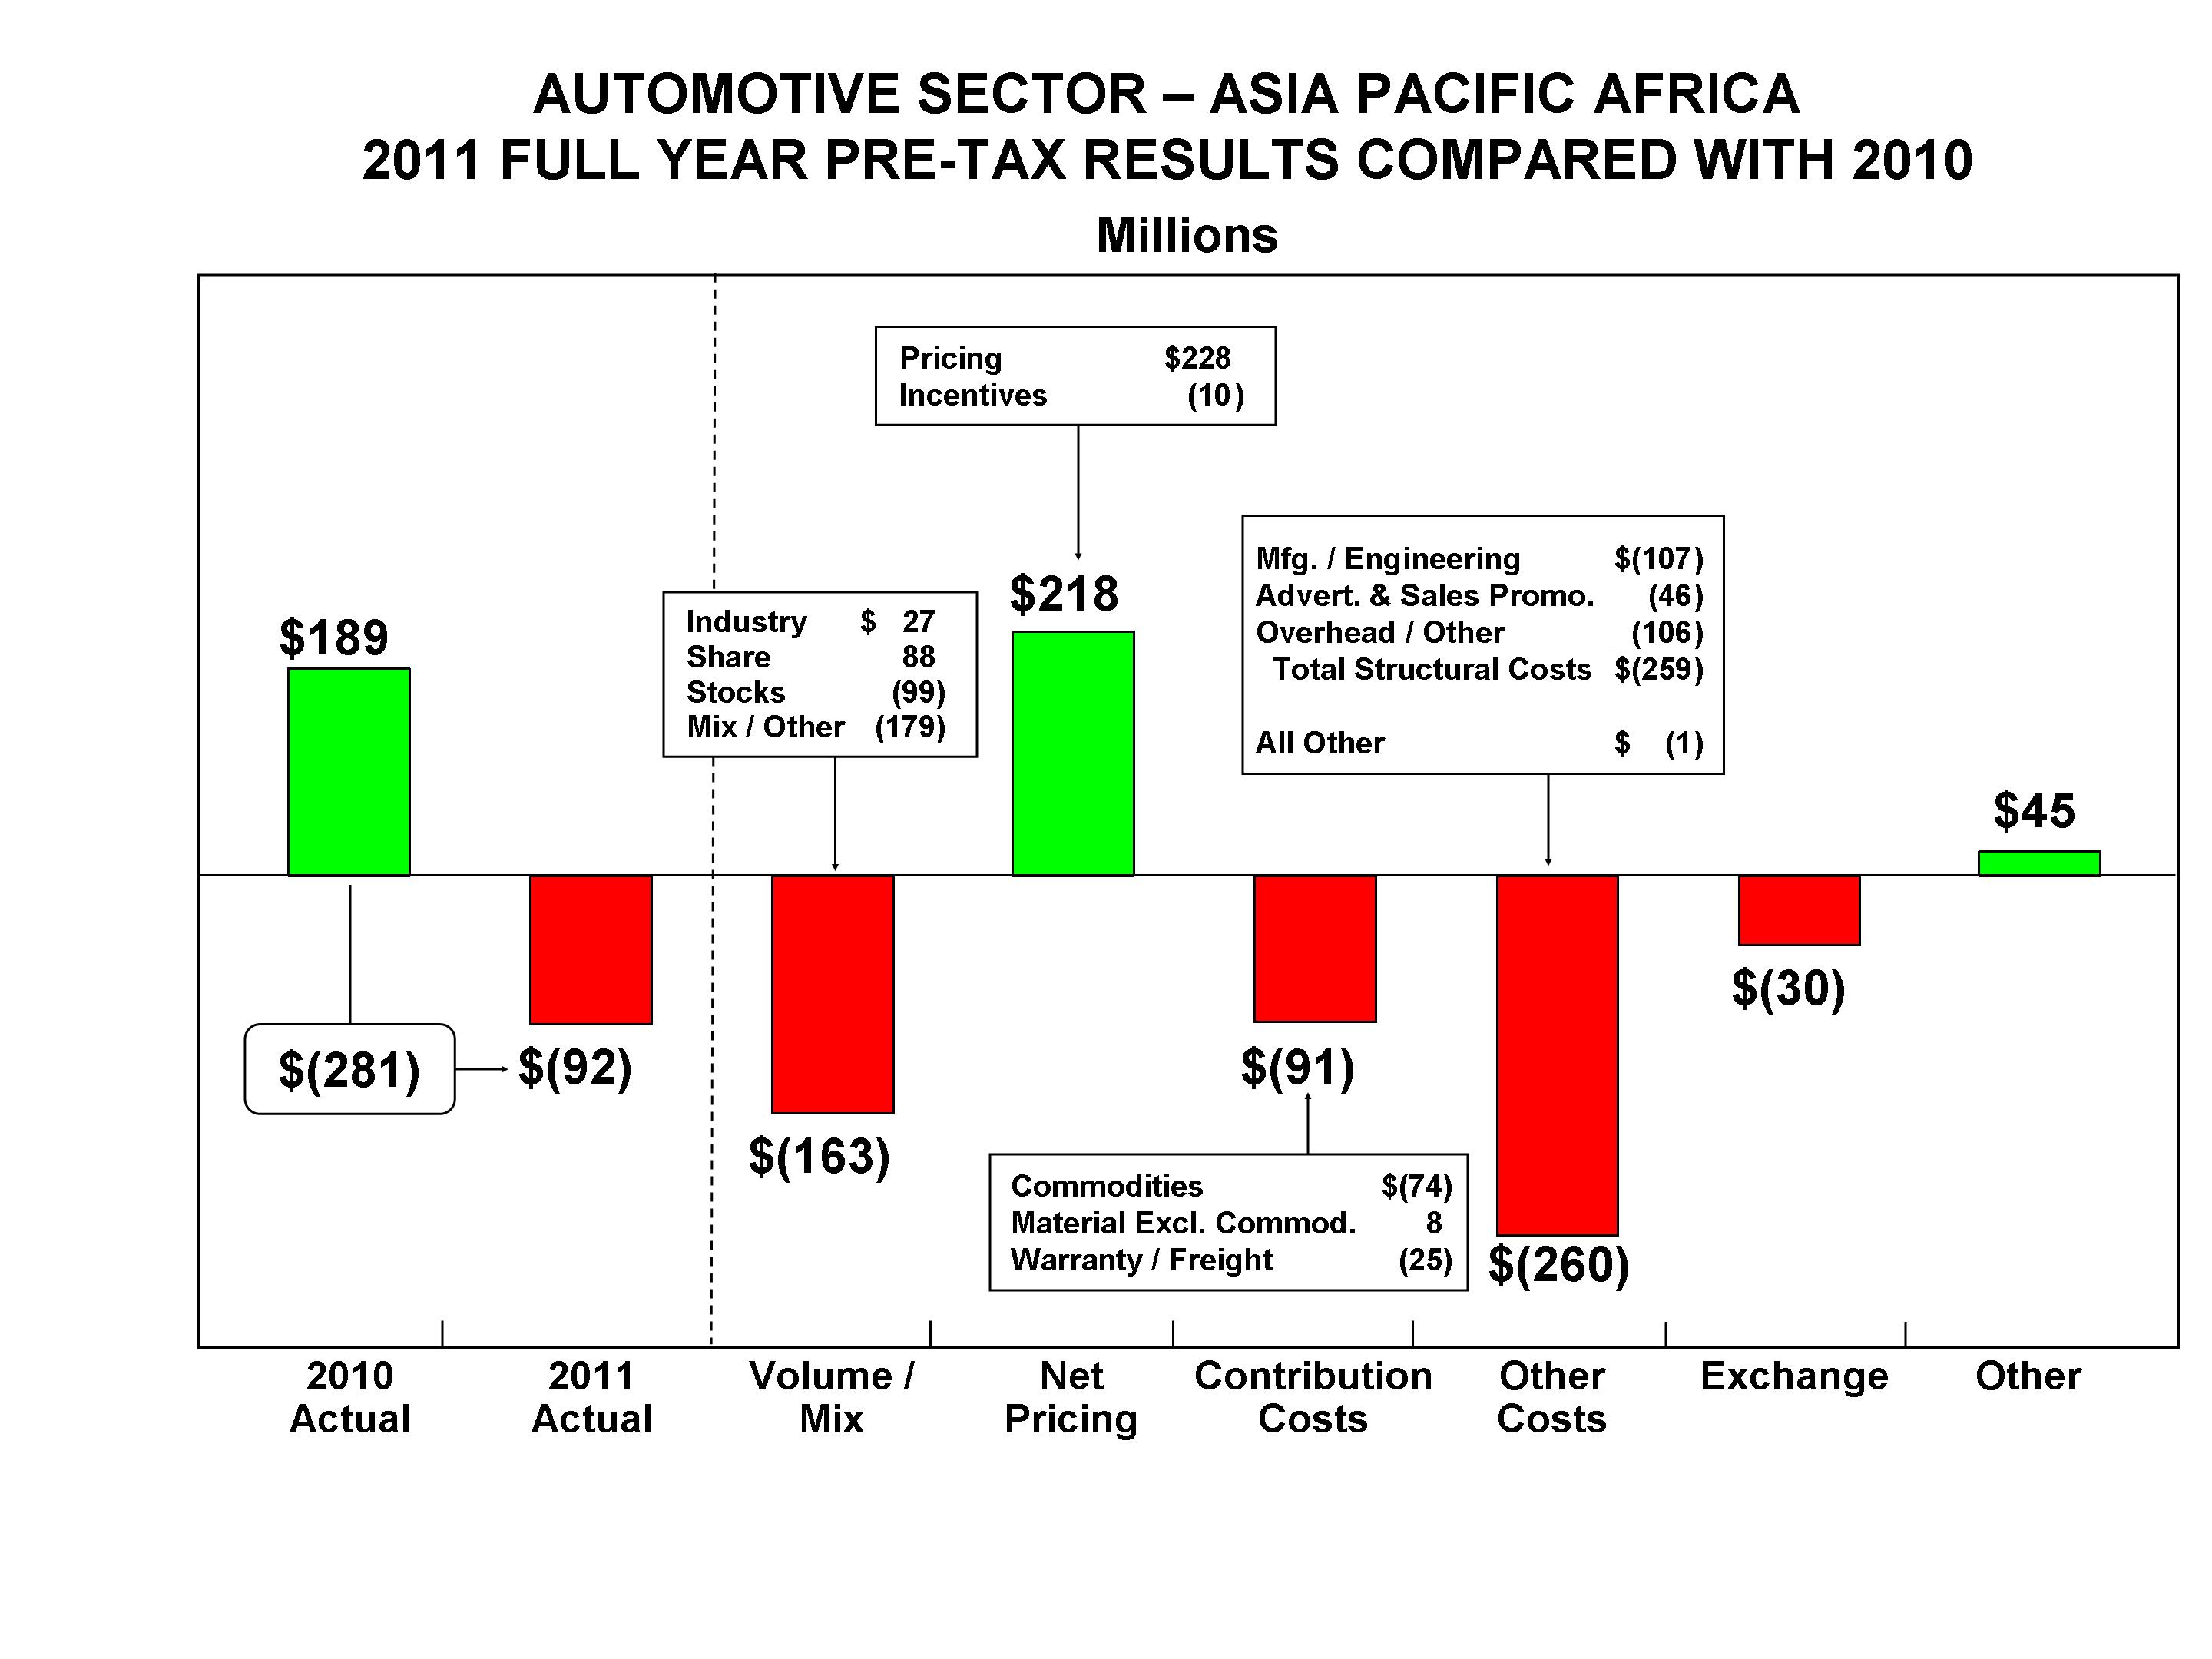
Ford Credit reviews its business performance from several perspectives, including:
· | On-balance sheet basis. Includes the receivables and leases Ford Credit owns and securitized receivables and leases that remain on Ford Credit's balance sheet (includes other structured financings and factoring transactions that have features similar to securitization transactions);
|
· | Securitized off-balance sheet basis. Includes receivables sold in securitization transactions that, when sold, do not remain on Ford Credit's balance sheet;
|
· | Managed basis. Includes on-balance sheet receivables, excluding unearned interest supplements related to finance receivables, and securitized off-balance sheet receivables that Ford Credit continues to service; and
|
· | Serviced basis. Includes managed receivables and leases, and receivables sold in whole-loan sale transactions where Ford Credit retains no interest in the sold receivables, but which it continues to service.
|
As shown above, wholesales and revenue increased compared with a year ago, while operating margin declined.
Ford Credit analyzes its financial performanceAsia Pacific Africa reported a pre-tax operating loss of $92 million, compared with a profit of $189 million a year ago. The decline in results reflects higher costs (primarily structural costs in support of Ford Asia Pacific Africa growth plans), unfavorable volume and mix (which includes the impact of events in Japan and Thailand), and unfavorable exchange, offset partially by higher net pricing.
We expect Ford Asia Pacific Africa to grow volume and be profitable for 2012, even as we continue to invest in additional capacity and our product line-up for an even stronger future, in line with implementation of our One Ford plan.
Item 7. Management's Discussion and Analysis of Financial Condition and Results of Operations (continued)
2010 Compared with 2009
Total Automotive. The charts below detail key metrics and the change in 2010 pre-tax operating results compared with 2009 by causal factor. Automotive operating margin is defined as Automotive pre-tax operating results, excluding special items and Other Automotive, divided by Automotive revenue.
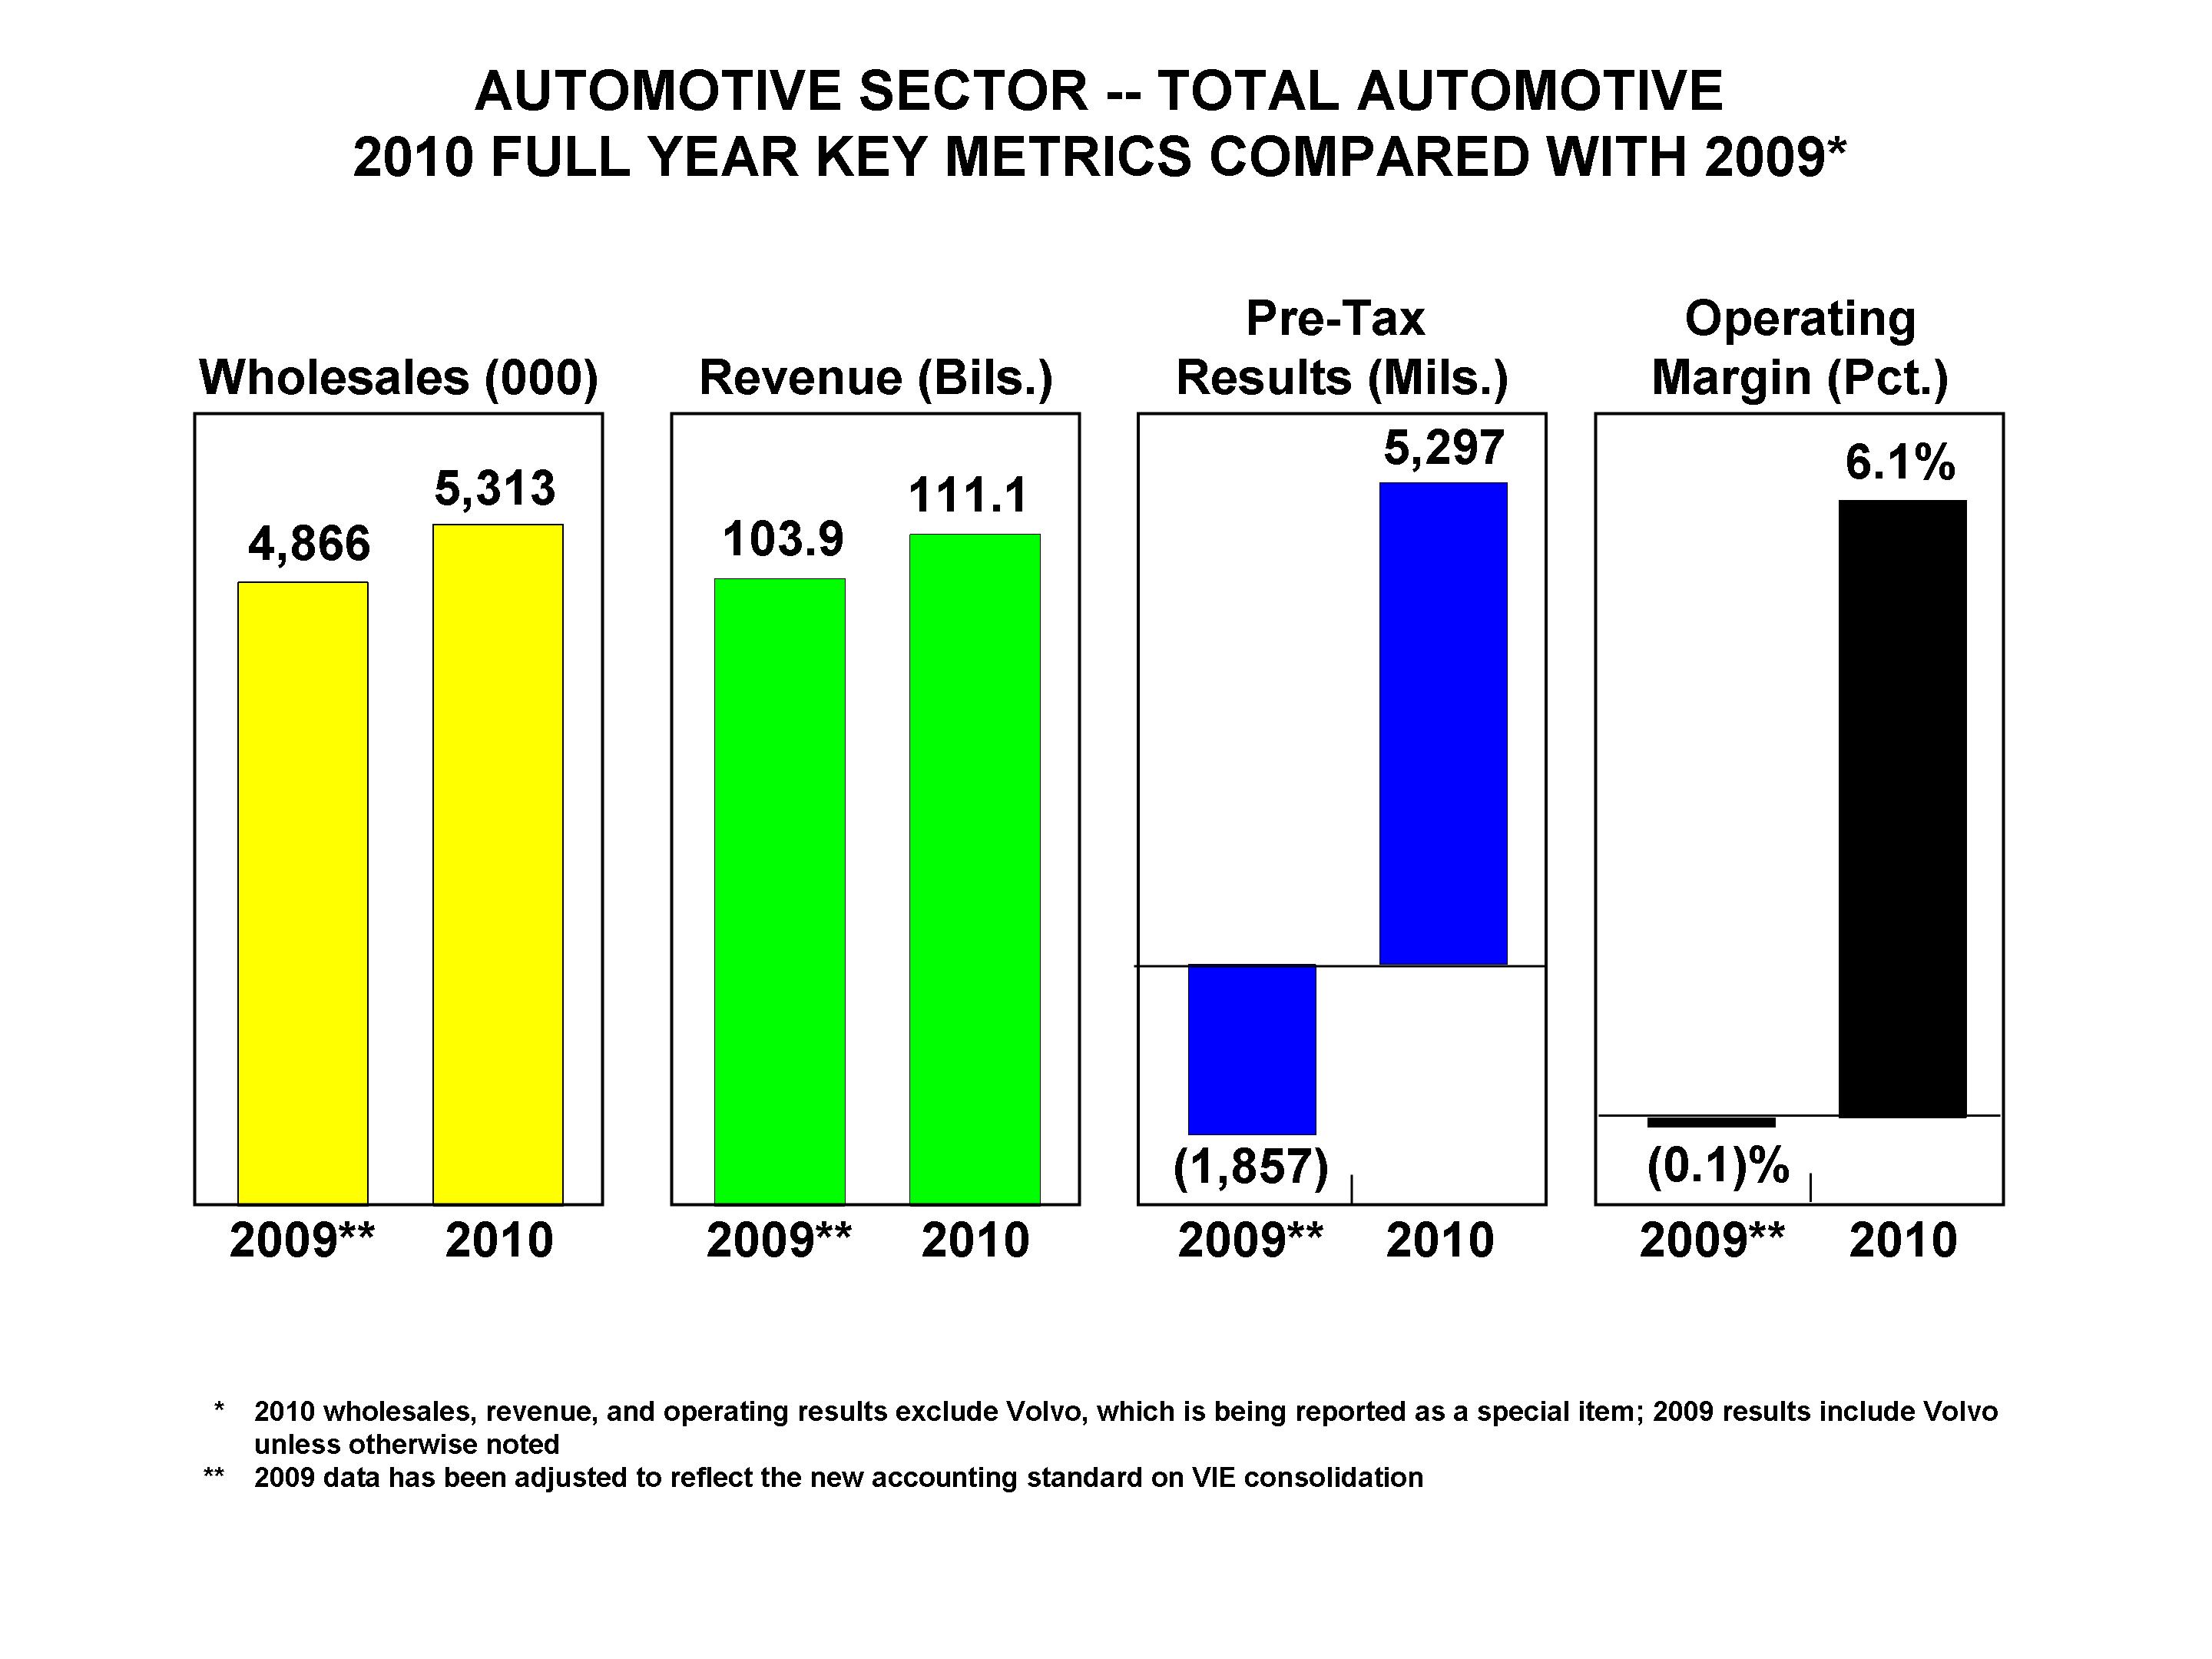
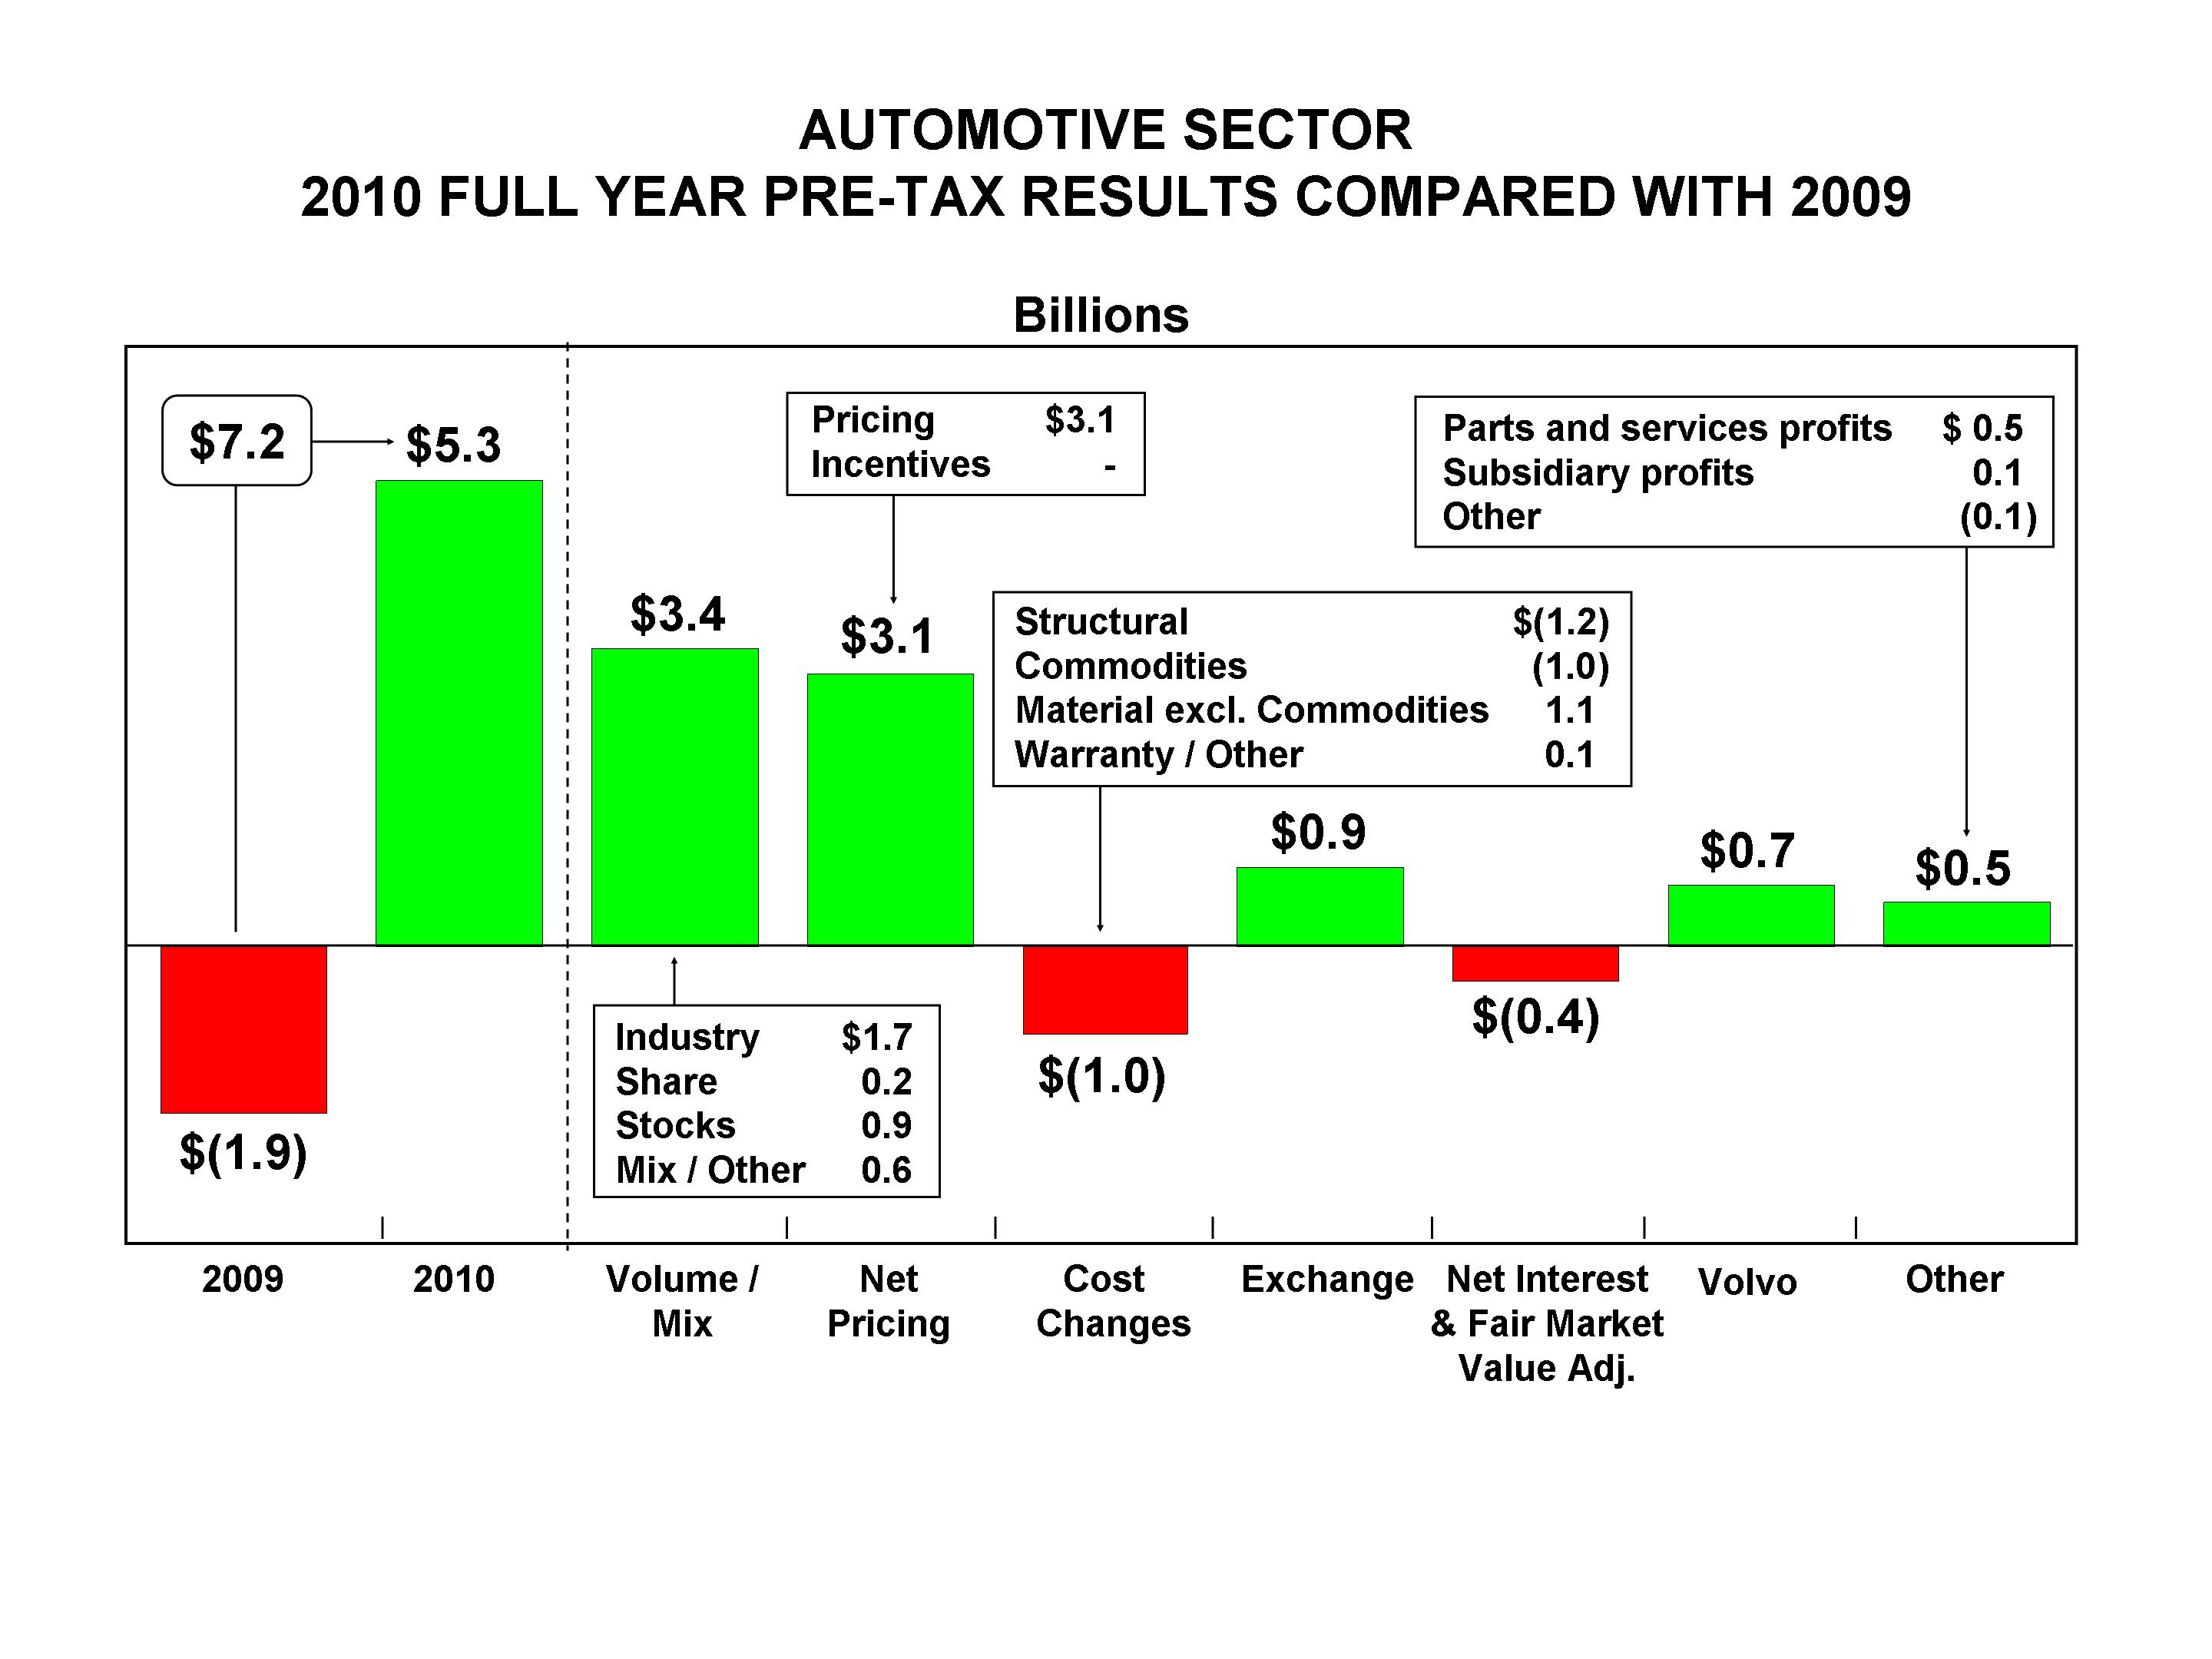
The increase in wholesales for total Automotive reflects higher wholesales in Ford North America and Ford Asia Pacific Africa, offset partially by lower Volvo wholesales (reflecting the sale of Volvo). The improvement in total Automotive results primarily reflects favorable volume and mix, net pricing (mainly in North America), changes in currency exchange, and the non-recurrence of Volvo operating losses from 2009, offset partially by unfavorable cost changes and higher net interest expense. Favorable volume and mix primarily reflects higher industry volumes, market share improvements in North America, and the non-recurrence of prior-year stock reductions, offset partially by lower market share in Europe.
Item 7. Management's Discussion and Analysis of Financial Condition and Results of Operations (continued)
Total costs and expenses for our Automotive sector for 2010 and 2009 was $113.5 billion and $107.2 billion, respectively, a difference of $6.3 billion. An explanation of the change as reconciled to our income statement is shown below (in billions):
|
| | | |
| | 2010 Better/(Worse) 2009 |
| Explanation of change: | |
| Volume and mix, exchange, and other | $ | (12.1 | ) |
| Material costs excluding commodity costs (a) | 1.1 |
|
| Commodity costs (a) | (1.0 | ) |
| Structural costs (a) | (1.2 | ) |
| Warranty/Other (a) | 0.1 |
|
| Special items (b) | 6.8 |
|
| Total | $ | (6.3 | ) |
_________
| |
| (a) | Our key cost change elements are measured primarily at present-year exchange; in addition, costs that vary directly with volume, such as material, freight and warranty costs, are measured at present-year volume and mix. Excludes special items (primarily changes in Volvo costs and expenses reflecting the sale of these operations). |
| |
| (b) | Primarily reflects changes in Volvo costs and expenses. |
Results by Automotive Segment. Details by segment of Income/(Loss) before income taxes are shown below for 2010.
Total Automotive pre-tax operating profit was $5.3 billion, with each Automotive segment profitable. The decline in Other Automotive primarily reflects higher interest expense net of interest income. This is more than explained by interest expense associated with the debt owed to the UAW VEBA Trust that was added at the end of 2009 and prepaid in full during 2010, and the interest expense associated with our convertible debt issued in November 2009, offset partially by lower interest expense on a managedour revolving debt which was 90% repaid in 2010.
Item 7. Management's Discussion and on-balance sheet basis. It retains interestsAnalysis of Financial Condition and Results of Operations (continued)
Ford North America Segment. The charts below detail key metrics and the change in receivables sold2010 pre-tax operating profit compared with 2009 by causal factor.
The increase in off-balance sheet securitization transactionswholesales for Ford North America primarily reflects higher U.S. industry volume, market share, and the non-recurrence of prior-year reductions in dealer stocks. In the United States, continued consumer awareness of our improvements in quality and fuel efficiency are driving strong consideration and demand for Ford products, which has enabled us to achieve market share gains and improve net pricing.
The improvement in results primarily reflects favorable volume and mix, net pricing, and changes in currency exchange, offset partially by unfavorable cost changes. The unfavorable cost changes primarily reflect higher structural costs driven primarily by higher manufacturing costs to support higher volume and product launches.
Item 7. Management's Discussion and Analysis of Financial Condition and Results of Operations (continued)
Ford South America Segment. The charts below detail key metrics and the change in 2010 pre-tax operating profit compared with respect2009 by causal factor.
The increase in wholesales for Ford South America primarily reflects higher industry volume, offset partially by lower market share and the non-recurrence of prior-year increases in dealer stocks. The decrease in market share primarily reflects planned lower production in Venezuela.
The increase in earnings is more than explained by favorable net pricing, changes in currency exchange, and favorable volume and mix, offset partially by unfavorable cost changes (primarily higher commodity and structural costs).
Item 7. Management's Discussion and Analysis of Financial Condition and Results of Operations (continued)
Ford Europe Segment. The charts below detail key metrics and the change in 2010 pre-tax operating profit compared with 2009 by causal factor.
The increase in wholesales for Ford Europe primarily reflects higher wholesales in Turkey, Russia, and other eastern European markets, offset partially by lower wholesales in the 19 markets that we track (primarily lower market share and industry volume, offset partially by the non-recurrence of prior-year reductions in dealer stocks). The decrease in market share reflects our decision to subordinated retained interests, Ford Credit has credit risk. As a result, it evaluates credit losses, receivables, and leverage on a managed basisreduce participation selectively in low-margin business, as well as the end of the favorable effect of government scrappage programs on an on-balance sheet basis. In contrast,our small car sales.
The improvement in results primarily reflects favorable cost changes and higher parts and subsidiary profits, offset partially by unfavorable volume and mix (primarily lower market share offset partially by the non-recurrence of prior-year reductions in dealer stocks). The favorable cost changes primarily reflect material cost reductions and lower warranty costs, offset partially by higher structural costs (in part to support product launches and growth of our product plans).
Item 7. Management's Discussion and Analysis of Financial Condition and Results of Operations (continued)
Ford Asia Pacific Africa Segment. The charts below detail key metrics and the change in 2010 pre-tax operating profit compared with 2009 by causal factor.
The increase in wholesales for Ford Asia Pacific Africa primarily reflects higher industry volume (primarily in China and India), increase in dealer stocks, and higher market share. The increase in market share primarily reflects share gains in India, as well as China, driven by new model introductions.
The improvement in results primarily reflects favorable volume and mix (higher industry volume offset partially by unfavorable mix) and favorable cost changes (material cost reductions and lower freight and warranty costs, offset by higher structural costs to support investment in our product and growth plans).
Item 7. Management's Discussion and Analysis of Financial Condition and Results of Operations (continued)
FINANCIAL SERVICES SECTOR
2011 Compared with 2010
As shown in the total Company discussion above, we present our Financial Services sector results in two segments, Ford Credit does not have the same financial interest in the performance of receivables sold in whole-loan sale transactions, and as a result,Other Financial Services. Ford Credit, generally reviewsin turn, has two segments, North America and International.
Ford Credit
The chart below details the performance of its serviced portfolio only to evaluate the effectiveness of its origination and collection activities. To evaluate the performance of these activities,change in 2011 pre-tax operating profit compared with 2010 by causal factor.
The decline in Ford Credit monitors a number of measures, such as delinquencies, repossession statistics, losses on repossessions,Credit's pre-tax operating profit reflects fewer leases being terminated and the number of bankruptcy filings.related vehicles sold at a gain, and lower credit loss reserve reductions.
Results of Ford Credit's net finance receivablesoperations and net investment in operating leasesunallocated risk management for the years ended December 31 are shown below (in millions):
|
| | | | | | | | | | | |
| | 2011 | | 2010 | | 2011 Over/(Under) 2010 |
| Income/(Loss) before income taxes | | | | | |
| North America segment | $ | 2,159 |
| | $ | 2,785 |
| | $ | (626 | ) |
| International segment | 371 |
| | 354 |
| | 17 |
|
| Unallocated risk management (a) | (126 | ) | | (85 | ) | | (41 | ) |
| Income/(Loss) before income taxes | $ | 2,404 |
| | $ | 3,054 |
| | $ | (650 | ) |
__________
| |
| (a) | Consists of gains and losses related to market valuation adjustments to derivatives primarily related to movements in interest rates. |
The full-year decrease in Ford Credit's North America segment pre-tax earnings is more than explained by fewer leases being terminated and the related vehicles sold at a gain, and lower credit loss reserve reductions. The full-year increase in its International segment pre-tax results is more than explained by foreign currency translation adjustments related to the discontinuation of financing in Australia.
Item 7. Management's Discussion and Analysis of Financial Condition and Results of Operations (continued)
Ford Credit's receivables, including finance receivables and operating leases, at December 31 were as follows (in billions):
| | | | |
| | | | | | | |
Receivables – On-Balance Sheet | | | | | | |
| Finance receivables | | | | | | |
Retail installment | | $ | 56.3 | | | $ | 65.5 | |
| Wholesale | | | 22.4 | | | | 27.7 | |
| Other | | | 2.4 | | | | 2.8 | |
| Unearned interest supplements | | | (1.9 | ) | | | (1.3 | ) |
| Allowance for credit losses | | | (1.3 | ) | | | (1.4 | ) |
| Finance receivables, net | | | 77.9 | | | | 93.3 | |
Net investment in operating leases | | | 14.6 | | | | 22.5 | |
| Total receivables – on-balance sheet (a)(b) | | $ | 92.5 | | | $ | 115.8 | |
| | | | | | | | | |
| Memo: | | | | | | | | |
Total receivables – managed (c) | | $ | 94.5 | | | $ | 117.7 | |
Total receivables – serviced (d) | | | 94.6 | | | | 118.0 | |
|
| | | | | | | | | | | |
| | 2011 | | 2010 | | 2009 |
| Receivables | | | | | |
| Finance receivables - North America Segment | | | | | |
| Consumer | | | | | |
| Retail installment and direct financing leases | $ | 38.4 |
| | $ | 39.1 |
| | $ | 42.3 |
|
| Non-Consumer | |
| | |
| | |
|
| Wholesale | 15.5 |
| | 13.3 |
| | 13.3 |
|
| Dealer Loan and other | 2.1 |
| | 1.9 |
| | 1.9 |
|
| Total North America Segment - finance receivables (a) | 56.0 |
| | 54.3 |
| | 57.5 |
|
| Finance receivables - International Segment | | | | | |
| Consumer | | | | | |
| Retail installment and direct financing leases | 9.1 |
| | 10.6 |
| | 14.0 |
|
| Non-Consumer | | | | | |
| Wholesale | 8.5 |
| | 8.7 |
| | 9.1 |
|
| Dealer Loan and other | 0.4 |
| | 0.4 |
| | 0.5 |
|
| Total International Segment - finance receivables (a) | 18.0 |
| | 19.7 |
| | 23.6 |
|
| Unearned interest supplements | (1.6 | ) | | (1.9 | ) | | (1.9 | ) |
| Allowance for credit losses | (0.5 | ) | | (0.8 | ) | | (1.3 | ) |
| Finance receivables, net | 71.9 |
| | 71.3 |
| | 77.9 |
|
| Net investment in operating leases (a) | 11.1 |
| | 10.0 |
| | 14.6 |
|
| Total receivables (b) | $ | 83.0 |
| | $ | 81.3 |
| | $ | 92.5 |
|
| Memo: | |
| | |
| | |
|
| Total managed receivables (c) | $ | 84.6 |
| | $ | 83.2 |
| | $ | 94.5 |
|
__________
(a) | |
| (a) | At December 31, 20092011 and 2008,2010, includes financeconsumer receivables before allowance for credit losses of $64.4$36 billion and $73.7$35.8 billion, respectively, and non-consumer receivables before allowance for credit losses of $19.8 billion and $18.7 billion, respectively, that have been sold for legal purposes in securitization transactions that do not satisfy the requirements for accounting sale treatment.but continue to be reported in Ford Credit's consolidated financial statements. In addition, at December 31, 20092011 and 2008,2010, includes net investment in operating leases before allowance for credit losses of $10.4$6.4 billion and $15.6$6.2 billion, respectively, that have been included in securitization transactions that do not satisfy the requirements for accounting sale treatment. These underlying securitized assetsbut continue to be reported in Ford Credit's financial statements. The receivables are available only for payment of the debt and other obligations issued or arising in the securitization transactions; they are not available to pay Ford Credit's other obligations or the claims of Ford Credit'sits other creditors. Ford Credit holds the right to the excess cash flows not needed to pay the debt and other obligations issued or arising in each of these securitization transactions.transactions. See Note 18 of the Notes to the Financial statements for more information regarding securitization transactions. |
(b) | |
| (b) | Includes allowance for credit losses of $1.5 billion $534 million and $1.7 billion$854 million at December 31, 20092011 and 2008, respectively.2010, respectively. |
(c) | Includes on-balance sheet receivables, excluding
|
| (c) | Excludes unearned interest supplements related to finance receivables of $1.9 billion and $1.3 billion at December 31, 2009 and 2008, respectively; and includes off-balance sheet retail receivables of about $100 million and about $600 million at December 31, 2009 and 2008, respectively.receivables. |
(d) | Includes managed receivables and receivables sold in whole-loan sale transactions where Ford Credit retains no interest, but which Ford Credit continues to service of about $100 million and about $300 million at December 31, 2009 and 2008, respectively.
|
Receivables at December 31, 2011 increased from year-end 2010, primarily due to higher Ford and Lincoln receivables, partially offset by the discontinuation of financing for Jaguar, Land Rover, Mazda, Volvo, and Mercury and changes in currency exchange rates. At December 31, 2011, Jaguar, Land Rover, Mazda, and Volvo receivables represented about 2% of Ford Credit's managed receivables. In addition, the Mercury financing portfolio represented about 1% of Ford Credit's managed receivables at December 31, 2011. These percentages will decline over time.
ITEMItem 7. Management's Discussion and Analysis of Financial Condition and Results of Operations (continued)
Receivables decreased from year-end 2008, primarily reflecting lower industry volumes, lower dealer stocks, and the transition of Jaguar, Land Rover, and Mazda financing to other finance providers. In 2009, as part of Ford Credit's commitment to support the sale of Ford, Lincoln, and Mercury brand vehicles, Volvo began to transition its financing to other sources. At December 31, 2009, the Jaguar, Land Rover, and Mazda financing portfolio represented 7% of Ford Credit's managed receivables and the Volvo financing portfolio represented 5% of Ford Credit's managed receivables. These percentages will decline over time.
Credit Losses. The following table shows worldwidechart below details annual trends in charge-offs (credit losses, net of recoveries), for Ford Credit for the various categories of financing during the periods indicated. The loss-to-receivables ("LTR") ratios which equal charge-offs on an annualized basis(charge-offs divided by the average amount of receivables outstanding, for the period, excluding the allowance for credit lossesreserve and unearned interest supplements related to finance receivables, are shown below for Ford Credit's on-balance sheetreceivables), credit loss reserve, and managed portfolios.credit loss reserve as a percentage of end-of-period ("EOP") receivables:
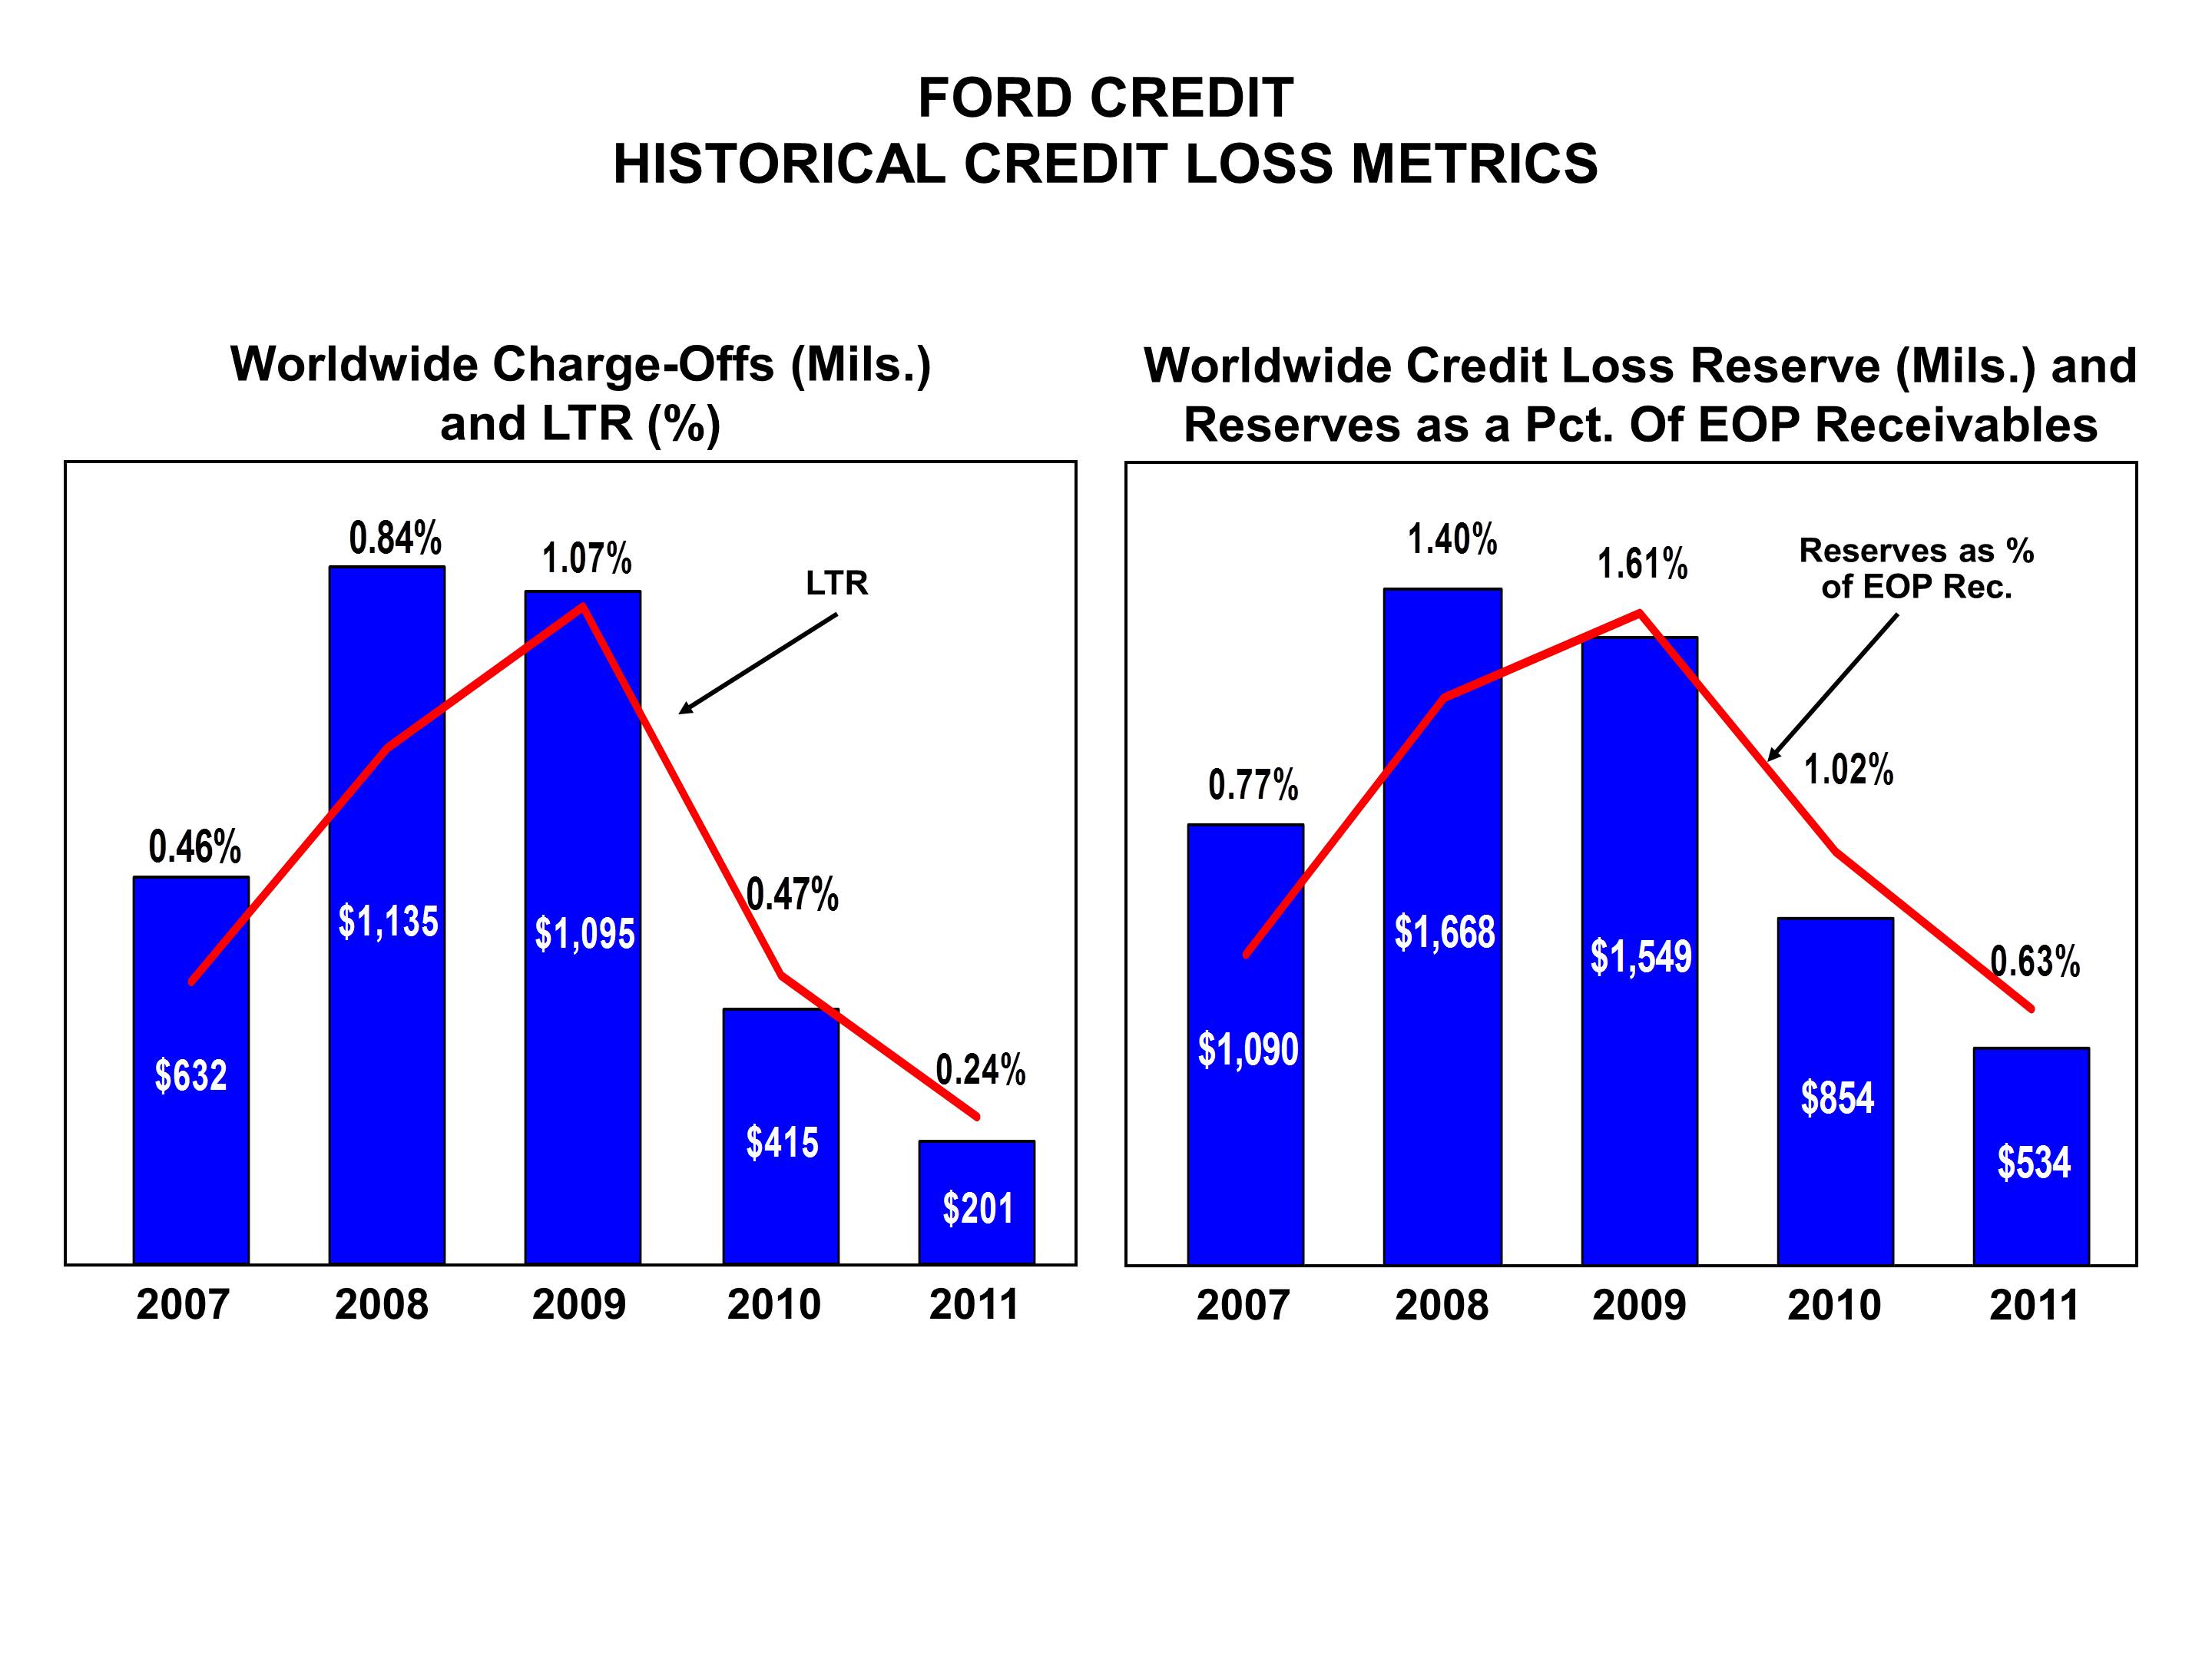
| | | | | | | | | | |
Charge-offs – On-Balance Sheet (in millions) | | | | | | | | | |
Retail installment and lease | | $ | 989 | | | $ | 1,089 | | | $ | (100 | ) |
Wholesale | | | 94 | | | | 29 | | | | 65 | |
Other | | | 12 | | | | 17 | | | | (5 | ) |
| Total charge-offs – on-balance sheet | | $ | 1,095 | | | $ | 1,135 | | | $ | (40 | ) |
| | | | | | | | | | | | | |
Loss-to-Receivables Ratios – On-Balance Sheet | | | | | | | | | | | | |
Retail installment and lease | | | 1.25 | % | | | 1.10 | % | | 0.15pts. | |
Wholesale | | | 0.45 | | | | 0.09 | | | | 0.36 | |
| Total loss-to-receivables ratio (including other) – on-balance sheet | | | 1.07 | % | | | 0.84 | % | | 0.23pts. | |
| | | | | | | | | | | | | |
| Memo: | | | | | | | | | | | | |
| Total charge-offs – managed (in millions) | | $ | 1,100 | | | $ | 1,166 | | | $ | (66 | ) |
Total loss-to-receivables (including other) – managed | | | 1.07 | % | | | 0.84 | % | | 0.23pts. | |
Most of Ford Credit's charge-offs are related to retail installment sale and lease contracts. Charge-offs depend on the number of vehicle repossessions, the unpaid balance outstanding at the time of repossession, the auction price of repossessed vehicles, and other charge-offs. Ford Credit also incurs credit losses on its wholesale loans, but default rates for these receivables historically have been substantiallydown from 2010 levels, primarily reflecting lower than those for retail installment sale and lease contracts.
The decrease in charge-offs from a year ago reflected lower losses in the United States, offset partially by higher losses in Europe. The decrease in charge-offs in the United States reflected lower severity and lower other charge-offs, offset partially by higher repossessions. The increase in charge-offs in Europe primarily reflected higher losses in Spain and Germany. The increase in loss-to-receivables ratios from a year ago primarily reflected a combination of lower average receivables, higher repossessions in the United States and higherlower losses in SpainEurope, offset partially by lower recoveries in the United States. The loss-to-receivables ratio is almost 50% lower than 2010, and Germany.is the lowest Ford Credit has seen in the last decade.
Shown below is an analysis of Ford Credit's allowance for credit lossesReserves and its allowance for credit lossesreserves as a percentage of end-of-periodEOP receivables (finance receivables (excluding unearned interest supplements), and net investmentboth are lower than a year ago, reflecting the decrease in operating leases, excluding the allowance for credit losses) for its on-balance sheet portfolio for the years ended December 31 (dollar amounts in billions):
| Allowance for Credit Losses | | | | | | |
Balance, beginning of year | | $ | 1.7 | | | $ | 1.1 | |
Provision for credit losses | | | 0.9 | | | | 1.8 | |
| Deductions | | | | | | | | |
Charge-offs before recoveries | | | 1.5 | | | | 1.5 | |
Recoveries | | | (0.4 | ) | | | (0.4 | ) |
Net charge-offs | | | 1.1 | | | | 1.1 | |
| Other changes, principally amounts related to translation adjustments and finance receivables sold | | | — | | | | 0.1 | |
Net deductions | | | 1.1 | | | | 1.2 | |
Balance, end of year | | $ | 1.5 | | | $ | 1.7 | |
| Allowance for credit losses as a percentage of end-of-period net receivables | | | 1.61 | % | | | 1.40 | % |
charge-offs. The allowance for credit losses is estimated using a combination of models and management judgment, and is based on such factors as portfolio quality, historical loss performance, and receivable levels. The decrease in Ford Credit's allowance for credit losses primarily reflected the decline in receivables and decrease in charge-offs. At December 31, 2009, Ford Credit's allowance for credit losses included about $215 million, which was based on management's judgment regarding higher retail installment and lease repossession assumptions and higher wholesale and dealer loan default assumptions compared with historical trends used in Ford Credit's models. At December 31, 2008, Ford Credit's allowance for credit losses included about $210 million, which was based on management's judgment regarding higher severity assumptions. The credit quality of Ford Credit's retail and lease originations remains high. For additional discussion, see "Critical Accounting Estimates – Allowance for Credit Losses."
ITEM 7. Management's Discussion and Analysis of Financial Condition and Results of Operations (continued)
In purchasing retail finance and lease contracts, Ford Credit uses a proprietary scoring system that classifies contracts using several factors, such as credit bureau information, credit bureau scores (e.g., FICO score), customer characteristics, and contract characteristics. In addition to Ford Credit's proprietary scoring system, it considers other factors, such as employment history, financial stability, and capacity to pay. As ofAt December 31, 2009, about2011 and 2010, Ford Credit classified between 5% - 6% of theits outstanding U.S. retail finance and lease contracts in Ford Credit's servicedits portfolio were classified as high risk at contract inception, slightly higher than year-end 2008 of about 4%. This increase primarily reflects a lower percentage of lease contracts in Ford Credit's retail portfolio. Lease contracts generally include shorter average terms and higher average FICO scores compared with retail installment sale contracts.inception.
Residual Risk
Risk. Ford Credit is exposed to residual risk on operating leases and similar balloon payment products where the customer may return the financed vehicle to Ford Credit. Residual risk is the possibility that the amount Ford Credit obtains from returned vehicles will be less than its estimate of the expected residual value for the vehicle. Ford Credit estimates the expected residual value by evaluating recent auction values, return volumes for its leased vehicles, industry-wide used vehicle prices, marketing incentive plans, and vehicle quality data. For additional discussion, see "Critical Accounting Estimates –- Accumulated Depreciation on Vehicles Subject to Operating Leases."Leases" below.
North America Retail Operating Lease Experience
Ford Credit uses various statistics to monitor its residual risk:
· | Placement volume measures the number of leases Ford Credit purchases in a given period; |
· | Termination volume measures the number of vehicles for which the lease has ended in the given period; and |
· | Return volume reflects the number of vehicles returned to Ford Credit by customers at lease-end. |
The following table shows operating lease placement, termination, and return volumes for Ford Credit's North America operations, which accounted for about 98% of its total investment in operating leases at December 31, 2009 (in thousands, except for percentages):
| | | | |
| | | | | | | |
Placements | | | 67 | | | | 317 | |
Terminations | | | 386 | | | | 381 | |
Returns | | | 314 | | | | 327 | |
| | | | | | | | | |
| Memo: | | | | | | | | |
Return rates | | | 81 | % | | | 86 | % |
In 2009, placement volumes were down 250,000 units compared with 2008, primarily reflecting changes in our marketing programs that emphasized retail installment sale contracts, lower industry volumes, and the transition of Jaguar Land Rover and Mazda financing to other providers. Termination volumes increased by 5,000 units compared with last year, reflecting higher placement volumes in 2006 and 2007. Return volumes decreased 13,000 units compared with last year, primarily reflecting lower return rates, consistent with improved auction values relative to Ford Credit's expectations of lease-end values at the time of contract purchase.
ITEMItem 7. Management's Discussion and Analysis of Financial Condition and Results of Operations (continued)
Ford Credit's North America segment accounted for 96% of its total operating leases at December 31, 2011. The following table shows operating lease placement, termination, and return volumes for this segment for the years ended December 31 (in thousands, except for percentages):
|
| | | | | | | | |
| | 2011 | | 2010 | | 2009 |
| Placements | 219 |
| | 120 |
| | 67 |
|
| Terminations | 246 |
| | 408 |
| | 386 |
|
| Returns | 144 |
| | 281 |
| | 314 |
|
| | | | | | |
| Memo: | | | | | |
| Return Rates | 59 | % | | 69 | % | | 81 | % |
In 2011, placement volumes were up 99,000 units compared with 2010, primarily reflecting higher industry sales, higher Ford market share, and changes in Ford's marketing programs. Termination volumes decreased by 162,000 units in 2011 compared with 2010, reflecting lower placement volumes in the second half of 2008 and 2009. Return volumes decreased 137,000 units in 2011 compared with 2010, primarily reflecting fewer terminations and lower return rates.
U.S. Ford and Lincoln and Mercury Brand Retail Operating Lease Experience
The following tablechart shows annual return volumes for Ford Credit's Ford, Lincoln, and Mercury brand U.S. operating lease portfolio. Also included are auction values at constant fourth quarter 2009incurred vehicle mix for lease terms comprising 59% ofvehicles returned in the respective periods. Ford Credit's activeU.S. Ford and Lincoln lease share was about 15% in 2011, and Mercury brand U.S.the operating lease portfolio (in thousands, exceptaccounted for percentages):about 85% of its total investment in operating leases at December 31, 2011.
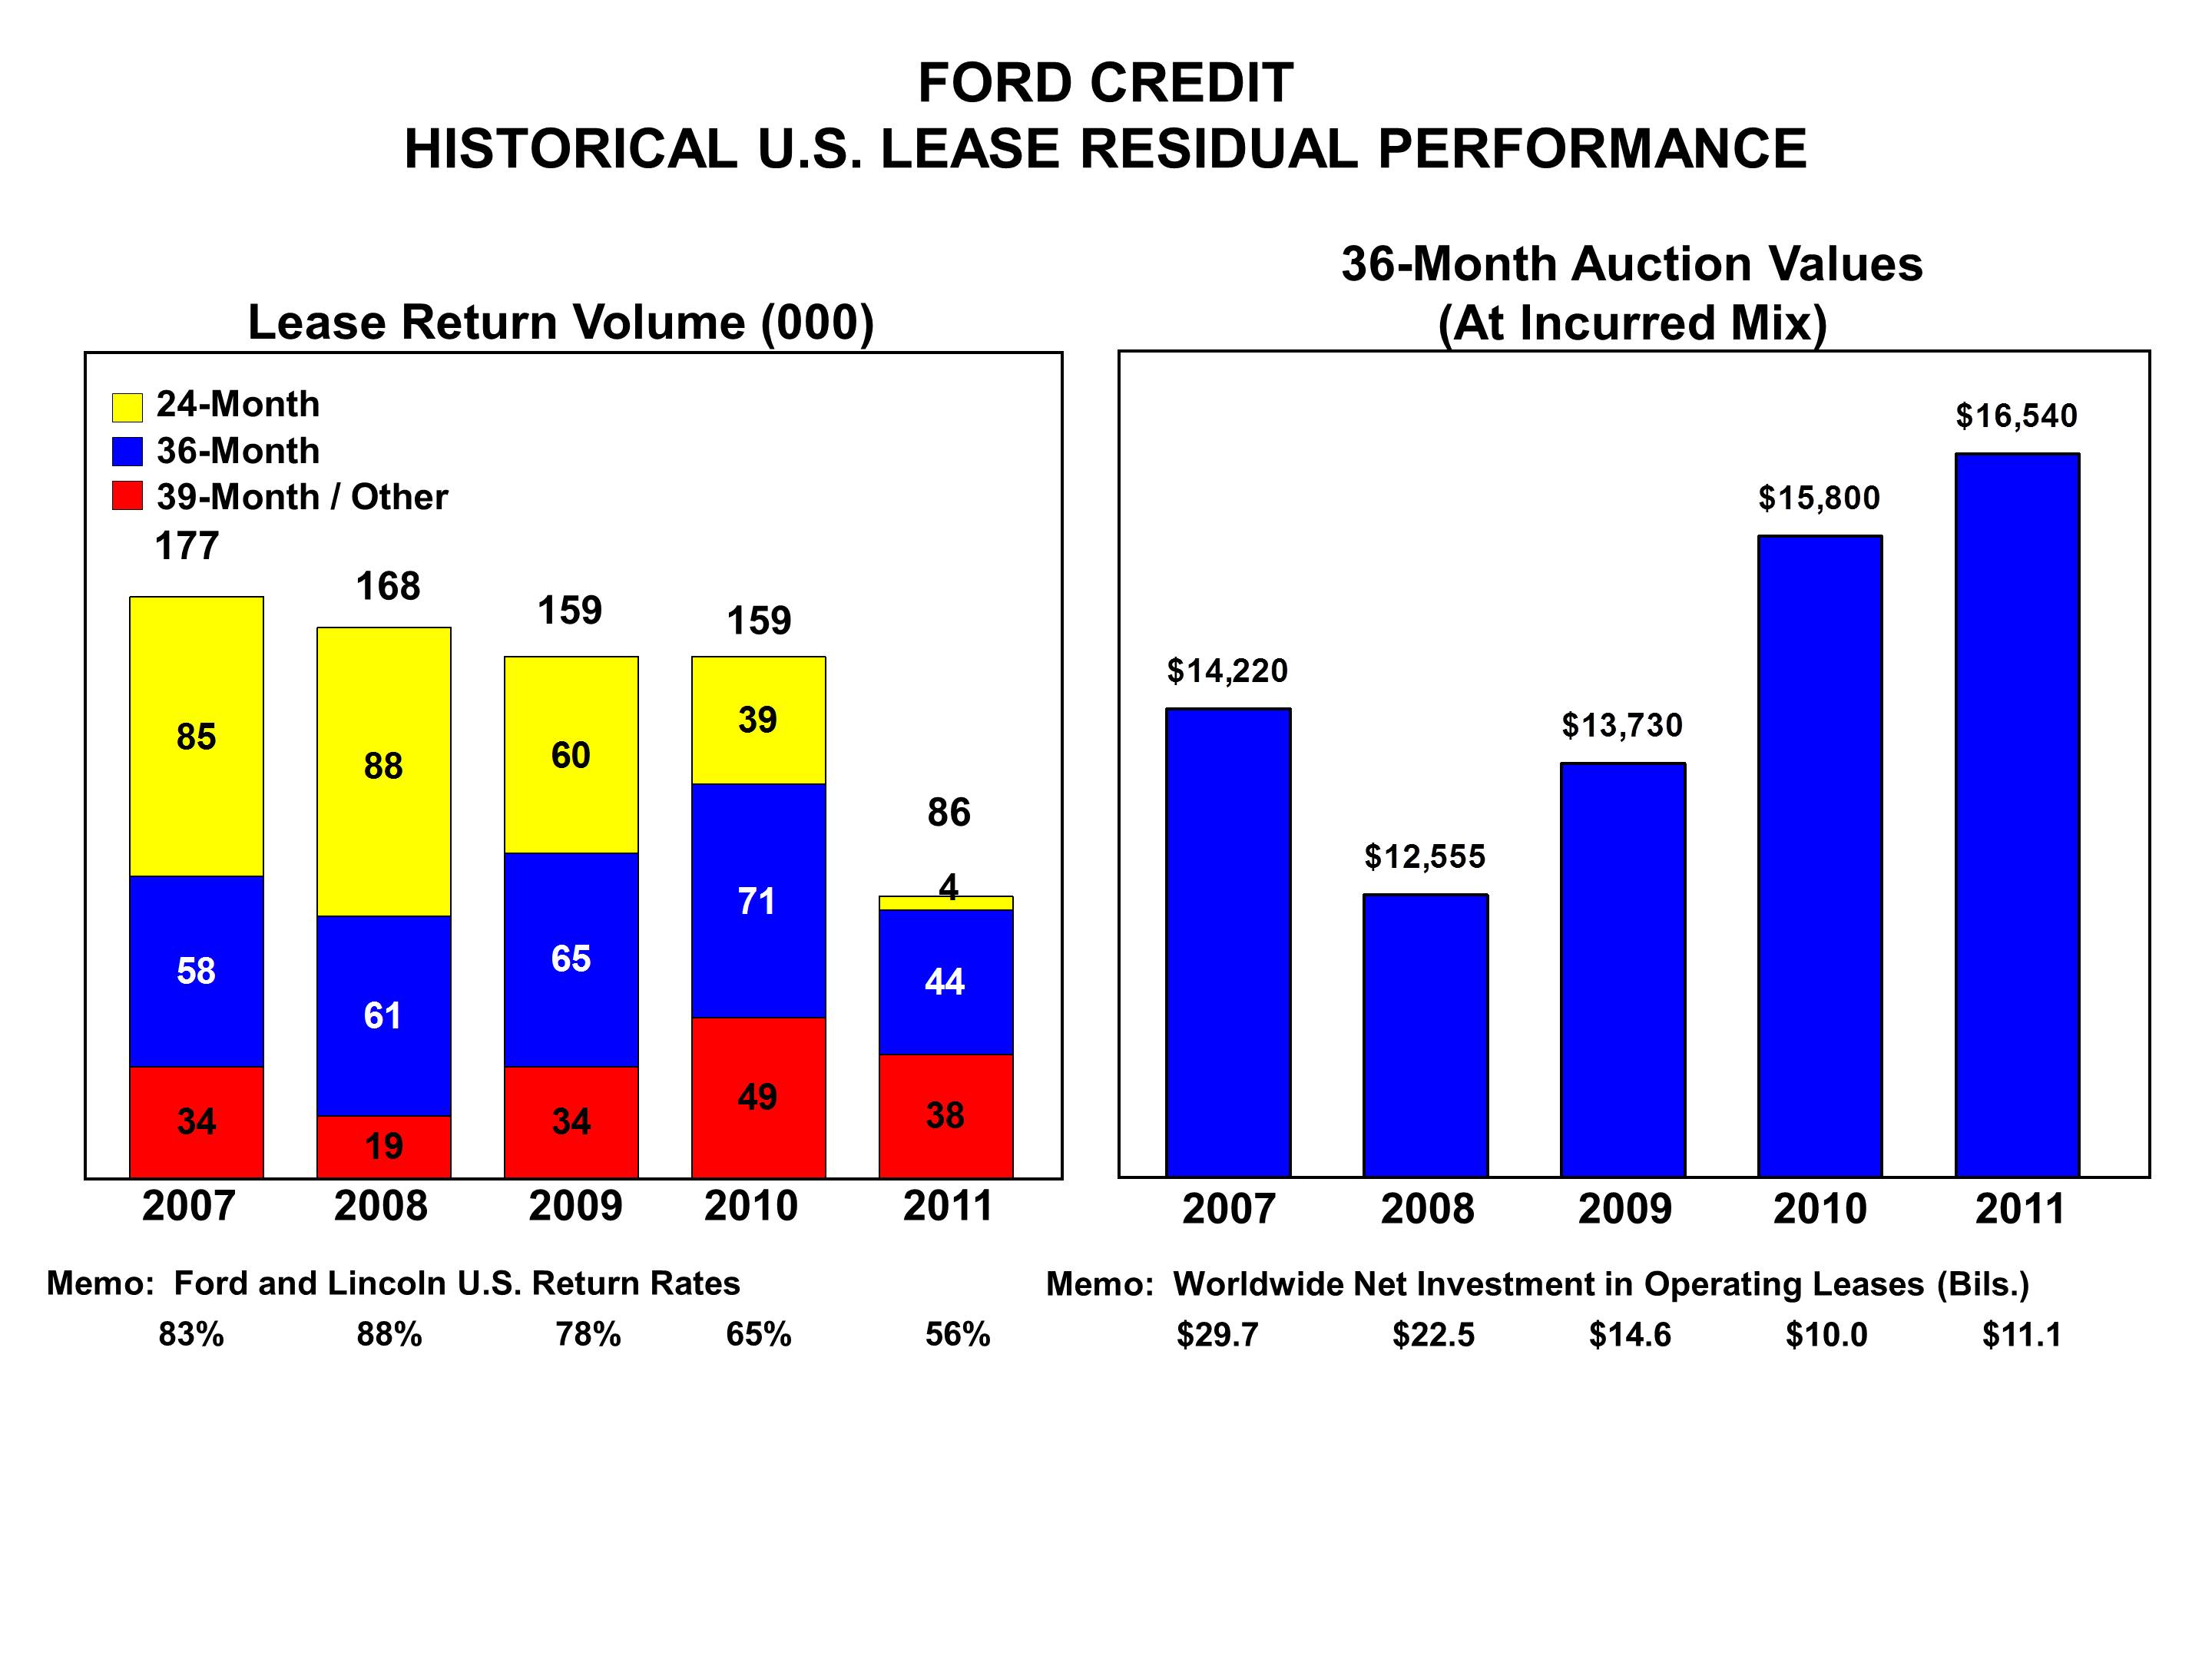
| | | | |
| | | | | | | |
| Returns | | | | | | |
24-Month term | | | 60 | | | | 88 | |
36-Month term | | | 65 | | | | 61 | |
39-Month term | | | 34 | | | | 19 | |
Total returns | | | 159 | | | | 168 | |
| | | | | | | | | |
| Memo: | | | | | | | | |
Return rates | | | 78 | % | | | 88 | % |
| | | | | | | | | |
| Auction Values at Constant Fourth Quarter 2009 Vehicle Mix | | | | | | | | |
24-Month term | | $ | 18,670 | | | $ | 16,310 | |
36-Month term | | | 13,365 | | | | 12,015 | |
In 2009,2011, Ford Lincoln, and Mercury brand U.S. return volumes were down 9,000 units compared with 2008, primarily reflecting a lower return rate, down 10 percentage points to 78%, consistent with improvedCredit's strong auction values relative to Ford Credit's expectations of lease-end values at the time of contract purchase. Auction values at constant fourth quarter 2009 mix were up $2,360for 36-month vehicles continued, increasing by $740 per unit from 2008 levels for vehicles under 24-month2010.
Ford Credit's worldwide net investment in operating leases andwas $11.1 billion at the end of 2011, up $1,350 for vehicles under 36-month leases, primarily reflecting the overall auction value improvementfrom $10 billion in the used vehicle market. Ford Credit expects future auction values to remain volatile.2010.
2008 Compared with 2007
Details of the full-year Financial Services sector Revenues and Income/(Loss) before income taxes for 2008 and 2007 are shown below:
| | | | | | Income/(Loss) Before Income Taxes (in millions) | |
| | | | | | | | | | | | | | | | | | | |
Ford Credit | | $ | 15.7 | | | $ | 16.0 | | | $ | (0.3 | ) | | $ | (2,559 | ) | | $ | 1,215 | | | $ | (3,774 | ) |
Other Financial Services | | | 0.3 | | | | 0.2 | | | | 0.1 | | | | (22 | ) | | | 9 | | | | (31 | ) |
Total | | $ | 16.0 | | | $ | 16.2 | | | $ | (0.2 | ) | | $ | (2,581 | ) | | $ | 1,224 | | | $ | (3,805 | ) |
Ford Credit
The decline in pre-tax results primarily reflected the significant decline in used vehicle auction values during 2008. This decline in auction values contributed to an impairment charge to Ford Credit's North America segment operating lease portfolio ($2.1 billion), a higher provision for credit losses ($1.2 billion), and higher depreciation expense for leased vehicles (about $700 million). Other factors that explain the decrease in pre-tax earnings include lower volume primarily related to lower average receivables (about $300 million), higher net losses related to market valuation adjustments to derivatives (about $200 million), and the non-recurrence of the gain related to the sale of a majority of Ford Credit's interest in AB Volvofinans (about $100 million). These factors were partially offset by higher financing margin primarily attributable to lower borrowing costs (about $200 million), the non-recurrence of costs associated with Ford Credit's North American business transformation initiative (about $200 million), lower expenses primarily reflecting improved operating costs (about $300 million), and a gain related to the sale of approximately half of Ford Credit's ownership interest in its Nordic operation (about $100 million).
ITEMItem 7. Management's Discussion and Analysis of Financial Condition and Results of Operations (continued)
2010 Compared with 2009
The chart below details the change in 2010 pre-tax operating profit compared with 2009 by causal factor.
The full-year increase was explained primarily by a lower provision for credit losses and lower depreciation expense for leased vehicles due to higher auction values; partial offsets included lower volume and other items, primarily reflecting the non-recurrence of net gains related to unhedged currency exposure from cross-border intercompany lending.
LIQUIDITY AND CAPITAL RESOURCES
Automotive Sector
Our industry has been heavily impacted by the global economic crisis that began in 2008, which included a sudden and substantial decline in global industry sales volume. The dramatic decline in industry sales volume, combined with tight credit markets, other economic factors, and the costs associated with transforming our business, put significant pressure on our Automotive liquidity in the first half of 2009. While the economic environment remains uncertain, we believe that our continued focus on delivering on our plan is the right strategy to achieve our objectives. Our Automotive liquidity strategy includes ensuring that we have sufficient fundingliquidity available with a high degree of certainty throughout the business cycle, with by generating cash from operations and maintaining access to other sources of funding. For a discussion of risks to our liquidity, see "Item 1A. Risk Factors," as well as Note 30 of the goal of improvingNotes to the Financial Statements regarding commitments and contingencies that could impact our core Automotive operations so that they generate positive operating-related cash flow.liquidity.
Gross Cash. Automotive gross cash includes cash and cash equivalents netand marketable securities, and loaned securities. Prior to 2008, we included in Automotive gross cash those assets contained in a VEBA trust which may be used to pre-fund certain typesnet of company-paid benefits for U.S. employees and retirees, that were invested in shorter-duration fixed income investments and could be used within 18 months to pay for benefits ("short-term VEBA assets"). Consistent with our Retiree Health Care Settlement Agreement dated March 28, 2008, in 2008 we reclassified out of our Automotive gross cash calculation the short-term VEBA assets and TAA securities.any securities-in-transit. Gross cash is detailed belowat December 31 was as of the dates shownfollows (in billions):
| | | | | | | | | | | | |
| | | | | | | | | | | | | | 2011 | | 2010 | | 2009 | |
Cash and cash equivalents | | $ | 10.3 | | | $ | 6.4 | | | $ | 20.7 | | | $ | 16.0 | | $ | 7.9 |
| | $ | 6.3 |
| | $ | 9.7 |
| |
Marketable securities (a) | | | 15.2 | | | | 9.3 | | | | 2.0 | | | | 11.3 | | 15.0 |
| | 14.2 |
| | 15.2 |
| |
Loaned securities | | | — | | | | — | | | | 10.3 | | | | 5.3 | | |
Total cash, marketable securities and loaned securities | | | 25.5 | | | | 15.7 | | | | 33.0 | | | | 32.6 | | 22.9 |
| | 20.5 |
| | 24.9 |
| |
Securities-in-transit (b) | | | — | | | | — | | | | (0.3 | ) | | | (0.5 | ) | — |
| | — |
| | — |
| |
UAW-Ford TAA/Other (c) | | | — | | | | (2.3 | ) | | | — | | | | — | | |
Short-term VEBA assets | | | — | | | | — | | | | 1.9 | | | | 1.8 | | |
Gross cash (d) | | $ | 25.5 | | | $ | 13.4 | | | $ | 34.6 | | | $ | 33.9 | | |
| Gross cash | | $ | 22.9 |
| | $ | 20.5 |
| | $ | 24.9 |
| |
__________
| |
| (a) | Included in 2009 and 2008at December 31, 2011 are Ford Credit debt securities that we purchased, which are reflected in the table at a carrying value of $646$201 million, and $492 million, respectively; the estimated fair value of these securitieswhich is $656 million and $437 million, respectively.$201 million. Also included are Mazda marketable securities with a fair value of $447 million and $322 million at December 31, 2009 and 2008, respectively.$110 million. For similar datapoints for the other periods listed here, see our prior-period financial reports. |
| |
| (b) | The purchase or sale of marketable securities for which the cash settlement was not made by period-end and for which there was a payable or receivable recorded on the balance sheet at period-end. |
(c) | Amount transferred to UAW-Ford TAA that, due to consolidation, was shown in Cash, marketable securities and loaned securities.
|
(d) | Pursuant to the Retiree Health Care Settlement Agreement (see Note 18 of the Notes to the Financial Statements), in January 2008 we contributed $4.6 billion of assets and reduced our Automotive gross cash accordingly. |
Our cash, cash equivalents, and marketable securities are held primarily in highly liquid investments, which provide for anticipated and unanticipated cash needs. Our cash, cash equivalents, and marketable securities primarily include U.S. Treasury obligations, federal agency securities, bank time deposits with investment-grade institutions, corporate investment-grade securities, A-1/P-1 (or higher) rated commercial paper, and debt obligations of a select group of
non-U.S. governments, non-U.S. governmental agencies, and supranational institutions. Within our Automotive gross cash portfolio, we currently do not hold investments in government obligations of Greece, Ireland, Italy, Portugal, or Spain, nor did we hold any at December 31, 2011.
Item 7. Management's Discussion and Analysis of Financial Condition and Results of Operations (continued)
The average maturity of these investments ranges from 90 days to up to one year and is adjusted based on market conditions and liquidity needs. We monitor our cash levels and average maturity on a daily basis.
In managing our business, we classify changes in Automotive gross cash into two categories: operating-related and other items (which includes the impact of certain special items, contributions to funded pension plans, the net effect of the change in the TAA and VEBA on gross cash, certain tax-related transactions, acquisitions and divestitures, capital transactions with the Financial Services sector, dividends paid to shareholders, and other –- primarily financing-related). Our key liquidity metrics are operating-related cash flow which(which best represents the ability of our Automotive operations to generate cash), Automotive gross cash, and Automotive gross cash. liquidity. These items at December 31 were as follows (in billions):
|
| | | | | | | |
| | 2011 | | 2010 |
| Gross cash | $ | 22.9 |
| | $ | 20.5 |
|
| Available credit lines: | |
| | |
|
| Secured credit facility, unutilized portion | 8.8 |
| | 6.9 |
|
| Local lines available to foreign affiliates, unutilized portion | 0.7 |
| | 0.5 |
|
| Automotive liquidity | $ | 32.4 |
| | $ | 27.9 |
|
We believe the cash flow analysis reflected in the table below is useful to investors because it includes in operating-related cash flow elements that we consider to be related to our Automotive operating activities (e.g., capital spending) and excludes cash flow elements that we do not consider to be related to the ability of our operations to generate cash. This differs from a cash flow statement presented in accordance with U.S. GAAPgenerally accepted accounting principles in the United States ("GAAP") and differs from Cash flows fromNetcash (used in)/provided by operating activities of continuing operations, the most directly comparable U.S. GAAP financial measure.
ITEM 7. Management's Discussion and Analysis of Financial Condition and Results of Operations (continued)
Changes in Automotive gross cash are summarized below (in billions):
| | | | | | | | | | |
Gross cash at end of period | | $ | 25.5 | | | $ | 13.4 | | | $ | 34.6 | |
Gross cash at beginning of period | | | 13.4 | | | | 34.6 | | | | 33.9 | |
Total change in gross cash | | $ | 12.1 | | | $ | (21.2 | ) | | $ | 0.7 | |
| | | | | | | | | | | | | |
| Operating-related cash flows | | | | | | | | | | | | |
Automotive income/(loss) before income taxes (excluding special items) | | $ | (1.4 | ) | | $ | (6.4 | ) | | $ | (1.2 | ) |
Capital expenditures | | | (4.5 | ) | | | (6.5 | ) | | | (6.0 | ) |
Depreciation and special tools amortization | | | 4.6 | | | | 5.5 | | | | 6.8 | |
Changes in receivables, inventory and trade payables | | | 4.3 | | | | (2.9 | ) | | | (0.7 | ) |
Other (b) | | | (1.3 | ) | | | (6.3 | ) | | | 1.5 | |
Subtotal | | | 1.7 | | | | (16.6 | ) | | | 0.4 | |
Up-front subvention payments to Ford Credit | | | (2.0 | ) | | | (2.9 | ) | | | — | |
Total operating-related cash flows | | | (0.3 | ) | | | (19.5 | ) | | | 0.4 | |
| | | | | | | | | | | | | |
| Other changes in gross cash | | | | | | | | | | | | |
| Cash impact of personnel-reduction programs and Job Security Benefits/ Transition Assistance Plan accrual | | | (0.7 | ) | | | (0.7 | ) | | | (2.5 | ) |
Contributions to funded pension plans | | | (0.9 | ) | | | (1.0 | ) | | | (1.6 | ) |
Net effect of TAA/VEBA on gross cash | | | (0.8 | ) | | | (4.6 | ) | | | 1.2 | |
Capital transactions with Financial Services sector (c) | | | 0.4 | | | | — | | | | — | |
Tax Payments, tax refunds, and tax receipts from affiliates | | | 0.6 | | | | 2.2 | | | | 2.6 | |
Acquisitions and divestitures | | | (0.1 | ) | | | 2.5 | | | | 1.1 | |
Dividends to shareholders | | | — | | | | — | | | | — | |
Net proceeds from/(Payments on) Automotive sector debt | | | 11.7 | | | | (0.5 | ) | | | (0.6 | ) |
Equity issuances, net | | | 2.4 | | | | — | | | | — | |
Other | | | (0.2 | ) | | | 0.4 | | | | 0.1 | |
Total change in gross cash | | $ | 12.1 | | | $ | (21.2 | ) | | $ | 0.7 | |
|
| | | | | | | | | | | |
| | 2011 | | 2010 (a) | | 2009 |
| Gross cash at end of period | $ | 22.9 |
| | $ | 20.5 |
| | $ | 24.9 |
|
| Gross cash at beginning of period | 20.5 |
| | 24.9 |
| | 13.1 |
|
| Total change in gross cash | $ | 2.4 |
| | $ | (4.4 | ) | | $ | 11.8 |
|
| |
|
| |
|
| |
|
|
| Automotive income/(loss) before income taxes (excluding special items) | $ | 6.3 |
| | $ | 5.3 |
| | $ | (1.9 | ) |
| Capital expenditures | (4.3 | ) | | (3.9 | ) | | (4.0 | ) |
| Depreciation and special tools amortization | 3.6 |
| | 3.8 |
| | 4.2 |
|
| Changes in working capital (b) | 0.3 |
| | (0.1 | ) | | 3.7 |
|
| Other/timing differences (c) | — |
| | 0.2 |
| | (0.8 | ) |
| Subvention payments to Ford Credit (d) | (0.3 | ) | | (0.9 | ) | | (2.0 | ) |
| Total operating-related cash flows | 5.6 |
| | 4.4 |
| | (0.8 | ) |
| |
|
| |
|
| |
|
|
| Cash impact of personnel-reduction programs accrual | (0.3 | ) | | (0.2 | ) | | (0.7 | ) |
| Net receipts from Financial Services sector (e) | 4.2 |
| | 2.7 |
| | 1.0 |
|
| Other | (0.2 | ) | | (0.8 | ) | | (1.1 | ) |
| Cash flow before other actions | 9.3 |
| | 6.1 |
| | (1.6 | ) |
| |
|
| |
|
| |
|
|
| Net proceeds from/(Payments on) Automotive sector debt | (6.0 | ) | | (12.1 | ) | | 11.9 |
|
| Contributions to funded pension plans | (1.1 | ) | | (1.0 | ) | | (0.9 | ) |
| Proceeds from the sale of Volvo/Other | 0.2 |
| | 2.6 |
| | 2.4 |
|
| Total change in gross cash | $ | 2.4 |
| | $ | (4.4 | ) | | $ | 11.8 |
|
__________
| |
| (a) | Excluding sale proceeds, total change in Automotive grossExcept as noted, Volvo's 2010 cash attributable to Jaguar Land Rover operations was $300 million net cash outflow for 2008. Except for up-front subvention payments to Ford Credit, Jaguar Land Rover cash outflowsflows are excluded from each line item of this table and included in Other within "OtherOther. |
| |
| (b) | Working capital comprised of changes in gross cash."receivables, inventory and trade payables. |
| |
(b)(c) | Primarily expense and payment timing differences for items such as pension and OPEB, compensation, marketing, and warranty, as well as additional factors, such as the impact of tax payments. |
(c) | |
| (d) | Beginning in 2008, Ford began paying all interest-rate subvention and residual value support to Ford Credit at the time of origination of new contracts. Cash flows represented here reflect Ford's monthly support payments on contracts existing prior to 2008. |
| |
| (e) | Primarily distributions and tax payments received from Ford Credit, excluding proceeds from Financial Services sector divestitures paid to the Automotive sector.Credit. |
With respect to "Changes in working capital," in general we carry relatively low trade receivables compared to our trade payables because the majority of our Automotive wholesales are financed (primarily by Ford Credit) immediately upon sale of vehicles to dealers, which generally occurs at the time the vehicles are gate-released shortly after being produced. In addition, our inventories are lean because we build to order, not for inventory. In contrast, our Automotive
Item 7. Management's Discussion and Analysis of Financial Condition and Results of Operations (continued)
trade payables are based primarily on industry-standard production supplier payment terms generally ranging between 30 to 45 days. As a result, our cash flow tends to improve as wholesale volumes increase, but can deteriorate significantly when wholesale volumes drop sharply. In addition, these working capital balances generally are subject to seasonal changes that can impact cash flow. For example, we typically experience cash flow timing differences associated with inventories and payables due to our annual summer and December shutdown periods, when production, and therefore inventories and wholesale volumes, are usually at their lowest levels, while payables continue to come due and be paid. The net impact of this typically results in cash outflows from changes in our working capital balances during these shutdown periods.
Shown below is a reconciliation between financial statement Cash flows fromNet cash (used in)/provided by operating activities of continuing operations and operating-related cash flows (calculated as shown in the table above), for the last three years (in billions):
| | | | | | | | | | | |
Cash flows from operating activities of continuing operations (b) | | $ | 4.1 | | | $ | (12.4 | ) | | $ | 8.7 | | |
| | | | 2011 | | 2010 (a) | | 2009 |
| Net cash (used in)/provided by operating activities (b) (c) | | $ | 9.4 |
| | $ | 6.4 |
| | $ | 2.9 |
|
| Items included in operating-related cash flows | | | | | | | | | | | | | |
| | | | |
|
Capital expenditures | | | (4.5 | ) | | | (6.5 | ) | | | (6.0 | ) | (4.3 | ) | | (3.9 | ) | | (4.0 | ) |
Net transactions between Automotive and Financial Services sectors (c) | | | (0.8 | ) | | | (0.8 | ) | | | (0.3 | ) | |
| Proceeds from the exercise of stock options | | 0.1 |
| | 0.3 |
| | — |
|
Net cash flows from non-designated derivatives | | | (0.1 | ) | | | 1.2 | | | | 1.1 | | 0.1 |
| | (0.2 | ) | | (0.1 | ) |
| Items not included in operating-related cash flows | | | | | | | | | | | | | |
| | |
| | |
|
| Cash impact of personnel-reduction programs and Job Security Benefits/ Transition Assistance Plan accrual | | | 0.7 | | | | 0.7 | | | | 2.5 | | |
Net (sales)/purchases of trading securities | | | — | | | | — | | | | (4.5 | ) | |
| Cash impact of Job Security Benefits and personnel-reduction actions | | 0.3 |
| | 0.2 |
| | 0.7 |
|
Contributions to funded pension plans | | | 0.9 | | | | 1.0 | | | | 1.6 | | 1.1 |
| | 1.0 |
| | 0.9 |
|
VEBA cash flows (reimbursement for benefits paid) | | | — | | | | — | | | | (1.1 | ) | |
Tax refunds, tax payments, and tax receipts from affiliates | | | (0.6 | ) | | | (2.2 | ) | | | (2.6 | ) | (1.4 | ) | | (0.2 | ) | | (0.6 | ) |
Other (b) | | | — | | | | (0.5 | ) | | | 1.0 | | 0.3 |
| | 0.8 |
| | (0.6 | ) |
Operating-related cash flows | | $ | (0.3 | ) | | $ | (19.5 | ) | | $ | 0.4 | | $ | 5.6 |
| | $ | 4.4 |
| | $ | (0.8 | ) |
__________
| |
| (a) | Except as noted (see footnote (b) below), 20082010 data exclude Jaguar Land Rover; 2007 includes Jaguar Land Rover.Volvo. |
| |
| (b) | Includes Jaguar Land Rover.2010 includes Volvo. |
| |
| (c) | Primarily 2009 and 2010 are adjusted to reflect the reallocation of amounts previously displayed in "Net change in intersector receivables/payables and receivables betweenother liabilities" on our sector statement of cash flows. These amounts were reallocated from a single line item to the Automotiveindividual cash flow line items within operating, investing, and Financial Services sectors in the normal coursefinancing activities of business. For example, vehicle wholesale loans that are made by Ford Credit to Ford-owned dealers.continuing operations on our sector statement of cash flows. |
ITEM 7. Management's Discussion and Analysis of Financial Condition and Results of Operations (continued)
Equity and Equity-Linked Issuances. On May 18, 2009, we issued 345 million shares of Ford Common Stock pursuant to a public offering at a price of $4.75 per share, resulting in net proceeds totaling $1.59 billion.
In August 2009, pursuant to an equity distribution agreement with a certain broker-dealer, we issued from time to time in market transactions 71.6 million shares of Ford Common Stock for an aggregate price of $565 million, and used the proceeds to purchase $556 million principal amount of outstanding Ford Credit debt securities maturing prior to 2011, and pay related accrued interest of $9 million. Pending their maturity, the Ford Credit debt securities are reflected in Automotive gross cash and, when the debt securities mature, their par value will be paid in cash by Ford Credit. For additional detail, see Note 1 of the Notes to the Financial Statements.
In November 2009, we issued $2.875 billion principal amount of 4.25% Senior Convertible Notes due November 15, 2016 ("2016 Convertible Notes") in a public offering, resulting in net proceeds totaling $2.81 billion. These notes are convertible, under certain circumstances, into Ford Common Stock at a conversion price of approximately $9.30 per share. Upon conversion, we will have the right to deliver, in lieu of shares of Ford Common Stock, cash or a combination of cash and Common Stock.Agreement. At December 31, 2009 the carrying value of the debt was $2.2 billion (which excludes the equity component of the convertible feature of this note valued at $704 million), reflecting the fair value of the debt obligation at date of issuance.
On December 4, 2009, we entered into another equity distribution agreement with certain broker-dealers pursuant to which we would offer and sell shares of Ford Common Stock from time to time for an aggregate offering price of up to $1 billion. Sales of Ford Common Stock under this equity distribution agreement are expected to be made over a several-month period by means of ordinary brokers' transactions on the New York Stock Exchange at market prices or as otherwise agreed. Through December 31, 2009 and February 15, 2010, we issued 9.8 million and 41.9 million shares of Ford Common Stock for an aggregate price of $97 million and $470 million, respectively, resulting in net proceeds of $96 million and $466 million, respectively, which will be used for general corporate purposes.
Secured Credit Agreement. Due to concerns about instability in the capital markets and the uncertain state of the global economy, on February 3, 2009, we borrowed $10.1 billion2011, commitments under the revolving credit facility of theour Credit Agreement to ensure access to these funds. As expected,totaled $8.9 billion, which includes an increase of $1.7 billion of commitments we obtained in the $890 million commitmentfirst quarter of Lehman Commercial Paper Inc. ("LCPI"), one2011. The $8.9 billion of the lenders under the facility, was not funded because LCPI filed for protection under Chapter 11 of the U.S. Bankruptcy Code on October 5, 2008. LCPI subsequently assigned $110 million of its revolving commitment to other lenders, and $89 million of these assignee lenders' revolving commitments were funded in the third quarter of 2009. On July 10, 2009, we terminated the remaining LCPI commitment of $780 million. We also received an additional $10 million under the revolving credit facility in the third quarter of 2009 for amounts previously committed but not yet received.
As disclosed in our Current Report on Form 8-K dated November 24, 2009, on that date we entered into the Fourth Amendment to the Credit Agreement. Prior to the Fourth Amendment, revolving lenders held commitments totaling $10.7 billion that matured on December 15, 2011. As a result of the Fourth Amendment, lenders now have commitments totaling $7.2 billion in a new revolving facility that maturesterminate on November 30, 2013 and such lenders converted $724 million of their previously existing revolving loans to a new term loan that matures on December 15, 2013. The new term loan has the same pricing, maturity, and other terms as the existing term loan, but is not subject to mandatory prepayments as is the existing term loan. Those lenders who agreed to extend the maturity of their revolving commitments had the option to reduce their commitments by up to 25%, and received a 1 percentage point increaseDuring 2011, we prepaid in interest rate margins, an increase in quarterly fees, and payment of an upfront fee.
Pursuant to these arrangements, on December 3, 2009, $2.3 billion of the revolving loan was repaid to effect the commitment reductions elected by extending lenders and certain other extending lenders increased their revolving loan commitments by, and funded, an aggregate of $400 million, thereby resulting in a net cash repayment by us of $1.9 billion. Lenders with revolving commitments totaling $886 million elected not to extend those commitments, which will mature on the original maturity date of December 15, 2011.
At December 31, 2009, the revolving credit facility of the Credit Agreement totaled $8.1 billion, of which (i) $7.9 billion was utilized (including $418 million to support letters of credit), (ii) $7.2 billion matures on November 30, 2013 and (iii) $886 million matures on December 15, 2011. Also on December 31, 2009,full the term loans outstanding under the Credit Agreement totaled $5.3 billion.and $821 million of 2011 revolving commitments terminated as scheduled on December 15, 2011. At December 31, 2011, the utilized portion of the $8.9 billion of 2013 revolving commitments was $131 million, representing amounts utilized as letters of credit. None of the lenders under our Credit Agreement is a financial institution based in Greece, Ireland, Italy, Portugal, or Spain.
The borrowings of the Company, the subsidiary borrowers, and the guarantors under the Credit Agreement are secured by a substantial portion of our domestic Automotive assets (excluding cash). The collateral includes a majority of our principal domestic manufacturing facilities, excluding facilities to be closed, subject to limitations set forth in existing public indentures and other unsecured credit agreements; domestic accounts receivable; domestic inventory; up to $4 billion of marketable securities or cash proceeds therefrom; 100% of the stock of our principal domestic subsidiaries, including Ford Credit (but excluding the assets of Ford Credit); certain intercompany notes of Volvo Holding Company Inc. (a holding company for Volvo), and Ford Motor Company of Canada, Limited;Limited intercompany notes (limited to its total tangible assets); 66% to 100% of the stock of all major first tier foreign subsidiaries (including Volvo);non-U.S. subsidiaries; and certain domestic intellectual property, including trademarks. Under the terms of the Credit Agreement, the collateral automatically will be released when our unsecured, long-term debt is rated investment grade by any two of Fitch, Moody's and S&P (as defined below under "Credit Ratings") (the "Collateral Release Date").
ITEM 7. Management's Discussion and Analysis of Financial Condition and Results of Operations (continued)
The Credit Agreement requires ongoing compliance with a borrowing base covenant until the Collateral Release Date and contains other restrictive covenants, including a restrictionlimitations on our ability to pay dividends. The Credit Agreement prohibits the paymentamount of cash dividends (other than dividends payable solely in stock) on Ford Common and Class B Stock, subject to certain limited exceptions.we can pay. In addition, the Credit Agreement contains a liquidity covenant requiring us to maintain a minimum of $4 billion in the aggregate of domestic cash, cash equivalents, loaned and marketable securities, and short-term VEBA assets and/or availability under the revolving credit facility.
With respect to the borrowing base covenant, we are required to limit the outstanding amount of debt under the Credit Agreement as well as certain permitted additional indebtedness secured by the collateral described above such that the total debt outstanding does not exceed the value of the collateral as calculated in accordance with the Credit Agreement (the "Borrowing Base value").
Item 7. Management's Discussion and Analysis of Financial Condition and Results of Operations (continued)
The following table provides detail of Borrowing Base values for various categories of collateral (in millions, except percentages):
| | | | | | | | | | | |
U.S. receivables | | $ | 491 | | | | 75 | % | | $ | 368 | | |
U.S. inventory | | | 1,935 | | | | 60 | % | | | 1,161 | | |
Pledge of intercompany notes | | | 4,713 | | | | N/A | | | | 3,073 | | |
| Pledge of equity in Ford Credit and certain foreign subsidiaries (net of intercompany transactions) | | | 18,872 | | | | 75 | % | | | 14,155 | | |
| | | | Eligible Value (a) | | Advance Rate | | Borrowing Base |
| U.S. receivables | | $ | 900 |
| | 75 | % | | $ | 675 |
|
| U.S. inventory | | 1,894 |
| | 60 | % | | 1,136 |
|
Pledge of Ford Motor Company of Canada, Limited intercompany notes (limited to its total tangible assets) | | 294 |
| | 100 | % | | 294 |
|
Pledge of equity in Ford Credit and certain non-U.S. subsidiaries (net of intercompany transactions) | | 18,180 |
| | 75 | % | | 13,635 |
|
U.S. property, plant, and equipment subject to indenture limitation | | | 4,539 | | | | N/A | | | | 2,181 | | 3,821 |
| | 48 | % | | 1,836 |
|
Other U.S. machinery and equipment | | | 2,813 | | | | 40 | % | | | 1,125 | | 2,595 |
| | 40 | % | | 1,038 |
|
Intellectual property and U.S. trademarks (b) | | | 7,900 | | | | N/A | | | | 2,500 | | 7,900 |
| | 32 | % | | 2,500 |
|
| | | | | | | | | | | | | | |
Eligible value/borrowing base | | $ | 41,263 | | | | | | | $ | 24,563 | | $ | 35,584 |
| | | | $ | 21,114 |
|
__________
|
| |
| (a) | Based on formulas set forth in the Credit Agreement, and not necessarily indicative of fair market value (which could be materially higher or lower); receivables, inventory, intercompany notes,notes, and property, plant and equipment reflect net book value at December 31, 2009;2011; equity of Ford Credit is based on its book value at December 31, 2009,2011, net of certain intercompany transactions, and equity in other subsidiaries is based on a multiple of theirtheir two-year average EBITDAearnings before interest, taxes, depreciation, and amortization ("EBITDA") less debt. For these purposes, EBITDA is defined as statutorily-reported consolidated operating income plus depreciation and amortization. |
| (b) | Value reflects independent third partythird-party valuation of trademarks. |
As of December 31, 2009,2011, the Borrowing Base value and the total outstanding amount of debt and letters of credit secured by collateral were $24,563$21,114 million and $13,206$131 million, respectively, compared with $23,183$22,141 million and $7,354$5,298 million, respectively, at December 31, 2008.2010. This resulted in a collateral coverage ratio of 1.86161.18 to 1 at December 31, 2009,2011, compared with a collateral coverage ratio of 3.154.18 to 1 at December 31, 2008.2010. The Borrowing Base value increased by $1.3 billion overborrowing base covenant requires a collateral coverage ratio of at least 1 to 1 assuming the corresponding value at December 31, 2008, more than explained by improved equity in Ford Credit and the inclusion of Ford Brasil Ltda. The debt secured by collateral increased by about $6 billion from the amount of debt secured at December 31, 2008, reflecting the (i) $10.1 billion revolving loan advanced to us on February 3, 2009, (ii) repurchase in March 2009 of $2.2 billion principal amount of term loans and (iii) repayment in December 2009 of $1.9 billion principal amount of revolving loans made in connection with the amendment and extension described above.credit facility is fully drawn. On a basis that assumes the revolving loan facility is fully drawn, the collateral coverage ratio at December 31, 2009 (1.842011 (2.38 to 1) increased from that at December 31, 2008 (1.332010 (1.82 to 1)., reflecting prepayment in full of the term loans and termination of the 2011 revolving commitments.
In addition to customary payment, representation, bankruptcy, and judgment defaults, the Credit Agreement contains cross-payment and cross-acceleration defaults with respect to other debt for borrowed money, and a change in control default.change-in-control default provision.
ITEM 7. Management's DiscussionWe are in the process of seeking to extend the termination date of the revolving credit facility under our Credit Agreement from November 30, 2013 to November 30, 2015, and Analysis of Financial Condition and Results of Operations (continued)
Other Automotiveto make certain other modifications to the Credit Facilities.* At December 31, 2009, we had $628 million of other contractually-committed Automotive credit facilities with financial institutions, including $25 million of worldwide Automotive unsecured credit facilities and $603 million of local credit facilities to foreign Automotive affiliates. Of the $628 million of contractually-committed, $130 million has been utilized. Of the $498 million available for use, $60 million expire in 2010, $65 million expire in 2013, and $373 million expire in 2014.Agreement.
U.S. Department of Energy ("DOE") Advanced Technology Vehicle Manufacturer ("ATVM") Incentive Program. We submitted to the DOE an application dated November 18, 2008 for term loans totaling $11.4 billion pursuant to the DOE's ATVM Program. Our application, which was deemed substantially complete on December 16, 2008, related to ATVM Program expenditures approved by the DOE to be made by us extending beyond 2011. By mutual agreement, our application was amended and restated on June 12, 2009 (as so amended and restated, the "Application") to request, initially, term loans totaling $5.9 billion to fund up to 80% of the ATVM Program expenditures approved through mid-2012. The ATVM Program was authorized by section 136 of the Energy Independence and Security Act of 2007, as amended from time to time, to provide up to $25 billion of loans to automobile and automobile part manufacturers for the cost of re-equipping, expanding, or establishing manufacturing facilities in the United States to produce advanced technology vehicles or qualified components, and for associated engineering integration costs. Loans under the ATVM Program are made by and through the Federal Financing Bank, an instrumentality of the U.S. government created by the Federal Financing Bank Act of 1973 that is under the general supervision of the Secretary of the Treasury.
As disclosed in our Current Report on Form 8-K dated September 16, 2009 (the "September 2009 Form 8-K Report"), we entered into a Loan Arrangement and Reimbursement Agreement ("Arrangement Agreement") with the DOE, pursuant to which the DOE agreed to (i) arrange a 13-year multi-draw term loan facility (the "Facility") under the ATVM Program in the aggregate principal amount of up to $5.9 billion, (ii) designate us as a borrower under the ATVM Program and (iii) cause the Federal Financing Bank to enter into a Note Purchase Agreement (the "Note Purchase Agreement") for the purchase of notes to be issued by us evidencing such loans. The proceeds of advances under the Facility willare to be used to finance certain costs for alternative technology vehicles eligible for financing under the ATVM Program that are incurred through mid-2012. Advances under the existing Facility may be requested through June 30,December 31, 2012. Each advance under the Facility will bearbears interest at a blended rate based on the Treasury yield curve at the time such advance is
Item 7. Management's Discussion and Analysis of Financial Condition and Results of Operations (continued)
borrowed, based on the principal amortization schedule for that advance, with interest payable quarterly in arrears. The principal amount of the loans under the Facility areis payable in equal quarterly installments, commencing on September 15, 2012, through June 15, 2022. Through December 31, 20092011, we have received $1.2$4.8 billion in loans under the Facility.Facility and the weighted-average interest rate on such loans is about 2.5% per annum. For additional details regarding the Arrangement Agreement and the Note Purchase Agreement, refer to Exhibits 10.1 and 10.2 filed with the September 2009 Form 8-K Report.
European Investment Bank ("EIB") Credit Facility. On July 12, 2010, Ford Motor Company Limited, our operating subsidiary in the United Kingdom ("Ford of Britain"), entered into a credit facility for an aggregate amount of £450 million with the EIB. Proceeds of loans drawn under the facility are being used for research and development of fuel-efficient engines and commercial vehicles with lower emissions, and related upgrades to an engine manufacturing plant. The facility was fully drawn in the third quarter of 2010, and Ford of Britain had outstanding $698 million of loans at
December 31, 2011. The loans are five-year, non-amortizing loans secured by a guarantee from the U.K. government for 80% of the outstanding principal amount and cash collateral from Ford of Britain equal to 20% of the outstanding principal amount, and bear interest at a fixed rate of approximately 3.6% per annum (excluding a commitment fee of 0.30% to the U.K. government). Ford of Britain has pledged substantially all of its fixed assets, receivables, and inventory to the U.K. government as collateral, and we have guaranteed Ford of Britain's obligations to the U.K. government related to the government's guarantee.
U.S. Ex-Im Bank and Private Export Funding Corporation ("PEFCO") Secured Revolving Loan. On December 21, 2010, we entered into a credit agreement with PEFCO and Ex-Im Bank. Under the terms of the credit agreement, PEFCO provided us with a $250 million revolving credit facility and Ex-Im Bank provided a guarantee to PEFCO for 100% of the outstanding principal amount of the loan, which is secured by our in-transit vehicle inventory to Canada and Mexico. The facility is used to finance vehicles exported for sale to Canada and Mexico that were manufactured in our U.S. assembly plants. The facility was fully drawn in the fourth quarter of 2010 and we had outstanding a $250 million loan at December 31, 2011. The loan matures on March 20, 2012 and bears interest at LIBOR, at a time period that most closely parallels the advancement term, plus a margin of 1% (excluding a facility fee of 1.6%), with interest payable monthly.
Other Automotive Credit Facilities. At December 31, 2011, we had $817million of local credit facilities to non-U.S. Automotive affiliates, of which $74 million has been utilized. Of the $817 million of committed credit facilities, $66 million expires in 2012, $165 million expires in 2013, $223 million expires in 2014, and $363 million expires in 2015.
Net Cash/(Debt).Cash. Our Automotive sector net debtcash calculation is detailed belowat December 31 was as follows (in billions):
| | | | | | | | | | |
| | | | | | | | 2011 | | 2010 |
Gross cash | | $ | 25.5 | | | $ | 13.4 | | $ | 22.9 |
| | $ | 20.5 |
|
| Less: | | | | | | | | | |
| | |
|
Long-term debt | | | 32.3 | | | | 23.0 | | 12.1 |
| | 17.1 |
|
Debt payable within one year | | | 2.1 | | | | 1.2 | | 1.0 |
| | 2.0 |
|
Total debt | | | 34.4 | | | | 24.2 | | 13.1 |
| | 19.1 |
|
Net cash/(debt) | | $ | (8.9 | ) | | $ | (10.8 | ) | |
| Net cash | | $ | 9.8 |
| | $ | 1.4 |
|
The changeTotal debt at December 31, 2011 decreased by $6 billion from December 31, 2010, reflecting the redemption of our Trust Preferred Securities in total debt primarily is explained by the net $7.5first quarter of 2011, resulting in a reduction of about $3 billion, drawand payments made throughout the year of $4.9 billion on our term loans and revolving credit facility discussed above,under the two New Notes, totaling $7 billion, issuedCredit Agreement, offset partially by an increase in connection with the UAW VEBA transaction discussed below, the issuance of $2.875 billion aggregate principal amount of the 2016 Convertible Notes discussed above, and the $10.1 billion of debt reduction actions discussed below.low-cost government loans to support advanced technology vehicle development.
See Note 1918 of the Notes to the Financial Statements for our debt maturity table as of December 31, 20092011 and additional debt disclosures.
Pension Plan Contributions and Strategy. Worldwide, our defined benefit pension plans were underfunded by
__________$15.4 billion at December 31, 2011, compared with being underfunded by $11.5 billion at December 31, 2010. The deterioration primarily reflects sharply lower discount rates, with the U.S. weighted-average discount rate declining to 4.64% at the end of 2011 from 5.24% at the end of 2010.
* Credit facilities of our VIEs are excluded as we do not control their use.
ITEMItem 7. Management's Discussion and Analysis of Financial Condition and Results of Operations (continued)
Debt Reduction Actions. We undertookOur long-term strategy is to reduce the following transactions duringrisk of our funded defined benefit pension plans, including minimizing the first halfvolatility of 2009, which reduced our Automotive debt by a total of $10.1 billion principal amount (with a carryingthe value of $8.5 billion):our pension assets relative to pension liabilities and the need for unplanned use of capital resources to fund the plans. The strategy will reduce balance sheet, cash flow, and income exposures and, in turn, reduce our risk profile. The key elements of this strategy include:
· | A private market transaction, completed in January 2009, pursuant to which we purchased $165 million principal amount of our outstanding unsecured notes for $37 million in cash. |
· | A cash tender offer by Ford Credit for our secured term loan under the Credit Agreement, pursuant to which Ford Credit purchased from lenders thereof $2.2 billion principal amount of the secured term loan for an aggregate cost of $1.1 billion (including transaction costs). This transaction settled on March 27, 2009, following which, consistent with previously-announced plans to return capital from Ford Credit to us, Ford Credit distributed the repurchased secured term loan to its immediate parent, Ford Holdings, whereupon the repurchased secured term loan was forgiven. |
· | A cash tender offer by Ford Credit for our unsecured notes, pursuant to which Ford Credit purchased $3.4 billion principal amount of debt securities for an aggregate cost of $1.1 billion (including transaction costs). This transaction settled on April 8, 2009, following which Ford Credit transferred the repurchased debt securities to us in satisfaction of $1.1 billion of Ford Credit's tax liabilities to us. Approximately $5.6 billion aggregate principal amount of our unsecured notes (including about $100 million of industrial revenue bonds) remains outstanding. |
· | An exchange offer by us for our 4.25% Senior Convertible Notes due December 15, 2036 ("2036 Convertible Notes"), pursuant to which $4.3 billion principal amount of 2036 Convertible Notes was exchanged for an aggregate of 468 million shares of Ford Common Stock and $344 million in cash ($80 in cash per $1,000 principal amount of 2036 Convertible Notes exchanged). This transaction settled on April 8, 2009. An aggregate principal amount of $579 million of 2036 Convertible Notes remains outstanding with a carrying value of approximately $400 million. |
Amendment to UAW Retiree Health Care Settlement Agreement. As disclosedLimiting liability growth in our Current Report on Form 8-K dated July 22, 2009 ("July 2009 Form 8-K Report"), on July 23, 2009, we entered into an amendmentdefined benefit plans by closing participation to new participants;
Reducing plan deficits through discretionary cash contributions;
Progressively re-balancing assets to more fixed income investments, with a target asset allocation to be reached over the next several years of about 80% fixed income investments and 20% growth assets, which will provide a better matching of plan assets to the UAW Retiree Health Care Settlement Agreement dated March 28, 2008 (the "Original Settlement Agreement") among and between us, the UAW, and certain class representatives, on behalfcharacteristics of the class of plaintiffs as set forth therein. The Original Settlement Agreement established the UAW Retiree Medical Benefits Trust as a new VEBA trust (the "UAW VEBA Trust") that on December 31, 2009 would assume the obligationliabilities, thereby reducing our net exposure; and
Taking other strategic actions to provide retiree health care benefits to eligible active and retired UAW Ford hourly employees and their eligible spouses, surviving spouses and dependents.
Pursuant to the Original Settlement Agreement, in April 2008, we issued to VEBA-F Holdings LLC, a then-wholly owned subsidiary of ours (the "LLC"): (a) $3.3 billion aggregate principal amount of 5.75% Convertible Notes Due January 1, 2013 (the "Convertible Notes"); (b) a $3 billion aggregate principal amount 9.50% Second Lien Term Note Due January 1, 2018 (the "Term Note") and a corresponding guaranty issued by certain subsidiary guarantors (the "Term Note Guaranty"); and (c) a promissory note dated January 5, 2009 in an aggregate principal amount of $2.3 billion, which is equal to the market value of the assets in the TAA held by the LLC on December 31, 2008 (the "TAA Note" and, together with the Convertible Notes, the Term Note and the Term Note Guaranty, the "Old Securities").
The amendment to the Original Settlement Agreement (the "Amended Settlement Agreement"), and the forms of the New Securities, the Exchange Agreement and the Registration Rights Agreement (each as defined below), were filed as exhibits to the July 2009 Form 8-K Report. The Amended Settlement Agreement changed the Original Settlement Agreement to provide for smoothing of payment obligations and to give us the option to use Ford Common Stock to satisfy up to approximately 50% of our future payment obligations to the UAW VEBA Trust.
The Amended Settlement Agreement was approved by the U.S. District Court for the Eastern District of Michigan on November 9, 2009. On December 8, 2009, the U.S. Department of Labor published in the Federal Register a Notice of Proposed Individual Exemption (the "Exemption") that would be retroactive to December 31, 2009 and would, among other things, permit the transfer to the UAW VEBA Trust and allow the UAW VEBA Trust to hold the New Securities (as defined below). This, along with prior discussions with the U.S. Department of Labor, met the condition under the Amended Settlement Agreement of obtaining the Exemption or reasonable assurance of retroactive effect thereof satisfactory to Ford and the UAW VEBA Trust.
On December 11, 2009, in accordance with the Amended Settlement Agreement and pursuant to a Securities Exchange Agreement dated as of December 11, 2009 among us, the LLC and certain subsidiary guarantors (the "Exchange Agreement"), we issued to the LLC in exchange for the Old Securities: (i) an Amortizing Guaranteed Secured Note Maturing June 30, 2022 with an original principal amount of $6.7 billion and with a fair value at December 31, 2009 of about $4.8 billion ("New Note A") excluding a "true-up amount" (described below); (ii) an Amortizing Guaranteed Secured Note Maturing June 30, 2022 with an original principal amount of $6.5 billion and with a fair value at December 31, 2009 of about $4.5 billion ("New Note B" and, together with New Note A, the "New Notes"); (iii) guaranties by certain subsidiary guarantors of the New Notes, limited to an aggregate of $3 billion of obligations thereunder (the "Guaranties") and (iv) warrants to purchase 362,391,305 shares of Ford Common Stock, issued pursuant to a Warrant Agreement (the "Warrant Agreement") dated December 11, 2009 between us and the LLC (the "Warrants" and, together with the New Notes and Guaranties, the "New Securities"). The New Notes are secured on second lien basis, to the extent of $3 billion of obligations thereunder, with collateral securing our obligations under the Credit Agreement.
ITEM 7. Management's Discussion and Analysis of Financial Condition and Results of Operations (continued)
Under New Note B, we have the option, subject to certain conditions, of making each payment in cash, Ford Common Stock, or a combination of cash and Ford Common Stock. Any Ford Common Stock to be delivered in satisfaction of such payment obligation is to be valued based on its volume-weighted average price per share for the 30 trading-day period ending on the second business day prior to the relevant payment date ("30-day VWAP price").
The Warrants, which expire on January 1, 2013, entitle the holder thereof to purchase 362,391,305 shares of Ford Common Stock at an exercise price of $9.20 per share. Generally, the warrants can be exercised at any time, but the underlying shares cannot be transferred prior to October 1, 2012, unless the closing sale price of Ford Common Stock was above $11.04 for at least 20 trading days in the 30 consecutive trading days ending on the last trading day in the preceding calendar quarter. Upon exercise of the Warrants, the warrant holder has the option to elect to have us settle on a cashless, net share basis (i.e., delivering to the holder shares of Ford Common Stock having a value equal to the "in-the-money" value of the Warrants being exercised).reduce pension liabilities.
In addition, on December 11, 2009,2011, we entered into a Securityholder and Registration Rights Agreement with the LLC (the "Registration Rights Agreement"), which provides for certain hedging restrictions, certain sales restrictions relating to the Warrants and shares of Ford Common Stock underlying the Warrants and delivered in payment of New Note B, and customary registration rights relating to the sale of shares of Ford Common Stock received by the UAW VEBA Trust pursuant to our stock payment option under New Note B, as well as the Warrants and shares of Ford Common Stock issued upon the exercise thereof.
As disclosed previously, notwithstanding our option to pay a portion of our obligations to the UAW VEBA Trust in stock in lieu of cash, we will use our discretion in determining which form of payment makes sense at the time of each required payment, balancing liquidity needs and preservation of shareholder value. In making such a determination, we will consider facts and circumstances existing at the time of each required payment, including market and economic conditions, our available liquidity, and the price of Ford Common Stock.
On December 31, 2009, with respect to New Note A, we paid to the LLC the payment due on that date of $1.3 billion, the payment of a true-up amount of $150 million, and a partial prepayment of New Note A in the amount of $500 million. The true-up amount was negotiated as part of the arrangement for us to use during 2009 the cash in the TAA in exchange for a fixed return of 9% per annum plus an amount that represents a hypothetical return on a portfolio of assets invested 70% in the equity markets and 30% in fixed income markets, subject to a cap of $150 million. Because the equity markets performed well in 2009, the true-up amount met the $150 million cap.
Also on December 31, 2009, with respect to New Note B, we paid to the LLC the payment due on that date of $610 million in cash. We decided to make the New Note B payment in cash because the 30-day VWAP price was $9.13 and the December 31, 2009 closing sale price of Ford Common Stock was $10.00 per share.
After giving effect to the payments made on the New Notes on December 31, 2009, the New Notes had a fair value of $7 billion.
Thereafter, at the close of business on December 31, 2009, we transferred to the UAW VEBA Trust: (i) our ownership interest in the LLC, which was the legal owner of the New Securities and which held cash and marketable securities in its TAA with a value on that date of $619 million, and (ii) the assets in our then-existing internal VEBA trust consisting of cash and marketable securities with a value on December 31, 2009 of $3.5 billion. The transfer by us to the UAW VEBA Trust of the ownership of these assets, including the beneficial ownership of the New Securities, irrevocably settled our obligation, valued at about $13.6 billion on December 31, 2009, to provide retiree health care benefits to eligible active and retired UAW Ford hourly employees and their eligible spouses, surviving spouses and dependents.
ITEM 7. Management's Discussion and Analysis of Financial Condition and Results of Operations (continued)
The schedule of remaining payments for each of the New Notes (which reflects the partial prepayment made on New Note A described above), as well as the prepayment amount for each of the New Notes in the event we were to pay the remaining balance in full on the corresponding payment date, is as follows:
| | | | | | | | | | | | |
June 30, 2010 | | $ | 249,452,786 | | | $ | 3,211,519,680 | | | $ | 609,950,000 | | | $ | 4,232,000,000 | |
June 30, 2011 | | | 249,452,786 | | | | 3,228,652,915 | | | | 609,950,000 | | | | 3,948,000,000 | |
June 30, 2012 | | | 584,063,591 | | | | 3,247,328,141 | | | | 654,000,000 | | | | 3,638,000,000 | |
June 30, 2013 | | | 584,063,591 | | | | 2,902,958,359 | | | | 654,000,000 | | | | 3,253,000,000 | |
June 30, 2014 | | | 584,063,591 | | | | 2,527,595,297 | | | | 654,000,000 | | | | 2,832,000,000 | |
June 30, 2015 | | | 584,063,591 | | | | 2,118,449,560 | | | | 654,000,000 | | | | 2,375,000,000 | |
June 30, 2016 | | | 584,063,591 | | | | 1,672,480,706 | | | | 654,000,000 | | | | 1,875,000,000 | |
June 30, 2017 | | | 584,063,591 | | | | 1,186,374,655 | | | | 654,000,000 | | | | 1,331,000,000 | |
June 30, 2018 | | | 584,063,591 | | | | 656,519,060 | | | | 654,000,000 | | | | 738,000,000 | |
June 30, 2019 | | | 22,364,733 | | | | 78,976,461 | | | | 26,000,000 | | | | 92,000,000 | |
June 30, 2020 | | | 22,364,733 | | | | 61,706,784 | | | | 26,000,000 | | | | 72,000,000 | |
June 30, 2021 | | | 22,364,733 | | | | 42,882,836 | | | | 26,000,000 | | | | 50,000,000 | |
June 30, 2022 | | | 22,364,733 | | | | 22,364,733 | | | | 26,000,000 | | | | 26,000,000 | |
Pension Plan Contributions. Our policy for funded plans is to contribute annually, at a minimum, amounts required by applicable laws and regulations. We do from time to time make contributions beyond those legally required.
In 2009, we made $900 million of cash contributions to our funded pension plans. During 2010, we expect to contributecontributed $1.1 billion to our worldwide funded pension plans and made $400 million of benefit payments directly by the Company for unfunded plans. During 2012, we expect to contribute from available Automotive cash and cash equivalents. In addition,equivalents $3.5 billion to our worldwide funded plans (including discretionary contributions to our U.S. plans of $2 billion), and to make $350 million of benefit payments made directly by usthe Company for unfunded plans, are expected to befor a total of about $400 million. $3.8 billion.
Based on current assumptions and regulations, we do not expect to have a legal requirement to fund our major U.S. pension plans in 2010. 2012.
As disclosed previously, based on present planning assumptions for long-term asset returns, a normalization of discount rates and planned cash contributions, we expect our global pension obligations in total to be fully funded over the next few years, with variability on a plan-by-plan basis.
For a furtherdetailed discussion of our pension plans, see Note 1817 of the Notes to the Financial Statements.
Liquidity Sufficiency. One of the four key priorities of our business plan is to finance our plan and improvestrengthen our balance sheet.sheet, while at the same time having resources available to grow our business. The actions described above are consistent with this priority. Based on our planning assumptions, we believe that we have sufficient liquidity and capital resources to continue to transform our business, invest in new products that customers want and value, grow our business, pay our debts and obligations as and when they come due, pay a sustainable dividend, and provide a cushion within thean uncertain global economic environment. We will continue to look for opportunities to improvestrengthen our balance sheet, primarily by working to improveensure our underlying business to generategenerates positive Automotive operating-related cash flow.flow, even as we continue to invest in the growth of our business.
Financial Services SectorWithin the limitations provided under our Credit Agreement, on December 8, 2011, our Board of Directors declared a dividend of $0.05 per share on our Common and Class B Stock, payable on March 1, 2012 to stockholders of record on January 31, 2012.
Ford Credit
Funding Strategy. Ford Credit's funding strategy is to maintain sufficient liquidity to meet short-term funding obligations by having a substantial cash balance and committed funding capacity. As a result of lower long-term senior unsecured credit ratings assigned to Ford Credit over the past few years, its unsecured funding costs have increased over time. While Ford Credit has accessed the unsecured debt market when available, Ford Credit has increased its use of securitization funding as this has been more cost effective than unsecured funding and has allowed Ford Credit access to a broader investor base. Ford Credit plans to meet a significant portion of its 2010 funding requirements through securitization transactions. In addition, Ford Credit has various alternative business arrangements for select products and markets that reduce its funding requirements while allowing Ford Credit to support us (e.g., Ford Credit's partnering in Brazil for retail financing and FCE Bank plc's ("FCE") partnering with various institutions in Europe for full service leasing and retail and wholesale financing). Ford Credit is continuing to explore and execute such alternative business arrangements.
Consistent with the overall market, Ford Credit has been impacted by volatility and disruptions in the asset-backed securitization markets since August 2007. The recent global credit environment has presented many challenges, including reduced access to public and private unsecured and securitization markets, increased credit spreads associated with both asset-backed and unsecured funding, higher renewal costs on its committed liquidity programs, reduced net proceeds from securitization transactions due to greater enhancements, shorter maturities in Ford Credit's public and private securitization transactions in certain circumstances, and reduced capacity to obtain derivatives to manage market risk, including interest rate risk, in Ford Credit's securitization programs.
ITEMItem 7. Management's Discussion and Analysis of Financial Condition and Results of Operations (continued)
Financial Services Sector
Ford Credit
Funding Strategy. Ford Credit's funding strategy remains focused on diversification, and it plans to continue accessing a variety of markets, channels and investors. Ford Credit's liquidity remains strong, and it maintains cash balances and committed capacity that meet its business and funding requirements in all global market conditions.
While challenges remain, Ford Credit saw improvementcompleted its full year funding plan despite volatile market conditions. In 2011, it completed $35 billion of term funding, including $19 billion in the capital markets in the last three quarterspublic market and $16 billion of 2009 evidenced by improvement in market access and credit spreads, including: four unsecured debt issuances in the United States and one in Europe totaling about $5 billion with significantly improved U.S. credit spreads from the first to the most recent; increasingly tighter spreads onprivate securitizations. Ford Credit's triple-A rated classes of Ford Credit'spublic unsecured issuance was over $8 billion, including over $800 million issued under its U.S. retail securitization transactions; a non-TALF public retail securitization transactionRetail Notes program which it reintroduced in November 2009; two European2011.
The public retail securitization transactions in the fourth quarter of 2009; Ford Credit's first public wholesale securitization transaction since 2006 in October 2009; a two-year committed lease facility in December 2009; and the sale of over $150 million of subordinated notesincluded $2.5 billion from Ford Credit's September 2009 publicFUEL notes program. These are
5-year notes backed by automotive retail securitization transaction.finance receivables. The FUEL notes will be mandatorily exchanged for Ford Credit unsecured notes having the same maturity and interest rate upon Ford Credit's senior unsecured debt receiving two investment grade credit ratings among S&P, Moody's, and Fitch. After the mandatory exchange, Ford Credit expects to reacquire the assets supporting the FUEL notes.
Ford Credit ended the year with over $17 billion of liquidity and about $33 billion of committed capacity, compared with about $34 billion at December 31, 2010. Throughout 2011, Ford Credit generally saw lower costs across the facilities it renewed.
Ford Credit's funding plan is subject to risks and uncertainties, many of which are beyond its control, including disruption in the capital markets for the types ofthat could impact both unsecured debt and asset-backed securities used in Ford Credit's asset-backed funding, as well as disruption beyondissuances and the expirationeffects of regulatory reform efforts on the government-sponsored securitization funding programs.financial markets. Potential impactimpacts of industry events and regulation on Ford Credit's ability to access debt and derivatives markets, or renew its committed liquidity programs in sufficient amounts and at competitive rates, represents another risk to Ford Credit'sits funding plan. As a result of such events or regulation, Ford Credit may need to further reduce the amountnew originations of finance receivables, and operating leases it purchases or originates, thereby reducing its ongoing profits and adversely affecting its ability to support the sale of Fordour vehicles.
Funding. Ford Credit requires substantial funding in the normal course of business. Its funding requirements are driven mainly by the need to: (i) purchase retail installment sale contracts and retail lease contracts to support the sale of Ford products, which are influenced by Ford-sponsored special-rate financing programs that are available exclusively through Ford Credit, (ii) provide wholesale financing and capital financing for Ford dealers, and (iii) repay its debt obligations.
Ford Credit's funding sources include primarily securitization transactions (including other structured financings) and unsecured debt. Ford Credit issues both short- and long-term debt that is held by both institutional and retail investors, with long-term debt having an original maturity of more than 12 months. Ford Credit sponsors a number of securitization programs that can be structured to provide both short- and long-term funding through institutional investors in the
United States and international capital markets.
Ford Credit obtains short-term unsecured funding from the sale of floating rate demand notes under its Ford Interest Advantage program and by issuing unsecured commercial paper in the United States, Europe, Mexico, and other international markets. At December 31, 2009,2011, the principal amount outstanding of Ford Interest Advantage notes, which may be redeemed at any time at the option of the holders thereof without restriction, was about $4$4.7 billion. At present, all of Ford Credit's short-term credit ratings by nationally recognized statistical rating organizations ("NRSROs") are below the Tier-2 category, and as a result it has limited access to the unsecured commercial paper market, and Ford Credit's unsecured commercial paper cannot be held by money market funds. At December 31, 2009,2011, the principal amount outstanding of Ford Credit's unsecured commercial paper was less than $1 million.about $150 million, which primarily represents issuance under its commercial paper program in Mexico and Europe. Ford Credit does not hold reserves specifically to fund the payment of any of its unsecured short-term funding obligations. Instead, Ford Credit maintains multiple sources of liquidity, including cash, cash equivalents, and marketable securities (excluding marketable securities related to insurance activities), unused committed liquidity programs, excess securitizable assets, and committed and uncommitted credit facilities, which should be sufficient for Ford Credit's unsecured short-term funding obligations.
U.S. Financial Industry Regulations. Government-Sponsored Securitization Funding Programs. Government-sponsored securitization funding programs have helped stabilize the asset-backed securitization market. Since the third quarterSee "Item 1A. Risk Factors" ("Item 1A") for discussion of 2009, Ford Credit significantly reduced the use of these programs as its access to the public and private securitization and unsecured markets continued to improve.new or increased credit, consumer, data protection, or other regulations.
Commercial Paper Funding Facility ("CPFF"): The CPFF became operational in October 2008 and purchased unsecured and asset-backed commercial paper from U.S. issuers. In 2008, Ford Credit registered to sell up to $16 billion from its asset-backed commercial paper program ("FCAR") to the CPFF. At December 31, 2008, FCAR had $7 billion of commercial paper outstanding under the CPFF, which represented about 60% of FCAR's outstanding balance. FCAR was able to issue a limited amount of commercial paper to investors during the first half of 2009 and at lower interest rates than under CPFF, but with a relatively short average maturity compared with CPFF and often overnight. FCAR issued a total of $9 billion of commercial paper to the CPFF in 2009, all of which had matured by September 30, 2009. Commercial paper was sold to the CPFF at a price based on the designated benchmark rate, plus a spread of 300 basis points. This represented a significantly higher rate than those that prevailed in the asset-backed commercial paper market before August 2007, when the disruptions in the debt and asset-backed securitization markets began. As a result of improvements in the asset-backed commercial paper market, as well as a reduction in the overall size of FCAR, FCAR is able to issue commercial paper outside the CPFF at prices and average maturities that are close to those that prevailed before August 2007. The CPFF ceased purchasing commercial paper on February 1, 2010.
ITEMItem 7. Management's Discussion and Analysis of Financial Condition and Results of Operations (continued)
Term Asset-Backed Securities Loan Facility ("TALF"): TALF began in March 2009 to make credit available by restoring liquidityFunding Portfolio.The chart below details the trends in the asset-backed securitization market. Under TALF, the Federal Reserve Bank of New York ("FRBNY") makes loans to holders of TALF-eligible asset-backed securities. The loans are equal to the market value of the asset-backed securities less a discount. Interest rates on most TALF loans are 100 basis points over the respective term benchmark rate, and discounts vary according to the assets supporting the asset-backed securities. The TALF program revived the asset-backed securitization market by attracting new investors who purchased asset-backed securities, receiving higher spreads on these securities than the spreads they pay on their loans from FRBNY. As investor demand increased due to the liquidity provided by TALF, spreads generally narrowed on Ford Credit's issuances and the percentage of non-TALF investors increased. As the spread on certain asset-backed securities fell below the 100 basis point spread on TALF loans, Ford Credit's TALF-eligible asset-backed securities were purchased almost exclusively by non-TALF investors.
Ford Credit issued $10.3 billion of TALF-eligible asset-backed securities in 2009, of which $2.2 billion amortized during the year and $8.1 billion was outstanding at December 31, 2009. Ford Credit has also issued a total of $1.3 billion of TALF-eligible asset-backed securities in 2010. The following table summarizes Ford Credit's TALF-eligible issuances including the weighted average spread of the triple-A rated notes over the relevant benchmark rates for securitization transactions:
| | | | | | Weighted Average Spread (basis points) | |
| Retail Installment | | | | | | | |
| March 2009 | Ford Credit Auto Owner Trust 2009 – A | | $ | 3.0 | | | | 295 | |
| June 2009 | Ford Credit Auto Owner Trust 2009 – B | | | 1.9 | | | | 161 | |
| July 2009 | Ford Credit Auto Owner Trust 2009 – C | | | 1.0 | | | | 165 | |
| September 2009 | Ford Credit Auto Owner Trust 2009 – D | | | 2.1 | | | | 83 | |
| | | | | | | | | | |
| Wholesale | | | | | | | | | |
| October 2009 | Ford Credit Master Owner Trust 2009 – 2 | | | 1.5 | | | | 155 | |
| January 2010 | Ford Credit Master Owner Trust 2010 – 1 | | | 1.3 | | | | 165 | |
| | | | | | | | | | |
| Retail Lease | | | | | | | | | |
| June 2009 | Ford Credit Auto Lease Trust 2009 – A | | | 0.8 | | | | 211 | |
Ford Credit recently completed two public asset-backed securitization transactions that were not TALF-eligible: a retail securitization transaction with a weighted average spread of 48 basis points on the triple-A rated notes in November 2009 and a lease securitization transaction with a weighted average spread of 54 basis points on the triple-A rated notes in February 2010. In January 2010, Ford Credit issued about $230 million of non-TALF subordinated wholesale asset-backed securities that were rated double-A and single-A. In February 2010, Ford Credit also issued $250 million of private wholesale asset-backed securities with a maturity of five years compared with the three-year maturityfunding of Ford Credit's previous TALF transactions. Ford Credit does not plan to complete any additional TALF-eligible retail or lease transactions before the expected expiration of TALF on March 31, 2010. Given the recent improvements in the securitization market, and absent further significant market disruptions, Ford Credit has confidence it can obtain funding in the public securitization markets without TALF.
European Central Bank ("ECB") Open Market Operations: FCE is eligible to access liquidity through the ECB’s open market operations program. This program allows eligible counterparties to use eligible assets (including asset-backed securities) as collateral for short-term liquidity. The present term limitation is three months; however, in the past the term has been as long as one year. The funding efficiency of liquidity provided under this program is typically lower than if the asset-backed securities were placed in the public or private markets because the ECB applies its own market valuation to the collateral and a discount to the original face value of the asset-backed securities. The market valuation and discount vary by the term of the asset, asset type, and jurisdiction of the asset. During the first half of 2009, FCE used the ECB's open market operations program to provide additional liquidity at a time when access to the asset-backed securitization market was limited and costs for such funding were significantly higher than in the past. FCE had $1.8 billion and $1.1 billion of funding through the ECB at December 31, 2009 and 2008, respectively. During the second half of 2009, improvements in the asset-backed securitization market allowed FCE to receive funding from public and private securitization transactions and sell collateral previously posted with the ECB in the secondary markets. Ford Credit expects FCE's utilization of the ECB open market operations program to decline.managed receivables:
ITEM 7. Management's Discussion and Analysis of Financial Condition and Results of Operations (continued)
Funding Portfolio. Ford Credit's outstanding debt and off-balance sheet securitization transactions were as follows on the dates indicated (in billions, except for ratios):
| | | | |
| Debt | | | | | | |
Asset-backed commercial paper (a)(b) | | $ | 6.4 | | | $ | 11.5 | |
Other asset-backed short-term debt (a) | | | 4.5 | | | | 5.6 | |
Ford Interest Advantage (c) | | | 3.6 | | | | 2.0 | |
Unsecured commercial paper | | | — | | | | — | |
Other short-term debt | | | 0.9 | | | | 1.0 | |
Total short-term debt | | | 15.4 | | | | 20.1 | |
Unsecured long-term debt (including notes payable within one year) | | | 38.9 | | | | 51.2 | |
| Asset-backed long-term debt (including notes payable within one year) (a) | | | 42.0 | | | | 55.2 | |
Total debt | | | 96.3 | | | | 126.5 | |
| | | | | | | | | |
| Off-Balance Sheet Securitizations | | | | | | | | |
Securitized off-balance sheet portfolio | | | 0.1 | | | | 0.6 | |
Retained interest | | | — | | | | (0.1 | ) |
Total off-balance sheet securitization transactions | | | 0.1 | | | | 0.5 | |
| | | | | | | | | |
Total debt plus off-balance sheet securitization transactions | | $ | 96.4 | | | $ | 127.0 | |
| | | | | | | | | |
| Ratios | | | | | | | | |
Securitized funding to managed receivables | | | 56 | % | | | 62 | % |
Short-term debt and notes payable within one year to total debt | | | 43 | | | | 50 | |
Short-term debt and notes payable within one year to total capitalization | | | 39 | | | | 46 | |
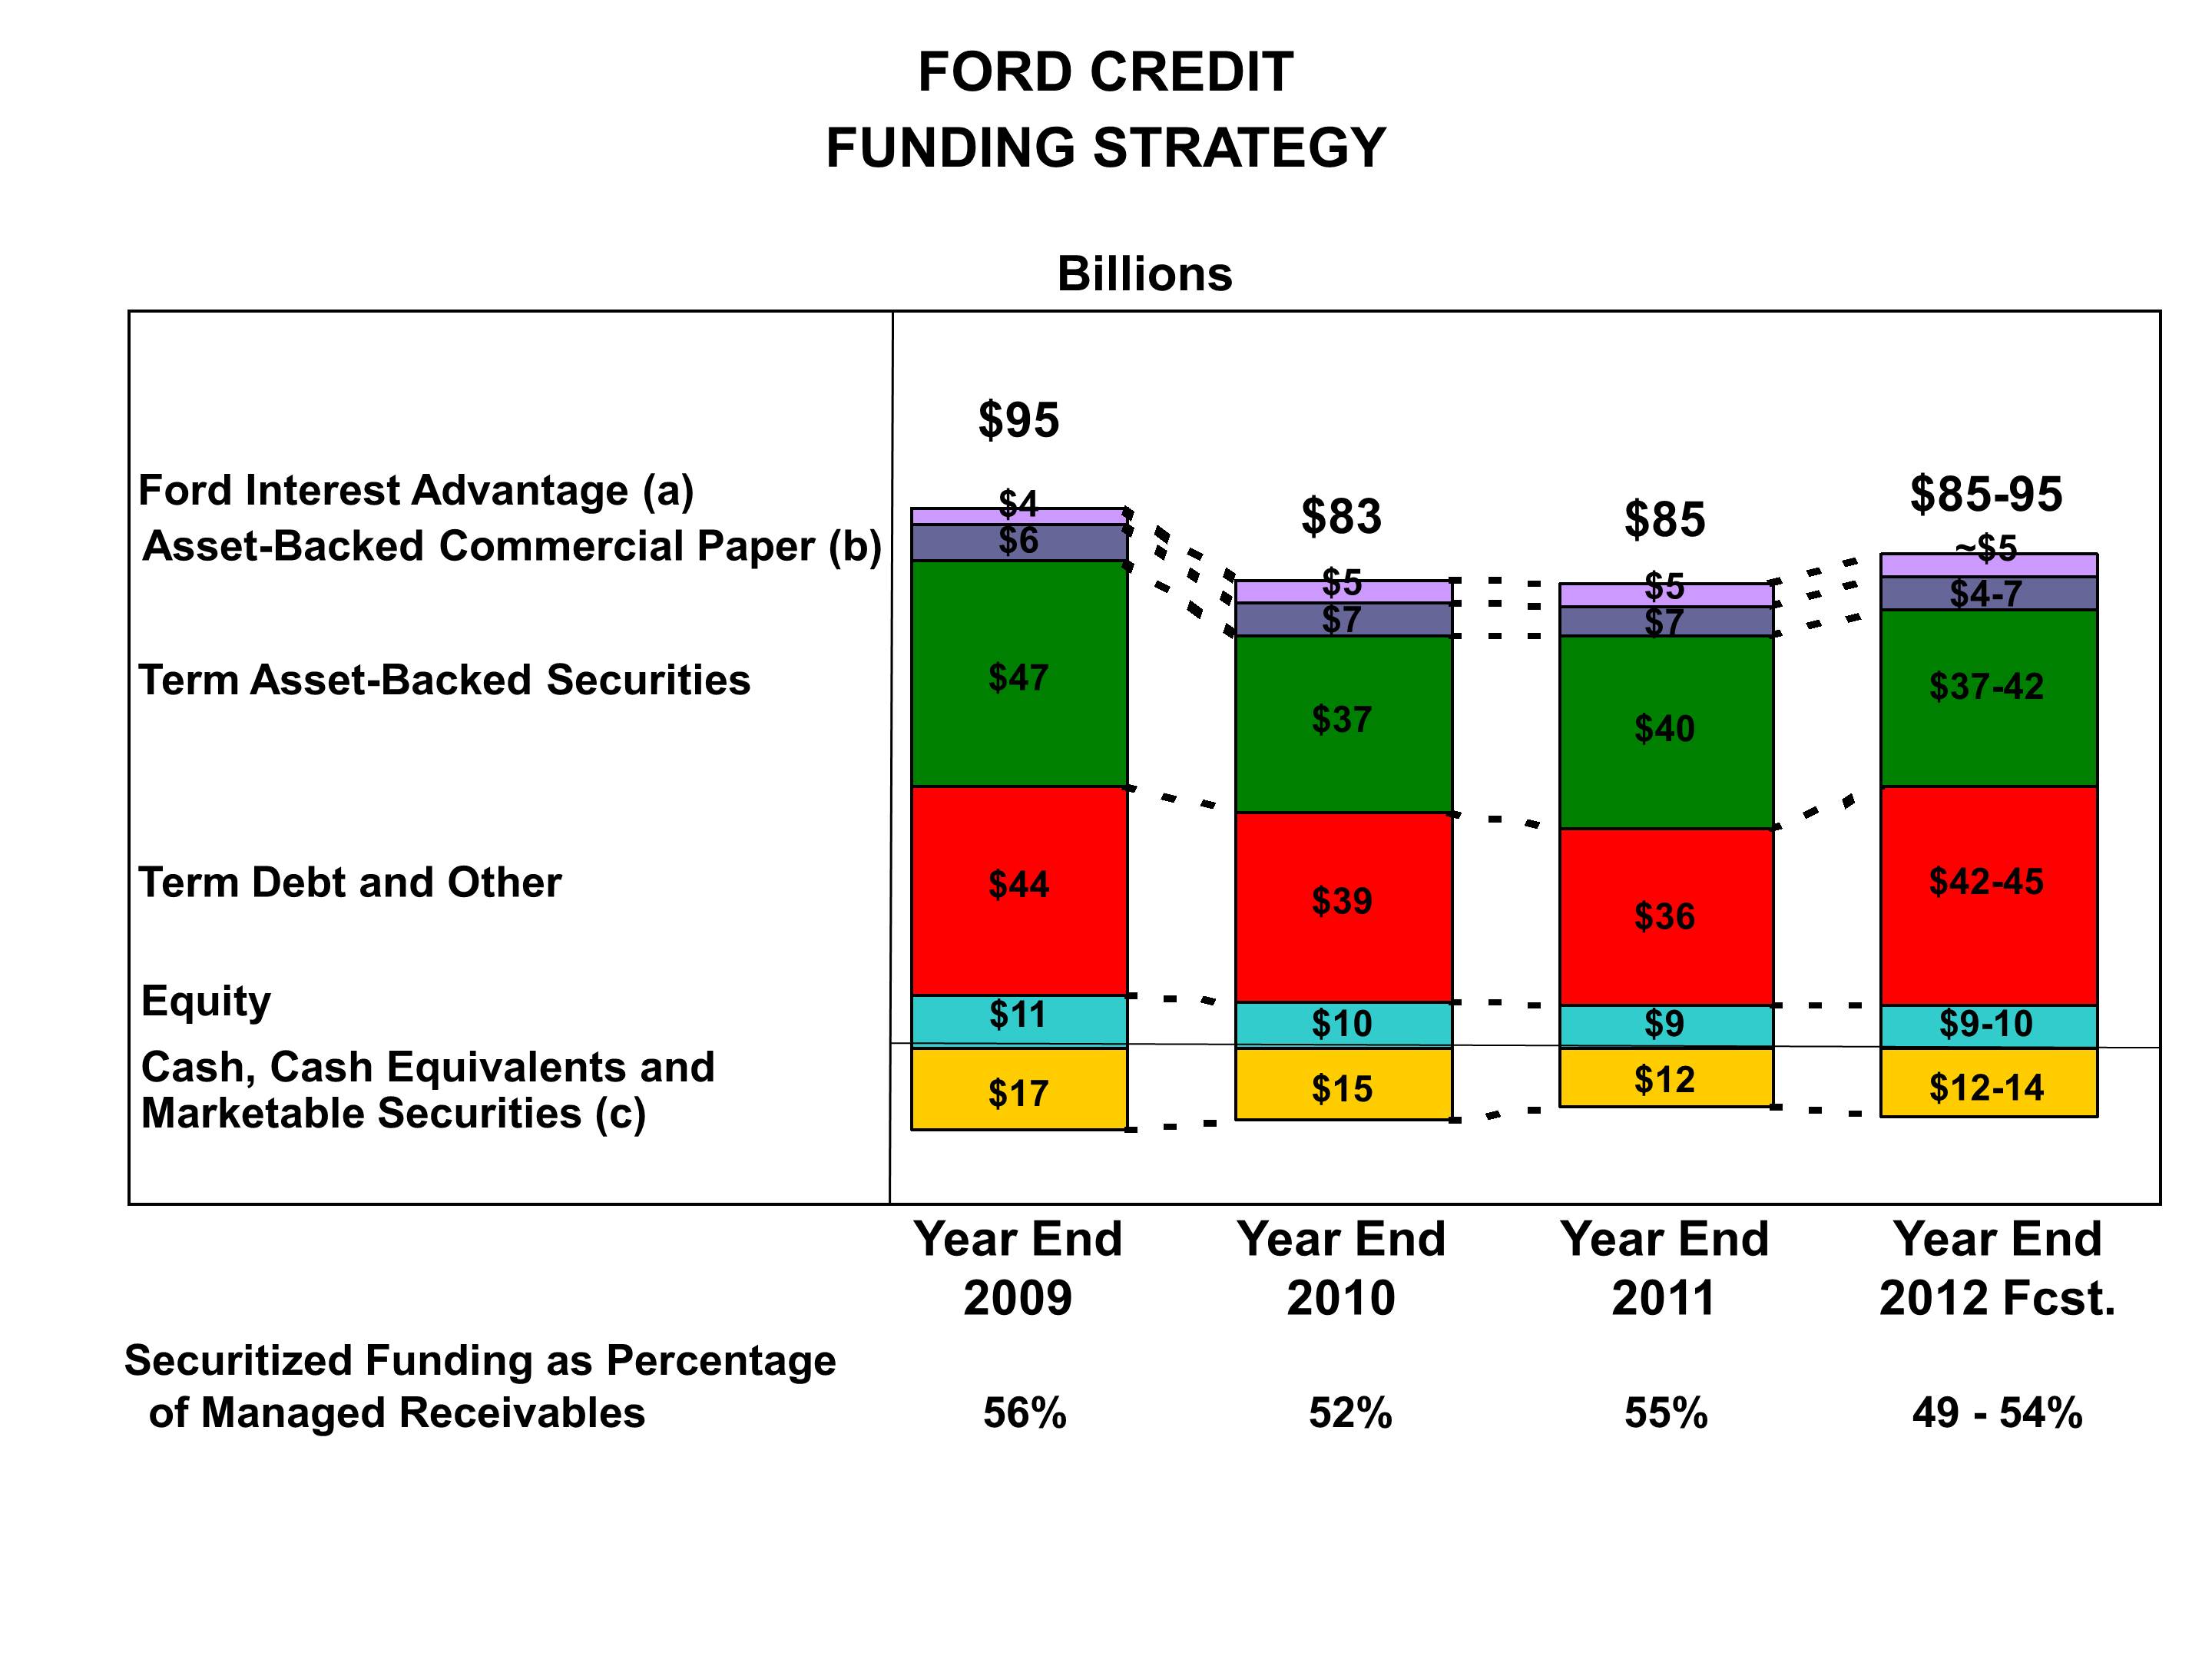
__________
(a) | Obligations issued in securitization transactions that are payable only out of collections on the underlying securitized assets and related enhancements. |
(b) | At December 31, 2009, Ford Credit did not have any asset-backed commercial paper sold to the CPFF. At December 31, 2008, includes asset-backed commercial paper sold to the CPFF of $7 billion. |
(c)(a) | The Ford Interest Advantage program consists of Ford Credit's floating rate demand notes. |
(b) Obligations issued in securitization transactions that are payable only out of collections on the underlying securitized assets and related enhancements.
(c) Excludes marketable securities related to insurance activities.
At December 31, 2009,year-end 2011, managed receivables were $85 billion. Ford Credit ended the year with $12.1 billion in cash, and securitized funding was 55% of managed receivables.
Ford Credit is projecting 2012 year-end managed receivables in the range of $85 billion to $95 billion and securitized funding is expected to represent about 49% to 54% of total managed receivables. The lower end of this range reflects, in part, FUEL notes converting to unsecured long-term debt (including notes payable within one year) was down about $12 billion from year-end 2008, primarily reflecting about $18 billiondebt. It is Ford Credit's expectation that the securitized funding as a percent of debt maturities and repurchases, offset partially by about $6 billion of new unsecured public and private long-term debt issuance. Unsecured long-term debt maturities were as follows: 2010 — $7 billion; 2011 — $11 billion; 2012 — $7 billion; and the remainder thereafter. At December 31, 2009, asset-backed long-term debt (including notes payable within one year) was down about $13 billion from year-end 2008, reflecting amortization of asset-backed debt in excess of asset-backed long-term debt issuance.managed receivables will decline going forward.
Funding Plan. The following table illustrates Ford Credit's planned issuances for full-year 2012 and its public and private term funding issuances for 2008in 2011, 2010, and 2009 and its planned issuances for 2010 (in billions):
| | | | | | | | | | |
| Public Term Funding | | | | | | | | | |
Unsecured | | $ | 3 – 6 | | | $ | 5 | | | $ | 2 | |
Securitization transactions | | | 8 – 12 | | | | 15 | | | | 11 | |
Total public term funding | | $ | 12 – 17 | | | $ | 20 | | | $ | 13 | |
| | | | | | | | | | | | | |
Private Term Funding* | | $ | 8 – 13 | | | $ | 11 | | | $ | 29 | |
|
| | | | | | | | | | | | | |
| | Term Funding Plan |
| | 2012 Forecast | | 2011 | | 2010 | | 2009 |
| Public Transactions (a) | | | | | | | |
| Unsecured | $ 8 - 11 | | $ | 8 |
| | $ | 6 |
| | $ | 5 |
|
| Securitization transactions (b) | 10 - 12 | | 11 |
| | 11 |
| | 15 |
|
| Total public term funding | $ 18 - 23 | | $ | 19 |
| | $ | 17 |
| | $ | 20 |
|
| | | | | | | | |
| Private Transactions (c) | $ 10 - 13 | | $ | 16 |
| | $ | 8 |
| | $ | 11 |
|
__________
* | |
| (a) | Includes Rule 144A offerings. |
| |
| (b) | Includes FUEL notes in 2011. |
| |
| (c) | Includes private term debt, securitization transactions,securitizations, other structured financings, and other term funding; excludes sales to Ford Credit's on-balance sheet asset-backed commercial paper program.FCAR. |
In 2009,2011, Ford Credit completed about $20$35 billion of public term funding transactions, including: about $12funding. About $19 billion of retail asset-backed securitization transactionsthis was public funding in the
United States, Canada and Europe; about $2 billion of wholesale asset-backed securitization transactions in the United States; about $1 billion of lease asset-backed securitization transactions in the United States; and about $5Europe, including over $8 billion of unsecured issuances. In 2009,debt. Ford Credit also completed about $11$16 billion of funding through its private term funding transactions (excluding Ford Credit's on-balance sheet asset-backed commercial paper program) in several markets, including about $4 billion in Canada. These private transactions included retail, lease,securitization channels across all of its major asset classes and wholesale asset-backed securitization transactions.regions.
ITEMItem 7. Management's Discussion and Analysis of Financial Condition and Results of Operations (continued)
For 2012, Ford Credit projects full-year public term funding in the range of $18 billion to $23 billion, consisting of
In 2009, total issuance was about$8 billion to $11 billion lower than 2008, primarily reflecting lower funding requirements resulting from lower receivables. However, 2009of unsecured debt and $10 billion to $12 billion of public securitizations. In addition to the public issuance, was about $7 billion higher than 2008, primarily reflecting the availability of and Ford Credit's preference to issue in the public markets. In 2009, there was a corresponding reduction in reliance on private capacity as Ford Credit loweredis projecting $10 billion to $13 billion of funding from its utilization of committed funding programs.private sources. Through
Through February 24, 2010,20, 2012, Ford Credit completed about $4$7 billion of public term funding transactions, including about $1 billion of retail asset-backed securitization transactions in the United States, Canada, and Europe, about $1$4 billion for a lease asset-backed securitization transaction in the United States, about $1 billion ofretail and wholesale asset-backed securitization transactions in the United States and about $1$3 billion of unsecured issuances.issuance in the United States, Europe, and Canada. Ford Credit also completed about $1 billion of private term funding transactions, primarily reflecting retail, lease and wholesale asset-backed securitization transactions in the United States, Europe, and Europe.Mexico.
Funding is expected to be relatively flat in 2012 despite the projected increase in managed receivables, largely reflecting fewer debt maturities.
Liquidity.The cost of securitization transactions and unsecured debt funding is based on a margin or spread over a benchmark interest rate. Spreads are typically measured in basis points. Ford Credit's asset-backed funding and unsecured long-term debt costs are based on spreads over U.S. Treasury securities of similar maturities, a comparable London Interbank Offered Rate ("LIBOR") or other comparable benchmark rates. Ford Credit's floating rate demand notes funding costs are changed depending on market conditions. In addition to enhancingfollowing chart illustrates Ford Credit's liquidity one of the main reasons that Ford Credit has increased its use of securitization transactions as a funding source over the last few years has been that spreads on Ford Credit's securitization transactions have been more stableprograms and lower than those on Ford Credit's unsecured long-term debt funding. Prior to August 2007, Ford Credit's securitized funding spreads (which are based on the creditworthiness of the underlying securitized asset and enhancements) were not volatile, while its unsecured long-term spreads were volatile. Consistent with the overall market, Ford Credit was impacted by volatility in the asset-backed securitization market beginning in the second half of 2007. Ford Credit experienced higher spreads for several of its committed liquidity programs as well as its public and private issuances. During 2009, Ford Credit's spreads on the three-year fixed rate notes offered in its U.S. public retail securitization transactions decreased from 425 basis points to 70 basis points over the relevant benchmark rates from March 2009 to November 2009, respectively. During 2009, Ford Credit's U.S. unsecured long-term debt transaction spreads decreased from 1,006 basis points to 480 basis points over the relevant benchmark rates from June 2009 toutilization at December 2009, respectively.
Liquidity. The following table illustrates the various sources of Ford Credit's liquidity as of the dates shown (in billions):31, 2011:
| | | | | | | | | | |
Cash, cash equivalents, and marketable securities* | | $ | 17.3 | | | $ | 23.6 | | | $ | 16.7 | |
| | | | | | | | | | | | | |
Committed liquidity programs | | | 23.2 | | | | 28.0 | | | | 36.8 | |
Asset-backed commercial paper ("FCAR") | | | 9.3 | | | | 15.7 | | | | 16.9 | |
Credit facilities | | | 1.3 | | | | 2.0 | | | | 3.0 | |
Committed capacity | | | 33.8 | | | | 45.7 | | | | 56.7 | |
| Committed capacity and cash | | | 51.1 | | | | 69.3 | | | | 73.4 | |
Less: Capacity in excess of eligible receivables | | | (6.5 | ) | | | (4.8 | ) | | | (4.7 | ) |
| Less: Cash and cash equivalents to support on-balance sheet securitization transactions | | | (5.2 | ) | | | (5.5 | ) | | | (4.7 | ) |
Liquidity | | | 39.4 | | | | 59.0 | | | | 64.0 | |
Less: Utilization | | | (18.3 | ) | | | (37.6 | ) | | | (36.1 | ) |
Liquidity available for use | | $ | 21.1 | | | $ | 21.4 | | | $ | 27.9 | |
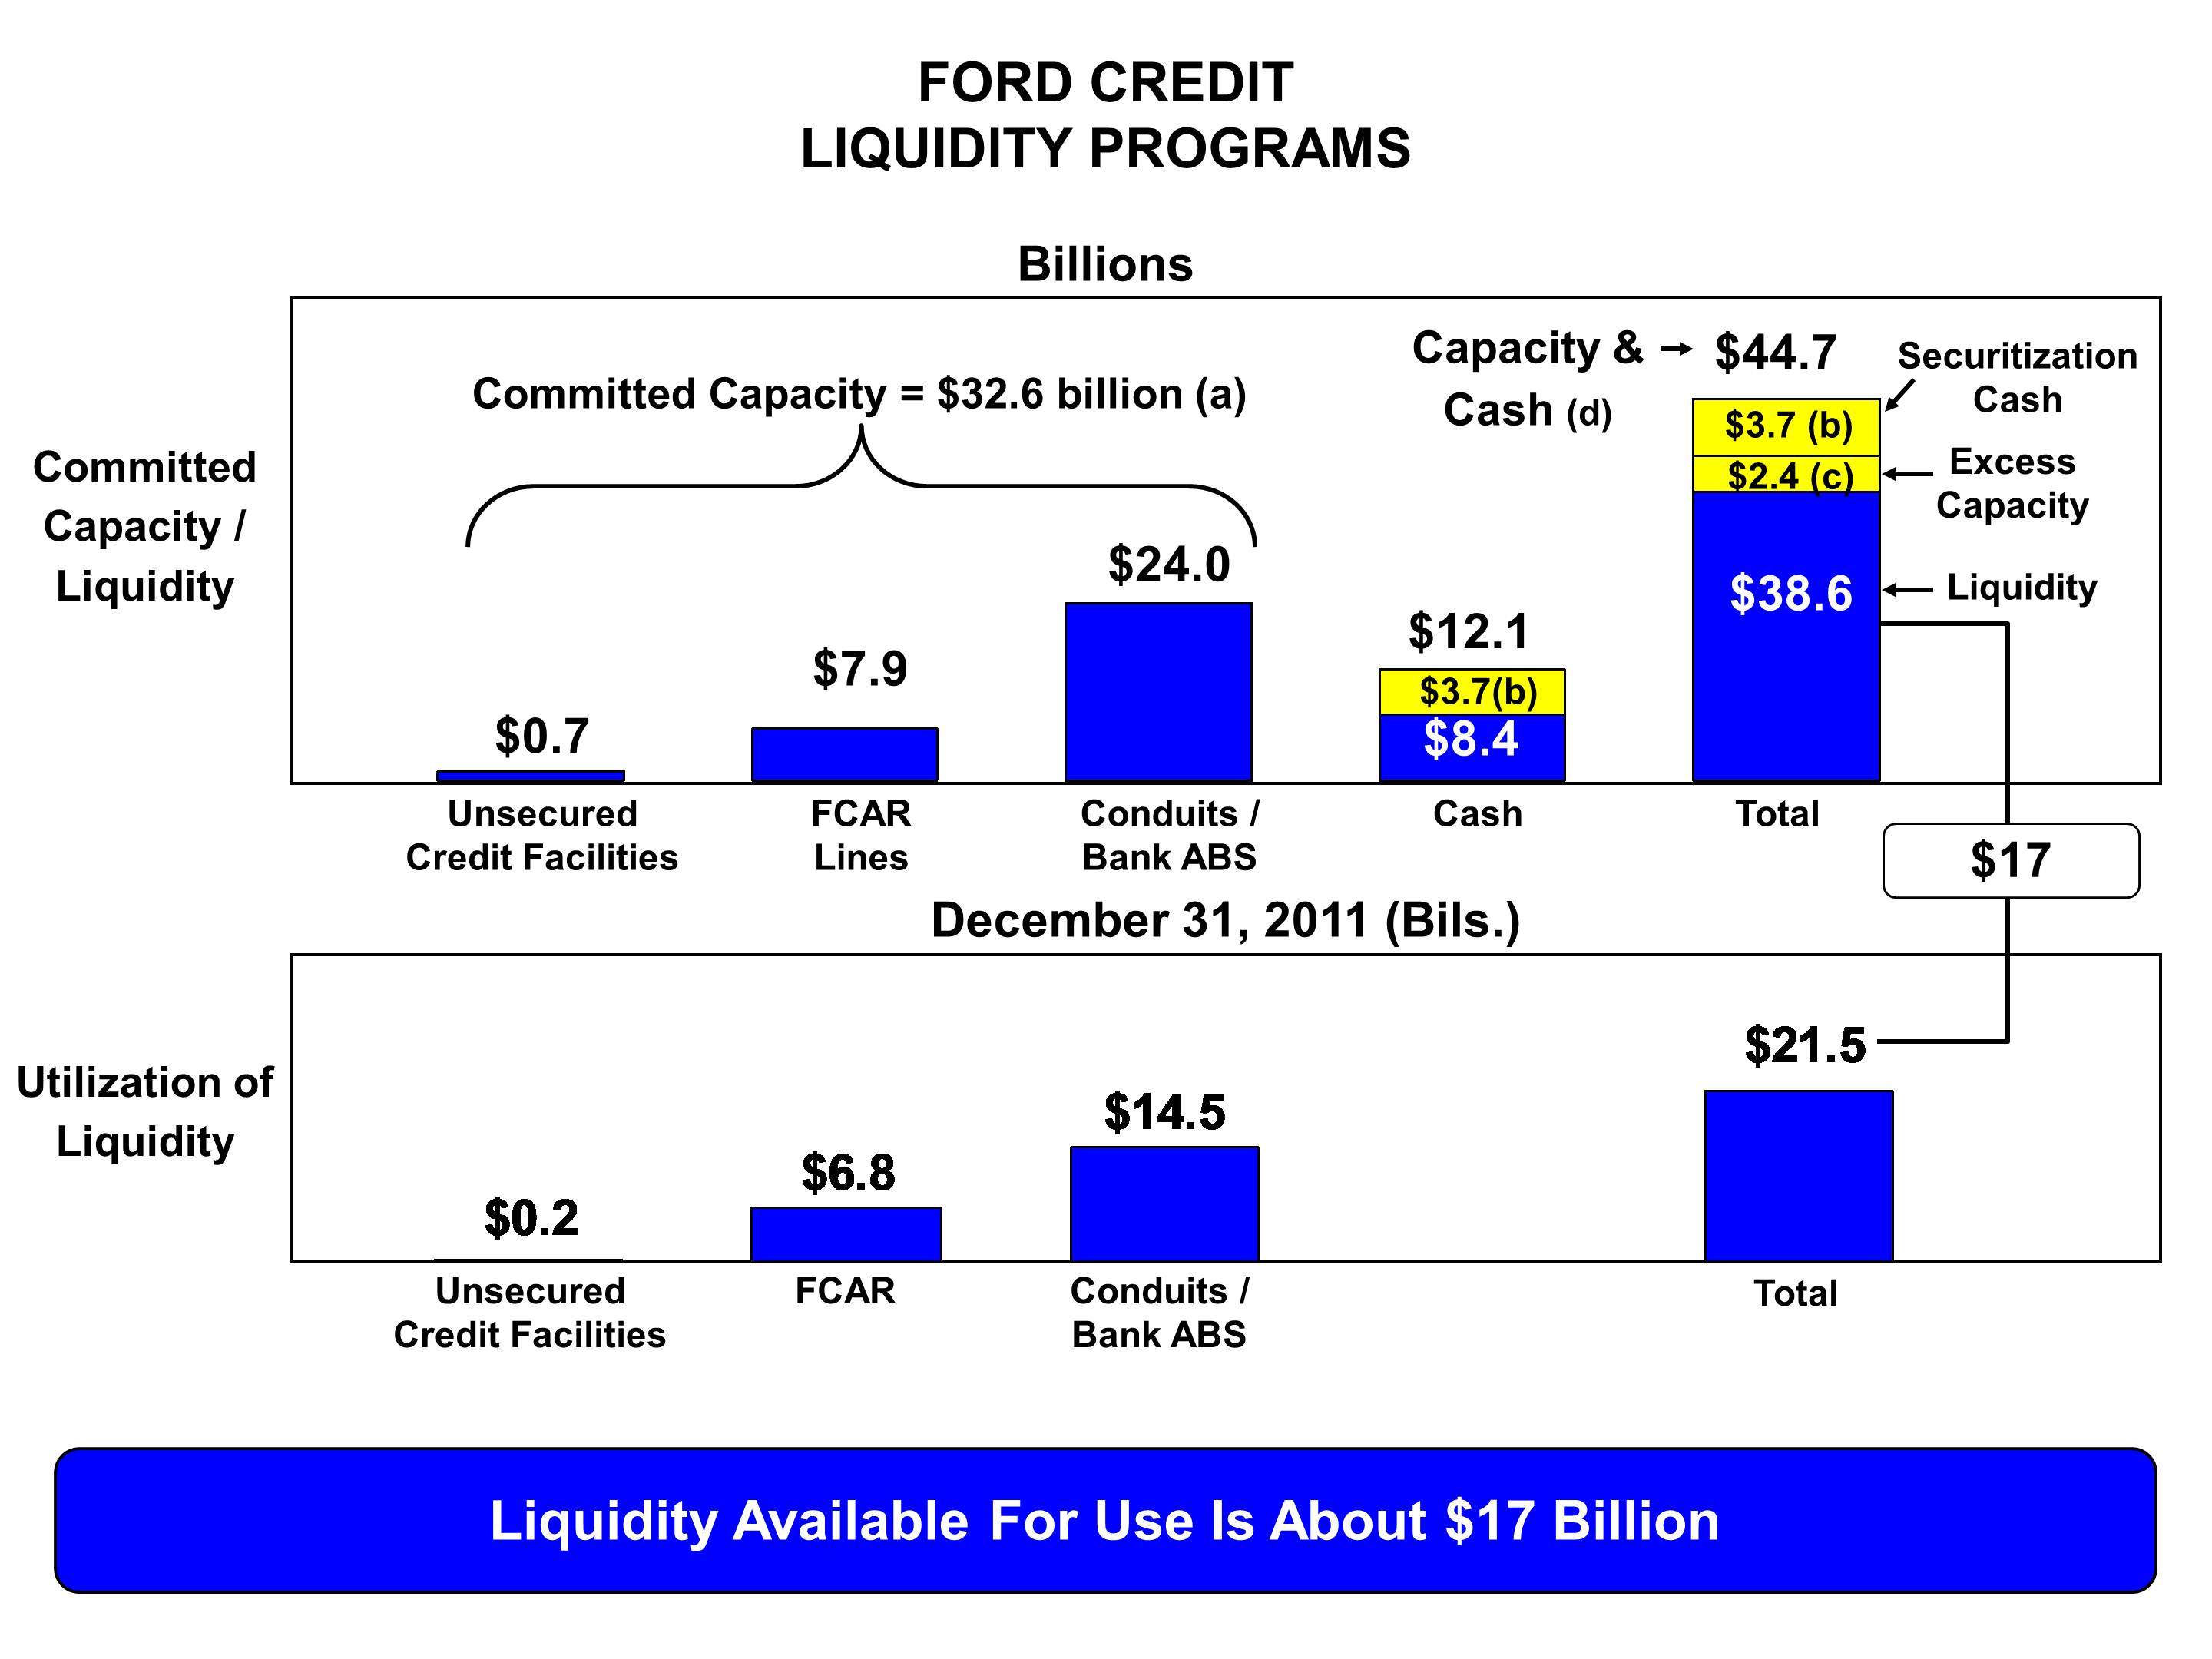
__________
* | Excludes |
| (a) | FCAR and conduits subject to availability of sufficient assets and ability to obtain derivatives to manage interest rate risk; FCAR commercial paper must be supported by bank lines equal to at least 100% of the principal amount; conduits include other committed securitization programs. |
| |
| (b) | Securitization cash is to be used only to support on-balance sheet securitization transactions. |
| |
| (c) | Excess capacity is capacity in excess of eligible receivables. |
| |
| (d) | Cash, cash equivalents, and marketable securities (excludes marketable securities related to insurance activities.activities). |
At December 31, 2009,2011 Ford Credit had $44.7 billion of committed capacity and cash. After excluding securitization cash shown above totaled $51.1and adjusting for available assets, liquidity was $38.6 billion, of which $39.4 billion could be utilized (after adjusting for capacity in excess of eligible receivables of $6.5 billion and cash required to support on-balance sheet securitization transactions of $5.2 billion). At December 31, 2009, $18.3$21.5 billion was utilized, leaving $21.1about
$17 billion of liquidity available for use (including $12.1use. Committed capacity at year-end was $32.6 billion, about $1.4 billion higher than at the end of the third quarter of 2011. Ford Credit ended the year with about $2.4 billion of cash, cash equivalents,excess committed capacity, providing a funding source for future originations and marketable securities, but excluding marketable securities relatedflexibility to insurance activitiestransfer capacity among markets and cash and cash equivalents to support on-balance sheet securitization transactions).asset classes where most needed.
At December 31, 2009,2011, Ford Credit's liquidity available for use was lower than year-end 20082010 by about $300 million, as$5.5 billion, reflecting cash payments for debt maturities, repurchases and cashcalls, distributions, and tax payments that were higher than the impact of lower receivablesliquidity generated from profits and new debt issuances. The reduction in liquidity available for use from year-end 2008 also included a $630 million cumulative adjustment, reflected in the first quarter of 2009, to correct for the overstatement of cash and cash equivalents and certain accounts payable that originated in prior periods. Liquidity available for use was 22% of managed receivables. In addition to the $21.1 billion of liquidity available for use, the $6.5 billion of capacity in excess of eligible receivables provides Ford Credit with an alternative for funding future purchases or originations and gives Ford Credit flexibility to shift capacity to alternate markets and asset classes.
ITEM 7. Management's Discussion and Analysis of Financial Condition and Results of Operations (continued)
Cash, Cash Equivalents, and Marketable Securities. At December 31, 2009,2011, Ford Credit's cash, cash equivalents, and marketable securities (excluding marketable securities related to insurance activities) totaled $17.3$12.1 billion, compared with $23.6$14.6 billion at year-end 2008.2010. In the normal course of Ford Credit'sits funding activities, itFord Credit may generate more proceeds than are required for Ford Credit'sits immediate funding needs. These excess amounts are maintained primarily as highly liquid investments, which provide liquidity for Ford Credit'sits short-term funding needs and give it flexibility in the use of Ford Credit'sits other funding programs. Ford Credit's cash, cash equivalents, and marketable securities are held primarily in highly liquid investments, which provide for anticipated and unanticipated cash needs. Ford Credit's cash, cash equivalents, and
Item 7. Management's Discussion and Analysis of Financial Condition and Results of Operations (continued)
marketable securities (excluding marketable securities related to insurance activities) primarily include U.S. Treasury obligations, federal agency securities, bank time deposits with investment-grade institutions and non-U.S. central banks, corporate investment-grade securities, A-1/P-1 (or higher) rated commercial paper, debt obligations of a select group of non-U.S. governments, non-U.S. government agencies, supranational institutions and money market funds that carry the highest possible ratings. Ford Credit currently does not hold cash, cash equivalents, or marketable securities consisting of investments in government obligations of Greece, Ireland, Italy, Portugal, or Spain, nor did Ford Credit hold any at December 31, 2011. The average maturity of these investments ranges from 90 days to up to one year and is adjusted based on market conditions and liquidity needs. Ford Credit monitors its cash levels and average maturity on a daily basis. Cash, cash equivalents, and marketable securities include amounts to be used only to support Ford Credit's securitization transactions of $3.7 billion and $4.2 billion at December 31, 2011 and 2010, respectively.
Ford Credit's substantial liquidity and cash balance have provided the opportunity to selectively call and repurchase its unsecured debt on the open market. For full year 2011, Ford Credit called about $1.1 billion of its unsecured debt maturities and repurchased about $1.2 billion.
Credit Facilities and Committed Liquidity Programs. See Note 1918 of the Notes to the Financial Statements for more information regarding credit facilities and committed liquidity programs for Ford Credit. While there is a risk of non-renewal of some of Ford Credit's committed liquidity programs, which could lead to a reduction in the size of these programs and/or higher costs, Ford Credit's capacity in excess of eligible receivables would enable it to absorb some reductions. Ford Credit's ability to obtain funding under these programs is subject to having a sufficient amount of assets eligible for these programs as well as its ability to obtain interest rate hedging arrangements for certain securitization transactions.
Balance Sheet Liquidity Profile. Ford Credit defines its balance sheet liquidity profile as the cumulative maturities of its finance receivables, investment in operating leases, and cash less the cumulative debt maturities over upcoming annual periods. The following tablechart shows Ford Credit's balance sheet liquidity profilecumulative maturities for the periods presented as of at
December 31, 2009 (in billions):2011:
| | | | |
| | | | | | | | | | | | Through 2013 and Thereafter | |
| Finance receivables (a), investment in operating leases (b), and cash (c) | | $ | 73.1 | | | $ | 95.0 | | | $ | 105.5 | | | $ | 113.3 | |
Debt | | | (49.9 | ) | | | (70.5 | ) | | | (81.7 | ) | | | (96.6 | ) |
| Finance receivables, investment in operating leases and cash over/(under) debt | | $ | 23.2 | | | $ | 24.5 | | | $ | 23.8 | | | $ | 16.7 | |

__________
| |
| (a) | FinanceIncludes finance receivables net of unearned income. |
(b) | Investmentincome, investment in operating leases net of accumulated depreciation. |
(c) | Cash includesdepreciation, cash and cash equivalents, and marketable securities (excludes marketable securities related to insurance activities) at December 31, 2009.. |
| |
| (b) | Retail and lease ABS are treated as amortizing immediately to match the underlying assets. |
| |
| (c) | Includes all of the wholesale ABS term and conduit maturities of $4.8 billion that otherwise contractually extend to 2013 and beyond. |
Item 7. Management's Discussion and Analysis of Financial Condition and Results of Operations (continued)
Ford Credit's balance sheet is inherently liquid because of the short-term nature of its finance receivables, investment in operating leases, and cash. Maturities of investment in operating leases consist primarily of rental payments attributable to depreciation over the remaining life of the lease and the expected residual value at lease termination. Maturities of finance receivables and investment in operating leases in the chart above include expected prepayments for our retail installment sale contracts and investment in operating leases. The 20102012 finance receivables maturities in the tablechart above also include all of the wholesale receivables maturities that are otherwise extending beyond 2010.2012. The tablechart above also reflects the following adjustments to debt maturities to match all of the asset-backed debt maturities with the underlying asset maturities:
· | The 2010 maturities include all of the wholesale securitization transactions that otherwise extend beyond 2010;The 2012 maturities include all of the wholesale securitization transactions, even if the maturities extend beyond 2012; and |
· | Retail securitization transactions under certain committed liquidity programs are treated as amortizing on January 1, 2010 instead of amortizing after the contractual maturity of those committed liquidity programs that otherwise extend beyond January 1, 2010. |
ITEM 7. Management's Discussion and Analysis of Financial Condition and Results of Operations (continued)
LeverageLeverage.. Ford Credit uses leverage, or the debt-to-equity ratio, to make various business decisions, including evaluating and establishing pricing for retail, wholesale, and lease financing, and assessing Ford Credit'sits capital structure. Ford Credit refers to its shareholder's interest as equity.
The following table shows the calculation of Ford Credit calculates leverage on aCredit's financial statement basis and on a managed basis using the following formulas:leverage at December 31 (in billions, except for ratios):
|
| | | | | | | | | | | |
| | 2011 | | 2010 | | 2009 |
| Total debt | $ | 84.7 |
| | $ | 82.9 |
| | $ | 96.3 |
|
| Equity | 8.9 |
| | 10.3 |
| | 11.0 |
|
| Financial statement leverage (to 1) | 9.5 |
| | 8.0 |
| | 8.8 |
|
The following table shows the calculation of Ford Credit's managed leverage at December 31 (in billions, except for ratios):
|
| | | | | | | | | | | |
| | 2011 | | 2010 | | 2009 |
| Total debt | $ | 84.7 |
| | $ | 82.9 |
| | $ | 96.3 |
|
| Securitized off-balance sheet receivables outstanding | — |
| | — |
| | 0.1 |
|
| Adjustments for cash, cash equivalents, and marketable securities (a) | (12.1 | ) | | (14.6 | ) | | (17.3 | ) |
| Adjustments for derivative accounting (b) | (0.7 | ) | | (0.3 | ) | | (0.2 | ) |
| Total adjusted debt | $ | 71.9 |
| | $ | 68.0 |
| | $ | 78.9 |
|
| | | | | | |
| Equity | $ | 8.9 |
| | $ | 10.3 |
| | $ | 11.0 |
|
| Adjustments for derivative accounting (b) | (0.2 | ) | | (0.1 | ) | | (0.2 | ) |
| Total adjusted equity | $ | 8.7 |
| | $ | 10.2 |
| | $ | 10.8 |
|
| Managed leverage (to 1) (c) | 8.3 |
| | 6.7 |
| | 7.3 |
|
________
Financial Statement Leverage | = | Total Debt | | | | | | | | | |
| (a) | | Equity | | | | | | | | | |
| | Total Debt | + | Securitized
Off-Balance
Sheet
Receivables
| - | Retained
Interest in
Securitized
Off-Balance
Sheet
Receivables
| - | Cash and Cash
Equivalents
and Marketable
Securities (a)
| - | Adjustments for
Derivative
Accounting on
Total Debt (b)
| |
Managed Leverage | = | | |
| | | | | | Equity | - | Adjustments
for Derivative
Accounting
on Equity (b)
| | | Excludes marketable securities related to insurance activities. |
__________
(a) Excluding marketable securities related to insurance activities.
| |
| (b) | Primarily related to market valuation adjustments to derivatives due to movements in interest rates. Adjustments to debt are related to designated fair value hedges and adjustments to equity are related to retained earnings. |
The following table illustrates the calculation of Ford Credit's financial statement leverage (in billions, except for ratios):
| | | | |
| | | | | | | | | | |
Total debt | | $ | 96.3 | | | $ | 126.5 | | | $ | 139.4 | |
Equity | | | 11.0 | | | | 10.6 | | | | 13.4 | |
Financial statement leverage (to 1) | | | 8.8 | | | | 12.0 | | | | 10.4 | |
The following table illustrates the calculation of Ford Credit's managed leverage (in billions, except for ratios):
| | | | |
| | | | | | | | | | |
Total debt | | $ | 96.3 | | | $ | 126.5 | | | $ | 139.4 | |
Securitized off-balance sheet receivables outstanding | | | 0.1 | | | | 0.6 | | | | 6.0 | |
Retained interest in securitized off-balance sheet receivables | | | — | | | | (0.1 | ) | | | (0.7 | ) |
Adjustments for cash, cash equivalents, and marketable securities (a) | | | (17.3 | ) | | | (23.6 | ) | | | (16.7 | ) |
Adjustments for derivative accounting (b) | | | (0.2 | ) | | | (0.4 | ) | | | — | |
Total adjusted debt | | $ | 78.9 | | | $ | 103.0 | | | $ | 128.0 | |
| | | | | | | | | | | | | |
Equity | | $ | 11.0 | | | $ | 10.6 | | | $ | 13.4 | |
Adjustments for derivative accounting (b) | | | (0.2 | ) | | | (0.2 | ) | | | (0.3 | ) |
Total adjusted equity | | $ | 10.8 | | | $ | 10.4 | | | $ | 13.1 | |
Managed leverage (to 1) | | | 7.3 | | | | 9.9 | | | | 9.8 | |
__________
(a) Excluding marketable securities related to insurance activities.
(b) | Primarily related to market valuation adjustments to derivatives due to movements in interest rates. Adjustments to |
| (c) | Equals total adjusted debt are related to designated fair value hedges and adjustments to equity are related to retained earnings.over total adjusted equity. |
Ford Credit believes that managed leverage is useful to its investors because it reflects the way Ford Credit manages its business. Ford Credit retains interests in receivables sold in off-balance sheet securitization transactions and, with respect to subordinated retained interests, is exposed to credit risk. Accordingly, Ford Credit evaluates charge-offs, receivables, and leverage on a managed as well as a financial statement basis. Ford Credit also deducts cash and cash equivalents, and marketable securities (excluding marketable securities related to insurance activities) because they generally correspond to excess debt beyond the amount required to support its operations and amounts to support on-balance sheet securitization transactions. Ford Credit makes derivative accounting adjustments to its assets, debt, and equity positions to reflect the impact of interest rate instruments Ford Credit uses in connection with its term-debt issuances and securitization transactions. The derivative accounting adjustments related to these instruments vary over the term of the underlying debt and securitized funding obligations based on changes in market interest rates. Ford Credit generally repays its debt obligations as they mature. As a result, Ford Credit excludes the impact of these derivative accounting adjustments on both the numerator and denominator in order to exclude the interim effects of changes in market interest rates. Ford Credit believes the managed leverage measure provides its investors with meaningful information regarding management's decision-making processes.
ITEMItem 7. Management's Discussion and Analysis of Financial Condition and Results of Operations (continued)
Ford Credit plans its managed leverage by considering prevailing market conditions and the risk characteristics of its business. At December 31, 2009,2011, Ford Credit's managed leverage was 7.38.3 to 1 compared with 9.96.7 to 1 a year ago. Ford Credit's managed leverage isat December 31, 2010, significantly below the threshold of 11.5 to 1 set forth in the Amended and Restated Support Agreement with us. In 2009,By mid-decade, Ford Credit distributed $1.5expects its leverage to be in the range of 10 - 11 to 1. In 2011, Ford Credit paid $3 billion in distributions to its parent, which included in the first quarter of 2009 a non-cash distribution of about $1.1 billion and in the third quarter of 2009 a cash distribution of $400 million and a non-cash distribution of $31 million for Ford Credit's ownership interest in AB Volvofinans.parent.
Securitization Transactions by Ford Credit
Securitization. Ford Credit securitizes finance receivables and net investment in operating leases through a variety of programs, utilizingusing amortizing, variable funding, and revolving structures. Ford Credit also sells finance receivables in structured financing transactions. Due to the similarities between securitization and structured financing, Ford Credit refers to structured financings as securitization transactions. Ford Credit's securitization programs are targeted to many different institutional investors in both public and private transactions in capital markets worldwide. Ford Credit completed its first securitization transaction in 1988, and regularly securitizes assets, purchased or originated, in the United States, Canada, Mexico, and Europe.European countries.
MostAll of Ford Credit's securitization transactions do not satisfyinvolve sales to consolidated entities or Ford Credit maintains control over the requirements for accounting sale treatment,assets, and, therefore, the securitized assets and related debt remain on Ford Credit'sits balance sheet. Some of Ford Credit's securitization transactions, however, do satisfy accounting sale treatment and are not reflected on Ford Credit's balance sheet in the same way as debt funding. All of Ford Credit's securitization transactions since the first quarter of 2007 have been on-balance sheet transactions. Both on- and off-balance sheet securitizationSecuritization transactions have an effect on itsFord Credit's financial condition, operating results, and liquidity.
Ford Credit securitizes its assets because the securitization market provides it with a lower cost source of funding compared with unsecured debt given Ford Credit's present credit ratings, and it diversifies Ford Credit's funding among different markets and investors. In the United States, Ford Credit is, generallyin most cases, able to obtain funding in two days for its unutilized capacity in most of its committed liquidity programs. New programs and new transaction structures typically require substantial development time before coming to market.
In a securitization transaction, the securitized assets are generally held by a bankruptcy-remote special purpose entity ("SPE") in order to isolate the securitized assets from the claims of Ford Credit's other creditors and ensure that the cash flows on the securitized assets are available for the benefit of securitization investors. As a result, payments to securitization investors are based on the creditworthiness of the securitized assets and any enhancements, and not on Ford Credit's creditworthiness. Senior asset-backed securities issued by the SPEs generally receive the highest short-term credit ratings and among the highest long-term credit ratings from the rating agencies that rate them.
Securitization SPEs have limited purposes and generally are only permitted to purchase the securitized assets, issue asset-backed securities, and make payments on the securities. Some SPEs, such as certain trusts that issue securities backed by retail installment sale contracts, only issue a single series of securities and generally are dissolved when those securities have been paid in full. Other SPEs, such as the trusts that issue securities backed by wholesale receivables, issue multiple series of securities from time to time and are not dissolved until the last series of securities is paid in full.
Ford Credit's use of SPEs in its securitization transactions is consistent with conventional practices in the consumer asset-backed securitization industry. Ford Credit sponsors the SPEs used in all of its securitization programs with the exception of bank-sponsored conduits. None of Ford Credit's officers, directors, or employees holds any equity interests in its SPEs or receives any direct or indirect compensation from the SPEs. These SPEs do not own Ford Credit's Sharesshares or shares of any of its affiliates.
In order to be eligible for inclusion in a securitization transaction, each asset must satisfy certain eligibility criteria designed for the specific transaction. For example, for securitization transactions of retail installment sale contracts, the selection criteria may be based on factors such as location of the obligor, contract term, payment schedule, interest rate, financing program, the type of financed vehicle, and whether the contracts are active and in good standing (e.g., when the obligor is not more than 30-days delinquent or bankrupt). Generally, Ford Credit selects the assets to be included in a particular securitization randomly from its entire portfolio of assets that satisfy the applicable eligibility criteria.
Ford Credit provides various forms of credit enhancements to reduce the risk of loss for securitization investors. Credit enhancements include over-collateralization (when the principal amount of the securitized assets exceeds the principal amount of related asset-backed securities), segregated cash reserve funds, subordinated securities, and excess spread (when interest collections on the securitized assets exceed the related fees and expenses, including interest payments on the related asset-backed securities). Ford Credit may also provide payment enhancements that increase the likelihood of the timely payment of interest and the payment of principal at maturity. Payment enhancements include yield supplement arrangements, interest rate swaps, and other hedging arrangements, liquidity facilities, and certain cash deposits.
ITEMItem 7. Management's Discussion and Analysis of Financial Condition and Results of Operations (continued)
Ford Credit retains interests in its securitization transactions, including senior andprimarily subordinated securities issued by the SPE, rights to cash held for the benefit of the securitization investors (for example, a reserve fund), and residual interests. Residual interests represent the right to receive collections on the securitized assets in excess of amounts needed to pay securitization investors and to pay other transaction participants and expenses. Ford Credit retains credit risk in securitization transactions because its retained interests include the most subordinated interests in the securitized assets and are structured to absorb expected credit losses on the securitized assets before any losses would be experienced by investors. Based on past experience, Ford Credit expects that any losses in the pool of securitized assets would likely be limited to its retained interests.
Ford Credit is engaged as servicer to collect and service the securitized assets. Its servicing duties include collecting payments on the securitized assets and preparing monthly investor reports on the performance of the securitized assets and on amounts of interest and/or principal payments to be made to investors. While servicing securitized assets, Ford Credit applies the same servicing policies and procedures that Ford Credit applies to its owned assets and maintains its normal relationship with its financing customers.
Ford Credit generally has no obligation to repurchase or replace any securitized asset that subsequently becomes delinquent in payment or otherwise is in default. Securitization investors have no recourse to Ford Credit or its other assets for credit losses on the securitized assets and have no right to require Ford Credit to repurchase theirthe investments. Ford Credit does not guarantee any asset-backed securities, although it is the co-obligor of the debt of a consolidated VIE up to $250 million for two of its securitization transactions, and has no obligation to provide liquidity or make monetary contributions or contributions of additional assets to its SPEs either due to the performance of the securitized assets or the credit rating of its short-term or long-term debt. However, as the seller and servicer of the securitized assets, Ford Credit is obligated to provide certain kinds of support to its securitization transactions, which are customary in the securitization industry. These obligations include indemnifications, repurchase obligations on assets that do not meet representations or warranties on eligibility criteria or that have been materially modified, the mandatory sale of additional assets in revolving transactions, and, in some cases, servicer advances of certain amounts.
Risks to Continued Funding under Securitization Programs. The following securitization programs contain structural features that could prevent Ford Credit from using these sources of funding in certain circumstances:
· | Retail Securitization. If the credit enhancement on any asset-backed security held by FCAR is reduced to zero, FCAR may not purchase any additional asset-backed securities or issue additional commercial paper and would wind down its operations. In addition, if credit losses or delinquencies in Ford Credit's portfolio of retail assets exceed specified levels, FCAR is not permitted to purchase additional asset-backed securities for so long as such levels are exceeded. |
· | Retail Conduits. If credit losses or delinquencies on the pool of assets held by a conduit exceed specified levels, or if the level of over-collateralization or credit enhancements for such pool decreases below a specified level, Ford Credit will not have the right to sell additional pools of assets to that conduit. |
· | Wholesale Securitization. If the payment rates on wholesale receivables in the securitization trust are lower than specified levels or if there are significant dealer defaults, Ford Credit will be unable to obtain additional funding and any existing funding would begin to amortize. |
· | Retail Warehouse. Lease Warehouse. If credit losses or delinquencies in Ford Credit's portfolio of retail assets exceed specified levels, Ford Credit will be unable to obtain additional funding from the securitization of retail installment sale contracts through its retail lease contracts exceed specified levels, Ford Credit will be unable to obtain additional funding from the securitization of retail lease contracts through its lease warehouse facility (i.e., a short-term credit facility under which draws are backed by the retail lease contracts). |
· | Lease Warehouse. If credit losses or delinquencies in Ford Credit's portfolio of retail lease contracts exceed specified levels, Ford Credit will be unable to obtain additional funding from the securitization of retail lease contracts through its lease warehouse facility (i.e., a credit facility under which draws are backed by the retail lease contracts).
|
In the past, these features have not limited Ford Credit's ability to use securitization to fund its operations.
ITEM 7. Management's Discussion and Analysis of Financial Condition and Results of Operations (continued)
In addition to the specific transaction-related structural features discussed above, Ford Credit's securitization programs may be affected by the following factors: market disruption and volatility, the market capacity for Ford Credit and Ford Credit's sponsored investments, the general demand for the type of assets supporting the asset-backed securities, the availability of committed liquidity facilities, the amount and credit quality of assets available, the performance of assets in its previous securitization transactions, accounting and regulatory changes, and Ford Credit's credit ratings. In addition, a bankruptcy of Ford, Ford Credit, or FCE would cause certain of Ford Credit's funding transactions to amortize and result in a termination of certain liquidity commitments. If, as a result of any of these or other factors, the cost of securitization funding were to increase significantly or funding through securitization transactions were no longer available to Ford Credit, it would have a material adverse impact on Ford Credit's financial condition and results of operations, which could adversely affect its ability to support the sale of Ford vehicles.
Item 7. Management's Discussion and Analysis of Financial Condition and Results of Operations (continued)
On-Balance Sheet Arrangements
MostAll of Ford Credit's securitization transactions do not satisfyinvolve sales to consolidated entities or it maintains control over the requirements for accounting sale treatmentassets and, therefore, the securitized assets and related debt are included inremain on Ford Credit's financial statements. Ford Credit expects its future securitization transactions to be on-balancebalance sheet. Ford Credit believes on-balance sheet arrangements are more transparent to its investors. Securitized assets are only available to repay the related asset-backed debt and to pay other securitization investors and other participants. These underlyingThe securitized assets are available only for payment of the debt and other obligations issued or arising in the securitization transactions; theytransactions. They are not available to pay Ford Credit's other obligations or the claims of its other creditors. Ford Credit holds the right to the excess cash flows not needed to pay the debt and other obligations issued or arising in each of thesethe securitization transactions. This debt is not Ford Credit's legal obligation ornor the legal obligation of its other subsidiaries. Assets and associated liabilities related to Ford Credit's on-balance sheet securitization transactions areat December 31 were as follows (in billions):
| | | | | | | | |
Total outstanding principal amount of finance receivables and net investment in operating leases included in on-balance sheet securitizations | | $ | 74.8 | | | $ | 89.3 | | |
| | | | 2011 | | 2010 |
| Total outstanding principal amount of finance receivables and net investment in operating leases included in on-balance sheet securitization transactions are as follows (in billions): | | $ | 62.2 |
| | $ | 60.7 |
|
| Cash balances to be used only to support the on-balance sheet securitizations | | | 5.2 | | | | 5.5 | | 3.7 |
| | 4.2 |
|
| Debt payable only out of collections on the underlying securitized assets and related enhancements | | | 52.9 | | | | 72.2 | | 46.7 |
| | 43.6 |
|
See Note 1918 of the Notes to the Financial Statements for more information regarding on-balance sheet securitization transactions.
Off-Balance Sheet Arrangements
We have entered into various arrangements not reflected on our balance sheet that have or are reasonably likely to have a current or future effect on our financial condition, results of operations or liquidity. These include securitizations by Ford Credit in off-balance sheet transactions, variable interest entities ("VIEs") and guarantees. For a discussion of our VIEs and guarantees, see Notes 13 and 31, respectively, of the Notes to the Financial Statements.
Ford Credit has not entered into any off-balance sheet arrangements (off-balance sheet securitization transactions and whole-loan sale transactions, excluding sales of businesses and liquidating portfolios) since the first quarter of 2007, which is consistent with Ford Credit's plan to execute on-balance sheet securitization transactions.
Total Company
Equity/(Deficit). At December 31, 2009, 2011, Total equity/(deficit) attributable to Ford Motor Company was negative $7.8$15 billion, an improvement of $7.9$15.7 billion compared with December 31, 2008.2010. The improvement is more thanprimarily explained by favorable changes in Capital in excess of par value of stockRetained earnings, (primarily the various equity issuances ($1.9 billion), the conversion of a portion of the 2036 Convertible Notes ($1.4 billion), the issuance of warrantsprimarily related to the UAW Amended Settlement Agreement ($1.2 billion), the equity component related to the issuance of the 2016 Convertible Notes (about $700 million), and the debt securities exchanged for equity (about $600 million)); and favorable changes in Retained earnings (primarily related to 20092011 net income attributable to Ford ($2.7 billion)).of $20.2 billion, offset partially by cash dividends declared of $190 million. The changes in Retained earnings are offset partially by unfavorable changes in Accumulated other comprehensive income/(loss), primarily related to pension and OPEB adjustments of $3.6 billion and currency translation of $718 million.
ITEM 7. Management's Discussion and Analysis of Financial Condition and Results of Operations (continued)
Credit Ratings. Our short-term and long-term debt is rated by four credit rating agencies designated as NRSROs by the SEC:U.S. Securities and Exchange Commission:
· | Moody's Investors Service, Inc. ("Moody's"); and |
· | Standard & Poor's Ratings Services, a division of The McGraw-Hill Companies, Inc. ("S&P"). |
In several markets, locally recognizedlocally-recognized rating agencies also rate us. A credit rating reflects an assessment by the rating agency of the credit risk associated with a corporate entity or particular securities issued by that entity. TheirRating agencies' ratings of us are based on information provided by us and other sources. Credit ratings are not recommendations to buy, sell, or hold securities, and are subject to revision or withdrawal at any time by the assigning rating agency. Each rating agency may have different criteria for evaluating company risk and, therefore, ratings should be evaluated independently for each rating agency. Lower credit ratings generally result in higher borrowing costs and reduced access to capital markets.
The following rating actions There have been no ratings actions taken by these NRSROs since October 1, 2009:
Ford | On November 2, 2009, DBRS placed Ford's long-term credit ratings under review with positive implications; Fitch revised Ford's outlook to positive from stable; and Moody's raised Ford's corporate rating to B3 from Caa1, its senior unsecured rating to Caa1 from Caa2, and its senior secured rating to Ba3 from B1. Moody's outlook for Ford remains stable.
On November 3, 2009, S&P upgraded Ford's corporate rating to B- from CCC+, its senior secured rating to B- from CCC+, and its senior unsecured rating to CCC from CCC-. S&P's ratings outlook for Ford remains stable.
On December 1, 2009, DBRS upgraded Ford's issuer Rating to B(low) from CCC(high) and upgraded Ford's senior secured rating to B(high) from B(low). DBRS' outlook for Ford remains stable. Also on December 1, Fitch Ratings upgraded Ford's senior secured rating to B+ from B, with a positive outlook.
On January 11, 2010, Fitch upgraded Ford's corporate rating to B- from CCC and the senior secured rating to BB- from B+; the outlook remains positive.
|
| |
Ford Credit | On November 2, 2009, DBRS placed Ford Credit's ratings under review with positive implications; Fitch revised Ford Credit's outlook to positive from stable; and Moody's upgraded Ford Credit's senior unsecured rating to B3 from Caa1 while keeping its credit ratings under review for a possible upgrade.
On November 3, 2009, S&P upgraded Ford Credit's senior unsecured rating to B- from CCC+ with a stable outlook.
On December 1, 2009, DBRS upgraded Ford Credit's corporate and senior unsecured ratings to B from B (low) with a stable outlook.
On January 11, 2010, Fitch upgraded Ford Credit's corporate rating to B- from CCC, the senior unsecured rating to B+ from B, and the short-term rating to B from C; the outlook remains positive.
|
the filing of our Quarterly Report on Form 10-Q for the quarter ended September 30, 2011. The following chart summarizes certain of the credit ratings and the outlook presently assigned to Ford and Ford Credit by these four NRSROs:
|
| | | | | | | | | | | | | |
| | |
| | Ford | | Ford Credit |
| | Issuer Default/ Corporate/ Issuer Rating | | | | Senior Secured | | | | | | | | Short-Term Unsecured | | | | |
| DBRS | B (low) | | CCCBB | | B (high) | | BBB (low) | | Stable | | BBB (high) | | R-5R-4 | | Stable |
| Fitch | B-BB+ | | CCBB+ | | BB-BBB- | | Positive | | B+BB+ | | B | | Positive |
| Moody's | B3Ba1 | | Caa1Ba2 | | Ba3Baa2 | | Positive | | Ba1 | | NP | | Positive |
| S&P | BB+ | | BB+ | | BBB | | Stable | | B3 | | NP | | Review |
S&P | B- | | CCC | | B- | | Stable | | B- *BB+ (a) | | NR | | Stable |
__________
* S&P assigns FCE a long-term senior unsecured rating of B, maintaining a one notch differential versus Ford Credit.
| |
| (a) | S&P assigns FCE a long-term senior unsecured rating of BBB-, maintaining a one notch differential versus Ford Credit. |
ITEMItem 7. Management's Discussion and Analysis of Financial Condition and Results of Operations (continued)
OUTLOOK
Although a global economic recovery is underway, the economic environment remains uncertain. We are encouraged by our strong progress, and believe that in the face of this uncertainty, our One Ford plan –- to aggressively restructure our business to operate profitably, at current demand and changing model mix, accelerate development of new products customers want and value, finance our plan and improvestrengthen our balance sheet, and work together effectively as one team to leverageleveraging our global resources –assets - provides the right strategy to achieve our objectives. For additional discussion of the economic environment, and discussion and assessment of the risks and opportunities with regard to our planning assumptions, see our "Risk Factors" and "Overview" discussion above, and "Critical Accounting Estimates" discussion below.
Our projection of upcomingprojected vehicle production (including Ford-badged vehicles manufactured by unconsolidated affiliates and non-Ford-badged vehicles manufactured by Ford or its consolidated affiliates)for the first quarter of 2012 is as follows (in thousands):
| | | | | | | First Quarter 2012 (a) |
| | | | | | Over/(Under) First Quarter 2009 | | Planned Vehicle Unit Production | | Over/(Under) First Quarter 2011 |
Ford North America | | | 570 | | | | 221 | | 675 |
| | 18 |
|
Ford South America | | | 111 | | | | 12 | | 100 |
| | (12 | ) |
Ford Europe | | | 440 | | | | 97 | | 410 |
| | (36 | ) |
Ford Asia Pacific Africa | | | 147 | | | | 49 | | 215 |
| | (21 | ) |
Volvo | | | 93 | | | | 28 | | |
| Total | | 1,400 |
| | (51 | ) |
__________
| |
| (a) | Includes production of Ford and JMC brand vehicles to be sold by our unconsolidated affiliates. |
The increaseyear-over-year decline in first quarter 2010planned production comparedreflects lower industry demand in Europe and launch-related effects of new products in Asia Pacific Africa. Our planned production level is consistent with a year ago reflects strong customer demand for our products, and the non-recurrence of prior-year dealer stock declines. disciplined strategy to match production with consumer demand.
We expect gradual improvementglobal economic growth to continue at a pace of about 3% during 2012. Economic growth in the United States is expected to be in the range of 2% to 3% for the year. Growth in Europe, however, remains very challenging. We expect weak conditions in Europe, with some markets doing better than others, while fiscal austerity programs are implemented. Several key emerging markets, including China, Brazil, India, Indonesia, Thailand, and Turkey, have entered cycles of fiscal policy easing to support economic growth.
Despite recent declines, we expect commodity prices over the longer term to continue to trend upward given global demand growth.
Overall, we expect the global business environment will favor automotive industry growth in 2012, with global industry sales volume during 2010, but significant uncertainties remain. As a resultprojected to be about 80 million units, up from about 76 million units in 2011. In light of the very effective 2009 scrappage programs in Europe, we expect vehicle demand in that region to be lower in 2010, particularly in Germany.volatile external environment, however, 2012 industry sales volume could range between 75 million units and 85 million units.
Item 7. Management's Discussion and Analysis of Financial Condition and Results of Operations (continued)
Our planning assumptions and key metrics for 2010 include2011, along with our actual results, included the following:
Industry Volume (a)
|
| | | | |
| | 2011 Full-Year Plan | | 2011 Full-Year Results |
(millionIndustry Volume (million units) (a) | | | | |
–United–United States
| | 11.513.0 – 12.5 | |
–Europe (b)
13.5 | | 13.5 13.0 |
– 14.5Europe (b) | | 14.5 – 15.5 | | 15.3 |
| | | | |
Operational Metrics (c) | | | | |
| Compared with prior year: | | | |
–Quality | | Improve | |
–Automotive Structural Costs (d)
| | Somewhat Higher | |
–U.S.–U.S. Market Share (Ford Lincoln Mercury) | | Equal / Improve | | 16.5% (up 0.1 ppt.) |
–U.S. –U.S. Retail Share of Retail Market
(c) | | Equal / Improve | | 14.0% (equal) |
–Europe–Europe Market Share (b)
(b) | | Equal / Improve | | 8.3% (down 0.1 ppt.) |
Absolute Amount:–Quality | | Improve | | Mixed |
| | | | |
Financial Metrics | | | | |
| Compared with prior year: | | | | |
| –Total Company Pre-Tax Operating Profit (d) | | Improve | | $8.8 Bils. (up $0.5 Bils.) |
| –Automotive Structural Costs (e) | | Higher | | $1.4 Bils. Higher |
| –Commodity Costs (Incl. Hedging) | | Higher | | $2.3 Bils. Higher |
| –Automotive Operating Margin (d) | | Equal / Improve | | 5.4% (down 0.7 ppt.) |
–Automotive Operating-Related Cash Flow (e)(f) | | PositiveImprove | | $5.6 Bils. (up $1.2 Bils.) |
| Absolute amount: | | | | |
–Capital–Capital Spending | | $4.5 Billion – $5$5.5 Billion | | $4.3 Billion |
__________
(a) Includes medium and heavy trucks.
(b) For the 19 markets we track in Europe as defined in Item 1.
(c) Excludes Volvo, and reflects new accounting standard effective January 1, 2010 related to the consolidation of variable interest entities.
| |
| (a) | Includes medium and heavy trucks. |
| |
| (b) | For the 19 markets we track. |
| |
| (c) | Current quarter estimated; prior periods based on latest Polk data. |
| |
| (d) | Excludes special items; Automotive operating margin defined as Automotive pre-tax results excluding Other Automotive divided by Automotive revenue. |
| |
| (e) | Structural cost changes are measured primarily at constantpresent-year exchange, and exclude special items and discontinued operations. |
(e) See "Liquidity and Capital Resources" discussion above for reconciliation to U.S. GAAP.
| |
| (f) | See "Liquidity and Capital Resources" discussion above for reconciliation of any datapoints to GAAP. |
Although we see improvement in leadingWithin the current economic indicators inenvironment, our major marketsplanning assumptions and financial markets have continued to normalize with ongoing policy support, low levels of consumer confidence and continuing labor market weakness present a challenge tokey metrics for 2012 include the near-term economic outlook (particularly for the United States and Europe). The outlook for consumer spending in the United States and Europe remains weak, with below-trend growth likely in 2010. In addition, our suppliers and dealers have been weakened by the global economic downturn.following:
Commodity prices have begun to increase with the emergence of initial signs of economic recovery, and we anticipate this trend will continue in 2010. Our business also will continue to be affected by currency volatility.
We experienced significant positive net pricing in 2009; we expect year-over-year improvement in 2010, but this will be a smaller magnitude than in 2009.
79 |
| | |
| | 2012 Full-Year Plan |
| Industry Volume (million units) (a) | | |
| –United States | | 13.5 – 14.5 |
| –Europe (b) | | 14.0 – 15.0 |
| | |
| Operational Metrics | | |
| Compared with prior year: | | |
| –U.S. Market Share | | About Equal |
| –Europe Market Share (b) | | About Equal |
| –Quality | | Improve |
| | |
| Financial Metrics | | |
| Compared with prior year: | | |
| –Automotive Pre-Tax Operating Profit (c) | | Higher |
| –Ford Credit Pre-Tax Operating Profit | | Lower |
| –Total Company Pre-Tax Operating Profit (c) | | About Equal |
| –Automotive Structural Cost Increase (d) | | Less than $2 Billion |
| –Automotive Operating Margin (c) | | Improve |
| | |
| Absolute amount: | | |
| –Capital Spending | | $5.5 Billion – $6 Billion |
__________ | |
| (a) | Includes medium and heavy trucks. |
| |
| (b) | For the 19 markets we track. |
| |
| (c) | Excludes special items; Automotive operating margin defined as Automotive pre-tax results excluding Other Automotive divided by Automotive revenue. |
| |
| (d) | Structural cost changes are measured primarily at present-year exchange, and exclude special items and discontinued operations. |
ITEMItem 7. Management's Discussion and Analysis of Financial Condition and Results of Operations (continued)
We see both challenges and opportunities in the current environment. While the uncertainty surrounding the European debt crisis and its impact on the global economy presents a challenge for all, our strong product portfolio and the prospect of global economic growth offer opportunities for our business going forward.
As reported,Although we will monitor closely the economic environment throughout the year, we have achieved significant structural cost reductions overestablished the past four years;key planning assumptions and metrics listed in 2010,the table above. As indicated, we expect full-year industry volume to range from 13.5 million to 14.5 million units in the United States, and 14 million to 15 million units for the 19 markets we track in Europe. We project full-year market share in the United States and Europe will be about equal compared with 2011. For quality, we expect to deliver year-over-year improvement.
Compared with 2011, we expect the following 2012 financial performance, excluding special items:
Automotive pre-tax operating profit to improve
Ford Credit to be solidly profitable, although at a lower level
Total Company pre-tax operating profit to be about equal
Automotive structural costs to be somewhat higherincrease by less than $2 billion as we increase productionsupport higher volumes, new product launches, and growth plans
Automotive operating margin to meet demand.improve
We expect that full-year 2010 Automotive operating-related cash flow will be positive, though less than the run rate implied by our strong second half 2009 cash flow. Our recent performance was heavily influenced by seasonal factors, including normal year-end inventory reductions, and significant non-recurring factors such as tax refunds and higher production to rebuild depleted dealer stocks.
Capitalcapital spending in 2010 is expected to be in thea range of $4.5$5.5 billion to $5$6 billion as we continue to focus oninvest in our product plan. This planning assumption for capital spending excludes Volvobusiness, and joint ventures that are being deconsolidated under the new accounting standard effective January 1, 2010. Onwe expect a comparable basis, planned 2010 capital spending isnon-material increase in our commodity costs in 2012 compared with 2011. We expect net interest in 2012 to be about $1 billion higher than our actual 2009 spending.equal to 2011; while interest expense will be reduced reflecting lower debt levels, lower interest rates result in reduced interest income.
We have excluded Volvo from our 2010 planning assumptions based on its held-for-sale status. As announced, we have settled on substantive terms for the salediscussed in "Results of Volvo to Zhejiang Geely Group Holding Co. Ltd. While some work still remains relating to final documentation, financing and government approvals,Operations" above, we expect Ford North America to reach a definitive sales agreementcontinue as the core of our Automotive operations, with improved profitability for full-year 2012 compared with 2011. Looking ahead for Ford South America, competition in the first quarterregion is intensifying with a number of 2010, with closingmanufacturers substantially increasing capacity and also importing new products into the region. Against this background, we expect Ford South America to continue to generate solid profitability for 2012, although somewhat lower than 2011. We are continuing to work on actions to strengthen our competitiveness in the region's changing environment; these actions include fully leveraging our One Ford plan, including the introduction of an all-new lineup of global products over the sale likely to occurnext two years starting in the second quarterhalf of 2010.2012. In Europe, the external environment is uncertain, and likely to remain so for some time. Given the challenges in Europe, we will continue to review, take and accelerate actions to strengthen and improve our Ford Europe business. This will include fully leveraging our One Ford plan and our global resources. We expect Ford Asia Pacific Africa to grow volume and be profitable for 2012, even as we continue to invest in additional capacity and in our product line-up for an even stronger future in line with our One Ford plan.
While deconsolidation of joint ventures pursuantAs indicated, we expect Ford Credit to be solidly profitable for full-year 2012 but at a lower level than 2011, primarily reflecting fewer leases being terminated and the new accounting standard will have no effect on Net income/(loss) attributablerelated vehicles sold at a gain, and lower credit loss reserve reductions. Of Ford Credit's $2.4 billion pre-tax profit for full-year 2011, the contribution related to Ford Motor Company and is not expected to have a substantial impact on total cash flow, we estimate that the accounting change will reduce our full-year 2010 pre-tax operating results by $350 million to $400 million. Additionally, deconsolidation will reduce Automotive gross cash by about $550 million, and decrease Automotive debt bythese two factors was about $800 million (of which about $500 million isfavorable; these factors are expected to mature during 2010) compared with December 31, 2009 levels.
be minimal in 2012. Ford Credit expects to be profitablealso anticipates lower financing margin in 2010, but at a reduced level compared with 2009, reflecting lower average receivables2012. As disclosed in "Liquidity and the non-recurrence of certain favorable factors experienced during 2009. At year-end 2010,Capital Resources" above, Ford Credit anticipates year-end 2012 managed receivables to be in the range of $80$85 billion to $90$95 billion. The projected decline in managed receivables primarily reflects lower industry and financing volumes in 2009 and 2010 compared with prior years, and the effect of transitioning Jaguar, Land Rover, Mazda and some Volvo financing to other providers. Ford Credit expects to payalso is projecting distributions of about $1.5between $500 million and $1 billion in 2010. Ford Credit will continueduring 2012, subject to assess its ability to make future distributions based on its available liquidity and managed leverage objectives.
Based on our planning assumptions, which include continued improvement in U.S. and global industry sales volume during 2010 and beyond, for full-year 2010Overall, we planexpect 2012 to be profitable on a solid year, with improved Automotive pre-tax basis excluding special items for Ford North America, total Automotive and total company, with positiveoperating profit, strong Automotive operating-related cash flow.flow, and solid Ford Credit profitability. We remainrecognize that we have both challenges and opportunities ahead, and chief among our tasks is accelerating the realization of the full potential of the global scale and operating margin benefits inherent in our One Ford plan. This task includes: working to improve even further our very strong North American operations; working to strengthen and grow our profitable South American operations in the face of increasing competition in the region; working to ensure that Ford Europe is on track for full-yearto deliver sustainable and appropriate returns in an uncertain environment; working to achieve strong growth and profit contribution from Ford Asia Pacific Africa; and continuing the strong performance of our strategic asset Ford Credit.
Building on our strong performance in 2011, we will continue to be solidly profitableleverage our One Ford plan as we go further on a pre-tax basis excluding special items, with positive Automotive operating-related cash flow.our path to achieving our mid-decade outlook.
ITEMItem 7. Management's Discussion and Analysis of Financial Condition and Results of Operations (continued)
Risk Factors
Statements included or incorporated by reference herein may constitute “forward-looking statements”"forward-looking statements" within the meaning of the Private Securities Litigation Reform Act of 1995. Forward-looking statements are based on expectations, forecasts, and assumptions by our management and involve a number of risks, uncertainties, and other factors that could cause actual results to differ materially from those stated, including, without limitation:
· | Further declines in industry sales volume, particularly in the United States or Europe, due to financial crisis, deepening recession, geo-political events, or other factors; |
Decline in industry sales volume, particularly in the United States or Europe, due to financial crisis, recession, geopolitical events, or other factors; · | Decline in market share; |
Decline in market share or failure to achieve growth;· | Lower-than-anticipated market acceptance of new or existing products; |
· | An increase in or acceleration of market shift beyond our current planning assumptions from sales of trucks, medium- and large-sized utilities, or otherMarket shift away from sales of larger, more profitable vehicles beyond our current planning assumption, particularly in the United States; |
· | A return to elevated gasoline prices, as well as the potential for volatile prices or reduced availability; |
An increase in fuel prices, continued volatility of fuel prices, or reduced availability of fuel;· | Continued or increased price competition resulting from industry overcapacity,Continued or increased price competition resulting from industry excess capacity, currency fluctuations, or other factors; |
· | Adverse effects from the bankruptcy, insolvency, or government-funded restructuring of, change in ownership or control of, or alliances entered into by a major competitor; |
Fluctuations in foreign currency exchange rates, commodity prices, and interest rates;· | A prolonged disruption of the debt and securitization markets; |
Adverse effects on our operations resulting from economic, geopolitical, or other events;· | Fluctuations in foreign currency exchange rates, commodity prices, and interest rates; |
Economic distress of suppliers that may require us to provide substantial financial support or take other measures to ensure supplies of components or materials and could increase our costs, affect our liquidity, or cause production constraints or disruptions;· | Economic distress of suppliers that may require us to provide substantial financial support or take other measures to ensure supplies of components or materials and could increase our costs, affect our liquidity, or cause production disruptions; |
Work stoppages at Ford or supplier facilities or other limitations on production (whether as a result of labor disputes, natural or man-made disasters, tight credit markets or other financial distress, information technology issues, production constraints or difficulties, or other factors);· | Single-source supply of components or materials; |
· | Labor or other constraints on our ability to restructure our business; |
Labor or other constraints on our ability to maintain competitive cost structure;· | Work stoppages at Ford or supplier facilities or other interruptions of production; |
Substantial pension and postretirement health care and life insurance liabilities impairing our liquidity or financial condition;· | Substantial pension and postretirement health care and life insurance liabilities impairing our liquidity or financial condition; |
Worse-than-assumed economic and demographic experience for our postretirement benefit plans (e.g., discount rates or investment returns);· | Worse-than-assumed economic and demographic experience for our postretirement benefit plans (e.g., discount rates or investment returns); |
Restriction on use of tax attributes from tax law "ownership change;" · | Restriction on use of tax attributes from tax law "ownership change;" |
The discovery of defects in vehicles resulting in delays in new model launches, recall campaigns, reputational damage, or increased warranty costs;· | The discovery of defects in vehicles resulting in delays in new model launches, recall campaigns, or increased warranty costs; |
Increased safety, emissions, fuel economy, or other regulations resulting in higher costs, cash expenditures, and/or sales restrictions;· | Increased safety, emissions, fuel economy, or other regulation resulting in higher costs, cash expenditures, and/or sales restrictions; |
Unusual or significant litigation, governmental investigations or adverse publicity arising out of alleged defects in our products, perceived environmental impacts, or otherwise;· | Unusual or significant litigation or governmental investigations arising out of alleged defects in our products, perceived environmental impacts, or otherwise; |
A change in our requirements where we have long-term supply arrangements committing us to purchase minimum or fixed quantities of certain parts, or to pay a minimum amount to the seller ("take-or-pay" contracts);· | A change in our requirements for parts or materials where we have long-term supply arrangements that commit us to purchase minimum or fixed quantities of certain parts or materials, or to pay a minimum amount to the seller ("take-or-pay" contracts); |
Adverse effects on our results from a decrease in or cessation or clawback of government incentives related to investments;· | Adverse effects on our results from a decrease in or cessation of government incentives related to capital investments; |
Inherent limitations of internal controls impacting financial statements and safeguarding of assets;· | Adverse effects on our operations resulting from certain geo-political or other events; |
Cybersecurity risks to operational systems, security systems, or infrastructure owned by us or a third-party vendor, or at a supplier facility; · | Substantial levels of Automotive indebtedness adversely affecting our financial condition or preventing us from fulfilling our debt obligations (which may grow because we are able to incur substantially more debt, including additional secured debt); |
Failure of financial institutions to fulfill commitments under committed credit facilities;· | Failure of financial institutions to fulfill commitments under committed credit facilities; |
Inability of Ford Credit to access debt, securitization, or derivative markets around the world at competitive rates or in sufficient amounts, due to credit rating downgrades, market volatility, market disruption, regulatory requirements, or other factors;· | Inability of Ford Credit to obtain competitive funding; |
Higher-than-expected credit losses, lower-than-anticipated residual values or higher-than-expected return volumes for leased vehicles;· | Inability of Ford Credit to access debt, securitization, or derivative markets around the world at competitive rates or in sufficient amounts due to credit rating downgrades, market volatility, market disruption, or other factors; |
Increased competition from banks or other financial institutions seeking to increase their share of financing Ford vehicles; and· | Higher-than-expected credit losses; |
· | Increased competition from banks or other financial institutions seeking to increase their share of financing Ford vehicles; |
· | Collection and servicing problems related to finance receivables and net investment in operating leases; |
· | Lower-than-anticipated residual values or higher-than-expected return volumes for leased vehicles; |
· | New or increased credit, consumer, or data protection or other regulations resulting in higher costs and/or additional financing restrictions; and |
· | Inability to implement our One Ford plan. |
New or increased credit, consumer, or data protection or other regulations resulting in higher costs and/or additional financing restrictions.
We cannot be certain that any expectation, forecast, or assumption made in preparing forward-looking statements will prove accurate, or that any projection will be realized. It is to be expected that there may be differences between projected and actual results. Our forward-looking statements speak only as of the date of their initial issuance, and we do not undertake any obligation to update or revise publicly any forward-looking statement, whether as a result of new information, future events or otherwise. For additional discussion of these risks, see "Item 1A. Risk Factors."
ITEMItem 7. Management's Discussion and Analysis of Financial Condition and Results of Operations (continued)
CRITICAL ACCOUNTING ESTIMATES
We consider an accounting estimate to be critical if: 1) the accounting estimate requires us to make assumptions about matters that were highly uncertain at the time the accounting estimate was made, and 2) changes in the estimate that are reasonably likely to occur from period to period, or use of different estimates that we reasonably could have used in the current period, would have a material impact on our financial condition or results of operations.
Management has discussed the development and selection of these critical accounting estimates with the Audit Committee of our Board of Directors. In addition, there are other items within our financial statements that require estimation, but are not deemed critical as defined above. Changes in estimates used in these and other items could have a material impact on our financial statements.
Warranty and Additional Service ActionsProduct Recalls
Nature of Estimates Required. TheWe accrue the estimated cost of basic warranty and additional service action costs are accruedcoverages for each vehicle at the time of sale. Estimates are principally based on assumptionsWe establish estimates using historical information regarding the lifetime warranty costsnature, frequency, and average cost of claims for each vehicle line and eachby model year of that vehicle line, whereyear. Where little or no claims experience may exist. In addition,exists, we rely on historical averages. See
Note 30 of the number and magnitude of additional service actions expected to be approved, and policies related to additional service actions, are taken into consideration. DueNotes to the uncertainty andFinancial Statements for information regarding costs for warranty actions. Separately, we also accrue at the time of sale for potential volatility of these estimated factors, changesproduct recalls based on historical experience with similar actions. Product recalls are distinguishable from warranty coverages in our assumptions could materially affect net income.that the actions may extend beyond basic warranty coverage periods.
Assumptions and Approach Used. OurWe reevaluate our estimate of warranty and additional service action obligations is re-evaluated on a quarterlyregular basis. Experience has shown that initial data for any given model year canmay be volatile; therefore, our process relies uponon long-term historical averages until sufficient data are available. As actual experience becomes available, it is usedwe use the data to modify the historical averages in order to ensure that the forecastestimate is within the range of likely outcomes. ResultingWe then compare the resulting accruals are then compared with present spending rates to ensure that the balances are adequate to meet expected future obligations.
See Note 31 of the Notes Based on these data, we revise our estimates as necessary. Due to the Financial Statements for more information regarding costsuncertainty and potential volatility of these factors, changes in our assumptions for warrantiescould materially affect our financial condition and additional service actions.results of operations.
Pensions
Nature of Estimates Required. The estimation of our pension obligations, costs, and liabilities requires that we make use of estimates of the present value of the projected future payments to all participants, taking into consideration the likelihood of potential future events such as demographic experience. These assumptions may have an effect on the amount and timing of future contributions.
Assumptions and Approach Used. The assumptions used in developing the required estimates include the following key factors:
· | Discount rates. We base the discount rate assumption primarily on the results of a cash flow matching analysis, which matches the future cash outflows for each major plan to a yield curve comprised of high qualityDiscount rates. We base the discount rate assumption primarily on the results of a cash flow matching analysis, which matches the future cash outflows for each major plan to a yield curve comprised of high-quality bonds specific to the country of the plan. Benefit payments are discounted at the rates on the curve and a single discount rate specific to the plan is determined. |
· | Expected return on plan assets. The expected return on plan assets assumption reflects historical returns and long-run inputs from a range of advisors for capital market returns, inflation, bond yields, and other variables, adjusted for specific aspects of our investment strategy. The assumption is based on consideration of all inputs, with a focus on long-term trends to avoid short-term market influences. Assumptions are not changed unless structural trends in the underlying economy are identified, our asset strategy changes, or there are significant changes in other inputs.
|
· | Salary growth. The salary growth assumption reflects our long-term actual experience, outlook, and assumed inflation.
|
· | Inflation. Our inflation assumption is based on an evaluation of external market indicators.
|
· | Expected contributions. The expected amount and timing of contributions is based on an assessment of minimum requirements, and additional amounts based on cash availability and other considerations (e.g., funded status, avoidance of regulatory premiums and levies, and tax efficiency).
|
Expected return on plan assets. The expected return on plan assets assumption reflects historical returns and long-run inputs from a range of advisors for capital market returns, inflation, bond yields, and other variables, adjusted for specific aspects of our investment strategy. The assumption is based on consideration of all inputs, with a focus on long-term trends to avoid short-term market influences. Assumptions are not changed unless structural trends in the underlying economy are identified, our asset strategy changes, or there are significant changes in other inputs.
· | Retirement rates. Retirement rates are developed to reflect actual and projected plan experience.Salary growth. The salary growth assumption reflects our long-term actual experience, outlook, and assumed inflation. |
· | Inflation. Our inflation assumption is based on an evaluation of external market indicators, including real gross domestic product growth and central bank inflation targets. Expected contributions. The expected amount and timing of contributions is based on an assessment of minimum requirements, and additional amounts based on cash availability and other considerations (e.g., funded status, avoidance of regulatory premiums and levies, and tax efficiency). Retirement rates. Retirement rates are developed to reflect actual and projected plan experience. Mortality rates. Mortality rates. Mortality rates are developed to reflect actual and projected plan experience. |
ITEMItem 7. Management's Discussion and Analysis of Financial Condition and Results of Operations (continued)
Plan obligations and costs are based on existing retirement plan provisions. No assumption is made regarding any potential future changes to benefit provisions beyond those to which we are presently committed (e.g., in existing labor contracts).
The effects of actual results differing from our assumptions and the effects of changing assumptions are included in unamortized net gains and losses. Unamortized gains and losses are amortized over future periods and, therefore, generally affect our recognized expense in future periods. Amounts are recognized as a component of net expense over the expected future years of service (approximately 12 years for the major U.S. plans). In 2009,2011, the U.S. actual return on assets was 14.4%7.7%, which was higherlower than the expected return of 8.25%8%. The year-end 20092011 weighted average discount rates for the U.S. and non-U.S. plans decreased by 6460 and 2747 basis points, respectively. These differences resulted in unamortized losses of about $2 billion (excluding Volvo). These$5 billion. Unamortized gains and losses are amortized only amortized to the extent they exceed 10% of the higher of the market-related value of assets or the projected benefit obligation of the respective plan. For the major U.S. plans, theunamortized losses do not exceed this threshold and recognition will begin at a future measurement date.is continuing in 2012.
See Note 1817 of the Notes to the Financial Statements for more information regarding costs and assumptions for employee retirement benefits.
Sensitivity Analysis. The December 31, 20092011 pension funded status and 20102012 expense are affected by year-end 20092011 assumptions. These sensitivities may be asymmetric and are specific to the time periods noted. They also may not be additive, so the impact of changing multiple factors simultaneously cannot be calculated by combining the individual sensitivities shown. The effect of the indicated increase/(decrease) in selected factors which generally have the largest impact on pension expense and obligation is shown below (in millions):
|
| | | | | | | | | | |
| | | Percentage | | | | |
| | | Point | | | | | | December 31, 20092011 Obligation | |
| Assumption | | | | | | | | | | | | | | | |
Discount rate | | +/- 1.0 pt. | | | $(260)/$70/$210310 | | | $(130)$(160)/$180 | | | $(4,150)(4,780)/$4,950 | 5,800 | | $(2,690)(2,980)/$3,060 | 3,440 |
Expected return on assets | | +/+/- 1.0 | | | (380)/380 | | | (180)(190)/180190 | | | — | | | — | |
_______
* Excludes Volvo
The foregoing indicates that changes in the discount rate and return on assets can have a significant effect on the expense of our pension plans and/or obligation. We cannot predict these changes in discount rates or investment returns and, therefore, cannot reasonably estimate whether adjustments to our expense or obligation in subsequent years will be significant.
Other Postretirement Employee Benefits
Nature of Estimates Required. The estimation of our obligations, costs, and liabilities associated with OPEB, primarily retiree health care and life insurance, requires that we make use of estimates of the present value of the projected future payments to all participants, taking into consideration the likelihood of potential future events such as health care cost increases and demographic experience, which may have an effect on the amount and timing of future payments.
Assumptions and Approach Used. The assumptions used in developing the required estimates include the following key factors:
· | Discount rates. We base the discount rate assumption primarily on the results of a cash flow matching analysis, which matches the future cash outflows for each plan to a yield curve comprised of high quality bonds specific to the country of the plan. Benefit payments are discounted at the rates on the curve and a single discount rate specific to the plan is determined. |
· | Health care cost trends. Our health care cost trend assumptions are developed based on historical cost data, the near-term outlook, and an assessment of likely long-term trends.
|
· | Salary growth. The salary growth assumptions reflect our long-term actual experience, outlook and assumed inflation.
|
· | Retirement rates. Retirement rates are developed to reflect actual and projected plan experience.
|
· | Mortality rates. Mortality rates are developed to reflect actual and projected plan experience.
|
83
Health care cost trends. Our health care cost trend assumptions are developed based on historical cost data, the near-term outlook, and an assessment of likely long-term trends.Salary growth. Salary growth assumptions reflect our long-term actual experience, our outlook, and assumed inflation. ITEM 7. Management's DiscussionRetirement rates. Retirement rates are developed to reflect actual and Analysis of Financial Condition and Results of Operations (continued)
Mortality rates. Mortality rates are developed to reflect actual and projected plan experience.
Plan obligations and costs are based on existing retirement plan provisions. No assumption is made regarding any potential future changes to benefit provisions beyond those to which we are presently committed (e.g., in existing labor contracts).
The effects of actual results differing from our assumptions and the effects of changing assumptions are included in unamortized net gains and losses. Unamortized gains and losses are amortized over future periods and, therefore, generally affect our recognized expense in future periods. The weighted average discount rate used to determine the benefit obligation for U.S. plans at December 31, 20092011 was 5.74%4.6%, compared with 4.95% (6.37% excluding the UAW retiree health care obligation)5.2% at December 31, 2008,2010, resulting in an unamortized loss of about $250$280 million. This amount is expected to be recognized as a component of net expense over the expected future years of service (approximately 1413 years).
See Note 1817 of the Notes to the Financial Statements for more information regarding OPEB costs and assumptions for other postretirement employee benefits.assumptions.
Item 7. Management's Discussion and Analysis of Financial Condition and Results of Operations (continued)
Sensitivity Analysis. The effect on U.S. and Canadian plans of a one percentage point increase/(decrease) in the assumed discount rate would be a (decrease)/increase in the postretirement health care benefit expense for 20102012 of approximately $(30)$(40) million/$40 million, and in the year-end 20092011 obligation of approximately $(590)$(730) million/$720880 million.
Impairments of Goodwill and Long-Lived Assets
Nature of Estimates Required – Goodwill. Goodwill is not amortized, but is subject to periodic assessments of impairment. We test goodwill for impairment annually during the fourth quarter, or when events occur or circumstances change that would more likely than not reduce the fair value of the reporting unit below its carrying value. Impairment of goodwill is evaluated using a two step process. The first step involves comparison of the fair value of a reporting unit with its carrying value. If the carrying value of the reporting unit exceeds its fair value, the second step of the process involves comparison of the implied fair value of goodwill with its carrying value. The implied fair value of goodwill is equivalent to the excess of the fair value of a reporting unit over the amounts assigned to its assets and liabilities as if the reporting unit had been acquired in a business combination. If the carrying value of the reporting unit's goodwill exceeds the implied fair value of that goodwill, an impairment loss is recognized in an amount equal to the excess. Restoration of a previously-recognized goodwill impairment loss is not allowed.
Nature of Estimates Required – Held-and-Used Long-Lived Assets. Long-lived asset groups are tested for recoverability when changes in circumstances indicate the carrying value may not be recoverable. Events that trigger a test for recoverability include material adverse changes in projected revenues and expenses, significant underperformance relative to historical and projected future operating results, and significant negative industry or economic trends. When a triggering event occurs, a test for recoverability is performed, comparing projected undiscounted future cash flows to the carrying value of the asset group. If the test for recoverability identifies a possible impairment, the asset group's fair value is measured relying primarily on a discounted cash flow methodology. An impairment charge is recognized for the amount by which the carrying value of the asset group exceeds its estimated fair value. A test for recoverability also is performed when management has committed to a plan to sell or otherwise dispose of an asset group and the plan is expected to be completed within a year. When an impairment loss is recognized for assets to be held and used, the adjusted carrying amount of those assets is depreciated over its remaining useful life. Restoration of a previously-recognized long-lived asset impairment loss is not allowed.
ITEM 7. Management's Discussion and Analysis of Financial Condition and Results of Operations (continued)
Nature of Estimates Required – Held-for-Sale Operations. We perform an impairment test on an asset group to be discontinued, held for sale, or otherwise disposed of when management has committed to the action and the action is expected to be completed within one year. We estimate fair value to approximate the expected proceeds to be received. An impairment charge is recognized when the carrying value of the asset group exceeds the estimated fair value less transaction costs.
Automotive Sector
Assumptions and Approach Used. We measure the fair value of a reporting unit or asset group based on market prices (i.e., the amount for which the asset could be sold to a third party), when available. When market prices are not available, we estimate the fair value of the reporting unit or asset group using the income approach and/or the market approach. The income approach uses cash flow projections. Inherent in our development of cash flow projections are assumptions and estimates derived from a review of our operating results, approved business plans, expected growth rates, and cost of capital, similar to those a market participant would use to assess fair value. We also make certain assumptions about future economic conditions and other data. Many of the factors used in assessing fair value are outside the control of management, and these assumptions and estimates may change in future periods.
Changes in assumptions or estimates can materially affect the fair value measurement of a reporting unit or asset group, and therefore can affect the amount of the impairment. The following are key assumptions we use in making cash flow projections:
· | Business projections. We make assumptions about the demand for our products in the marketplace. These assumptions drive our planning assumptions for volume, mix, and pricing. We also make assumptions about our cost levels (e.g., capacity utilization, cost performance, etc.). These projections are derived using our internal business plans that are updated at least annually and reviewed by our Board of Directors.
|
· | Long-term growth rate. A growth rate is used to calculate the terminal value of the business, and is added to the present value of the debt-free interim cash flows. The growth rate is the expected rate at which a business unit's earnings stream is projected to grow beyond the planning period.
|
· | Discount rate. When measuring possible impairment, future cash flows are discounted at a rate that is consistent with a weighted-average cost of capital that we anticipate a potential market participant would use. Weighted-average cost of capital is an estimate of the overall risk-adjusted after-tax rate of return required by equity and debt holders of a business enterprise, which is developed with the assistance of external financial advisors.
|
· | Economic projections. Assumptions regarding general economic conditions are included in and affect our assumptions regarding industry sales and pricing estimates for our vehicles. These macro-economic assumptions include, but are not limited to, industry sales volumes, inflation, interest rates, prices of raw materials (i.e., commodities), and foreign currency exchange rates.
|
The market approach is another method for measuring the fair value of a reporting unit or asset group. This approach relies on the market value (i.e., market capitalization) of companies that are engaged in the same or similar line of business.
Automotive Sector – Goodwill
We had $34 million of Automotive goodwill on our balance sheet at December 31, 2009, all related to Ford of Europe. Volvo goodwill is reflected as part of held-for-sale assets (see Note 24 of the Notes to the Financial Statements for additional detail).
Ford Europe. We performed our annual goodwill testing in the fourth quarter of 2009 and assessed that the carrying value of our Ford Europe reporting unit at December 31, 2009 did not exceed its fair value.
Volvo. As previously disclosed, in the fourth quarter of 2007 we recorded a $2.4 billion impairment of our Volvo goodwill. We estimated at that time that a 0.5 percentage point decrease in the long-term growth rate would have decreased our fair value estimate by about $250 million. A 0.5 percentage point increase in the discount rate assumption would have decreased the fair value estimate by about $350 million.
In the fourth quarter of 2008, we performed annual goodwill impairment testing for our Volvo reporting unit. We compared the carrying value of our Volvo reporting unit to its fair value, and concluded that the goodwill was not impaired. We performed this measurement relying primarily on the income approach, applying a discounted cash flow methodology.
ITEM 7. Management's Discussion and Analysis of Financial Condition and Results of Operations (continued)
Our valuation was based on an in-use premise which considered a discount rate, after-tax return on sales rate, growth rate, and terminal value consistent with assumptions we believed principal market participants (i.e., other global automotive manufacturers) would use. This methodology produced appropriate valuations for entities we disposed of in recent years; in light of worsening economic conditions, however, we also considered other valuations, including a discounted cash flow analysis using more conservative assumptions than we initially used. This alternative analysis incorporated a significantly higher discount rate, offset partially by a higher growth rate; a much lower after-tax return on sales rate; and a lower terminal value. This alternative analysis reduced the valuation of our Volvo reporting unit by about 50%. Even this more conservative analysis, however, did not support an impairment of Volvo goodwill at year-end 2008. For information regarding 2009 testing, see "Automotive Sector – Held-for-Sale Operations" shown below.
Automotive Sector – Held-and-Used Long-Lived Assets
In 2008, we examined each of our asset groups for triggering events and recorded a pre-tax impairment charge for Ford North America. All other asset groups were found to either have no triggering events or have a carrying value of assets that was recoverable.
Ford North America. Due to rapidly-changing U.S. market conditions in the second quarter of 2008 (discussed in Note 15 of the Notes to the Financial Statements), we tested the long-lived assets of our Ford North America segment and recorded a pre-tax impairment charge of $5.3 billion. The impairment was driven almost entirely by deterioration in projected cash flows for our near-term business plan period, attributable to changes in our business and economic projections as discussed above. Following this impairment, Ford North America had $11 billion of net property recorded in our financial statements as of June 30, 2008.
Sensitivity Analysis. The impairment reflected changes in the assumptions used to measure the fair value of the asset group based on the rapidly-changing market conditions (including changes to our business projections). The most notable changes in our business and economic projections included: (1) a more pronounced and accelerated shift in consumer preferences away from full-size trucks and SUVs to smaller and more fuel-efficient vehicles as a result of higher fuel prices, with a return over time to a level between today's mix and recent levels; (2) lowered U.S. industry demand in the near term, with a return to trend levels as the U.S. economy recovers subsequent to 2010; and (3) higher commodity costs over the business plan period compared with prior projections. For additional discussion of the planning assumptions used, see the "Outlook" discussion in our Quarterly Report on Form 10-Q for the period ended June 30, 2008.
Beyond the business and economic projections discussed above, we also updated our assumptions with regard to long-term growth and discount rates. The long-term growth rate assumption used in our second quarter 2008 testing is similar to that used in our 2006 North America impairment testing, when we last had an impairment of North America fixed assets. This growth rate, however, when applied to lowered business plan period projections, resulted in a less favorable undiscounted long-term outlook. This outlook is consistent with our present projection of lower margins, resulting primarily from the recent shift in consumer preferences discussed above. We estimate that a 0.5 percentage point decrease in the long-term growth rate assumed in our second quarter impairment testing would have decreased the fair value estimate by about $800 million.
The discount rate that we used in our second quarter of 2008 impairment testing was consistent with a weighted-average cost of capital that we estimate a potential market participant would use. This discount rate was lower than that used in our 2006 impairment testing, primarily reflecting the change in long-term outlook discussed above. A 0.5 percentage point increase in the discount rate assumption used in the impairment testing would have decreased the fair value estimate by about $1.4 billion.
During the third quarter of 2008, we experienced a severe deterioration in U.S. credit markets, which adversely affected economic conditions and depressed automotive sales. As a result of this significant adverse change in the U.S. business climate, we again tested the long-lived assets of our Ford North America segment. Using updated business and economic projections, we assessed that the carrying value of our long-lived assets at September 30, 2008 did not exceed their fair value. We used the same long-term growth rate as used in our second quarter testing as we believe that long-term economic conditions have not deteriorated as a result of the present credit crisis. We estimate that a 0.5 percentage point decrease in the long-term growth rate assumed in our third quarter impairment testing would have decreased the fair value estimate by about $800 million. Additionally, we used the same discount rate as used in our second quarter testing. This is based on the assumption that the present credit crisis does not have a material impact on the weighted cost of capital in the medium- to long-term (consistent with our planning horizon). A 0.5 percentage point increase in the discount rate assumption used in the impairment testing would have decreased the fair value estimate by about $1.3 billion.
ITEM 7. Management's Discussion and Analysis of Financial Condition and Results of Operations (continued)
We closely examined each of our asset groups for triggering events and most recently tested each of our held-and-used asset groups in the first quarter of 2009. We assessed that the carrying value of our long-lived assets was recoverable.
In 2010, we have plans to expand our product line-up in the United States to include additional small, more fuel-efficient vehicles to our product portfolio which will more closely match the overall market. Additionally, we continue to align our production capacity with industry sales volume and market share. As our plan progresses, we will be less exposed to rapid changes in vehicle mix and demand, and less susceptible to future impairment of long-lived assets. For further discussion of actions we are taking to respond to changing market conditions, see "Overview" above.
Refer to the Held-for-Sale Operations discussion below for detail regarding our 2009 impairment testing of Volvo.
Automotive Sector – Held-for-Sale Operations
Volvo. As previously disclosed, in recent years we have undertaken efforts to divest non-core assets in order to allow us to focus exclusively on our global Ford brand. Toward that end, in 2007 we sold our interest in Aston Martin; in 2008, we sold our interest in Jaguar Land Rover, and a significant portion of our ownership in Mazda. During the first quarter of 2009, based on our strategic review of Volvo and in light of our goal to focus on the global Ford brand, our Board of Directors committed to actively market Volvo for sale, notwithstanding the current distressed market for automotive-related assets. Accordingly, in the first quarter of 2009 we reported Volvo as held for sale and we ceased depreciation of its long-lived assets in the second quarter of 2009.
Our commitment to actively market Volvo for sale also triggered a held-for-sale impairment test in the first quarter of 2009. We received information from our discussions with potential buyers that provided us a value for Volvo using a market approach, rather than an income approach. We concluded that the information we received from our discussions with potential buyers was more representative of the value of Volvo given the current market conditions, the characteristics of viable market participants, and our anticipation of a more immediate transaction for Volvo. These inputs resulted in a lower value for Volvo than the discounted cash flow method we had previously used.
After considering deferred gains reported in Accumulated other comprehensive income/(loss), we recognized a pre-tax impairment charge of $650 million related to our total investment in Volvo. The impairment was recorded in Automotive cost of sales for the first quarter of 2009.
Had we not committed to actively market Volvo for sale, we would not have been afforded the benefit of the new information obtained in discussions with potential buyers. Rather, we would have continued to employ an in-use premise to test Volvo's goodwill and long-lived assets, using a discounted cash flow methodology with assumptions similar to those we used at year-end 2008. Such a discounted cash flow methodology would not have resulted in an impairment of goodwill or long-lived assets at March 31, 2009.
See Notes 15, 16 and 24 of the Notes to the Financial Statements for more information regarding impairment of long-lived assets, goodwill, and held-for-sale operations.
Financial Services Sector – Ford Credit North America Investment in Operating Leases
Assumptions and Approach Used. As noted above, we measure the fair value of an asset group based on market prices (i.e., the amount for which the asset could be sold to a third party), when available. When market prices are not available, we estimate the fair value of the asset group using the income approach. The income approach uses discounted cash flow projections. Ford Credit measures the fair value of its North America operating lease portfolio using the projected cash flow based on the terms of the operating lease contracts. Inherent in the cash flow assumptions are estimates derived from its quarterly operating lease portfolio adequacy study for accumulated depreciation. Many of the factors used in measuring fair value are outside the control of management, and these assumptions and estimates may change in future periods.
ITEM 7. Management's Discussion and Analysis of Financial Condition and Results of Operations (continued)
Changes in assumptions or estimates may materially affect the fair value measurement of an asset group, and therefore may affect the amount of the impairment. The following are key assumptions we use in making cash flow projections for Ford Credit's operating leases:
· | Auction values. Ford Credit's projection of the market value of the vehicles when Ford Credit sells them at the end of the lease.
|
· | Return volume. Ford Credit's projection of the number of vehicles that will be returned at lease-end.
|
· | Discount rate. Ford Credit's estimation of the discount rate, reflecting hypothetical market assumptions regarding borrowing rates, credit loss patterns, and residual value risk.
|
See Notes 15 of the Notes to the Financial Statements for more information regarding impairment of long-lived assets.
Sensitivity Analysis. Higher fuel prices and the weak economic climate in the United States and Canada during the second quarter of 2008 caused a more pronounced and accelerated shift in consumer preferences away from full-size trucks and SUVs to smaller, more fuel-efficient vehicles. This shift in consumer preferences, combined with the weak economic climate, caused a significant reduction in auction values for used full-size trucks and SUVs (as discussed in Note 15 of the Notes to the Financial Statements). Recognizing these rapidly-changing market conditions, Ford Credit tested its U.S. and Canadian investments in operating leases for recoverability. As a result of this testing, Ford Credit concluded that the operating lease portfolio was impaired and we and Ford Credit recorded a pre-tax charge of $2.1 billion in second quarter 2008 financial statements. This charge represents the amount by which the carrying value of certain vehicle lines in Ford Credit's lease portfolio, primarily full-size trucks and SUVs, exceeded their fair value. See "Residual Risk" discussion above for additional information regarding the significant decrease in auction values.
At the time of the impairment, Ford Credit estimated that a one percent decrease in the auction value of the impaired vehicles assumed in the impairment testing would have decreased the fair value estimate by about $50 million. A one percentage point increase in the return rate of the impaired vehicles assumed in the impairment testing would have decreased the fair value estimate by about $30 million. A one percentage point increase in the discount rate assumed in the impairment testing would have decreased the fair value estimate by about $100 million.
Although at this time we do not anticipate additional impairment charges, a deterioration of the business climate would impact the assumptions we use in future impairment testing and could result in additional impairments.
Valuation of Deferred Tax Assets
Nature of Estimates Required. Deferred tax assets and liabilities are recognized based on the future tax consequences attributable to temporary differences that exist between the financial statement carrying value of assets and liabilities and their respective tax bases, and operating loss and tax credit carryforwards on a taxing jurisdiction basis. We measure deferred tax assets and liabilities using enacted tax rates that will apply in the years in which we expect the temporary differences to be recovered or paid.
U.S. GAAP standards of accounting for income taxes requirerequires a reduction of the carrying amounts of deferred tax assets by recording a valuation allowance if, based on the available evidence, it is more likely than not (defined as a likelihood of more than 50%) such assets will not be realized. The valuation of deferred tax assets requires judgment in assessing the likely future tax consequences of events that have been recognized in our financial statements or tax returns and future profitability. Our accounting for deferred tax consequences represents our best estimate of those future events. Changes in our current estimates, due to unanticipated events or otherwise, could have a material impact on our financial condition and results of operations.
Assumptions and Approach Used. In assessing the need for a valuation allowance, we consider both positive and negative evidence related to the likelihood of realization of the deferred tax assets. If, based on the weight of available evidence, it is more likely than not the deferred tax assets will not be realized, we record a valuation allowance. The weight given to the positive and negative evidence is commensurate with the extent to which the evidence may be objectively verified. As such, it is generally difficult for positive evidence regarding projected future taxable income exclusive of reversing taxable temporary differences to outweigh objective negative evidence of recent financial reporting losses. U.S. GAAP states that a cumulative loss in recent years is a significant piece of negative evidence that is difficult to overcome in determining that a valuation allowance is not needed against deferred tax assets.
ITEM 7. Management's Discussion and Analysis of Financial Condition and Results of Operations (continued)
This assessment, which is completed on a taxing jurisdiction basis, takes into account a number of types of evidence, including the following:
· | Nature, frequency, and severity of current and cumulative financial reporting losses. A pattern of objectively measured recent financial reporting losses is heavily weighted as a source of negative evidence. In certain circumstances, historical information may not be as relevant due to changed circumstances;Nature, frequency, and severity of current and cumulative financial reporting losses. A pattern of objectively-measured recent financial reporting losses is heavily weighted as a source of negative evidence. We generally consider cumulative pre-tax losses in the three-year period ending with the current quarter to be significant negative evidence regarding future profitability. We also consider the strength and trend of earnings, as well as other relevant factors. In certain circumstances, historical information may not be as relevant due to changes in our business operations; |
· | Sources of future taxable income.Future reversals of existing temporary differences are heavily-weighted sources of objectively verifiable positive evidence. Projections of future taxable income exclusive of reversing temporary differences are a source of positive evidence only when the projections are combined with a history of recent profits and can be reasonably estimated. Otherwise, these projections are considered inherently subjective and generally will not be sufficient to overcome negative evidence that includes relevant cumulative losses in recent years, particularly if the projected future taxable income is dependent on an anticipated turnaround to profitability that has not yet been achieved. In such cases, we generally give these projections of future taxable income no weight for the purposes of our valuation allowance assessment pursuant to U.S. GAAP; and |
· | Tax planning strategies.If necessary and available, tax planning strategies would be implemented to accelerate taxable amounts to utilize expiring carryforwards. These strategies would be a source of additional positive evidence and, depending on their nature, could be heavily weighted. |
See Note 2322 of the Notes to the Financial Statements for more information regarding deferred tax assets.
Sensitivity Analysis. In 2006, our net deferred tax position in the United States changed from a net deferred tax liability position to a net deferred tax asset position. In our assessment of the need for a valuation allowance, we heavily weighted the negative evidence of cumulative financial reporting losses in recentthen-recent periods and the positive evidence of future reversals of existing temporary differences. Although a sizable portion of our North American losses in recentthen-recent years were the result of charges incurred for restructuring actions, impairments, and other special items, even without these charges we still would have incurred significant operating losses. Accordingly, we considered our pattern of recentthen-recent losses to be relevant to our analysis. Considering this pattern of recentthen-recent relevant losses and the uncertainties associated with projected future taxable income exclusive of reversing temporary differences, we gave no weight to projections showing future U.S. taxable income for purposes of assessing the need for a valuation allowance.
Item 7. Management's Discussion and Analysis of Financial Condition and Results of Operations (continued)
As a result of our assessment, we concluded that the net deferred tax assets of our U.S. entities required a full valuation allowance. We also recorded a full valuation allowance on the net deferred tax assets of certain foreign entities, such as Germany, Canada and Spain, as thewhere realization of these foreign deferred tax assets are reliant upon U.S.-source taxable income.also was uncertain.
At December 31, 2006,2010, our valuation allowance was $15.7 billion, leaving net deferred tax assets of about $900 million on our balance sheet. Prior to year-end 2011, the pattern of objectively-measured negative evidence of recent financial reporting losses outweighed the positive evidence of our growing profitability, despite the tangible progress we reportedwere making in implementing our One Ford plan.
By the end of 2011, our U.S. operations had returned to a $7.3 billionposition of cumulative profits for the most recent three-year period. We concluded that this record of cumulative profitability in recent years, our ten consecutive quarters of pre-tax operating profits, our successful completion of labor negotiations with the UAW, and our business plan showing continued profitability, provided assurance that our future tax benefits more likely than not will be realized. Accordingly, at year-end 2011, we released almost all of our valuation allowance against ournet deferred tax assets (including $2.7 billion resulting from the adoption of the revised standard on accounting for defined benefit pension and other postretirement benefit plans). During 2007, we recorded an additional valuation allowance of $700 million. Losses during 2008, primarilyentities in the United States, increased the valuation allowance by $9.3Canada, and Spain, resulting in a $12.4 billion to a balance of $17.3 billion atbenefit in our provision for income taxes.
At December 31, 2008. The valuation allowance increased by $200 million in 2009, which reflects2011, we have retained a $1.1 billion increase related to charges to other comprehensive income, partially offset by a $900 million decrease as a result of operating profits.
A sustained period of profitability in our North America operations is required before we would change our judgment regarding the need for a full valuation allowance against our net deferred tax assets. Accordingly, although we were profitable in 2009, we continue to record a full valuation allowance against the netapproximately $500 million of deferred tax assets in the United States and foreign entities discussed above. Although the weight of negative evidenceNorth America related to cumulative losses is decreasing as we deliver on our One Ford plan (discussed in "Overview"various state and "Outlook" above), we believelocal operating loss carryforwards that this objectively-measured negative evidence outweighs the subjectively-determined positive evidenceare subject to restrictive rules for future utilization, and as such, we currently do not anticipate a change in judgment regarding the need for a full valuation allowance in 2010. The consumption of tax attributes to offset expected operating profits during 2010, however, would reduce the overall level oftotaling about $1 billion primarily against deferred tax assets subject to valuation allowance.
ITEM 7. Management's Discussion and Analysis of Financial Condition and Results of Operations (continued)
At December 31, 2009 and 2008, our net deferred tax assets, net of the valuation allowances of $17.5 billion and $17.3 billion, respectively, were $1.1 billion in each period. Unlike our U.S. operations where, considering the pattern of recent relevant losses and the uncertainties associated with projected future taxable income exclusive of reversing temporary differences, we gave no weight to projections showing future taxable income, these net deferred tax assets relate to certain operations outside North America where we generally have had a long history of profitability and believe it is more likely than not that the net deferred tax assets will be realized through future taxable earnings. Accordingly, we have not established a valuation allowance on our remaining net deferred tax assets. Most notably, at December 31, 2009 and 2008, we recognized a net deferred tax asset of $1.5 billion and $1.4 billion, respectively, in our U.K. Automotive operations, primarily based upon the tax return consolidation of our Automotive operations with our U.K. FCE operation. Our U.K. FCE operation has a long history of profitability, and we believe it will provide a source of future taxable income that can be reasonably estimated. Even with lower volumes and higher credit losses in the recent past as discussed in "Results of Operations" above, FCE operations remain profitable in 2009. If in the future FCE profits in the United Kingdom decline, additional valuation allowances may be required. We will continue to assess the need for a valuation allowance in the future.
Accumulated Depreciation on Vehicles Subject to Operating Leases
Accumulated depreciation on vehicles subject to operating leases reduces the value of the leased vehicles in our operating lease portfolio from their original acquisition value to their expected residual value at the end of the lease term. These vehicles primarily consist of retail lease contracts for Ford Credit and vehicles sold to daily rental car companies subject to a guaranteed repurchase option ("rental repurchase vehicles") for the Automotive sector.
We monitor residual values each month, and we review the adequacy of our accumulated depreciation on a quarterly basis. If we believe that the expected residual values for our vehicles have changed, we revise depreciation to ensure that our net investment in operating leases (equal to our acquisition value of the vehicles less accumulated depreciation) will be adjusted to reflect our revised estimate of the expected residual value at the end of the lease term. Such adjustments to depreciation expense would result in a change in the depreciation rates of the vehicles subject to operating leases, and are recorded prospectively on a straight-line basis.
For retail leases, each lease customer has the option to buy the leased vehicle at the end of the lease or to return the vehicle to the dealer. If the customer returns the vehicle to the dealer, the dealer may buy the vehicle from Ford Credit or return it to Ford Credit. Ford Credit's NorthSouth America operating lease activity was as follows for each of the last three years (in thousands, except percentages):operations.
| | | | | | | | | | |
Vehicle return volume | | | 314 | | | | 327 | | | | 300 | |
Return rate | | | 81 | % | | | 86 | % | | | 79 | % |
For rental repurchase vehicles, practically all vehicles have been returned to us.
Nature of Estimates Required. Each operating lease in our portfolio represents a vehicle we own that has been leased to a customer. At the time we purchase a lease, we establish an expected residual value for the vehicle. We estimate the expected residual value by evaluating recent auction values, historical return volumes for our leased vehicles, industry-wide used vehicle prices, our marketing incentive plans and vehicle quality data.
Assumptions Used. For retail leases, our accumulated depreciation on vehicles subject to operating leases is based on our assumptions of:
· | Auction value. Ford Credit's projection of the market value of the vehicles when we sell them at the end of the lease; and
|
· | Return volume. Ford Credit's projection of the number of vehicles that will be returned to us at lease-end.
|
See Note 8 of the Notes to the Financial Statements for more information regarding accumulated depreciation on vehicles subject to operating leases.
ITEM 7. Management's Discussion and Analysis of Financial Condition and Results of Operations (continued)
Sensitivity Analysis. For returned vehicles, we face a risk that the amount we obtain from the vehicle sold at auction will be less than our estimate of the expected residual value for the vehicle. At December 31, 2009, if future auction values for Ford Credit's existing portfolio of operating leases on Ford, Lincoln and Mercury brand vehicles in the United States were to decrease by one percent from its present estimates, the effect would be to increase the depreciation on these vehicles by about $50 million. Similarly, if return volumes for Ford Credit's existing portfolio of operating leases on Ford, Lincoln and Mercury brand vehicles in the United States were to increase by one percent from its present estimates, the effect would be to increase the depreciation on these vehicles by about $7 million. These increases in depreciation would be charged to depreciation expense during the 2010 through 2013 period so that the net investment in operating leases at the end of the lease term for these vehicles is equal to the revised expected residual value. Adjustments to the amount of accumulated depreciation on operating leases will be reflected on our balance sheet as Net investment in operating leases and on the statement of operations in Depreciation, in each case under the Financial Services sector.
Allowance for Credit Losses
The allowance for credit losses is Ford Credit's estimate of the probable credit losses inherent in finance receivables and operating leases at the date of the balance sheet. Consistent with its normal practices and policies, Ford Credit assesses the adequacy of its allowance for credit losses quarterly and regularly evaluates the assumptions and models used in establishing the allowance. Because credit losses can vary substantially over time, estimating credit losses requires a number of assumptions about matters that are uncertain.
Nature of Estimates Required. Ford Credit estimates the probable credit losses inherent in finance receivables and operating leases based on several factors.
Consumer Segment.Retail Installment and Lease Portfolio. The retail installment and lease portfolio is evaluated using a combination of models and management judgment, and is based on factors such as historical trends in credit losses and recoveries (including key metrics such as delinquencies, repossessions, and bankruptcies), the composition of Ford Credit's present portfolio (including vehicle brand, term, risk evaluation, and new/used vehicles), trends in historical and projected used vehicle values, and economic conditions. Estimates from models may not fully reflect losses inherent in the present portfolio, and an element of the allowance for credit losses is established for the imprecision inherent in loan loss models. Reasons for imprecision include changes in economic trends and conditions, portfolio composition, and other relevant factors.
Assumptions Used. Ford Credit makes projections of two key assumptions:
· | Frequency. The number of finance receivables and operating lease contracts that Ford Credit expects will default over a period of time, measured as repossessions; and |
· | Loss severity. The expected difference between the amount a customer owes Ford Credit when Ford Credit charges off the finance contract and the amount Ford Credit receives, net of expenses, from selling the repossessed vehicle, including any recoveries from the customer. |
Ford Credit uses these assumptions to assist it in estimating its allowance for credit losses. See Note 9 of the Notes to the Financial Statements for more information regarding allowance for credit losses.
Item 7. Management's Discussion and Analysis of Financial Condition and Results of Operations (continued)
Sensitivity Analysis. Changes in the assumptions used to derive frequency and severity would affect the allowance for credit losses. The effect of the indicated increase/decrease in the assumptions is shown below for Ford Lincoln,Credit's U.S. Ford and Mercury brand vehicles in the U.S.Lincoln retail and lease portfolio (in millions):
|
| | | | | | |
| | | | | Increase/(Decrease) |
| Assumption | | Percentage Point Change | | December 31, 20092011 Allowance for Credit Losses | | |
Repossession rates* rates (a) | | +/- 0.1 pt. | | $30/$(30)20/$(20) | | $30/$20/$(30)(20) |
Loss severity | | +/- 1.0 | | 10/(10)5/(5) | | 10/(10)5/(5) |
__________
* | |
| (a) | Reflects the number of finance receivables and operating lease contracts that Ford Credit expects will default over a period of time relative to the average number of contracts outstanding. |
ITEM 7. Management's Discussion and Analysis of Financial Condition and Results of Operations (continued)
Non-Consumer Segment. Wholesale and Dealer Loan Portfolio. The wholesale and dealer loan portfolio is evaluated by segmenting individual loans into risk pools, which are determined by the risk characteristics of the loan (such as the amount of the loan, the nature of collateral, and the financial status of the dealer). The risk pools are analyzed to determine if individual loans are impaired, and an allowance is estimated for the expected loss of these loans.
Changes in Ford Credit's assumptions affect the Provision for credit and insurance losses on our statement of operations and the allowance for credit losses contained within Finance receivables, net and Net investment inoperating leases on our balance sheet, in each case under the Financial Services sector.
Accumulated Depreciation on Vehicles Subject to Operating Leases
Accumulated depreciation on vehicles subject to operating leases reduces the value of the leased vehicles in our operating lease portfolio from their original acquisition value to their expected residual value at the end of the lease term. These vehicles primarily consist of retail lease contracts for Ford Credit and vehicles sold to daily rental car companies subject to a guaranteed repurchase option ("rental repurchase vehicles") for the Automotive sector.
We monitor residual values each month, and we review the adequacy of our accumulated depreciation on a quarterly basis. If we believe that the expected residual values for our vehicles have changed, we revise depreciation to ensure that our net investment in operating leases (equal to our acquisition value of the vehicles less accumulated depreciation) will be adjusted to reflect our revised estimate of the expected residual value at the end of the lease term. Such adjustments to depreciation expense would result in a change in the depreciation rates of the vehicles subject to operating leases, and are recorded prospectively on a straight-line basis.
For retail leases, each lease customer has the option to buy the leased vehicle at the end of the lease or to return the vehicle to the dealer. Ford Credit's North America operating lease activity was as follows for each of the last three years (in thousands, except percentages):
|
| | | | | |
| | 2011 | | 2010 | | 2009 |
| Vehicle return volume | 144 | | 281 | | 314 |
| Return rate | 59% | | 69% | | 81% |
For rental repurchase vehicles, practically all vehicles have been returned to us.
Nature of Estimates Required. Each operating lease in our portfolio represents a vehicle we own that has been leased to a customer. At the time we purchase a lease, we establish an expected residual value for the vehicle. We estimate the expected residual value by evaluating recent auction values, historical return volumes for our leased vehicles, industry-wide used vehicle prices, our marketing incentive plans, and vehicle quality data.
Assumptions Used. For retail leases, our accumulated depreciation on vehicles subject to operating leases is based on our assumptions regarding:
Auction value. Ford Credit's projection of the market value of the vehicles when we sell them at the end of the lease; and
Return volume. Ford Credit's projection of the number of vehicles that will be returned to us at lease-end.
See Note 8 of the Notes to the Financial Statements for more information regarding accumulated depreciation on vehicles subject to operating leases.
Item 7. Management's Discussion and Analysis of Financial Condition and Results of Operations (continued)
Sensitivity Analysis. For returned vehicles, we face a risk that the amount we obtain from the vehicle sold at auction will be less than our estimate of the expected residual value for the vehicle. The effect of the indicated increase/decrease in the assumptions for our U.S. Ford and Lincoln retail and lease portfolio is as follows:
|
| | | | | | |
| | | | Increase/(Decrease) |
| Assumption | | Percentage Change | | December 31, 2011 Accumulated Depreciation on Vehicles Subject to Operating Leases | |
2012 Expense |
| Future auction values | | +/- 1.0 | | $32/$(32) | | $12/$(12) |
| Return volumes | | +/- 1.0 | | 3/(3) | | 1/(1) |
The impact of the increased accumulated supplemental depreciation in 2011 would be charged to expense in the
2012 - 2015 periods. Adjustments to the amount of accumulated depreciation on operating leases are reflected on our balance sheet as Net investment in operating leases and on the statement of operations in Depreciation, in each case under the Financial Services sector.
ACCOUNTING STANDARDS ISSUED BUT NOT YET ADOPTED
For information on accounting standards issued but not yet adopted, see Note 3 of the Notes to the Financial Statements.
Item 7. Management's Discussion and Analysis of Financial Condition and Results of Operations (continued)
AGGREGATE CONTRACTUAL OBLIGATIONS
We are party to many contractual obligations involving commitments to make payments to third parties. Most of these are debt obligations incurred by our Financial Services sector. Long-term debt may have fixed or variable interest rates. For long-term debt with variable ratevariable-rate interest, we estimate the future interest payments based on projected market interest rates for various floating-rate benchmarks received from third parties. In addition, as part of our normal business practices, we enter into contracts with suppliers for purchases of certain raw materials, components, and services to facilitate adequate supply of these materials and services. These arrangements may contain fixed or minimum quantity purchase requirements. We enter into such arrangements to facilitate adequate supply of these materials and services. "Purchase obligations" are defined as off-balance sheet agreements to purchase goods or services that are enforceable and legally binding on the Company and that specify all significant terms.
The table below summarizes our contractual obligations as of December 31, 20092011 (in millions):
| | | | | | | |
| | | | | | 2011 - 2012 | | | 2013 - 2014 | | | | | | | |
| Automotive Sector | | | | | | | | | | | | | | | | | |
| On-balance sheet | | | | | | | | | | | | | | | | | |
| Long-term debt (a) (b) (excluding capital leases) | | $ | 1,618 | | | $ | 3,720 | | | $ | 14,749 | | | $ | 18,030 | | | $ | 38,117 | |
| Interest payments relating to long-term debt (c) | | | 1,149 | | | | 2,711 | | | | 3,492 | | | | 11,468 | | | | 18,820 | |
Capital leases | | | 23 | | | | 32 | | | | 9 | | | | 26 | | | | 90 | |
| Off-balance sheet | | | | | | | | | | | | | | | | | | | | |
Purchase obligations | | | 1,564 | | | | 858 | | | | 241 | | | | 183 | | | | 2,846 | |
Operating leases | | | 217 | | | | 280 | | | | 161 | | | | 211 | | | | 869 | |
Total Automotive sector | | | 4,571 | | | | 7,601 | | | | 18,652 | | | | 29,918 | | | | 60,742 | |
| | | | | | | | | | | | | | | | | | | | | |
| Financial Services Sector | | | | | | | | | | | | | | | | | | | | |
| On-balance sheet | | | | | | | | | | | | | | | | | | | | |
| Long-term debt (a) (b) (excluding capital leases) | | | 26,300 | | | | 40,810 | | | | 10,096 | | | | 6,145 | | | | 83,351 | |
| Interest payments relating to long-term debt (c) | | | 3,651 | | | | 4,551 | | | | 1,918 | | | | 3,114 | | | | 13,234 | |
Capital leases | | | — | | | | — | | | | — | | | | — | | | | — | |
| Off-balance sheet | | | | | | | | | | | | | | | | | | | | |
Purchase obligations | | | 45 | | | | 14 | | | | 4 | | | | 4 | | | | 67 | |
Operating leases | | | 92 | | | | 126 | | | | 56 | | | | 52 | | | | 326 | |
Total Financial Services sector | | | 30,088 | | | | 45,501 | | | | 12,074 | | | | 9,315 | | | | 96,978 | |
| | | | | | | | | | | | | | | | | | | | | |
Intersector elimination (d) | | | (646 | ) | | | — | | | | — | | | | — | | | | (646 | ) |
| | | | | | | | | | | | | | | | | | | | | |
Total Company | | $ | 34,013 | | | $ | 53,102 | | | $ | 30,726 | | | $ | 39,233 | | | $ | 157,074 | |
(a) | Amount includes, prior to adjustment noted above, $1,641 million for the Automotive sector and $26.3 billion for the Financial Services sector for the current portion of long-term debt. See Note 19 of the Notes to the Financial Statements for additional discussion. |
(b) | Automotive sector excludes unamortized debt discounts of $(4,578) million. Financial Services sector excludes unamortized debt discounts of $(530) million and adjustments of $231 million related to designated fair value hedges of the debt. |
(c) | For the years 2010 – 2013, excludes deferred interest on our Subordinated Convertible Debentures; for all periods, excludes amortization of debt discounts. |
(d) | Intersector elimination related to Ford's acquisition of Ford Credit debt securities. See Note 1 of the Notes to the Financial Statements for additional detail. |
92 |
| | | | | | | | | | | | | | | | | | | |
| | Payments Due by Period | | |
| | 2012 | | 2013 - 2014 | | 2015 - 2016 | | 2017 and Thereafter | | Total |
| Automotive Sector | | | | | | | | | |
| On-balance sheet | | | | | | | | | |
| Long-term debt (a) (b) (excluding capital leases) | $ | 446 |
| | $ | 1,401 |
| | $ | 2,688 |
| | $ | 8,198 |
| | $ | 12,733 |
|
| Interest payments relating to long-term debt (c) | 589 |
| | 1,130 |
| | 1,046 |
| | 7,717 |
| | 10,482 |
|
| Capital leases | 10 |
| | 12 |
| | 7 |
| | 4 |
| | 33 |
|
| Off-balance sheet | | | | | | | | |
|
|
| Purchase obligations | 1,765 |
| | 1,455 |
| | 726 |
| | 1,106 |
| | 5,052 |
|
| Operating leases | 195 |
| | 351 |
| | 229 |
| | 231 |
| | 1,006 |
|
| Total Automotive sector | 3,005 |
| | 4,349 |
|
| 4,696 |
|
| 17,256 |
|
| 29,306 |
|
| | | | | | | | | |
|
| Financial Services Sector | | | | | | | | |
|
| On-balance sheet | | | | | | | | |
|
| Long-term debt (a) (b) (excluding capital leases) | 22,681 |
| | 24,832 |
| | 13,976 |
| | 7,977 |
| | 69,466 |
|
| Interest payments relating to long-term debt (c) | 2,755 |
| | 3,719 |
| | 1,751 |
| | 2,043 |
| | 10,268 |
|
| Capital leases | 1 |
| | 2 |
| | 1 |
| | — |
| | 4 |
|
| Off-balance sheet | | | | | | | | |
|
|
| Purchase obligations | 19 |
| | 12 |
| | 11 |
| | 11 |
| | 53 |
|
| Operating leases | 54 |
| | 70 |
| | 42 |
| | 41 |
| | 207 |
|
| Total Financial Services sector | 25,510 |
| | 28,635 |
|
| 15,781 |
|
| 10,072 |
|
| 79,998 |
|
| Intersector elimination (d) | (201 | ) | | — |
| | — |
| | — |
| | (201 | ) |
| Total Company | $ | 28,314 |
| | $ | 32,984 |
|
| $ | 20,477 |
|
| $ | 27,328 |
|
| $ | 109,103 |
|
__________(a) Amount includes, prior to adjustment noted above, $456 million for the Automotive sector and $22,682 million for the Financial Services sector for the current portion of long-term debt. See Note 18 of the Notes to the Financial Statements for additional discussion. ITEM 7. Management's Discussion(b) Automotive sector excludes unamortized debt discounts of $(249) million. Financial Services sector excludes unamortized debt discounts of $(152) million and Analysisadjustments of $681 million related to designated fair value hedges of the debt.
(c) Excludes amortization of debt discounts/premiums.
(d) Intersector elimination related to Ford's acquisition of Ford Credit debt securities. See Note 18 of the Notes to the Financial Condition and Results of Operations (continued)
The amount of unrecognized tax benefits for 20092011 of $1.2$1.8 billion (see Note 2322 of the Notes to the Financial Statements)Statements for additional discussion) is excluded from the table above. Final settlement of a significant portion of these obligations will require bilateral tax agreements among us and various countries, the timing of which cannot reasonably be reasonably estimated.
For additional information regarding long-term debt, operating lease obligations, and pension and OPEB obligations, and the UAW VEBA Trust,long-term debt, see Notes 19, 8, 17 and 18, respectively, of the Notes to the Financial Statements.
ITEM 7A.Quantitative and Qualitative Disclosures About Market Risk
OVERVIEW
We are exposed to a variety of market and other risks, including the effects of changes in foreign currency exchange rates, commodity prices, interest rates, as well as risks to availability of funding sources, hazard events, and specific asset risks.
These risks affect our Automotive and Financial Services sectors differently. We monitor and manage these exposures as an integral part of our overall risk management program, which includes regular reports to a central management committee, the Global Risk Management Committee ("GRMC"). The GRMC is chaired by our Chief Financial Officer, and its members include our Treasurer, our Corporate Controller, and other members of senior management.
Our Automotive and Financial Services sectors are exposed to liquidity risk, or the possibility of having to curtail their businesses or being unable to meet present and future financial obligations as they come due because funding sources may be reduced or become unavailable. We maintain plans for sources of funding to ensure liquidity through a variety of economic or business cycles. As discussed in greater detail in Item 7 our funding sources include sales of receivables in securitizations and other structured financings, unsecured debt issuances, equity and equity-linked issuances, and bank borrowings.
We are exposed to a variety of insurable risks, such as loss or damage to property, liability claims, and employee injury. We protect against these risks through a combination of self-insurance and the purchase of commercial insurance designed to protect against events that could generate significant losses.
Direct responsibility for the execution of our market risk management strategies resides with our Treasurer's Office and is governed by written policespolicies and procedures. Separation of duties is maintained between the development and authorization of derivative trades, the transaction of derivatives, and the settlement of cash flows. Regular audits are conducted to ensure that appropriate controls are in place and that they remain effective. In addition, our market risk exposures and our use of derivatives to manage these exposures are approved by the GRMC, and reviewed by the Audit Committee of our Board of Directors.
In accordance with corporate risk management policies, we use derivative instruments, when available, such as forward contracts, swaps and options that economically hedge certain exposures (foreign currency, commodity, and interest rates). Derivative positions, when available, are used to hedge underlying exposures; we do not use derivative contracts for trading, market-making or speculative purposes. In certain instances, we forgo hedge accounting, whichand, in certain other instances, our derivatives do not qualify for hedge accounting. Either situation results in unrealized gains and losses that are recognized currently in net income.
The continued deterioration of our derivative capacity in the first half of 2009 resulted in unhedged currency exposure from cross-border intercompany lending during 2009. Total unhedged intercompany loans were about $1.7 billion as of March 31, 2009 and increased to about $5.5 billion as of June 30, 2009. Currency exposure from intercompany loans was substantially hedged at December 31, 2009 through implementation of collateral arrangements with certain counterparties and continued reduction in intercompany loans resulting from local funding actions. For additional information on our derivatives, see Note 2625 of the Notes to the Financial Statements.
ITEM 7A. Quantitative and Qualitative Disclosures About Market Risk (continued)
The market and counterparty risks of our Automotive sector and Ford Credit are discussed and quantified below.
AUTOMOTIVE MARKET AND COUNTERPARTY RISK
Our Automotive sector frequently has expenditures and receipts denominated in foreign currencies, including the following: purchases and sales of finished vehicles and production parts, debt and other payables, subsidiary dividends, and investments in foreign operations. These expenditures and receipts create exposures to changes in exchange rates. We also are exposed to changes in prices of commodities used in our Automotive sector and changes in interest rates.
Foreign currency risk and commodity risk are measured and quantified using a model to evaluate the sensitivity of the fair value of currency and commodity derivative instruments with exposure to market risk that assumes instantaneous, parallel shifts in rates and/or prices. For options and instruments with non-linear returns, appropriate models are utilized to determine the impact of shifts in rates and prices.
Foreign Currency Risk.Foreign currency risk is the possibility that our financial results could be better or worse than planned because of changes in currency exchange rates. Accordingly, our normal practice is to use derivative instruments, when available, to hedge our economic exposure with respect to forecasted revenues and costs, assets, liabilities, investments in foreign operations, and firm commitments denominated in foreign currencies. In our hedging actions, we use primarily instruments commonly used by corporations to reduce foreign exchange risk (e.g., forward and option contracts).
Item 7A. Quantitative and Qualitative Disclosures About Market Risk (continued)
The net fair value of foreign exchange forward and option contracts (including adjustments for credit risk) as of
December 31, 20092011 was a liability of $26$236 million compared to a net fair value assetliability of $249$35 million as of December 31, 2008.2010. The potential decrease in fair value of foreign exchange forward and option contracts (excluding adjustments for credit risk), assumingfrom a 10% adverse change in the underlying foreign currency exchange rates, versus thein U.S. dollar terms, would be approximately $622 millionabout $1.7 billion at December 31, 2009 and was $6002011 compared with a decrease of about $350 million as of December 31, 2008. If adjustments for credit2010. The increase in potential market risk were to be included,from the decrease would be smaller.end of last year primarily results from an increase in the amount of foreign currencies hedged during 2011 as our hedging capacity has increased with improved operating performance.
At December 31, 2009, substantially all of our intercompany loans were fully hedged.
Commodity Price Risk. Commodity price risk is the possibility that our financial results could be better or worse than planned because of changes in the prices of commodities used in the production of motor vehicles, such as ferrous metals (e.g., steel and iron castings), non-ferrous metals (e.g., aluminum), precious metals (e.g., palladium), ferrous metals (e.g., steel and iron castings), energy (e.g., natural gas and electricity), and plastics/resins (e.g., polypropylene). Steel and resins are two of our largest commodity exposures and are among the most difficult to hedge.
Our normal practice is to use derivative instruments, when available, to hedge the price risk associated with the purchase of those commodities that we can economically hedge (primarily non-ferrous metals and precious metals and energies)metals). In our hedging actions, we primarily use derivative instruments commonly used by corporations to reduce commodity price risk (e.g., financially settled forward contracts, swaps, and options).
The net fair value of commodity forward and option contracts (including adjustments for credit risk) as of December 31, 20092011 was a liability of $39$370 million (which reflects the cumulative mark to market net loss on our hedging contracts for full year 2011), compared to a liabilityan asset of $212$63 million as of December 31, 2008.2010. The potential decrease in fair value of commodity forward and option contracts (excluding adjustments for credit risk), assumingfrom a 10% decreaseadverse change in the underlying commodity prices, in U.S. dollar terms, would be approximately $20about $203 million at December 31, 2009,2011, compared with a decrease of $26about $90 million at December 31, 2008. If adjustments for credit2010. The increase in potential market risk were to be included,from the decrease would be smaller.end of last year primarily results from an increase in the amount of commodities hedged during 2011 as our hedging capacity has increased with improved operating performance.
In addition, our purchasing organization (with guidance from the GRMC as appropriate) negotiates contracts to ensure continuous supply of raw materials. In some cases, these contracts stipulate minimum purchase amounts and specific prices, and as such, play a role in managing price risk.
ITEM 7A. Quantitative and Qualitative Disclosures About Market Risk (continued)
Interest Rate Risk. Interest rate risk relates to the gain or loss we could incur in our Automotive investment portfolios due to a change in interest rates. Our interest rate sensitivity analysis on the investment portfolios includes cash and cash equivalents and net marketable securities. At December 31, 2009,2011, we had $25.5$22.9 billion in our Automotive investment portfolios, compared to $13.4$20.5 billion at December 31, 2008.2010. We invest the portfolios in securities of various types and maturities, the value of which are subject to fluctuations in interest rates. The portfolios are classified as trading portfolios and gains and losses (unrealized and realized) are reported in the statement of operations. The investment strategy is based on clearly defined risk and liquidity guidelines to maintain liquidity, minimize risk, and earn a reasonable return on the short-term investment.investments. In 2009,investing our Automotive cash, safety of principal wasis the primary objective in investing our Automotive cash.and risk-adjusted return is the secondary objective.
At any time, a rise in interest rates could have a material adverse impact on the fair value of our portfolios. Assuming a hypothetical increase in interest rates of one percentage point, the value of our portfolios would be reduced by about $62$95 million. This compares to $57$81 million, as calculated as of December 31, 2008.2010. While these are our best estimates of the impact of the specified interest rate scenario, actual results could differ from those projected. The sensitivity analysis presented assumes interest rate changes are instantaneous, parallel shifts in the yield curve. In reality, interest rate changes of this magnitude are rarely instantaneous or parallel.
Counterparty Risk. Counterparty risk relates to the loss we could incur if an obligor or counterparty defaulted on an investment or a derivative contract. We enter into master agreements with counterparties that allow netting of certain exposures in order to manage this risk. Exposures primarily relate to investments in fixed income instruments and derivative contracts used for managing interest rate, foreign currency exchange rate and commodity price risk. We, together with Ford Credit, establish exposure limits for each counterparty to minimize risk and provide counterparty diversification.
Our approach to managing counterparty risk is forward-looking and proactive, allowing us to take risk mitigation actions before risks become losses. We establish exposureExposure limits for both net fair value and future potential exposure,are established based on our overall risk tolerance and estimated loss projections which are calculated from ratings-based historical default probabilities. The exposure limits are lower for lower-rated counterparties and for longer-dated exposures. We use a model to assess our potential exposure, defined at a 95% confidence level. Our exposures are monitored on a regular basis and included in periodic reportingreports to our Treasurer.
Item 7A. Quantitative and Qualitative Disclosures About Market Risk (continued)
Substantially all of our counterparty exposures are with counterparties that are rated single-A or better. Ourhave an investment grade rating. Investment grade is our guideline for counterparty minimum long-term ratings is BBB-.ratings.
For additional information about derivative notional amount and fair value of derivatives, please refer to Note 2625 of the Notes to the Financial Statements.
FORD CREDIT MARKET RISK
Overview. Ford Credit is exposed to a variety of risks in the normal course of its business activities. In addition to counterparty risk discussed above, Ford Credit is subject to the following additional types of risks that it seeks to identify, assess, monitor, and manage, in accordance with defined policies and procedures:
· | Market risk —Market risk - the possibility that changes in interest and currency exchange rates will adversely affect cash flow and economic value; |
· | Credit risk — the possibility of loss from a customer’sCredit risk - the possibility of loss from a customer's failure to make payments according to contract terms; |
· | Residual risk —Residual risk - the possibility that the actual proceeds received at lease termination will be lower than projections or return volumes will be higher than projections; and |
· | Liquidity risk —Liquidity risk - the possibility that Ford Credit may be unable to meet all of its current and future obligations in a timely manner. |
Each form of risk is uniquely managed in the context of its contribution to Ford Credit's overall global risk. Business decisions are evaluated on a risk-adjusted basis and services are priced consistent with these risks. Credit and residual risks, as well as liquidity risk, are discussed above in Item 7. A discussion of Ford Credit's market risks (interest rate risk and foreign currency risk) is included below.
ITEM 7A. Quantitative and Qualitative Disclosures About Market Risk (continued)
Interest Rate Risk. Risk. Ford Credit's primary market risk exposureCredit is exposed to interest rate risk and the particular market to which it is most exposed is U.S. dollar LIBOR. Interest rate risk exposure results principally from “re-pricing risk” or differences in the re-pricing characteristics of assets and liabilities. An instrument’s re-pricing period is a term used to describe how an interest rate-sensitive instrument responds to changes in interest rates. It refers to the time it takes an instrument’s interest rate to reflect a change in market interest rates. For fixed-rate instruments, the re-pricing period is equal to the maturity of the instrument’s principal, because the principal is considered to re-price only when re-invested in a new instrument. For a floating-rate instrument, the re-pricing period is the period of time before the interest rate adjusts to the market rate. For instance, a floating-rate loan whose interest rate is reset to a market index annually on December 31 would have a re-pricing period of one year on January 1, regardless of the instrument’s maturity.
Re-pricing risk arises whenextent that its assets and the related debt have different re-pricing periods, and consequently, respond differently to changes in interest rates. As an example, consider a hypothetical portfolio of fixed-rate assets that is funded with floating-rate debt. If interest rates increase, the interest paid on debt increases while the interest received on assets remains fixed. In this case, the hypothetical portfolio’s cash flows are exposed to changes in interest rates because its assets and debt have a re-pricing mismatch.
Ford Credit's receivablesassets consist primarily of fixed-rate retail installment sale and lease contracts and floating-rate wholesale receivables. Fixed-rate retail installment sale and lease contracts are originated principally with maturities ranging between two and six years and generally require customers to make equal monthly payments over the life of the contract. Wholesale receivables are originated to finance new and used vehicles held in dealers’dealers' inventory and generally require dealers to pay a floating rate.
Funding sources consistDebt consists primarily of securitizations and short- and long-term unsecured debt. In the case of unsecured term debt, and in an effort to have funds available throughout business cycles, Ford Credit may borrow at terms longer than the terms of their assets, in most instances with up to ten year maturities. These debt instruments are principally fixed-rate and require fixed and equal interest payments over the life of the instrument and a single principal payment at maturity.
Ford Credit is exposed to interest rate risk to the extent that a difference exists between the re-pricing profile of its assets and its debt. Specifically, without derivatives, in the aggregate Ford Credit's assets would re-price more quickly than its debt.
Ford Credit's interest rate risk management objective is to maximizereduce volatility in its cash flows and volatility in its economic value while limiting the impactfrom changes in interest rates based on an established risk tolerance.
Ford Credit uses re-pricing gap analysis and economic value sensitivity analysis to evaluate potential long term effects of changes in interest rates. Ford Credit achieves this objective by setting an established risk tolerance and staying within the tolerance through the following risk management process.
Ford Credit determines the sensitivity of its economic value to hypothetical changes in interest rates. Ford CreditIt then enters into interest rate swaps, when available, to economically convert portions of its floating-rate debt to fixed or its fixed-rate debt to floating to ensure that the sensitivity of its economic valueFord Credit's exposure falls within anthe established tolerance. As part of its process,tolerances. Ford Credit also monitors the sensitivity of itsuses pre-tax cash flow using simulation techniques. To measure this sensitivity Ford Credit calculatesanalysis to monitor the changelevel of near-term cash flow exposure. The pre-tax cash flow sensitivity analysis measures the changes in expected cash flows toassociated with Ford Credit's interest-rate-sensitive assets, liabilities, and derivative financial instruments from hypothetical changes in interest rates over a twelve-month horizon. This calculation determines the sensitivity of changes in cash flows associated withFord Credit's Asset-Liability Committee reviews the re-pricing characteristics of its interest-rate-sensitive assets, liabilities,mismatch and derivative financial instruments under various hypothetical interest rate scenarios including both parallelexposure every month and non-parallel shifts in the yield curve. This sensitivity calculation does not take into account any future actions Ford Credit may take to reduce the risk profile that arises from a change in interest rates. These quantifications of interest rate risk are reported to the Treasurer regularly (either monthly or quarterly depending on the market).
The process described above is used to measure and manage the interest rate risk of Ford Credit's operations in the United States, Canada, and the United Kingdom, which together represented approximately 80% of its total on-balance sheet finance receivables at December 31, 2009. For its other international affiliates, Ford Credit uses a technique, commonly referred to as "gap analysis," to measure re-pricing mismatch. This process uses re-pricing schedules that group assets, debt, and swaps into discrete time-bands based on their re-pricing characteristics. Ford Credit then enters intoapproves interest rate swaps when available, which effectively change the re-pricing profile of its debt,required to ensure that any re-pricing mismatch (between assets and liabilities) existing in a particular time-band fallsmaintain exposure within an established tolerance.
ITEM 7A. Quantitative and Qualitative Disclosures About Market Risk (continued)
As of December 31, 2009, in the aggregate Ford Credit's assets re-price faster than its debt (including the derivative instruments economically hedging the debt). Other things being equal, this means that during a period of rising interest rates, the interest rates earned on its assets will increase more rapidly than the interest rates paid on its debt, thereby initially increasing Ford Credit's pre-tax cash flow. Correspondingly, during a period of falling interest rates, Ford Credit would expect its pre-tax cash flow to initially decrease.
To provide a quantitative measure of the sensitivity of its pre-tax cash flow to changes in interest rates, Ford Credit uses interest rate scenarios that assume a hypothetical, instantaneous increase or decrease in interest rates of one percentage point in all interest rates, across all maturities (a "parallel shift"), as well as a base case that assumes that all interest rates remain constant at existing levels. In reality, interest rate changes are rarely instantaneous or parallel and rates could move more or less than the one percentage point assumed in Ford Credit's analysis. As a result, the actual impact to pre-tax cash flow could be higher or lower than the results detailed in the table below. These interest rate scenarios are purely hypothetical and do not represent Ford Credit's view of future interest rate movements.
Item 7A. Quantitative and Qualitative Disclosures About Market Risk (continued)
Pre-tax cash flow sensitivity as of year-end 20092011 and 20082010 was as follows (in millions):
| | | Pre-Tax Cash Flow Sensitivity (given a one percentage point instantaneous increase in interest rates) | | | Pre-Tax Cash Flow Sensitivity (given a one percentage point instantaneous decrease in interest rates) | |
| December 31, 2009 | | $ 27 | | | $ (27) | |
December 31, 2008 | | (28) | | | 28 | |
|
| | | | | | | |
| | Pre-Tax Cash Flow Sensitivity (given a one percentage point instantaneous increase in interest rates) | | Pre-Tax Cash Flow Sensitivity (given a one percentage point instantaneous decrease in interest rates) (a) |
| December 31, 2011 | $ | 60 |
| | $ | (60 | ) |
| December 31, 2010 | $ | (22 | ) | | $ | 22 |
|
_____
| * |
| (a) | Pre-tax cash flow sensitivity given a one percentage point decrease in interest rates requires an assumption of negative interest rates in markets where existing interest rates are below one percent. |
Based on assumptions includedAs of December 31, 2011, in the analysis, sensitivity toaggregate Ford Credit's assets re-price faster than its debt combined with the derivative instruments hedging the debt. Other things being equal, this means that during a one-percentage point instantaneous increase inperiod of rising interest rates, at year-end 2009 was anthe interest rates earned on Ford Credit's assets will increase inmore rapidly than the interest paid on Ford Credit's debt, thereby initially increasing Ford Credit's pre-tax cash flow overflow. Correspondingly, during a twelve-month horizonperiod of $27 million compared to a decrease of $28 million at year-end 2008. Correspondingly, the sensitivity to a one-percentage point instantaneous decrease infalling interest rates, at year-end 2009 was a decrease inFord Credit would expect its pre-tax cash flow over a twelve-month horizon of $27 million compared to an increase of $28 million at year-end 2008. This change primarily results from the decline in Ford Credit's managed receivables and Ford Credit's limited ability to obtain interest rate derivatives.
Foreign Currency Risk. Ford Credit's policy is to minimize exposure to changes in currency exchange rates. To meet funding objectives, Ford Credit borrows in a variety of currencies, principally U.S. dollars and euros. Ford Credit faces exposure to currency exchange rates if a mismatch exists between the currency of receivables and the currency of the debt funding those receivables. When possible, receivables are funded with debt in the same currency, minimizing exposure to exchange rate movements. When a different currency is used, Ford Credit may execute the following foreign currency derivatives to convert substantially all of foreign currency debt obligations to the local country currency of the receivables:
· | Foreign currency swap — an agreement to convert non-U.S. dollar long-term debt to U.S. dollar-denominated payments or non-local market debt to local market debt for our international affiliates; or
|
· | Foreign currency forward — an agreement to buy or sell an amount of funds in an agreed currency at a certain time in the future for a certain price.
|
As a result of this policy, Ford Credit believes its market risk exposure relating to changes in currency exchange rates is insignificant.initially decrease.
While the sensitivity analysis presented is Ford Credit's best estimate of the impacts of the specified assumed interest rate scenarios, its actual results could differ from those projected. The model Ford Credit uses to conduct this analysis is heavily dependent on assumptions. Embedded in the model are assumptions regarding the reinvestment of maturing asset principal, refinancing of maturing debt, replacement of maturing derivatives, exercise of options embedded in debt and derivatives, and predicted repayment of retail installment sale and lease contracts ahead of contractual maturity. Ford Credit's repayment projections ahead of contractual maturity are based on historical experience. If interest rates or other factors change, Ford Credit's actual prepayment experience could be different than projected.
Foreign Currency Risk. Ford Credit's policy is to minimize exposure to changes in currency exchange rates. To meet funding objectives, Ford Credit borrows in a variety of currencies, principally U.S. dollars, Canadian dollars, Euros and Pound Sterling. Ford Credit faces exposure to currency exchange rates if a mismatch exists between the currency of receivables and the currency of the debt funding those receivables. When possible, receivables are funded with debt in the same currency, minimizing exposure to exchange rate movements. When a different currency is used, Ford Credit may use foreign currency swaps and foreign currency forwards to convert substantially all of its foreign currency debt obligations to the local country currency of the receivables:
As a result of this policy, Ford Credit believes its market risk exposure relating to changes in currency exchange rates is insignificant.
Derivative Fair Values. The net fair value of Ford Credit's net derivative financial instruments (derivative assets less derivative liabilities) atas of December 31, 20092011 was $683an asset of about $1.1 billion, compared to an asset of $712 million which was $963 million lower thanas of December 31, 2008. The decrease primarily reflects lower derivative notional value.2010. For additional information regarding our Financial Services sector derivatives, see Note 2625 of the Notes to the Financial Statements.
ITEM 8. Financial Statements and Supplementary Data
OurThe Report of Independent Registered Public Accounting Firm, our Financial Statements, the accompanying Notes to the Financial Statements, the Report of Independent Registered Public Accounting Firm, and the Financial Statement Schedule that are filed as part of this Report are listed under "Item 15. Exhibits and Financial Statement Schedules" and are set forth on pages FS-1 through FS-93FS-97 and FSS-1 immediately following the signature pages of this Report.
Selected quarterly financial data for 20092011 and 2008 is2010 are provided in Note 3029 of the Notes to the Financial Statements.
ITEM 9. Changes in and Disagreements with Accountants on Accounting and Financial Disclosure
None.
ITEM 9A. Controls and Procedures
EVALUATION OF DISCLOSURE CONTROLS AND PROCEDURES
Evaluation of Disclosure Controls and Procedures. Alan Mulally, our Chief Executive Officer ("CEO"), and Lewis Booth, our Chief Financial Officer ("CFO"), have performed an evaluation of the Company’sCompany's disclosure controls and procedures, as that term is defined in Rule 13a-15(e) of the Securities Exchange Act of 1934, as amended (the "Exchange("Exchange Act"), as of December 31, 20092011, and each has concluded that such disclosure controls and procedures wereare effective to ensure that information required to be disclosed in our periodic reports filed under the Exchange Act is recorded, processed, summarized and reported within the time periods specified by the Securities and Exchange Commission'sSEC rules and forms, and that such information is accumulated and communicated to our management as appropriatethe CEO and CFO to allow for timely decisions regarding required disclosure.disclosures.
MANAGEMENT'S REPORT ON INTERNAL CONTROL OVER FINANCIAL REPORTING
Management's Report on Internal Control Over Financial Reporting. Our management is responsible for establishing and maintaining adequate internal control over financial reporting, as such term is defined in Exchange Act Rule 13a-15(f). The Company's internal control over financial reporting is a process designed to provide reasonable assurance regarding the reliability of financial reporting and the preparation of financial statements for external purposes in accordance with generally accepted accounting principles.
Because of its inherent limitations, internal control over financial reporting may not prevent or detect misstatements. Also, projections of any evaluation of effectiveness to future periods are subject to the risk that controls may become inadequate because of changes in conditions or because the degree of compliance with policies or procedures may deteriorate.
Under the supervision and with the participation of our management, including our CEO and CFO, we conducted an assessment of the effectiveness of our internal control over financial reporting as of December 31, 2009.2011. The assessment was based on criteria established in the framework Internal Control –- Integrated Framework, issued by the Committee of Sponsoring Organizations of the Treadway Commission. Based on this assessment, management concluded that our internal control over financial reporting was effective as of December 31, 2009.2011.
The effectiveness of the Company's internal control over financial reporting as of December 31, 20092011 has been audited by PricewaterhouseCoopers LLP, an independent registered public accounting firm, as stated in its report included herein.
MATERIAL CHANGES IN INTERNAL CONTROL
We identified the following changesChanges in internal controlInternal Control over financial reporting that materially affected or are reasonably likely to materially affect internal control over financial reportingFinancial Reporting. As previously disclosed, during the fourth quarter of 2009:
German Payroll System. Ford Europe launched a2011 we transferred our Russian operations to the new payroll system for Germany during the quarter.FordSollers joint venture, which is an unconsolidated affiliate.
ITEM 9B. Other Information
None.
PART IIIIII.
ITEM 10.Directors, Executive Officers of Ford and Corporate Governance
The information required by Item 10 regarding our directors is incorporated by reference from the information under the captions "Election of Directors," "Section 16(a) Beneficial Ownership Reporting Compliance" and "Management Stock Ownership" in our Proxy Statement. The information required by Item 10 regarding our executive officers appears as Item 4A under Part I of this Report. The information required by Item 10 regarding an audit committee financial expert is incorporated by reference from the information under the caption "Corporate Governance" in our Proxy Statement. The information required by Item 10 regarding the members of our Audit Committee of the Board of Directors is incorporated by reference from the information under the caption "Committees of the Board of Directors" in our Proxy Statement. The information required by Item 10 regarding the Audit Committee's review and discussion of the audited financial statements is incorporated by reference from information under the caption "Audit Committee Report" in our Proxy Statement. The information required by Item 10 regarding our codes of ethics is incorporated by reference from the information under the caption "Corporate Governance" in our Proxy Statement. In addition, we have included in Item 1 instructions for how to access our codes of ethics on our website and our Internet address. Amendments to, and waivers granted under, our Code of Ethics for Senior Financial Personnel, if any, will be posted to our website as well.
ITEM 11.Executive Compensation
The information required by Item 11 is incorporated by reference from the information under the following captions in our Proxy Statement: "Director Compensation," "Compensation Discussion and Analysis," "Compensation Committee Report," "Compensation Committee Interlocks and Insider Participation," "Compensation of Executive Officers," "Grants of Plan-Based Awards in 2009,2011," "Outstanding Equity Awards at 20092011 Fiscal Year-End," "Option Exercises and Stock Vested in 2009,2011," "Pension Benefits in 2009,2011," "Nonqualified Deferred Compensation in 2009,2011," and "Potential Payments Upon Termination or Change in Control."
ITEM 12.Security Ownership of Certain Beneficial Owners and Management and Related Stockholder Matters
The information required by Item 12 is incorporated by reference from the information under the captions "Equity Compensation Plan Information" and "Management Stock Ownership" in our Proxy Statement.
ITEM 13.Certain Relationships and Related Transactions, and Director Independence
The information required by Item 13 is incorporated by reference from the information under the captions "Certain Relationships and Related Transactions" and "Corporate Governance" in our Proxy Statement.
ITEM 14.Principal Accounting Fees and Services
The information required by Item 14 is incorporated by reference from the information under the caption "Audit Committee Report" in our Proxy Statement.
PART IV
PART IV.
ITEM 15. Exhibits and Financial Statement Schedules
(a) 1. Financial Statements – Ford Motor Company and Subsidiaries
The following are contained in this 20092011 Form 10-K Report:
· | Consolidated Statement of Operations and Sector Statement of Operations for the years ended December 31, 2009, 2008, and 2007. |
Report of Independent Registered Public Accounting Firm.
· | Consolidated Balance Sheet and Sector Balance Sheet at December 31, 2009 and 2008. |
Consolidated Statement of Operations and Sector Statement of Operations for the years ended December 31, 2011, 2010, and 2009.
· | Consolidated Statement of Cash Flows and Sector Statement of Cash Flows for the years ended December 31, 2009, 2008, and 2007. |
Consolidated Balance Sheet and Sector Balance Sheet at December 31, 2011 and 2010.
· | Consolidated Statement of Equity for the years ended December 31, 2009, 2008, and 2007. |
Consolidated Statement of Cash Flows and Sector Statement of Cash Flows for the years ended December 31, 2011, 2010, and 2009.
· | Notes to the Financial Statements. |
Consolidated Statement of Equity for the years ended December 31, 2011, 2010, and 2009.
· | Report of Independent Registered Public Accounting Firm. |
The Consolidated and Sector Financial Statements, the Notes to the Financial Statements and theStatements.
The Report of Independent Registered Public Accounting Firm, the Consolidated and Sector Financial Statements, and the Notes to the Financial Statements listed above are filed as part of this Report and are set forth on pages FS-1 through FS-93FS-97 immediately following the signature pages of this Report.
(a) 2. Financial Statement Schedules
|
| |
| Designation | Description |
| |
Schedule II | Valuation and Qualifying Accounts |
Schedule II is filed as part of this Report and is set forth on page FSS-1 immediately following the Notes to the Financial Statements referred to above. The other schedules are omitted because they are not applicable, the information required to be contained in them is disclosed elsewhere in our Consolidated and Sector Financial Statements or the amounts involved are not sufficient to require submission.
(a) 3. Exhibits
|
| | | | |
| Designation | | Description | | Method of Filing |
| Exhibit 3-A | | | |
Exhibit 2 | Stock Purchase Agreement dated as of September 12, 2005 between CCMG Holdings, Inc., Ford Holdings LLC and Ford Motor Company. | | Filed as Exhibit 2 to our Quarterly Report on
Form 10-Q for the period ended September 30, 2005.*
|
| | | |
Exhibit 3-A | Restated Certificate of Incorporation, dated August 2, 2000. | | Filed as Exhibit 3-A to our Annual Report on Form 10-K for the year ended December 31, 2000.* |
| | | |
| Exhibit 3-B | | By-Laws as amended through December 14, 2006. | | Filed as Exhibit 3-B to our Annual Report on Form 10-K for the year ended December 31, 2006.* |
| | | |
| Exhibit 10-A | | Executive Separation Allowance Plan as amended and restated as of December 31, 2008.January 1, 2011.** | | Filed as Exhibit 10-A to our Annual Report on Form 10-K for the year ended December 31, 2008.2010.* |
| | | |
| Exhibit 10-B | | Deferred Compensation Plan for Non- EmployeeNon-Employee Directors, as amended and restated as of December 31, 2008.January 1, 2012.** | | Filed as Exhibit 10-B to our Annual Report on Form 10-K for the year ended December 31, 2008.*
with this Report. |
ITEM 15. Exhibits and Financial Statement Schedules (continued)
| Exhibit 10-C | | Benefit Equalization Plan, as amended and restated as of December 31, 2008.January 1, 2011.** | | Filed as Exhibit 10-C to our Annual Report on Form 10-K for the year ended December 31, 2008.2010.* |
| | | |
| Exhibit 10-D | | Description of financial counseling services provided to certain executives.** | | Filed as Exhibit 10-F to Ford'sour Annual Report on Form 10-K for the year ended December 31, 2002.* |
| Exhibit 10-E | | | |
Exhibit 10-E | Supplemental Executive Retirement Plan, as amended and restated as of December 31, 2008.January 1, 2011.** | | Filed as Exhibit 10-E to our Annual Report on Form 10-K for the year ended December 31, 2010.* |
|
| | | | |
| Designation | | Description | | Method of Filing |
| Exhibit 10-F | | Description of Director Compensation as of July 13, 2006.** | | Filed as Exhibit 10-G-3 to our Quarterly Report on Form 10-Q for the quarter ended September 30, 2006.* |
| Exhibit 10-F-1 | | Amendment to Description of Director Compensation as of March 1, 2009.** | | Filed as Exhibit 10-F-5 to our Annual Report on Form 10-K for the year ended December 31, 2008.* |
| | | |
Exhibit 10-F10-F-2 | Restricted Stock Plan for Non-Employee Directors adopted by the Board | Amendment to Description of Directors on November 10, 1988.Director Compensation as of February 25, 2010.** | | Filed as Exhibit 10-P10-F-6 to our Annual Report on Form 10-K for the year ended December 31, 1988.2009.* |
| | | |
Exhibit 10-F-110-F-3 | | Amendment to Restricted Stock Plan for Non-Employee Directors, effectiveDescription of Director Compensation as of August 1, 1996.February 8, 2012.** | | Filed with this Report. |
| Exhibit 10-G | | 2008 Long-Term Incentive Plan.** | | Filed as Exhibit 10.1 to our Quarterly Report on Form 10-Q for the quarter ended September 30, 1996.* |
| | | |
Exhibit 10-F-2 | Amendment to Restricted Stock Plan for Non-Employee Directors, effective as of July 1, 2004.** | | Filed as Exhibit 10 to our Quarterly Report on
Form 10-Q for the quarter ended September 30, 2004.*
|
| | | |
Exhibit 10-F-3 | Third Amendment to Restricted Stock Plan for Non-Employee Directors, effective as of December 31, 2008.** | | Filed as Exhibit 10-F-3 to our Annual Report on
Form 10-K for the year ended December 31, 2008.*
|
| | | |
Exhibit 10-F-4 | Description of Director Compensation as of July 13, 2006.** | | Filed as Exhibit 10-G-3 to our Quarterly Report on
Form 10-Q for the quarter ended September 30, 2006.*
|
| | | |
Exhibit 10-F-5 | Amendment to Description of Director Compensation as of March 1, 2009.** | | Filed as Exhibit 10-F-5 to our Annual Report on
Form 10-K for the year ended December 31, 2008.*
|
| | | |
Exhibit 10-F-6 | Amendment to Description of Director Compensation as of February 25, 2010.** | | Filed with this Report. |
| | | |
Exhibit 10-G | 2008 Long-Term Incentive Plan.** | | Filed as Exhibit 10.1 to our Quarterly Report on
Form 10-Q for the quarter ended June 30, 2008.*
|
| | | |
| Exhibit 10-H | | Description of Matching Gift Program and Vehicle Evaluation Program for Non-Employee Directors.** | | Filed as Exhibit 10-I to our Annual Report on Form 10-K/A for the year ended December 31, 2005.* |
| | | |
| Exhibit 10-I | | Non-Employee Directors Life Insurance and Optional Retirement Plan as amended and restated as of December 31, 2008.2010.** | | Filed as Exhibit 10-I to our Annual Report on Form 10-K for the year ended December 31, 2008.2010.* |
| | | |
| Exhibit 10-J | | Description of Non-Employee Directors Accidental Death, Dismemberment and Permanent Total Disablement Indemnity.** | | Filed as Exhibit 10-S to our Annual Report on Form 10-K for the year ended December 31, 1992.* |
| | | |
| Exhibit 10-K | | Agreement dated December 10, 1992 between Ford and William C. Ford.** | | Filed as Exhibit 10-T to our Annual Report on Form 10-K for the year ended December 31, 1992.* |
| | | |
| Exhibit 10-L | | Select Retirement Plan, as amended and restated as of December 31, 2008.January 1, 2011.** | | Filed as Exhibit 10-L to our Annual Report on Form 10-K for the year ended December 31, 2008.2010.* |
| | | |
| Exhibit 10-M | | Deferred Compensation Plan, as amended and restated as of December 31, 2008.2010.** | | Filed as Exhibit 10-M to our Annual Report on Form 10-K for the year ended December 31, 2008.2010.* |
ITEM 15. Exhibits and Financial Statement Schedules (continued)
| Exhibit 10-M-1 | | Suspension of Open Enrollment in Deferred Compensation Plan.** | | Filed with this Report. |
| | | as Exhibit 10-M-1 to our Annual Report on Form 10-K for the year ended December 31, 2009.* |
| Exhibit 10-N | | Annual Incentive Compensation Plan, as amended and restated as of March 1, 2008.** | | Filed as Exhibit 10.2 to our Quarterly Report on Form 10-Q for the quarter ended June 30, 2008.* |
| Exhibit 10-N-1 | | | |
Exhibit 10-N-1 | Amendment to the Ford Motor Company Annual Incentive Compensation Plan (effective as of December 31, 2008).** | | Filed as Exhibit 10-N-1 to our Annual Report on Form 10-K for the year ended December 31, 2008.* |
| | | |
| Exhibit 10-N-2 | | Annual Incentive Compensation Plan Metrics for 2010.** | | Filed as Exhibit 10-N-2 to our Annual Report on Form 10-K for the year ended December 31, 2009.* |
| Exhibit 10-N-3 | | Annual Incentive Compensation Plan Metrics for 2011.** | | Filed as Exhibit 10-N-3 to our Annual Report on Form 10-K for the year ended December 31, 2010.* |
| Exhibit 10-N-4 | | Annual Incentive Compensation Plan Metrics for 2012.** | | Filed with this Report. |
| Exhibit 10-N-5 | | | |
Exhibit 10-N-3 | Performance-Based Restricted Stock Unit Metrics for 2008.** | | Filed as Exhibit 10-O-3 to our Annual Report on Form 10-K for the year ended December 31, 2007.* |
| | | |
Exhibit 10-N-410-N-6 | | Performance-Based Restricted Stock Unit Metrics for 2009.** | | Filed as Exhibit 10-N-5 to our Annual Report on Form 10-K for the year ended December 31, 2008.* |
| | | |
Exhibit 10-N-510-N-7 | | Performance-Based Restricted Stock Unit Metrics for 2010.** | | Filed as Exhibit 10-N-5 to our Annual Report on Form 10-K for the year ended December 31, 2009.* |
| Exhibit 10-N-8 | | Performance-Based Restricted Stock Unit Metrics for 2011.** | | Filed as Exhibit 10-N-7 to our Annual Report on Form 10-K for the year ended December 31, 2010.* |
|
| | | | |
| Designation | | Description | | Method of Filing |
| Exhibit 10-N-9 | | Performance-Based Restricted Stock Unit Metrics for 2012.** | | Filed with this Report. |
| Exhibit 10-N-10 | | Executive Compensation Recoupment Policy.** | | Filed as Exhibit 10-N-8 to our Annual Report on Form 10-K for the year ended December 31, 2010.* |
| Exhibit 10-N-11 | | Incremental Bonus Description.** | | Filed as Exhibit 10-N-9 to our Annual Report on Form 10-K for the year ended December 31, 2010.* |
| Exhibit 10-O | | 1998 Long-Term Incentive Plan, as amended and restated effective as of January 1, 2003.** | | Filed as Exhibit 10-R to our Annual Report on Form 10-K for the year ended December 31, 2002.* |
| | | |
| Exhibit 10-O-1 | | Amendment to Ford Motor Company 1998 Long-Term Incentive Plan (effective as of January 1, 2006).** | | Filed as Exhibit 10-P-1 to our Annual Report on Form 10-K/A for the year ended December 31, 2005.* |
| Exhibit 10-O-2 | | | |
Exhibit 10-O-2 | Form of Stock Option Agreement (NQO) with Terms and Conditions.** | | Filed as Exhibit 10-P-2 to our Annual Report on Form 10-K/A for the year ended December 31, 2005.* |
| Exhibit 10-O-3 | | | |
Exhibit 10-O-3 | Form of Stock Option (NQO) Terms and Conditions for 2008 Long-Term Incentive Plan.** | | Filed as Exhibit 10-O-3 to our Annual Report on Form 10-K for the year ended December 31, 2008.* |
| Exhibit 10-O-4 | | | |
Exhibit 10-O-4 | Form of Stock Option (NQO) Agreement for 2008 Long-Term Incentive Plan.** | | Filed as Exhibit 10-O-4 to our Annual Report on Form 10-K for the year ended December 31, 2008.* |
| | | |
| Exhibit 10-O-5 | | Form of Stock Option Agreement (ISO) with Terms and Conditions.** | | Filed as Exhibit 10-P-3 to our Annual Report on Form 10-K/A for the year ended December 31, 2005.* |
| Exhibit 10-O-6 | | | |
Exhibit 10-O-6 | Form of Stock Option (ISO) Terms and Conditions for 2008 Long-Term Incentive Plan.** | | Filed as Exhibit 10-O-6 to our Annual Report on Form 10-K for the year ended December 31, 2008.* |
| | | |
| Exhibit 10-O-7 | | Form of Stock Option Agreement (ISO) for 2008 Long-Term Incentive Plan.** | | Filed as Exhibit 10-O-7 to our Annual Report on Form 10-K for the year ended December 31, 2008.* |
| | | |
| Exhibit 10-O-8 | | Form of Stock Option Agreement (U.K. NQO) with Terms and Conditions.** | | Filed as Exhibit 10-P-4 to our Annual Report on Form 10-K/A for the year ended December 31, 2005.* |
| Exhibit 10-O-9 | | | |
Exhibit 10-O-9 | Form of Stock Option (U.K.) Terms and Conditions for 2008 Long-Term Incentive Plan.** | | Filed with this Report.as Exhibit 10-O-9 to our Annual Report on Form 10-K for the year ended December 31, 2009.* |
ITEM 15. Exhibits and Financial Statement Schedules (continued)
| Exhibit 10-O-10 | | Form of Stock Option Agreement (U.K.) for 2008 Long-Term Incentive Plan.** | | Filed with this Report. |
| | | |
Exhibit 10-O-11 | Performance Stock Rights Description for 2006-2008 Performance Period.** | | Filed as Exhibit 10-P-610-O-10 to our Annual Report on Form 10-K/A10-K for the year ended December 31, 2005.2009.* |
| | | |
Exhibit 10-O-1210-O-11 | | Form of Restricted Stock Grant Letter.** | | Filed as Exhibit 10-O-14 to our Annual Report on Form 10-K for the year ended December 31, 2008.* |
| | | |
Exhibit 10-O-1310-O-12 | | Form of Final Award Notification Letter for 2007 Performance-Based Restricted Stock Units.Grant Letter as of January 1, 2011.** | | Filed as Exhibit 10-P-1510-O-12 to our Annual Report on Form 10-K for the year ended December 31, 2007.2010.* |
| | | |
Exhibit 10-O-1410-O-13 | | Form of Final Award Notification Letter for Performance-Based Restricted Stock Units.** | | Filed as Exhibit 10-O-17 to our Annual Report on Form 10-K for the year ended December 31, 2008.* |
| | | |
Exhibit 10-O-1510-O-14 | | Form of Performance-Based Restricted Stock Unit Opportunity Letter for 2008.** | | Filed as Exhibit 10-P-16 to our Annual Report on Form 10-K for the year ended December 31, 2007.* |
| | | |
Exhibit 10-O-1610-O-15 | | Form of Performance-Based Restricted Stock Unit Opportunity Letter (2008 Long-Term Incentive Plan).** | | Filed as Exhibit 10-O-19 to our Annual Report on Form 10-K for the year ended December 31, 2008.* |
| | | |
Exhibit 10-O-1710-O-16 | | Form of Final Award Notification Letter for 2006-2008 Performance Period.** | | Filed as Exhibit 10-O-20 to our Annual Report on Form 10-K for the year ended December 31, 2008.* |
|
| | | | |
| Designation | | Description | | Method of Filing |
Exhibit 10-O-1810-O-17 | | 1998 Long-Term Incentive Plan Restricted Stock Unit Agreement.** | | Filed as Exhibit 10-P-19 to our Annual Report on Form 10-K for the year ended December 31, 2007.* |
| | | |
Exhibit 10-O-1910-O-18 | 2009 | 2008 Long-Term Incentive Plan Restricted Stock Unit Agreement.** | | Filed as Exhibit 10-O-22 to our Annual Report on Form 10-K for the year ended December 31, 2008.* |
| | | |
Exhibit 10-O-2010-O-19 | | 1998 Long-Term Incentive Plan Restricted Stock Unit Terms and Conditions.** | | Filed as Exhibit 10-P-20 to our Annual Report on Form 10-K for the year ended December 31, 2007.* |
| | | |
Exhibit 10-O-2110-O-20 | | 2008 Long-Term Incentive Plan Restricted Stock Unit Terms and Conditions.** | | Filed as Exhibit 10-O-24 to our Annual Report on Form 10-K for the year ended December 31, 2008.* |
| | | |
Exhibit 10-O-2210-O-21 | | Form of Final Award Agreement for Performance-Based Restricted Stock Units under 1998 Long-Term Incentive Plan.** | | Filed as Exhibit 10-P-21 to our Annual Report on Form 10-K for the year ended December 31, 2007.* |
| | | |
Exhibit 10-O-2310-O-22 | | Form of Final Award Agreement for Performance-Based Restricted Stock Units under 2008 Long-Term Incentive Plan.** | | Filed as Exhibit 10-O-26 to our Annual Report on Form 10-K for the year ended December 31, 2008.* |
| | | |
Exhibit 10-O-2410-O-23 | | Form of Final Award Terms and Conditions for Performance-Based Restricted Stock Units under 1998 Long-Term Incentive Plan.** | | Filed as Exhibit 10-O-22 to our Annual Report on Form 10-K for the year ended December 31, 2007.* |
| | | |
Exhibit 10-O-2510-O-24 | | Form of Final Award Terms and Conditions for Performance-Based Restricted Stock Units under 2008 Long-Term Incentive Plan.** | | Filed as Exhibit 10-O-28 to our Annual Report on Form 10-K for the year ended December 31, 2008.* |
ITEM 15. Exhibits and Financial Statement Schedules (continued)
| | | |
Exhibit 10-O-2610-O-25 | | Form of Notification Letter for Time-Based Restricted Stock Units.** | | Filed as Exhibit 10-O-29 to our Annual Report on Form 10-K for the year ended December 31, 2008.* |
| | | |
| Exhibit 10-P | | Agreement dated January 13, 1999 between Ford Motor Company and Edsel B. Ford II.** | | Filed as Exhibit 10-X to our Annual Report on Form 10-K for the year ended December 31, 1998.* |
| Exhibit 10-P-1 | | Amendment dated May 5, 2010 to the Consulting Agreement between Ford Motor Company and Edsel B. Ford II.** | | Filed as Exhibit 10.3 to our Quarterly Report on Form 10-Q for the quarter ended March 31, 2010.* |
| Exhibit 10-P-2 | | Amendment dated January 1, 2012 to the Consulting Agreement between Ford Motor Company and Edsel B. Ford II.** | | Filed with this Report. |
| Exhibit 10-Q | | Amended and Restated Agreement between Ford Motor Company and Ford Motor Credit Company dated as of December 12, 2006. | | Filed as Exhibit 10-R to our Annual Report on Form 10-K for the year ended December 31, 2006.* |
| | | |
| Exhibit 10-R | Agreement between Ford and Carl Reichardt, entered into in June 2002.** | | Filed as Exhibit 10.2 to our Quarterly Report on Form 10-Q for the quarter ended June 30, 2002.* |
| | | |
Exhibit 10-S | Form of Trade Secrets/Non-Compete Statement between Ford and certain of its Executive Officers.** | | Filed as Exhibit 10-V to our Annual Report on Form 10-K for the year ended December 31, 2003.* |
| | | |
Exhibit 10-T10-S | | Description of Settlement of Special 2006 – 2008 Senior Executive Retention Program.** | | Filed as Exhibit 10-U-1 to our Annual Report on Form 10-K for the year ended December 31, 2006.* |
| Exhibit 10-S-1 | | | |
Exhibit 10-T-1 | Form of Final Award Letter for Performance-Based Restricted Stock Unit Enhanced Grant.** | | Filed as Exhibit 10-T-1 to our Annual Report on Form 10-K for the year ended December 31, 2008.* |
| | | |
Exhibit 10-U | Form of Special 2006 Performance Incentive Opportunity Letter.**10-T | | Filed as Exhibit 10-V to our Annual Report on
Form 10-K/A for the year ended December 31, 2005.*
|
| | | |
Exhibit 10-U-1 | Form of Final Award Letter for Performance Incentive Opportunity.** | | Filed as Exhibit 10-V-1 to our Annual Report on
Form 10-K for the year ended December 31, 2007.*
|
| | | |
Exhibit 10-V | Arrangement between Ford Motor Company and William C. Ford, Jr., dated February 25, 2009.** | | Filed as Exhibit 10-V to our Annual Report on Form 10-K for the year ended December 31, 2008.* |
| | | |
Exhibit 10-W10-U | | Arrangement between Ford Motor Company and Mark Fields dated February 7, 2007.** | | Filed as Exhibit 10-AA-1 to our Annual Report on Form 10-K for the year ended December 31, 2006.* |
| Exhibit 10-V | | | |
Exhibit 10-X | Description of Company Practices regarding Club Memberships for Executives.** | | Filed as Exhibit 10-BB to our Annual Report on Form 10-K for the year ended December 31, 2006.* |
| Exhibit 10-W | | | |
Exhibit 10-Y | Accession Agreement between Ford Motor Company and Alan Mulally as of September 1, 2006.** | | Filed as Exhibit 10.1 to our Quarterly Report on Form 10-Q for the quarter ended September 30, 2006.* |
|
| | | | |
| Designation | | Description | | Method of Filing |
Exhibit 10-Y-110-W-1 | | Description of Special Terms and Conditions for Stock Options Granted to Alan Mulally.** | | Filed as Exhibit 10-CC-1 to our Annual Report on Form 10-K for the year ended December 31, 2006.* |
| Exhibit 10-W-2 | | | |
Exhibit 10-Y-2 | Description of President and CEO Compensation Arrangements.** | | Filed as Exhibit 10-CC-2 to our Annual Report on Form 10-K for the year ended December 31, 2006.* |
| Exhibit 10-W-3 | | | |
Exhibit 10-Y-3 | Form of Alan Mulally Agreement Amendment.** | | Filed as Exhibit 10-Y-3 to our Annual Report on Form 10-K for the year ended December 31, 2008.* |
| | | |
Exhibit 10-Z10-X | | Amended and Restated Credit Agreement dated as of November 24, 2009. | | Filed as Exhibit 99.2 to our Current Report on Form 8-K filed November 25, 2009.* |
| Exhibit 10-Y | | | |
Exhibit 10-AA | Amended Ford-UAW Retiree Health Care Settlement Agreement dated July 23, 2009. | | Filed as Exhibit 10.2 to our Current Report on Form 8-K filed July 28, 2009.* |
ITEM 15. Exhibits and Financial Statement Schedules (continued)
Exhibit 10-AA-110-Y-1 | | Amendment dated July 22, 2009 to the Note Purchase Agreement dated April 7, 2008 between Ford Motor Company and its wholly-owned subsidiary Ford-UAW Holdings LLC. | | Filed as Exhibit 10.3 to our Current Report on Form 8-K filed July 28, 2009.* |
| Exhibit 10-Z | | | |
Exhibit 10-BB | Ford Motor Company, TML Holdings Limited and Tata Motors Limited Agreement for the Sale and Purchase of Jaguar and Land Rover dated as of March 25, 2008. | | Filed as Exhibit 10.2 to our Quarterly Report on
Form 10-Q for the quarter ended March 31, 2008.*
|
| | | |
Exhibit 10-CC | Amended and Restated Support Agreement (formerly known as Amended and Restated Profit Maintenance Agreement) dated November 6, 2008 between Ford Motor Company and Ford Motor Credit Company LLC. | | Filed as Exhibit 10 to our Quarterly Report on Form 10-Q for the quarter ended September 30, 2008.* |
| | | |
Exhibit 10-DD10-AA | | Certificate of Designation of Series A Junior Participating Preferred Stock filed on September 11, 2009. | | Filed as Exhibit 3.1 to our Current Report on Form 8-K filed September 11, 2009.* |
| Exhibit 10-BB | | | |
Exhibit 10-EE | Tax Benefit Preservation Plan dated September 11, 2009 between Ford Motor Company and Computershare Trust Company, N.A. | | Filed as Exhibit 4.1 to our Current Report on Form 8-K filed September 11, 2009.* |
| Exhibit 10-CC | | | |
Exhibit 10-FF | Loan Arrangement and Reimbursement Agreement between Ford Motor Company and the U.S. Department of Energy dated as of September 16, 2009. | | Filed as Exhibit 10.1 to our Current Report on Form 8-K filed September 22, 2009.* |
| Exhibit 10-DD | | | |
Exhibit 10-GG | Note Purchase Agreement dated as of September 16, 2009 among the Federal Financing Bank, Ford Motor Company, and the U.S. Secretary of Energy. | | Filed as Exhibit 10.2 to our Current Report on Form 8-K filed September 22, 2009.* |
| Exhibit 10-EE | | | |
Exhibit 10-HH | Employment Arrangement dated as of October 3, 2007 betweenStock Purchase Agreement by and among Ford Motor Company, Volvo Personvagnar Holding AB, Mintime North America, LLC, and James Farley.**Geely Sweden AB for the sale and Purchase of Volvo Car Corporation and Volvo Cars of North America, LLC. | | Filed as Exhibit 10-B10.1 to our Quarterly Report on Form 10-Q for the quarter ended September 30, 2009.* |
| | | |
Exhibit 10-HH-1 | Employment Arrangement Amendment dated as of DecemberMarch 31, 2008 between Ford Motor Company and James Farley.2010.** | | Filed as Exhibit 10-B-1 to our Quarterly Report on Form 10-Q for the quarter ended September 30, 2009.* |
| | | |
Exhibit 10-II | Employment Arrangement dated as of March 22, 2005 between Ford Motor Company and David Leitch.** | | Filed as Exhibit 10-C to our Quarterly Report on Form 10-Q for the quarter ended September 30, 2009.* |
| | | |
Exhibit 10-II-1 | Employment Arrangement Amendment dated as of January 1, 2009 between Ford Motor Company and David Leitch.** | | Filed as Exhibit 10-C-1 to our Quarterly Report on Form 10-Q for the quarter ended September 30, 2009.* |
| | | |
| Exhibit 12 | | Calculation of Ratio of Earnings to Combined Fixed Charges. | | Filed with this Report. |
| Exhibit 21 | | | |
Exhibit 21 | List of Subsidiaries of Ford as of February 19, 2010.13, 2012. | | Filed with this Report. |
ITEM 15. Exhibits and Financial Statement Schedules (continued)
| Exhibit 23 | | Consent of Independent Registered Public Accounting Firm. | | Filed with this Report. |
| Exhibit 24 | | | |
Exhibit 24 | Powers of Attorney. | | Filed with this Report. |
| Exhibit 31.1 | | | |
Exhibit 31.1 | Rule 15d-14(a) Certification of CEO. | | Filed with this Report. |
| Exhibit 31.2 | | | |
Exhibit 31.2 | Rule 15d-14(a) Certification of CFO. | | Filed with this Report. |
| Exhibit 32.1 | | | |
Exhibit 32.1 | Section 1350 Certification of CEO. | | Furnished with this Report. |
| Exhibit 32.2 | | | |
Exhibit 32.2 | Section 1350 Certification of CFO. | | Furnished with this Report. |
|
| | | | |
| Designation | | Description | | Method of Filing |
| Exhibit 101.INS | | XBRL Instance Document. | | *** |
| Exhibit 101.SCH | | XBRL Taxonomy Extension Schema Document. | | *** |
| Exhibit 101.CAL | | XBRL Taxonomy Extension Calculation Linkbase Document. | | *** |
| Exhibit 101.LAB | | XBRL Taxonomy Extension Label Linkbase Document. | | *** |
| Exhibit 101.PRE | | XBRL Taxonomy Extension Presentation Linkbase Document. | | *** |
| Exhibit 101.DEF | | XBRL Taxonomy Extension Definition Linkbase Document. | | *** |
__________
* Incorporated by reference as an exhibit to this Report (file number reference 1-3950, unless otherwise indicated).
** | |
| * | Incorporated by reference as an exhibit to this Report (file number reference 1-3950, unless otherwise indicated). |
| |
| ** | Management contract or compensatory plan or arrangement. |
*** Submitted electronically with this Report in accordance with the provisions of Regulation S-T.
Instruments defining the rights of holders of certain issues of long-term debt of Ford and of certain consolidated subsidiaries and of any unconsolidated subsidiary, for which financial statements are required to be filed with this Report, have not been filed as exhibits to this Report because the authorized principal amount of any one of such issues does not exceed 10% of the total assets of Ford and our subsidiaries on a consolidated basis. Ford agrees to furnish a copy of each of such instrument to the Securities and Exchange Commission upon request.
In addition to the exhibits listed herein, Ford also files electronically certain exhibits containing its XBRL-tagged Financial Statements and Notes to the Financial Statements pursuant to SEC requirements.
SIGNATURES
Pursuant to the requirements of Section 13 or 15(d) of the Securities Exchange Act of 1934, as amended, Ford has duly caused this Report to be signed on its behalf by the undersigned, thereunto duly authorized.
FORD MOTOR COMPANY
|
| |
| By: | /s/ Bob Shanks | BOB SHANKS |
| | Bob Shanks, Vice President and Controller | |
| | (Chief Accounting Officer) | chief accounting officer) |
| | |
| Date: | February 25, 2010 | 21, 2012 |
Pursuant to the requirements of the Securities Exchange Act of 1934, as amended, this Report has been signed below by the following persons on behalf of Ford and in the capacities on the date indicated:
|
| | | | |
| Signature | | | | |
| | | | | |
| | Director, Chairman of the Board, Executive Chairman, Chair of the Office of | | February 25, 2010 |
William Clay Ford, Jr. | | the Chairman and Chief Executive, and Chair of the Finance Committee | | February 21, 2012 |
| William Clay Ford, Jr. | | | |
| | | | | |
| | Director, President and Chief Executive Officer | | February 25, 201021, 2012 |
| Alan Mulally | | (principal executive officer) | | |
| | | | | |
| | Director and Chair of the Audit Committee | | February 25, 201021, 2012 |
| Stephen G. Butler | | | | |
| | | | | |
| | Director | | February 25, 201021, 2012 |
| Kimberly A. Casiano | | | | |
| | | | | |
| | Director | | February 25, 201021, 2012 |
| Anthony F. Earley, Jr. | | | | |
| | | | | |
| | Director | | February 25, 201021, 2012 |
| Edsel B. Ford II | | | | |
| | | | | |
| | Director | | February 25, 201021, 2012 |
| Richard A. Gephardt | | | | |
| | | | | |
IRVINE O. HOCKADAY,JAMES H. HANCE, JR.*
| | Director | | February 25, 201021, 2012 |
Irvine O. Hockaday,James H. Hance, Jr. | | | | |
| | | | | |
| WILLIAM W. HELMAN IV* | | Director | | February 21, 2012 |
| William W. Helman IV | | | | |
| | | | |
| IRVINE O. HOCKADAY, JR.* | | Director | | February 21, 2012 |
| Irvine O. Hockaday, Jr. | | | | |
|
| | | | |
| Signature | | Title | | Date |
| | | | |
| JON M. HUNTSMAN, JR.* | | Director | | February 21, 2012 |
| Jon M. Huntsman, Jr. | | | | |
| | | | |
| RICHARD A. MANOOGIAN* | | Director and Chair of the Compensation Committee | | February 25, 201021, 2012 |
| Richard A. Manoogian | | | | |
| | | | | |
| | Director and Chair of the Nominating and Governance Committee | | February 25, 201021, 2012 |
| Ellen R. Marram | | Governance Committee | | |
| | | | | |
| | Director and Chair of the Sustainability Committee | | February 25, 201021, 2012 |
| Homer A. Neal | | | | |
| | | | |
| | | | | |
| GERALD L. SHAHEEN* | | Director | | February 25, 201021, 2012 |
| Gerald L. Shaheen | | | | |
| | | | | |
| | Director | | February 25, 201021, 2012 |
| John L. Thornton | | | | |
| | | | | |
| | Executive Vice President and Chief Financial Officer | | February 25, 201021, 2012 |
| L.W.K. Booth | | (principal financial officer) | | |
| | | | | |
| | Vice President and Controller | | February 25, 201021, 2012 |
| Bob Shanks | | (principal accounting officer) | | |
| | | | | |
*By: /s/ PETER J. SHERRY, JR. | | | | February 25, 201021, 2012 |
(Peter J. Sherry, Jr.) | | | | |
| Attorney-in-Fact | | | | |
| | | | |
This page intentionally left blank.
Report of Independent Registered Public Accounting Firm
To the Board of Directors and Stockholders of
Ford Motor Company
In our opinion, the accompanying consolidated balance sheets and the related consolidated statements of operations, of equity and of cash flows present fairly, in all material respects, the financial position of Ford Motor Company and its subsidiaries at December 31, 2011 and December 31, 2010, and the results of their operations and their cash flows for each of the three years in the period ended December 31, 2011 in conformity with accounting principles generally accepted in the United States of America. In addition, in our opinion, the accompanying financial statement schedule presents fairly, in all material respects, the information set forth therein when read in conjunction with the related consolidated financial statements. Also in our opinion, the Company maintained, in all material respects, effective internal control over financial reporting as of December 31, 2011, based on criteria established in Internal Control - Integrated Framework issued by the Committee of Sponsoring Organizations of the Treadway Commission (COSO). The Company's management is responsible for these financial statements and the financial statement schedule, for maintaining effective internal control over financial reporting and for its assessment of the effectiveness of internal control over financial reporting, included in Management's Report on Internal Control over Financial Reporting appearing under Item 9A. Our responsibility is to express opinions on these financial statements and on the Company's internal control over financial reporting based on our integrated audits. We conducted our audits in accordance with the standards of the Public Company Accounting Oversight Board (United States). Those standards require that we plan and perform the audits to obtain reasonable assurance about whether the financial statements are free of material misstatement and whether effective internal control over financial reporting was maintained in all material respects. Our audits of the financial statements included examining, on a test basis, evidence supporting the amounts and disclosures in the financial statements, assessing the accounting principles used and significant estimates made by management, and evaluating the overall financial statement presentation. Our audit of internal control over financial reporting included obtaining an understanding of internal control over financial reporting, assessing the risk that a material weakness exists, and testing and evaluating the design and operating effectiveness of internal control based on the assessed risk. Our audits also included performing such other procedures as we considered necessary in the circumstances. We believe that our audits provide a reasonable basis for our opinions.
Our audits were conducted for the purpose of forming an opinion on the basic financial statements taken as a whole. The accompanying sector balance sheets and the related sector statements of operations and of cash flows are presented for purposes of additional analysis and are not a required part of the basic financial statements. Such information has been subjected to the auditing procedures applied in the audit of the basic financial statements and, in our opinion, is fairly stated in all material respects in relation to the basic financial statements taken as a whole.
A company's internal control over financial reporting is a process designed to provide reasonable assurance regarding the reliability of financial reporting and the preparation of financial statements for external purposes in accordance with generally accepted accounting principles. A company's internal control over financial reporting includes those policies and procedures that (i) pertain to the maintenance of records that, in reasonable detail, accurately and fairly reflect the transactions and dispositions of the assets of the company; (ii) provide reasonable assurance that transactions are recorded as necessary to permit preparation of financial statements in accordance with generally accepted accounting principles, and that receipts and expenditures of the company are being made only in accordance with authorizations of management and directors of the company; and (iii) provide reasonable assurance regarding prevention or timely detection of unauthorized acquisition, use, or disposition of the company's assets that could have a material effect on the financial statements.
Because of its inherent limitations, internal control over financial reporting may not prevent or detect misstatements. Also, projections of any evaluation of effectiveness to future periods are subject to the risk that controls may become inadequate because of changes in conditions, or that the degree of compliance with the policies or procedures may deteriorate.
/s/ PricewaterhouseCoopers LLP
PricewaterhouseCoopers LLP
Detroit, Michigan
February 21, 2012
FORD MOTOR COMPANY AND SUBSIDIARIES
CONSOLIDATED STATEMENT OF OPERATIONS
For the Years Ended December 31, 2009, 20082011, 2010, and 20072009
(in millions, except per share amounts)
| | | | | | | | | | | |
| Sales and revenues | | | | | | | | | | |
Automotive sales | | $ | 105,893 | | | $ | 129,165 | | | $ | 154,379 | | |
Financial Services revenues | | | 12,415 | | | | 15,949 | | | | 16,193 | | |
Total sales and revenues | | | 118,308 | | | | 145,114 | | | | 170,572 | | |
| | | | 2011 | | 2010 | | 2009 |
| | | |
| Revenues | | | | | | |
| Automotive | | $ | 128,168 |
| | $ | 119,280 |
| | $ | 103,868 |
|
| Financial Services | | 8,096 |
| | 9,674 |
| | 12,415 |
|
| Total revenues | | 136,264 |
| | 128,954 |
| | 116,283 |
|
| | | | | | | | | | | | | | | | | | |
| Costs and expenses | | | | | | | | | | | | | |
| | |
| | |
Automotive cost of sales | | | 100,016 | | | | 127,102 | | | | 142,587 | | 113,345 |
| | 104,451 |
| | 98,866 |
|
Selling, administrative and other expenses | | | 13,258 | | | | 21,430 | | | | 21,169 | | 11,578 |
| | 11,909 |
| | 13,029 |
|
Goodwill impairment | | | — | | | | — | | | | 2,400 | | |
Interest expense | | | 6,828 | | | | 9,805 | | | | 11,038 | | 4,431 |
| | 6,152 |
| | 6,790 |
|
Financial Services provision for credit and insurance losses | | | 1,030 | | | | 1,874 | | | | 668 | | (33 | ) | | (216 | ) | | 1,030 |
|
Total costs and expenses | | | 121,132 | | | | 160,211 | | | | 177,862 | | 129,321 |
| | 122,296 |
| | 119,715 |
|
| | | | | | | | | | | | | | | | | | |
Automotive interest income and other non-operating income/(expense), net (Note 20) | | | 5,288 | | | | (726 | ) | | | 1,161 | | |
Financial Services other income/(loss), net (Note 20) | | | 552 | | | | 1,149 | | | | 1,869 | | |
Automotive interest income and other non-operating income/(expense), net (Note 19) | | 825 |
| | (362 | ) | | 5,284 |
|
| Financial Services other income/(loss), net (Note 19) | | 413 |
| | 315 |
| | 552 |
|
Equity in net income/(loss) of affiliated companies | | | 10 | | | | 176 | | | | 403 | | 500 |
| | 538 |
| | 195 |
|
Income/(Loss) before income taxes | | | 3,026 | | | | (14,498 | ) | | | (3,857 | ) | 8,681 |
| | 7,149 |
| | 2,599 |
|
Provision for/(Benefit from) income taxes (Note 23) | | | 69 | | | | 63 | | | | (1,333 | ) | |
| Provision for/(Benefit from) income taxes (Note 22) | | (11,541 | ) | | 592 |
| | (113 | ) |
Income/(Loss) from continuing operations | | | 2,957 | | | | (14,561 | ) | | | (2,524 | ) | 20,222 |
| | 6,557 |
| | 2,712 |
|
Income/(Loss) from discontinued operations (Note 24) | | | 5 | | | | 9 | | | | 41 | | |
| Income/(Loss) from discontinued operations | | — |
| | — |
| | 5 |
|
Net income/(loss) | | | 2,962 | | | | (14,552 | ) | | | (2,483 | ) | 20,222 |
| | 6,557 |
| | 2,717 |
|
Less: Income/(Loss) attributable to noncontrolling interests | | | 245 | | | | 214 | | | | 312 | | 9 |
| | (4 | ) | | — |
|
Net income/(loss) attributable to Ford Motor Company | | $ | 2,717 | | | $ | (14,766 | ) | | $ | (2,795 | ) | $ | 20,213 |
| | $ | 6,561 |
| | $ | 2,717 |
|
| | | | | | | | | | | | | | | | | | |
| NET INCOME/(LOSS) ATTRIBUTABLE TO FORD MOTOR COMPANY | | | | | | | | | | | | | | | | | |
Income/(Loss) from continuing operations | | $ | 2,712 | | | $ | (14,775 | ) | | $ | (2,836 | ) | $ | 20,213 |
| | $ | 6,561 |
| | $ | 2,712 |
|
Income/(Loss) from discontinued operations (Note 24) | | | 5 | | | | 9 | | | | 41 | | |
Net income/(loss) | | $ | 2,717 | | | $ | (14,766 | ) | | $ | (2,795 | ) | |
| Income/(Loss) from discontinued operations | | — |
| | — |
| | 5 |
|
| Net income/(loss) attributable to Ford Motor Company | | $ | 20,213 |
| | $ | 6,561 |
| | $ | 2,717 |
|
| | | | | | | | | | | | | | | | | | |
| Average number of shares of Common and Class B Stock outstanding | | | 2,992 | | | | 2,273 | | | | 1,979 | | |
| | | | | | | | | | | | | | |
| AMOUNTS PER SHARE ATTRIBUTABLE TO FORD MOTOR COMPANY | | | | | | | | | | | | | |
| COMMON AND CLASS B STOCK (Note 25) | | | | | | | | | | | | | |
| AMOUNTS PER SHARE ATTRIBUTABLE TO FORD MOTOR COMPANY COMMON AND CLASS B STOCK (Note 24) | | AMOUNTS PER SHARE ATTRIBUTABLE TO FORD MOTOR COMPANY COMMON AND CLASS B STOCK (Note 24) | | |
| Basic income/(loss) | | | | | | | | | | | | | |
| | |
| | |
Income/(Loss) from continuing operations | | $ | 0.91 | | | $ | (6.50 | ) | | $ | (1.43 | ) | $ | 5.33 |
| | $ | 1.90 |
| | $ | 0.91 |
|
Income/(Loss) from discontinued operations | | | — | | | | — | | | | 0.02 | | — |
| | — |
| | — |
|
Net income/(loss) | | $ | 0.91 | | | $ | (6.50 | ) | | $ | (1.41 | ) | $ | 5.33 |
| | $ | 1.90 |
| | $ | 0.91 |
|
| | | | | | | | | | | | | | |
| Diluted income/(loss) | | | | | | | | | | | | | |
| | |
| | |
Income/(Loss) from continuing operations | | $ | 0.86 | | | $ | (6.50 | ) | | $ | (1.43 | ) | $ | 4.94 |
| | $ | 1.66 |
| | $ | 0.86 |
|
Income/(Loss) from discontinued operations | | | — | | | | — | | | | 0.02 | | — |
| | — |
| | — |
|
Net income/(loss) | | $ | 0.86 | | | $ | (6.50 | ) | | $ | (1.41 | ) | $ | 4.94 |
| | $ | 1.66 |
| | $ | 0.86 |
|
| | | | | | | |
| Cash dividends declared | | $ | 0.05 |
| | $ | — |
| | $ | — |
|
The accompanying notes are part of the financial statements.
FORD MOTOR COMPANY AND SUBSIDIARIES
SECTOR STATEMENT OF OPERATIONS
For the Years Ended December 31, 2009, 20082011, 2010, and 20072009
(in millions, except per share amounts)
| | | | | 2011 | | 2010 | | 2009 |
| | | | | | | | | | | |
| AUTOMOTIVE | | | | | | | | | | | | | | |
Sales | | $ | 105,893 | | | $ | 129,165 | | | $ | 154,379 | | |
| Revenues | | $ | 128,168 |
| | $ | 119,280 |
| | $ | 103,868 |
|
| Costs and expenses | | | | | | | | | | | | | | | | | |
|
Cost of sales | | | 100,016 | | | | 127,102 | | | | 142,587 | | 113,345 |
| | 104,451 |
| | 98,866 |
|
Selling, administrative and other expenses | | | 8,583 | | | | 11,356 | | | | 13,660 | | 9,060 |
| | 9,040 |
| | 8,354 |
|
Goodwill impairment | | | — | | | | — | | | | 2,400 | | |
Total costs and expenses | | | 108,599 | | | | 138,458 | | | | 158,647 | | 122,405 |
| | 113,491 |
| | 107,220 |
|
Operating income/(loss) | | | (2,706 | ) | | | (9,293 | ) | | | (4,268 | ) | 5,763 |
| | 5,789 |
| | (3,352 | ) |
| | | | | | | | | | | | | | | | | | |
Interest expense | | | 1,515 | | | | 2,061 | | | | 2,363 | | 817 |
| | 1,807 |
| | 1,477 |
|
| | | | | | | | | | | | | | | | | | |
| Interest income and other non-operating income/(expense), net (Note 20) | | | 5,288 | | | | (726 | ) | | | 1,161 | | |
| Interest income and other non-operating income/(expense), net (Note 19) | | 825 |
| | (362 | ) | | 5,284 |
|
Equity in net income/(loss) of affiliated companies | | | 145 | | | | 163 | | | | 389 | | 479 |
| | 526 |
| | 330 |
|
Income/(Loss) before income taxes — Automotive | | | 1,212 | | | | (11,917 | ) | | | (5,081 | ) | |
| Income/(Loss) before income taxes — Automotive | | 6,250 |
| | 4,146 |
| | 785 |
|
| | | | | | | | | | | | | | | | | | |
| FINANCIAL SERVICES | | | | | | | | | | | | | |
| | |
| | |
Revenues | | | 12,415 | | | | 15,949 | | | | 16,193 | | 8,096 |
| | 9,674 |
| | 12,415 |
|
| Costs and expenses | | | | | | | | | | | | | | | | | |
Interest expense | | | 5,313 | | | | 7,744 | | | | 8,675 | | 3,614 |
| | 4,345 |
| | 5,313 |
|
Depreciation | | | 3,937 | | | | 9,109 | | | | 6,289 | | 1,843 |
| | 2,024 |
| | 3,937 |
|
Operating and other expenses | | | 738 | | | | 965 | | | | 1,220 | | 675 |
| | 845 |
| | 738 |
|
Provision for credit and insurance losses | | | 1,030 | | | | 1,874 | | | | 668 | | (33 | ) | | (216 | ) | | 1,030 |
|
Total costs and expenses | | | 11,018 | | | | 19,692 | | | | 16,852 | | 6,099 |
| | 6,998 |
| | 11,018 |
|
| | | | | | | | | | | | | | | | | | |
Other income/(loss), net (Note 20) | | | 552 | | | | 1,149 | | | | 1,869 | | |
| Other income/(loss), net (Note 19) | | 413 |
| | 315 |
| | 552 |
|
Equity in net income/(loss) of affiliated companies | | | (135 | ) | | | 13 | | | | 14 | | 21 |
| | 12 |
| | (135 | ) |
Income/(Loss) before income taxes — Financial Services | | | 1,814 | | | | (2,581 | ) | | | 1,224 | | 2,431 |
| | 3,003 |
| | 1,814 |
|
| | | | | | | | | | | | | | | | | | |
| TOTAL COMPANY | | | | | | | | | | | | | |
| | |
| | |
Income/(Loss) before income taxes | | | 3,026 | | | | (14,498 | ) | | | (3,857 | ) | 8,681 |
| | 7,149 |
| | 2,599 |
|
Provision for/(Benefit from) income taxes (Note 23) | | | 69 | | | | 63 | | | | (1,333 | ) | |
| Provision for/(Benefit from) income taxes (Note 22) | | (11,541 | ) | | 592 |
| | (113 | ) |
Income/(Loss) from continuing operations | | | 2,957 | | | | (14,561 | ) | | | (2,524 | ) | 20,222 |
| | 6,557 |
| | 2,712 |
|
Income/(Loss) from discontinued operations (Note 24) | | | 5 | | | | 9 | | | | 41 | | |
| Income/(Loss) from discontinued operations | | — |
| | — |
| | 5 |
|
Net income/(loss) | | | 2,962 | | | | (14,552 | ) | | | (2,483 | ) | 20,222 |
| | 6,557 |
| | 2,717 |
|
Less: Income/(Loss) attributable to noncontrolling interests | | | 245 | | | | 214 | | | | 312 | | 9 |
| | (4 | ) | | — |
|
Net income/(loss) attributable to Ford Motor Company | | $ | 2,717 | | | $ | (14,766 | ) | | $ | (2,795 | ) | $ | 20,213 |
| | $ | 6,561 |
| | $ | 2,717 |
|
| | | | | | | | | | | | | | | | | | |
| NET INCOME/(LOSS) ATTRIBUTABLE TO FORD MOTOR COMPANY | | | | | | | | | | | | | | | | | |
Income/(Loss) from continuing operations | | $ | 2,712 | | | $ | (14,775 | ) | | $ | (2,836 | ) | $ | 20,213 |
| | $ | 6,561 |
| | $ | 2,712 |
|
Income/(Loss) from discontinued operations (Note 24) | | | 5 | | | | 9 | | | | 41 | | |
Net income/(loss) | | $ | 2,717 | | | $ | (14,766 | ) | | $ | (2,795 | ) | |
| Income/(Loss) from discontinued operations | | — |
| | — |
| | 5 |
|
| Net income/(loss) attributable to Ford Motor Company | | $ | 20,213 |
| | $ | 6,561 |
| | $ | 2,717 |
|
| | | | | | | | | | | | | | | | | | |
| Average number of shares of Common and Class B Stock outstanding | | | 2,992 | | | | 2,273 | | | | 1,979 | | |
| | | | | | | | | | | | | | |
| AMOUNTS PER SHARE ATTRIBUTABLE TO FORD MOTOR COMPANY COMMON AND CLASS B STOCK (Note 25) | | | | | | | | | | | | | |
| AMOUNTS PER SHARE ATTRIBUTABLE TO FORD MOTOR COMPANY COMMON AND CLASS B STOCK (Note 24) | | AMOUNTS PER SHARE ATTRIBUTABLE TO FORD MOTOR COMPANY COMMON AND CLASS B STOCK (Note 24) | | |
| Basic income/(loss) | | | | | | | | | | | | | |
| | |
| | |
Income/(Loss) from continuing operations | | $ | 0.91 | | | $ | (6.50 | ) | | $ | (1.43 | ) | $ | 5.33 |
| | $ | 1.90 |
| | $ | 0.91 |
|
Income/(Loss) from discontinued operations | | | — | | | | — | | | | 0.02 | | — |
| | — |
| | — |
|
Net income/(loss) | | $ | 0.91 | | | $ | (6.50 | ) | | $ | (1.41 | ) | $ | 5.33 |
| | $ | 1.90 |
| | $ | 0.91 |
|
| | | | | | | | | | | | | | |
| Diluted income/(loss) | | | | | | | | | | | | | |
| | |
| | |
Income/(Loss) from continuing operations | | $ | 0.86 | | | $ | (6.50 | ) | | $ | (1.43 | ) | $ | 4.94 |
| | $ | 1.66 |
| | $ | 0.86 |
|
Income/(Loss) from discontinued operations | | | — | | | | — | | | | 0.02 | | — |
| | — |
| | — |
|
Net income/(loss) | | $ | 0.86 | | | $ | (6.50 | ) | | $ | (1.41 | ) | $ | 4.94 |
| | $ | 1.66 |
| | $ | 0.86 |
|
| | | | | | | |
| Cash dividends declared | | $ | 0.05 |
| | $ | — |
| | $ | — |
|
The accompanying notes are part of the financial statements.
FORD MOTOR COMPANY AND SUBSIDIARIES
CONSOLIDATED BALANCE SHEET
(in millions)
| | | | | December 31,
2011 | | December 31,
2010 |
| | | December 31, | | | | | |
| ASSETS | | | | | | | | | |
Cash and cash equivalents | | $ | 21,441 | | | $ | 22,049 | | $ | 17,148 |
| | $ | 14,805 |
|
Marketable securities (Note 6) | | | 21,387 | | | | 17,411 | | 18,618 |
| | 20,765 |
|
Finance receivables, net (Note 7) | | | 76,996 | | | | 93,484 | | 69,976 |
| | 70,070 |
|
Other receivables, net | | | 7,587 | | | | 5,674 | | 8,565 |
| | 8,381 |
|
Net investment in operating leases (Note 8) | | | 17,270 | | | | 25,250 | | 12,838 |
| | 11,675 |
|
Inventories (Note 10) | | | 5,450 | | | | 6,988 | | 5,901 |
| | 5,917 |
|
Equity in net assets of affiliated companies (Note 11) | | | 1,550 | | | | 1,599 | | 2,936 |
| | 2,569 |
|
Net property (Note 14) | | | 24,778 | | | | 24,143 | | 22,371 |
| | 23,179 |
|
Deferred income taxes | | | 3,440 | | | | 3,108 | | |
Goodwill and other net intangible assets (Note 16) | | | 209 | | | | 246 | | |
Assets of held-for-sale operations (Note 24) | | | 7,923 | | | | 8,612 | | |
| Deferred income taxes (Note 22) | | 15,125 |
| | 2,003 |
|
| Net intangible assets (Note 15) | | 100 |
| | 102 |
|
Other assets | | | 6,819 | | | | 9,734 | | 4,770 |
| | 5,221 |
|
Total assets | | $ | 194,850 | | | $ | 218,298 | | $ | 178,348 |
| | $ | 164,687 |
|
| | | | | | | | | | | | |
| LIABILITIES | | | | | | | | | |
| | |
|
Payables | | $ | 14,594 | | | $ | 13,145 | | $ | 17,724 |
| | $ | 16,362 |
|
Accrued liabilities and deferred revenue (Note 17) | | | 46,599 | | | | 59,526 | | |
Debt (Note 19) | | | 132,441 | | | | 152,577 | | |
Deferred income taxes | | | 2,375 | | | | 2,035 | | |
Liabilities of held-for-sale operations (Note 24) | | | 5,356 | | | | 5,542 | | |
| Accrued liabilities and deferred revenue (Note 16) | | 45,369 |
| | 43,844 |
|
| Debt (Note 18) | | 99,488 |
| | 103,988 |
|
| Deferred income taxes (Note 22) | | 696 |
| | 1,135 |
|
Total liabilities | | | 201,365 | | | | 232,825 | | 163,277 |
| | 165,329 |
|
| | | | | | | | | | | | |
| EQUITY | | | | | | | | | |
| | |
|
| Capital stock (Note 25) | | | | | | | | | |
| Common Stock, par value $0.01 per share (3,266 million shares issued of 6 billion authorized) | | | 33 | | | | 23 | | |
| Class B Stock, par value $0.01 per share (71 million shares issued of 530 million authorized) | | | 1 | | | | 1 | | |
| Capital stock (Note 24) | | |
| | |
|
| Common Stock, par value $.01 per share (3,745 million shares issued) | | 37 |
| | 37 |
|
| Class B Stock, par value $.01 per share (71 million shares issued) | | 1 |
| | 1 |
|
Capital in excess of par value of stock | | | 16,786 | | | | 10,875 | | 20,905 |
| | 20,803 |
|
| Retained earnings/(Accumulated deficit) | | 12,985 |
| | (7,038 | ) |
Accumulated other comprehensive income/(loss) | | | (10,864 | ) | | | (10,124 | ) | (18,734 | ) | | (14,313 | ) |
Treasury stock | | | (177 | ) | | | (181 | ) | (166 | ) | | (163 | ) |
Retained earnings/(Accumulated deficit) | | | (13,599 | ) | | | (16,316 | ) | |
Total equity/(deficit) attributable to Ford Motor Company | | | (7,820 | ) | | | (15,722 | ) | 15,028 |
| | (673 | ) |
Equity/(Deficit) attributable to noncontrolling interests | | | 1,305 | | | | 1,195 | | 43 |
| | 31 |
|
Total equity/(deficit) | | | (6,515 | ) | | | (14,527 | ) | 15,071 |
| | (642 | ) |
Total liabilities and equity | | $ | 194,850 | | | $ | 218,298 | | $ | 178,348 |
| | $ | 164,687 |
|
The following table includes assets to be used to settle liabilities of the consolidated variable interest entities ("VIEs"). These assets and liabilities are included in the consolidated balance sheet above. See Note 13 for additional information on our VIEs.
|
| | | | | | | |
| ASSETS | | | |
| Cash and cash equivalents | $ | 3,402 |
| | $ | 4,062 |
|
| Finance receivables, net | 49,795 |
| | 50,473 |
|
| Other receivables, net | — |
| | 13 |
|
| Net investment in operating leases | 6,354 |
| | 6,121 |
|
| Inventories | — |
| | 19 |
|
| Net property | — |
| | 31 |
|
| Other assets | 157 |
| | 28 |
|
| LIABILITIES |
|
| |
|
|
| Payables | — |
| | 16 |
|
| Accrued liabilities and deferred revenue | 97 |
| | 222 |
|
| Debt | 41,421 |
| | 40,247 |
|
The accompanying notes are part of the financial statements.
FORD MOTOR COMPANY AND SUBSIDIARIES
SECTOR BALANCE SHEET
(in millions)
| | | | | | | |
| ASSETS | | | | | | |
| Automotive | | | | | | |
Cash and cash equivalents | | $ | 10,309 | | | $ | 6,377 | |
Marketable securities (Note 6) | | | 15,169 | | | | 9,296 | |
Total cash and marketable securities | | | 25,478 | | | | 15,673 | |
Receivables, less allowances of $372 and $200 | | | 3,708 | | | | 3,065 | |
Inventories (Note 10) | | | 5,450 | | | | 6,988 | |
Deferred income taxes | | | 511 | | | | 302 | |
Other current assets | | | 2,845 | | | | 3,450 | |
Current receivable from Financial Services (Note 1) | | | 2,568 | | | | 2,035 | |
Total current assets | | | 40,560 | | | | 31,513 | |
Equity in net assets of affiliated companies (Note 11) | | | 1,429 | | | | 1,076 | |
Net property (Note 14) | | | 24,596 | | | | 23,930 | |
Deferred income taxes | | | 5,663 | | | | 7,204 | |
Goodwill and other net intangible assets (Note 16) | | | 200 | | | | 237 | |
Assets of held-for-sale operations (Note 24) | | | 7,923 | | | | 8,414 | |
Other assets | | | 1,631 | | | | 1,441 | |
Total Automotive assets | | | 82,002 | | | | 73,815 | |
| Financial Services | | | | | | | | |
Cash and cash equivalents | | | 11,132 | | | | 15,672 | |
Marketable securities (Note 6) | | | 6,864 | | | | 8,607 | |
Finance receivables, net (Note 7) | | | 80,885 | | | | 96,101 | |
Net investment in operating leases (Note 8) | | | 15,062 | | | | 23,120 | |
Equity in net assets of affiliated companies (Note 11) | | | 121 | | | | 523 | |
Goodwill and other net intangible assets (Note 16) | | | 9 | | | | 9 | |
Assets of held-for-sale operations (Note 24) | | | — | | | | 198 | |
Other assets | | | 5,039 | | | | 7,437 | |
Total Financial Services assets | | | 119,112 | | | | 151,667 | |
Intersector elimination | | | (3,224 | ) | | | (2,535 | ) |
Total assets | | $ | 197,890 | | | $ | 222,947 | |
| LIABILITIES | | | | | | | | |
| Automotive | | | | | | | | |
Trade payables | | $ | 11,210 | | | $ | 9,193 | |
Other payables | | | 2,148 | | | | 1,982 | |
Accrued liabilities and deferred revenue (Note 17) | | | 18,465 | | | | 29,584 | |
Deferred income taxes | | | 3,119 | | | | 2,790 | |
Debt payable within one year (Note 19) | | | 2,095 | | | | 1,191 | |
Total current liabilities | | | 37,037 | | | | 44,740 | |
Long-term debt (Note 19) | | | 32,321 | | | | 23,036 | |
Other liabilities (Note 17) | | | 23,260 | | | | 23,766 | |
Deferred income taxes | | | 561 | | | | 614 | |
Liabilities of held-for-sale operations (Note 24) | | | 5,356 | | | | 5,487 | |
Total Automotive liabilities | | | 98,535 | | | | 97,643 | |
| Financial Services | | | | | | | | |
Payables | | | 1,236 | | | | 1,970 | |
Debt (Note 19) | | | 98,671 | | | | 128,842 | |
Deferred income taxes | | | 1,735 | | | | 3,280 | |
Other liabilities and deferred income (Note 17) | | | 4,884 | | | | 6,184 | |
Liabilities of held-for-sale operations (Note 24) | | | — | | | | 55 | |
Payable to Automotive (Note 1) | | | 2,568 | | | | 2,035 | |
Total Financial Services liabilities | | | 109,094 | | | | 142,366 | |
Intersector elimination | | | (3,224 | ) | | | (2,535 | ) |
Total liabilities | | | 204,405 | | | | 237,474 | |
| EQUITY | | | | | | | | |
| Capital stock (Note 25) | | | | | | | | |
| Common Stock, par value $0.01 per share (3,266 million shares issued of 6 billion authorized) | | | 33 | | | | 23 | |
| Class B Stock, par value $0.01 per share (71 million shares issued of 530 million authorized) | | | 1 | | | | 1 | |
Capital in excess of par value of stock | | | 16,786 | | | | 10,875 | |
Accumulated other comprehensive income/(loss) | | | (10,864 | ) | | | (10,124 | ) |
Treasury stock | | | (177 | ) | | | (181 | ) |
Retained earnings/(Accumulated deficit) | | | (13,599 | ) | | | (16,316 | ) |
Total equity/(deficit) attributable to Ford Motor Company | | | (7,820 | ) | | | (15,722 | ) |
Equity/(Deficit) attributable to noncontrolling interests | | | 1,305 | | | | 1,195 | |
Total equity/(deficit) | | | (6,515 | ) | | | (14,527 | ) |
Total liabilities and equity | | $ | 197,890 | | | $ | 222,947 | |
The accompanying notes are part of the financial statements.
FORD MOTOR COMPANY AND SUBSIDIARIES
CONSOLIDATED STATEMENT OF CASH FLOWS
For the Years Ended December 31, 2009, 2008 and 2007
(in millions)
| | | | | | | | | | |
| Cash flows from operating activities of continuing operations | | | | | | | | | |
| Net cash (used in)/provided by operating activities (Note 27) | | $ | 16,042 | | | $ | (179 | ) | | $ | 17,074 | |
| | | | | | | | | | | | | |
| Cash flows from investing activities of continuing operations | | | | | | | | | | | | |
Capital expenditures (Note 28) | | | (4,561 | ) | | | (6,696 | ) | | | (6,022 | ) |
| Acquisitions of retail and other finance receivables and operating leases | | | (26,392 | ) | | | (44,562 | ) | | | (55,681 | ) |
| Collections of retail and other finance receivables and operating leases | | | 39,884 | | | | 42,061 | | | | 45,498 | |
Purchases of securities | | | (78,789 | ) | | | (64,754 | ) | | | (11,423 | ) |
Sales and maturities of securities | | | 74,933 | | | | 62,046 | | | | 18,660 | |
Settlements of derivatives | | | 478 | | | | 2,533 | | | | 861 | |
| Proceeds from sales of retail and other finance receivables and operating leases | | | 911 | | | | — | | | | 708 | |
Proceeds from sale of businesses | | | 382 | | | | 6,854 | | | | 1,236 | |
Cash paid for acquisitions | | | — | | | | (13 | ) | | | — | |
| Transfer of cash balances upon disposition of discontinued/held-for-sale operations | | | — | | | | (928 | ) | | | (83 | ) |
Other | | | (377 | ) | | | 316 | | | | (211 | ) |
Net cash (used in)/provided by investing activities | | | 6,469 | | | | (3,143 | ) | | | (6,457 | ) |
| | | | | | | | | | | | | |
| Cash flows from financing activities of continuing operations | | | | | | | | | | | | |
Sales of Common Stock | | | 2,450 | | | | 756 | | | | 250 | |
Purchases of Common Stock | | | — | | | | — | | | | (31 | ) |
Changes in short-term debt | | | (5,935 | ) | | | (5,120 | ) | | | 919 | |
Proceeds from issuance of other debt | | | 45,990 | | | | 42,163 | | | | 33,113 | |
Principal payments on other debt | | | (61,894 | ) | | | (46,299 | ) | | | (39,431 | ) |
Payments on notes/transfer of cash equivalents to the UAW Voluntary Employee Benefit Association ("VEBA") Trust (Note 18) | | | (2,574 | ) | | | — | | | | — | |
Other | | | (996 | ) | | | (604 | ) | | | (88 | ) |
Net cash (used in)/provided by financing activities | | | (22,959 | ) | | | (9,104 | ) | | | (5,268 | ) |
| | | | | | | | | | | | | |
Effect of exchange rate changes on cash | | | 470 | | | | (808 | ) | | | 1,014 | |
| Cumulative correction of Financial Services prior-period error (Note 1) | | | (630 | ) | | | — | | | | — | |
| | | | | | | | | | | | | |
| Net increase/(decrease) in cash and cash equivalents from continuing operations | | | (608 | ) | | | (13,234 | ) | | | 6,363 | |
| | | | | | | | | | | | | |
| Cash flows from discontinued operations | | | | | | | | | | | | |
Cash flows from operating activities of discontinued operations | | | — | | | | — | | | | 26 | |
Cash flows from investing activities of discontinued operations | | | — | | | | — | | | | — | |
Cash flows from financing activities of discontinued operations | | | — | | | | — | | | | — | |
| | | | | | | | | | | | | |
Net increase/(decrease) in cash and cash equivalents | | $ | (608 | ) | | $ | (13,234 | ) | | $ | 6,389 | |
| | | | | | | | | | | | | |
Cash and cash equivalents at January 1 | | $ | 22,049 | | | $ | 35,283 | | | $ | 28,896 | |
| Cash and cash equivalents of discontinued/held-for-sale operations at January 1 | | | — | | | | — | | | | (2 | ) |
Net increase/(decrease) in cash and cash equivalents | | | (608 | ) | | | (13,234 | ) | | | 6,389 | |
Less: Cash and cash equivalents of discontinued/held-for-sale operations at December 31 | | | — | | | | — | | | | — | |
Cash and cash equivalents at December 31 | | $ | 21,441 | | | $ | 22,049 | | | $ | 35,283 | |
|
| | | | | | | |
| | December 31,
2011 | | December 31,
2010 |
| ASSETS | |
| Automotive | | | |
| Cash and cash equivalents | $ | 7,965 |
| | $ | 6,301 |
|
| Marketable securities (Note 6) | 14,984 |
| | 14,207 |
|
| Total cash and marketable securities | 22,949 |
| | 20,508 |
|
| Receivables, less allowances of $126 and $228 | 4,219 |
| | 3,992 |
|
| Inventories (Note 10) | 5,901 |
| | 5,917 |
|
| Deferred income taxes | 1,791 |
| | 359 |
|
| Net investment in operating leases (Note 8) | 1,356 |
| | 1,282 |
|
| Other current assets | 1,053 |
| | 610 |
|
| Current receivable from Financial Services (Note 1) | 878 |
| | 1,700 |
|
| Total current assets | 38,147 |
| | 34,368 |
|
| Equity in net assets of affiliated companies (Note 11) | 2,797 |
| | 2,441 |
|
| Net property (Note 14) | 22,229 |
| | 23,027 |
|
| Deferred income taxes | 13,932 |
| | 2,468 |
|
| Net intangible assets (Note 15) | 100 |
| | 102 |
|
| Non-current receivable from Financial Services (Note 1) | 32 |
| | 181 |
|
| Other assets | 1,549 |
| | 2,019 |
|
| Total Automotive assets | 78,786 |
| | 64,606 |
|
| Financial Services | |
| | |
|
| Cash and cash equivalents | 9,183 |
| | 8,504 |
|
| Marketable securities (Note 6) | 3,835 |
| | 6,759 |
|
| Finance receivables, net (Note 7) | 73,330 |
| | 73,265 |
|
| Net investment in operating leases (Note 8) | 11,482 |
| | 10,393 |
|
| Equity in net assets of affiliated companies (Note 11) | 139 |
| | 128 |
|
| Other assets | 3,605 |
| | 4,221 |
|
| Total Financial Services assets | 101,574 |
| | 103,270 |
|
| Intersector elimination | (1,112 | ) | | (2,083 | ) |
| Total assets | $ | 179,248 |
| | $ | 165,793 |
|
| LIABILITIES | |
| | |
|
| Automotive | |
| | |
|
| Trade payables | $ | 14,015 |
| | $ | 13,466 |
|
| Other payables | 2,734 |
| | 1,544 |
|
| Accrued liabilities and deferred revenue (Note 16) | 15,003 |
| | 17,065 |
|
| Deferred income taxes | 40 |
| | 392 |
|
| Debt payable within one year (Note 18) | 1,033 |
| | 2,049 |
|
| Total current liabilities | 32,825 |
| | 34,516 |
|
| Long-term debt (Note 18) | 12,061 |
| | 17,028 |
|
| Other liabilities (Note 16) | 26,910 |
| | 23,016 |
|
| Deferred income taxes | 255 |
| | 344 |
|
| Total Automotive liabilities | 72,051 |
| | 74,904 |
|
| Financial Services | |
| | |
|
| Payables | 975 |
| | 1,352 |
|
| Debt (Note 18) | 86,595 |
| | 85,112 |
|
| Deferred income taxes | 1,301 |
| | 1,505 |
|
| Other liabilities and deferred income (Note 16) | 3,457 |
| | 3,764 |
|
| Payable to Automotive (Note 1) | 910 |
| | 1,881 |
|
| Total Financial Services liabilities | 93,238 |
| | 93,614 |
|
| Intersector elimination | (1,112 | ) | | (2,083 | ) |
| Total liabilities | 164,177 |
| | 166,435 |
|
| EQUITY | |
| | |
|
| Capital stock (Note 24) | |
| | |
|
| Common Stock, par value $.01 per share (3,745 million shares issued) | 37 |
| | 37 |
|
| Class B Stock, par value $.01 per share (71 million shares issued) | 1 |
| | 1 |
|
| Capital in excess of par value of stock | 20,905 |
| | 20,803 |
|
| Retained earnings/(Accumulated deficit) | 12,985 |
| | (7,038 | ) |
| Accumulated other comprehensive income/(loss) | (18,734 | ) | | (14,313 | ) |
| Treasury stock | (166 | ) | | (163 | ) |
| Total equity/(deficit) attributable to Ford Motor Company | 15,028 |
| | (673 | ) |
| Equity/(Deficit) attributable to noncontrolling interests | 43 |
| | 31 |
|
| Total equity/(deficit) | 15,071 |
| | (642 | ) |
| Total liabilities and equity | $ | 179,248 |
| | $ | 165,793 |
|
The accompanying notes are part of the financial statements.
FORD MOTOR COMPANY AND SUBSIDIARIES
SECTORCONDENSED CONSOLIDATED STATEMENT OF CASH FLOWS
For the Years Ended December 31, 2009, 20082011, 2010, and 20072009
(in millions)
| | | | | | | | | | | | | | | | | | |
| | | | | | | | | | | | | | | | | | | | 2011 | | 2010 | | 2009 |
| Cash flows from operating activities of continuing operations | | | | | | | | | | | | | | | | | | | | | | | |
| Net cash (used in)/provided by operating activities (Note 27) | | $ | 4,091 | | | $ | 5,153 | | | $ | (12,440 | ) | | $ | 9,107 | | | $ | 8,725 | | | $ | 6,402 | | |
| Net cash (used in)/provided by operating activities | | $ | 9,784 |
| | $ | 11,477 |
| | $ | 15,477 |
|
| | | | | | | | | | | | | | | | | | | | | | | | | | | | | | |
| Cash flows from investing activities of continuing operations | | | | | | | | | | | | | | | | | | | | | | | | | | | | | |
Capital expenditures (Note 28) | | | (4,545 | ) | | | (16 | ) | | | (6,620 | ) | | | (76 | ) | | | (5,971 | ) | | | (51 | ) | |
| Capital expenditures | | (4,293 | ) | | (4,092 | ) | | (4,059 | ) |
| Acquisitions of retail and other finance receivables and operating leases | | | — | | | | (26,392 | ) | | | — | | | | (44,562 | ) | | | — | | | | (55,681 | ) | (35,866 | ) | | (28,873 | ) | | (26,392 | ) |
| Collections of retail and other finance receivables and operating leases | | | — | | | | 40,013 | | | | — | | | | 42,479 | | | | — | | | | 45,518 | | 33,964 |
| | 37,757 |
| | 39,884 |
|
| Net (increase)/decrease in wholesale receivables | | | — | | | | 5,542 | | | | — | | | | 2,736 | | | | — | | | | 1,927 | | |
Purchases of securities | | | (52,882 | ) | | | (27,555 | ) | | | (41,347 | ) | | | (23,831 | ) | | | (2,628 | ) | | | (8,795 | ) | (68,723 | ) | | (100,150 | ) | | (78,200 | ) |
Sales and maturities of securities | | | 47,009 | | | | 28,326 | | | | 43,617 | | | | 18,429 | | | | 2,686 | | | | 15,974 | | 70,795 |
| | 101,077 |
| | 74,344 |
|
| Proceeds from sales of retail and other finance receivables and operating leases | | — |
| | — |
| | 911 |
|
| Proceeds from sale of business | | 333 |
| | 1,318 |
| | 382 |
|
Settlements of derivatives | | | (76 | ) | | | 554 | | | | 1,157 | | | | 1,376 | | | | 1,051 | | | | (190 | ) | 353 |
| | (37 | ) | | 478 |
|
| Proceeds from sales of retail and other finance receivables and operating leases | | | — | | | | 911 | | | | — | | | | — | | | | — | | | | 708 | | |
Proceeds from sale of businesses | | | 8 | | | | 374 | | | | 3,156 | | | | 3,698 | | | | 1,079 | | | | 157 | | |
Cash paid for acquisitions | | | — | | | | — | | | | (13 | ) | | | — | | | | — | | | | — | | |
| Transfer of cash balances upon disposition of discontinued/held-for-sale operations | | | — | | | | — | | | | (928 | ) | | | — | | | | (83 | ) | | | — | | |
Investing activity from Financial Services | | | 19 | | | | — | | | | 9 | | | | — | | | | — | | | | — | | |
Investing activity to Financial Services | | | — | | | | — | | | | — | | | | — | | | | (18 | ) | | | — | | |
| Elimination of cash balances upon disposition of discontinued/held-for-sale operations | | (69 | ) | | (456 | ) | | — |
|
| Cash change due to deconsolidation of joint ventures | | — |
| | — |
| | (343 | ) |
| Receipt of cash from purchase of Bordeaux | | — |
| | 94 |
| | — |
|
Other | | | (698 | ) | | | 321 | | | | 40 | | | | 276 | | | | 19 | | | | (230 | ) | 465 |
| | 270 |
| | (386 | ) |
| Net cash (used in)/provided by investing activities | | | (11,165 | ) | | | 22,078 | | | | (929 | ) | | | 525 | | | | (3,865 | ) | | | (663 | ) | (3,041 | ) | | 6,908 |
| | 6,619 |
|
| | | | | | | | | | | | | | | | | | | | | | | | | | | | | | |
| Cash flows from financing activities of continuing operations | | | | | | | | | | | | | | | | | | | | | | | | | |
| | |
| | |
Sales of Common Stock | | | 2,450 | | | | — | | | | 756 | | | | — | | | | 250 | | | | — | | — |
| | 1,339 |
| | 2,450 |
|
Purchases of Common Stock | | | — | | | | — | | | | — | | | | — | | | | (31 | ) | | | — | | |
Changes in short-term debt | | | 227 | | | | (6,162 | ) | | | 104 | | | | (5,224 | ) | | | (90 | ) | | | 1,009 | | 2,841 |
| | (1,754 | ) | | (5,881 | ) |
Proceeds from issuance of other debt | | | 14,727 | | | | 31,263 | | | | 203 | | | | 41,960 | | | | 240 | | | | 32,873 | | 35,921 |
| | 30,821 |
| | 45,993 |
|
Principal payments on other debt | | | (3,013 | ) | | | (56,508 | ) | | | (594 | ) | | | (45,281 | ) | | | (837 | ) | | | (38,594 | ) | (43,095 | ) | | (47,625 | ) | | (61,822 | ) |
Payments on notes/transfer of cash equivalents to the UAW VEBA Trust (Note 18) | | | (2,574 | ) | | | — | | | | — | | | | — | | | | — | | | | — | | |
Financing activity from Automotive | | | — | | | | — | | | | — | | | | — | | | | — | | | | 18 | | |
Financing activity to Automotive | | | — | | | | (19 | ) | | | — | | | | (9 | ) | | | — | | | | — | | |
| Payments on notes/transfer of cash equivalents to the UAW Voluntary Employee Benefit Association ("VEBA") Trust (Note 17) | | — |
| | (7,302 | ) | | (2,574 | ) |
Other | | | (395 | ) | | | (601 | ) | | | (252 | ) | | | (352 | ) | | | 35 | | | | (123 | ) | 92 |
| | 100 |
| | (996 | ) |
| Net cash (used in)/provided by financing activities | | | 11,422 | | | | (32,027 | ) | | | 217 | | | | (8,906 | ) | | | (433 | ) | | | (4,817 | ) | (4,241 | ) | | (24,421 | ) | | (22,830 | ) |
| | | | | | | | | | | | | | | | | | | | | | | | | | | | | | |
Effect of exchange rate changes on cash | | | 179 | | | | 291 | | | | (309 | ) | | | (499 | ) | | | 506 | | | | 508 | | (159 | ) | | (53 | ) | | 454 |
|
| Net change in intersector receivables/payables and other liabilities | | | (595 | ) | | | 595 | | | | (840 | ) | | | 840 | | | | (291 | ) | | | 291 | | |
| Cumulative correction of prior period-error (Note 1) | | | — | | | | (630 | ) | | | — | | | | — | | | | — | | | | — | | |
| Net increase/(decrease) in cash and cash equivalents from continuing operations | | | 3,932 | | | | (4,540 | ) | | | (14,301 | ) | | | 1,067 | | | | 4,642 | | | | 1,721 | | |
| | | | | | | | | | | | | | | | | | | | | | | | | | |
| Cash flows from discontinued operations | | | | | | | | | | | | | | | | | | | | | | | | | |
| Cash flows from operating activities of discontinued operations | | | — | | | | — | | | | — | | | | — | | | | 16 | | | | 10 | | |
| Cash flows from investing activities of discontinued operations | | | — | | | | — | | | | — | | | | — | | | | — | | | | — | | |
| Cash flows from financing activities of discontinued operations | | | — | | | | — | | | | — | | | | — | | | | — | | | | — | | |
| Cumulative correction of Financial Services prior-period error (Note 1) | | — |
| | — |
| | (630 | ) |
| | | | | | | | | | | | | | | | | | | | | | | | | | | | | | |
| Net increase/(decrease) in cash and cash equivalents | | $ | 3,932 | | | $ | (4,540 | ) | | $ | (14,301 | ) | | $ | 1,067 | | | $ | 4,658 | | | $ | 1,731 | | $ | 2,343 |
| | $ | (6,089 | ) | | $ | (910 | ) |
| | | | | | | | | | | | | | | | | | | | | | | | | | | | | | |
Cash and cash equivalents at January 1 | | $ | 6,377 | | | $ | 15,672 | | | $ | 20,678 | | | $ | 14,605 | | | $ | 16,022 | | | $ | 12,874 | | $ | 14,805 |
| | $ | 20,894 |
| | $ | 21,804 |
|
| Cash and cash equivalents of discontinued/held-for-sale operations at January 1 | | | — | | | | — | | | | — | | | | — | | | | (2 | ) | | | — | | |
| Net increase/(decrease) in cash and cash equivalents | | | 3,932 | | | | (4,540 | ) | | | (14,301 | ) | | | 1,067 | | | | 4,658 | | | | 1,731 | | 2,343 |
| | (6,089 | ) | | (910 | ) |
| Less: Cash and cash equivalents of discontinued/held-for-sale operations at December 31 | | | — | | | | — | | | | — | | | | — | | | | — | | | | — | | |
| Cash and cash equivalents at December 31 | | $ | 10,309 | | | $ | 11,132 | | | $ | 6,377 | | | $ | 15,672 | | | $ | 20,678 | | | $ | 14,605 | | $ | 17,148 |
| | $ | 14,805 |
| | $ | 20,894 |
|
The accompanying notes are part of the financial statements.
FORD MOTOR COMPANY AND SUBSIDIARIES
CONSOLIDATEDCONDENSED SECTOR STATEMENT OF EQUITY
CASH FLOWS
For the Years Ended December 31, 2009, 20082011, 2010, and 2007
2009
(in millions)
|
| | | | | | | | | | | | | | | | | | | | | | | |
| | 2011 | | 2010 | | 2009 |
| | Automotive | | Financial Services | | Automotive | | Financial Services | | Automotive | | Financial Services |
| Cash flows from operating activities of continuing operations | | | | | | | | | | | |
| Net cash (used in)/provided by operating activities (Note 26) | $ | 9,368 |
| | $ | 2,405 |
| | $ | 6,363 |
| | $ | 3,798 |
| | $ | 2,874 |
| | $ | 5,805 |
|
| | | | | | | | | | | | |
| Cash flows from investing activities of continuing operations | | | | | | | | | | | |
| Capital expenditures | (4,272 | ) | | (21 | ) | | (4,066 | ) | | (26 | ) | | (4,043 | ) | | (16 | ) |
| Acquisitions of retail and other finance receivables and operating leases | — |
| | (35,845 | ) | | — |
| | (28,811 | ) | | — |
| | (26,392 | ) |
| Collections of retail and other finance receivables and operating leases | — |
| | 33,964 |
| | — |
| | 37,757 |
| | — |
| | 40,013 |
|
| Net (acquisitions)/collections of wholesale receivables | — |
| | (2,010 | ) | | — |
| | (46 | ) | | — |
| | 5,542 |
|
| Purchases of securities | (44,353 | ) | | (24,370 | ) | | (53,614 | ) | | (46,728 | ) | | (52,293 | ) | | (27,555 | ) |
| Sales and maturities of securities | 43,525 |
| | 27,270 |
| | 54,857 |
| | 46,866 |
| | 46,420 |
| | 28,326 |
|
| Settlements of derivatives | 135 |
| | 218 |
| | (196 | ) | | 159 |
| | (76 | ) | | 554 |
|
| Proceeds from sales of retail and other finance receivables and operating leases | — |
| | — |
| | — |
| | — |
| | — |
| | 911 |
|
| Proceeds from sale of business | 310 |
| | 23 |
| | 1,318 |
| | — |
| | 8 |
| | 374 |
|
| Receipt of cash from purchase of Bordeaux | — |
| | — |
| | 94 |
| | — |
| | — |
| | — |
|
| Cash change due to deconsolidation of joint ventures | — |
| | — |
| | — |
| | — |
| | (343 | ) | | — |
|
| Investing activity (to)/from Financial Services | 2,903 |
| | — |
| | 2,455 |
| | — |
| | 76 |
| | — |
|
| Elimination of cash balances upon disposition of discontinued/held-for-sale operations | (69 | ) | | — |
| | (456 | ) | | — |
| | — |
| | — |
|
| Other | 280 |
| | 185 |
| | 185 |
| | 85 |
| | (707 | ) | | 321 |
|
| Net cash (used in)/provided by investing activities | (1,541 | ) | | (586 | ) | | 577 |
| | 9,256 |
| | (10,958 | ) | | 22,078 |
|
| | | | | | | | | | | | |
| Cash flows from financing activities of continuing operations | |
| | |
| | |
| | |
| | | | |
| Sales of Common Stock | — |
| | — |
| | 1,339 |
| | — |
| | 2,450 |
| | — |
|
| Changes in short-term debt | (396 | ) | | 3,237 |
| | 391 |
| | (2,145 | ) | | 281 |
| | (6,162 | ) |
| Proceeds from issuance of other debt | 2,452 |
| | 33,469 |
| | 2,648 |
| | 28,173 |
| | 14,730 |
| | 31,263 |
|
| Principal payments on other debt | (8,058 | ) | | (35,037 | ) | | (9,144 | ) | | (38,935 | ) | | (2,941 | ) | | (56,508 | ) |
| Payments on notes/transfer of cash equivalents to the UAW VEBA Trust (Note 17) | — |
| | — |
| | (6,002 | ) | | — |
| | (2,574 | ) | | — |
|
| Financing activity to/(from) Automotive | — |
| | (2,903 | ) | | — |
| | (2,455 | ) | | — |
| | (76 | ) |
| Other | 70 |
| | 22 |
| | 292 |
| | (192 | ) | | (395 | ) | | (601 | ) |
| Net cash (used in)/provided by financing activities | (5,932 | ) | | (1,212 | ) | | (10,476 | ) | | (15,554 | ) | | 11,551 |
| | (32,084 | ) |
| | | | | | | | | | | | |
| Effect of exchange rate changes on cash | (231 | ) | | 72 |
| | 75 |
| | (128 | ) | | 163 |
| | 291 |
|
| Cumulative correction of prior period-error (Note 1) | — |
| | — |
| | — |
| | — |
| | — |
| | (630 | ) |
| | | | | | | | | | | | |
| Net increase/(decrease) in cash and cash equivalents | $ | 1,664 |
| | $ | 679 |
| | $ | (3,461 | ) | | $ | (2,628 | ) | | $ | 3,630 |
| | $ | (4,540 | ) |
| | | | | | | | | | | | |
| Cash and cash equivalents at January 1 | $ | 6,301 |
| | $ | 8,504 |
| | $ | 9,762 |
| | $ | 11,132 |
| | $ | 6,132 |
| | $ | 15,672 |
|
| Net increase/(decrease) in cash and cash equivalents | 1,664 |
| | 679 |
| | (3,461 | ) | | (2,628 | ) | | 3,630 |
| | (4,540 | ) |
| Cash and cash equivalents at December 31 | $ | 7,965 |
| | $ | 9,183 |
| | $ | 6,301 |
| | $ | 8,504 |
| | $ | 9,762 |
| | $ | 11,132 |
|
| | | Equity/(Deficit) Attributable to Ford Motor Company | | | | | | | |
| | | | | | Capital in Excess of Par Value of Stock | | | Retained Earnings/ (Accumulated Deficit) | | | Accumulated Other Comprehensive Income/(Loss) | | | | | | | | | Equity/ (Deficit) Attributable to Non-controlling Interests | | | | |
| YEAR ENDED DECEMBER 31, 2007 | | | | | | | | | | | | | | | | | | | | | | | | |
Balance at beginning of year | | $ | 19 | | | $ | 6,412 | | | $ | (22 | ) | | $ | (7,846 | ) | | $ | (183 | ) | | $ | (1,620 | ) | | $ | 1,159 | | | $ | (461 | ) |
| Comprehensive income/(loss) | | | | | | | | | | | | | | | | | | | | | | | | | | | | | | | | |
Net income/(loss) | | | — | | | | — | | | | (2,795 | ) | | | — | | | | — | | | | (2,795 | ) | | | 312 | | | | (2,483 | ) |
| Foreign currency translation (net of $0 of tax) | | | — | | | | — | | | | — | | | | 1,780 | | | | — | | | | 1,780 | | | | 140 | | | | 1,920 | |
| Net gain/(loss) on derivative instruments (net of $77 of tax benefit) | | | — | | | | — | | | | — | | | | (64 | ) | | | — | | | | (64 | ) | | | — | | | | (64 | ) |
| Employee benefit related (net of $1,909 of tax) | | | — | | | | — | | | | — | | | | 5,581 | | | | — | | | | 5,581 | | | | — | | | | 5,581 | |
| Net holding gain/(loss) (net of $0 of tax) | | | — | | | | — | | | | — | | | | (48 | ) | | | — | | | | (48 | ) | | | 1 | | | | (47 | ) |
Comprehensive income/(loss) | | | | | | | | | | | | | | | | | | | | | | | 4,454 | | | | 453 | | | | 4,907 | |
| Adoption of the accounting standard for uncertainty in income taxes | | | — | | | | — | | | | 1,255 | | | | — | | | | — | | | | 1,255 | | | | — | | | | 1,255 | |
| Common Stock issued for debt conversion, employee benefit plans, and other | | | 3 | | | | 3,272 | | | | — | | | | — | | | | — | | | | 3,275 | | | | — | | | | 3,275 | |
ESOP loan, treasury stock, and other | | | — | | | | — | | | | — | | | | — | | | | (2 | ) | | | (2 | ) | | | 7 | | | | 5 | |
Cash dividends | | | — | | | | — | | | | — | | | | — | | | | — | | | | — | | | | (198 | ) | | | (198 | ) |
Balance at end of year | | $ | 22 | | | $ | 9,684 | | | $ | (1,562 | ) | | $ | (597 | ) | | $ | (185 | ) | | $ | 7,362 | | | $ | 1,421 | | | $ | 8,783 | |
| YEAR ENDED DECEMBER 31, 2008 | | | | | | | | | | | | | | | | | | | | | | | | | | | | | | | | |
Balance at beginning of year | | $ | 22 | | | $ | 9,684 | | | $ | (1,562 | ) | | $ | (597 | ) | | $ | (185 | ) | | $ | 7,362 | | | $ | 1,421 | | | $ | 8,783 | |
| Comprehensive income/(loss) | | | | | | | | | | | | | | | | | | | | | | | | | | | | | | | | |
Net income/(loss) | | | — | | | | — | | | | (14,766 | ) | | | — | | | | — | | | | (14,766 | ) | | | 214 | | | | (14,552 | ) |
| Foreign currency translation (net of $0 of tax) | | | — | | | | — | | | | — | | | | (5,576 | ) | | | — | | | | (5,576 | ) | | | (219 | ) | | | (5,795 | ) |
| Net gain/(loss) on derivative instruments (net of $47 of tax benefit) | | | — | | | | — | | | | — | | | | (334 | ) | | | — | | | | (334 | ) | | | — | | | | (334 | ) |
| Employee benefit related (net of $352 of tax benefit) | | | — | | | | — | | | | — | | | | (3,575 | ) | | | — | | | | (3,575 | ) | | | — | | | | (3,575 | ) |
| Net holding gain/(loss) (net of $0 of tax) | | | — | | | | — | | | | — | | | | (42 | ) | | | — | | | | (42 | ) | | | — | | | | (42 | ) |
Comprehensive income/(loss) | | | | | | | | | | | | | | | | | | | | | | | (24,293 | ) | | | (5 | ) | | | (24,298 | ) |
| Adoption of the fair value option standard for financial assets and liabilities (net of $0 of tax) | | | — | | | | — | | | | 12 | | | | — | | | | — | | | | 12 | | | | — | | | | 12 | |
| Common Stock issued for debt conversion, employee benefit plans, and other | | | 2 | | | | 1,191 | | | | — | | | | — | | | | — | | | | 1,193 | | | | — | | | | 1,193 | |
ESOP loan, treasury stock, and other | | | — | | | | — | | | | — | | | | — | | | | 4 | | | | 4 | | | | 9 | | | | 13 | |
Cash dividends | | | — | | | | — | | | | — | | | | — | | | | — | | | | — | | | | (230 | ) | | | (230 | ) |
Balance at end of year | | $ | 24 | | | $ | 10,875 | | | $ | (16,316 | ) | | $ | (10,124 | ) | | $ | (181 | ) | | $ | (15,722 | ) | | $ | 1,195 | | | $ | (14,527 | ) |
| YEAR ENDED DECEMBER 31, 2009 | | | | | | | | | | | | | | | | | | | | | | | | | | | | | | | | |
Balance at beginning of year | | $ | 24 | | | $ | 10,875 | | | $ | (16,316 | ) | | $ | (10,124 | ) | | $ | (181 | ) | | $ | (15,722 | ) | | $ | 1,195 | | | $ | (14,527 | ) |
| Comprehensive income/(loss) | | | | | | | | | | | | | | | | | | | | | | | | | | | | | | | | |
Net income/(loss) | | | — | | | | — | | | | 2,717 | | | | — | | | | — | | | | 2,717 | | | | 245 | | | | 2,962 | |
Foreign currency translation (net of $0 of tax) | | | — | | | | — | | | | — | | | | 2,236 | | | | — | | | | 2,236 | | | | 38 | | | | 2,274 | |
| Net gain/(loss) on derivative instruments (net of $64 of tax) | | | — | | | | — | | | | — | | | | (127 | ) | | | — | | | | (127 | ) | | | — | | | | (127 | ) |
| Employee benefit related (net of $131 of tax benefit) | | | — | | | | — | | | | — | | | | (2,851 | ) | | | — | | | | (2,851 | ) | | | (1 | ) | | | (2,852 | ) |
Net holding gain/(loss) (net of $0 of tax) | | | — | | | | — | | | | — | | | | 2 | | | | — | | | | 2 | | | | (3 | ) | | | (1 | ) |
Comprehensive income/(loss) | | | | | | | | | | | | | | | | | | | | | | | 1,977 | | | | 279 | | | | 2,256 | |
| Common Stock issued for debt conversion, employee benefit plans, and other | | | 10 | | | | 5,911 | | | | — | | | | — | | | | — | | | | 5,921 | | | | — | | | | 5,921 | |
ESOP loan, treasury stock, and other | | | — | | | | — | | | | — | | | | — | | | | 4 | | | | 4 | | | | 3 | | | | 7 | |
Cash dividends | | | — | | | | — | | | | — | | | | — | | | | — | | | | — | | | | (172 | ) | | | (172 | ) |
Balance at end of year | | $ | 34 | | | $ | 16,786 | | | $ | (13,599 | ) | | $ | (10,864 | ) | | $ | (177 | ) | | $ | (7,820 | ) | | $ | 1,305 | | | $ | (6,515 | ) |
The accompanying notes are part of the financial statements.
FORD MOTOR COMPANY AND SUBSIDIARIES
CONSOLIDATED STATEMENT OF EQUITY
For the Years Ended December 31, 2011, 2010, and 2009
(in millions)
|
| | | | | | | | | | | | | | | | | | | | | | | | | | | | | | | |
| | Equity/(Deficit) Attributable to Ford Motor Company | | | | |
| | Capital Stock | | Cap. in Excess of Par Value of Stock | | Retained Earnings/ (Accumulated Deficit) | | Accumulated Other Comprehensive Income/(Loss) | | Treasury Stock | | Total | | Equity/(Deficit) Attributable to Non-controlling Interests | | Total Equity/ (Deficit) |
| YEAR ENDED DECEMBER 31, 2009 | |
| | |
| | |
| | |
| | |
| | |
| | |
| | |
|
| Balance at beginning of year | $ | 24 |
| | $ | 10,875 |
| | $ | (16,316 | ) | | $ | (10,123 | ) | | $ | (181 | ) | | $ | (15,721 | ) | | $ | 350 |
| | $ | (15,371 | ) |
| Comprehensive income/(loss) | |
| | |
| | |
| | |
| | |
| | |
| | |
| | |
|
| Net income/(loss) | — |
| | — |
| | 2,717 |
| | — |
| | — |
| | 2,717 |
| | — |
| | 2,717 |
|
| Foreign curr. translation (net of $65 of tax) | — |
| | — |
| | — |
| | 2,235 |
| | — |
| | 2,235 |
| | — |
| | 2,235 |
|
| Net gain/(loss) on derivative instruments (net of $0 of tax) | — |
| | — |
| | — |
| | (127 | ) | | — |
| | (127 | ) | | — |
| | (127 | ) |
| Employee benefit related (net of $302 of tax benefit & other) | — |
| | — |
| | — |
| | (2,851 | ) | | — |
| | (2,851 | ) | | — |
| | (2,851 | ) |
| Net holding gain/(loss) (net of $0 of tax) | — |
| | — |
| | — |
| | 2 |
| | — |
| | 2 |
| | — |
| | 2 |
|
| Comprehensive income/(loss) | |
| | |
| | |
| | |
| | |
| | 1,976 |
| | — |
| | 1,976 |
|
| Common Stock issued | 10 |
| | 5,911 |
| | — |
| | — |
| | — |
| | 5,921 |
| | — |
| | 5,921 |
|
| Impact of deconsolidation of AutoAlliance International, Inc. | — |
| | — |
| | — |
| | — |
| | — |
| | — |
| | (269 | ) | | (269 | ) |
| Treasury stock/other | — |
| | — |
| | — |
| | — |
| | 4 |
| | 4 |
| | (40 | ) | | (36 | ) |
| Cash dividends declared | — |
| | — |
| | — |
| | — |
| | — |
| | — |
| | (3 | ) | | (3 | ) |
| Balance at end of year | $ | 34 |
| | $ | 16,786 |
| | $ | (13,599 | ) | | $ | (10,864 | ) | | $ | (177 | ) | | $ | (7,820 | ) | | $ | 38 |
| | $ | (7,782 | ) |
| | | | | | | | | | | | | | | | |
| YEAR ENDED DECEMBER 31, 2010 | |
| | |
| | |
| | |
| | |
| | |
| | |
| | |
|
| Balance at beginning of year | $ | 34 |
| | $ | 16,786 |
| | $ | (13,599 | ) | | $ | (10,864 | ) | | $ | (177 | ) | | $ | (7,820 | ) | | $ | 38 |
| | $ | (7,782 | ) |
| Comprehensive income/(loss) | |
| | |
| | |
| | |
| | |
| | |
| | |
| | |
|
| Net income/(loss) | — |
| | — |
| | 6,561 |
| | — |
| | — |
| | 6,561 |
| | (4 | ) | | 6,557 |
|
| Foreign curr. translation (net of $2 of tax benefit) | — |
| | — |
| | — |
| | (2,233 | ) | | — |
| | (2,233 | ) | | (1 | ) | | (2,234 | ) |
| Net gain/(loss) on derivative instruments (net of $0 of tax) | — |
| | — |
| | — |
| | (24 | ) | | — |
| | (24 | ) | | — |
| | (24 | ) |
| Employee benefit related (net of $222 of tax benefit & other) | — |
| | — |
| | — |
| | (1,190 | ) | | — |
| | (1,190 | ) | | — |
| | (1,190 | ) |
| Net holding gain/(loss) (net of $0 of tax) | — |
| | — |
| | — |
| | (2 | ) | | — |
| | (2 | ) | | — |
| | (2 | ) |
| Comprehensive income/(loss) | |
| | |
| | |
| | |
| | |
| | 3,112 |
| | (5 | ) | | 3,107 |
|
| Common Stock issued | 4 |
| | 4,017 |
| | — |
| | — |
| | — |
| | 4,021 |
| | — |
| | 4,021 |
|
| Treasury stock/other | — |
| | — |
| | — |
| | — |
| | 14 |
| | 14 |
| | — |
| | 14 |
|
| Cash dividends declared | — |
| | — |
| | — |
| | — |
| | — |
| | — |
| | (2 | ) | | (2 | ) |
| Balance at end of year | $ | 38 |
| | $ | 20,803 |
| | $ | (7,038 | ) | | $ | (14,313 | ) | | $ | (163 | ) | | $ | (673 | ) | | $ | 31 |
| | $ | (642 | ) |
| | | | | | | | | | | | | | | | |
| YEAR ENDED DECEMBER 31, 2011 | |
| | |
| | |
| | |
| | |
| | |
| | |
| | |
|
| Balance at beginning of year | $ | 38 |
| | $ | 20,803 |
| | $ | (7,038 | ) | | $ | (14,313 | ) | | $ | (163 | ) | | $ | (673 | ) | | $ | 31 |
| | $ | (642 | ) |
| Comprehensive income/(loss) | |
| | |
| | |
| | |
| | |
| | |
| | |
| | |
|
| Net income/(loss) | — |
| | — |
| | 20,213 |
| | — |
| | — |
| | 20,213 |
| | 9 |
| | 20,222 |
|
| Foreign curr. translation (net of $2 of tax benefit) | — |
| | — |
| | — |
| | (718 | ) | | — |
| | (718 | ) | | (2 | ) | | (720 | ) |
| Net gain/(loss) on derivative instruments (net of $67 of tax benefit) | — |
| | — |
| | — |
| | (152 | ) | | — |
| | (152 | ) | | — |
| | (152 | ) |
| Employee benefit related (net of $1,560 of tax benefit & other) | — |
| | — |
| | — |
| | (3,553 | ) | | — |
| | (3,553 | ) | | — |
| | (3,553 | ) |
| Net holding gain/(loss) (net of $0 of tax) | — |
| | — |
| | — |
| | 2 |
| | — |
| | 2 |
| | — |
| | 2 |
|
| Comprehensive income/(loss) | |
| | |
| | |
| | |
| | |
| | 15,792 |
| | 7 |
| | 15,799 |
|
| Common Stock issued | — |
| | 102 |
| | — |
| | — |
| | — |
| | 102 |
| | — |
| | 102 |
|
| Treasury stock/other | — |
| | — |
| | — |
| | — |
| | (3 | ) | | (3 | ) | | 5 |
| | 2 |
|
| Cash dividends declared (Note 24) | — |
| | — |
| | (190 | ) | | — |
| | — |
| | (190 | ) | | — |
| | (190 | ) |
| Balance at end of year | $ | 38 |
| | $ | 20,905 |
| | $ | 12,985 |
| | $ | (18,734 | ) | | $ | (166 | ) | | $ | 15,028 |
| | $ | 43 |
| | $ | 15,071 |
|
The accompanying notes are part of the financial statements.
FORD MOTOR COMPANY AND SUBSIDIARIES
NOTES TO THE FINANCIAL STATEMENTS
Table of Contents
|
| | |
| Footnote | | Page |
| Note 1 | Presentation | FS – 9 |
| Note 2 | Summary of Accounting Policies | FS – 15 |
| Note 3 | RecentlyAccounting Standards Issued Accounting Standards
But Not Yet Adopted | FS – 17 |
| Note 4 | Fair Value Measurements | FS – 18 |
| Note 5 | Cash and Restricted Cash
| FS – 25 |
| Note 6 | Marketable and Other Securities | FS – 25 |
| Note 7 | Finance Receivables – Financial Services Sector | FS – 26 |
| Note 8 | Net Investment in Operating Leases | FS – 28 |
| Note 9 | Allowance for Credit Losses – Financial Services Sector | FS – 29 |
| Note 10 | Inventories | FS – 30 |
| Note 11 | Equity in Net Assets of Affiliated Companies | FS – 30 |
| Note 12 | Significant Unconsolidated Affiliates | FS – 31 |
| Note 13 | Variable Interest Entities | FS – 32 |
| Note 14 | Net Property and Lease Commitments | FS – 37 |
| Note 15 | Impairment of Long-LivedNet Intangible Assets
| FS – 38 |
| Note 16 | GoodwillAccrued Liabilities and Other Net Intangible Assets
Deferred Revenue | FS – 39 |
| Note 17 | Accrued Liabilities and Deferred Revenue
Retirement Benefits | FS – 41 |
| Note 18 | Retirement Benefits
Debt and Commitments | FS – 42 |
| Note 19 | Debt and Commitments
Other Income/(Loss) | FS – 53 |
| Note 20 | Other Income/(Loss)
Share-Based Compensation | FS – 64 |
| Note 21 | Share-Based Compensation
Employee Separation Actions | FS – 64 |
| Note 22 | Employee Separation Actions
Income Taxes | FS – 68 |
| Note 23 | Income Taxes
Held-for-Sale Operations, Dispositions, and Acquisitions | FS – 69 |
| Note 24 | Held-For-Sale Operations, Discontinued Operations, Other Dispositions, and Acquisitions | FS – 73 |
Note 25 | Capital Stock and Amounts Per Share | FS – 77 |
Note 2625 | Derivative Financial Instruments and Hedging Activities | |
FS – 80Note 26 | Operating Cash Flows | |
| Note 27 | Operating Cash Flows
Segment Information | FS – 84 |
| Note 28 | SegmentGeographic Information
| FS – 85 |
| Note 29 | Geographic Information
Selected Quarterly Financial Data | FS – 89 |
| Note 30 | Selected Quarterly Financial Data
| FS – 89 |
Note 31Commitments and Contingencies | Commitment and ContingenciesFS-96 | FS – 90 |
FORD MOTOR COMPANY AND SUBSIDIARIES
NOTES TO THE FINANCIAL STATEMENTS
NOTE 1. PRESENTATION
For purposes of this report, "Ford," the "Company," "we," "our," "us" or similar references mean Ford Motor Company and our consolidated subsidiaries and our consolidated variable interest entities ("VIEs") of which we are the primary beneficiary, unless the context requires otherwise.
We prepare our financial statements in accordance with generally accepted accounting principles ("GAAP") in the United States.States ("GAAP"). We present the financial statements on a consolidated basis and on a sector basis for our Automotive and Financial Services sectors. The additional information provided in the sector statements enables the reader to better understand the operating performance, financial position, cash flows, and liquidity of our two very different businesses. We eliminate all intercompany items and transactions in both the consolidated and sector basis financial statements.balance sheets. In certain circumstances, presentation of these intercompany eliminations or consolidated adjustments differ between the consolidated and sector financial statements. These line items are reconciled below under "Reconciliations between Consolidated and Sector Financial Statements."Statements" or in related footnotes.
The majority of theWe reclassified certain prior year amounts presented onin our balance sheets are based on historical values. However, certain amounts are shown at fair value. For additional information on fair value, see Note 4.consolidated financial statements to conform to current year presentation.
To provide comparative prior-year balance sheets, certain amounts on our December 31, 2008 consolidated and sector balance sheets and related footnotes have been reclassified for operations held for sale in 2009. All held-for-sale assets and liabilities are excluded from the footnotes unless otherwise noted. For information about our held-for-sale operations, see Note 24.
In the first quarter of 2009, our wholly-owned subsidiary Ford Motor Credit Company LLC ("Ford Credit") recorded a $630$630 million cumulative adjustment to correct for the overstatement of Financial Services sector cash and cash equivalents and certain accounts payable that originated in prior periods. The impact on previously-issued annual and interim financial statements was not material.
Subsequent Events. We evaluated the effects of all subsequent events from the end of the fourth quarter through February 25, 2010, the date we filed our financial statements with the U.S. Securities and Exchange Commission ("SEC").
Adoption of New Accounting Standards
Troubled Debt Restructurings. Noncontrolling Interests. WeOn July 1, 2011 we adopted the Financial Accounting Standards Board'snew accounting standard related to a creditor's determination of whether a restructuring is a troubled debt restructuring ("FASB"TDR") revised. The new standard on accountingprovides additional guidance as to whether a restructuring meets the criteria to be considered a TDR. Refer to Notes 7 and 9 for noncontrolling interests on January 1, 2009. This standard establishes accounting and reporting requirements for the noncontrolling interest (formerly "minority interest") in a subsidiary and for the deconsolidation of a subsidiary. The standard clarifies that a noncontrolling interest is an ownership interest in a consolidated entity that should be reported as equity in the consolidated financial statements. We have retrospectively applied the presentation and disclosure requirements of this standard for all periods. This requirement changed the presentation of our consolidated and sector statements of operations, our consolidated and sector balance sheets, and our consolidated statement of equity.further information regarding TDRs.
Business Combinations.Convertible Debt Instruments. We On January 1, 2011 we adopted the FASB'snew accounting standard on business combinations. The new standard on accounting for convertible debt instrumentsrequires public entities that may be settled in cash upon conversion (including partial cash settlement) on January 1, 2009. The standard specifies that issuers of convertible debt securities that, upon conversion, may be settled in cash should separately account forpresent comparative financial statements to disclose the liabilityrevenue and equity components in a manner that will reflect the entity's nonconvertible debt borrowing rate resulting in higher interest expense over the lifeearnings of the instrument due to amortizationcombined entity as though the business combination(s) that occurred during the current year had occurred as of the discount. Thisbeginning of the prior annual reporting period. The new accounting standard applies todid not have an impact on our 4.25% Senior Convertible Notes due December 15, 2036 ("2036 Convertible Notes") issued in December 2006 and our 4.25% Senior Convertible Notes due December 15, 2016 ("2016 Convertible Notes") issued in November 2009. We have applied retrospectively the standard to all periods presented for the 2036 Convertible Notes.financial statement disclosures.
FORD MOTOR COMPANY AND SUBSIDIARIES
NOTES TO THE FINANCIAL STATEMENTS
NOTE 1. PRESENTATION (Continued)Accumulated Other Comprehensive Income/(Loss)
The following financial statement line items from our sector statementcomponents of operations and sector balance sheetaccumulated other comprehensive income/(loss) attributable to Ford Motor Company as of December 31 were affected by implementation of the change in accounting for convertible debt instrumentsas follows (in millions, except per share information)millions):
| Statement of Operations | | | | | As Originally Reported 2008 | | | | |
Automotive interest expense | | $ | 2,061 | | | $ | 1,938 | | | $ | (123 | ) |
| Automotive interest income and other non-operating income/(expense), net | | | (726 | ) | | | (755 | ) | | | 29 | |
| Income/(Loss) from continuing operations attributable to Ford Motor Company | | | (14,775 | ) | | | (14,681 | ) | | | (94 | ) |
Net income/(loss) attributable to Ford Motor Company | | | (14,766 | ) | | | (14,672 | ) | | | (94 | ) |
Earnings per share attributable to Ford Motor Company | | | (6.50 | ) | | | (6.46 | ) | | | (0.04 | ) |
| Statement of Operations | | | | | As Originally Reported 2007 | | | | |
Automotive interest expense | | $ | 2,363 | | | $ | 2,252 | | | $ | (111 | ) |
Provision for/(Benefit from) income taxes | | | (1,333 | ) | | | (1,294 | ) | | | 39 | |
| Income/(Loss) from continuing operations attributable to Ford Motor Company | | | (2,836 | ) | | | (2,764 | ) | | | (72 | ) |
Net income/(loss) attributable to Ford Motor Company | | | (2,795 | ) | | | (2,723 | ) | | | (72 | ) |
Earnings per share attributable to Ford Motor Company | | | (1.41 | ) | | | (1.38 | ) | | | (0.03 | ) |
| Balance Sheet | | Revised December 31, | | | As Originally Reported December 31, | | | | |
| Automotive other assets – noncurrent (a) | | $ | 1,441 | | | $ | 1,512 | | | $ | (71 | ) |
Automotive long-term debt | | | 23,036 | | | | 24,655 | | | | (1,619 | ) |
Capital in excess of par value of stock (b) | | | 10,875 | | | | 9,076 | | | | 1,799 | |
Accumulated other comprehensive income/(loss) | | | (10,124 | ) | | | (10,085 | ) | | | (39 | ) |
Retained earnings/(Accumulated deficit) | | | (16,316 | ) | | | (16,145 | ) | | | (171 | ) |
__________
(a) | "Effect of Change" related to the standard on accounting for convertible debt instruments that includes capitalized charges of $30 million; the remaining $41 million relates to the assets of Volvo classified as held-for-sale operations (see Note 24 for discussion of Volvo). |
(b) | "Effect of Change" represents the equity component of the 2036 Convertible Notes under the standard on accounting for convertible debt instruments ($1,864 million), less those amounts previously recorded on conversions prior to adoption of the standard ($65 million). |
| Statement of Equity | | Revised December 31, | | | As Originally Reported December 31, | | | | |
Capital in excess of par value of stock | | $ | 10,875 | | | $ | 9,076 | | | $ | 1,799 | |
Accumulated other comprehensive income/(loss) | | | (10,124 | ) | | | (10,085 | ) | | | (39 | ) |
Retained earnings/(Accumulated deficit) | | | (16,316 | ) | | | (16,145 | ) | | | (171 | ) |
| Statement of Equity | | Revised December 31, | | | As Originally Reported December 31, | | | | |
Capital in excess of par value of stock* | | $ | 9,684 | | | $ | 7,834 | | | $ | 1,850 | |
Accumulated other comprehensive income/(loss) | | | (597 | ) | | | (558 | ) | | | (39 | ) |
Retained earnings/(Accumulated deficit) | | | (1,562 | ) | | | (1,485 | ) | | | (77 | ) |
__________
* | "Effect of Change" represents the equity component under the standard on accounting for convertible debt. The net change of $1,799 million in 2008 impacted calendar years 2006 and 2008 by $1,850 million and $(51) million, respectively. The 2006 change impacted the beginning balance of the 2007 equity statement. |
FS - 10 |
| | | | | | | | | | | |
| | 2011 | | 2010 | | 2009 |
| Accumulated other comprehensive income/(loss): | | | | | |
| Foreign currency translation | $ | (1,383 | ) | | $ | (665 | ) | | $ | 1,568 |
|
| Net gain/(loss) on derivative instruments | (181 | ) | | (29 | ) | | (5 | ) |
| Employee benefit related | (17,170 | ) | | (13,617 | ) | | (12,427 | ) |
| Net holding gain/(loss) | — |
| | (2 | ) | | — |
|
| Total accumulated other comprehensive income/(loss) | $ | (18,734 | ) | | $ | (14,313 | ) | | $ | (10,864 | ) |
FORD MOTOR COMPANY AND SUBSIDIARIES
NOTES TO THE FINANCIAL STATEMENTS
NOTE 1. PRESENTATION(Continued)
The following shows the effect on the per share amounts attributable to Ford Common and Class B Stock associated with our 2036 Convertible Notes before and after the adoption of the standard on accounting for convertible debt instruments:
| | | | |
| Basic income/(loss) | | | | | | | | | |
Income/(Loss) from continuing operations | | $ | 0.92 | | | $ | 0.91 | | | $ | (0.01 | ) |
Income/(Loss) from discontinued operations | | | — | | | | — | | | | — | |
Net income/(loss) | | $ | 0.92 | | | $ | 0.91 | | | $ | (0.01 | ) |
| Diluted income/(loss) | | | | | | | | | | | | |
Income/(Loss) from continuing operations | | $ | 0.86 | | | $ | 0.86 | | | $ | — | |
Income/(Loss) from discontinued operations | | | — | | | | — | | | | — | |
Net income/(loss) | | $ | 0.86 | | | $ | 0.86 | | | $ | — | |
Trading Securities. Beginning with our statement of cash flows for the year ended December 31, 2008, we changed the presentation of cash flows to separately disclose the purchases of trading securities and the sale and maturities of trading securities as gross amounts within Cash flows from investing activities of continuing operations instead of Cash flows from operating activities of continuing operations. This change is in response to our election to apply the fair value option to our available-for-sale and held-to-maturity securities on January 1, 2008.
Reconciliations between Consolidated and Sector Financial Statements
Deferred Tax Assets and Liabilities. The amount ofdifference between the total assets and total liabilities as presented in our sector balance sheet differ from the amounts in ourand consolidated balance sheet by $3,040 million and $4,649 million at December 31, 2009 and 2008, respectively. As shown in the table below, the difference is the result of a reclassification for netting of deferred income tax assets and liabilitiesliabilities. The reconciliation between the totals for the sector and consolidated balance sheets at December 31 was as follows (in millions):
| | | | | | | | | | 2011 | | 2010 |
| Sector balance sheet presentation of deferred income tax assets: | | | | | | | | | |
Automotive sector current deferred income tax assets | | $ | 511 | | | $ | 302 | | $ | 1,791 |
| | $ | 359 |
|
Automotive sector non-current deferred income tax assets | | | 5,663 | | | | 7,204 | | 13,932 |
| | 2,468 |
|
Financial Services sector deferred income tax assets* | | | 306 | | | | 251 | | |
| Financial Services sector deferred income tax assets (a) | | 302 |
| | 282 |
|
Total | | | 6,480 | | | | 7,757 | | 16,025 |
| | 3,109 |
|
Reclassification for netting of deferred income taxes | | | (3,040 | ) | | | (4,649 | ) | (900 | ) | | (1,106 | ) |
| Consolidated balance sheet presentation of deferred income tax assets | | $ | 3,440 | | | $ | 3,108 | | $ | 15,125 |
| | $ | 2,003 |
|
| | | | | | | | | | | | |
| Sector balance sheet presentation of deferred income tax liabilities: | | | | | | | | | |
| | |
|
Automotive sector current deferred income tax liabilities | | $ | 3,119 | | | $ | 2,790 | | $ | 40 |
| | $ | 392 |
|
Automotive sector non-current deferred income tax liabilities | | | 561 | | | | 614 | | 255 |
| | 344 |
|
Financial Services sector deferred income tax liabilities | | | 1,735 | | | | 3,280 | | 1,301 |
| | 1,505 |
|
Total | | | 5,415 | | | | 6,684 | | 1,596 |
| | 2,241 |
|
Reclassification for netting of deferred income taxes | | | (3,040 | ) | | | (4,649 | ) | (900 | ) | | (1,106 | ) |
| Consolidated balance sheet presentation of deferred income tax liabilities | | $ | 2,375 | | | $ | 2,035 | | $ | 696 |
| | $ | 1,135 |
|
__________
| |
| (a) | Financial Services deferred income tax assets are included in Financial Services other assets on our sector balance sheet. |
* Financial Services deferred income tax assets are included in Financial Services other assets on our sector balance sheet.
Debt Reduction Actions
During 2008 and 2009, we completed numerous financing transactions designed to improve our balance sheet, including the repurchase of Automotive and Financial Services debt. The transactions involved, among other things, the repurchase of Automotive sector debt by the Financial Services sector and the repurchase of Financial Services sector debt by the Automotive sector. Because of the intercompany impacts, the transactions have been recorded differently in the consolidated and sector balance sheets. There also are differences in the way the transactions have been recorded in the consolidated and sector statements of cash flows. See the table below for the reconciliation between total sector and consolidated cash flows.
FORD MOTOR COMPANY AND SUBSIDIARIES
NOTES TO THE FINANCIAL STATEMENTS
NOTE 1. PRESENTATION(Continued)
Automotive Acquisition of Financial Services Debt. During 2008 and 2009, we issued 159,913,115 shares of Ford Common Stock through an equity distribution agreement and used the proceeds of $1 billion to purchase Ford Credit debt and related interest of $20 million. We recognized a gain on extinguishment of debt of $68 million on the transactions, recorded in Automotive interest income and other non-operating income/(expense), net. Approximately $135 million of the debt purchased has matured, and $267 million was repurchased from us by Ford Credit.
On our consolidated balance sheet, we net the remaining debt purchased by Ford with the outstanding debt of Ford Credit, reducing our consolidated marketable securities and debt balances by $646 million and $492 million at December 31, 2009 and 2008, respectively. On our sector balance sheet, the acquisition is reported separately as Automotive marketable securities and Financial Services debt as it has not been retired or cancelled by Ford Credit.
Financial Services Acquisition of Automotive Debt. During 2009, the Financial Services sector acquired $2.2 billion principal amount of Automotive secured term loan and $3.4 billion principal amount of Automotive unsecured debt securities for $2.2 billion of cash. The debt was then distributed to us, whereupon it was forgiven or used in satisfaction of Ford Credit's tax liabilities with us under our tax-sharing agreement. The debt acquired is no longer outstanding. We recorded gains on the extinguishment of debt (net of unamortized discounts, premiums and fees, and transaction costs) of $3.3 billion in Automotive interest income and other non-operating income/(expense), net. See Note 19 for further discussion of these transactions.
FORD MOTOR COMPANY AND SUBSIDIARIES
NOTES TO THE FINANCIAL STATEMENTS
NOTE 1. PRESENTATION (Continued)
Sector to Consolidated Cash Flow Reconciliation. We present certain cash flows from the wholesale receivables, finance receivables and the acquisition of intersector debt reduction actions differently on our sector and consolidated statementstatements of cash flows. The reconciliation between totaltotals for the sector and consolidated cash flows isfor the years ended December 31 was as follows (in millions):
|
| | | | | | | | | | | |
| | 2011 | | 2010 | | 2009 |
| Automotive net cash (used in)/provided by operating activities | $ | 9,368 |
| | $ | 6,363 |
| | $ | 2,874 |
|
| Financial Services net cash (used in)/provided by operating activities | 2,405 |
| | 3,798 |
| | 5,805 |
|
| Total sector net cash (used in)/provided by operating activities (Note 26) | 11,773 |
| | 10,161 |
| | 8,679 |
|
| Reclassifications from investing to operating cash flows: | |
| | |
| | |
| Wholesale receivables (a) | (2,010 | ) | | (46 | ) | | 5,542 |
|
| Finance receivables (b) | 21 |
| | 62 |
| | 129 |
|
| Reclassifications from operating to financing cash flows: | | | | | |
| Payments on notes to the UAW VEBA Trust (c) | — |
| | 1,300 |
| | — |
|
| Financial Services sector second quarter 2009 acquisition of Automotive sector debt (d) | — |
| | — |
| | 1,127 |
|
| Consolidated net cash (used in)/provided by operating activities | $ | 9,784 |
| | $ | 11,477 |
| | $ | 15,477 |
|
| | | | | | |
| Automotive net cash (used in)/provided by investing activities | $ | (1,541 | ) | | $ | 577 |
| | $ | (10,958 | ) |
| Financial Services net cash (used in)/provided by investing activities | (586 | ) | | 9,256 |
| | 22,078 |
|
| Total sector net cash (used in)/provided by investing activities | (2,127 | ) | | 9,833 |
| | 11,120 |
|
| Reclassifications from investing to operating cash flows: | |
| | |
| | |
| Wholesale receivables (a) | 2,010 |
| | 46 |
| | (5,542 | ) |
| Finance receivables (b) | (21 | ) | | (62 | ) | | (129 | ) |
| Reclassifications from investing to financing cash flows: | | | | | |
| Automotive sector acquisition of Financial Services sector debt (e) | — |
| | (454 | ) | | 155 |
|
| Financial Services sector first quarter 2009 acquisition of Automotive sector debt (d) | — |
| | — |
| | 1,091 |
|
| Elimination of investing activity to/(from) Financial Services in consolidation | (2,903 | ) | | (2,455 | ) | | (76 | ) |
| Consolidated net cash (used in)/provided by investing activities | $ | (3,041 | ) | | $ | 6,908 |
| | $ | 6,619 |
|
| | | | | | |
| Automotive net cash (used in)/provided by financing activities | $ | (5,932 | ) | | $ | (10,476 | ) | | $ | 11,551 |
|
| Financial Services net cash (used in)/provided by financing activities | (1,212 | ) | | (15,554 | ) | | (32,084 | ) |
| Total sector net cash (used in)/provided by financing activities | (7,144 | ) | | (26,030 | ) | | (20,533 | ) |
| Reclassifications from investing to financing cash flows: | |
| | |
| | |
| Automotive sector acquisition of Financial Services sector debt (e) | — |
| | 454 |
| | (155 | ) |
| Financial Services sector first quarter 2009 acquisition of Automotive sector debt (d) | — |
| | — |
| | (1,091 | ) |
| Reclassifications from operating to financing cash flows: | | | | | |
| Financial Services sector second quarter 2009 acquisition of Automotive sector debt (d) | — |
| | — |
| | (1,127 | ) |
| Payments on notes to the UAW VEBA Trust (c) | — |
| | (1,300 | ) | | — |
|
| Elimination of investing activity to/(from) Financial Services in consolidation | 2,903 |
| | 2,455 |
| | 76 |
|
| Consolidated net cash (used in)/provided by financing activities | $ | (4,241 | ) | | $ | (24,421 | ) | | $ | (22,830 | ) |
| | | | | | | | | | |
Automotive cash flows from operating activities of continuing operations | | $ | 4,091 | | | $ | (12,440 | ) | | $ | 8,725 | |
| Financial Services cash flows from operating activities of continuing operations | | | 5,153 | | | | 9,107 | | | | 6,402 | |
Total sector cash flows from operating activities of continuing operations | | | 9,244 | | | | (3,333 | ) | | | 15,127 | |
| Reclassifications from investing to operating cash flows: | | | | | | | | | | | | |
Wholesale receivables (a) | | | 5,542 | | | | 2,736 | | | | 1,927 | |
Finance receivables (b) | | | 129 | | | | 418 | | | | 20 | |
| Reclassifications from operating to financing cash flows: | | | | | | | | | | | | |
Financial Services sector acquisition of Automotive sector debt (c) | | | 1,127 | | | | — | | | | — | |
| Consolidated cash flows from operating activities of continuing operations | | $ | 16,042 | | | $ | (179 | ) | | $ | 17,074 | |
| | | | | | | | | | | | | |
Automotive cash flows from investing activities of continuing operations | | $ | (11,165 | ) | | $ | (929 | ) | | $ | (3,865 | ) |
| Financial Services cash flows from investing activities of continuing operations | | | 22,078 | | | | 525 | | | | (663 | ) |
Total sector cash flows from investing activities of continuing operations | | | 10,913 | | | | (404 | ) | | | (4,528 | ) |
| Reclassifications from investing to operating cash flows: | | | | | | | | | | | | |
Wholesale receivables (a) | | | (5,542 | ) | | | (2,736 | ) | | | (1,927 | ) |
Finance receivables (b) | | | (129 | ) | | | (418 | ) | | | (20 | ) |
| Reclassifications from investing to financing cash flows: | | | | | | | | | | | | |
Automotive sector acquisition of Financial Services sector debt (d) | | | 155 | | | | 424 | | | | — | |
Financial Services sector acquisition of Automotive sector debt (c) | | | 1,091 | | | | — | | | | — | |
| Elimination of Investing activity to/(from) Financial Services in consolidation | | | (19 | ) | | | (9 | ) | | | 18 | |
Consolidated cash flows from investing activities of continuing operations | | $ | 6,469 | | | $ | (3,143 | ) | | $ | (6,457 | ) |
| | | | | | | | | | | | | |
Automotive cash flows from financing activities of continuing operations | | $ | 11,422 | | | $ | 217 | | | $ | (433 | ) |
| Financial Services cash flows from financing activities of continuing operations | | | (32,027 | ) | | | (8,906 | ) | | | (4,817 | ) |
Total sector cash flows from financing activities of continuing operations | | | (20,605 | ) | | | (8,689 | ) | | | (5,250 | ) |
| Reclassifications from investing to financing cash flows: | | | | | | | | | | | | |
Automotive sector acquisition of Financial Services sector debt (d) | | | (155 | ) | | | (424 | ) | | | — | |
Financial Services sector acquisition of Automotive sector debt (c) | | | (1,091 | ) | | | — | | | | — | |
| Reclassifications from operating to financing cash flows: | | | | | | | | | | | | |
Financial Services sector acquisition of Automotive sector debt (c) | | | (1,127 | ) | | | — | | | | — | |
| Elimination of financing activity to/(from) Financial Services in consolidation | | | 19 | | | | 9 | | | | (18 | ) |
Consolidated cash flows from financing activities of continuing operations | | $ | (22,959 | ) | | $ | (9,104 | ) | | $ | (5,268 | ) |
__________
(a) | |
| (a) | In addition to the cash flow from vehicles sold by us, the cash flow from wholesale finance receivables (being reclassified from investing to operating) includes financing by Ford Credit of used and non-Ford vehicles. 100% of cash flows from wholesale finance receivables have been reclassified for consolidated presentation as the portion of these cash flows from used and non-Ford vehicles is impracticable to separate. |
| |
| (b) | Includes cash flows of finance receivables purchased/collected from certain divisions and subsidiaries of the Automotive sector. |
| |
| (c) | See "April 2009 Unsecured Notes Tender Offer""Notes Due to UAW VEBA Trust" in Note 18 for discussion of these transactions. Cash outflows related to this transaction are reported as financing activities on the consolidated statement of cash flows and "2009 Securedoperating activities on the sector statement of cash flows. |
| |
| (d) | See the "Secured Term Loan Actions" within the AutomotiveLoan" section of Note 1918 for further discussion of these transactions. Cash outflows related to these transactions are reported as financing activities on the consolidated statement of cash flows and either investing or operating activities on the sector statement of cash flows. |
(d) | |
| (e) | See "Debt Reduction Actions" above"Automotive Acquisition of Financial Services Debt" in Note 18 for further discussion.discussion of these transactions. Cash outflowsinflows related to these transactions are reported as financing activities on the consolidated statement of cash flows and investing activities on the sector statement of cash flows. |
FORD MOTOR COMPANY AND SUBSIDIARIES
NOTES TO THE FINANCIAL STATEMENTS
NOTE 1. PRESENTATION(Continued)
Certain Transactions Between Automotive and Financial Services Sectors
Intersector transactions occur in the ordinary course of business. We formally documented certain long-standing business practices with Ford Credit, our indirect wholly-owned subsidiary, in a 2001 agreement that was amended in 2006. Additional details ondetail regarding certain transactions and the effect on each sector's balance sheet at December 31 are shown belowwas as follows (in billions):
| | | | | | | | | | 2011 | | 2010 |
| | | | | | | | | | | | Automotive | | Financial Services | | Automotive | | Financial Services |
Finance receivables, net (a) | | | | $ | 3.9 | | | | $ | 2.6 | | | | $ | 3.7 |
| | | | $ | 3.4 |
|
Unearned interest supplements and residual support (b) | | | | | (3.0 | ) | | | | | (2.6 | ) | | | (2.6 | ) | | | | (2.7 | ) |
Wholesale receivables/Other (c) | | | | | 0.6 | | | | | 1.0 | | | | 0.7 |
| | | | 0.5 |
|
Net investment in operating leases (d) | | | | | 0.5 | | | | | 0.6 | | | | 0.4 |
| | | | 0.6 |
|
Other assets (e) | | | | | 0.5 | | | | | 0.6 | | |
Intersector receivables/(payables) (f) | $ | 2.6 | | | (2.6 | ) | $ | 2.0 | | | (2.0 | ) | |
| Intersector receivables/(payables) (e) | | $ | 0.9 |
| | (0.9 | ) | | $ | 1.9 |
| | (1.9 | ) |
__________
| |
| (a) | Automotive sector receivables (generated primarily from vehicle and parts sales to third parties) sold to Ford Credit. These receivables are classified as Other receivables, neton our consolidated balance sheet and Finance receivables, neton our sector balance sheet. |
| |
| (b) | As of January 1, 2008, to reduce ongoing obligationsWe pay amounts to Ford Credit and to be consistent with general industry practice, we began payingat the point of retail or lease origination that represent interest supplements and residual value support tothat Ford Credit at the time Ford Credit purchased eligible contracts from dealers.
provides to retail customers. |
| |
| (c) | Primarily wholesale receivables with entities that are consolidated subsidiaries of Ford. The consolidated subsidiaries include dealerships that are partially or wholly owned by Ford and consolidated as VIEs, and also certain overseas affiliates. |
| |
| (d) | Sale-leaseback agreement between Automotive and Financial Services sectors relating to vehicles that we lease to our employees and employees of our subsidiaries.employees. |
| |
| (e) | Primarily used vehicles purchased by Ford Credit pursuant to the Automotive sector's obligation to repurchase such vehicles from daily rental car companies. These vehicles are subsequently sold at auction. |
(f) | Amounts owed to the Automotive sector by Financial Services sector, or vice versa, largely related to our tax sharing agreement. |
Additionally, amounts recorded as revenue by the Financial Services sector and billed to the Automotive sector for interest supplements and other support costs for special financing and leasing programs were $3.7$2.8 billion $4.8, $3.2 billion, and $4.6$3.7 billion in 2009, 20082011, 2010, and 2007,2009, respectively. The Automotive sector had accrued in Accrued liabilities and deferred revenue $1 billion$47 million and $2.5 billion$269 million for interest supplements at December 31, 20092011 and 2008,2010, respectively, and about $180$0 and $26 million and about $450 million for residual-value supplements in the United States and Canada to be paid to Ford Credit over the term of the related finance contracts at December 31, 20092011 and 2008,2010, respectively.
LiquidityVenezuelan Operations
At December 31, 2009, our Automotive sector2011 and 2010, we had total$311 million and $41 million, respectively, in net monetary assets (primarily cash and receivables partially offset by payables and accrued liabilities) denominated in Venezuelan bolivars. These net monetary assets included $331 million and $132 million in cash and cash equivalents at December 31, 2011and marketable2010, respectively. As a result of regulation of foreign currency exchange in Venezuela, the official exchange rate of 4.3 bolivars to the U.S. dollar is used to re-measure the assets and liabilities of our Venezuelan operations for GAAP financial statement presentation. The Venezuelan government also controls securities transactions in the parallel exchange market. Our ability to obtain funds in the parallel exchange market has been limited. For any U.S. dollars that we obtain at a rate less favorable than the official rate, we realize a loss for the difference in the exchange rates at the time of $25.5 billion and full-year operating cash flows from continuing operationsthe transaction. Based on our net monetary position at December 31, 2011, a devaluation equal to a 50% change in the official bolivar exchange rate would have resulted in a balance sheet translation loss of $4.1 billion.
During 2009, we completed numerous financing transactions designed to provide additional Automotive liquidity and improveapproximately $100 million. Continuing restrictions on the foreign currency exchange market could affect our balance sheet. These transactions include the Amended Settlement Agreement relating to our hourly retiree health care obligation (discussed in Note 18) (providing us the optionVenezuelan operations' ability to pay up to approximately 50% of VEBA obligations denominated in Ford Common Stock), reduction of Automotive debt by $10.1 billion principal amount, and issuance of $1.6 billion of equity in an underwritten offering of Ford Common Stock and about $700 million through equity distribution agreements. In addition, we entered into a U.S. Department of Energy ("DOE") loan agreement to provide up to $5.9 billion in loans, issued $2.875 billion of 2016 Convertible Notes, and amended and extended the revolving credit facility (discussed in Note 19) thereby extending the maturity date for $7.2 billion of the facility from December 2011 to November 2013.
Although the economic environment for 2010 remains uncertain, we believe that all reasonably possible scenarios, including a decline in 2010 industry sales volumes to levels below our planning assumptions, would not exhaust our presently available liquidity. Therefore, we do not believe that these reasonably possible scenarios cause substantial doubt aboutdollars as well as our ability to continue as a going concern for the next year.benefit from those operations.
Accordingly, we have concluded that there is no substantial doubt about our ability to continue as a going concern, and our financial statements have been prepared on a going concern basis.
FORD MOTOR COMPANY AND SUBSIDIARIES
NOTES TO THE FINANCIAL STATEMENTS
NOTE 2. SUMMARY OF ACCOUNTING POLICIES
For each accounting topic that is addressed in its own footnote, the description of the accompanying accounting policy may be found in the related footnote. The remaining accounting policies are described below.
Use of Estimates
The preparation of financial statements in accordance with U.S. GAAP requires us to make estimates and assumptions that affect our reported amounts of assets and liabilities, our disclosure of contingent assets and liabilities at the date of the financial statements, and our revenue and expensesresults during the periods reported. Estimates are used to account for certain items such as marketing accruals, warranty costs, employee benefit programs, etc. Estimates are based on historical experience, where applicable, and assumptions that we believe are reasonable under the circumstances. Due to the inherent uncertainty involved with estimates, actual results may differ.
FORD MOTOR COMPANY AND SUBSIDIARIES
NOTES TO THE FINANCIAL STATEMENTS
NOTE 2. SUMMARY OF ACCOUNTING POLICIES (Continued)
Foreign Currency Translation
The assets and liabilities of foreign subsidiaries using the local currency as their functional currency are translated to U.S. dollars using end-of-period exchange rates and any resulting translation adjustments are reported in Accumulated other comprehensive income/(loss). Upon sale or liquidation of an investment in a foreign subsidiary, the accumulated amount of translation adjustments related to that entity areis reclassified to net income as part of the recognized gain or loss on the investment.
Increases/(decreases)(Decreases) in Accumulated other comprehensive income/(loss)resulting fromtranslation adjustments for the years ended December 31 were as follows (in billions)millions):
| | | | | | | | | | |
Adjustments due to change in net assets of foreign subsidiaries | | $ | 2.0 | | | $ | (3.8 | ) | | $ | 1.8 | |
Deferred translation (gains)/losses reclassified to net income* | | | 0.3 | | | | (1.8 | ) | | | — | |
Total translation adjustments (net of taxes) | | $ | 2.3 | | | $ | (5.6 | ) | | $ | 1.8 | |
|
| | | | | | | | | | | |
| | 2011 | | 2010 | | 2009 |
| Beginning of year: foreign currency translation | $ | (665 | ) | | $ | 1,568 |
| | $ | (667 | ) |
| Adjustments due to translation of net assets of foreign subsidiaries | (697 | ) | | (497 | ) | | 1,951 |
|
| Deferred translation (gains)/losses reclassified to net income (a) | (21 | ) | | (1,736 | ) | | 284 |
|
| Total translation adjustments (net of taxes) | (718 | ) | | (2,233 | ) | | 2,235 |
|
| End of year: foreign currency translation | $ | (1,383 | ) | | $ | (665 | ) | | $ | 1,568 |
|
______* The 2008 adjustment primarily relates to the sale of Jaguar Land Rover and a portion of our stake in Mazda Motor Corporation ("Mazda").
| |
| (a) | The adjustment for 2010 primarily relates to the sale of Volvo. |
Gains or losses arising from transactions denominated in currencies other than the affiliate's functional currency, of the locations, the effect of remeasuring assets and liabilities of foreign subsidiaries using U.S. dollars as their functional currency, and the results of our foreign currency hedging activities are reported in Automotive cost of sales Automotive interest income and other non-operating income/(expense), net, and Selling, administrative and other expenses. For additional discussion of hedging activities, see Note 26. The net after-taxpre-tax gain/(loss) of this activity for 2009, 2008,2011, 2010, and 20072009 was $(757)$4 million $922, $56 million, and $217$(768) million, respectively.
Trade Receivables
Trade receivables, recorded on our consolidated balance sheet in Other receivables, net, consist primarily of Automotive sector receivables for vehicles, parts, and accessories. Trade receivables are initially recorded at the transaction amount. We record an allowance for doubtful accounts representing our estimate of the probable losses inherent in trade receivables. At every reporting period, we assess the adequacy of our allowance for doubtful accounts taking into consideration recoveries received during that period. Additions to the allowance for doubtful accounts are made by recording charges to bad debt expense reported in Automotive cost of sales on our statement of operations. Receivables are charged to the allowance for doubtful accounts when an account is deemed to be uncollectible.
Revenue Recognition — Automotive Sector
Automotive revenue is generated primarily by sales consist primarily of revenue generated from the sale of vehicles. Sales arevehicles, parts and accessories. Revenue is recorded when theall risks and rewards of ownership are transferred to our customers (generally dealers and distributors). For the majority of our sales, this occurs when products are shipped from our manufacturing facilities or delivered to our customers.facilities. When vehicles are shipped to customers or vehicle modifiers on consignment, revenue is recognized when the vehicle is sold to the ultimate customer. When we give our dealers the right to return eligible parts for credit, we reduce the related revenue for expected returns.
We sell vehicles to daily rental car companies subject to guaranteed repurchase options. These vehicles are accounted for as operating leases. At the time of sale, the proceeds are recorded as deferred revenue in Accrued liabilities and deferred revenue. The difference between the proceeds and the guaranteed repurchase amount is recognized in Automotive revenues over an average term of eight months, using a straight-line method. The cost of the vehicles is recorded in Net investment in operating leases and the difference between the cost of the vehicle and the estimated auction value is depreciated in Automotive cost of sales over the term of the lease. Any difference between the estimated auction value and the auction sale proceeds is recognized in Automotive revenues at the time the vehicle is sold at auction. At December 31, 2011 and 2010, we recorded $1.5 billion and $1.4 billion as deferred revenue, respectively. See Note 8 for additional information.
Income generated from cash and cash equivalents and investments in marketable securities and other miscellaneous receivables is reported in Automotive interest income and other non-operating income/(expense), net.
FORD MOTOR COMPANY AND SUBSIDIARIES
NOTES TO THE FINANCIAL STATEMENTS
NOTE 2. SUMMARY OF ACCOUNTING POLICIES (Continued)
Revenue Recognition — Financial Services Sector
Financial Services revenue is generated primarily from interest on finance receivables (including direct financing leases) and is recognized using the interest method. Certain origination costs on receivables are deferred and amortized over the term of the related receivable as a reduction to revenue. Revenue from rental payments received on operating leases is recognized on a straight-line basis over the term of the lease. Initial direct costs related to leases are deferred and amortized over the term of the lease as a reduction to revenue. The accrual of interest on finance receivables and revenue on operating leases is discontinued at the earlier of the time a receivable or account is determined to be uncollectible, at bankruptcy status notification, or greater than 120 days past due.
Income generated from cash and cash equivalents and investments in marketable securities and other miscellaneous receivables is reported in Financial Services other income/(loss), net.
FORD MOTOR COMPANY AND SUBSIDIARIES
NOTES TO THE FINANCIAL STATEMENTS
Retail and Lease Incentives
NOTE 2. SUMMARY OF ACCOUNTING POLICIES We offer special retail and lease incentives to dealers' customers who choose to finance or lease Ford-brand vehicles from Ford Credit. Generally, the estimated cost for these incentives is recorded as a revenue reduction to (Continued)Automotive revenues when the vehicle is sold to the dealer. In order to compensate Ford Credit for the lower interest or lease rates offered to the retail customer, we pay the discounted value of the incentive directly to Ford Credit when it originates the retail finance or lease contract with the dealer's customer. The Financial Services sector recognizes income for the special financing and leasing programs consistent with the earnings process of the underlying receivable or operating lease.
Sales and Marketing Incentives and Interest Supplements
MarketingSales and marketing incentives generally are recognized by the Automotive sector as revenue reductions in Automotive salesrevenues. These includeThe incentives take the form of customer andand/or dealer cash payments and costs for special financing and leasing programs paidpayments. The reduction to the Financial Services sector. The revenue reductions areis accrued at the later of the date the related vehicle sales to the dealers are recordedis sold or the date the incentive program is both approved and communicated. We generally estimate these accruals using marketingincentive programs that are approved as of the balance sheet date and are expected to be effective at the beginning of the subsequent period. The Financial Services sector identifies payments for special financing and leasing programs as interest supplements or other support costs and recognizes them consistent with the earnings process of the underlying receivable or operating lease.
Supplier Price Adjustments
We frequently negotiate price adjustments with our suppliers throughout a production cycle, even after receiving production material. These price adjustments relate to changes in design specifications or other commercial terms such as economics, productivity, and competitive pricing. We recognize price adjustments when we reach final agreement with our suppliers. In general, we avoid direct price changes in consideration of future business; however, when these occur, our policy is to defer the financial statement impact of any such price change given explicitly in consideration of future business where guaranteed volumes are specified.
Raw Material Arrangements
We negotiate prices for and facilitate the purchase of raw materials on behalf of our suppliers. These raw material arrangements, which take place independently of any purchase orders being issued to our suppliers, are negotiated at armsarms' length and do not involve volume guarantees to either party.guarantees. When we pass the risks and rewards of ownership to our suppliers, including inventory risk, market price risk, and credit risk for the raw material, we record both the cost of the raw material and the income from the subsequent sale to the supplier in Automotive cost of sales. When we retain the risks and rewards of ownership, we account for the raw material as Inventory on our balance sheet.
Government Grants and Loan Incentives
From time to time, weWe receive grants and loan incentives from domesticU.S. and foreign governments. Grantsnon-U.S. governments in the form of tax rebates or credits, loans and grants. Incentives are recorded in the financial statements in accordance with their purpose, either as a reduction of expensesexpense or a reduction of the cost of the capital investment. When recorded asA premium or a reductiondiscount is calculated on low-interest or interest-free loans if the stated rate differs from the market rate, unless the governmental authority imposes specific restrictions on the use of expense, grants are recorded as a reduction in Automotive cost of sales.the loan proceeds. The benefit of grants and loanthese incentives areis recorded when performance is complete and all conditions as specified in the agreement are fulfilled.
FORD MOTOR COMPANY AND SUBSIDIARIES
NOTES TO THE FINANCIAL STATEMENTS
NOTE 2. SUMMARY OF ACCOUNTING POLICIES (Continued)
Labor Costs
On October 26, 2011, we signed a new national labor agreement with the UAW covering approximately 41,000 employees in the United States ("Agreement"). Among other things, the Agreement sets wages and benefits for the covered employees for a four-year period expiring in September 2015.
The Agreement provided for a ratification bonus of $6,000 to most of the covered employees. These bonuses were paid, and the full amount of the expense recorded, in the fourth quarter of 2011.
Covered employees also will receive four annual operational performance bonuses of up to $250 per year beginning in December 2011, and four annual inflation protection lump sum payments in the amount of $1,500 per year beginning in June 2012. The first operational performance bonus in the amount of $250 was paid and expensed in the fourth quarter of 2011. The subsequent operational performance bonuses will be expensed over the twelve-month period leading up to each payment date. The first inflation protection lump sum payment will be expensed over the eight-month period leading up to the June 2012 payment date; each subsequent lump sum payment will be expensed over the twelve-month period leading up to the respective June payment date.
The Agreement also modifies the method for calculating payment to covered employees under our profit sharing plan. Planned profit sharing payments are accrued throughout the year in which the payment is earned. Each quarter, we evaluate and adjust as necessary the year to date accrual to ensure that it is consistent with our expected full year profit and current profit sharing plan in place at the end of the quarter. We generally make any payment under the profit sharing plan in the first quarter subsequent to the year in which it is earned. We made a partial payment in the fourth quarter of 2011, based on first half 2011 Ford North America profits, with the remainder of the 2011 profit sharing payment to be made in the first quarter of 2012.
Payments made pursuant to the Agreement are recognized in Automotive cost of sales.
Selected Other Costs
Freight, engineering, and research and development costs are included in Automotive cost of sales; advertising costs are included in Selling, administrative and other expenses. Freight costs on goods shipped and advertisingare expensed at the earlier of revenue recognition or as incurred. Advertising costs are expensed as incurred. Engineering, research and development costs are expensed as incurred when performed internally or when performed by a supplier when reimbursement is guaranteed.if we guarantee reimbursement. Engineering, research, and development, and advertising expenses for the years ended December 31 were as follows (in billions):
| | | | | | | | | | |
Engineering, research and development | | $ | 4.9 | | | $ | 7.3 | | | $ | 7.5 | |
Advertising | | | 3.3 | | | | 4.6 | | | | 5.4 | |
FORD MOTOR COMPANY AND SUBSIDIARIES
NOTES TO THE FINANCIAL STATEMENTS
NOTE 2. SUMMARY OF ACCOUNTING POLICIES (Continued) |
| | | | | | | | | | | |
| | 2011 | | 2010 | | 2009 |
| Engineering, research, and development | $ | 5.3 |
| | $ | 5.0 |
| | $ | 4.7 |
|
| Advertising | 4.1 |
| | 3.9 |
| | 3.2 |
|
Presentation of Sales and Sales-Related Taxes
We collect and remit taxes assessed by different governmental authorities that are both imposed on and concurrent with a revenue-producing transaction between us and our customers. These taxes may include, but are not limited to, sales, use, value-added, and some excise taxes. We report the collection of these taxes on a net basis (excluded from revenues).
FORD MOTOR COMPANY AND SUBSIDIARIES
NOTES TO THE FINANCIAL STATEMENTS
NOTE 3. RECENTLYACCOUNTING STANDARDS ISSUED ACCOUNTING STANDARDSBUT NOT YET ADOPTED
Balance Sheet - Offsetting. In June 2009, December 2011,the FASB issued Statement of Financial Accounting Standards No. 168, The FASB Accounting Standards Codification™ and the Hierarchy of Generally Accepted Accounting Principles - a replacement of FASB Statement No. 162. This standard establishes the FASB Accounting Standards CodificationBoard ("Codification"FASB") as the single source of authoritative U.S. GAAP, superseding all previously issued authoritative guidance. All references to pre-Codification GAAP in our financial statements are replaced with descriptive titles.
In June 2009, the FASB issued a new accounting standard related to transfers of financial assets. The standard provides greater transparency about transfers of financial assets and a company’s continuing involvement in the transferred financial assets. The standard also removes the concept of a qualifying special-purpose entity from U.S. GAAP, changes the requirements for derecognizing financial assets, andthat requires additional disclosures about a transferor's continuing involvement with the transferredoffsetting and related arrangements for recognized financial assetsinstruments and the related risks retained.derivative instruments. The standard is effective for us as of January 1, 2010. We do not expect this standard to have a material2013 and will impact on our financial condition, results of operations, and financial statement disclosures.
Intangibles - Goodwill and Other. In June 2009,September 2011, the FASB issued a new accounting standard relatedthat provides the option to the consolidation of VIEs. The standard replaces the quantitative-based risks and rewards calculation with an approach thatevaluate prescribed qualitative factors to determine whether a calculated goodwill impairment test is primarily qualitative. The standard also requires ongoing reassessments of the appropriateness of consolidation, and additional disclosures about involvement with VIEs.necessary. The standard is effective for us as of January 1, 2010. We expect that adoption of this standard2012 and will result in the deconsolidation of many of our joint ventures, including Ford Otomotiv Sanayi Anonim Sirketi ("Ford Otosan") reported within our Ford Europe segment results. Although we continue to examine the potentialnot materially impact of this standard on our financial condition, results of operations, andor financial statement disclosures, we anticipatedisclosures.
Comprehensive Income - Presentation. In June 2011, the FASB issued a new standard that its adoptionmodifies the options for presentation of other comprehensive income. The new standard will require us to present comprehensive income either on a single continuous statement or two separate but consecutive statements. The standard is effective for us as of January 1, 2012 and will impact Income/(Loss) before income taxes and in particular Ford Europe's pre-tax results (see Note 13 for additional information regarding theour financial results of our consolidated VIEs). The standard will have no effect on Net income/(loss) attributable to Ford Motor Company.statement disclosures.
Fair Value Measurement. In October 2009,May 2011, the FASB issued amended guidance addressing revenue arrangements with multiple deliverables.a new standard that provides a consistent definition of fair value measurement and closely aligns disclosure requirements between GAAP and International Financial Reporting Standards. The new guidance establishes a selling pricestandard will require us to report the level in the fair value hierarchy of assets and liabilities not measured at fair value in the balance sheet but for determiningwhich the selling price of a deliverable, eliminates the residual method of allocation, requires the allocation of arrangement considerationfair value is disclosed, and to all deliverables using the relative selling price method, and significantly expands disclosure requirements.expand existing disclosures. The guidancestandard is effective prospectively for revenue arrangements entered intous as of January 1, 2012 and will impact our financial statement disclosures.
Transfers and Servicing - Repurchase Agreements. In April 2011, the FASB issued a new standard for agreements that both entitle and obligate a transferor to repurchase or materially modified in fiscal years beginning on or after June 15, 2010. We are addressing the potentialredeem financial assets before their maturity. The standard is effective for us as of January 1, 2012 and will not impact of this guidance on our financial condition, results of operations, andor financial statement disclosures.
Financial Services - Insurance.In October 2009,2010, the FASB issued amended guidancea new standard addressing revenue arrangements that include both tangible products and software elements.the deferral of acquisition costs within the insurance industry. The new guidance amendsstandard modifies which types of costs can be capitalized in the scopeacquisition and renewal of the software guidance to exclude tangible products containing both software and nonsoftware components that function together to deliver the tangible product's essential functionality.insurance contracts. The guidance also requires entities affected by its amendments to provide the expanded disclosures included within the amended guidance on revenue arrangements with multiple deliverables. The guidancestandard is effective prospectively for revenue arrangements entered into orus as of January 1, 2012 and will not materially modified in fiscal years beginning on or after June 15, 2010. We are addressing the potential impact of this guidance on our financial condition, results of operations, andor financial statement disclosures.
FORD MOTOR COMPANY AND SUBSIDIARIES
NOTES TO THE FINANCIAL STATEMENTS
NOTE 4. FAIR VALUE MEASUREMENTS
Certain assetsCash equivalents, marketable securities, and liabilitiesderivative financial instruments are presented on our financial statements at fair value. AssetsThe fair value of finance receivables and debt is disclosed in Notes 7 and 18, respectively. Certain other assets and liabilities are measured at fair value on a recurringnonrecurring basis, such as impairments, and vary based on our balance sheet include cash equivalents, marketable securities, derivative financial instruments, retained interest in securitized assets, and pension assets. Assets and liabilities measured at fair value on a recurring basis for disclosure only include debt and finance receivables. Fair value of these items are presented together with the related carrying value in Notes 19 and 7, respectively. Assets and liabilities measured at fair value on a non-recurring basis include held-for-sale operations, finance receivables, held-and-used long-lived assets, and equity method investments.specific circumstances.
Fair Value Measurements
Fair value is the price that would be received to sell an asset or paid to transfer a liability in an orderly transaction between market participants at the measurement date. The fair value should be based on assumptions that market participants would use, including a consideration of non-performance risk.
In determining fair value, we use various valuation methodologies and prioritize the use of observable inputs. The availabilityuse of observable and unobservable inputs varies by instrument and depends on a variety of factors including the type of instrument, whether the instrument is actively traded, and other characteristics particular to the transaction. For many financial instruments, pricing inputs are readily observable in the market, the valuation methodology used is widely accepted by market participants, and the valuation does not require significant management discretion. For other financial instruments, pricing inputs are less observable in the marketplace and may require management judgment.
We assess the inputs used to measure fair value using a three-tier hierarchy based on the extent to which inputs usedtheir significance in measuring fair value are reflected in our hierarchy assessment.
Level 1 — inputs include quoted prices for identical instruments and are the most observable
Level 2 — inputs include quoted prices for similar instruments and observable inputs such as interest rates, currency exchange rates and yield curves
Level 3 — inputs include data not observable in the market:market and reflect management judgment about the assumptions market participants would use in pricing the instruments
FORD MOTOR COMPANY AND SUBSIDIARIES
NOTES TO THE FINANCIAL STATEMENTS
| · | Level 1 – inputs include quoted prices for identical instruments and are the most observable. |
| · | Level 2 – inputs include quoted prices for similar assets and observable inputs such as interest rates, currency exchange rates and yield curves. |
| · | Level 3 – inputs are not observable in the market and include management's judgments about the assumptions market participants would use in pricing the asset or liability. |
For instruments measured using Level 3 inputs, a reconciliation of the beginning and ending balances is disclosed.NOTE 4. FAIR VALUE MEASUREMENTS (Continued)
Valuation Methodologies
Cash Equivalents – Financial Instruments.Cash and allCash Equivalents. Included in Cash and cash equivalents are highly liquid investments withthat are readily convertible to known amounts of cash, and which are subject to an insignificant risk of changes in value due to interest rate, market price, or penalty on withdrawal. A debt security is classified as a cash equivalent if it meets these criteria and if it has a remaining time to maturity of 90 days or less atfrom the date of purchaseacquisition. Amounts on deposit and available upon demand, or negotiated to provide for daily liquidity without penalty, are classified as Cash and cash equivalents. equivalentsWe use quoted. These include $1.8 billion of demand deposits with financial institutions which were classified as Marketable securities prior to 2011, and this amount is reported in Sales and maturities of securities in the 2011 consolidated statement of cash flows. Time deposits, certificates of deposit, and money market prices where availableaccounts that meet the above criteria are classified as Cash and industry-standard valuation models using market-based inputs when quoted prices are unavailable.cash equivalents, reported at par value, and excluded from the tables below.
Marketable Securities. SecuritiesFixed income and equity. Investments in securities with a maturity date greater than 90 days at the date of purchase and other securities for which there is a more than insignificant risk of changes in value because of interest rate, market price, or penalty on withdrawal are classified as Marketable securities. For marketable securities. Wesecurities, we generally measure fair value using prices obtained from pricing services. Pricing methodologies and inputs to valuation models used by the pricing services depend on the security type (i.e., asset class). Where possible, fair values are generated using market inputs including quoted prices (the closing price in an exchange market), bid prices (the price at which a buyer stands ready to purchase), and other market information. For securities that are not actively traded, the pricing services obtain quotes for similar fixed-income securities or utilize broker quotes, matrix pricing, benchmark curves, or other factors to determine fair value. In certain cases, when observable pricing data are not available, we estimate the fair value of theseinvestment securities based on an income approach using quoted market prices where available and industry-standardindustry standard valuation models using market-based inputs when quoted prices are unavailable. Where there is limited transparency to valuation inputs, we generally utilize dealer security quotes or standard models using unobservable inputs.and estimates regarding non-performance risk.
Derivative Financial Instruments.Our derivatives are over-the-counter customized derivative transactions and are not exchange traded. We estimate the fair value of our derivativesthese instruments based on an income approach using industry-standardindustry standard valuation models, including Black-Scholes and Curran's Approximation.models. These models project future cash flows and discount the future amounts to a present value using market-based expectations for interest rates, foreign exchange rates, and commodity prices, taking into account the contractual terms of the derivative instruments.
FORD MOTOR COMPANY AND SUBSIDIARIES
NOTES TO THE FINANCIAL STATEMENTS
NOTE 4. FAIR VALUE MEASUREMENTS (Continued)
We include The discount rate used is the relevant interbank deposit rate (e.g., LIBOR) plus an adjustment for non-performance risk in the recognized measure of fair value of derivative instruments.risk. The adjustment reflects the full credit default swap ("CDS") spread applied to a net exposure, by counterparty.counterparty, considering the master netting agreements and posted collateral. We use our counterparty's CDS spread when we are in a net asset position and our own CDS spread when we are in a net liability position.
In certain cases, market data are not available and we use management judgment to develop assumptions, which are usedincluding the use of broker quotes, or use models (e.g., Black Scholes) to determine fair value. This includes situations where there is illiquidity for a particular currency or commodity or for longer-dated instruments. For longer-dated instruments
Ford Credit's two Ford Upgrade Exchange Linked ("FUEL") notes securitization transactions have derivative features. These features include a mandatory exchange to Ford Credit unsecured notes when Ford Credit's senior unsecured debt receives two investment grade credit ratings among Fitch, Moody's and S&P, and a make-whole provision. We estimated the fair value of these features by comparing the market value of the FUEL notes to the value of a hypothetical debt instrument without these features.
Finance Receivables. We estimate the fair value of finance receivables based on an income approach using internal valuation models. These models project future cash flows of financing contracts based on scheduled contract payments (including principal and interest). The projected cash flows are discounted to a present value based on assumptions regarding credit losses, pre-payment speed, and the discount rate. Our assumptions regarding pre-payment speed and credit losses are based on historical performance.
Debt. We estimate the fair value of debt using quoted market prices or current market rates for similar debt with approximately the same remaining maturities, where observable interest ratespossible. Where market prices or foreign exchangecurrent market rates are not available, we estimate fair value using discounted cash flow models. These models project future cash flows and discount the future amounts to a present value using market-based expectations for all periods through maturity, we holdinterest rates, our own credit risk and the last available data point constant through maturity.contractual terms of the debt instruments. For certain commodity contracts, observable market data may be limited and, in those cases,short term debt issuances with an original maturity date of one year or less, we generally survey brokers and use the averageassume that book value is a reasonable approximation of the surveyed prices in estimatingdebt's fair value. For asset-backed debt issued in securitization interest rate swaps, we use management judgment in estimating timing of cash flows which may varytransactions, the principal payments are based on actual repayments of securitized contracts.
Retained Interest in Securitized Assets. Ford Credit estimatesprojected payments for specific assets securing the fair value of retained interests using internal valuation models, market inputs, and its own assumptions in estimating cash flows from the sales of retail receivables.underlying debt considering historical pre-payment speeds.
Pension Assets. Pension assets are recorded at fair value, and include fixed income and equity securities, as well as alternative investments. Fixed income and equity securities may each be combined into commingled fund investments. Commingled funds are valued to reflect the Company's interest in the fund based on the reported year-end net asset value. Alternative investments include investments in private equity and hedge funds, and are valued based on year-end reported net asset value, with adjustments as appropriate for lagged reporting of 1 – 3 months. For pension assets, the balance sheet includes the funded status of the benefit plans, which represents the difference between the benefit obligations and fair value of plan assets. Refer to Note 18 for additional information, including the input hierarchy and Level 3 reconciliation.
Valuation methodologies for debt and finance receivables, for which fair value is measured for disclosure only, can be found in Note 19 and 7, respectively.
FORD MOTOR COMPANY AND SUBSIDIARIES
NOTES TO THE FINANCIAL STATEMENTS
NOTE 4. FAIR VALUE MEASUREMENTS (Continued)
Input Hierarchy of Items Measured at Fair Value on a Recurring Basis
The following tables summarizecategorize the fair values by input hierarchy of items measured at fair value on a recurring basis on our balance sheet for the years endedat December 31 (in millions):
| | | | | | | 2011 |
| | | | | | | | | | | | | | Level 1 (a) | | Level 2 (a) | | Level 3 | | Total |
| Automotive Sector | | | | | | | | | | | | | | | | | | | |
| Assets | | | | | | | | | | | | | | | | | | | |
Cash equivalents – financial instruments (a) | | | | | | | | | | | | | |
| Cash equivalents – financial instruments (b) | | | | | | | | |
U.S. government | | $ | 30 | | | $ | — | | | $ | — | | | $ | 30 | | $ | — |
| | $ | — |
| | $ | — |
| | $ | — |
|
Government-sponsored enterprises | | | — | | | | 949 | | | | — | | | | 949 | | |
| Government – non-U.S. | | | — | | | | 238 | | | | — | | | | 238 | | |
| U.S. government-sponsored enterprises | | — |
| | 319 |
| | — |
| | 319 |
|
| Non-U.S. government | | — |
| | 168 |
| | — |
| | 168 |
|
| Non-U.S. government agencies (c) | | — |
| | 820 |
| | — |
| | 820 |
|
Corporate debt | | | — | | | | 2,557 | | | | — | | | | 2,557 | | — |
| | 2 |
| | — |
| | 2 |
|
| Total cash equivalents – financial instruments | | | 30 | | | | 3,744 | | | | — | | | | 3,774 | | — |
| | 1,309 |
| | — |
| | 1,309 |
|
| Marketable securities (b) | | | | | | | | | | | | | | | | | |
| Marketable securities (d) | | |
| | |
| | |
| | |
|
U.S. government | | | 9,130 | | | | — | | | | — | | | | 9,130 | | 2,960 |
| | — |
| | — |
| | 2,960 |
|
Government-sponsored enterprises | | | — | | | | 2,408 | | | | — | | | | 2,408 | | |
| U.S. government-sponsored enterprises | | — |
| | 4,852 |
| | — |
| | 4,852 |
|
| Non-U.S. government agencies (c) | | — |
| | 4,558 |
| | — |
| | 4,558 |
|
Corporate debt | | | — | | | | 414 | | | | 8 | | | | 422 | | — |
| | 1,631 |
| | — |
| | 1,631 |
|
Mortgage-backed and other asset-backed | | | — | | | | 191 | | | | 17 | | | | 208 | | — |
| | 38 |
| | — |
| | 38 |
|
Equity | | | 477 | | | | — | | | | — | | | | 477 | | |
| Government – non-U.S. | | | — | | | | 977 | | | | — | | | | 977 | | |
Other liquid investments (c) | | | — | | | | 901 | | | | — | | | | 901 | | |
| Equities | | 129 |
| | — |
| | — |
| | 129 |
|
| Non-U.S. government | | — |
| | 598 |
| | — |
| | 598 |
|
| Other liquid investments (e) | | — |
| | 17 |
| | — |
| | 17 |
|
Total marketable securities | | | 9,607 | | | | 4,891 | | | | 25 | | | | 14,523 | | 3,089 |
| | 11,694 |
| | — |
| | 14,783 |
|
Derivative financial instruments | | | — | | | | 67 | | | | 9 | | | | 76 | | |
| | |
| | |
| | |
|
| Foreign exchange contracts | | — |
| | 198 |
| | 14 |
| | 212 |
|
| Commodity contracts | | — |
| | 1 |
| | 1 |
| | 2 |
|
| Other – warrants | | — |
| | — |
| | 4 |
| | 4 |
|
| Total derivative financial instruments (f) | | — |
| | 199 |
| | 19 |
| | 218 |
|
Total assets at fair value | | $ | 9,637 | | | $ | 8,702 | | | $ | 34 | | | $ | 18,373 | | $ | 3,089 |
| | $ | 13,202 |
| | $ | 19 |
| | $ | 16,310 |
|
| Liabilities | | | | | | | | | | | | | | | | | |
| | |
| | |
| | |
|
Derivative financial instruments | | $ | — | | | $ | 154 | | | $ | — | | | $ | 154 | | |
| | |
| | |
| | |
|
| Foreign exchange contracts | | $ | — |
| | $ | 442 |
| | $ | 6 |
| | $ | 448 |
|
| Commodity contracts | | — |
| | 289 |
| | 83 |
| | 372 |
|
| Total derivative financial instruments (f) | | — |
| | 731 |
| | 89 |
| | 820 |
|
Total liabilities at fair value | | $ | — | | | $ | 154 | | | $ | — | | | $ | 154 | | $ | — |
| | $ | 731 |
| | $ | 89 |
| | $ | 820 |
|
| | | | | | | | | | | | | | | | | | |
| Financial Services Sector | | | | | | | | | | | | | | | | | |
| Assets | | | | | | | | | | | | | | | | | |
| Cash equivalents – financial instruments (a) | | | | | | | | | | | | | | | | | |
U.S. government | | $ | 75 | | | $ | — | | | $ | — | | | $ | 75 | | |
Government-sponsored enterprises | | | — | | | | 400 | | | | — | | | | 400 | | |
Corporate debt | | | — | | | | 75 | | | | — | | | | 75 | | |
| Government – non-U.S. | | | — | | | | 29 | | | | — | | | | 29 | | |
Total cash equivalents – financial instruments | | | 75 | | | | 504 | | | | — | | | | 579 | | |
| Marketable securities | | | | | | | | | | | | | | | | | |
U.S. government | | | 5,256 | | | | — | | | | — | | | | 5,256 | | |
Government-sponsored enterprises | | | — | | | | 1,098 | | | | — | | | | 1,098 | | |
Corporate debt | | | — | | | | 159 | | | | 4 | | | | 163 | | |
Mortgage-backed | | | — | | | | 237 | | | | — | | | | 237 | | |
| Government – non-U.S. | | | — | | | | 65 | | | | — | | | | 65 | | |
Other liquid investments (c) | | | — | | | | 45 | | | | — | | | | 45 | | |
Total marketable securities | | | 5,256 | | | | 1,604 | | | | 4 | | | | 6,864 | | |
Derivative financial instruments | | | — | | | | 1,459 | | | | 420 | | | | 1,879 | | |
Retained interest in securitized assets | | | — | | | | — | | | | 26 | | | | 26 | | |
Total assets at fair value | | $ | 5,331 | | | $ | 3,567 | | | $ | 450 | | | $ | 9,348 | | |
| Liabilities | | | | | | | | | | | | | | | | | |
Derivative financial instruments | | $ | — | | | $ | 599 | | | $ | 575 | | | $ | 1,174 | | |
Total liabilities at fair value | | $ | — | | | $ | 599 | | | $ | 575 | | | $ | 1,174 | | |
__________
| |
| (a) | There were no transfers between Level 1 and 2 during the year. |
| |
| (b) | "Cash equivalents –- financial instruments" in this table excludes time deposits, certificates of deposit, money market accounts, and other cash equivalents reported at par value totaling $4.6 billion as of December 31, 2011 for the Automotive sector. In addition to these cash equivalents, our Automotive sector also had cash on hand totaling $2.1 billion as of December 31, 2011. |
| |
| (c) | Includes notes issued by Non-U.S. government agencies, as well as notes issued by supranational institutions. |
| |
| (d) | Excludes an investment in Ford Credit debt securities held by the Automotive sector with a carrying value of $201 million and an estimated fair value of $201 million as of December 31, 2011; see Note 18 for additional detail. |
| |
| (e) | "Other liquid investments" in this table includes certificates of deposit and time deposits subject to changes in value. |
| |
| (f) | See Note 25 for additional information regarding derivative financial instruments. |
FORD MOTOR COMPANY AND SUBSIDIARIES
NOTES TO THE FINANCIAL STATEMENTS
NOTE 4. FAIR VALUE MEASUREMENTS (Continued)
|
| | | | | | | | | | | | | | | |
| | 2011 |
| | Level 1 (a) | | Level 2 (a) | | Level 3 | | Total |
| Financial Services Sector | | | | | | | |
| Assets | | | | | | | |
| Cash equivalents – financial instruments (b) | | | | | | | |
| U.S. government | $ | 1 |
| | $ | — |
| | $ | — |
| | $ | 1 |
|
| U.S. government-sponsored enterprises | — |
| | 75 |
| | — |
| | 75 |
|
| Non-U.S. government | — |
| | 15 |
| | — |
| | 15 |
|
| Non-U.S. government agencies (c) | — |
| | 150 |
| | — |
| | 150 |
|
| Corporate debt | — |
| | — |
| | — |
| | — |
|
| Mortgage-backed and other asset-backed | — |
| | — |
| | — |
| | — |
|
| Total cash equivalents – financial instruments | 1 |
| | 240 |
| | — |
| | 241 |
|
| Marketable securities | |
| | |
| | |
| | |
|
| U.S. government | 619 |
| | — |
| | — |
| | 619 |
|
| U.S. government-sponsored enterprises | — |
| | 713 |
| | — |
| | 713 |
|
| Non-U.S. government agencies (c) | — |
| | 778 |
| | — |
| | 778 |
|
| Corporate debt | — |
| | 1,186 |
| | — |
| | 1,186 |
|
| Mortgage-backed and other asset-backed | — |
| | 88 |
| | — |
| | 88 |
|
| Non-U.S. government | — |
| | 444 |
| | — |
| | 444 |
|
| Other liquid investments (d) | — |
| | 7 |
| | — |
| | 7 |
|
| Total marketable securities | 619 |
| | 3,216 |
| | — |
| | 3,835 |
|
| Derivative financial instruments | |
| | |
| | |
| | |
|
| Interest rate contracts | — |
| | 1,196 |
| | — |
| | 1,196 |
|
| Foreign exchange contracts | — |
| | 30 |
| | — |
| | 30 |
|
| Cross currency interest rate swap contracts | — |
| | 12 |
| | — |
| | 12 |
|
| Other (e) | — |
| | — |
| | 137 |
| | 137 |
|
| Total derivative financial instruments (f) | — |
| | 1,238 |
| | 137 |
| | 1,375 |
|
| Total assets at fair value | $ | 620 |
| | $ | 4,694 |
| | $ | 137 |
| | $ | 5,451 |
|
| Liabilities | |
| | |
| | |
| | |
|
| Derivative financial instruments | |
| | |
| | |
| | |
|
| Interest rate contracts | $ | — |
| | $ | 237 |
| | $ | — |
| | $ | 237 |
|
| Foreign exchange contracts | — |
| | 50 |
| | — |
| | 50 |
|
| Cross-currency interest rate swap contracts | — |
| | 12 |
| | — |
| | 12 |
|
| Total derivative financial instruments (f) | — |
| | 299 |
| | — |
| | 299 |
|
| Total liabilities at fair value | $ | — |
| | $ | 299 |
| | $ | — |
| | $ | 299 |
|
__________
| |
| (a) | There were no transfers between Level 1 and 2 during the year. |
| |
| (b) | "Cash equivalents - financial instruments" in this table excludes time deposits, certificates of deposit, money market accounts, and other cash equivalents reported at par value on our balance sheet totaling $6 billion2.3 billion and $7.7 billion as of December 31, 20092011 for Automotive andthe Financial Services sectors, respectively, which approximates fair value.sector. In addition to these cash equivalents, weour Financial Services sector also had cash on hand totaling $4.2$3 billion and $2.8 billion as of December 31, 20092011. |
| |
| (c) | Includes notes issued by Non-U.S. government agencies, as well as notes issues by supranational institutions. |
| |
| (d) | "Other liquid investments" in this table includes certificates of deposit and time deposits subject to changes in value. |
| |
| (e) | "Other" in this table represents derivative features included in the FUEL notes. |
| |
| (f) | See Note 25 for Automotiveadditional information regarding derivative financial instruments. |
FORD MOTOR COMPANY AND SUBSIDIARIES
NOTES TO THE FINANCIAL STATEMENTS
NOTE 4. FAIR VALUE MEASUREMENTS (Continued)
|
| | | | | | | | | | | | | | | |
| | 2010 |
| | Level 1 (a) | | Level 2 (a) | | Level 3 | | Total |
| Automotive Sector | | | | | | | |
| Assets | | | | | | | |
| Cash equivalents – financial instruments (b) | | | | | | | |
| U.S. government | $ | — |
| | $ | — |
| | $ | — |
| | $ | — |
|
| U.S. government-sponsored enterprises | — |
| | 224 |
| | — |
| | 224 |
|
| Non-U.S. government | — |
| | 133 |
| | — |
| | 133 |
|
| Non-U.S. government agencies (c) | — |
| | 1,619 |
| | — |
| | 1,619 |
|
| Corporate debt | — |
| | 199 |
| | — |
| | 199 |
|
| Total cash equivalents – financial instruments | — |
| | 2,175 |
| | — |
| | 2,175 |
|
| Marketable securities (d) | |
| | |
| | |
| | |
|
| U.S. government | 2,718 |
| | — |
| | — |
| | 2,718 |
|
| U.S. government-sponsored enterprises | — |
| | 4,809 |
| | — |
| | 4,809 |
|
| Non-U.S. government agencies (c) | — |
| | 3,215 |
| | 1 |
| | 3,216 |
|
| Corporate debt | — |
| | 517 |
| | — |
| | 517 |
|
| Mortgage-backed and other asset-backed | — |
| | 20 |
| | — |
| | 20 |
|
| Equities | 203 |
| | — |
| | — |
| | 203 |
|
| Non-U.S. government | — |
| | 818 |
| | 1 |
| | 819 |
|
| Other liquid investments (e) | — |
| | 1,704 |
| | — |
| | 1,704 |
|
| Total marketable securities | 2,921 |
| | 11,083 |
| | 2 |
| | 14,006 |
|
| Derivative financial instruments | |
| | |
| | |
| | |
|
| Foreign exchange contracts | — |
| | 58 |
| | — |
| | 58 |
|
| Commodity contracts | — |
| | 36 |
| | 33 |
| | 69 |
|
| Other – warrants | — |
| | — |
| | 5 |
| | 5 |
|
| Total derivative financial instruments (f) | — |
| | 94 |
| | 38 |
| | 132 |
|
| Total assets at fair value | $ | 2,921 |
| | $ | 13,352 |
| | $ | 40 |
| | $ | 16,313 |
|
| Liabilities | |
| | |
| | |
| | |
|
| Derivative financial instruments | |
| | |
| | |
| | |
|
| Foreign exchange contracts | $ | — |
| | $ | 93 |
| | $ | — |
| | $ | 93 |
|
| Commodity contracts | — |
| | 6 |
| | — |
| | 6 |
|
| Total derivative financial instruments (f) | — |
| | 99 |
| | — |
| | 99 |
|
| Total liabilities at fair value | $ | — |
| | $ | 99 |
| | $ | — |
| | $ | 99 |
|
__________
| |
| (a) | There were no transfers between Level 1 and Financial Services sectors, respectively.2 during the year. |
| |
| (b) | "Cash equivalents - financial instruments" in this table excludes time deposits, certificates of deposit, money market accounts, and other cash equivalents reported at par value totaling $2.2 billion as of December 31, 2010 for the Automotive sector. In addition to these cash equivalents, our Automotive sector also had cash on hand totaling $1.9 billion as of December 31, 2010. |
| |
| (c) | Includes notes issued by Non-U.S. government agencies, as well as notes issued by supranational institutions. |
| |
| (d) | Excludes an investment in Ford Credit debt securities held by the AutomotiveAutomotive sector with a carrying value of $646$201 million and an estimated fair value of $656$203 million as of December 31, 2009;2010; see Note 118 for additional detail. |
| |
(c)(e) | Includes"Other liquid investments" in this table includes certificates of deposit and time deposits with a maturity of more than 90 days at date of purchase.subject to changes in value. |
| |
| (f) | See Note 25 for additional information regarding derivative financial instruments. |
FORD MOTOR COMPANY AND SUBSIDIARIES
NOTES TO THE FINANCIAL STATEMENTS
NOTE 4. FAIR VALUE MEASUREMENTS (Continued)
| | | | | |
| | | | | | | | | | | | | | | | | | | | | | |
| Automotive Sector | | | | | | | | | | | | | |
| | | 2010 |
| | | Level 1 (a) | | Level 2 (a) | | Level 3 | | Total |
| Financial Services Sector | | | | | | | | |
| Assets | | | | | | | | | | | | | | | | | | | |
| Cash equivalents – financial instruments (a) | | | | | | | | | | | | | |
| Cash equivalents – financial instruments (b) | | | | | | | | |
U.S. government | | $ | 117 | | | $ | — | | | $ | — | | | $ | 117 | | $ | 9 |
| | $ | — |
| | $ | — |
| | $ | 9 |
|
Government-sponsored enterprises | | | — | | | | 386 | | | | — | | | | 386 | | |
Government – non-U.S. | | | — | | | | 82 | | | | — | | | | 82 | | |
| U.S. government-sponsored enterprises | | — |
| | 150 |
| | — |
| | 150 |
|
| Non-U.S. government | | — |
| | 323 |
| | — |
| | 323 |
|
| Non-U.S. government agencies (c) | | — |
| | 100 |
| | — |
| | 100 |
|
Corporate debt | | | — | | | | 992 | | | | — | | | | 992 | | — |
| | 200 |
| | — |
| | 200 |
|
| Total cash equivalents – financial instruments | | | 117 | | | | 1,460 | | | | — | | | | 1,577 | | 9 |
| | 773 |
| | — |
| | 782 |
|
| Marketable securities (b) | | | | | | | | | | | | | | | | | |
| Marketable securities | | |
| | |
| | |
| | |
|
U.S. government | | | 3,347 | | | | — | | | | — | | | | 3,347 | | 1,671 |
| | — |
| | — |
| | 1,671 |
|
Government-sponsored enterprises | | | — | | | | 1,468 | | | | — | | | | 1,468 | | |
| U.S. government-sponsored enterprises | | — |
| | 2,905 |
| | — |
| | 2,905 |
|
| Non-U.S. government agencies (c) | | — |
| | 821 |
| | 1 |
| | 822 |
|
Corporate debt | | | — | | | | 1,103 | | | | 26 | | | | 1,129 | | — |
| | 732 |
| | — |
| | 732 |
|
Mortgage-backed and other asset-backed | | | — | | | | 888 | | | | 123 | | | | 1,011 | | — |
| | 177 |
| | — |
| | 177 |
|
Equity | | | 1,590 | | | | 16 | | | | 1 | | | | 1,607 | | |
Government – non-U.S. | | | — | | | | 37 | | | | — | | | | 37 | | |
Other liquid investments | | | 1 | | | | 204 | | | | — | | | | 205 | | |
| Non-U.S. government | | — |
| | 364 |
| | — |
| | 364 |
|
| Other liquid investments (d) | | — |
| | 88 |
| | — |
| | 88 |
|
Total marketable securities | | | 4,938 | | | | 3,716 | | | | 150 | | | | 8,804 | | 1,671 |
| | 5,087 |
| | 1 |
| | 6,759 |
|
Derivative financial instruments | | | — | | | | 698 | | | | 6 | | | | 704 | | |
| | |
| | |
| | |
|
| Interest rate contracts | | — |
| | 1,035 |
| | 177 |
| | 1,212 |
|
| Foreign exchange contracts | | — |
| | 24 |
| | — |
| | 24 |
|
| Cross currency interest rate swap contracts | | — |
| | 25 |
| | — |
| | 25 |
|
| Total derivative financial instruments (e) | | — |
| | 1,084 |
| | 177 |
| | 1,261 |
|
Total assets at fair value | | $ | 5,055 | | | $ | 5,874 | | | $ | 156 | | | $ | 11,085 | | $ | 1,680 |
| | $ | 6,944 |
| | $ | 178 |
| | $ | 8,802 |
|
| Liabilities | | | | | | | | | | | | | | | | | |
| | |
| | |
| | |
|
Derivative financial instruments | | $ | — | | | $ | 628 | | | $ | 38 | | | $ | 666 | | |
| | |
| | |
| | |
|
| Interest rate contracts | | $ | — |
| | $ | 134 |
| | $ | 195 |
| | $ | 329 |
|
| Foreign exchange contracts | | — |
| | 73 |
| | — |
| | 73 |
|
| Cross-currency interest rate swap contracts | | — |
| | 118 |
| | 71 |
| | 189 |
|
| Total derivative financial instruments (e) | | — |
| | 325 |
| | 266 |
| | 591 |
|
Total liabilities at fair value | | $ | — | | | $ | 628 | | | $ | 38 | | | $ | 666 | | $ | — |
| | $ | 325 |
| | $ | 266 |
| | $ | 591 |
|
| | | | | | | | | | | | | | | | | | |
| Financial Services Sector | | | | | | | | | | | | | | | | | |
| Assets | | | | | | | | | | | | | | | | | |
| Cash equivalents – financial instruments (a) | | | | | | | | | | | | | | | | | |
U.S. government | | $ | 655 | | | $ | — | | | $ | — | | | $ | 655 | | |
Government-sponsored enterprises | | | — | | | | 4,221 | | | | — | | | | 4,221 | | |
Corporate debt. | | | — | | | | 167 | | | | — | | | | 167 | | |
Total cash equivalents – financial instruments | | | 655 | | | | 4,388 | | | | — | | | | 5,043 | | |
| Marketable securities | | | | | | | | | | | | | | | | | |
U.S. government | | | 6,177 | | | | — | | | | — | | | | 6,177 | | |
Government-sponsored enterprises | | | — | | | | 1,924 | | | | — | | | | 1,924 | | |
Corporate debt | | | — | | | | 111 | | | | 5 | | | | 116 | | |
Mortgage-backed | | | — | | | | 275 | | | | — | | | | 275 | | |
Equity | | | 59 | | | | — | | | | — | | | | 59 | | |
| Government – non-U.S. | | | — | | | | 12 | | | | — | | | | 12 | | |
Other liquid investments | | | — | | | | 44 | | | | — | | | | 44 | | |
Total marketable securities | | | 6,236 | | | | 2,366 | | | | 5 | | | | 8,607 | | |
Derivative financial instruments | | | — | | | | 2,900 | | | | 916 | | | | 3,816 | | |
Retained interest in securitized assets | | | — | | | | — | | | | 92 | | | | 92 | | |
Total assets at fair value | | $ | 6,891 | | | $ | 9,654 | | | $ | 1,013 | | | $ | 17,558 | | |
| Liabilities | | | | | | | | | | | | | | | | | |
Derivative financial instruments | | $ | — | | | $ | 1,167 | | | $ | 990 | | | $ | 2,157 | | |
Total liabilities at fair value | | $ | — | | | $ | 1,167 | | | $ | 990 | | | $ | 2,157 | | |
__________
| |
| (a) | There were no transfers between Level 1 and 2 during the year. |
| |
| (b) | "Cash equivalents –- financial instruments"instruments" in this table excludes time deposits, certificates of deposit, money market accounts, and other cash equivalents reported at par value on our balance sheet totaling $5.7 billion1.9 billion and $3.2 billion as of December 31, 20020108 for Automotive andthe Financial Services sectors, respectively, which approximates fair value.sector. In addition to these cash equivalents, weour Financial Services sector also had cash on hand totaling $2.9$2 billion and $7.5 billion as of December 31, 20020108 for Automotive and Financial Services sectors, respectively. |
(b) | Excludes an investment in Ford Credit debt securities held by the Automotive sector with a carrying value of $492 million and an estimated fair value of $437 million. See Note 1 for additional detail..
|
| |
| (c) | Includes notes issued by Non-U.S. government agencies, as well as notes issues by supranational institutions. |
| |
| (d) | "Other liquid investments" in this table includes certificates of deposit and time deposits subject to changes in value. |
| |
| (e) | See Note 25 for additional information regarding derivative financial instruments. |
FORD MOTOR COMPANY AND SUBSIDIARIES
NOTES TO THE FINANCIAL STATEMENTS
NOTE 4. FAIR VALUE MEASUREMENTS (Continued)
Reconciliation of Changes in Level 3 Balances
The following tables summarize the changes in Level 3 items measured at fair value on a recurring basis on our balance sheet for the years ended December 31 (in millions):
| | | | |
| | | Fair Value at December 31, 2008 | | | Total Realized/ Unrealized Gains/ (Losses) | | | Net Purchases/ (Settlements) (a) | | | Net Transfers Into/(Out of) Level 3 | | | Fair Value at December 31, 2009 | | | Change In Unrealized Gains/ (Losses) on Instruments Still Held (b) | |
| Automotive Sector | | | | | | | | | | | | | | | | | | |
Marketable securities (c) | | $ | 150 | | | $ | (19 | ) | | $ | (72 | ) | | $ | (34 | ) | | $ | 25 | | | $ | 2 | |
Derivative financial instruments, net | | | (32 | ) | | | (5 | ) | | | 46 | | | | — | | | | 9 | | | | 5 | |
Total Level 3 fair value | | $ | 118 | | | $ | (24 | ) | | $ | (26 | ) | | $ | (34 | ) | | $ | 34 | | | $ | 7 | |
| | | | | | | | | | | | | | | | | | | | | | | | | |
| Financial Services Sector | | | | | | | | | | | | | | | | | | | | | | | | |
Marketable securities | | $ | 5 | | | $ | (1 | ) | | $ | — | | | $ | — | | | $ | 4 | | | $ | (1 | ) |
Derivative financial instruments, net | | | (74 | ) | | | (87 | ) | | | 6 | | | | — | | | | (155 | ) | | | (70 | ) |
Retained interest in securitized assets | | | 92 | | | | 9 | | | | (75 | ) | | | — | | | | 26 | | | | 1 | |
Total Level 3 fair value | | $ | 23 | | | $ | (79 | ) | | $ | (69 | ) | | $ | — | | | $ | (125 | ) | | $ | (70 | ) |
|
| | | | | | | | | | | | | | | | | | | | | | | | | | | |
| | 2011 |
| | Marketable Securities | | | | |
| | Non-U.S. Government Agencies | | Corporate Debt | | Mortgage- Backed and Other Asset- Backed | | Non-U.S. Government | | Total Marketable Securities | | Derivative Financial Instruments, Net | | Total Level 3 Fair Value |
| Automotive Sector | | | | | | | | | | | | | |
| Beginning balance | $ | 1 |
| | $ | — |
| | $ | — |
| | $ | 1 |
| | $ | 2 |
| | $ | 38 |
| | $ | 40 |
|
| Realized/unrealized gains/(losses) | | | | | | | | | |
| | | | |
|
| Cost of sales | — |
| | — |
| | — |
| | — |
| | — |
| | (99 | ) | | (99 | ) |
| Interest income and other non-operating income/(expense), net | — |
| | — |
| | — |
| | (1 | ) | | (1 | ) | | (1 | ) | | (2 | ) |
| Other comprehensive income/(loss) (a) | — |
| | — |
| | — |
| | — |
| | — |
| | — |
| | — |
|
| Total realized/unrealized gains/(losses) | — |
| | — |
| | — |
| | (1 | ) | | (1 | ) | | (100 | ) | | (101 | ) |
| Purchases, issues, sales, and settlements | |
| | |
| | |
| | |
| | |
| | |
| | |
|
| Purchases | — |
| | 5 |
| | 1 |
| | 1 |
| | 7 |
| | — |
| | 7 |
|
| Issues | — |
| | — |
| | — |
| | — |
| | — |
| | — |
| | — |
|
| Sales | — |
| | — |
| | — |
| | (1 | ) | | (1 | ) | | — |
| | (1 | ) |
| Settlements | — |
| | — |
| | — |
| | — |
| | — |
| | (14 | ) | | (14 | ) |
| Total purchases, issues, sales, and settlements | — |
| | 5 |
| | 1 |
| | — |
| | 6 |
| | (14 | ) | | (8 | ) |
| Transfers into Level 3 (b) | — |
| | — |
| | — |
| | — |
| | — |
| | — |
| | — |
|
| Transfers out of Level 3 (b) | (1 | ) | | (5 | ) | | (1 | ) | | — |
| | (7 | ) | | 6 |
| | (1 | ) |
| Ending balance | $ | — |
| | $ | — |
| | $ | — |
| | $ | — |
| | $ | — |
| | $ | (70 | ) | | $ | (70 | ) |
| Unrealized gains/ (losses) on instruments still held | $ | — |
| | $ | — |
| | $ | — |
| | $ | — |
| | $ | — |
| | $ | (69 | ) | | $ | (69 | ) |
| | | | | | | | | | | | | | |
| Financial Services Sector | |
| | |
| | |
| | |
| | |
| | |
| | |
|
| Beginning balance | $ | 1 |
| | $ | — |
| | $ | — |
| | $ | — |
| | $ | 1 |
| | $ | (89 | ) | | $ | (88 | ) |
| Realized/unrealized gains/(losses) | | | | | | | | | |
| | | | |
|
| Other income/(loss), net | — |
| | — |
| | — |
| | — |
| | — |
| | 382 |
| | 382 |
|
| Other comprehensive income/(loss) (a) | — |
| | — |
| | — |
| | — |
| | — |
| | (1 | ) | | (1 | ) |
| Interest income/(expense) (c) | — |
| | — |
| | — |
| | — |
| | — |
| | 90 |
| | 90 |
|
| Total realized/unrealized gains/(losses) | — |
| | — |
| | — |
| | — |
| | — |
| | 471 |
| | 471 |
|
| Purchases, issues, sales, and settlements | |
| | |
| | |
| | |
| | |
| | |
| | |
|
| Purchases | — |
| | 5 |
| | — |
| | — |
| | 5 |
| | — |
| | 5 |
|
| Issues (d) | — |
| | — |
| | — |
| | — |
| | — |
| | 73 |
| | 73 |
|
| Sales | — |
| | — |
| | — |
| | — |
| | — |
| | — |
| | — |
|
| Settlements | — |
| | — |
| | — |
| | — |
| | — |
| | 114 |
| | 114 |
|
| Total purchases, issues, sales, and settlements | — |
| | 5 |
| | — |
| | — |
| | 5 |
| | 187 |
| | 192 |
|
| Transfers into Level 3 (b) | — |
| | — |
| | — |
| | — |
| | — |
| | — |
| | — |
|
| Transfers out of Level 3 (b) | (1 | ) | | (5 | ) | | — |
| | — |
| | (6 | ) | | (432 | ) | | (438 | ) |
| Ending balance | $ | — |
| | $ | — |
| | $ | — |
| | $ | — |
| | $ | — |
| | $ | 137 |
| | $ | 137 |
|
| Unrealized gains/ (losses) on instruments still held | $ | — |
| | $ | — |
| | $ | — |
| | $ | — |
| | $ | — |
| | $ | 65 |
| | $ | 65 |
|
__________
| |
| (a) | Includes option premiums (paid)/received"Other comprehensive income/(loss)" represents foreign currency translation on options traded during the quarter.derivative asset and liability balances held by non-U.S. dollar foreign affiliates. |
| |
| (b) | For those assetsRepresents transfers due to the increase in availability of observable data for $13 million of marketable securities as a result of greater market activity for these securities and liabilities still heldtransfers for $6 million due to shorter duration of Automotive Sector derivative financial instruments. The transfer of $432 million Financial Services derivative financial instruments was primarily the result of management's validation of the observable data and determination that certain unobservable inputs had an insignificant impact on the valuation of these instruments. The company's policy is to recognize transfers in and transfers out at the value at the end of the reporting date.period. |
| |
| (c) | "Net Purchases/(Settlements)" for Level 3 Automotive sector marketable securities includes assets totaling $15 million transferred as part of the settlement of our UAW retiree health care obligation detailedRecorded in Note 18.Interest expense.
|
| | | | |
| | | Fair Value at January 1, 2008 | | | Total Realized/ Unrealized Gains/ (Losses) | | | Net Purchases/ (Settlements) (a) | | | Net Transfers Into/(Out of) Level 3 | | | Fair Value at December 31, 2008 | | | Change In Unrealized Gains/ (Losses) on Instruments Still Held (b) | |
| Automotive Sector | | | | | | | | | | | | | | | | | | |
Marketable securities | | $ | 201 | | | $ | (28 | ) | | $ | 24 | | | $ | (47 | ) | | $ | 150 | | | $ | (24 | ) |
Derivative financial instruments, net | | | 257 | | | | (124 | ) | | | (83 | ) | | | (82 | ) | | | (32 | ) | | | (63 | ) |
Total Level 3 fair value | | $ | 458 | | | $ | (152 | ) | | $ | (59 | ) | | $ | (129 | ) | | $ | 118 | | | $ | (87 | ) |
| | | | | | | | | | | | | | | | | | | | | | | | | |
| Financial Services Sector | | | | | | | | | | | | | | | | | | | | | | | | |
Marketable securities | | $ | — | | | $ | — | | | $ | 5 | | | $ | — | | | $ | 5 | | | $ | — | |
Derivative financial instruments, net | | | (2 | ) | | | 8 | | | | (5 | ) | | | (75 | ) | | | (74 | ) | | | (41 | ) |
Retained interest in securitized assets | | | 653 | | | | 49 | | | | (610 | ) | | | — | | | | 92 | | | | (58 | ) |
Total Level 3 fair value | | $ | 651 | | | $ | 57 | | | $ | (610 | ) | | $ | (75 | ) | | $ | 23 | | | $ | (99 | ) |
| |
(a)(d) | Includes option premiums (paid)/received on options traded duringReflects derivative features included in the quarter. |
(b) | For those assets and liabilities still held at reporting date.
FUEL notes. |
FORD MOTOR COMPANY AND SUBSIDIARIES
NOTES TO THE FINANCIAL STATEMENTS
NOTE 4. FAIR VALUE MEASUREMENTS (Continued)
The following tables summarize the realized/unrealized gains/(losses) on Level 3 items by financial statement position for the period ending December 31 (in millions): |
| | | | | | | | | | | | | | | | | | | | | | | | | | | | | | | |
| | 2010 |
| | Marketable Securities | | | | | | |
| | Non-U.S. Government Agencies | | Corporate Debt | | Mortgage-Backed and Other Asset- Backed | | Non-U.S. Government | | Total Marketable Securities | | Derivative Financial Instruments, Net | | Retained Interest in Securitized Assets | | Total Level 3 Fair Value |
| Automotive Sector | | | | | | | | | | | | | | | |
| Beginning balance | $ | — |
| | $ | 8 |
| | $ | 17 |
| | $ | — |
| | $ | 25 |
| | $ | 9 |
| | $ | — |
| | $ | 34 |
|
| Realized/unrealized gains/(losses) | | | | | | | | | |
| | | | |
| | |
|
| Cost of sales | — |
| | — |
| | — |
| | — |
| | — |
| | 39 |
| | — |
| | 39 |
|
| Interest income and other non-operating income/(expense), net | — |
| | — |
| | (1 | ) | | — |
| | (1 | ) | | 2 |
| | — |
| | 1 |
|
| Other comprehensive income/(loss) (a) | — |
| | — |
| | — |
| | — |
| | — |
| | — |
| | — |
| | — |
|
| Total realized/unrealized gains/(losses) | — |
| | — |
| | (1 | ) | | — |
| | (1 | ) | | 41 |
| | — |
| | 40 |
|
| Purchases, issues, sales, and settlements | |
| | |
| | |
| | |
| | |
| | |
| | |
| | |
|
| Purchases | 1 |
| | 13 |
| | — |
| | 1 |
| | 15 |
| | — |
| | — |
| | 15 |
|
| Issues | — |
| | — |
| | — |
| | — |
| | — |
| | — |
| | — |
| | — |
|
| Sales | — |
| | (11 | ) | | (16 | ) | | — |
| | (27 | ) | | — |
| | — |
| | (27 | ) |
| Settlements | — |
| | — |
| | — |
| | — |
| | — |
| | (12 | ) | | — |
| | (12 | ) |
| Total purchases, issues, sales, and settlements | 1 |
| | 2 |
| | (16 | ) | | 1 |
| | (12 | ) | | (12 | ) | | — |
| | (24 | ) |
| Transfers into Level 3 (b) | — |
| | — |
| | — |
| | — |
| | — |
| | — |
| | — |
| | — |
|
| Transfers out of Level 3 (b) | — |
| | (10 | ) | | — |
| | — |
| | (10 | ) | | — |
| | — |
| | (10 | ) |
| Ending balance | $ | 1 |
| | $ | — |
| | $ | — |
| | $ | 1 |
| | $ | 2 |
| | $ | 38 |
| | $ | — |
| | $ | 40 |
|
| Unrealized gains/ (losses) on instruments still held | $ | — |
| | $ | — |
| | $ | — |
| | $ | — |
| | $ | — |
| | $ | 29 |
| | $ | — |
| | $ | 29 |
|
| | | | | | | | | | | | | | | | |
| Financial Services Sector | |
| | |
| | |
| | |
| | |
| | |
| | |
| | |
|
| Beginning balance | $ | — |
| | $ | 4 |
| | $ | — |
| | $ | — |
| | $ | 4 |
| | $ | (155 | ) | | $ | 26 |
| | $ | (125 | ) |
| Realized/unrealized gains/(losses) | | | | | | | | | |
| | | | |
| | |
|
| Other income/(loss), net | — |
| | (4 | ) | | — |
| | — |
| | (4 | ) | | (91 | ) | | (3 | ) | | (98 | ) |
| Other comprehensive income/(loss) (a) | — |
| | — |
| | — |
| | — |
| | — |
| | (6 | ) | | 2 |
| | (4 | ) |
| Interest income/(expense) | — |
| | — |
| | — |
| | — |
| | — |
| | — |
| | — |
| | — |
|
| Total realized/unrealized gains/(losses) | — |
| | (4 | ) | | — |
| | — |
| | (4 | ) | | (97 | ) | | (1 | ) | | (102 | ) |
| Purchases, issues, sales, and settlements | |
| | |
| | |
| | |
| | |
| | |
| | |
| | |
|
| Purchases | 1 |
| | 10 |
| | — |
| | — |
| | 11 |
| | — |
| | — |
| | 11 |
|
| Issues | — |
| | — |
| | — |
| | — |
| | — |
| | — |
| | — |
| | — |
|
| Sales | — |
| | — |
| | — |
| | — |
| | — |
| | — |
| | — |
| | — |
|
| Settlements | — |
| | — |
| | — |
| | — |
| | — |
| | 164 |
| | (25 | ) | | 139 |
|
| Total purchases, issues, sales, and settlements | 1 |
| | 10 |
| | — |
| | — |
| | 11 |
| | 164 |
| | (25 | ) | | 150 |
|
| Transfers into Level 3 (b) | — |
| | — |
| | — |
| | — |
| | — |
| | — |
| | — |
| | — |
|
| Transfers out of Level 3 (b) | — |
| | (10 | ) | | — |
| | — |
| | (10 | ) | | (1 | ) | | — |
| | (11 | ) |
| Ending balance | $ | 1 |
| | $ | — |
| | $ | — |
| | $ | — |
| | $ | 1 |
| | $ | (89 | ) | | $ | — |
| | $ | (88 | ) |
| Unrealized gains/(losses) on instruments still held | $ | — |
| | $ | — |
| | $ | — |
| | $ | — |
| | $ | — |
| | $ | 64 |
| | $ | — |
| | $ | 64 |
|
__________
| | | | |
| | | | | | Automotive Interest Income and Other Non-Operating Income/ (Loss), Net | | | Financial Services Other Income/ (Loss), Net | | | Other Comprehensive Income/ (Loss) (a) | | | Total Realized/ Unrealized Gains/ (Losses) | |
| Automotive Sector | | | | | | | | | | | | | | | |
Marketable securities | | $ | — | | | $ | 1 | | | $ | — | | | $ | (20 | ) | | $ | (19 | ) |
Derivative financial instruments, net (b) | | | (7 | ) | | | 2 | | | | — | | | | — | | | | (5 | ) |
Total Automotive sector | | | (7 | ) | | | 3 | | | | — | | | | (20 | ) | | | (24 | ) |
| | | | | | | | | | | | | | | | | | | | | |
| Financial Services Sector | | | | | | | | | | | | | | | | | | | | |
Marketable securities | | | — | | | | — | | | | (1 | ) | | | — | | | | (1 | ) |
Derivative financial instruments, net (b) | | | — | | | | — | | | | (89 | ) | | | 2 | | | | (87 | ) |
Retained interest in securitized assets | | | — | | | | — | | | | 9 | | | | — | | | | 9 | |
Total Financial Services sector | | | — | | | | — | | | | (81 | ) | | | 2 | | | | (79 | ) |
| | | | | | | | | | | | | | | | | | | | | |
Total Company | | $ | (7 | ) | | $ | 3 | | | $ | (81 | ) | | $ | (18 | ) | | $ | (103 | ) |
| |
| (a) | "Other Comprehensive Income/(Loss)comprehensive income/(loss)" on marketable securities and derivative financial instruments reflectsrepresents foreign currency translation on derivative asset and liability balances held by non-U.S. dollar foreign affiliates. |
(b) | See Note 26 for detail on financial statement presentation by hedge designation. |
| | | | |
| | | | | | Automotive Interest Income and Other Non-Operating Income/ (Loss), Net | | | Financial Services Other Income/ (Loss), Net | | | Financial Services Interest Expense | | | Other Comprehensive Income/ (Loss) (a) | | | Total Realized/ Unrealized Gains/ (Losses) | |
| Automotive Sector | | | | | | | | | | | | | | | | | | |
Marketable securities | | $ | — | | | $ | (29 | ) | | $ | — | | | $ | — | | | $ | 1 | | | $ | (28 | ) |
Derivative financial instruments, net (b) | | | (119 | ) | | | (5 | ) | | | — | | | | — | | | | — | | | | (124 | ) |
Total Automotive sector | | | (119 | ) | | | (34 | ) | | | — | | | | — | | | | 1 | | | | (152 | ) |
| | | | | | | | | | | | | | | | | | | | | | | | | |
| Financial Services Sector | | | | | | | | | | | | | | | | | | | | | | | | |
Marketable securities | | | — | | | | — | | | | — | | | | — | | | | — | | | | — | |
Derivative financial instruments, net (b) | | | — | | | | — | | | | 23 | | | | 12 | | | | (27 | ) | | | 8 | |
Retained interest in securitized assets | | | — | | | | — | | | | 107 | | | | — | | | | (58 | ) | | | 49 | |
Total Financial Services sector | | | — | | | | — | | | | 130 | | | | 12 | | | | (85 | ) | | | 57 | |
| | | | | | | | | | | | | | | | | | | | | | | | | |
Total Company | | $ | (119 | ) | | $ | (34 | ) | | $ | 130 | | | $ | 12 | | | $ | (84 | ) | | $ | (95 | ) |
| |
(a) | "Other Comprehensive Income/(Loss)" on marketable securities and derivative financial instruments reflects foreign currency translation on non-U.S. dollar foreign affiliates. |
| (b) | See Note 26Represents transfers due to the increase in availability of observable data for detail on$20 million of marketable securities as a result of greater market activity for these securities and $1 million due to shorter duration of derivative financial statement presentation by hedge designation.instruments. The company's policy is to recognize transfers in and transfers out at the value at the end of the reporting period. |
FORD MOTOR COMPANY AND SUBSIDIARIES
NOTES TO THE FINANCIAL STATEMENTS
NOTE 4. FAIR VALUE MEASUREMENTS (Continued)
Input Hierarchy of Items Measured at Fair Value on a Non-RecurringNonrecurring Basis
The following tables summarize the fair values by input hierarchy of items measured at fair value subsequent to initial recognition on a nonrecurring basis by input hierarchy for the years ended December 31 that were still held on our balance sheet at those dates (in millions):
|
| | | | | | | | | | | | | | | | | | | | | | | | | | | | | | | |
| | 2011 | | 2010 |
| | Level 1 | | Level 2 | | Level 3 | | Total | | Level 1 | | Level 2 | | Level 3 | | Total |
| Financial Services Sector | | | | | | | | | | | | | | | |
| North America | | | | | | | | | | | | | | | |
| Retail receivables (a) | $ | — |
| | $ | — |
| | $ | 70 |
| | $ | 70 |
| | $ | — |
| | $ | — |
| | $ | 82 |
| | $ | 82 |
|
| Dealer loans, net (a) | — |
| | — |
| | 6 |
| | 6 |
| | — |
| | — |
| | 22 |
| | 22 |
|
| Total North America | — |
| | — |
| | 76 |
| | 76 |
| | — |
| | — |
| | 104 |
| | 104 |
|
| International | |
| | |
| | |
| | |
| | |
| | |
| | |
| | |
|
| Retail receivables (a) | — |
| | — |
| | 39 |
| | 39 |
| | — |
| | — |
| | 45 |
| | 45 |
|
| Total International | — |
| | — |
| | 39 |
| | 39 |
| | — |
| | — |
| | 45 |
| | 45 |
|
| Total Financial Services sector | $ | — |
| | $ | — |
| | $ | 115 |
| | $ | 115 |
| | $ | — |
| | $ | — |
| | $ | 149 |
| | $ | 149 |
|
__________
| |
| (a) | Finance receivables, including retail accounts that have been charged off and individual dealer loans where foreclosure is probable, are measured based on the fair value of the collateral adjusted for estimated costs to sell. The collateral for retail receivables is the vehicle being financed and for dealer loans is real estate or other property. See Note 9 for additional information related to the development of Ford Credit's allowance for credit losses. |
Nonrecurring Fair Value Changes
The following table summarizes the total change in value of items for which a non-recurring basisnonrecurring fair value adjustment has been included in our statement of operations for the years ended December 31 related to items still held on our balance sheet at those dates (in millions):
| | | | |
| | | | | | | | | | | | | | | | |
Automotive Sector(a) | | | | | | | | | | | | | | | |
First Aquitaine Industries SAS ("First Aquitaine") investment (b) | | $ | — | | | $ | — | | | $ | 241 | | | $ | 241 | | | $ | (79 | ) |
U.S. consolidated dealership investment (c) | | | — | | | | — | | | | — | | | | — | | | | (78 | ) |
Total assets at fair value | | $ | — | | | $ | — | | | $ | 241 | | | $ | 241 | | | $ | (157 | ) |
| | | | | | | | | | | | | | | | | | | | | |
| Financial Services Sector | | | | | | | | | | | | | | | | | | | | |
Equity investment (d) | | $ | — | | | $ | 200 | | | $ | — | | | $ | 200 | | | $ | (141 | ) |
Held-for-sale finance receivables (e) | | | — | | | | 911 | | | | — | | | | 911 | | | | (52 | ) |
Total assets at fair value | | $ | — | | | $ | 1,111 | | | $ | — | | | $ | 1,111 | | | $ | (193 | ) |
|
| | | | | | | | | | | |
| | Total Gains / (Losses) |
| | 2011 | | 2010 | | 2009 |
| Automotive Sector | | | | | |
| First Aquitaine investment (a) | $ | — |
| | $ | — |
| | $ | (79 | ) |
| U.S. consolidated dealership investment (a) | — |
| | — |
| | (78 | ) |
| Total Automotive sector | $ | — |
| | $ | — |
| | $ | (157 | ) |
| | | | | | |
| Financial Services Sector | | | | | |
| North America | | | | | |
| Retail receivables (b) | $ | (23 | ) | | $ | (29 | ) | | $ | (24 | ) |
| Dealer loans, net (b) | — |
| | (3 | ) | | (1 | ) |
| Total North America | (23 | ) | | (32 | ) | | (25 | ) |
| International | | | | | |
| Retail receivables (b) | (14 | ) | | (25 | ) | | (141 | ) |
| Total International | (14 | ) | | (25 | ) | | (141 | ) |
| Total Financial Services sector | $ | (37 | ) | | $ | (57 | ) | | $ | (166 | ) |
__________
| |
| (a) | See Note 24 for discussionOther-than-temporary impairments of our held-for-sale impairment of Volvo.
|
(b) | During the second quarter of 2009, weinvestments are recorded an other-than-temporary impairment of our investment in the Bordeaux automatic transmission plant of $79 million in Automotive cost of sales. The fair value measurement used to determine the impairment was based on the cost approach and considered the condition of the plant's fixed assets.
|
(c) | During the first quarter of 2009, we recorded an other-than-temporary impairment of our investment in our U.S. consolidated dealerships of $78 million in Automotive cost of sales. The fair value measurement used to determine the impairment was based on the market approach and reflected anticipated proceeds, expected to be de minimis. The fair value of our investment was classified in Level 2 of our fair-value hierarchy.
|
(d) | In March 2009, our Board of Directors approved potential sale of the Financial Services sector's investment in DFO Partnership. DFO Partnership held a portfolio of "non-core" diversified leveraged lease assets (e.g., railcars, aircraft, and energy facilities). The fair value measurement used to determine the fair value of the investment in DFO Partnership was based on the market approach and reflected information obtained from a number of bids. As a result, during the first quarter of 2009, we recorded an other-than-temporary impairment of the investment of $141 million in Financial Services equity in net income/(loss) of affiliated companies.
|
(e) | During the third quarter of 2009, Ford Credit recorded a valuation allowance of $52 million related to held-for-sale finance receivables. The fair value was determined based on the market approach and reflected information from an independent bid for the assets. See Note 24 for additional discussion of this impairment.
|
| | | | |
| | | | | | | | | | | | | | | | |
| Automotive Sector | | | | | | | | | | | | | | | |
U.S. consolidated dealership investment (a) | | $ | — | | | $ | — | | | $ | 131 | | | $ | 131 | | | $ | (88 | ) |
North America net property (b) | | | — | | | | — | | | | 11,009 | | | | 11,009 | | | | (5,300 | ) |
Held-for-sale operations (c) | | | — | | | | — | | | | 1,728 | | | | 1,728 | | | | (439 | ) |
Total assets at fair value | | $ | — | | | $ | — | | | $ | 12,868 | | | $ | 12,868 | | | $ | (5,827 | ) |
| | | | | | | | | | | | | | | | | | | | | |
| Financial Services Sector | | | | | | | | | | | | | | | | | | | | |
Net investment in certain operating leases (d) | | $ | — | | | $ | — | | | $ | 9,414 | | | $ | 9,414 | | | $ | (2,086 | ) |
Total assets at fair value | | $ | — | | | $ | — | | | $ | 9,414 | | | $ | 9,414 | | | $ | (2,086 | ) |
| |
(a) | During the first quarter of 2008, we recorded an other-than-temporary impairment of our investment in U.S. consolidated dealerships of $88 million in Automotive cost of sales. The fair value measurement used to determine the impairment was based on liquidation prices of comparable assets.
|
| |
| (b) | During the second quarter of 2008, we recorded a pre-tax impairment of $5.3 billion relatedFair value changes related to Ford North America held-and-used long-lived assets. The fair value measurement used to determine the impairment wasretail finance receivables that have been written down or dealer loans that have been impaired based on the income approach, which utilized cash flow projections consistent with the most recent Ford North America business plan approved by our Board or Directors, a terminal value, and a discount rate equivalent to a market participant's weighted average cost of capital. See Note 15 for additional discussion of this impairment.
|
(c) | We recorded pre-tax impairments of $421 million during the first quarter of 2008 and $18 million during the second quarter of 2008 related to held-for-sale operations. The fair value measurements usedof the collateral adjusted for estimated costs to determine the impairments were based on the market approach and reflected expected proceeds negotiated with the buyer. See Note 24 for additional discussion of these impairments.
|
(d) | Wesell are recorded a pre-tax impairment of $2.1 billion during the second quarter of 2008 related to certain vehicle lines included in our Financial Services sector provision for credit and insurance lossesNet Investment in operating leases. The fair value used to determine the impairment was based on the income approach and was measured by discounting the contractual payments and estimated auction proceeds. The discount rate reflected hypothetical market assumptions regarding borrowing rates, credit loss patterns, and residual value risk. See Note 15 for additional discussion of this impairment.
|
FORD MOTOR COMPANY AND SUBSIDIARIES
NOTES TO THE FINANCIAL STATEMENTS
NOTE 5. CASH AND RESTRICTED CASH
Cash and cash equivalents that are restricted as to withdrawal or usage under the terms of certain contractual arrangementsagreements are recorded as restricted in Other assets on our consolidated balancesheet.
Our Automotive sector restricted cash balances primarily include cash collateral required to be held against loans from the European Investment Bank ("EIB") and cash collateral required for bank guarantees. Additionally, restricted cash includes various escrow agreements related to insurance, customs, judicial, and environmental matters. Our Financial Services sector restricted cash balances primarily include cash held to meet certain local governmental and regulatoryreserve requirements. At December 31, 2010, restricted cash also included cash collateral required to be held against loans from the EIB.
Restricted cash does not include required minimum balances or cash securing debt raisedissued through securitization transactions ("securitization cash"). See Note 19 for discussion of the minimum balance requirement related to the secured credit agreement that we initially entered into in December 2006, and securitization cash. See Note 13 for additional information regarding Automotive VIEs. For cash and cash equivalents, we review our disbursement accounts and reclassify any aggregate negative balances to a liability account included in Payables on our balance sheet.
Restricted Cashtransactions.
Restricted cash reflected on our balance sheet at December 31 iswas as follows (in millions):
| | | | | | | | | | 2011 | | 2010 |
Automotive sector | | $ | 789 | | | $ | 363 | | $ | 330 |
| | $ | 433 |
|
Financial Services sector | | | 335 | | | | 449 | | 149 |
| | 298 |
|
Total Company | | $ | 1,124 | | | $ | 812 | | $ | 479 |
| | $ | 731 |
|
NOTE 6. MARKETABLE AND OTHER SECURITIES
Ford holdsWe hold various investments classified as marketable securities, including U.S. government and non-U.S. government securities, non-U.S. government agencies, corporate obligations and equities, and asset-backed securities. Highly-liquid investments with a maturity of 90 days or less at the date of purchase are classified in Cash and cash equivalents. Investment securities with a maturity date greater than 90 days at the date of the security's acquisition are classified as Marketable securities.
Prior to 2008, we classified allWe record marketable securities as trading, available-for-sale or held-to-maturity. The unrealizedat fair value. Unrealized gains and losses for available-for-sale securities were recorded, net of tax, as a separate component of Accumulated other comprehensive income/(loss) and the unrealized gains and losses for held-to-maturity securities were not recognized. On January 1, 2008, we elected to apply the fair value option and recorded all available-for-sale or held-to-maturity securities as trading securities. This election resulted in a cumulative after-tax increase of about $12 million to the opening balance of Retained earnings. Marketable securities acquired subsequent to January 1, 2008 have been recorded as trading securities.
Trading securities are recorded at fair value with unrealized gains and losses recorded in Automotive interest income and other non-operating income/(expense), net and Financial Services other income/(loss), net. Realized gains and losses are accounted formeasured using the specific identification method. See Note 4 for information on valuation methodologies.
Investments in Marketable Securities
Investments in marketable securities at December 31 were as follows (in millions):
| | | | | | | | |
| | | | | | Unrealized Gains/(Losses) (a) | | | | | | Unrealized Gains/(Losses) (a) | | | | | | | | | | |
| Trading Securities | | | | | | | | | | | | | |
| | | 2011 | | 2010 |
| | | Fair Value | | Unrealized Gains/(Losses) (a) | | Fair Value | | Unrealized Gains/(Losses) (a) |
Automotive sector (b) | | $ | 15,169 | | | $ | 141 | | | $ | 9,296 | | | $ | (1,443 | ) | $ | 14,984 |
| | $ | (93 | ) | | $ | 14,207 |
| | $ | 34 |
|
Financial Services sector | | | 6,864 | | | | 14 | | | | 8,607 | | | | (32 | ) | 3,835 |
| | (9 | ) | | 6,759 |
| | 4 |
|
Intersector elimination (b) | | | (646 | ) | | | — | | | | (492 | ) | | | — | | (201 | ) | | — |
| | (201 | ) | | — |
|
Total Company | | $ | 21,387 | | | $ | 155 | | | $ | 17,411 | | | $ | (1,475 | ) | $ | 18,618 |
| | $ | (102 | ) | | $ | 20,765 |
| | $ | 38 |
|
__________
| |
| (a) | Unrealized gains/(losses) for period related to instruments still held. held. |
| |
| (b) | "Fair Value" reflects an investment in Ford Credit debt securities shown at a carrying value of $646$201 million million and $492$201 million (estimated fair value of which is $201 million656 million and $437 million)$203 million) at December 31, 20092011 and 2008, respectively.2010, respectively. See Note 118 for additional detail. |
FORD MOTOR COMPANY AND SUBSIDIARIES
NOTES TO THE FINANCIAL STATEMENTS
NOTE 6. MARKETABLE AND OTHER SECURITIES (Continued)
Included in Automotive sector tradingmarketable securities above is our investment in Mazda. In 2010, we sold 133 million shares of Mazda for net proceeds of $372 million. We continue to own 62 million shares of Mazda, representing a 3.5% ownership interest. The fair value of our investment in Mazda at December 31, 20092011 and 20082010 was $447$110 million and $322$179 million, respectively. See Note 12 for additional information.
The proceeds from maturities and sales of available-for-sale securities in 2007 were as follows (in millions):FS-26
FORD MOTOR COMPANY AND SUBSIDIARIES
NOTES TO THE FINANCIAL STATEMENTS
| | | | |
| | | | | | | |
Automotive sector | | $ | — | | | $ | 2,686 | |
Financial Services sector | | | 7,900 | | | | 8,074 | |
Total Company | | $ | 7,900 | | | $ | 10,760 | |
Realized gains and losses on sales of available-for-sale securities in 2007 were as follows (in millions):
| | | | |
| | | | | | | |
Automotive sector | | $ | 10 | | | $ | 7 | |
Financial Services sector | | | 45 | | | | 5 | |
Total Company | | $ | 55 | | | $ | 12 | |
Other Securities
Investments in entities that we do not control and over which we do not have the ability to exercise significant influence are recorded at cost and included in Other assets. These cost method investments at December 31 were as follows (in millions):
| | | | | | | |
Automotive sector * | | $ | 97 | | | $ | 68 | |
Financial Services sector | | | 5 | | | | 5 | |
Total Company | | $ | 102 | | | $ | 73 | |
__________
* | Our largest cost method investment relates to our ownership in Primrose Cove Limited of $69 million and $56 million at December 31, 2009 and 2008, respectively. This investment represents preferred shares we received as part of the sale of Aston Martin Lagonda Group Limited ("Aston Martin").See Note 24 for further discussion of the sale of Aston Martin.
|
|
| | | | | | | |
| | 2011 | | 2010 |
| Automotive sector | $ | 21 |
| | $ | 92 |
|
| Financial Services sector | 5 |
| | 5 |
|
| Total Company | $ | 26 |
| | $ | 97 |
|
NOTE 7. FINANCE RECEIVABLES — FINANCIAL SERVICES SECTOR
Retail financeFinance receivables reflected on our consolidated balance sheet at December 31 were as follows (in millions):
|
| | | | | | | |
| | 2011 | | 2010 |
| Automotive sector (a) | $ | 355 |
| | $ | 224 |
|
| Financial Services sector | 73,330 |
| | 73,265 |
|
Reclassification of receivables purchased by Financial Services sector from Automotive sector to Other receivables, net | (3,709 | ) | | (3,419 | ) |
| Finance receivables, net | $ | 69,976 |
| | $ | 70,070 |
|
__________
| |
| (a) | Finance receivables are reported on our sector balance sheet in Receivables, less allowances and Other assets. |
Automotive Sector
Our Automotive sector holds notes receivable, which consist primarily of installmentnotes related to the restructuring of our businesses and loans with certain suppliers. Performance of this group of receivables is evaluated based on payment activity and direct financing lease contracts for newthe financial stability of the debtor. Notes receivable initially are recorded at fair value and used vehicles with retail customers, daily rental companies, government entities, and fleet customers. Wholesale finance receivables include dealer financing of new and used vehicles in inventory. Other finance receivables consist primarily of real estate, commercial and other collateralized loans, and accrued interest.subsequently measured at amortized cost.
Revenue from finance receivables (including direct financing leases) is recognized using the interest method. Certain origination costs on receivables are deferred and amortized, using the interest method, over the term of the relatedNotes receivable, net at December 31 were as a reduction in financing revenue. The accrual of interest on receivables is discontinued at the time a receivable is determined to be uncollectible.follows (in millions):
Ford Credit receives interest supplements and other support payments on certain financing transactions under agreements with Ford and other affiliates. Income is recognized in a manner that is consistent with revenue recognition on the underlying financing contracts over the periods that the related finance receivables are outstanding.
FS - 26 |
| | | | | | | |
| | 2011 | | 2010 |
| Notes receivable | $ | 384 |
| | $ | 344 |
|
| Less: Allowance for credit losses | (29 | ) | | (120 | ) |
| Notes receivable, net | $ | 355 |
| | $ | 224 |
|
FORD MOTOR COMPANY AND SUBSIDIARIES
NOTES TO THE FINANCIAL STATEMENTS
NOTE 7. FINANCE RECEIVABLES — FINANCIAL SERVICES SECTOR(Continued)
Financial Services Sector
Ford Credit segments its North America and International portfolio of finance receivables into "consumer" and "non-consumer" receivables. The receivables are secured by the vehicles, inventory, or other property being financed.
Consumer Segment –Receivables in this portfolio segment relate to products offered to individuals and businesses that finance the acquisition of Ford vehicles from dealers for personal or commercial use. The products include:
Retail financing – retail installment contracts for new and used vehicles
Direct financing leases – direct financing leases with retail customers, government entities, daily rental companies, and fleet customers
Non-consumer Segment – Receivables in this portfolio segment relate to products offered to dealers. The products include:
Wholesale financing – loans to dealers to finance the purchase of vehicle inventory, also known as floorplan financing
Dealer loans – loans to dealers to finance working capital, and to finance the purchase of dealership real estate and/or make improvements to dealership facilities
Other financing – receivables related to the sale of parts and accessories to dealers
Finance Receivables, Netreceivables are recorded at the time of origination or purchase for the principal amount financed and are subsequently reported at amortized cost, net of any allowance for credit losses. Amortized cost is the outstanding principal adjusted for any charge-offs and any unamortized deferred fees or costs. At December 31, 2011 and 2010, the recorded investment in Ford Credit's finance receivables excluded $180 million and $176 million of accrued uncollected interest receivable, respectively, which we report in Other assets on the balance sheet.
Finance receivables, net at December 31 were as follows (in millions):
| | | | | | | |
Retail (including direct financing leases) | | $ | 58,229 | | | $ | 67,316 | |
Wholesale | | | 22,370 | | | | 27,483 | |
Other finance receivables | | | 3,611 | | | | 4,057 | |
Total finance receivables | | | 84,210 | | | | 98,856 | |
Unearned interest supplements | | | (1,994 | ) | | | (1,343 | ) |
Allowance for credit losses | | | (1,351 | ) | | | (1,417 | ) |
Other | | | 20 | | | | 5 | |
Finance receivables, net – sector balance sheet | | $ | 80,885 | | | $ | 96,101 | |
| | | | | | | | | |
Finance receivables, net, subject to fair value* | | $ | 76,991 | | | $ | 91,584 | |
Fair value | | $ | 76,066 | | | $ | 84,615 | |
| | | | | | | | | |
Finance receivables, net – sector balance sheet | | $ | 80,885 | | | $ | 96,101 | |
Reclassification of receivables purchased from Automotive sector to Other receivables, net | | | (3,889 | ) | | | (2,617 | ) |
Finance receivables, net – consolidated balance sheet | | $ | 76,996 | | | $ | 93,484 | |
|
| | | | | | | | | | | | | | | | | | | | | | | |
| | 2011 | | 2010 |
| | North America | | International | | Total Finance Receivables | | North America | | International | | Total Finance Receivables |
| Consumer | | | | | | | | | | | |
| Retail, gross | $ | 38,406 |
| | $ | 8,400 |
| | $ | 46,806 |
| | $ | 39,129 |
| | $ | 9,436 |
| | $ | 48,565 |
|
| Less: Unearned interest supplements | (1,407 | ) | | (219 | ) | | (1,626 | ) | | (1,580 | ) | | (289 | ) | | (1,869 | ) |
| Retail | 36,999 |
| | 8,181 |
| | 45,180 |
| | 37,549 |
| | 9,147 |
| | 46,696 |
|
| Direct financing leases, gross | 4 |
| | 2,683 |
| | 2,687 |
| | 17 |
| | 3,011 |
| | 3,028 |
|
| Less: Unearned interest supplements | — |
| | (116 | ) | | (116 | ) | | — |
| | (84 | ) | | (84 | ) |
| Direct financing leases | 4 |
| | 2,567 |
| | 2,571 |
| | 17 |
| | 2,927 |
| | 2,944 |
|
| Consumer finance receivables | $ | 37,003 |
| | $ | 10,748 |
| | $ | 47,751 |
| | $ | 37,566 |
| | $ | 12,074 |
| | $ | 49,640 |
|
| Non-consumer | |
| | |
| | |
| | |
| | |
| | |
|
| Wholesale | $ | 15,413 |
| | $ | 8,416 |
| | $ | 23,829 |
| | $ | 13,273 |
| | $ | 8,851 |
| | $ | 22,124 |
|
| Dealer loans | 1,088 |
| | 63 |
| | 1,151 |
| | 1,117 |
| | 33 |
| | 1,150 |
|
| Other | 723 |
| | 377 |
| | 1,100 |
| | 738 |
| | 390 |
| | 1,128 |
|
| Non-consumer finance receivables | 17,224 |
| | 8,856 |
| | 26,080 |
| | 15,128 |
| | 9,274 |
| | 24,402 |
|
| Total recorded investment | $ | 54,227 |
| | $ | 19,604 |
| | $ | 73,831 |
| | $ | 52,694 |
| | $ | 21,348 |
| | $ | 74,042 |
|
| | | | | | | | | | | | |
| Recorded investment in finance receivables | $ | 54,227 |
| | $ | 19,604 |
| | $ | 73,831 |
| | $ | 52,694 |
| | $ | 21,348 |
| | $ | 74,042 |
|
| Less: Allowance for credit losses | (388 | ) | | (113 | ) | | (501 | ) | | (625 | ) | | (152 | ) | | (777 | ) |
| Finance receivables, net | $ | 53,839 |
| | $ | 19,491 |
| | $ | 73,330 |
| | $ | 52,069 |
| | $ | 21,196 |
| | $ | 73,265 |
|
| | | | | | | | | | | | |
| Net finance receivables subject to fair value (a) | |
| | |
| | $ | 70,754 |
| | |
| | |
| | $ | 70,318 |
|
| Fair value | |
| | |
| | 72,294 |
| | |
| | |
| | 72,021 |
|
__________
* | |
| (a) | At December 31, 20092011 and 2008,2010, excludes $3.92.6 billion and $4.52.9 billion, respectively, of certain receivables (primarily direct financing leases) that are not subject to fair value disclosure requirements. |
FORD MOTOR COMPANY AND SUBSIDIARIES
NOTES TO THE FINANCIAL STATEMENTS
Finance receivables that originated outside of the United States were $35.4 billion and $43.1 billion at December 31, 2009 and 2008, respectively. At December 31, 2009, finance receivables included $663 million owed by the three customers with the largest receivables balances.NOTE 7. FINANCE RECEIVABLES (Continued)
Included in netthe recorded investment in finance and other receivables at December 31, 20092011 and 20082010 were $64.4North America consumer receivables of $29.4 billion and $73.7$28.7 billion and non-consumer receivables of $14.2 billion and $12.8 billion, respectively, and International consumer receivables of finance$7.1 billion and $7.6 billion and non-consumer receivables of $5.6 billion and $5.9 billion, respectively, that secure certain debt obligations. The cash flows generated from collection of these receivables can be usedare available only for payment of the related debt and obligations arising from the transfer;obligations; they are not available to pay ourthe other obligations of our Financial Services sector or the claims of ourits other creditors (see Notes 13 and 19)18).
The fair value of finance receivables is generally calculated by discounting future cash flows using an estimated discount rate that reflects the current credit, interest rate, and prepayment risks associated with similar types of instruments.
ScheduledContractual maturities of total finance receivables, including minimum lease rentals, areexcluding unearned interest supplements, outstanding at December 31, 2011 reflect contractual repayments due from customers or borrowers reported in the maturity category in which the payment is due and were as follows (in millions):
| | | | | | | | | | | | | | | | |
| Total finance receivables, including minimum lease rentals | | $ | 51,768 | | | $ | 17,876 | | | $ | 9,107 | | | $ | 5,459 | | | $ | 84,210 | |
|
| | | | | | | | | | | | | | | | | | | |
| | Due in Year Ending December 31, | | | | |
| | 2012 | | 2013 | | 2014 | | Thereafter | | Total |
| North America | | | | | | | | | |
| Consumer | | | | | | | | | |
| Retail, gross | $ | 12,163 |
| | $ | 9,710 |
| | $ | 7,642 |
| | $ | 8,891 |
| | $ | 38,406 |
|
| Direct financing leases, gross | 4 |
| | — |
| | — |
| | — |
| | 4 |
|
| Non-consumer | | | | | | | | | |
| Wholesale | 15,165 |
| | 248 |
| | — |
| | — |
| | 15,413 |
|
| Dealer loans | 170 |
| | 164 |
| | 61 |
| | 693 |
| | 1,088 |
|
| Other | 713 |
| | 4 |
| | 3 |
| | 3 |
| | 723 |
|
| Total North America | $ | 28,215 |
| | $ | 10,126 |
| | $ | 7,706 |
| | $ | 9,587 |
| | $ | 55,634 |
|
| | | | | | | | | | |
| International | | | | | | | | | |
| Consumer | | | | | | | | | |
| Retail, gross | $ | 3,208 |
| | $ | 3,091 |
| | $ | 1,380 |
| | $ | 721 |
| | $ | 8,400 |
|
| Direct financing leases, gross | 1,557 |
| | 443 |
| | 314 |
| | 369 |
| | 2,683 |
|
| Non-consumer | | | | | | | | | |
| Wholesale | 7,316 |
| | 979 |
| | 92 |
| | 29 |
| | 8,416 |
|
| Dealer loans | 43 |
| | 4 |
| | 2 |
| | 14 |
| | 63 |
|
| Other | 377 |
| | — |
| | — |
| | — |
| | 377 |
|
| Total International | $ | 12,501 |
| | $ | 4,517 |
| | $ | 1,788 |
| | $ | 1,133 |
| | $ | 19,939 |
|
Experience indicates that a portion of the portfolio is repaid before the scheduledcontractual maturity dates.
The net investmentInvestment in direct financing leases, which are included in consumer receivables, were as follows at December 31 (in millions):
|
| | | | | | | | | | | | | | | | | | | | | | | |
| | 2011 | | 2010 |
| | North America | | International | | Total Direct Financing Leases | | North America | | International | | Total Direct Financing Leases |
| Total minimum lease rentals to be received | $ | 4 |
| | $ | 1,897 |
| | $ | 1,901 |
| | $ | 8 |
| | $ | 1,980 |
| | $ | 1,988 |
|
| Initial direct costs | — |
| | 18 |
| | 18 |
| | — |
| | 19 |
| | 19 |
|
| Estimated residual values | 1 |
| | 971 |
| | 972 |
| | 10 |
| | 1,256 |
| | 1,266 |
|
| Less: Unearned income | (1 | ) | | (203 | ) | | (204 | ) | | (1 | ) | | (244 | ) | | (245 | ) |
| Less: Unearned interest supplements | — |
| | (116 | ) | | (116 | ) | | — |
| | (84 | ) | | (84 | ) |
| Recorded investment in direct financing leases | 4 |
| | 2,567 |
| | 2,571 |
| | 17 |
| | 2,927 |
| | 2,944 |
|
| Less: Allowance for credit losses | — |
| | (12 | ) | | (12 | ) | | (1 | ) | | (17 | ) | | (18 | ) |
| Net investment in direct financing leases | $ | 4 |
| | $ | 2,555 |
| | $ | 2,559 |
| | $ | 16 |
| | $ | 2,910 |
| | $ | 2,926 |
|
At December 31, 2011, future lease minimum rentals due from North America direct financing leases were as follows (in millions): 2012 - $4; thereafter - $0.
FORD MOTOR COMPANY AND SUBSIDIARIES
NOTES TO THE FINANCIAL STATEMENTS
NOTE 7. FINANCE RECEIVABLES (Continued)
At December 31, 2011, future lease minimum rentals due from International direct financing leases were as follows (in millions): 2012 - $780; 2013 - $518; 2014 - $395; thereafter - $204.
Aging. For all classes of finance receivables, Ford Credit defines "past due" as any payment, including principal and interest, that has not been collected and is at least 31 days past the contractual due date. The aging analysis of Ford Credit's finance receivables balances at December 31, 2011 was as follows (in millions):
|
| | | | | | | | | | | | | | | | | | | | | | | | | | | |
| | 31-60 Days Past Due | | 61-90 Days Past Due | | 91-120 Days Past Due | | Greater Than 120 Days Past Due | | Total Past Due | | Current | | Total Finance Receivables |
| North America | | | | | | | | | | | | | |
| Consumer | | | | | | | | | | | | | |
| Retail | $ | 732 |
| | $ | 68 |
| | $ | 22 |
| | $ | 70 |
| | $ | 892 |
| | $ | 36,107 |
| | $ | 36,999 |
|
| Direct financing leases | — |
| | — |
| | — |
| | — |
| | — |
| | 4 |
| | 4 |
|
| Non-consumer | | | | | | | | | |
| | |
| | |
|
| Wholesale | 9 |
| | — |
| | — |
| | 2 |
| | 11 |
| | 15,402 |
| | 15,413 |
|
| Dealer loans | 3 |
| | 11 |
| | — |
| | 5 |
| | 19 |
| | 1,069 |
| | 1,088 |
|
| Other | — |
| | — |
| | — |
| | — |
| | — |
| | 723 |
| | 723 |
|
| Subtotal | 744 |
| | 79 |
| | 22 |
| | 77 |
| | 922 |
| | 53,305 |
| | 54,227 |
|
| | | | | | | | | | | | | | |
| International | | | | | | | | | | | | | |
| Consumer | | | | | | | | | | | | | |
| Retail | 55 |
| | 24 |
| | 10 |
| | 40 |
| | 129 |
| | 8,052 |
| | 8,181 |
|
| Direct financing leases | 9 |
| | 4 |
| | 2 |
| | 3 |
| | 18 |
| | 2,549 |
| | 2,567 |
|
| Non-consumer | | | | | | | | | |
| | |
| | |
|
| Wholesale | 1 |
| | 1 |
| | — |
| | 5 |
| | 7 |
| | 8,409 |
| | 8,416 |
|
| Dealer loans | — |
| | — |
| | — |
| | 1 |
| | 1 |
| | 62 |
| | 63 |
|
| Other | — |
| | — |
| | — |
| | 1 |
| | 1 |
| | 376 |
| | 377 |
|
| Subtotal | 65 |
| | 29 |
| | 12 |
| | 50 |
| | 156 |
| | 19,448 |
| | 19,604 |
|
| Total recorded investment | $ | 809 |
| | $ | 108 |
| | $ | 34 |
| | $ | 127 |
| | $ | 1,078 |
| | $ | 72,753 |
| | $ | 73,831 |
|
Consumer Credit Quality. When originating all classes of consumer receivables, Ford Credit uses a proprietary scoring system that measures the credit quality of the receivables using several factors, such as credit bureau information, consumer credit risk scores (e.g., FICO score), customer characteristics, and contract characteristics. In addition to its proprietary scoring system, Ford Credit considers other individual consumer factors, such as employment history, financial stability, and capacity to pay.
Subsequent to origination, Ford Credit reviews the credit quality of retail and direct financing lease receivables based on customer payment activity. As each customer develops a payment history, Ford Credit uses an internally-developed behavioral scoring model to assist in determining the best collection strategies. Based on data from this scoring model, contracts are categorized by collection risk. Ford Credit's collection models evaluate several factors, including origination characteristics, updated credit bureau data, and payment patterns. These models allow for more focused collection activity on higher-risk accounts and are used to refine Ford Credit's risk-based staffing model to ensure collection resources are aligned with portfolio risk.
Credit quality ratings for Ford Credit's consumer receivables are categorized as follows:
Pass – current to 60 days past due
Special Mention – 61 to 120 days past due and in intensified collection status
Substandard – greater than 120 days past due and for which the uncollectible portion of the receivables has already been charged-off, as measured using the fair value of the collateral
FORD MOTOR COMPANY AND SUBSIDIARIES
NOTES TO THE FINANCIAL STATEMENTS
NOTE 7. FINANCE RECEIVABLES (Continued)
The credit quality analysis of Ford Credit's consumer receivables portfolio at December 31 was as follows (in millions):
| | | | | | | |
Total minimum lease rentals to be received | | $ | 2,509 | | | $ | 2,940 | |
Less: Unearned income | | | (434 | ) | | | (541 | ) |
Loan origination costs | | | 23 | | | | 33 | |
Estimated residual values | | | 1,826 | | | | 2,135 | |
Less: Allowance for credit losses | | | (45 | ) | | | (50 | ) |
Net investment in direct financing leases | | $ | 3,879 | | | $ | 4,517 | |
|
| | | | | | | | | | | | | | | |
| | 2011 | | 2010 |
| | Retail | | Direct Financing Leases | | Retail | | Direct Financing Leases |
| North America | | | | | | | |
| Pass | $ | 36,839 |
| | $ | 4 |
| | $ | 37,348 |
| | $ | 17 |
|
| Special Mention | 90 |
| | — |
| | 119 |
| | — |
|
| Substandard | 70 |
| | — |
| | 82 |
| | — |
|
| Subtotal | 36,999 |
| | 4 |
| | 37,549 |
| | 17 |
|
| | | | | | | | |
| International | |
| | |
| | |
| | |
|
| Pass | 8,107 |
| | 2,559 |
| | 9,068 |
| | 2,914 |
|
| Special Mention | 34 |
| | 5 |
| | 60 |
| | 10 |
|
| Substandard | 40 |
| | 3 |
| | 19 |
| | 3 |
|
| Subtotal | 8,181 |
| | 2,567 |
| | 9,147 |
| | 2,927 |
|
| Total recorded investment | $ | 45,180 |
| | $ | 2,571 |
| | $ | 46,696 |
| | $ | 2,944 |
|
The investmentNon-consumer Credit Quality. For all classes of non-consumer receivables, Ford Credit extends commercial credit to dealers primarily in direct financing leases primarily relatesthe form of approved lines of credit to purchase new Ford and Lincoln vehicles as well as used vehicles. Each commercial lending request is evaluated by taking into consideration the leasing of vehiclesborrower's financial condition and the underlying collateral securing the loan. Ford Credit uses a proprietary model to assign each dealer a risk rating. This model uses historical performance data to identify key factors about a dealer that Ford Credit considers significant in predicting a dealer's ability to meet its financial obligations. Ford Credit also considers numerous other financial and qualitative factors including capitalization and leverage, liquidity and cash flow, profitability, and credit history with Ford Credit and other creditors. A dealer's risk rating does not reflect any guarantees or a term greater than 60 months. Scheduled maturities of minimum lease rentals, as included above, are as follows (in millions):dealer owner's net worth.
| | | | | | | | | | | | | | | | |
Minimum rentals on direct financing leases | | $ | 1,115 | | | $ | 681 | | | $ | 477 | | | $ | 236 | | | $ | 2,509 | |
Group I – strong to superior financial metrics
FS - 27
Group II – fair to favorable financial metricsGroup III – marginal to weak financial metrics Group IV – poor financial metrics, including dealers classified as uncollectible
Ford Credit suspends credit lines and extends no further funding to dealers classified in Group IV.
Ford Credit regularly reviews its model to confirm the continued business significance and statistical predictability of the factors and updates the model to incorporate new factors or other information that improves its statistical predictability. In addition, Ford Credit verifies the existence of the assets collateralizing the receivables by physical audits of vehicle inventories, which are performed with increased frequency for higher-risk (i.e., Group III and Group IV) dealers. Ford Credit performs a credit review of each dealer at least annually and adjusts the dealer's risk rating, if necessary.
FORD MOTOR COMPANY AND SUBSIDIARIES
NOTES TO THE FINANCIAL STATEMENTS
NOTE 7. FINANCE RECEIVABLES (Continued)
Performance of non-consumer receivables is evaluated based on Ford Credit's internal dealer risk rating analysis, as payment for wholesale receivables generally is not required until the dealer has sold the vehicle inventory. Wholesale and dealer loan receivables with the same dealer share the same risk rating. The credit quality analysis of wholesale and dealer loan receivables at December 31 was as follows (in millions):
|
| | | | | | | | | | | | | | | |
| | 2011 | | 2010 |
| | Wholesale | | Dealer Loan | | Wholesale | | Dealer Loan |
| North America | | | | | | | |
| Group I | $ | 12,645 |
| | $ | 861 |
| | $ | 10,540 |
| | $ | 785 |
|
| Group II | 2,489 |
| | 165 |
| | 2,372 |
| | 208 |
|
| Group III | 273 |
| | 58 |
| | 353 |
| | 107 |
|
| Group IV | 6 |
| | 4 |
| | 8 |
| | 17 |
|
| Subtotal | 15,413 |
| | 1,088 |
| | 13,273 |
| | 1,117 |
|
| | | | | | | | |
| International | |
| | |
| | |
| | |
|
| Group I | 5,115 |
| | 42 |
| | 5,135 |
| | 5 |
|
| Group II | 1,965 |
| | 10 |
| | 2,189 |
| | 15 |
|
| Group III | 1,327 |
| | 10 |
| | 1,527 |
| | 12 |
|
| Group IV | 9 |
| | 1 |
| | — |
| | 1 |
|
| Subtotal | 8,416 |
| | 63 |
| | 8,851 |
| | 33 |
|
| Total recorded investment | $ | 23,829 |
| | $ | 1,151 |
| | $ | 22,124 |
| | $ | 1,150 |
|
Non-Accrual Status. The accrual of revenue is discontinued at the earlier of the time a receivable is determined to be uncollectible, at bankruptcy status notification, or greater than 120 days past due. Finance receivable accounts may be restored to accrual status only when a customer settles all past-due deficiency balances and future payments are reasonably assured. For receivables in non-accrual status, subsequent financing revenue is recognized only to the extent a payment is received. Payments are generally applied first to outstanding interest and then to the unpaid principal balance.
The recorded investment of consumer receivables in non-accrual status was $402 million, or 0.9% of our consumer receivables, at December 31, 2011, and $486 million, or 1% of our consumer receivables, at December 31, 2010.
The recorded investment of non-consumer receivables in non-accrual status was $27 million, or 0.1% of our non-consumer receivables, at December 31, 2011, and $102 million, or 0.4% of our non-consumer receivables, at
December 31, 2010.
Finance receivables greater than 90 days past due and still accruing interest at December 31, 2011 and 2010, reflect $14 million and $7 million, respectively, of non-bankrupt retail accounts in the 91-120 days past due category, and $1 million and $1 million, respectively, of dealer loans.
Impairment. Ford Credit's finance receivables are evaluated both collectively and specifically for impairment. Impaired consumer receivables represent accounts that have been re-written or modified in reorganization proceedings pursuant to the U.S. Bankruptcy Code and are considered to be TDRs as well as all accounts greater than 120 days past due. The recorded investment of consumer receivables that were impaired as of December 31, 2011 and 2010 was $382 million, or 0.8% of consumer receivables, and $104 million, or 0.2% of consumer receivables, respectively. Impaired non-consumer receivables represent accounts with dealers that have weak or poor financial metrics or dealer loans that have been modified in TDRs. The following factors (not necessarily in order of importance or probability of occurrence) are considered in determining whether a non-consumer receivable is impaired:
Delinquency in contractual payments of principal or interest
Deterioration of the borrower's competitive position
Cash flow difficulties experienced by the borrower
Breach of loan covenants or conditions
Initiation of dealer bankruptcy or other insolvency proceedings
Fraud or criminal conviction
FORD MOTOR COMPANY AND SUBSIDIARIES
NOTES TO THE FINANCIAL STATEMENTS
NOTE 7. FINANCE RECEIVABLES (Continued)
The recorded investment of non-consumer receivables that were impaired at December 31, 2011 and 2010, was $64 million, or 0.2% of the non-consumer receivables and $102 million, or 0.4% of the non-consumer receivables, respectively.
Troubled Debt Restructurings
Ford Credit has applied the requirements of the new accounting standard related to TDRs to restructurings occurring on or after January 1, 2011. Evaluation under the new guidance resulted in certain consumer finance receivables that are now considered TDRs. Under the old guidance only certain non-consumer receivables were considered TDRs.
A restructuring of debt constitutes a TDR if Ford Credit grants a concession to a customer or borrower for economic or legal reasons related to the debtor's financial difficulties that Ford Credit otherwise would not consider.
Consumer. While payment extensions are granted on consumer receivables in the normal course of the collection process, for consumers not considered to be in financial difficulty, no concessions are made on the principal balance loaned or the interest rate charged. Payment extensions typically result in a short-term deferral of the customer's normal monthly payment and do not constitute a TDR.
Consumer receivable contracts may be modified to lower the customer's payment by extending the term of the contract or lowering the interest rate as a remedy to avoid or cure delinquency. Ford Credit does not grant concessions on the principal balance for re-written contracts. Contracts that have a modified interest rate that is below the market rate are considered to be TDRs.
Consumer receivables modified in reorganization proceedings pursuant to the U.S. Bankruptcy Code are considered to be TDRs. Ford Credit does not record changes to the recorded investment per the original contract for these TDRs until all payments and requirements of the reorganization plan are met.
The outstanding recorded investment at time of modification for consumer receivables that are considered to be TDRs was $370 million, or 0.8% of Ford Credit's consumer receivables at December 31, 2011. A subsequent default occurs when contracts that were previously modified in TDRs within the last twelve months and subsequently had past due payments that resulted in repossession. The subsequent default rate for consumer contracts was 3.7% of TDRs at December 31, 2011. Ford Credit had no consumer receivables considered to be TDRs at December 31, 2010.
Consumer receivables involved in TDRs are specifically assessed for impairment. A specific allowance is estimated based on the present value of the expected future cash flows of the receivable discounted at the loan's original effective interest rate or the fair value of any collateral adjusted for estimated costs to sell. For loans where foreclosure is probable, the fair value of the collateral is used to estimate the specific impairment. The allowance for credit losses related to consumer TDRs was $16 million at December 31, 2011.
Non-Consumer. Within Ford Credit's non-consumer receivables segment, only dealer loans subject to forbearance, moratoriums, extension agreements or other actions intended to minimize economic loss and to avoid foreclosure or repossession of collateral are classified as TDRs. Ford Credit does not grant concessions on the principal balance of dealer loans. The outstanding recorded investment of dealer loans involved in TDRs is $13 million, or less than 0.1% of Ford Credit's non-consumer receivables, at December 31, 2011 and 2010. A subsequent default occurs when receivables that were previously modified in TDRs within the last twelve months and subsequently had past due payments that resulted in foreclosure or charge-off. The subsequent default rate for non-consumer contracts for the years ending December 31, 2011 and 2010 was 25% and 17%, respectively.
Dealer loans involved in TDRs are assessed for impairment and included in Ford Credit's allowance for credit losses based on either the present value of the expected future cash flows of the receivable discounted at the loan's original effective interest rate, or the fair value of the collateral adjusted for estimated costs to sell. For loans where foreclosure is probable, the fair value of the collateral is used to estimate the specific impairment. An impairment charge is recorded as part of the provision to the allowance for credit losses for the amount by which the recorded investment of the receivable exceeds its estimated fair value. The allowance for credit losses related to non-consumer TDRs was $6 million at December 31, 2011.
See Note 9 for additional information related to the development of Ford Credit's allowance for credit losses.
FORD MOTOR COMPANY AND SUBSIDIARIES
NOTES TO THE FINANCIAL STATEMENTS
NOTE 8. NET INVESTMENT IN OPERATING LEASES
Net investment in operating leases on our balance sheet consists primarily of lease contracts for new and used vehicles with retail customers, daily rental companies, fleet customers,government entities, and retailfleet customers. Assets subject to operating leases are depreciated on the straight-line method over the term of the lease to reduce the asset to its estimated residual value. Estimated residual values are based on assumptions for used vehicle prices at lease termination and the number of vehicles that are expected to be returned.
Included in the Automotive sector on our consolidated balance sheet are vehicles sold to daily rental car companies subject to guaranteed repurchase options. At the time of transfer, the proceeds are recorded as deferred revenue in Accrued liabilities and deferred revenue. At December 31, 2009 and 2008, $2.5 billion and $2.3 billion, respectively, was included in this line item for these vehicles. Also at the time of transfer, the cost of the vehicles is recorded in Other current assets. The difference between the proceeds and the guaranteed repurchase amount is recognized in Automotive sales over an average term of 8 months, using a straight-line method. The difference between the cost of the vehicle and the estimated auction value is depreciated in Automotive cost of sales over the term of the lease.
Net Investment in Operating Leases
The net investment in operating leases at December 31 was as follows (in millions):
| | | | | | | | | | 2011 | | 2010 |
| Automotive Sector | | | | | | | | | |
Vehicles, net of depreciation (a) | | $ | 2,208 | | | $ | 2,130 | | |
| Vehicles, net of depreciation | | $ | 1,356 |
| | $ | 1,282 |
|
| Financial Services Sector | | | | | | | | | |
| | |
|
Vehicles and other equipment, at cost (b) | | | 21,769 | | | | 28,926 | | |
| Vehicles and other equipment, at cost (a) | | 14,242 |
| | 14,800 |
|
Accumulated depreciation | | | (6,493 | ) | | | (5,542 | ) | (2,720 | ) | | (4,320 | ) |
Allowance for credit losses | | | (214 | ) | | | (264 | ) | (40 | ) | | (87 | ) |
Total Financial Services sector | | | 15,062 | | | | 23,120 | | 11,482 |
| | 10,393 |
|
Total Company | | $ | 17,270 | | | $ | 25,250 | | $ | 12,838 |
| | $ | 11,675 |
|
__________
(a) Included in Automotive other current | |
| (a) | Includes Ford Credit's operating lease assets of $6.4 billion and $6.2 billion at December 31, 2011 and 2010, respectively, for which the related cash flows have been used to secure certain lease securitization transactions. Cash flows associated with the net investment in operating leases are available only for payment of the debt or other obligations issued or arising in the securitization transactions; they are not available to pay other obligations or the claims of other creditors.on our sector balance sheet. (b) Includes the impact of the 2008 impairment of vehicles subject to operating leases at Ford Credit. See Note 15 for additional details.
|
Automotive Sector
Included in Net investment in operating leases are vehicles sold to daily rental car companies subject to guaranteed repurchase options. Operating lease depreciation expense (which excludes gains and losses on disposal of assets) for the years ended December 31 was as follows (in millions):
| | | | | | | | | | |
Operating lease depreciation expense | | $ | 536 | | | $ | 861 | | | $ | 979 | |
|
| | | | | | | | | | | |
| | 2011 | | 2010 | | 2009 |
| Operating lease depreciation expense | $ | 61 |
| | $ | 297 |
| | $ | 475 |
|
Included in Automotive salesrevenues are rents on operating leases. The amount contractually due for minimum rentals on operating leases is $404$126 million for 2010.2012.
Financial Services Sector
Included in Net investment in operating leases atOperating lease depreciation expense (which includes gains and losses on disposal of assets) for the years ended December 31 2009 and 2008 were Ford Credit's interests of $10.4 billion and $15.6 billion, respectively, that have been included in securitizations that do not satisfy the requirements for accounting sale treatment. These net investments in operating leases are available only for payment of the debt or other obligations issued or arising in the securitization transactions; they are not available to pay other obligations or the claims of other creditors.was as follows (in millions):
FORD MOTOR COMPANY AND SUBSIDIARIES
NOTES TO THE FINANCIAL STATEMENTS
NOTE 8. NET INVESTMENT IN OPERATING LEASES (Continued) |
| | | | | | | | | | | |
| | 2011 | | 2010 | | 2009 |
| Operating lease depreciation expense | $ | 1,799 |
| | $ | 1,977 |
| | $ | 3,890 |
|
Included in Financial Services revenues are rents on operating leases. The amounts contractually due for minimum rentals on operating leases are as follows (in millions):
| | | | | | | | | | | | | | | | |
Minimum rentals on operating leases | | $ | 2,825 | | | $ | 1,602 | | | $ | 604 | | | $ | 332 | | | $ | 5,363 | |
|
| | | | | | | | | | | | | | | | | | | | | | | |
| | 2012 | | 2013 | | 2014 | | 2015 | | Thereafter | | Total |
| Minimum rentals on operating leases | $ | 1,507 |
| | $ | 1,413 |
| | $ | 1,173 |
| | $ | 238 |
| | $ | 100 |
| | $ | 4,431 |
|
Operating lease depreciation expense (which includes gains and losses on disposal of assets) was as follows (in millions):FS-34
FORD MOTOR COMPANY AND SUBSIDIARIES
NOTES TO THE FINANCIAL STATEMENTS
| | | | | | | | | | |
Operating lease depreciation expense | | $ | 3,890 | | | $ | 9,048 | | | $ | 6,212 | |
NOTE 9. ALLOWANCE FOR CREDIT LOSSES — FINANCIAL SERVICES SECTOR
Automotive Sector
We estimate credit loss reserves for notes receivable on an individual receivable basis. A specific impairment allowance reserve is established based on expected future cash flows, the fair value of any collateral, and the financial condition of the debtor. Following is an analysis of the allowance for credit losses for the years ended December 31 (in millions):
|
| | | | | | | |
| | 2011 | | 2010 |
| Allowance for credit losses: | | | |
| Beginning balance | $ | 120 |
| | $ | 192 |
|
| Charge-offs | — |
| | (1 | ) |
| Recoveries | (85 | ) | | (122 | ) |
| Provision for credit losses | 2 |
| | 51 |
|
| Other | (8 | ) | | — |
|
| Ending balance | $ | 29 |
| | $ | 120 |
|
Financial Services Sector
The allowance for credit losses is ourrepresents Ford Credit's estimate of the probable credit losses inherent inloss on the collection of finance receivables and operating leases at the dateas of the balance sheet. Consistent with our normal practices and policies, we assess thesheet date. The adequacy of ourthe allowance for credit losses is assessed quarterly and regularly evaluate the assumptions and models used in establishing the allowance.allowance are evaluated regularly. Because credit losses canmay vary substantially over time, estimating credit losses requires a number of assumptions about matters that are uncertain. The majority of credit losses are attributable to Ford Credit's consumer receivables segment.
TheAdditions to the allowance for credit losses are made by recording charges to Provision for credit and insurance losses on the sector statement of operations. The uncollectible portion of finance receivables and investments in operating leases are charged to the allowance for credit losses at the earlier of when an account is deemed to be uncollectible or when an account is 120 days delinquent, taking into consideration the financial condition of the customer, borrower or lessee, the value of the collateral, recourse to guarantors and other factors. In the event we repossess the collateral, the receivable is written off and we record the collateral at its estimated fair value less costs to sell and report it in Other assets on the balance sheet. Recoveries on finance receivables and investment in operating leases previously charged-off as uncollectible are credited to the allowance for credit losses.
Consumer Receivables
Ford Credit estimates the allowance for credit losses on its consumer receivables segment and on its investments in operating leases using a combination of measurement models and management judgment and is based onjudgment. The models consider factors such as historical trends in credit losses and recoveries (including key metrics such as delinquencies, repossessions and bankruptcies), the composition of ourthe present portfolio (including vehicle brand, term, risk evaluation and new/used vehicles), trends in historical and projected used vehicle values, and economic conditions. AdditionsEstimates from these models rely on historical information and may not fully reflect losses inherent in the present portfolio. Therefore, Ford Credit may adjust the estimate to reflect management judgment regarding justifiable changes in recent economic trends and conditions, portfolio composition, and other relevant factors.
Ford Credit makes projections of two key assumptions to assist in estimating the consumer allowance for credit losses:
Frequency - number of finance receivables that are expected to default over the loss emergence period, measured as repossessions
Loss severity - expected difference between the amount a customer owes when the finance contract is charged off and the amount received, net of expenses from selling the repossessed vehicle, including any recoveries from the customer
FORD MOTOR COMPANY AND SUBSIDIARIES
NOTES TO THE FINANCIAL STATEMENTS
NOTE 9. ALLOWANCE FOR CREDIT LOSSES (Continued)
Collective Allowance for Credit Losses. The consumer receivables portfolio allowance is evaluated primarily using a collective loss-to-receivables ("LTR") model that, based on historical experience, indicates credit losses have been incurred in the portfolio even though the particular receivables that are uncollectible cannot be specifically identified. The LTR model is based on the most recent years of history. Each LTR is calculated by dividing credit losses by average end-of-period receivables excluding unearned interest supplements and allowance for credit losses. A weighted-average LTR is calculated for each class of consumer receivables and multiplied by the end-of-period receivable balances for that given class.
The loss emergence period ("LEP") is a key assumption within Ford Credit's models and represents the average amount of time between when a loss event first occurs and when it is charged off. This time period starts when the consumer begins to experience financial difficulty. It is evidenced later, typically through delinquency, before eventually resulting in a charge-off. The LEP is a multiplier in the calculation of the collective consumer allowance for credit losses.
For consumer receivables greater than 120 days past due, the uncollectible portion of the receivable is charged-off, such that the remaining recorded investment in the loan is equal to the estimated fair value of the collateral less costs to sell.
Specific Allowance for Impaired Receivables. Consumer receivables involved in TDRs are specifically assessed for impairment. A specific allowance is estimated based on the present value of the expected future cash flows of the receivable discounted at the loan's original effective interest rate or the fair value of any collateral adjusted for estimated costs to sell.
After establishing the collective and specific allowance for credit losses, are made by recording charges to Financial Services provision for credit and insurance losses on our consolidated statement of operations. Finance receivables, investments in direct financing leases, and investments in operating leases are charged toif management believes the allowance for creditdoes not reflect all losses atinherent in the earlier of whenportfolio due to changes in recent economic trends and conditions, or other relevant factors, an accountadjustment is deemed to be uncollectible or when an account is 120 days delinquent, taking into consideration the financial condition of the borrower or lessee, the value of the collateral, recourse to guarantors and other factors. Recoveriesmade based on finance receivables and investments in leases previously charged off as uncollectible are credited to the allowance for credit losses.management judgment.
Non-Consumer Receivables
Changes in Allowance forFord Credit Losses
Changes inestimates the allowance for credit losses for financenon-consumer receivables investment in direct financing leases,based on historical LTR ratios, expected future cash flows, and investment in operating leases were as follows (in millions):the fair value of collateral.
| | | | | | | | | | |
Beginning balance | | $ | 1,681 | | | $ | 1,102 | | | $ | 1,121 | |
Provision for credit losses | | | 977 | | | | 1,773 | | | | 592 | |
| Total charge-offs and recoveries | | | | | | | | | | | | |
Charge-offs | | | (1,526 | ) | | | (1,552 | ) | | | (1,105 | ) |
Recoveries | | | 423 | | | | 414 | | | | 470 | |
Net charge-offs | | | (1,103 | ) | | | (1,138 | ) | | | (635 | ) |
| Other changes, principally amounts related to finance receivables sold and translation adjustments | | | 10 | | | | (56 | ) | | | 24 | |
Ending balance | | $ | 1,565 | | | $ | 1,681 | | | $ | 1,102 | |
Specific Allowance for Impaired Receivables. The decrease inwholesale and dealer loan portfolio is evaluated by grouping individual loans into risk pools determined by the risk characteristics of the loan (such as the amount of the loan, the nature of the collateral, and the financial status of the debtor). The risk pools are analyzed to determine whether individual loans are impaired, and a specific allowance is estimated based on the present value of the expected future cash flows of the receivable discounted at the loan's original effective interest rate or the fair value of the collateral adjusted for estimated costs to sell.
After establishment of the collective and the specific allowance for credit losses, primarily reflectedif management believes the declineallowance does not reflect all losses inherent in receivablesthe portfolio due to changes in recent economic trends and the related charge-offs. At December 31, 2009, Ford Credit's allowance for credit losses included about $215 million that wasconditions or other relevant factors, an adjustment is made based on management's judgment regarding higher retail installment and lease repossession assumptions and higher wholesale and dealer loan default assumptions compared with historical trends used in Ford Credit's models. At December 31, 2008, Ford Credit's allowance for credit losses included about $210 million that was based on management's judgment regarding higher severity assumptions. At December 31, 2007, Ford Credit's allowance for credit losses did not include any adjustments for management judgment.
FORD MOTOR COMPANY AND SUBSIDIARIES
NOTES TO THE FINANCIAL STATEMENTS
NOTE 9. ALLOWANCE FOR CREDIT LOSSES (Continued)
Following is an analysis of the allowance for credit losses related to finance receivables and investment in operating leases for the years ended December 31 (in millions):
|
| | | | | | | | | | | | | | | | | | | |
| | 2011 |
| | Finance Receivables | | Net Investment in Operating Leases | | |
| | Consumer | | Non-consumer | | Total | | | Total Allowance |
| Allowance for credit losses | | | | | | | | | |
| Beginning balance | $ | 707 |
| | $ | 70 |
| | $ | 777 |
| | $ | 87 |
| | $ | 864 |
|
| Charge-offs | (405 | ) | | (11 | ) | | (416 | ) | | (89 | ) | | (505 | ) |
| Recoveries | 207 |
| | 7 |
| | 214 |
| | 86 |
| | 300 |
|
| Provision for credit losses | (51 | ) | | (22 | ) | | (73 | ) | | (44 | ) | | (117 | ) |
| Other (a) | (1 | ) | | — |
| | (1 | ) | | — |
| | (1 | ) |
| Ending balance | $ | 457 |
| | $ | 44 |
| | $ | 501 |
| | $ | 40 |
| | $ | 541 |
|
| | | | | | | | | | |
Analysis of ending balance of allowance for credit losses | |
| | |
| | |
| | |
| | |
|
| Collective impairment allowance | $ | 441 |
| | $ | 36 |
| | $ | 477 |
| | $ | 40 |
| | $ | 517 |
|
| Specific impairment allowance | 16 |
| | 8 |
| | 24 |
| | — |
| | 24 |
|
| Ending balance | $ | 457 |
| | $ | 44 |
| | $ | 501 |
| | $ | 40 |
| | $ | 541 |
|
| | | | | | | | | | |
| Analysis of ending balance of finance receivables and net investment in operating leases | |
| | |
| | |
| | |
| | |
|
| Collectively evaluated for impairment | $ | 47,364 |
| | $ | 26,016 |
| | $ | 73,380 |
| | $ | 11,522 |
| | |
|
| Specifically evaluated for impairment | 387 |
| | 64 |
| | 451 |
| | — |
| | |
|
| Recorded investment (b) | $ | 47,751 |
| | $ | 26,080 |
| | $ | 73,831 |
| | $ | 11,522 |
| | |
|
| | | | | | | | | | |
| Ending balance, net of allowance for credit losses | $ | 47,294 |
| | $ | 26,036 |
| | $ | 73,330 |
| | $ | 11,482 |
| | |
|
__________
| |
| (a) | Primarily represents amounts related to translation adjustments. |
| |
| (b) | Finance receivables and net investment in operating leases before allowance for credit losses. |
|
| | | | | | | | | | | | | | | | | | | |
| | 2010 |
| | Finance Receivables | | Net Investment in Operating Leases | | |
| | Consumer | | Non-consumer | | Total | | | Total Allowance |
| Allowance for credit losses | | | | | | | | | |
| Beginning balance | $ | 1,271 |
| | $ | 80 |
| | $ | 1,351 |
| | $ | 214 |
| | $ | 1,565 |
|
| Charge-offs | (606 | ) | | (41 | ) | | (647 | ) | | (200 | ) | | (847 | ) |
| Recoveries | 247 |
| | 34 |
| | 281 |
| | 138 |
| | 419 |
|
| Provision for credit losses | (195 | ) | | (2 | ) | | (197 | ) | | (65 | ) | | (262 | ) |
| Other (a) | (10 | ) | | (1 | ) | | (11 | ) | | — |
| | (11 | ) |
| Ending balance | $ | 707 |
| | $ | 70 |
| | $ | 777 |
| | $ | 87 |
| | $ | 864 |
|
| | | | | | | | | | |
Analysis of ending balance of allowance for credit losses | |
| | |
| | |
| | |
| | |
|
| Collective impairment allowance | $ | 707 |
| | $ | 58 |
| | $ | 765 |
| | $ | 87 |
| | $ | 852 |
|
| Specific impairment allowance | — |
| | 12 |
| | 12 |
| | — |
| | 12 |
|
| Ending balance | $ | 707 |
| | $ | 70 |
| | $ | 777 |
| | $ | 87 |
| | $ | 864 |
|
| | | | | | | | | | |
| Analysis of ending balance of finance receivables and net investment in operating leases | |
| | |
| | |
| | |
| | |
|
| Collectively evaluated for impairment | $ | 49,640 |
| | $ | 24,300 |
| | $ | 73,940 |
| | $ | 10,480 |
| | |
|
| Specifically evaluated for impairment | — |
| | 102 |
| | 102 |
| | — |
| | |
|
| Recorded investment (b) | $ | 49,640 |
| | $ | 24,402 |
| | $ | 74,042 |
| | $ | 10,480 |
| | |
|
| | | | | | | | | | |
| Ending balance, net of allowance for credit losses | $ | 48,933 |
| | $ | 24,332 |
| | $ | 73,265 |
| | $ | 10,393 |
| | |
|
__________
| |
| (a) | Primarily represents amounts related to translation adjustments. |
| |
| (b) | Finance receivables and net investment in operating leases before allowance for credit losses. |
FORD MOTOR COMPANY AND SUBSIDIARIES
NOTES TO THE FINANCIAL STATEMENTS
NOTE 10. INVENTORIES
All inventories are stated at the lower of cost or market. Cost for a substantial portion of U.S. inventories is determined on a last-in, first-out ("LIFO") basis. LIFO was used for approximately 28% and 24%32% of total inventories at
December 31, 20092011 and 2008, respectively.2010. Cost of other inventories is determined onby costing methods that approximate a first-in, first-out ("FIFO") basis.
Inventories at December 31 were as follows (in millions):
| | | | | | | | | | 2011 | | 2010 |
Raw materials, work-in-process and supplies | | $ | 2,783 | | | $ | 2,747 | | $ | 2,847 |
| | $ | 2,812 |
|
Finished products | | | 3,465 | | | | 5,091 | | 3,982 |
| | 3,970 |
|
Total inventories under FIFO | | | 6,248 | | | | 7,838 | | 6,829 |
| | 6,782 |
|
Less: LIFO adjustment | | | (798 | ) | | | (850 | ) | (928 | ) | | (865 | ) |
Total inventories | | $ | 5,450 | | | $ | 6,988 | | $ | 5,901 |
| | $ | 5,917 |
|
At December 31, 2009, inventory quantities were reduced, resulting in a liquidation of LIFO inventory quantities carried at lower costs prevailing in prior years as compared with the cost of 2009 purchases, the effect of which decreased Automotive cost of sales by about $33 million.
NOTE 11. EQUITY IN NET ASSETS OF AFFILIATED COMPANIES
We use the equity method of accounting for our investments in entities over which we do not have control, or of which we are not the primary beneficiary, but over whose operating and financial policies we are able to exercise significant influence.
Ownership Percentages and Investment Balances
The following table reflects our ownership percentages at December 31, 2009,2011, and balancescarrying value of equity method investments at December 31, 20092011 and 20082010 (in millions, except percentages):
| | | | | | | | | | | | | | |
| | | | | | | | | | | | | Investment Balance |
| Automotive Sector | | | | | | | | | | Ownership Percentage | | 2011 | | 2010 |
AutoAlliance (Thailand) Co., Ltd ("AAT"). | | | 50.0 | % | | $ | 301 | | | $ | 258 | | |
| S.C. Automobile Craiova SA. ("ACSA") * | | | 97.1 | | | | 289 | | | | 24 | | |
Changan Ford Mazda Automobile Corporation, Ltd | | | 35.0 | | | | 247 | | | | 189 | | 35.0 | % | | $ | 468 |
| | $ | 313 |
|
Jiangling Motors Corporation, Ltd | | | 30.0 | | | | 238 | | | | 191 | | 30.0 |
| | 373 |
| | 307 |
|
Ford Motor Company Capital Trust II ("Trust II") | | | 5.0 | | | | 155 | | | | 155 | | |
| AutoAlliance International, Inc | | 50.0 |
| | 372 |
| | 293 |
|
| Ford Otomotiv Sanayi Anonim Sirketi ("Ford Otosan") | | 41.0 |
| | 369 |
| | 414 |
|
| AutoAlliance (Thailand) Co., Ltd. | | 50.0 |
| | 367 |
| | 338 |
|
| FordSollers Netherlands B.V. ("FordSollers") (a) | | 50.0 |
| | 361 |
| | — |
|
| Getrag Ford Transmissions GmbH ("GFT") | | 50.0 |
| | 229 |
| | 227 |
|
| S.C. Automobile Craiova S.A. ("ACSA") (a) | | 100.0 |
| | 92 |
| | 223 |
|
Tenedora Nemak, S.A. de C.V. | | | 6.8 | | | | 64 | | | | 74 | | 6.8 |
| | 68 |
| | 67 |
|
| Changan Ford Mazda Engine Company, Ltd. | | 25.0 |
| | 33 |
| | 32 |
|
| DealerDirect LLC | | 97.7 |
| | 18 |
| | 20 |
|
| OEConnection LLC | | 33.3 |
| | 13 |
| | 13 |
|
| Percepta, LLC | | 45.0 |
| | 7 |
| | 6 |
|
Blue Diamond Truck, S. de R.L. de C.V. | | | 25.0 | | | | 45 | | | | 33 | | 25.0 |
| | 7 |
| | 6 |
|
Getrag Asia Pacific GmbH & Co. KG | | | 25.0 | | | | 33 | | | | 29 | | |
Changan Ford Mazda Engine Company, Ltd. | | | 25.0 | | | | 19 | | | | 15 | | |
OEConnection LLC | | | 33.0 | | | | 10 | | | | 7 | | |
Ford Performance Vehicles Pty Ltd. | | | 49.0 | | | | 9 | | | | 8 | | 49.0 |
| | 6 |
| | 9 |
|
Percepta, LLC | | | 45.0 | | | | 6 | | | | 7 | | |
Blue Diamond Parts, LLC | | | 25.0 | | | | 5 | | | | 10 | | 25.0 |
| | 4 |
| | 6 |
|
Automotive Fuel Cell Cooperation Corporation ("AFCC") | | | 30.0 | | | | 3 | | | | 4 | | |
Getrag America Holdings GmbH CH ("Getrag America Holdings") | | | — | | | | — | | | | 19 | | |
| NuCellsys Holding GmbH ("NuCellsys") * | | | — | | | | — | | | | 18 | | |
| Automotive Fuel Cell Cooperation Corporation | | 30.0 |
| | 4 |
| | 4 |
|
| Ford Motor Company Capital Trust II ("Trust II") (b) | | — |
| | — |
| | 157 |
|
Other | | Various | | | | 5 | | | | 35 | | Various |
| | 6 |
| | 6 |
|
Total Automotive sector | | | | | | | 1,429 | | | | 1,076 | | |
| | 2,797 |
| | 2,441 |
|
| Financial Services Sector | | | | | | | | | | | | | |
| | |
| | |
|
Forso Nordic AB | | | 50.0 | | | | 67 | | | | 66 | | 50.0 |
| | 71 |
| | 71 |
|
FFS Finance South Africa (Pty) Limited | | | 50.0 | | | | 32 | | | | 34 | | 50.0 |
| | 43 |
| | 39 |
|
RouteOne LLC | | | 30.0 | | | | 18 | | | | 18 | | 30.0 |
| | 15 |
| | 14 |
|
DFO Partnership | | | — | | | | — | | | | 357 | | |
Other | | Various | | | | 4 | | | | 48 | | |
| CNF-Administradora de Consorcio National Ltda. | | 33.3 |
| | 10 |
| | 4 |
|
Total Financial Services sector | | | | | | | 121 | | | | 523 | | |
| | 139 |
| | 128 |
|
Total Company | | | | | | $ | 1,550 | | | $ | 1,599 | | |
| | $ | 2,936 |
| | $ | 2,569 |
|
__________
* | |
| (a) | See Note 2423 for discussion of this entity.further discussion. |
FORD MOTOR COMPANY AND SUBSIDIARIES
| |
| (b) | See Note 18 for further discussion. |
NOTES TO THE FINANCIAL STATEMENTS
NOTE 11. EQUITY IN NET ASSETS OF AFFILIATED COMPANIES (Continued)
We received $152$316 million $224, $337 million, and $216$299 million of dividends from these affiliated companies for the years ended December 31, 2009, 2008,2011, 2010, and 2007,2009, respectively.
FORD MOTOR COMPANY AND SUBSIDIARIES
NOTES TO THE FINANCIAL STATEMENTS
Changes in Equity Method Investments
Getrag America Holdings. In 2009, Getrag America Holdings changed its operating profile from a development stage enterprise to an operating business. Accordingly, we reconsidered the consolidation analysis and determined this to be a variable interest entity of which we are the primary beneficiary.
DFO Partnership. In March 2009, our Board of Directors approved a potential sale of the Financial Services sector investment in DFO Partnership. DFO Partnership holds a portfolio of "non-core" diversified leveraged lease assets (e.g., railcars, aircraft, and energy facilities). During the first quarter of 2009, an other-than-temporary impairment of the investment in DFO Partnership of $141 million was recorded in Financial Services equity in net income/(loss) of affiliated companies. During the third quarter of 2009, the Financial Services sector completed the sale of its interest in DFO Partnership to a subsidiary of Bank of America. As a result of the sale, a pre-tax gain of $9 million (net of transaction costs) was recognized in Financial Services other income/(loss), net.
NOTE 12. SIGNIFICANT UNCONSOLIDATED AFFILIATES
We are required to measure the impact of all unconsolidated majority-owned subsidiaries and equity-method investments to determine their significance to our financial statements. If the affiliates meet the defined thresholds of significance, certain financial disclosure data is required.
Mazda
Mazda was considered to be a significant unconsolidated affiliate in 2007. Presented below is summarized financial information for Mazda for 2008 and 2007.
For In November 2008, we sold 278 million shares of Mazda for net proceeds of $532 million. As a result2011, none of the transaction, we recorded a pre-tax loss onaffiliates met the saledefined thresholds of $121 million, net of transaction costs and recognition of foreign currency translation adjustments, in Automotive interest income and other non-operating income/(expense), net. We continue to own 195.5 million shares of Mazda, representing an 11% ownership interest. We no longer have certain management rights we previously held and, as a result, we have deemed that we no longer hold significant influence over Mazda's operating and financial policies. Consequently, we account for our remaining investment of $447 million as of December 31, 2009 as a marketable security.significance.
As a result, we had no equity in net assets of affiliated companies at December 31, 2008 associated with our investment in Mazda. Our investment in Mazda included $0 of goodwill included in Equity in net assets of affiliated companies at December 31, 2008. Dividends received from Mazda were $27 million and $36 million for the years ended December 31, 2008 and 2007, respectively.
Summarized income statement information from Mazda's published financial statements, prepared in accordance with Japanese GAAP, for the twelve months ended September 30, 2008 and 2007, and summarized balance sheet information from Mazda's published financial statements at September 30, 2008 and 2007 is as follows (in millions):
| | | | | | | |
Net sales | | $ | 31,422 | | | $ | 28,108 | |
Cost and expenses | | | 30,036 | | | | 26,763 | |
Income from continuing operations | | | 889 | | | | 698 | |
Net income/(loss) | | | 854 | | | | 628 | |
| | | | | | | | | |
Total assets | | $ | 19,548 | | | $ | 16,776 | |
Total liabilities | | | 14,067 | | | | 12,430 | |
FORD MOTOR COMPANY AND SUBSIDIARIES
NOTES TO THE FINANCIAL STATEMENTS
NOTE 12. SIGNIFICANT UNCONSOLIDATED AFFILIATES (Continued)
Included in our Automotive equity in net income/(loss) of affiliated companies was the following income for the years ended December 31 (in millions):
| | | | | | | |
Ford's share of Mazda's net income/(loss) | | $ | 25 | | | $ | 189 | |
Ford's share of Mazda's net income/(loss) in the table above represents our share of Mazda's results on a U.S. GAAP basis. For 2008, our share includes a charge as determined under U.S. GAAP representing the impact on us of a goodwill impairment related to Mazda-owned dealerships in Japan.
NOTE 13. VARIABLE INTEREST ENTITIES
A VIE is an entity that either (i) has insufficient equity to permit the entity to finance its activities without additional subordinated financial support or (ii) has equity investors who lack the characteristics of a controlling financial interest. A VIE is consolidated by its primary beneficiary. The primary beneficiary ishas both the power to direct the activities that most significantly impact the entity's economic performance and the obligation to absorb losses or the right to receive benefits from the entity that absorbs the majority of the risk for the variability in the VIE's assets. A variable interest is a contractual, ownership, or other interest that changes with changes in the fair value of the VIE's net assets.
We use qualitative analysiscould potentially be significant to determine whether or not we need to consolidate a VIE. We consider the rights and obligations conveyed by variable interests to determine whether we will absorb a majority of a VIE's expected losses, receive a majority of its expected residual returns, or both. If so, we consolidate the VIE.
The liabilities recognizedWe have the power to direct the activities of an entity when our management has the ability to make key operating decisions, such as decisions regarding capital or product investment or manufacturing production schedules. We have the power to direct the activities of our special purpose entities when we have the ability to exercise discretion in the servicing of financial assets, issue additional debt, exercise a result of consolidating these VIEs do not necessarily represent additional claims on our general assets; rather, they represent claims against the specificunilateral call option, add assets of the consolidated VIEs. Conversely, assetsto revolving structures, or control investment decisions.
Assets recognized as a result of consolidating these VIEs do not represent additional assets that could be used to satisfy claims against our general assets. Conversely, liabilities recognized as a result of consolidating these VIEs do not represent additional claims on our general assets; rather, they represent claims against the specific assets of the consolidated VIEs.
Automotive Sector
VIEs of which we are the primary beneficiary:
We have contractual agreements with the VIEs we consolidate to purchase the majority, and in some cases substantially all, of the entity's output under a cost-plus-margin arrangement and/or volume-dependent pricing. These contractual arrangements may require us to absorb entity losses when production volume targets are not met and/or allow us to receive bonuses when production volume targets are exceeded. Described below are the significant VIEs we consolidated as of At December 31, 2009:
AutoAlliance International, Inc. ("AAI") is a 50/50 joint venture with Mazda in North America, engaged in the manufacture of automobiles on behalf of Ford and Mazda, primarily for sale in North America.
First Aquitaine operates a transmission plant in Bordeaux, France which manufactures automatic transmissions for Ford Explorer, Ranger, and Mustang vehicles. During the second quarter of 2009,2010, we transferred legal ownership of First Aquitaine to HZ Holding France. We also entered into a volume-dependent pricing agreement with the new owner to purchase transmissions through the end of the product cycle. As a result, we now consider this entity to be ahad one VIE of which we arewere the primary beneficiary. See Note 4 for discussion of the impairment of our investment in this plant.
Ford Otosan is a 41/41/18 joint venture in Turkey with the Koc Group of Turkey and public investors. Ford Otosan is a supplier of the Ford Transit Connect model, and an assembly supplier of the Ford Transit van model, both of which we sell primarily in Europe.
Getrag Ford Transmissionsbeneficiary - Cologne Precision Forge GmbH ("GFT"CPF") is a 50/50 joint venture with Getrag Deutsche Venture GmbH and Co. KG. and is the primary supplier of manual transmissions for use in our European vehicles.
FORD MOTOR COMPANY AND SUBSIDIARIES
NOTES TO THE FINANCIAL STATEMENTS
NOTE 13. VARIABLE INTEREST ENTITIES (Continued)
Getrag All Wheel Drive AB is a 40/60 joint venture between Volvo Cars and Getrag Dana Holding GmbH. The joint venture produces all-wheel-drive components. The assets and liabilities associated with this joint venture that were classified during the first quarter of 2009 as held for sale are shown in the table below and are included in the assets and liabilities of Volvo classified as held-for-sale operations in Note 24.
Pininfarina Sverige, AB is a 40/60 joint venture between Volvo Cars and Pininfarina, S.p.A. The joint venture was established to engineer and manufacture niche vehicles. The assets and liabilities associated with this joint venture that were classified as held for sale during the first quarter of 2009 are shown in the table below and are included in the assets and liabilities of Volvo classified as held-for-sale operations in Note 24.
, formerly Tekfor Cologne GmbH ("Tekfor") isGmbH. CPF was a 50/50/50 joint venture with Neumayer Tekfor GmbH. TekforGmbH ("Neumayer") to which Ford transferred the operations of its Cologne forge plant in 2003. CPF produces transmissionforged components, primarily for transmissions and chassis, components for use in our vehicles. DuringFord vehicles and for sale to third parties. On December 21, 2010, Ford and Neumayer signed an agreement pursuant to which Neumayer would withdraw from the fourth quarterjoint venture and sell its shares in the joint venture to Ford. The agreement became effective in March 2011 and CPF is now a wholly-owned subsidiary of 2009, Ford initiated a revolving loan agreement with Tekfor for $12.8 million. This loan is being used by Tekfor to refinance external debt.Ford.
WeAt December 31, 2009, in addition to CPF, we also holdheld interests in certain dealerships in North America. At December 31, 2009 there were approximately 13 dealerships consolidatedAmerica as a part of our Dealer Development program. We supplyThroughout 2009, we sold our ownership interest and financeliquidated most of these dealerships. As at December 31, 2010, we consolidated the majority of vehicles and parts for theseremaining dealerships andunder the operators have a contract to buy our equityvoting interest over a period of time. See Note 4 for discussion of the impairment of our investment in these assets.model.
The total consolidated VIE assets and liabilities reflected on our December 31 balance sheet arewere as follows (in millions):
| Assets | | | | | | |
Cash and cash equivalents | | $ | 574 | | | $ | 665 | |
Receivables | | | 578 | | | | 518 | |
Inventories | | | 513 | | | | 1,117 | |
Net property | | | 2,294 | | | | 2,136 | |
Assets of held-for-sale operations | | | 330 | | | | 318 | |
Other assets | | | 236 | | | | 297 | |
Total assets | | $ | 4,525 | | | $ | 5,051 | |
| Liabilities | | | | | | | | |
Trade payables | | $ | 628 | | | $ | 516 | |
Accrued liabilities | | | 327 | | | | 324 | |
Debt | | | 851 | | | | 972 | |
Liabilities of held-for-sale operations | | | 105 | | | | 97 | |
Other liabilities | | | 230 | | | | 167 | |
Total liabilities | | $ | 2,141 | | | $ | 2,076 | |
| | | | | | | | | |
Equity attributable to noncontrolling interests | | $ | 1,267 | | | $ | 1,168 | |
FORD MOTOR COMPANY AND SUBSIDIARIES |
| | | |
| Assets | 2010 |
| Cash and cash equivalents | $ | 9 |
|
| Other receivables, net | 13 |
|
| Inventories | 19 |
|
| Net property | 31 |
|
| Other assets | 2 |
|
| Total assets | $ | 74 |
|
| Liabilities | |
|
| Payables | $ | 16 |
|
| Total liabilities | $ | 16 |
|
NOTES TO THE FINANCIAL STATEMENTS
NOTE 13. VARIABLE INTEREST ENTITIES (Continued)
The financial performance of the consolidated VIEs reflected on our statement of operations is as follows (in millions):at December 31, 2011, 2010, and 2009 includes consolidated sales of $10 million, $58 million, and $1,907 million, respectively, and consolidated cost of sales, selling, administrative, and interest expense of $9 million, $66 million, and $2,071 million, respectively.
FORD MOTOR COMPANY AND SUBSIDIARIES
NOTES TO THE FINANCIAL STATEMENTS
| | | | | | | | | | |
Sales | | $ | 4,581 | | | $ | 7,191 | | | $ | 7,753 | |
| Costs and expenses | | | | | | | | | | | | |
Cost of sales | | | 3,661 | | | | 6,154 | | | | 6,166 | |
Selling, administrative and other expenses | | | 451 | | | | 749 | | | | 814 | |
Total costs and expenses | | | 4,112 | | | | 6,903 | | | | 6,980 | |
Operating income/(loss) | | | 469 | | | | 288 | | | | 773 | |
| | | | | | | | | | | | | |
Interest expense | | | 39 | | | | 82 | | | | 55 | |
| | | | | | | | | | | | | |
Interest income and other non-operating income/(expense), net | | | 17 | | | | 55 | | | | 40 | |
Equity in net income/(loss) of affiliated companies | | | — | | | | (3 | ) | | | (1 | ) |
Income/(Loss) before income taxes – Automotive | | | 447 | | | | 258 | | | | 757 | |
| | | | | | | | | | | | | |
Provision for/(Benefit from) income taxes | | | 130 | | | | 46 | | | | 172 | |
Income/(Loss) from continuing operations | | | 317 | | | | 212 | | | | 585 | |
Income/(Loss) from discontinued operations | | | — | | | | — | | | | — | |
Net income/(loss) | | | 317 | | | | 212 | | | | 585 | |
| | | | | | | | | | | | | |
Less: Income/(Loss) attributable to noncontrolling interests | | | 231 | | | | 202 | | | | 322 | |
Net income/(loss) attributable to Ford Motor Company | | $ | 86 | | | $ | 10 | | | $ | 263 | |
VIEs of which we are not the primary beneficiary:
In 2005, as part of the transaction to sell our interest in The Hertz CorporationGetrag Ford Transmissions GmbH ("Hertz"GFT"), we provided cash-collateralized letters of credit to support the payment obligations of Hertz Vehicle Financing LLC, is a joint venture that constitutes a significant VIE which is wholly owned by Hertz and of which we are not the primary beneficiary, and which was not consolidated as of December 31, 2011 or December 31, 2010. GFT is a 50/50 joint venture with Getrag Deutsche Venture GmbH and Co. KG. Ford and its related parties purchase substantially all of the joint venture's output. We do not, however, have the power to direct economically significant activities of the joint venture.
Zeledyne, LLC ("Zeledyne") is a VIE (that is not a joint venture) of which we are not the primary beneficiary as of
December 31, 2011 or December 31, 2010. Zeledyne manufactures and sells glass products for automotive glass markets. Ford provides certain guarantees to Zeledyne. On April 1, 2011, Zeledyne sold a portion of its glass business to Central Glass. As the guarantees are still in place, Zeledyne remains a VIE of which Ford is not the primary beneficiary. The carrying value of our obligation relatedrelating to these letters of credit, which will expire no later than December 21, 2011, was approximately $9 millionthe guarantees to Zeledyne's shareholders at December 31, 2009.2011 and 2010 was $6 million and $10 million, respectively.
Ford Motor Company Capital Trust II ("Trust II") was a VIE of which we were not the primary beneficiary as of December 31, 2010. On March 15, 2011, Ford redeemed the Subordinated Convertible Debentures due to Trust II and, as a result, Trust II was liquidated. For additional discussion of these letters of credit,Trust II, see Note 31.18.
We also have investments in unconsolidated subsidiaries determined to be VIEs of which we are not the primary beneficiary. These investments, described below, are accounted for as equity method investments and are included in Equity in net assets of affiliated companies.
AAT is a 50/50 joint venture with Mazda in Thailand. AAT is engaged in the manufacture of automobiles on behalf of Ford and Mazda for the Thai domestic market and for export markets through Ford and Mazda. Ford and Mazda share equally the risks and rewards of the joint venture.
Trust II was formed in 2002. We own 100% of Trust II's common stock which is equal to 5% of Trust II's total equity.
Our maximum exposure to loss from VIEs of which we are not the primary beneficiary at December 31 is was as follows (in millions):
| | | | | | | | | Change in Maximum Exposure | |
Investments | | $ | 456 | | | $ | 413 | | | $ | 43 | |
Liabilities | | | (30 | ) | | | (38 | ) | | | 8 | |
Guarantees (off-balance sheet) | | | 370 | | | | 362 | | | | 8 | |
Total maximum exposure | | $ | 796 | | | $ | 737 | | | $ | 59 | |
This includes a guarantee of a line of credit on behalf of AAT for plant expansion.
FORD MOTOR COMPANY AND SUBSIDIARIES
NOTES TO THE FINANCIAL STATEMENTS
NOTE 13. VARIABLE INTEREST ENTITIES (Continued) |
| | | | | | | | | | | |
| | 2011 | | 2010 | | Change in Maximum Exposure |
| Investments | $ | 229 |
| | $ | 417 |
| | $ | (188 | ) |
| Guarantees | 6 |
| | 10 |
| | (4 | ) |
| Total maximum exposure | $ | 235 |
| | $ | 427 |
| | $ | (192 | ) |
Financial Services Sector
VIEs of which Ford Credit iswe are the primary beneficiary:
Ford CreditOur Financial Services sector uses special-purposespecial purpose entities to issue asset-backed securities in transactions to public and private investors, bank conduits, and government-sponsored entities or others who obtain funding from government programs. We have deemed most of these special purpose entities to be VIEs. The asset-backed securities are secured by the expected cash flows from finance receivables and interests in net investments in operating leases. The expected cash flows from these assets have been legally sold but Ford Credit retainscontinue to be consolidated by our Financial Services sector. We retain interests in itsthe securitization transactions,VIEs, including senior andprimarily subordinated securities issued by the VIEs and rights to cash held for the benefit of the securitization investors such as cash reserves, and residual interests. Therefore, the assets continue to be consolidated by Ford Credit.investors.
The VIE transactions create and pass along risks to the variable interest holders, depending on the assets securing the debt and the specific terms of the transactions.
Ford Credit Our Financial Services sector aggregates and analyzes itsthe following transactions based on the risk profile of the product and the type of funding structure, including:
| · | Retail transactions –Retail - consumer credit risk and prepayment riskWholesale - dealer credit risk Net investments in operating lease - vehicle residual value risk, consumer credit risk, and prepayment risk and prepayment risk. |
| · | Wholesale transactions – dealer credit risk. |
| · | Net investments in operating lease transactions – vehicle residual value risk, consumer credit risk, and prepayment risk. |
As residual interest holder, Ford Credit iswe are exposed to underlying residual and credit risk of the collateral, and may beare exposed to interest rate risk. However, this risk is not incremental to the exposure Ford Credit has on the underlying assets. Ford Credit's residual interest in these transactions was $27.2 billion and $18.2 billion at December 31, 2009 and 2008, respectively.some transactions. The amount of risk absorbed by Ford Credit'sour residual interests generally is generally represented by and limited to the amount of overcollaterization of itsthe assets securing the debt and any cash reserves.
FORD MOTOR COMPANY AND SUBSIDIARIES
NOTES TO THE FINANCIAL STATEMENTS
NOTE 13. VARIABLE INTEREST ENTITIES (Continued)
Ford Credit hasWe have no obligation to repurchase or replace any securitized asset that subsequently becomes delinquent in payment or otherwise is in default.default, except under standard representations and warranties such as good and marketable title to the assets, or when certain changes are made to the underlying asset contracts. Securitization investors have no recourse to Ford Creditour Financial Services sector or its other assets for credit losses on the securitized assets, and have no right to require Ford Creditus to repurchase the investments. We generally have no obligation to provide liquidity or contribute cash or additional assets to the VIEs and do not guarantee any asset-backed securities, although Ford Credit is the co-obligor of the debt of a consolidated VIE up to $250 million for two of its securitization transactions. Ford Credit may be required to support the performance of certain securitization transactions, however, by increasing cash reserves.
Although not contractually required, Ford Credit regularly supports theirits wholesale securitization programs by repurchasing receivables of a dealer from the VIEs when the dealer's performance is at risk, which transfers the corresponding risk of loss from the VIE to Ford Credit. In order to continue to fund the wholesale receivables, Ford Credit also may contribute additional cash or wholesale receivables if the collateral falls below the required level.levels. The balances of cash related to these contributions were $0 and $179 million$0 at December 31, 20092011 and 2008, respectively,2010, and ranged from $0$0 to $1.4$490 million during 2011 and ranged from $0 to $1.4 billion and $0 to $2.2 billion during 2009 and 2008, respectively.2010. In addition, while not contractually required, Ford Credit may purchase the commercial paper issued by Ford Credit's FCAR Owner Trust retail securitization program.
During 2009, Ford Credit elected to provide additional enhancements or repurchase specific senior or subordinated notes in order to address market conditions. From time to time, Ford Credit renegotiates the terms of its funding commitments and may reallocate the commitments globally. Ford Credit does not guarantee any asset-backed securities and generally has no obligation to provide liquidity or contribute cash or additional assets to the VIEs. In certain securitization transactions, Ford Credit has dynamic enhancements where Ford Credit is required to support the performance of the securitization transactions by purchasing additional subordinated notes or increasing cash reserves.commercial paper program ("FCAR").
VIEs that are exposed to interest rate or currency risk have reduced their exposurerisks by entering into derivatives.derivative transactions. In certain instances, Ford Credit has entered into offsetting derivative transactions with the VIE to protect the VIE from thesethe risks that are not mitigated through the derivative transactions between the VIE and its external counterparty. In other instances, Ford Credit has entered into derivative transactions with the counterparty to protect the counterparty from risks absorbed through derivative transactions with the VIEs. See Note 264 and Note 25 for additional information regarding Ford Credit's derivatives.
Finance receivables and net investment in operating leases that secure the debt of the VIE remain on Ford Credit's balance sheet and therefore are not included in the VIE assets shown in the following table. As of December 31, 2009, the carrying values of the assets were $41.7 billion of retail receivables, $16.5 billion of wholesale receivables, and $10.4 billion of net investment in operating leases. As of December 31, 2008, the carrying values of the assets were $41.9 billion of retail receivables, $19.6 billion of wholesale receivables, and $15.6 billion of net investment in operating leases.
The totalfollowing table includes assets to be used to settle the liabilities of the consolidated VIEVIEs. We may retain debt issued by consolidated VIEs and this debt is excluded from the table below. We hold the right to the excess cash flows from the assets that are not needed to pay liabilities of the consolidated VIEs. The assets and liabilities that support Ford Credit's securitization transactionsdebt reflected on our consolidated balance sheet at December 31 balance sheet arewere as follows (in millions)billions):
| | | | | | | | |
| | | Cash & Cash Equivalents (a) | | | | | | Cash & Cash Equivalents (a) | | | | | | | | | | | |
| VIEs by asset class | | | | | | | | | | | | | |
| | | 2011 |
| | | Cash and Cash Equivalents | | Finance Receivables, Net and Net Investment in Operating Leases | | Debt |
| Finance receivables | | | | | | |
Retail | | $ | 3,132 | | | $ | 31,243 | | | $ | 2,673 | | | $ | 34,507 | | $ | 2.5 |
| | $ | 31.9 |
| | $ | 26.0 |
|
Wholesale | | | 402 | | | | 8,349 | | | | 1,029 | | | | 15,537 | | 0.5 |
| | 17.9 |
| | 11.2 |
|
| Total finance receivables | | 3.0 |
| | 49.8 |
| | 37.2 |
|
Net investment in operating leases | | | 436 | | | | 6,561 | | | | 206 | | | | 12,005 | | 0.4 |
| | 6.4 |
| | 4.2 |
|
Total | | $ | 3,970 | | | $ | 46,153 | | | $ | 3,908 | | | $ | 62,049 | | |
| Total (a) | | $ | 3.4 |
| | $ | 56.2 |
| | $ | 41.4 |
|
__________
(a) | Additionally, Ford Credit's cash and cash equivalents securing the obligations of the VIEs that are not assets of the VIEs were $925 million and $949 million as of December 31, 2009 and 2008, respectively.
|
(b)(a) | Certain notes issued by the VIEs to affiliated companies served as collateral for accessing the European Central Bank ("ECB") open market operations program. This external funding of $1.8 billion and $308$246 million million at December 31, 2009 and 20020118, respectively, was not reflected as a liabilitydebt of the VIEs and is excluded from the table above, but was included in our consolidated liabilities.debt. The finance receivables backing this external funding are included in the table above. |
FORD MOTOR COMPANY AND SUBSIDIARIES
NOTES TO THE FINANCIAL STATEMENTS
NOTE 13. VARIABLE INTEREST ENTITIES (Continued)
|
| | | | | | | | | | | |
| | 2010 |
| | Cash and Cash Equivalents | | Finance Receivables, Net and Net Investment in Operating Leases | | Debt |
| Finance receivables | | | | | |
| Retail | $ | 2.9 |
| | $ | 33.9 |
| | $ | 27.1 |
|
| Wholesale | 0.4 |
| | 16.6 |
| | 10.1 |
|
| Total finance receivables | 3.3 |
| | 50.5 |
| | 37.2 |
|
| Net investment in operating leases | 0.8 |
| | 6.1 |
| | 3.0 |
|
| Total (a) | $ | 4.1 |
| | $ | 56.6 |
| | $ | 40.2 |
|
__________
| |
| (a) | Certain notes issued by the VIEs to affiliated companies served as collateral for accessing the ECB open market operations program. This external funding of $334 million at December 31, 2010 was not reflected as debt of the VIEs and is excluded from the table above, but was included in our consolidated debt. The finance receivables backing this external funding are included in the table above. |
Ford Credit's exposure based on the fair value of derivative instruments related to consolidated VIEs that support its securitization programstransactions at December 31 iswas as follows (in millions):
| | | | | | | |
| | | | | | | | | | | | | |
Total derivative financial instruments | | $ | 55 | | | $ | 528 | | | $ | 46 | | | $ | 808 | |
FS - 36 |
| | | | | | | | | | | | | | | |
| | 2011 | | 2010 |
| | Derivative Asset | | Derivative Liability | | Derivative Asset | | Derivative Liability |
| VIE – Securitization entities | $ | 157 |
| | $ | 97 |
| | $ | 26 |
| | $ | 222 |
|
| Ford Credit related to VIE | 81 |
| | 63 |
| | 134 |
| | 37 |
|
| Total including Ford Credit related to VIE (a) | $ | 238 |
| | $ | 160 |
| | $ | 160 |
| | $ | 259 |
|
__________FORD MOTOR COMPANY AND SUBSIDIARIES
NOTES TO THE FINANCIAL STATEMENTS
NOTE 13. VARIABLE INTEREST ENTITIES (Continued) | |
| (a) | Ford Credit derivative assets and liabilities are included in Other assets and Accrued liabilitiesand deferred revenue, respectively, on our consolidated balance sheet. |
The financial performance of the consolidated VIEs that support Ford Credit's securitization transactions reflected in our statement of operations isfor the years ended December 31 was as follows (in millions):
| | | | | | | |
| | | Derivative (Income)/ Expense | | | | | | Derivative (Income)/ Expense | | | | |
| VIEs by asset class | | | | | | | | | | | | |
Retail | | $ | 262 | | | $ | 957 | | | $ | 684 | | | $ | 1,725 | |
Wholesale | | | (3 | ) | | | 248 | | | | (47 | ) | | | 706 | |
Net investment in operating leases | | | 80 | | | | 473 | | | | 178 | | | | 622 | |
Total | | $ | 339 | | | $ | 1,678 | | | $ | 815 | | | $ | 3,053 | |
|
| | | | | | | | | | | | | | | | | | | | | | | |
| | 2011 | | 2010 | | 2009 |
| | Derivative Expense | | Interest Expense | | Derivative Expense | | Interest Expense | | Derivative Expense | | Interest Expense |
| VIEs financial performance | $ | 31 |
| | $ | 994 |
| | $ | 225 |
| | $ | 1,247 |
| | $ | 339 |
| | $ | 1,678 |
|
VIEs of which Ford Credit iswe are not the primary beneficiary:
Ford Credit has investmentsan investment in certainForso Nordic AB, a joint venturesventure determined to be VIEsa VIE of which it iswe are not the primary beneficiary. TheseThe joint ventures provideventure provides consumer and dealer financing in their respective markets. The joint ventures areits local markets and is financed by external debt and additional subordinated interest ofdebt provided by the joint venture partners.partner. The risksoperating agreement indicates that the power to direct economically significant activities is shared with the joint venture partner, and rewards associatedthe obligation to absorb losses or right to receive benefits resides primarily with Ford Credit's intereststhe joint venture partner. Our investment in thesethe joint ventures are based primarily on ownership percentages. Ford Credit's investments in these joint ventures areventure is accounted for as an equity method investmentsinvestment and areis included in Equity in net assets of affiliated companies.Other assets. Ford Credit's Our maximum exposure to any potential losses associated with these VIEsthis VIE is $67limited to its equity investment, and amounted to $71 million and $109 million at
December 31, 20092011 and 2008, respectively.2010.
FORD MOTOR COMPANY AND SUBSIDIARIES
NOTES TO THE FINANCIAL STATEMENTS
NOTE 14. NET PROPERTY AND LEASE COMMITMENTS
Net Property
Net property includes land, buildings and land improvements, machinery and equipment, special tools, and other assets that we use in our normal operations. These assets are recorded at cost, net of accumulated depreciation and impairments. We capitalize new assets when we expect to use the asset for more than one year and the acquisition cost is greater than $2,500.$2,500. Routine maintenance and repair costs are expensed when incurred.
Included in our carrying value is the estimated cost for legal obligations to retire, abandon, or dispose of the asset. These conditional asset retirement obligations relate to the estimated cost for asbestos abatement and PCB removal.
Property and equipment are depreciated primarily using the straight-line method over the estimated useful life of the asset. Useful lives range from 3 years to 36 years. The estimated useful lives generally are 14.5 years for machinery and equipment, 3 years for software (8 years for mainframe and client based software), and 30 years for buildings and land improvements. Special tools generally are amortized over the expected life of a product program using a straight-line method. If the expected production volumes for major product programs associated with the tools decline significantly, we accelerate the amortization reflecting the rate of decline.
Net property at December 31 was as follows (in millions):
| | | Automotive Sector | | | | | | | 2011 | | 2010 |
Land | | $ | 348 | | | $ | 409 | | $ | 384 |
| | $ | 336 |
|
Buildings and land improvements | | | 11,034 | | | | 10,797 | | 10,129 |
| | 10,348 |
|
Machinery, equipment and other | | | 40,220 | | | | 38,767 | | 34,363 |
| | 35,780 |
|
| Software | | 1,917 |
| | 1,888 |
|
Construction in progress | | | 1,325 | | | | 1,295 | | 1,311 |
| | 1,102 |
|
Total land, plant and equipment | | | 52,927 | | | | 51,268 | | |
| Total land, plant and equipment and other | | 48,104 |
| | 49,454 |
|
Accumulated depreciation | | | (35,404 | ) | | | (34,552 | ) | (32,874 | ) | | (33,900 | ) |
Net land, plant and equipment | | | 17,523 | | | | 16,716 | | |
| Net land, plant and equipment and other | | 15,230 |
| | 15,554 |
|
Special tools, net of amortization | | | 7,073 | | | | 7,214 | | 6,999 |
| | 7,473 |
|
Total Automotive sector | | | 24,596 | | | | 23,930 | | 22,229 |
| | 23,027 |
|
Financial Services sector* | | | 182 | | | | 213 | | |
Financial Services sector (a) | | 142 |
| | 152 |
|
Total Company | | $ | 24,778 | | | $ | 24,143 | | $ | 22,371 |
| | $ | 23,179 |
|
__________
* | |
| (a) | Included in Financial Services other assets on our sector balance sheet. |
FORD MOTOR COMPANY AND SUBSIDIARIES
NOTES TO THE FINANCIAL STATEMENTS
NOTE 14. NET PROPERTY AND LEASE COMMITMENTS (Continued)
Automotive sector property-related expenses for the years ended December 31 were as follows (in millions):
| | | | | | | | | | |
Depreciation and other amortization | | $ | 2,127 | | | $ | 6,584 | | | $ | 3,474 | |
Amortization of special tools | | | 1,967 | | | | 4,537 | | | | 3,289 | |
Total* | | $ | 4,094 | | | $ | 11,121 | | | $ | 6,763 | |
| | | | | | | | | | | | | |
Maintenance and rearrangement | | $ | 1,272 | | | $ | 1,839 | | | $ | 2,014 | |
__________
* | Includes impairments of long-lived assets for 2008. See Note 15 for additional information. |
|
| | | | | | | | | | | |
| | 2011 | | 2010 | | 2009 |
| Depreciation and other amortization | $ | 1,759 |
| | $ | 1,956 |
| | $ | 1,913 |
|
| Amortization of special tools | 1,774 |
| | 1,920 |
| | 1,830 |
|
| Total | $ | 3,533 |
| | $ | 3,876 |
| | $ | 3,743 |
|
| | | | | | |
| Maintenance and rearrangement | $ | 1,431 |
| | $ | 1,397 |
| | $ | 1,230 |
|
Conditional Asset Retirement Obligations
Included in our carrying value is the estimated cost for legal obligations to retire, abandon, or dispose of the asset. These conditional asset retirement obligations relate to the estimated cost for asbestos abatement and PCB removal.
Asbestos abatement was estimated using site-specific surveys where available and a per/square foot estimate where surveys were unavailable. PCB removal costs were based on historical removal costs per transformer and applied to transformers identified by a PCB transformer global survey we conducted.
FORD MOTOR COMPANY AND SUBSIDIARIES
NOTES TO THE FINANCIAL STATEMENTS
NOTE 14. NET PROPERTY AND LEASE COMMITMENTS (Continued)
The liability for our conditional asset retirement obligations which are recorded in Accrued liabilities and deferred revenue at December 31 was as follows (in millions):
| | | | | | | | | | 2011 | | 2010 |
Beginning balance | | $ | 360 | | | $ | 404 | | $ | 331 |
| | $ | 347 |
|
Liabilities settled | | | (6 | ) | | | (39 | ) | (6 | ) | | (7 | ) |
Revisions to estimates | | | (7 | ) | | | (3 | ) | (59 | ) | | (9 | ) |
Foreign currency translation | | | — | | | | (2 | ) | |
Ending balance | | $ | 347 | | | $ | 360 | | $ | 266 |
| | $ | 331 |
|
Lease Commitments
We lease land, buildings and equipment under agreements that expire inover various years.contractual periods. Minimum rental commitments under non-cancelable operating leaseslease commitments were as follows (in millions):
| | | | | | | | | | | | | | | | | | | | | | | | | 2012 | | 2013 | | 2014 | | 2015 | | 2016 | | Thereafter | | Total |
Automotive sector | | $ | 217 | | | $ | 163 | | | $ | 117 | | | $ | 90 | | | $ | 71 | | | $ | 211 | | | $ | 869 | | $ | 195 |
| | $ | 194 |
| | $ | 157 |
| | $ | 124 |
| | $ | 105 |
| | $ | 231 |
| | $ | 1,006 |
|
Financial Services sector | | | 92 | | | | 72 | | | | 54 | | | | 36 | | | | 20 | | | | 52 | | | | 326 | | 54 |
| | 42 |
| | 28 |
| | 22 |
| | 20 |
| | 41 |
| | 207 |
|
Total Company | | $ | 309 | | | $ | 235 | | | $ | 171 | | | $ | 126 | | | $ | 91 | | | $ | 263 | | | $ | 1,195 | | $ | 249 |
| | $ | 236 |
| | $ | 185 |
| | $ | 146 |
| | $ | 125 |
| | $ | 272 |
| | $ | 1,213 |
|
RentalOperating lease expense for the years ended December 31 was as follows (in billions)millions):
|
| | | | | | | | | | | |
| | 2011 | | 2010 | | 2009 |
| Automotive sector | $ | 416 |
| | $ | 475 |
| | $ | 624 |
|
| Financial Services sector | 124 |
| | 136 |
| | 149 |
|
| Total Company | $ | 540 |
| | $ | 611 |
| | $ | 773 |
|
| | | | | | | | | | |
Rental expense | | $ | 0.8 | | | $ | 1.0 | | | $ | 1.0 | |
NOTE 15. IMPAIRMENT OF LONG-LIVED ASSETS
We monitor our operating units for conditions that may indicate a potential impairment of long-lived assets. These conditions include current-period operating losses combined with a history of losses and a projection of continuing losses, and significant negative industry or economic trends. When these conditions exist, we test for impairment. An impairment charge is recognized for the amount by which the carrying value of the asset group exceeds its estimated fair value.
During the second quarter of 2008, higher fuel prices and the weak economic climate in the United States and Canada resulted in a more pronounced and accelerated shift in consumer preferences away from full-size trucks and traditional sport utility vehicles ("SUVs") to smaller, more fuel-efficient vehicles. This shift in consumer preferences combined with lower-than-anticipated U.S. industry demand and greater-than-anticipated escalation of commodity costs resulted in impairment charges related to Ford North America's long-lived assets and Ford Credit's operating lease portfolio.
FORD MOTOR COMPANY AND SUBSIDIARIES
NOTES TO THE FINANCIAL STATEMENTS
NOTE 15. IMPAIRMENT OF LONG-LIVED ASSETS (Continued)
Automotive Sector
North America Long-Lived Assets. Based upon the financial impact of rapidly-changing U.S. market conditions during the second quarter of 2008, we projected a decline in net cash flows for the Ford North America segment. As a result, in the second quarter of 2008 we tested the long-lived assets for impairment and recorded in Automotive cost of sales a pre-tax charge of $5.3 billion, representing the amount by which the carrying value of the assets exceeded the estimated fair value. See Note 4 for further discussion of the fair value used in the impairment.
The table below describes the significant components of the second quarter 2008 long-lived asset impairment (in millions):
| | | | |
Land | | $ | — | |
Buildings and land improvements | | | 698 | |
Machinery, equipment and other | | | 2,833 | |
Special tools | | | 1,769 | |
Total | | $ | 5,300 | |
Financial Services Sector
Certain Vehicle Line Operating Leases. The shift in consumer preferences combined with a weak economic climate caused a significant reduction in auction values, in particular for used full-size trucks and traditional SUVs. As a result, in the second quarter of 2008 we tested Ford Credit's operating leases in its North America segment for impairment and recorded a pre-tax impairment charge in Selling, administrative and other expenses on our consolidated statement of operations and in Financial Services depreciation on our sector statement of operations of $2.1 billion, representing the amount by which the carrying value of certain vehicle lines in Ford Credit's lease portfolio exceeded the estimated fair value. See Note 4 for further discussion of the fair value used in the impairment.
NOTE 16. GOODWILL AND OTHER NET INTANGIBLE ASSETS
Goodwill is subject to impairment testing at least annually or upon a triggering event. Our annual testing of goodwill occurs in the fourth quarter. An impairment charge is recognized for the amount by which the carrying value of the operating segment's goodwill exceeds its implied fair value.
Our intangible assets are comprised primarily of manufacturing and production incentive rights, license and advertising agreements, land rights, patents, customer contracts, and technology, and land rights and all areeach is amortized over theirits determinable lives.
Goodwill
In the fourth quarter of 2007, we recorded a goodwill impairment charge of $2.4 billion in Goodwill impairment as a result of our impairment testing of Volvo. Volvo's fair value declined throughout 2007, primarily related to three factors. First, the weakening of the U.S. dollar resulted in lower sales revenues relative to euro and Swedish krona material costs; approximately 25% of Volvo vehicle sales are in the United States. Second, higher gas prices and other factors were causing a shift from larger to smaller vehicle segments in the U.S. and other markets. This resulted in lower-than-planned volumes for new vehicles, especially high-margin SUVs. Third, to encourage sales in the face of lower-than-planned volumes for Volvo vehicles in the U.S. and other markets, we offered higher-than-anticipated marketing incentives on the sale of these vehicles. These higher marketing incentives led to a reduction in revenues and profits. Volvo goodwill was tested for impairment at December 31, 2007 by comparing the carrying value of the Volvo reporting unit to its implied fair value using discounted cash flow and market methods.
FORD MOTOR COMPANY AND SUBSIDIARIES
NOTES TO THE FINANCIAL STATEMENTS
NOTE 16. GOODWILL AND OTHER NET INTANGIBLE ASSETS (Continued)
The following table summarizes the changes in the carrying amount of goodwill (in millions):
| | | | | | Financial Services Sector | | | | |
| | | | | | | | | | | | | | | | | | | | | | |
| Balances at December 31, 2007 | | | | | | | | | | | | | | | | | | | | | |
Goodwill | | $ | 89 | | | $ | 37 | | | $ | 3,760 | | | $ | 1,438 | | | $ | 5,324 | | | $ | 18 | | | $ | 5,342 | |
Accumulated impairment losses | | | — | | | | — | | | | (2,400 | ) | | | — | | | | (2,400 | ) | | | — | | | | (2,400 | ) |
| Balances reclassified to held for sale (a) | | | — | | | | — | | | | (1,360 | ) | | | (1,438 | ) | | | (2,798 | ) | | | — | | | | (2,798 | ) |
Net goodwill at December 31, 2007 | | | 89 | | | | 37 | | | | — | | | | — | | | | 126 | | | | 18 | | | | 144 | |
| | | | | | | | | | | | | | | | | | | | | | | | | | | | | |
| Changes in goodwill: | | | | | | | | | | | | | | | | | | | | | | | | | | | | |
Dealer goodwill impairment (b) | | | (88 | ) | | | — | | | | — | | | | — | | | | (88 | ) | | | — | | | | (88 | ) |
| Effect of foreign currency translation/Other | | | — | | | | (6 | ) | | | — | | | | — | | | | (6 | ) | | | — | | | | (6 | ) |
Goodwill-related dispositions | | | (1 | ) | | | — | | | | — | | | | — | | | | (1 | ) | | | (9 | ) | | | (10 | ) |
| Balances at December 31, 2008 | | | | | | | | | | | | | | | | | | | | | | | | | | | | |
Goodwill | | | 88 | | | | 31 | | | | — | | | | — | | | | 119 | | | | 9 | | | | 128 | |
Accumulated impairment losses | | | (88 | ) | | | — | | | | — | | | | — | | | | (88 | ) | | | — | | | | (88 | ) |
Net goodwill at December 31, 2008 | | | — | | | | 31 | | | | — | | | | — | | | | 31 | | | | 9 | | | | 40 | |
| | | | | | | | | | | | | | | | | | | | | | | | | | | | | |
| Changes in goodwill: | | | | | | | | | | | | | | | | | | | | | | | | | | | | |
| Effect of foreign currency translation/Other | | | — | | | | 3 | | | | — | | | | — | | | | 3 | | | | — | | | | 3 | |
| Balances at December 31, 2009 | | | | | | | | | | | | | | | | | | | | | | | | | | | | |
Goodwill | | | 88 | | | | 34 | | | | — | | | | — | | | | 122 | | | | 9 | | | | 131 | |
Accumulated impairment losses | | | (88 | ) | | | — | | | | — | | | | — | | | | (88 | ) | | | — | | | | (88 | ) |
Net goodwill at December 31, 2009 | | $ | — | | | $ | 34 | | | $ | — | | | $ | — | | | $ | 34 | | | $ | 9 | | | $ | 43 | |
| |
(a) | See Note 24 for discussion of our held-for-sale operations. |
(b) | Based on our expected reduction of our Ford North America dealership base, we recorded an other-than-temporary impairment of our investment in our consolidated North America dealerships of $88 million in Automotive cost of sales. We recorded the impairment of our investment by writing down the related goodwill to its fair value of $0.
|
Excluded from the table above is goodwill within Equity in net assets of affiliated companies of $34 million at December 31, 2009 and 2008.
Other Net Intangibleslife.
The components of other net intangible assets at December 31 arewere as follows (in millions):
| | | | | | | |
| | | | | | Less: Accumulated Amortization | | | | | | | | | Less: Accumulated Amortization | | | | |
| Automotive Sector | | | | | | | | | | | | | | | | | | |
Manufacturing and production incentive rights | | $ | 305 | | | | (228 | ) | | | 77 | | | | 227 | | | | (113 | ) | | | 114 | |
License and advertising agreements | | | 96 | | | | (32 | ) | | | 64 | | | | 85 | | | | (23 | ) | | | 62 | |
Other | | | 75 | | | | (50 | ) | | | 25 | | | | 71 | | | | (41 | ) | | | 30 | |
Total Automotive sector | | | 476 | | | | (310 | ) | | | 166 | | | | 383 | | | | (177 | ) | | | 206 | |
Financial Services Sector | | | | | | | | | | | | | | | | | | | | | | | | |
Other | | | 1 | | | | (1 | ) | | | — | | | | 4 | | | | (4 | ) | | | — | |
Total Financial Services sector | | | 1 | | | | (1 | ) | | | — | | | | 4 | | | | (4 | ) | | | — | |
Total Company | | $ | 477 | | | $ | (311 | ) | | $ | 166 | | | $ | 387 | | | $ | (181 | ) | | $ | 206 | |
FORD MOTOR COMPANY AND SUBSIDIARIES |
| | | | | | | | | | | | | | | | | | | | | | | |
| | 2011 | | 2010 |
| | Gross Carrying Amount | | Accumulated Amortization | | Net Carrying Amount | | Gross Carrying Amount | | Accumulated Amortization | | Net Carrying Amount |
| Automotive Sector | | | | | | | | | | | |
| License and advertising agreements | $ | 118 |
| | $ | (47 | ) | | $ | 71 |
| | $ | 111 |
| | $ | (39 | ) | | $ | 72 |
|
| Land rights | 23 |
| | (8 | ) | | 15 |
| | 23 |
| | (7 | ) | | 16 |
|
| Patents | 26 |
| | (17 | ) | | 9 |
| | 25 |
| | (16 | ) | | 9 |
|
| Other | 27 |
| | (22 | ) | | 5 |
| | 28 |
| | (23 | ) | | 5 |
|
| Total Automotive sector | $ | 194 |
| | $ | (94 | ) | | $ | 100 |
| | $ | 187 |
| | $ | (85 | ) | | $ | 102 |
|
NOTES TO THE FINANCIAL STATEMENTS
NOTE 16. GOODWILL AND OTHER NET INTANGIBLE ASSETS (Continued)
Our manufacturing and production incentive rights were acquired in 2006 and have a useful life of 4 years, our license and advertising agreements have amortization periods primarily of 5 years to 25 years, our land rights have amortization periods of 40 years to 50 years, our patents have amortization periods primarily of 7 years to 17 years, and our other intangibles (primarily customer contracts and technology) have various amortization periods (primarily patents, customer contracts, technology, and land rights).periods.
Pre-tax amortization expense for the years ending December 31 was as follows (in millions):
|
| | | | | | | | | | | |
| | 2011 | | 2010 | | 2009 |
| Pre-tax amortization expense | $ | 12 |
| | $ | 97 |
| | $ | 86 |
|
| | | | | | | | | | |
Pre-tax amortization expense | | $ | 86 | | | $ | 99 | | | $ | 106 | |
Amortization for current intangible assets is forecasted to be approximately $80$12 million to $90 million in 20102012 and $10 million pereach year thereafter.
FORD MOTOR COMPANY AND SUBSIDIARIES
NOTES TO THE FINANCIAL STATEMENTS
NOTE 17.16. ACCRUED LIABILITIES AND DEFERRED REVENUE
Accrued liabilities and deferred revenue at December 31 were as follows (in millions):
| | | | | | | | | | 2011 | | 2010 |
| Automotive Sector | | | | | | | | | |
| Current | | | | | | | | | |
Dealer and customer allowances and claims | | $ | 8,651 | | | $ | 9,715 | | $ | 6,971 |
| | $ | 7,900 |
|
Deferred revenue | | | 3,162 | | | | 2,883 | | 2,216 |
| | 2,069 |
|
Employee benefit plans | | | 1,481 | | | | 1,820 | | 1,552 |
| | 1,834 |
|
Accrued interest | | | 570 | | | | 419 | | 253 |
| | 479 |
|
| Other postretirement employee benefits ("OPEB") | | 439 |
| | 437 |
|
Pension | | | 469 | | | | 473 | | 388 |
| | 376 |
|
Other postretirement employee benefits ("OPEB") (a) | | | 453 | | | | 10,917 | | |
Other | | | 3,679 | | | | 3,357 | | 3,184 |
| | 3,970 |
|
Total Automotive current | | | 18,465 | | | | 29,584 | | 15,003 |
| | 17,065 |
|
| Non-current | | | | | | | | | |
| | |
|
Pension | | | 11,607 | | | | 10,924 | | 15,091 |
| | 11,637 |
|
OPEB | | | 5,597 | | | | 5,358 | | 6,152 |
| | 5,982 |
|
Dealer and customer allowances and claims | | | 2,919 | | | | 4,303 | | 2,453 |
| | 2,203 |
|
Deferred revenue | | | 1,656 | | | | 1,751 | | 1,739 |
| | 1,622 |
|
Employee benefit plans | | | 587 | | | | 525 | | 709 |
| | 624 |
|
Other | | | 894 | | | | 905 | | 766 |
| | 948 |
|
Total Automotive non-current | | | 23,260 | | | | 23,766 | | 26,910 |
| | 23,016 |
|
Total Automotive sector | | | 41,725 | | | | 53,350 | | 41,913 |
| | 40,081 |
|
Financial Services Sector | | | 4,884 | | | | 6,184 | | 3,457 |
| | 3,764 |
|
Total sectors | | | 46,609 | | | | 59,534 | | 45,370 |
| | 43,845 |
|
Intersector elimination (b) | | | (10 | ) | | | (8 | ) | |
| Intersector elimination (a) | | (1 | ) | | (1 | ) |
Total Company | | $ | 46,599 | | | $ | 59,526 | | $ | 45,369 |
| | $ | 43,844 |
|
__________
(a) | See Note 18 for discussion regarding settlement of the UAW retiree health care obligation. |
(b) (a) | Accrued interest related to Ford's acquisition of Ford Credit debt securities. See Note 118 for additional detail. |
FORD MOTOR COMPANY AND SUBSIDIARIES
NOTES TO THE FINANCIAL STATEMENTS
NOTE 18.17. RETIREMENT BENEFITS
We provide pension benefits and OPEB, such as health care and life insurance, to employees in many of our operations around the world. Plan obligations are measured based on the present value of projected future benefit payments for all participants for services rendered to date. The measurement of projected future benefits is dependent on the provisions of each specific plan, demographics of the group covered by the plan, and other key measurement assumptions. For plans that provide benefits dependent on salary assumptions, we include a projection of salary growth in our measurements. No assumption is made regarding any potential future changes to benefit provisions beyond those to which we are presently committed (e.g., in existing labor contracts).
The net periodic benefit costs associated with the Company's defined benefit pension plans are determined using assumptions regarding the benefit obligation and the market-related value of plan assets as of the beginning of each year. We have elected to use a market-related value of plan assets to calculate the expected return on assets in net periodic benefit costs. The market-related value recognizes changes in the fair value of plan assets in a systematic manner over five years. Net periodic benefit costs are recorded in Automotive cost of sales and Selling, administrative and other expenses. The funded status of the benefit plans, which represents the difference between the benefit obligation and fair value of plan assets, is calculated on a plan-by-plan basis. The net periodic costsbenefit obligation and related funded status are determined using assumptions as of these benefits are recorded in Automotive costthe end of sales and Selling, administrative and other expenses.each year. The impact of plan amendments and actuarial gains and losses are recorded in Accumulated other comprehensive income/(loss)and generally are amortized as a component of net periodic cost over the remaining service period of our active employees. We record a curtailment loss when an event occurs that significantly reduces the expected years of future service or eliminates the accrual of defined benefits for the future services of a significant number of employees. We record a curtailment gain when a significant number ofthe employees who are entitled to the benefits terminate their employment.employment; we record a curtailment loss when it becomes probable a loss will occur.
FORD MOTOR COMPANY AND SUBSIDIARIES
NOTES TO THE FINANCIAL STATEMENTS
NOTE 17. RETIREMENT BENEFITS (Continued)
The measurement of the fair value of plan assets, including stocks, bonds and other investments, uses valuation methodologies and the inputs as described in Note 4. Certain investments within our plan assets do not have a readily determinable fair value; in such instances, we use net asset value per share to measure fair value.
Our contribution policy for funded pension plans is to contribute annually, at a minimum, amounts required by applicable laws and regulations. We do from time to timeoccasionally make contributions beyond those legally required. In general, our plans are funded, with the main exceptions being certain plans in Germany, and U.S. defined benefit plans for senior management. In such cases, an unfunded liability is recorded.
Employee Retirement and Savings Plans. We, and certain of our subsidiaries, sponsor plans to provide pension benefits for retired employees. We have two principal qualified defined benefit retirement plans in the United States.States covering hourly and salaried employees. The Ford-UAW Retirement Planprincipal hourly plan covers hourlyFord employees represented by the UAW, and the General Retirement PlanUAW. The salaried plan covers substantially all other Ford employees in the United States hired on or before December 31, 2003. The hourly plan provides noncontributory benefits related to employee service. The salaried plan provides similar noncontributory benefits and contributory benefits related to pay and service. Other U.S. and non-U.S. subsidiaries have separate plans that generally provide similar types of benefits for their employees.
We established, effective January 1, 2004, a defined contribution plan covering new salaried U.S. employees hired on or after that date.
Certain of our defined benefit pension plans provide benefits that are not based on salary (e.g., Ford-UAW Retirement Plan, noncontributory portion of the General Retirement Plan, and the Ford Canada retirement plan for Effective October 24, 2011, hourly U.S. employees represented by the National Automobile, Aerospace, Transportation, and General Workers Union of Canada ("CAW")). The salary growth assumption is not applicable to these benefits.UAW hired on or after that date also participate in a defined contribution plan.
The expense for our worldwide defined contribution plans was $88$134 million $159, $123 million, and $136$92 million in 2009, 20082011, 2010, and 2007,2009, respectively. This includes the expense for company matching contributions to our primary employee savings plan in the United States of $0, $58$54 million, $52 million, and $37 million$0 in 2011, 2010, and 2009, 2008 and 2007, respectively. Company matching contributions for U.S. employees were suspended January 1, 2009 and reinstated effective January 1, 2010.
FORD MOTOR COMPANY AND SUBSIDIARIES
NOTES TO THE FINANCIAL STATEMENTS
NOTE 18. RETIREMENT BENEFITS (Continued)
OPEB. We, and certain of our subsidiaries, sponsor plans to provide OPEB for retired employees, primarily certain health care and life insurance benefits. During 2009, the Ford UAW Hospital-Surgical-Medical-Drug-Dental-Vision Program ("H-S-M-D-D-V Program") covered hourly employees represented by the UAW and hired before November 19, 2007. UAW-represented individuals hired after November 19, 2007 are eligible to participate in a separate health care plan that provides defined contributions made by Ford to individual participant accounts.
The Ford Salaried Health Care Plan covers substantially all other(the "Plan") provides retiree health care benefits for Ford salaried employees in the United States hired before June 1, 2001. U.S. salaried employees hired on or after June 1, 2001 are covered by a separate plan that provides for annual company allocations to employee-specific notional accounts to be used to fund postretirement health care benefits. WeThe Plan also provide company-paidcovers Ford hourly non-UAW represented employees in the United States hired before November 19, 2007. U.S. hourly employees hired on or after November 19, 2007 are eligible to participate in a separate health care plan that provides defined contributions made by Ford to individual participant accounts. As discussed below, UAW represented employees hired before November 19, 2007 are covered by the UAW Retiree Medical Benefits Trust (the "UAW VEBA Trust"), an independent non-Ford sponsored voluntary employee beneficiary association trust. Company-paid postretirement life insurance benefits also are provided to U.S. salaried employees hired before January 1, 2004 and all U.S. hourly employees. Our employees may become eligible for benefits when they retire; however, benefits and eligibility rules may be modified from time to time.
Effective August 1, 2008, the Company-paid retiree basic life insurance benefits were capped at $25,000$25,000 for eligible existing and future salaried retirees. Salaried employees hired on or after January 1, 2004 are not eligible for retiree basic life insurance. Our obligation decreased by about $850 million and ongoing expense was reduced by about $125 million annually beginning in 2009 as a result of this benefit change.
Settlement of UAW Retiree Health Care Obligation
On July 23,December 31, 2009, we entered into an amendmentfully settled our UAW postretirement health care obligation pursuant to the 2008 UAW Retiree Health Care Settlement Agreement (the "Settlement("Settlement Agreement"). The Settlement Agreement established a new VEBA trust (the "UAW VEBA Trust") that on December 31, 2009 would assume amended in 2009. In exchange for the transfer of Plan Assets of about $3.5 billion and certain assets of about $11.3 billion, we irrevocably transferred our obligation to provide retiree health care benefits tofor eligible active and retired UAW Ford hourly employees and their eligible spouses, surviving spouses and dependents (the "Benefit Group"). The amendment to the Settlement Agreement (the "Amended Settlement Agreement") described below was approved by the U.S. District Court for the Eastern District of Michigan on November 9, 2009. The Amended Settlement Agreement provides for smoothing of payment obligations and provides us the option to use Ford Common Stock to satisfy up to approximately 50% of our future payment obligations to the UAW VEBA Trust.
Pursuant to the Amended Settlement Agreement, on December 31, 2009, we fully settled our UAW postretirement health care obligation, irrevocably transferring our obligation to provide retiree health care for the Benefit Group to the UAW VEBA Trust in exchange for the transfer of certain assets. The trustees of the UAW VEBA Trust have established a new retiree health care plan (the "New Plan") for the Benefit Group that will be responsible for administering these benefits, and the New Plan will be a closed plan.
On December 31, 2009, pursuant to the Amended Settlement Agreement we transferred to the UAW VEBA Trust the following assets and thereby fully discharged any obligation we had to provide retiree health care benefits to the Benefit Group:
| · | A non-interest bearing Amortizing Guaranteed Secured Note maturing June 30, 2022 with a par value of $6.7 billion ("New Note A"). The fair value of New Note A at December 31, 2009 was $3.1 billion after a scheduled payment of $1.3 billion, a partial prepayment of $500 million, and payment of a true-up amount of $150 million were made on December 31, 2009; |
| · | A non-interest bearing Amortizing Guaranteed Secured Note maturing June 30, 2022 with a par value of $6.5 billion ("New Note B"). The fair value of New Note B at December 31, 2009 was $3.9 billion after a scheduled payment of $610 million was made on December 31, 2009; |
| · | Warrants that expire on January 1, 2013 to purchase 362,391,305 shares of Ford Common Stock at an exercise price of $9.20 per share. The fair value of the warrants at December 31, 2009 was $1.2 billion; |
| · | Assets of the H-S-M-D-D-V program ("Plan Assets") consisting of cash and marketable securities. The fair value of the Plan Assets at December 31, 2009 was $3.5 billion; and |
| · | Assets in the Temporary Asset Account ("TAA") consisting of cash and marketable securities. The fair value of these assets at December 31, 2009 was $619 million. |
FORD MOTOR COMPANY AND SUBSIDIARIES
NOTES TO THE FINANCIAL STATEMENTS
NOTE 18. RETIREMENT BENEFITS (Continued)
In addition to the foregoing transfers, we retained an obligation for 2009 retiree health care costs incurred, but not yet reported, which we have estimated to be $71 million as of December 31, 2009. This obligation is recorded in Accrued liabilities and deferred revenue on our consolidated balance sheet.
As a result of the transfer, of the foregoing assets, we removed from our balance sheet and transferred to the UAW VEBA Trust our UAW postretirement health care obligation of about $13.6 billion.
Upon settlement, we$13.6 billion. We recognized a net loss of $264$264 million in Automotive cost of sales, including the effect of a deferred gain from prior periods of $967$967 million previously included as a component of Accumulated other comprehensive income/(loss). .
FORD MOTOR COMPANY AND SUBSIDIARIES
NOTES TO THE FINANCIAL STATEMENTS
NOTE 17. RETIREMENT BENEFITS (Continued)
A summary of the transaction and related net loss is as follows (in billions):
| | | | | | | December 31, 2009 |
| Liabilities Transferred | | | | |
UAW postretirement health care obligation | | $ | 13.6 | | $ | 13.6 |
|
Plan Assets | | | (3.5 | ) | (3.5 | ) |
Net liability transferred | | | 10.1 | | 10.1 |
|
| | | | | | |
|
| Assets Transferred | | | | | |
|
Cash | | | (2.5 | ) | (2.5 | ) |
New Notes A and B (a) | | | (7.0 | ) | |
| New Notes A and B (a) (b) | | (7.0 | ) |
Warrants (a) | | | (1.2 | ) | (1.2 | ) |
TAA (b) | | | (0.6 | ) | |
| TAA (c) | | (0.6 | ) |
Net assets transferred (excluding Plan Assets) | | | (11.3 | ) | (11.3 | ) |
| | | | | | |
|
Deferred gain/Other (c) | | | 0.9 | | |
| Deferred gain/Other (d) | | 0.9 |
|
| | | | | | |
|
Net loss at settlement | | $ | (0.3 | ) | $ | (0.3 | ) |
_______
| |
| (a) | Assets shown at fair value after giving effect to cash payments made on December 31, 2009 of $2.5 billion.$2.5 billion. |
| |
| (b) | Prepaid in full during 2010. |
| |
| (c) | Includes primarily $591 $591 million of marketable securities and $25 millionmillion of cash equivalents. |
(c) | |
| (d) | We previously recorded an actuarial gain of $4.7$4.7 billion on August 29, 2008, the effectiveeffective date of the Settlement Agreement. The gain offset pre-existing actuarial losses. |
We computed the fair value of New Note A and New Note B (See Note 18 for definition and discussion) using an income approach that maximized the use of relevant observable market available data and adjusted for unobservable data that we believe market participants would assume given the specific attributes of the instruments. Significant inputs considered in the fair value measurement included the credit-adjusted yield of our unsecured debt, adjusted for term and liquidity. The principal of New Note A and New Note B, up to a limit of $3$3 billion is, was secured on a second lien basis with the collateral pledged under the secured credit agreement we entered into in December 2006 (see Note 1918 for additional discussion). Accordingly, we adjusted the unsecured yields observable in the market to reflect this limited second lien priority within our overall capital structure, considering spreads on credit default swaps based on our secured and unsecured debt. The discount rate of 9.2% and 9.9% used to determine the fair value for New Note A and New Note B, respectively, reflectsreflected consideration of the fair value of specific features of the instruments, including prepayment provisions and the option to settle New Note B with Ford Common Stock. The stock settlement option was valued using an industry standard option-pricing model that considered the volatility of our stock and multiple scenarios with assigned probabilities.
FORD MOTOR COMPANY AND SUBSIDIARIES
NOTES TO THE FINANCIAL STATEMENTS
NOTE 18. RETIREMENT BENEFITS (Continued)
We measured the fair value of the warrants issued to the UAW VEBA Trust using a Black-Scholes model and an American Options Model (Binomial). Model. Inputs to the fair value measurement included an exercise price of $9.20$9.20 per share, and a market price of $10$10 per share (the closing sale price of Ford Common Stock on December 31, 2009). The fair value of the warrants reflectsreflected a risk-free rate based on a three-year U.S. Treasury debt instrument and a 40% volatility assumption which was derived from a historical volatility analysis and present market (implied) volatility assumptions commensurate with the exercise term of the warrants, and adjusted for transfer and registration restrictions of the underlying shares.
We independently validated severalSee Note 18 for discussion of our assumptions by obtaining non-binding quotes regarding volatility, prepayment features,in full of the New Notes A and yields from several financial institutions and published analysts' reports regarding the market outlook for Ford.B.
The UAW Benefit TrustFS-47
FORD MOTOR COMPANY AND SUBSIDIARIES
NOTES TO THE FINANCIAL STATEMENTS
In 2005, we entered into an agreement with the UAW ("2005 Agreement") and a class of employees and retirees to increase retiree health care cost sharing under the H-S-M-D-D-V Program as part of our overall cost reduction efforts. The 2005 Agreement established an independent Defined Contribution Retiree Health Benefit Trust ("UAW Benefit Trust") which served as a non-Ford sponsored VEBA. The UAW Benefit Trust was used to mitigate the increased cost sharing for the Benefit Group and was accounted for as a separate plan from the H-S-M-D-D-V Program.
Pursuant to the Settlement Agreement, we made a third contribution of $43 million to the UAW Benefit Trust on January 1, 2009. The terms of the 2005 Agreement were superseded by the terms of the Amended Settlement Agreement and the UAW Benefit Trust was terminated on January 4, 2010.NOTE 17. RETIREMENT BENEFITS (Continued)
Benefit Plans – Expense and Status
The measurement date for all of our worldwide postretirement benefit plans is December 31. OurThe expense for our defined benefit pension and OPEB plans was as follows (in millions):
| | | | | | | | | | | | | | | | | | | | | | | | | | | | | | | | | |
| | | | | | | | | | | Pension Benefits (a) | | | | | | |
| | | | | | | | | | | | | | | | | | | | | | | | | | | | | U.S. Plans | | Non-U.S. Plans | | Worldwide OPEB |
| | | | | | | | | | | | | | | | | | | | | | | | | | | | | 2011 | | 2010 | | 2009 | | 2011 | | 2010 | | 2009 | | 2011 | | 2010 | | 2009 |
Service cost | | $ | 343 | | | $ | 378 | | | $ | 464 | | | $ | 293 | | | $ | 403 | | | $ | 632 | | | $ | 408 | | | $ | 326 | | | $ | 369 | | $ | 467 |
| | $ | 376 |
| | $ | 343 |
| | $ | 327 |
| | $ | 314 |
| | $ | 293 |
| | $ | 63 |
| | $ | 54 |
| | $ | 408 |
|
Interest cost | | | 2,698 | | | | 2,687 | | | | 2,621 | | | | 1,253 | | | | 1,519 | | | | 1,650 | | | | 899 | | | | 1,456 | | | | 1,805 | | 2,374 |
| | 2,530 |
| | 2,698 |
| | 1,227 |
| | 1,249 |
| | 1,253 |
| | 327 |
| | 338 |
| | 899 |
|
Expected return on assets | | | (3,288 | ) | | | (3,462 | ) | | | (3,479 | ) | | | (1,309 | ) | | | (1,693 | ) | | | (1,905 | ) | | | (130 | ) | | | (265 | ) | | | (256 | ) | (3,028 | ) | | (3,172 | ) | | (3,288 | ) | | (1,404 | ) | | (1,337 | ) | | (1,309 | ) | | — |
| | — |
| | (130 | ) |
| Amortization of: | | | | | | | | | | | | | | | | | | | | | | | | | | | | | | | | | | | | | |
| | |
| | |
| | |
| | |
| | |
| | |
| | |
| | |
|
Prior service cost/(credit) | | | 374 | | | | 374 | | | | 265 | | | | 83 | | | | 99 | | | | 109 | | | | (913 | ) | | | (900 | ) | | | (996 | ) | |
| Prior service costs/(credits) | | 343 |
| | 370 |
| | 374 |
| | 72 |
| | 75 |
| | 83 |
| | (612 | ) | | (617 | ) | | (913 | ) |
(Gains)/Losses and Other | | | 16 | | | | 19 | | | | 24 | | | | 167 | | | | 213 | | | | 460 | | | | 83 | | | | 267 | | | | 817 | | 186 |
| | 12 |
| | 8 |
| | 333 |
| | 246 |
| | 158 |
| | 94 |
| | 96 |
| | 82 |
|
Separation programs | | | 12 | | | | 334 | | | | 814 | | | | 176 | | | | 138 | | | | 190 | | | | 2 | | | | 13 | | | | 7 | | 9 |
| | 6 |
| | 12 |
| | 138 |
| | 26 |
| | 176 |
| | 10 |
| | 1 |
| | 2 |
|
| (Gain)/Loss from curtailment and | | | | | | | | | | | | | | | | | | | | | | | | | | | | | | | | | | | | | |
settlements | | | — | | | | — | | | | 176 | | | | 47 | | | | — | | | | (8 | ) | | | 244 | | | | (2,714 | ) | | | (1,332 | ) | |
| | | | | | | | | | | | | | | | | | | | | | | | | | | | | | | | | | | | | | |
Net expense | | $ | 155 | | | $ | 330 | | | $ | 885 | | | $ | 710 | | | $ | 679 | | | $ | 1,128 | | | $ | 593 | | | $ | (1,817 | ) | | $ | 414 | | |
| (Gains)/Losses from curtailments and settlements | | — |
| | — |
| | — |
| | 111 |
| | — |
| | 47 |
| | (26 | ) | | (30 | ) | | 244 |
|
| Net expense/(income) | | $ | 351 |
| | $ | 122 |
| | $ | 147 |
| | $ | 804 |
| | $ | 573 |
| | $ | 701 |
| | $ | (144 | ) | | $ | (158 | ) | | $ | 592 |
|
_______
* | |
| (a) | Includes Jaguar Land Rover for 2007 – 2008, and Volvo for 20072009 – 2009.2010. |
FORD MOTOR COMPANY AND SUBSIDIARIES
NOTES TO THE FINANCIAL STATEMENTS
NOTE 18.17. RETIREMENT BENEFITS (Continued)
The year-end status of these plans was as follows (dollar amounts in millions):
| | | | | | | | | | |
| | | | | | | | | | |
| | | | | | | | | | | | | | | | | | | |
| Change in Benefit Obligation (a) | | | | | | | | | | | | | | | | | | |
Benefit obligation at January 1 | | $ | 43,053 | | | $ | 44,412 | | | $ | 20,382 | | | $ | 25,558 | | | $ | 19,065 | | | $ | 28,096 | |
Service cost | | | 343 | | | | 378 | | | | 251 | | | | 301 | | | | 408 | | | | 326 | |
Interest cost | | | 2,693 | | | | 2,682 | | | | 1,193 | | | | 1,321 | | | | 899 | | | | 1,456 | |
Amendments | | | — | | | | 4 | | | | (54 | ) | | | 117 | | | | (175 | ) | | | (928 | ) |
Separation programs | | | 12 | | | | 334 | | | | 121 | | | | 42 | | | | 2 | | | | 13 | |
Curtailments | | | — | | | | — | | | | (19 | ) | | | — | | | | — | | | | (1 | ) |
Settlements | | | — | | | | — | | | | (1 | ) | | | (58 | ) | | | (13,637 | ) | | | — | |
Plan participant contributions | | | 27 | | | | 25 | | | | 80 | | | | 101 | | | | 40 | | | | 42 | |
Benefits paid | | | (3,908 | ) | | | (3,960 | ) | | | (1,456 | ) | | | (1,380 | ) | | | (1,673 | ) | | | (1,628 | ) |
Medicare D subsidy | | | — | | | | — | | | | — | | | | — | | | | 67 | | | | 68 | |
Foreign exchange translation | | | — | | | | — | | | | 1,927 | | | | (4,779 | ) | | | 253 | | | | (478 | ) |
Divestiture | | | — | | | | — | | | | — | | | | (6 | ) | | | — | | | | — | |
Actuarial (gain)/loss and other | | | 2,418 | | | | (822 | ) | | | 921 | | | | (835 | ) | | | 804 | | | | (7,901 | ) |
Benefit obligation at December 31 | | $ | 44,638 | | | $ | 43,053 | | | $ | 23,345 | | | $ | 20,382 | | | $ | 6,053 | | | $ | 19,065 | |
| Change in Plan Assets (a) | | | | | | | | | | | | | | | | | | | | | | | | |
Fair value of plan assets at January 1 | | $ | 37,381 | | | $ | 45,696 | | | $ | 14,707 | | | $ | 21,396 | | | $ | 2,786 | | | $ | 3,875 | |
Actual return on plan assets | | | 4,855 | | | | (4,480 | ) | | | 1,692 | | | | (2,036 | ) | | | 792 | | | | (1,011 | ) |
Company contributions | | | 136 | | | | 138 | | | | 968 | | | | 1,209 | | | | — | | | | — | |
Plan participant contributions | | | 27 | | | | 25 | | | | 80 | | | | 101 | | | | — | | | | — | |
Benefits paid | | | (3,908 | ) | | | (3,960 | ) | | | (1,456 | ) | | | (1,380 | ) | | | (62 | ) | | | (77 | ) |
Settlements | | | — | | | | — | | | | (1 | ) | | | (58 | ) | | | (3,517 | ) | | | — | |
Foreign exchange translation | | | — | | | | — | | | | 1,581 | | | | (4,510 | ) | | | — | | | | — | |
Divestiture | | | — | | | | — | | | | — | | | | (3 | ) | | | — | | | | — | |
Other | | | (34 | ) | | | (38 | ) | | | (7 | ) | | | (12 | ) | | | 1 | | | | (1 | ) |
| Fair value of plan assets at December 31 | | $ | 38,457 | | | $ | 37,381 | | | $ | 17,564 | | | $ | 14,707 | | | $ | — | | | $ | 2,786 | |
| | | | | | | | | | | | | | | | | | | | | | | | | |
Funded status at December 31 | | $ | (6,181 | ) | | $ | (5,672 | ) | | $ | (5,781 | ) | | $ | (5,675 | ) | | $ | (6,053 | ) | | $ | (16,279 | ) |
| | | | | | | | | | | | | | | | | | | | | | | | | |
| Amounts Recognized on the Balance Sheet (a) | | | | | | | | | | | | | | | | | | | | | | | | |
Prepaid assets | | $ | 13 | | | $ | 15 | | | $ | 101 | | | $ | 53 | | | $ | — | | | $ | — | |
Accrued liabilities | | | (6,194 | ) | | | (5,687 | ) | | | (5,882 | ) | | | (5,728 | ) | | | (6,053 | ) | | | (16,279 | ) |
Total | | $ | (6,181 | ) | | $ | (5,672 | ) | | $ | (5,781 | ) | | $ | (5,675 | ) | | $ | (6,053 | ) | | $ | (16,279 | ) |
| Amounts Recognized in Accumulated Other Comprehensive Loss (b) | | | | | | | | | | | | | | | | | | | | | | | | |
Unamortized prior service costs/(credits) | | $ | 1,895 | | | $ | 2,268 | | | $ | 433 | | | $ | 557 | | | $ | (2,799 | ) | | $ | (3,510 | ) |
| Unamortized net (gains)/losses and other | | | 5,705 | | | | 4,858 | | | | 6,100 | | | | 5,163 | | | | 1,772 | | | | 611 | |
Total | | $ | 7,600 | | | $ | 7,126 | | | $ | 6,533 | | | $ | 5,720 | | | $ | (1,027 | ) | | $ | (2,899 | ) |
| Pension Plans in which Accumulated Benefit Obligation Exceeds Plan Assets at December 31 (a) | | | | | | | | | | | | | | | | | | | | | | | | |
Accumulated benefit obligation | | $ | 25,686 | | | $ | 24,975 | | | $ | 16,707 | | | $ | 11,649 | | | | | | | | | |
Fair value of plan assets | | | 20,248 | | | | 20,044 | | | | 12,034 | | | | 7,171 | | | | | | | | | |
| | | | | | | | | | | | | | | | | | | | | | | | | |
| Accumulated Benefit Obligation at December 31 (a) | | $ | 43,756 | | | $ | 42,279 | | | $ | 21,975 | | | $ | 19,197 | | | | | | | | | |
_______
(a) Excludes Jaguar Land Rover and Volvo.
(b) Includes Jaguar Land Rover for 2008, and Volvo for 2008 – 2009.
FS - 46 |
| | | | | | | | | | | | | | | | | | | | | | | | |
| | | Pension Benefits | | | | |
| | | U.S. Plans | | Non-U.S. Plans | | Worldwide OPEB |
| | | 2011 | | 2010 | | 2011 | | 2010 | | 2011 | | 2010 |
| Change in Benefit Obligation | | | | | | | | | | | | |
| Benefit obligation at January 1 | | $ | 46,647 |
| | $ | 44,638 |
| | $ | 23,385 |
| | $ | 23,300 |
| | $ | 6,423 |
| | $ | 6,053 |
|
| Service cost | | 467 |
| | 376 |
| | 327 |
| | 290 |
| | 63 |
| | 54 |
|
| Interest cost | | 2,374 |
| | 2,528 |
| | 1,227 |
| | 1,213 |
| | 327 |
| | 338 |
|
| Amendments | | 5 |
| | 10 |
| | 38 |
| | — |
| | (62 | ) | | (71 | ) |
| Separation programs | | 9 |
| | 6 |
| | 138 |
| | 26 |
| | 10 |
| | 1 |
|
| Curtailments | | — |
| | — |
| | — |
| | — |
| | (50 | ) | | — |
|
| Settlements | | — |
| | — |
| | (152 | ) | | — |
| | — |
| | — |
|
| Plan participant contributions | | 23 |
| | 23 |
| | 46 |
| | 47 |
| | 29 |
| | 18 |
|
| Benefits paid | | (3,534 | ) | | (3,704 | ) | | (1,373 | ) | | (1,281 | ) | | (473 | ) | | (458 | ) |
| Foreign exchange translation | | — |
| | — |
| | (441 | ) | | (606 | ) | | (62 | ) | | 97 |
|
| Divestiture | | — |
| | — |
| | — |
| | (61 | ) | | — |
| | — |
|
| Actuarial (gain)/loss and other | | 2,825 |
| | 2,770 |
| | 1,968 |
| | 457 |
| | 388 |
| | 391 |
|
| Benefit obligation at December 31 | | $ | 48,816 |
| | $ | 46,647 |
| | $ | 25,163 |
| | $ | 23,385 |
| | $ | 6,593 |
| | $ | 6,423 |
|
| Change in Plan Assets | | |
| | |
| | |
| | |
| | |
| | |
|
| Fair value of plan assets at January 1 | | $ | 39,960 |
| | $ | 38,457 |
| | $ | 18,615 |
| | $ | 17,556 |
| | $ | — |
| | $ | — |
|
| Actual return on plan assets | | 2,887 |
| | 5,115 |
| | 934 |
| | 1,487 |
| | — |
| | — |
|
| Company contributions | | 132 |
| | 135 |
| | 1,403 |
| | 1,236 |
| | — |
| | — |
|
| Plan participant contributions | | 23 |
| | 23 |
| | 46 |
| | 47 |
| | — |
| | — |
|
| Benefits paid | | (3,534 | ) | | (3,704 | ) | | (1,373 | ) | | (1,281 | ) | | — |
| | — |
|
| Settlements | | — |
| | — |
| | (152 | ) | | — |
| | — |
| | — |
|
| Foreign exchange translation | | — |
| | — |
| | (267 | ) | | (356 | ) | | — |
| | — |
|
| Divestiture | | — |
| | — |
| | — |
| | (66 | ) | | — |
| | — |
|
| Other | | (54 | ) | | (66 | ) | | (8 | ) | | (8 | ) | | — |
| | — |
|
| Fair value of plan assets at December 31 | | $ | 39,414 |
| | $ | 39,960 |
| | $ | 19,198 |
| | $ | 18,615 |
| | $ | — |
| | $ | — |
|
| | | | | | | | | | | | | |
| Funded status at December 31 | | $ | (9,402 | ) | | $ | (6,687 | ) | | $ | (5,965 | ) | | $ | (4,770 | ) | | $ | (6,593 | ) | | $ | (6,423 | ) |
| | | | | | | | | | | | | |
| Amounts Recognized on the Balance Sheet | | |
| | |
| | |
| | |
| | |
| | |
|
| Prepaid assets | | $ | — |
| | $ | 7 |
| | $ | 114 |
| | $ | 560 |
| | $ | — |
| | $ | — |
|
| Accrued liabilities | | (9,402 | ) | | (6,694 | ) | | (6,079 | ) | | (5,330 | ) | | (6,593 | ) | | (6,423 | ) |
| Total | | $ | (9,402 | ) | | $ | (6,687 | ) | | $ | (5,965 | ) | | $ | (4,770 | ) | | $ | (6,593 | ) | | $ | (6,423 | ) |
| Amounts Recognized in Accumulated Other Comprehensive Loss | | |
| | |
| | |
| | |
| | |
| | |
|
| Unamortized prior service costs/(credits) | | $ | 1,197 |
| | $ | 1,535 |
| | $ | 323 |
| | $ | 364 |
| | $ | (1,648 | ) | | $ | (2,220 | ) |
| Unamortized net (gains)/losses and other | | 9,394 |
| | 6,567 |
| | 7,612 |
| | 5,751 |
| | 2,305 |
| | 2,073 |
|
| Total | | $ | 10,591 |
| | $ | 8,102 |
| | $ | 7,935 |
| | $ | 6,115 |
| | $ | 657 |
| | $ | (147 | ) |
| Pension Plans in which Accumulated Benefit Obligation Exceeds Plan Assets at December 31 | | |
| | |
| | |
| | |
| | |
| | |
|
| Accumulated benefit obligation | | $ | 47,555 |
| | $ | 45,445 |
| | $ | 17,799 |
| | $ | 12,239 |
| | |
| | |
|
| Fair value of plan assets | | 39,414 |
| | 39,836 |
| | 13,129 |
| | 7,912 |
| | |
| | |
|
| | | | | | | | | | | | | |
| Accumulated Benefit Obligation at December 31 | | $ | 47,555 |
| | $ | 45,562 |
| | $ | 23,524 |
| | $ | 21,909 |
| | |
| | |
|
| | | | | | | | | | | | | |
| Pension Plans in which Projected Benefit Obligation Exceeds Plan Assets at December 31 | | | | | | | | | | | | |
| Projected benefit obligation | | $ | 48,816 |
| | $ | 46,530 |
| | $ | 23,846 |
| | $ | 17,374 |
| | | | |
| Fair value of plan assets | | 39,414 |
| | 39,836 |
| | 18,027 |
| | 12,292 |
| | | | |
| | | | | | | | | | | | | |
| Projected Benefit Obligation at December 31 | | $ | 48,816 |
| | $ | 46,647 |
| | $ | 25,163 |
| | $ | 23,385 |
| | | | |
FORD MOTOR COMPANY AND SUBSIDIARIES
NOTES TO THE FINANCIAL STATEMENTS
NOTE 18.17. RETIREMENT BENEFITS (Continued)
| | | | | | | | | | |
| | | | | | | | | | |
| | | | | | | | | | | | | | | | | | | |
| Weighted Average Assumptions at December 31 (a) | | | | | | | | | | | | | | | | | | |
Discount rate | | | 5.86 | % | | | 6.50 | % | | | 5.68 | % | | | 5.95 | % | | | 5.74 | % | | | 4.95 | % |
Expected return on assets | | | 8.25 | % | | | 8.25 | % | | | 7.17 | % | | | 7.11 | % | | | — | | | | 4.67 | % |
| Average rate of increase in compensation | | | 3.80 | % | | | 3.80 | % | | | 3.15 | % | | | 3.13 | % | | | 3.80 | % | | | 3.80 | % |
Initial health care cost trend rate (b) | | | — | | | | — | | | | — | | | | — | | | | — | | | | 5 | % |
| | | | | | | | | | | | | | | | | | | | | | | | | |
| Assumptions Used to Determine Net Benefit Cost for the Year | | | | | | | | | | | | | | | | | | | | | | | | |
Discount rate (c) | | | 6.50 | % | | | 6.25 | % | | | 5.93 | % | | | 5.58 | % | | | 4.95 | % | | | 5.81 | % |
Expected return on assets | | | 8.25 | % | | | 8.25 | % | | | 7.11 | % | | | 7.26 | % | | | 4.67 | % | | | 7.17 | % |
| Average rate of increase in compensation | | | 3.80 | % | | | 3.80 | % | | | 3.13 | % | | | 3.21 | % | | | 3.80 | % | | | 3.80 | % |
_______
(a) | Excludes Jaguar Land Rover and Volvo. |
(b) | The trend rates for U.S. health care plans no longer apply beyond 2008 since we have settled our obligation for UAW retiree health care costs and capped our obligation for salaried retiree health care costs. |
(c) | Includes effects of remeasurements. |
As a result of the UAW Retiree Health Care Settlement Agreement and various personnel-reduction programs (discussed in Note 22)21), we have recognized curtailments and settlements in the U.S. and Canadian pension and OPEB plans. We also recognized in 2011 a settlement loss associated with the partial settlement of a Belgium pension plan. The financial impact of the curtailments and settlements is reflected in the tables above and is recorded in Automotive cost of sales and Selling, administrative and other expenses.
|
| | | | | | | | | | | | | | | | | |
| | Pension Benefits | | | | |
| | U.S. Plans | | Non-U.S. Plans | | U.S. OPEB |
| | 2011 | | 2010 | | 2011 | | 2010 | | 2011 | | 2010 |
| Weighted Average Assumptions Used to Measure our Benefit Obligations and Plan Assets at December 31 | | | | | | | | | | | |
| Discount rate | 4.64 | % | | 5.24 | % | | 4.84 | % | | 5.31 | % | | 4.60 | % | | 5.20 | % |
| Expected return on assets | 7.50 | % | | 8.00 | % | | 6.77 | % | | 7.20 | % | | — |
| | — |
|
| Average rate of increase in compensation | 3.80 | % | | 3.80 | % | | 3.39 | % | | 3.34 | % | | 3.80 | % | | 3.80 | % |
| Assumptions Used to Determine Net Benefit Cost for the Year Ended December 31 | | | | | |
| | |
| | |
| | |
|
| Discount rate | 5.24 | % | | 5.86 | % | | 5.31 | % | | 5.68 | % | | 5.20 | % | | 5.74 | % |
| Expected return on assets | 8.00 | % | | 8.25 | % | | 7.20 | % | | 7.17 | % | | — |
| | — |
|
| Average rate of increase in compensation | 3.80 | % | | 3.80 | % | | 3.34 | % | | 3.15 | % | | 3.80 | % | | 3.80 | % |
The amounts in Accumulated other comprehensive income/(loss) that are expected to be recognized as components of net expense/(income) during the next year are as follows (in millions):
| | | | | | | | | | |
| | | | | | | | | | | | | |
Prior service cost/(credit)* | | $ | 370 | | | $ | 77 | | | $ | (616 | ) | | $ | (169 | ) |
(Gains)/Losses and other* | | | 20 | | | | 213 | | | | 91 | | | | 324 | |
_______
* Excludes Volvo. |
| | | | | | | | | | | | | | | | |
| | | Pension Benefits | | | | |
| | | U.S. Plans | | Non-U.S. Plans | | Worldwide OPEB | | Total |
| Prior service cost/(credit) | | $ | 220 |
| | $ | 70 |
| | $ | (544 | ) | | $ | (254 | ) |
| (Gains)/Losses and other | | 425 |
| | 403 |
| | 129 |
| | 957 |
|
Pension Plan Contributions and Drawdowns
Pension. In 2009,2011, we made $900 million of cash contributions to our funded pension plans. During 2010, we expect to contribute $1.1contributed $1.1 billion to our worldwide funded pension plans and made $400 million of benefit payments directly by the Company for unfunded plans. During 2012, we expect to contribute from available Automotive cash and cash equivalents. In addition,equivalents $3.5 billion to our worldwide funded plans (including discretionary contributions to our U.S. plans of $2 billion), and to make $350 million of benefit payments made directly by usthe Company for unfunded plans, are expected to befor a total of about $400 million.$3.8 billion.
Based on current assumptions and regulations, we do not expect to have a legal requirement to fund our major U.S. pension plans in 2010.
FORD MOTOR COMPANY AND SUBSIDIARIES2012.
NOTES TO THE FINANCIAL STATEMENTS
NOTE 18. RETIREMENT BENEFITS (Continued)
Estimated Future Benefit Payments
The following table presents estimated future gross benefit payments and subsidy receipts related to the Medicare Prescription Drug Improvement and Modernization Act of 2003 (in millions):
|
| | | | | | | | | | | | |
| | | Gross Benefit Payments |
| | | Pension | | |
| | | U.S. Plans | | Non-U.S. Plans | | Worldwide OPEB |
| 2012 | | $ | 3,520 |
| | $ | 1,290 |
| | $ | 460 |
|
| 2013 | | 3,430 |
| | 1,290 |
| | 430 |
|
| 2014 | | 3,350 |
| | 1,300 |
| | 420 |
|
| 2015 | | 3,290 |
| | 1,330 |
| | 410 |
|
| 2016 | | 3,220 |
| | 1,340 |
| | 400 |
|
| 2017 - 2021 | | 15,430 |
| | 7,150 |
| | 1,980 |
|
| | | | | | | |
| | | | | | | | | | |
| | | | | | | | | | | | | |
2010 | | $ | 3,820 | | | $ | 1,350 | | | $ | 480 | | | $ | (20 | ) |
2011 | | | 3,680 | | | | 1,330 | | | | 440 | | | | — | |
2012 | | | 3,580 | | | | 1,360 | | | | 440 | | | | — | |
2013 | | | 3,470 | | | | 1,370 | | | | 430 | | | | — | |
2014 | | | 3,380 | | | | 1,390 | | | | 420 | | | | — | |
2015 - 2019 | | | 15,940 | | | | 7,310 | | | | 2,060 | | | | — | |
FS-50
FORD MOTOR COMPANY AND SUBSIDIARIES
_______NOTES TO THE FINANCIAL STATEMENTS
* Excludes Volvo.NOTE 17. RETIREMENT BENEFITS (Continued)
Pension Plan Asset Information
Investment Objective and Strategies. Our investment objectives for the U.S. plans are to minimize the volatility of the value of our U.S. pension assets relative to U.S. pension liabilities and to ensure assets are sufficient to pay plan benefits. TargetOur prior target asset allocations whichdisclosed in our 2010 Form 10-K Report were established in 2007about 30% public equity investments, 45% fixed income investments, and up to 25% alternative investments (e.g., private equity, real estate, and hedge funds). In October 2011, as part of our broader pension de-risking strategy, we revised our U.S. investment strategy to increase the matching characteristics of our assets relative to our liabilities. Our new U.S. target asset allocations, which we expect to reach over the next several years, are about 30% public equity investments, 45%80% fixed income investments, and up to 25%20% growth assets (primarily alternative investments, (e.g.,which include hedge funds, real estate, private equity, real estate, and hedge funds)public equity). Our largest non-U.S. plans (Ford U.K. and Ford Canada) have similar investment objectives to the U.S. plans. Their prior target asset allocations were 45% fixed income investments, 30% public equity investments, and investment objectives and strategies.up to 25% alternative investments. We expect to reach target asset allocations similar to the new U.S. target asset allocations over the next several years, subject to legal requirements in each country.
Investment strategies and policies for the U.S. plans and the largest non-U.S. plans reflect a balance of risk-reducing and return-seeking considerations. The objective of minimizing the volatility of assets relative to liabilities is addressed primarily through asset diversification, partial asset –- liability matching, asset diversification, and hedging. The fixed income target asset allocation matches the bond-like and long-dated nature of the pension liabilities. Assets are broadly diversified across manywithin asset classes to achieve risk-adjusted returns that in total lower asset volatility relative to the liabilities. Our policy to rebalance our investments regularly ensures actual allocations are in line with target allocations as appropriate. The fixed income target asset allocation partially matches the bond-like and long-dated nature of the pension liabilities.
Strategies to address the goal of ensuring sufficient assets to pay benefits include target allocations to a broad array of asset classes, and strategies within asset classes that provide adequate return,returns, diversification, and liquidity.
All assets are externally managed and most assets are actively managed. Managers are not permitted to invest outside of the asset class (e.g., fixed income, public equity, alternatives) or strategy for which they have been appointed. We use investment guidelines and recurring audits as tools to ensure investment managers invest solely within the investment strategy they have been provided.
Derivatives are permitted for public equity and fixed income investment and public equity managers to use as efficient substitutes for traditional securities and to manage exposure to interest rate and foreign exchange and interest rate risks. Interest rate and foreign currency derivative instruments are used for the purpose of hedging changes in the fair value of assets that result from interest rate changes and currency fluctuations. Interest rate derivatives also are used to adjust portfolio duration. Derivatives may not be used to leverage or to alter the economic exposure to an asset class outside the scope of the mandate an investment manager has been given. Alternative investment managers are permitted to employ leverage (including through the use of derivatives or other tools) that may alter economic exposure.
FORD MOTOR COMPANY AND SUBSIDIARIES
NOTES TO THE FINANCIAL STATEMENTS
NOTE 18. RETIREMENT BENEFITS (Continued)
Significant Concentrations of Risk. Significant concentrations of risk in our plan assets relate to equity, interest rate, equity, and operating risk. In order to ensure assets are sufficient to pay benefits, a portion of plan assets is allocated to equity investments that are expected over time to earn higher returns with more volatility than fixed income investments which more closely match pension liabilities. Within equities, risk is mitigated by constructing a portfolio that is broadly diversified by geography, market capitalization, manager mandate size, investment style and process.
In order to minimize asset volatility relative to the liabilities, a portion of plan assets areis allocated to fixed income investments that are exposed to interest rate risk. Rate increases generally will result in a decline in fixed income assets while reducing the present value of the liabilities. Conversely, rate decreases will increase fixed income assets, partially offsetting the related increase in the liabilities.
In order to ensure assets are sufficient to pay benefits, a portion of plan assets is allocated to growth assets (equity investments and alternative investments) that are expected over time to earn higher returns with more volatility than fixed income investments which more closely match pension liabilities. Within equities, risk is mitigated by constructing a portfolio that is broadly diversified by geography, market capitalization, manager mandate size, investment style and process. Within alternative investments, risk is similarly mitigated by constructing a portfolio that is broadly diversified by asset class, investment strategy, manager, style and process.
Operating risks include the risks of inadequate diversification and weak controls. To mitigate these risks, investments are diversified across and within asset classes in support of investment objectives. Policies and practices to address operating risks include ongoing manager oversight (e.g., style adherence, team strength, firm health, and internal risk controls), plan and asset class investment guidelines and instructions that are communicated to managers, and periodic compliance and audit reviews to ensure adherence.
Ford securities comprised less than 5% ofFS-51
FORD MOTOR COMPANY AND SUBSIDIARIES
NOTES TO THE FINANCIAL STATEMENTS
NOTE 17. RETIREMENT BENEFITS (Continued)
At year-end 2011, within the total market value of our assets in major worldwide plans, during 2009we held less than 2% of fixed income investments in the obligations of Greece, Ireland, Italy, Portugal, and 2008.Spain. Also at year-end 2011, we held less than 2% in Ford securities.
Expected Long-Term Rate of Return on Assets. The long-term return assumption at year-end 20092011 is 8.25%7.50% for the U.S. plans, and 7.75%7.25% for the U.K. plans and7.00% for the Canadian plans, and averages 7.17%6.77% for all non-U.S. plans. A generally consistent approach is used worldwide to develop this assumption. This approach considers various sources, primarily inputs from a range of advisors for long-term capital market returns, inflation, bond yields, and other variables, adjusted for specific aspects of our investment strategy by plan. Historical returns also are considered where appropriate.
At December 31, 2009,2011, our actual 10-year10-year annual rate of return on pension plan assets was 6.3%8.6% for the U.S. plans, 2.6%6.0% for the U.K. plans, and 3.4%4.6% for the Canadian plans. At December 31, 2008,2010, our actual 10-year10-year annual rate of return on pension plan assets was 6%7.3% for the U.S. plans, 3.4%4.1% for the U.K. plans, and 3.7% for the Canadian plans.
Fair Value of Plan Assets. Pension assets are recorded at fair value, and include primarily fixed income and equity securities, derivatives, and alternative investments, which include hedge funds, private equity, and real estate. Fixed income and equity securities may each be combined into commingled fund investments. Commingled funds are valued to reflect the pension fund's interest in the fund based on the reported year-end net asset value ("NAV"). Alternative investments are valued based on year-end reported NAV, with adjustments as appropriate for lagged reporting of 1-6 months.
Fixed Income - Government and Agency Debt Securities and Corporate Debt Securities. U.S. government and government agency obligations, non-U.S. government and government agency obligations, municipal securities, supranational obligations, corporate bonds, bank notes, floating rate notes, and preferred securities are valued based on quotes received from independent pricing services or from dealers who make markets in such securities. Pricing services utilize matrix pricing, which considers readily available inputs such as the yield or price of bonds of comparable quality, coupon, maturity and type, as well as dealer-supplied prices, and generally are categorized as Level 2 inputs in the fair value hierarchy. Securities categorized as Level 3 typically are priced by dealers and pricing services that use proprietary pricing models which incorporate unobservable inputs. These inputs primarily consist of yield and credit spread assumptions.
Fixed Income - Agency and Non-Agency Mortgage and Other Asset-Backed Securities. U.S. and non-U.S. government agency mortgage and asset-backed securities, non-agency collateralized mortgage obligations, commercial mortgage securities, residential mortgage securities, and other asset-backed securities are valued based on quotes received from independent pricing services or from dealers who make markets in such securities. Pricing services utilize matrix pricing, which considers prepayment speed assumptions, attributes of the collateral, yield or price of bonds of comparable quality, coupon, maturity and type, as well as dealer-supplied prices, and generally are categorized as Level 2 inputs in the fair value hierarchy. Securities categorized as Level 3 typically are priced by dealers and pricing services that use proprietary pricing models which incorporate unobservable inputs. These inputs primarily consist of prepayment curves, discount rates, default assumptions, and recovery rates.
Equities. Equity securities are valued based on quoted prices and are primarily exchange-traded. Securities for which official close or last trade pricing on an active exchange is available are classified as Level 1 in the fair value hierarchy. If closing prices are not available, securities are valued at the last quoted bid price or may be valued using the last available price and typically are categorized as Level 2. Level 3 securities often are thinly traded or delisted, with unobservable pricing data.
Derivatives. Exchange-traded derivatives for which market quotations are readily available are valued at the last reported sale price or official closing price as reported by an independent pricing service on the primary market or exchange on which they are traded and are categorized as Level 1. Over-the-counter derivatives typically are valued by independent pricing services and categorized as Level 2. Level 3 derivatives typically are priced by dealers and pricing services that use proprietary pricing models which incorporate unobservable inputs, including extrapolated or model-derived assumptions such as volatilities and yield and credit spread assumptions.
FORD MOTOR COMPANY AND SUBSIDIARIES
NOTES TO THE FINANCIAL STATEMENTS
NOTE 17. RETIREMENT BENEFITS (Continued)
Alternative Assets. Hedge funds generally hold liquid and readily priceable securities, such as public equities in long/short funds, exchange-traded derivatives in macro/commodity trading advisor funds, and corporate bonds in credit relative value funds. Hedge funds themselves do not have readily available market quotations, and therefore are valued using the NAV per share provided by the investment sponsor or third party administrator. Hedge fund assets typically are categorized as Level 3 in the fair value hierarchy, due to the inherent restrictions on redemptions that may affect our ability to sell the investment at its NAV in the near term. Valuations may be lagged 1-3 months. For 2010 and 2011, we made adjustments of $66 million, and $(10) million, respectively, to adjust for hedge fund lagged valuations.
Private equity and real estate investments are less liquid. External investment managers typically report valuations reflecting initial cost or updated appraisals, which are adjusted for cash flows, and realized and unrealized gains/losses. Private equity funds do not have readily available market quotations, and therefore are valued using the NAV per share provided by the investment sponsor or third party administrator. These assets typically are categorized as Level 3 in the fair value hierarchy, due to the inherent restrictions on redemptions that may affect our ability to sell the investment at its NAV in the near term. Valuations may be lagged 1-6 months. The NAV will be adjusted for cash flows (additional investments or contributions, and distributions) through year-end. We may make further adjustments for any known substantive valuation changes not reflected in the NAV. For 2011, we made adjustments of $6 million to adjust for private equity lagged valuations. For 2011, we made adjustments of $13 million to adjust for real estate lagged valuations.
The Ford Germany defined benefit plan is funded through a group insurance contract, in a pool with other policy holders. The contract value represents the value of the underlying assets held by the insurance company (primarily bonds) at the guaranteed rate of return. The adjustment to market asset prices to recognize contractual returns is a significant unobservable input; therefore the contract is Level 3.
FORD MOTOR COMPANY AND SUBSIDIARIES
NOTES TO THE FINANCIAL STATEMENTS
NOTE 18.17. RETIREMENT BENEFITS (Continued)
Fair Value of Plan Assets. The fair value of our pension benefits plan assets (including dividends and interest receivables of $267$291 million and $75$78 million for U.S. and non-U.S. plans, respectively) at December 31, 20092011 by asset category iswas as follows (in millions):
| U.S. Plans | | | |
| | | | | | | | | | | | | |
| Asset Category | | | | | | | | | | | | |
| Equity | | | | | | | | | | | | |
U.S. companies | | $ | 8,675 | | | $ | 26 | | | $ | 15 | | | $ | 8,716 | |
International companies | | | 8,413 | | | | 48 | | | | 92 | | | | 8,553 | |
Commingled funds | | | — | | | | 386 | | | | 3 | | | | 389 | |
Derivative financial instruments (a) | | | (1 | ) | | | — | | | | — | | | | (1 | ) |
Total equity | | | 17,087 | | | | 460 | | | | 110 | | | | 17,657 | |
| Fixed Income | | | | | | | | | | | | | | | | |
U.S. government | | | 2,340 | | | | — | | | | — | | | | 2,340 | |
Government-sponsored enterprises (b) | | | — | | | | 1,310 | | | | 7 | | | | 1,317 | |
| Government – non-U.S. | | | — | | | | 449 | | | | 256 | | | | 705 | |
| Corporate bonds (c) | | | | | | | | | | | | | | | | |
Investment grade | | | — | | | | 8,403 | | | | 85 | | | | 8,488 | |
High yield | | | — | | | | 1,152 | | | | 15 | | | | 1,167 | |
Other credit | | | — | | | | 33 | | | | 21 | | | | 54 | |
Mortgage-backed and other asset-backed | | | — | | | | 1,488 | | | | 278 | | | | 1,766 | |
Commingled funds | | | — | | | | 338 | | | | — | | | | 338 | |
Derivative financial instruments (a) | | | (8 | ) | | | (149 | ) | | | (42 | ) | | | (199 | ) |
Total fixed income | | | 2,332 | | | | 13,024 | | | | 620 | | | | 15,976 | |
| Alternatives | | | | | | | | | | | | | | | | |
Private equity (d) | | | — | | | | — | | | | 1,005 | | | | 1,005 | |
Hedge funds (e) | | | — | | | | — | | | | 1,986 | | | | 1,986 | |
Real estate (f) | | | — | | | | — | | | | 1 | | | | 1 | |
Total alternatives | | | — | | | | — | | | | 2,992 | | | | 2,992 | |
Cash and cash equivalents (g) | | | 7 | | | | 1,864 | | | | — | | | | 1,871 | |
Other (h) | | | (62 | ) | | | 26 | | | | (3 | ) | | | (39 | ) |
Total assets at fair value | | $ | 19,364 | | | $ | 15,374 | | | $ | 3,719 | | | $ | 38,457 | |
|
| | | | | | | | | | | | | | | |
| U.S. Plans | 2011 |
| | Level 1 | | Level 2 | | Level 3 | | Total |
| Asset Category | | | | | | | |
| Equity | | | | | | | |
| U.S. companies | $ | 7,331 |
| | $ | 44 |
| | $ | 12 |
| | $ | 7,387 |
|
| International companies | 5,565 |
| | 32 |
| | 3 |
| | 5,600 |
|
| Commingled funds | — |
| | 244 |
| | 3 |
| | 247 |
|
| Derivative financial instruments (a) | — |
| | — |
| | — |
| | — |
|
| Total equity | 12,896 |
| | 320 |
| | 18 |
| | 13,234 |
|
| Fixed Income | |
| | |
| | |
| | |
|
| U.S. government | 4,084 |
| | — |
| | — |
| | 4,084 |
|
| U.S. government-sponsored enterprises (b) | — |
| | 4,581 |
| | 7 |
| | 4,588 |
|
| Non-U.S. government | — |
| | 1,375 |
| | 169 |
| | 1,544 |
|
| Corporate bonds (c) | |
| | |
| | |
| | |
|
| Investment grade | — |
| | 9,061 |
| | 33 |
| | 9,094 |
|
| High yield | — |
| | 1,280 |
| | 11 |
| | 1,291 |
|
| Other credit | — |
| | 17 |
| | 18 |
| | 35 |
|
| Mortgage/other asset-backed | — |
| | 1,348 |
| | 54 |
| | 1,402 |
|
| Commingled funds | — |
| | 258 |
| | — |
| | 258 |
|
| Derivative financial instruments (a) | |
| | |
| | |
| | |
|
| Interest rate contracts | 13 |
| | 28 |
| | (3 | ) | | 38 |
|
| Credit contracts | — |
| | (8 | ) | | — |
| | (8 | ) |
| Other contracts | — |
| | (265 | ) | | 9 |
| | (256 | ) |
| Total fixed income | 4,097 |
| | 17,675 |
| | 298 |
| | 22,070 |
|
| Alternatives | |
| | |
| | |
| | |
|
| Hedge funds (d) | — |
| | — |
| | 2,968 |
| | 2,968 |
|
| Private equity (e) | — |
| | — |
| | 2,085 |
| | 2,085 |
|
| Real estate (f) | — |
| | — |
| | 362 |
| | 362 |
|
| Total alternatives | — |
| | — |
| | 5,415 |
| | 5,415 |
|
| Cash and cash equivalents (g) | — |
| | 1,477 |
| | 1 |
| | 1,478 |
|
| Other (h) | (2,798 | ) | | 18 |
| | (3 | ) | | (2,783 | ) |
| Total assets at fair value | $ | 14,195 |
| | $ | 19,490 |
| | $ | 5,729 |
| | $ | 39,414 |
|
_______
| |
| (a) | Net derivative position. Gross equity derivative position includes assets of $0.4 million offset by liabilities of $1 million. Gross fixed income derivative position includes assets of $40 million offset by liabilities of $239 million. |
| |
| (b) | Debt securities primarily issued by U.S. government-sponsored enterprises ("GSEs"). |
| |
| (c) | "Investment grade" bonds are those rated Baa3/BBB or higher by at least two rating agencies; "High yield" bonds are those rated below investment grade; "Other credit" refers to non-rated bonds. |
(d) | Diversified investments in private equity funds with the following strategies: buyout (59%), venture capital (25%), mezzanine/distressed (9%), and other (7%). Allocations are estimated based on latest available data for managers reflecting June 30, 2009 holdings.
|
(e)(d) | Funds investing in diverse hedge fund strategies (primarily commingled fund of funds) with the following composition of underlying hedge fund investments within the U.S. pension plans at December 31, 20092011: global macro (39%(42%), equity long/short (25%(21%), event-driven (16%(18%), relative value (12%(11%), and multi-strategy (7%) and cash (1%(8%). |
| |
| (e) | Diversified investments in private equity funds with the following strategies: buyout (61%), venture capital (25%), mezzanine/distressed (8%), and other (6%). Allocations are estimated based on latest available data for managers reflecting June 30, 2011 holdings. |
| |
| (f) | Investment in private property funds broadly classified as core value(-64%added), value-added and opportunistic.opportunistic (36%). |
| |
| (g) | Primarily short-term investment funds to provide liquidity to plan investment managers and cash held to pay benefits. |
| |
| (h) | Primarily cash related to net pending trade purchases/sales and net pending foreign exchange purchases/sales. |
FORD MOTOR COMPANY AND SUBSIDIARIES
NOTES TO THE FINANCIAL STATEMENTS
NOTE 18.17. RETIREMENT BENEFITS (Continued)
| Non-U.S. Plans | | | |
| | | | | | | | | | | | | |
| Asset Category | | | | | | | | | | | | |
| Equity | | | | | | | | | | | | |
U.S. companies | | $ | 2,769 | | | $ | 144 | | | $ | — | | | $ | 2,913 | |
International companies | | | 3,864 | | | | 468 | | | | 21 | | | | 4,353 | |
Total equity | | | 6,633 | | | | 612 | | | | 21 | | | | 7,266 | |
| Fixed Income | | | | | | | | | | | | | | | | |
U.S. government | | | 67 | | | | — | | | | — | | | | 67 | |
Government-sponsored enterprises (a) | | | — | | | | 147 | | | | — | | | | 147 | |
| Government – non-U.S. | | | — | | | | 3,691 | | | | 77 | | | | 3,768 | |
| Corporate bonds (b) | | | | | | | | | | | | | | | | |
Investment grade | | | — | | | | 884 | | | | 28 | | | | 912 | |
High yield | | | — | | | | 101 | | | | 19 | | | | 120 | |
Other credit | | | — | | | | 4 | | | | 7 | | | | 11 | |
Mortgage-backed and other asset-backed | | | — | | | | 151 | | | | 43 | | | | 194 | |
Commingled funds | | | — | | | | 518 | | | | — | | | | 518 | |
Derivative financial instruments (c) | | | — | | | | 1 | | | | 2 | | | | 3 | |
Total fixed income | | | 67 | | | | 5,497 | | | | 176 | | | | 5,740 | |
| Alternatives | | | | | | | | | | | | | | | | |
Private equity (d) | | | — | | | | — | | | | 4 | | | | 4 | |
Hedge funds (e) | | | — | | | | — | | | | 244 | | | | 244 | |
Real estate (f) | | | 1 | | | | 12 | | | | — | | | | 13 | |
Total alternatives | | | 1 | | | | 12 | | | | 248 | | | | 261 | |
Cash and cash equivalents (g) | | | 22 | | | | 310 | | | | — | | | | 332 | |
Other (h) | | | (45 | ) | | | 13 | | | | 3,997 | | | | 3,965 | |
Total assets at fair value | | $ | 6,678 | | | $ | 6,444 | | | $ | 4,442 | | | $ | 17,564 | |
|
| | | | | | | | | | | | | | | |
| Non-U.S. Plans | 2011 |
| | Level 1 | | Level 2 | | Level 3 | | Total |
| Asset Category | | | | | | | |
| Equity | | | | | | | |
| U.S. companies | $ | 2,596 |
| | $ | 181 |
| | $ | — |
| | $ | 2,777 |
|
| International companies | 2,906 |
| | 154 |
| | 1 |
| | 3,061 |
|
| Derivative financial instruments (a) | — |
| | — |
| | — |
| | — |
|
| Total equity | 5,502 |
| | 335 |
| | 1 |
| | 5,838 |
|
| Fixed Income | |
| | |
| | |
| | |
|
| U.S. government | 33 |
| | — |
| | — |
| | 33 |
|
| U.S. government-sponsored enterprises (b) | — |
| | 16 |
| | — |
| | 16 |
|
| Non-U.S. government | 2 |
| | 5,805 |
| | 122 |
| | 5,929 |
|
| Corporate bonds (c) | |
| | |
| | |
| | |
|
| Investment grade | — |
| | 975 |
| | 11 |
| | 986 |
|
| High yield | — |
| | 271 |
| | — |
| | 271 |
|
| Other credit | — |
| | 15 |
| | — |
| | 15 |
|
| Mortgage/other asset-backed | — |
| | 189 |
| | 6 |
| | 195 |
|
| Commingled funds | — |
| | 415 |
| | — |
| | 415 |
|
| Derivative financial instruments (a) | |
| | |
| | |
| | |
|
| Interest rate contracts | — |
| | (15 | ) | | (6 | ) | | (21 | ) |
| Credit contracts | — |
| | (1 | ) | | — |
| | (1 | ) |
| Other contracts | — |
| | (1 | ) | | — |
| | (1 | ) |
| Total fixed income | 35 |
| | 7,669 |
| | 133 |
| | 7,837 |
|
| Alternatives | |
| | |
| | |
| | |
|
| Hedge funds (d) | — |
| | — |
| | 1,053 |
| | 1,053 |
|
| Private equity (e) | — |
| | — |
| | 123 |
| | 123 |
|
| Real estate (f) | — |
| | 1 |
| | 160 |
| | 161 |
|
| Total alternatives | — |
| | 1 |
| | 1,336 |
| | 1,337 |
|
| Cash and cash equivalents (g) | — |
| | 370 |
| | — |
| | 370 |
|
| Other (h) | (554 | ) | | 12 |
| | 4,358 |
| | 3,816 |
|
| Total assets at fair value | $ | 4,983 |
| | $ | 8,387 |
| | $ | 5,828 |
| | $ | 19,198 |
|
_______
| |
| (a) | Net derivative position. |
| |
| (b) | Debt securities primarily issued by GSEs.GSEs. |
| |
(b)(c) | "Investment grade" bonds are those rated Baa3/BBB or higher by at least two rating agencies; "High yield" bonds are those rated below investment grade; "Other credit" refers to non-rated bonds. |
(c) | Net derivative position. Fixed income derivative position includes assets of $12 million offset by liabilities of $9 million.
|
| (d) | Funds investing in diversified portfolio of underlying hedge funds (commingled fund of funds). At December 31, 2011, the composition of underlying hedge fund investments (within the U.K. and Canada pension plans) was: event-driven (30%), equity long/short (27%), global macro (14%), multi-strategy (14%) relative value (11%), and cash (4%). |
| |
| (e) | Investments in private investment funds (funds of funds) pursuing strategies broadly classified as venture capital and buyouts. |
| |
| (f) | Investment in private property funds broadly classified as core (13%), value-added and opportunistic (87%). Also includes investment in real assets. |
| |
| (g) | Primarily short-term investment funds to provide liquidity to plan investment managers. |
| |
| (h) | Primarily Ford-Werke GmbH ("Ford-Werke") plan assets (insurance contract valued at $3,406 million) and cash related to net pending trade purchases/sales and net pending foreign exchange purchases/sales. |
FORD MOTOR COMPANY AND SUBSIDIARIES
NOTES TO THE FINANCIAL STATEMENTS
NOTE 17. RETIREMENT BENEFITS (Continued)
The fair value of our pension benefits plan assets (including dividends and interest receivables of $266 million and $72 million for U.S. and non-U.S. plans, respectively) at December 31, 2010 by asset category was as follows (in millions):
|
| | | | | | | | | | | | | | | |
| U.S. Plans | 2010 |
| | Level 1 | | Level 2 | | Level 3 | | Total |
| Asset Category | | | | | | | |
| Equity | | | | | | | |
| U.S. companies | $ | 8,832 |
| | $ | 35 |
| | $ | 13 |
| | $ | 8,880 |
|
| International companies | 7,879 |
| | 50 |
| | 6 |
| | 7,935 |
|
| Commingled funds | — |
| | 351 |
| | 3 |
| | 354 |
|
| Derivative financial instruments (a) | — |
| | — |
| | — |
| | — |
|
| Total equity | 16,711 |
| | 436 |
| | 22 |
| | 17,169 |
|
| Fixed Income | |
| | |
| | |
| | |
|
| U.S. government | 2,366 |
| | — |
| | — |
| | 2,366 |
|
| U.S. government-sponsored enterprises (b) | — |
| | 2,706 |
| | 13 |
| | 2,719 |
|
| Non-U.S. government | — |
| | 1,005 |
| | 280 |
| | 1,285 |
|
| Corporate bonds (c) | |
| | |
| | |
| | |
|
| Investment grade | — |
| | 8,530 |
| | 28 |
| | 8,558 |
|
| High yield | — |
| | 1,170 |
| | 2 |
| | 1,172 |
|
| Other credit | — |
| | 22 |
| | 51 |
| | 73 |
|
| Mortgage/other asset-backed | — |
| | 1,637 |
| | 125 |
| | 1,762 |
|
| Commingled funds | — |
| | 248 |
| | — |
| | 248 |
|
| Derivative financial instruments (a) | |
| | |
| | |
| | |
|
| Interest rate contracts | 39 |
| | (32 | ) | | (2 | ) | | 5 |
|
| Credit contracts | — |
| | 1 |
| | — |
| | 1 |
|
| Other contracts | — |
| | (1 | ) | | — |
| | (1 | ) |
| Total fixed income | 2,405 |
| | 15,286 |
| | 497 |
| | 18,188 |
|
| Alternatives | |
| | |
| | |
| | |
|
| Hedge funds (d) | — |
| | — |
| | 2,854 |
| | 2,854 |
|
| Private equity (e) | — |
| | — |
| | 1,491 |
| | 1,491 |
|
| Real estate (f) | — |
| | — |
| | 120 |
| | 120 |
|
| Total alternatives | — |
| | — |
| | 4,465 |
| | 4,465 |
|
| Cash and cash equivalents (g) | — |
| | 1,064 |
| | — |
| | 1,064 |
|
| Other (h) | (939 | ) | | 16 |
| | (3 | ) | | (926 | ) |
| Total assets at fair value | $ | 18,177 |
| | $ | 16,802 |
| | $ | 4,981 |
| | $ | 39,960 |
|
_______
| |
| (a) | Net derivative position. Gross equity derivative position includes assets of $0.4 million offset by liabilities of $0.2 million. Gross fixed income derivative position includes assets of $44 million offset by liabilities of $39 million. |
| |
| (b) | Debt securities primarily issued by GSEs. |
| |
| (c) | "Investment grade" bonds are those rated Baa3/BBB or higher by at least two rating agencies; "High yield" bonds are those rated below investment grade; "Other credit" refers to non-rated bonds. |
| |
| (d) | Funds investing in diverse hedge fund strategies (primarily commingled fund of funds) with the following composition of underlying hedge fund investments within the U.S. pension plans at December 31, 2010: global macro (34%), equity long/short (25%), event-driven (20%), relative value (15%), and multi-strategy (6%). |
| |
| (e) | Diversified investments in private equity funds with the following strategies: buyout (61%), venture capital (27%), mezzanine/distressed (9%), and other (3%). Allocations are estimated based on latest available data for managers reflecting June 30, 2010 holdings. |
| |
| (f) | Investment in private property funds broadly classified as core, value-added and opportunistic. |
| |
| (g) | Primarily short-term investment funds to provide liquidity to plan investment managers and cash held to pay benefits. |
| |
| (h) | Primarily cash related to net pending trade purchases/sales and net pending foreign exchange purchases/sales. |
FORD MOTOR COMPANY AND SUBSIDIARIES
NOTES TO THE FINANCIAL STATEMENTS
NOTE 17. RETIREMENT BENEFITS (Continued)
|
| | | | | | | | | | | | | | | |
| Non-U.S. Plans | 2010 |
| | Level 1 | | Level 2 | | Level 3 | | Total |
| Asset Category | | | | | | | |
| Equity | | | | | | | |
| U.S. companies | $ | 2,837 |
| | $ | 214 |
| | $ | — |
| | $ | 3,051 |
|
| International companies | 3,759 |
| | 217 |
| | 10 |
| | 3,986 |
|
| Derivative financial instruments (a) | — |
| | — |
| | — |
| | — |
|
| Total equity | 6,596 |
| | 431 |
| | 10 |
| | 7,037 |
|
| Fixed Income | |
| | |
| | |
| | |
|
| U.S. government | 36 |
| | — |
| | — |
| | 36 |
|
| U.S. government-sponsored enterprises (b) | — |
| | 118 |
| | — |
| | 118 |
|
| Non-U.S. government | — |
| | 4,282 |
| | 103 |
| | 4,385 |
|
| Corporate bonds (c) | |
| | |
| | |
| | |
|
| Investment grade | — |
| | 802 |
| | 15 |
| | 817 |
|
| High yield | — |
| | 180 |
| | 20 |
| | 200 |
|
| Other credit | — |
| | 15 |
| | — |
| | 15 |
|
| Mortgage/other asset-backed | — |
| | 203 |
| | 34 |
| | 237 |
|
| Commingled funds | — |
| | 573 |
| | 8 |
| | 581 |
|
| Derivative financial instruments (a) | |
| | |
| | |
| | |
|
| Interest rate contracts | 2 |
| | 4 |
| | — |
| | 6 |
|
| Credit contracts | — |
| | 1 |
| | — |
| | 1 |
|
| Other contracts | — |
| | — |
| | — |
| | — |
|
| Total fixed income | 38 |
| | 6,178 |
| | 180 |
| | 6,396 |
|
| Alternatives | |
| | |
| | |
| | |
|
| Hedge funds (d) | — |
| | — |
| | 711 |
| | 711 |
|
| Private equity (e) | — |
| | — |
| | 31 |
| | 31 |
|
| Real estate (f) | — |
| | — |
| | 11 |
| | 11 |
|
| Total alternatives | — |
| | — |
| | 753 |
| | 753 |
|
| Cash and cash equivalents (g) | — |
| | 335 |
| | — |
| | 335 |
|
| Other (h) | (297 | ) | | 11 |
| | 4,380 |
| | 4,094 |
|
| Total assets at fair value | $ | 6,337 |
| | $ | 6,955 |
| | $ | 5,323 |
| | $ | 18,615 |
|
_______
| |
| (a) | Net derivative position. Gross equity derivative position includes liabilities of $0.1 million. Gross fixed income derivative position includes assets of $7.2 million offset by liabilities of $0.4 million. |
| |
| (b) | Debt securities primarily issued by GSEs. |
| |
| (c) | "Investment grade" bonds are those rated Baa3/BBB or higher by at least two rating agencies; "High yield" bonds are those rated below investment grade; "Other credit" refers to non-rated bonds. |
| |
| (d) | Funds investing in diversified portfolio of underlying hedge funds (commingled fund of funds)funds). At December 31, 2009,2010, the composition of underlying hedge fund investments (within the U.K. and Canada pension plans) was: equity long/short (26%(33%), event-driven (25%), relative value (20%), global macro (20%), event-driven (18%), relative value (16%(11%), multi-strategy (14%(10%) and cash (6%(1%). |
| |
| (e) | Investments in private investment funds (funds of funds) pursuing strategies broadly classified as venture capital and buyouts. |
| |
| (f) | Investment in private property funds broadly classified as core, value-addedvalue-added and opportunistic. Also includes investment in real assets. |
| |
| (g) | Primarily short-term investment funds to provide liquidity to plan investment managers. |
| |
| (h) | Primarily Ford-Werke GmbH ("Ford-Werke") plan assets (insurance contractscontract valued at $3,480 million)$3,371 million) and cash related to net pending trade purchases/sales and net pending foreign exchange purchases/sales. |
FORD MOTOR COMPANY AND SUBSIDIARIES
NOTES TO THE FINANCIAL STATEMENTS
NOTE 18.17. RETIREMENT BENEFITS (Continued)
The following table summarizes the changes in Level 3 pension benefits plan assets measured at fair value on a recurring basis for the periodyear ended December 31, 20092011 (in millions):
| U.S. Plans | | | |
| | | | | | | | | | | | | | | | |
| | | Fair Value at January 1, 2009 | | | Attributable to Assets Held at December 31, 2009 | | | Attributable to Assets Sold | | | Net Purchases/ (Settlements) | | | Net Transfers Into/(Out of) Level 3 | | | Fair Value at December 31, 2009 | |
| Asset Category | | | | | | | | | | | | | | | | | | |
| Equity | | | | | | | | | | | | | | | | | | |
U.S. companies | | $ | 2 | | | $ | — | | | $ | — | | | $ | — | | | $ | 13 | | | $ | 15 | |
International companies | | | 13 | | | | 24 | | | | (5 | ) | | | 20 | | | | 40 | | | | 92 | |
Commingled funds | | | 4 | | | | (2 | ) | | | — | | | | 1 | | | | — | | | | 3 | |
Total equity | | | 19 | | | | 22 | | | | (5 | ) | | | 21 | | | | 53 | | | | 110 | |
| Fixed Income | | | | | | | | | | | | | | | | | | | | | | | | |
U.S. government | | | 19 | | | | — | | | | (2 | ) | | | (17 | ) | | | — | | | | — | |
Government-sponsored enterprises | | | 12 | | | | — | | | | — | | | | (1 | ) | | | (4 | ) | | | 7 | |
| Government – non-U.S. | | | 254 | | | | 20 | | | | 5 | | | | (31 | ) | | | 8 | | | | 256 | |
| Corporate bonds | | | | | | | | | | | | | | | | | | | | | | | | |
Investment grade | | | 371 | | | | (4 | ) | | | 12 | | | | (133 | ) | | | (161 | ) | | | 85 | |
High yield | | | 66 | | | | 1 | | | | — | | | | (45 | ) | | | (7 | ) | | | 15 | |
Other credit | | | 29 | | | | 8 | | | | — | | | | (11 | ) | | | (5 | ) | | | 21 | |
Mortgage-backed and other asset-backed | | | 723 | | | | 16 | | | | 63 | | | | (416 | ) | | | (108 | ) | | | 278 | |
Derivative financial instruments | | | (140 | ) | | | (5 | ) | | | 148 | | | | (45 | ) | | | — | | | | (42 | ) |
Total fixed income | | | 1,334 | | | | 36 | | | | 226 | | | | (699 | ) | | | (277 | ) | | | 620 | |
| Alternatives | | | | | | | | | | | | | | | | | | | | | | | | |
Private equity | | | 868 | | | | (84 | ) | | | — | | | | 221 | | | | — | | | | 1,005 | |
Hedge funds | | | 1,170 | | | | 137 | | | | 9 | | | | 670 | | | | — | | | | 1,986 | |
Real estate | | | 1 | | | | — | | | | — | | | | — | | | | — | | | | 1 | |
Total alternatives | | | 2,039 | | | | 53 | | | | 9 | | | | 891 | | | | — | | | | 2,992 | |
Cash and cash equivalents | | | 3 | | | | — | | | | — | | | | — | | | | (3 | ) | | | — | |
Other | | | — | | | | — | | | | (2 | ) | | | (1 | ) | | | — | | | | (3 | ) |
Total Level 3 fair value | | $ | 3,395 | | | $ | 111 | | | $ | 228 | | | $ | 212 | | | $ | (227 | ) | | $ | 3,719 | |
FS - 52 |
| | | | | | | | | | | | | | | | | | | | | | | | | | | |
| U.S. Plans | 2011 |
| | | Return on plan assets | | | | Transfers | | |
| | Fair Value at January 1, 2011 | | Attributable to Assets Held at December 31, 2011 | | Attributable to Assets Sold | | Net Purchases/ (Settlements) | | Into Level 3 | | Out of Level 3 | | Fair Value at December 31, 2011 |
| Asset Category | | | | | | | | | | | | | |
| Equity | | | | | | | | | | | | | |
| U.S. companies | $ | 13 |
| | $ | (1 | ) | | $ | — |
| | $ | — |
| | $ | — |
| | $ | — |
| | $ | 12 |
|
| International companies | 6 |
| | — |
| | (1 | ) | | (1 | ) | | — |
| | (1 | ) | | 3 |
|
| Commingled funds | 3 |
| | — |
| | — |
| | — |
| | — |
| | — |
| | 3 |
|
| Derivative financial instruments | — |
| | — |
| | — |
| | — |
| | — |
| | — |
| | — |
|
| Total equity | 22 |
| | (1 | ) | | (1 | ) | | (1 | ) | | — |
| | (1 | ) | | 18 |
|
| Fixed Income | |
| | |
| | |
| | |
| | |
| | |
| | |
|
| U.S. government | — |
| | — |
| | — |
| | — |
| | — |
| | — |
| | — |
|
| U.S. government-sponsored enterprises | 14 |
| | — |
| | — |
| | (5 | ) | | — |
| | (1 | ) | | 8 |
|
| Non-U.S. government | 280 |
| | (2 | ) | | (3 | ) | | (86 | ) | | 13 |
| | (33 | ) | | 169 |
|
| Corporate bonds | |
| | |
| | |
| | |
| | |
| | |
| | |
|
| Investment grade | 28 |
| | 4 |
| | 2 |
| | 18 |
| | 3 |
| | (22 | ) | | 33 |
|
| High yield | 2 |
| | (1 | ) | | — |
| | 8 |
| | 3 |
| | (1 | ) | | 11 |
|
| Other credit | 50 |
| | (1 | ) | | — |
| | (32 | ) | | — |
| | — |
| | 17 |
|
| Mortgage/other asset-backed | 125 |
| | (3 | ) | | 1 |
| | (38 | ) | | 4 |
| | (35 | ) | | 54 |
|
| Derivative financial instruments | |
| | |
| | |
| | |
| | |
| | |
| | |
|
| Interest rate contracts | (2 | ) | | — |
| | (1 | ) | | — |
| | — |
| | — |
| | (3 | ) |
| Credit contracts | — |
| | — |
| | — |
| | — |
| | — |
| | — |
| | — |
|
| Other contracts | — |
| | 25 |
| | (8 | ) | | (8 | ) | | — |
| | — |
| | 9 |
|
| Total fixed income | 497 |
| | 22 |
| | (9 | ) | | (143 | ) | | 23 |
| | (92 | ) | | 298 |
|
| Alternatives | |
| | |
| | |
| | |
| | |
| | |
| | |
|
| Hedge funds | 2,854 |
| | 10 |
| | (22 | ) | | 126 |
| | — |
| | — |
| | 2,968 |
|
| Private equity | 1,491 |
| | 244 |
| | — |
| | 350 |
| | — |
| | — |
| | 2,085 |
|
| Real estate | 120 |
| | 39 |
| | — |
| | 203 |
| | — |
| | — |
| | 362 |
|
| Total alternatives | 4,465 |
| | 293 |
| | (22 | ) | | 679 |
| | — |
| | — |
| | 5,415 |
|
| Other | (3 | ) | | — |
| | — |
| | 1 |
| | — |
| | — |
| | (2 | ) |
| Total Level 3 fair value | $ | 4,981 |
| | $ | 314 |
| | $ | (32 | ) | | $ | 536 |
| | $ | 23 |
| | $ | (93 | ) | | $ | 5,729 |
|
FORD MOTOR COMPANY AND SUBSIDIARIES
NOTES TO THE FINANCIAL STATEMENTS
NOTE 18.17. RETIREMENT BENEFITS (Continued)
| Non-U.S. Plans | | | |
| | | | | | | | | | | | | | | | |
| | | Fair Value at January 1, 2009 | | | Attributable to Assets Held at December 31, 2009 | | | Attributable to Assets Sold | | | Net Purchases/ (Settlements) | | | Net Transfers Into/(Out of) Level 3 | | | Fair Value at December 31, 2009 | |
| Asset Category | | | | | | | | | | | | | | | | | | |
| Equity | | | | | | | | | | | | | | | | | | |
U.S. companies | | $ | 1 | | | $ | — | | | $ | — | | | $ | (1 | ) | | $ | — | | | $ | — | |
International companies | | | 10 | | | | 6 | | | | (1 | ) | | | 2 | | | | 4 | | | | 21 | |
Total equity | | | 11 | | | | 6 | | | | (1 | ) | | | 1 | | | | 4 | | | | 21 | |
| Fixed Income | | | | | | | | | | | | | | | | | | | | | | | | |
| Government – non-U.S. | | | 152 | | | | 10 | | | | 3 | | | | (43 | ) | | | (45 | ) | | | 77 | |
| Corporate bonds | | | | | | | | | | | | | | | | | | | | | | | | |
Investment grade | | | 80 | | | | 1 | | | | 4 | | | | (14 | ) | | | (43 | ) | | | 28 | |
High yield | | | 12 | | | | 2 | | | | 1 | | | | 2 | | | | 2 | | | | 19 | |
Other credit | | | 5 | | | | 1 | | | | — | | | | (2 | ) | | | 3 | | | | 7 | |
Mortgage-backed and other asset-backed | | | 38 | | | | 5 | | | | 1 | | | | (8 | ) | | | 7 | | | | 43 | |
Derivative financial instruments | | | 16 | | | | (3 | ) | | | — | | | | (11 | ) | | | — | | | | 2 | |
Total fixed income | | | 303 | | | | 16 | | | | 9 | | | | (76 | ) | | | (76 | ) | | | 176 | |
| Alternatives | | | | | | | | | | | | | | | | | | | | | | | | |
Private equity | | | — | | | | — | | | | — | | | | 4 | | | | — | | | | 4 | |
Hedge funds | | | 3 | | | | 18 | | | | — | | | | 223 | | | | — | | | | 244 | |
Real estate | | | — | | | | — | | | | — | | | | — | | | | — | | | | — | |
Total alternatives | | | 3 | | | | 18 | | | | — | | | | 227 | | | | — | | | | 248 | |
| Other * | | | 3,643 | | | | 354 | | | | — | | | | — | | | | — | | | | 3,997 | |
Total Level 3 fair value | | $ | 3,960 | | | $ | 394 | | | $ | 8 | | | $ | 152 | | | $ | (72 | ) | | $ | 4,442 | |
|
| | | | | | | | | | | | | | | | | | | | | | | | | | | |
| Non-U.S. Plans | 2011 |
| | | | Return on plan assets | | | | Transfers | | |
| | Fair Value at January 1, 2011 | | Attributable to Assets Held at December 31, 2011 | | Attributable to Assets Sold | | Net Purchases/ (Settlements) | | Into Level 3 | | Out of Level 3 | | Fair Value at December 31, 2011 |
| Asset Category | | | | | | | | | | | | | |
| Equity | | | | | | | | | | | | | |
| U.S. companies | $ | — |
| | $ | — |
| | $ | — |
| | $ | — |
| | $ | — |
| | $ | — |
| | $ | — |
|
| International companies | 10 |
| | — |
| | — |
| | (5 | ) | | 1 |
| | (5 | ) | | 1 |
|
| Commingled funds | — |
| | — |
| | — |
| | — |
| | — |
| | — |
| | — |
|
| Total equity | 10 |
| | — |
| | — |
| | (5 | ) | | 1 |
| | (5 | ) | | 1 |
|
| Fixed Income | |
| | |
| | |
| | |
| | |
| | |
| | |
|
| U.S. government | — |
| | — |
| | — |
| | — |
| | — |
| | — |
| | — |
|
| U.S. government-sponsored enterprises | — |
| | — |
| | — |
| | — |
| | — |
| | — |
| | — |
|
| Non-U.S. government | 103 |
| | (6 | ) | | 1 |
| | 28 |
| | — |
| | (4 | ) | | 122 |
|
| Corporate bonds | |
| | |
| | |
| | |
| | |
| | |
| | |
|
| Investment grade | 15 |
| | (1 | ) | | 1 |
| | (7 | ) | | 3 |
| | — |
| | 11 |
|
| High yield | 20 |
| | — |
| | — |
| | (10 | ) | | — |
| | (10 | ) | | — |
|
| Other credit | — |
| | — |
| | — |
| | — |
| | — |
| | — |
| | — |
|
| Mortgage/other asset-backed | 34 |
| | — |
| | 1 |
| | (24 | ) | | 1 |
| | (6 | ) | | 6 |
|
| Commingled funds | 8 |
| | — |
| | — |
| | (8 | ) | | — |
| | — |
| | — |
|
| Derivative financial instruments | — |
| | — |
| | (2 | ) | | (4 | ) | | — |
| | — |
| | (6 | ) |
| Total fixed income | 180 |
| | (7 | ) | | 1 |
| | (25 | ) | | 4 |
| | (20 | ) | | 133 |
|
| Alternatives | |
| | |
| | |
| | |
| | |
| | |
| | |
|
| Hedge funds | 711 |
| | (31 | ) | | 11 |
| | 362 |
| | — |
| | — |
| | 1,053 |
|
| Private equity | 31 |
| | (3 | ) | | — |
| | 95 |
| | — |
| | — |
| | 123 |
|
| Real estate | 11 |
| | 6 |
| | — |
| | 143 |
| | — |
| | — |
| | 160 |
|
| Total alternatives | 753 |
| | (28 | ) | | 11 |
| | 600 |
| | — |
| | — |
| | 1,336 |
|
| Other (a) | 4,380 |
| | (22 | ) | | — |
| | — |
| | — |
| | — |
| | 4,358 |
|
| Total Level 3 fair value | $ | 5,323 |
| | $ | (57 | ) | | $ | 12 |
| | $ | 570 |
| | $ | 5 |
| | $ | (25 | ) | | $ | 5,828 |
|
_______
* | |
| (a) | Primarily Ford-Werke plan assets (insurance contractscontract valued at $3,4803,406 million). |
FORD MOTOR COMPANY AND SUBSIDIARIES
NOTES TO THE FINANCIAL STATEMENTS
NOTE 17. RETIREMENT BENEFITS (Continued)
The following table summarizes the changes in Level 3 pension benefits plan assets measured at fair value on a recurring basis for the year ended December 31, 2010 (in millions):
|
| | | | | | | | | | | | | | | | | | | | | | | | | | | |
| U.S. Plans | 2010 |
| | | Return on plan assets | | | | Transfers | | |
| | Fair Value at January 1, 2010 | | Attributable to Assets Held at December 31, 2010 | | Attributable to Assets Sold | | Net Purchases/ (Settlements) | | Into Level 3 | | Out of Level 3 | | Fair Value at December 31, 2010 |
| Asset Category | | | | | | | | | | | | | |
| Equity | | | | | | | | | | | | | |
| U.S. companies | $ | 15 |
| | $ | (2 | ) | | $ | — |
| | $ | — |
| | $ | — |
| | $ | — |
| | $ | 13 |
|
| International companies | 92 |
| | 2 |
| | 4 |
| | (38 | ) | | 1 |
| | (55 | ) | | 6 |
|
| Commingled funds | 3 |
| | — |
| | — |
| | — |
| | — |
| | — |
| | 3 |
|
| Derivative financial instruments | — |
| | — |
| | — |
| | — |
| | — |
| | — |
| | — |
|
| Total equity | 110 |
| | — |
| | 4 |
| | (38 | ) | | 1 |
| | (55 | ) | | 22 |
|
| Fixed Income | |
| | |
| | |
| | |
| | |
| | |
| | |
|
| U.S. government | — |
| | — |
| | — |
| | — |
| | — |
| | — |
| | — |
|
| U.S. government-sponsored enterprises | 7 |
| | — |
| | — |
| | 8 |
| | — |
| | (1 | ) | | 14 |
|
| Non-U.S. government | 256 |
| | 15 |
| | 7 |
| | 91 |
| | 1 |
| | (90 | ) | | 280 |
|
| Corporate bonds | |
| | |
| | |
| | |
| | |
| | |
| | |
|
| Investment grade | 85 |
| | — |
| | 5 |
| | (42 | ) | | 13 |
| | (33 | ) | | 28 |
|
| High yield | 15 |
| | — |
| | (9 | ) | | — |
| | — |
| | (4 | ) | | 2 |
|
| Other credit | 21 |
| | 2 |
| | 1 |
| | 30 |
| | — |
| | (4 | ) | | 50 |
|
| Mortgage/other asset-backed | 278 |
| | 4 |
| | 47 |
| | (23 | ) | | 30 |
| | (211 | ) | | 125 |
|
| Derivative financial instruments | |
| | |
| | |
| | |
| | |
| | |
| | |
|
| Interest rate contracts | (42 | ) | | — |
| | 10 |
| | 32 |
| | 1 |
| | (3 | ) | | (2 | ) |
| Credit contracts | — |
| | — |
| | — |
| | — |
| | — |
| | — |
| | — |
|
| Other contracts | — |
| | — |
| | — |
| | — |
| | — |
| | — |
| | — |
|
| Total fixed income | 620 |
| | 21 |
| | 61 |
| | 96 |
| | 45 |
| | (346 | ) | | 497 |
|
| Alternatives | |
| | |
| | |
| | |
| | |
| | |
| | |
|
| Hedge funds | 1,986 |
| | 330 |
| | — |
| | 538 |
| | — |
| | — |
| | 2,854 |
|
| Private equity | 1,005 |
| | 104 |
| | — |
| | 382 |
| | — |
| | — |
| | 1,491 |
|
| Real estate | 1 |
| | 2 |
| | — |
| | 117 |
| | — |
| | — |
| | 120 |
|
| Total alternatives | 2,992 |
| | 436 |
| | — |
| | 1,037 |
| | — |
| | — |
| | 4,465 |
|
| Other | (3 | ) | | — |
| | — |
| | — |
| | — |
| | — |
| | (3 | ) |
| Total Level 3 fair value | $ | 3,719 |
| | $ | 457 |
| | $ | 65 |
| | $ | 1,095 |
| | $ | 46 |
| | $ | (401 | ) | | $ | 4,981 |
|
FORD MOTOR COMPANY AND SUBSIDIARIES
NOTES TO THE FINANCIAL STATEMENTS
NOTE 19.17. RETIREMENT BENEFITS (Continued)
|
| | | | | | | | | | | | | | | | | | | | | | | | | | | |
| Non-U.S. Plans | 2010 |
| | | | Return on plan assets | | | | Transfers | | |
| | Fair Value at January 1, 2010 | | Attributable to Assets Held at December 31, 2010 | | Attributable to Assets Sold | | Net Purchases/ (Settlements) | | Into Level 3 | | Out of Level 3 | | Fair Value at December 31, 2010 |
| Asset Category | | | | | | | | | | | | | |
| Equity | | | | | | | | | | | | | |
| U.S. companies | $ | — |
| | $ | — |
| | $ | — |
| | $ | — |
| | $ | — |
| | $ | — |
| | $ | — |
|
| International companies | 21 |
| | — |
| | 1 |
| | (9 | ) | | 6 |
| | (9 | ) | | 10 |
|
| Commingled funds | — |
| | — |
| | — |
| | — |
| | — |
| | — |
| | — |
|
| Total equity | 21 |
| | — |
| | 1 |
| | (9 | ) | | 6 |
| | (9 | ) | | 10 |
|
| Fixed Income | |
| | |
| | |
| | |
| | |
| | |
| | |
|
| U.S. government | — |
| | — |
| | — |
| | — |
| | — |
| | — |
| | — |
|
| U.S. government-sponsored enterprises | — |
| | — |
| | — |
| | — |
| | — |
| | — |
| | — |
|
| Non-U.S. government | 77 |
| | 9 |
| | 2 |
| | (3 | ) | | 26 |
| | (8 | ) | | 103 |
|
| Corporate bonds | |
| | |
| | |
| | |
| | |
| | |
| | |
|
| Investment grade | 28 |
| | — |
| | (2 | ) | | 2 |
| | 5 |
| | (18 | ) | | 15 |
|
| High yield | 19 |
| | 1 |
| | (2 | ) | | 4 |
| | — |
| | (2 | ) | | 20 |
|
| Other credit | 7 |
| | — |
| | — |
| | (7 | ) | | — |
| | — |
| | — |
|
| Mortgage/other asset-backed | 43 |
| | 2 |
| | — |
| | — |
| | 2 |
| | (13 | ) | | 34 |
|
| Commingled funds | — |
| | — |
| | 1 |
| | 7 |
| | — |
| | — |
| | 8 |
|
| Derivative financial instruments | 2 |
| | — |
| | — |
| | (2 | ) | | — |
| | — |
| | — |
|
| Total fixed income | 176 |
| | 12 |
| | (1 | ) | | 1 |
| | 33 |
| | (41 | ) | | 180 |
|
| Alternatives | |
| | |
| | |
| | |
| | |
| | |
| | |
|
| Hedge funds | 244 |
| | 23 |
| | — |
| | 444 |
| | — |
| | — |
| | 711 |
|
| Private equity | 4 |
| | — |
| | — |
| | 27 |
| | — |
| | — |
| | 31 |
|
| Real estate | — |
| | 2 |
| | — |
| | 9 |
| | — |
| | — |
| | 11 |
|
| Total alternatives | 248 |
| | 25 |
| | — |
| | 480 |
| | — |
| | — |
| | 753 |
|
| Other (a) | 3,989 |
| | 391 |
| | — |
| | — |
| | — |
| | — |
| | 4,380 |
|
| Total Level 3 fair value | $ | 4,434 |
| | $ | 428 |
| | $ | — |
| | $ | 472 |
| | $ | 39 |
| | $ | (50 | ) | | $ | 5,323 |
|
_______
| |
| (a) | Primarily Ford-Werke plan assets (insurance contract valued at $3,371 million). |
NOTE 18. DEBT AND COMMITMENTS
Our debt consists of short-term and long-term unsecured debt securities, convertible debt securities, and unsecured and secured borrowings from banks and other lenders. Debt issuances are placed directly by us or through securities dealers or underwriters and are held by institutional and retail investors. In addition, Ford Credit sponsors securitization programs that provide short-term and long-term asset-backed financing through institutional investors in the U.S. and international capital markets.
Debt is recorded on our balance sheet at par value adjusted for unamortized discount or premium (in addition toand adjustments related to debt in designated fair value hedge relationships; seehedges (see Note 2625 for policy detail). Discounts, premiums, and costs directly related to the issuance of debt generally are capitalized and amortized over the life of the debt and are recorded in Interest expenseusing the interest method. Gains and losses on the extinguishment of debt are recorded in Automotive interest income and other non-operating income/(expense), net andFinancial Services other income/(loss), net.
Although we have not elected to mark anyAmounts borrowed and repaid are reported in our Statement of our debt to fair value through earnings, we estimate its fair value for disclosures. The fair valueCash Flows as Net cash (used in)/provided by financing activities. Interest, fees and deferred charges paid in excess of debt is estimated based on quoted market prices, current market rates for similar debt with approximately the same remaining maturities, or discountedamount borrowed are reported as Net cash flow models utilizing current market rates.(used in)/provided by operating activities.
FORD MOTOR COMPANY AND SUBSIDIARIES
NOTES TO THE FINANCIAL STATEMENTS
NOTE 19.18. DEBT AND COMMITMENTS (Continued)
Debt outstandingThe carrying value of our debt at December 31 is shown belowwas as follows (in millions, except percentages)millions):
| | | | | | �� | | | | | | | | | | | | | | | | | | |
| | | | | | | | | | | | | | | | | | Interest Rates (a) |
| | | | | | | | | | | | | | | | | | | | | | | | Average Contractual (b) | | Average Effective (c) |
| Automotive Sector | | | | | | | | | | | | | | | | | | | 2011 | | 2010 | | 2011 | | 2010 | | 2011 | | 2010 |
| Debt payable within one year | | | | | | | | | | | | | | | | | | | | | | | | | | | | | |
Short-term | | | 3.2 | % | | | 4.5 | % | | | 3.2 | % | | | 4.5 | % | | $ | 787 | | | $ | 543 | | |
| Short-term with non-affiliates (d) | | $ | 559 |
| | $ | 478 |
| | 1.6 | % | | 2.5 | % | | 1.6 | % | | 2.5 | % |
| Short-term with unconsolidated affiliates | | 18 |
| | 382 |
| | | | | | | | |
| Long-term payable within one year | | | | | | | | | | | | | | | | | | | | | | | | | |
| | |
| | | | | | | | |
Public unsecured debt securities | | | | | | | | | | | | | | | | | | | 334 | | | | — | | |
Notes due to UAW VEBA Trust unsecured portion (c) | | | | | | | | | | | | | | | | | | | 859 | | | | — | | |
Secured term loan | | | | | | | | | | | | | | | | | | | 77 | | | | 70 | | — |
| | 140 |
| | | | | | | | |
| Secured revolving loan | | — |
| | 838 |
| | | | | | | | |
| U.S. Department of Energy ("DOE") loans | | 240 |
| | — |
| | | | | | | | |
Other debt | | | | | | | | | | | | | | | | | | | 371 | | | | 578 | | 216 |
| | 211 |
| | | | | | | | |
Unamortized discount | | | | | | | | | | | | | | | | | | | (333 | ) | | | — | | |
Total debt payable within one year | | | | | | | | | | | | | | | | | | | 2,095 | | | | 1,191 | | 1,033 |
| | 2,049 |
| | | | | | | | |
| Long-term debt payable after one year | | | | | | | | | | | | | | | | | | | | | | | | | |
| | |
| | | | | | | | |
Public unsecured debt securities | | | | | | | | | | | | | | | | | | | 5,260 | | | | 9,148 | | 5,260 |
| | 5,260 |
| | | | | | | | |
| Unamortized discount | | (77 | ) | | (81 | ) | | | | | | | | |
Convertible notes | | | | | | | | | | | | | | | | | | | 3,454 | | | | 4,883 | | 908 |
| | 908 |
| | | | | | | | |
| Unamortized discount | | (172 | ) | | (199 | ) | | | | | | | | |
Subordinated convertible debentures | | | | | | | | | | | | | | | | | | | 3,124 | | | | 3,027 | | — |
| | 2,985 |
| | | | | | | | |
Secured term loan | | | | | | | | | | | | | | | | | | | 5,184 | | | | 6,790 | | — |
| | 3,946 |
| | | | | | | | |
Secured revolving loan | | | | | | | | | | | | | | | | | | | 7,527 | | | | — | | |
| Notes due to UAW VEBA Trust (c) | | | | | | | | | | | | | | | | | | | | | | | | | |
Unsecured portion | | | | | | | | | | | | | | | | | | | 6,720 | | | | — | | |
Secured portion | | | | | | | | | | | | | | | | | | | 3,000 | | | | — | | |
U.S. Department of Energy loans | | | | | | | | | | | | | | | | | | | 1,221 | | | | — | | |
| DOE loans | | 4,556 |
| | 2,752 |
| | | | | | | | |
| EIB loan | | 698 |
| | 699 |
| | | | | | | | |
Other debt | | | | | | | | | | | | | | | | | | | 1,076 | | | | 951 | | 888 |
| | 758 |
| | | | | | | | |
Unamortized discount | | | | | | | | | | | | | | | | | | | (4,245 | ) | | | (1,763 | ) | |
Total long-term debt payable after one year (d) | | | 5.4 | % | | | 7.1 | % | | | 5.6 | % | | | 7.4 | % | | | 32,321 | | | | 23,036 | | |
| Total long-term debt payable after one year | | 12,061 |
| | 17,028 |
| | 4.9 | % | | 4.1 | % | | 5.5 | % | | 5.3 | % |
Total Automotive sector | | | | | | | | | | | | | | | | | | $ | 34,416 | | | $ | 24,227 | | $ | 13,094 |
| | $ | 19,077 |
| | | | | | | | |
Fair value of debt | | | | | | | | | | | | | | | | | | $ | 32,949 | | | $ | 9,480 | | $ | 13,451 |
| | $ | 19,260 |
| | | | | | | | |
| Financial Services Sector | | | | | | | | | | | | | | | | | | | | | | | | | |
| | |
| | | | | | | | |
| Short-term debt | | | | | | | | | | | | | | | | | | | | | | | | | |
| | |
| | | | | | | | |
Asset-backed commercial paper | | | | | | | | | | | | | | | | | | $ | 6,369 | | | $ | 11,503 | | $ | 6,835 |
| | $ | 6,634 |
| | | | | | | | |
Other asset-backed short-term debt | | | | | | | | | | | | | | | | | | | 4,482 | | | | 5,569 | | 2,987 |
| | 1,447 |
| | | | | | | | |
Ford Interest Advantage (e) | | | | | | | | | | | | | | | | | | | 3,680 | | | | 1,958 | | 4,713 |
| | 4,525 |
| | | | | | | | |
Other short-term debt | | | | | | | | | | | | | | | | | | | 1,088 | | | | 1,538 | | 2,061 |
| | 801 |
| | | | | | | | |
Total short-term debt | | | 2.0 | % | | | 4.5 | % | | | 3.0 | % | | | 5.2 | % | | | 15,619 | | | | 20,568 | | 16,596 |
| | 13,407 |
| | 1.4 | % | | 1.4 | % | | 1.4 | % | | 1.4 | % |
| Long-term debt | | | | | | | | | | | | | | | | | | | | | | | | | |
| | |
| | | | | | | | |
| Unsecured debt | | | | | | | | | | | | | | | | | | | | | | | | | |
| | |
| | | | | | | | |
Notes payable within one year | | | | | | | | | | | | | | | | | | | 7,338 | | | | 15,712 | | 6,144 |
| | 9,524 |
| | | | | | | | |
Notes payable after one year | | | | | | | | | | | | | | | | | | | 33,888 | | | | 37,249 | | 26,167 |
| | 26,390 |
| | | | | | | | |
| Asset-backed debt | | | | | | | | | | | | | | | | | | | | | | | | | |
| | |
| | | | | | | | |
Notes payable within one year | | | | | | | | | | | | | | | | | | | 18,962 | | | | 26,501 | | 16,538 |
| | 16,684 |
| | | | | | | | |
Notes payable after one year | | | | | | | | | | | | | | | | | | | 23,163 | | | | 28,734 | | 20,621 |
| | 19,208 |
| | | | | | | | |
Unamortized discount | | | | | | | | | | | | | | | | | | | (530 | ) | | | (256 | ) | (152 | ) | | (403 | ) | | | | | | | | |
Fair value adjustment (f) | | | | | | | | | | | | | | | | | | | 231 | | | | 334 | | |
| Fair value adjustments (f) | | 681 |
| | 302 |
| | | | | | | | |
Total long-term debt | | | 5.4 | % | | | 6.1 | % | | | 5.1 | % | | | 6.0 | % | | | 83,052 | | | | 108,274 | | 69,999 |
| | 71,705 |
| | 4.3 | % | | 4.6 | % | | 4.6 | % | | 5.0 | % |
Total Financial Services sector | | | | | | | | | | | | | | | | | | $ | 98,671 | | | $ | 128,842 | | $ | 86,595 |
| | $ | 85,112 |
| | | | | | | | |
Fair value of debt | | | | | | | | | | | | | | | | | | $ | 100,231 | | | $ | 112,389 | | $ | 88,823 |
| | $ | 88,569 |
| | | | | | | | |
Total Automotive and Financial Services sectors | | | | | | | | | | | | | | | | | | $ | 133,087 | | | $ | 153,069 | | $ | 99,689 |
| | $ | 104,189 |
| | | | | | | | |
Intersector elimination (g) | | | | | | | | | | | | | | | | | | | (646 | ) | | | (492 | ) | (201 | ) | | (201 | ) | | | | | | | | |
Total Company | | | | | | | | | | | | | | | | | | $ | 132,441 | | | $ | 152,577 | | $ | 99,488 |
| | $ | 103,988 |
| | | | | | | | |
__________
| |
| (a) | ExcludesInterest rates are presented for the effectfourth quarter of interest rate swap agreements2011 and facility fees.the fourth quarter of 2010. |
| |
| (b) | IncludesAverage contractual rates reflect the effectstated contractual interest rate; excludes amortization of interest rate swap agreementsdiscounts, premiums, and facilityissuance fees. |
| |
| (c) | Amortizing Guaranteed Secured Notes maturing June 30, 2022 owed to UAW VEBA Trust.
Average effective rates reflect the average contractual interest rate plus amortization of discounts, premiums, and issuance fees. |
| |
| (d) | Average ContractualIncludes Export-Import Bank of the United States secured loan of $250 million at December 31, 2011 and Weighted Average Interest Rates include long-term debt payable within one year.2010. |
| |
| (e) | The Ford Interest Advantage program consists of Ford Credit's floating ratefloating-rate demand notes. |
| |
| (f) | Adjustments related to designated fair value hedges of unsecured debt. |
| |
| (g) | Debt related to Ford's acquisition of Ford Credit debt securities; see Note 1 for additional detail.securities. |
FORD MOTOR COMPANY AND SUBSIDIARIES
NOTES TO THE FINANCIAL STATEMENTS
NOTE 19.18. DEBT AND COMMITMENTS (Continued)
The fair value of debt presented above reflects interest accrued but not yet paid. Interest accrued on Automotive sector debt is reported in Automotive accrued liabilities and deferred revenue and was $352$205 million and $438$275 million at December 31, 20092011 and 2008,2010, respectively. Interest accrued on Financial Services sector debt is reported in Financial Services other liabilities and deferred income and was $1.1$836 million and about $1 billion and $1.3 billion at December 31, 20092011 and 2008,2010, respectively. The change in theSee Note 4 for fair value of our debt in 2009 was primarily driven by improvements in the credit markets generally, and an improved market view of Ford specifically.methodology.
Maturities
Debt maturities at December 31, 20092011 were as follows (in millions):
| | | | | | | | | | | | | | | | | | | | | | | | | | | | |
| Automotive Sector | | | | | | | | | | | | | | | | | | | | | | | | | | | |
Public unsecured debt securities | | $ | 334 | | | $ | — | | | $ | — | | | $ | — | | | $ | — | | | $ | 5,260 | | | $ | 5,594 | | | $ | — | | | $ | 5,594 | |
Unamortized discount | | | — | | | | — | | | | — | | | | — | | | | — | | | | (85 | ) | | | (85 | ) | | | — | | | | (85 | ) |
Convertible notes | | | — | | | | — | | | | — | | | | — | | | | — | | | | 3,454 | | | | 3,454 | | | | — | | | | 3,454 | |
Unamortized discount | | | — | | | | — | | | | — | | | | — | | | | — | | | | (877 | ) | | | (877 | ) | | | — | | | | (877 | ) |
Subordinated convertible debentures | | | — | | | | — | | | | — | | | | — | | | | 140 | | | | 2,984 | | | | 3,124 | | | | — | | | | 3,124 | |
Secured term loan | | | 77 | | | | 77 | | | | 77 | | | | 5,030 | | | | — | | | | — | | | | 5,261 | | | | — | | | | 5,261 | |
Secured revolving loan | | | — | | | | 838 | | | | — | | | | 6,689 | | | | — | | | | — | | | | 7,527 | | | | — | | | | 7,527 | |
Notes due to UAW VEBA Trust (b) | | | 859 | | | | 859 | | | | 1,238 | | | | 1,238 | | | | 1,238 | | | | 5,147 | | | | 10,579 | | | | — | | | | 10,579 | |
Unamortized discount | | | (333 | ) | | | (617 | ) | | | (593 | ) | | | (531 | ) | | | (463 | ) | | | (1,079 | ) | | | (3,616 | ) | | | — | | | | (3,616 | ) |
U.S. Department of Energy loans | | | — | | | | — | | | | 61 | | | | 122 | | | | 122 | | | | 916 | | | | 1,221 | | | | — | | | | 1,221 | |
Short-term and other debt (c) | | | 1,158 | | | | 329 | | | | 273 | | | | 143 | | | | 36 | | | | 295 | | | | 2,234 | | | | — | | | | 2,234 | |
Total Automotive debt | | | 2,095 | | | | 1,486 | | | | 1,056 | | | | 12,691 | | | | 1,073 | | | | 16,015 | | | | 34,416 | | | | — | | | | 34,416 | |
| | | | | | | | | | | | | | | | | | | | | | | | | | | | | | | | | | | | | |
| Financial Services Sector | | | | | | | | | | | | | | | | | | | | | | | | | | | | | | | | | | | | |
Unsecured debt | | | 12,106 | | | | 11,953 | | | | 7,333 | | | | 4,879 | | | | 3,752 | | | | 5,971 | | | | 45,994 | | | | (304 | ) | | | 45,690 | |
Asset-backed debt | | | 29,813 | | | | 15,316 | | | | 6,208 | | | | 1,443 | | | | 22 | | | | 174 | | | | 52,976 | | | | 5 | | | | 52,981 | |
Total Financial Services debt | | | 41,919 | | | | 27,269 | | | | 13,541 | | | | 6,322 | | | | 3,774 | | | | 6,145 | | | | 98,970 | | | | (299 | ) | | | 98,671 | |
| | | | | | | | | | | | | | | | | | | | | | | | | | | | | | | | | | | | | |
Intersector elimination (d) | | | (646 | ) | | | — | | | | — | | | | — | | | | — | | | | — | | | | (646 | ) | | | — | | | | (646 | ) |
Total Company | | $ | 43,368 | | | $ | 28,755 | | | $ | 14,597 | | | $ | 19,013 | | | $ | 4,847 | | | $ | 22,160 | | | $ | 132,740 | | | $ | (299 | ) | | $ | 132,441 | |
|
| | | | | | | | | | | | | | | | | | | | | | | | | | | |
| | 2012 | | 2013 | | 2014 | | 2015 | | 2016 | | Thereafter | | Total Debt Maturities |
| Automotive Sector | | | | | | | | | | | | | |
| Public unsecured debt securities | $ | — |
| | $ | — |
| | $ | — |
| | $ | — |
| | $ | — |
| | $ | 5,260 |
| | $ | 5,260 |
|
| Unamortized discount (a) | — |
| | — |
| | — |
| | — |
| | — |
| | (77 | ) | | (77 | ) |
| Convertible notes | — |
| | — |
| | — |
| | — |
| | 883 |
| | 25 |
| | 908 |
|
| Unamortized discount (a) | — |
| | — |
| | — |
| | — |
| | (166 | ) | | (6 | ) | | (172 | ) |
| U.S. DOE loans | 240 |
| | 480 |
| | 480 |
| | 480 |
| | 480 |
| | 2,636 |
| | 4,796 |
|
| Short-term and other debt (b) | 793 |
| | 401 |
| | 52 |
| | 744 |
| | 108 |
| | 281 |
| | 2,379 |
|
| Total Automotive debt | 1,033 |
| | 881 |
| | 532 |
| | 1,224 |
| | 1,305 |
| | 8,119 |
| | 13,094 |
|
| | | | | | | | | | | | | | |
| Financial Services Sector | |
| | |
| | |
| | |
| | |
| | |
| | |
|
| Unsecured debt | 12,918 |
| | 5,749 |
| | 3,643 |
| | 6,986 |
| | 1,812 |
| | 7,977 |
| | 39,085 |
|
| Asset-backed debt | 26,360 |
| | 10,010 |
| | 5,432 |
| | 2,598 |
| | 2,581 |
| | — |
| | 46,981 |
|
| Unamortized (discount)/premium (a) | (14 | ) | | (11 | ) | | (104 | ) | | (5 | ) | | (7 | ) | | (11 | ) | | (152 | ) |
| Fair value adjustments (a) (c) | 18 |
| | 71 |
| | 42 |
| | 107 |
| | 24 |
| | 419 |
| | 681 |
|
| Total Financial Services debt | 39,282 |
| | 15,819 |
| | 9,013 |
| | 9,686 |
| | 4,410 |
| | 8,385 |
| | 86,595 |
|
| | | | | | | | | | | | | | |
| Intersector elimination | (201 | ) | | — |
| | — |
| | — |
| | — |
| | — |
| | (201 | ) |
| Total Company | $ | 40,114 |
| | $ | 16,700 |
| | $ | 9,545 |
| | $ | 10,910 |
| | $ | 5,715 |
| | $ | 16,504 |
| | $ | 99,488 |
|
__________
| |
| (a) | Adjustment reflects unamortized (discount)/premiumUnamortized discount and fair value adjustments are presented based on contractual payment date of related debt. |
| |
| (b) | Primarily non-U.S. affiliate debt and adjustmentsincludes the EIB secured loan. |
| |
| (c) | Adjustments related to designated fair value hedges of unsecured debt. |
(b) | Amortizing Guaranteed Secured Notes maturing June 30, 2022 due to UAW VEBA Trust.
|
(c) | Primarily non-U.S. affiliate debt. |
(d) | Debt related to Ford's acquisition of Ford Credit debt securities; see Note 1 for additional detail. |
FORD MOTOR COMPANY AND SUBSIDIARIES
NOTES TO THE FINANCIAL STATEMENTS
NOTE 19.18. DEBT AND COMMITMENTS (Continued)
Automotive Sector
Public Unsecured Debt Securities
Our public unsecured debt securities outstanding at December 31 were as follows (in millions):
| | | | | Aggregate Principal Amount Outstanding | | Aggregate Principal Amount Outstanding |
| Title of Security | | | | | | | 2011 | | 2010 |
9.50% Guaranteed Debentures due June 1, 2010 | | $ | 334 | | | $ | 490 | | |
6 1/2% Debentures due August 1, 2018 | | | 361 | | | | 482 | | $ | 361 |
| | $ | 361 |
|
8 7/8% Debentures due January 15, 2022 | | | 86 | | | | 184 | | 86 |
| | 86 |
|
6.55% Debentures due October 3, 2022 (a) | | | 15 | | | | 15 | | 15 |
| | 15 |
|
7 1/8% Debentures due November 15, 2025 | | | 209 | | | | 297 | | 209 |
| | 209 |
|
7 1/2% Debentures due August 1, 2026 | | | 193 | | | | 250 | | 193 |
| | 193 |
|
6 5/8% Debentures due February 15, 2028 | | | 104 | | | | 127 | | 104 |
| | 104 |
|
6 5/8% Debentures due October 1, 2028 (b) | | | 638 | | | | 760 | | 638 |
| | 638 |
|
6 3/8% Debentures due February 1, 2029 (b) | | | 260 | | | | 458 | | 260 |
| | 260 |
|
5.95% Debentures due September 3, 2029 (a) | | | 8 | | | | 8 | | 8 |
| | 8 |
|
6.15% Debentures due June 3, 2030 (a) | | | 10 | | | | 10 | | 10 |
| | 10 |
|
7.45% GLOBLS due July 16, 2031 (b) | | | 1,794 | | | | 3,699 | | 1,794 |
| | 1,794 |
|
8.900% Debentures due January 15, 2032 | | | 151 | | | | 397 | | 151 |
| | 151 |
|
9.95% Debentures due February 15, 2032 | | | 4 | | | | 11 | | 4 |
| | 4 |
|
5.75% Debentures due April 2, 2035 (a) | | | 40 | | | | 40 | | 40 |
| | 40 |
|
7.50% Debentures due June 10, 2043 (c) | | | 593 | | | | 690 | | 593 |
| | 593 |
|
7.75% Debentures due June 15, 2043 | | | 73 | | | | 152 | | 73 |
| | 73 |
|
7.40% Debentures due November 1, 2046 | | | 398 | | | | 469 | | 398 |
| | 398 |
|
9.980% Debentures due February 15, 2047 | | | 181 | | | | 232 | | 181 |
| | 181 |
|
7.70% Debentures due May 15, 2097 | | | 142 | | | | 377 | | 142 |
| | 142 |
|
Total public unsecured debt securities (d) | | $ | 5,594 | | | $ | 9,148 | | $ | 5,260 |
| | $ | 5,260 |
|
__________
| |
| (a) | Unregistered industrial revenue bonds. |
| |
| (b) | Listed on the Luxembourg Exchange and on the Singapore Exchange. |
| |
| (c) | Listed on the New York Stock Exchange. |
| |
| (d) | Excludes 9 1/2% Debentures due September 15, 2011 and 9.215% Debentures due September 15, 2021 with an outstanding balancesbalance at December 31, 201131, 2009 of $167180 million and $180 million, respectively. These. The proceeds from these securities arewere on-lent by Ford to Ford Holdings to fund Financial Services activity and are reported as Financial Services debt. |
April 2009 Unsecured Notes Tender Offer. Pursuant to a cash tender offer conducted by Ford Credit, on the settlement date of April 8, 2009, Ford Credit purchased $3.4 billion principal amount of our public unsecured debt securities for an aggregate cost of $1.1 billion cash (including transaction costs and accrued and unpaid interest payments for such tendered debt securities). Upon settlement, Ford Credit transferred the repurchased debt securities to us in satisfaction of $1.1 billion of its tax liabilities to us. As a result of the transaction, we recorded a pre-tax gain of $2.2 billion (net of unamortized discounts, premiums and fees) in the second quarter of 2009.
Other 2009 Debt Repurchases. In the first quarter of 2009, we repurchased through a private market transaction $165 million principal amount of our outstanding public unsecured debt securities for $37 million in cash. As a result, we recorded a pre-tax gain of $127 million (net of unamortized discounts, premiums and fees).
2008 Debt for Equity Exchanges. During the first half of 2008, we issued an aggregate of 46,437,906 shares of Ford Common Stock, par value $0.01 per share, in exchange for $431 million principal amount of our outstanding public unsecured debt securities. As a result of the exchange, we recorded a pre-tax gain of $73 million (net of unamortized discounts, premiums and fees).
FORD MOTOR COMPANY AND SUBSIDIARIES
NOTES TO THE FINANCIAL STATEMENTS
NOTE 19. DEBT AND COMMITMENTS (Continued)
Convertible Notes
At December 31, 2011, we had outstanding $883 million and $25 million principal of 4.25% Senior Convertible Notes due December 15, 2036
At2016 ("2016 Convertible Notes") and December 31, 2009, we had outstanding $579 million of 15, 2036 ("2036 Convertible Notes"), respectively. Subject to certain limitations relating to the price of Ford Common Stock, the 2016 Convertible Notes that were originally issued in December 2006 withare convertible into shares of Ford Common Stock, based on a conversion rate (subject to adjustment) of 107.5269 shares per $1,000 principal amount of $4.95 billion. The 20362016 Convertible Notes pay interest semiannually at(which is equal to a rateconversion price of 4.25%$9.30 per annum.share, representing a 25% conversion premium based on the closing price of $7.44 per share on November 3, 2009). The 2036 Convertible Notes are convertible into shares of Ford Common Stock, based on a conversion rate (subject to adjustment) of 108.6957 shares per $1,000$1,000 principal amount of 2036 Convertible Notes (which is equal to a conversion price of $9.20$9.20 per share, representing a 25% conversion premium based on the closing price of $7.36$7.36 per share on December 6, 2006).
Upon conversion, we have the right to deliver, in lieu of shares of Ford Common Stock, either cash or a combination of cash and Ford Common Stock. Holders may require us to purchase all or a portion of the 2036 Convertible Notes for cash on December 20, 2016 and December 15, 2026 or upon a change in control of the Company, or for shares of Ford Common Stock upon a designated event that is not a change in control, in each case for a price equal to 100% of the principal amount of the 2036 Convertible Notes being repurchased plus any accrued and unpaid interest to, but not including, the date of repurchase. We may redeem for cash all or a portion of the 2036 Convertible Notes at our option at any time or from time to time on or after December 20, 2016 at a price equal to 100% of the principal amount of the 2036 Convertible Notes to be redeemed, plus accrued and unpaid interest to, but not including, the redemption date. We also may terminate the conversion rights at any time on or after December 20, 2013 if the closing price of Ford Common Stock exceeds 140% of the then-applicable conversion price for 20 trading days during any consecutive 30-trading day period.
Liability and equity components of our 2036 Convertible Notes at December 31 are summarized as follows (in millions):
| | | | | | | |
| Liability component | | | | | | |
Principal | | $ | 579 | | | $ | 4,883 | |
Unamortized discount | | | (175 | ) | | | (1,619 | ) |
Net carrying amount | | $ | 404 | | | $ | 3,264 | |
| | | | | | | | | |
Equity component (recorded in Capital in excess of par value of stock) | | $ | (3,207 | ) | | $ | (1,864 | ) |
We recognized interest cost on our 2036 Convertible Notes as follows (in millions):
| | | | | | | | | | |
Contractual interest coupon | | $ | 74 | | | $ | 210 | | | $ | 210 | |
Amortization of discount | | | 49 | | | | 127 | | | | 115 | |
Total interest cost on 2036 Convertible Notes | | $ | 123 | | | $ | 337 | | | $ | 325 | |
The discount on the liability component of the 2036 Convertible Notes will amortize through December 20, 2016, the first put date. The total effective rate on the liability component was 10.5%. If all $579 million of 2036 Convertible Notes were converted into shares as of December 31, 2009 at a share price of $10.00, the share value would exceed the principal value of debt by $50 million.
April 2009 Conversion Offer. Pursuant to an exchange offer we conducted, on the settlement date for such exchange offer of April 8, 2009, $4.3 billion principal amount of 2036 Convertible Notes was exchanged for an aggregate of 467,909,227 shares of Ford Common Stock, $344 million in cash ($80 in cash per $1,000 principal amount of 2036 Convertible Notes exchanged) and the applicable accrued and unpaid interest on such 2036 Convertible Notes. As a result of the conversion, we recorded a pre-tax gain of $1.2 billion in the second quarter of 2009.
December 2008 Conversion Request. Pursuant to a request for conversion in the fourth quarter of 2008, $67 million principal amount of 2036 Convertible Notes was exchanged for an aggregate of 7,253,035 shares of Ford Common Stock. As a result of the conversion we retrospectively recorded a pre-tax gain of $29 million.
FORD MOTOR COMPANY AND SUBSIDIARIES
NOTES TO THE FINANCIAL STATEMENTS
NOTE 19. DEBT AND COMMITMENTS (Continued)
Convertible Notes due December 15, 2016
On November 9, 2009, we issued $2.875 billion principal of our 2016 Convertible Notes. This issuance included $2.5 billion from the original offering on November 3, 2009 and $375 million from the underwriters option to purchase additional convertible notes exercised on November 6, 2009 ("Over-Allotment Option"). The 2016 Convertible Notes pay interest semiannually at a rate of 4.25% per annum. The 2016 Convertible Notes are convertible into shares of Ford Common Stock, based on a conversion rate (subject to adjustment) of 107.5269 shares per $1,000 principal amount of 2016 Convertible Notes (which is equal to a conversion price of $9.30 per share, representing a 25% conversion premium based on the closing price of $7.44 per share on November 3, 2009).
Upon conversion, we have the right to deliver, in lieu of shares of Ford Common Stock, cash or a combination of cash and Ford Common Stock. Holders may require us to purchase all or a portion of the 2016 Convertible Notes upon a change in control of the Company, or for shares of Ford Common Stock upon a designated event that is not a change in control, in each case for a price equal to 100% of the principal amount of the 2016 Convertible Notes being repurchased plus any accrued and unpaid interest to, but not including, the date of repurchase. Additionally, holders of the 2036 Convertible Notes may require us to purchase all or a portion for cash on December 20, 2016 and December 15, 2026.
FORD MOTOR COMPANY AND SUBSIDIARIES
NOTES TO THE FINANCIAL STATEMENTS
NOTE 18. DEBT AND COMMITMENTS (Continued)
We also may terminate the conversion rights related to the 2016 Convertible Notes at any time on or after November 20, 2014 if the closing price of Ford Common Stock exceeds 130% of the then-applicable conversion price for 20 trading days during any consecutive 30-trading day period. Also, we may redeem for cash all or a portion of the 2036 Convertible Notes at our option at any time or from time to time on or after December 20, 2016 at a price equal to 100% of the principal amount of the 2036 Convertible Notes to be redeemed, plus accrued and unpaid interest to, but not including, the redemption date. We may terminate the conversion rights related to the 2036 Convertible Notes at any time on or after December 20, 2013 if the closing price of Ford Common Stock exceeds 140% of the then-applicable conversion price for 20 trading days during any consecutive 30-trading day period.
Liability, equity, and equityif-converted components of our 2016 Convertible Notes at December 31 are summarized as follows (in millions):
| | | | | | | | | Total Effective Interest Rate |
| | | | | 2011 | | 2010 | | 2011 | | 2010 |
| Liability component | | | | | | | |
Principal | | $ | 2,875 | | |
| 4.25% Debentures due December 15, 2016 | | $ | 768 |
| | $ | 768 |
| | 9.2% | | 9.2% |
| 4.25% Debentures due December 15, 2016 (underwriter option) | | 115 |
| | 115 |
| | 8.6% | | 8.6% |
| Subtotal Convertible Debt due December 15, 2016 | | 883 |
| | 883 |
| |
| 4.25% Debentures due December 20, 2036 | | 25 |
| | 25 |
| | 10.5% | | 10.5% |
Unamortized discount | | | (702 | ) | (172 | ) | | (199 | ) | |
Net carrying amount | | $ | 2,173 | | $ | 736 |
| | $ | 709 |
| |
| | | | | | | | | |
Equity component (recorded in Capital in excess of par value of stock) | | $ | (704 | ) | |
| Equity component of outstanding debt (a) | | $ | (225 | ) | | $ | (225 | ) | |
| Share value in excess of principal value, if converted (b) | | $ | 143 |
| | $ | 732 |
| |
__________
| |
| (a) | Recorded in Capital in excess of par value of stock. |
| |
| (b) | Based on share price of $10.76 and $16.79 as of December 31, 2011 and 2010, respectively. |
We recognized interest cost on our 2016 Convertible Notes as follows (in millions):
| | | | | | | 2011 | | 2010 | | 2009 |
Contractual interest coupon | | $ | 28 | | $ | 38 |
| | $ | 138 |
| | $ | 92 |
|
Amortization of discount | | | 10 | | 27 |
| | 87 |
| | 59 |
|
Total interest cost on 2016 Convertible Notes | | $ | 38 | | |
| Total interest cost on Convertible Notes | | $ | 65 |
| | $ | 225 |
| | $ | 151 |
|
The discount on2010 Conversion Offer. In the liability componentsfourth quarter of 2010, pursuant to an exchange offer we conducted, about $2 billion and $554 million principal amount of the 2016 Convertible Notes will amortize through November 16, 2016. The total effective rate on the liability component was 9.2% on the original offering and 8.6% on the Over-Allotment Option. If all $2.9 billion2036 Convertible Notes, respectively, were exchanged for an aggregate of 274,385,596 shares of Ford Common Stock, $534 million in cash ($215 in cash per $1,000 principal amount and $190 in cash per $1,000 principal amount of 2016 Convertible Notes were converted intoand 2036 Convertible Notes exchanged, respectively) and the applicable accrued and unpaid interest on such 2016 Convertible Notes and 2036 Convertible Notes. As a result of the conversion, we recorded a pre-tax loss of $962 million, net of unamortized discounts, premiums and fees, in Automotive interest income and other non-operating income/(expense), net.
2009 Conversion Offer. In the second quarter of 2009, pursuant to an exchange offer we conducted, $4.3 billion principal amount of 2036 Convertible Notes was exchanged for an aggregate of 467,909,227 shares as of December 31, 2009 atFord Common Stock, $344 million in cash ($80 in cash per $1,000 principal amount of 2036 Convertible Notes exchanged) and the applicable accrued and unpaid interest on such 2036 Convertible Notes. As a share priceresult of $10.00, the share value would exceed the principal valueconversion, we recorded a pre-tax gain of debt by $216 million.$1.2 billion, net of unamortized discounts, premiums, and fees, in Automotive interest income and other non-operating income/(expense), net.
Subordinated Convertible Debentures
In the first quarter of 2011, we redeemed in whole the Subordinated Convertible Debentures held by Trust II at a price of $100.66 per $100 principal amount of such debentures, plus accrued and unpaid interest of $1.08 per debenture. The proceeds from the redemption of the Subordinated Convertible Debentures were used by Trust II to redeem in whole the Trust Preferred Securities at a price of $50.33 per $50 liquidation preference of such securities, plus accrued and unpaid distributions of $0.54 per security. Redemption of these securities resulted in a reduction of about $3 billion in Automotive debt and lower annualized interest costs of about $190 million. It also resulted in a 2011 first quarter pre-tax charge of $60 million in Automotive interest income and other non-operating income/(expense), net.
FORD MOTOR COMPANY AND SUBSIDIARIES
NOTES TO THE FINANCIAL STATEMENTS
NOTE 18. DEBT AND COMMITMENTS (Continued)
At December 31, 2009,2010, we had outstanding $3$3 billion of 6.50% Junior Subordinated Convertible Debentures due 2032 ("Subordinated Convertible Debentures") and $140 million of deferred interest,, reported in Automotive long-term debt. The $3$3 billion of Subordinated Convertible Debentures are due towere held by Trust II, a subsidiary trust,an unconsolidated entity, and arewere the sole assets of Trust II. AsII (for additional discussion of January 15, 2007, the Subordinated Convertible Debentures have become redeemable at our option.Trust II, see Note 13).
At December 31, 2009,2010, Trust II had outstanding 6.50% Cumulative Convertible Trust Preferred Securities with an aggregate liquidation preference of $2.8$2.8 billion ("Trust Preferred Securities"). The Trust Preferred Securities arewere convertible into shares of Ford Common Stock, based on a conversion rate (subject to adjustment) of 2.8769 shares per $50 principal$50 liquidation preference amount of Trust Preferred Securities (which is equal to a conversion price of $17.38$17.38 per share). We guaranteeguaranteed the payment of all distribution and other payments of the Trust Preferred Securities to the extent not paid by Trust II, but only if and to the extent we havehad made a payment of interest or principal on the Subordinated Convertible Debentures. As announced on March 27, 2009, we elected to defer future interest payments related to the Trust Preferred Securities for up to 5 years. Trust II is not consolidated by us as it is a VIE in which we do not have a significant variable interest and of which we are not the primary beneficiary.
FORD MOTOR COMPANY AND SUBSIDIARIES
NOTES TO THE FINANCIAL STATEMENTS
NOTE 19. DEBT AND COMMITMENTS (Continued)
During the first quarter of 2009, pursuant to a request for conversion, we issued an aggregate of 2,437,562 shares of Ford Common Stock, par value $0.01 per share, in exchange for $43 million principal amount of our Subordinated Convertible Debentures.
Secured Term Loan and Revolving Loan
On2011 Secured Term Loan Actions. In the second and third quarters of 2011, we made optional prepayments of $2.2 billion and $1.8 billion, respectively, to the term loan lenders under our secured Credit Agreement dated December 15, 2006, we entered into a secured credit agreementas amended and restated on November 24, 2009 and as further amended (the "Credit Agreement") which provided for. In addition, in the second quarter of 2011 we also made a seven-year, $7 billion term-loan facility andrequired payment of $67 million to the term lenders as a five-year revolving credit facilityresult of $11.5 billion.the completion of the true-up of the purchase price adjustments related to the sale of Volvo. As a result, we have repaid in full all amounts related to the term loans under our Credit Agreement.
2010 Secured Term Loan Actions. Pursuant to our Credit Agreement, at December 31, 2009, we had outstanding:
| · | $838 million of revolving loans which bear interest of LIBOR plus a margin of 2.25%, maturing on December 15, 2011; |
| · | $6.7 billion of revolving loans which bear interest of LIBOR plus a margin of 3.25%, maturing on November 30, 2013; and |
| · | $5.3 billion of a secured term loan maturing on December 15, 2013. The term loan principal amount amortizes at a rate of $77 million (1% of original loan) per annum and bears interest at LIBOR plus a margin of 3.00%. |
Underthe requirement to use a portion of the cash proceeds from the sale of Volvo upon the closing thereof to partially prepay certain outstanding term loans under the Credit Agreement, we may designate certain of our domestic and foreign subsidiaries, including Ford Credit, as borrowers underpaid $288 million to the revolving facility. We and certain of our domestic subsidiaries that constitute a substantial portion of our domestic Automotive assets (excluding cash) are guarantors under the Credit Agreement, and future material domestic subsidiaries will become guarantors when formed or acquired.
Collateral. The borrowingsterm loan lenders on August 3, 2010 following completion of the Company, the subsidiary borrowers, and the guarantors under the Credit Agreement are secured by a substantial portionsale of our domestic Automotive assets (excluding cash). The collateral includes a majority of our principal domestic manufacturing facilities, excluding facilitiesVolvo. On December 15, 2010, we voluntarily paid $810 million on term loans that were scheduled to be closed, subject to limitations set forth in existing public indentures and other unsecured credit agreements; domestic accounts receivable; domestic inventory; up to $4 billion of marketable securities or cash proceeds therefrom; 100% of the stock of our principal domestic subsidiaries, including Ford Credit (but excluding the assets of Ford Credit); certain intercompany notes of Volvo Holding Company Inc., a holding company for Volvo, Ford Motor Company of Canada, Limited and Grupo Ford S. de R.L. de C.V. (a Mexican subsidiary); 66% to 100% of the stock of all major first tier foreign subsidiaries (including Volvo); and certain domestic intellectual property, including trademarks.
Covenants. The Credit Agreement requires ongoing compliance with a borrowing base covenant and contains other restrictive covenants, including a restrictionmature on our ability to pay dividends. The Credit Agreement prohibits the payment of dividends (other than dividends payable solely in stock) on Ford Common and Class B Stock, subject to certain limited exceptions. In addition, the Credit Agreement contains a liquidity covenant requiring us to maintain a minimum of $4 billion in the aggregate of domestic cash, cash equivalents, loaned and marketable securities and short-term VEBA assets and/or availability under the revolving credit facility.
With respect to the borrowing base covenant, we are required to limit the outstanding amount of debt under the Credit Agreement as well as certain permitted additional indebtedness secured by the collateral described above such that the total debt outstanding does not exceed the value of the collateral as calculated in accordance with the Credit Agreement.
Events of Default. In addition to customary payment, representation, bankruptcy and judgment defaults, the Credit Agreement contains cross-payment and cross-acceleration defaults with respect to other debt for borrowed money and a change in control default.
2009 Secured Revolver Actions. Due to concerns about instability in the capital markets and the uncertain state of the global economy, on February 3, 2009, we borrowed $10.1 billion under the revolving credit facility of the Credit Agreement to ensure access to these funds. As expected, the $890 million commitment of Lehman Commercial Paper Inc. ("LCPI"), one of the lenders under the facility, was not funded because LCPI filed for protection under Chapter 11 of the U.S. Bankruptcy Code on October 5, 2008. LCPI subsequently assigned $110 million of its revolving commitment to other lenders, and $89 million of these assignee lenders' revolving commitments were funded in the third quarter of 2009. On July 10, 2009, we terminated the remaining LCPI commitment of $780 million.
FORD MOTOR COMPANY AND SUBSIDIARIES
NOTES TO THE FINANCIAL STATEMENTS
NOTE 19. DEBT AND COMMITMENTS (Continued)December 15, 2013.
We also received an additional $10 million under the revolving credit facility in the third quarter of 2009 for amounts previously committed but not yet received.
On November 24, 2009, we entered into the Fourth Amendment to the Credit Agreement. Prior to the Fourth Amendment, revolving lenders held commitments totaling $10.7 billion that matured on December 15, 2011, of which $10.2 billion was drawn. As a result of the Fourth Amendment, revolving lenders have commitments totaling $7.2 billion in a new revolving facility that matures on November 30, 2013. Those lenders who agreed to extend the maturity of their revolving commitments had the option to reduce their commitments by up to 25%, and receive a 1 percentage point increase in interest rate margins, an increase in quarterly fees, and payment of an upfront fee.
Pursuant to these arrangements, on December 3, 2009, $2.3 billion of the existing secured revolver was repaid to effect the commitment reductions elected by extending lenders, while other extending lenders increased their revolving loan commitments by an aggregate of $400 million, resulting in a net cash repayment of $1.9 billion. Extending lenders also converted $724 million of the previously-existing revolving facility into a new term loan. Lenders with revolving commitments totaling $886 million, of which $838 million is drawn, elected not to extend those commitments which will mature on the original maturity date of December 15, 2011.
At December 31, 2009, $7.5 billion of the $8.1 billion combined revolving facilities has been drawn. In addition, $418 million was utilized in the form of Letters of Credit, leaving $154 million available to be drawn.
2009 Secured Term Loan Actions. On March 27,In the first quarter of 2009, Ford Credit purchased from term loan lenders under the Credit Agreement $2.2$2.2 billion principal amount of the secured term loan for an aggregate cost of $1.1$1.1 billion (including transaction costs). Consistent with previously-announced plans to return capital from Ford Credit to us, Ford Credit distributed the repurchased secured term loan to its immediate parent, Ford Holdings, whereupon the debt was forgiven. As a result of this transaction, we recorded a pre-tax gain of $1.1$1.1 billion in the first quarter of 2009.Automotive interest income and other non-operating income/(expense), net.
In the third quarter of 2009, Ford Leasing purchased from a term loan lenderthe lenders under the Credit Agreement $45$45 million principal amount of theour secured term loan thereunder for an aggregate cost of $37 million.$37 million. Ford Holdings elected to receive the $37$37 million from Ford Leasing as a dividend, whereupon the debt was immediately forgiven. As a result of this transaction, we recorded a pre-tax gain of $8 million.$8 million in Automotive interest income and other non-operating income/(expense), net.
On December 3, 2009, as described above, $724Revolving Loan
2011 Secured Revolver Actions. In the second quarter of 2011, we made an optional prepayment of $838 million of on revolving loans under our secured revolving loan was converted into an additional secured term loanCredit Agreement that matureswere scheduled to mature on December 15, 2013. The new term loan has the same pricing, maturity, and other terms as the existing secured term loan, but is not subject to mandatory prepayments (as defined in the Credit Agreement) as is the existing term loan.2011.
2010 Secured Revolver Actions. On April 6, 2010, September 9, 2010, and December 15, 2010, we paid $3 billion, $2 billion, and $1.7 billion, respectively, on revolving loans that were scheduled to mature on November 30, 2013.
FORD MOTOR COMPANY AND SUBSIDIARIES
NOTES TO THE FINANCIAL STATEMENTS
NOTE 18. DEBT AND COMMITMENTS (Continued)
Notes Due to UAW VEBA Trust
Pursuant to the Amended Settlement Agreement as described in Note 18, atOn December 31, 2009, as part of the settlement of our UAW postretirement health care obligation (as described in our 2009 Form 10-K Report) we had outstanding $7issued two non-interest bearing notes, $6.7 billion in amortizing notes Amortizing Guaranteed Secured Note maturing June 30, 2022 ("Note A") and $6.5 billion Amortizing Guaranteed Secured Note maturing June 30, 2022 ("Note B"), to the UAW VEBA Trust.
2010 Actions on Note A and Note B. In the second quarter of 2010, we made the scheduled payment due on Note A and Note B to the UAW VEBA Trust made up of New Note A$249 million and New Note B. New Note A was recorded at a fair value of $3.1 billion ($4.7 billion par value net of $1.6 billion unamortized discount) using an effective yield of 9.2%. New Note B was recorded at a fair value of $3.9 billion ($5.9 billion par value net of $2 billion unamortized discount) using an effective yield of 9.9%. The New Notes mature June 30, 2022,$610 million in cash, respectively. In addition, Ford and allow for prepayments that, if paid, are due withFord Credit together purchased from the annual scheduled principal payment dates. The New Notes are secured on a second lien basis, limited toUAW VEBA Trust the lesser of an aggregate $3 billion or theremaining outstanding principal amount of obligations thereunder, with collateral securing our obligations underNote A for cash of $2.9 billion, of which $1.6 billion was paid by us and $1.3 billion was paid by Ford Credit. Upon settlement, Ford Credit immediately transferred the Credit Agreement.
Under Newportion of Note B, we have the option, subjectA it purchased to certain conditions, of making each payment in cash, Ford Common Stock, or a combination of cash and Ford Common Stock. Any Ford Common Stock to be deliveredus in satisfaction of such payment obligation is$1.3 billion of Ford Credit's tax liabilities to be valuedus. The purchase price for Note A was based on its volume-weighted average price per share for the 30 trading-day period ending on the second business daycontractual pre-payment amount less an agreed-upon discount of 2%. Immediately prior to our payments on Note A, the relevant payment date.
FORD MOTOR COMPANY AND SUBSIDIARIEScarrying value of the note was $3.2 billion. As a result of the purchase of Note A at a discount, we recorded a pre-tax gain of $40 million in the third quarter of 2010 in Automotive interest income and other non-operating income/(expense), net. In relation to the combined $859 million scheduled principal payments made under Note A and Note B on June 30, 2010, $448 million of discount was amortized and reported in Interest expense in the first nine months of 2010.
NOTES TO THE FINANCIAL STATEMENTS
NOTE 19. DEBT AND COMMITMENTS (Continued)In the fourth quarter of 2010, we pre-paid the remaining outstanding principal amount of Note B, which fully satisfied our obligations to the UAW VEBA Trust.
DOE LoanAdvanced Technology Vehicles Manufacturing ("ATVM") Program
Pursuant to the Loan Arrangement and Reimbursement Agreement (the "Arrangement Agreement") with the DOE entered into on September 16, 2009, we havehad outstanding $1.2$4.8 billion in loans as of December 31, 2009.2011. Under the terms of the Arrangement Agreement, the DOE agreed to (i) arrange a 13-year multi-draw term loan facility (the "Facility") under the Advanced Technology Vehicles Manufacturing ("ATVM")ATVM Program in the aggregate principal amount of up to $5.9$5.9 billion, (ii) designate us as a borrower under the ATVM Program and (iii) cause the Federal Financing Bank ("FFB") to enter into the Note Purchase Agreement (the "Note Purchase Agreement") for the purchase of notes to be issued by us evidencing such loans under the Arrangement Agreement. Loans under the ATVM are made by and through the FFB, an instrumentality of the U.S. government that is under the general supervision of the U.S. Secretary of the Treasury.
The proceeds of advances under the Facility willmay be used only to finance certain costs eligible for financing under the ATVM Program ("Eligible Project Costs") that are incurred through mid-2012the end of 2012. Eligible Project Costs are those incurred in the implementation of 1312 advanced technology vehicle programs approved for funding by the DOE (each, a "Project"). The Arrangement Agreement limits the amount of advances that may be used to fund Eligible Project Costs for each Project, and our ability to finance Eligible Project Costs with respect to a Project is conditioned on us meeting agreed timing milestones and fuel economy targets for that Project.
Maturity, Interest Rate and Amortization. Advances under the Facility may be requested through June 30, 2012, and the loans will mature on June 15, 2022 (the "Maturity Date"). Each advance bears interest at a blended rate based on the Treasury yield curve at the time such advance is borrowed, based on the principal amortization schedule for that advance, with interest payable quarterly in arrears. The principal
EIB Credit Facility
On July 12, 2010, Ford Motor Company Limited, our operating subsidiary in the United Kingdom ("Ford of Britain"), entered into a credit facility for an aggregate amount of £450 million with the EIB. Proceeds of loans is payable in equal quarterly installments commencing on September 15, 2012 and continuing through the Maturity Date. Per the Arrangement Agreement, we have the ability to voluntarily prepay all or a portion of any advancedrawn under the Facility at a prepayment price based on the Treasury yield curve at the time the prepayment is made. It is intendedfacility are being used to replicate the price for such advance that would, if it were purchased by a third party and held to maturity, produce a yield to the third-party purchaserfund costs for the period fromresearch and development of fuel-efficient engines and commercial vehicles with lower emissions, and related upgrades to an engine manufacturing plant. The facility was fully drawn in the datethird quarter of purchase to the Maturity Date substantially equal to the interest rate that would be set on a loan from the Secretary2010, and Ford of Treasury to the FFB to purchase an obligation having a payment schedule identical to the payment scheduleBritain had outstanding $698 million of such advance for the period from the intended prepayment date to the Maturity Date.loans at December 31, 2011
Collateral. . The $5.9 billion commitment is comprised of two loans: (i) a $1.5 billion noteloans are five-year, non-amortizing loans secured by a first priority lien on any assets purchased or developed withguarantee from the proceedsU.K. government for 80% of the loans,outstanding principal amount and (ii)cash collateral from Ford of Britain equal to 20% of the outstanding principal amount, and bear interest at a $4.4 billion note secured byfixed rate of approximately 3.6% per annum (excluding a junior lien oncommitment fee of 0.30% to the U.K. government). Ford of Britain has pledged substantially all of its fixed assets, receivables and inventory to the U.K. government as collateral, pledgedand we have guaranteed Ford of Britain's obligations to the U.K. government related to the government's guarantee.
Automotive Credit Facilities
Commitments under the revolving credit facility of our secured Credit Agreement totaled $8.9 billion which will mature on November 30, 2013. Pursuant to our Credit Agreement, subordinated solelyat December 31, 2011, we had $8.8 billion available to (a) prior perfected security interests securing certain indebtedness,be drawn under the revolving facility and had outstanding $131 million of letters of credit cash-management obligations and hedging obligations in an aggregate principal amount not to exceed $19.1 billion as described in the First Amendment to the Arrangement Agreement and (b) certain other permitted liens described in the Arrangement Agreement.
Guarantees. Certain of our subsidiaries that, together with us, hold a substantial portion of the consolidated domestic Automotive assets (excluding cash) and that guarantee the Credit Agreement will guarantee our obligations under the Facility, and future material domestic subsidiaries will become guarantors when formed or acquired.revolving facility.
Affirmative Covenants. The Arrangement Agreement contains affirmative covenants substantially similar to those in the Credit Agreement (including similar baskets and exceptions), as well as certain other affirmative covenants required in connection with the ATVM Program, including compliance with ATVM Program requirements, introduction of advanced technology vehicles to meet or exceed projected overall annual fuel economy improvements and delivery of progress reports and independent auditor reports with respect to the Projects.
Negative Covenants. The Arrangement Agreement contains negative covenants substantially similar to those in the Credit Agreement. The Arrangement Agreement also contains a negative covenant substantially similar to the liquidity covenant in the Credit Agreement requiring that we not permit Available Liquidity (as defined in the Arrangement Agreement) to be less than $4 billion.
FORD MOTOR COMPANY AND SUBSIDIARIES
NOTES TO THE FINANCIAL STATEMENTS
NOTE 19.18. DEBT AND COMMITMENTS (Continued)
Covenants.Events of Default. The Credit Agreement requires ongoing compliance with a borrowing base covenant until the collateral pledged under the Credit Agreement is released, and contains other restrictive covenants. Our ability to pay dividends (other than dividends payable in stock) is subject to certain limits under the Credit Agreement. In addition, to customary payment, representation, bankruptcy and judgment defaults, the ArrangementCredit Agreement contains cross-paymenta liquidity covenant requiring us to maintain a minimum of $4 billion in the aggregate of domestic cash, cash equivalents, loaned and cross-acceleration defaults withmarketable securities and short-term VEBA assets and/or availability under the revolving credit facility.
With respect to otherthe borrowing base covenant, until the collateral pledged under the Credit Agreement is released, we are required to limit the outstanding amount of debt for borrowed money and a change in control default,under the Credit Agreement as well as eventscertain permitted additional indebtedness secured by the collateral such that the total debt outstanding does not exceed the value of default specific to the facility.collateral as calculated in accordance with the Credit Agreement.
Other Automotive Credit Facilities*
At December 31, 2009,2011, we had $628$817 million of other contractually-committed Automotive credit facilities with financial institutions, including $25 million of worldwide Automotive unsecured credit facilities and $603 million of local credit facilities to foreign Automotive affiliates. Of the $628affiliates, of which $74 million of contractually-committed, $130 million has been utilized. Of the $498$817 million available for use, $60 of committed credit facilities, $66 million expire expires in 2010, $652012, $165 million expire expires in 2013, $223 million expires in 2014, and $373$363 million expire expires in 2014.2015.
Financial Services Sector
Unsecured Debt Repurchases and Calls
From time to time and based on market conditions, our Financial Services sector may repurchase or call some of its outstanding unsecured and asset-backed debt. If our Financial Services sector has excess liquidity, and it is an economically favorable use of its available cash, it may repurchase or call debt at a price lower or higher than its carrying value, resulting in a gain or loss on extinguishment.
2011 Debt RepurchasesRepurchases.. During 2009, through Through private market transactions, our Financial Services sector repurchased and called an aggregate of $3.6 billion principal amount of $2.3 billion (including $268 million maturing in 2011) of our unsecured debt. As a result, we recorded a pre-tax loss of $68 million, net of unamortized premiums, discounts and fees in Other income, net in 2011. There were no repurchase or call transactions for asset-backed debt during 2011.
2010 Debt Repurchases. Through private market transactions, our Financial Services sector repurchased and called an aggregate principal amount of $5.6 billion (including $683 million maturing in 2010) of its outstanding notes for $3.5unsecured debt and asset-backed debt. As a result, our Financial Services sector recorded a pre-tax loss of $139 million, net of unamortized premiums and discounts, in Financial Services other income/(loss), net in 2010.
2009 Debt Repurchases. Through private market transactions, our Financial Services sector repurchased and called an aggregate principal amount of $3.9 billion (including $1.6 billion maturing in cash.2009) of its unsecured debt and asset-backed debt. As a result, our Financial Services sector recorded a pre-tax gain of $67$67 million (net, net of unamortized discounts, premiums and fees)discounts, in 2009 ($51 million related to Ford Holdings and $16 million related to Ford Credit).Financial Services other income/(loss), net in 2009.
Asset-Backed Debt
Ford Credit transfers finance receivables and net investmentsengages in operating leases in structuredsecuritization transactions to fund operations and to maintain liquidity. Each transaction is evaluated to determine whether for accounting purposes the transfer qualifies as a sale of financial assets or a secured borrowing. The majority of Ford Credit's transactions do not meet the criteria for selling and derecognizing financial assets. Accordingly, suchsecuritization transactions are recorded as a secured borrowingasset-backed debt and the associated assets are not derecognized and continue to be reported onincluded in our financial statements as Financestatements.
The finance receivables and netor as Net investment in operating leases.leases that have been included in securitization transactions are only available for payment of the debt and other obligations issued or arising in the securitization transactions. They are not available to pay Ford Credit's other obligations or the claims of its other creditors. Ford Credit does, however, hold the right to the excess cash flows not needed to pay the debt and other obligations issued or arising in each of the securitization transactions. The debt is the obligation of our consolidated securitization entities and not Ford Credit's legal obligation or of its other subsidiaries.
FORD MOTOR COMPANY AND SUBSIDIARIES
NOTES TO THE FINANCIAL STATEMENTS
NOTE 18. DEBT AND COMMITMENTS (Continued)
The following table shows the assets and liabilities related to Ford Credit's securedour Financial Services sector's asset-backed debt arrangements that are included in our financial statements for the years ended December 31 (in billions):
| | | | | | | |
| | | | | | Finance Receivables and Net Investment in Operating Leases | | | | | | | | | Finance Receivables and Net Investment in Operating Leases | | | | |
Retail | | $ | 3.4 | | | $ | 44.9 | | | $ | 35.7 | | | $ | 3.3 | | | $ | 51.6 | | | $ | 42.6 | |
Wholesale | | | 0.5 | | | | 19.5 | | | | 10.6 | | | | 1.2 | | | | 22.1 | | | | 17.6 | |
Net investment in operating leases | | | 1.3 | | | | 10.4 | | | | 6.6 | | | | 1.0 | | | | 15.6 | | | | 12.0 | |
Total secured debt arrangements* | | $ | 5.2 | | | $ | 74.8 | | | $ | 52.9 | | | $ | 5.5 | | | $ | 89.3 | | | $ | 72.2 | |
|
| | | | | | | | | | | |
| | 2011 |
| | Cash and Cash Equivalents | | Finance Receivables, Net and Net Investment in Operating Leases | | Related Debt |
| VIEs (a) | | | | | |
| Finance receivables | $ | 3.0 |
| | $ | 49.8 |
| | $ | 37.2 |
|
| Net investment in operating leases | 0.4 |
| | 6.4 |
| | 4.2 |
|
| Total | $ | 3.4 |
| | $ | 56.2 |
| | $ | 41.4 |
|
| Non-VIE | |
| | |
| | |
|
| Finance receivables (b) | $ | 0.3 |
| | $ | 6.2 |
| | $ | 5.6 |
|
| Total securitization transactions | |
| | |
| | |
|
| Finance receivables | $ | 3.3 |
| | $ | 56.0 |
| | $ | 42.8 |
|
| Net investment in operating leases | 0.4 |
| | 6.4 |
| | 4.2 |
|
| Total | $ | 3.7 |
| | $ | 62.4 |
| | $ | 47.0 |
|
| | | | | | |
| | 2010 |
| | Cash and Cash Equivalents | | Finance Receivables, Net and Net Investment in Operating Leases | | Related Debt |
| VIEs (a) | |
| | |
| | |
|
| Finance receivables | $ | 3.3 |
| | $ | 50.5 |
| | $ | 37.2 |
|
| Net investment in operating leases | 0.8 |
| | 6.1 |
| | 3.0 |
|
| Total | $ | 4.1 |
| | $ | 56.6 |
| | $ | 40.2 |
|
| Non-VIE | |
| | |
| | |
|
| Finance receivables (b) | $ | 0.2 |
| | $ | 4.1 |
| | $ | 3.7 |
|
| Total securitization transactions | |
| | |
| | |
|
| Finance receivables | $ | 3.5 |
| | $ | 54.6 |
| | $ | 40.9 |
|
| Net investment in operating leases | 0.8 |
| | 6.1 |
| | 3.0 |
|
| Total | $ | 4.3 |
| | $ | 60.7 |
| | $ | 43.9 |
|
__________
* | |
| (a) | Includes assets to be used to settle liabilities of the consolidated VIEs. See Note 13 for additional information on Financial Services sector VIEs. |
| |
| (b) | Includes debt of $46.2 billion and $62 billion at December 31, 2009 and 2008, respectively, issued by VIEs of which Ford Credit is the primary beneficiary. The carrying value of Ford Credit assets securing theCertain debt issued by thesethe VIEs was $4 billionto affiliated companies served as collateral for accessing the ECB open market operations program. This external funding of $246 million and $3.9 billion of cash and cash equivalents, $41.7 billion and $41.9 billion of retail receivables, $16.5 billion and $19.6 billion of wholesale receivables, and $10.4 billion and $15.6 billion of net investment in operating leases$334 million at December 31, 20092011 and 2008, respectively. Refer to Note 13 for further discussion regarding VIEs.2010, respectively was not reflected as a liability of the VIEs and is reflected as a non-VIE liability above. The finance receivables backing this external funding are reflected in VIE finance receivables.
|
Financial Services sector asset-backed debt also includes $97included $75 million and $96$87 million at December 31, 20092011 and 2008,2010, respectively, that is secured by property.
__________
*Automotive Acquisition of Financial Services Debt. During 2008 and 2009 we issued 159,913,115 shares of Ford Common Stock through an equity distribution agreement and used the proceeds of $1 billion to purchase $1,048 million of Ford Credit facilitiesdebt and related interest of $20 million. We recognized a gain on extinguishment of debt of $68 million on the transaction in Automotive interest income and other non-operating income/(expense), net. During the second quarter of 2010, we utilized cash of $192 million to purchase $200 million of Ford Credit debt and related interest of about $1 million. We recognized a gain on extinguishment of debt of $9 million on the transaction in Automotive interest income and other non-operating income/(expense), net.
On our VIEs are excludedconsolidated balance sheet, we net the remaining debt purchased by Ford with the outstanding debt of Ford Credit, reducing our consolidated marketable securities and debt balances by $201 million and $201 million at December 31, 2011 and 2010, respectively. On our sector balance sheet, the debt is reported separately as we doAutomotive marketable securities and Financial Services debt as it has not control their use.been retired or cancelled by Ford Credit.
FORD MOTOR COMPANY AND SUBSIDIARIES
NOTES TO THE FINANCIAL STATEMENTS
NOTE 19.18. DEBT AND COMMITMENTS (Continued)
Credit Facilities
At December 31, 2009,2011, Ford Credit and its majority-owned subsidiaries including FCE Bank, plc ("FCE"), had $1.3 billionabout $714 million of contractually-committedcontractually committed unsecured credit facilities with financial institutions, including FCE's £440 million (equivalent to $683 million at December 31, 2011) credit facility (the "FCE Credit Agreement") which matures in 2014. FCE drew $200 million as part of which $645its plans for periodic usage of the facility and at December 31, 2011, FCE had $483 million were available for use. Of the credit facilities available for use, $276 million, $308 million, and $61 million expire in 2010, 2011, and 2012, respectively. Of the $1.3 billion of contractually-committed credit facilities, almost all are FCE worldwide credit facilities. The FCE worldwide credit facilities may be used,Credit Agreement contains certain covenants, including an obligation for FCE to maintain its ratio of regulatory capital to risk weighted assets at FCE's option,no less than the applicable regulatory minimum, and for the support agreement between FCE and Ford Credit to remain in full force and effect (and enforced by any of FCE's direct or indirect, majority-owned subsidiaries. FCE will guarantee any such borrowings. All of the worldwide credit facilities are free of material adverse change clauses, restrictive financial covenants (for example, debt-to-equity limitations and minimumto ensure that its net worth requirements)is maintained at no less than $500 million). In addition to customary payment, representation, bankruptcy, and credit rating triggers that could limit Ford Credit's abilityjudgment defaults, the FCE Credit Agreement contains cross-payment and cross-acceleration defaults with respect to obtain funding.other debt.
In addition, at December 31, 2009,2011, Ford Credit had $9.3about $7.9 billion of contractually-committed liquidity facilities provided by banks to support its FCAR program. Of the $9.3program of which $4.3 billion of contractually-committed liquidity facilities, $4.4 billion and $4.9 billion expire in 20102012 and 2012, respectively.$3.6 billion expire in 2014. Utilization of these facilities is subject to conditions specific to the FCAR program and Ford Credit having a sufficient amount of eligible retail assets for securitization. The FCAR program must be supported by liquidity facilities equal to at least 100% of its outstanding balance. At December 31, 2009, $9.32011, about $7.9 billion of FCAR'sFCAR’s bank liquidity facilities were available to support FCAR'sFCAR’s asset-backed commercial paper, subordinated debt or FCAR'sFCAR’s purchase of Ford Credit'sCredit asset-backed securities. At December 31, 2009,2011, the outstanding commercial paper balance for the FCAR program was $6.4$6.8 billion of which $1 million was held by Ford Credit..
Committed Liquidity Programs
Ford Credit and its subsidiaries, including FCE, have entered into agreements with a number of bank-sponsored asset-backed commercial paper conduits (“conduits”) and other financial institutions whereby such partiesinstitutions. Such counterparties are contractually committed, at Ford Credit's option, to purchase from Ford Credit eligible retail or wholesale assets or to purchase or make advances under asset-backed securities backed by retail, lease, or wholesale assets for proceeds of up to $23.2$24 billion at
December 31, 2009 ($10.82011 ($12.6 billion retail, $8.1$8 billion wholesale, and $4.3$3.4 billion supported by various retail, lease or wholesale)assets), of which $7.4$7 billion are commitments to FCE. These committed liquidity programs have varying maturity dates, with $20.2$21.6 billion having maturities within the next twelve months (of which $6.7about $6.6 billion relates to FCE commitments), and the remaining balance having maturities between March 2011January 2013 and December 2011. While there is a risk of non-renewal of some of these committed liquidity programs, which could leadAugust 2014. Ford Credit plans to a reduction in the size of these programs and/or higher costs, Ford Credit'sachieve capacity in excess of eligible receivables would enable itrenewals to absorb some reductions.protect its global funding needs, optimize capacity utilization and maintain sufficient liquidity. Ford Credit's ability to obtain funding under these programs is subject to having a sufficient amount of assets eligible for these programs as well as theits ability to obtain interest rate hedging arrangements for securitizations.certain securitization transactions. Ford Credit's capacity in excess of eligible receivables and operating leases would protect it against the risk of lower than planned renewal rates. At December 31, 2009, $11.22011, $14.5 billion of these commitments were in use. These programs are free of material adverse change clauses, restrictive financial covenants (for example, debt-to-equity limitations and minimum net worth requirements), and generally credit rating triggers that could limit Ford Credit's ability to obtain funding. However, the unused portion of these commitments may be terminated if the performance of the underlying assets deteriorates beyond specified levels. Based on Ford Credit's experience and knowledge as servicer of the related assets, it does not expect any of these programs to be terminated due to such events.
FORD MOTOR COMPANY AND SUBSIDIARIES
NOTES TO THE FINANCIAL STATEMENTS
NOTE 20.19. OTHER INCOME/(LOSS)
Automotive Sector
The following table summarizes amounts included in Automotive interest income and other non-operating income/(expense), net for the years ending December 31 (in millions):
| | | | | | | | | | | | | 2011 | | 2010 | | 2009 |
Interest income | | $ | 209 | | | $ | 951 | | | $ | 1,713 | | $ | 387 |
| | $ | 262 |
| | $ | 205 |
|
| Realized and unrealized gains/(losses) on cash equivalents and marketable securities | | | 372 | | | | (1,309 | ) | | | (109 | ) | (77 | ) | | 125 |
| | 373 |
|
Gains/(Losses) on the sale of held-for-sale operations, equity and cost investments, and other dispositions | | | (7 | ) | | | (527 | ) | | | 139 | | 436 |
| | 5 |
| | (7 | ) |
Gains/(Losses) on extinguishment of debt | | | 4,666 | | | | 170 | | | | (512 | ) | |
Other * | | | 48 | | | | (11 | ) | | | (70 | ) | |
| Gains/(Losses) on extinguishment of debt (a) | | (60 | ) | | (844 | ) | | 4,666 |
|
| Other | | 139 |
| | 90 |
| | 47 |
|
Total | | $ | 5,288 | | | $ | (726 | ) | | $ | 1,161 | | $ | 825 |
| | $ | (362 | ) | | $ | 5,284 |
|
__________
* 2009 includes $5 million of expense in other income associated with the overall debt reduction actions discussed in Note 1.
| |
| (a) | See Note 18 for a description of the debt transactions. |
Financial Services Sector
The following table summarizes the amounts included in Financial Services other income/(loss), net for the years ending December 31 (in millions):
| | | | | | | | | | | |
Interest income (non-financing related) | | $ | 107 | | | $ | 503 | | | $ | 860 | | |
| | �� | | 2011 | | 2010 | | 2009 |
| Interest income (investment-related) | | $ | 84 |
| | $ | 86 |
| | $ | 107 |
|
| Realized and unrealized gains/(losses) on cash equivalents and marketable securities | | | 42 | | | | (8 | ) | | | 39 | | 15 |
| | 22 |
| | 42 |
|
Gains/(Losses) on the sale of held-for-sale operations, equity and cost investments, and other dispositions | | | 16 | | | | 119 | | | | 54 | | 51 |
| | 9 |
| | 16 |
|
Gains/(Losses) on extinguishment of debt* | | | 71 | | | | — | | | | — | | |
| Gains/(Losses) on extinguishment of debt (a) | | (68 | ) | | (139 | ) | | 71 |
|
Investment and other income related to sales of receivables | | | (25 | ) | | | 199 | | | | 391 | | 1 |
| | 2 |
| | (25 | ) |
Insurance premiums earned, net | | | 100 | | | | 140 | | | | 169 | | 100 |
| | 98 |
| | 100 |
|
Other | | | 241 | | | | 196 | | | | 356 | | 230 |
| | 237 |
| | 241 |
|
Total | | $ | 552 | | | $ | 1,149 | | | $ | 1,869 | | $ | 413 |
| | $ | 315 |
| | $ | 552 |
|
__________
| |
| (a) | * 2009 includes a gain of$4 million $4 millionbased on extinguishment of debt from the exercise of a contractually-permitted put option. See Note 18 for a description of the debt transactions.
|
NOTE 21.20. SHARE-BASED COMPENSATION
At December 31, 2009,2011, a variety of Ford stock-based compensation grants and awards were outstanding for employees (including officers) and members of the Board of Directors. All stock-based compensation plans are approved by the shareholders.
Included below is information on restricted stock units, stock option awards, and other share-based awards.
We grant performance and time-based restricted stock units to our employees. Restricted stock units awarded in stock ("RSU-stock") provide the recipients with the right to shares of stock after a restriction period. We have stock-based compensation outstanding under two Long-Term Incentive Plans ("LTIP"): the 1998 LTIP and the 2008 LTIP. No further grants may be made under the 1998 LTIP. All outstanding stock-based compensation under the 1998 LTIP continues to be governed by the terms and conditions of the existing agreements for those grants. Grants may continue to be made under the 2008 LTIP through April 2018. Under the 2008 LTIP, 2% of our issued Common Stock as of December 31 becomes available for granting plan awards in the succeeding calendar year. Any unused portion is available for later years. The limit may be increased up to 3% in any year, with a corresponding reduction in shares available for grants in future years. AllAt December 31, 2011 the number of unused shares from previous years and shares available under the 2% limit were used in 2009, as well as additional shares allocated from increasing the limit above 2%.carried forward was 96 million shares.
The fair value of the awards under the two plans is calculated differently:
1998 LTIP - Fair value is the average of the high and low market price of our Common Stock on the grant date.
2008 LTIP - Fair value is the closing price of our Common Stock on the grant date.
FORD MOTOR COMPANY AND SUBSIDIARIES
NOTES TO THE FINANCIAL STATEMENTS
NOTE 21.20. SHARE-BASED COMPENSATION (Continued)
Outstanding RSU-stock are either strictly time-based or a combination of performance and time-based awards. Expenses associated with RSU-stock are recorded in Selling, administrative, and other expense.
| · | Time-based RSU-stock issued in 2006 and prior vest at the end of the restriction period and the expense is taken equally over the restriction period. |
Time-based RSU-stock generally have a graded vesting feature whereby one-third of each RSU-stock vests after the first anniversary of the grant date, one-third after the second anniversary, and one-third after the third anniversary. The expense is recognized using the graded vesting method. | · | Time-based RSU-stock issued in and after 2007 generally have a graded vesting feature whereby one-third of each RSU-stock vests after the first anniversary of the grant date, one-third after the second anniversary, and one-third after the third anniversary. The expense is recognized using the graded vesting method. |
Performance RSU-stock have a performance period (usually 1-3 years) and usually a restriction period (usually 1-3 years). Compensation expense for performance RSU-stock is recognized when it is probable and estimable as measured against the performance metrics. Expense is then recognized over the performance and restriction periods, if any, based on the fair market value of Ford Common Stock at grant date.
| · | Performance RSU-stock have a performance period (usually 1-3 years) and a restriction period (usually 1-3 years). Compensation expense for performance RSU-stock is not recognized until it is probable and estimable. Expense is then recognized over the performance and restriction periods based on the fair market value of Ford Common Stock at grant date. |
We also grant stock options to our employees. We measure the fair value of the majority of our stock options using the Black-Scholes option-pricing model, using historical volatility and our determination of the expected term. The expected term of stock options is the time period that the stock options are expected to be outstanding. Historical data are used to estimate option exercise behaviors and employee termination experience. Based on our assessment of employee groupings and observable behaviors, we determined that
Stock options generally have a single grouping is appropriate. Generally, 33%vesting feature whereby one-third of the stock options are exercisable after the first anniversary of the grant date, of grant, 66%one-third after the second anniversary, and 100%one-third after the third anniversary. Stock options expire ten years from the grant date and are expensed in Selling, administrative, and other expenses using a three-yearthree-year graded vesting methodology.
Upon stock-settled compensation exercises and awards, we issuedWe issue new shares of Common Stock. We do not expectStock upon settlement of RSU-stock and options settleable in shares. During 2012, we intend to implement a modest anti-dilutive share repurchase a significant number of shares for treasury stock during 2010.plan to offset share-based compensation.
Restricted Stock Units
RSU-stock activity during 20092011 was as follows:
|
| | | | | | | | | | |
| | Shares (millions) | | Weighted- Average Grant- Date Fair Value | | Aggregate Intrinsic Value (millions) |
| Outstanding, beginning of year | 72.4 |
| | $ | 3.96 |
| | |
| Granted | 8.6 |
| | 14.47 |
| | |
| Vested | (44.4 | ) | | 3.19 |
| | |
| Forfeited | (0.5 | ) | | 11.03 |
| | |
| Outstanding, end of year | 36.1 |
| | 7.31 |
| | $ | 388.4 |
|
| RSU-stock expected to vest | 35.5 |
| | N/A |
| | 381.9 |
|
| | | | | | Weighted- Average Grant- Date Fair Value | | | Aggregate Intrinsic Value (millions) | |
Outstanding, beginning of year | | | 25.9 | | | $ | 6.84 | | | | |
Granted | | | 80.4 | | | | 2.13 | | | | |
Vested | | | (9.5 | ) | | | 6.88 | | | | |
Forfeited | | | (2.4 | ) | | | 3.98 | | | | |
Outstanding, end of year | | | 94.4 | | | | 2.89 | | | $ | 944.5 | |
| | | | | | | | | | | | | |
RSU-stock expected to vest | | | 91.9 | | | | N/A | | | | 919.5 | |
Intrinsic value of RSU-stock is measured by applying the closing stock price as of December 31 to the applicable number of units. The fair value and intrinsic value of RSU-stock during 2009, 2008,2011, 2010, and 20072009 were as follows (in millions, except RSURSU-stock per unit amounts):
|
| | | | | | | | | | | |
| | 2011 | | 2010 | | 2009 |
| Fair value | | | | | |
| Granted | $ | 123 |
| | $ | 130 |
| | $ | 171 |
|
| Weighted average for multiple grant dates (per unit) | 14.47 |
| | 12.69 |
| | 2.13 |
|
| Vested | 141 |
| | 112 |
| | 66 |
|
| Intrinsic value | |
| | |
| | |
|
| Vested | 478 |
| | 522 |
| | 95 |
|
| | | | | | | | | | |
| Fair value | | | | | | | | | |
Granted | | $ | 171 | | | $ | 112 | | | $ | 121 | |
Weighted average for multiple grant dates (per unit) | | | 2.13 | | | | 6.05 | | | | 7.64 | |
Vested | | | 66 | | | | 40 | | | | 9 | |
| Intrinsic value | | | | | | | | | | | | |
Vested | | | 95 | | | | 12 | | | | 8 | |
FS-72
FORD MOTOR COMPANY AND SUBSIDIARIES
NOTES TO THE FINANCIAL STATEMENTS
NOTE 20. SHARE-BASED COMPENSATION (Continued)
Compensation cost for RSU-stock was as follows (in millions):
| | | | | | | | | | |
Compensation cost, net of taxes* | | $ | 117 | | | $ | 82 | | | $ | 76 | |
|
| | | | | | | | | | | |
| | 2011 | | 2010 | | 2009 |
| Compensation cost (a) | $ | 84 |
| | $ | 138 |
| | $ | 117 |
|
__________
* No taxes recorded in each period due to established valuation allowances.
FORD MOTOR COMPANY AND SUBSIDIARIES
NOTES TO THE FINANCIAL STATEMENTS
NOTE 21. SHARE-BASED COMPENSATION (Continued) | |
| (a) | Net of tax benefit of $49 million, $0, and $0 in 2011, 2010, and 2009, respectively. |
As of December 31, 2009,2011, there was approximately $86$49 million in unrealized compensation cost related to non-vested RSU-stock. This expense will be recognized over a weighted average period of 1.3 years.
Stock Options
Stock option activity was as follows:
| | | | | | | | | | | | | 2011 | | 2010 | | 2009 |
| | | | | | Weighted- Average Exercise Price | | | | | | Weighted- Average Exercise Price | | | | | | Weighted- Average Exercise Price | | Shares (millions) | | Weighted- Average Exercise Price | | Shares (millions) | | Weighted- Average Exercise Price | | Shares (millions) | | Weighted- Average Exercise Price |
Outstanding, beginning of year | | | 226.2 | | | $ | 16.37 | | | | 247.3 | | | $ | 17.57 | | | | 255.6 | | | $ | 17.83 | | 172.5 |
| | $ | 13.07 |
| | 225.4 |
| | $ | 13.36 |
| | 226.2 |
| | $ | 16.37 |
|
Granted | | | 26.5 | | | | 2.06 | | | | 13.5 | | | | 6.12 | | | | 16.3 | | | | 7.56 | | 4.4 |
| | 14.76 |
| | 6.7 |
| | 12.75 |
| | 26.5 |
| | 2.06 |
|
Exercised* | | | (1.3 | ) | | | 7.35 | | | | (0.3 | ) | | | 7.65 | | | | (1.2 | ) | | | 7.61 | | |
| Exercised (a) | | (8.2 | ) | | 9.25 |
| | (36.5 | ) | | 8.41 |
| | (1.3 | ) | | 7.35 |
|
Forfeited (including expirations) | | | (26.0 | ) | | | 28.28 | | | | (34.3 | ) | | | 21.03 | | | | (23.4 | ) | | | 14.00 | | (24.3 | ) | | 29.18 |
| | (23.1 | ) | | 23.18 |
| | (26.0 | ) | | 28.28 |
|
Outstanding, end of year | | | 225.4 | | | | 13.36 | | | | 226.2 | | | | 16.37 | | | | 247.3 | | | | 17.57 | | 144.4 |
| | 10.63 |
| | 172.5 |
| | 13.07 |
| | 225.4 |
| | 13.36 |
|
Exercisable, end of year | | | 185.0 | | | | 15.47 | | | | 194.8 | | | | 17.86 | | | | 205.6 | | | | 19.38 | | 126.8 |
| | 11.00 |
| | 143.7 |
| | 14.63 |
| | 185.0 |
| | 15.47 |
|
__________
* | |
| (a) | Exercised at option price ranging from $5.49$1.96 to $7.83$16.91 during 2009,2011, option price ranging from $7.55$1.96 to $7.83$16.91 during 2008,2010, and option price ranging from $7.12$5.49 to $7.83$7.83 during 20072009. |
The total grant date fair value of options that vested during the years ended December 31 was as follows (in millions):
|
| | | | | | | | | | | |
| | 2011 | | 2010 | | 2009 |
| Fair value of vested options | $ | 36 |
| | $ | 37 |
| | $ | 41 |
|
| | | | | | | | | | |
Fair value of vested options | | $ | 41 | | | $ | 65 | | | $ | 81 | |
We have 185126.8 million fully-vested stock options, with a weighted-average exercise price of $15.47$11.00 and average remaining term of 3.53 years. We expect 39.217.2 million stock options (after forfeitures), with a weighted-average exercise price of $3.72$7.96 and average remaining term of 8.78 years, to vest in the future.
The intrinsic value for vested and unvested options during the years ended December 31 was as follows (in millions):
| | | | | | | | | | |
Intrinsic value of vested options* | | $ | 132 | | | $ | — | | | $ | — | |
Intrinsic value of unvested options (after forfeitures)* | | | 246 | | | | — | | | | — | |
|
| | | | | | | | | | | |
| | 2011 | | 2010 | | 2009 |
| Intrinsic value of vested options (a) | $ | 257 |
| | $ | 623 |
| | $ | 132 |
|
| Intrinsic value of unvested options (after forfeitures) (a) | 74 |
| | 324 |
| | 246 |
|
__________
* | |
| (a) | The intrinsic value for stock options is measured by comparing the awarded option price to the closing stock price at December 31. There was no intrinsic value for vested and unvested options at December 31, 2007 and 2008 due to our stock closing at a market price lower than any of the outstanding option prices. |
We received approximately $10$76 million from the exercise of stock options in 2009.2011. The tax benefit realized was de minimis. An equivalent of about $10$73 million in new issues were used to settle exercised options. For options exercised during the years ended December 31, 2009, 2008,2011, 2010, and 2007,2009, the difference between the fair value of the common sharesCommon Stock issued and theirthe respective exercise price was $2$54 millionde minimis, $187 million, and $1$2 million, respectively.
Compensation cost for stock options was as follows (in millions):
| | | | | | | | | | |
Compensation cost, net of taxes* | | $ | 29 | | | $ | 35 | | | $ | 75 | |
|
| | | | | | | | | | | |
| | 2011 | | 2010 | | 2009 |
| Compensation cost (a) | $ | 30 |
| | $ | 34 |
| | $ | 29 |
|
__________
| |
| (a) | Net of tax benefit of $17 million, $0, and $0 in 2011, 2010, and 2009, respectively. |
* No taxes recorded in each period due to established valuation allowances.
FORD MOTOR COMPANY AND SUBSIDIARIES
NOTES TO THE FINANCIAL STATEMENTS
NOTE 21.20. SHARE-BASED COMPENSATION (Continued)
As of December 31, 2009,2011, there was about $15$13 million in unrealized compensation cost related to non-vested stock options. This expense will be recognized over a weighted averageweighted-average period of 1.3 years. A summary of the status of our non-vested shares and changes during 20092011 follows:
| | | | | | Weighted- Average Grant- Date Fair Value | | |
Non-vested, beginning of year | | | 31.4 | | | $ | 2.79 | | |
| | | | Shares (millions) | | Weighted- Average Grant- Date Fair Value |
| Non-vested, beginning of year | | 28.8 |
| | $ | 2.77 |
|
Granted | | | 26.5 | | | | 1.07 | | 4.4 |
| | 8.48 |
|
Vested | | | (16.0 | ) | | | 2.68 | | (15.1 | ) | | 2.43 |
|
Forfeited | | | (1.5 | ) | | | 2.13 | | (0.5 | ) | | 2.79 |
|
Non-vested, end of year | | | 40.4 | | | | 1.73 | | |
| Non-vested, end of year | | 17.6 |
| | 4.49 |
|
The estimated fair value of stock options at the time of grant using the Black-Scholes option-pricing model was as follows:
| | | | | | | | | | | | | 2011 | | 2010 | | 2009 |
Fair value per stock option | | $ | 1.07 | | | $ | 2.65 | | | $ | 3.57 | | $ | 8.48 |
| | $ | 7.21 |
| | $ | 1.07 |
|
| Assumptions: | | | | | | | | | | | | | |
| | |
| | |
|
Annualized dividend yield | | | — | % | | | — | % | | | — | % | — | % | | — | % | | — | % |
Expected volatility | | | 52.0 | % | | | 37.7 | % | | | 39.2 | % | 53.2 | % | | 53.4 | % | | 52.0 | % |
Risk-free interest rate | | | 2.7 | % | | | 3.9 | % | | | 4.8 | % | 3.2 | % | | 3.0 | % | | 2.7 | % |
Expected stock option term (in years) | | | 6.0 | | | | 6.0 | | | | 6.5 | | 7.1 |
| | 6.9 |
| | 6.0 |
|
Details on various stock option exercise price ranges are as follows:
| | | | | | | | |
| Range of Exercise Prices | | | | | | Weighted- Average Life (years) | | | Weighted- Average Exercise Price | | | | | | Weighted- Average Exercise Price | |
| $1.96 - $10.58 | | | | 99.1 | | | | 6.73 | | | $ | 6.11 | | | | 58.7 | | | $ | 7.76 | |
| $10.62 – $15.81 | | | | 46.7 | | | | 4.49 | | | | 13.03 | | | | 46.7 | | | | 13.03 | |
| $15.91 – $23.88 | | | | 54.1 | | | | 5.57 | | | | 19.00 | | | | 54.1 | | | | 19.00 | |
| $23.97 – $35.79 | | | | 25.5 | | | | 1.14 | | | | 30.16 | | | | 25.5 | | | | 30.16 | |
Total stock options | | | | 225.4 | | | | | | | | | | | | 185.0 | | | | | |
|
| | | | | | | | | | | | | | | | |
| | Outstanding Options | | Exercisable Options |
| Range of Exercise Prices | Shares (millions) | | Weighted- Average Life (years) | | Weighted- Average Exercise Price | | Shares (millions) | | Weighted- Average Exercise Price |
| $1.96 – $2.84 | 22.4 |
| | 7.20 |
| | $ | 2.10 |
| | 13.7 |
| | $ | 2.11 |
|
| $5.11 – $10.18 | 41.5 |
| | 4.21 |
| | 7.42 |
| | 41.5 |
| | 7.42 |
|
| $11.10 – $15.98 | 48.3 |
| | 3.85 |
| | 13.20 |
| | 39.4 |
| | 13.08 |
|
| $16.09 – $17.05 | 32.2 |
| | 0.30 |
| | 16.88 |
| | 32.2 |
| | 16.88 |
|
| Total stock options | 144.4 |
| | |
| | |
| | 126.8 |
| | |
|
Other Share-Based Awards
Under the 1998 LTIP and 2008 LTIP, we have granted other share-based awards to select executives and other key employees, in addition to stock options and restricted stock units.certain employees. These awards include restricted stock cash-awardedgrants, cash-settled restricted stock units, performance stock rights, and stock appreciation rights. These awards have various vesting criteria which may include service requirements, individual performance targets, and company-wide performance targets.
Other share-based compensation cost was as follows (in millions):
| | | | | | | | | | |
Compensation cost, net of taxes* | | $ | 11 | | | $ | — | | | $ | 9 | |
|
| | | | | | | | | | | |
| | 2011 | | 2010 | | 2009 |
| Compensation cost (a) | $ | (9 | ) | | $ | 6 |
| | $ | 11 |
|
__________
| |
| (a) | Net of tax of $3 million, $0, and $0 in 2011, 2010, and 2009, respectively. |
* No taxes recorded in each period due to established valuation allowances.
FORD MOTOR COMPANY AND SUBSIDIARIES
NOTES TO THE FINANCIAL STATEMENTS
NOTE 22.21. EMPLOYEE SEPARATION ACTIONS
As part of our plan to realign our vehicle assembly capacity to operate profitably at the current demand and changing model mix, we have implemented a number of different employee separation plans. The accounting for employee separation plans is dependent on the specific design of the plans.
Under certain labor agreements, we are required to pay transitional benefits to our employees who are idled. For employees who will be temporarytemporarily idled, we expense the benefits on an as-incurred basis. For employees who will be permanently idled, we expense all of the future benefits payments in the period when it is probable that the employees will be permanently idled. Our reserve balance for these future benefit payments to permanently idled employees takes into account several factors: the demographics of the population at each affected facility, redeployment alternatives, estimate of benefits to be paid, and recent experience relative to voluntary redeployments.
We also incur payments to employees for separation actions. The costs of unconditional voluntary employee separation actions are recorded at the time of employee acceptance, unless the acceptance requires explicit approval by the Company. The costs of conditional voluntary separations are accrued when all conditions are satisfied. The costs of involuntary separation programs are accrued when management has approved the program and the affected employees are identified.
Automotive Sector
Transitional Benefits
Our collective bargaining agreements with the UAW and the CAW require us to pay a portion of wage and benefits for a specified period of time to employees who are considered permanently idled employeesand who meet certain conditions. We have established a reserve for employee benefits that we expect to provide under our collective bargaining agreements. At December 31, 2011 and 2010, this reserve was $153 million and $372 million, respectively.
The following table summarizes the activitybalance in the reserve:
| | | | | | | |
| | | | | | | | | | | | | |
Beginning balance | | $ | 411 | | | $ | 817 | | | | 4,187 | | | | 8,316 | |
Additions to transitional benefits reserve/transfers from voluntary separation program (i.e., rescissions) | | | 318 | | | | 71 | | | | 1,542 | | | | 806 | |
Voluntary separations and relocations | | | (87 | ) | | | (248 | ) | | | (983 | ) | | | (2,880 | ) |
Benefit payments and other adjustments | | | (268 | ) | | | (229 | ) | | | (2,310 | ) | | | (2,055 | ) |
Ending balance | | $ | 374 | | | $ | 411 | | | | 2,436 | | | | 4,187 | |
During the first quarter of 2009, we reached an agreement with the UAWreserve primarily relates to modify our collective bargaining agreement. We renegotiated Job Security Benefits, modified Supplemental Unemployment Benefits, and established a new Transition Assistance Plan. This change in the contract benefits combined with a change in our plans to redeploy employees in our operations reduced our reserve. Additionally, in the fourth quarter of 2009, we announced the closure of our St. Thomas Assembly Plant in Canada, which resultedwas announced in an increase to the reserve.
During 2009, 2008, and 2007 we recorded in Automotive costfourth quarter of sales a reduction of expense of $40 million, $346 million, and $80 million, respectively.2009.
Separation Actions
UAW Voluntary Separations. We established a separation reserve for costs associated with separation actions recorded at the time of employee acceptance of a voluntary termination. At December 31, 2009 and 2008, this reserve was $51 million and $162 million, respectively. The ending balance in the reserve primarily represents the cost of separation packages for employees who accepted separation packages but have not yet left the Company, as well as employees who accepted a retirement package and ceased duties but remain on our employment rolls until they reach retirement eligibility.
FORD MOTOR COMPANY AND SUBSIDIARIES
NOTES TO THE FINANCIAL STATEMENTS
NOTE 22. EMPLOYEE SEPARATION ACTIONS (Continued)
We recorded in Automotive cost of sales pre-tax charges of $122 million and $323 million for 2009 and 2008, respectively, and recorded a reduction to expense for rescissions of previous acceptances of $298 million for 2007.
Other Employee Separation Actions. The following table shows pre-tax charges for other hourly and salaried employee separation actions, which are recorded in Automotive cost of sales and Selling, administrative and other expenses(in for the years ended December 31 (in millions):
| | | | | | | | | | | | | 2011 | | 2010 | | 2009 |
Ford Europe | | $ | 109 | | | $ | 38 | | | $ | 45 | | $ | 67 |
| | $ | 56 |
| | $ | 109 |
|
Ford North America (U.S. salaried-related) | | | 105 | | | | 186 | | | | 377 | | |
Volvo | | | 20 | | | | 108 | | | | 11 | | |
| Ford North America | | 154 |
| | 110 |
| | 225 |
|
Ford South America | | | 20 | | | | — | | | | — | | 15 |
| | 3 |
| | 20 |
|
Ford Asia Pacific Africa | | | 17 | | | | 90 | | | | 5 | | 38 |
| | 1 |
| | 17 |
|
The charges above exclude costs for pension and OPEB.
Financial Services Sector
Separation Actions
In 2009, Ford Credit announced plans to restructure its U.S. operations to meet changing business conditions, including the declineWe recorded in its receivables. The restructuring affects its servicing, sales, and central operations. In 2009, 2008, and 2007, Ford Credit recognized pre-tax charges of $64 million, $16 million, and $37 million, respectively, in Selling, administrative and other expenses pre-tax charges of $32 million, $33 million, and $64 million for this2011, 2010, and other2009, respectively, for employee separation actions outside of the United States.actions.
These charges exclude costs for pension costs.and OPEB.
FORD MOTOR COMPANY AND SUBSIDIARIES
NOTES TO THE FINANCIAL STATEMENTS
NOTE 23.22. INCOME TAXES
Income Taxes
According to U.S.In accordance with GAAP, we have elected to recognize accrued interest related to unrecognized tax benefits and tax-related penalties in the Provision for/(Benefit from) income taxeson our consolidated statement of operations.
Valuation of Deferred Tax Assets and Liabilities
Deferred tax assets and liabilities are recognized based on the future tax consequences attributable to temporary differences that exist between the financial statement carrying value of assets and liabilities and their respective tax bases, and operating loss and tax credit carryforwards on a taxing jurisdiction basis. We measure deferred tax assets and liabilities using enacted tax rates that will apply in the years in which we expect the temporary differences to be recovered or paid.
Our accounting for deferred tax consequences represents our best estimate of the likely future tax consequences of events that have been recognized in our financial statements or tax returns and their future probability. In assessing the need for a valuation allowance, we consider both positive and negative evidence related to the likelihood of realization of the deferred tax assets. If, based on the weight of available evidence, it is more likely than not that the deferred tax assets will not be realized, we record a valuation allowance.
FORD MOTOR COMPANY AND SUBSIDIARIES
NOTES TO THE FINANCIAL STATEMENTS
NOTE 23. INCOME TAXES(Continued)
Components of Income Taxes
Components of income taxes excluding discontinued operations, cumulative effects of changes in accounting principles, other comprehensive income, and equity in net results of affiliated companies accounted for after-tax, are as follows:
| | | | | | | | | | | | | 2011 | | 2010 | | 2009 |
Income/(Loss) before income taxes, excluding equity in net results of affiliated companies accounted for after-tax (in millions) | | | | | | | | | | | | | | |
U.S. | | $ | 1,869 | | | $ | (16,122 | ) | | $ | (6,373 | ) | $ | 6,043 |
| | $ | 4,057 |
| | $ | 1,724 |
|
Non-U.S. | | | 1,147 | | | | 1,448 | | | | 2,113 | | 2,138 |
| | 2,554 |
| | 680 |
|
Total | | $ | 3,016 | | | $ | (14,674 | ) | | $ | (4,260 | ) | $ | 8,181 |
| | $ | 6,611 |
| | $ | 2,404 |
|
| | | | | | | | | | | | | | |
| Provision for/(Benefit from) income taxes (in millions) | | | | | | | | | | | | | |
| | |
| | |
|
| Current | | | | | | | | | | | | | |
| | |
| | |
|
Federal | | $ | (274 | ) | | $ | (117 | ) | | $ | (39 | ) | $ | (4 | ) | | $ | (69 | ) | | $ | (274 | ) |
Non-U.S. | | | 293 | | | | 458 | | | | 313 | | 298 |
| | 289 |
| | 269 |
|
State and local | | | 7 | | | | 36 | | | | 1 | | (24 | ) | | (5 | ) | | 7 |
|
Total current | | | 26 | | | | 377 | | | | 275 | | 270 |
| | 215 |
| | 2 |
|
| Deferred | | | | | | | | | | | | | |
| | |
| | |
|
Federal | | | — | | | | 95 | | | | (1,749 | ) | (9,785 | ) | | — |
| | (100 | ) |
Non-U.S. | | | 102 | | | | (350 | ) | | | 410 | | (1,590 | ) | | 292 |
| | 44 |
|
State and local | | | (59 | ) | | | (59 | ) | | | (269 | ) | (436 | ) | | 85 |
| | (59 | ) |
Total deferred | | | 43 | | | | (314 | ) | | | (1,608 | ) | (11,811 | ) | | 377 |
| | (115 | ) |
Total | | $ | 69 | | | $ | 63 | | | $ | (1,333 | ) | $ | (11,541 | ) | | $ | 592 |
| | $ | (113 | ) |
| | | | | | | | | | | | | | |
| Reconciliation of effective tax rate | | | | | | | | | | | | | |
| | |
| | |
|
U.S. tax at statutory rate | | | 35.0 | % | | | 35.0 | % | | | 35.0 | % | |
Non-U.S. income taxes | | | (1.6 | ) | | | 1.2 | | | | 1.3 | | |
| U.S. statutory rate | | 35.0 | % | | 35.0 | % | | 35.0 | % |
| Non-U.S. tax rates under U.S. rates | | (1.5 | ) | | (0.1 | ) | | (0.6 | ) |
State and local income taxes | | | (1.6 | ) | | | 0.2 | | | | 4.2 | | 1.1 |
| | 1.5 |
| | (1.9 | ) |
General business credits | | | (5.0 | ) | | | 1.1 | | | | 5.4 | | (1.9 | ) | | (1.8 | ) | | (6.2 | ) |
Dispositions and restructurings | | | (3.4 | ) | | | 15.8 | | | | (6.1 | ) | 6.8 |
| | (9.5 | ) | | (4.3 | ) |
Medicare prescription drug benefit | | | — | | | | 0.6 | | | | 2.1 | | |
| U.S. tax on non-U.S. earnings | | (0.8 | ) | | 0.1 |
| | 0.6 |
|
Prior year settlements and claims | | | 8.3 | | | | (0.6 | ) | | | 1.0 | | (0.2 | ) | | (10.0 | ) | | 10.4 |
|
Tax-related interest | | | (1.2 | ) | | | 0.5 | | | | (1.7 | ) | (0.9 | ) | | (0.7 | ) | | (1.5 | ) |
| Tax-exempt income | | (3.9 | ) | | (4.7 | ) | | (10.4 | ) |
Other | | | 0.9 | | | | (0.1 | ) | | | 2.5 | | (2.5 | ) | | 0.2 |
| | 0.2 |
|
Valuation allowance | | | (29.1 | ) | | | (54.1 | ) | | | (12.4 | ) | |
| Valuation allowances | | (172.3 | ) | | (1.0 | ) | | (26.0 | ) |
Effective rate | | | 2.3 | % | | | (0.4 | )% | | | 31.3 | % | (141.1 | )% | | 9.0 | % | | (4.7 | )% |
No provision for deferred taxes has been made on $1.3 billion of unremitted earnings that are permanently invested in our non-U.S. operating assets. Had these earnings not been permanently reinvested in non-U.S. operations, the U.S. tax consequences of their repatriation would have been insignificant since these earnings were subject to foreign taxes that would offset, as foreign tax credits, substantially all U.S. taxes.
FORD MOTOR COMPANY AND SUBSIDIARIES
NOTES TO THE FINANCIAL STATEMENTS
NOTE 23.22. INCOME TAXES(Continued)
We historically have provided deferred taxes for the presumed repatriation to the United States of earnings from nearly all non-U.S. subsidiaries. During 2011, we determined that $6.9 billion of these non-U.S. subsidiaries' undistributed earnings are now indefinitely reinvested outside the United States. As management has determined that the earnings of these subsidiaries are not required as a source of funding for U.S. operations, such earnings are not planned to be distributed to the U.S. in the foreseeable future. As a result of this change in assertion, deferred tax liabilities related to undistributed foreign earnings decreased by $63 million.
As of December 31, 2011, $8.4 billion of non-U.S. earnings are considered indefinitely reinvested in operations outside the United States, for which deferred taxes have not been provided. These earnings have been subject to significant non-U.S. taxes; repatriation in their entirety would result in a residual U.S. tax liability of about $300 million.
At the end of 2011, our U.S. operations had returned to a position of cumulative profits for the most recent three-year period. We concluded that this record of cumulative profitability in recent years, our ten consecutive quarters of pre-tax operating profits, our successful completion of labor negotiations with the UAW, and our business plan showing continued profitability, provide assurance that our future tax benefits more likely than not will be realized. Accordingly, at year-end 2011, we released almost all of our valuation allowance against net deferred tax assets for entities in the United States, Canada, and Spain.
At December 31, 2011, we have retained a valuation allowance against approximately $500 million in North America related to various state and local operating loss carryforwards that are subject to restrictive rules for future utilization, and a valuation allowance totaling $1 billion primarily against deferred tax assets for our South American operations.
Components of Deferred Tax Assets and Liabilities
The components of deferred tax assets and liabilities at December 31 were as follows (in millions):
| | | | | | | | | | 2011 | | 2010 |
| Deferred tax assets | | | | | | | | | |
Employee benefit plans | | $ | 8,590 | | | $ | 9,482 | | $ | 8,189 |
| | $ | 6,332 |
|
Net operating loss carryforwards | | | 1,901 | | | | 7,083 | | 3,163 |
| | 4,124 |
|
Tax credit carryforwards | | | 2,941 | | | | 2,520 | | 4,534 |
| | 4,546 |
|
Research expenditures | | | 2,477 | | | | 277 | | 2,297 |
| | 2,336 |
|
Dealer and customer allowances and claims | | | 1,960 | | | | 1,873 | | 1,731 |
| | 1,428 |
|
Other foreign deferred tax assets | | | 5,291 | | | | 3,948 | | 694 |
| | 1,513 |
|
Allowance for credit losses | | | 1,771 | | | | 1,884 | | 194 |
| | 252 |
|
All other | | | 2,156 | | | | 1,899 | | 1,483 |
| | 2,839 |
|
Total gross deferred tax assets | | | 27,087 | | | | 28,966 | | 22,285 |
| | 23,370 |
|
Less: valuation allowance | | | (17,451 | ) | | | (17,268 | ) | |
| Less: valuation allowances | | (1,545 | ) | | (15,664 | ) |
Total net deferred tax assets | | | 9,636 | | | | 11,698 | | 20,740 |
| | 7,706 |
|
| Deferred tax liabilities | | | | | | | | | |
| | |
|
Leasing transactions | | | 2,245 | | | | 3,206 | | 932 |
| | 928 |
|
| Deferred income | | 2,098 |
| | 2,101 |
|
Depreciation and amortization (excluding leasing transactions) | | | 3,080 | | | | 2,890 | | 1,659 |
| | 1,146 |
|
Finance receivables | | | 515 | | | | 786 | | 551 |
| | 716 |
|
| Other foreign deferred tax liabilities | | 360 |
| | 334 |
|
All other | | | 2,731 | | | | 3,743 | | 711 |
| | 1,613 |
|
Total deferred tax liabilities | | | 8,571 | | | | 10,625 | | 6,311 |
| | 6,838 |
|
Net deferred tax assets/(liabilities) | | $ | 1,065 | | | $ | 1,073 | | $ | 14,429 |
| | $ | 868 |
|
Operating loss carryforwards for tax purposes were $5.8$8.5 billion at December 31, 2009.2011, resulting in a deferred tax asset of $3.2 billion. A substantial portion of these losses begin to expire in 2029; the remaining losses will begin to expire in 2018. Capital loss carryforwards for tax purposes were $465 million at December 31, 2009. Tax credits available to offset future tax liabilities are $2.9 billion.$4.5 billion. A substantial portion of these credits have a remaining carryforward period of 10 years or more. Tax benefits of operating loss and tax credit carryforwards are evaluated on an ongoing basis, including a review of historical and projected future operating results, the eligible carryforward period, and other circumstances.
Effective September 30, 2006, the balance of deferred taxes primarily at our U.S. entities has changed from a net deferred tax liability position to a net deferred tax asset position. Due to the cumulative losses we have incurred at these operations and their near-term financial outlook, at December 31, 2009 we have a valuation allowance of $17.5 billion against the net deferred tax asset.
FORD MOTOR COMPANY AND SUBSIDIARIES
NOTES TO THE FINANCIAL STATEMENTS
NOTE 23.22. INCOME TAXES(Continued)
Tax Benefits Preservation Plan
On September 11, 2009, our Board of Directors adopted a tax benefit preservation plan designed to preserve shareholder value and the value of certain tax assets including net operating losses, capital losses, and tax credit carryforwards ("Tax Attributes"). At December 31, 2009, we had Tax Attributes that would offset $17 billion of U.S. taxable income. Our ability to use these Tax Attributes would be substantially limited if there were an "ownership change" as defined under Section 382 of the Internal Revenue Code. In general, an ownership change would occur if 5-percent shareholders (as defined under U.S. federal income tax laws) collectively increase their ownership in Ford by more than 50 percentage points over a rolling three-year period.
In connection with the tax benefit preservation plan, our Board of Directors declared a dividend of one preferred share purchase right for each share of Ford Common Stock and Class B Stock outstanding as of the close of business on September 25, 2009. In accordance with the Plan, shares held by any person who acquires, without the approval of our Board of Directors, beneficial ownership of 4.99% or more of outstanding Ford Common Stock (including any ownership interest held by that person's affiliates and associates as defined under the tax benefit preservation plan) could be subject to significant dilution.
Other
We adopted the provisions of the accounting standard for uncertainty in income taxes on January 1, 2007. As a result of its implementation, we recorded an increase of $1.3 billion to Retained earnings.
A reconciliation of the beginning and ending amount of unrecognized tax benefits is as follows for the years listed (in millions):
| | | | | | | | | | 2011 | | 2010 |
Balance at January 1 | | $ | 1,898 | | | $ | 1,810 | | $ | 1,063 |
| | $ | 1,173 |
|
Increase – tax positions in prior periods | | | 282 | | | | 416 | | |
| Increase – tax positions in prior periods | | 1,045 |
| | 138 |
|
| Increase – tax positions in current period | | | 55 | | | | 64 | | 59 |
| | 52 |
|
| Decrease – tax positions in prior periods | | | (213 | ) | | | (38 | ) | (134 | ) | | (141 | ) |
Settlements | | | (836 | ) | | | (235 | ) | (186 | ) | | (109 | ) |
Lapse of statute of limitations | | | (37 | ) | | | (23 | ) | (21 | ) | | (29 | ) |
Foreign currency translation adjustment | | | 24 | | | | (96 | ) | (8 | ) | | (21 | ) |
Balance at December 31 | | $ | 1,173 | | | $ | 1,898 | | $ | 1,818 |
| | $ | 1,063 |
|
The amount of unrecognized tax benefits at December 31, 20092011 and 20082010 that would affect the effective tax rate if recognized was $745$1.2 billion and $510 million and $964 million,, respectively.
The U.S. and Canadian governments have reached agreement on our transfer pricing methodologies. The agreement covers a number of years and has resulted in a favorable impact to the income tax provision of $196 million in 2009 after the impact of valuation allowances, primarily resulting from the refund of prior Canadian tax payments.
Examinations by tax authorities have been completed through 19992005 in Germany, 2001and through 2007 in Sweden, 2004 in Canada, 2005 in the United States, and 2006 in the United Kingdom. Although examinations have been completed in these jurisdictions, various unresolved transfer pricing disputes exist for years dating back to 1994.
During 2009 and 2008, weWe recorded in our consolidated statement of operations approximately $54$77 million, $45 million, and $69$54 million in tax relatedtax-related interest income respectively.for the years ended December 31, 2011, 2010, and 2009. As of December 31, 20092011 and 2008,2010, we had recorded a net payable of $38$171 million and a net receivable of $177$77 million, respectively, for tax-related interest.
FORD MOTOR COMPANY AND SUBSIDIARIES
NOTES TO THE FINANCIAL STATEMENTS
NOTE 24.23. HELD-FOR-SALE OPERATIONS, DISCONTINUED OPERATIONS, OTHER DISPOSITIONS, AND ACQUISITIONS
We classify disposal groupsassets and liabilities as held for sale ("disposal group") when management, having the authority to approve the action, commits to a plan to sell the disposal group, the sale is probable within one year, and the disposal group is available for immediate sale in its present condition. We also consider whether an active program to locate a buyer has been initiated, whether the disposal group is marketed actively for sale at a price that is reasonable in relation to its current fair value, and whether actions required to complete the plan indicate that it is unlikely that significant changes to the plan will be made or that the plan will be withdrawn. We classify a disposal groupsgroup as a discontinued operationsoperation when the criteria to be classified as held for sale have been met and we will not have any significant involvement with the disposal groupsgroup after the sale.
We perform an impairmentWhen we classify a disposal group as held for sale, we test on disposal groups.for impairment. An impairment charge is recognized when the carrying value of the disposal group exceeds the estimated fair value, less transaction costs. We estimate fair value under the market approach to approximate the expected proceeds to be received.
We are required by U.S. GAAP to aggregate the assets and liabilities of all held-for-sale disposal groups on the balance sheet for the period in which the disposal group is held for sale. To provide comparative balance sheets, we also aggregate the assets and liabilities for significant held-for-sale disposal groups on the prior-period balance sheet.
Automotive Sector
Held-for-Sale Operations
Ford Russia.Volvo. In the fourthsecond quarter of 2008,2011, we performed annual goodwill impairment testing for our Volvo reporting unit. We comparedsigned an agreement with Sollers OJSC ("Sollers") establishing a 50/50 joint venture in Russia, FordSollers, and classified the carrying valueassets and liabilities of our Volvo reporting unit to its fair value, and concluded that the goodwill was not impaired. We performed this measurement relying primarily on the income approach, applying a discounted cash flow methodology. Our valuation was based on an in-use premise which considered a discount rate, after-tax return on sales rate, growth rate, and terminal value consistent with assumptions we believed principal market participants (i.e., other global automotive manufacturers) would use. This methodology produced appropriate valuations for entities we disposed ofoperations in recent years; in light of worsening economic conditions, however, we also considered other valuations, including a discounted cash flow analysis using more conservative assumptions than we initially used. This alternative analysis incorporated a significantly higher discount rate, offset partially by a higher growth rate; a much lower after-tax return on sales rate; and a lower terminal value. This alternative analysis reduced the valuation of our Volvo reporting unit by about 50%. Even this more conservative analysis, however, did not support an impairment of Volvo goodwill at year end.
As previously disclosed, in recent years we have undertaken efforts to divest non-core assets in order to allow us to focus exclusively on our global Ford brand. Toward that end, in 2007 we sold our interest in Aston Martin; in 2008, we sold our interest in our Jaguar Land Rover operations, and a significant portion of our ownership in Mazda. During the first quarter of 2009, based on our strategic review of Volvo and in light of our goal to focus on the global Ford brand, our Board of Directors committed to actively market Volvo for sale, notwithstanding the current distressed market for automotive-related assets. Accordingly, in the first quarter of 2009 we reported VolvoRussia as held for sale and we ceasedsuspended depreciation of its long-lived assetsand amortization on those assets. A joint application by Ford and Sollers to the Russian government for participation in the second quarternew industrial assembly regime, which will qualify the joint venture for reduced import duties for parts imported into Russia, was approved by the Ministry of 2009.
Our commitment to actively market Volvo for sale also triggered a held-for-sale impairment test in the first quarter of 2009. We received information from our discussions with potential buyers that provided us a value for Volvo using a market approach, rather than an income approach. We concluded that the information we received from our discussions with potential buyers was more representative of the value of Volvo given the current market conditions, the characteristics of viable market participants,Economic Development and our anticipation of a more immediate transaction for Volvo. These inputs resulted in a lower value for Volvo than the discounted cash flow method we had previously used.
After considering deferred gains reported in Accumulated other comprehensive income/(loss), we recognized a pre-tax impairment charge of $650 million related to our total investment in Volvo. The impairment was recorded in Automotive cost of sales for the first quarter of 2009.Trade on June 1, 2011.
Had we not committed to actively market Volvo for sale, we would not have been afforded the benefit of the new information obtained in discussions with potential buyers. Rather, we would have continued to employ an in-use premise to test Volvo's goodwill and long-lived assets, using a discounted cash flow methodology with assumptions similar to those we used at year-end 2008.
FORD MOTOR COMPANY AND SUBSIDIARIES
NOTES TO THE FINANCIAL STATEMENTS
NOTE 24.23. HELD-FOR-SALE OPERATIONS, DISCONTINUED OPERATIONS, OTHER DISPOSITIONS, AND ACQUISITIONS(Continued)
On October 1, 2011, we contributed our wholly-owned operations in Russia, consisting primarily of a manufacturing plant near St. Petersburg and access to our Russian dealership network to the joint venture. Additionally, we entered into an agreement with FordSollers for the granting of an exclusive right to manufacture, assemble, and distribute certain Ford-brand vehicles in Russia through the licensing of certain trademarks and intellectual property rights. Sollers contributed two production facilities. The joint venture will be engaged in the manufacturing and distribution of a range of Ford passenger cars and light commercial vehicles in Russia. As part of our ongoing relationship with FordSollers, we will supply parts and other vehicle components to the joint venture and receive a royalty of five percent of the joint venture's net sales revenue.
The assets and liabilities of VolvoFord Russia that were classified as held for sale at December 31 arewere as follows:follows (in millions):
| | | | | | | |
| Assets | | | | | | |
Receivables | | $ | 440 | | | $ | 399 | |
Inventories | | | 1,276 | | | | 1,630 | |
Net property | | | 4,943 | | | | 4,422 | |
Goodwill | | | 1,241 | | | | 1,150 | |
Other intangibles | | | 204 | | | | 198 | |
Other assets | | | 469 | | | | 615 | |
Impairment of carrying value | | | (650 | ) | | | — | |
Total assets of the held-for-sale operations | | $ | 7,923 | | | $ | 8,414 | |
| Liabilities | | | | | | | | |
Payables | | $ | 1,982 | | | $ | 1,626 | |
Pension liabilities | | | 387 | | | | 560 | |
Warranty liabilities | | | 358 | | | | 494 | |
Other liabilities | | | 2,629 | | | | 2,807 | |
Total liabilities of the held-for-sale operations | | $ | 5,356 | | | $ | 5,487 | |
|
| | | |
| | October 1, 2011 |
| Assets | |
| Cash and cash equivalents | $ | 69 |
|
| Receivables | 54 |
|
| Inventories | 145 |
|
| Net property | 221 |
|
| Other assets | 13 |
|
| Total assets of held-for-sale operations | $ | 502 |
|
| Liabilities | |
| Trade payables | $ | 222 |
|
| Other payables | 5 |
|
| Accrued liabilities | 89 |
|
| Total liabilities of held-for-sale operations | $ | 316 |
|
Upon contribution of our wholly-owned operations in Russia to the joint venture in exchange for a Jaguar Land Rover.50% equity interest, we deconsolidated the assets and liabilities shown above, recorded an equity method investment in FordSollers at its fair value of $364 million, and recognized a pre-tax gain of $178 million attributable to the remeasurement of the retained investment to its fair value. In 2008,addition, we sold our Jaguar Land Rover operations. Wereceived cash proceeds of $174 million, recorded a note receivable in the amount of $133 million, recorded a payable of $27 million, and recognized loss in accumulated foreign currency adjustment of $57 million. The total pre-tax impairment chargegain of $421$401 million is reported in Automotive cost of sales and a pre-tax loss of $136 million reported in Automotive interest income and other non-operating income/(expense), net.
As partWe measured the fair value of our equity interest using the income approach. We used cash flows that were developed jointly by Ford and Sollers. The significant assumptions used in this transaction, we continue to supply Jaguar Land Rover with powertrains, stampings, and other vehicle components. We also provide transitional support, including engineering, information technology, accounting and other services. Ford Credit provided financing for Jaguar Land Rover dealers and customers during a transition period, which varied by market, for up to 12 months.approach included:
•Projected growth in the Russian automobile market;
•Reduced import duties on certain auto parts; and
A discount rate of 16% based on an appropriate weighted average cost of capital, adjusted for perceived business risks related to regulatory concerns, foreign exchange volatility, execution risk, and risk associated with the Russian automotive industry.
We, along with Sollers, pledged 100% of the shares in the joint venture to the State Corporation Bank for Development and Foreign Economic Operations - Vnesheconombank ("VEB") as collateral securing the joint venture's debt.
Dispositions
Automotive Components Holdings, LLC ("ACH") – Milan.. In 2008, we classifiedOn June 1, 2011, ACH completed the ACHlegal sale of its blow-molded fuel tank business located at its Milan plant which produces fuel tanks and bumper fascias, as held for sale. At that time,to Inergy Automotive Systems. As a pre-tax impairment chargeresult of $18 million was recorded, which represented the excessterms of net bookthe arrangement, the value of the held-for-sale assetsproperty remains on our balance sheet and is being amortized over the expected proceeds. Duringterm of the third quarter of 2008, deteriorating domestic economic and industry conditions significantly reduced the probability of this sale, and the Milan plant was subsequently reclassified as held and used. The pre-tax impairment charge continues to be reported in Automotive cost of sales.new supply agreement with Inergy Automotive.
Volvo. ACH – Converca. In 2007,On August 2, 2010, we completed the sale of Volvo and related assets to Zhejiang Geely Holding Group Company Limited ("Geely"). As agreed, Volvo retained or acquired certain assets used by Volvo, consisting principally of licenses to use certain intellectual property. During the ACH Converca plant tofirst quarter of 2011, the Linamar Corporation. The Converca plant, which produced power transfer units, was a component of ACH in Mexico. As a resultfinal true-up of the transaction, ACH reported apurchase price was adjusted upward by $9 million, lowering our pre-tax gainloss on the sale of $3to $14 million (net of transaction costs and liabilities assumed), reported in Automotive interest income and other non-operating income/(expense), net.
Aston Martin. In 2007, Ford and our subsidiary (at that time), Jaguar Cars Limited, completed the sale of our 100% interest in Aston Martin. As a result of the sale, we recognized a pre-tax gain of $181 million (net of transaction costs and working capital adjustments) reported in Automotive interest income and other non-operating income/(expense), net.
European dealerships. In 2007,As part of the agreement between Ford and Geely, we continue to supply Volvo with various vehicle components. Due to our subsidiary, FIECO Holdings GmbH, completed the sale of its interest in three European dealerships to MVC Automotive Group B.V. Ascontinued involvement with Volvo after separation, we did not classify Volvo as a result of the transaction, we recognized a pre-tax loss on the sale of $14 million (net of transaction costs and recognition of foreign currency translation adjustments) reported in Automotive interest income and other non-operating income/(expense), net.discontinued operation.
FORD MOTOR COMPANY AND SUBSIDIARIES
NOTES TO THE FINANCIAL STATEMENTS
NOTE 24.23. HELD-FOR-SALE OPERATIONS, DISCONTINUED OPERATIONS, OTHER DISPOSITIONS, AND ACQUISITIONS(Continued)
Discontinued Operations
Automotive Protection Corporation ("APCO"). In 2007, we completed the sale of APCO and realized a pre-tax gain of $51 million (net of transaction costs and working capital adjustments), reported in Income/(Loss) from discontinued operations. In the second quarter of 2009, we received additional proceeds related to the settlement of a state and local tax matter that was unresolved at the time of sale and recognized an after-tax gain of $3 million in Income/(Loss) from discontinued operations.
The results of all discontinued Automotive sector operations are as follows (in millions):
| | | | | | | | | | |
Sales | | $ | — | | | $ | — | | | $ | 13 | |
| | | | | | | | | | | | | |
Operating income/(loss) from discontinued operations | | $ | — | | | $ | — | | | $ | 2 | |
Gain/(Loss) on discontinued operations | | | 3 | | | | — | | | | 51 | |
(Provision for)/Benefit from income taxes | | | — | | | | — | | | | (18 | ) |
Income/(Loss) from discontinued operations | | $ | 3 | | | $ | — | | | $ | 35 | |
Other Dispositions
Progress Ford Sales Limited ("PFS").In the second quarter of 2009, PFS was liquidated. As a result, we recognized in Automotive cost of salesa $281$281 million foreign exchange translation loss previously deferred in Accumulated other comprehensive income/(loss).
NuCellSys. In 2009, we reached an agreement with Daimler AG ("Daimler") to sell our entire ownership interest in NuCellSys to Daimler. NuCellSys was a joint venture created by Ford and Daimler in 2005 for research into and development and manufacture of fuel cell systems. As a result of the sale, we recognized a loss of $29$29 million in Automotive interest income and other non-operating income/(expense), net.
ACH – Glass. In 2008, we completed the sale of the ACH glass business to Zeledyne, LLC ("Zeledyne"). As a result of this transaction, we recognized a pre-tax loss of $285 million reported in Automotive interest income and other non-operating income/(expense), net. During the third quarter of 2008, the sale agreement between Ford and Zeledyne was amended resulting in an additional $19 million pre-tax loss reported in Automotive interest income and other non-operating income/(expense), net. With this, our pre-tax loss was $304 million.
Ballard Power Systems, Inc. ("Ballard"). In 2008, we reached an agreement with Ballard to exchange our entire ownership interest of 12.9 million shares of Ballard stock for a 30% equity interest in AFCC along with $22 million in cash. AFCC is a joint venture between Ford (30%), Daimler (50.1%) and Ballard (19.9%) that was created for the development of automotive fuel cells. We also have agreed to purchase from Ballard its 19.9% equity interest for $65 million plus interest within five years. As a result of the exchange, we recognized in Automotive cost of sales a pre-tax loss of $70 million. Our investment in AFCC is reported in Equity in net assets of affiliated companies.
Thai-Swedish Assembly Group ("TSA"). In 2008, Ford and our subsidiary, Volvo Car Corporation, completed the sale of TSA to Volvo Holding Sverige, AB (an unrelated company, aka Volvo Truck and Bus (Thailand) Co., Ltd.). Under the terms of the agreement, we sold $14 million of net assets and received $24 million in gross proceeds. We recognized a pre-tax gain of $12 million (including $2 million of foreign currency translation adjustments) in Automotive interest income and other non-operating income/(expense), net.
ACH – El Jarudo. In 2007, we completed the sale of the ACH El Jarudo plant to Cooper-Standard Automotive Inc. The El Jarudo plant, which produced fuel rails, fuel charging assemblies, and spring lock connectors, was a component of ACH in Mexico. As a result of the sale, we recognized a de minimis pre-tax loss, reported in Automotive interest income and other non-operating income/(expense), net.
FORD MOTOR COMPANY AND SUBSIDIARIES
NOTES TO THE FINANCIAL STATEMENTS
NOTE 24. HELD-FOR-SALE OPERATIONS, DISCONTINUED OPERATIONS, OTHER DISPOSITIONS, AND ACQUISITIONS (Continued)
Acquisitions
CPF. On March 15, 2011, we acquired the remaining interest in CPF, formerly Tekfor Cologne GmbH. CPF was a 50/50 joint venture with Neumayer Tekfor GmbH which previously was consolidated as a VIE. For additional discussion on the CPF acquisition, see Note 13.
ACSA. In 2008, we acquired 72.4% of the shares of ACSA, a Romanian carmaker located in Craiova, from Romania's Authority for State Assets Recovery ("AVAS") for $87 million. In 2009,. During 2010 we increased our ownership percentage to 97.1%completed the acquisition of the remaining minority interest, and to date, have invested now own €100%250 million into of ACSA.
We manage the day-to-day operations at ACSA and its subsidiary, Ford Romania towardsS.A. However, as a result of the committed spend of €675 million over a four-year period as outlinedcontractual commitments in the Salesale and Purchase Agreementpurchase agreement, the Romanian government maintains the ability to influence certain key decisions regarding the business until March 2012. For example, during this period the Romanian government has the ability to influence the following:
Implementation of the business plan, including investment and strategic decisions to achieve minimum vehicle production levels;
The minimum level of full-time employees used in automobile production;
Capital expenditure and investment levels, including environmental protection improvements; and
Completion of restructuring plans requiring us to return non-core assets to the Romanian government.
We have been in discussions with the Romanian government. We plangovernment to fulfill our outstanding investment obligationrenegotiate some of €425 million ($593 million) over the next three years and acquireterms of the remaining minority shareholder's equity interest. Based onagreement, including an extension of the continuing significance of AVAS' control and participation in the operations of ACSA during the four-year investment period, our investment is reflected in Equity in net assets of affiliated companies.agreement to January 2013. We anticipate that we will consolidate the operations upon the cessation of AVAS' control and participation in the operations.operations by AVAS.
Financial Services Sector
Held-for-Sale Operations
Held-for-Sale Finance Receivables.During the third quarter of 2009, Ford Credit reclassified toclassified Assets of held-for-sale operations$911 million $911 million of Ford Credit Australia held-for-investment finance receivables as held for sale that it no longer had the intent to hold for the foreseeable future or until maturity or payoff. AWe recorded a valuation allowance of $52$52 million was recorded in Financial Services other income/(loss), net related to these assets. The receivables were sold on October 1, 2009.
Dispositions
Asia Pacific Markets.Primus Leasing Company Limited ("Primus Thailand"). In March 2009,2011, Ford Credit completedrecorded foreign currency translation adjustments of $60 million (including $72 million recorded in the salefourth quarter of Primus Thailand, its operation in Thailand that offered automotive2011), related to the strategic decision to exit retail and wholesale financing of Ford, Mazdain certain Asia Pacific markets. These adjustments decreased Accumulated other comprehensive income (foreign currency translation) and Volvo vehicles. As a result of the sale, Ford Credit received $165 million in proceeds and recognized a de minimisincreased pre-tax gain in income, which was recorded to Financial Services other income/(loss), net.loss, net.
The assets and liabilities of Primus Thailand classified as held for sale at December 31, 2008 are summarized as follows (in millions):
| | | | |
| Assets | | | |
Finance receivables, net | | $ | 194 | |
Other assets | | | 4 | |
Total assets of the held-for-sale operations | | $ | 198 | |
| | | | | |
| Liabilities | | | | |
Accounts payable | | $ | 13 | |
Debt | | | 41 | |
Other liabilities | | | 1 | |
Total liabilities of the held-for-sale operations | | $ | 55 | |
Discontinued Operations
Triad Financial Corporation ("Triad"). In 2005, Ford Credit completed the sale of Triad. Ford Credit received additional proceeds pursuant to a contractual agreement entered into at the closing of the sale, causing Ford Credit to recognize an after-tax gain of $2 million, $9 million and $6 million in 2009, 2008 and 2007, respectively, in Income/(Loss) from discontinued operations.
The results of all discontinued Financial Services sector operations are as follows (in millions):
| | | | | | | | | | |
Operating income/(loss) from discontinued operations | | $ | — | | | $ | — | | | $ | — | |
Gain/(Loss) on discontinued operations | | | 3 | | | | 15 | | | | 10 | |
(Provision for)/Benefit from income taxes | | | (1 | ) | | | (6 | ) | | | (4 | ) |
Income/(Loss) from discontinued operations | | $ | 2 | | | $ | 9 | | | $ | 6 | |
FORD MOTOR COMPANY AND SUBSIDIARIES
NOTES TO THE FINANCIAL STATEMENTS
NOTE 24. HELD-FOR-SALE OPERATIONS, DISCONTINUED OPERATIONS, OTHER DISPOSITIONS, AND ACQUISITIONS (Continued)
Other Dispositions
Nordic Operations. In 2008, Ford Credit completed the creation of a joint venture finance company and transferred the majority of its business and assets from Denmark, Finland, Norway, and Sweden into the joint venture. The joint venture will support the sale of Ford vehicles in these markets. As a result of the sale, we reduced Finance receivables, net by $1.7 billion, and recognized a pre-tax gain of $85 million (net of transaction costs and including $35 million of foreign currency translation adjustments) in Financial Services other income/(loss), net. Ford Credit reports its ownership interest in the joint venture as an equity method investment.
PRIMUS Financial Services Inc. ("PRIMUS Japan"). In 2008, Ford Credit completed the sale of 96% of its ownership interest in PRIMUS Japan, its operation in Japan that offered automotive retail and wholesale financing of Ford and Mazda vehicles. As a result of the sale, we reduced Finance receivables, net by $1.8 billion, reduced Debt by $252 million, and recognized a pre-tax gain of $22 million (net of transaction costs and including $28 million of foreign currency translation adjustments) in Financial Services other income/(loss), net. Ford Credit reports its remaining ownership interest as a cost method investment.
Primus Finance and Leasing, Inc. ("Primus Philippines"). In 2008, Ford Credit completed the sale of its 60% ownership interest in Primus Philippines, its operation in the Philippines that offered automotive retail and wholesale financing of Ford and Mazda vehicles. Ford Credit also completed the sale of its 40% ownership interest in PFL Holdings, Inc., a holding company in the Philippines that owned the remaining 40% ownership interest in Primus Philippines. As a result of the sale, we recognized a pre-tax gain of $5 million (net of transaction costs and including $1 million of foreign currency translation adjustments) in Financial Services other income/(loss), net.
NOTE 25. CAPITAL STOCK AND AMOUNTS PER SHARE
Capital Stock. All general voting power is vested in the holders of Common Stock and Class B Stock. Holders of our Common Stock have 60% of the general voting power and holders of our Class B Stock are entitled to such number of votes per share as will give them the remaining 40%. Shares of Common Stock and Class B Stock share equally in dividends when and as paid, with stock dividends payable in shares of stock of the class held. As discussed in Note 19, we are restricted in ourOur ability to pay dividends (other than dividends payable in stock) is subject to certain limits under the terms of the amendedour Credit Agreement.Agreement, which is discussed in more detail in Note 18.
If liquidated, each share of Common Stock will be entitled to the first $0.50$0.50 available for distribution to holders of Common Stock and Class B Stock, each share of Class B Stock will be entitled to the next $1.00$1.00 so available, each share of Common Stock will be entitled to the next $0.50$0.50 so available and each share of Common and Class B Stock will be entitled to an equal amount thereafter.
Earnings Per Share. We calculatepresent both basic and diluted earnings per share on a basic and on a diluted basis. Basic earnings per share measures("EPS") amounts in our performance over the reporting period. The numerator of our basic earnings per share calculationfinancial reporting. EPS is ourcomputed independently each quarter for income from continuing operations, income/(loss) from discontinued operations, and net income; as a result, the sum of per-share amounts from continuing operations attributableand discontinued operations may not equal the total per-share amount for net earnings. Basic EPS excludes dilution and is computed by dividing income available to Ford Motor CompanyCommon and Class B Stock holders by the denominator is the average sharesweighted-average number of Common and Class B Stock outstanding for the period. Diluted earnings per share measuresEPS, on the other hand, reflects the maximum potential dilution that could occur if all our performance over the reporting period (less restrictedequity-linked securities and uncommitted ESOP shares), while giving effect to all dilutive potential common shares that were outstanding during the period. The dilutive earnings per share calculation adjusts the basic calculation by the dilutive effect of potential Common Stock (securities such asother share-based compensation, including stock options, warrants, and rights under our convertible securities, and contingent stock agreements). Each individual type of potential Common Stock is evaluated for itsnotes, were exercised. Potential dilutive effect. If a security is determined to be dilutive, income/(loss) from continuing operations attributable to Ford Motor Company is then adjusted by the interest expense, amortization of discount, amortization of fees, and other changes in income or loss that would resultshares are excluded from the assumed conversion. The number of average shares outstanding is adjusted by the number of shares this conversion would create. A security that is shown to be antidilutive would not be includedcalculation if they have an anti-dilutive effect in the diluted earnings per share calculation.
FORD MOTOR COMPANY AND SUBSIDIARIES
NOTES TO THE FINANCIAL STATEMENTS
NOTE 25. CAPITAL STOCK AND AMOUNTS PER SHARE (Continued)period.
Convertible Securities
As discussed in Note 19, Trust Preferred Securities18, 2016 Convertible Notes with an aggregate liquidation preferencea principal amount of $2.8 billion are outstanding at December 31, 2009. In the first quarter of 2009, holders of 862,889 Trust Preferred Securities with an aggregate liquidation preference of $43$883 million elected to convert such securities into an aggregate 2,437,562 shares of Ford Common Stock. In the third quarter of 2007, holders of 42,543,071 Trust Preferred Securities with an aggregate liquidation preference of $2.1 billion elected to convert such securities into an aggregate 194,494,157 shares of Ford Common Stock. At the option of the holder, each Trust Preferred Security is convertible, at any time on or before January 15, 2032, into shares of our Common Stock at a rate of 2.8769 shares for each Trust Preferred Security (equivalent to a conversion price of $17.38 per share). Conversion of all shares of such Trust Preferred Securities would result in the issuance of 163 million shares of our Common Stock.
As discussed in Note 19, and 2036 Convertible Notes with a principal amount of $579$25 million are were each outstanding at December 31, 2009. In2011.
Subject to certain limitations relating to the second quarterprice of 2009, $4.3 billionour Common Stock, at the option of the holder, each 2016 Convertible Note is convertible on or before November 16, 2016, into shares of Common Stock at a rate of 107.5269 shares per $1,000 principal amount of 20362016 Convertible Note (equivalent to a conversion price of $9.30 per share). Conversion of all remaining shares of 2016 Convertible Notes was exchanged for an aggregatewould result in the issuance of 467,909,227about 95 million shares of Fordour Common Stock, $344 million in cash ($80 in cash per $1,000 principal amount of 2036 Convertible Notes exchanged) and the applicable accrued and unpaid interest on such 2036 Convertible Notes. In the fourth quarter of 2008, $67 million principal amount of 2036 Convertible Notes was exchanged for an aggregate of 7,253,035 shares of Ford Common Stock.
At the option of the holder, each 2036 Convertible Note is convertible at any time on or before December 15, 2036, into shares of Ford Common Stock at a rate of 108.6957 shares per $1,000$1,000 principal amount of Convertible Notes (equivalent to a conversion price of $9.20$9.20 per share). Conversion of all remaining shares of 2036 Convertible Notes would result in the issuance of 63about 2.7 million shares of our Common Stock.
As discussed in Note 19, 2016 Convertible NotesWarrants
In conjunction with a principal amountthe transfer of $2.9 billion are outstanding atassets to the UAW VEBA Trust on December 31, 2009. At the option of the holder, each 2016 Convertible Note is convertible at any time on or before November 16, 2016, into2009, we issued warrants to purchase 362,391,305 shares of Ford Common Stock at a rate of 107.5269 shares per $1,000 principal amount of 2016 Convertible Note (equivalent to a conversionan exercise price of $9.30$9.20 per share). Conversionshare. On April 6, 2010, the UAW VEBA Trust sold all such warrants to parties unrelated to us. In connection with the sale, the terms of allthe warrants were modified to provide for, among other things, net share settlement as the only permitted settlement method thereby eliminating full physical settlement as an option, and elimination of certain of the transfer restrictions applicable to the underlying stock. We received no proceeds from the offering. All warrants are fully exercisable and expire January 1, 2013. The net dilutive effect for warrants, shown below, includes approximately 111 million dilutive shares for 2011, representing the net share settlement methodology for the 362 million warrants outstanding as of
December 31, 2011.
Dividend Reinstatement
On December 8, 2011, our Board of Directors declared a dividend on our Common and Class B Stock of $0.05 per share payable on March 1, 2012, to stockholders of record on January 31, 2012. Accordingly, we recorded a reduction to retained earnings of $190 million in the fourth quarter of 2011.
FORD MOTOR COMPANY AND SUBSIDIARIES
NOTES TO THE FINANCIAL STATEMENTS
NOTE 24. CAPITAL STOCK AND AMOUNTS PER SHARE (Continued)
Dividends will affect our diluted earnings per share calculation because they likely will cause an adjustment to the conversion and exercise prices of our outstanding convertible debt securities and warrants described above. Pursuant to the terms of these securities, the conversion and exercise prices will be adjusted (i) when dividends on our Common and Class B stock are paid in a sufficient amount so as to trigger a 1 percent or greater change in the conversion and/or exercise prices or (ii) on the anniversary date of issuance of those securities -- November 9, 2012 for the 2016 Convertible Notes, would resultDecember 15, 2012 for the 2036 Convertible Notes, and December 11, 2012 for the warrants, whichever occurs first. At that time we will adjust the exercise price in the issuancecalculation of 309 millionthe additional dilutive shares offor our Common Stock.convertible debt and for warrants.
Other Transactions Related to Capital Stock
In the fourth quarter of 2007, we issued an aggregate of 62,000,761 shares of Ford Common Stock in exchange for $567 million principal amount of our public unsecured debt securities.
As described in Note 19, during the first half of 2008, we issued an aggregate of 46,437,906 shares of Ford Common Stock in exchange for $431 million principal amount of our outstanding public unsecured debt securities.
On May 18, 2009, we issued 345,000,000345 million shares of Ford Common Stock pursuant to a public offering at a price of $4.75$4.75 per share, resulting in total gross proceeds of $1.6 billion.$1.6 billion.
As discussed in Note 1,18, we issued shares of Ford Common Stock from time to time pursuant to an equity distribution agreement in market transactions and used the proceeds to purchase outstanding Ford Credit debt securities maturing prior to 2012. In the second halfthird quarter of 2008,2009, we issued 88,325,37271,587,743 shares of Ford Common Stock resulting in proceeds of $434 million. In the third quarter of 2009, we issued 71,587,743 shares of Ford Common Stock resulting in proceeds of $565 million.$565 million.
On December 4, 2009, we entered into a newan equity distribution agreement with certain broker-dealers pursuant to which we may offeroffered and sellsold shares of Ford Common Stock from time to time for an aggregate offering price of up to $1 billion.time. Sales of Ford Common Stock under this equity distribution agreement are expected to be made over a several-month period by means of ordinary brokers’ transactions on the New York Stock Exchange at market prices or as otherwise agreed. Through December 31, 2009 and February 15, 2010,were completed in September 2010. Under this agreement we issued 9,840,42985.8 million shares and 41,896,329 shares of Ford Common Stock for an aggregate price of $97$1 billion, with 75.9 million and $470 million, respectively, resulting in net proceeds of $96 million and $466 million, respectively, which will be used for general corporate purposes.
FORD MOTOR COMPANY AND SUBSIDIARIES
NOTES TO THE FINANCIAL STATEMENTS
NOTE 25. CAPITAL STOCK AND AMOUNTS PER SHARE (Continued)
Tax Benefits Preservation Plan
For information regarding our Tax Benefits Preservation Plan, see Note 23.
Warrants
In conjunction with the transfer of assets to the UAW VEBA Trust on December 31, 2009, warrants to purchase 362,391,305 shares of Ford Common Stock atfor an exerciseaggregate price of $9.20 per share were issued. The warrants expire on January 1, 2013.$903 million issued in 2010.
Amounts Per Share Attributable to Ford Motor Company Common and Class B Stock
Basic and diluted income/(loss) per share were calculated using the following (in millions):
| | | | | | | | | | | | | 2011 | | 2010 | | 2009 |
| Basic and Diluted Income/(Loss) Attributable to Ford Motor Company | | | | | | | | | | | | | | |
Basic income/(loss) from continuing operations | | $ | 2,712 | | | $ | (14,775 | ) | | $ | (2,836 | ) | $ | 20,213 |
| | $ | 6,561 |
| | $ | 2,712 |
|
Effect of dilutive 2016 Convertible Notes (a) | | | 27 | | | | — | | | | — | | 64 |
| | 173 |
| | 27 |
|
Effect of dilutive 2036 Convertible Notes (a)(b) | | | 119 | | | | — | | | | — | | |
Effect of dilutive Trust Preferred Securities (a)(c) | | | — | | | | — | | | | — | | |
| Effect of dilutive 2036 Convertible Notes (a) | | 2 |
| | 37 |
| | 119 |
|
| Effect of dilutive Trust Preferred Securities (a) (b) (c) | | 40 |
| | 182 |
| | — |
|
Diluted income/(loss) from continuing operations | | $ | 2,858 | | | $ | (14,775 | ) | | $ | (2,836 | ) | $ | 20,319 |
| | $ | 6,953 |
| | $ | 2,858 |
|
| | | | | | | | | | | | | | | | | | |
| Basic and Diluted Shares | | | | | | | | | | | | | |
| | |
| | |
Average shares outstanding | | | 2,992 | | | | 2,273 | | | | 1,979 | | 3,793 |
| | 3,449 |
| | 2,992 |
|
Restricted and uncommitted-ESOP shares | | | (1 | ) | | | (1 | ) | | | (1 | ) | — |
| | — |
| | (1 | ) |
Basic shares | | | 2,991 | | | | 2,272 | | | | 1,978 | | 3,793 |
| | 3,449 |
| | 2,991 |
|
| Net dilutive options, warrants, and restricted and uncommitted-ESOP shares (d) | | | 87 | | | | — | | | | — | | |
| Net dilutive options and warrants | | 187 |
| | 217 |
| | 87 |
|
Dilutive 2016 Convertible Notes | | | 45 | | | | — | | | | — | | 95 |
| | 291 |
| | 45 |
|
Dilutive 2036 Convertible Notes (b) | | | 189 | | | | — | | | | — | | |
Dilutive Trust Preferred Securities (c) | | | — | | | | — | | | | — | | |
| Dilutive 2036 Convertible Notes | | 3 |
| | 58 |
| | 189 |
|
| Dilutive Trust Preferred Securities (b) (c) | | 33 |
| | 163 |
| | — |
|
Diluted shares | | | 3,312 | | | | 2,272 | | | | 1,978 | | 4,111 |
| | 4,178 |
| | 3,312 |
|
__________
| |
| (a) | As applicable, includes interest expense, amortization of discount, amortization of fees, and other changes in income or loss that would result from the assumed conversion. |
| |
| (b) | On March 15, 2011, the Trust Preferred Securities, which were convertible into Ford Common Stock, were fully redeemed and, as a result, for purposes of dilution effect, the full year average shares outstanding will reflect the Common Stock underlying the Trust Preferred Securities only through March 15. |
| |
| (c) | Not included in the calculation of diluted earnings per share due to their antidilutive effect: |
(b) | 537effect are million shares and 538 million shares for 2008 and 2007, respectively, and the related income effect for 2036 Convertible Notes.
|
(c) | 162 millionmillion shares, 162 million shares and 233 million shares for 2009 2008, and 2007, respectively, and the related income effect for Trust Preferred Securities. |
(d) | 27 million and 14 million contingently-issuable shares for 2008 and 2007.Securities.
|
FORD MOTOR COMPANY AND SUBSIDIARIES
NOTES TO THE FINANCIAL STATEMENTS
NOTE 26.25. DERIVATIVE FINANCIAL INSTRUMENTS AND HEDGING ACTIVITIES
In the normal course of business, our operations are exposed to global market risks, including the effect of changes in foreign currency exchange rates, certain commodity prices, and interest rates. To manage these risks, we enter into various derivatives contracts. contracts:
Foreign currency exchange contracts, including forwards and options, that are used to manage foreign exchange exposure. exposure;
Commodity contracts, including forwards and options, that are used to manage commodity price risk. risk;
Interest rate contracts including swaps, caps, and floors that are used to manage the effects of interest rate fluctuations. fluctuations; and
Cross-currency interest rate swap contracts that are used to manage foreign currency and interest rate exposures on foreign-denominated debt. The vast majority of our
Our derivatives are over-the-counter customized derivative transactions and are not exchange-traded. Management reviewsWe review our hedging program, derivative positions, and overall risk management strategy on a regular basis.
Derivative Financial Instruments and Hedge Accounting. All derivatives are recognized on the balance sheet at fair value. We do not net our derivative position by counterparty for purposes of balance sheet presentation and disclosure. We do, however, consider our net position for determining fair value.
We have elected to apply hedge accounting to certain derivatives. Derivatives that are designated in hedging relationships are evaluated for effectiveness using regression analysis at the time they are designated and throughout the hedge period. Cash flows and the profit impact associated with designated hedges are reported in the same category as the underlying hedged item.
Some derivatives do not qualify for hedge accounting; for others, we elect not to apply hedge accounting. Regardless, we only enter into transactions that we believe will be highly effective at offsetting the underlying economic risk.
Consistent with the FASB's new standard on disclosures for derivative instruments and hedging activities effective January 1, 2009, in this initial year of adoption, we have elected to not present earlier periods for comparative purposes.
Overall Derivative Financial Instruments and Hedge Accounting. All derivatives are recognized on the balance sheet at fair value. To ensure consistency in our treatment of derivative and non-derivative exposures with regard to our master agreements, we do not net our derivative position by counterparty for purposes of balance sheet presentation and disclosure.
We have elected to apply hedge accounting to certain derivatives in both the Automotive and Financial Services sectors; derivatives that receive designated hedge accounting treatment are documented and evaluated for effectiveness at the time they are designated, as well as throughout the hedge period. Cash flows associated with designated hedges are reported in the same category as the underlying hedged item.
Some derivatives do not qualify for hedge accounting; for others, we elect to not apply hedge accounting. We report changes in the fair value of derivatives not designated as hedging instruments through Automotive cost of sales, Automotive interest income and other non-operating income/(expense), net,or Financial Services other income/(loss), net depending on the sector and underlying exposure. Cash flows associated with non-designated or de-designated derivatives are reported in Net cash (used in)/provided by investing activities in our statements of cash flows.
Cash Flow Hedges. Our Automotive sector has designated certain forward and option contracts as cash flow hedges of forecasted transactions with exposure to foreign currency exchange and commodity price risks. During the second half of 2008, all foreign exchange forwards and options previously designated as cash flow hedges of forecasted transactions under critical terms match were de-designated and re-designated under the "long-haul" method using regression analysis to assess hedge effectiveness. Since 2007, we have had no commodity derivatives designated as cash flow hedges.risk.
The effective portion of changes in the fair value of cash flow hedges is deferred in Accumulated other comprehensive income/(loss) and is recognized in Automotive cost of sales when the hedged item affects earnings. The ineffective portion is reported currently in Automotive cost of sales. Our policy is to de-designate cash flow hedges prior to the time forecasted transactions are recognized as assets or liabilities on the balance sheet and report subsequent changes in fair value through Automotive cost of sales. If it becomes probable that the originally-forecasted transaction will not occur, the related amount also is reclassified from Accumulated other comprehensive income/(loss) and recognized in earnings. Our cash flow hedges mature within in two years or less.
Fair Value Hedges. Our Financial Services sector uses derivatives to reduce the risk of changes in the fair value of liabilities. We have designated certain receive-fixed, pay-float interest rate swaps as fair value hedges of fixed-rate debt under the "long haul" method of assessing effectiveness.debt. The risk being hedged is the risk of changes in the fair value of the hedged debt attributable to changes in the benchmark interest rate. We use regression analysis to assess hedge effectiveness. If the hedge relationship is deemed to be highly effective, we record the changes in the fair value of the hedged debt related to the risk being hedged in Financial Services debt with the offset in Financial Services other income/(loss), net.The change in fair value of the related derivative (excluding accrued interest) also is recorded in Financial Services other income/(loss), net. Hedge ineffectiveness, recorded directly in earnings, is the difference between the two amounts.change in fair value of the derivative and the change in the value of the hedged debt that is attributable to the changes in the benchmark interest rate.
FORD MOTOR COMPANY AND SUBSIDIARIES
NOTES TO THE FINANCIAL STATEMENTS
NOTE 25. DERIVATIVE FINANCIAL INSTRUMENTS AND HEDGING ACTIVITIES (Continued)
For our Financial Services sector, net interest settlements and accruals on fair value hedges are excluded from the assessment of hedge effectiveness. We report net interest settlements and accruals on fair value hedges in Interest expense, with the exception of foreign currency revaluation on accrued interest, which is reported in Selling, administrative, and other expenses. Ineffectiveness on fair value hedges and gains and losses on interest rate contracts not designated as hedging instruments are reported in Financial Services other income/(loss), net.Gains and losses on foreign exchange and cross-currency interest rate swap contracts not designated as hedging instruments are reported in Selling, administrative, and other expenses.
When a derivative is de-designated from a fair value hedge relationship,is de-designated, or when the derivative in a fair value hedge relationship is terminated before maturity, the fair value adjustment to the hedged debt continues to be reported as part of the carrying basisvalue of the itemdebt and is amortized over its remaining life.
Net Investment Hedges. We have used foreign currency exchange derivatives to hedge the net assets of certain foreign entities to offset the translation and economic exposures related to our investment in these entities. The effective portion of changes in the value of these derivativedesignated instruments is included in Accumulated other comprehensive income/(loss) as a foreign currency translation adjustment until the hedged investment is sold or liquidated. When the investment is sold or liquidated, the effective portion of the hedge isgains and losses previously reported in Accumulated other comprehensive income/(loss) are recognized in Automotive interest income and other non-operating income/(expense), net as part of the gain or loss on sale. WePresently, we have had no derivative instruments in an active foreign currency derivatives classified as net investment hedges sincehedging relationship. We have elected the first quarter of 2007.spot to spot method.
Normal Purchases and Normal Sales Classification. ForWe have elected to apply the normal purchases and normal sales classification for physical supply contracts that are entered into for the purpose of procuring commodities to be used in production over a reasonable period in the normal course of our business, we have elected to apply the normal purchases and normal sales classification.business.
FORD MOTOR COMPANY AND SUBSIDIARIES
NOTES TO THE FINANCIAL STATEMENTS
NOTE 25. DERIVATIVE FINANCIAL INSTRUMENTS AND HEDGING ACTIVITIES (Continued)
Income Effect of Derivative Instruments
The following table summarizestables summarize by hedge designation the pre-tax gains/(losses) recorded in Other comprehensive income/(loss) ("OCI"), reclassified from Accumulated other comprehensive income/(loss)(" ("AOCI") to income andand/or recognized directly in income (in millions):
| | | | | | | 2011 | | 2010 | | 2009 |
| | | Gain/(Loss) Recorded in OCI | | | Gain/(Loss) Reclassified from AOCI to Income | | | Gain/(Loss) Recognized in Income | | Gain/(Loss) Recorded in OCI | | Gain/(Loss) Reclassified from AOCI to Income | | Gain/(Loss) Recognized in Income | | Gain/(Loss) Recorded in OCI | | Gain/(Loss) Reclassified from AOCI to Income | | Gain/(Loss) Recognized in Income | | Gain/(Loss) Recorded in OCI | | Gain/(Loss) Reclassified from AOCI to Income | | Gain/(Loss) Recognized in Income |
| Automotive Sector | | | | | | | | | | | | | | | | | | | | | | | | | | |
| Designated Cash flow hedges: | | | | | | | | | | |
Foreign exchange contracts | | $ | (86 | ) | | $ | 37 | (a) | | $ | (1 | ) | |
| Cash flow hedges: | | | | | | | | | | | | | | | | | | |
| Foreign currency exchange contracts | | $ | (100 | ) | | $ | 119 |
| (a) | | $ | (3 | ) | | $ | (7 | ) | | $ | 17 |
| | $ | — |
| | $ | (86 | ) | | $ | 37 |
| (b) | | $ | (1 | ) |
Commodity contracts | | | — | | | | 4 | | | | — | | — |
| | — |
| | — |
| | — |
| | — |
| | — |
| | — |
| | 4 |
| | — |
|
Total | | $ | (86 | ) | | $ | 41 | | | $ | (1 | ) | $ | (100 | ) | | $ | 119 |
| | $ | (3 | ) | | $ | (7 | ) | | $ | 17 |
| | $ | — |
| | $ | (86 | ) | | $ | 41 |
| | $ | (1 | ) |
| Derivatives not designated as hedging instruments: | | | | | | | | | | | | | |
| | |
| | |
| | |
| | |
| | |
| | | | | | |
| Foreign exchange contracts – operating exposures (b) | | | | | | | | | | $ | (120 | ) | |
| Foreign exchange contracts – investment portfolios (c) | | | | | | | | | | | (11 | ) | |
| Foreign currency exchange contracts - operating exposures | | |
| | |
| | $ | 20 |
| | |
| | |
| | $ | (183 | ) | | | | | | $ | (120 | ) |
| Foreign currency exchange contracts - investment portfolios | | | | | | — |
| | | | | | — |
| | | | | | (11 | ) |
Commodity contracts | | | | | | | | | | | (4 | ) | |
| | |
| | (423 | ) | | |
| | |
| | 68 |
| | | | | | (4 | ) |
Other – interest rate contracts and warrants | | | | | | | | | | | (20 | ) | |
| Other – warrants | | |
| | |
| | (1 | ) | | |
| | |
| | 2 |
| | | | | | (12 | ) |
Total | | | | | | | | | | $ | (155 | ) | |
| | |
| | $ | (404 | ) | | |
| | |
| | $ | (113 | ) | | | | | | $ | (147 | ) |
| | | | | | | | | | | | | | | | | | | | | | | | | | | | | | |
| Financial Services Sector | | | | | | | | | | | | | |
| | |
| | |
| | |
| | |
| | |
| | | | | | |
| Fair value hedges: | | | | | | | | | | | | | |
| | |
| | |
| | |
| | |
| | |
| | | | | | |
| Interest rate contracts | | | | | | | | | | | | | |
| | |
| | |
| | |
| | |
| | |
| | | | | | |
| Net interest settlements and accruals excluded from the assessment of hedge effectiveness | | | | | | | | | | $ | 164 | | |
| | |
| | $ | 217 |
| | |
| | |
| | $ | 225 |
| | | | | | $ | 164 |
|
Ineffectiveness (d) | | | | | | | | | | | (13 | ) | |
| Ineffectiveness (c) | | |
| | |
| | (30 | ) | | |
| | |
| | (6 | ) | | | | | | (13 | ) |
Total | | | | | | | | | | $ | 151 | | |
| | |
| | $ | 187 |
| | |
| | |
| | $ | 219 |
| | | | | | $ | 151 |
|
| Derivatives not designated as hedging instruments: | | | | | | | | | | | | | |
| | |
| | |
| | |
| | |
| | |
| | | | | | |
Interest rate contracts | | | | | | | | | | $ | (63 | ) | |
| | |
| | $ | (5 | ) | | |
| | |
| | $ | 38 |
| | | | | | $ | (63 | ) |
Foreign exchange contracts (b) | | | | | | | | | | | (268 | ) | |
Cross currency interest rate swap contracts (b) | | | | | | | | | | | 12 | | |
| Foreign currency exchange contracts | | |
| | |
| | (48 | ) | | |
| | |
| | (88 | ) | | | | | | (268 | ) |
| Cross-currency interest rate swap contracts | | |
| | |
| | (3 | ) | | |
| | |
| | (1 | ) | | | | | | 12 |
|
| Other (d) | | |
| | |
| | 65 |
| | |
| | |
| | — |
| | | | | | — |
|
Total | | | | | | | | | | $ | (319 | ) | |
| | |
| | $ | 9 |
| | |
| | |
| | $ | (51 | ) | | | | | | $ | (319 | ) |
__________
| |
| (a) | Includes Include$3 millions $4 loss reclassified from AOCI to income in fourth quarter 2011 attributable to transactions no longer probable to occur, related to Ford of Thailand. |
| |
| (b) | Includes $4 million gain reclassified from AOCI to income in first quarter 2009 attributable to transactions no longer probable to occur, primarily related to Volvo. |
(b) | Gains/(Losses) related to foreign currency derivatives were partially offset by net revaluation impacts on foreign denominated assets and liabilities, which were recorded to the same statement of operations line item as the derivative gains/(losses). |
| (c) | Foreign exchange contracts – investment portfolios on the balance sheet were $0 at December 31, 2009. |
(d) | HedgeFor 2011, 2010 and 2009, hedge ineffectiveness reflects change in fair value on derivatives of $433 million gain, $117 million gain, and $46 million loss, respectively, and change in fair value on hedged debt of $33$463 million loss, $123 million loss, and $33 million gain, in 2009.respectively.
|
| |
| (d) | Reflects gains/(losses) for derivative features included in the FUEL notes (see Note 4). |
In 2010, a net gain of $7 million of foreign currency translation on net investment hedges was transferred from Accumulated other comprehensive income/(loss) to earnings due to the sale of investments in foreign affiliates.
FORD MOTOR COMPANY AND SUBSIDIARIES
NOTES TO THE FINANCIAL STATEMENTS
NOTE 26.25. DERIVATIVE FINANCIAL INSTRUMENTS AND HEDGING ACTIVITIES (Continued)
For our Automotive sector, we report in Automotive cost of sales on our consolidated statement of operations gains and losses on cash flow hedges and foreign exchange contracts on operating exposures and commodity contracts not designated as hedging instruments. Gains and losses on foreign exchange contracts on investment portfolios and other contracts not designated as hedging instruments are reported in Automotive interest income and other non-operating income/(expense), net.
For our Financial Services sector, we report net interest settlements and accruals on fair value hedges (which are excluded from the assessment of hedge effectiveness) in Interest expense on our consolidated statement of operations, with the exception of foreign currency revaluation on accrued interest ($2 million gain in 2009) which is reported in Selling, administrative, and other expenses. Ineffectiveness on fair value hedges and gains and losses on interest rate contracts not designated as hedging instruments are reported in Financial Services other income/(loss), net. Gains and losses on foreign exchange and cross currency interest rate swap contracts not designated as hedging instruments are reported in Selling, administrative, and other expenses.
Accumulated Other Comprehensive Income/(Loss) Activity
The following table summarizes activity on a pre-tax basis in Accumulated other comprehensive income/(loss) related to designated cash flow hedges for periodthe years ended December 31 (in millions):
| | | | | | | 2011 | | 2010 | | 2009 |
Beginning of year: net unrealized gain/(loss) on derivative financial instruments | | $ | 129 | | $ | (22 | ) | | $ | 2 |
| | $ | 129 |
|
Increase/(Decrease) in fair value of derivatives | | | (86 | ) | (100 | ) | | (7 | ) | | (86 | ) |
Gains reclassified from Accumulated other comprehensive income/(loss) | | | (41 | ) | (119 | ) | | (17 | ) | | (41 | ) |
End of year: net unrealized gain/(loss) on derivative financial instruments | | $ | 2 | | $ | (241 | ) | | $ | (22 | ) | | $ | 2 |
|
We expect to reclassify existing net gainslosses of $1$158 million from Accumulated other comprehensive income/(loss) to Automotive cost of sales during the next twelve months as the underlying exposures are realized.
Balance Sheet Effect of Derivative Instruments
The following table summarizestables summarize the notional amount and estimated fair value of our derivative financial instruments at December 31 2009 (in millions):
| | | | | | Fair Value of | | | Fair Value of | |
| | | | | | | | | | |
| Automotive Sector | | | | | | | | | |
| Cash flow hedges: | | | | | | | | | |
Foreign exchange contracts | | $ | 118 | | | $ | — | | | $ | 5 | |
| | | | | | | | | | | | | |
| Derivatives not designated as hedging instruments: | | | | | | | | | | | | |
| Foreign exchange contracts – operating exposures | | | 4,255 | | | | 59 | | | | 80 | |
Commodity contracts | | | 980 | | | | 15 | | | | 54 | |
| Other – interest rate contracts and warrants | | | 180 | | | | 2 | | | | 15 | |
Total derivatives not designated as hedging instruments | | | 5,415 | | | | 76 | | | | 149 | |
| | | | | | | | | | | | | |
Total Automotive sector derivative instruments | | $ | 5,533 | | | $ | 76 | | | $ | 154 | |
| | | | | | | | | | | | | |
| Financial Services Sector | | | | | | | | | | | | |
| Fair value hedges: | | | | | | | | | | | | |
Interest rate contracts | | $ | 6,309 | | | $ | 385 | | | $ | — | |
| | | | | | | | | | | | | |
| Derivatives not designated as hedging instruments: | | | | | | | | | | | | |
Interest rate contracts | | | 68,527 | | | | 1,269 | | | | 846 | |
Foreign exchange contracts | | | 4,386 | | | | 22 | | | | 46 | |
Cross currency interest rate swap contracts | | | 3,873 | | | | 203 | | | | 282 | |
Total derivatives not designated as hedging instruments | | | 76,786 | | | | 1,494 | | | | 1,174 | |
| | | | | | | | | | | | | |
Total Financial Services sector derivative instruments | | $ | 83,095 | | | $ | 1,879 | | | $ | 1,174 | |
FS - 82 |
| | | | | | | | | | | |
| | 2011 |
| | Notionals | | Fair Value of Assets | | Fair Value of Liabilities |
| Automotive Sector | | | | | |
| Cash flow hedges: | | | | | |
| Foreign currency exchange contracts | $ | 14,535 |
| | $ | 120 |
| | $ | 368 |
|
| | | | | | |
| Derivatives not designated as hedging instruments: | | | | | |
| Foreign currency exchange contracts | 5,692 |
| | 92 |
| | 80 |
|
| Commodity contracts | 2,396 |
| | 2 |
| | 372 |
|
| Other – warrants | 12 |
| | 4 |
| | — |
|
| Total derivatives not designated as hedging instruments | 8,100 |
| | 98 |
| | 452 |
|
| Total Automotive sector derivative instruments | $ | 22,635 |
| | $ | 218 |
| | $ | 820 |
|
| | | | | | |
| Financial Services Sector | |
| | |
| | |
|
| Fair value hedges: | |
| | |
| | |
|
| Interest rate contracts | $ | 7,786 |
| | $ | 526 |
| | $ | — |
|
| | | | | | |
| Derivatives not designated as hedging instruments: | | | | | |
| Interest rate contracts | 70,639 |
| | 670 |
| | 237 |
|
| Foreign currency exchange contracts | 3,582 |
| | 30 |
| | 50 |
|
| Cross-currency interest rate swap contracts | 987 |
| | 12 |
| | 12 |
|
| Other (a) | 2,500 |
| | 137 |
| | — |
|
| Total derivatives not designated as hedging instruments | 77,708 |
| | 849 |
| | 299 |
|
| Total Financial Services sector derivative instruments | $ | 85,494 |
| | $ | 1,375 |
| | $ | 299 |
|
__________ | |
| (a) | Represents derivative features included in the FUEL notes (see Note 4). |
FORD MOTOR COMPANY AND SUBSIDIARIES
NOTES TO THE FINANCIAL STATEMENTS
NOTE 26.25. DERIVATIVE FINANCIAL INSTRUMENTS AND HEDGING ACTIVITIES (Continued)
|
| | | | | | | | | | | |
| | 2010 |
| | Notionals | | Fair Value of Assets | | Fair Value of Liabilities |
| Automotive Sector | | | | | |
| Cash flow hedges: | | | | | |
| Foreign currency exchange contracts | $ | 1,324 |
| | $ | 8 |
| | $ | 15 |
|
| | | | | | |
| Derivatives not designated as hedging instruments: | | | | | |
| Foreign currency exchange contracts | 6,100 |
| | 50 |
| | 78 |
|
| Commodity contracts | 846 |
| | 69 |
| | 6 |
|
| Other – warrants | 12 |
| | 5 |
| | — |
|
| Total derivatives not designated as hedging instruments | 6,958 |
| | 124 |
| | 84 |
|
| Total Automotive sector derivative instruments | $ | 8,282 |
| | $ | 132 |
| | $ | 99 |
|
| | | | | | |
| Financial Services Sector | |
| | |
| | |
|
| Fair value hedges: | |
| | |
| | |
|
| Interest rate contracts | $ | 8,826 |
| | $ | 503 |
| | $ | 7 |
|
| | | | | | |
| Derivatives not designated as hedging instruments: | | | | | |
| Interest rate contracts | 52,999 |
| | 709 |
| | 322 |
|
| Foreign currency exchange contracts | 3,835 |
| | 24 |
| | 73 |
|
| Cross-currency interest rate swap contracts | 1,472 |
| | 25 |
| | 189 |
|
| Total derivatives not designated as hedging instruments | 58,306 |
| | 758 |
| | 584 |
|
| Total Financial Services sector derivative instruments | $ | 67,132 |
| | $ | 1,261 |
| | $ | 591 |
|
InOn our consolidated balance sheet, we report derivative assets are reported in Other assets for Automotive and Financial Services sectors, and derivative liabilities are reported in Payables for our Automotive sector and in Accrued liabilities and deferred revenue for Automotive andour Financial Services sectors, respectively.sector.
The notional amounts of the derivative financial instruments do not necessarily represent amounts exchanged by the parties and, therefore, are not a direct measure of our exposure to the financial risks described above. Notional amounts are presented on a gross basis with no netting of offsetting exposure positions. The amounts exchanged are calculated by reference to the notional amounts and by other terms of the derivatives, such as interest rates, foreign currency exchange rates or commodity volumes and prices.
Counterparty Risk and Collateral
Use of derivatives exposes us to the risk that a counterparty may default on a derivative contract. We establish exposure limits for each counterparty to minimize this risk and provide counterparty diversification. Substantially all of our derivative exposures are with counterparties that have long-term credit ratings of single-A or better.an investment grade rating. The aggregate fair value of derivative instruments in asset positions on December 31, 20092011 was about $2$1.6 billion, representing the maximum loss that we would recognize at that date if all counterparties failed to perform as contracted. We enter into master agreements with counterparties that generally allow for netting of certain exposures; therefore, the actual loss we would recognize if all counterparties failed to perform as contracted would be significantly lower.
We include an adjustment for non-performance risk in the fair value of derivative instruments. At December 31, 2009, ourOur adjustment for non-performance risk is relative to a measure based on an unadjusted inter-bank deposit rate (e.g., LIBOR). For our Automotive sector, at December 31, 2011 and 2010, our adjustment reduced derivative assets by $0$3 million and $6less than $1 million for Automotive and Financial Services sectors,, respectively, and reduced derivative liabilities by $1$10 million and $13less than $1 million for Automotive and, respectively. For our Financial Services sectors,sector, at December 31, 2011 and 2010, our adjustment reduced derivative assets by $54 million and $10 million, respectively, and reduced derivative liabilities by $7 million and $4 million, respectively. See Note 4 for more detail on valuation methodologies.
In the third quarter of 2009, we began postingWe post cash collateral with certain counterparties based on our net position with regard to foreign currency and commodity derivative contracts. AsWe posted $70 million and $11 million as of December 31, 2009, we posted $64 million in cash collateral related to derivative instruments,2011 and December 31, 2010, respectively, which is included in restricted cash and reported in Other assets on our consolidated balance sheet.
FORD MOTOR COMPANY AND SUBSIDIARIES
NOTES TO THE FINANCIAL STATEMENTS
NOTE 27.26. OPERATING CASH FLOWS
The reconciliation of Net income/(loss) attributable to Ford Motor Companyto Net cash flows from(used in)/provided by operating activities of continuing operations is for the years ended December 31 was as follows (in millions):
|
| | | | | | | | | | | |
| | 2011 |
| | Automotive | | Financial Services | | Total (a) |
| Net income/(loss) attributable to Ford Motor Company | $ | 18,447 |
| | $ | 1,766 |
| | $ | 20,213 |
|
| Depreciation and special tools amortization | 3,533 |
| | 1,843 |
| | 5,376 |
|
| Other amortization | 80 |
| | (1,200 | ) | | (1,120 | ) |
| Provision for credit and insurance losses | — |
| | (33 | ) | | (33 | ) |
| Net (gain)/loss on extinguishment of debt | 60 |
| | 68 |
| | 128 |
|
| Net (gain)/loss on investment securities | 76 |
| | 6 |
| | 82 |
|
| Net losses/(earnings) from equity investments in excess of dividends received | (169 | ) | | — |
| | (169 | ) |
| Foreign currency adjustments | (35 | ) | | (2 | ) | | (37 | ) |
| Net (gain)/loss on sale of businesses | (410 | ) | | (11 | ) | | (421 | ) |
| Stock compensation | 163 |
| | 8 |
| | 171 |
|
| Cash changes in operating assets and liabilities were as follows: | |
| | |
| | |
|
| Provision for deferred income taxes | (11,566 | ) | | 495 |
| | (11,071 | ) |
| Decrease/(Increase) in intersector receivables/payables | 642 |
| | (642 | ) | | — |
|
| Decrease/(Increase) in accounts receivable and other assets | (1,649 | ) | | 722 |
| | (927 | ) |
| Decrease/(Increase) in inventory | (367 | ) | | — |
| | (367 | ) |
| Increase/(Decrease) in accounts payable and accrued and other liabilities | (230 | ) | | (450 | ) | | (680 | ) |
| Other | 793 |
| | (165 | ) | | 628 |
|
| Net cash (used in)/provided by operating activities | $ | 9,368 |
| | $ | 2,405 |
| | $ | 11,773 |
|
| | | | |
| | | | | | | | | | |
Net income/(loss) attributable to Ford Motor Company | | $ | 1,563 | | | $ | 1,154 | | | $ | 2,717 | |
(Income)/Loss of discontinued operations | | | (3 | ) | | | (2 | ) | | | (5 | ) |
Depreciation and special tools amortization | | | 4,094 | | | | 3,924 | | | | 8,018 | |
Other amortization | | | 174 | | | | (1,261 | ) | | | (1,087 | ) |
Impairment charges (depreciation and amortization) | | | 157 | | | | 154 | | | | 311 | |
Held-for-sale impairment | | | 650 | | | | — | | | | 650 | |
Provision for credit and insurance losses | | | — | | | | 1,030 | | | | 1,030 | |
Net (gain)/loss on extinguishment of debt | | | (4,666 | ) | | | (71 | ) | | | (4,737 | ) |
Net (gain)/loss on investment securities | | | (385 | ) | | | (25 | ) | | | (410 | ) |
Net (gain)/loss on pension and OPEB curtailment | | | (4 | ) | | | — | | | | (4 | ) |
| Net (gain)/loss on settlement of U.S. hourly retiree health care obligation | | | 248 | | | | — | | | | 248 | |
| Net losses/(earnings) from equity investments in excess of dividends received | | | 1 | | | | (7 | ) | | | (6 | ) |
Foreign currency adjustments | | | 398 | | | | (323 | ) | | | 75 | |
Net (gain)/loss on sale of businesses | | | 29 | | | | 4 | | | | 33 | |
Stock option expense | | | 27 | | | | 2 | | | | 29 | |
| Cash changes in operating assets and liabilities were as follows: | | | | | | | | | �� | | | |
Provision for deferred income taxes | | | 586 | | | | (1,390 | ) | | | (804 | ) |
| Decrease/(Increase) in accounts receivable and other assets | | | 39 | | | | 2,205 | | | | 2,244 | |
Decrease/(Increase) in inventory | | | 2,333 | | | | — | | | | 2,333 | |
| Increase/(Decrease) in accounts payable and accrued and other liabilities | | | (809 | ) | | | (994 | ) | | | (1,803 | ) |
Other | | | (341 | ) | | | 753 | | | | 412 | |
Net cash (used in)/provided by operating activities | | $ | 4,091 | | | $ | 5,153 | | | $ | 9,244 | |
__________ |
| | | | | | | | | | | |
| | 2010 |
| | Automotive | | Financial Services | | Total (a) |
| Net income/(loss) attributable to Ford Motor Company | $ | 4,690 |
| | $ | 1,871 |
| | $ | 6,561 |
|
| Depreciation and special tools amortization | 3,876 |
| | 2,024 |
| | 5,900 |
|
| Other amortization | 703 |
| | (1,019 | ) | | (316 | ) |
| Provision for credit and insurance losses | — |
| | (216 | ) | | (216 | ) |
| Net (gain)/loss on extinguishment of debt | 844 |
| | 139 |
| | 983 |
|
| Net (gain)/loss on investment securities | (102 | ) | | 19 |
| | (83 | ) |
| Net (gain)/loss on pension and OPEB curtailment | (29 | ) | | — |
| | (29 | ) |
| Net losses/(earnings) from equity investments in excess of dividends received | (198 | ) | | — |
| | (198 | ) |
| Foreign currency adjustments | (347 | ) | | (1 | ) | | (348 | ) |
| Net (gain)/loss on sale of businesses | 23 |
| | (5 | ) | | 18 |
|
| Stock option expense | 32 |
| | 2 |
| | 34 |
|
| Cash changes in operating assets and liabilities were as follows: | |
| | |
| | |
|
| Provision for deferred income taxes | 300 |
| | (266 | ) | | 34 |
|
| Decrease/(Increase) in intersector receivables/payables | 321 |
| | (321 | ) | | — |
|
| Decrease/(Increase) in accounts receivable and other assets | (918 | ) | | 1,683 |
| | 765 |
|
| Decrease/(Increase) in inventory | (903 | ) | | — |
| | (903 | ) |
| Increase/(Decrease) in accounts payable and accrued and other liabilities | (1,179 | ) | | 475 |
| | (704 | ) |
| Other | (750 | ) | | (587 | ) | | (1,337 | ) |
| Net cash (used in)/provided by operating activities | $ | 6,363 |
| | $ | 3,798 |
| | $ | 10,161 |
|
_________
*
| |
| (a) | See Note 1 for a reconciliation of the sum of the sector net cash flows from(used in)/provided by operating activities of continuing operations to the consolidated net cash flows from(used in)/provided by operating activities of continuing operations.activities. |
| | | | |
| | | | | | | | | | |
Net income/(loss) attributable to Ford Motor Company | | $ | (13,174 | ) | | $ | (1,592 | ) | | $ | (14,766 | ) |
(Income)/Loss of discontinued operations | | | — | | | | (9 | ) | | | (9 | ) |
Depreciation and special tools amortization | | | 5,803 | | | | 7,023 | | | | 12,826 | |
Other amortization | | | 274 | | | | (643 | ) | | | (369 | ) |
Impairment charges (depreciation and amortization) | | | 5,318 | | | | 2,086 | | | | 7,404 | |
Held-for-sale impairment | | | 421 | | | | — | | | | 421 | |
U.S. consolidated dealerships goodwill impairment | | | 88 | | | | — | | | | 88 | |
Provision for credit and insurance losses | | | — | | | | 1,874 | | | | 1,874 | |
Net (gain)/loss on extinguishment of debt | | | (170 | ) | | | — | | | | (170 | ) |
Net (gain)/loss on investment securities | | | 1,364 | | | | 12 | | | | 1,376 | |
Net (gain)/loss on pension and OPEB curtailment | | | (2,714 | ) | | | — | | | | (2,714 | ) |
| Net losses/(earnings) from equity investments in excess of dividends received | | | 60 | | | | (4 | ) | | | 56 | |
Foreign currency adjustments | | | (484 | ) | | | (4 | ) | | | (488 | ) |
Net (gain)/loss on sale of businesses | | | 551 | | | | (29 | ) | | | 522 | |
Stock option expense | | | 32 | | | | 3 | | | | 35 | |
| Cash changes in operating assets and liabilities were as follows: | | | | | | | | | | | | |
Provision for deferred income taxes | | | 4,602 | | | | (2,648 | ) | | | 1,954 | |
| Decrease/(Increase) in accounts receivable and other assets | | | (1,351 | ) | | | 2,446 | | | | 1,095 | |
Decrease/(Increase) in inventory | | | (358 | ) | | | — | | | | (358 | ) |
| Increase/(Decrease) in accounts payable and accrued and other liabilities | | | (13,905 | ) | | | 1,258 | | | | (12,647 | ) |
Other | | | 1,203 | | | | (666 | ) | | | 537 | |
Net cash (used in)/provided by operating activities | | $ | (12,440 | ) | | $ | 9,107 | | | $ | (3,333 | ) |
__________
FORD MOTOR COMPANY AND SUBSIDIARIES
NOTES TO THE FINANCIAL STATEMENTS
NOTE 26. OPERATING CASH FLOWS (Continued)
|
| | | | | | | | | | | |
| | 2009 |
| | Automotive | | Financial Services | | Total (a) |
| Net income/(loss) attributable to Ford Motor Company | $ | 1,563 |
| | $ | 1,154 |
| | $ | 2,717 |
|
| (Income)/Loss of discontinued operations | (3 | ) | | (2 | ) | | (5 | ) |
| Depreciation and special tools amortization | 3,743 |
| | 3,924 |
| | 7,667 |
|
| Other amortization | 174 |
| | (1,261 | ) | | (1,087 | ) |
| Impairment charges | 157 |
| | 154 |
| | 311 |
|
| Held-for-sale impairment | 650 |
| | — |
| | 650 |
|
| Provision for credit and insurance losses | — |
| | 1,030 |
| | 1,030 |
|
| Net (gain)/loss on extinguishment of debt | (4,666 | ) | | (71 | ) | | (4,737 | ) |
| Net (gain)/loss on investment securities | (385 | ) | | (25 | ) | | (410 | ) |
| Net (gain)/loss on pension and OPEB curtailment | (4 | ) | | — |
| | (4 | ) |
| Net (gain)/loss on settlement of U.S. hourly retiree health care obligation | 248 |
| | — |
| | 248 |
|
| Net losses/(earnings) from equity investments in excess of dividends received | (38 | ) | | (7 | ) | | (45 | ) |
| Foreign currency adjustments | 415 |
| | (323 | ) | | 92 |
|
| Net (gain)/loss on sale of businesses | 29 |
| | 4 |
| | 33 |
|
| Stock option expense | 27 |
| | 2 |
| | 29 |
|
| Cash changes in operating assets and liabilities were as follows: | |
| | |
| | |
|
| Provision for deferred income taxes | 590 |
| | (1,336 | ) | | (746 | ) |
| Decrease/(Increase) in intersector receivables/payables | (598 | ) | | 598 |
| | — |
|
| Decrease/(Increase) in equity method investments | 74 |
| | — |
| | 74 |
|
| Decrease/(Increase) in accounts receivable and other assets | 407 |
| | 2,205 |
| | 2,612 |
|
| Decrease/(Increase) in inventory | 2,201 |
| | — |
| | 2,201 |
|
| Increase/(Decrease) in accounts payable and accrued and other liabilities | (1,838 | ) | | (994 | ) | | (2,832 | ) |
| Other | 128 |
| | 753 |
| | 881 |
|
| Net cash (used in)/provided by operating activities | $ | 2,874 |
| | $ | 5,805 |
| | $ | 8,679 |
|
_________
* | |
| (a) | See Note 1 for a reconciliation of the sum of the sector net cash flows from(used in)/provided by operating activities of continuing operations to the consolidated net cash flows from(used in)/provided by operating activities of continuing operations.activities. |
FORD MOTOR COMPANY AND SUBSIDIARIES
NOTES TO THE FINANCIAL STATEMENTS
NOTE 27. OPERATING CASH FLOWS (Continued)
| | | | |
| | | | | | | | | | |
Net income/(loss) attributable to Ford Motor Company | | $ | (3,552 | ) | | $ | 757 | | | $ | (2,795 | ) |
(Income)/Loss of discontinued operations | | | (35 | ) | | | (6 | ) | | | (41 | ) |
Depreciation and special tools amortization | | | 6,763 | | | | 6,289 | | | | 13,052 | |
Other amortization | | | 274 | | | | 521 | | | | 795 | |
Goodwill impairment | | | 2,400 | | | | — | | | | 2,400 | |
Provision for credit and insurance losses | | | — | | | | 668 | | | | 668 | |
Net (gain)/loss on extinguishment of debt | | | 512 | | | | — | | | | 512 | |
Net (gain)/loss on investment securities | | | 60 | | | | (40 | ) | | | 20 | |
Net (gain)/loss on pension and OPEB curtailment | | | (1,164 | ) | | | — | | | | (1,164 | ) |
| Net losses/(earnings) from equity investments in excess of dividends received | | | (175 | ) | | | — | | | | (175 | ) |
Foreign currency adjustments | | | 206 | | | | 13 | | | | 219 | |
Net (gain)/loss on sale of businesses | | | (172 | ) | | | (7 | ) | | | (179 | ) |
Stock option expense | | | 70 | | | | 5 | | | | 75 | |
| Cash changes in operating assets and liabilities were as follows: | | | | | | | | | | | | |
Provision for deferred income taxes | | | (880 | ) | | | (4,597 | ) | | | (5,477 | ) |
| Decrease/(Increase) in accounts receivable and other assets | | | 313 | | | | (268 | ) | | | 45 | |
Decrease/(Increase) in inventory | | | 371 | | | | — | | | | 371 | |
| Increase/(Decrease) in accounts payable and accrued and other liabilities | | | (1,041 | ) | | | 2,389 | | | | 1,348 | |
Net sales/(purchases) of trading securities | | | 4,537 | | | | 2 | | | | 4,539 | |
Other | | | 238 | | | | 676 | | | | 914 | |
| Cash flows from operating activities of continuing operations | | $ | 8,725 | | | $ | 6,402 | | | $ | 15,127 | |
__________
* | See Note 1 for a reconciliation of the sum of the sector cash flows from operating activities of continuing operations to the consolidated cash flows from operating activities of continuing operations. |
Cash paid/(received) for interest and income taxes for continuing operations for the years ended December 31 was as follows (in millions):
| | | | | | | | | | | | | 2011 | | 2010 | | 2009 |
| Interest | | | | | | | | | | | | | | |
Automotive sector | | $ | 1,343 | | | $ | 2,021 | | | $ | 2,584 | | $ | 1,059 |
| | $ | 1,336 |
| | $ | 1,302 |
|
Financial Services sector | | | 5,587 | | | | 7,661 | | | | 8,346 | | 3,348 |
| | 4,018 |
| | 5,572 |
|
Total interest paid | | $ | 6,930 | | | $ | 9,682 | | | $ | 10,930 | | $ | 4,407 |
| | $ | 5,354 |
| | $ | 6,874 |
|
| | | | | | | | | | | | | | |
Income taxes | | $ | (643 | ) | | $ | 685 | | | $ | (223 | ) | $ | 268 |
| | $ | 73 |
| | $ | (764 | ) |
FORD MOTOR COMPANY AND SUBSIDIARIES
NOTES TO THE FINANCIAL STATEMENTS
NOTE 28.27. SEGMENT INFORMATION
Our operating activity consists of two operating sectors, Automotive and Financial Services. Segment selection is based on the organizational structure we use to evaluate performance and make decisions on resource allocation, as well as availability and materiality of separate financial results consistent with that structure.
Automotive Sector
In 2008,2010, we changed the reporting structure of our Automotive sector to separately disclose the following sevenfour segments: 1) Ford North America, 2) Ford South America, 3) Ford Europe, and 4) Ford Asia Pacific Africa, 5) Volvo, 6) Mazda, and 7) Jaguar Land Rover and Aston Martin. Automotive sector prior period information has been reclassified into these seven segments, and is provided for these segments in the table below.Africa. Included in each segment, described below, are the associated costs to design, develop, manufacture, distribute, and service vehicles and parts. Automotive sector prior period information includes Volvo.
Ford North America segment includes primarily the sale of Ford, Lincoln, and Mercury brand vehicles and related service parts and accessories in North America (the United States, Canada and Mexico). In the first quarter of 2008, we changed the reporting structure of this segment to include the sale of Mazda6 vehicles by our consolidated subsidiary, AAI (previously included in the results for Ford Asia Pacific Africa). We have reclassified prior period information to reflect this structural change to our segment reporting.
FORD MOTOR COMPANY AND SUBSIDIARIES
NOTES TO THE FINANCIAL STATEMENTS
NOTE 28. SEGMENT INFORMATION (Continued)
Ford South America segment includes primarily the sale of Ford-brand vehicles and related service parts and accessories in South America.
Ford Europe segment, including all parts of Turkey and Russia, includes primarily the sale of Ford-brand vehicles and related service parts and accessories in Europe (including all parts of Turkey and Russia).Europe.
Ford Asia Pacific Africa segment includes primarily the sale of Ford-brand vehicles and related service parts and accessories in the Asia Pacific region and South Africa.
TheRevenue from certain vehicles (specifically, Ford brand vehicles produced and distributed by our unconsolidated affiliates, including our unconsolidated joint venture FordSollers that began operations in the fourth quarter of 2011, as well as by our Chinese unconsolidated affiliate Jiangling Motors Corporation (JMC) brand vehicles) is not included in our revenue.
Prior to the sale of the brand, the Volvo segment includesincluded primarily the sale of Volvo-brand vehicles and related service parts throughout the world (including in North America, South America, Europe, Asia Pacific, and Africa).
The Mazda segment includes the equity income/(loss) associated with our investment in Mazda (33.4% of Mazda's profit after tax before the sale of a portion of our investment in November 2008), which were reported as well as certain of our Mazda-related investments. Beginning with the fourth quarter of 2008, our remaining investment in Mazda (approximately 11%) is treated as marketable securities. All mark-to-market adjustments are recorded in Other Automotive.
Prior to the sale of these brands, the Jaguar Land Rover and Aston Martin segment included primarily the sale of Jaguar Land Rover and Aston Martin vehicles and related service parts throughout the world (including in North America, South America, Europe, Asia Pacific, and Africa).operating results through 2009. In May 2007 and June 2008, respectively,August 2010 we completed the sale of Aston MartinVolvo. Results for Volvo are reported as special items in 2010 and Jaguar Land Rover; sales of Aston Martin and Jaguar Land Rover vehicles and related service parts throughout the world are included within thisas segment for the period until each brand's respective date of sale.operating results in 2009.
The Other Automotive component of the Automotive sector consists primarily of centrally-managed net interest expense and related fair market value adjustments.
Transactions among Automotive segments generally are presented on a "where-sold," absolute-cost basis, which reflects the profit/(loss) on the sale within the segment making the ultimate sale to an external entity. This presentation generally eliminates the effect of legal entity transfer prices within the Automotive sector for vehicles, components, and product engineering. Beginning with the first quarter of 2008 and until their sale in August 2010, income/(loss) before income taxes on vehicle component sales by Volvo or Jaguar Land Rover to each other or to any other segmentsegments and by the Ford-brand segments to either Volvo or Jaguar Land Rover arewere reflected in the results for the segment making the vehicle component sale.
FORD MOTOR COMPANY AND SUBSIDIARIES
NOTES TO THE FINANCIAL STATEMENTS
NOTE 27. SEGMENT INFORMATION (Continued)
Financial Services Sector
The Financial Services sector includes the following segments: 1) Ford Credit, and 2) Other Financial Services. Ford Credit provides vehicle-related financing, leasing, and insurance. Other Financial Services includes a variety of businesses including holding companies, real estate, and the financing and leasing of some Volvo vehicles in Europe.
Special Items
In the second quarter of 2010, we changed our presentation of special items. We now show special items as a separate reconciling item to reconcile segment results to consolidated results of the Company. These special items include (i) personnel and dealer-related items stemming from our efforts to match production capacity and cost structure to market demand and changing model mix, and (ii) certain infrequent significant items that we generally do not consider to be indicative of our ongoing operating activities. Prior to this change, special items were included within the operating segments and the Other Automotive reconciling item. Our current presentation reflects the fact that management excludes these items from its review of the results of the operating segments for purposes of measuring segment profitability and allocating resources. Results for prior periods herein are presented on the same basis.
FORD MOTOR COMPANY AND SUBSIDIARIES
NOTES TO THE FINANCIAL STATEMENTS
NOTE 27. SEGMENT INFORMATION (Continued)
|
| | | | | | | | | | | | | | | | | | | | | | | | | | | | | | | | |
| (In millions) | Automotive Sector | |
| | Operating Segments | | Reconciling Items | | |
| |
| | Ford North America | | Ford South America | | Ford Europe | | Ford Asia Pacific Africa | | Volvo | | Other Automotive | | Special Items | | Total |
| 2011 | |
| | |
| | |
| | |
| | | | |
| | |
| | |
| |
| Revenues | |
| | |
| | |
| | |
| | | | |
| | |
| | |
| |
| External customer | $ | 75,022 |
| | $ | 10,976 |
| | $ | 33,758 |
| | $ | 8,412 |
| | $ | — |
| | $ | — |
| | $ | — |
| | $ | 128,168 |
| |
| Intersegment | 244 |
| | — |
| | 836 |
| | — |
| | — |
| | — |
| | — |
| | 1,080 |
| |
| Income | | | | | | | | | | | | | | | |
| |
| Income/(Loss) before income taxes | 6,191 |
| | 861 |
| | (27 | ) | | (92 | ) | | — |
| | (601 | ) | | (82 | ) | | 6,250 |
| |
| Other disclosures: | | | | | | | | | | | | | | | | |
| Depreciation and special tools amortization | 1,769 |
| | 265 |
| | 1,225 |
| | 274 |
| | — |
| | — |
| | — |
| | 3,533 |
| |
| Amortization of intangibles | 9 |
| | 2 |
| | — |
| | 1 |
| | — |
| | — |
| | — |
| | 12 |
| |
| Interest expense | — |
| | — |
| | — |
| | — |
| | — |
| | 817 |
| | — |
| | 817 |
| |
| Interest income | 60 |
| | — |
| | — |
| | — |
| | — |
| | 327 |
| | — |
| | 387 |
| |
| Cash outflow for capital expenditures | 2,164 |
| | 581 |
| | 1,034 |
| | 493 |
| | — |
| | — |
| | — |
| | 4,272 |
| |
| Unconsolidated affiliates | | | | | | | | | | | | | | | | |
| Equity in net income/(loss) | 179 |
| | — |
| | 61 |
| | 239 |
| | — |
| | — |
| | — |
| | 479 |
| |
| Total assets at year-end | 46,038 |
| | 6,878 |
| | 19,737 |
| | 6,133 |
| | — |
| | — |
| | — |
| | 78,786 |
| (a) |
| | | | | | | | | | | | | | | | | |
| 2010 | |
| | |
| | |
| | |
| | | | |
| | |
| | |
| |
| Revenues | |
| | |
| | |
| | |
| | | | |
| | |
| | |
| |
| External customer | $ | 64,428 |
| | $ | 9,905 |
| | $ | 29,486 |
| | $ | 7,381 |
| | $ | — |
| | $ | — |
| | $ | 8,080 |
| | $ | 119,280 |
| |
| Intersegment | 674 |
| | — |
| | 732 |
| | — |
| | — |
| | — |
| | 13 |
| | 1,419 |
| |
| Income | | | | | | | | | | | | | | | |
| |
| Income/(Loss) before income taxes | 5,409 |
| | 1,010 |
| | 182 |
| | 189 |
| | — |
| | (1,493 | ) | | (1,151 | ) | | 4,146 |
| |
| Other disclosures: | | | | | | | | | | | | | | | | |
| Depreciation and special tools amortization | 2,058 |
| | 247 |
| | 1,199 |
| | 262 |
| | — |
| | — |
| | 110 |
| | 3,876 |
| |
| Amortization of intangibles | 9 |
| | 77 |
| | — |
| | 1 |
| | — |
| | — |
| | 10 |
| | 97 |
| |
| Interest expense | — |
| | — |
| | — |
| | — |
| | — |
| | 1,807 |
| | — |
| | 1,807 |
| |
| Interest income | 47 |
| | — |
| | — |
| | — |
| | — |
| | 215 |
| | — |
| | 262 |
| |
| Cash outflow for capital expenditures | 2,127 |
| | 364 |
| | 971 |
| | 467 |
| | — |
| | — |
| | 137 |
| | 4,066 |
| |
| Unconsolidated affiliates | | | | | | | | | | | | | | | | |
| Equity in net income/(loss) | 155 |
| | — |
| | 128 |
| | 242 |
| | — |
| | — |
| | 1 |
| | 526 |
| |
| Total assets at year-end | 29,955 |
| | 6,623 |
| | 22,260 |
| | 5,768 |
| | — |
| | — |
| | — |
| | 64,606 |
| (a) |
| | | | | | | | | | | | | | | | | |
| 2009 | | | | | | | | | | | | | | | | |
| Revenues | | | | | | | | | | | | | | | | |
| External customer | $ | 49,713 |
| | $ | 7,947 |
| | $ | 28,304 |
| | $ | 5,548 |
| | $ | 12,356 |
| | $ | — |
| | $ | — |
| | $ | 103,868 |
| |
| Intersegment | 347 |
| | — |
| | 608 |
| | — |
| | 48 |
| | — |
| | — |
| | 1,003 |
| |
| Income | |
| | |
| | |
| | |
| | |
| | |
| | |
| | |
| |
| Income/(Loss) before income taxes | (639 | ) | | 765 |
| | (144 | ) | | (86 | ) | | (662 | ) | | (1,091 | ) | | 2,642 |
| | 785 |
| |
| Other disclosures: | |
| | |
| | |
| | |
| | |
| | |
| | |
| | |
| |
| Depreciation and special tools amortization | 2,033 |
| | 187 |
| | 1,153 |
| | 229 |
| | 141 |
| | — |
| | — |
| | 3,743 |
| |
| Amortization of intangibles | 10 |
| | 68 |
| | — |
| | 1 |
| | 7 |
| | — |
| | — |
| | 86 |
| |
| Interest expense | — |
| | — |
| | — |
| | — |
| | — |
| | 1,477 |
| | — |
| | 1,477 |
| |
| Interest income | 55 |
| | — |
| | — |
| | — |
| | — |
| | 150 |
| | — |
| | 205 |
| |
| Cash outflow for capital expenditures | 2,374 |
| | 300 |
| | 742 |
| | 215 |
| | 412 |
| | — |
| | — |
| | 4,043 |
| |
| Unconsolidated affiliates | |
| | |
| | |
| | |
| | |
| | |
| | |
| | |
| |
| Equity in net income/(loss) | 91 |
| | — |
| | 30 |
| | 164 |
| | 45 |
| | — |
| | — |
| | 330 |
| |
| Total assets at year-end (b) | |
| | |
| | |
| | |
| | |
| | |
| | |
| | 79,118 |
| (a) |
__________
| |
| (a) | As reported on our sector balance sheet. |
| |
| (b) | Total assets by operating segment not available. |
FORD MOTOR COMPANY AND SUBSIDIARIES
NOTES TO THE FINANCIAL STATEMENTS
NOTE 28.27. SEGMENT INFORMATION (Continued)
| (In millions) | | | |
| 2009 | | | | | | | | | | | | | | | | | | | | Jaguar Land Rover / Aston Martin | | | | | | | |
| Sales/Revenues | | | | | | | | | | | | | | | | | | | | | | | | | | | |
External customer | | $ | 50,514 | | | $ | 7,947 | | | $ | 29,454 | | | $ | 5,531 | | | $ | 12,447 | | | $ | — | | | $ | — | | | $ | — | | | $ | 105,893 | |
Intersegment | | | 347 | | | | — | | | | 608 | | | | — | | | | 48 | | | | — | | | | — | | | | — | | | | 1,003 | |
| Income | | | | | | | | | | | | | | | | | | | | | | | | | | | | | | | | | | | | |
| Income/(Loss) before income taxes | | | (1,649 | ) | | | 745 | | | | (226 | ) | | | (97 | ) | | | (934 | ) | | | — | | | | 3 | | | | 3,370 | | | | 1,212 | |
| Other disclosures: | | | | | | | | | | | | | | | | | | | | | | | | | | | | | | | | | | | | |
| Depreciation and special tools amortization | | | 2,156 | | | | 187 | | | | 1,371 | | | | 228 | | | | 152 | | | | — | | | | — | | | | — | | | | 4,094 | |
Amortization of intangibles | | | 10 | | | | 68 | | | | — | | | | 1 | | | | 7 | | | | — | | | | — | | | | — | | | | 86 | |
Interest expense | | | — | | | | — | | | | — | | | | — | | | | — | | | | — | | | | — | | | | 1,515 | | | | 1,515 | |
Automotive interest income | | | 55 | | | | — | | | | — | | | | — | | | | — | | | | — | | | | — | | | | 154 | | | | 209 | |
| Cash outflow for capital expenditures | | | 2,729 | | | | 300 | | | | 881 | | | | 215 | | | | 420 | | | | — | | | | — | | | | — | | | | 4,545 | |
| Unconsolidated affiliates | | | | | | | | | | | | | | | | | | | | | | | | | | | | | | | | | | | | |
Equity in net income/(loss) | | | 88 | | | | — | | | | (89 | ) | | | 164 | | | | (18 | ) | | | — | | | | — | | | | — | | | | 145 | |
Total assets at year-end* | | | | | | | | | | | | | | | | | | | | | | | | | | | | | | | | | | | 82,002 | |
| | | | | | | | | | | | | | | | | | | | | | | | | | | | | | | | | | | | | |
| 2008 | | | | | | | | | | | | | | | | | | | | | | | | | | | | | | | | | | | | |
| Sales/Revenues | | | | | | | | | | | | | | | | | | | | | | | | | | | | | | | | | | | | |
External customer | | $ | 53,382 | | | $ | 8,647 | | | $ | 39,009 | | | $ | 6,474 | | | $ | 14,679 | | | $ | — | | | $ | 6,974 | | | $ | — | | | $ | 129,165 | |
Intersegment | | | 677 | | | | — | | | | 761 | | | | — | | | | 99 | | | | — | | | | 63 | | | | — | | | | 1,600 | |
| Income | | | | | | | | | | | | | | | | | | | | | | | | | | | | | | | | | | | | |
| Income/(Loss) before income taxes | | | (10,248 | ) | | | 1,230 | | | | 970 | | | | (290 | ) | | | (1,690 | ) | | | (105 | ) | | | 32 | | | | (1,816 | ) | | | (11,917 | ) |
| Other disclosures: | | | | | | | | | | | | | | | | | | | | | | | | | | | | | | | | | | | | |
| Depreciation and special tools amortization | | | 8,272 | | | | 193 | | | | 1,645 | | | | 254 | | | | 742 | | | | — | | | | 15 | | | | — | | | | 11,121 | |
Amortization of intangibles | | | 7 | | | | 77 | | | | 7 | | | | 1 | | | | 7 | | | | — | | | | — | | | | — | | | | 99 | |
Interest expense | | | — | | | | — | | | | — | | | | — | | | | — | | | | — | | | | — | | | | 2,061 | | | | 2,061 | |
Automotive interest income | | | 61 | | | | — | | | | — | | | | — | | | | — | | | | — | | | | — | | | | 890 | | | | 951 | |
| Cash outflow for capital expenditures | | | 3,718 | | | | 217 | | | | 1,669 | | | | 321 | | | | 547 | | | | — | | | | 148 | | | | — | | | | 6,620 | |
| Unconsolidated affiliates | | | | | | | | | | | | | | | | | | | | | | | | | | | | | | | | | | | | |
Equity in net income/(loss) | | | 90 | | | | — | | | | (58 | ) | | | 107 | | | | (1 | ) | | | 25 | | | | — | | | | — | | | | 163 | |
Total assets at year-end* | | | | | | | | | | | | | | | | | | | | | | | | | | | | | | | | | | | 73,815 | |
| | | | | | | | | | | | | | | | | | | | | | | | | | | | | | | | | | | | | |
| 2007 | | | | | | | | | | | | | | | | | | | | | | | | | | | | | | | | | | | | |
| Sales/Revenues | | | | | | | | | | | | | | | | | | | | | | | | | | | | | | | | | | | | |
External customer | | $ | 70,366 | | | $ | 7,585 | | | $ | 36,330 | | | $ | 7,031 | | | $ | 17,772 | | | $ | — | | | $ | 15,295 | | | $ | — | | | $ | 154,379 | |
Intersegment | | | 523 | | | | — | | | | 712 | | | | — | | | | 118 | | | | — | | | | 153 | | | | — | | | | 1,506 | |
| Income | | | | | | | | | | | | | | | | | | | | | | | | | | | | | | | | | | | | |
| Income/(Loss) before income taxes | | | (4,139 | ) | | | 1,172 | | | | 744 | | | | 2 | | | | (2,718 | ) | | | 182 | | | | 846 | | | | (1,170 | ) | | | (5,081 | ) |
| Other disclosures: | | | | | | | | | | | | | | | | | | | | | | | | | | | | | | | | | | | | |
| Depreciation and special tools amortization | | | 3,809 | | | | 117 | | | | 1,423 | | | | 261 | | | | 770 | | | | — | | | | 383 | | | | — | | | | 6,763 | |
Amortization of intangibles | | | 17 | | | | 69 | | | | 7 | | | | 1 | | | | 7 | | | | — | | | | 5 | | | | — | | | | 106 | |
Interest expense | | | — | | | | — | | | | — | | | | — | | | | — | | | | — | | | | — | | | | 2,363 | | | | 2,363 | |
Automotive interest income | | | 87 | | | | — | | | | — | | | | — | | | | — | | | | — | | | | — | | | | 1,626 | | | | 1,713 | |
| Cash outflow for capital expenditures | | | 2,895 | | | | 183 | | | | 1,366 | | | | 258 | | | | 752 | | | | — | | | | 517 | | | | — | | | | 5,971 | |
| Unconsolidated affiliates | | | | | | | | | | | | | | | | | | | | | | | | | | | | | | | | | | | | |
Equity in net income/(loss) | | | 66 | | | | — | | | | 4 | | | | 130 | | | | — | | | | 189 | | | | — | | | | — | | | | 389 | |
Total assets at year-end* | | | | | | | | | | | | | | | | | | | | | | | | | | | | | | | | | | | 118,455 | |
__________
* As reported on our sector balance sheet.
FORD MOTOR COMPANY AND SUBSIDIARIES
NOTES TO THE FINANCIAL STATEMENTS
NOTE 28. SEGMENT INFORMATION (Continued)
| (In millions) | | Financial Services Sector | | | | | |
| | | | | | | | | | | | | | | | | | | | |
| 2009 | | | | | | | | | | | | | | | | | | | |
| Sales/Revenues | | | | | | | | | | | | | | | | | | | |
| | | | Financial Services Sector | | Total Company |
| | | Operating Segments | | Reconciling Items | | | | | | |
| | | Ford Credit | | Other Financial Services | | Special Items | | Elims | | Total | | Elims (a) | | Total |
| 2011 | | | | | | | | | | | | | | |
| Revenues | | | | | | | | | | | | | | |
External customer | | $ | 12,112 | | | $ | 303 | | | $ | — | | | $ | 12,415 | | | $ | — | | | $ | 118,308 | | $ | 7,764 |
| | $ | 332 |
| | $ | — |
| | $ | — |
| | $ | 8,096 |
| | $ | — |
| | $ | 136,264 |
|
Intersegment | | | 429 | | | | 15 | | | | — | | | | 444 | | | | (1,447 | ) | | | — | | 557 |
| | 5 |
| | — |
| | — |
| | 562 |
| | (1,642 | ) | | — |
|
| Income | | | | | | | | | | | | | | | | | | | | | | | | | | | | | | | | | |
| | | | |
| Income/(Loss) before income taxes | | | 2,001 | | | | (187 | ) | | | — | | | | 1,814 | | | | — | | | | 3,026 | | 2,404 |
| | 27 |
| | — |
| | — |
| | 2,431 |
| | — |
| | 8,681 |
|
| Other disclosures: | | | | | | | | | | | | | | | | | | | | | | | | | | | | | | | | | | | | | |
| Depreciation and special tools amortization | | | 3,903 | | | | 34 | | | | — | | | | 3,937 | | | | — | | | | 8,031 | | 1,813 |
| | 30 |
| | — |
| | — |
| | 1,843 |
| | — |
| | 5,376 |
|
Amortization of intangibles | | | — | | | | — | | | | — | | | | — | | | | — | | | | 86 | | — |
| | — |
| | — |
| | — |
| | — |
| | — |
| | 12 |
|
Interest expense | | | 5,162 | | | | 151 | | | | — | | | | 5,313 | | | | — | | | | 6,828 | | 3,507 |
| | 107 |
| | — |
| | — |
| | 3,614 |
| | — |
| | 4,431 |
|
Automotive interest income | | | — | | | | — | | | | — | | | | — | | | | — | | | | 209 | | |
| Interest income (b) | | 83 |
| | 1 |
| | — |
| | — |
| | 84 |
| | — |
| | 471 |
|
| Cash outflow for capital expenditures | | | 11 | | | | 5 | | | | — | | | | 16 | | | | — | | | | 4,561 | | 15 |
| | 6 |
| | — |
| | — |
| | 21 |
| | — |
| | 4,293 |
|
| Unconsolidated affiliates | | | | | | | | | | | | | | | | | | | | | | | | | | | | | | | | | | | | | |
Equity in net income/(loss) | | | 1 | | | | (136 | ) | | | — | | | | (135 | ) | | | — | | | | 10 | | 21 |
| | — |
| | — |
| | — |
| | 21 |
| | — |
| | 500 |
|
Total assets at year-end (b) | | | 117,344 | | | | 8,727 | | | | (6,959 | ) | | | 119,112 | | | | (3,224 | ) | | | 197,890 | | |
| Total assets at year-end | | 100,242 |
| | 8,634 |
| | — |
| | (7,302 | ) | | 101,574 |
| (c) | | (2,012 | ) | | 178,348 |
|
| | | | | | | | | | | | | | | | | | | | | | | | | | | | | | | | | | | | | | |
| 2008 | | | | | | | | | | | | | | | | | | | | | | | | | |
| Sales/Revenues | | | | | | | | | | | | | | | | | | | | | | | | | |
| 2010 | | |
| | |
| | |
| | |
| | |
| | |
| | |
|
| Revenues | | |
| | |
| | |
| | |
| | |
| | |
| | |
|
External customer | | $ | 15,679 | | | $ | 270 | | | $ | — | | | $ | 15,949 | | | $ | — | | | $ | 145,114 | | $ | 9,357 |
| | $ | 317 |
| | $ | — |
| | $ | — |
| | $ | 9,674 |
| | $ | — |
| | $ | 128,954 |
|
Intersegment | | | 738 | | | | 12 | | | | — | | | | 750 | | | | (2,350 | ) | | | — | | 469 |
| | 10 |
| | — |
| | — |
| | 479 |
| | (1,898 | ) | | — |
|
| Income | | | | | | | | | | | | | | | | | | | | | | | | | | | | | | | | | |
| | | | |
| Income/(Loss) before income taxes | | | (2,559 | ) | | | (22 | ) | | | — | | | | (2,581 | ) | | | — | | | | (14,498 | ) | 3,054 |
| | (51 | ) | | — |
| | — |
| | 3,003 |
| | — |
| | 7,149 |
|
| Other disclosures: | | | | | | | | | | | | | | | | | | | | | | | | | | | | | | | | | | | | | |
| Depreciation and special tools amortization | | | 9,072 | | | | 37 | | | | — | | | | 9,109 | | | | — | | | | 20,230 | | 1,989 |
| | 35 |
| | — |
| | — |
| | 2,024 |
| | — |
| | 5,900 |
|
Amortization of intangibles | | | — | | | | — | | | | — | | | | — | | | | — | | | | 99 | | — |
| | — |
| | — |
| | — |
| | — |
| | — |
| | 97 |
|
Interest expense | | | 7,634 | | | | 110 | | | | — | | | | 7,744 | | | | — | | | | 9,805 | | 4,222 |
| | 123 |
| | — |
| | — |
| | 4,345 |
| | — |
| | 6,152 |
|
Automotive interest income | | | — | | | | — | | | | — | | | | — | | | | — | | | | 951 | | |
| Interest income (b) | | 86 |
| | — |
| | — |
| | — |
| | 86 |
| | — |
| | 348 |
|
| Cash outflow for capital expenditures | | | 44 | | | | 32 | | | | — | | | | 76 | | | | — | | | | 6,696 | | 13 |
| | 13 |
| | — |
| | — |
| | 26 |
| | — |
| | 4,092 |
|
| Unconsolidated affiliates | | | | | | | | | | | | | | | | | | | | | | | | | | | | | | | | | | | | | |
Equity in net income/(loss) | | | 8 | | | | 5 | | | | — | | | | 13 | | | | — | | | | 176 | | 12 |
| | — |
| | — |
| | — |
| | 12 |
| | — |
| | 538 |
|
Total assets at year-end (b) | | | 150,127 | | | | 11,017 | | | | (9,477 | ) | | | 151,667 | | | | (2,535 | ) | | | 222,947 | | |
| Total assets at year-end | | 101,696 |
| | 8,708 |
| | — |
| | (7,134 | ) | | 103,270 |
| (c) | | (3,189 | ) | | 164,687 |
|
| | | | | | | | | | | | | | | | | | | | | | | | | | | | | | | | | | | | | | |
| 2007 | | | | | | | | | | | | | | | | | | | | | | | | | |
| Sales/Revenues | | | | | | | | | | | | | | | | | | | | | | | | | |
| 2009 | | | | | | | | | | | | | | |
| Revenues | | | | | | | | | | | | | | |
External customer | | $ | 15,955 | | | $ | 238 | | | $ | — | | | $ | 16,193 | | | $ | — | | | $ | 170,572 | | $ | 12,079 |
| | $ | 336 |
| | $ | — |
| | $ | — |
| | $ | 12,415 |
| | $ | — |
| | $ | 116,283 |
|
Intersegment | | | 761 | | | | 15 | | | | — | | | | 776 | | | | (2,282 | ) | | | — | | 462 |
| | 15 |
| | — |
| | — |
| | 477 |
| | (1,480 | ) | | — |
|
| Income | | | | | | | | | | | | | | | | | | | | | | | | | |
| | |
| | |
| | |
| | |
| | |
| | |
|
| Income/(Loss) before income taxes | | | 1,215 | | | | 9 | | | | — | | | | 1,224 | | | | — | | | | (3,857 | ) | 2,001 |
| | (106 | ) | | (81 | ) | | — |
| | 1,814 |
| | — |
| | 2,599 |
|
| Other disclosures: | | | | | | | | | | | | | | | | | | | | | | | | | |
| | |
| | |
| | |
| | |
| | |
| | |
|
| Depreciation and special tools amortization | | | 6,257 | | | | 32 | | | | — | | | | 6,289 | | | | — | | | | 13,052 | | 3,903 |
| | 34 |
| | — |
| | — |
| | 3,937 |
| | — |
| | 7,680 |
|
Amortization of intangibles | | | — | | | | — | | | | — | | | | — | | | | — | | | | 106 | | — |
| | — |
| | — |
| | — |
| | — |
| | — |
| | 86 |
|
Interest expense | | | 8,630 | | | | 45 | | | | — | | | | 8,675 | | | | — | | | | 11,038 | | 5,162 |
| | 151 |
| | — |
| | — |
| | 5,313 |
| | — |
| | 6,790 |
|
Automotive interest income | | | — | | | | — | | | | — | | | | — | | | | — | | | | 1,713 | | |
| Interest income (b) | | 107 |
| | — |
| | — |
| | — |
| | 107 |
| | — |
| | 312 |
|
| Cash outflow for capital expenditures | | | 2 | | | | 49 | | | | — | | | | 51 | | | | — | | | | 6,022 | | 11 |
| | 5 |
| | — |
| | — |
| | 16 |
| | — |
| | 4,059 |
|
| Unconsolidated affiliates | | | | | | | | | | | | | | | | | | | | | | | | | |
| | |
| | |
| | |
| | |
| | |
| | |
|
Equity in net income/(loss) | | | 14 | | | | — | | | | — | | | | 14 | | | | — | | | | 403 | | 1 |
| | (4 | ) | | (132 | ) | | — |
| | (135 | ) | | — |
| | 195 |
|
Total assets at year-end (b) | | | 169,023 | | | | 10,520 | | | | (10,282 | ) | | | 169,261 | | | | (2,023 | ) | | | 285,693 | | |
| Total assets at year-end | | 117,344 |
| | 8,727 |
| | — |
| | (6,959 | ) | | 119,112 |
| (c) | | (6,190 | ) | | 192,040 |
|
__________
| |
| (a) | Includes intersector transactions occurring in the ordinary course of business.business and deferred tax netting. |
| |
| (b) | Interest income reflected on this line for Financial Services sector is non-financing related. Interest income in the normal course of business for Financial Services sector is reported in Financial Services revenues. |
| |
| (c) | As reported on our sector balance sheet. |
FORD MOTOR COMPANY AND SUBSIDIARIES
NOTES TO THE FINANCIAL STATEMENTS
NOTE 29.28. GEOGRAPHIC INFORMATION
The following table includes information for both Automotive and Financial Services sectors for the years ended December 31 (in millions):
| | | | | | | | | | | | | 2011 | | 2010 | | 2009 |
| | | | | | | | | | | | | | | | | | | | Net Sales and Revenues | | Long-Lived Assets (a) | | Net Sales and Revenues | | Long-Lived Assets (a) | | Net Sales and Revenues | | Long-Lived Assets (a) |
| North America | | | | | | | | | | | | | | | | | | | | | | | | | | | | | |
United States | | $ | 54,377 | | | $ | 22,489 | | | $ | 60,481 | | | $ | 29,158 | | | $ | 80,237 | | | $ | 37,174 | | $ | 71,165 |
| | $ | 19,311 |
| | $ | 63,318 |
| | $ | 17,423 |
| | $ | 53,595 |
| | $ | 20,390 |
|
Canada | | | 7,974 | | | | 5,000 | | | | 7,964 | | | | 6,369 | | | | 9,332 | | | | 10,280 | | 9,525 |
| | 2,525 |
| | 9,351 |
| | 3,456 |
| | 7,974 |
| | 4,717 |
|
Mexico/Other | | | 1,336 | | | | 1,393 | | | | 2,224 | | | | 950 | | | | 2,253 | | | | 1,054 | | 1,436 |
| | 1,420 |
| | 1,537 |
| | 1,411 |
| | 1,335 |
| | 1,322 |
|
Total North America | | | 63,687 | | | | 28,882 | | | | 70,669 | | | | 36,477 | | | | 91,822 | | | | 48,508 | | 82,126 |
| | 23,256 |
| | 74,206 |
| | 22,290 |
| | 62,904 |
| | 26,429 |
|
| | | | | | | | | | | | | | | | | | | | | | | | | | | | | | | | | | | | |
| Europe | | | | | | | | | | | | | | | | | | | | | | | | | |
| | |
| | |
| | |
| | |
| | |
|
United Kingdom | | | 8,448 | | | | 2,388 | | | | 14,406 | | | | 2,259 | | | | 16,634 | | | | 2,899 | | 9,486 |
| | 1,721 |
| | 9,172 |
| | 1,817 |
| | 8,661 |
| | 2,081 |
|
Germany | | | 7,843 | | | | 3,468 | | | | 9,146 | | | | 3,845 | | | | 8,239 | | | | 3,849 | | 8,717 |
| | 3,060 |
| | 7,139 |
| | 3,395 |
| | 8,161 |
| | 3,180 |
|
Italy | | | 4,529 | | | | 53 | | | | 5,052 | | | | 31 | | | | 5,537 | | | | 44 | | 3,038 |
| | 3 |
| | 3,656 |
| | 3 |
| | 4,529 |
| | 4 |
|
France | | | 3,102 | | | | 504 | | | | 3,554 | | | | 502 | | | | 3,580 | | | | 581 | | 2,806 |
| | 102 |
| | 2,754 |
| | 105 |
| | 3,081 |
| | 307 |
|
Spain | | | 2,174 | | | | 1,280 | | | | 3,550 | | | | 1,223 | | | | 5,039 | | | | 1,198 | | 2,189 |
| | 1,185 |
| | 2,235 |
| | 1,211 |
| | 2,174 |
| | 1,256 |
|
Russia | | | 1,573 | | | | 240 | | | | 5,211 | | | | 221 | | | | 4,647 | | | | 166 | | 1,913 |
| | — |
| | 2,041 |
| | 228 |
| | 1,573 |
| | 240 |
|
Belgium | | | 1,460 | | | | 1,229 | | | | 2,029 | | | | 1,330 | | | | 1,912 | | | | 1,621 | | 1,288 |
| | 735 |
| | 1,539 |
| | 964 |
| | 1,484 |
| | 1,187 |
|
Other | | | 8,976 | | | | 344 | | | | 13,286 | | | | 424 | | | | 14,203 | | | | 842 | | 5,843 |
| | 28 |
| | 8,238 |
| | 33 |
| | 8,934 |
| | 53 |
|
Total Europe | | | 38,105 | | | | 9,506 | | | | 56,234 | | | | 9,835 | | | | 59,791 | | | | 11,200 | | 35,280 |
| | 6,834 |
| | 36,774 |
| | 7,756 |
| | 38,597 |
| | 8,308 |
|
| | | | | | | | | | | | | | | | | | | | | | | | | | | | | | | | | | | | |
All Other | | | 16,516 | | | | 3,660 | | | | 18,211 | | | | 3,081 | | | | 18,959 | | | | 3,871 | | 18,858 |
| | 3,763 |
| | 17,974 |
| | 3,526 |
| | 14,782 |
| | 2,962 |
|
Total Company | | $ | 118,308 | | | $ | 42,048 | | | $ | 145,114 | | | $ | 49,393 | | | $ | 170,572 | | | $ | 63,579 | | $ | 136,264 |
| | $ | 33,853 |
| | $ | 128,954 |
| | $ | 33,572 |
| | $ | 116,283 |
| | $ | 37,699 |
|
__________
* | |
| (a) | Includes Net property from our consolidated balance sheet and Financial Services Net investment in operating leases and Net property from our consolidatedthe sector balance sheet. |
FORD MOTOR COMPANY AND SUBSIDIARIES
NOTES TO THE FINANCIAL STATEMENTS
NOTE 30.29. SELECTED QUARTERLY FINANCIAL DATA (unaudited)
| (In millions, except per share amounts) | | | | | | |
| | | | | | | | | | | | | | | | | | | | | | | | | |
| Automotive Sector | | | | | | | | | | | | | | | | | | | | | | | | |
Sales | | $ | 21,368 | | | $ | 23,989 | | | $ | 27,870 | | | $ | 32,666 | | | $ | 39,117 | | | $ | 37,057 | | | $ | 27,733 | | | $ | 25,258 | |
Operating income/(loss) | | | (2,338 | ) | | | (1,568 | ) | | | 667 | | | | 533 | | | | 552 | | | | (5,892 | ) | | | (8 | ) | | | (3,945 | ) |
Income/(Loss) before income taxes | | | (1,468 | ) | | | 1,776 | | | | 545 | | | | 359 | | | | 222 | | | | (6,639 | ) | | | (732 | ) | | | (4,768 | ) |
| Financial Services Sector | | | | | | | | | | | | | | | | | | | | | | | | | | | | | | | | |
Revenues | | | 3,410 | | | | 3,200 | | | | 3,022 | | | | 2,783 | | | | 4,175 | | | | 4,045 | | | | 4,013 | | | | 3,716 | |
Income/(Loss) before income taxes | | | (152 | ) | | | 595 | | | | 670 | | | | 701 | | | | 64 | | | | (2,420 | ) | | | 159 | | | | (384 | ) |
| Total Company | |
Income/(Loss) before income taxes | | | (1,620 | ) | | | 2,371 | | | | 1,215 | | | | 1,060 | | | | 286 | | | | (9,059 | ) | | | (573 | ) | | | (5,152 | ) |
| | |
| Amounts Attributable to Ford Motor Company Common and Class B Shareholders | |
Income/(Loss) from continuing operations before cumulative effects of changes in accounting principles | | | (1,427 | ) | | | 2,256 | | | | 997 | | | | 886 | | | | 69 | | | | (8,705 | ) | | | (161 | ) | | | (5,978 | ) |
Net income/(loss) | | | (1,427 | ) | | | 2,261 | | | | 997 | | | | 886 | | | | 70 | | | | (8,697 | ) | | | (161 | ) | | | (5,978 | ) |
| | | | | | | | | | | | | | | | | | | | | | | | | | | | | | | | | |
| Common and Class B per share from income/(loss) from continuing operations before cumulative effects of changes in accounting principles | |
Basic | | | (0.60 | ) | | | 0.75 | | | | 0.31 | | | | 0.27 | | | | 0.03 | | | | (3.89 | ) | | | (0.07 | ) | | | (2.51 | ) |
Diluted | | | (0.60 | ) | | | 0.69 | | | | 0.29 | | | | 0.25 | | | | 0.03 | | | | (3.89 | ) | | | (0.07 | ) | | | (2.51 | ) |
|
| | | | | | | | | | | | | | | | | | | | | | | | | | | | | | | |
| | 2011 | | 2010 |
| Automotive Sector | First Quarter | | Second Quarter | | Third Quarter | | Fourth Quarter | | First Quarter | | Second Quarter | | Third Quarter | | Fourth Quarter |
| Sales | $ | 31,038 |
| | $ | 33,476 |
| | $ | 31,043 |
| | $ | 32,611 |
| | $ | 28,894 |
| | $ | 32,564 |
| | $ | 27,592 |
| | $ | 30,230 |
|
| Operating income/(loss) | 2,119 |
| | 1,878 |
| | 1,224 |
| | 542 |
| | 1,535 |
| | 2,312 |
| | 1,334 |
| | 608 |
|
| Income/(Loss) before income taxes | 2,070 |
| | 2,004 |
| | 1,241 |
| | 935 |
| | 1,320 |
| | 1,972 |
| | 1,126 |
| | (272 | ) |
| Financial Services Sector | |
| | |
| | |
| | |
| | |
| | |
| | |
| | |
|
| Revenues | 2,076 |
| | 2,051 |
| | 2,004 |
| | 1,965 |
| | 2,672 |
| | 2,503 |
| | 2,301 |
| | 2,198 |
|
| Income/(Loss) before income taxes | 706 |
| | 602 |
| | 605 |
| | 518 |
| | 815 |
| | 875 |
| | 761 |
| | 552 |
|
| | | | | | | | | | | | | | | | |
| Total Company | | | | | | | | | | | | | | | |
| Income/(Loss) before income taxes | 2,776 |
| | 2,606 |
| | 1,846 |
| | 1,453 |
| | 2,135 |
| | 2,847 |
| | 1,887 |
| | 280 |
|
| | | | | | | | | | | | | | | | |
| Amounts Attributable to Ford Motor Company Common and Class B Shareholders |
| Income/(Loss) from continuing operations before cumulative effects of changes in accounting principles | 2,551 |
| | 2,398 |
| | 1,649 |
| | 13,615 |
| | 2,085 |
| | 2,599 |
| | 1,687 |
| | 190 |
|
| Net income/(loss) | 2,551 |
| | 2,398 |
| | 1,649 |
| | 13,615 |
| | 2,085 |
| | 2,599 |
| | 1,687 |
| | 190 |
|
| | | | | | | | | | | | | | | | |
| Common and Class B per share from income/(loss) from continuing operations before cumulative effects of changes in accounting principles |
| Basic | 0.68 |
| | 0.63 |
| | 0.43 |
| | 3.58 |
| | 0.62 |
| | 0.76 |
| | 0.49 |
| | 0.05 |
|
| Diluted | 0.61 |
| | 0.59 |
| | 0.41 |
| | 3.40 |
| | 0.50 |
| | 0.61 |
| | 0.43 |
| | 0.05 |
|
Certain of the quarterly results identified above include material unusual or infrequently occurring items as follows:
The pre-tax lossincome of $1.6$1.5 billion in the firstfourth quarter of 20092011 includes a $1.1 billion$401 million gain (net of transaction costs) related to Ford Credit's acquisition of $2.2 billion principal amountthe sale of our secured term loan for $1.1Russian operations to the newly-created FordSollers joint venture, which began operations on October 1, 2011.
The net income/(loss) attributable to Ford Motor Company of $13.6 billion in the fourth quarter of cash,2011 includes a $292$12.4 billion favorable item, reflecting the release of almost all of the valuation allowance against our net deferred tax assets.
The pre-tax income of $280 million reduction in the fourth quarter of expense related2010 includes a $962 million loss on the conversion of our 2016 and 2036 Convertible Notes to a change in benefits and our ability to redeploy employees, and a $650 million impairment charge related to our total investment in Volvo.Ford Common Stock.
FORD MOTOR COMPANY AND SUBSIDIARIES
NOTES TO THE FINANCIAL STATEMENTS
NOTE 30. SELECTED QUARTERLY FINANCIAL DATA (unaudited) (Continued)
The pre-tax income of $2.4 billion in the second quarter of 2009 includes a $2.2 billion gain (net of transaction costs, unamortized discounts, premiums and fees) related to Ford Credit's acquisition of $3.4 billion principal amount of our public unsecured debt securities for $1.1 billion, a $1.2 billion gain related to a conversion offer on our 2036 Convertible Notes, and a $281 million foreign exchange translation loss related to the liquidation of Progress Ford Sales Limited.
The pre-tax income of $1.1 billion in the fourth quarter of 2009 includes a $310 million charge related to the announced closure of our St. Thomas Assembly Plant in Canada, and a $264 million charge related to the settlement of the UAW retiree health care obligation.
The pre-tax income of $286 million in the first quarter of 2008 includes $340 million in charges related to worldwide personnel-reduction programs.
The pre-tax loss of $9.1 billion in the second quarter of 2008 includes a $5.3 billion impairment charge related to North America long-lived assets, a $2.1 billion impairment charge related to Ford Credit operating leases in its North America segment, and a $285 million loss related to the sale of our ACH glass business.
The pre-tax loss of $573 million in the third quarter of 2008 includes a $2.6 billion OPEB curtailment gain, a $344 million reduction of expense primarily related to employees at three ACH plants who were no longer probable to be permanently idled, and a $290 million loss related to returns on the TAA.
The pre-tax loss of $5.2 billion in the fourth quarter of 2008 reflects the sudden and dramatic decline in vehicle industry sales volume, particularly in the United State and Europe, and a $259 million loss related to returns on the TAA.
NOTE 31. COMMITMENTS AND CONTINGENCIES
Guarantees are recorded at fair value at the inception of the guarantee. Litigation and claims are accrued when losses are deemed probable and reasonably estimable.
Estimated warranty costs and additional service actions are accrued for at the time the vehicle is sold to a dealer, including costs for basic warranty coverage on vehicles sold, product recalls, and other customer service actions. Fees or premiums for the issuance of extended service plans are recognized in income over the contract period in proportion to the costs expected to be incurred in performing services under the contract.
Guarantees
At December 31, 20092011 and 2008,2010, the following guarantees and indemnifications were issued and outstanding:
Guarantees related to affiliates and third parties. We guarantee debt and lease obligations of certain joint ventures, as well as certain financial obligations of outside third parties, including suppliers, to support our business and economic growth. Expiration dates vary through 2017, and guarantees will terminate on payment and/or cancellation of the obligation. A payment by us would be triggered by failure of the guaranteedjoint venture or other third party to fulfill its obligation covered by the guarantee. In some circumstances, we are entitled to recover from the third party amounts paid by us under the guarantee. However, our ability to enforce these rights is sometimes stayed until the guaranteed party is paid in full, and may be limited in the event of insolvency of the third party or other circumstances. MaximumThe maximum potential payments under guarantees total $215 million for 2009 and $206 million for 2008. Thethe carrying value of our recorded liabilities related to guarantees was $30 million and $24 million at December 31 2009 and 2008, respectively. Ourwere as follows (in millions):
|
| | | | | | | |
| | 2011 | | 2010 |
| Maximum potential payments | $ | 444 |
| | $ | 500 |
|
| Carrying value of recorded liabilities related to guarantees | 31 |
| | 43 |
|
We regularly review our performance risk under these guarantees, is reviewed regularly, andwhich has resulted in no changes to our initial valuations.
FORD MOTOR COMPANY AND SUBSIDIARIES
NOTES TO THE FINANCIAL STATEMENTS
NOTE 31. COMMITMENTS AND CONTINGENCIES(Continued)
In December 2005, we completed the sale of Hertz. As part of this transaction, we provided cash-collateralized letters of credit in an aggregate amount of $200 million to support the asset-backed portion of the buyer's financing for the transaction. Our commitment to provide the letters of credit expires no later than December 21, 2011 and supports the payment obligations of Hertz Vehicle Finance LLC under one or more series of asset-backed notes. The letters of credit can be drawn upon on any date funds allocated to pay interest on the asset-backed notes are insufficient to pay scheduled interest payments, principal amounts due on the legal final maturity date, or when the balance of assets supporting the asset-backed notes is less than the outstanding balance of the asset-backed notes. The carrying value of our deferred gain related to the letters of credit was $9 million and $14 million at December 31, 2009 and 2008, respectively. We believe future performance under these letters of credit is remote.
Indemnifications. In the ordinary course of business, we execute contracts involving indemnifications standard in the industry and indemnifications specific to a transaction, such as the sale of a business. These indemnifications might include claims relating to any of the following: environmental, tax, and shareholder matters; intellectual property rights; power generation contracts; governmental regulations and employment-related matters; dealers, supplier, and other commercial contractual relationships; and financial matters, such as securitizations. Performance under these indemnities generally would be triggered by a breach of terms of the contract or by a third-party claim.
As part of the sale of Jaguar Land Rover, we provided the buyer a customary set of indemnifications, some of which were subject to an aggregate limit of $805 million (which expired June 1, 2009) and some of which (e.g., warranties related to our capacity and authority to enter into the transaction, our ownership of the companies sold and the shares of those companies being free from encumbrances and certain tax covenants) are unlimited in amount. Outstanding claims relating to the $805 million indemnification as well as indemnifications relating to certain warranties described in the preceding sentence continue. We believe that the probability of payment under these claims and indemnifications is remote.
We also are party to numerous indemnifications which do not limit potential payment; therefore, we are unable to estimate a maximum amount of potential future payments that could result from claims made under these indemnities.
Litigation and Claims
Various legal actions, governmental investigations, and proceedings and claims (generally, "matters") are pending or may be instituted or asserted in the future against us, includingus. These include but are not limited to thosematters arising out of alleged defects in our products; product warranties; governmental regulations relating to safety, emissions and fuel economy or other matters; government incentives related to capital investments;incentives; tax matters; financial services; employment-related matters; dealer, supplier, and other contractual relationships; intellectual property rights; product warranties; environmental matters; shareholder or investor matters; and financial reporting matters. Certain of the pending legal actions are, or purport to be, class actions. Some of the foregoing matters involve or may involve compensatory, punitive, or antitrust or other treble damage claims in very large amounts, or demands for recall campaigns, environmental remediation programs, sanctions, loss of government incentives, assessments, or other relief, which, if granted, would require very large expenditures.
LitigationThe extent of our financial exposure to these matters is difficult to estimate. Many matters do not specify a dollar amount for damages, and many others specify only a jurisdictional minimum. To the extent an amount is asserted, our historical experience suggests that in most instances the amount asserted is not a reliable indicator of the ultimate outcome.
FORD MOTOR COMPANY AND SUBSIDIARIES
NOTES TO THE FINANCIAL STATEMENTS
NOTE 30. COMMITMENTS AND CONTINGENCIES (Continued)
In evaluating for accrual and disclosure purposes matters filed against us, we take into consideration factors such as our historical experience with matters of a similar nature, the specific facts and circumstances asserted, the likelihood of our prevailing, and the severity of any potential loss. We reevaluate and update our accruals as matters progress over time.
For the majority of matters, which generally arise out of alleged defects in our products, we establish an accrual based on our extensive historical experience with similar matters, and we do not believe that there is a reasonably possible outcome materially in excess of our accrual.
For the remaining matters, where our historical experience with similar matters is of more limited value (i.e., "non-pattern matters"), we evaluate matters primarily based on the individual facts and circumstances. For non-pattern matters, we evaluate whether there is a reasonable possibility of material loss in excess of any accrual. Our current estimate of this reasonably possible loss in excess of our accruals for all material matters currently includes items of the following nature: (i) a civil matter in which we are appealing an adverse judgment, and (ii) non-U.S. indirect tax matters. We currently estimate the aggregate risk of this reasonably possible loss in excess of our accruals for all material matters to be a range of up to about $3.4 billion. Our estimate includes matters in which an adverse judgment has been entered against the Company that we believe is unlikely to be upheld on appeal.
As noted, the litigation process is subject to many uncertainties, and the outcome of individual litigated matters is not predictable with assurance. We have established accruals for certain of the matters discussed in the foregoing paragraph where lossesOur assessments are deemed probable and reasonably estimable. It is reasonably possible, however, that some of the matters discussed in the foregoing paragraph for which accruals have not been established could be decided unfavorably to us and could require us to pay damages or make other expenditures in amounts or a range of amounts that cannot be estimated at December 31, 2009. We do not reasonably expect, based on our analysis,knowledge and experience, but the ultimate outcome of any matter could require payment substantially in excess of the amount that such matters wouldwe have a material effect on future financial statements for a particular year, although such an outcome is possible.accrued and/or disclosed.
Warranty
Included in the warranty cost accruals are the costs for basic warranty coverages on vehicles sold. Additional service actions, such asand product recalls and other customer service actions, are not included in the warranty reconciliation below, but are also accrued for at the time of sale. Estimates for warrantyon products sold. These costs are madeestimates based primarily on historical warranty claim experience. Product warrantyWarranty accruals accounted for in Accrued liabilities and deferred revenue at December 31 were as follows (in millions):
| | | | | | | |
Beginning balance | | $ | 3,346 | | | $ | 4,209 | |
Payments made during the period | | | (2,481 | ) | | | (2,747 | ) |
Changes in accrual related to warranties issued during the period | | | 1,561 | | | | 1,969 | |
Changes in accrual related to pre-existing warranties | | | 672 | | | | 153 | |
Foreign currency translation and other | | | 121 | | | | (238 | ) |
Ending balance | | $ | 3,219 | | | $ | 3,346 | |
FS - 91 |
| | | | | | | |
| | 2011 | | 2010 |
| Beginning balance | $ | 3,855 |
| | $ | 4,204 |
|
| Payments made during the period | (2,799 | ) | | (2,475 | ) |
| Changes in accrual related to warranties issued during the period | 2,215 |
| | 1,801 |
|
| Changes in accrual related to pre-existing warranties | 690 |
| | 387 |
|
| Foreign currency translation and other | (46 | ) | | (62 | ) |
| Ending balance | $ | 3,915 |
| | $ | 3,855 |
|
Excluded from the table above are costs accrued for customer satisfaction actions.
Report of Independent Registered Public Accounting Firm
To the Board of Directors and Stockholders
Ford Motor Company:
In our opinion, the consolidated financial statements listed in the index appearing under Item 15(a)(1) present fairly, in all material respects, the financial position of Ford Motor Company and its subsidiaries at December 31, 2009 and December 31, 2008, and the results of their operations and their cash flows for each of the three years in the period ended December 31, 2009 in conformity with accounting principles generally accepted in the United States of America. In addition, in our opinion, the financial statement schedule listed in the index appearing under Item 15(a)(2) presents fairly, in all material respects, the information set forth therein when read in conjunction with the related consolidated financial statements. Also in our opinion, the Company maintained, in all material respects, effective internal control over financial reporting as of December 31, 2009, based on criteria established in Internal Control - Integrated Framework issued by the Committee of Sponsoring Organizations of the Treadway Commission (COSO). The Company's management is responsible for these financial statements and financial statement schedule, for maintaining effective internal control over financial reporting and for its assessment of the effectiveness of internal control over financial reporting, included in Management's Report on Internal Control Over Financial Reporting appearing under Item 9A. Our responsibility is to express opinions on these financial statements, on the financial statement schedule, and on the Company's internal control over financial reporting based on our integrated audits. We conducted our audits in accordance with the standards of the Public Company Accounting Oversight Board (United States). Those standards require that we plan and perform the audits to obtain reasonable assurance about whether the financial statements are free of material misstatement and whether effective internal control over financial reporting was maintained in all material respects. Our audits of the financial statements included examining, on a test basis, evidence supporting the amounts and disclosures in the financial statements, assessing the accounting principles used and significant estimates made by management, and evaluating the overall financial statement presentation. Our audit of internal control over financial reporting included obtaining an understanding of internal control over financial reporting, assessing the risk that a material weakness exists, and testing and evaluating the design and operating effectiveness of internal control based on the assessed risk. Our audits also included performing such other procedures as we considered necessary in the circumstances. We believe that our audits provide a reasonable basis for our opinions.
Our audits were conducted for the purpose of forming an opinion on the basic financial statements taken as a whole. The accompanying sector balance sheets and the related sector statements of income and of cash flows are presented for purposes of additional analysis and are not a required part of the basic financial statements. Such information has been subjected to the auditing procedures applied in the audit of the basic financial statements and, in our opinion, are fairly stated in all material respects in relation to the basic financial statements taken as a whole.
As discussed in Note 1 to the consolidated financial statements, the Company changed the manner in which it accounts for noncontrolling interests and convertible debt instruments that may be settled in cash upon conversion (including partial cash settlement) in 2009. As discussed in Note 23 to the consolidated financial statements, the Company changed the manner in which it accounts for uncertain tax positions in 2007.
A company’s internal control over financial reporting is a process designed to provide reasonable assurance regarding the reliability of financial reporting and the preparation of financial statements for external purposes in accordance with generally accepted accounting principles. A company’s internal control over financial reporting includes those policies and procedures that (i) pertain to the maintenance of records that, in reasonable detail, accurately and fairly reflect the transactions and dispositions of the assets of the company; (ii) provide reasonable assurance that transactions are recorded as necessary to permit preparation of financial statements in accordance with generally accepted accounting principles, and that receipts and expenditures of the company are being made only in accordance with authorizations of management and directors of the company; and (iii) provide reasonable assurance regarding prevention or timely detection of unauthorized acquisition, use, or disposition of the company’s assets that could have a material effect on the financial statements.
Because of its inherent limitations, internal control over financial reporting may not prevent or detect misstatements. Also, projections of any evaluation of effectiveness to future periods are subject to the risk that controls may become inadequate because of changes in conditions, or that the degree of compliance with the policies or procedures may deteriorate.
/s/ PricewaterhouseCoopers LLP
PricewaterhouseCoopers LLP
Detroit, Michigan
February 25, 2010
FORD MOTOR COMPANY AND SUBSIDIARIES
Schedule II — Valuation and Qualifying Accounts
(in millions)
| | | | Balance at Beginning of Period | | | Charged to Costs and Expenses | | | | | | | | | Balance at Beginning of Period | | Charged to Costs and Expenses | | Deductions | | Balance at End of Period |
| For the Year Ended December 31, 2011 | | | | | | | | | | | |
| Allowances deducted from assets | | | | | | | | | | | |
| Credit losses | | | $ | 984 |
| | $ | (115 | ) | | $ | 299 |
| (a) | | $ | 570 |
|
| Doubtful receivables | | | 116 |
| | (69 | ) | | (63 | ) | (c) | | 110 |
|
| Inventories (primarily service part obsolescence) | | | 245 |
| | 4 |
| (d) | | — |
| | | 249 |
|
| Deferred tax assets | | | 15,664 |
| | (14,119 | ) | (e) | | — |
| | 1,545 |
|
| Total allowances deducted from assets | | | $ | 17,009 |
| | $ | (14,299 | ) | | $ | 236 |
| | | $ | 2,474 |
|
| | | | | | | | | | |
| For the Year Ended December 31, 2010 | | | |
| | |
| | | |
| | | |
|
| Allowances deducted from assets | | | |
| | |
| | | |
| | | |
|
| Credit losses | | | $ | 1,757 |
| | $ | (211 | ) | | | $ | 562 |
| (a) | | $ | 984 |
|
| Doubtful receivables (b) | | | 276 |
| | (98 | ) | | | 62 |
| (c) | | 116 |
|
| Inventories (primarily service part obsolescence) (b) | | | 242 |
| | 3 |
| (d) | | — |
| | | 245 |
|
| Deferred tax assets | | | 17,396 |
| | 194 |
| (e) | | 1,926 |
| (f) | | 15,664 |
|
| Total allowances deducted from assets | | | $ | 19,671 |
| | $ | (112 | ) | | | $ | 2,550 |
| | | $ | 17,009 |
|
| | | | | | | | | | |
| For the Year Ended December 31, 2009 | | | | | | | | | | | | | | |
| | |
| | | |
| | | |
|
| Allowances deducted from assets | | | | | | | | | | | | | | |
| | |
| | | |
| | | |
|
Credit losses | | $ | 1,681 | | | $ | 977 | | | $ | 1,093 | | (a) | | $ | 1,565 | | | $ | 1,713 |
| | $ | 1,172 |
| | | $ | 1,128 |
| (a) | | $ | 1,757 |
|
Doubtful receivables (b) | | | 204 | | | | 291 | | | | (4 | ) | (c) | | | 499 | | | 142 |
| | 93 |
| | | (41 | ) | (c) | | 276 |
|
Inventories (primarily service part obsolescence) (b) | | | 280 | | | | (14 | ) | (d) | | | — | | | | 266 | | | 272 |
| | (30 | ) | (d) | | — |
| | | 242 |
|
| Deferred tax assets | | | 17,268 | | | | 183 | | (f) | | | — | | | | 17,451 | | | 17,268 |
| | 128 |
| (e) | | — |
| | | 17,396 |
|
Total allowances deducted from assets | | $ | 19,433 | | | $ | 1,437 | | | $ | 1,089 | | | $ | 19,781 | | | $ | 19,395 |
| | $ | 1,363 |
| | | $ | 1,087 |
| | | $ | 19,671 |
|
| | | | | | | | | | | | | | | | | | |
| For the Year Ended December 31, 2008 | | | | | | | | | | | | | | | | | |
| Allowances deducted from assets | | | | | | | | | | | | | | | | | |
Credit losses | | $ | 1,102 | | | $ | 1,773 | | | $ | 1,194 | | (a) | | $ | 1,681 | | |
Doubtful receivables (b) | | | 175 | | | | 55 | | | | 26 | | (c) | | | 204 | | |
Inventories (primarily service part obsolescence) (b) | | | 309 | | | | (29 | ) | (d) | | | — | | | | 280 | | |
Deferred tax assets (e) | | | 7,988 | | | | 9,280 | | (f) | | | — | | | | 17,268 | | |
Total allowances deducted from assets | | $ | 9,574 | | | $ | 11,079 | | | $ | 1,220 | | | $ | 19,433 | | |
| | | | | | | | | | | | | | | | | | |
| For the Year Ended December 31, 2007 | | | | | | | | | | | | | | | | | |
| Allowances deducted from assets | | | | | | | | | | | | | | | | | |
Credit losses | | $ | 1,121 | | | $ | 592 | | | $ | 611 | | (a) | | $ | 1,102 | | |
Doubtful receivables (b) | | | 154 | | | | 6 | | | | (15 | ) | (c) | | | 175 | | |
Inventories (primarily service part obsolescence) (b) | | | 350 | | | | (41 | ) | (d) | | | — | | | | 309 | | |
Deferred tax assets (e) | | | 7,293 | | | | 695 | | (f) | | | — | | | | 7,988 | | |
Total allowances deducted from assets | | $ | 8,918 | | | $ | 1,252 | | | $ | 596 | | | $ | 9,574 | | |
___________________
| |
| (a) | Finance receivables and lease investments deemed to be uncollectible and other changes, principally amounts related to finance receivables sold and translation adjustments. |
| |
| (b) | Excludes Jaguar Land Rover and Volvo. |
| |
| (c) | Accounts and notes receivable deemed to be uncollectible as well as translation adjustments. |
| |
| (d) | Net change in inventory allowances. Excludes Jaguar Land Rover and Volvo |
| |
| (e) | Includes Jaguar Land Rover. |
(f) | Includes $1.1 billion, $0, $572 million, and $1.1 billion in 2011, 2010, and $156 million in 2009, 2008, and 2007, respectively, of valuation allowance for deferred tax assets through Accumulated other comprehensive income/(loss)and $(879)$(14.1) billion, $(378) million $8.2 billion, , and $539 million(1) billion in 2009, 2008,2011, 2010, and 2007,2009, respectively, of valuation allowance for deferred tax assets through the statement of operations.operations. |
| |
| (f) | Deductions relate primarily to the disposition of Volvo. |
FSS - 1FSS-1