0001161154 eto:FirstTargetDistributionMember us-gaap:LimitedPartnerMember 2018-10-01 2018-12-31
UNITED STATES
SECURITIES AND EXCHANGE COMMISSION
Washington, D.C. 20549
FORM 10-K
|
| |
ý☒ | ANNUAL REPORT PURSUANT TO SECTION 13 OR 15(d) OF THE SECURITIES EXCHANGE ACT OF 1934 |
| For the fiscal year ended December 31, 2017 |
ORFor the fiscal year ended December 31, 2019
or
|
| |
¨☐ | TRANSITION REPORT PURSUANT TO SECTION 13 OR 15(d) OF THE SECURITIES EXCHANGE ACT OF 1934 |
Commission file number 1-31219
ENERGY TRANSFER PARTNERS,OPERATING, L.P.
(Exact name of registrant as specified in its charter)
|
| | |
| Delaware | | 73-1493906 |
| (state or other jurisdiction of incorporation or organization) | | (I.R.S. Employer Identification No.) |
8111 Westchester Drive, Suite 600, Dallas, Texas75225
(Address of principal executive offices) (zip code)
Registrant’s telephone number, including area code: (214) (214) 981-0700
Securities registered pursuant to Section 12(b) of the Act:
|
| | | | |
| Title of each class | | Trading Symbol(s) | | Name of each exchange on which registered |
Common7.375% Series C Fixed-to-Floating Rate Cumulative Redeemable Perpetual Preferred Units | | ETPprC | | New York Stock Exchange |
| 7.625% Series D Fixed-to-Floating Rate Cumulative Redeemable Perpetual Preferred Units | | ETPprD | | New York Stock Exchange |
| 7.600% Series E Fixed-to-Floating Rate Cumulative Redeemable Perpetual Preferred Units | | ETPprE | | New York Stock Exchange |
| 7.500% Senior Notes due 2020 | | ETP 20 | | New York Stock Exchange |
| 4.250% Senior Notes due 2023 | | ETP 23 | | New York Stock Exchange |
| 5.875% Senior Notes due 2024 | | ETP 24 | | New York Stock Exchange |
| 5.500% Senior Notes due 2027 | | ETP 27 | | New York Stock Exchange |
Securities registered pursuant to section 12(g) of the Act: None
Indicate by check mark if the registrant is a well-known seasoned issuer, as defined in Rule 405 of the Securities Act.
Yesý No ¨
Indicate by check mark if the registrant is not required to file reports pursuant to Section 13 or Section 15(d) of the Act.
Yes ¨Noý
Indicate by check mark whether the registrant (1) has filed all reports required to be filed by Section 13 or 15(d) of the Securities Exchange Act of 1934 during the preceding 12 months (or for such shorter period that the registrant was required to file such reports) and (2) has been subject to such filing requirements for the past 90 days.
Yesý No ¨
Indicate by check mark whether the registrant has submitted electronically and posted on its corporate Web site, if any, every Interactive Data File required to be submitted and posted pursuant to Rule 405 of Regulation S-T during the preceding 12 months (or for such shorter period that the registrant was required to submit and post such files).
Yesý No �� ¨
Indicate by check mark if disclosure of delinquent filers pursuant to Item 405 of Regulation S-K is not contained herein, and will not be contained, to the best of the registrant’s knowledge, in definitive proxy or information statements incorporated by reference in Part III of this Form 10-K or any amendment to this Form 10-K. ¨
Indicate by check mark whether the registrant is a large accelerated filer, an accelerated filer, a non-accelerated filer, a smaller reporting company, or an emerging growth company. See the definitions of “large accelerated filer,” “accelerated filer,” “smaller reporting company” and “emerging growth company” in Rule 12b-2 of the Exchange Act.
Large accelerated filer ý¨ Accelerated filer ¨Non-accelerated filer¨ý Smaller reporting company ¨ ☐Emerging growth company ¨☐
If an emerging growth company, indicate by check mark if the registrant has elected not to use the extended transition period for complying with any new or revised financial accounting standards provided pursuant to Section 13(a) of the Exchange Act. ¨
Indicate by check mark whether the registrant is a shell company (as defined in Rule 12b-2 of the Exchange Act).
Yes ¨☐ No ý
The aggregate market value as of June 30, 2017, of the registrant’s Common Units held by non-affiliates of the registrant, based on the reported closing price of such Common Units on the New York Stock Exchange on such date, was $21.66 billion. Common Units held by each executive officer and director and by each person who owns 5% or more of the outstanding Common Units have been excluded in that such persons may be deemed to be affiliates. This determination of affiliate status is not necessarily a conclusive determination for other purposes.
At February 16, 2018, the registrant had 1,164,024,480 Common Units outstanding.
DOCUMENTS INCORPORATED BY REFERENCE
None
TABLE OF CONTENTS
|
| | |
| | | PAGE |
|
| | | |
| ITEM 1. | | |
| | | |
| ITEM 1A. | | |
| | | |
| ITEM 1B. | | |
| | | |
| ITEM 2. | | |
| | | |
| ITEM 3. | | |
| | | |
| ITEM 4. | | |
| | | |
|
| | | |
| ITEM 5. | | |
| | | |
| ITEM 6. | | |
| | | |
| ITEM 7. | | |
| | | |
| ITEM 7A. | | |
| | | |
| ITEM 8. | | |
| | | |
| ITEM 9. | | |
| | |
ITEM 9A. | | |
| | |
ITEM 9B. | | |
| | |
|
| | |
ITEM 10. | | |
| | |
ITEM 11. | | |
| | | |
| ITEM 9A. | | |
| | |
| ITEM 9B. | | |
| | |
|
| | |
| ITEM 10. | | |
| | |
| ITEM 11. | | |
| | |
| ITEM 12. | | |
| | | |
| ITEM 13. | | |
| | | |
| ITEM 14. | | |
| | | |
|
| | | |
| ITEM 15. | | |
| | | |
| ITEM 16. | | |
| | | |
| | | |
Forward-Looking Statements
Certain matters discussed in this report, excluding historical information, as well as some statements by Energy Transfer Partners,Operating, L.P. (the “Partnership,” or “ETP”“ETO”) in periodic press releases and some oral statements of the Partnership’s officials during presentations about the Partnership, include forward-looking statements. These forward-looking statements are identified as any statement that does not relate strictly to historical or current facts. Statements using words such as “anticipate,” “believe,” “intend,” “project,” “plan,” “expect,” “continue,” “estimate,” “goal,” “forecast,” “may,” “will” or similar expressions help identify forward-looking statements. Although the Partnership and its General Partner believe such forward-looking statements are based on reasonable assumptions and current expectations and projections about future events, no assurance can be given that such assumptions, expectations, or projections will prove to be correct. Forward-looking statements are subject to a variety of risks, uncertainties and assumptions. If one or more of these risks or uncertainties materialize, or if underlying assumptions prove incorrect, the Partnership’s actual results may vary materially from those anticipated, projected or expected, forecasted, estimated or expressed in forward-looking statements since many of the factors that determine these results are subject to uncertainties and risks that are difficult to predict and beyond management’s control. For additional discussion of risks, uncertainties and assumptions, see “Item 1A. Risk Factors” included in this annual report.
Definitions
The following is a list of certain acronyms and terms generally used in the energy industry and throughout this document:
|
| | | |
| | /d | | per day |
| | | | |
| | AmeriGas | | AmeriGas Partners, L.P. |
| | | |
| AOCI | | accumulated other comprehensive income (loss) |
| | | |
| Aqua – PVR | | Aqua – PVR Water Services, LLC |
| | | | |
| | AROs | | asset retirement obligations |
| | | | |
| | Bbls | | barrels |
| | | | |
| | BBtu | | billion British thermal units |
| | | | |
| | Bcf | | billion cubic feet |
| | | | |
| | Btu | | British thermal unit, an energy measurement used by gas companies to convert the volume of gas used to its heat equivalent, and thus calculate the actual energy used |
| | | | |
| | Capacity | | capacity of a pipeline, processing plant or storage facility refers to the maximum capacity under normal operating conditions and, with respect to pipeline transportation capacity, is subject to multiple factors (including natural gas injections and withdrawals at various delivery points along the pipeline and the utilization of compression) which may reduce the throughput capacity from specified capacity levels |
| | | | |
| | CDM | | CDM Resource Management LLC |
| | | |
| CDM E&T | | and CDM Environmental & Technical Services LLC, collectively |
| | | | |
| | Citrus | | Citrus, LLC |
| | | | |
| | CrossCountry | | CrossCountry Energy, LLC |
| | | |
| Dakota Access | | Dakota Access, LLC, a less than wholly-owned subsidiary of ETO |
| | | | |
| | DOE | | United States Department of Energy |
| | | | |
| | DOJ | | United States Department of Justice |
| | | | |
| | DOT | | United States Department of Transportation |
| | | | |
| | ELG | | Edwards Lime Gathering LLC |
| | | |
| EPA | | United States Environmental Protection Agency |
| | | | |
| | ETC FEPET | | ETC Fayetteville Express Pipeline, LLCEnergy Transfer LP, the parent company of ETO |
| | | | |
| ETC MEP | | ETC Midcontinent Express Pipeline, L.L.C. |
| | | |
|
| | | |
| | ETC OLP | | La Grange Acquisition, L.P., which conducts business under the assumed name of Energy Transfer Company and is a wholly-owned subsidiary of ETO |
| | | |
| ETC Sunoco | | ETC Sunoco Holdings LLC (formerly, Sunoco Inc.), a wholly-owned subsidiary of ETO |
| | | | |
| | ETC Tiger | | ETC Tiger Pipeline, LLC, a wholly-owned subsidiary of ETO |
| | | | |
| | ETCO | | Energy Transfer Crude Oil Company, LLC, |
| | | |
| ETE | | Energy Transfer Equity, L.P., a publicly traded partnership and the owner of ETP LLC for the periods presented herein |
| | | |
| ETE Holdings | | ETE Common Holdings, LLC, aless than wholly-owned subsidiary of ETEETO |
| | | | |
| | ETP GP | | Energy Transfer Partners GP, L.P., the general partner of ETPETO |
| | | | |
|
| | | |
| | ETP Holdco | | ETP Holdco Corporation, a wholly owned subsidiary of ETO |
| | | | |
| | ETP LLC | | Energy Transfer Partners, L.L.C., the general partner of ETP GP |
| | | | |
| | Exchange Act | | Securities Exchange Act of 1934, as amended |
| | | | |
| | ExxonMobil | | Exxon Mobil Corporation |
| | | | |
| | FEP | | Fayetteville Express Pipeline LLC |
| | | | |
| | FERC | | Federal Energy Regulatory Commission |
| | | | |
| | FGT | | Florida Gas Transmission Company, LLC, a wholly-owned subsidiary of Citrus |
| | | | |
| | GAAP | | accounting principles generally accepted in the United States of America |
| | | | |
| | Gulf States | | Gulf States Transmission LLC, a wholly-owned subsidiary of ETO |
| | | |
| HFOTCO | | Houston Fuel Oil Terminal Company, a wholly-owned subsidiary of ETO, which owns the Houston Terminal |
| | | | |
| | HPC | | RIGS Haynesville Partnership Co. and its, a wholly-owned subsidiary Regency Intrastate Gas LPof ETO |
| | | | |
| | IDRs | | incentive distribution rights |
| | | | |
| | KMI | | Kinder Morgan Inc. |
| | | | |
| | Lake Charles LNG | | Lake Charles LNG Company, LLC (previously named Trunkline LNG Company, LLC), a wholly-owned subsidiary of ETEETO |
| | | | |
| | LCL | | Lake Charles LNG Export Company, LLC, |
| | | |
| Legacy ETP Preferred Units | | legacy ETP Series A cumulative convertible preferred units a wholly-owned subsidiary of ETO |
| | | | |
| | LIBOR | | London Interbank Offered Rate |
| | | | |
| | LNG | | liquefied natural gas |
| | | | |
| | Lone Star | | Lone Star NGL LLC, |
| | | |
| LPG | | liquefied petroleum gas a wholly-owned subsidiary of ETO |
| | | | |
| | MBbls | | thousand barrels |
| | | | |
| | MEP | | Midcontinent Express Pipeline LLC |
| | | | |
| | Mi Vida JV | | Mi Vida JV LLC |
| | | |
| Mid-Valley | | Mid-Valley Pipeline Company, a wholly-owned subsidiary of ETO |
| | | |
| MMBls | | million barrels |
| | | | |
| | MMcf | | million cubic feet |
| | | | |
| | MTBE | | methyl tertiary butyl ether |
| | | | |
| | NGL | | natural gas liquid, such as propane, butane and natural gasoline |
| | | | |
| | NYMEX | | New York Mercantile Exchange |
| | | | |
| | NYSE | | New York Stock Exchange |
| | | | |
| | ORS | | Ohio River System LLC, a less than wholly-owned subsidiary of ETO |
| | | | |
| | OSHA | | federal Occupational Safety and Health Act |
|
| | | |
| | | | |
| | OTC | | over-the-counter |
| | | | |
| | Panhandle | | Panhandle Eastern Pipe Line Company, LP and its subsidiaries, wholly-owned by ETO |
| | | | |
| | PCBs | | polychlorinated biphenyls |
| | | | |
| | PennTex | | PennTex Midstream Partners, LP, acquired by ETO during 2016-2017 and now a wholly-owned subsidiary named ETC PennTex LLC |
| | | | |
| | PEP | | Permian Express Partners LLC, a less than wholly-owned subsidiary of ETO |
| | | |
|
| | | |
| PES | | Philadelphia Energy Solutions Refining and Marketing LLC, non-controlling interest owned by ETO |
| | | | |
| | PESPhillips 66 | | Philadelphia Energy SolutionsPhillips 66 Partners LP |
| | | | |
| | PHMSA | | Pipeline Hazardous Materials Safety Administration |
| | | | |
| | Phillips 66Preferred Unitholders | | Phillips 66 Partners LPUnitholders of the Series A Preferred Units, Series B Preferred Units, Series C Preferred Units, Series D Preferred Units, Series E Preferred Units, Series F Preferred Units and Series G Preferred Units, collectively |
| | | | |
| | Ranch JV | | Ranch Westex JV LLC |
| | | | |
| | Regency | | Regency Energy Partners LP, a wholly-owned subsidiary of ETO |
| | | | |
| | Retail Holdings | | ETP Retail Holdings, LLC, a wholly-owned subsidiary of ETPETO |
| | | | |
| | RIGS | | Regency Intrastate Gas System, a wholly-owned subsidiary of ETO |
| | | | |
| | Rover | | Rover Pipeline LLC, a less than wholly-owned subsidiary of ETPETO |
| | | | |
| | Sea Robin | | Sea Robin Pipeline Company, LLC, a wholly-owned subsidiary of Panhandle |
| | | | |
| | SEC | | Securities and Exchange Commission |
| | | | |
| | SemGroup | | SemGroup Corporation |
| | | |
| Series A Preferred Units | | 6.250% Series A Fixed-to-Floating Rate Cumulative Redeemable Perpetual Preferred Units |
| | | | |
| | Series B Preferred Units | | 6.625% Series B Fixed-to-Floating Rate Cumulative Redeemable Perpetual Preferred Units |
| | | |
| Series C Preferred Units | | 7.375% Series C Fixed-to-Floating Rate Cumulative Redeemable Perpetual Preferred Units |
| | | |
| Series D Preferred Units | | 7.625% Series D Fixed-to-Floating Rate Cumulative Redeemable Perpetual Preferred Units |
| | | |
| Series E Preferred Units | | 7.600% Series E Fixed-to-Floating Rate Cumulative Redeemable Perpetual Preferred Units |
| | | |
| Series F Preferred Units | | 6.750% Series F Fixed-Rate Reset Cumulative Redeemable Perpetual Preferred Units |
| | | |
| Series G Preferred Units | | 7.125% Series G Fixed-Rate Reset Cumulative Redeemable Perpetual Preferred Units |
| | | | |
| | Shell | | Royal Dutch Shell plc |
| | | | |
| | Southwest Gas | | Pan Gas Storage, LLC (d.b.a. Southwest Gas Storage Company) |
| | | | |
| | Sunoco GPSPLP | | Sunoco GP LLC, the general partnerPipeline L.P., a wholly-owned subsidiary of Sunoco LPETO |
| | | | |
| | Sunoco Logistics | | Sunoco Logistics Partners L.P., a wholly-owned subsidiary of ETO |
| | | | |
| | Sunoco LP(R&M) | | Sunoco LP (previously named Susser Petroleum Partners, LP) |
| | | |
| Sunoco Partners | | Sunoco Partners(R&M), LLC the general partner of Sunoco Logistics |
| | | |
| Susser | | Susser Holdings Corporation |
| | | | |
| | Transwestern | | Transwestern Pipeline Company, LLC, a wholly-owned subsidiary of ETO |
| | | | |
| | TRRC | | Texas Railroad Commission |
| | | | |
| | Trunkline | | Trunkline Gas Company, LLC, a wholly-owned subsidiary of Panhandle |
| | | |
| Unitholders | | Preferred Unitholders and our common unitholder (Energy Transfer LP), collectively |
| | | | |
| | USAC | | USA Compression Partners, LP, |
| | | |
| USAC Holdings | | USA Compression Holdings, LLC a wholly-owned subsidiary of ETO |
Adjusted EBITDA is a term used throughout this document, which we define as total Partnership earnings before interest, taxes, depreciation, depletion, amortization and other non-cash items, such as non-cash compensation expense, gains and losses on disposals of assets, the allowance for equity funds used during construction, unrealized gains and losses on commodity risk management activities, inventory valuation adjustments, non-cash impairment charges, losses on extinguishments of debt and
other non-operating income or expense items. Unrealized gains and losses on commodity risk management activities include unrealized gains and losses on commodity derivatives and inventory fair value adjustments (excluding lower of cost or market adjustments). Adjusted EBITDA reflectsreflect amounts for less than wholly-owned subsidiaries based on 100% of the subsidiaries’ results of operations and for unconsolidated affiliates based on the Partnership’s proportionate ownership.same recognition and measurement methods used to record equity in earnings of unconsolidated affiliates. Adjusted EBITDA related to unconsolidated affiliates excludes the same items with respect to the unconsolidated affiliate as those excluded from the calculation of Segment Adjusted EBITDA and consolidated Adjusted EBITDA, such as interest, taxes, depreciation, depletion, amortization and other non-cash items. Although these amounts are excluded from Adjusted EBITDA related to unconsolidated affiliates, such exclusion should not be understood to imply that we have control over the operations and resulting revenues and expenses of such affiliates. We do not control our unconsolidated affiliates; therefore, we do not control the earnings or cash flows of such affiliates. The use of Segment Adjusted EBITDA or Adjusted EBITDA related to unconsolidated affiliates as an analytical tool should be limited accordingly.
PART I
ITEM 1. BUSINESS
Overview
We (Energy Transfer Partners,Operating, L.P., a Delaware limited partnership, “ETP”“ETO” or the “Partnership”) are onea consolidated subsidiary of Energy Transfer LP (“ET”). In October 2018, ET completed the largest publicly traded master limited partnershipsmerger of ETO with a wholly-owned subsidiary of ET in a unit-for-unit exchange (the “Energy Transfer Merger”), as discussed further below, at which time the United States in terms of equity market capitalization (approximately $23.31 billion as of January 31, 2018). Partnership changed its name from Energy Transfer Partners, L.P. to Energy Transfer Operating, L.P.
We are managed by our general partner, Energy Transfer Partners GP, L.P. (our “General Partner” or “ETP GP”), and ETP GP is managed by its general partner, Energy Transfer Partners, L.L.C. (“ETP LLC”), which is wholly owned by Energy Transfer Equity, L.P., another publicly traded master limited partnership (“ETE”).ET. The primary activities in which we are engaged, all of which are in the United States, and the operating subsidiaries (collectively referred to as the “Operating Companies”) through which we conduct those activities are as follows:
| |
| • | natural gas operations, including the following: |
| |
| • | natural gas midstream and intrastate transportation and storage; |
| |
| • | interstate natural gas transportation and storage; and |
Natural gas operations, including the following:
natural gas midstream and intrastate transportation and storage; and
interstate natural gas transportation and storage.
Crudecrude oil, NGLsNGL and refined productproducts transportation, terminalling services and acquisition and marketing activities, as well as NGL storage and fractionation services.
In addition, we own investments in other businesses, including Sunoco LP and USAC, both of which are publicly traded master limited partnerships.
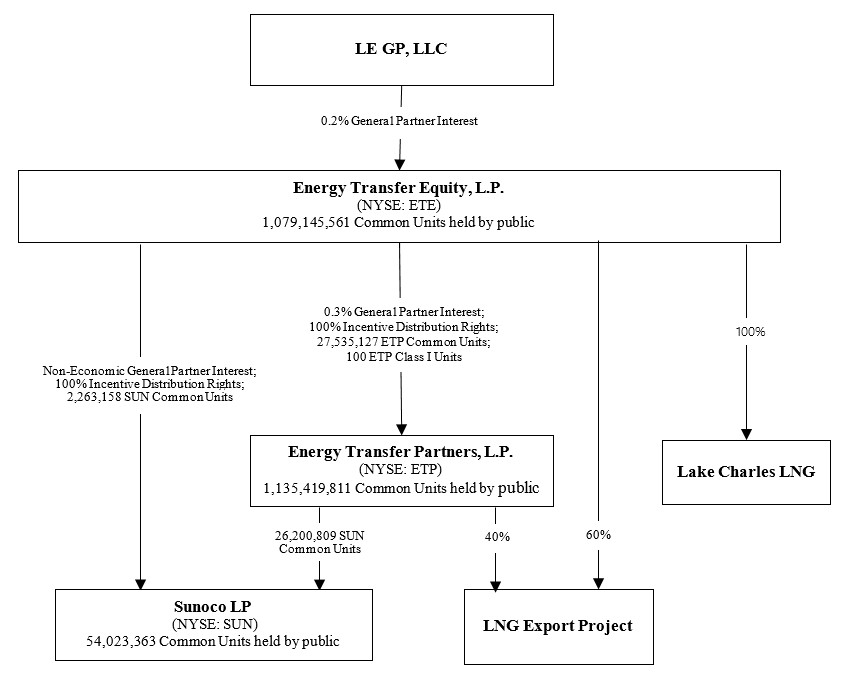
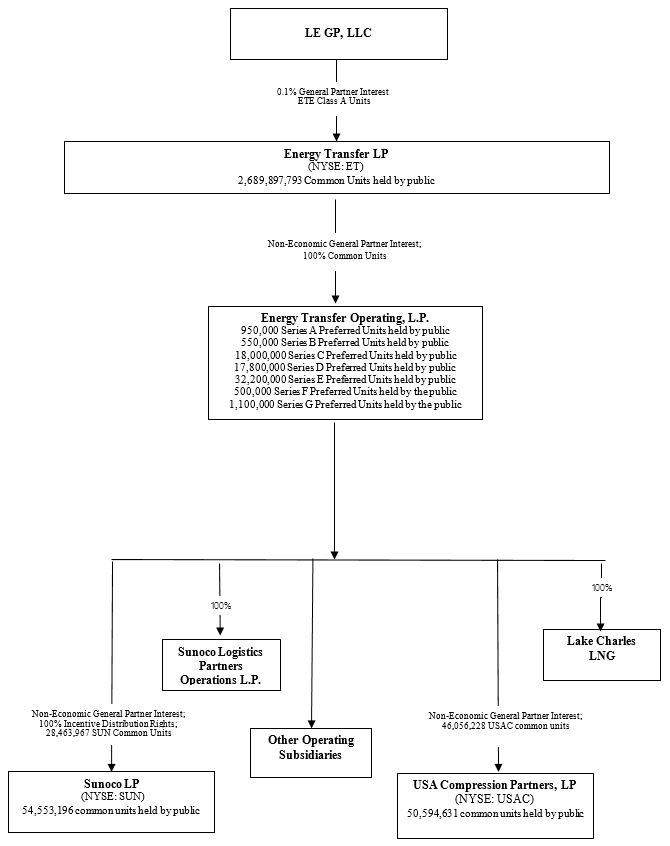
The following chart summarizes our organizational structure as of February 7, 2018.14, 2020. For simplicity, certain immaterial entities and ownership interestinterests have not been depicted.
Unless the context requires otherwise, the Partnership the Operating Companies, and theirits subsidiaries are collectively referred to in this report as “we,” “us,” “ETP,“ETO,” “Energy Transfer” or “the Partnership.”
Significant Achievements in 20172019 and Beyond
Strategic Transactions
Our significant strategic transactions in 2017 and beyond included the following, as discussed in more detail herein:
In February 2017, Bakken Holdings Company LLC, an entity in which ETP indirectly owns a 100% membership interest, sold a 49% interest in its wholly-owned subsidiary, Bakken Pipeline Investments LLC, to MarEn Bakken Company LLC, an entity jointly owned by MPLX LP and Enbridge Energy Partners, L.P., for $2.00 billion in cash. Bakken Pipeline Investments LLC indirectly owns a 75% interest in each of Dakota Access and ETCO. The remaining 25% of each of Dakota Access and ETCO is owned by wholly-owned subsidiaries of Phillips 66. As discussed below, in July 2017, the Partnership contributed a portion of its ownership interest in Dakota Access and ETCO to PEP. ETP continues to consolidate Dakota Access and ETCO subsequent to this transaction.
In February 2017, Sunoco Logistics formed PEP, a strategic joint venture with ExxonMobil. Sunoco Logistics contributed its Permian Express 1, Permian Express 2, Permian Longview and Louisiana Access pipelines. ExxonMobil contributed its Longview to Louisiana and Pegasus pipelines, Hawkins gathering system, an idle pipeline in southern Oklahoma, and its Patoka, Illinois terminal. Assets contributed to PEP by ExxonMobil were reflected at fair value on the Partnership’s consolidated balance sheet at the date of the contribution, including $547 million of intangible assets and $435 million of property, plant and equipment.
In April 2017, Energy Transfer Partners, L.P. and Sunoco Logistics completed a merger transaction (the “Sunoco Logistics Merger”) in which Sunoco Logistics acquired Energy Transfer Partners, L.P. in a unit-for-unit transaction, with the Energy Transfer Partners, L.P. unitholders receiving 1.5 common units of Sunoco Logistics for each Energy Transfer Partners, L.P. common unit they owned. In connection with the merger, Sunoco Logistics was renamed Energy Transfer Partners, L.P. and Sunoco Logistics’ general partner was merged with and into ETP GP, with ETP GP surviving as an indirect wholly-owned subsidiary of ETE.
In July 2017, ETP contributed an approximate 15% ownership interest in Dakota Access and ETCO to PEP, which resulted in an increase in ETP’s ownership interest in PEP to approximately 88%. ETP maintains a controlling financial and voting interest in PEP and is the operator of all of the assets. As such, PEP is reflected as a consolidated subsidiary of the Partnership. ExxonMobil’s interest in PEP is reflected as noncontrolling interest in the consolidated balance sheets. ExxonMobil’s contribution resulted in an increase of $988 million in noncontrolling interest, which is reflected in “Capital contributions from noncontrolling interest” in the consolidated statement of equity.
In October 2017, ETP completed the previously announced contribution transaction with a fund managed by Blackstone Energy Partners and Blackstone Capital Partners, pursuant to which ETP exchanged a 49.9% interest in the holding company that owns 65% of the Rover pipeline (“Rover Holdco”). As a result, Rover Holdco is now owned 50.1% by ETP and 49.9% by Blackstone. Upon closing, Blackstone contributed funds to reimburse ETP for its pro rata share of the Rover construction costs incurred by ETP through the closing date, along with the payment of additional amounts subject to certain adjustments.
In January 2018, ETP entered into a contribution agreement (“CDM Contribution Agreement”) with ETP GP, ETC Compression, LLC, USAC and ETE, pursuant to which ETP will contribute to USAC 100% of the membership interests of CDM and CDM E&T for aggregate consideration of $1.7 billion, consisting of USAC common units, new USAC Class B units and cash. The Class B units will be substantially similar to USAC common units, except the Class B units will not receive distributions paid with respect to USAC common units prior Related to the one year anniversary of the closing date of the CDM Contribution Agreement. Each Class B Unit will convert into one USAC common unit on such one year anniversary. In connection with the foregoing, ETP entered into a purchase agreement with ETE, ETP LLC, USAC Holdings and, for certain limited purposes, R/C IV USACP Holdings, L.P., pursuant to which ETE and ETP LLC will acquire from USAC Holdings (i) all of the outstanding interests in the general partner of USAC and (ii) 12,466,912 USAC common units for $250 million in cash. The transactions are expected to close in the first half of 2018, subject to customary closing conditions.Partnership
| |
| • | In December 2019, ET completed its acquisition of Tulsa-based SemGroup Corporation in a unit and cash transaction. During the first quarter of 2020, certain of the operating assets of SemGroup were contributed to ETO, and as such, the segment and asset overviews below include those contributed SemGroup assets. |
Significant Organic Growth Projects
Our significant announced organic growth projects in 20172019 included the following, as discussed in more detail herein:
In June 2017, ETP announced that the Dakota Access Pipeline and the Energy Transfer Crude Oil Pipeline (collectively, the “Bakken Pipeline”) were placed in commercial service.
ETP announced that Phase 1A and Phase 1B of the Rover pipeline were placed in service in August 2017 and December 2017, respectively.
| |
| • | In December 2019, ET announced a comprehensive commercial tender package which was issued to engineering, procurement and construction contractors to submit final bids for the proposed Lake Charles LNG liquefaction project being developed with Shell US LNG, LLC. The project would modify ETO’s existing LNG import facility located in Lake Charles, Louisiana to add LNG liquefaction capacity of 16.45 million tonnes per annum for expert to global markets. The commercial bids are expected to be received in the second quarter of 2020. |
| |
| • | In connection with the acquisition of SemGroup and to provide shippers with further access to markets along the Gulf Coast through the Houston Ship Channel, ET announced the construction of the Ted Collins pipeline, a 75-mile crude line that will connect Houston Terminal, which was recently acquired in the SemGroup acquisition, to the Nederland terminal. The pipeline is expected to be in service in 2021 and will have an initial capacity of 500 MBbls/d. |
Segment Overview
See Note 1516 to our consolidated financial statements in “Item 8. Financial Statements and Supplementary Data” for additional financial information about our segments.
Intrastate Transportation and Storage Segment
Natural gas transportation pipelines receive natural gas from other mainline transportation pipelines, storage facilities and gathering systems and deliver the natural gas to industrial end-users, storage facilities, utilities, power generators and other third-party pipelines. Through our intrastate transportation and storage segment, we own and operate (through wholly-owned or through joint venture interests) approximately 7,9009,400 miles of natural gas transportation pipelines with approximately 15.222 Bcf/d of transportation capacity and three natural gas storage facilities located in the state of Texas. We also own a 49.99% general partner interest in RIGS, a 450-mile intrastate pipeline that delivers natural gas from northwest Louisiana to downstream pipelines and markets.
We own a 16% membership70% interest in the Trans-Pecos and Comanche Trail pipelines,Red Bluff Express Pipeline, a 338-mile108-mile intrastate pipeline system that delivers natural gas fromconnects our Orla Plant, as well as third-party plants to the Waha Hub near Midland, Texas to the United States/Mexico border.Oasis Header.
Through ETC OLP, we ownEnergy Transfer operates one of the largest intrastate pipeline systemsystems in the United States with interconnectsproviding energy logistics to Texas marketsmajor trading hubs and to majorindustrial consumption areas throughout the United States. Our intrastate transportation and storage segment focuses on the transportation of natural gas to major markets from various prolific natural gas producing areas through connections with other pipeline systems as well as(Permian, Barnett, Haynesville and Eagle Ford Shale) through our Oasis pipeline, our East TexasETC Katy pipeline, our natural gas pipeline and storage assetssystems that are referred to as the ET Fuel System, and our HPL System, which areas further described below.
Our intrastate transportation and storage segment’s results are determined primarily by the amount of capacity our customers reserve as well as the actual volume of natural gas that flows through the transportation pipelines. Under transportation contracts, our customers are charged (i) a demand fee, which is a fixed fee for the reservation of an agreed amount of capacity on the transportation pipeline for a specified period of time and which obligates the customer to pay a fee even if the customer does not transport natural gas on the respective pipeline, (ii) a transportation fee, which is based on the actual throughput of natural gas by the customer, (iii) fuel retention based on a percentage of gas transported on the pipeline, or (iv) a combination of the three, generally payable monthly.
We also generate revenues and margin from the sale of natural gas to electric utilities, independent power plants, local distribution companies, industrial end-users and marketing companies on our HPL System. Generally, we purchase natural gas from either the market (including purchases from our marketing operations) or from producers at the wellhead. To the extent the natural gas comes from producers, it is primarily purchased at a discount to a specified market price and typically resold to customers based on an index price. In addition, our intrastate transportation and storage segment generates revenues from fees charged for storing customers’ working natural gas in our storage facilities and from managing natural gas for our own account.
Interstate Transportation and Storage Segment
Natural gas transportation pipelines receive natural gas from supply sources including other mainline transportation pipelines, storage facilities and gathering systems and deliver the natural gas to industrial end-users storage facilities, utilities and other pipelines. Through our interstate transportation and storage segment, we directly own and operate approximately 11,80012,500 miles of interstate natural gas pipelines with approximately 10.310.7 Bcf/d of transportation capacity and have a 50% interest in theanother approximately 6,770 miles and 10.6 Bcf/d of transportation capacity through joint venture that owns the 185-mile Fayetteville Express pipeline and the 500-mile Midcontinent Express pipeline. ETP also owns a 50% interest in Citrus, which owns 100% of FGT, an approximately 5,360-mile pipeline system that extends from South Texas through the Gulf Coast to south Florida. ETP operates the FEP and FGT joint ventures.interests.
OurETO’s vast interstate transportation and storage segment includes Panhandle, which owns and operates a large natural gas open-access interstate pipeline network. The pipeline network consisting ofspans the Panhandle, Trunkline and Sea Robin transmission systems, serves customers in the Midwest, Gulf Coast and Midcontinent United States withfrom Florida to California and Texas to Michigan, offering a comprehensive array of transportationpipeline and storage services. In connection with its natural gas pipeline transmission and storage systems, Panhandle has five natural gas storage fields located in Illinois, Kansas, Louisiana, Michigan and Oklahoma. Southwest Gas operates four of these fields and Trunkline operates one.
The Rover Pipeline is a new 713-mile natural gas pipeline designed to transport 3.25 Bcf/d of domestically produced natural gas from the Marcellus and Utica Shale production areas to markets across the United States as well as into the Union Gas Dawn Storage Hub in Ontario, Canada, for redistribution back into the United States or into the Canadian market. Currently under construction, portions of the pipeline are in service transporting gas from processing plants in Eastern Ohio for delivery to other pipeline interconnects in Eastern Ohio as well as the Midwest Hub near Defiance, Ohio, where the gas will be delivered for distribution to markets across the United States. The Rover Pipeline Phase 1A and 1B are in service with a capacity of approximately 1.7 Bcf/d.
We also own a 50% interest in the MEP pipeline system, which is operated by KMI, and hasOur pipelines have the capability to transport upnatural gas from nearly all Lower 48 onshore and offshore supply basins to customers in the Southeast, Gulf Coast, Southwest, Midwest, Northeast and Canada. Through numerous interconnections with other pipelines, our interstate systems can access virtually any supply or market in the country. As discussed further herein, our interstate segment operations are regulated by the FERC, which has broad regulatory authority over the business and operations of interstate natural gas pipelines.
Lake Charles LNG, our wholly-owned subsidiary, owns an LNG import terminal and regasification facility located on Louisiana’s Gulf Coast near Lake Charles, Louisiana. The import terminal has approximately 9.0 Bcf of above ground storage capacity and the regasification facility has a send out capacity of 1.8 Bcf/dd. Lake Charles LNG derives all of its revenue from a series of long-term contracts with a wholly-owned subsidiary of Shell.
LCL, our wholly-owned subsidiary, is currently developing a natural gas liquefaction facility for the export of LNG. In December 2015, Lake Charles LNG received authorization from the FERC to site, construct and operate facilities for the liquefaction and export of natural gas. The project would utilize existing dock and storage facilities owned by Lake Charles LNG located on the Lake Charles site. In December 2019, ET announced a comprehensive commercial tender package has been issued to engineering, procurement and construction contractors to submit final bids for the proposed Lake Charles LNG liquefaction project being developed with Shell US LNG, LLC. The project would modify ETO’s existing LNG import facility to add LNG liquefaction capacity of 16.45 million tonnes per annum for expert to global markets. The commercial bids are expected to be received in the second quarter of 2020.
Gulf States is a small interstate pipeline that uses cost-based rates and terms and conditions of service for shippers wishing to secure capacity for interstate transportation service. Rates charged are largely governed by long-term negotiated rate agreements.
The results from our interstate transportation and storage segment are primarily derived from the fees we earn from natural gas transportation and storage services.
Midstream Segment
The midstream natural gas industry is the link between the exploration and production of natural gas and the delivery of its components to end-use markets. The midstream industry consists of natural gas gathering, compression, treating, processing, storage, and transportation, and is generally characterized by regional competition based on the proximity of gathering systems and processing plants to natural gas producing wells and the proximity of storage facilities to production areas and end-use markets.
The natural gas gathering process begins with the drilling of wells into gas-bearing rock formations. Once a well has been completed, the well is connected to a gathering system. Gathering systems generally consist of a network of small diameter pipelines and, if necessary, compression systems, that collectscollect natural gas from points near producing wells and transports it to larger pipelines for further transportation.
Gathering systems are operated at design pressures that will maximize the total throughput from all connected wells. Specifically, lower pressure gathering systems allow wells, which produce at progressively lower field pressures as they age, to remain connected to gathering systems and to continue to produce for longer periods of time. As the pressure of a well declines, it becomes increasingly difficult to deliver the remaining production in the ground against a higher pressure that exists in the connecting gathering system. Field compression is typically used to lower the pressure of a gathering system. If field compression is not installed, then the remaining production in the ground will not be produced because it cannot overcome the higher gathering system pressure. In contrast, if field compression is installed, then a well can continue delivering production that otherwise might not be produced.
Natural gas has a varied composition depending on the field, the formation and the reservoir from which it is produced. Natural gas from certain formations is higher in carbon dioxide, hydrogen sulfide or certain other contaminants. Treating plants remove carbon dioxide and hydrogen sulfide from natural gas that is higher in carbon dioxide, hydrogen sulfide or certain other contaminants, to ensure that it meets pipeline quality specifications.
Natural gas processing involves the separation of natural gas into pipeline quality natural gas, or residue gas, and a mixed NGL stream. Some natural gas produced by a well does not meet the pipeline quality specifications established by downstream pipelines or is not suitable for commercial use and must be processed to remove the mixed NGL stream. In addition, some natural gas produced by a well, while not required to be processed, can be processed to take advantage of favorable margins for NGLs extracted from the gas stream. Natural gas processing involves the separation of natural gas into pipeline quality natural gas, or residue gas, and a mixed NGL stream.
Through our midstream segment, we own and operate natural gas gathering and NGL gathering pipelines, natural gas processing plants, natural gas treating facilities and natural gas conditioning facilities with an aggregate processing treating and conditioning capacity of approximately 12.38.8 Bcf/d. Our midstream segment focuses on the gathering, compression, treating, blending, and processing, and our operations are currently concentrated in major producing basins and shales including the Austin Chalk trend and Eagle Ford Shale in South and Southeast Texas, the Permian Basin in West Texas, and New Mexico, the Barnett Shale and Woodford Shale in North Texas, the Bossier Sands in East Texas, the Marcellus Shale in West Virginia, and Pennsylvania, the Haynesville Shale in East TexasOhio, Oklahoma, Kansas and Louisiana, and the Cotton Valley Shale in Louisiana. Many of our midstream assets are integrated with our intrastate transportation and storage assets.
Our midstream segment also includes a 60% interest in ELG,Edwards Lime Gathering, LLC, which operates natural gas gathering, oil pipeline and oil stabilization facilities in South Texas a 33.33% membership interest in Ranch Westex JV LLC, which processes natural gas delivered from the NGLs-rich shale formations in West Texas,and a 75% membership interest in ORS, which operates a natural gas gathering system in the Utica shale in Ohio, and a 50% interest in Mi Vida JV, which operates a cryogenic processing plant and related facilities in West Texas, a 51% membership interest in Aqua – PVR, which transports and supplies fresh water to natural gas producers in the Marcellus shale in Pennsylvania, and a 50% interest in Sweeny Gathering LP, which operates a natural gas gathering facility in South Texas.Ohio.
Our midstream segment results are derived primarily from margins we earn for natural gas volumes that are gathered, transported, purchased and sold through our pipeline systems and the natural gas and NGL volumes processed at our processing and treating facilities.
NGL and Refined Products Transportation and Services Segment
Our NGL operations transport, store and execute acquisition and marketing activities utilizing a complementary network of pipelines, storage and blending facilities, and strategic off-take locations that provide access to multiple NGL markets.
Liquids transportation pipelines transport mixed NGLs and other hydrocarbons from natural gas processing facilities to fractionation plants and storage facilities. NGL storage facilities are used for the storage of mixed NGLs, NGL products and petrochemical products owned by third parties in storage tanks and underground wells, which allow for the injection and withdrawal of such products at various times of the year to meet demand cycles.NGL fractionators separate mixed NGL streams into purity products, such as ethane, propane, normal butane, isobutane and natural gasoline.
Our NGL and refined products transportation and services segment includes includes:
approximately 4,3004,515 miles of NGL pipelines, five pipelines;
NGL and propane fractionation facilities with an aggregate capacity of 545825 MBbls/d and d;
NGL storage facilitiesfacility in Mont Belvieu with aggregatea working storage capacity of approximately 53 million Bbls. Four of50 MMBbls; and
other NGL storage assets, located at our NGLCedar Bayou and propane fractionationHattiesburg storage facilities, and 50 million Bbls of our Nederland, Marcus Hook and Inkster NGL terminals with an aggregate storage capacity are located at Mont Belvieu, Texas, one NGL fractionation facility is located in Geismar, Louisiana, and the segment has 3 million Bbls of salt dome storage capacity near Hattiesburg, Mississippi. approximately 13 MMBbls.
We are currently constructing a fifthseventh fractionator, which went into operation in the first quarter of 2020, and sixthan eighth fractionator, in Mont Belvieu, Texas, which are expectedwe expect to be operational in the third quarter of 2018 and the second quarter of 2019, respectively.2021, at our Mont Belvieu facility. In addition, we are constructing an expansion to the Lone Star Express pipeline, which is expected to be in service early in the fourth quarter of 2020. The NGL pipelines primarily transport NGLs from the Permian and Delaware basins and the Barnett and Eagle Ford Shales to Mont Belvieu.
TerminallingNGL terminalling services are facilitated by approximately 7 million Bbls8 MMBbls of NGLsNGL storage capacity, including approximately 1 million Bbls of storage at our Nederland, Texas terminal facility, 1 million Bbls of storage at our Inkster, Michigan terminal facility and 5 million Bbls at our Marcus Hook, Pennsylvania terminal facility (the “Marcus Hook Industrial Complex”).capacity. These operations also support our NGLsliquids blending activities, including the use of our patented butane blending technology. Refined products operations provide transportation and terminalling services through the use of approximately 3,265 miles of refined products pipelines and approximately 35 active refined products marketing terminals. Our marketing terminals are located primarily in the northeast, midwest and southwest United States, with approximately 8 MMBbls of refined products storage capacity. Our refined products operations utilize our integrated pipeline and terminalling assets, as well as acquisition and marketing activities, to service refined products markets in several regions throughout the United States. The mix of products delivered through our refined products pipelines varies seasonally, with gasoline demand peaking during the summer months, and demand for heating oil and other distillate fuels peaking in the winter. The products transported in these pipelines include multiple grades of gasoline and middle distillates, such as heating oil, diesel and jet fuel. Rates for shipments on these product pipelines are regulated by the FERC and other state regulatory agencies, as applicable.
Liquids transportation revenue isRevenues in this segment are principally generated from fees charged to customers under dedicated contracts or take-or-pay contracts. Under a dedicated contract, the customer agrees to deliver the total output from particular processing plants that are connected to the NGL pipeline. Take-or-pay contracts have minimum throughput commitments requiring the customer to pay regardless of whether a fixed volume is transported. Transportation feesFees are market-based, negotiated with customers and competitive with regional regulated pipelines.
NGL fractionation revenue is principally generated from fees charged to customers under take-or-pay contracts. Take-or-pay contracts have minimum payment obligations for throughput commitments requiring the customer to pay regardless of whether a fixed volume is fractionated from raw make into purity NGL products. Fractionation fees are market-based, negotiated with customerspipelines and competitive with other fractionators along the Gulf Coast.
NGL storagefractionators. Storage revenues are derived from base storage fees and throughput fees. Base storage fees are firm take-or-pay contracts on the volume of capacity reserved, regardless of the capacity actually used. Throughput fees are charged for providing ancillary services, including receipt and delivery and custody transfer fees.
This segment also includesderives revenues earned from the marketing of NGLs and processing and fractionating refinery off-gas. Marketing of NGLs primarily generates margin from selling ratable NGLs to end users and from optimizing storage assets. Processing and fractionation of refinery off-gas margin is generated from a percentage-of-proceeds of O-grade product sales and income sharing contracts, which are subject to market pricing of olefins and NGLs.
Our refined products operations provide transportation and terminalling services through the use of approximately 2,200 miles of refined products pipelines and approximately 40 active refined products marketing terminals. Our marketing terminals are located primarily in the northeast, midwest and southwest United States, with approximately 8 million Bbls of refined products storage capacity. Our refined products operations include our Eagle Point facility in New Jersey, which has approximately 6 million Bbls of refined products storage capacity. We also include our equity ownership interests in four refined products pipeline companies. The operations also perform terminalling activities at our Marcus Hook Industrial Complex. Our refined products operations utilize our integrated pipeline and terminalling assets, as well as acquisition and marketing activities, to service refined products markets in several regions in the United States.
Crude Oil Transportation and Services Segment
Our crude oil operations provide transportation (via pipeline and trucking), terminalling and acquisition and marketing services to crude oil markets throughout the southwest, midwest, northwestern and northeastern United States. Included within the operations areThrough our crude oil transportation and services segment, we own and operate (through wholly-owned subsidiaries or joint venture interests) approximately 9,36010,770 miles of crude oil trunk and gathering pipelines in the southwest and midwest United States andStates. This segment includes equity ownership interests in twofour crude oil pipelines.pipelines, the Bakken Pipeline system, Bayou Bridge Pipeline, White Cliffs Pipeline and Maurepas Pipeline. Our crude oil terminalling services operate with an aggregate storage capacity of approximately 33 million Bbls,64 MMBbls, including approximately 26 million Bbls29 MMBbls at our Gulf Coast terminal in Nederland, Texas, approximately 18.2 MMBbls at our Gulf coast terminal on the Houston Ship Channel, approximately 7.6 MMBbls at our Cushing facility in Cushing, Oklahoma and approximately 3 million Bbls3.2 MMBbls at our
Fort Mifflin terminal complex in Pennsylvania. Our crude oil acquisition and marketing activities utilize our pipeline and terminal assets, our proprietary fleet crude oil tractor trailers and truck unloading facilities, as well as third-party assets, to service crude oil markets principally in the mid-continentmidcontinent United States.
Revenues throughout our crude oil pipeline systems are generated from tariffs paid by shippers utilizing our transportation services. These tariffs are filed with the FERC and other state regulatory agencies, as applicable.
Our crude oil acquisition and marketing activities include the gathering, purchasing, marketing and selling of crude oil primarily in the mid-continent United States.oil. Specifically, the crude oil acquisition and marketing activities include:
| |
| • | purchasing crude oil at both the wellhead from producers, and in bulk from aggregators at major pipeline interconnections and trading locations; |
purchasing crude oil at both the wellhead from producers, and in bulk from aggregators at major pipeline interconnections and trading locations;
storing inventory during contango market conditions (when the price5
buying and selling crude oil of different grades, at different locations in order to maximize value;
transporting crude oil using the pipelines, terminals and trucks or, when necessary or cost effective, pipelines, terminals or trucks owned and operated by third parties; and | |
| • | storing inventory during contango market conditions (when the price of crude oil for future delivery is higher than current prices); |
| |
| • | buying and selling crude oil of different grades, at different locations in order to maximize value; |
| |
| • | transporting crude oil using the pipelines, terminals and trucks or, when necessary or cost effective, pipelines, terminals or trucks owned and operated by third parties; and |
marketing crude oil to major integrated oil companies, independent refiners and resellers through various types of sale and exchange transactions.
Investment in Sunoco LP
Sunoco LP is engaged in the distribution of motor fuels to independent dealers, distributors, and other commercial customers and the distribution of motor fuels to end-user customers at retail sites operated by commission agents. Additionally, it receives rental income through the leasing or subleasing of real estate used in the retail distribution of motor fuel. Sunoco LP also operates 75 retail stores located in Hawaii and New Jersey.
Sunoco LP is a distributor of motor fuels and other petroleum products which Sunoco LP supplies to third-party dealers and distributors, to independent operators of commission agent locations and other commercial consumers of motor fuel. Also included in the wholesale operations are transmix processing plants and refined products terminals. Transmix is the mixture of various refined products (primarily gasoline and diesel) created in the supply chain (primarily in pipelines and terminals) when various products interface with each other. Transmix processing plants separate this mixture and return it to salable products of gasoline and diesel.
Sunoco LP is the exclusive wholesale supplier of the Sunoco-branded motor fuel, supplying an extensive distribution network of approximately 5,474 Sunoco-branded company and third-party operated locations throughout the East Coast, Midwest, South Central and Southeast regions of the United States. Sunoco LP believes it is one of the largest independent motor fuel distributors of Chevron, Exxon and Valero branded motor fuel in the United States. In November 2016, we purchased aaddition to distributing motor fuels, Sunoco LP also distributes other petroleum products such as propane and lubricating oil, and Sunoco LP receives rental income from real estate that it leases or subleases.
Sunoco LP operations primarily consist of fuel distribution and marketing.
Investment in USAC
USAC provides natural gas compression services throughout the United States, including the Utica, Marcellus, Permian Basin, Delaware Basin, Eagle Ford, Mississippi Lime, Granite Wash, Woodford, Barnett, Haynesville, Niobrara and Fayetteville shales. USAC provides compression services to its customers primarily in connection with infrastructure applications, including both allowing for the processing and transportation of natural gas through the domestic pipeline system and enhancing crude oil acquisition and marketing business from Vitol, with operations basedproduction through artificial lift processes. As such, USAC’s compression services play a critical role in the Permian Basin, Texas. Includedproduction, processing and transportation of both natural gas and crude oil.
USAC operates a modern fleet of compression units, with an average age of approximately six years. USAC’s standard new-build compression units are generally configured for multiple compression stages allowing USAC to operate its units across a broad range of operating conditions. As part of USAC’s services, it engineers, designs, operates, services and repairs its compression units and maintains related support inventory and equipment.
USAC provides compression services to its customers under fixed-fee contracts with initial contract terms typically between six months and five years, depending on the application and location of the compression unit. USAC typically continues to provide compression services at a specific location beyond the initial contract term, either through contract renewal or on a month-to-month or longer basis. USAC primarily enters into take-or-pay contracts whereby its customers are required to pay a monthly fee even during periods of limited or disrupted throughput, which enhances the stability and predictability of its cash flows. USAC is not directly exposed to commodity price risk because it does not take title to the natural gas or crude oil involved in its services and because the natural gas used as fuel by its compression units is supplied by its customers without cost to USAC.
USAC’s assets and operations are all located and conducted in the acquisition was a significant acreage dedication from an investment-grade Permian producer.United States.
All Other Segment
Segments below the quantitative thresholds are classified as “All other.” These include the following:
We own an equity method investment in limited partnership units of Sunoco LP. As of December 31, 2017, our investment consisted of 43.5 million units, representing 43.6% of Sunoco LP’s total outstanding common units. Subsequent to Sunoco LP’s repurchase of a portion of2019, USAC had 3,682,968 horsepower in its common unitsfleet and 56,500 large horsepower on February 7, 2018, our investment consists of 26.2 million units, representing 31.8% of Sunoco LP’s total outstanding common units.order for expected delivery during 2020.
Our wholly-owned subsidiary, Sunoco, Inc., owns an approximate 33% non-operating interest in PES, a refining joint venture with The Carlyle Group, L.P., which owns a refinery in Philadelphia.
PES Holdings, LLC ("PES Holdings") and eight affiliates filed for Chapter 11 bankruptcy protection on January 21, 2018 in the United States Bankruptcy Court for the District of Delaware to implement a prepackaged reorganization plan that will allow its shareholders to retain a minority stake. PES Holdings' Chapter 11 Plan (“Plan”) proposes to inject $260 million in new capital into PES Holdings, cut debt service obligations by about $35 million per year and remove debt maturities before 2022. Under that Plan, PES Holdings’ non-debtor parent, PES, in which ETP holds an indirect 33% equity interest, will provide a $65 million cash contribution in exchange for a 25% stake in the reorganized debtor. After the restructuring, the proportionate ownership of Carlyle Group, L.P. and ETP in PES Holdings will be 16.26% and 8.13%, respectively. Finally, Sunoco Logistics Partners Operations L.P. (“SXL Operating Partnership”), a subsidiary of ETP, is providing an additional $75 million exit loan ranked pari passu with the other debt. SXL Operating Partnership’s, PES Holdings’ and ETP’s current contracts will be assumed, without any impairments, in the Chapter 11, and business operations will continue uninterrupted. The financial reorganization is expected to complete in the first quarter of 2018.
We conduct marketing operations in which we market the natural gas that flows through our gathering and intrastate transportation assets, referred to as on-system gas. We also attract other customers by marketing volumes of natural gas that do not move through our assets, referred to as off-system gas. For both on-system and off-system gas, we purchase natural gas from natural gas producers and other suppliers and sell that natural gas to utilities, industrial consumers, other marketers and pipeline companies, thereby generating gross margins based upon the difference between the purchase and resale prices of natural gas, less the costs of transportation. For the off-system gas, we purchase gas or act as an agent for small independent producers that may not have marketing operations.
We own a natural gas compression equipment business with operations in Arkansas, California, Colorado, Louisiana, New Mexico, Oklahoma, Pennsylvania and Texas.
We own 100% of the membership interests of Energy Transfer Group, L.L.C. (“ETG”), which owns all of the partnership interests of Energy Transfer Technologies, Ltd. (“ETT”). ETT provides compression services to customers engaged in the transportation of natural gas, including our other segments.
We own a 40% interest inAll Other Segment
Our “All Other” segment includes the parent of LCL, which is developing a LNG liquefaction project, as described further under “Asset Overview – All Other” below.following:
| |
| • | Our approximately 7.4% non-operating interest in PES, which owns a refinery in Philadelphia. |
| |
| • | Our marketing operations in which we market the natural gas that flows through our gathering and intrastate transportation assets, referred to as on-system gas. We also attract other customers by marketing volumes of natural gas that do not move through our assets, referred to as off-system gas. For both on-system and off-system gas, we purchase natural gas from natural gas producers and other suppliers and sell that natural gas to utilities, industrial consumers, other marketers and pipeline companies, thereby generating gross margins based upon the difference between the purchase and resale prices of natural gas, less the costs of transportation. For the off-system gas, we purchase gas or act as an agent for small independent producers that may not have marketing operations. |
| |
| • | Our natural gas compression equipment business which has operations in Arkansas, California, Colorado, Louisiana, New Mexico, Oklahoma, Pennsylvania and Texas. |
| |
| • | Our wholly-owned subsidiary, Dual Drive Technologies, Ltd. (“DDT”), which provides compression services to customers engaged in the transportation of natural gas, including our other segments. |
| |
| • | Our subsidiaries are involved in the management of coal and natural resources properties and the related collection of royalties. We also earn revenues from other land management activities, such as selling standing timber, leasing coal-related infrastructure facilities, and collecting oil and gas royalties. These operations also include end-user coal handling facilities. |
We own and operate a fleet of compressors used to provide turn-key natural gas compression services for customer specific systems. We also own and operate a fleet of equipment used to provide treating services, such as carbon dioxide and hydrogen sulfide removal, natural gas cooling, dehydration and BTU management. These assets are primarily owned through CDM and CDM E&T. As discussed in “Recent Developments” in “Item 7. Management’s Discussion and Analysis of Financial Condition and Results of Operations,” in January 2018, we entered into an agreement to contribute these assets to USAC.
We are involved in the management of coal and natural resources properties and the related collection of royalties. We also earn revenues from other land management activities, such as selling standing timber, leasing coal-related infrastructure facilities, and collecting oil and gas royalties. These operations also include end-user coal handling facilities.
We also own PEI Power Corp.LLC and PEI Power II, which own and operate a facility in Pennsylvania that generates a total of 75 megawatts of electrical power.
Asset Overview
The descriptions below include summaries of significant assets within the Partnership’s reportable segments. Amounts, such as capacities, volumes and miles included in the descriptions below are approximate and are based on information currently available; such amounts are subject to change based on future events or additional information.
Intrastate Transportation and Storage
The following details our pipelines and storage facilities in the intrastate transportation and storage segment:
| | | Description of Assets | | Ownership Interest
(%) | | Miles of Natural Gas Pipeline | | Pipeline Throughput Capacity (Bcf/d) | | Working Storage Capacity (Bcf/d) | | Ownership Interest | | Miles of Natural Gas Pipeline | | Pipeline Throughput Capacity (Bcf/d) | | Working Storage Capacity (Bcf/d) |
| ET Fuel System | | 100 | % | | 2,780 |
| | 5.2 |
| | 11.2 |
| | 100 | % | | 3,150 |
| | 5.2 |
| | 11.2 |
|
Oasis Pipeline | | 100 | % | | 750 |
| | 2.3 |
| | — |
| | 100 | % | | 750 |
| | 2.0 |
| | — |
|
| HPL System | | 100 | % | | 3,920 |
| | 5.3 |
| | 52.5 |
| | 100 | % | | 3,920 |
| | 5.3 |
| | 52.5 |
|
| East Texas Pipeline | | 100 | % | | 460 |
| | 2.4 |
| | — |
| |
| RIGS Haynesville Partnership Co. | | 49.99 | % | | 450 |
| | 2.1 |
| | — |
| |
| ETC Katy Pipeline | | | 100 | % | | 460 |
| | 2.9 |
| | — |
|
| Regency Intrastate Gas | | | 100 | % | | 450 |
| | 2.1 |
| | — |
|
| Comanche Trail Pipeline | | 16 | % | | 195 |
| | 1.1 |
| | — |
| | 16 | % | | 195 |
| | 1.1 |
| | — |
|
| Trans-Pecos Pipeline | | 16 | % | | 143 |
| | 1.4 |
| | — |
| | 16 | % | | 143 |
| | 1.4 |
| | — |
|
| Old Ocean Pipeline, LLC | | | 50 | % | | 240 |
| | 0.2 |
| | — |
|
| Red Bluff Express Pipeline | | | 70 | % | | 108 |
| | 1.4 |
| | — |
|
| |
(1) | Includes bi-directional capabilities |
The following information describes our principal intrastate transportation and storage assets:
| |
| • | The ET Fuel System serves some of the most prolific production areas in the United States and is comprised of intrastate natural gas pipeline and related natural gas storage facilities. The ET Fuel System has many interconnections with pipelines providing direct access to power plants, other intrastate and interstate pipelines, and has bi-directional capabilities. It is strategically located near high-growth production areas and provides access to the Waha Hub near Pecos, Texas, the Maypearl Hub in Central Texas and the Carthage Hub in East Texas, the three major natural gas trading centers in Texas. |
The ET Fuel System serves some
7
The ET Fuel System also includes our Bethel natural gas storage facility, with a working capacity of 6.0 Bcf, an average withdrawal capacity of 300 MMcf/d and an injection capacity of 75 MMcf/d, and our Bryson natural gas storage facility, with a working capacity of 5.2 Bcf, an average withdrawal capacity of 120 MMcf/d and an average injection capacity of 96 MMcf/d. Storage capacity on the ET Fuel System is contracted to third parties under fee-based arrangements that extend through 2023.
In addition, the ET Fuel System is integrated with our Godley processing plant which gives us the ability to bypass the plant when processing margins are unfavorable by blending the untreated natural gas from the North Texas System with natural gas on the ET Fuel System while continuing to meet pipeline quality specifications.
| |
| • | The Oasis Pipeline is primarily a 36-inch natural gas pipeline. It has bi-directional capabilities with approximately 1.3 Bcf/d of throughput capacity moving west-to-east and greater than 750 MMcf/d of throughput capacity moving east-to-west. The Oasis pipeline connects to the Waha and Katy market hubs and has many interconnections with other pipelines, power plants, processing facilities, municipalities and producers. |
The Oasis Pipeline is primarily a 36-inch natural gas pipeline. It has bi-directional capabilities with approximately 1.2 Bcf/d of throughput capacity moving west-to-east and greater than 750 MMcf/d of throughput capacity moving east-to-west. The Oasis pipeline connects to the Waha and Katy market hubs and has many interconnections with other pipelines, power plants, processing facilities, municipalities and producers.
The Oasis pipeline is integrated with our gathering system known as the Southeast Texas System and is an important component to maximizing our Southeast Texas System’s profitability. The Oasis pipeline enhances the Southeast Texas System by (i) providing access for natural gas gathered on the Southeast Texas System to other third-party supply and market points and interconnecting pipelines and (ii) allowing us to bypass our processing plants and treating facilities on the Southeast Texas System when processing margins are unfavorable by blending untreated natural gas from the Southeast Texas System with gas on the Oasis pipeline while continuing to meet pipeline quality specifications.
| |
| • | The HPL System is an extensive network of intrastate natural gas pipelines, an underground Bammel storage reservoir and related transportation assets. The system has access to multiple sources of historically significant natural gas supply reserves from South Texas, the Gulf Coast of Texas, East Texas and the western Gulf of Mexico, and is directly connected to major gas distribution, electric and industrial load centers in Houston, Corpus Christi, Texas City, Beaumont and other cities located along the Gulf Coast of Texas. The HPL System is well situated to gather and transport gas in many of the major gas producing areas in Texas including a strong presence in the key Houston Ship Channel and Katy Hub markets, allowing us to play an important role in the Texas natural gas markets. The HPL System also offers its shippers off-system opportunities due to its numerous interconnections with other pipeline systems, its direct access to multiple market hubs at Katy, the Houston Ship Channel, Carthage and Agua Dulce, as well as our Bammel storage facility. |
The HPL System is an extensive network of intrastate natural gas pipelines, an underground Bammel storage reservoir and related transportation assets. The system has access to multiple sources of historically significant natural gas supply reserves from South Texas, the Gulf Coast of Texas, East Texas and the western Gulf of Mexico, and is directly connected to major gas distribution, electric and industrial load centers in Houston, Corpus Christi, Texas City and other cities located along the Gulf Coast of Texas. The HPL System is well situated to gather and transport gas in many of the major gas producing areas in Texas including a strong presence in the key Houston Ship Channel and Katy Hub markets, allowing us to play an important role in the Texas natural gas markets. The HPL System also offers its shippers off-system opportunities due to its numerous interconnections with other pipeline systems, its direct access to multiple market hubs at Katy, the Houston Ship Channel and Agua Dulce, as well as our Bammel storage facility.
The Bammel storage facility has a total working gas capacity of approximately 52.5 Bcf, a peak withdrawal rate of 1.3 Bcf/d and a peak injection rate of 0.6 Bcf/d. The Bammel storage facility is located near the Houston Ship Channel market area and the Katy Hub, and is ideally suited to provide a physical backup for on-system and off-system customers. As of December 31, 2017,2019, we had approximately 10.819.0 Bcf committed under fee-based arrangements with third parties and approximately 36.927.3 Bcf stored in the facility for our own account.
| |
| • | The ETC Katy Pipeline connects three treating facilities, one of which we own, with our gathering system known as Southeast Texas System. The ETC Katy pipeline serves producers in East and North Central Texas and provided access to the Katy Hub. The ETC Katy pipeline expansions include the 36-inch East Texas extension to connect our Reed compressor station in Freestone County to our Grimes County compressor station, the 36-inch Katy expansion connecting Grimes to the Katy Hub, and the 42-inch Southeast Bossier pipeline connecting our Cleburne to Carthage pipeline to the HPL System. |
| |
| • | RIGS is a 450-mile intrastate pipeline that delivers natural gas from northwest Louisiana to downstream pipelines and markets. |
| |
| • | Comanche Trail is a 195-mile intrastate pipeline that delivers natural gas from the Waha Hub near Pecos, Texas to the United States/Mexico border near San Elizario, Texas. The Partnership owns a 16% membership interest in and operates Comanche Trail. |
| |
| • | Trans-Pecos is a 143-mile intrastate pipeline that delivers natural gas from the Waha Hub near Pecos, Texas to the United States/Mexico border near Presidio, Texas. The Partnership owns a 16% membership interest in and operates Trans-Pecos. |
| |
| • | Old Ocean is a 240-mile intrastate pipeline system that delivers natural gas from Ellis County, Texas to Brazoria County, Texas. The Partnership owns a 50% membership interest in and operates Old Ocean. |
| |
| • | The Red Bluff Express Pipeline is an approximately 108-mile intrastate pipeline that runs through the heart of the Delaware basin and connects our Orla Plant, as well as third-party plants to the Waha Oasis Header. The Partnership owns a 70% membership interest in and operates Red Bluff Express. |
The East Texas Pipeline connects three treating facilities, one
8
RIGS is a 450-mile intrastate pipeline that delivers natural gas from northwest Louisiana to downstream pipelines and markets. The Partnership owns a 49.99% general partner interest in RIGS.
Comanche Trail is a 195-mile intrastate pipeline that delivers natural gas from the Waha Hub near Midland, Texas to the United States/Mexico border near San Elizario, Texas. The Partnership owns a 16% membership interest in and operates Comanche Trail.
Trans-Pecos is a 143-mile intrastate pipeline that delivers natural gas from the Waha Hub near Midland, Texas to the United States/Mexico border near Presidio, Texas. The Partnership owns a 16% membership interest in and operates Trans-Pecos.
Interstate Transportation and Storage
The following details our pipelines in the interstate transportation and storage segment:
| | | Description of Assets | | Ownership Interest
(%) | | Miles of Natural Gas Pipeline | | Pipeline Throughput Capacity (Bcf/d) | | Working Gas Capacity (Bcf/d) | | Ownership Interest | | Miles of Natural Gas Pipeline | | Pipeline Throughput Capacity (Bcf/d) | | Working Gas Capacity (Bcf/d) |
| Florida Gas Transmission Pipeline | | 50 | % | | 5,360 |
| | 3.1 |
| | — |
| |
| Florida Gas Transmission | | | 50 | % | | 5,362 |
| | 3.5 |
| | — |
|
| Transwestern Pipeline | | 100 | % | | 2,570 |
| | 2.1 |
| | — |
| | 100 | % | | 2,614 |
| | 2.1 |
| | — |
|
Panhandle Eastern Pipe Line | | 100 | % | | 5,980 |
| | 2.8 |
| | 83.9 |
| | 100 | % | | 6,402 |
| | 2.8 |
| | 73.4 |
|
| Trunkline Gas Pipeline | | 100 | % | | 2,220 |
| | 0.9 |
| | 13.0 |
| |
| Trunkline Gas Company | | | 100 | % | | 2,231 |
| | 0.9 |
| | 13.0 |
|
| Tiger Pipeline | | 100 | % | | 195 |
| | 2.4 |
| | — |
| | 100 | % | | 197 |
| | 2.4 |
| | — |
|
| Fayetteville Express Pipeline | | 50 | % | | 185 |
| | 2.0 |
| | — |
| | 50 | % | | 185 |
| | 2.0 |
| | — |
|
| Sea Robin Pipeline | | 100 | % | | 830 |
| | 2.0 |
| | — |
| | 100 | % | | 785 |
| | 2.0 |
| | — |
|
| Stingray Pipeline | | | 100 | % | | 302 |
| | 0.4 |
| | — |
|
| Rover Pipeline | | 32.6 | % | | 713 |
| | 3.25 |
| | — |
| | 32.6 | % | | 713 |
| | 3.25 |
| | — |
|
| Midcontinent Express Pipeline | | 50 | % | | 500 |
| | 1.8 |
| | — |
| | 50 | % | | 512 |
| | 1.8 |
| | — |
|
| Gulf States | | 100 | % | | 10 |
| | 0.1 |
| | — |
| | 100 | % | | 10 |
| | 0.1 |
| | — |
|
| |
(1) | Natural gas storage assets are owned by Southwest Gas. |
The following information describes our principal interstate transportation and storage assets:
The Florida Gas Transmission Pipeline (“FGT”) is an open-access | |
| • | Florida Gas Transmission Pipeline (“FGT”) has mainline capacity of 3.5 Bcf/d and approximately 5,362 miles of pipelines extending from south Texas through the Gulf Coast region of the United States to south Florida. The FGT system receives natural gas from various onshore and offshore natural gas producing basins. FGT is the principal transporter of natural gas to the Florida energy market, delivering approximately 60% of the natural gas consumed in the state. In addition, FGT’s system operates and maintains multiple interconnects with major interstate and intrastate natural gas pipelines, which provide FGT’s customers access to diverse natural gas producing regions. FGT’s customers include electric utilities, independent power producers, industrial end-users and local distribution companies. FGT is owned by Citrus, a 50/50 joint venture with KMI. |
| |
| • | Transwestern Pipeline transports natural gas supply from the Permian Basin in West Texas and eastern New Mexico, the San Juan Basin in northwestern New Mexico and southern Colorado, and the Anadarko Basin in the Texas and Oklahoma panhandles. The system has bi-directional capabilities and can access Texas and Midcontinent natural gas market hubs, as well as major western markets in Arizona, Nevada and California. Transwestern’s customers include local distribution companies, producers, marketers, electric power generators and industrial end-users. |
| |
| • | Panhandle Eastern Pipe Line’s transmission system consists of four large diameter pipelines with bi-directional capabilities, extending approximately 1,300 miles from producing areas in the Anadarko Basin of Texas, Oklahoma and Kansas through Missouri, Illinois, Indiana, Ohio and into Michigan. Panhandle contracts for over 73 Bcf of natural gas storage. |
| |
| • | Trunkline Gas Company’s transmission system consists of one large diameter pipeline with bi-directional capabilities, extending approximately 1,400 miles from the Gulf Coast areas of Texas and Louisiana through Arkansas, Mississippi, Tennessee, Kentucky, Illinois, Indiana and Michigan. Trunkline has one natural gas storage field located in Louisiana. |
| |
| • | Tiger Pipeline is a bi-directional system that extends through the heart of the Haynesville Shale and ends near Delhi, Louisiana, interconnecting with multiple interstate pipelines. |
| |
| • | Fayetteville Express Pipeline originates near Conway County, Arkansas and continues eastward to Panola County, Mississippi with multiple pipeline interconnections along the route. Fayetteville Express Pipeline is owned by a 50/50 joint venture with KMI. |
| |
| • | Sea Robin Pipeline’s system consists of two offshore Louisiana natural gas supply pipelines extending 120 miles into the Gulf of Mexico. |
| |
| • | Stingray Pipeline is an interstate natural gas pipeline system with related assets located in the western Gulf of Mexico and Johnson Bayou, Louisiana. |
| |
| • | Rover Pipeline is a large diameter pipeline with total capacity to transport 3.25 Bcf/d natural gas from processing plants in West Virginia, Eastern Ohio and Western Pennsylvania for delivery to other pipeline interconnects in Ohio and Michigan, where the gas is delivered for distribution to markets across the United States, as well as to Ontario, Canada. |
| |
| • | Midcontinent Express Pipeline originates near Bennington, Oklahoma and traverses northern Louisiana and central Mississippi to an interconnect with the Transcontinental Gas Pipeline system in Butler, Alabama. The Midcontinent Express Pipeline is owned by a 50/50 joint venture with KMI, the operator of the system. |
| |
| • | Gulf States Transmission is a 10-mile interstate pipeline that extends from Harrison County, Texas to Caddo Parish, Louisiana. |
Regasification Facility
Lake Charles LNG, our wholly-owned subsidiary, owns a LNG import terminal and regasification facility located on Louisiana’s Gulf Coast near Lake Charles, Louisiana. The import terminal has approximately 9.0 Bcf of above ground LNG storage capacity and the regasification facility has a send out capacity of 1.8 Bcf/d.
Liquefaction Project
LCL, our wholly-owned subsidiary, is in the process of developing an LNG liquefaction project at the site of our Lake Charles LNG import terminal and regasification facility. The liquefaction facility would be constructed on 440 acres of land, of which 80 acres are owned by Lake Charles LNG and the remaining acres are to be leased by LCL under a long-term lease from the Lake Charles Harbor and Terminal District. The liquefaction project is expected to consist of three LNG trains with a mainlinecombined design nameplate outlet capacity of 3.1 Bcf/d and approximately 5,360 miles of pipelines extending from south Texas through16.45 metric tonnes per annum. Once completed, the Gulf Coast region of the United Statesliquefaction project will enable LCL to south Florida. The FGT system receives natural gas from various onshore and offshore natural gas producing basins. FGT is the principal transporter of natural gas to the Florida energy market, delivering over 66% of the natural gas consumed in the state. In addition, FGT’s system operates and maintains over 81 interconnects with major interstate and intrastate natural gas pipelines, which provide FGT’s customers access to diverse natural gas producing regions. FGT’s customers include electric utilities, independent power producers, industrials and local distribution companies. FGT is owned by Citrus, a 50/50 joint venture with KMI.
The Transwestern Pipeline is an open-access interstate natural gas pipeline extending from the gas producing regions of West Texas, eastern and northwestern New Mexico, and southern Colorado primarily to pipeline interconnects off the east end of its system and to pipeline interconnects at the California border. The Transwestern Pipeline has bi-directional capabilities and access to three significant gas basins: the Permian Basin in West Texas and eastern New Mexico; the San Juan Basin in northwestern New Mexico and southern Colorado; and the Anadarko Basin in the Texas and Oklahoma panhandles. Natural gas sources from the San Juan Basin and surrounding producing areas can be delivered eastward to Texas intrastate and mid-continent connecting pipelines and natural gas market hubs as well as westward to markets in Arizona, Nevada and California. Transwestern’s Phoenix Lateral Pipeline, with a throughput capacity of 660 MMcf/d, connects the Phoenix area to the Transwestern mainline. Transwestern’s customers include local distribution companies, producers, marketers, electric power generators and industrial end-users.
The Panhandle Eastern Pipe Line’s transmission system consists of four large diameter pipelines with bi-directional capabilities, extending approximately 1,300 miles from producing areas in the Anadarko Basin of Texas, Oklahoma and Kansas through Missouri, Illinois, Indiana, Ohio and into Michigan.
The Trunkline Gas Pipeline’s transmission system consists of one large diameter pipeline with bi-directional capabilities, extending approximately 1,400 miles from the Gulf Coast areas of Texas and Louisiana through Arkansas, Mississippi, Tennessee, Kentucky, Illinois, Indiana and Michigan.
The Tiger Pipeline is an approximately 195-mile interstate natural gas pipeline with bi-directional capabilities, that connects to our dual 42-inch pipeline system near Carthage, Texas, extends through the heart of the Haynesville Shale and ends near Delhi, Louisiana, with interconnects to at least seven interstate pipelines at various points in Louisiana.
The Fayetteville Express Pipeline is an approximately 185-mile interstate natural gas pipeline that originates near Conway County, Arkansas, continues eastward through White County, Arkansas and terminates at an interconnect with Trunkline Gas Company in Panola County, Mississippi. The Fayetteville Express Pipeline is owned by a 50/50 joint venture with KMI.
The Sea Robin Pipeline’s transmission system consists of two offshore Louisiana natural gas supply systems extending approximately 120 miles into the Gulf of Mexico.
The Rover Pipeline is a new 713-mile natural gas pipeline designed to transport 3.25 Bcf/d ofliquefy domestically produced natural gas fromand export it as LNG. On June 18, 2017, LCL signed a memorandum of understanding with Korea Gas Corporation and Shell to study the Marcellusfeasibility of a joint development of the Lake Charles liquefaction project. LCL and Utica Shale production areasShell are actively involved in a variety of activities related to markets acrossthe development of the project. LCL has also been marketing LNG offtake to numerous potential customers in Asia and Europe.
In December 2019, ET announced a comprehensive commercial tender package which was issued to engineering, procurement and construction contractors to submit final bids for the proposed Lake Charles LNG liquefaction project being developed with Shell US LNG, LLC. The commercial bids are expected to be received in the second quarter of 2020.
The export of LNG produced by the liquefaction project from the United States as well as intowould be undertaken under long-term export authorizations issued by the Union Gas Dawn Storage Hub in Ontario, Canada, for redistribution back intoDOE to LCL. In March 2013, LCL obtained a DOE authorization to export LNG to countries with which the United States has or intowill have Free Trade Agreements (“FTA”) for trade in natural gas (the “FTA Authorization”). In July 2016, LCL also obtained a conditional DOE authorization to export LNG to countries that do not have an FTA for trade in natural gas (the “Non-FTA Authorization”). The FTA Authorization and Non-FTA Authorization have 25- and 20-year terms, respectively. In addition, LCL received its wetlands permits from the Canadian market.United States Army Corps of Engineers (“USACE”) to perform wetlands mitigation work and to perform modification and dredging work for the temporary and permanent dock facilities at the Lake Charles LNG facilities.
The Midcontinent Express Pipeline is an approximately 500-mile interstate pipeline stretching from southeast Oklahoma through northeast Texas, northern Louisiana and central Mississippi to an interconnect with the Transcontinental Gas Pipeline System in Butler, Alabama. The Midcontinent Express Pipeline is owned by a 50/50 joint venture with KMI.Midstream
Gulf States owns a 10-mile interstate pipeline that extends from Harrison County, Texas to Caddo Parish, Louisiana.
Midstream
The following details our assets in the midstream segment:
|
| | | | | | |
| Description of Assets | | Net Gas Processing Capacity (MMcf/d) | | Net Gas Treating Capacity (MMcf/d) |
| South Texas Region: | | | | |
| Southeast Texas System | | 410 |
| | 510 |
|
| Eagle Ford System | | 1,920 |
| | 1,808 |
|
| Ark-La-Tex Region | | 1,025 |
| | 1,186 |
|
| North Central Texas Region | | 715 |
| | 212 |
|
| Permian Region | | 1,943 |
| | 1,580 |
|
| Mid-Continent Region | | 885 |
| | 20 |
|
| Eastern Region | | — |
| | 70 |
|
|
| | | |
| Description of Assets | | Net Gas Processing Capacity (MMcf/d) |
| South Texas Region: | | |
| Southeast Texas System | | 410 |
|
| Eagle Ford System | | 1,920 |
|
| Ark-La-Tex Region | | 1,442 |
|
| North Central Texas Region | | 700 |
|
| Permian Region | | 2,740 |
|
| Midcontinent Region | | 1,385 |
|
| Eastern Region | | 200 |
|
The following information describes our principal midstream assets:
South Texas Region:
| |
| • | The Southeast Texas System is an integrated system that gathers, compresses, treats, processes, dehydrates and transports natural gas from the Austin Chalk trend and Eagle Ford shale formation. The Southeast Texas System is a large natural gas gathering system covering thirteen counties between Austin and Houston. This system is connected to the Katy Hub through the ETC Katy Pipeline and is also connected to the Oasis Pipeline. The Southeast Texas System includes two natural gas processing plants (La Grange and Alamo) with aggregate capacity of 410 MMcf/d. The La Grange and Alamo processing plants are natural gas processing plants that process the rich gas that flows through our gathering system to produce residue gas and NGLs. Residue gas is delivered into our intrastate pipelines and NGLs are delivered into our NGL pipelines to Lone Star. |
The Southeast Texas System is an integrated system that gathers, compresses, treats, processes, dehydrates and transports natural gas from the Austin Chalk trend and Eagle Ford shale formation. The Southeast Texas System is a large natural gas gathering system covering thirteen counties between Austin and Houston. This system is connected to the Katy Hub through the East Texas Pipeline and is also connected to the Oasis Pipeline. The Southeast Texas System includes two natural gas processing plant (La Grange and Alamo) with aggregate capacity of 410 MMcf/d and natural gas treating facilities with aggregate capacity of 510 MMcf/d. The La Grange and Alamo processing plants are natural gas processing plants that process the rich gas that flows through our gathering system to produce residue gas and NGLs. Residue gas is delivered into our intrastate pipelines and NGLs are delivered into our NGL pipelines to Lone Star.
Our treating facilities remove carbon dioxide and hydrogen sulfide from natural gas gathered into our system before the natural gas is introduced to transportation pipelines to ensure that the gas meets pipeline quality specifications.
| |
| • | The Eagle Ford Gathering System consists of 30-inch and 42-inch natural gas gathering pipelines with over 1.4 Bcf/d of capacity originating in Dimmitt County, Texas, and extending to both our King Ranch gas plant in Kleberg County, Texas and Jackson plant in Jackson County, Texas. The Eagle Ford Gathering System includes four processing plants (Chisholm, Kenedy, Jackson and King Ranch) with aggregate capacity of 1.92 Bcf/d. Our Chisholm, Kenedy, Jackson and King Ranch processing plants are connected to our intrastate transportation pipeline systems for deliveries of residue gas and are also connected with our NGL pipelines for delivery of NGLs to Lone Star. |
The Eagle Ford Gathering System consists of 30-inch and 42-inch natural gas gathering pipelines with over 1.4 Bcf/d of capacity originating in Dimmitt County, Texas, and extending to both our King Ranch gas plant in Kleberg County, Texas and Jackson plant in Jackson County, Texas. The Eagle Ford Gathering System includes four processing plants (Chisholm, Kenedy, Jackson and King Ranch) with aggregate capacity of 1.92 Bcf/d and multiple natural gas treating facilities with combined capacity of 1.81 Bcf/d. Our Chisholm, Kenedy, Jackson and King Ranch processing plants are connected to our intrastate transportation pipeline systems for deliveries of residue gas and are also connected with our NGL pipelines for delivery of NGLs to Lone Star.
Ark-La-Tex Region:
Our Northern Louisiana assets are comprised of several gathering systems in the Haynesville Shale with access to multiple markets through interconnects with several pipelines, including our Tiger Pipeline. Our Northern Louisiana assets include the Bistineau, Creedence, and Tristate Systems, which collectively include three natural gas treating facilities, with aggregate capacity of 1.19 Bcf/d.
Our PennTex Midstream System is primarily located in Lincoln Parish, Louisiana, and consists of the Lincoln Parish plant, a 200 MMcf/d design-capacity cryogenic natural gas processing plant located near Arcadia, Louisiana, the Mt. Olive plant, a 200 MMcf/d design-capacity cryogenic natural gas processing plant located near Ruston, Louisiana, with on-site liquids handling facilities for inlet gas; a 35-mile rich gas gathering system that provides producers with access to our processing plants and third-party processing capacity; a 15-mile residue gas pipeline that provides market access for natural gas from our processing plants, including connections with pipelines that provide access to the Perryville Hub and other markets in the Gulf Coast region; and a 40-mile NGL pipeline that provides connections to the Mont Belvieu market for NGLs produced from our processing plants. | |
| • | Our Northern Louisiana assets are comprised of several gathering systems in the Haynesville Shale with access to multiple markets through interconnects with several pipelines, including our Tiger Pipeline. Our Northern Louisiana assets include the Bistineau, Creedence, and Tristate Systems, which collectively include three natural gas treating facilities, with aggregate capacity of 1.4 Bcf/d. |
The Ark-La-Tex assets gather, compress, treat and dehydrate natural gas in several parishes in north and west Louisiana and several counties in East Texas. These assets also include cryogenic natural gas processing facilities, a refrigeration plant, a conditioning plant, amine treating plants, a residue gas pipeline that provides market access for natural gas from our processing plants, including connections with pipelines that provide access to the Perryville Hub and other markets in the Gulf Coast region, and an interstate NGL pipeline.pipeline that provides connections to the Mont Belvieu market for NGLs produced from our processing plants. Collectively, the eightten natural gas processing
facilities (Dubach, Dubberly, Lisbon, Salem, Elm Grove, Minden, Ada, Brookeland, Lincoln Parish and Brookeland)Mt. Olive) have an aggregate capacity of 1.031.3 Bcf/d.
| |
| • | Through the gathering and processing systems described above and their interconnections with RIGS in north Louisiana, as well as other pipelines, we offer producers wellhead-to-market services, including natural gas gathering, compression, processing, treating and transportation. |
Through the gathering and processing systems described above and their interconnections with RIGS in north Louisiana, we offer producers wellhead-to-market services, including natural gas gathering, compression, processing, treating and transportation.
North Central Texas Region:
| |
| • | The North Central Texas System is an integrated system located in four counties in North Central Texas that gathers, compresses, treats, processes and transports natural gas from the Barnett and Woodford Shales. Our North Central Texas assets include our Godley and Crescent plants, which process rich gas produced from the Barnett Shale and STACK play, with aggregate capacity of 700 MMcf/d. The Godley plant is integrated with the ET Fuel System. |
The North Central Texas System is an integrated system located in four counties in North Central Texas that gathers, compresses, treats, processes and transports natural gas from the Barnett and Woodford Shales. Our North Central Texas assets include our Godley and Crescent plants, which process rich gas produced from the Barnett Shale and STACK play, with aggregate capacity of 715 MMcf/d and aggregate treating capacity of 212 MMcf/d. The Godley plant is integrated with the ET Fuel System.
Permian Region:
The Permian Basin Gathering System offers wellhead-to-market services to producers in eleven counties in West Texas, as well as two counties in New Mexico which surround the Waha Hub, one of Texas’s developing NGL-rich natural gas market areas. As a result of the proximity of our system to the Waha Hub, the Waha Gathering System has a variety of market outlets for the natural gas that we gather and process, including several major interstate and intrastate pipelines serving California, the mid-continentmidcontinent region of the United States and Texas natural gas markets. The NGL market outlets includes Lone Star’s liquids pipelines. The Permian Basin Gathering System includes teneleven processing facilities (Waha, Coyanosa, Red Bluff, Halley, Jal, Keyston, Tippet, Orla, Panther, Rebel and Rebel)Arrowhead) with an aggregate processing capacity of 1.62 Bcf/d, treating capacity of 1.582.4 Bcf/d and one natural gas conditioning facility with aggregate capacity of 200 MMcf/d.
| |
| • | We own a 50% membership interest in Mi Vida JV, a joint venture which owns a 200 MMcf/d cryogenic processing plant in West Texas. We operate the plant and related facilities on behalf of Mi Vida JV. |
We own a 33.33% membership interest in Ranch JV, which processes natural gas delivered from the NGL-rich Bone Spring and Avalon Shale formations in West Texas. The joint venture owns a 25 MMcf/d refrigeration plant and a 125 MMcf/d cryogenic processing plant.
| |
| • | We own a 50% membership interest in Ranch JV, which processes natural gas delivered from the NGL-rich Bone Spring and Avalon Shale formations in West Texas. The joint venture owns a 25 MMcf/d refrigeration plant and a 125 MMcf/d cryogenic processing plant. |
Mid-ContinentMidcontinent Region:
The Mid-ContinentMidcontinent Systems are located in two large natural gas producing regions in the United States, the Hugoton Basin in southwest Kansas, and the Anadarko Basin in western Oklahoma and the Texas Panhandle.Panhandle and the STACK in central Oklahoma. These mature basins have continued to provide generally long-lived, predictable production volume. Our Mid-ContinentMidcontinent assets are extensive systems that gather, compress and dehydrate low-pressure gas. The Mid-ContinentMidcontinent Systems include fourteensixteen natural gas processing facilities (Mocane, Beaver, Antelope Hills, Woodall, Wheeler, Sunray, Hemphill, Phoenix, Hamlin, Spearman, Red Deer, Lefors, Cargray, Gray, Rose Valley, and Gray)Hopeton) with an aggregate capacity of 885 MMcf/d and one natural gas treating facility with aggregate capacity of 20 MMcf/approximately 1.4 Bcf/d.
| |
| • | We operate our Midcontinent Systems at low pressures to maximize the total throughput volumes from the connected wells. Wellhead pressures are therefore adequate to allow for flow of natural gas into the gathering lines without the cost of wellhead compression. |
| |
| • | We also own the Hugoton Gathering System that has 1,900 miles of pipeline extending over nine counties in Kansas and Oklahoma. This system is operated by a third party. |
We operate our Mid-Continent Systems at low pressures to maximize the total throughput volumes from the connected wells. Wellhead pressures are therefore adequate to allow for flow of natural gas into the gathering lines without the cost of wellhead compression.
We also own the Hugoton Gathering System that has 1,900 miles of pipeline extending over nine counties in Kansas and Oklahoma. This system is operated by a third party.
Eastern Region:
| |
| • | The Eastern Region assets are located in eleven counties in Pennsylvania, four counties in Ohio, three counties in West Virginia, and gather natural gas from the Marcellus and Utica basins. Our Eastern Region assets include approximately 600 miles of natural gas gathering pipeline, natural gas trunklines, fresh-water pipelines, and nine gathering and processing systems, as well as the 200 MMcf/d Revolution processing plant, which feeds into our Mariner East and Rover pipeline systems. |
| |
| • | We also own a 51% membership interest in Aqua – ETC Water Solutions LLC, a joint venture that transports and supplies fresh water to natural gas producers drilling in the Marcellus Shale in Pennsylvania. |
| |
| • | We own a 75% membership interest in ORS. On behalf of ORS, we operate its Ohio Utica River System, which consists of 47 miles of 36-inch, 13 miles of 30-inch and 3 miles of 24-inch gathering trunklines, that delivers up to 3.6 Bcf/d to Rockies Express Pipeline, Texas Eastern Transmission, Leach Xpress, Rover and DEO TPL-18. |
The Eastern Region assets are located in nine counties in Pennsylvania, three counties in Ohio, three counties in West Virginia, and gather natural gas from the Marcellus and Utica basins. Our Eastern Region assets include approximately 500 miles of natural gas gathering pipeline, natural gas trunklines, fresh-water pipelines, and nine gathering and processing systems. The fresh water pipeline system and Ohio gathering assets are held by jointly-owned entities.
We also own a 51% membership interest in Aqua – PVR, a joint venture that transports and supplies fresh water to natural gas producers drilling in the Marcellus Shale in Pennsylvania.
We and Traverse ORS LLC, a subsidiary of Traverse Midstream Partners LLC, own a 75% and 25% membership interest, respectively, in the ORS joint venture. On behalf of ORS, we operate its Ohio Utica River System (the “ORS System”), which consists of 47 miles of 36-inch and 13 miles of 30-inch gathering trunklines that delivers up to 2.1 Bcf/d to Rockies Express Pipeline (“REX”), Texas Eastern Transmission, and others.
NGL and Refined Products Transportation and Services
The following details the assets in our NGL and refined products transportation and services segment:
| | | Description of Assets | | Miles of Liquids Pipeline (2) | | Pipeline Throughput Capacity (MBbls/d) | | NGL Fractionation / Processing Capacity (MBbls/d) | | Working Storage Capacity (MBbls) | | Miles of Liquids Pipeline (2) | | NGL Fractionation / Processing Capacity (MBbls/d) | | Working Storage Capacity (MBbls) |
| Liquids Pipelines: | | | | | | | | | | | | | | |
| Lone Star Express | | 535 |
| | 507 |
| | — |
| | — |
| | 535 |
| | — |
| | — |
|
| West Texas Gateway Pipeline | | 512 |
| | 240 |
| | — |
| | — |
| | 512 |
| | — |
| | — |
|
| Lone Star | | 1,617 |
| | 120 |
| | — |
| | — |
| | 1,617 |
| | — |
| | — |
|
| Mariner East | | 300 |
| | 70 |
| | — |
| | — |
| | 670 |
| | — |
| | — |
|
| Mariner South | | 67 |
| | 200 |
| | — |
| | — |
| | 97 |
| | — |
| | — |
|
| Mariner West | | 395 |
| | 50 |
| | — |
| | — |
| | 395 |
| | — |
| | — |
|
White Cliffs Pipeline(3) | | | 527 |
| | — |
| | — |
|
| Other NGL Pipelines | | 645 |
| | 591 |
| | — |
| | — |
| | 162 |
| | — |
| | — |
|
| Liquids Fractionation and Services Facilities: | | | | | | | | | | | | | | |
| Mont Belvieu Facilities | | 163 |
| | 42 |
| | 520 |
| | 50,000 |
| | 182 |
| | 790 |
| | 50,000 |
|
Sea Robin Processing Plant1 | | — |
| | — |
| | 26 |
| | — |
| |
Refinery Services1 | | 103 |
| | — |
| | 25 |
| | — |
| |
Sea Robin Processing Plant(1) | | | — |
| | 26 |
| | — |
|
Refinery Services(1) | | | 103 |
| | 35 |
| | — |
|
| Hattiesburg Storage Facilities | | — |
| | — |
| | — |
| | 3,000 |
| | — |
| | — |
| | 3,000 |
|
| NGLs Terminals: | | | | | | | | | |
| Cedar Bayou | | | — |
| | — |
| | 1,600 |
|
| NGL Terminals: | | | | | | | |
| Nederland | | — |
| | — |
| | — |
| | 1,000 |
| | — |
| | — |
| | 1,200 |
|
| Marcus Hook Industrial Complex | | — |
| | — |
| | 90 |
| | 5,000 |
| | — |
| | 132 |
| | 6,000 |
|
| Inkster | | — |
| | — |
| | — |
| | 1,000 |
| | — |
| | — |
| | 860 |
|
| Refined Products Pipelines | | 2,200 |
| | 800 |
| | — |
| | — |
| |
| Refined Products Pipelines: | | |
| |
| |
|
| Eastern region pipelines | | | 957 |
| | — |
| | — |
|
| Midcontinent region pipelines | | | 349 |
| | — |
| | — |
|
| Southwest region pipelines | | | 876 |
| | — |
| | — |
|
| Inland Pipeline | | | 581 |
| | — |
| | — |
|
| JC Nolan Pipeline | | | 502 |
| | — |
| | — |
|
| Refined Products Terminals: | | | | | | | | | | | | | | |
| Eagle Point | | — |
| | — |
| | — |
| | 6,000 |
| | — |
| | — |
| | 7,000 |
|
| Marcus Hook Industrial Complex | | — |
| | — |
| | — |
| | 1,000 |
| | — |
| | — |
| | 1,000 |
|
| Marcus Hook Tank Farm | | — |
| | — |
| | — |
| | 2,000 |
| | — |
| | — |
| | 2,000 |
|
| Marketing Terminals | | — |
| | — |
| | — |
| | 8,000 |
| | — |
| | — |
| | 8,000 |
|
| JC Nolan Terminal | | | — |
| | — |
| | 134 |
|
| |
(1) | Additionally, the Sea Robin Processing Plant and Refinery Services have residue capacities of 850 MMcf/d and 54 MMcf/d, respectively. |
| |
(2) | Miles of pipeline as reported to PHMSA. |
| |
(3) | The White Cliffs Pipeline consists of two parallel, 12-inch common carrier pipelines: one crude oil pipeline and one NGL pipeline. |
The following information describes our principal NGL and refined products transportation and services assets:
The Lone Star Express System is an interstate NGL pipeline consisting of 24-inch and 30-inch long-haul transportation pipeline, with throughput capacity of approximately 500 MBbls/d, that delivers mixed NGLs from processing plants in the
Permian Basin, the Barnett Shale, and from East Texas to the Mont Belvieu NGL storage facility.
The West Texas Gateway Pipeline transports NGLs produced in the Permian and Delaware Basins and the Eagle Ford Shale to Mont Belvieu, Texas.
The Mariner East pipeline transports NGLs from the Marcellus and Utica Shales areas in Western Pennsylvania, West Virginia and Eastern Ohio to destinations in Pennsylvania, including our Marcus Hook Industrial Complex on the Delaware River, where they are processed, stored and distributed to local, domestic and waterborne markets. The first phase An expansion of the project, referredpipeline is currently underway, which will add approximately 400 MBbls/d of NGL pipeline capacity from Lone Star’s pipeline system near Wink, Texas to as Mariner East 1, consistedthe Lone Star Express 30-inch pipeline south of interstate and intrastate propane and ethaneFort Worth, Texas. It is expected to be in service and commenced operations inby the fourth quarter of 2014 and the first quarter of 2016, respectively. The second phase of the project, referred to as Mariner East 2, will expand the total takeaway capacity to 345 MBbls/d for interstate and intrastate propane, ethane and butane service, and is expected to commence operations in the second quarter of 2018.2020.
The Mariner South pipeline is part of a joint project with Lone Star to deliver export-grade propane and butane products from Lone Star’s Mont Belvieu, Texas storage and fractionation complex to our marine terminal in Nederland, Texas.
The Mariner West pipeline provides transportation of ethane from the Marcellus shale processing and fractionating areas in Houston, Pennsylvania to Marysville, Michigan and the Canadian border. Mariner West commenced operations in the fourth quarter of 2013, with capacity to transport approximately 50 MBbls/d.
Refined products pipelines include approximately 2,200 miles of refined products pipelines in several regions of the United States. The pipelines primarily provide transportation in the northeast, midwest, and southwest United States markets. These operations include our controlling financial interest in Inland Corporation (“Inland”). The mix of products delivered varies seasonally, with gasoline demand peaking during the summer months, and demand for heating oil and other distillate fuels peaking in the winter. In addition, weather conditions in the areas served by the refined products pipelines affect both the demand for, and the mix of, the refined products delivered through the pipelines, although historically, any overall impact on the total volume shipped has been short-term. The products transported in these pipelines include multiple grades of gasoline, and middle distillates, such as heating oil, diesel and jet fuel. Rates for shipments on these product pipelines are regulated by the FERC and other state regulatory agencies, as applicable.
Other NGL pipelines include the 127-mile Justice pipeline with capacity of 375 MBbls/d, the 45-mile Freedom pipeline with a capacity of 56 MBbls/d, the 20-mile Spirit pipeline with a capacity of 20 MBbls/d and a 50% interest in the 87-mile Liberty pipeline with a capacity of 140 MBbls/d.
Our Mont Belvieu storage facility is an integrated liquids storage facility with over 50 million Bbls of salt dome capacity providing 100% fee-based cash flows. The Mont Belvieu storage facility has access to multiple NGL and refined products pipelines, the Houston Ship Channel trading hub, and numerous chemical plants, refineries and fractionators.
Our Mont Belvieu fractionators handle NGLs delivered from several sources, including the Lone Star Express pipeline and the Justice pipeline. Fractionator V is currently under construction and is scheduled to be operational by the third quarter of 2018.
Sea Robin is a rich gas processing plant located on the Sea Robin Pipeline in southern Louisiana. The plant is connected to nine interstate and four intrastate residue pipelines, as well as various deep-water production fields. | |
| • | The West Texas Gateway Pipeline transports NGLs produced in the Permian and Delaware Basins and the Eagle Ford Shale to Mont Belvieu, Texas and has a throughput capacity of approximately 240 MBbls/d. |
| |
| • | The Mariner East pipeline transports NGLs from the Marcellus and Utica Shales areas in Western Pennsylvania, West Virginia and Eastern Ohio to destinations in Pennsylvania, including our Marcus Hook Industrial Complex on the Delaware River, where they are processed, stored and distributed to local, domestic and waterborne markets. The first phase of the project, referred to as Mariner East 1, consisted of interstate and intrastate propane and ethane service and commenced operations in the fourth quarter of 2014 and the first quarter of 2016, respectively. The second phase of the project, referred to as Mariner East 2, began service in December 2018. The Mariner East pipeline has a throughput capacity of approximately 345 MBbls/d. |
| |
| • | The Mariner South liquids pipeline delivers export-grade propane and butane products from Lone Star’s Mont Belvieu, Texas storage and fractionation complex to our marine terminal in Nederland, Texas and has a throughput capacity of approximately 200 MBbls/d. |
| |
| • | The Mariner West pipeline provides transportation of ethane from the Marcellus shale processing and fractionating areas in Houston, Pennsylvania to Marysville, Michigan and the Canadian border and has a throughput capacity of approximately 50 MBbls/d. |
| |
| • | The White Cliffs NGL pipeline, which we have 51% ownership interest in and which was acquired by ET in the SemGroup acquisition and contributed to ETO in January 2020, transports NGLs produced in the DJ Basin to Cushing, where it interconnects with the Southern Hills Pipeline to move NGLs to Mont Belvieu, Texas and has a throughput capacity of approximately 40 MBbls/d. |
| |
| • | Other NGL pipelines include the 127-mile Justice pipeline with capacity of 375 MBbls/d, the 45-mile Freedom pipeline with a capacity of 56 MBbls/d, the 20-mile Spirit pipeline with a capacity of 20 MBbls/d and a 50% interest in the 87-mile Liberty pipeline with a capacity of 140 MBbls/d. |
| |
| • | Our Mont Belvieu storage facility is an integrated liquids storage facility with approximately 50 MMBbls of salt dome capacity providing 100% fee-based cash flows. The Mont Belvieu storage facility has access to multiple NGL and refined products pipelines, the Houston Ship Channel trading hub, and numerous chemical plants, refineries and fractionators. |
| |
| • | Our Mont Belvieu fractionators handle NGLs delivered from several sources, including the Lone Star Express pipeline and the Justice pipeline. Fractionator VI was placed in service in February 2019, Fractionator VII was placed in service in the first quarter of 2020, and Fractionator VIII is currently under construction and is scheduled to be operational by the second quarter of 2021. |
| |
| • | Sea Robin is a rich gas processing plant located on the Sea Robin Pipeline in southern Louisiana. The plant is connected to nine interstate and four intrastate residue pipelines, as well as various deep-water production fields. |
Refinery Services consists of a refinery off-gas processing unit and an O-grade NGL fractionation / Refinery-Grade Propylene (“RGP”) splitting complex located along the Mississippi River refinery corridor in southern Louisiana. The off-gas processing unit cryogenically processes refinery off-gas, and the fractionation / RGP splitting complex fractionates the streams into higher value components. The O-grade fractionator and RGP splitting complex, located in Geismar, Louisiana, is connected by approximately 103 miles of pipeline to the Chalmette processing plant, which has a processing capacity of 54 MMcf/d.
The Hattiesburg storage facility is an integrated liquids storage facility with approximately 3 million Bbls of salt dome capacity, providing 100% fee-based cash flows.
The Nederland terminal, in addition to crude oil activities, also provides approximately 1 million Bbls of storage and distribution services for NGLs in connection with the Mariner South pipeline, which provides transportation of propane and butane products from the Mont Belvieu region to the Nederland terminal, where such products can be exported via ship. | |
| • | The Hattiesburg storage facility is an integrated liquids storage facility with approximately 3 MMBbls of salt dome capacity, providing 100% fee-based cash flows. |
| |
| • | The Cedar Bayou storage facility is an integrated liquids storage facility with approximately 1.6 MMBbls of tank storage, generating revenues from fixed fee storage contracts, throughput fees, and revenue from blending butane into refined gasoline. |
| |
| • | The Nederland terminal, in addition to crude oil activities, also provides approximately 1.2 MMBbls of storage and distribution services for NGLs in connection with the Mariner South pipeline, which provides transportation of propane and butane products from the Mont Belvieu region to the Nederland terminal, where such products can be exported via ship. |
The Marcus Hook Industrial Complex includes fractionation, terminalling and storage assets, with a capacity of approximately 2 million BblsMMBbls of NGL storage capacity in underground caverns, 3 million Bbls4 MMBbls of above-ground refrigerated storage, and related commercial agreements. The terminal has a total active refined products storage capacity of approximately 1 million Bbls.MMBbls. The facility can receive NGLs and refined products via marine vessel, pipeline, truck and rail, and can deliver via marine vessel,
pipeline and truck. In addition to providing NGLsNGL storage and terminalling services to both affiliates and third-party customers, the Marcus Hook Industrial Complex currently serves as an off-take outlet for theour Mariner East 1 pipeline and will provide similar off-take capabilities for the Mariner East 2 pipeline when it commences operations.system.
| |
| • | The Inkster terminal, located near Detroit, Michigan, consists of multiple salt caverns with a total storage capacity of approximately 860 MBbls of NGLs. We use the Inkster terminal’s storage in connection with the Toledo North pipeline system and for the storage of NGLs from local producers and a refinery in Western Ohio. The terminal can receive and ship by pipeline in both directions and has a truck loading and unloading rack. |
| |
| • | The Eastern region refined products pipelines consist of approximately 615 miles of 6-inch to 16-inch diameters refined product pipelines in Eastern, Central and North Central Pennsylvania, approximately 162 miles of 8-inch refined products pipeline in western New York and approximately 180 miles of various diameters refined products pipeline in New Jersey (including 80 miles of the 16-inch diameter Harbor Pipeline). |
| |
| • | The midcontinent region refined products pipelines primarily consist of approximately 296 miles of 3-inch to 12-inch refined products pipelines in Ohio and approximately 53 miles of 6-inch and 8-inch refined products pipeline in Michigan. |
The Inkster terminal, located near Detroit, Michigan, consists of multiple salt caverns with a total storage capacity of approximately 1 million Bbls of NGLs. We use the Inkster terminal’s storage in connection with the Toledo North pipeline system and for the storage of NGLs from local producers and a refinery in Western Ohio. The terminal can receive and ship by pipeline in both directions and has a truck loading and unloading rack.
We have approximately 40 refined products terminals with an aggregate storage capacity of approximately 8 million Bbls that facilitate the movement of refined products to or from storage or transportation systems, such as a pipeline, to other transportation systems, such as trucks or other pipelines. Each facility typically consists of multiple storage tanks and is equipped with automated truck loading equipment that is operational 24 hours a day.
In addition to crude oil service, the Eagle Point terminal can accommodate three marine vessels (ships or barges) to receive and deliver refined products to outbound ships and barges. The tank farm has a total active refined products storage capacity
of approximately 6 million Bbls, and provides customers with access to the facility via ship, barge and pipeline. The terminal can deliver via ship, barge, truck or pipeline, providing customers with access to various markets. The terminal generates revenue primarily by charging fees based on throughput, blending services and storage.
The Marcus Hook Tank Farm has a total refined products storage capacity of approximately 2 million Bbls of refined products storage. The tank farm historically served Sunoco Inc.’s Marcus Hook refinery and generated revenue from the related throughput and storage. In 2012, the main processing units at the refinery were idled in connection with Sunoco Inc.’s exit from its refining business. The terminal continues to receive and deliver refined products via pipeline and now primarily provides terminalling services to support movements on our refined products pipelines.
The EasternSouthwest region refined products pipelines consists of approximately 470 miles of 6-inch to 24-inch diameters refined product pipelines in Eastern, Central and North Central Pennsylvania, approximately 162 miles of 8-inch refined products pipeline in western New York and approximately 182 miles of various diameters refined products pipeline in New Jersey (including 80 miles of the 16-inch diameter Harbor Pipeline).
The Mid-Continent refined products pipelines primarily consists of approximately 212 miles of 3-inch to 12-inch refined products pipelines in Ohio, approximately 85 miles of 6-inch to 12-inch refined products pipeline in Western Pennsylvania and approximately 52 miles of 8-inch refined products pipeline in Michigan.
The Southwest refined products pipelines isare located in Eastern Texas and consistsconsist primarily of approximately 300876 miles of 8-inch diameter refined products pipeline.
| |
| • | The Inland refined products pipeline is approximately 580 miles of pipeline in Ohio, consisting of 72 miles of 12-inch diameter refined products pipeline in Northwest Ohio, 206 miles of 10-inch diameter refined products pipeline in vicinity of Columbus, Ohio, 135 miles of 8-inch diameter refined products pipeline in western Ohio, and 168 miles of 6-inch diameter refined products pipeline in Northeast Ohio. |
| |
| • | The JC Nolan Pipeline is a joint venture between a wholly-owned subsidiary of the Partnership and a wholly-owned subsidiary of Sunoco LP, which transports diesel fuel from a tank farm in Hebert, Texas to Midland, Texas, and was placed into service in July 2019 and has a throughput capacity of approximately 36 MBbls/d. |
| |
| • | We have approximately 35 refined products terminals with an aggregate storage capacity of approximately 8 MMBbls that facilitate the movement of refined products to or from storage or transportation systems, such as a pipeline, to other transportation systems, such as trucks or other pipelines. Each facility typically consists of multiple storage tanks and is equipped with automated truck loading equipment that is operational 24 hours a day. |
| |
| • | In addition to crude oil service, the Eagle Point terminal can accommodate three marine vessels (ships or barges) to receive and deliver refined products to outbound ships and barges. The tank farm has a total active refined products storage capacity of approximately 7 MMBbls, and provides customers with access to the facility via ship, barge and pipeline. The terminal can deliver via ship, barge, truck or pipeline, providing customers with access to various markets. The terminal generates revenue primarily by charging fees based on throughput, blending services and storage. |
| |
| • | The Marcus Hook Tank Farm has a total refined products storage capacity of approximately 2 MMBbls of refined products storage. The terminal receives and delivers refined products via pipeline and primarily provides terminalling services to support movements on our refined products pipelines. |
| |
| • | The JC Nolan Terminal, located in Midland, Texas, is a joint venture between a wholly-owned entity of the Partnership and wholly-owned entity of Sunoco LP, which provides diesel fuel storage that was placed into service in August 2019. |
| |
| • | This segment also includes the following joint ventures: 15% membership interest in the Explorer Pipeline Company, a 1,850-mile pipeline which originates from refining centers in Beaumont, Port Arthur, and Houston, Texas and extends to Chicago, Illinois; 31% membership interest in the Wolverine Pipe Line Company, a 1,055-mile pipeline that originates from Chicago, Illinois and extends to Detroit, Grand Haven, and Bay City, Michigan; 17% membership interest in the West Shore Pipe Line Company, a 650-mile pipeline which originates in Chicago, Illinois and extends to Madison and Green Bay, Wisconsin; a 14% membership interest in the Yellowstone Pipe Line Company, a 710-mile pipeline which originates from Billings, Montana and extends to Moses Lake, Washington. |
The Inland refined products pipeline, approximately 350 miles
Crude Oil Transportation and Services
The following details our pipelines and terminals in the crude oil transportation and services segment:
|
| | | | | | |
Description of Assets | | Miles of Crude Pipeline (1)
| | Working Storage Capacity
(MBbls) |
Dakota Access Pipeline | | 1,172 |
| | — |
|
Energy Transfer Crude Oil Pipeline | | 743 |
| | — |
|
Bayou Bridge Pipeline | | 49 |
| | — |
|
Permian Express Pipelines | | 1,712 |
| | — |
|
Other Crude Oil Pipelines | | 5,682 |
| | — |
|
Nederland Terminal | | — |
| | 26,000 |
|
Fort Mifflin Terminal | | — |
| | 570 |
|
Eagle Point Terminal | | — |
| | 1,000 |
|
Midland Terminal | | — |
| | 2,000 |
|
Marcus Hook Industrial Complex | | — |
| | 1,000 |
|
Patoka, Illinois Terminal | | — |
| | 2,000 |
|
|
| | | | | | | | | |
| Description of Assets | | Ownership Interest | | Miles of Crude Pipeline (1) | | Working Storage Capacity
(MBbls) |
| Dakota Access Pipeline | | 36.4 | % | | 1,172 |
| | — |
|
| Energy Transfer Crude Oil Pipeline | | 36.4 | % | | 744 |
| | — |
|
| Bayou Bridge Pipeline | | 60 | % | | 212 |
| | — |
|
| Permian Express Pipelines | | 87.7 | % | | 1,712 |
| | — |
|
| Wattenberg Oil Trunkline | | 100 | % | | 75 |
| | 360 |
|
White Cliffs Pipeline(2) | | 51 | % | | 527 |
| | 100 |
|
| Maurepas Pipeline | | 51 | % | | 106 |
| | — |
|
| Other Crude Oil Pipelines | | 100 | % | | 6,222 |
| | — |
|
| Nederland Terminal | | 100 | % | | — |
| | 29,000 |
|
| Fort Mifflin Terminal | | 100 | % | | — |
| | 3,175 |
|
| Eagle Point Terminal | | 100 | % | | — |
| | 1,300 |
|
| Midland Terminal | | 100 | % | | — |
| | 2,000 |
|
| Marcus Hook Industrial Complex | | 100 | % | | — |
| | 1,000 |
|
| Houston Terminal | | 100 | % | | — |
| | 18,200 |
|
| Cushing Facility | | 100 | % | | — |
| | 7,600 |
|
| Patoka, Illinois Terminal | | 87.7 | % | | — |
| | 2,000 |
|
| |
(1) | Miles of pipeline as reported to PHMSA. |
| |
(2) | The White Cliffs Pipeline consists of two parallel, 12-inch common carrier crude oil pipelines: one crude oil pipeline and one NGL pipeline. |
Our crude oil operations consist of an integrated set of pipeline, terminalling, trucking and acquisition and marketing assets that service the movement of crude oil from producers to end-user markets. The following details our assets in the crude oil transportation and services segment:
Crude Oil Pipelines
Our crude oil pipelines consist of approximately 9,35810,770 miles of crude oil trunk and gathering pipelines in the southwest, northwest and midwest United States, including our wholly-owned interests in West Texas Gulf, Permian Express Terminal LLC, (“PET”),Mid-Valley and Mid-Valley Pipeline Company (“Mid-Valley”).Wattenberg Oil Trunkline. Additionally, we have equity ownership interests in two crude oil pipelines. Our crude oil pipelines provide access to several trading hubs, including the largest trading hub for crude oil in the United States located
in Cushing, Oklahoma, and other trading hubs located in Midland, Colorado City and Longview, Texas. Our crude oil pipelines also deliver to and connect with other pipelines that deliver crude oil to a number of refineries.
| |
| • | Bakken Pipeline. Dakota Access and ETCO are collectively referred to as the “Bakken Pipeline.” The Bakken Pipeline is a 1,916 mile pipeline with capacity of 570 MBbls/d, that transports domestically produced crude oil from the Bakken/Three Forks production areas in North Dakota to a storage and terminal hub outside of Patoka, Illinois, or to gulf coast connections including our crude terminal in Nederland Texas. |
Bakken Pipeline. Dakota Access and ETCO are collectively referred to as the “Bakken Pipeline.” The Bakken Pipeline is a 1,915 mile pipeline with an initial capacity of 470 MBbls/d, expandable to 570 MBbls/d, that transports domestically produced crude oil from the Bakken/Three Forks production areas in North Dakota to a storage and terminal hub outside of Patoka, Illinois, or to gulf coast connections including our crude terminal in Nederland Texas.
The pipeline transports light, sweet crude oil from North Dakota to major refining markets in the Midwest and Gulf Coast regions.
Dakota Access went into service on June 1, 2017 and consists of approximately 1,172 miles of 12, 20, 24 and 30-inch diameter pipeline traversing North Dakota, South Dakota, Iowa and Illinois. Crude oil transported on the Dakota Access originates at six terminal locations in the North Dakota counties of Mountrail, Williams and McKenzie. The pipeline delivers the crude oil to a hub outside of Patoka, Illinois where it can be delivered to the ETCO Pipeline for delivery to the Gulf Coast, or can be transported via other pipelines to refining markets throughout the Midwest.
ETCO went into service on June 1, 2017 and consists of more than 743 miles consisting of 678approximately 675 miles of mostly 30-inch converted natural gas pipeline and 6569 miles of new 30-inch pipeline from Patoka, Illinois to Nederland, Texas, where the crude oil can be refined or further transported to additional refining markets.
| |
| • | Bayou Bridge Pipeline. The Bayou Bridge Pipeline is a joint venture between ETO and Phillips 66, in which ETO has a 60% ownership interest and serves as the operator of the pipeline. Phase I of the pipeline, which consists of a 30-inch pipeline from Nederland, Texas to Lake Charles, Louisiana, went into service in April 2016. Phase II of the pipeline, which consists of 24-inch pipe from Lake Charles, Louisiana to St. James, Louisiana, which went into service in March 2019. |
Bayou Bridge Pipeline. TheWith the completion of Phase II, Bayou Bridge Pipeline is a joint venture between ETP and Phillips 66, in which ETP has a 60% ownership interest and serves as the operatorcapacity of the pipeline. Phase I of the pipeline, which consists of a 30-inch pipeline from Nederland, Texas to Lake Charles, Louisiana, went into service in April 2016. Phase II of the pipeline, which will consist of 24-inch pipe from Lake Charles, Louisiana to St. James, Louisiana, is expected to be completed in the second half of 2018.
When completed the Bayou Bridge Pipeline will have a capacity expandable to approximately 480 MBbls/d of light and heavy crude oil from different sources to the St. James crude oil hub, which is home to important refineries located in the Gulf Coast region.
| |
| • | Permian Express Pipelines. The Permian Express pipelines are part of the PEP joint venture and include Permian Express 1, Permian Express 2, Permian Express 3, Permian Express 4, which became operational in May 2019, Permian Longview and Louisiana Access pipelines, as well as the Longview to Louisiana and Nederland Access pipelines contributed to this joint venture by ExxonMobil. These pipelines are comprised of crude oil trunk pipelines and crude oil gathering pipelines in Texas and Oklahoma and provide takeaway capacity from the Permian Basin, which origins in multiple locations in Western Texas. |
| |
| • | White Cliffs Pipeline. White Cliffs Pipeline, which was acquired by ET in the SemGroup acquisition and contributed to ETO in January 2020, owns a12-inch common carrier, crude oil pipeline, with a throughput capacity of 100 MBbls/d, that transports crude oil from Platteville, Colorado to Cushing, Oklahoma. |
| |
| • | Maurepas Pipeline. The Maurepas Pipeline, which was acquired by ET in the SemGroup acquisition and contributed to ETO in January 2020, consists of three pipelines, with an aggregate throughput capacity of 460 MBbls/d, which service refineries in the Gulf Coast region. |
| |
| • | Other Crude Oil pipelines include the Mid-Valley pipeline system which originates in Longview, Texas and passes through Louisiana, Arkansas, Mississippi, Tennessee, Kentucky and Ohio and terminates in Samaria, Michigan. This pipeline provides crude oil to a number of refineries, primarily in the Midwest United States. |
Permian Express Pipelines. The Permian Express pipelines are part of the PEP joint venture and include Permian Express 1, Permian Express 2, Permian Longview and Louisiana Access pipelines, as well as the Longview to Louisiana and Pegasus pipelines contributed to this joint venture by ExxonMobil. These pipelines are comprised of crude oil trunk pipelines and crude oil gathering pipelines in Texas and Oklahoma and provide takeaway capacity from the Permian Basin, which origins in multiple locations in Western Texas.
Other Crude Oil pipelines include the Mid-Valley pipeline system which originates in Longview, Texas and passes through Louisiana, Arkansas, Mississippi, Tennessee, Kentucky and Ohio and terminates in Samaria, Michigan. This pipeline provides crude oil to a number of refineries, primarily in the Midwest United States.
In addition, we own a crude oil pipeline that runs from Marysville, Michigan to Toledo, Ohio, and a truck injection point for local production at Marysville. This pipeline receives crude oil from the Enbridge pipeline system for delivery to refineries located in Toledo, Ohio and to MPLX’s Samaria, Michigan tank farm, which supplies its Marathon Petroleum Corporation’s refinery in Detroit, Michigan.
We also own and operate crude oil pipeline and gathering systems in Oklahoma.Oklahoma and Kansas. We have the ability to deliver substantially all of the crude oil gathered on our Oklahoma systemand Kansas systems to Cushing. We are one of the largest purchasers of crude oil from producers in the state,area, and our crude oil acquisition and marketing activities business is the primary shipper on our Oklahoma crude oil system.
Crude Oil Terminals
Nederland. The Nederland terminal, located on the Sabine-Neches waterway between Beaumont and Port Arthur, Texas, is a large marine terminal providing storage and distribution services for refiners and other large transporters of crude oil and NGLs. The terminal receives, stores, and distributes crude oil, NGLs, feedstocks, lubricants, petrochemicals, and bunker oils (used for fueling ships and other marine vessels), and also blends lubricants. The terminal currently has a total storage capacity of approximately 26 million Bbls in approximately 150 above ground storage tanks with individual capacities of up to 660 MBbls.
| |
| • | Nederland. The Nederland terminal, located on the Sabine-Neches waterway between Beaumont and Port Arthur, Texas, is a large marine terminal providing storage and distribution services for refiners and other large transporters of crude oil and NGLs. The terminal receives, stores, and distributes crude oil, NGLs, feedstocks, petrochemicals and bunker oils (used for fueling ships and other marine vessels). The terminal currently has a total storage capacity of approximately 29 MMBbls in approximately 150 above ground storage tanks with individual capacities of up to 660 MBbls. |
The Nederland terminal can receive crude oil at four of its five ship docks and four barge berths. The four ship docks are capable of receiving over 2 million Bbls/MMBbls/d of crude oil. In addition to our crude oil pipelines, the terminal can also receive crude oil through a number of other pipelines, including the DOE. The DOE pipelines connect the terminal to the United States Strategic Petroleum Reserve’s West Hackberry caverns at Hackberry, Louisiana and Big Hill caverns near Winnie, Texas, which have an aggregate storage capacity of approximately 395 million Bbls.MMBbls.
The Nederland Terminal can deliver crude oil and other petroleum products via pipeline, barge and ship. The terminal has twothree ship docks and three barge berths that are capable of delivering crude oils for international transport. In total, the terminal is capable of delivering over 2 million Bbls/MMBbls/d of crude oil to our crude oil pipelines or a number of third-party pipelines including the DOE. The Nederland terminal generates crude oil revenues primarily by providing term or spot storage services and throughput capabilities to a number of customers.
| |
| • | Fort Mifflin. The Fort Mifflin terminal complex is located on the Delaware River in Philadelphia, Pennsylvania and includes the Fort Mifflin terminal, the Hog Island wharf, the Darby Creek tank farm and connecting pipelines. Revenues are generated from the Fort Mifflin terminal complex by charging fees based on throughput. |
Fort Mifflin. The Fort Mifflin terminal complex is located on the Delaware River in Philadelphia, Pennsylvania and includes the Fort Mifflin terminal, the Hog Island wharf, the Darby Creek tank farm and connecting pipelines. Revenues are generated from the Fort Mifflin terminal complex by charging fees based on throughput.
17
The Fort Mifflin terminal contains two ship docks with freshwater drafts and a total storage capacity of approximately 570575 MBbls. Crude oil and some refined products enter the Fort Mifflin terminal primarily from marine vessels on the Delaware River. One Fort Mifflin dock is designed to handle crude oil from very large crude carrier-class tankers and smaller crude oil vessels. The other dock can accommodate only smaller crude oil vessels.
The Hog Island wharf is located next to the Fort Mifflin terminal on the Delaware River and receives crude oil via two ship docks, one of which can accommodate crude oil tankers and smaller crude oil vessels, and the other of which can accommodate some smaller crude oil vessels.
The Darby Creek tank farm is a primary crude oil storage terminal for the Philadelphia refinery, which is operated by PES under a joint venture with Sunoco, Inc.refinery. This facility has a total storage capacity of approximately 3 million Bbls.2.6 MMBbls. Darby Creek receives crude oil from the Fort Mifflin terminal and Hog Island wharf via our pipelines. The tank farm then stores the crude oil and transports it to the PES refinery via our pipelines.
Eagle Point. The Eagle Point terminal is located in Westville, New Jersey and consists of docks, truck loading facilities and a tank farm. The docks are located on the Delaware River and can accommodate three marine vessels (ships or barges) to receive and deliver crude oil, intermediate products and refined products to outbound ships and barges. The tank farm has a total active storage capacity of approximately 1 million Bbls and can receive crude oil via barge and rail and deliver via ship and barge, providing customers with access to various markets. The terminal generates revenue primarily by charging fees based on throughput, blending services and storage.
Midland. The Midland terminal is located in Midland, Texas and was acquired in November 2016 from Vitol. The facility includes approximately 2 million Bbls of crude oil storage, a combined 14 lanes of truck loading and unloading, and provides access to the Permian Express 2 transportation system.
Marcus Hook Industrial Complex. The Marcus Hook Industrial Complex can receive crude oil via marine vessel and can deliver via marine vessel and pipeline. The terminal has a total active crude oil storage capacity of approximately 1 million Bbls.
Patoka, Illinois Terminal. The Patoka, Illinois terminal is a tank farm and was contributed by ExxonMobil to the PEP joint venture and is located in Marion County, Illinois. The facility includes 234 acres of owned land and provides for approximately 2 million Bbls of crude oil storage.
| |
| • | Eagle Point. The Eagle Point terminal is located in Westville, New Jersey and consists of docks, truck loading facilities and a tank farm. The docks are located on the Delaware River and can accommodate three marine vessels (ships or barges) to receive and deliver crude oil, intermediate products and refined products to outbound ships and barges. The tank farm has a total active storage capacity of approximately 1.3 MMBbls and can receive crude oil via barge and rail and deliver via ship and barge, providing customers with access to various markets. The terminal generates revenue primarily by charging fees based on throughput, blending services and storage. |
| |
| • | Midland. The Midland terminal is located in Midland, Texas and was acquired in November 2016 from Vitol. The facility includes approximately 2 MMBbls of crude oil storage, a combined 20 lanes of truck loading and unloading, and provides access to the Permian Express 2 transportation system. |
| |
| • | Marcus Hook Industrial Complex. The Marcus Hook Industrial Complex can receive crude oil via marine vessel and can deliver via marine vessel and pipeline. The terminal has a total active crude oil storage capacity of approximately 1 MMBbls. |
| |
| • | Patoka, Illinois Terminal. The Patoka, Illinois terminal is a tank farm and was contributed by ExxonMobil to the PEP joint venture and is located in Marion County, Illinois. The facility includes 234 acres of owned land and provides for approximately 2 MMBbls of crude oil storage. |
| |
| • | Houston Terminal. The Houston Terminal, which was acquired by ET in the SemGroup acquisition and contributed to ETO in February 2020, consists of storage tanks located on the Houston Ship Channel with an aggregate storage capacity of 18.2 MMBbls used to store, blend and transport refinery products and refinery feedstocks via pipeline, barge, rail, truck and ship. This facility has five deep-water ship docks on the Houston Ship Channel capable of loading and unloading Suezmax cargo vessels and seven barge docks which can accommodate 23 barges simultaneously, three crude oil pipelines connecting to four refineries and numerous rail and truck loading spots. |
| |
| • | Cushing Facilities. The Cushing Facility, which was acquired by ET in the SemGroup acquisition and contributed to ETO in January 2020, has approximately 7.6 MMBbls crude oil storage, of which 5.6 MMBbls are leased to customer and 2.0 MMBbls are available for crude oil operations, blending and marketing activities. The storage terminal has inbound connections with the White Cliffs Pipeline from Platteville, Colorado, the Great Salt Plains Pipeline from Cherokee, Oklahoma, the Cimarron Pipeline from Boyer, Kansas, and two-way connections with all of the other major storage terminals in Cushing. The Cushing terminal also includes truck unloading facilities. |
Crude Oil Acquisition and Marketing
Our crude oil acquisition and marketing operations are conducted using our assets, which include approximately 370575 crude oil transport trucks, 360 trailers and approximately 150 crude oil truck unloading facilities, as well as third-party truck, rail and marine assets.
Investment in Sunoco LP
Sunoco LP is a distributor of motor fuels and other petroleum products which Sunoco LP supplies to third-party dealers and distributors, to independent operators of commission agent locations and other commercial consumers of motor fuel. Also included in the wholesale operations are transmix processing plants and refined products terminals. Transmix is the mixture of various refined products (primarily gasoline and diesel) created in the supply chain (primarily in pipelines and terminals) when various products interface with each other. Transmix processing plants separate this mixture and return it to salable products of gasoline and diesel.
Sunoco LP is the exclusive wholesale supplier of the Sunoco-branded motor fuel, supplying an extensive distribution network of approximately 5,474 Sunoco-branded company and third-party operated locations throughout the East Coast, Midwest, South
Central and Southeast regions of the United States. Sunoco LP believes it is one of the largest independent motor fuel distributors of Chevron, Exxon and Valero branded motor fuel in the United States. In addition to distributing motor fuels, Sunoco LP also distributes other petroleum products such as propane and lubricating oil, and Sunoco LP receives rental income from real estate that it leases or subleases.
Sunoco LP operations primarily consist of fuel distribution and marketing.
Sunoco LP’s Fuel Distribution and Marketing Operations
Sunoco LP’s fuel distribution and marketing operations are conducted by the following consolidated subsidiaries:
| |
| • | Sunoco, LLC (“Sunoco LLC”), a Delaware limited liability company, primarily distributes motor fuel in 30 states throughout the East Coast, Midwest, South Central and Southeast regions of the United States. Sunoco LLC also processes transmix and distributes refined product through its terminals in Alabama, Texas, Arkansas and New York; |
| |
| • | Sunoco Retail LLC (“Sunoco Retail”), a Pennsylvania limited liability company, owns and operates retail stores that sell motor fuel and merchandise primarily in New Jersey; |
| |
| • | Aloha Petroleum LLC, a Delaware limited liability company, distributes motor fuel and operates terminal facilities on the Hawaiian Islands; and |
| |
| • | Aloha Petroleum, Ltd. (“Aloha”), a Hawaii corporation, owns and operates retail stores on the Hawaiian Islands. |
Sunoco LP purchases motor fuel primarily from independent refiners and major oil companies and distributes it across more than 30 states throughout the East Coast, Midwest, South Central and Southeast regions of the United States, as well as Hawaii to approximately:
| |
| • | 75 company owned and operated retail stores; |
| |
| • | 537 independently operated consignment locations where Sunoco LP sells motor fuel to customers under commission agent arrangements with such operators; |
| |
| • | 6,742 convenience stores and retail fuel outlets operated by independent operators, which are referred to as “dealers” or “distributors,” pursuant to long-term distribution agreements; and |
2,581 other commercial customers, including unbranded convenience stores, other fuel distributors, school districts and municipalities and other industrial customers.
Sunoco LP’s Other Operations
Sunoco LP’s other operations include retail operations in Hawaii and New Jersey, credit card services and franchise royalties.
Investment in USAC
The following details the assets of USAC:
USAC’s modern, standardized compression unit fleet is powered primarily by the Caterpillar, Inc.’s 3400, 3500 and 3600 engine classes, which range from 401 to 5,000 horsepower per unit. These larger horsepower units, which USAC defines as 400 horsepower per unit or greater, represented 86.2% of its total fleet horsepower (including compression units on order) as of December 31, 2019. In addition, a portion of its fleet consists of smaller horsepower units ranging from 40 horsepower to 399 horsepower that are primarily used in gas lift applications.
The following table provides a summary of USAC’s compression units by horsepower as of December 31, 2019:
|
| | | | | | | | | | | | | | | | | | |
| Unit Horsepower | | Fleet Horsepower | | Number of Units | | Horsepower on Order (1) | | Number of Units on Order | | Total Horsepower | | Total Number of Units |
| Small horsepower | | | | | | | | | | | | |
| <400 | | 516,674 |
| | 3,031 |
| | — |
| | — |
| | 516,674 |
| | 3,031 |
|
| | | | | | | | | | | | | |
| Large horsepower | | | | | | | | | | | | |
| >400 and <1,000 | | 426,384 |
| | 730 |
| | 9,000 |
| | 15 |
| | 435,384 |
| | 745 |
|
| >1,000 | | 2,739,910 |
| | 1,690 |
| | 47,500 |
| | 19 |
| | 2,787,410 |
| | 1,709 |
|
| Total large horsepower | | 3,166,294 |
| | 2,420 |
| | 56,500 |
| | 34 |
| | 3,222,794 |
| | 2,454 |
|
| Total horsepower | | 3,682,968 |
| | 5,451 |
| | 56,500 |
| | 34 |
| | 3,739,468 |
| | 5,485 |
|
| |
(1) | As of December 31, 2019, USAC had 56,500 large horsepower compression units on order for delivery during 2020. |
All Other
The following details ourthe significant assets in the all other“All Other” segment.
Equity Method Investments
Sunoco LP. We have an equity method investment in limited partnership units of Sunoco LP. As of December 31, 2017, our investment consisted of 43.5 million units, representing 43.6% of Sunoco LP’s total outstanding common units. Subsequent to Sunoco LP’s repurchase of a portion of its common units on February 7, 2018, our investment consists of 26.2 million units, representing 31.8% of Sunoco LP’s total outstanding common units.
PES. We have a non-controlling interest in PES, comprising 33% of PES’ outstanding common units. As discussed in “Segment Overview - All Other” above, PES Holdings and eight affiliates filed for Chapter 11 bankruptcy protection on January 21, 2018.
Contract Services Operations
We own and operate a fleet of equipment used to provide treating services, such as carbon dioxide and hydrogen sulfide removal, natural gas cooling, dehydration and BTUBtu management. Our contract treating services are primarily located in Texas, Louisiana and Arkansas.
Compression
We own all of the outstanding equity interests of CDM,DDT, which operates a natural gas compression equipment business with operations in Arkansas, California, Colorado, Louisiana, New Mexico, Oklahoma, Pennsylvania and Texas. As discussed in “Strategic Transactions,” in January 2018, we entered into an agreement to contribute CDM to USAC.
We own 100% of the membership interests of ETG, which owns all of the partnership interests of ETT. ETT provides compression services to customers engaged in the transportation of natural gas, including our subsidiaries in other segments.
Natural Resources Operations
Our Natural Resources operations primarily involve the management and leasing of coal properties and the subsequent collection of royalties. We also earn revenues from other land management activities, such as selling standing timber, leasing fee-based coal-related infrastructure facilities to certain lessees and end-user industrial plants, collecting oil and gas royalties and from coal transportation, or wheelage fees. As of December 31, 2017,2019, we owned or controlled approximately 766762 million tons of proven and probable coal reserves in central and northern Appalachia, properties in eastern Kentucky, southwestern Virginia and southern West Virginia, and in the Illinois Basin, properties in southern Illinois, Indiana, and western Kentucky and as the operator of end-user coal handling facilities.
Liquefaction Project
LCL, an entity whose parent is owned 60% by ETE and 40% by ETP, is in the process of developing a liquefaction project at the site of ETE’s existing regasification facility in Lake Charles, Louisiana. The project development agreement previously entered into in September 2013 with BG Group plc (now "Shell") related to this project expired in February 2017. On June 28, 2017, LCL signed a memorandum of understanding with Korea Gas Corporation and Shell to study the feasibility of a joint development of the Lake Charles liquefaction project. The project would utilize existing dock and storage facilities owned by ETE located on the Lake Charles site. The parties’ determination as to the feasibility of the project will be particularly dependent upon the prospects for securing long-term contractual arrangements for the off-take of LNG which in turn will be dependent upon supply and demand factors affecting the price of LNG in foreign markets. The financial viability of the project will also be dependent upon a number of other factors, including the expected cost to construct the liquefaction facility, the terms and conditions of the financing for the construction of the liquefaction facility, the cost of the natural gas supply, the costs to transport natural gas to the liquefaction facility, the costs to operate the liquefaction facility and the costs to transport LNG from the liquefaction facility to customers in foreign markets (particularly Europe and Asia). Some of these costs fluctuate based on a variety of factors, including supply and demand factors affecting the price of natural gas in the United States, supply and demand factors affecting the costs for construction services for large infrastructure projects in the United States, and general economic conditions, there can be no assurance that the parties will determine to proceed to develop this project.
The liquefaction project is expected to consist of three LNG trains with a combined design nameplate outlet capacity of 16.45 metric tonnes per annum. Once completed, the liquefaction project will enable LCL to liquefy domestically produced natural gas and export it as LNG. By adding the new liquefaction facility and integrating with the existing LNG regasification/import facility, the enhanced facility would become a bi-directional facility capable of exporting and importing LNG. Shell is the sole customer for the existing regasification facility and is obligated to pay reservation fees for 100% of the regasification capacity regardless of whether it actually utilizes such capacity pursuant to a regasification services agreement that terminates in 2030. The liquefaction project would be constructed on 440 acres of land, of which 80 acres are owned by Lake Charles LNG and the remaining acres are to be leased by LCL under a long-term lease from the Lake Charles Harbor and Terminal District.
The export of LNG produced by the liquefaction project from the United States would be undertaken under long-term export authorizations issued by the DOE to LCL. In March 2013, LCL obtained a DOE authorization to export LNG to countries with which the United States has or will have Free Trade Agreements (“FTA”) for trade in natural gas (the “FTA Authorization”). In July 2016, LCL also obtained a conditional DOE authorization to export LNG to countries that do not have an FTA for trade in natural gas (the “Non-FTA Authorization”). The FTA Authorization and Non-FTA Authorization have 25- and 20-year terms, respectively.
We have received our wetlands permits from the United States Army Corps of Engineers (“USACE”) to perform wetlands mitigation work and to perform modification and dredging work for the temporary and permanent dock facilities at the Lake Charles LNG facilities.
Business Strategy
We have designed our business strategy with the goal of creating and maximizing value to our Unitholders. We believe we have engaged, and will continue to engage, in a well-balanced plan for growth through strategic acquisitions, internally generated expansion, measures aimed at increasing the profitability of our existing assets and executing cost control measures where appropriate to manage our operations.
We intend to continue to operate as a diversified, growth-oriented master limited partnership with a focus on increasing the amount of cash available for distribution on each Common Unit.partnership. We believe that by pursuing independent operating and growth strategies we will be best positioned to achieve our objectives. We balance our desire for growth with our goal of preserving a strong balance sheet, ample liquidity and investment grade credit metrics.
Following is a summary of the business strategies of our core businesses:
Growth through acquisitions. We intend to continue to make strategic acquisitions that offer the opportunity for operational efficiencies and the potential for increased utilization and expansion of our existing assets while supporting our investment grade credit ratings.
Engage in construction and expansion opportunities. We intend to leverage our existing infrastructure and customer relationships by constructing and expanding systems to meet new or increased demand for midstream and transportation services.
Increase cash flow from fee-based businesses. We intend to increase the percentage of our business conducted with third parties under fee-based arrangements in order to provide for stable, consistent cash flows over long contract periods while reducing exposure to changes in commodity prices.
Enhance profitability of existing assets. We intend to increase the profitability of our existing asset base by adding new volumes under long-term producer commitments, undertaking additional initiatives to enhance utilization and reducing costs by improving operations.
Competition
Natural Gas
The business of providing natural gas gathering, compression, treating, transportation, storage and marketing services is highly competitive. Since pipelines are generally the only practical mode of transportation for natural gas over land, the most significant competitors of our transportation and storage segment are other pipelines. Pipelines typically compete with each other based on location, capacity, price and reliability.
We face competition with respect to retaining and obtaining significant natural gas supplies under terms favorable to us for the gathering, treating and marketing portions of our business. Our competitors include major integrated oil and gas companies, interstate and intrastate pipelines and other companies that gather, compress, treat, process, transport and market natural gas. Many of our competitors, such as major oil and gas and pipeline companies, have capital resources and control supplies of natural gas substantially greater than ours.
In marketing natural gas, we have numerous competitors, including marketing affiliates of interstate pipelines, major integrated oil and gas companies, and local and national natural gas gatherers, brokers and marketers of widely varying sizes, financial resources and experience. Local utilities and distributors of natural gas are, in some cases, engaged directly, and through affiliates, in marketing activities that compete with our marketing operations.
NGL
In markets served by our NGL pipelines, we face competition with other pipeline companies, including those affiliated with major oil, petrochemical and natural gas companies, and barge, rail and truck fleet operations. In general, our NGL pipelines compete with these entities in terms of transportation fees, reliability and quality of customer service. We face competition with other storage facilities based on fees charged and the ability to receive and distribute the customer’s products. We compete with a number of NGL fractionators in Texas and Louisiana. Competition for such services is primarily based on the fractionation fee charged.
Crude Oil and Refined Products
In markets served by our productscrude oil and crude oilrefined products pipelines, we face competition from other pipelines as well as rail and truck transportation. Generally, pipelines are the safest, lowest cost method for long-haul, overland movement of products and crude oil. Therefore, the most significant competitors for large volume shipments in the areas served by our pipelines are other pipelines.
In addition, pipeline operations face competition from rail and trucks that deliver products in a number of areas that our pipeline operations serve. While their costs may not be competitive for longer hauls or large volume shipments, rail and trucks compete effectively for incremental and marginal volume in many areas served by our pipelines.
With respect to competition from other pipelines, the primary competitive factors consist of transportation charges, access to crude oil supply and market demand. Competitive factors in crude oil purchasing and marketing include price and contract flexibility, quantity and quality of services, and accessibility to end markets.
Our refined product terminals compete with other independent terminals with respect to price, versatility and services provided. The competition primarily comes from integrated petroleum companies, refining and marketing companies, independent terminal companies and distribution companies with marketing and trading operations.
Wholesale Fuel Distribution and Retail Marketing
In our wholesale fuel distribution business, we compete primarily with other independent motor fuel distributors. The markets for distribution of wholesale motor fuel and the large and growing convenience store industry are highly competitive and fragmented, which results in narrow margins. We have numerous competitors, some of which may have significantly greater resources and name recognition than we do. Significant competitive factors include the availability of major brands, customer service, price, range of services offered and quality of service, among others. We rely on our ability to provide value-added and reliable service and to control our operating costs in order to maintain our margins and competitive position.
In our retail business, we face strong competition in the market for the sale of retail gasoline and merchandise. Our competitors include service stations of large integrated oil companies, independent gasoline service stations, convenience stores, fast food stores, supermarkets, drugstores, dollar stores, club stores and other similar retail outlets, some of which are well-recognized national or regional retail systems. The number of competitors varies depending on the geographical area. It also varies with gasoline and convenience store offerings. The principal competitive factors affecting our retail marketing operations include gasoline and diesel acquisition costs, site location, product price, selection and quality, site appearance and cleanliness, hours of operation, store safety, customer loyalty and brand recognition. We compete by pricing gasoline competitively, combining our retail gasoline business with convenience stores that provide a wide variety of products, and using advertising and promotional campaigns.
Credit Risk and Customers
Credit risk refers to the risk that a counterparty may default on its contractual obligations resulting in a loss to the Partnership. Credit policies have been approved and implemented to govern the Partnership’s portfolio of counterparties with the objective of mitigating credit losses. These policies establish guidelines, controls and limits to manage credit risk within approved tolerances by mandating an appropriate evaluation of the financial condition of existing and potential counterparties, monitoring agency credit ratings, and by implementing credit practices that limit exposure according to the risk profiles of the counterparties. Furthermore, the Partnership may, at times, require collateral under certain circumstances to mitigate credit risk as necessary. The Partnership also uses industry standard commercial agreements which allow for the netting of exposures associated with transactions executed under a single commercial agreement. Additionally, we utilize master netting agreements to offset credit exposure across multiple commercial agreements with a single counterparty or affiliated group of counterparties.
The Partnership’s counterparties consist of a diverse portfolio of customers across the energy industry, including petrochemical companies, commercial and industrials,industrial end-users, oil and gas producers, municipalities, gas and electric utilities, midstream companies and independent power generators. Our overall exposure may be affected positively or negatively by macroeconomic or regulatory changes that impact our counterparties to one extent or another. Currently, management does not anticipate a material adverse effect in our financial position or results of operations as a consequence of counterparty non-performance.
Our natural gas transportation and midstream revenues are derived significantly from companies that engage in exploration and production activities. The discovery and development of new shale formations across the United States has created an abundance of natural gas and crude oil resulting in a negative impact on prices in recent years for natural gas and crude oil. As a result, some of our exploration and production customers have been adversely impacted; however, we are monitoring these customers and mitigating credit risk as necessary.
During the year ended December 31, 2017,2019, none of our customers individually accounted for more than 10% of our consolidated revenues.
Regulation of Interstate Natural Gas Pipelines.The FERC has broad regulatory authority over the business and operations of interstate natural gas pipelines. Under the Natural Gas Act of 1938 (“NGA”), the FERC generally regulates the transportation of natural gas in interstate commerce. For FERC regulatory purposes, “transportation” includes natural gas pipeline transmission (forwardhauls and backhauls), storage and other services. The Florida Gas Transmission, Transwestern, Panhandle Eastern, Trunkline Gas, Tiger, Fayetteville Express, Rover, Sea Robin, Gulf States and Midcontinent Express pipelines transport natural gas in interstate commerce and thus each qualifies as a “natural-gas company” under the NGA subject to the FERC’s regulatory jurisdiction. We also hold certain natural gas storage facilities that are subject to the FERC’s regulatory oversight under the NGA.
The FERC’s NGA authority includes the power to:
approve the siting, construction and operation of new facilities;
review and approve transportation rates;
determine the types of services our regulated assets are permitted to perform;
regulate the terms and conditions associated with these services;
permit the extension or abandonment of services and facilities;
require the maintenance of accounts and records; and
authorize the acquisition and disposition of facilities.
Under the NGA, interstate natural gas companies must charge rates that are just and reasonable. In addition, the NGA prohibits natural gas companies from unduly preferring or unreasonably discriminating against any person with respect to pipeline rates or terms and conditions of service.
The maximum rates to be charged by NGA-jurisdictional natural gas companies and their terms and conditions for service are required to be on file with the FERC. Most natural gas companies are authorized to offer discounts from their FERC-approved maximum just and reasonable rates when competition warrants such discounts. Natural gas companies are also generally permitted to offer negotiated rates different from rates established in their tariff if, among other requirements, such companies’ tariffs offer a cost-based recourse rate to a prospective shipper as an alternative to the negotiated rate. Natural gas companies must make offers of rate discounts and negotiated rates on a basis that is not unduly discriminatory. Existing tariff rates may be challenged by complaint or on the FERC’s own motion, and if found unjust and unreasonable, may be altered on a prospective basis from no earlier than the date of the complaint or initiation of a proceeding by the FERC. The FERC must also approve all rate changes. We cannot guarantee that the FERC will allow us to charge rates that fully recover our costs or continue to pursue its approach of pro-competitive policies.
For two of our NGA-jurisdictional natural gas companies, Tiger and Fayetteville Express, the large majority of capacity in those pipelines is subscribed for lengthy terms under FERC-approved negotiated rates. However, as indicated above, cost-based recourse rates are also offered under their respective tariffs.
Pursuant to the FERC’s rules promulgated under the Energy Policy Act of 2005, it is unlawful for any entity, directly or indirectly, in connection with the purchase or sale of electric energy or natural gas or the purchase or sale of transmission or transportation services subject to FERC jurisdiction: (i) to defraud using any device, scheme or artifice; (ii) to make any untrue statement of material fact or omit a material fact; or (iii) to engage in any act, practice or course of business that operates or would operate as a fraud or deceit. The Commodity Futures Trading Commission (“CFTC”) also holds authority to monitor certain segments of the physical and futures energy commodities market pursuant to the Commodity Exchange Act (“CEA”). With regard to our physical purchases and sales of natural gas, NGLs or other energy commodities; our gathering or transportation of these energy commodities; and any related hedging activities that we undertake, we are required to observe these anti-market manipulation laws and related regulations enforced by the FERC and/or the CFTC. These agencies hold substantial enforcement authority, including the ability to assess or seek civil penalties in excess of up to approximately $1$1.1 million per day per violation, to order disgorgement of profits and to recommend criminal penalties. Should we violate the anti-market manipulation laws and regulations, we could also be subject to related third-party damage claims by, among others, sellers, royalty owners and taxing authorities.
Failure to comply with the NGA, the Energy Policy Act of 2005, the CEA and the other federal laws and regulations governing our operations and business activities can result in the imposition of administrative, civil and criminal remedies.
Regulation of Intrastate Natural Gas and NGL Pipelines. Intrastate transportation of natural gas and NGLs is largely regulated by the state in which such transportation takes place. To the extent that our intrastate natural gas transportation systems transport natural gas in interstate commerce, the rates and terms and conditions of such services are subject to FERC jurisdiction under Section 311 of the Natural Gas Policy Act of 1978 (“NGPA”). The NGPA regulates, among other things, the provision of transportation services by an intrastate natural gas pipeline on behalf of a local distribution company or an interstate natural gas pipeline. The rates and terms and conditions of some transportation and storage services provided on the Oasis pipeline, HPL System, East Texas pipeline, ET Fuel System, Trans-Pecos and Comanche Trail are subject to FERC regulation pursuant to Section 311 of the NGPA. Under Section 311, rates charged for intrastate transportation must be fair and equitable, and amounts collected in excess of fair and equitable rates are subject to refund with interest. The terms and conditions of service set forth in the intrastate facility’s statement of operating conditions are also subject to FERC review and approval. Should the FERC determine not to authorize rates equal to or greater than our currently approved Section 311 rates, our business may be adversely affected. Failure to observe the service limitations applicable to transportation and storage services under Section 311, failure to comply with the rates approved by the FERC for Section 311 service, and failure to comply with the terms and conditions of service established in the pipeline’s FERC-approved statement of operating conditions could result in an alteration of jurisdictional status, and/or the imposition of administrative, civil and criminal remedies.
Our intrastate natural gas operations are also subject to regulation by various agencies in Texas, principally the TRRC. Our intrastate pipeline and storage operations in Texas are also subject to the Texas Utilities Code, as implemented by the TRRC. Generally, the TRRC is vested with authority to ensure that rates, operations and services of gas utilities, including intrastate pipelines, are just and reasonable and not discriminatory. The rates we charge for transportation services are deemed just and reasonable under Texas law unless challenged in a customer or TRRC complaint. We cannot predict whether such a complaint will be filed against us or whether the TRRC will change its regulation of these rates. Failure to comply with the Texas Utilities Code can result in the imposition of administrative, civil and criminal remedies.
Our NGL pipelines and operations may also be or becomeare subject to state public utility or related jurisdictionstatutes and regulations which could impose additional environmental, safety and operational regulationsrequirements relating to the design, siting, installation, testing, construction, operation, replacement and management of NGL gathering facilities.transportation systems. In some jurisdictions, state public utility commission oversight may include the possibility of fines, penalties and delays in construction related to these regulations. In addition, the rates, terms and conditions of service for shipments of NGLs on our pipelines are subject to regulation by the FERC under the Interstate Commerce Act (“ICA”
("ICA") and the Energy Policy Act of 1992 (the “EPAct"EPAct of 1992”1992") if the NGLs are transported in interstate or foreign commerce whether by our pipelines or other means of transportation. Since we do not control the entire transportation path of all NGLs shipped on our pipelines, FERC regulation could be triggered by our customers’customers' transportation decisions.
Regulation of Sales of Natural Gas and NGLs.The price at which we buy and sell natural gas currently is not subject to federal regulation and, for the most part, is not subject to state regulation. The price at which we sell NGLs is not subject to federal or state regulation.
To the extent that we enter into transportation contracts with natural gas pipelines that are subject to FERC regulation, we are subject to FERC requirements related to the use of such capacity. Any failure on our part to comply with the FERC’s regulations and policies, or with an interstate pipeline’s tariff, could result in the imposition of civil and criminal penalties.
Our sales of natural gas are affected by the availability, terms and cost of pipeline transportation. As noted above, the price and terms of access to pipeline transportation are subject to extensive federal and state regulation. The FERC is continually proposing and implementing new rules and regulations affecting those segments of the natural gas industry. These initiatives also may affect the intrastate transportation of natural gas under certain circumstances. The stated purpose of many of these regulatory changes is to promote competition among the various sectors of the natural gas industry and these initiatives generally reflect more light-handed regulation. We cannot predict the ultimate impact of these regulatory changes to our natural gas marketing operations, and we note that some of the FERC’s regulatory changes may adversely affect the availability and reliability of interruptible transportation service on interstate pipelines. We do not believe that we will be affected by any such FERC action in a manner that is materially different from other natural gas marketers with whom we compete.
Regulation of Gathering Pipelines. Section 1(b) of the NGA exempts natural gas gathering facilities from the jurisdiction of the FERC under the NGA. We own a number of natural gas pipelines in Texas, Louisiana and West Virginia that we believe meet the traditional tests the FERC uses to establish a pipeline’s status as a gathering pipeline not subject to FERC jurisdiction. However, the distinction between FERC-regulated transmission services and federally unregulated gathering services has been the subject of substantial litigation and varying interpretations, so the classification and regulation of our gathering facilities could be subject to change based on future determinations by the FERC, the courts and Congress. State regulation of gathering facilities generally includes various safety, environmental and, in some circumstances, nondiscriminatory take requirements and complaint-based rate regulation.
In Texas, our gathering facilities are subject to regulation by the TRRC under the Texas Utilities Code in the same manner as described above for our intrastate pipeline facilities. Louisiana’s Pipeline Operations Section of the Department of Natural Resources’ Office of Conservation is generally responsible for regulating intrastate pipelines and gathering facilities in Louisiana and has authority to review and authorize natural gas transportation transactions and the construction, acquisition, abandonment and interconnection of physical facilities.
Historically, apart from pipeline safety, Louisiana has not acted to exercise this jurisdiction respecting gathering facilities. In Louisiana, our Chalkley System is regulated as an intrastate transporter, and the Louisiana Office of Conservation has determined that our Whiskey Bay System is a gathering system.
We are subject to state ratable take and common purchaser statutes in all of the states in which we operate. The ratable take statutes generally require gatherers to take, without undue discrimination, natural gas production that may be tendered to the gatherer for handling. Similarly, common purchaser statutes generally require gatherers to purchase without undue discrimination as to source of supply or producer. These statutes are designed to prohibit discrimination in favor of one producer over another producer or one source of supply over another source of supply. These statutes have the effect of restricting the right of an owner of gathering facilities to decide with whom it contracts to purchase or transport natural gas.
Natural gas gathering may receive greater regulatory scrutiny at both the state and federal levels. For example, the TRRC has approved changes to its regulations governing transportation and gathering services performed by intrastate pipelines and gatherers, which prohibit such entities from unduly discriminating in favor of their affiliates. Many of the producing states have adopted some form of complaint-based regulation that generally allows natural gas producers and shippers to file complaints with state regulators in an effort to resolve grievances relating to natural gas gathering access and rate discrimination allegations. Our gathering operations could be adversely affected should they be subject in the future to the application of additional or different state or federal regulation of rates and services. Our gathering operations also may be or become subject to safety and operational regulations relating to the design, installation, testing, construction, operation, replacement and management of gathering facilities. Additional rules and legislation pertaining to these matters are considered or adopted from time to time. We cannot predict what effect, if any,
such changes might have on our operations, but the industry could be required to incur additional capital expenditures and increased costs depending on future legislative and regulatory changes.
Regulation of Interstate Crude Oil, NGL and Products Pipelines. Interstate common carrier pipeline operations are subject to rate regulation by the FERC under the ICA, the EPAct of 1992, and related rules and orders. The ICA requires that tariff rates for petroleum pipelines be “just and reasonable” and not unduly discriminatory and that such rates and terms and conditions of service be filed with the FERC. This statute also permits interested persons to challenge proposed new or changed rates. The FERC is authorized to suspend the effectiveness of such rates for up to seven months, though rates are typically not suspended for the maximum allowable period. If the FERC finds that the new or changed rate is unlawful, it may require the carrier to pay refunds for the period that the rate was in effect. The FERC also may investigate, upon complaint or on its own motion, rates that are already in effect and may order a carrier to change its rates prospectively. Upon an appropriate showing, a shipper may obtain reparations for damages sustained for a period of up to two years prior to the filing of a complaint.
The FERC generally has not investigated interstate rates on its own initiative when those rates, like those we charge, have not been the subject of a protest or a complaint by a shipper. However, the FERC could investigate our rates at the urging of a third party if the third party is either a current shipper or has a substantial economic interest in the tariff rate level. Although no assurance can be given that the tariff rates charged by us ultimately will be upheld if challenged, management believes that the tariff rates now in effect for our pipelines are within the maximum rates allowed under current FERC policies and precedents.
For many locations served by our product and crude pipelines, we are able to establish negotiated rates. Otherwise, we are permitted to charge cost-based rates, or in many cases, grandfathered rates based on historical charges or settlements with our customers. To the extent we rely on cost-of-service ratemaking to establish or support our rates, the issue of the proper allowance for federal and state income taxes could arise. In 2005, the FERC issued a policy statement stating that it would permit common carriers, among others, to include an income tax allowance in cost-of-service rates to reflect actual or potential tax liability attributable to a regulated entity’s operating income, regardless of the form of ownership. Under the FERC’s policy, a tax pass-through entity seeking such an income tax allowance must establish that its partners or members have an actual or potential income tax liability on the regulated entity’s income. Whether a pipeline’s owners have such actual or potential income tax liability is subject to review by the FERC on a case-by-case basis. Although this policy is generally favorable for common carriers that are organized as pass-through entities, it still entails rate risk due to the FERC’s case-by-case review approach. The application of this policy, as well as any decision by the FERC regarding our cost of service, may also be subject to review in the courts. In July 2016, the United States Court of Appeals for the District of Columbia Circuit issued an opinion in United Airlines, Inc., et al. v. FERC, finding that the FERC had acted arbitrarily and capriciously when it failed to demonstrate that permitting an interstate petroleum products pipeline organized as a master limited partnership, or MLP, to include an income tax allowance in the cost of service underlying its rates, in addition to the discounted cash flow return on equity, would not result in the pipeline partnership owners double recovering their income taxes. The court vacated the FERC’s order and remanded to the FERC to consider mechanisms for demonstrating that there is no double recovery as a result of the income tax allowance. In December 2016, the FERC issued a Notice of Inquiry Regarding the Commission’s Policy for Recovery of Income Tax Costs. The FERC requested comments regarding how to address any double recovery resulting from the Commission’s current income tax allowance and rate of return policies. The comment period with respect to the notice of inquiry ended in April 2017.
In March 2018, the FERC issued a Revised Policy Statement on April 7, 2017.Treatment of Income Taxes in which the FERC found that an impermissible double recovery results from granting an MLP pipeline both an income tax allowance and a return on equity pursuant to the FERC’s discounted cash flow methodology. The outcomeFERC revised its previous policy, stating that it would no longer permit an MLP pipeline to recover an income tax allowance in its cost of service. The FERC stated it will address the application of the inquiryUnited Airlines decision to non-MLP partnership forms as those issues arise in subsequent proceedings. Further, the FERC stated that it will incorporate the effects of the post-United Airlines policy changes and the Tax Cuts and Jobs Act of 2017 on industry-wide crude oil pipeline costs in the 2020 five-year review of the crude oil pipeline index level. The FERC will also apply the revised Policy Statement and the Tax Cuts and Jobs Act of 2017 to initial crude oil pipeline cost-of-service rates and cost-of-service rate changes on a going-forward basis under the FERC’s existing ratemaking policies, including cost-of-service rate proceedings resulting from shipper-initiated complaints. In July 2018, the FERC dismissed requests for rehearing and clarification of the March 2018 Revised Policy Statement, but provided further guidance, clarifying that a pass-through entity will not be precluded in a future proceeding from arguing and providing evidentiary support that it is still pending.entitled to an income tax allowance and demonstrating that its recovery of an income tax allowance does not result in a double recovery of investors’ income tax costs.
Effective January 2018, the 2017 Tax Cuts and Jobs Act changed several provisions of the federal tax code, including a reduction in the maximum corporate tax rate. With the lower tax rate, and as discussed immediately above, the maximum tariff rates allowed by the FERC under its rate base methodology for master limited partnerships may be impacted by a lower income tax allowance component. Many of our interstate pipelines, such as Tiger, MEP and FEP, have negotiated market rates that were agreed to by customers in connection with long-term contracts entered into to support the construction of the pipelines. Other systems, such as FGT, Transwestern and PEPL, have a mix of tariff rate, discount rate, and negotiated rate agreements. In addition, several of these pipelines are covered by approved settlements, where rate filings will be made in the future. As such, the timing and impact of these systems of any tax change is unknown at this time.
In March 2019, following the decision of the D.C. Circuit in Emera Maine v. Federal Energy Regulatory Commission, FERC issued a Notice of Inquiry regarding its policy for determining return on equity (“ROE”). FERC specifically sought information and stakeholder views to help FERC explore whether, and if so how, it should modify its policies concerning the determination of ROE to be used in designing jurisdictional rates charged by public utilities. FERC also expressly sought comment on whether any changes to its policies concerning public utility ROEs should be applied to interstate natural gas and oil pipelines. Initial comments were due in June 2019, and reply comments were due in July 2019. FERC has not taken any further action with respect to the Notice of Inquiry as of this time, and therefore we cannot predict what effect, if any, such development could have on our cost-of-service rates in the future.
The EPAct of 1992 required the FERC to establish a simplified and generally applicable methodology to adjust tariff rates for inflation for interstate petroleum pipelines. As a result, the FERC adopted an indexing rate methodology which, as currently in effect, allows common carriers to change their rates within prescribed ceiling levels that are tied to changes in the Producer Price Index for Finished Goods, or PPIFG. The FERC’s indexing methodology is subject to review every five years. During the five-year period commencing July 1, 2011 and ending June 30, 2016, common carriers charging indexed rates are permitted to adjust their indexed ceilings annually by PPIFG plus 2.65%. Beginning July 1, 2016, the indexing method provided for annual changes equal to the change in PPIFG plus 1.23%. The indexing methodology is applicable to existing rates, including grandfathered rates, with the exclusion of market-based rates. A pipeline is not required to raise its rates up to the index ceiling, but it is permitted to do so and rate increases made under the index are presumed to be just and reasonable unless a protesting party can demonstrate that the portion of the rate increase resulting from application of the index is substantially in excess of the pipeline’s increase in costs. Under the indexing rate methodology, in any year in which the index is negative, pipelines must file to lower their rates if those rates would otherwise be above the rate ceiling. In October 2016, the FERC issued an Advance Notice of Proposed Rulemaking seeking comment on a number of proposals, including: (1) whether the Commission should deny any increase in a rate ceiling or annual index-based rate increase if a pipeline’s revenues exceed total costs by 15% for the prior two years; (2) a new percentage comparison test that would deny a proposed increase to a pipeline’s rate or ceiling level greater than 5% above the barrel-mile cost changes; and (3) a requirement that all pipelines file indexed ceiling levels annually, with the ceiling levels subject to challenge
and restricting the pipeline’s ability to carry forward the full indexed increase to a future period. The comment period with respect to the proposed rules ended onin March 17, 2017. The FERC has taken no further action on the proposed rule to date.
Finally, in November 2017, the FERC responded to a petition for declaratory order and issued an order that may have significant impacts on the way a marketer of crude oil or petroleum products that is affiliated with an interstate pipeline can price its services if those services include transportation on an affiliate’s interstate pipeline. In particular, the FERC’s November 2017 order prohibits buy/sell arrangements by a marketing affiliate if: (i) the transportation differential applicable to its affiliate’s interstate pipeline transportation service is at a discount to the affiliated pipeline’s filed rate for that service; and (ii) the pipeline affiliate subsidizes the loss. Several parties have requested that the FERC clarify its November 2017 order or, in the alternative, grant rehearing of the November 2017 order. The FERC extended the time frame to respond to such requests in January 2018, but has not yet taken final action. We are unable to predict how the FERC will respond to such requests. Depending on how the FERC responds, it could have an impact on the rates we are permitted to charge.
Regulation of Intrastate Crude Oil, NGL and Products Pipelines. Some of our crude oil, NGL and products pipelines are subject to regulation by the TRRC, the PA PUC,Pennsylvania Public Utility Commission and the Oklahoma Corporation Commission. The operations of our joint venture interests are also subject to regulation in the states in which they operate. The applicable state statutes require that pipeline rates be nondiscriminatory and provide no more than a fair return on the aggregate value of the pipeline property used to render services. State commissions generally have not initiated an investigation of rates or practices of petroleum pipelines in the absence of shipper complaints. Complaints to state agencies have been infrequent and are usually resolved informally. Although management cannot be certain that our intrastate rates ultimately would be upheld if challenged, we believe that, given this history, the tariffs now in effect are not likely to be challenged or, if challenged, are not likely to be ordered to be reduced.
In addition, as noted above, the rates, terms and conditions for shipments of crude oil, NGLs or products on our pipelines could be subject to regulation by the FERC under the ICA and the EPAct of 1992 if the crude oil, NGLs or products are transported in interstate or foreign commerce whether by our pipelines or other means of transportation. Since we do not control the entire transportation path of all crude oil, NGLs or products shipped on our pipelines, FERC regulation could be triggered by our customers’ transportation decisions.
Regulation of Pipeline Safety.Our pipeline operations are subject to regulation by the DOT, through the PHMSA, pursuant to the Natural Gas Pipeline Safety Act of 1968, as amended (“NGPSA”), with respect to natural gas and the Hazardous Liquids Pipeline Safety Act of 1979, as amended (“HLPSA”), with respect to crude oil, NGLs and condensates. The NGPSA and HLPSA, as amended, govern the design, installation, testing, construction, operation, replacement and management of natural gas as well as crude oil, NGL and condensate pipeline facilities. Pursuant to these acts, PHMSA has promulgated regulations governing pipeline wall thickness, design pressures, maximum operating pressures, pipeline patrols and leak surveys, minimum depth requirements,
and emergency procedures, as well as other matters intended to ensure adequate protection for the public and to prevent accidents and failures. Additionally, PHMSA has established a series of rules requiring pipeline operators to develop and implement integrity management programs for certain gas and hazardous liquid pipelines that, in the event of a pipeline leak or rupture, could affect high consequence areas (“HCAs”), which are areas where a release could have the most significant adverse consequences, including high population areas, certain drinking water sources and unusually sensitive ecological areas. Failure to comply with the pipeline safety laws and regulations may result in the assessment of sanctions, including administrative, civil or criminal penalties, the imposition of investigatory, remedial or corrective action obligations, the occurrence of delays in permitting or the performance of projects, or the issuance of injunctions limiting or prohibiting some or all of our operations in the affected area.
The HLPSA and NGPSA have been amended by the Pipeline Safety, Regulatory Certainty, and Job Creation Act of 2011 (“2011 Pipeline Safety Act”) and the Protecting Our Infrastructure of Pipelines and Enhancing Safety Act of 2016 (“2016 Pipeline Safety Act”). The 2011 Pipeline Safety Act increased the penalties for safety violations, established additional safety requirements for newly constructed pipelines and required studies of safety issues that could result in the adoption of new regulatory requirements by PHMSA for existing pipelines. The 2011 Pipeline Safety Act doubled the maximum administrative fines for safety violations from $100,000 to $200,000 for a single violation and from $1 million to $2 million for a related series of violations, but provided that these maximum penalty caps do not apply to certain civil enforcement actions. Effective April 27, 2017, to account for inflation,In July 2019, PHMSA issued a final rule increasing those maximum civil penalties were increased to $209,002$218,647 per day, with a maximum of $2,090,022$2,186,465 for a series of violations. The 2016 Pipeline Safety Act extended PHMSA’s statutory mandate through 2019 and, among other things, requiringrequire PHMSA to complete certain of its outstanding mandates under the 2011 Pipeline Safety Act and developingdevelop new safety standards for natural gas storage facilities, which was issued by June 22, 2018.PHMSA in January 2020. The 2016 Pipeline Safety Act also empowers PHMSA to address imminent hazards by imposing emergency restrictions, prohibitions and safety measures on owners and operators of hazardous liquid or natural gas pipeline facilities without prior notice or an opportunity for a hearing. PHMSA issued interim regulations in October 2016 to implement the agency’s expanded authority to address unsafe pipeline conditions or practices that pose an imminent hazard to life, property, or the environment.
In addition, states have adopted regulations, similar to existing PHMSA regulations, for intrastate gathering and transmission lines. The states in which we conduct operations typically have developed regulatory programs that parallel the federal regulatory scheme and are applicable to intrastate pipelines. Under such state regulatory programs, states have the authority to conduct pipeline inspections, to investigate accidents and to oversee compliance and enforcement, safety programs and record maintenance and reporting. Congress, PHMSA and individual states may pass or implement additional safety requirements that could result in increased compliance costs for us and other companies in our industry. For example, federal construction, maintenance and inspection standards under the NGPSA that apply to pipelines in relatively populated areas may not apply to gathering lines running through rural regions. This “rural gathering exemption” under the NGPSA presently exempts substantial portions of our gathering facilities located outside of cities, towns or any area designated as residential or commercial from jurisdiction under the NGPSA, but does not apply to our intrastate natural gas pipelines. In recent years, the PHMSA has considered changes to this rural gathering exemption, including publishing an advance notice of proposed rulemaking relating to gas pipelines in 2011, in which the agency sought public comment on possible changes to the definition of “high consequence areas” and “gathering lines” and the strengthening of pipeline integrity management requirements. In April 2016, pursuant to one of the requirements of the 2011 Pipeline Safety Act, PHMSA published a proposed rulemaking that, among other things, would expand certain of PHMSA’s current regulatory safety programs for natural gas pipelines in newly defined “moderate consequence areas” that contain as few as 5 dwellings within a potential impact area; require natural gas pipelines installed before 1970 and thus excluded from certain pressure testing obligations to be tested to determine their maximum allowable operating pressures (“MAOP”); and require certain onshore and offshore gathering lines in Class I areas to comply with damage prevention, corrosion control, public education, MAOP limits, line markers and emergency planning standards. Additional requirements proposed by this proposed rulemaking would increase PHMSA’s integrity management requirements for natural gas pipelines and also require consideration of seismicity in evaluating threats to pipelines. In October 2019, PHMSA has not yet finalizedsubmitted three major rules to the March 2016 proposed rulemaking.Federal Register, including rules focused on: the safety of gas transmission pipelines (the first of three parts of the Mega Rule), the safety of hazardous liquid pipelines, and enhanced emergency order procedures. The gas transmission rule requires operators of gas transmission pipelines constructed before 1970 to determine the material strength of their lines by reconfirming MAOP. In addition, the rule updates reporting and records retention standards for gas transmission pipelines. This rule will take effect on July 1, 2020. PHMSA is then expected to issue the second part of the Mega Rule focusing on repair criteria in HCAs and creating new repair criteria for non-HCAs, requirements for inspecting pipelines following extreme events, updates to pipeline corrosion control requirements, and various other integrity management requirements. PHMSA is expected to subsequently issue the final part of the gas Mega Rule, the Gas Gathering Rule, focusing on requirements relating to gas gathering lines.
In January 2017, PHMSA issued a final rule amending federal safety standards for hazardous liquid pipelines. The final rule is the latest step in a lengthy rulemaking process that began in 2010 with a request for comments and continued with publication of a rulemaking proposal in October 2015. The general effective date of this final rule is six months from publication in the Federal Register, but it is currently subject to further administrative review in connection with the transition of Presidential administrations
and thus, implementation of this final rule remains uncertain. The final rule addresses several areas including reporting requirements for gravity and unregulated gathering lines, inspections after weather or climatic events, leak detection system requirements, revisions to repair criteria and other integrity management revisions. In addition, PHMSA issued regulations on January 23, 2017, on operator qualification, cost recovery, accident and incident notification and other pipeline safety changes that are now effective. These regulations are also subject, however, to potential further review in connection with the transition of Presidential administrations. The safety and hazardous liquid pipelines rule discussed above, submitted to the Federal Register by PHMSA in October 2019, extended leak detection requirements to all non-gathering hazardous liquid pipelines and requires operators to inspect affected pipelines following extreme weather events or natural disasters to address any resulting damage. This rule will also take effect on July 1, 2020. In addition, the enhanced emergency procedures rule also mentioned above focuses on increased emergency safety measures. In particular, this rule increases the authority of PHMSA to issue an emergency order that addresses unsafe conditions or hazards that pose an imminent threat to pipeline safety. Unlike the other two rules submitted in October 2019, this rule took effect on December 2, 2019. Historically, our pipeline safety costs have not had a material adverse effect on our business or results of operations but there is no assurance that such costs will not be material in the future, whether due to elimination of the rural gathering exemption or otherwise due to changes in pipeline safety laws and regulations.
In another example of how future legal requirements could result in increased compliance costs, notwithstanding the applicability of the federal OSHA’s Process Safety Management (“PSM”) regulations and the EPA’s Risk Management Planning (“RMP”) requirements at regulated facilities, PHMSA and one or more state regulators, including the Texas Railroad Commission,TRRC, have in recent years, expanded the scope of their regulatory inspections to include certain in-plant equipment and pipelines found within NGL fractionation facilities and associated storage facilities, in order to assess compliance of such equipment and pipelines with hazardous liquid pipeline safety requirements. To the extent that these actions are pursued by PHMSA, midstream operators of NGL fractionation facilities and associated storage facilities subject to such inspection may be required to make operational changes or modifications at their facilities to meet standards beyond current PSM and RMP requirements, which changes or modifications may result in additional capital costs, possible operational delays and increased costs of operation that, in some instances, may be significant.
Environmental Matters
General. Our operation of processing plants, pipelines and associated facilities, including compression, in connection with the gathering, processing, storage and transmission of natural gas and the storage and transportation of NGLs, crude oil and refined products is subject to stringent federal, tribal, state and local laws and regulations, including those governing, among other things, air emissions, wastewater discharges, the use, management and disposal of hazardous and nonhazardous materials and wastes, and the cleanup of contamination. Noncompliance with such laws and regulations, or incidents resulting in environmental releases, could cause us to incur substantial costs, penalties, fines and criminal sanctions, third-party claims for personal injury or property damage, capital expenditures to retrofit or upgrade our facilities and programs, or curtailment or cancellation of permits on operations. As with the industry generally, compliance with existing and anticipated environmental laws and regulations increases our overall cost of doing business, including our cost of planning, permitting, constructing and operating our plants, pipelines and other facilities. As a result of these laws and regulations, our construction and operation costs include capital, operating and maintenance cost items necessary to maintain or upgrade our equipment and facilities.
We have implemented procedures designed to ensure that governmental environmental approvals for both existing operations and those under construction are updated as circumstances require. Historically, our environmental compliance costs have not had a material adverse effect on our business, results of operations or financial condition; however, there can be no assurance that such costs will not be material in the future. For example, we cannot be certain, however, that identification of presently unidentified conditions, more rigorous enforcement by regulatory agencies, enactment of more stringent environmental laws and regulations or unanticipated events will not arise in the future and give rise to environmental liabilities that could have a material adverse effect on our business, financial condition or results of operations.
Hazardous Substances and Waste Materials. To a large extent, the environmental laws and regulations affecting our operations relate to the release of hazardous substances and waste materials into soils, groundwater and surface water and include measures to prevent, minimize or remediate contamination of the environment. These laws and regulations generally regulate the generation, storage, treatment, transportation and disposal of hazardous substances and waste materials and may require investigatory and remedial actions at sites where such material has been released or disposed. For example, the Comprehensive Environmental Response, Compensation and Liability Act, as amended, (“CERCLA”), also known as the “Superfund” law, and comparable state laws, impose liability without regard to fault or the legality of the original conduct on certain classes of persons that contributed to a release of a “hazardous substance” into the environment. These persons include the owner and operator of the site where a release occurred and companies that disposed or arranged for the disposal of the hazardous substance that has been released into the environment. Under CERCLA, these persons may be subject to strict, joint and several liability, without regard to fault, for, among other things, the costs of investigating and remediating the hazardous substances that have been released into the environment, for damages to natural resources and for the costs of certain health studies. CERCLA and comparable state law also authorize the federal EPA, its state counterparts, and, in some instances, third parties to take actions in response to threats to the
public health or the environment and to seek to recover from the responsible classes of persons the costs they incur. It is not uncommon for neighboring landowners and other third parties to file claims for personal injury and property damage allegedly caused by hazardous substances or other pollutants released into the environment. Although “petroleum” as well as natural gas and NGLs are excluded from CERCLA’s definition of a “hazardous substance,” in the course of our ordinary operations we generate wastes that may fall within that definition or that may be subject to other waste disposal laws and regulations. We may be responsible under CERCLA or state laws for all or part of the costs required to clean up sites at which such substances or wastes have been disposed.
We also generate both hazardous and nonhazardous wastes that are subject to requirements of the federal Resource Conservation and Recovery Act, as amended, (“RCRA”) and comparable state statutes. We are not currently required to comply with a substantial portion of the RCRA hazardous waste requirements at many of our facilities because the minimal quantities of hazardous wastes generated there make us subject to less stringent non-hazardous management standards. From time to time, the EPA has considered or third parties have petitioned the agency on the adoption of stricter handling, storage and disposal standards for nonhazardous wastes, including certain wastes associated with the exploration, development and production of crude oil and natural gas. For example, following the filing of a lawsuit by several non-governmental environmental groups against the EPA for the agency’s failure to timely assess its RCRA Subtitle D criteria regulations for oil and gas wastes, the EPA and the environmental groups entered into an agreement that was finalized in a consent decree issued by the United States District Court for the District of Columbia on December 28, 2016. Under the decree, the EPA iswas required to propose no later than March 15, 2019, a rulemaking for revision of certain Subtitle D criteria regulations pertaining to oil and gas wastes or sign a determination that revision of the regulations is not necessary. If EPA proposes a rulemaking for revised oil and gas waste regulations,In response to the Consent Decree requires thatdecree, in April 2019, the EPA take final action following notice and comment rulemaking no later than July 15, 2021.signed a determination that revision of the regulations is not necessary at this time. It is possible that some wastes generated by us that are currently classified as nonhazardous may in the future be designated as “hazardous wastes,” resulting in the wastes being subject to more rigorous and costly disposal requirements, or that the full complement of RCRA standards could be applied to facilities that generate lesser amounts of hazardous waste. Changes such as these examples in applicable regulations may result in a material increase in our capital expenditures or plant operating and maintenance expense and, in the case of our oil and natural gas exploration and production customers, could result in increased operating costs for those customers and a corresponding decrease in demand for our processing, transportation and storage services.
We currently own or lease sites that have been used over the years by prior owners and lessees and by us for various activities related to gathering, processing, storage and transmission of natural gas, NGLs, crude oil and refined products. Waste disposal practices within the oil and gas industry have improved over the years with the passage and implementation of various environmental laws and regulations. Nevertheless, some hydrocarbons and wastes have been disposed of or otherwise released on or under various sites during the operating history of those facilities that are now owned or leased by us. Notwithstanding the possibility that these releases may have occurred during the ownership or operation of these assets by others, these sites may be subject to CERCLA, RCRA and comparable state laws. Under these laws, we could be required to remove or remediate previously disposed wastes (including wastes disposed of or released by prior owners or operators) or contamination (including soil and groundwater contamination) or to prevent the migration of contamination.
As of December 31, 20172019 and 20162018, accruals of $350$317 million and $309$337 million, respectively, were recorded in our consolidated balance sheets as accrued and other current liabilities and other non-current liabilities to cover estimated material environmental liabilities including, for example, certain matters assumed in connection with our acquisition of the HPL System, our acquisition of Transwestern, potential environmental liabilities for three sites that were formerly owned by Titan Energy Partners, L.P. or its predecessors, and the predecessor owner’s share of certain environmental liabilities of ETC OLP.
The Partnership is subject to extensive and frequently changing federal, tribal, state and local laws and regulations, including those relating to the discharge of materials into the environment or that otherwise relate to the protection of the environment, waste management and the characteristics and composition of fuels. These laws and regulations require environmental assessment and remediation efforts at many of Sunoco, Inc.’sETC Sunoco’s facilities and at formerly owned or third-party sites. Accruals for these environmental remediation activities amounted to $284$252 million and $289$263 million at December 31, 20172019 and 2016,2018, respectively, which is included in the total accruals above. These legacy sites that are subject to environmental assessments include formerly owned terminals and other logistics assets, retail sites that are no longer operated by ETC Sunoco, Inc., closed and/or sold refineries and other formerly owned sites. In December 2013, a wholly-owned captive insurance company was established for these legacy sites that are no longer operating. The premiums paid to the captive insurance company include estimates for environmental claims that have been incurred but not reported, based on an actuarially determined fully developed claims expense estimate. In such cases, we accrue losses attributable to unasserted claims based on the discounted estimates that are used to develop the premiums paid to the captive insurance company. As of December 31, 20172019, the captive insurance company held $207$205 million of cash and investments.
The Partnership’s accrual for environmental remediation activities reflects anticipated work at identified sites where an assessment has indicated that cleanup costs are probable and reasonably estimable. The accrual for known claims is undiscounted and is based on currently available information, estimated timing of remedial actions and related inflation assumptions, existing technology
and presently enacted laws and regulations. It is often extremely difficult to develop reasonable estimates of future site remediation costs due to changing regulations, changing technologies and their associated costs, and changes in the economic environment. Engineering studies, historical experience and other factors are used to identify and evaluate remediation alternatives and their related costs in determining the estimated accruals for environmental remediation activities.
Under various environmental laws, including the RCRA, the Partnership has initiated corrective remedial action at certain of its facilities, formerly owned facilities and at certain third-party sites. At the Partnership’s major manufacturing facilities, we have typically assumed continued industrial use and a containment/remediation strategy focused on eliminating unacceptable risks to human health or the environment. The remediation accruals for these sites reflect that strategy. Accruals include amounts designed to prevent or mitigate off-site migration and to contain the impact on the facility property, as well as to address known, discrete areas requiring remediation within the plants. Remedial activities include, for example, closure of RCRA waste management units, recovery of hydrocarbons, handling of impacted soil, mitigation of surface water impacts and prevention or mitigation of off-site migration. A change in this approach as a result of changing the intended use of a property or a sale to a third party could result in a comparatively higher cost remediation strategy in the future.
In general, a remediation site or issue is typically evaluated on an individual basis based upon information available for the site or issue and no pooling or statistical analysis is used to evaluate an aggregate risk for a group of similar items (for example, service station sites) in determining the amount of probable loss accrual to be recorded. The estimates of environmental remediation costs also frequently involve evaluation of a range of estimates. In many cases, it is difficult to determine that one point in the range of loss estimates is more likely than any other. In these situations, existing accounting guidance allows us the minimum amount of the range to accrue. Accordingly, the low end of the range often represents the amount of loss which has been recorded.
In addition to the probable and estimable losses which have been recorded, management believes it is reasonably possible (that is, it is less than probable but greater than remote) that additional environmental remediation losses will be incurred. At December 31, 2017, the aggregate of such additional estimated maximum reasonably possible losses, which relate to numerous individual sites, totaled approximately $5 million, which amount is in excess of the $350 The Partnership’s consolidated balance sheet reflected $317 million in environmental accruals recorded onas of December 31, 2017. This estimate of reasonably possible losses comprises estimates for remediation activities at current logistics and retail assets, and in many cases, reflects the upper end of the loss ranges which are described above. Such estimates include potentially higher contractor costs for expected remediation activities, the potential need to use more costly or comprehensive remediation methods and longer operating and monitoring periods, among other things.2019.
In summary, total future costs for environmental remediation activities will depend upon, among other things, the identification of any additional sites, the determination of the extent of the contamination at each site, the timing and nature of required remedial actions, the nature of operations at each site, the technology available and needed to meet the various existing legal requirements, the nature and terms of cost-sharing arrangements with other potentially responsible parties, the availability of insurance coverage, the nature and extent of future environmental laws and regulations, inflation rates, terms of consent agreements or remediation permits with regulatory agencies and the determination of the Partnership’s liability at the sites, if any, in light of the number, participation level and financial viability of the other parties. The recognition of additional losses, if and when they were to occur,
would likely extend over many years, but management can provide no assurance that it would be over many years. If changes in environmental laws or regulations occur or the assumptions used to estimate losses at multiple sites are adjusted, such changes could materially and adversely impact multiple facilities, formerly owned facilities and third-party sites at the same time. As a result, from time to time, significant charges against income for environmental remediation may occur. And while management does not believe that any such charges would have a material adverse impact on the Partnership’s consolidated financial position, it can provide no assurance.
Transwestern conducts soil and groundwater remediation at a number of its facilities. Some of the cleanup activities include remediation of several compressor sites on the Transwestern system for contamination by PCBs, and the costs of this work are not eligible for recovery in rates. The total accrued future estimated cost of remediation activities expected to continue through 2025 is $5$4 million, which is included in the total environmental accruals mentioned above. Transwestern received FERC approval for rate recovery of projected soil and groundwater remediation costs not related to PCBs effective April 1, 2007. Transwestern, as part of ongoing arrangements with customers, continues to incur costs associated with containing and removing potential PCB contamination. Future costs cannot be reasonably estimated because remediation activities are undertaken as potential claims are made by customers and former customers. Such future costs are not expected to have a material impact on our financial position, results of operations or cash flows, but management can provide no assurance.
Air Emissions. Our operations are subject to the federal Clean Air Act, as amended, and comparable state laws and regulations. These laws and regulations regulate emissions of air pollutants from various industrial sources, including our processing plants, and also impose various monitoring and reporting requirements. Such laws and regulations may require that we obtain pre-approval for the construction or modification of certain projects or facilities, such as our processing plants and compression facilities, expected to produce air emissions or to result in the increase of existing air emissions, that we obtain and strictly comply with air permits containing various emissions and operational limitations, or that we utilize specific emission control technologies to limit emissions. We will incur capital expenditures in the future for air pollution control equipment in connection with obtaining and maintaining operating permits and approvals for air emissions. In addition, our processing plants, pipelines and compression facilities are subject to increasingly stringent regulations, including regulations that require the installation of control technology or the implementation of work practices to control hazardous air pollutants. Moreover, the Clean Air Act requires an operating permit for major sources of emissions and this requirement applies to some of our facilities. Historically, our costs for compliance with existing Clean Air Act and comparable state law requirements have not had a material adverse effect on our results of operations; however, there can be no assurance that such costs will not be material in the future. The EPA and state agencies are
often considering, proposing or finalizing new regulations that could impact our existing operations and the costs and timing of new infrastructure development. For example, in October 2015, the EPA published a final rule under the Clean Air Act, lowering the National Ambient Air Quality Standard (“NAAQS”) for ground-level ozone to 70 parts per billion for the 8-hour primary and secondary ozone standards. The EPA published a final rule in November 2017 that issued area designations with respect to ground-level ozone for approximately 85% of the United States counties as either “attainment/unclassifiable” or “unclassifiable”“unclassifiable.” In April 2018 and is expected to issue non-attainmentJuly 2018, the EPA issued area designations for the remainingall areas of the United States not addressed underin the November 2017 final rule inrule. States with moderate or high nonattainment areas must submit state implementation plans to the first half of 2018.EPA by October 2021. Reclassification of areas or imposition of more stringent standards may make it more difficult to construct new or modified sources of air pollution in newly designated non-attainment areas. Also, states are expected to implement more stringent requirements as a result of this new final rule, which could apply to our customers’ operations. Compliance with this or other new regulations could, among other things, require installation of new emission controls on some of our equipment, result in longer permitting timelines, and significantly increase our capital expenditures and operating costs, which could adversely impact our business.
Clean Water Act. The Federal Water Pollution Control Act of 1972, as amended, (“Clean Water Act”) and comparable state laws impose restrictions and strict controls regarding the discharge of pollutants, including hydrocarbon-bearing wastes, into state waters and waters of the United States. Pursuant to the Clean Water Act and similar state laws, a National Pollutant Discharge Elimination System, or state permit, or both, must be obtained to discharge pollutants into federal and state waters. In addition, the Clean Water Act and comparable state laws require that individual permits or coverage under general permits be obtained by subject facilities for discharges of storm water runoff. The Clean Water Act also prohibits the discharge of dredge and fill material in regulated waters, including wetlands, unless authorized by permit. In May 2015, the EPA issued a final rule that attempts to clarify the federal jurisdictional reach over waters of the United States but this rule has been stayed nationwide by the United States Sixth Circuit Court of Appeals as that appellate court and numerous district courts ponder lawsuits opposing implementation of the rule. In June 2015, the EPA and the United States Army Corps of Engineers (the “Corps”(“USACE”) published a final rule attempting to clarify the federal jurisdictional reach over waters of the United States, but legal challenges to this rule followed. The 2015 rule was stayed nationwide to determine whether federal district or appellate courts had jurisdiction to hear cases in the matter and, in January 2017, the United States Supreme Court agreed to hear the case. The EPA and CorpsUSACE proposed a rulemaking in June 2017 to repeal the June 2015 rule, announced their intent to issue a new rule defining the Clean Water Act’s jurisdiction, and published a proposed rule in November 2017 specifying that the contested May 2015 rule would not take effect until two years after the November 2017 proposed rule was finalized and published in the Federal Register. Recently, onIn January 22, 2018, the
United States Supreme Court issued a decision finding that jurisdiction resides with the federal district courts; consequently, while implementation of the 2015 rule currently remains stayed, the previously-filed district court cases will be allowed to proceed. Oncourts. Also in January 31, 2018, the EPA and CorpsUSACE finalized a rule that would delay applicability of the rule to two years from the rule’s publication in the Federal Register. The EPA and USACE formally proposed a rule revising the definition of “waters of the United States” in December 2018. The proposed definition would substantially reduce the scope of waters that fall within the Clean Water Act’s jurisdiction, in part by excluding ephemeral streams. The EPA and USACE had previously determined that ephemeral streams could potentially qualify as “waters of the United States,” which would not be possible under the proposed definition. In January 2020, a new “waters of the United States” rule was finalized to replace the June 2015 rule. Under the final rule, the following four categories of waters would be defined as “waters of the United States”: traditional navigable waters and territorial seas; perennial and intermittent tributaries to those waters; lakes, ponds and impoundments of jurisdictional waters; and wetlands adjacent to jurisdictional waters. Additional litigation and administrative proceedings are expected in the future. As a result of these recent developments, future implementation of the June 2015 rule or any replacement rule is uncertain at this time, but to the extent any rule expands the scope of the Clean Water Act’s jurisdiction, our operations as well as our exploration and production customers’ drilling programs could incur increased costs and delays with respect to obtaining permits for dredge and fill activities in wetland areas.
Spills. Our operations can result in the discharge of regulated substances, including NGLs, crude oil or other products. The Clean Water Act, as amended by the federal Oil Pollution Act of 1990, as amended, (“OPA”), and comparable state laws impose restrictions and strict controls regarding the discharge of regulated substances into state waters or waters of the United States. The Clean Water Act and comparable state laws can impose substantial administrative, civil and criminal penalties for non-compliance including spills and other non-authorized discharges. The OPA subjects owners of covered facilities to strict joint and potentially unlimited liability for removal costs and other consequences of a release of oil, where the release is into navigable waters, along shorelines or in the exclusive economic zone of the United States. Spill prevention control and countermeasure requirements of the Clean Water Act and some state laws require that containment dikes and similar structures be installed to help prevent the impact on navigable waters in the event of a release of oil. The PHMSA, the EPA, or various state regulatory agencies, has approved our oil spill emergency response plans that are to be used in the event of a spill incident.
In addition, some states maintain groundwater protection programs that require permits for discharges or operations that may impact groundwater conditions. Our management believes that compliance with existing permits and compliance with foreseeable new permit requirements will not have a material adverse effect on our results of operations, financial position or expected cash flows.
Endangered Species Act. The Endangered Species Act, as amended, restricts activities that may affect endangered or threatened species or their habitat. Similar protections are offered to migratory birds under the Migratory Bird Treaty Act. We may operate
in areas that are currently designated as a habitat for endangered or threatened species or where the discovery of previously unidentified endangered species, or the designation of additional species as endangered or threatened may occur in which event such one or more developments could cause us to incur additional costs, to develop habitat conservation plans, to become subject to expansion or operating restrictions, or bans in the affected areas. Moreover, such designation of previously unprotected species as threatened or endangered in areas where our oil and natural gas exploration and production customers operate could cause our customers to incur increased costs arising from species protection measures and could result in delays or limitations in our customers’ performance of operations, which could reduce demand for our services.
Climate Change. Climate change continues to attract considerable public, governmental and scientific attention. As a result, numerous proposals have been made and are likely to continue to be made at the international, national, regional and state levels of government to monitor and limit emissions of GHGs.greenhouse gases (“GHGs”). These efforts have included consideration of cap-and-trade programs, carbon taxes and GHG reporting and tracking programs, and regulations that directly limit GHG emissions from certain sources. At the federal level, no comprehensive climate change legislation has been implemented to date. The EPA has, however, adopted rules under authority of the Clean Air Act that, among other things, establish Potential for Significant Deterioration (“PSD”) construction and Title V operating permit reviews for GHG emissions from certain large stationary sources that are also potential major sources of certain principal, or criteria, pollutant emissions, which reviews could require securing PSD permits at covered facilities emitting GHGs and meeting “best available control technology” standards for those GHG emissions. In addition, the EPA has adopted rules requiring the monitoring and annual reporting of GHG emissions from certain petroleum and natural gas system sources in the United States, including, among others, onshore processing, transmission, storage and distribution facilities. In October 2015, the EPA amended and expanded the GHG reporting requirements to all segments of the oil and natural gas industry, including gathering and boosting facilities and blowdowns of natural gas transmission pipelines.
Federal agencies also have begun directly regulating emissions of methane, a GHG, from oil and natural gas operations. In June 2016, the EPA published New Source Performance Standards (“NSPS”), known as Subpart OOOOa, that require certain new, modified or reconstructed facilities in the oil and natural gas sector to reduce these methane gas and volatile organic compound (“VOC”) emissions. These Subpart OOOOa standards will expand previously issued NSPS published by the EPA in 2012 and known as Subpart OOOO, by using certain equipment-specific emissions control practices, requiring additional controls for pneumatic controllers and pumps as well as compressors, and imposing leak detection and repair requirements for natural gas compressor and booster stations. However, the Subpart OOOOa standards have been subject to attempts by the EPA to stay portions of those standards, and the agency proposed rulemaking in June 2017 to stay the requirements for a period of two years and revisit implementation of Subpart OOOOa in its entirety. TheIn September 2018, the EPA has not yet published a final ruleproposed amendments to Subpart OOOOa that would reduce the 2016 standards’ fugitive emissions monitoring requirements and as a result,expand exceptions to controlling methane emissions from pneumatic pumps, among other changes. Various industry and environmental groups have separately challenged both the Juneoriginal 2016 rule remains in effect but futurestandards and the EPA’s attempts to delay the implementation of the 2016rule. In August 2019, the EPA proposed two options for further rescinding the Subpart OOOOa standards. Under the EPA’s preferred alternative, the agency would rescind the methane limits for new, reconstructed and modified oil and natural gas production sources while leaving in place the general emission limits for volatile organic compounds, or VOCs, and relieve the EPA of its obligation to develop guidelines for methane emissions from existing sources. In addition, the proposal would remove from the oil and natural gas category the natural gas transmission and storage segment. The other proposed alternative would rescind the methane requirements of the Subpart OOOOa standards is uncertain at this time.applicable to all oil and natural gas sources, without removing any sources from that source category (and still requiring control of VOCs in general). This rule, should it remain in effect, and any other new methane emission standards imposed on the oil and gas sector could result in increased costs to our operations as well as result in delays or curtailment in such operations, which costs, delays or curtailment could adversely affect our business.
Additionally, in December 2015, the United States joined the international community at the 21st Conference of the Parties of the United Nations Framework Convention on Climate Change in Paris, France preparing an agreement requiring member countries to review and “represent a progression” in their intended nationally determined contributions, which set GHG emission reduction goals every five years beginning in 2020. This “Paris Agreement” was signed by the United States in April 2016 and entered into force in November 2016; however, this agreement does not create any binding obligations for nations to limit their GHG emissions, but rather includes pledges to voluntarily limit or reduce future emissions. In August 2017, the United States State Department informed the United Nations of the intent of the United States to withdraw from the Paris Agreement. The Paris Agreement provides for a four-year exitUnited States formally initiated the withdrawal process beginning when it took effect in November 2016,2019, which would result in an effective exit date of November 2020. The United States’ adherence to the exit process and/or the terms on which the United States may re-enter the Paris Agreement or a separately negotiated agreement are unclear at this time.
The adoption and implementation of any international, federal or state legislation or regulations that require reporting of GHGs or otherwise restrict emissions of GHGs could result in increased compliance costs or additional operating restrictions, and could have a material adverse effect on our business, financial condition, demand for our services, results of operations, and cash flows. Recently, activists concerned about the potential effects of climate change have directed their attention at sources of funding for fossil-fuel energy companies, which has resulted in certain financial institutions, funds and other sources of capital restricting or eliminating their investment in oil and natural gas activities. Ultimately, this could make it more difficult to secure funding for
exploration and production or midstream activities. Notwithstanding potential risks related to climate change, the International Energy Agency estimates that global energy demand will continue to rise and will not peak until after 2040 and that oil and natural gas will continue to represent a substantial percentage of global energy use over that time. Finally, some scientists have concluded that increasing concentrations of GHG in the atmosphere may produce climate changes that have significant physical effects, such as increased frequency and severity of storms, droughts, and floods and other climate events that could have an adverse effect on our assets.
Some have suggested that one consequence of climate change could be increased severity of extreme weather, such as increased hurricanes and floods. If such effects were to occur, our operations could be adversely affected in various ways, including damages to our facilities from powerful winds or rising waters, or increased costs for insurance. Another possible consequence of climate change is increased volatility in seasonal temperatures. The market for our NGLs and natural gas is generally improved by periods of colder weather and impaired by periods of warmer weather, so any changes in climate could affect the market for the fuels that we produce. Despite the use of the term “global warming” as a shorthand for climate change, some studies indicate that climate change could cause some areas to experience temperatures substantially colder than their historical averages. As a result, it is difficult to predict how the market for our products could be affected by increased temperature volatility, although if there is an overall trend of warmer temperatures, it would be expected to have an adverse effect on our business.
Employee Health and Safety. We are subject to the requirements of the federal OSHA and comparable state laws that regulate the protection of the health and safety of workers. In addition, the Occupational Safety and Health Administration’s hazard communication standard requires that information be maintained about hazardous materials used or produced in operations and that this information be provided to employees, state and local government authorities and citizens. Historically, our costs for OSHA required activities, including general industry standards, recordkeeping requirements, and monitoring of occupational exposure to regulated substances, have not had a material adverse effect on our results of operations but there is no assurance that such costs will not be material in the future.
Employees
As of December 31, 2017, we2019, ETO and its consolidated subsidiaries employed 8,494an aggregate of 12,517 persons, 1,2251,495 of which are represented by labor unions. We believe that our relations with our employees are satisfactory.
SEC Reporting
We file or furnish annual reports on Form 10-K, quarterly reports on Form 10-Q, current reports on Form 8-K and any related amendments and supplements thereto with the SEC. From time to time, we may also file registration and related statements pertaining to equity or debt offerings. You may read and copy any materials we file or furnish with the SEC at the SEC’s Public Reference Room at 100 F Street, N.E., Washington, D.C. 20549. You may obtain information regarding the Public Reference Room by calling the SEC at 1-800-732-0330. In addition, theThe SEC maintains an Internet website at http://www.sec.gov that contains reports, proxy and information statements and other information regarding issuers that file electronically with the SEC.
We provide electronic access, free of charge, to our periodic and current reports, and amendments to these reports, on our internet website located at http://www.energytransfer.com. These reports are available on our website as soon as reasonably practicable after we electronically file such materials with the SEC. Information contained on our website is not part of this report.
ITEM 1A. RISK FACTORS
In addition to risks and uncertainties in the ordinary course of business that are common to all businesses, important factors that are specific to our structure as a limited partnership, our industry and our company could materially impact our future performance and results of operations. We have provided below a list of these risk factors that should be reviewed when considering an investment in our securities. Panhandle files Annual Reports on Form 10-K that include risk factors that can be reviewed for further information. The risk factors set forth below, and those included in Panhandle’s Annual Report on Form 10-K, are not all the risks we face and other factors currently considered immaterial or unknown to us may impact our future operations.
Risks Inherent in an Investment in Us
Cash distributions are not guaranteed and may fluctuate with our performance and other external factors.
The amount of cash we can distribute to holders of our Common Units or other partnership securitiesUnitholders depends upon the amount of cash we generate from our operations.operations and from our subsidiaries, Sunoco LP and USAC. The amount of cash we generate from our operations will fluctuate from quarter to quarter and will depend upon, among other things:
the amount of natural gas, NGLs, crude oil and refined products transported in our pipelines and gathering systems;pipelines;
the level of throughput in our processing and treating operations;
the fees we charge and the margins we realize for our services;
the price of natural gas, NGLs, crude oil and refined products;
the relationship between natural gas, NGL and crude oil prices;
the amount of cash distributions we receive with respect to the Sunoco LP common units that our subsidiaries own;
the weather in our operating areas;
the level of competition from other midstream, transportation and storage and other energy providers;
the level of our operating costs;
prevailing economic conditions; and
the level and results of our derivative activities.
In addition, the actual amount of cash we and our subsidiaries, including Sunoco LP and USAC, will have available for distribution will also depend on other factors, such as:
the level of capital expenditures we make;
the level of costs related to litigation and regulatory compliance matters;
the cost of acquisitions, if any;
the levels of any margin calls that result from changes in commodity prices;
our debt service requirements;
fluctuations in our working capital needs;
our ability to borrow under our revolving credit facility;
our ability to access capital markets;
restrictions on distributions contained in our debt agreements; and
the amount of cash reserves established by our General Partner in its discretion for the proper conduct of our business.
Because of all these factors, we cannot guarantee that we will have sufficient available cash to pay a specific level of cash distributions to holders of our Unitholders.
Furthermore, our Unitholders should be aware that the amount of cash we have available for distribution depends primarily upon our cash flow and is not solely a function of profitability, which is affected by non-cash items. As a result, we may declare and/or pay cash distributions during periods when we record net losses.
We may sell additional limited partner interests or other classes of equity, diluting existing interests of Unitholders.
Our partnership agreement allows us to issue an unlimited number of additional limited partner interests, including securities senior to the Common Units, without the approval of our Unitholders. The issuance of additional Common Units or other equity securities will have the following effects:
the current proportionate ownership interest of our Unitholders in us will decrease;
the amount of cash available for distribution on each Common Unit or partnership security may decrease;
the ratio of taxable income to distributions may increase;
the relative voting strength of each previously outstanding Common Unit may be diminished; and
the market price of the Common Units or partnership securities may decline.
Sunoco LP and USAC may issue additional common units, which may increase the risk that Sunoco LP or USAC will not have sufficient available cash to maintain or increase its per unit distribution level.
The partnership agreements of Sunoco LP’sLP and USAC allow each partnership agreement allows the issuance ofto issue an unlimited number of additional limited partner interests. The issuance of additional common units or other equity securities by Sunoco LPeach respective partnership will have the following effects:
| |
| • | Unitholders’ current proportionate ownership interest in each partnership will decrease; |
| |
| • | the amount of cash available for distribution on each common unit or partnership security may decrease; |
| |
| • | the ratio of taxable income to distributions may increase; |
| |
| • | the relative voting strength of each previously outstanding common unit may be diminished; and |
| |
| • | the market price of each partnership’s common units may decline. |
Unitholders’ current proportionate ownership interest in Sunoco LP will decrease;
the amount of cash available for distribution on each common unit or partnership security may decrease;
the ratio of taxable income to distributions may increase;
the relative voting strength of each previously outstanding common unit may be diminished; and
the market price of Sunoco LP common units may decline.
The payment of distributions on any additional units issued by Sunoco LP and USAC may increase the risk that iteither partnership may not have sufficient cash available to maintain or increase its per unit distribution level, which in turn may impact the available cash that we have to meet our obligations.
Future sales
As of January 31, 2018, ETE owned 27.5 million ETP Common Units. If ETE were to sell and/or distribute its Common Units to the holders of its equity interests in the future, those holders may dispose of some or all of these units. The sale or disposition of a substantial portion of these units in the public markets could reduce the market price of our outstanding Common Units.
Unitholders may not have limited liability if a court finds that Unitholder actions constitute control of our business.
Under Delaware law, a Unitholder could be held liable for our obligations to the same extent as a general partner if a court determined that the right of Unitholders to remove our general partner or to take other action under our partnership agreement constituted participation in the “control” of our business.
Our general partner generally has unlimited liability for our obligations, such as our debts and environmental liabilities, except for those contractual obligations that are expressly made without recourse to our general partner. Our partnership agreement allows the general partner to incur obligations on our behalf that are expressly non-recourse to the general partner. The general partner has entered into such limited recourse obligations in most instances involving payment liability and intends to do so in the future.
In addition, Section 17-607 of the Delaware Revised Uniform Limited Partnership Act provides that under some circumstances, a Unitholder may be liable to us for the amount of a distribution for a period of three years from the date of the distribution.
Our debt level and debt agreements may limit our ability to make distributions to Unitholders and may limit our future financial and operating flexibility.flexibility.
As of December 31, 2017,2019, we had approximately $33.09$50.35 billion of consolidated debt, excluding the debt of our unconsolidated joint ventures. Our level of indebtedness affects our operations in several ways, including, among other things:
a significant portion of our and our subsidiaries’ cash flow from operations will be dedicated to the payment of principal and interest on outstanding debt and will not be available for other purposes, including payment of distributions;
covenants contained in our and our subsidiaries’ existing debt agreements require us and them, as applicable, to meet financial tests that may adversely affect our flexibility in planning for and reacting to changes in our business;
our and our subsidiaries’ ability to obtain additional financing for working capital, capital expenditures, acquisitions and general partnership, corporate or limited liability company purposes, as applicable, may be limited;
we may be at a competitive disadvantage relative to similar companies that have less debt;
we may be more vulnerable to adverse economic and industry conditions as a result of our significant debt level; and
failure by us or our subsidiaries to comply with the various restrictive covenants of our respective debt agreements could negatively impact our ability to incur additional debt, including our ability to utilize the available capacity under our revolving credit facility, and our ability to pay our distributions. | |
| • | a significant portion of our and our subsidiaries’ cash flow from operations will be dedicated to the payment of principal and interest on outstanding debt and will not be available for other purposes, including payment of distributions; |
| |
| • | covenants contained in our and our subsidiaries’ existing debt agreements require us and them, as applicable, to meet financial tests that may adversely affect our flexibility in planning for and reacting to changes in our business; |
| |
| • | our and our subsidiaries’ ability to obtain additional financing for working capital, capital expenditures, acquisitions and general partnership, corporate or limited liability company purposes, as applicable, may be limited; |
| |
| • | we may be at a competitive disadvantage relative to similar companies that have less debt; |
| |
| • | we may be more vulnerable to adverse economic and industry conditions as a result of our significant debt level; and |
| |
| • | failure by us or our subsidiaries to comply with the various restrictive covenants of our respective debt agreements could negatively impact our ability to incur additional debt, including our ability to utilize the available capacity under our revolving credit facility, and our ability to pay our distributions. |
Capital projects will require significant amounts of debt and equity financing, which may not be available to us on acceptable terms, or at all.
We plan to fund our growth capital expenditures, including any new pipeline construction projects and improvements or repairs to existing facilities that we may undertake, with proceeds from sales of our debt and equity securities and borrowings under our revolving credit facility; however, we cannot be certain that we will be able to issue our debt and equity securities on terms satisfactory to us, or at all. If we are unable to finance our expansion projects as expected, we could be required to seek alternative financing, the terms of which may not be attractive to us, or to revise or cancel our expansion plans.
A significant increase in our indebtedness that is proportionately greater than our issuance of equity could negatively impact our and our subsidiaries’ credit ratings or our ability to remain in compliance with the financial covenants under our revolving credit agreement, which could have a material adverse effect on our financial condition, results of operations and cash flows.
Increases in interest rates could materially adversely affect our business, results of operations, cash flows and financial condition.
In addition to our exposure to commodity prices, we have significant exposure to changes in interest rates. Approximately $5.11$7.38 billion of our consolidated debt as of December 31, 20172019 bears interest at variable interest rates and the remainder bears interest at fixed rates. To the extent that we have debt with floating interest rates, our results of operations, cash flows and financial condition could be materially adversely affected by increases in interest rates. We manage a portion of our interest rate exposures by utilizing interest rate swaps.
An
Changes in LIBOR reporting practices or the method in which LIBOR is determined may adversely affect the market value of our current or future debt obligations, including our revolving credit facility.
As of December 31, 2019, we had outstanding approximately $7.38 billion of debt that bears interest at variable interest rates that use the LIBOR as a benchmark rate. On July 27, 2017, the Financial Conduct Authority (the “FCA”), which regulates LIBOR, announced that it intends to stop persuading or compelling banks to submit LIBOR quotations after 2021. It is unclear whether LIBOR will cease to exist or if new methods of calculating LIBOR will be established such that it continues to exist after 2021, or whether any alternative benchmark rate will attain market acceptance as a replacement for LIBOR. It is not possible to predict the further effect of the rules of the FCA, any changes in the methods by which LIBOR is determined or any other reforms to LIBOR that may be enacted in the United Kingdom, the European Union or elsewhere. Any such developments may cause LIBOR to perform differently than in the past, or cease to exist. In addition, any other legal or regulatory changes made by the FCA, the European Commission or any other successor governance or oversight body, or future changes adopted by such body, in the method by which LIBOR is determined or the change from LIBOR to an alternative benchmark rate may result in, among other things, a sudden or prolonged increase or decrease in LIBOR, a delay in the publication of LIBOR, and changes in the rules or methodologies in LIBOR, which may discourage market participants from continuing to administer or to participate in LIBOR’s determination, and, in certain situations, could result in LIBOR no longer being determined and published.
If a published U.S. dollar LIBOR rate is unavailable after 2021, the interest rates on our debt which are indexed to LIBOR will be determined using an alternative method, which may result in interest obligations which are more than or do not otherwise correlate over time with the payments that would have been made on such debt if U.S. dollar LIBOR was available in its current form or will be determined using an alternative benchmark rate as negotiated with our counterparties. Further, the same costs and risks that may lead to the discontinuation or unavailability of U.S. dollar LIBOR may make one or more of the alternative methods impossible or impracticable to determine. Alternative benchmark rate(s) may replace LIBOR and could affect our debt securities, derivative instruments, receivables, debt payments and receipts. At this time, it is not possible to predict the effect of any establishment of any alternative benchmark rate(s) and we cannot predict what alternative benchmark rate(s) will be negotiated with our counterparties. Any new benchmark rate will likely not replicate LIBOR exactly, and any changes to benchmark rates may also causehave an uncertain impact on our cost of funds and our access to the capital markets. Any of these proposals or consequences could have a corresponding decline in demand for equity investments, in general, and in particular for yield-based equity investments such asmaterial adverse effect on our Common Units. Any such reduction in demand for our Common Units resulting from other more attractive investment opportunities may cause the trading price of our Common Units to decline.financing costs.
The credit and risk profile of our General Partner and its owners could adversely affect our credit ratings and profile.
The credit and business risk profiles of our General Partner, and of ETEET as the indirect owner of our General Partner, may be factors in credit evaluations of us as a publicly traded limited partnership due to the significant influence of our General Partner and ETEET over our business activities, including our cash distributions, acquisition strategy and business risk profile. Another factor that may be considered is the financial condition of our General Partner and its owners, including the degree of their financial leverage and their dependence on cash flow from the Partnership to service their indebtedness.
ETEET has significant indebtedness outstanding and is dependent principally on the cash distributions from its general and limited partner equity interests in us to service such indebtedness. Any distributions by us to ETEET will be made only after satisfying our then current obligations to our creditors. Although we have taken certain steps in our organizational structure, financial reporting and contractual relationships to reflect the separateness of us, ETP GP and ETP LLC from the entities that control ETP GP (ETE(ET and its general partner), our credit ratings and business risk profile could be adversely affected if the ratings and risk profiles of such entities were viewed as substantially lower or riskier than ours.
Unitholders have limited voting rights and are not entitled to elect the General Partner or its directors. In addition, even if Unitholders are dissatisfied, they cannot easily remove the General Partner.
Unlike the holders of common stock in a corporation, Unitholders have only limited voting rights on matters affecting our business, and therefore limited ability to influence management’s decisions regarding our business. Unitholders did not elect our General Partner and will have no right to elect our General Partner on an annual or other continuing basis. Although our General Partner has a contractually-limited fiduciary duty to our Unitholders, the directors of our General Partner and its general partner have a fiduciary duty to manage the General Partner and its general partner in a manner beneficial to the owners of those entities.
Furthermore, if the Unitholders are dissatisfied with the performance of our General Partner, they may be unable to remove our General Partner. The General Partner generally may not be removed except upon the vote of the holders of 66 2/3% of the outstanding units voting together as a single class, including units owned by the General Partner and its affiliates. As of December 31, 2017,
ETE and its affiliates held approximately 2.4% of our outstanding Common Units and our officers and directors held less than 1% of our outstanding Common Units.
Furthermore, Unitholders’ voting rights are further restricted by the partnership agreement provision providing that any units held by a person that owns 20% or more of any class of units then outstanding, other than the General Partner and its affiliates, cannot be voted on any matter.
Our General Partner may, in its sole discretion, approve the issuance of partnership securities and specify the terms of such partnership securities.
Pursuant to our partnership agreement, our General Partner has the ability, in its sole discretion and without the approval of the Unitholders, to approve the issuance of securities by the Partnership at any time and to specify the terms and conditions of such securities. The securities authorized to be issued may be issued in one or more classes or series, with such designations, preferences, rights, powers and duties (which may be senior to existing classes and series of partnership securities), as shall be determined by our General Partner, including:
the right to share in the Partnership’s profits and losses;
the right to share in the Partnership’s distributions;
the rights upon dissolution and liquidation of the Partnership;
whether, and the terms upon which, the Partnership may redeem the securities;
whether the securities will be issued, evidenced by certificates and assigned or transferred; and
the right, if any, of the security to vote on matters relating to the Partnership, including matters relating to the relative rights, preferences and privileges of such security.
Please see “We may sell additional limited partner interests, diluting existing interests of Unitholders.” above.
The control of our General Partner may be transferred to a third party without Unitholder consent.
The General Partner may transfer its general partner interest to a third party without the consent of the Unitholders. Furthermore, the general partner of our General Partner may transfer its general partner interest in our General Partner to a third party without the consent of the Unitholders. Any new owner of the General Partner or the general partner of the General Partner would be in a position to replace the officers of the General Partner with its own choices and to control the decisions taken by such officers.
Unitholders may be required to sell their units to the General Partner at an undesirable time or price.
If at any time less than 20% of the outstanding units of any class are held by persons other than the General Partner and its affiliates, the General Partner will have the right to acquire all, but not less than all, of those units at a price no less than their then-current market price. As a consequence, a Unitholder may be required to sell their Common Units at an undesirable time or price. The General Partner may assign this purchase right to any of its affiliates or to us.
The interruption of distributions to us from our operating subsidiaries and equity investees may affect our ability to satisfy our obligations and to make distributions to our partners.
We are a holding company with no business operations other than that of our operating subsidiaries. Our only significant assets are the equity interests we own in our operating subsidiaries and equity investees. As a result, we depend upon the earnings and cash flow of our operating subsidiaries and equity investees and any interruption of distributions to us may affect our ability to meet our obligations, including any obligations under our debt agreements, and to make distributions to our partners.
Cost reimbursements due to our General Partner may be substantial and may reduce our ability to pay the distributions to Unitholders.
Prior to making any distributions to our Unitholders, we will reimburse our General Partner for all expenses it has incurred on our behalf. In addition, our General Partner and its affiliates may provide us with services for which we will be charged reasonable fees as determined by the General Partner. The reimbursement of these expenses and the payment of these fees could adversely affect our ability to make distributions to the Unitholders. Our General Partner has sole discretion to determine the amount of these expenses and fees.
A reduction in Sunoco LP’s distributions will disproportionately affect the amount of cash distributions to which ETO is entitled.
ETO indirectly owns all of the IDRs of Sunoco LP. These IDRs entitle the holder to receive increasing percentages of total cash distributions made by Sunoco LP as such entity reaches established target cash distribution levels as specified in its partnership agreement. ETO currently receives its pro rata share of cash distributions from Sunoco LP based on the highest sharing level of 50% in respect of the Sunoco LP IDRs.
33
distributions by Sunoco LP to less than $0.65625 per unit per quarter would reduce ETO’s percentage of the incremental cash distributions from Sunoco LP above $0.546875 per unit per quarter from 50% to 25%. As a result, any such reduction in quarterly cash distributions from Sunoco LP would have the effect of disproportionately reducing the amount of all distributions that ETO receives, based on its ownership interest in the IDRs as compared to cash distributions received from its Sunoco LP common units.
Unitholders may have liability to repay distributions.
Under certain circumstances, Unitholders may have to repay us amounts wrongfully distributed to them. Under Delaware law, we may not make a distribution to Unitholders if the distribution causes our liabilities to exceed the fair value of our assets. Liabilities to partners on account of their partnership interests and non-recourse liabilities are not counted for purposes of determining whether a distribution is permitted. Delaware law provides that a limited partner who receives such a distribution and knew at the time of the distribution that the distribution violated Delaware law, will be liable to the limited partnership for the distribution amount for three years from the distribution date. Under Delaware law, an assignee who becomes a substituted limited partner of a limited partnership is liable for the obligations of the assignor to make contributions to the partnership. However, such an assignee is not obligated for liabilities unknown to him at the time he or she became a limited partner if the liabilities could not be determined from the partnership agreement.
We have a holding company structure in which our subsidiaries conduct our operations and own our operating assets.
We are a holding company, and our subsidiaries conduct all of our operations and own all of our operating assets. We do not have significant assets other than the partnership interests and the equity in our subsidiaries. As a result, our ability to pay distributions to our Unitholders and to service our debt depends on the performance of our subsidiaries and their ability to distribute funds to us. The ability of our subsidiaries to make distributions to us may be restricted by, among other things, credit facilities and applicable state partnership laws and other laws and regulations. If we are unable to obtain funds from our subsidiaries we may not be able to pay distributions to our Unitholders or to pay interest or principal on our debt when due.
We do not have the same flexibility as other types of organizations to accumulate cash, which may limit cash available to service our debt or to repay debt at maturity.
Unlike a corporation, our partnership agreement requires us to distribute, on a quarterly basis, 100% of our Available Cash (as defined in our partnership agreement) to our Unitholders of record and our General Partner. Available Cash is generally all of our cash on hand as of the end of a quarter, adjusted for cash distributions and net changes to reserves. Our General Partner will determine the amount and timing of such distributions and has broad discretion to establish and make additions to our reserves or the reserves of our operating subsidiaries in amounts it determines in its reasonable discretion to be necessary or appropriate:
| |
| • | to provide for the proper conduct of our business and the businesses of our operating subsidiaries (including reserves for future capital expenditures and for our anticipated future credit needs); |
to provide funds for distributions to our Unitholders and our General Partner for any onepreferred unitholders; or more of the next four calendar quarters; or
| |
| • | to comply with applicable law or any of our loan or other agreements. |
to comply with applicable law or any of our loan or other agreements.
A downgrade of our credit ratings could impact our and our subsidiaries’ liquidity, access to capital and costs of doing business, and maintaining credit ratings is under the control of independent third parties.
A downgrade of our credit ratings mightmay increase our and our subsidiaries’ cost of borrowing and could require us to post collateral with third parties, negatively impacting our available liquidity. Our and our subsidiaries’ ability to access capital markets could also be limited by a downgrade of our credit ratings and other disruptions. Such disruptions could include:
| |
| • | deteriorating capital market conditions; |
| |
| • | declining market prices for crude oil, natural gas, NGLs and other commodities; |
| |
| • | terrorist attacks or threatened attacks on our facilities or those of other energy companies; and |
| |
| • | the overall health of the energy industry, including the bankruptcy or insolvency of other companies. |
economic downturns;
deteriorating capital market conditions;
declining market prices for natural gas, NGLs and other commodities;
terrorist attacks or threatened attacks on our facilities or those of other energy companies; and
the overall health of the energy industry, including the bankruptcy or insolvency of other companies.
Credit rating agencies perform independent analysis when assigning credit ratings. The analysis includes a number of criteria including, but not limited to, business composition, market and operational risks, as well as various financial tests. Credit rating agencies continue to review the criteria for industry sectors and various debt ratings and may make changes to those criteria from time to time. Credit ratings are not recommendations to buy, sell or hold investments in the rated entity. Ratings are subject to revision or withdrawal at any time by the rating agencies, and we cannot assure you that we will maintain our current credit ratings.
Risks Related to Conflicts of Interest
Although we control Sunoco LP and USAC through our ownership of Sunoco LP’s and USAC’s general partners, Sunoco LP’s and USAC’s general partners owe fiduciary duties to Sunoco LP and Sunoco LP’s unitholders and USAC and USAC’s unitholders, respectively, which may conflict with our interests.
Conflicts of interest exist and may arise in the future as a result of the relationships between us and our affiliates, on the one hand, and Sunoco LP and USAC and their respective limited partners, on the other hand. The directors and officers of Sunoco LP’s and USAC’s general partners have fiduciary duties to manage Sunoco LP and USAC, respectively, in a manner beneficial to us. At the same time, the general partners have fiduciary duties to manage Sunoco LP and USAC in a manner beneficial to Sunoco LP and USAC and their respective limited partners. The boards of directors of Sunoco LP’s and USAC’s general partner will resolve any such conflict and have broad latitude to consider the interests of all parties to the conflict. The resolution of these conflicts may not always be in our best interest.
For example, conflicts of interest with Sunoco LP and USAC may arise in the following situations:
the allocation of shared overhead expenses to Sunoco LP, USAC and us;
the interpretation and enforcement of contractual obligations between us and our affiliates, on the one hand, and Sunoco LP and USAC, on the other hand;
the determination of the amount of cash to be distributed to Sunoco LP’s and USAC’s partners and the amount of cash to be reserved for the future conduct of Sunoco LP’s and USAC’s businesses;
the determination whether to make borrowings under Sunoco LP’s and USAC’s revolving credit facilities to pay distributions to their respective partners;
the determination of whether a business opportunity (such as a commercial development opportunity or an acquisition) that we may become aware of independently of Sunoco LP and USAC is made available for Sunoco LP and USAC to pursue; and
any decision we make in the future to engage in business activities independent of Sunoco LP and USAC.
The fiduciary duties of our General Partner’s officers and directors may conflict with those of Sunoco LP’s or USAC’s respective general partners.
Conflicts of interest may arise because of the relationships among Sunoco LP, USAC, their general partners and us. Our General Partner’s directors and officers have fiduciary duties to manage our business in a manner beneficial to us and our Unitholders. Some of our General Partner’s directors or officers are also directors and/or officers of Sunoco LP’s general partner or USAC’s general partner, and have fiduciary duties to manage the respective businesses of Sunoco LP and USAC in a manner beneficial to Sunoco LP, USAC and their respective Unitholders. The resolution of these conflicts may not always be in our best interest or that of our Unitholders.
Potential conflicts of interest may arise among our General Partner, its affiliates and us. Our General Partner and its affiliates have limited fiduciary duties to us, which may permit them to favor their own interests to the detriment of us.
Conflicts of interest may arise among our General Partner and its affiliates, on the one hand, and us, on the other hand. As a result of these conflicts, our General Partner may favor its own interests and the interests of its affiliates over our interests. These conflicts include, among others, the following:
our General Partner is allowed to take into account the interests of parties other than us, including Sunoco LP and USAC, and their respective affiliates and any general partners and limited partnerships acquired in the future, in resolving conflicts of interest, which has the effect of limiting its fiduciary duties to us.
our General Partner has limited its liability and reduced its fiduciary duties under the terms of our partnership agreement, while also restricting the remedies available for actions that, without these limitations, might constitute breaches of fiduciary duty. As a result of purchasing our units, Unitholders consent to various actions and conflicts of interest that might otherwise constitute a breach of fiduciary or other duties under applicable state law.
our General Partner determines the amount and timing of our investment transactions, borrowings, issuances of additional partnership securities and reserves, each of which can affect the amount of cash that is available for distribution.
our General Partner determines which costs it and its affiliates have incurred are reimbursable by us.
our partnership agreement does not restrict our General Partner from causing us to pay it or its affiliates for any services rendered, or from entering into additional contractual arrangements with any of these entities on our behalf, so long as the terms of any such payments or additional contractual arrangements are fair and reasonable to us.
our General Partner controls the enforcement of obligations owed to us by it and its affiliates.
our General Partner decides whether to retain separate counsel, accountants or others to perform services for us.
Our partnership agreement limits our General Partner’s fiduciary duties to our Unitholders and restricts the remedies available to Unitholders for actions taken by our General Partner that might otherwise constitute breaches of fiduciary duty.
Our partnership agreement contains provisions that waive or consent to conduct by our General Partner and its affiliates and reduce the obligations to which our General Partner would otherwise be held by state-law fiduciary duty standards. The following is a summary of the material restrictions contained in our partnership agreement on the duties owed by our General Partner, and our officers and directors, to the limited partners. Our partnership agreement:
eliminates all standards of care and duties other than those set forth in our partnership agreement, including fiduciary duties, to the fullest extent permitted by law;
permits our General Partner to make a number of decisions in its “sole discretion,” which standard entitles our General Partner to consider only the interests and factors that it desires, and it has no duty or obligation to give any consideration to any interest of, or factors affecting, us, our affiliates or any limited partner;
provides that our General Partner is entitled to make other decisions in its “reasonable discretion;”
generally provides that affiliated transactions and resolutions of conflicts of interest must be “fair and reasonable” to us and that, in determining whether a transaction or resolution is “fair and reasonable,” our General Partner may consider the interests of all parties involved, including its own;
provides that unless our General Partner has acted in bad faith, the action taken by our General Partner shall not constitute a breach of its fiduciary duty;
provides that our General Partner may resolve any conflicts of interest involving us and our General Partner and its affiliates, and any resolution of a conflict of interest by our General Partner that is “fair and reasonable” to us will be deemed approved by all partners, including the Unitholders, and will not constitute a breach of the partnership agreement;
provides that our General Partner may, but is not required, in connection with its resolution of a conflict of interest, to seek “special approval” of such resolution by appointing a conflicts committee of the General Partner’s board of directors composed of two or more independent directors to consider such conflicts of interest and to recommend action to the board of directors, and any resolution of the conflict of interest by the conflicts committee shall be conclusively deemed “fair and reasonable” to us;
provides that our General Partner may consult with consultants and advisors and, subject to certain restrictions, is conclusively deemed to have acted in good faith when it acts in reliance on the opinion of such consultants and advisors; and
provides that our General Partner and its officers and directors will not be liable for monetary damages to us, our limited partners or assignees for errors of judgment or for any acts or omissions if our General Partner and those other persons acted in good faith.
In order to become a limited partner of our partnership, a Unitholder is required to agree to be bound by the provisions in our partnership agreement, including the provisions discussed above.
Some of our executive officers and directors face potential conflicts of interest in managing our business.
Certain of our executive officers and directors are also officers and/or directors of ETE.ET. These relationships may create conflicts of interest regarding corporate opportunities and other matters. The resolution of any such conflicts may not always be in our or our Unitholders’ best interests. In addition, these overlapping executive officers and directors allocate their time among us and ETE.ET. These officers and directors face potential conflicts regarding the allocation of their time, which may adversely affect our business, results of operations and financial condition.
The General Partner’s absolute discretion in determining the level of cash reserves may adversely affect our ability to make cash distributions to our Unitholders.
Our partnership agreement requires the General Partner to deduct from operating surplus cash reserves that in its reasonable discretion are necessary to fund our future operating expenditures. In addition, our partnership agreement permits the General Partner to reduce available cash by establishing cash reserves for the proper conduct of our business, to comply with applicable law or agreements to which we are a party or to provide funds for future distributions to partners. These cash reserves will affect the amount of cash available for distribution to Unitholders.
Our General Partner has conflicts of interest and limited fiduciary responsibilities that may permit our General Partner to favor its own interests to the detriment of Unitholders.
ETEET indirectly owns our General Partner and as a result controls us. The directors and officers of our General Partner and its affiliates have fiduciary duties to manage our General Partner in a manner that is beneficial to ETE,ET, the sole owner of our General Partner. At the same time, our General Partner has contractually-limited fiduciary duties to our Unitholders. Therefore, our General Partner’s duties to us may conflict with the duties of its officers and directors to ETEET as its sole owner. As a result of these conflicts of interest, our General Partner may favor its own interest or those of ETEET or their owners or affiliates over the interest of our Unitholders.
Such conflicts may arise from, among others, the following:
Ourour partnership agreement limits the liability and reduces the fiduciary duties of our General Partner while also restricting the remedies available to our Unitholders for actions that, without these limitations, might constitute breaches of fiduciary duty. Unitholders are deemed to have consented to some actions and conflicts of interest that might otherwise be deemed a breach of fiduciary or other duties under applicable state law. Our General Partner is allowed to take into account the interests of parties in addition to us in resolving conflicts of interest, thereby limiting its fiduciary duties to us.
Ourour General Partner is allowed to take into account the interests of parties in addition to us, including ETE,ET, in resolving conflicts of interest, thereby limiting its fiduciary duties to us.
Ourour General Partner’s affiliates, including ETE,ET, are not prohibited from engaging in other businesses or activities, including those in direct competition with us.
Ourour General Partner determines the amount and timing of our asset purchases and sales, capital expenditures, borrowings, repayments of debt, issuances of equity and debt securities and cash reserves, each of which can affect the amount of cash that is distributed to Unitholders and to ETE.ET.
Neither
neither our partnership agreement nor any other agreement requires ETEET or its affiliates to pursue a business strategy that favors us. The directors and officers of the general partners of ETEET have a fiduciary duty to make decisions in the best interest of their members, limited partners and Unitholders, which may be contrary to our best interests.
Somesome of the directors and officers of ETEET who provide advice to us also may devote significant time to the businesses of ETEET and will be compensated by them for their services.
Ourour General Partner determines which costs, including allocated overhead costs, are reimbursable by us.
Ourour General Partner is allowed to resolve any conflicts of interest involving us and our General Partner and its affiliates, and any resolution of a conflict of interest by our General Partner that is fair and reasonable to us will be deemed approved by all partners and will not constitute a breach of the partnership agreement.
Ourour General Partner controls the enforcement of obligations owed to us by it.
Ourour General Partner decides whether to retain separate counsel, accountants or others to perform services for us.
Ourour General Partner is not restricted from causing us to pay it or its affiliates for any services rendered on terms that are fair and reasonable to us or entering into additional contractual arrangements with any of these entities on our behalf.
Ourour General Partner intends to limit its liability regarding our contractual and other obligations and, in some circumstances, may be entitled to be indemnified by us.
Inin some instances, our General Partner may cause us to borrow funds in order to permit the payment of distributions, even if the purpose or effect of the borrowing is to make incentive distributions.
Affiliates of our General Partner may compete with us.
Except as provided in our partnership agreement, affiliates and related parties of our General Partner are not prohibited from engaging in other businesses or activities, including those that might be in direct competition with us.
Risks Related to Our Business
We do not control, and therefore may not be able to cause or prevent certain actions by, certain of our joint ventures.
Certain of our operations are conducted through joint ventures, some of which have their own governing boards,boards. With respect to our joint ventures, we share ownership and wemanagement responsibilities with partners that may not control all of the decisions of those boards.share our goals and objectives. Consequently, it may be difficult or impossible for us to cause the joint venture entity to take actions that we believe would be in ourtheir or the joint venture’s best interests. Likewise, we may be unable to prevent actions of the joint venture.
assets or borrowing money, among others. Delay or failure to agree may prevent action with respect to such matters, even though such action may serve our best interest or that of the joint venture. Accordingly, delayed decisions and disagreements could adversely affect the business and operations of the joint ventures and, in turn, our business and operations.
We and our subsidiaries, including Sunoco LP and USAC, are exposed to the credit risk of our customers and derivative counterparties, and an increase in the nonpayment and nonperformance by our customers or derivative counterparties could reduce our ability to make distributions to our Unitholders.
The risks of nonpayment and nonperformance by our, Sunoco LP’s and USAC’s customers are a major concern in our business. Participants in the energy industry have been subjected to heightened scrutiny from the financial markets in light of past collapses and failures of other energy companies. We, Sunoco LP and USAC are subject to risks of loss resulting from nonpayment or nonperformance by our, Sunoco LP’s and USAC’s customers. The current commodityCommodity price volatility andand/or the tightening of credit in the financial markets may make it more difficult for customers to obtain financing and, depending on the degree to which this occurs, there may be a material increase in the nonpayment and nonperformance by our customers. To the extent one or more of our customers is in financial distress or commences bankruptcy proceedings, contracts with these customers may be subject to renegotiation or rejection under applicable provisions of the United States Bankruptcy Code. In addition, our risk management activities are subject to the risks that a counterparty may not perform its obligation under the applicable derivative instrument, the terms of the derivative instruments are imperfect, and our risk management policies and procedures are not properly followed. Any material nonpayment or nonperformance by our customers or our derivative counterparties could reduce our ability to make distributions to our Unitholders. Any substantial increase in the nonpayment and nonperformance by our customers could have a material effect on our, Sunoco LP’s and USAC’s results of operations and operating cash flows.
We compete with other businesses in our market with respect to attracting and retaining qualified employees.
Our continued success depends on our ability to attract and retain qualified personnel in all areas of our business. We compete with other businesses in our market with respect to attracting and retaining qualified employees. A tight labor market, increased overtime and a higher full-time employee ratio may cause labor costs to increase. A shortage of qualified employees may require us to enhance wage and benefits packages in order to compete effectively in the hiring and retention of such employees or to hire more expensive temporary employees. No assurance can be given that our labor costs will not increase, or that such increases can be recovered through increased prices charged to customers. We are especially vulnerable to labor shortages in oil and gas drilling areas when energy prices drive higher exploration and production activity.
Income from our midstream, transportation, terminalling and storage operations is exposed to risks due to fluctuations in the demand for and price of natural gas, NGLs, crude oil and oilrefined products that are beyond our control.
The prices for natural gas, NGLs, crude oil and oil (including refined petroleum products)products reflect market demand that fluctuates with changes in global and United States economic conditions and other factors, including:
the level of domestic natural gas, NGL, and oil production;
the level of natural gas, NGL, and oil imports and exports, including liquefied natural gas;
actions taken by natural gas and oil producing nations;
instability or other events affecting natural gas and oil producing nations;
the impact of weather and other events of nature on the demand for natural gas, NGLs and oil;
the availability of storage, terminal and transportation systems, and refining, processing and treating facilities;
the price, availability and marketing of competitive fuels;
the demand for electricity;
activities by non-governmental organizations to limit certain sources of funding for the energy sector or restrict the exploration, development and production of oil and natural gas;
the cost of capital needed to maintain or increase production levels and to construct and expand facilities
the impact of energy conservation and fuel efficiency efforts; and
the extent of governmental regulation, taxation, fees and duties.
In the past, the prices of natural gas, NGLs and oil have been extremely volatile, and we expect this volatility to continue.
Any loss of business from existing customers or our inability to attract new customers due to a decline in demand for natural gas, NGLs, or oil could have a material adverse effect on our revenues and results of operations. In addition, significant price fluctuations for natural gas, NGL and oil commodities could materially affect our profitability.
We are affected by competition from other midstream, transportation, terminalling and storage companies.
We experience competition in all of our business segments. With respect to our midstream operations, we compete for both natural gas supplies and customers for our services. Our competitors include major integrated oil companies, interstate and intrastate pipelines and companies that gather, compress, treat, process, transport, store and market natural gas.
Our natural gas and NGL transportation pipelines and storage facilities compete with other interstate and intrastate pipeline companies and storage providers in the transportation and storage of natural gas and NGLs. The principal elements of competition among pipelines are rates, terms of service, access to sources of supply and the flexibility and reliability of service. Natural gas and NGLs also competes with other forms of energy, including electricity, coal, fuel oils and renewable or alternative energy. Competition among fuels and energy supplies is primarily based on price; however, non-price factors, including governmental regulation, environmental impacts, efficiency, ease of use and handling, and the availability of subsidies and tax benefits also affects competitive outcomes.
In markets served by our NGL pipelines, we compete with other pipeline companies and barge, rail and truck fleet operations. We also face competition with other storage and fractionation facilities based on fees charged and the ability to receive, distribute and/or fractionate the customer’s products.
Our crude oil and refined petroleum products pipelines face significant competition from other pipelines for large volume shipments. These operations also face competition from trucks for incremental and marginal volumes in the areas we serve. Further, our
crude and refined product terminals compete with terminals owned by integrated petroleum companies, refining and marketing companies, independent terminal companies and distribution companies with marketing and trading operations.
We may be unable to retain or replace existing midstream, transportation, terminalling and storagecustomers or volumes due to declining demand or increased competition in crude oil, refined products, natural gas and NGL markets, which would reduce our revenues and limit our future profitability.
The retention or replacement of existing customers and the volume of services that we provide at rates sufficient to maintain or increase current revenues and cash flows depends on a number of factors beyond our control, including the price of and demand for crude oil, refined products, natural gas and NGLs in the markets we serve and competition from other service providers.
A significant portion of our sales of natural gas are to industrial customers and utilities. As a consequence of the volatility of natural gas prices and increased competition in the industry and other factors, industrial customers, utilities and other gas customers are increasingly reluctant to enter into long-term purchase contracts. Many customers purchase natural gas from more than one supplier and have the ability to change suppliers at any time. Some of these customers also have the ability to switch between gas and alternate fuels in response to relative price fluctuations in the market. Because there are many companies of greatly varying size and financial capacity that compete with us in the marketing of natural gas, we often compete in natural gas sales markets primarily on the basis of price.
We also receive a substantial portion of our revenues by providing natural gas gathering, processing, treating, transportation and storage services. While a substantial portion of our services are sold under long-term contracts for reserved service, we also provide service on an unreserved or short-term basis. Demand for our services may be substantially reduced due to changing market prices. Declining prices may result in lower rates of natural gas production resulting in less use of services, while rising prices may diminish consumer demand and also limit the use of services. In addition, our competitors may attract our customers’ business. If demand declines or competition increases, we may not be able to sustain existing levels of unreserved service or renew or extend long-term contracts as they expire or we may reduce our rates to meet competitive pressures.
Revenue from our NGL transportation systems and refined products storage is also exposed to risks due to fluctuations in demand for transportation and storage service as a result of unfavorable commodity prices, competition from nearby pipelines, and other factors. We receive substantially all of our transportation revenues through dedicated contracts under which the customer agrees to deliver the total output from particular processing plants that are connected only to our transportation system. Reduction in demand for natural gas or NGLs due to unfavorable prices or other factors, however, may result lower rates of production under dedicated contracts and lower demand for our services. In addition, our refined products storage revenues are primarily derived from fixed capacity arrangements between us and our customers, a portion of our revenue is derived from fungible storage and throughput arrangements, under which our revenue is more dependent upon demand for storage from our customers.
The volume of crude oil and refined products transported through our crude oil and refined products pipelines and terminal facilities depends on the availability of attractively priced crude oil and refined products in the areas serviced by our assets. A period of sustained price reductions for crude oil or refined products could lead to a decline in drilling activity, production and refining of crude oil or import levels in these areas. A period of sustained increases in the price of crude oil or refined products supplied from or delivered to any of these areas could materially reduce demand for crude oil or refined products in these areas. In either case, the volumes of crude oil or refined products transported in our crude oil and refined products pipelines and terminal facilities could decline.
The loss of existing customers by our midstream, transportation, terminalling and storage facilities or a reduction in the volume of the services our customers purchase from us, or our inability to attract new customers and service volumes would negatively affect our revenues, be detrimental to our growth, and adversely affect our results of operations.
Our midstream facilities and transportation pipelines are attachedprovide services related to basins with naturally decliningnatural gas wells that experience production declines over time, which we may not be able to replace with natural gas production from newly drilled wells in the same natural gas basins or in other new sources of supply.natural gas producing areas.
In order to maintain or increase throughput levels on our gathering systems and transportation pipeline systems and asset utilization rates at our treating and processing plants, we must continually contract for new natural gas supplies and natural gas transportation services.
A substantial portion of our assets, including our gathering systems and our processing and treating plants, are connected to natural gas reserves and wells that experience declining production over time. Our gas transportation pipelines are also dependent upon natural gas production in areas served by our gathering systems or in areas served by other gathering systems or transportation pipelines that connect with our transportation pipelines. We may not be able to obtain additional contracts for natural gas supplies for our natural gas gathering systems, and we may be unable to maintain or increase the levels of natural gas throughput on our
transportation pipelines. The primary factors affecting our ability to connect new supplies of natural gas to our gathering systems include our success in contracting for existing natural gas supplies that are not committed to other systems and the level of drilling activity and production of natural gas near our gathering systems or in areas that provide access to our transportation pipelines or markets to which our systems connect. We have no control over the level of drilling activity in our areas of operation, the amount of reserves underlying the wells and the rate at which production from a well will decline. In addition, we have no control over producers or their production and contracting decisions.
While a substantial portion of our services are provided under long-term contracts for reserved service, we also provide service on an unreserved basis. The reserves available through the supply basins connected to our gathering, processing, treating, transportation and storage facilities may decline and may not be replaced by other sources of supply. A decrease in development or production activity could cause a decrease in the volume of unreserved services we provide and a decrease in the number and volume of our contracts for reserved transportation service over the long run, which in each case would adversely affect our revenues and results of operations.
If we are unable to replace any significant volume declines with additional volumes from other sources, our results of operations and cash flows could be materially and adversely affected.
The profitability of certain activities in our natural gas gathering, processing, transportation and storage operations are largely dependent upon natural gas commodity prices, price spreads between two or more physical locations and market demand for natural gas and NGLs.
For a portion of the natural gas gathered on our systems, we purchase natural gas from producers at the wellhead and then gather and deliver the natural gas to pipelines where we typically resell the natural gas under various arrangements, including sales at index prices. Generally, the gross margins we realize under these arrangements decrease in periods of low natural gas prices.
We also enter into percent-of-proceeds arrangements, keep-whole arrangements, and processing fee agreements pursuant to which we agree to gather and process natural gas received from the producers.
Under percent-of-proceeds arrangements, we generally sell the residue gas and NGLs at market prices and remit to the producers an agreed upon percentage of the proceeds based on an index price. In other cases, instead of remitting cash payments to the producer, we deliver an agreed upon percentage of the residue gas and NGL volumes to the producer and sell the volumes we keep to third parties at market prices. Under these arrangements, our revenues and gross margins decline when natural gas prices and NGL prices decrease. Accordingly, a decrease in the price of natural gas or NGLs could have an adverse effect on our revenues and results of operations.
Under keep-whole arrangements, we generally sell the NGLs produced from our gathering and processing operations at market prices. Because the extraction of the NGLs from the natural gas during processing reduces the Btu content of the natural gas, we must either purchase natural gas at market prices for return to producers or make a cash payment to producers equal to the value of this natural gas. Under these arrangements, our gross margins generally decrease when the price of natural gas increases relative to the price of NGLs.
When we process the gas for a fee under processing fee agreements, we may guarantee recoveries to the producer. If recoveries are less than those guaranteed to the producer, we may suffer a loss by having to supply liquids or its cash equivalent to keep the producer whole.
We also receive fees and retain gas in kind from our natural gas transportation and storage customers. Our fuel retention fees and the value of gas that we retain in kind are directly affected by changes in natural gas prices. Decreases in natural gas prices tend to decrease our fuel retention fees and the value of retained gas.
In addition, we receive revenue from our off-gas processing and fractionating system in south Louisiana primarily through customer agreements that are a combination of keep-whole and percent-of-proceeds arrangements, as well as from transportation and fractionation fees. Consequently, a large portion of our off-gas processing and fractionation revenue is exposed to risks due to fluctuations in commodity prices. In addition, a decline in NGL prices could cause a decrease in demand for our off-gas processing and fractionation services and could have an adverse effect on our results of operations.
For our midstream segment, we generally analyze gross margin based on fee-based margin (which includes revenues from processing fee arrangements) and non-fee based margin (which includes gross margin earned on percent-of-proceeds and keep-whole arrangements). For the years ended December 31, 2019, 2018 and 2017, 2016segment margin (a non-GAAP measure discussed in “Item 7. Management’s Discussion and 2015, gross marginAnalysis of Financial Condition and Results of Operations”) from our midstream segment totaled $2.18$2.45 billion, $1.80$2.38 billion and $1.79$2.18 billion, respectively, of which fee-based revenues constituted 78%82%, 86%75% and 88%77%, respectively, and non-fee based margin constituted 22%18%, 14%25% and 12%23%, respectively. The amount of grosssegment margin earned by
our midstream segment from fee-based and non-fee based arrangements (individually and as a percentage of total revenues) will be impacted by the volumes associated with both types of arrangements, as well as commodity prices; therefore, the dollar amounts and the relative magnitude of gross margin from fee-based and non-fee based arrangements in future periods may be significantly different from results reported in previous periods.
A material decrease in demand or distribution of crude oil available for transport through our pipelines or terminal facilities could materially and adversely affect our results of operations, financial position, or cash flows.
The volume of crude oil transported through our crude oil pipelines and terminal facilities depends on the availability of attractively priced crude oil produced or received in the areas serviced by our assets. A period of sustained crude oil price declines could lead to a decline in drilling activity, production and import levels in these areas. Similarly, a period of sustained increases in the price of crude oil supplied from any of these areas, as compared to alternative sources of crude oil available to our customers, could materially reduce demand for crude oil in these areas. In either case, the volumes of crude oil transported in our crude oil pipelines and terminal facilities could decline, and it could likely be difficult to secure alternative sources of attractively priced crude oil supply in a timely fashion or at all. If we are unable to replace any significant volume declines with additional volumes from other sources, our results of operations, financial position, or cash flows could be materially and adversely affected.
Shifts in the overall supply of, and demand for, crude oil in regional, national and global markets, over which we have no control, can have an adverse impact on crude oil index prices in the markets we serve relative to other index prices. A prolonged decline in the WTI Index price, relative to other index prices, may cause reduced demand for our transportation to, and storage in, Cushing, which could have a material adverse effect on our business, results of operations and financial condition.
An interruption of supply of crude oil to our facilities could materially and adversely affect our results of operations and revenues.
While we are well positioned to transport and receive crude oil by pipeline, marine transport and trucks, rail transportation also serves as a critical link in the supply of domestic crude oil production to United States refiners, especially for crude oil from regions such as the Bakken that are not sourced near pipelines or waterways that connect to all of the major United States refining centers. Federal regulators have issued a safety advisory warning that Bakken crude oil may be more volatile than many other North American crude oils and reinforcing the requirement to properly test, characterize, classify, and, if applicable, sufficiently degasify hazardous materials prior to and during transportation. The domestic crude oil received by our facilities, especially from the Bakken region, may be transported by railroad. If the ability to transport crude oil by rail is disrupted because of accidents, weather interruptions, governmental regulation, congestion on rail lines, terrorism, other third-party action or casualty or other events, then we could experience an interruption of supply or delivery or an increased cost of receiving crude oil, and could experience a decline in volumes received. Recent railcar accidents in Quebec, Alabama, North Dakota, Pennsylvania and Virginia, in each case involving trains carrying crude oil from the Bakken region, have led to increased legislative and regulatory scrutiny over the safety of transporting crude oil by rail. In 2015, the DOT, through the PHMSA, issued a rule implementing new rail car standards and railroad operating procedures. Changing operating practices, as well as new regulations on tank car standards and shipper classifications, could increase the time required to move crude oil from production areas of facilities, increase the cost of rail transportation, and decrease the efficiency of transportation of crude oil by rail, any of which could materially reduce the volume of crude oil received by rail and adversely affect our financial condition, results of operations, and cash flows.
A significant decrease in demand for motor fuel, including increased consumer preference for alternative motor fuels or improvements in fuel efficiency, in the areas Sunoco LP serves would reduce their ability to make distributions to its unitholders.
Sales of refined motor fuels account for approximately 97% of Sunoco LP’s total revenues and 74% of continuing operations gross profit. A significant decrease in demand for motor fuel in the areas Sunoco LP serves could significantly reduce revenues and Sunoco LP’s ability to make distributions to its unitholders. Sunoco LP revenues are dependent on various trends, such as trends in commercial truck traffic, travel and tourism in their areas of operation, and these trends can change. Regulatory action, including government imposed fuel efficiency standards, may also affect demand for motor fuel. Because certain of Sunoco LP’s operating costs and expenses are fixed and do not vary with the volumes of motor fuel distributed, their costs and expenses might not decrease ratably or at all should they experience such a reduction. As a result, Sunoco LP may experience declines in their profit margin if fuel distribution volumes decrease.
Any technological advancements, regulatory changes or changes in consumer preferences causing a significant shift toward alternative motor fuels could reduce demand for the conventional petroleum based motor fuels Sunoco LP currently sells. Additionally, a shift toward electric, hydrogen, natural gas or other alternative-power vehicles could fundamentally change customers' shopping habits or lead to new forms of fueling destinations or new competitive pressures.
New technologies have been developed and governmental mandates have been implemented to improve fuel efficiency, which may result in decreased demand for petroleum-based fuel. Any of these outcomes could result in fewer visits to Sunoco LP’s
convenience stores or independently operated commission agents and dealer locations, a reduction in demand from their wholesale customers, decreases in both fuel and merchandise sales revenue, or reduced profit margins, any of which could have a material adverse effect on Sunoco LP’s business, financial condition, results of operations and cash available for distribution to its unitholders.
The industries in which Sunoco LP operates are subject to seasonal trends, which may cause its operating costs to fluctuate, affecting its cash flow.
Sunoco LP relies in part on customer travel and spending patterns, and may experience more demand for gasoline in the late spring and summer months than during the fall and winter. Travel, recreation and construction are typically higher in these months in the geographic areas in which Sunoco LP or its commission agents and dealers operate, increasing the demand for motor fuel that they sell and distribute. Therefore, Sunoco LP’s revenues and cash flows are typically higher in the second and third quarters of our fiscal year. As a result, Sunoco LP’s results from operations may vary widely from period to period, affecting Sunoco LP’s cash flow.
Sunoco LP’s financial condition and results of operations are influenced by changes in the prices of motor fuel, which may adversely impact margins, customers’ financial condition and the availability of trade credit.
Sunoco LP’s operating results are influenced by prices for motor fuel. General economic and political conditions, acts of war or terrorism and instability in oil producing regions, particularly in the Middle East and South America, could significantly impact crude oil supplies and petroleum costs. Significant increases or high volatility in petroleum costs could impact consumer demand for motor fuel and convenience merchandise. Such volatility makes it difficult to predict the impact that future petroleum costs fluctuations may have on Sunoco LP’s operating results and financial condition. Sunoco LP is subject to dealer tank wagon pricing structures at certain locations further contributing to margin volatility. A significant change in any of these factors could materially impact both wholesale and retail fuel margins, the volume of motor fuel distributed or sold at retail, and overall customer traffic, each of which in turn could have a material adverse effect on Sunoco LP’s business, financial condition, results of operations and cash available for distribution to its unitholders.
Significant increases in wholesale motor fuel prices could impact Sunoco LP as some of their customers may have insufficient credit to purchase motor fuel from us at their historical volumes. Higher prices for motor fuel may also reduce access to trade credit support or cause it to become more expensive.
The dangers inherent in the storage and transportation of motor fuel could cause disruptions in Sunoco LP’s operations and could expose them to potentially significant losses, costs or liabilities.
Sunoco LP stores motor fuel in underground and aboveground storage tanks. Sunoco LP transports the majority of its motor fuel in its own trucks, instead of by third-party carriers. Sunoco LP’s operations are subject to significant hazards and risks inherent in transporting and storing motor fuel. These hazards and risks include, but are not limited to, traffic accidents, fires, explosions, spills, discharges, and other releases, any of which could result in distribution difficulties and disruptions, environmental pollution, governmentally-imposed fines or clean-up obligations, personal injury or wrongful death claims, and other damage to its properties and the properties of others. Any such event not covered by Sunoco LP’s insurance could have a material adverse effect on its business, financial condition, results of operations and cash available for distribution to its unitholders.
Sunoco LP’s fuel storage terminals are subject to operational and business risks which may adversely affect their financial condition, results of operations, cash flows and ability to make distributions to its unitholders.
Sunoco LP’s fuel storage terminals are subject to operational and business risks, the most significant of which include the following:
the inability to renew a ground lease for certain of their fuel storage terminals on similar terms or at all;
the dependence on third parties to supply their fuel storage terminals;
outages at their fuel storage terminals or interrupted operations due to weather-related or other natural causes;
the threat that the nation’s terminal infrastructure may be a future target of terrorist organizations;
the volatility in the prices of the products stored at their fuel storage terminals and the resulting fluctuations in demand for storage services;
the effects of a sustained recession or other adverse economic conditions;
the possibility of federal and/or state regulations that may discourage their customers from storing gasoline, diesel fuel, ethanol and jet fuel at their fuel storage terminals or reduce the demand by consumers for petroleum products;
competition from other fuel storage terminals that are able to supply their customers with comparable storage capacity at lower prices; and
climate change legislation or regulations that restrict emissions of GHGs could result in increased operating and capital costs and reduced demand for our storage services.
The occurrence of any of the above situations, amongst others, may affect operations at their fuel storage terminals and may adversely affect Sunoco LP’s business, financial condition, results of operations, cash flows and ability to make distributions to its unitholders.
Negative events or developments associated with Sunoco LP’s branded suppliers could have an adverse impact on its revenues.
Sunoco LP believes that the success of its operations is dependent, in part, on the continuing favorable reputation, market value, and name recognition associated with the motor fuel brands sold at Sunoco LP’s convenience stores and at stores operated by its independent, branded dealers and commission agents. Erosion of the value of those brands could have an adverse impact on the volumes of motor fuel Sunoco LP distributes, which in turn could have a material adverse effect on its business, financial condition, results of operations and ability to make distributions to its unitholders.
The wholesale motor fuel distribution industry and convenience store industry are characterized by intense competition and fragmentation and impacted by new entrants. Failure to effectively compete could result in lower margins.
The market for distribution of wholesale motor fuel is highly competitive and fragmented, which results in narrow margins. Sunoco LP has numerous competitors, some of which may have significantly greater resources and name recognition than it does. Sunoco LP relies on its ability to provide value-added, reliable services and to control its operating costs in order to maintain our margins and competitive position. If Sunoco LP fails to maintain the quality of its services, certain of its customers could choose alternative distribution sources and margins could decrease. While major integrated oil companies have generally continued to divest retail sites and the corresponding wholesale distribution to such sites, such major oil companies could shift from this strategy and decide to distribute their own products in direct competition with Sunoco LP, or large customers could attempt to buy directly from the major oil companies. The occurrence of any of these events could have a material adverse effect on Sunoco LP’s business, financial condition, results of operations and cash available for distribution to its unitholders.
The geographic areas in which Sunoco LP operates and supplies independently operated commission agent and dealer locations are highly competitive and marked by ease of entry and constant change in the number and type of retailers offering products and services of the type we and our independently operated commission agents and dealers sell in stores. Sunoco LP competes with other convenience store chains, independently owned convenience stores, motor fuel stations, supermarkets, drugstores, discount stores, dollar stores, club stores, mass merchants and local restaurants. Over the past two decades, several non-traditional retailers, such as supermarkets, hypermarkets, club stores and mass merchants, have impacted the convenience store industry, particularly in the geographic areas in which Sunoco LP operates, by entering the motor fuel retail business. These non-traditional motor fuel retailers have captured a significant share of the motor fuels market, and Sunoco LP expects their market share will continue to grow.
In some of Sunoco LP’s markets, its competitors have been in existence longer and have greater financial, marketing, and other resources than they or their independently operated commission agents and dealers do. As a result, Sunoco LP’s competitors may be able to better respond to changes in the economy and new opportunities within the industry. To remain competitive, Sunoco LP must constantly analyze consumer preferences and competitors’ offerings and prices to ensure that they offer a selection of convenience products and services at competitive prices to meet consumer demand. Sunoco LP must also maintain and upgrade our customer service levels, facilities and locations to remain competitive and attract customer traffic to our stores. Sunoco LP may not be able to compete successfully against current and future competitors, and competitive pressures faced by Sunoco LP could have a material adverse effect on its business, results of operations and cash available for distribution to its unitholders.
Sunoco LP currently depends on a limited number of principal suppliers in each of its operating areas for a substantial portion of its merchandise inventory and its products and ingredients for its food service facilities. A disruption in supply or a change in either relationship could have a material adverse effect on its business.
Sunoco LP currently depends on a limited number of principal suppliers in each of its operating areas for a substantial portion of its merchandise inventory and its products and ingredients for its food service facilities. If any of Sunoco LP’s principal suppliers elect not to renew their contracts, Sunoco LP may be unable to replace the volume of merchandise inventory and products and ingredients currently purchased from them on similar terms or at all in those operating areas. Further, a disruption in supply or a significant change in Sunoco LP’s relationship with any of these suppliers could have a material adverse effect on Sunoco LP’s business, financial condition and results of operations and cash available for distribution to its unitholders.
Sunoco LP may be subject to adverse publicity resulting from concerns over food quality, product safety, health or other negative events or developments that could cause consumers to avoid its retail locations or independently operated commission agent or dealer locations.
Sunoco LP may be the subject of complaints or litigation arising from food-related illness or product safety which could have a negative impact on its business. Negative publicity, regardless of whether the allegations are valid, concerning food quality, food safety or other health concerns, food service facilities, employee relations or other matters related to its operations may materially adversely affect demand for its food and other products and could result in a decrease in customer traffic to its retail stores or independently operated commission agent or dealer locations.
It is critical to Sunoco LP’s reputation that they maintain a consistent level of high quality at their food service facilities and other franchise or fast food offerings. Health concerns, poor food quality or operating issues stemming from one store or a limited number of stores could materially and adversely affect the operating results of some or all of their stores and harm the company-owned brands, continuing favorable reputation, market value and name recognition.
USAC’s customers may choose to vertically integrate their operations by purchasing and operating their own compression fleet, increasing the number of compression units they currently own or using alternative technologies for enhancing crude oil production.
USAC’s customers that are significant producers, processors, gatherers and transporters of natural gas and crude oil may choose to vertically integrate their operations by purchasing and operating their own compression fleets in lieu of using USAC’s compression services. The historical availability of attractive financing terms from financial institutions and equipment manufacturers facilitates this possibility by making the purchase of individual compression units increasingly affordable to USAC's customers. In addition, there are many technologies available for the artificial enhancement of crude oil production, and USAC's customers may elect to use these alternative technologies instead of the gas lift compression services USAC provides. Such vertical integration, increases in vertical integration or use of alternative technologies could result in decreased demand for USAC's compression services, which may have a material adverse effect on its business, results of operations, financial condition and reduce its cash available for distribution.
A significant portion of USAC's services are provided to customers on a month-to-month basis, and USAC cannot be sure that such customers will continue to utilize its services.
USAC's contracts typically have an initial term of between six months and five years, depending on the application and location of the compression unit. After the expiration of the initial term, the contract continues on a month-to-month or longer basis until terminated by USAC or USAC's customers upon notice as provided for in the applicable contract. For the year ended December 31, 2019, approximately 36% of USAC's compression services on a revenue basis were provided on a month-to-month basis to customers who continue to utilize its services following expiration of the primary term of their contracts. These customers can generally terminate their month-to-month compression services contracts on 30-days’ written notice. If a significant number of these customers were to terminate their month-to-month services, or attempt to renegotiate their month-to-month contracts at substantially lower rates, it could have a material adverse effect on USAC's business, results of operations, financial condition and cash available for distribution.
USAC’s Preferred Units have rights, preferences and privileges that are not held by, and are preferential to the rights of, holders of its common units.
USAC’s Preferred Units rank senior to all of its other classes or series of equity securities with respect to distribution rights and rights upon liquidation. These preferences could adversely affect the market price for its common units, or could make it more difficult for USAC to sell its common units in the future.
In addition, distributions on USAC’s Preferred Units accrue and are cumulative, at the rate of 9.75% per annum on the original issue price, which amounts to a quarterly distribution of $24.375 per Preferred Unit. If USAC does not pay the required distributions on its Preferred Units, USAC will be unable to pay distributions on its common units. Additionally, because distributions on USAC’s Preferred Units are cumulative, USAC will have to pay all unpaid accumulated distributions on the Preferred Units before USAC can pay any distributions on its common units. Also, because distributions on USAC’s common units are not cumulative, if USAC does not pay distributions on its common units with respect to any quarter, USAC’s common unitholders will not be entitled to receive distributions covering any prior periods if USAC later recommences paying distributions on its common units.
USAC’s Preferred Units are convertible into common units by the holders of USAC’s Preferred Units or by USAC in certain circumstances. USAC’s obligation to pay distributions on USAC’s Preferred Units, or on the common units issued following the conversion of USAC’s Preferred Units, could impact USAC’s liquidity and reduce the amount of cash flow available for working capital, capital expenditures, growth opportunities, acquisitions and other general Partnership purposes. USAC’s obligations to
the holders of USAC’s Preferred Units could also limit its ability to obtain additional financing or increase its borrowing costs, which could have an adverse effect on its financial condition.
The use of derivative financial instruments could result in material financial losses by us.
From time to time, we and/or our subsidiaries have sought to reduce our exposure to fluctuations in commodity prices and interest rates by using derivative financial instruments and other risk management mechanisms and by our trading, marketing and/or system optimization activities. To the extent that we hedge our commodity price and interest rate exposures, we forgo the benefits we would otherwise experience if commodity prices or interest rates were to change in our favor.
The accounting standards regarding hedge accounting are very complex, and even when we engage in hedging transactions that are effective economically (whether to mitigate our exposure to fluctuations in commodity prices, or to balance our exposure to fixed and variable interest rates), these transactions may not be considered effective for accounting purposes. Accordingly, our consolidated financial statements may reflect some volatility due to these hedges, even when there is no underlying economic impact at that point. It is also not always possible for us to engage in a hedging transaction that completely mitigates our exposure to commodity prices. Our consolidated financial statements may reflect a gain or loss arising from an exposure to commodity prices for which we are unable to enter into a completely effective hedge.
In addition, our derivatives activities can result in losses. Such losses could occur under various circumstances, including if a counterparty does not perform its obligations under the derivative arrangement, the hedge is imperfect, commodity prices move unfavorably related to our physical or financial positions or hedging policies and procedures are not followed.
Our revenues depend on our customers’ ability to use our pipelines and third-party pipelines over which we have no control.
Our natural gas transportation, storage and NGL businesses depend, in part, on our customers’ ability to obtain access to pipelines to deliver gas to us and receive gas from us. Many of these pipelines are owned by parties not affiliated with us. Any interruption of service on our pipelines or third-party pipelines due to testing, line repair, reduced operating pressures, or other causes or adverse change in terms and conditions of service could have a material adverse effect on our ability, and the ability of our customers, to transport natural gas to and from our pipelines and facilities and a corresponding material adverse effect on our transportation and storage revenues. In addition, the rates charged by interconnected pipelines for transportation to and from our facilities affect the utilization and value of our storage services. Significant changes in the rates charged by those pipelines or the rates charged by other pipelines with which the interconnected pipelines compete could also have a material adverse effect on our storage revenues.
Shippers using our oil pipelines and terminals are also dependent upon our pipelines and connections to third-party pipelines to receive and deliver crude oil and products. Any interruptions or reduction in the capabilities of these pipelines due to testing, line repair, reduced operating pressures, or other causes could result in reduced volumes transported in our pipelines or through our terminals. Similarly, if additional shippers begin transporting volume over interconnecting oil pipelines, the allocations of pipeline capacity to our existing shippers on these interconnecting pipelines could be reduced, which also could reduce volumes transported in its pipelines or through our terminals. Allocation reductions of this nature are not infrequent and are beyond our control. Any such interruptions or allocation reductions that, individually or in the aggregate, are material or continue for a sustained period of time could have a material adverse effect on our results of operations, financial position, or cash flows.
The inability to continue to access lands owned by third parties could adversely affect our ability to operate and our financial results.
Our ability to operate our pipeline systems on certain lands owned by third parties, will depend on our success in maintaining existing rights-of-way and obtaining new rights-of-way on those lands. We are parties to rights-of-way agreements, permits and licenses authorizing land use with numerous parties, including, private land owners, governmental entities, Native American tribes, rail carriers, public utilities and others. Our ability to secure extensions of existing agreements, permits and licenses is essential to our continuing business operations, and securing additional rights-of-way will be critical to our ability to pursue expansion projects. We cannot provide any assurance that we will be able to maintain access to existing rights-of-way upon the expiration of the current grants, that all of the rights-of-way will be obtained in a timely fashion or that we will acquire new rights-of-way as needed.
Further, whether we have the power of eminent domain for our pipelines varies from state to state, depending upon the type of pipeline and the laws of the particular state and the ownership of the land to which we seek access. When we exercise eminent down rights or negotiate private agreements cases, we must compensate landowners for the use of their property and, in eminent domain actions, such compensation may be determined by a court. The inability to exercise the power of eminent domain could negatively affect our business if we were to lose the right to use or occupy the property on which our pipelines are located. For example, following a recent decision issued in May 2017 by the federal Tenth Circuit Court of Appeals, tribal ownership of even a very small fractional interest in an allotted land, that is, tribal land owned or at one time owned by an individual Indian landowner, bars
condemnation of any interest in the allotment. Consequently, the inability to condemn such allotted lands under circumstances where an existing pipeline rights-of-way may soon lapse or terminate serves as an additional impediment for pipeline operators. Any loss of rights with respect to our real property, through our inability to renew right-of-way contracts or otherwise, could have a material adverse effect on our business, results of operations, financial condition and ability to make cash distributions to you.Unitholders.
Sunoco LP does not own all of the land on which its retail service stations are located, and Sunoco LP leases certain facilities and equipment, and Sunoco LP is subject to the possibility of increased costs to retain necessary land use which could disrupt its operations.
Sunoco LP does not own all of the land on which its retail service stations are located. Sunoco LP has rental agreements for approximately 38.0%of the company, commission agent or dealer operated retail service stations where Sunoco LP currently controls the real estate. Sunoco LP also has rental agreements for certain logistics facilities. As such, Sunoco LP is subject to the possibility of increased costs under rental agreements with landowners, primarily through rental increases and renewals of expired agreements. Sunoco LP is also subject to the risk that such agreements may not be renewed. Additionally, certain facilities and equipment (or parts thereof) used by Sunoco LP are leased from third parties for specific periods. Sunoco LP’s inability to renew leases or otherwise maintain the right to utilize such facilities and equipment on acceptable terms, or the increased costs to maintain such rights, could have a material adverse effect on its financial condition, results of operations and cash flows.
We, Sunoco LP and USAC may not be able to fully execute our growth strategy if we encounter increased competition for qualified assets.
Our strategy contemplates growth through the development and acquisition of a wide range of midstream, transportation, storage and other energy infrastructure assets while maintaining a strong balance sheet. This strategy includes constructing and acquiring additional assets and businesses to enhance our ability to compete effectively and diversify our asset portfolio, thereby providing more stable cash flow. We regularly consider and enter into discussions regarding the acquisition of additional assets and businesses, stand-alone development projects or other transactions that we believe will present opportunities to realize synergies and increase our cash flow.
Consistent with our strategy, we may, from time to time, engage in discussions with potential sellers regarding the possible acquisition of additional assets or businesses. Such acquisition efforts may involve our participation in processes that involve a number of potential buyers, commonly referred to as “auction” processes, as well as situations in which we believe we are the only party or one of a very limited number of potential buyers in negotiations with the potential seller. We cannot give assurance that our acquisition efforts will be successful or that any acquisition will be completed on terms considered favorable to us.
In addition, we are experiencing increased competition for the assets we purchase or contemplate purchasing. Increased competition for a limited pool of assets could result in us losing to other bidders more often or acquiring assets at higher prices, both of which
would limit our ability to fully execute our growth strategy. Inability to execute our growth strategy may materially adversely impact our results of operations.
An impairment of goodwill and intangible assets could reduce our earnings.
As of December 31, 20172019, our consolidated balance sheet reflected $3.12$4.90 billion of goodwill and $5.31$5.70 billion of intangible assets. Goodwill is recorded when the purchase price of a business exceeds the fair value of the tangible and separately measurable intangible net assets. Accounting principles generally accepted in the United States require us to test goodwill for impairment on an annual basis or when events or circumstances occur, indicating that goodwill might be impaired. Long-lived assets such as intangible assets with finite useful lives are reviewed for impairment whenever events or changes in circumstances indicate that the carrying amount may not be recoverable. If we determine that any of our goodwill or intangible assets were impaired, we would be required to take an immediate charge to earnings with a correlative effect on partners’ capital and balance sheet leverage as measured by debt to total capitalization.
During the third quarter of 2019, the Partnership recognized a goodwill impairment of $12 million related to the Southwest Gas operations within the interstate segment primarily due to decreases in projected future revenues and cash flows. During the fourth quarter of 2019, the Partnership recognized a goodwill impairment of $9 million related to our North Central operations within the midstream segment primarily due to changes in assumptions related to projected future revenues and cash flows.
During the fourth quarter of 2018, the Partnership recognized goodwill impairments of $378 million related to our Northeast operations within the midstream segment primarily due to changes in assumptions related to projected future revenues and cash flows from the dates the goodwill was originally recorded. These changes in assumptions reflect delays in the construction of third-party takeaway capacity in the Northeast. During 2018, Sunoco LP recognized a $30 million impairment charge on its contractual rights.
During the fourth quarter of 2017, the Partnership performed goodwill impairment tests on our reporting units and recognized goodwill impairments of $262 million in the interstate transportation and storage segment, $79 million in the NGL and refined products transportation and services segment and $452 million in the all other segment primarily due to changes in assumptions related to projected future revenues and cash flows from the dates the goodwill was originally recorded.
During the fourth quarter of 2016, we performed goodwill impairment tests on our reporting units and2017, Sunoco LP recognized goodwill impairmentsan impairment of $638$102 million in the interstate transportation and storage segment and $32 million in the midstream segment. These goodwill impairments were primarily due to decreases in projected future revenues and cash flows driven by declines in commodity prices and changes in the markets that these assets serve. In 2015, we recorded goodwill impairments of $99 million related to Transwestern due primarily to the market declines in current and expected future commodity prices in the fourth quarter of 2015 and $106 million related to Lone Star Refinery Services due primarily to changes in assumptions related to potential future revenues as well as the market declines in current and expected future commodity prices, as well as $24 million of intangible asset impairments related to Lone Star NGL Refinery Services primarily due to the economic obsolescence identified as a result of expected decrease in future cash flows.on its retail reporting unit.
If we and our subsidiaries do not make acquisitions on economically acceptable terms, our future growth could be limited.
Our results of operations and our ability to grow and to increasemake distributions to Unitholders will depend in part on our ability to make acquisitions that are accretive to our distributable cash flow per unit.
We may be unable to make accretive acquisitions for any of the following reasons, among others:
because we are unable to identify attractive acquisition candidates or negotiate acceptable purchase contracts with them;
because we are unable to raise financing for such acquisitions on economically acceptable terms; or
because we are outbid by competitors, some of which are substantially larger than us and have greater financial resources and lower costs of capital then we do.
Furthermore, even if we consummate acquisitions that we believe will be accretive, those acquisitions may in fact adversely affect our results of operations or result in a decrease in distributable cash flow per unit. Any acquisition involves potential risks, including the risk that we may:
fail to realize anticipated benefits, such as new customer relationships, cost-savings or cash flow enhancements;
decrease our liquidity by using a significant portion of our available cash or borrowing capacity to finance acquisitions;
significantly increase our interest expense or financial leverage if we incur additional debt to finance acquisitions;
encounter difficulties operating in new geographic areas or new lines of business;
incur or assume unanticipated liabilities, losses or costs associated with the business or assets acquired for which we are not indemnified or for which the indemnity is inadequate;
be unable to hire, train or retrain qualified personnel to manage and operate our growing business and assets;
less effectively manage our historical assets, due to the diversion of management’s attention from other business concerns; or
incur other significant charges, such as impairment of goodwill or other intangible assets, asset devaluation or restructuring charges.
If we consummate future acquisitions, our capitalization and results of operations may change significantly. As we determine the application of our funds and other resources, Unitholders will not have an opportunity to evaluate the economic, financial and other relevant information that we will consider.
Integration of assets acquired in past acquisitions or future acquisitions with our existing business will be a complex and time-consuming process. A failure to successfully integrate the acquired assets with our existing business in a timely manner may have a material adverse effect on our business, financial condition, results of operations or cash available for distribution to our unitholders.Unitholders.
The difficulties of integrating past and future acquisitions with our business include, among other things:
operating a larger combined organization in new geographic areas and new lines of business;
hiring, training or retaining qualified personnel to manage and operate our growing business and assets;
integrating management teams and employees into existing operations and establishing effective communication and information exchange with such management teams and employees;
diversion of management’s attention from our existing business;
assimilation of acquired assets and operations, including additional regulatory programs;
loss of customers or key employees;
maintaining an effective system of internal controls in compliance with the Sarbanes-Oxley Act of 2002 as well as other regulatory compliance and corporate governance matters; and
integrating new technology systems for financial reporting.
If any of these risks or other unanticipated liabilities or costs were to materialize, then desired benefits from past acquisitions and future acquisitions resulting in a negative impact to our future results of operations. In addition, acquired assets may perform at levels below the forecasts used to evaluate their acquisition, due to factors beyond our control. If the acquired assets perform at levels below the forecasts, then our future results of operations could be negatively impacted.
Also, our reviews of proposed business or asset acquisitions are inherently imperfect because it is generally not feasible to perform an in-depth review of each such proposal given time constraints imposed by sellers. Even if performed, a detailed review of assets and businesses may not reveal existing or potential problems, and may not provide sufficient familiarity with such business or assets to fully assess their deficiencies and potential. Inspections may not be performed on every asset, and environmental problems, may not be observable even when an inspection is undertaken.
If we do not continue to construct new pipelines, our future growth could be limited.
Our results of operations and ability to grow and to increase distributable cash flow per unit will depend, in part, on our ability to construct pipelines that are accretive to our distributable cash flow. We may be unable to construct pipelines that are accretive to distributable cash flow for any of the following reasons, among others:
we are unable to identify pipeline construction opportunities with favorable projected financial returns;
we are unable to obtain necessary governmental approvals and contracts with qualified contractors and vendors on acceptable terms;
we are unable to raise financing for our identified pipeline construction opportunities; or
we are unable to secure sufficient transportation commitments from potential customers due to competition from other pipeline construction projects or for other reasons.
Furthermore, even if we construct a pipeline that we believe will be accretive, the pipeline may in fact adversely affect our results of operations or results from those projected prior to commencement of construction and other factors.
Expanding our business by constructing new pipelines and related facilities subjects us to risks.
One of the ways that we have grown our business is through the construction of additions to our existing gathering, compression, treating, processing and transportation systems. The construction of new pipelines and related facilities (or the improvement and repair of existing facilities) involves numerous regulatory, environmental, political and legal uncertainties beyond our control and requires the expenditure of significant amounts of capital that we will be required to finance through borrowings, the issuance of additional equity or from operating cash flow. If we undertake these projects, they may not be completed on schedule, at all, or at the budgeted cost. A variety of factors outside our control, such as weather, natural disasters and difficulties in obtaining permits
and rights-of-way or other regulatory approvals, as well as the performance by third-party contractors, may result in increased costs or delays in construction. Cost overruns or delays in completing a project could have a material adverse effect on our results of operations and cash flows. Moreover, our revenues may not increase immediately following the completion of a particular project. For instance, if we build a new pipeline, the construction will occur over an extended period of time, but we may not materially increase our revenues until long after the project’s completion. In addition, the success of a pipeline construction project will likely depend upon the level of oil and natural gas exploration and development drilling activity and the demand for pipeline transportation in the areas proposed to be serviced by the project as well as our ability to obtain commitments from producers in the area to utilize the newly constructed pipelines. In this regard, we may construct facilities to capture anticipated future growth in oil or natural gas production in a region in which such growth does not materialize. As a result, new facilities may be unable to attract enough throughput or contracted capacity reservation commitments to achieve our expected investment return, which could adversely affect our results of operations and financial condition.
We depend on certain key producers for our supply of natural gas and the loss of any of these key producers could adversely affect our financial results.
Certain producers who are connected to our systems represent a material source of our supply of natural gas. We are not the only option available to these producers for disposition of the natural gas they produce. To the extent that these and other producers may reduce the volumes of natural gas that they supply us, we would be adversely affected unless we were able to acquire comparable supplies of natural gas from other producers.
Our intrastate transportation and storage and interstate transportation and storage operations depend on key customers to transport natural gas through our pipelines and the pipelines of our joint ventures.
During 2017,2019, Trafigura US Inc., KMI, and Calpine Energy Services L.P. collectively accounted for approximately 36%33% of our intrastate transportation and storage revenues. During 2017, Chesapeake Energy Marketing, Inc., EnCana Marketing (USA), Inc.2019, Shell, Ascent Resources LLC and Shell Energy North America (US), L.P.,Antero Resources Corporation collectively accounted for 19%41% of our interstate transportation and storage revenues.
Our joint ventures, FEP and Citrus, also depend on key customers for the transport of natural gas through their pipelines. FEP has a small number of major shippers with one shipper accounting for approximately 64%54% of its revenues in 20172019 while Citrus has long-term agreements with its top twothree customers which accounted for 61%58% of its 20172019 revenue. For Trans-Pecos and Comanche Trail, CFE International LLC is the sole shipper.
The failure of the major shippers on our and our joint ventures’ intrastate and interstate transportation and storage pipelines to fulfill their contractual obligations could have a material adverse effect on our cash flow and results of operations if we or our joint ventures were unable to replace these customers under arrangements that provide similar economic benefits as these existing contracts.
Our storage operations are influenced by the overall forward market for crude oil and other products we store, and certain market conditions may adversely affect its financial and operating results.
Our storage operations are influenced by the overall forward market for crude oil and other products we store. A contango market (meaning that the price of crude oil or other products for future delivery is higher than the current price) is associated with greater demand for storage capacity, because a party can simultaneously purchase crude oil or other products at current prices for storage and sell at higher prices for future delivery. A backwardated market (meaning that the price of crude oil or other products for future delivery is lower than the current price) is associated with lower demand for storage capacity because a party can capture a premium for prompt delivery of crude oil or other products rather than storing it for future sale. A prolonged backwardated market, or other adverse market conditions, could have an adverse impact on its ability to negotiate favorable prices under new or renewing storage contracts, which could have an adverse impact on our storage revenues. As a result, the overall forward market for crude oil or other products may have an adverse effect on our financial condition or results of operations.
An increase in interest rates could impact demand for our storage capacity.
There is a financing cost for a storage capacity user to own crude oil while it is stored. That financing cost is impacted by the cost of capital or interest rate incurred by the storage user, in addition to the commodity cost of the crude oil in inventory. Absent other factors, a higher financing cost adversely impacts the economics of storing crude oil for future sale. As a result, a significant increase in interest rates could adversely affect the demand for our storage capacity independent of other market factors.
Increasing levels of congestion in the Houston Ship Channel could result in a diversion of business to less busy ports.
Our Gulf Coast facilities are strategically situated on prime real estate located in the Houston Ship Channel, which is in close proximity to both supply sources and demand sources. In recent years, the success of the Port of Houston has led to an increase in vessel traffic driven in part by the growing overseas demand for U.S. crude, gasoline, liquefied natural gas and petrochemicals and in part by the Port of Houston’s recent decision to accept large container vessels, which can restrict the flow of other cargo. Increasing congestion in the Port of Houston could cause our customers or potential customers to divert their business to smaller ports in the Gulf of Mexico, which could result in lower utilization of our facilities.
Increased regulation of hydraulic fracturing or produced water disposal could result in reductions or delays in crude oil and natural gas production in our areas of operation, which could adversely impact its business and results of operations.
The hydraulic fracturing process has come under considerable scrutiny from sections of the public as well as environmental and other groups asserting that chemicals used in the hydraulic fracturing process could adversely affect drinking water supplies and may have other detrimental impacts on public health, safety, welfare and the environment. In addition, the water disposal process has come under scrutiny from sections of the public as well as environmental and other groups asserting that the operation of certain water disposal wells has caused increased seismic activity. The adoption of new laws or regulations imposing additional permitting, disclosures, restrictions or costs related to hydraulic fracturing or produced water disposal or prohibiting hydraulic fracturing in proximity to areas considered to be environmentally sensitive could make drilling certain wells impossible or less economically attractive. As a result, the volume of crude oil and natural gas we gather, transport and store for our customers could be substantially reduced which could have an adverse effect on our financial condition or results of operations.
Competition for water resources or limitations on water usage for hydraulic fracturing could disrupt crude oil and natural gas production from shale formations.
Hydraulic fracturing is the process of creating or expanding cracks by pumping water, sand and chemicals under high pressure into an underground formation in order to increase the productivity of crude oil and natural gas wells. Water used in the process is generally fresh water, recycled produced water or salt water. There is competition for fresh water from municipalities, farmers, ranchers and industrial users. In addition, the available supply of fresh water can also be reduced directly by drought. Prolonged drought conditions increase the intensity of competition for fresh water. Limitations on oil and gas producers’ access to fresh water may restrict their ability to use hydraulic fracturing and could reduce new production. Such disruptions could potentially have a material adverse impact on our financial condition or results of operations.
Our interstate natural gas pipelines are subject to laws, regulations and policies governing the rates they are allowed to charge for their services, which may prevent us from fully recovering our costs.
Laws, regulations and policies governing interstate natural gas pipeline rates could affect the ability of our interstate pipelines to establish rates, to charge rates that would cover future increases in its costs, or to continue to collect rates that cover current costs.
We are required to file tariff rates (also known as recourse rates) with the FERC that shippers may pay for interstate natural gas transportation services. We may also agree to discount these rates on a not unduly discriminatory basis or negotiate rates with shippers who elect not to pay the recourse rates. The FERC must approve or accept all rate filings for us to be allowed to charge such rates.
The FERC may review existing tariff rates on its own initiative or upon receipt of a complaint filed by a third party. The FERC may, on a prospective basis, order refunds of amounts collected if it finds the rates to have been shown not to be just and reasonable or to have been unduly discriminatory. The FERC has recently exercised this authority with respect to several other pipeline companies. If the FERC were to initiate a proceeding against us and find that our rates were not just and reasonable or unduly discriminatory, the maximum rates we are permitted to charge may be reduced and the reduction could have an adverse effect on our revenues and results of operations.
The costs of our interstate pipeline operations may increase and we may not be able to recover all of those costs due to FERC regulation of our rates. If we propose to change our tariff rates, our proposed rates may be challenged by the FERC or third parties, and the FERC may deny, modify or limit our proposed changes if we are unable to persuade the FERC that changes would result in just and reasonable rates that are not unduly discriminatory. We also may be limited by the terms of rate case settlement agreements or negotiated rate agreements with individual customers from seeking future rate increases, or we may be constrained by competitive factors from charging our tariff rates.
To the extent our costs increase in an amount greater than our revenues increase, or there is a lag between our cost increases and our ability to file for and obtain rate increases, our operating results would be negatively affected. Even if a rate increase is permitted by the FERC to become effective, the rate increase may not be adequate. We cannot guarantee that our interstate pipelines will be able to recover all of our costs through existing or future rates.
The ability of interstate pipelines held in tax-pass-through entities, like us, to include an allowance for income taxes as a cost-of-service element in their regulated rates has been subject to extensive litigation before the FERC and the courts for a number of years. It is currently the FERC’s policy to permit pipelines to include in cost-of-service a tax allowance to reflect actual or potential income tax liability on their public utility income attributable to all partnership or limited liability company interests, to the extent that the ultimate owners have an actual or potential income tax liability on such income. Whether a pipeline’s owners have such actual or potential income tax liability will be reviewed by the FERC on a case-by-case basis. Under the FERC’s policy, we thus remain eligible to include an income tax allowance in the tariff rates we charge for interstate natural gas transportation. On December 15, 2016, FERC issued a Notice of Inquiry requesting energy industry input on how FERC should address income tax allowances in cost-based rates proposed by pipeline companies organized as part of a master limited partnership. FERC issued the Notice of Inquiry in response to a remand from the United States Court of Appeals for the D.C. Circuit in United Airlines v. FERC, in which the court determined that FERC had not justified its conclusion that an oil pipeline organized as a partnership would not “double recover” its taxes under the current policy by both including a tax allowance in its cost-based rates and earning a return on equity calculated on a pre-tax basis. FERC requested comments regarding how to address any double recovery resulting from the Commission’s current income tax allowance and rate of return policies. The comment period with respect to the notice of inquiry ended on April 7, 2017. The outcome of the inquiry is still pending. We cannot predict whether FERC will successfully justify its conclusion that there is no double recovery of taxes under these circumstances or whether FERC will modify its current policy on either income tax allowances or return on equity calculations for pipeline companies organized as part of a master limited partnership. However, any modification that reduces or eliminates an income tax allowance for pipeline companies organized as part of a master limited partnership or decreases the return on equity for such pipelines could result in an adverse impact on our revenues associated with the transportation and storage services we provide pursuant to cost-based rates.
Effective January 2018, the 2017 Tax Cuts and Jobs Act (the “Tax Act”) changed several provisions of the federal tax code, including a reduction in the maximum corporate tax rate. FollowingOn March 15, 2018, in a set of related proposals, the 2017 Tax CutsFERC addressed treatment of federal income tax allowances in regulated entity rates. The FERC issued a Revised Policy Statement on Treatment of Income Taxes (“Revised Policy Statement”) stating that it will no longer permit master limited partnerships to recover an income tax allowance in their cost of service rates. The FERC issued the Revised Policy Statement in response to a remand from the United States Court of Appeals for the District of Columbia Circuit in United Airlines v. FERC, in which the court determined that the FERC had not justified its conclusion that a pipeline organized as a master limited partnership would not “double recover” its taxes under the current policy by both including an income-tax allowance in its cost of service and Jobs Act being signed into law, filingsearning a return on equity calculated using the discounted cash flow methodology. On July 18, 2018, the FERC issued an order denying requests for rehearing and clarification of its Revised Policy Statement because it is a non-binding policy and parties will have been made atthe opportunity to address the policy as applied in future cases. In the rehearing order, the FERC requestingclarified that FERC require pipelinesa pipeline organized as a master limited partnership will not be precluded in a future proceeding from arguing and providing evidentiary support that it is entitled to lower their transportation rates to accountan income tax allowance and demonstrating that its recovery of an income tax allowance does not result in a double-recovery of investors’ income tax costs.
Included in the March 15, 2018 proposals is a Notice of Proposed Rulemaking (“NOPR”) proposing rules for lower taxes. Following the effective dateimplementation of the law,Revised Policy Statement and the corporate income tax rate reduction with respect to natural gas pipeline rates. On July 18, 2018, the FERC orders granting certificates to constructissued a Final Rule (Order No. 849) adopting procedures that are generally the same as proposed pipeline facilitiesin the NOPR with a few clarifications and modifications. With limited exceptions, the Final Rule requires all FERC-regulated natural gas pipelines that have directed pipelines proposing newcost-based rates for service to make a one-time Form No. 501-G filing providing certain financial information and to make an election on those facilitieshow to re-file suchtreat its existing rates. The Final Rule suggests that this information will allow the FERC and
other stakeholders to evaluate the impacts of the Tax Act and the Revised Policy Statement on each individual pipeline’s rates. The Final Rule also requires that each FERC-regulated natural gas pipeline select one of four options: file a limited Natural Gas Act (“NGA”) Section 4 filing reducing its rates soonly as required related to the Tax Act and the Revised Policy Statement, commit to filing a general NGA Section 4 rate case in the near future, file a statement explaining why an adjustment to rates is not needed, or take no other action. For the limited NGA Section 4 option, the FERC clarified that, notwithstanding the Revised Policy Statement, a pipeline organized as a master limited partnership does not need to eliminate its income tax allowance but, instead, can reduce its rates to reflect the reduction in the maximum corporate tax rate,rate. Trunkline, ETC Tiger and Panhandle filed their respective FERC has issued data requests in pending certificate proceedings for proposed pipeline facilities requesting pipelines to explain the impacts of the reduction in the corporate tax rateForm No. 501-Gs on the rate proposals in those proceedingsOctober 11, 2018. FEP, Lake Charles LNG and to provide re-calculated initial rates for servicecertain other operating subsidiaries filed their respective FERC Form No. 501-Gs on the proposed pipeline facilities.or about November 8, 2018. Rover, FGT, Transwestern and MEP filed their respective FERC may enact other regulationsForm No. 501-Gs on or issue further requests to pipelines regarding the impact of the corporate tax rate change on the rates. The FERC’s establishment of a just and reasonable rate is based on many components, and the reduction in the corporate tax rate may impact two of such components: the allowance for income taxes and the amount for accumulated deferred income taxes.about December 6, 2018. Because our existing jurisdictional rates were established based on a higher corporate tax rate, the FERC or our shippers may challenge these rates in the future, and the resulting new rate may be lower than the rates we currently charge. For example, the FERC has recently initiated reviews of Panhandle’s and Southwest Gas Storage Company’s existing rates pursuant to Section 5 of the Natural Gas Act to determine whether the rates currently charged are just and reasonable. These reviews will require the filing of a cost and revenue study prior to the FERC issuing a decision.
Our interstate natural gas pipelines are subject to laws, regulations and policies governing terms and conditions of service, which could adversely affect our business and results of operations.
In addition to rate oversight, the FERC’s regulatory authority extends to many other aspects of the business and operations of our interstate natural gas pipelines, including:
terms and conditions of service;
the types of services interstate pipelines may or must offer their customers;
construction of new facilities;
acquisition, extension or abandonment of services or facilities;
reporting and information posting requirements;
accounts and records; and
relationships with affiliated companies involved in all aspects of the natural gas and energy businesses.
Compliance with these requirements can be costly and burdensome. In addition, we cannot guarantee that the FERC will authorize tariff changes and other activities we might propose and to undertake in a timely manner and free from potentially burdensome conditions. Future changes to laws, regulations, policies and interpretations thereof may impair our access to capital markets or
may impair the ability of our interstate pipelines to compete for business, may impair their ability to recover costs or may increase the cost and burden of operation.
The current FERC Chairman announced in December 2017 that the FERC will review its policies on certification of natural gas pipelines, including an examination of its long-standing Policy Statement on Certification of New Interstate Natural Gas Pipeline Facilities, issued in 1999, that is used to determine whether to grant certificates for new pipeline projects. We are unable to predict what, if any, changes may be proposed that will affect our natural gas pipeline business or when such proposals, if any, might become effective. We do not expect that any change in this policy would affect us in a materially different manner than any other similarly sized natural gas pipeline company operating in the United States.
Rate regulation or market conditions may not allow us to recover the full amount of increases in the costs of our crude oil, NGL and refined products pipeline operations.
Transportation provided on our common carrier interstate crude oil, NGL and refined products pipelines is subject to rate regulation by the FERC, which requires that tariff rates for transportation on these oil pipelines be just and reasonable and not unduly discriminatory. If we propose new or changed rates, the FERC or interested persons may challenge those rates and the FERC is authorized to suspend the effectiveness of such rates for up to seven months and to investigate such rates. If, upon completion of an investigation, the FERC finds that the proposed rate is unjust or unreasonable, it is authorized to require the carrier to refund revenues in excess of the prior tariff during the term of the investigation. The FERC also may investigate, upon complaint or on its own motion, rates that are already in effect and may order a carrier to change its rates prospectively. Upon an appropriate showing, a shipper may obtain reparations for damages sustained for a period of up to two years prior to the filing of a complaint.
The primary ratemaking methodology used by the FERC to authorize increases in the tariff rates of petroleum pipelines is price indexing. The FERC’s ratemaking methodologies may limit our ability to set rates based on our costs or may delay the use of rates that reflect increased costs. In October 2016, the FERC issued an Advance Notice of Proposed Rulemaking seeking comment on a number of proposals, including: (1) whether the Commission should deny any increase in a rate ceiling or annual index-basedindex-
based rate increase if a pipeline’s revenues exceed total costs by 15% for the prior two years; (2) a new percentage comparison test that would deny a proposed increase to a pipeline’s rate or ceiling level greater than 5% above the barrel-mile cost changes; and (3) a requirement that all pipelines file indexed ceiling levels annually, with the ceiling levels subject to challenge and restricting the pipeline’s ability to carry forward the full indexed increase to a future period. The comment period with respect to the proposed rules ended March 17, 2017. The FERC has not yet taken any further action on the proposed rule. If the FERC’s indexing methodology changes, the new methodology could materially and adversely affect our financial condition, results of operations or cash flows.
Under the EPActEnergy Policy Act of 1992, certain interstate pipeline rates were deemed just and reasonable or “grandfathered.” Revenues are derived from such grandfathered rates on most of our FERC-regulated pipelines. A person challenging a grandfathered rate must, as a threshold matter, establish a substantial change since the date of enactment of the Energy Policy Act, in either the economic circumstances or the nature of the service that formed the basis for the rate. If the FERC were to find a substantial change in circumstances, then the existing rates could be subject to detailed review and there is a risk that some rates could be found to be in excess of levels justified by the pipeline’s costs. In such event, the FERC could order us to reduce pipeline rates prospectively and to pay refunds to shippers.
If the FERC’s petroleum pipeline ratemaking methodologies procedures changes, the new methodology or procedures could adversely affect our business and results of operations.
State regulatory measures could adversely affect the business and operations of our midstream and intrastate pipeline and storage assets.
Our midstream and intrastate transportation and storage operations are generally exempt from FERC regulation under the NGA, but FERC regulation still significantly affects our business and the market for our products. The rates, terms and conditions of service for the interstate services we provide in our intrastate gas pipelines and gas storage are subject to FERC regulation under Section 311 of the NGPA. Our HPL System, East Texas pipeline, Oasis pipeline and ET Fuel System provide such services. Under Section 311, rates charged for transportation and storage must be fair and equitable. Amounts collected in excess of fair and equitable rates are subject to refund with interest, and the terms and conditions of service, set forth in the pipeline’s statement of operating conditions, are subject to FERC review and approval. Should the FERC determine not to authorize rates equal to or greater than our costs of service, our cash flow would be negatively affected.
Our midstream and intrastate gas and oil transportation pipelines and our intrastate gas storage operations are subject to state regulation. All of the states in which we operate midstream assets, intrastate pipelines or intrastate storage facilities have adopted some form of complaint-based regulation, which allow producers and shippers to file complaints with state regulators in an effort to resolve grievances relating to the fairness of rates and terms of access. The states in which we operate have ratable take statutes, which generally require gatherers to take, without undue discrimination, production that may be tendered to the gatherer for
handling. Similarly, common purchaser statutes generally require gatherers to purchase without undue discrimination as to source of supply or producer. These statutes have the effect of restricting our right as an owner of gathering facilities to decide with whom we contract to purchase or transport natural gas. Should a complaint be filed in any of these states or should regulation become more active, our business may be adversely affected.
Our intrastate transportation operations located in Texas are also subject to regulation as gas utilities by the TRRC. Texas gas utilities must publish the rates they charge for transportation and storage services in tariffs filed with the TRRC, although such rates are deemed just and reasonable under Texas law unless challenged in a complaint.
We are subject to other forms of state regulation, including requirements to obtain operating permits, reporting requirements, and safety rules (see description of federal and state pipeline safety regulation below). Violations of state laws, regulations, orders and permit conditions can result in the modification, cancellation or suspension of a permit, civil penalties and other relief.
Certain of our assets may become subject to regulation.
The distinction between federally unregulated gathering facilities and FERC-regulated transmission pipelines under the NGA has been the subject of extensive litigation and may be determined by the FERC on a case-by-case basis, although the FERC has made no determinations as to the status of our facilities. Consequently, the classification and regulation of our gathering facilities could change based on future determinations by the FERC, the courts or Congress. If our gas gathering operations become subject to FERC jurisdiction, the result may adversely affect the rates we are able to charge and the services we currently provide, and may include the potential for a termination of our gathering agreements with our customers.
Intrastate transportation of NGLs is largely regulated by the state in which such transportation takes place. Lone Star’s NGL Pipeline transports NGLs within the state of Texas and is subject to regulation by the TRRC. This NGLs transportation system offers services pursuant to an intrastate transportation tariff on file with the TRRC. In 2013, Lone Star’s NGL pipeline also
commenced the interstate transportation of NGLs, which is subject to the FERC’s jurisdiction under the Interstate Commerce Act and the Energy Policy Act of 1992. Both intrastate and interstate NGL transportation services must be provided in a manner that is just, reasonable, and non-discriminatory. The tariff rates established for interstate services were based on a negotiated agreement; however, if the FERC’s ratemaking methodologies were imposed, they may, among other things, delay the use of rates that reflect increased costs and subject us to potentially burdensome and expensive operational, reporting and other requirements. In addition, the rates, terms and conditions for shipments of crude oil, petroleum products and NGLs on our pipelines are subject to regulation by the FERC if the NGLs are transported in interstate or foreign commerce, whether by our pipelines or other means of transportation. Since we do not control the entire transportation path of all crude oil, petroleum products and NGLs on our pipelines, FERC regulation could be triggered by our customers’ transportation decisions.
In addition, if any of our pipelines were found to have provided services or otherwise operated in violation of the NGA, NGPA, or ICA, this could result in the imposition of administrative and criminal remedies and civil penalties, as well as a requirement to disgorge charges collected for such services in excess of the rate established by the FERC. Any of the foregoing could adversely affect revenues and cash flow related to these assets.
We may incur significant costs and liabilities resulting from performance of pipeline integrity programs and related repairs.
Pursuant to authority under the NGPSA and HLPSA, PHMSA has established a series of rules requiring pipeline operators to develop and implement integrity management programs for natural gas transmission and hazardous liquid pipelines that, in the event of a pipeline leak or rupture, could affect HCAs which are areas where a release could have the most significant adverse consequences, including high population areas, certain drinking water sources, and unusually sensitive ecological areas. These regulations require operators of covered pipelines to:
perform ongoing assessments of pipeline integrity;
identify and characterize applicable threats to pipeline segments that could impact a high consequence area;
improve data collection, integration and analysis;
repair and remediate the pipeline as necessary; and
implement preventive and mitigating actions.
In addition, states have adopted regulations similar to existing PHMSA regulations for intrastate gathering and transmission lines. At this time, we cannot predict the ultimate cost of compliance with applicable pipeline integrity management regulations, as the cost will vary significantly depending on the number and extent of any repairs found to be necessary as a result of the pipeline integrity testing. We will continue our pipeline integrity testing programs to assess and maintain the integrity of our pipelines. The results of these tests could cause us to incur significant and unanticipated capital and operating expenditures for repairs or upgrades
deemed necessary to ensure the continued safe and reliable operation of our pipelines. Any changes to pipeline safety laws by Congress and regulations by PHMSA that result in more stringent or costly safety standards could have a significant adverse effect on us and similarly situated midstream operators. For example, in January 2017, PHMSA issued a final rule for hazardous liquid pipelines that significantly expands the reach of certain PHMSA integrity management requirements, such as, for example, periodic assessments, leak detection and repairs, regardless of the pipeline’s proximity to a HCA. The final rule also imposes new reporting requirements for certain unregulated pipelines, including all hazardous liquid gathering lines. However, the date of implementation of this final rule by publication in the Federal Register is uncertain given the recent change in Presidential Administrations.administrations. In a second example, in April 2016, PHMSA published a proposed rulemaking that would impose new or more stringent requirements for certain natural gas lines and gathering lines including, among other things, expanding certain of PHMSA’s current regulatory safety programs for natural gas pipelines in newly defined “moderate consequence areas” that contain as few as 5 dwellings within a potential impact area; requiring gas pipelines installed before 1970 and thus excluded from certain pressure testing obligations to be tested to determine their maximum allowable operating pressure (“MAOP”); and requiring certain onshore and offshore gathering lines in Class I areas to comply with damage prevention, corrosion control, public education, MAOP limits, line markers and emergency planning standards. Additional requirements proposed by this proposed rulemaking would increase PHMSA’s integrity management requirements and also require consideration of seismicity in evaluating threats to pipelines. In 2018, PHMSA announced its intention to divide the original proposed rulemaking into three parts and issue three separate final rulemakings in 2019. In October 2019, PHMSA submitted three major rules to the Federal Register, including rules focused on: the safety of gas transmission pipelines (the first of three parts of the so-called gas Mega Rule), the safety of hazardous liquid pipelines, and enhanced emergency order procedures. The gas transmission rule requires operators of gas transmission pipelines constructed before 1970 to determine the material strength of their lines by reconfirming MAOP. In addition, the rule updates reporting and records retention standards for gas transmission pipelines. PHMSA is expected to issue the second and third parts of the gas Mega Rule in the near future. The safety and hazardous liquid pipelines rule would extend leak detection requirements to all non-gathering hazardous liquid pipelines and require operators to inspect affected pipelines following extreme weather events or natural disasters to address any resulting damage. Finally, the enhanced emergency procedures rule focuses on increased emergency
safety measures. In particular, this rule increases the authority of PHMSA to issue an emergency order that addresses unsafe conditions or hazards that pose an imminent threat to pipeline safety. The changes adopted or proposed by these rulemakings or made in future legal requirements could have a material adverse effect on our results of operations and costs of transportation services.
Federal and state legislative and regulatory initiatives relating to pipeline safety that require the use of new or more stringent safety controls or result in more stringent enforcement of applicable legal requirements could subject us to increased capital costs, operational delays and costs of operation.
The NGPSA and HLPSA were amended by the 2011 Pipeline Safety Act. Among other things, the 2011 Pipeline Safety Act increased the penalties for safety violations and directed the Secretary of Transportation to promulgate rules or standards relating to expanded integrity management requirements, automatic or remote-controlled valve use, excess flow valve use, leak detection system installation, testing to confirm that the material strength of certain pipelines are above 30% of specified minimum yield strength, and operator verification of records confirming the MAOP of certain interstate natural gas transmission pipelines. Effective April 27, 2017,In July 2019, PHMSA issued a final rule increasing the maximum administrative fines for safety violations were increased to account for inflation, with maximum civil penalties set at $209,002$218,647 per day, with a maximum of $2,090,022$2,186,465 for a series of violations. In June 2016, the 2016 Pipeline Safety Act was passed, extending PHMSA’s statutory mandate through 2019 and, among other things, requiring PHMSA to complete certain of its outstanding mandates under the 2011 Pipeline Safety Act and developing new safety standards for natural gas storage facilities, by June 22, 2018.which were issued in January 2020. The 2016 Pipeline Safety Act also empowers PHMSA to address imminent hazards by imposing emergency restrictions, prohibitions and safety measures on owners and operators of natural gas or hazardous liquid pipeline facilities without prior notice or an opportunity for a hearing. PHMSA issued interim regulations in October 2016 to implement the agency’s expanded authority to address unsafe pipeline conditions or practices that pose an imminent hazard to life, property, or the environment. In 2018, PHMSA announced its intention to divide the original proposed rulemaking into three parts and issue three separate final rulemakings in 2019. In October 2019, PHMSA submitted the first of the three parts of the so-called gas Mega Rule to the Federal Register. That rule, application to gas transmission pipelines, requires operators of gas transmission pipelines constructed before 1970 to determine the material strength of their lines by reconfirming MAOP. In addition, the rule updates reporting and records retention standards for gas transmission pipelines. This rule will take effect on July 1, 2020. PHMSA is then expected to issue the second part of the Mega Rule focusing on repair criteria in HCAs and creating new repair criteria for non-HCAs, requirements for inspecting pipelines following extreme events, updates to pipeline corrosion control requirements, and various other integrity management requirements. PHMSA is expected to subsequently issue the final part of the gas Mega Rule, the Gas Gathering Rule, focusing on requirements relating to gas gathering lines. The safety enhancement requirements and other provisions of the 2011 Pipeline Safety Act, as further amended by the 2016 Pipeline Safety Act, as well as any implementation of PHMSA rules thereunder or any issuance or reinterpretation of guidance by PHMSA or any state agencies with respect thereto, could require us to install new or modified safety controls, pursue additional capital projects, or conduct maintenance programs on an accelerated basis, any or all of which tasks could result in our incurring increased operating costs that could be significant and have a material adverse effect on our results of operations or financial condition.
Our business involves the generation, handling and disposal of hazardous substances, hydrocarbons and wastes which activities are subject to environmental and worker health and safety laws and regulations that may cause us to incur significant costs and liabilities.
Our business is subject to stringent federal, tribal state, and local laws and regulations governing the discharge of materials into the environment, worker health and safety and protection of the environment. These laws and regulations may require the acquisition of permits for the construction and operation of our pipelines, plants and facilities, result in capital expenditures to manage, limit or prevent emissions, discharges or releases of various materials from our pipelines, plants and facilities, impose specific health and safety standards addressing worker protection, and impose substantial liabilities for pollution resulting from our construction and operations activities. Several governmental authorities, such as the EPA and analogous state agencies have the power to enforce compliance with these laws and regulations and the permits issued under them and frequently mandate difficult and costly remediation measures and other actions. Failure to comply with these laws, regulations and permits may result in the assessment of significant administrative, civil and criminal penalties, the imposition of investigatory remedial and corrective action obligations, the occurrence of delays in permitting and completion of projects, and the issuance of injunctive relief. Certain environmental laws impose strict, joint and several liability for costs required to clean up and restore sites where hazardous substances, hydrocarbons or wastes have been disposed or released, even under circumstances where the substances, hydrocarbons or wastes have been released by a predecessor operator. Moreover, it is not uncommon for neighboring landowners and other third parties
to file claims for personal injury and property and natural resource damage allegedly caused by noise, odor or the release of hazardous substances, hydrocarbons or wastes into the environment.
We may incur substantial environmental costs and liabilities because of the underlying risk arising out of our operations. Although we have established financial reserves for our estimated environmental remediation liabilities, additional contamination or
conditions may be discovered, resulting in increased remediation costs, liabilities or natural resource damages that could substantially increase our costs for site remediation projects. Accordingly, we cannot assure you that our current reserves are adequate to cover all future liabilities, even for currently known contamination.
Changes in environmental laws and regulations occur frequently, and any such changes that result in more stringent and costly waste handling, emission standards, or storage, transport, disposal or remediation requirements could have a material adverse effect on our operations or financial position. For example, in October 2015, the EPA published a final rule under the Clean Air Act, lowering the NAAQS for ground-level ozone to 70 parts per billion for the 8-hour primary and secondary ozone standards. The EPA published a final rule in November 2017 that issued area designations with respect to ground-level ozone for approximately 85% of the United States counties as either “attainment/unclassifiable” or “unclassifiable” and is expected to issue“unclassifiable.” The EPA finalized its non-attainment designations for the remaining areas of the United States not addressed under the November 2017 final rule in the first halfApril and July of 2018. Reclassification of areas or imposition of more stringent standards may make it more difficult to construct new or modified sources of air pollution in newly designated non-attainment areas. Also, states are expected to implement more stringent requirements as a result of this new final rule, which could apply to our customers’ operations. Compliance with this final rule or any other new regulations could, among other things, require installation of new emission controls on some of our equipment, result in longer permitting timelines or new restrictions or prohibitions with respect to permits or projects, and significantly increase our capital expenditures and operating costs, which could adversely impact our business. Historically, we have been able to satisfy the more stringent nitrogen oxide emission reduction requirements that affect our compressor units in ozone non-attainment areas at reasonable cost, but there is no assurance that we will not incur material costs in the future to meet the new, more stringent ozone standard.
Regulations under the Clean Water Act, OPA and state laws impose regulatory burdens on terminal operations. Spill prevention control and countermeasure requirements of federal and state laws require containment to mitigate or prevent contamination of waters in the event of a refined product overflow, rupture, or leak from above-ground pipelines and storage tanks. The Clean Water Act also requires us to maintain spill prevention control and countermeasure plans at our terminal facilities with above-ground storage tanks and pipelines. In addition, OPA requires that most fuel transport and storage companies maintain and update various oil spill prevention and oil spill contingency plans. Facilities that are adjacent to water require the engagement of Federally Certified Oil Spill Response Organizations (“OSRO”s) to be available to respond to a spill on water from above-ground storage tanks or pipelines.
Transportation and storage of refined products over and adjacent to water involves risk and potentially subjects us to strict, joint, and potentially unlimited liability for removal costs and other consequences of an oil spill where the spill is into navigable waters, along shorelines or in the exclusive economic zone of the United States. In the event of an oil spill into navigable waters, substantial liabilities could be imposed upon us. The Clean Water Act imposes restrictions and strict controls regarding the discharge of pollutants into navigable waters, with the potential of substantial liability for the violation of permits or permitting requirements.
Terminal operations and associated facilities are subject to the Clean Air Act as well as comparable state and local statutes. Under these laws, permits may be required before construction can commence on a new source of potentially significant air emissions, and operating permits may be required for sources that are already constructed. If regulations become more stringent, additional emission control technologies
Product liability claims and litigation could adversely affect our business and results of operations.
Product liability is a significant commercial risk. Substantial damage awards have been made in certain jurisdictions against manufacturers and resellers based upon claims for injuries caused by the use of or exposure to various products. There can be no assurance that product liability claims against us would not have a material adverse effect on our business or results of operations.
Along with other refiners, manufacturers and sellers of gasoline, ETC Sunoco Inc. is a defendant in numerous lawsuits that allege MTBE contamination in groundwater. Plaintiffs, who include water purveyors and municipalities responsible for supplying drinking water and private well owners, are seeking compensatory damages (and in some cases injunctive relief, punitive damages and attorneys’ fees) for claims relating to the alleged manufacture and distribution of a defective product (MTBE-containing gasoline) that contaminates groundwater, and general allegations of product liability, nuisance, trespass, negligence, violation of environmental laws and deceptive business practices. There has been insufficient information developed about the plaintiffs’ legal theories or the facts that would be relevant to an analysis of the ultimate liability to Sunoco, Inc.ETC Sunoco. An adverse determination of liability related to these allegations or other product liability claims against Sunoco, Inc.ETC Sunoco. could have a material adverse effect on our business or results of operations.
Climate change legislation or regulations restricting emissions of “greenhouse gases”GHGs could result in increased operating costs and reduced demand for the services we provide.
Climate change continues to attract considerable public, governmental and scientific attention. As a result, numerous proposals have been made and are likely to continue to be made at the international, national, regional and state levels of government to monitor and limit emissions of GHGs. These efforts have included consideration of cap-and-trade programs, carbon taxes and GHG reporting and tracking programs, and regulations that directly limit GHG emissions from certain sources. At the federal level, no comprehensive climate change legislation has been implemented to date. The EPA has, however, adopted rules under authority of the Clean Air Act that, among other things, establish PSD construction and Title V operating permit reviews for GHG emissions from certain large stationary sources that are also potential major sources of certain principal, or criteria, pollutant emissions, which reviews could require securing PSD permits at covered facilities emitting GHGs and meeting “best available control technology” standards for those GHG emissions. In addition, the EPA has adopted rules requiring the monitoring and annual reporting of GHG emissions from certain petroleum and natural gas system sources in the United States, including, among others, onshore processing, transmission, storage and distribution facilities. In October 2015, the EPA amended and expanded the GHG reporting requirements to all segments of the oil and natural gas industry, including gathering and boosting facilities and blowdowns of natural gas transmission pipelines.
Federal agencies also have begun directly regulating emissions of methane, a GHG, from oil and natural gas operations. In June 2016, the EPA published New Source Performance Standards (“NSPS”), known as Subpart OOOOa, that require certain new,
modified or reconstructed facilities in the oil and natural gas sector to reduce these methane gas and volatile organic compound (“VOC”) emissions. These Subpart OOOOa standards will expand previously issued NSPS published by the EPA in 2012 and known as Subpart OOOO, by using certain equipment-specific emissions control practices, requiring additional controls for pneumatic controllers and pumps as well as compressors, and imposing leak detection and repair requirements for natural gas compressor and booster stations. However, the Subpart OOOOa standards have been subject to attempts by the EPA to stay portions of those standards, and the agency proposed rulemaking in June 2017 to stay the requirements for a period of two years and revisit implementation of Subpart OOOOa in its entirety. TheIn September 2018, the EPA has not yet published a final ruleproposed amendments to Subpart OOOOa that would reduce the 2016 standards’ fugitive emissions monitoring requirements and as a result,expand exceptions to controlling methane emissions from pneumatic pumps, among other changes. Various industry and environmental groups have separately challenged both the Juneoriginal 2016 rule remains in effect but futurestandards and the EPA’s attempts to delay the implementation of the 2016rule. In August 2019, the EPA proposed two options for further rescinding the Subpart OOOOa standards. Under the EPA’s preferred alternative, the agency would rescind the methane limits for new, reconstructed and modified oil and natural gas production sources while leaving in place the general emission limits for volatile organic compounds, or VOCs, and relieve the EPA of its obligation to develop guidelines for methane emissions from existing sources. In addition, the proposal would remove from the oil and natural gas category the natural gas transmission and storage segment. The other proposed alternative would rescind the methane requirements of the Subpart OOOOa standards is uncertain at this time.applicable to all oil and natural gas sources, without removing any sources from that source category (and still requiring control of VOCs in general). This rule, should it remain in effect, and any other new methane emission standards imposed on the oil and gas sector could result in increased costs to our operations as well as result in delays or curtailment in such operations, which costs, delays or curtailment could adversely affect our business. Additionally, in December 2015, the United States joined the international community at the 21st Conference of the Parties of the United Nations Framework Convention on Climate Change in Paris, France preparing an agreement requiring member countries to review and “represent a progression” in their intended nationally determined contributions, which set GHG emission reduction goals every five years beginning in 2020. This “Paris Agreement” was signed by the United States in April 2016 and entered into force in November 2016; however, this agreement does not create any binding obligations for nations to limit their GHG emissions, but rather includes pledges to voluntarily limit or reduce future emissions. In August 2017, the United States State Department informed the United Nations of the intent of the United States to withdraw from the Paris Agreement. The Paris Agreement provides for a four-year exitUnited States formally initiated the withdrawal process beginning when it took effect in November 2016,2019, which would result in an effective exit date of November 2020. The United States’ adherence to the exit process and/or the terms on which the United States may re-enter the Paris Agreement or a separately negotiated agreement are unclear at this time.
The adoption and implementation of any international, federal or state legislation or regulations that require reporting of GHGs or otherwise restrict emissions of GHGs could result in increased compliance costs or additional operating restrictions, and could have a material adverse effect on our business, financial condition, demand for our services, results of operations, and cash flows. Recently, activists concerned about the potential effects of climate change have directed their attention at sources of funding for fossil-fuel energy companies, which has resulted in certain financial institutions, funds and other sources of capital restricting or eliminating their investment in oil and natural gas activities. Ultimately, this could make it more difficult to secure funding for exploration and production or midstream activities. Notwithstanding potential risks related to climate change, the International Energy Agency estimates that global energy demand will continue to rise and will not peak until after 2040 and that oil and natural gas will continue to represent a substantial percentage of global energy use over that time. Finally, some scientists have concluded that increasing concentrations of GHG in the atmosphere may produce climate changes that have significant physical effects, such
as increased frequency and severity of storms, droughts, and floods and other climate events that could have an adverse effect on our assets.
The swaps regulatory provisions of the Dodd-Frank Act and the rules adopted thereunder could have an adverse effect on our ability to use derivative instruments to mitigate the risks of changes in commodity prices and interest rates and other risks associated with our business.
Provisions of the Dodd-Frank Wall Street Reform and Consumer Protection Act (the “Dodd-Frank Act”) and rules adopted by the Commodity Futures Trading Commission (the “CFTC”), the SEC and other prudential regulators establish federal regulation of the physical and financial derivatives, including over-the-counterOTC derivatives market and entities, such as us, participating in that market. While most of these regulations are already in effect, the implementation process is still ongoing and the CFTC continues to review and refine its initial rulemakings through additional interpretations and supplemental rulemakings. As a result, any new regulations or modifications to existing regulations could significantly increase the cost of derivative contracts, materially alter the terms of derivative contracts, reduce the availability and/or liquidity of derivatives to protect against risks we encounter, reduce our ability to monetize or restructure our existing derivative contracts, and increase our exposure to less creditworthy counterparties. Any of these consequences could have a material adverse effect on our financial condition, results of operations and cash available for distribution to our unitholders.Unitholders.
The CFTC has re-proposed speculative position limits for certain futures and option contracts in the major energy markets and for swaps that are their economic equivalents, although certain bona fide hedging transactions would be exempt from these position limits provided that various conditions are satisfied. The CFTC has also finalized a related aggregation rule that requires market participants to aggregate their positions with certain other persons under common ownership and control, unless an exemption applies, for purposes of determining whether the position limits have been exceeded. If adopted, the revised position limits rule and its finalized companion rule on aggregation may create additional implementation or operational exposure. In addition to the CFTC federal speculative position limit regime, designated contract markets (“DCMs”) also maintain speculative position limit and accountability regimes with respect to contracts listed on their platform as well as aggregation requirements similar to the CFTC’s final aggregation rule. Any speculative position limit regime, whether imposed at the federal-level or at the DCM-level may impose added operating costs to monitor compliance with such position limit levels, addressing accountability level concerns and maintaining appropriate exemptions, if applicable.
The Dodd-Frank Act requires that certain classes of swaps be cleared on a derivatives clearing organization and traded on a DCM or other regulated exchange, unless exempt from such clearing and trading requirements, which could result in the application of certain margin requirements imposed by derivatives clearing organizations and their members. The CFTC and prudential regulators have also adopted mandatory margin requirements for uncleared swaps entered into between swap dealers and certain other counterparties. We currently qualify for and rely upon an end-user exception from such clearing and margin requirements for the swaps we enter into to hedge our commercial risks. However, the application of the mandatory clearing and trade execution requirements and the uncleared swaps margin requirements to other market participants, such as swap dealers, may adversely affect the cost and availability of the swaps that we use for hedging.
In addition to the Dodd-Frank Act, the European Union and other foreign regulators have adopted and are implementing local reforms generally comparable with the reforms under the Dodd-Frank Act. Implementation and enforcement of these regulatory provisions may reduce our ability to hedge our market risks with non-U.S. counterparties and may make transactions involving cross-border swaps more expensive and burdensome. Additionally, the lack of regulatory equivalency across jurisdictions may increase compliance costs and make it more difficult to satisfy our regulatory obligations.
The NYSE does not require a publicly traded partnership like us to comply with certain corporate governance requirements.
We have preferred units that are listed on the NYSE. Because we are a publicly traded partnership, the NYSE does not require us to have a majority of independent directors on our general partner’s board of directors or to establish a compensation committee or a nominating and corporate governance committee. Accordingly, unitholdersour Unitholders do not have the same protections afforded to stockholders of corporations that are subject to all of the corporate governance requirements of the applicable stock exchange.
A natural disaster, catastrophe or other event could result in severe personal injury, property damage and environmental damage, which could curtail our operations and otherwise materially adversely affect our cash flow and, accordingly, affect the market price of our Common Units.
Some of our operations involve risks of personal injury, property damage and environmental damage, which could curtail our operations and otherwise materially adversely affect our cash flow. For example, natural gas pipeline and other facilities operate at high pressures, sometimes in excess of 1,100 pounds per square inch.pressures. Virtually all of our operations are exposed to potential natural disasters, including hurricanes, tornadoes, storms, floods and/or earthquakes.
If one or more facilities that are owned by us, or that deliver natural gas or other products to us, are damaged by severe weather or any other disaster, accident, catastrophe or event, our operations could be significantly interrupted. Similar interruptions could result from damage to production or other facilities that supply our facilities or other stoppages arising from factors beyond our control. These interruptions might involve significant damage to people, property or the environment, and repairs might take from a week or less for a minor incident to six months or more for a major interruption. Any event that interrupts the revenues generated by our operations, or which causes us to make significant expenditures not covered by insurance, could reduce our cash available for paying distributions to our Unitholders and, accordingly, adversely affect the market price of our Common Units.Unitholders.
As a result of market conditions, premiums and deductibles for certain insurance policies can increase substantially, and in some instances, certain insurance may become unavailable or available only for reduced amounts of coverage. As a result, we may not be able to renew existing insurance policies or procure other desirable insurance on commercially reasonable terms, if at all. If we were to incur a significant liability for which we were not fully insured, it could have a material adverse effect on our financial position and results of operations. In addition, the proceeds of any such insurance may not be paid in a timely manner and may be insufficient if such an event were to occur.
Terrorist attacks aimed at our facilities could adversely affect our business, results of operations, cash flows and financial condition.
The United States government has issued warnings that energy assets, including our nation’s pipeline infrastructure, may be the future target of terrorist organizations. Some of our facilities are subject to standards and procedures required by the Chemical Facility Anti-Terrorism Standards. We believe we are in compliance with all material requirements; however, such compliance may not prevent a terrorist attack from causing material damage to our facilities or pipelines. Any such terrorist attack on our facilities or pipelines, those of our customers, or in some cases, those of other pipelines could have a material adverse effect on our business, financial condition and results of operations.
Additional deepwater drilling laws and regulations, delays in the processing and approval of drilling permits and exploration, development, oil spill-response and decommissioning plans, and other related developments may have a material adverse effect on our business, financial condition, or results of operations.
The federal Bureau of Ocean Energy Management (“BOEM”) and the federal Bureau of Safety and Environmental Enforcement (“BSEE”), each agencies of the United States Department of the Interior, have imposed more stringent permitting procedures and regulatory safety and performance requirements for new wells to be drilled in federal waters. Compliance with these more stringent regulatory requirements and with existing environmental and oil spill regulations, together with any uncertainties or inconsistencies in decisions and rulings by governmental agencies, delays in the processing and approval of drilling permits or exploration, development, oil spill-response and decommissioning plans, and possible additional regulatory initiatives could result in difficult and more costly actions and adversely affect or delay new drilling and ongoing development efforts.
In addition, new regulatory initiatives may be adopted or enforced by the BOEM or the BSEE in the future that could result in additional costs, delays, restrictions, or obligations with respect to oil and natural gas exploration and production operations conducted offshore by certain of our customers. For example, in April 2016, the BOEM published a proposed rule that would update existing air-emissions requirements relating to offshore oil and natural-gas activity on federal Outer Continental Shelf waters. However, in May 2017, Order 3350 was issued by the Department of the Interior Secretary Ryan Zinke, directing the BOEM to reconsider a number of regulatory initiatives governing oil and gas exploration in offshore waters, including, among other things, a cessation of all activities to promulgate the April 2016 proposed rulemaking (“Order 3350”). In an unrelated legal initiative, BOEM issued a Notice to Lessees and Operators (“NTL #2016-N01”) that became effective in September 2016 and imposes more stringent requirements relating to the provision of financial assurance to satisfy decommissioning obligations. Together with a recent re-assessment by BSEE in 2016 in how it determines the amount of financial assurance required, the revised BOEM-administered offshore financial assurance program that is currently being implemented is expected to result in increased amounts of financial assurance being required of operators on the OCS, which amounts may be significant. However, as directed under Order 3350, the BOEM has delayed implementation of NTL #2016-N01 so that it may reconsider this regulatory initiative and, currently, this NTL’s implementation timeline has been extended indefinitely beyond June 30, 2017, except in certain circumstances where there is a substantial risk of nonperformance of the interest holder’s decommissioning liabilities. The April 2016 proposed rule and NTL #2016-N01, should they be finalized and/or implemented, as well as any new rules, regulations, or legal initiatives could delay or disrupt our customers operations, increase the risk of expired leases due to the time required to develop new technology, result in increased supplemental bonding and costs, limit activities in certain areas, or cause our customers’ to incur penalties, or shut-in production or lease cancellation. Also, if material spill events were to occur in the future, the United States or other countries could elect to issue directives to temporarily cease drilling activities offshore and, in any event, may from time to time issue further safety and environmental laws and regulations regarding offshore oil and gas exploration and development. The overall costs imposed on our customers to implement and complete any such spill response activities or any decommissioning obligations could exceed estimated accruals, insurance limits, or supplemental bonding amounts, which could result in the
incurrence of additional costs to complete. We cannot predict with any certainty the full impact of any new laws or regulations on our customers’ drilling operations or on the cost or availability of insurance to cover some or all of the risks associated with such operations. The occurrence of any one or more of these developments could result in decreased demand for our services, which could have a material adverse effect on our business as well as our financial position, results of operation and liquidity.
Our business is subject to federal, state and local laws and regulations that govern the product quality specifications of the petroleum products that we store and transport.
The petroleum products that we store and transport are sold by our customers for consumption into the public market. Various federal, state and local agencies have the authority to prescribe specific product quality specifications to commodities sold into the public market. Changes in product quality specifications could reduce our throughput volume, require us to incur additional handling costs or require the expenditure of significant capital. In addition, different product specifications for different markets impact the fungibility of products transported and stored in our pipeline systems and terminal facilities and could require the construction of additional storage to segregate products with different specifications. We may be unable to recover these costs through increased revenues.
In addition, our patented butane blending services are reliant upon gasoline vapor pressure specifications. Significant changes in such specifications could reduce butane blending opportunities, which would affect our ability to market our butane blending service licenses and which would ultimately affect our ability to recover the costs incurred to acquire and integrate our butane blending assets.
Our business could be affected adversely by union disputes and strikes or work stoppages by unionized employees.
As of December 31, 2017,2019, approximately 14%12% of our workforce is covered by a number of collective bargaining agreements with various terms and dates of expiration. There can be no assurances that we will not experience a work stoppage in the future as a
result of labor disagreements. Any work stoppage could, depending on the affected operations and the length of the work stoppage, have a material adverse effect on our business, financial position, results of operations or cash flows.
Our operations could be disrupted if our information systems fail, causing increased expenses and loss of sales.
Our business is highly dependent on financial, accounting and other data processing systems and other communications and information systems, including our enterprise resource planning tools. We process a large number of transactions on a daily basis and rely upon the proper functioning of computer systems. If a key system was to fail or experience unscheduled downtime for any reason, even if only for a short period, our operations and financial results could be affected adversely. Our systems could be damaged or interrupted by a security breach, fire, flood, power loss, telecommunications failure or similar event. We have a formal disaster recovery plan in place, but this plan may not entirely prevent delays or other complications that could arise from an information systems failure. Our business interruption insurance may not compensate us adequately for losses that may occur.
Cybersecurity breaches and other disruptions could compromise our information and operations, and expose us to liability, which would cause our business and reputation to suffer.
In the ordinary course of our business, we collect and store sensitive data, including intellectual property, our proprietary business information and that of our customers, suppliers and business partners, and personally identifiable information of our employees, in our data centers and on our networks. The secure processing, maintenance and transmission of this information is critical to our operations and business strategy. Despite our security measures, our information technology and infrastructure may be vulnerable to attacks by hackers or breached due to employee error, malfeasance or other disruptions. Any such breach could compromise our networks and the information stored there could be accessed, publicly disclosed, lost or stolen. Any such access, disclosure or other loss of information could result in legal claims or proceedings, liability under laws that protect the privacy of personal information, regulatory penalties for divulging shipper information, disruption of our operations, damage to our reputation, and loss of confidence in our products and services, which could adversely affect our business.
Our information technology infrastructure is critical to the efficient operation of our business and essential to our ability to perform day-today operations. Breaches in our information technology infrastructure or physical facilities, or other disruptions, could result in damage to our assets, safety incidents, damage to the environment, potential liability or the loss of contracts, and have a material adverse effect on our operations, financial position and results of operations.
The costs of providing pension and other postretirement health care benefits and related funding requirements are subject to changes in pension fund values, changing demographics and fluctuating actuarial assumptions and may have a material adverse effect on our financial results.
Certain of our subsidiaries provide pension plan and other postretirement healthcare benefits to certain of their employees. The costs of providing pension and other postretirement health care benefits and related funding requirements are subject to changes
in pension and other postretirement fund values, changing demographics and fluctuating actuarial assumptions that may have a material adverse effect on the Partnership’s future consolidated financial results. While certain of the costs incurred in providing such pension and other postretirement healthcare benefits are recovered through the rates charged by the Partnership’s regulated businesses, the Partnership’s subsidiaries may not recover all of the costs and those rates are generally not immediately responsive to current market conditions or funding requirements. Additionally, if the current cost recovery mechanisms are changed or eliminated, the impact of these benefits on operating results could significantly increase.
Our contract compression operations depend on particular suppliers and are vulnerable to parts and equipment shortages and price increases, which could have a negative impact on results of operations.
The principal manufacturerssubstantial majority of the components for our natural gas compression equipment includeare supplied by Caterpillar Inc., Cummins Inc. and Arrow Engine Company for engines, Air-X-Changers and Alfa Laval (US) for coolers, and Ariel Corporation, GE Oil & Gas Gemini products and Arrow Engine Company for compressorscompressor frames and frames.cylinders. Our reliance on these suppliers involves several risks, including price increases and a potential inability to obtain an adequate supply of required components in a timely manner. We also rely primarily on twofour vendors, Spitzer IndustriesA G Equipment Company, Alegacy Equipment, LLC, Standard Equipment Corp. and Standard Equipment Corp.,Genis Holdings LLC, to package and assemble our compression units. We do not have long-term contracts with these suppliers or packagers, and a partial or complete loss of certainany of these sources could have a negative impact on our results of operations and could damage our customer relationships. Some of these suppliers manufacture the components we purchase in a single facility, and any damage to that facility could lead to significant delays in delivery of completed compression units to us.
Mergers among customers and competitors could result in lower volumes being shipped on our pipelines or products stored in or distributed through our terminals, or reduced crude oil marketing margins or volumes.
Mergers between existing customers could provide strong economic incentives for the combined entities to utilize their existing systems instead of our systems in those markets where the systems compete. As a result, we could lose some or all of the volumes and associated revenues from these customers and could experience difficulty in replacing those lost volumes and revenues, which could materially and adversely affect our results of operations, financial position, or cash flows.
Fraudulent activity or misuse of proprietary data involving its outsourcing partners could expose us to additional liability.
We utilize both affiliated entities and third parties in the processing of our information and data. Breaches of security measures or the accidental loss, inadvertent disclosure or unapproved dissemination of proprietary information, or sensitive or confidential data about us or our customers, including the potential loss or disclosure of such information or data as a result of fraud or other forms of deception, could expose us to a risk of loss, or misuse of this information, result in litigation and potential liability, lead to reputational damage, increase our compliance costs, or otherwise harm its business.
The liquefaction project is dependent upon securing long-term contractual arrangements for the off-take of LNG on terms sufficient to support the financial viability of the projectproject.
LCL, an entity whose parent is owned 60% by ETE and 40% by ETP,our wholly-owned subsidiary, is in the process of developing a liquefaction project at the site of ETE’sour existing regasification facility in Lake Charles, Louisiana. The project development agreement previously entered into in September 2013 with BG Group plc, (now "Shell")a subsidiary of Shell, related to this project expired in February 2017. On June 28, 2017, LCL signed a memorandum of understanding with Korea Gas Corporation and Shell to study the feasibility of a joint development of the Lake Charles liquefaction project. The project would utilize existing dock and storage facilities owned by ETEus located on the Lake Charles site. The parties’ determination as to the feasibility of the project will be particularly dependent upon the prospects for securing long-term contractual arrangements for the off-take of LNG which in turn will be dependent upon supply and demand factors affecting the price of LNG in foreign markets. The financial viability of the project will also be dependent upon a number of other factors, including the expected cost to construct the liquefaction facility, the terms and conditions of the financing for the construction of the liquefaction facility, the cost of the natural gas supply, the costs to transport natural gas to the liquefaction facility, the costs to operate the liquefaction facility and the costs to transport LNG from the liquefaction facility to customers in foreign markets (particularly Europe and Asia). Some of these costs fluctuate based on a variety of factors, including supply and demand factors affecting the price of natural gas in the United States, supply and demand factors affecting the costs for construction services for large infrastructure projects in the United States, and general economic conditions, there can be no assurance that the parties will determine to proceed to develop this project.
The construction of the liquefaction project remains subject to further approvals and some approvals may be subject to further conditions, review and/or revocation.
While LCL has received authorization from the DOE to export LNG to non-FTA countries, the non-FTA authorization is subject to review, and the DOE may impose additional approval and permit requirements in the future or revoke the non-FTA authorization should the DOE conclude that such export authorization is inconsistent with the public interest. The failure byFERC order (issued December
17, 2015) authorizing LCL to timely maintain the approvals necessary to completesite, construct and operate the liquefaction project could havecontains a material adverse effect on its operationscondition requiring all phases of the liquefaction project to be completed and financial condition.in-service within five years of the date of the order. The order also requires the modifications to our Trunkline pipeline facilities that connect to our Lake Charles facility be complete by December 17, 2019 and additionally requires execution of a transportation contract for natural gas supply to the liquefaction facility prior to the initiation of construction of the liquefaction facility. Although we intend to file an application with the FERC to seek an extension of these completion dates for the project, the FERC may not grant this extension.
Legal or regulatory actions related to the Dakota Access Pipeline could cause an interruption to current or future operations, which could have an adverse effect on our business and results of operations.
On July 25,27, 2016, the United States Army Corps of Engineers (“USACE”) issued permits to Dakota Access consistent with environmental and historic preservation statutes for the pipeline to make two crossings of the Missouri River in North Dakota, including a crossing of the Missouri River at Lake Oahe. The USACE also issued easements to allow the pipeline to cross land owned by the USACE adjacent to the Missouri River in two locations. The Standing Rock Sioux Tribe (“SRST”) filed a lawsuit in the United States District Court for the District of Columbia (the “Court”challenging permits issued by the United States Army Corps of Engineers (“USACE”) againstpermitting Dakota Access, LLC (“Dakota Access”) to cross the Missouri River at Lake Oahe in North Dakota. The case was subsequently amended to challenge an easement issued by the USACE that challenged the legality of the permits issued for the construction of the Dakota Access pipeline and claimed violations of the National Historic Preservation Act (“NHPA”). Dakota Access intervened in the case.
In February 2017, the Department of the Army delivered an easement to Dakota Access allowing the pipeline to cross Lake Oahe. The SRSTland owned by the USACE adjacent to the Missouri River. Dakota Access and the Cheyenne River Sioux Tribe (“CRST”) (which had intervened inintervened. Separate lawsuits filed by the lawsuit brought by SRST), amended their complaints to incorporate religious freedomOglala Sioux Tribe (“OST”) and other claims related to treaties and use of government property. The Oglala andthe Yankton Sioux tribes,Tribe (“YST”) were consolidated with this action and variousseveral individual tribal members intervened (collectively with SRST and CRST, the “Tribes”). Plaintiffs and Defendants filed related lawsuits in opposition tocross motions for summary judgment which are pending before the Dakota Access pipeline. These lawsuits have been consolidated into the action initiated by the SRST.court.
On June 14, 2017, the Court ruled that the USACE substantially complied with all relevant statutes in connection with the issuance of the permits and easement, but remanded to the USACE three discrete issues for further analysis and explanation of its prior determination under certain of these statutes. On October 11, 2017, the Court ruled that the pipeline could continue to transport crude oil during the pendency of the remand, but requested briefing from the parties as to whether any conditions on the continued operation of the pipeline during this period. On December 4, 2017, the Court determined to impose three conditions on continued operation of the pipeline during the remand process. First, Dakota Access must retain an independent auditor to review its compliance with the conditions and regulations governing its easements and to assess integrity threats to the pipeline. Second, the Court directed Dakota Access to continue its work with the tribes and the USACE to revise and finalize its response planning
for the section of the pipeline crossing Lake Oahe. Third, the Court directed Dakota Access to submit bi-monthly reports during the remand period disclosing certain inspection and maintenance information recommended by PHMSA.
While we believe that the pending lawsuits are unlikely to adversely affect the continued operation or potential expansion of the pipeline, we cannot assure this outcome. At this time, we cannot determine when or how these lawsuits will be resolved or the impact they may have on the Dakota Access project.
In addition, lawsuits and/or regulatory proceedings or actions of this or a similar nature could result in interruptions to construction or operations of current or future projects, delays in completing those projects and/or increased project costs, all of which could have an adverse effect on our business and results of operations.
Sunoco LP is subject to federal laws related to the Renewable Fuel Standard.
New laws, new interpretations of existing laws, increased governmental enforcement of existing laws or other developments could require us to make additional capital expenditures or incur additional liabilities. For example, certain independent refiners have initiated discussions with the EPA to change the way the Renewable Fuel Standard (“RFS”) is administered in an attempt to shift the burden of compliance from refiners and importers to blenders and distributors. Under the RFS, which requires an annually increasing amount of biofuels to be blended into the fuels used by U.S. drivers, refiners/importers are obligated to obtain renewable identification numbers (“RINS”) either by blending biofuel into gasoline or through purchase in the open market. If the obligation was shifted from the importer/refiner to the blender/distributor, the Partnership would potentially have to utilize the RINS it obtains through its blending activities to satisfy a new obligation and would be unable to sell RINS to other obligated parties, which may cause an impact on the fuel margins associated with Sunoco LP’s sale of gasoline.
The occurrence of any of the events described above could have a material adverse effect on Sunoco LP’s business, financial condition, results of operations and cash available for distribution to its unitholders.
Sunoco LP is subject to federal, state and local laws and regulations that govern the product quality specifications of refined petroleum products it purchases, stores, transports, and sells to its distribution customers.
Various federal, state, and local government agencies have the authority to prescribe specific product quality specifications for certain commodities, including commodities that Sunoco LP distributes. Changes in product quality specifications, such as reduced sulfur content in refined petroleum products, or other more stringent requirements for fuels, could reduce Sunoco LP’s ability to procure product, require it to incur additional handling costs and/or require the expenditure of capital. If Sunoco LP is unable to procure product or recover these costs through increased selling price, it may not be able to meet its financial obligations. Failure to comply with these regulations could result in substantial penalties for Sunoco LP.
Tax Risks to Unitholders
Our tax treatment depends on our status as a partnership for federal income tax purposes, as well as our not being subject to a material amount of entity-level taxation by individual states. If the Internal Revenue Service (“IRS”) were to treat us as a corporation for federal income tax purposes or if we become subject to a material amount of entity-level taxation for state tax purposes, then our cash available for distribution would be substantially reduced.
The anticipated after-tax economic benefit of an investment in our CommonSeries A Preferred Units, Series B Preferred Units, Series C Preferred Units, Series D Preferred Units, Series E Preferred Units, Series F Preferred Units, and Series G Preferred Units (collectively, “ETO Preferred Units”)depends largely on our being treated as a partnership for federal income tax purposes. We
have not requested, and do not plan to request, a ruling from the IRS, with respect to our classification as a partnership for federal income tax purposes. Despite the fact that we are a limited partnership under Delaware law, we would be treated as a corporation for federal income tax purposes unless we satisfy a “qualifying income” requirement. Based upon our current operations, we believe we satisfy the qualifying income requirement. Failing to meet the qualifying income requirement or a change in current law could cause us to be treated as a corporation for federal income tax purposes or otherwise subject us to taxation as an entity.
If we were treated as a corporation, we would pay federal income tax at the corporate tax rate, and we would likely pay additional state income taxes at varying rates. Distributions to Unitholdersholders of our ETO Preferred Units ("ETO Preferred Unitholders") would generally be taxed again as corporate distributions and noneinstead of our income, gains, losses or deductions would flow through to Unitholders.guaranteed payments for the use of capital, as described further below. Because a tax would then be imposed upon us as a corporation, our cash available for distribution to ETO Preferred Unitholders would be substantially reduced. Therefore, treatment of us as a corporation would result in a material reduction in the anticipated cash flow and after-tax return to the Unitholders, likely causing a substantial reduction in the value of our Common Units.ETO Preferred Unitholders.
At the state level, several states have been evaluating ways to subject partnerships to entity-level taxation through the imposition of state income, franchise, or other forms of taxation. Imposition of a similar tax on us in the jurisdictions in which we operate or in other jurisdictions to which we may expand could substantially reduce our cash available for distribution to our ETO Preferred Unitholders. Our partnership agreement provides that if a law is enacted or existing law is modified or interpreted in a manner that subjects us to taxation as a corporation or otherwise subjects us to entity-level taxation for federal, state or local income tax purposes, the minimum quarterly distribution amount and the target distribution amounts may be adjusted to reflect the impact of that law on us.
The tax treatment of publicly traded partnerships or an investment in our unitsETO Preferred Units could be subject to potential legislative, judicial or administrative changes or differing interpretations, possibly applied on a retroactive basis.
The present United States federal income tax treatment of publicly traded partnerships, including us, or an investment in our common unitsETO Preferred Units may be modified by administrative, legislative or judicial changes or differing interpretations at any time. From time to time, members of Congress propose and consider substantive changes to the existing United States federal income tax laws that affect publicly traded partnerships. Although there is no current legislative proposal, a prior legislative proposal would have eliminated the qualifying income exception to the treatment of all publicly traded partnerships as corporations upon which we rely for our treatment as a partnership for United States federal income tax purposes.
In addition, on January 24, 2017, final regulations regarding which activities give rise to qualifying income within the meaning of Section 7704 of the Internal Revenue Code of 1986, as amended (the “Final Regulations”) were published in the Federal Register. The Final Regulations are effective as of January 19, 2017, and apply to taxable years beginning on or after January 19, 2017. We do not believe the Final Regulations affect our ability to be treated as a partnership for United States federal income tax purposes.
However, any modification to the United States federal income tax laws may be applied retroactively and could make it more difficult or impossible for us to meet the exception for certain publicly traded partnerships to be treated as partnerships for United States federal income tax purposes. We are unable to predict whether any of these changes or other proposals will ultimately be enacted. Any similar or future legislative changes could negatively impact the value of an investment in our common units.us. You are urged to consult with your own tax advisor with respect to the status of regulatory or administrative developments and proposals and their potential effect on your investment in our common units.
us.
If the IRS contests the federal income tax positions we take, the market for our CommonETO Preferred Units may be adversely affected and the costs of any such contest will reduce cash available for distributions to our ETO Preferred Unitholders.
We have not requested a ruling from the IRS with respect to our treatment as a partnership for federal income tax purposes. The IRS may adopt positions that differ from the positions we take. It may be necessary to resort to administrative or court proceedings to sustain some or all of the positions we take. A court may not agree with some or all of the positions we take. Any contest with the IRS may materially and adversely impact the market for our CommonETO Preferred Units and the prices at which they trade. In addition, the costs of any contest with the IRS will be borne by us reducing the cash available for distribution to our ETO Preferred Unitholders.
If the IRS makes audit adjustments to our income tax returns for tax years beginning after December 31, 2017, it (and some states) may assess and collect any taxes (including any applicable penalties and interest) resulting from such audit adjustment directly from us, in which case our cash available for distribution to our ETO PreferredUnitholders might be substantially reduced.
Pursuant to the Bipartisan Budget Act of 2015, for tax years beginning after December 31, 2017, if the IRS makes audit adjustments to our income tax returns, it (and some states) may assess and collect any taxes (including any applicable penalties and interest) resulting from such audit adjustment directly from us. To the extent possible under the new rules, our general partner may elect to either pay the taxes (including any applicable penalties and interest) directly to the IRS or, if we are eligible, issue a revised information statement to each ETO Preferred Unitholder and former ETO Preferred Unitholder with respect to an audited and adjusted return. Although our general partner may elect to have our Unitholders and former Unitholders, including ETO Preferred Unitholders and former ETO Preferred Unitholders, take such audit adjustment into account and pay any resulting taxes (including applicable penalties or interest) in accordance with their interests in us during the tax year under audit, there can be no assurance
that such election will be practical, permissible or effective in all circumstances. As a result, our current ETO Preferred Unitholders may bear some or all of the tax liability resulting from such audit adjustment, even if such ETO Preferred Unitholders did not own units in usETO Preferred Units during the tax year under audit. If, as a result of any such audit adjustment, we are required to make payments of taxes, penalties and interest, our cash available for distribution to our ETO Preferred Unitholders might be substantially reduced. These rules are not applicable for tax years beginning on or prior to December 31, 2017.
ETO PreferredUnitholders may be required to pay taxes on their share of our income even if they do not receive any cash distributions from us.
Because our unitholdersETO Preferred Unitholders, who will be treated as our partners, to whom we will allocatemay receive allocations of taxable income which will be different in amount than the cash we distribute, our unitholdersdistribute. ETO Preferred Unitholders will be required to pay any federal income taxes and, in some cases, state and local income taxes on their share of our taxable income even if they receive no cash distributions from us. Our unitholdersETO Preferred Unitholders may not receive cash distributions from us equal to their share of our taxable income or even equal to the actual tax liability that result from that income.
Tax gain or loss on disposition of our Common Units could be more or less than expected.
If our unitholders sell their common units, they will recognize a gain or loss equal to the difference between the amount realizedTax-exempt entities and their tax basis in those common units. Prior distributions to our unitholders in excess of the total net taxable income the unitholder was allocated for a unit, which decreased their tax basis in that unit, will, in effect, become taxable income to our unitholders if the common unit is sold at a price greater than their tax basis in that common unit, even if the price they receive is less than their original cost. A substantial portion of the amount realized, whether or not representing gain, may be ordinary income. In addition, if our unitholders sell their units, they may incur a tax liability in excess of the amount of cash received from the sale.
Tax-exempt entitiesnon-U.S. persons face unique tax issues from owning our unitsETO Preferred Units that may result in adverse tax consequences to them.
Investment in our unitsthe ETO Preferred Units by tax-exempt entities, includinginvestors, such as employee benefit plans and individual retirement accounts, (known as IRAs)and non-United States persons raises issues unique to them. For example, virtually allThe treatment of our income allocatedguaranteed payments for the use of capital to Unitholders who are organizations exempt from federal income tax, including IRAstax-exempt investors is not certain and other retirement plans, willsuch payments may be “unrelated business taxable income” and will be taxable to them. Further, with respect to taxable years beginning after December 31, 2017, a tax-exempt entity with more than one unrelated trade or business (including by attribution from investment in a partnership suchtreated as ours that is engaged in one or more unrelated trade or business) is required to compute the unrelated business taxable income of such tax-exempt entity separately with respectfor federal income tax purposes. Distributions to each such trade or business (including for purposes of determining any net operating loss deduction). As a result, for years beginning after December 31, 2017, it may not be possible for tax-exempt entities to utilize losses from an investment in our partnership to offset unrelated business taxable income from another unrelated trade or business and vice versa. Tax-exempt entities should consult a tax advisor before investing in our units.
Non-Unitednon-United States ETO Preferred Unitholders will be subject to United States taxes and withholding with respect to their income and gain from owning our units.
Non-United States unitholders are generally taxed and subject to income tax filing requirements bytaxes. If the United States on income effectively connected with a United States trade or business (“effectively connected income”). Income allocated to our unitholders and any gain fromamount of withholding exceeds the saleamount of our units will generally be considered to be “effectively connected” with a United States trade or business. As a result, distributions to a Non-United States unitholder will be subject to withholding at the highest applicable effective tax rate and a Non-United States unitholder who sells or otherwise disposes of a unit will also be subject to United States federal income tax on the gain realized from the sale or dispositionactually due, non-United States ETO Preferred Unitholders may be required to file United States federal income tax returns in order to seek a refund of that unit. such excess.
The Tax Cuts and Jobs Act imposes a withholding obligation of 10% of the amount realized upon a Non-Unitednon-United States unitholder’sETO Preferred Unitholder's sale or exchange of an interest in a partnership that is engaged in a United States trade or business. However, due to challenges of administering a withholding obligation applicable to open market trading and other complications, the IRS has temporarily suspended the application of this withholding rule to open market transfers of interests in publicly traded partnerships pending promulgation of regulations or other guidance that resolves the challenges. It is not clear if or when such regulations or other guidance will be issued.finalized. Non-United States unitholdersETO Preferred Unitholders should consult a tax advisor before investing in our units.ETO Preferred Units.
We have subsidiaries that will be treated as corporations for federal income tax purposes and subject to corporate-level income taxes.
Even though we (as a partnership for United States federal income tax purposes) are not subject to United States federal income tax, some of our operations are currently conducted through subsidiaries that are organized as corporations for United States federal income tax purposes. The taxable income, if any, of subsidiaries that are treated as corporations for United States federal income tax purposes, is subject to corporate-level United States federal income taxes, which may reduce the cash available for distribution to us and, in turn, to our ETO Preferred Unitholders. If the IRS or other state or local jurisdictions were to successfully assert that these corporations have more tax liability than we anticipate or legislation was enacted that increased the corporate tax rate, the cash available for distribution could be further reduced. The income tax return filings positions taken by these corporate subsidiaries require significant judgment, use of estimates, and the interpretation and application of complex tax laws. Significant judgment is also required in assessing the timing and amounts of deductible and taxable items. Despite our belief that the income tax return positions taken by these subsidiaries are fully supportable, certain positions may be successfully challenged by the IRS, state or local jurisdictions.
We treat each purchaser of Common Units as having the same tax benefits without regard to the actual Common Units purchased. The IRS may challenge this treatment, which could result in a Unitholder owing more tax and may adversely affect the value of the Common Units.
Because we cannot match transferors and transferees of Common Units and because of other reasons, we have adopted depreciation and amortization positions that may not conform to all aspects of existing Treasury Regulations. A successful IRS challenge to those positions could adversely affect the amount of tax benefits available to our Unitholders. It also could affect the timing of these tax benefits or the amount of gain from the sale of Common Units and could have a negative impact on the value of our Common Units or result in audit adjustments to tax returns of our Unitholders. Moreover, because we have subsidiaries that are organized as C corporations for federal income tax purposes which own units in us, a successful IRS challenge could result in this subsidiary having more tax liability than we anticipate and, therefore, reduce the cash available for distribution to our partnership and, in turn, to our Unitholders.
We prorate our items of income, gain, loss and deduction between transferors and transferees of our units each month based upon the ownership of our units on the first business day of each month, instead of on the basis of the date a particular unit is transferred. The IRS may challenge aspects of our proration method, and, if successful, we would be required to change the allocation of items of income, gain, loss and deduction among our Unitholders.
We generally prorate our items of income, gain, loss and deduction between transferors and transferees of our units each month based upon the ownership of our units on the first business day of each month (the “Allocation Date”), instead of on the basis of the date a particular unit is transferred. Similarly, we generally allocate certain deductions for depreciation of capital additions, gain or loss realized on a sale or other disposition of our assets and, in the discretion of the general partner, any other extraordinary item of income, gain, loss or deduction based upon ownership on the Allocation Date. Treasury Regulations allow a similar monthly simplifying convention, but such regulations do not specifically authorize all aspects of the proration method we have adopted. If the IRS were to challenge our proration method, we may be required to change the allocation of items of income, gain, loss and deduction among our Unitholders.
A An ETO PreferredUnitholder whose units ETO Preferred Unitsare the subject of a securities loan (e.g. a loan to a “short seller”) to cover a short sale of units ETO Preferred Unitsmay be considered as having disposed of those units.ETO Preferred Units. If so, the ETO PreferredUnitholder would no longer be treated for tax purposes as a partner with respect to those unitsETO Preferred Units during the period of the loan and may recognize gain or loss from the disposition.
Because there are no specific rules governing the federal income tax consequences of loaning a partnership interest, aan ETO Preferred Unitholder whose unitsETO Preferred Units are the subject of a securities loan may be considered as having disposed of the loaned units.ETO Preferred Units. In that case, the ETO Preferred Unitholder may no longer be treated for tax purposes as a partner with respect to those unitsETO Preferred Units during the period of the loan and may recognize gain or loss from such disposition. Moreover, during the period of the loan, any of our income, gain, loss or deduction with respect to those units may not be reportable by the Unitholder and any cash distributions received by the Unitholder as to those units could be fully taxable as ordinary income.ETO Preferred Unitholders desiring to assure their status as partners and avoid the risk of gain recognition from a loan of their unitsETO Preferred Units are urged to consult a tax advisor to determine whether it is advisable to modify any applicable brokerage account agreements to prohibit their brokers from borrowing their units.ETO Preferred Units.
We have adopted certain valuation methodologies in determining Unitholder’s allocations
When we issue additional units or engage in certain other transactions, we determine the fair market value of our assets and allocate any unrealized gain or loss attributable to such assets to the capital accounts of our unitholders and our general partner. Although we may from time to time consult with professional appraisers regarding valuation matters, including the valuation of our assets, we make many of the fair market value estimates of our assets ourselves using a methodology based on the market value of our common units as a means to measure the fair market value of our assets. Our methodology may be viewed as understating the value of our assets. In that case, there may be a shift of income, gain, loss and deduction between certain unitholders and our general partner, which may be unfavorable to such unitholders. Moreover, under our current valuation methods, subsequent purchasers of our common units may have a greater portion of their Internal Revenue Code Section 743(b) adjustment allocated to our tangible assets and a lesser portion allocated to our intangible assets. The IRS may challenge our valuation methods, or our allocation of Section 743(b) adjustment attributable to our tangible and intangible assets, and allocations of income, gain, loss and deduction between our general partner and certain of our unitholders.
A successful IRS challenge to these methods or allocations could adversely affect the amount of taxable income or loss being allocated to our unitholders. It also could affect the amount of gain on the sale of common units by our unitholders and could have a negative impact on the value of our common units or result in audit adjustments to the tax returns of our unitholders without the benefit of additional deductions.
ETO PreferredUnitholders will likely be subject to state and local taxes and return filing requirements in states where they do not live as a result of investing in our units.ETO Preferred Units.
In addition to federal income taxes, the ETO Preferred Unitholders may be subject to other taxes, including state and local taxes, unincorporated business taxes and estate, inheritance or intangible taxes that are imposed by the various jurisdictions in which we conduct business or own property now or in the future, even if they do not live in any of those jurisdictions. ETO Preferred Unitholders may be required to file state and local income tax returns and pay state and local income taxes in some or all of the jurisdictions. We currently own property or conduct business in many states, most of which impose an income tax on individuals, corporations and other entities. As we make acquisitions or expand our business, we may control assets or conduct business in additional states that impose a personal or corporate income tax. Further, ETO Preferred Unitholders may be subject to penalties for failure to comply with those requirements. It is the responsibility of each ETO Preferred Unitholder to file all federal, state and local tax returns.
Unitholders may be subject to limitation on their ability to deduct interest expense incurred by us.
In general, our unitholders are entitled to a deduction for the interest we have paid or accrued on indebtedness properly allocable to our trade or business during our taxable year. However, under the Tax Cuts and Jobs Act, for taxable years beginning after December 31, 2017, our deduction for “business interest” is limited to the sum of our business interest income and 30% of our “adjusted taxable income.” For the purposes of this limitation, adjusted taxable income is computed without regard to any business interest expense or business interest income, and in the case of taxable years beginning before January 1, 2022, any deduction allowable for depreciation, amortization, or depletion. Although the interest limitation does not apply to certain regulated pipeline businesses, application of the interest limitation to tiered businesses like ours that hold interests in regulated and unregulated businesses is not clear. Pending further guidance specific to this issue, we have not yet determined the impact the limitation could have on our unitholders’ ability to deduct our interest expense, but it is possible that our unitholders’ interest expense deduction will be limited.
Treatment of distributions on our Series A Preferred Units and Series BETO Preferred Units as guaranteed payments for the use of capital creates a different tax treatment for the holders of Series A Preferred Units and Series B Preferred Units than the holders of our common unitsis uncertain and such distributions may not be eligible for the 20% deduction for qualified publicly traded partnership income.
The tax treatment of distributions on our Series A Preferred Units and our Series BETO Preferred Units is uncertain. We will treat each of the holders of the Series AETO Preferred Units and Series B Preferred UnitsUnitholders as partners for tax purposes and will treat distributions on the Series A Preferred Units and the Series BETO Preferred Units as guaranteed payments for the use of capital that will generally be taxable to each of the holders of Series AETO Preferred Units and Series B Preferred UnitsUnitholders as ordinary income. Holders of our Series AETO Preferred Units or Series B Preferred UnitsUnitholders will recognize taxable income from the accrual of such a guaranteed payment (even in the absence of a contemporaneous cash distribution). Otherwise, except in the case of our liquidation, the holders of Series AETO Preferred Units and Series B Preferred UnitsUnitholders are generally not anticipated to share in our items of income, gain, loss or deduction, nor will we allocate any share of our nonrecourse liabilities to the holders of Series AETO Preferred Units and the Series B Preferred Units.Unitholders. If the Series A Preferred Units and Series BETO Preferred Units were treated as indebtedness for tax purposes, rather than as guaranteed payments for the use of capital, distributions likely would be treated as payments of interest by us to each of the holders of Series AETO Preferred Units and Series B Preferred Units. Unitholders.
Although we expect that much of the income we earn is generally eligible for the 20% deduction for qualified publicly traded partnership income, it is uncertain whether a guaranteed payment for the use of capital may constitute an allocable or distributive share of such income. As a result the guaranteed payment for use of capital received by our Series A Preferred Units and Series BETO Preferred Units may not be eligible for the 20% deduction for qualified publicly traded partnership income.
A holder of Series AAn ETO Preferred Units or Series B Preferred UnitsUnitholder will be required to recognize gain or loss on a sale of Series A
ETO Preferred Units or Series B Preferred Units, as applicable, equal to the difference between the amount realized by such holderETO Preferred Unitholder and such holder’sETO Preferred Unitholder's tax basis in the Series AETO Preferred Units or Series B Preferred Units, as applicable, sold. The amount realized generally will equal the sum of the cash and the fair market value of other property such holderETO Preferred Unitholder receives in exchange for such Series AETO Preferred Units or Series B Preferred Units, as applicable.Units. Subject to general rules requiring a blended basis among multiple partnership interests, the tax basis of a Series Aan ETO Preferred Unit or Series B Preferred Unit, as applicable, will generally be equal to the sum of the cash and the fair market value of other property paid by the holder of such Series AETO Preferred Units or Series B Preferred Units, as applicable,Unitholder to acquire such Series AETO Preferred Unit or Series B Preferred Unit, as applicable.Units. Gain or loss recognized by a holder of Series Aan ETO Preferred Units or Series B Preferred UnitsUnitholder on the sale or exchange of a Series AETO Preferred Unit or Series B Preferred Unit, as applicable,Units held for more than one year generally will be taxable as long-term capital gain or loss. Because holders of Series AETO Preferred Units and Series B Preferred UnitsUnitholders will generally not be allocated a share of our items of depreciation, depletion or amortization, it is not anticipated that such holdersETO Preferred Unitholders would be required to recharacterize any portion of their gain as ordinary income as a result of the recapture rules.
Investment in the Series A Preferred Units or the Series B Preferred Units by tax-exempt investors, such as employee benefit plans and individual retirement accounts, and non-United States persons raises issues unique to them. The treatment of guaranteed payments for the use of capital to tax-exempt investors is not certain and such payments may be treated as unrelated business taxable income for federal income tax purposes. Distributions to non-United States holders of Series A Preferred Units and Series B Preferred Units will be subject to withholding taxes. If the amount of withholding exceeds the amount of United States federal income tax actually due, non-United States holders of Series A Preferred Units and Series B Preferred Units may be required to file United States federal income tax returns in order to seek a refund of such excess.
All holders of our Series AETO Preferred Units and Series B Preferred UnitsUnitholders are urged to consult a tax advisor with respect to the consequences of owning our Series A Preferred Units and Series BETO Preferred Units.
ITEM 1B. UNRESOLVED STAFF COMMENTS
None.
ITEM 2. PROPERTIES
A description of our properties is included in “Item 1. Business.” In addition, we own office buildings for our executive offices in Dallas, Texas and office buildings in Newton Square, Pennsylvania andPennsylvania; Houston, Texas and San Antonio, Texas. While we may require additional office space as our business expands, we believe that our existing facilities are adequate to meet our needs for the immediate future, and that additional facilities will be available on commercially reasonable terms as needed.
We believe that we have satisfactory title to or valid rights to use all of our material properties. Although some of our properties are subject to liabilities and leases, liens for taxes not yet due and payable, encumbrances securing payment obligations under
non-competition agreements and immaterial encumbrances, easements and restrictions, we do not believe that any such burdens will materially interfere with our continued use of such properties in our business, taken as a whole. In addition, we believe that we have, or are in the process of obtaining, all required material approvals, authorizations, orders, licenses, permits, franchises
and consents of, and have obtained or made all required material registrations, qualifications and filings with, the various state and local government and regulatory authorities which relate to ownership of our properties or the operations of our business.
Substantially all of our pipelines, which are described in “Item 1. Business,” are constructed on rights-of-way granted by the apparent record owners of the property. Lands over which pipeline rights-of-way have been obtained may be subject to prior liens that have not been subordinated to the right-of-way grants. We have obtained, where necessary, easement agreements from public authorities and railroad companies to cross over or under, or to lay facilities in or along, watercourses, county roads, municipal streets, railroad properties and state highways, as applicable. In some cases, properties on which our pipelines were built were purchased in fee. We also own and operate multiple natural gas and NGL storage facilities and own or lease other processing, treating and conditioning facilities in connection with our midstream operations.
ITEM 3. LEGAL PROCEEDINGS
ETC Sunoco Inc. and/or Sunoco, Inc. (R&M), (now known asHoldings LLC and Sunoco (R&M), LLC) along with other members of the petroleum industry,LLC (collectively, “Sunoco”) are defendants in lawsuits alleging MTBE contamination of groundwater. The plaintiffs, state-level governmental entities, assert product liability, claims and additional claims including nuisance, trespass, negligence, violation of environmental laws, and/or deceptive business practices.practices claims. The plaintiffs seek to recover compensatory damages, and in some cases also seek natural resource damages, injunctive relief, punitive damages, and attorneys’ fees.
As of December 31, 2017,2019, Sunoco Inc. is a defendant in sevenfive cases, including one case each initiated by the States of Maryland New Jersey, Vermont,and Rhode Island, one by the Commonwealth of Pennsylvania and two by the Commonwealth of Puerto Rico. The more recent Puerto Rico action is a companion case alleging damages for additional sites beyond those at issue in the initial Puerto Rico action. The actions brought by the State of Maryland and Commonwealth of Pennsylvania have also named as defendants Energy Transfer Partners, L.P.,ETO, ETP Holdco Corporation, and Sunoco Partners Marketing & Terminals L.P. Four of these cases are pending in a multidistrict litigation proceeding in a New York federal court; one is pending in federal court in Rhode Island, one is pending in state court in Vermont, and one is pending in state court in Maryland.(“SPMT”).
Sunoco, Inc. and Sunoco, Inc. (R&M) have reached a settlement with the State of New Jersey. The Court approved the Judicial Consent Order on December 5, 2017. Dismissal of the case against Sunoco, Inc. and Sunoco, Inc. (R&M) is expected shortly. The Maryland complaint was filed in December 2017 but was not served until January 2018.
It is reasonably possible that a loss may be realized in the remaining cases; however, we are unable to estimate the possible loss or range of loss in excess of amounts accrued. An adverse determination with respect to one or more of the MTBE cases could have a significant impact on results of operations during the period in which any such adverse determination occurs, but such an adverse determination likely would not have a material adverse effect on the Partnership’s consolidated financial position.
In January 2012, we experienced a release on our products pipeline in Wellington, Ohio. In connection with this release, the PHMSA issued a Corrective Action Order under which we are obligated to follow specific requirements in the investigation of the release and the repair and reactivation of the pipeline. This PHMSA Corrective Action Order was closed via correspondence dated November 4, 2016. No civil penalties were associated with the PHMSA Order. We also entered into an Order on Consent with the EPA regarding the environmental remediation of the release site. All requirements of the Order on Consent with the EPA have been fulfilled and the Order has been satisfied and closed. We have also received a “No Further Action” approval from the Ohio EPA for all soil and groundwater remediation requirements. In May 2016, we received a proposed penalty from the EPA and DOJ associated with this release, and continues to work with the involved parties to bring this matter to closure. The timing and outcome of this matter cannot be reasonably determined at this time. However, we do not expect there to be a material impact to our results of operations, cash flows or financial position.
In October 2016, the PHMSA issued a Notice of Probable Violation (“NOPVs”) and a Proposed Compliance Order (“PCO”) related to ourETO’s West Texas Gulf pipeline in connection with repairs being carried out on the pipeline and other administrative and procedural findings. The proposed penalty is in excess of $100,000. The case went to hearing in March 20172017. On November 14, 2019, PHMSA issued a Final Order that upheld the two alleged violations and remains open with PHMSA. We do not expect there to be a material impact to our resultsresultant civil penalty in the amount of operations, cash flows or financial position.$251,800. The full payment was made on November 27, 2019, and the case is now closed.
In April 2016, the PHMSA issued a NOPV, PCO and Proposed Civil Penalty related to certain welding practices and procedures carried outfollowed during construction of ourETO’s Permian Express 2 pipeline system in Texas. The proposed penalties are in excess of $100,000. The case went to hearing before an Administrative Hearing Officer in November 20162016. Recently, PHMSA issued a Final Order withdrawing two of the five alleged violations and remains openresulting in a reduction of the civil penalty from $1,278,100 to $882,600 along with PHMSA. We do not expect there to be a material impact to our results of operations, cash flows or financial position.ordering compliance actions.
In July 2016, the PHMSA issued a NOPV, PCO and PCOproposed civil penalty to our West Texas Gulf pipeline in connection with inspection and maintenance activities related to a 2013 incident on our crude oil pipeline near Wortham, Texas. The proposed penalties are in excess of $100,000. The case went to hearing in March 2017 and remains open with PHMSA. We do not expect there to be a material impact to our results of operations, cash flows, or financial position.
In August 2017, the2017. The Proposed Compliance Order was fully withdrawn. On November 8, 2019, PHMSA issued a NOPVFinal Order that withdrew three alleged violations and reduced the civil penalty from $1,539,800 to $1,019,200. The full payment was made on December 9, 2019 and the case is now closed.
In late 2016, FERC Enforcement Staff began a PCOnon-public investigation of Rover’s removal of the Stoneman House, a potential historic structure, in connection with alleged violations on our NederlandRover’s application for permission to Kilgoreconstruct a new interstate natural gas pipeline and related facilities. In mid-2017, FERC Enforcement Staff began a non-public investigation regarding allegations that diesel fuel may have been included in Texas. The case remains open with PHMSAthe drilling mud at the Tuscarawas River horizontal directional drilling (“HDD”) operations. Rover and the proposedPartnership are cooperating with the investigations. Enforcement Staff has provided Rover its non-public preliminary findings regarding those investigations. The company disagrees with those findings and intends to vigorously defend against any potential penalty. Given the stage of the proceedings, and the non-public nature of the investigation, the Partnership is unable at this time to provide an assessment of the potential outcome or range of potential liability, if any.
On November 3, 2017, the State of Ohio and the Ohio Environmental Protection Agency (“Ohio EPA”) filed suit against Rover and other defendants (collectively, the “Defendants”) seeking to recover approximately $2.6 million in civil penalties are in excessallegedly owed and certain injunctive relief related to permit compliance. The Defendants filed several motions to dismiss, which were granted on all counts. The Ohio EPA appealed, and on December 9, 2019, the Fifth District court of $100,000. We do not expect there to beappeals entered a material impact to our results of operations, cash flows or financial position.
In December 2016, we received multiple Notice of Violations (“NOVs”)unanimous judgment affirming the trial court. The Ohio EPA sought review from the Delaware County Regional Water Quality Control AuthorityOhio Supreme Court, which Defendants intend to oppose.
Energy Transfer Company Field Services received NOV REG-0569-1701 on June 6, 2017 for emission events that occurred January 1, 2017 through April 16, 2017 at the Jal 3 gas plant. On September 11, 2017, the New Mexico Environmental Department sent ETO a settlement offer to resolve the NOV for a penalty of $596,278. Negotiations for this settlement offer are ongoing.
Energy Transfer Company Field Services received NOV REG-0569-1702 on December 8, 2017 for emission events that occurred April 17, 2017 through September 23, 2017 at the Jal 3 gas plant. On January 31, 2018, ETO received a settlement offer to resolve the NOV for a penalty of $602,138. Negotiations for this settlement offer are ongoing.
Energy Transfer Company Field Services received NOV REG-0569-1801 on February 13, 2018 for emission events that occurred September 25, 2017 through December 29, 2017 at the Jal 3 gas plant. On June, 11, 2018, the New Mexico Environmental Department sent ETO a settlement offer to resolve the NOV for a penalty of $268,213. Negotiations for this settlement offer are ongoing.
In June 2018, ETC Northeast Pipeline LLC (“DELCORA”ETC Northeast”) in connection with a discharge at our Marcus Hook Industrial Complex (“MHIC”) in July 2016. We also entered ininto a Consent Order and Agreement from the Pennsylvania Department of Environmental Protection (“PADEP”) related to our tank inspection plan at MHIC. These actions propose penalties in excess of $100,000, and we are currently in discussions with the PADEP, pursuant to which ETC Northeast agreed to pay $150,242 to the PADEP to settle various statutory and DELCORAcommon law claims relating to soil discharge into, and erosion of the stream bed of, Raccoon Creek in Center Township, Pennsylvania during construction of the Revolution Pipeline. ETC Northeast has paid the settlement amount and continues to monitor the construction site and work with the landowner to resolve these matters.any remaining issues related to the restoration of the construction site.
Energy Transfer Company Field Services received NOV REG-0569-1802 from the New Mexico Environmental Department on July 25, 2018 for emission events that occurred January 1, 2018 through April 30, 2018 at the Jal 3 gas plant. On September 25, 2018, ETO received a settlement offer to resolve the NOV for a penalty of $1,151,499. Negotiations for this settlement offer are ongoing.
Energy Transfer Field Company Services received NOV REG-0569-1803 from the New Mexico Environmental Department on November 8, 2018 for emission events that occurred May 1, 2018 through August 31, 2018 at the Jal 3 gas plant. On December 28, 2018, ETO received a settlement offer to resolve the NOV for a penalty of $1,405,652. Negotiations for this settlement offer are ongoing.
In January 2019, we received notice from the DOJ on behalf of the EPA that a civil penalty enforcement action was being pursued under the Clean Water Act for an estimated 450 barrel crude oil release from the Mid-Valley Pipeline operated by SPLP and owned by Mid-Valley Pipeline Corporation. The release purportedly occurred in October 2014 on a nature preserve located in Hamilton County, Ohio, near Cincinnati, Ohio. After discovery and notification of the release, SPLP conducted substantial emergency response, remedial work and primary restoration in three phases and the primary restoration has been acknowledged to be complete. Operation and maintenance (O&M) activities will continue for several years. In December of 2019, SPLP reached an agreement in principal with the EPA regarding payment of a civil penalty which will be subject to public comment. The DOJ, on behalf of United States Department of Interior Fish and Wildlife, and the Ohio Attorney General, on behalf of the Ohio EPA, along with technical representatives from those agencies have been discussing natural resource damage assessment claims related to state endangered species and compensatory restoration. The timing orand outcome of these matters cannot be reasonably determined at this time; however, we do not expect there to be a material impact to our results of operations, cash flows or financial position.
The Ohio Environmental Protection Agency (“Ohio EPA”On September 10, 2018, a pipeline release and fire (the “Incident”) has alleged that various environmental violations have occurred during construction ofon the RoverRevolution pipeline, project. The alleged violations include inadvertent returns of drilling muds and fluids at horizontal directional drilling (“HDD”) locations in Ohio that affected waters of the State, storm water control violations, improper disposal of spent drilling mud containing diesel fuel residuals, and open burning. The alleged violations occurred from April 2017 to July 2017. Although Rover has successfully completed clean-up mitigation for the alleged violations to Ohio EPA’s satisfaction, the Ohio EPA has proposed penalties of approximately $2.6 million in connection with the alleged violations and is seeking certain injunctive relief. The Ohio Attorney General filed a complaint in the Court of Common Pleas of Stark County, Ohio to obtain these remedies and that case remains pending and is in the early stages. The timing or outcome of this matter cannot be reasonably determined at this time; however, we do not expect there to be a material impact to our results of operations, cash flows or financial position.
In addition, on May 10, 2017, the FERC prohibited Rover from conducting HDD activities at 27 sites in Ohio. On July 31, 2017, the FERC issued an independent third party assessment of what led to the release at the Tuscarawas River site and what Rover can do to prevent reoccurrence once the HDD suspension is lifted. Rover notified the FERC of its intention to implement the suggestions in the assessment and to implement additional voluntary protocols. In response, FERC authorized Rover to resume HDD activities at certain sites. On January 24, 2018, FERC ordered Rover to cease HDD activities at the Tuscarawas River HDD site pending FERC review of additional information from Rover. Rover continues to correspond with regulators regarding drilling operations and drilling plans at the HDD sites where Rover has not yet completed HDD activities, including the Tuscarawas River HDD site. The timing or outcome of this matter cannot be reasonably determined at this time. We do not expect there to be a material impact to its results of operations, cash flows or financial position.
In late 2016, FERC Enforcement Staff began a non-public investigation of Rover’s demolition of the Stoneman House, a potential historic structure, in connection with Rover’s application for permission to construct a new interstate natural gas pipeline and related facilities. Rover and ETP are cooperating with the investigation. In March and April 2017, Enforcement Staff provided Rover its non-public preliminary findings regarding its investigation. The company disagrees with those findings and intends to vigorously defend against any potential penalty. Given the stage of the proceeding, and the non-public nature of the preliminary findings and investigation, ETP is unable at this time to provide an assessment of the potential outcome or range of potential liability, if any.
gathering line located in Center Township, Beaver County, Pennsylvania. There were no injuries. On July 25, 2017, the Pennsylvania Environmental Hearing Board (“EHB”) issued an order to SPLP to cease HDD activities in Pennsylvania related to the Mariner East 2 project. The EHB issued the order in response to a complaint filed by environmental groups against SPLP andFebruary 8, 2019, the Pennsylvania Department of Environmental Protection (“PADEP”). On August 10, 2017 issued a Permit Hold on any requests for approvals/permits or permit amendments for any project in Pennsylvania pursuant to the parties reached a final settlement requiring that SPLP reevaluate the design parameters of approximately 26 drills on the Mariner East 2 project and approximately 43 drills on the Mariner East 2X project.state’s water laws. The settlement agreement also provides a defined framework for approval by PADEP for these drills to proceed after reevaluation. Additionally, the settlement agreement requires modifications to severalPartnership filed an appeal of the HDD plans that are part ofPermit Hold with the PADEP permits. Those modifications have been completed and agreed to byPennsylvania Environmental Hearing Board. On January 3, 2020, the parties and the reevaluation of the drills has been initiated by the company.
In addition, on June 27, 2017 and July 25, 2017, the PADEPPartnership entered into a Consent Order and Agreement with the Department in which, among other things, the Permit Hold was lifted, the Partnership agreed to pay a $28.6 million civil penalty and fund a $2 million community environmental project, and all related appeals were withdrawn.
The Pennsylvania Office of Attorney General has commenced an investigation regarding the Incident, and the United States Attorney for the Western District of Pennsylvania has issued a federal grand jury subpoena for documents relevant to the Incident. The scope of these investigations is not further known at this time.
On June 4, 2019, the Oklahoma Corporation Commission’s (“OCC”) Transportation Division filed a complaint against SPLP regarding inadvertent returnsseeking a penalty of drilling fluids at three HDD locations in Pennsylvaniaup to $1 million related to a May 2018 rupture near Edmond, Oklahoma. The rupture occurred on the Mariner East 2 project. Those agreements requireNoble to Douglas 8” pipeline in an area of external corrosion and caused the release of approximately fifteen barrels of crude oil. SPLP responded immediately to cease HDD activities at those three locations until PADEP reauthorizes such activitiesthe release and remediated the surrounding environment and pipeline in cooperation with the OCC. The OCC filed the complaint alleging that SPLP failed to submit a corrective action plan for agency review and approval.provide adequate cathodic protection to the pipeline causing the failure. SPLP is working to fulfillnegotiating a settlement agreement with the requirements of those agreements and has been authorized by PADEP to resume drilling at one of the three locations.OCC for a lesser penalty.
On January 3, 2018, PADEP issued an Administrative Order to Sunoco Pipeline L.P. directing that work on the Mariner East 2 and 2X pipelines be stopped. The Administrative Order detailed alleged violations of the permits issued by PADEP in February of 2017, during the construction of the project. Sunoco Pipeline L.P. began working with PADEP representatives immediately after the Administrative Order was issued to resolve the compliance issues. Those compliance issues could not be fully resolved by the deadline to appeal the Administrative Order, so Sunoco Pipeline L.P. took an appeal of the Administrative Order to the Pennsylvania Environmental Hearing Board on February 2, 2018. On February 8, 2018, Sunoco Pipeline L.P. entered into a Consent Order and Agreement with PADEP that (1) withdraws the Administrative Order; (2) establishes requirements for compliance with permits on a going forward basis; (3) resolves the non-compliance alleged in the Administrative Order; and (4) conditions restart of work on an agreement by Sunoco Pipeline L.P. to pay a $12.6 million civil penalty to the Commonwealth of Pennsylvania. In the Consent Order and agreement, Sunoco Pipeline L.P. admits to the factual allegations, but does not admit to the conclusions of law that were made by PADEP. PADEP also found in the Consent Order and Agreement that Sunoco Pipeline L.P. had adequately addressed the issues raised in the Administrative Order and demonstrated an ability to comply with the permits. Sunoco Pipeline L.P. concurrently filed a request to the Pennsylvania Environmental Hearing Board to discontinue the appeal of the Administrative Order. That request was granted on February 8, 2018.
On January 18, 2018, PHMSA issued a NOPV and a Proposed Civil Penalty in connection with alleged violations on our East Boston jet fuel pipeline in Boston, MA. The case remains open with PHMSA and the proposed penalties are in excess of $100,000. We do not expect there to be a material impact to its results of operations, cash flows or financial position.
On January 18, PHMSA issued a NOPV and a PCO in connection with alleged violations on Eastern Area refined products and crude oil pipeline system in the States of MI, OH, PA, NY, NJ and DE. The case remains open with PHMSA and the proposed penalties are in excess of $100,000. We do not expect there to be a material impact to its results of operations, cash flows or financial position.
Additionally, we have received notices of violations and potential fines under various federal, state and local provisions relating to the discharge of materials into the environment or protection of the environment. While we believe that even if any one or more of the environmental proceedings listed above were decided against us, it would not be material to our financial position, results of operations or cash flows, we are required to report governmental proceedings if we reasonably believe that such proceedings will result in monetary sanctions in excess of $100,000.
For a description of other legal proceedings, see Note 1110 to our consolidated financial statements included in “Item 8. Financial Statements and Supplementary Data.”
ITEM 4. MINE SAFETY DISCLOSURES
Not applicable.
PART II
ITEM 5. MARKET FOR REGISTRANT’S COMMON UNITS, RELATED UNITHOLDER
MATTERS AND ISSUER PURCHASES OF EQUITY SECURITIES
Market Price of and Distributions on the Common Units and Related Unitholder Matters
Our Common Units are listed on the NYSE under the symbol “ETP.” The following table sets forth, for the periods indicated, the high and low sales prices per Common Unit, as reported on the NYSE Composite Tape, and the amount of cash distributions paid per Common Unit for the periods indicated.
|
| | | | | | | | | | | |
| | Price Range | | Cash Distribution(1) |
| | High | | Low | |
| Fiscal Year 2017 | | | | | |
| Fourth Quarter | $ | 18.75 |
| | $ | 15.71 |
| | $ | 0.5650 |
|
| Third Quarter | 21.68 |
| | 17.85 |
| | 0.5650 |
|
| Second Quarter | 24.71 |
| | 18.31 |
| | 0.5500 |
|
| First Quarter | 26.73 |
| | 22.90 |
| | 0.5350 |
|
| | | | | | |
| Fiscal Year 2016 | | | | | |
| Fourth Quarter | $ | 28.61 |
| | $ | 22.07 |
| | $ | 0.5200 |
|
| Third Quarter | 31.49 |
| | 26.88 |
| | 0.5100 |
|
| Second Quarter | 29.77 |
| | 22.63 |
| | 0.5000 |
|
| First Quarter | 28.72 |
| | 15.43 |
| | 0.4890 |
|
| |
(1)
| Distributions are shown in the quarter with respect to which they relate. Please see “Cash Distribution Policy” below for a discussion of our policy regarding the payment of distributions. |
Description of Units
Common Units
As of February 16, 2018, there were approximately 506,829 individual Common Unitholders, which includes Common Units held in street name. The Common Units are entitled to distributions of Available Cash as described below under “Cash Distribution Policy.”
Class E Units
There are currently 8.9 million Class E Units outstanding, all of which are currently owned by HHI. The Class E Units generally do not have any voting rights. The Class E Units are entitled to aggregate cash distributions equal to 11.1% of the total amount of cash distributed to all Unitholders, including the Class E Unitholders, up to $1.41 per unit per year. As the Class E Units are owned by a wholly-owned subsidiary, the cash distributions on those units are eliminated in our consolidated financial statements. Although no plans are currently in place, management may evaluate whether to retire the Class E Units at a future date.
Class G Units
There are currently 90.7 million Class G Units outstanding, all of which are held by a wholly-owned subsidiary of the Partnership. The Class G Units generally do not have any voting rights. The Class G Units are entitled to aggregate cash distributions equal to 35% of the total amount of cash generated by us and our subsidiaries, other than ETP Holdco, and available for distribution, up to a maximum of $3.75 per Class G Unit per year. Allocations of depreciation and amortization to the Class G Units for tax purposes are based on a predetermined percentage and are not contingent on whether ETP has net income or loss. These units are reflected as treasury units in the consolidated financial statements.
Class I Units
The Class I Units are held by ETE and are not currently entitled to any distributions.
Class J Units
On July 27, 2016, the Partnership issued to ETE an aggregate amount of 180 Class J units representing limited partner interests in the Partnership (the “Class J Units”). A portion of the additional Class J Units will be issued during each of 2016, 2017 and 2018. Each Class J Unit is entitled to an allocation of $10.0 million of depreciation, amortization, depletion or other form of cost-recovery during the year in which such Class J Unit was issued; no Class J Unit is entitled to any other allocations of depreciation, amortization, depletion or other cost-recovery in any other year, and such units are not entitled to any cash distributions at any time. In exchange for the issuance of the Class J Units, ETP’s partnership agreement was amended to further reduce incentive distributions commencing with the quarter ended June 30, 2016 and ending with the quarter ending December 31, 2017, in an aggregate amount of $720 million.
Class K Units
On December 29, 2016, the Partnership issued to certain of its indirect subsidiaries, in exchange for cash contributions and the exchange of outstanding common units representing limited partner interests in the Partnership, Class K Units, each of which is entitled to a quarterly cash distribution of $0.67275 per Class K Unit prior to ETP making distributions of available cash to any class of units, excluding any cash available distributions or dividends or capital stock sales proceeds received by ETP from ETP Holdco. If the Partnership is unable to pay the Class K Unit quarterly distribution with respect to any quarter, the accrued and unpaid distributions will accumulate until paid and any accumulated balance will accrue 1.5% per annum until paid. As of December 31, 2017, a total of 101.5 million Class K Units were held by wholly-owned subsidiaries of ETP.
General Partner Interest
As of December 31, 2017, our General Partner owned an approximate 0.3% general partner interest in us and the holders of Common Units, Class E, Class G, Class I, Class J, and Class K Units collectively owned a 99.7% limited partner interest in us.
Incentive Distribution Rights
IDRs represent the contractual right, pursuant to the terms of our partnership agreement, of our general partner to receive a specified percentage of quarterly distributions of Available Cash from operating surplus after the minimum quarterly distribution has been paid. Please read “Distributions of Available Cash from Operating Surplus” below.
ETPETO Preferred Units
In November 2017, ETPETO issued 950,000 of its 6.250% Series A Preferred Units at a price of $1,000 per unit and 550,000 of its 6.625% Series B Preferred Units at a price of $1,000 per unit. In April 2018, ETO issued 18 million of its 7.375% Series C Preferred Units at a price of $25 per unit. In July 2018, ETO issued 17.8 million of its 7.625% Series D Preferred Units at a price of $25 per unit. In April 2019, ETO issued 32 million of its 7.600% Series E Preferred Units at a price of $25 per unit. In January 2020, ETO issued 500,000 of its 6.75% Series F Preferred Units at a price of $1,000 per unit and 1.1 million of its 7.125% Series G Preferred Units at a price of $1,000 per unit.
ETO Series A Preferred Units
Distributions on the Series A Preferred Units will accrue and be cumulative from and including the date of original issue to, but excluding, February 15, 2023, at a rate of 6.250% per annum of the stated liquidation preference of $1,000. On and after February 15, 2023, distributions on the Series A Preferred Units will accumulate at a percentage of the $1,000 liquidation preference equal to an annual floating rate of the three-month LIBOR, determined quarterly, plus a spread of 4.028% per annum. The Series A Preferred Units are redeemable at ETP’sETO’s option on or after February 15, 2023 at a redemption price of $1,000 per Series A Preferred Unit, plus an amount equal to all accumulated and unpaid distributions thereon to, but excluding, the date of redemption.
ETO Series B Preferred Units
Distributions on the Series B Preferred Units will accrue and be cumulative from and including the date of original issue to, but excluding, February 15, 2028, at a rate of 6.625% per annum of the stated liquidation preference of $1,000. On and after February 15, 2028, distributions on the Series B Preferred Units will accumulate at a percentage of the $1,000 liquidation preference equal to an annual floating rate of the three-month LIBOR, determined quarterly, plus a spread of 4.155% per annum. The Series B Preferred Units are redeemable at ETP’sETO’s option on or after February 15, 2028 at a redemption price of $1,000 per Series B Preferred Unit, plus an amount equal to all accumulated and unpaid distributions thereon to, but excluding, the date of redemption.
ETO Series C Preferred Units
Distributions on the Series C Preferred Units will accrue and be cumulative from and including the date of original issue to, but excluding, May 15, 2023, at a rate of 7.375% per annum of the stated liquidation preference of $25. On and after May 15, 2023, distributions on the Series C Preferred Units will accumulate at a percentage of the $25 liquidation preference equal to an annual floating rate of the three-month LIBOR, determined quarterly, plus a spread of 4.530% per annum. The Series C Preferred Units are redeemable at ETO’s option on or after May 15, 2023 at a redemption price of $25 per Series C Preferred Unit, plus an amount equal to all accumulated and unpaid distributions thereon to, but excluding, the date of redemption.
ETO Series D Preferred Units
Distributions on the Series D Preferred Units will accrue and be cumulative from and including the date of original issue to, but excluding, August 15, 2023, at a rate of 7.625% per annum of the stated liquidation preference of $25. On and after August 15, 2023, distributions on the Series D Preferred Units will accumulate at a percentage of the $25 liquidation preference equal to an annual floating rate of the three-month LIBOR, determined quarterly, plus a spread of 4.738% per annum. The Series D Preferred Units are redeemable at ETO’s option on or after August 15, 2023 at a redemption price of $25 per Series D Preferred Unit, plus an amount equal to all accumulated and unpaid distributions thereon to, but excluding, the date of redemption.
ETO Series E Preferred Units
Distributions on the Series E Preferred Units will accrue and be cumulative from and including the date of original issue to, but excluding, May 15, 2024, at a rate of 7.600% per annum of the stated liquidation preference of $25. On and after May 15, 2024, distributions on the Series E Preferred Units will accumulate at a percentage of the $25 liquidation preference equal to an annual floating rate of the three-month LIBOR, determined quarterly, plus a spread of 5.161% per annum. The Series E Preferred Units are redeemable at ETO’s option on or after May 15, 2024 at a redemption price of $25 per Series E Preferred Unit, plus an amount equal to all accumulated and unpaid distributions thereon to, but excluding, the date of redemption.
ETO Series F Preferred Units
On January 22, 2020, the Partnership issued 500,000 of its 6.750% Series F Fixed-Rate Reset Cumulative Redeemable Perpetual Preferred Units representing limited partner interest in the Partnership, at a price to the public of $1,000 per unit. Distributions on the Series F Preferred Units are cumulative from and including the original issue date and will be payable semi-annually in arrears on the 15th day of May and November of each year, commencing on May 15, 2020 to, but excluding, May 15, 2025, at a rate equal to 6.750% per annum of the $1,000 liquidation preference. On and after May 15, 2025, the distribution rate on the Series F Preferred Units will equal a percentage of the $1,000 liquidation preference equal to the five-year U.S. treasury rate plus a spread of 5.134% per annum. The Series F Preferred Units are redeemable at ETO’s option on or after May 15, 2025 at a redemption price of $1,000 per Series F Preferred Unit, plus an amount equal to all accumulated and unpaid distributions thereon to, but excluding, the date of redemption.
ETO Series G Preferred Units
On January 22, 2020, the Partnership issued 1,100,000 of its 7.125% Series G Fixed-Rate Reset Cumulative Redeemable Perpetual Preferred Units representing limited partner interest in the Partnership, at a price to the public of $1,000 per unit. Distributions on the Series G Preferred Units are cumulative from and including the original issue date and will be payable semi-annually in arrears on the 15th day of May and November of each year, commencing on May 15, 2020 to, but excluding, May 15, 2030, at a rate equal to 7.125% per annum of the $1,000 liquidation preference. On and after May 15, 2030, the distribution rate on the Series G Preferred Units will equal a percentage of the $1,000 liquidation preference equal to the five-year U.S. treasury rate plus a spread of 5.306% per annum. The Series G Preferred Units are redeemable at ETO’s option on or after May 15, 2030 at a redemption price of $1,000 per Series G Preferred Unit, plus an amount equal to all accumulated and unpaid distributions thereon to, but excluding, the date of redemption.
Cash Distribution Policy
General. We will distribute all of our “Available Cash” to our Unitholders and our General Partner within 45 days following the end of each fiscal quarter. Our general partner does not receive a distribution.
Definition of Available Cash. Available Cash is defined in our Partnership Agreement and generally means, with respect to any calendar quarter, all cash on hand at the end of such quarter:
Less the amount of cash reserves that are necessary or appropriate in the reasonable discretion of the General Partner to:
provide for the proper conduct of our business;
comply with applicable law and/or debt instrument or other agreementbusiness (including reserves for future capital expenditures and for our future capital needs);
comply with applicable law and/or debt instrument or other agreement; or
provide funds for distributions to Unitholders and our General Partner in respect of any one or more of the next four quarters.Preferred Unitholders.
Plus all cash on hand on the date of determination of Available Cash for the quarter resulting from working capital borrowings made after the end of the quarter. Working capital borrowings are generally borrowings that are made under our credit facilities and in all cases used solely for working capital purposes or to pay distributions to partners.
Available Cash is more fully defined in our Partnership Agreement, which is an exhibit to this report.
Operating Surplus and Capital Surplus
General. All cash distributed to our Unitholders is characterized as either “operating surplus” or “capital surplus.” We distribute available cash from operating surplus differently than available cash from capital surplus.
Definition of Operating Surplus. Our operating surplus for any period generally means:
our cash balance on the closing date of our initial public offering; plus
$15 million (as described below); plus
all of our cash receipts since the closing of our initial public offering, excluding cash from interim capital transactions such as borrowings that are not working capital borrowings, sales of equity and debt securities and sales or other dispositions of assets outside the ordinary course of business; plus
our working capital borrowings made after the end of a quarter but before the date of determination of operating surplus for the quarter; plus
legacy ETP’s operating surplus at the time of closing of the merger between legacy ETP and the Partnership in April 2017; less
all of our operating expenditures after the closing of our initial public offering, including the repayment of working capital borrowings, but not the repayment of other borrowings, and including maintenance capital expenditures; less
the amount of our cash reserves that our General Partner deems necessary or advisable to provide funds for future operating expenditures.
Definition of Capital Surplus. Generally, our capital surplus will be generated only by:
borrowings other than working capital borrowings;
sales of our debt and equity securities; and
sales or other disposition of assets for cash, other than inventory, accounts receivable and other current assets sold in the ordinary course of business or as part of normal retirements or replacements of assets.
Characterization of Cash Distributions. We will treat all Available Cash distributed as coming from operating surplus until the sum of all Available Cash distributed since we began operations equals the operating surplus as of the most recent date of determination of Available Cash. We will treat any amount distributed in excess of operating surplus, regardless of its source, as capital surplus. As defined in our Partnership Agreement, operating surplus includes $25 million (consisting of $15 million related to the legacy Sunoco Logistics operating surplus and $10 million related to the legacy ETP operating surplus) in addition to our cash balance on the closing date of our initial public offering, cash receipts from our operations and cash from working capital borrowings. This amount does not reflect actual cash on hand that is available for distribution to our Unitholders. Rather, it is a provision that enables us, if we choose, to distribute as operating surplus up to $25 million of cash we receive in the future from non-operating sources, such as asset sales, issuances of securities, and long-term borrowings, that would otherwise be distributed as capital surplus. We have not made, and we anticipate that we will not make, any distributions from capital surplus.
Distributions of Available Cash from Operating Surplus
The terms of our partnership agreement require that we make cash distributions with respect to each calendar quarter within 45 days following the end of each calendar quarter. As discussed above under “Description of Units – Class K Units” and “Description of Units – ETP Preferred Units,” the Class K Units, the Series A Preferred Units and the Series B Preferred Units are entitled to distributions from ETP prior to ETP making quarterly distributions of Available Cash to other classes of units. We are required to make distributions of remaining Available Cash from operating surplus for any quarter in the following manner:
First, 100% to all Common Unitholders, Class E Unitholders and Class G Unitholders and the general partner, in accordance with their percentage interests, until each Common Unit has received $0.075 per unit for such quarter (the “minimum quarterly distribution”);
Second, 100% to all Common Unitholders, Class E Unitholders and Class G Unitholders and the general partner, in accordance with their respective percentage interests, until each Common Unit has received $0.0833 per unit for such quarter (the “first target distribution”);
Third, (i) to the general partner in accordance with its percentage interest, (ii) 13% to the holders of the IDRs, pro rata, and (iii) to all Common Unitholders, Class E Unitholders and Class G Unitholders, pro rata, a percentage equal to 100% less the percentages applicable to the general partner and holders of the IDRs, until each Common Unit has received $0.0958 per unit for such quarter (the “second target distribution”);
Fourth, (i) to the general partner in accordance with its percentage interest, (ii) 35% to the holders of the IDRs, pro rata, and (iii) to all Common Unitholders, Class E Unitholders and Class G Unitholders, pro rata, a percentage equal to 100% less the percentages applicable to the general partner and holders of the IDRs, until each Common Unit has received $0.2638 per unit for such quarter (the “third target distribution”); and
Fifth, thereafter, (i) to the general partner in accordance with its percentage interest, (ii) 48% to the holder of the IDRs, pro rata, and (iii) to all Common Unitholders, Class E Unitholders and Class G Unitholders, pro rata, a percentage equal to 100% less the percentages applicable to the general partner and holders of the IDRs.
The allocation of distributions among the Common, Class E and Class G Unitholders and the General Partner is based on their respective interests as of the record date for such distributions.
Notwithstanding the foregoing, the distributions on each Class E unit may not exceed $1.41 per year and distributions on each Class G unit may not exceed $3.75 per year. In addition, the distributions to the holders of the incentive distribution rights will not exceed the amount the holders of the incentive distributions rights would otherwise receive if the available cash for distribution were reduced to the extent it constitutes amounts previously distributed with respect to the Class G units.
The incentive distributions described above do not reflect the impact of IDR subsidies previously agreed to by ETE in connection with previous transactions, as described below under “IDR Subsidies.”
Distributions of Available Cash from Capital Surplus
We will make distributions of any Available Cash from capital surplus in the following manner:
First, to all of our Unitholders and to our General Partner, in accordance with their percentage interests, until we distribute for each Common Unit, an amount of available cash from capital surplus equal to our initial public offering price; and
Thereafter, we will make all distributions of Available Cash from capital surplus as if they were from operating surplus.
Our Partnership Agreement treats a distribution of capital surplus as the repayment of the initial unit price from the initial public offering, which is a return of capital. The initial public offering price per Common Unit less any distributions of capital surplus per unit is referred to as the “unrecovered capital.”
If we combine our units into fewer units or subdivide our units into a greater number of units, we will proportionately adjust our minimum quarterly distribution; our target cash distribution levels; and our unrecovered capital. For example, if a two-for-one split of our Common Units should occur, our unrecovered capital would be reduced to 50% of the initial level. We will not make any adjustment by reason of our issuance of additional units for cash or property.
In addition, if legislation is enacted or if existing law is modified or interpreted in a manner that causes us to become taxable as a corporation or otherwise subject to additional taxation as an entity for federal, state or local income tax purposes, under the terms of the Partnership Agreement, we can reduce our minimum quarterly distribution and the target cash distribution levels by multiplying the same by one minus the sum of the highest marginal federal corporate income tax rate that could apply and any increase in the effective overall state and local income tax rates.
IDR Subsidies and Other Distribution Adjustments
As described above, our partnership agreement requires certain incentive distributions to the holders of the IDRs.
In connection with previous transactions, ETE has agreed to relinquish its right to the following amounts of incentive distributions in future periods:
|
| | | | |
| | | Total Year |
| 2018 | | $ | 153 |
|
| 2019 | | 128 |
|
| Each year beyond 2019 | | 33 |
|
Recent Sales of Unregistered Securities
None.
Issuer Purchases of Equity Securities
None.
Securities Authorized for Issuance Under Equity Compensation Plans
For information on the securities authorized for issuance under ETP’s equity compensation plans, see “Item 12. Security Ownership of Certain Beneficial Owners and Management and Related Unitholder Matters.”
ITEM 6. SELECTED FINANCIAL DATA
The selected financial data should be read in conjunction with “Item 7. Management’s Discussion and Analysis of Financial Condition and Results of Operations” and the historical consolidated financial statements and the accompanying notes thereto included elsewhere in this report. The amounts in the table below, except per unit data, are in millions.
As discussed in Note 1 to the consolidated financial statements in “Item 8. Financial Statements and Supplementary Data” the Energy Transfer Merger resulted in the retrospective adjustment to consolidate Sunoco LP and Lake Charles LNG for all periods presented and USAC beginning April 2, 2018.
As discussed in Note 1 to the consolidated financial statements in “Item 8. Financial Statements and Supplementary Data” the merger of legacy ETPETO (the entity named Energy Transfer Partners, L.P. prior to the merger) and legacy Sunoco Logistics in April 2017 resulted in legacy ETPETO being treated as the surviving entity from an accounting perspective. Accordingly, the selected financial data below reflects the consolidated financial information of legacy ETP, except otherwise noted.ETO.
The historical common units, cash distributions per unit and net income (loss) per limited partner unit amounts presented in these consolidated financial statements have been retrospectively adjusted to reflect the 1.5 to one unit-for-unit exchange in connection with the Sunoco Logistics Merger.
As discussed in Note 2 to the Partnership’s consolidated financial statements included in “Item 8. Financial Statements and Supplementary Data,” in the fourth quarter of 2017, the Partnership changed its accounting policy related to certain inventories. Certain crude oil, refined product and NGL inventories were changed from last-in, first-out (“LIFO”) method to the weighted average cost method. These changes have been applied retrospectively to all periods presented, and the prior period amounts reflected below have been adjusted from those amounts previously reported.
|
| | | | | | | | | | | | | | | | | | | |
| | Years Ended December 31, |
| | 2017 | | 2016* | | 2015* | | 2014* | | 2013* |
| Statement of Operations Data: | | | | | | | | | |
| Total revenues | $ | 29,054 |
| | $ | 21,827 |
| | $ | 34,292 |
| | $ | 55,475 |
| | $ | 48,335 |
|
| Operating income | 2,397 |
| | 1,761 |
| | 2,227 |
| | 2,393 |
| | 1,655 |
|
| Income from continuing operations | 2,501 |
| | 583 |
| | 1,489 |
| | 1,185 |
| | 749 |
|
| Net income (loss) per Common Unit | 0.94 |
| | (1.38 | ) | | (0.07 | ) | | 1.16 |
| | (0.10 | ) |
| Diluted net income (loss) per Common Unit | 0.93 |
| | (1.38 | ) | | (0.08 | ) | | 1.15 |
| | (0.10 | ) |
Cash distributions per common unit (1) | 2.22 |
| | 2.02 |
| | 1.79 |
| | 1.50 |
| | 1.23 |
|
Cash distributions per common unit - Legacy ETP (2) | N/A |
| | 2.81 |
| | 2.77 |
| | 2.57 |
| | 2.41 |
|
| Balance Sheet Data (at period end): | | | | | | | | | |
| Total assets | 77,965 |
| | 70,105 |
| | 65,128 |
| | 62,505 |
| | 49,937 |
|
| Long-term debt, less current maturities | 32,687 |
| | 31,741 |
| | 28,553 |
| | 24,831 |
| | 19,761 |
|
| Total equity | 34,151 |
| | 26,441 |
| | 26,986 |
| | 25,298 |
| | 18,731 |
|
| Other Financial Data: | | | | | | | | | |
| Capital expenditures: | | | | | | | | | |
| Maintenance (accrual basis) | 429 |
| | 368 |
| | 485 |
| | 444 |
| | 391 |
|
| Growth (accrual basis) | 5,472 |
| | 5,442 |
| | 7,682 |
| | 5,050 |
| | 2,936 |
|
| Cash paid for acquisitions | 264 |
| | 1,227 |
| | 804 |
| | 2,367 |
| | 1,737 |
|
* As adjusted for the change in accounting policy related to inventory valuation, as discussed above. |
| | | | | | | | | | | | | | | | | | | |
| | Years Ended December 31, |
| | 2019 | | 2018 | | 2017 | | 2016 | | 2015 |
| Statement of Operations Data: | | | | | | | | | |
| Total revenues | $ | 54,032 |
| | $ | 54,087 |
| | $ | 40,523 |
| | $ | 31,792 |
| | $ | 36,096 |
|
| Operating income | 7,285 |
| | 5,402 |
| | 2,765 |
| | 1,975 |
| | 2,341 |
|
| Income from continuing operations | 5,186 |
| | 4,039 |
| | 2,952 |
| | 911 |
| | 1,371 |
|
| Balance Sheet Data (at period end): | | | | | | | | | |
| Assets held for sale | — |
| | — |
| | 3,313 |
| | 3,588 |
| | 3,681 |
|
| Total assets | 98,525 |
| | 88,442 |
| | 86,484 |
| | 78,984 |
| | 71,117 |
|
| Liabilities associated with assets held for sale | — |
| | — |
| | 75 |
| | 48 |
| | 42 |
|
| Long-term debt, less current maturities | 50,334 |
| | 37,853 |
| | 36,971 |
| | 36,251 |
| | 30,505 |
|
| Total equity | 35,307 |
| | 36,621 |
| | 36,967 |
| | 28,938 |
| | 29,968 |
|
| Other Financial Data: | | | | | | | | | |
| Capital expenditures: | | | | | | | | | |
Maintenance (accrual basis) (1) | 652 |
| | 510 |
| | 479 |
| | 474 |
| | 550 |
|
Growth (accrual basis) (1) | 4,602 |
| | 5,120 |
| | 5,601 |
| | 5,775 |
| | 8,046 |
|
| Cash paid for acquisitions | 7 |
| | 429 |
| | 583 |
| | 1,398 |
| | 964 |
|
| |
(1) | Represents cash distributions of legacyMaintenance and growth capital expenditures include Sunoco Logistics throughLP’s capital expenditures related to discontinued operations for the closing of the Sunoco Logistics Mergeryears ended December 31, 2016 and ETP thereafter. |
| |
(2)
| Represents cash distributions on legacy ETP common units through the closing of the Sunoco Logistics Merger.2015. |
ITEM 7. MANAGEMENT’S DISCUSSION AND ANALYSIS OF FINANCIAL CONDITION
AND RESULTS OF OPERATIONS
(Tabular dollar and unit amounts, except per unit data, are in millions)
The following is a discussion of our historical consolidated financial condition and results of operations and should be read in conjunction with our historical consolidated financial statements and accompanying notes thereto included in “Item 8. Financial Statements and Supplementary Data” of this report. This discussion includes forward-looking statements that are subject to risk and uncertainties. Actual results may differ substantially from the statements we make in this section due to a number of factors that are discussed in “Item 1A. Risk Factors” included in this report.
References to “we,” “us,” “our,” the “Partnership” and “ETP”“ETO” shall mean Energy Transfer Partners,Operating, L.P. and its subsidiaries.
Overview
The primary activities and operating subsidiaries through which we conduct those activities are as follows:
| |
| • | natural gas operations, including the following: |
| |
| • | natural gas midstream and intrastate transportation and storage; |
| |
| • | interstate natural gas transportation and storage; and |
Natural gas operations, including the following:
natural gas midstream and intrastate transportation and storage; and
interstate natural gas transportation and storage.
Crudecrude oil, NGLsNGL and refined productproducts transportation, terminalling services and acquisition and marketing activities, as well as NGL storage and fractionation services.
In addition, we own investments in other businesses, including Sunoco LP and USAC, both of which are publicly traded master limited partnerships.
Recent Developments
January 2018 Sunoco LP Common Units Repurchase
In February 2018, after the record date for Sunoco LP’s fourth quarter 2017 cash distributions, Sunoco LP repurchased 17,286,859 Sunoco LP common units owned by ETP for aggregate cash consideration of approximately $540 million. ETP used the proceeds from the sale of the Sunoco LP common units to repay amounts outstanding under its revolving credit facility.
CDM Contribution Agreement
In January 2018, ETP entered into a contribution agreement (“CDM Contribution Agreement”) with ETP GP, ETC Compression, LLC, USACSeries F and ETE, pursuant to which, among other things, ETP will contribute to USAC and USAC will acquire from ETP all of the issued and outstanding membership interests of CDM and CDM E&T for aggregate consideration of approximately $1.7 billion, consisting of (i) 19,191,351 common units representing limited partner interests in USAC (“USAC Common Units”), with a value of approximately $335 million, (ii) 6,397,965 units of a newly authorized and established class of units representing limited partner interests in USAC (“Class B Units”), with a value of approximately $112 million and (iii) an amount in cash equal to $1.225 billion, subject to certain adjustments. The Class B Units that ETP will receive will be a new class of partnership interests of USAC that will have substantially all of the rights and obligations of a USAC Common Unit, except the Class B Units will not participate in distributions made prior to the one year anniversary of the closing date of the CDM Contribution Agreement (such date, the “Class B Conversion Date”) with respect to USAC Common Units. On the Class B Conversion Date, each Class B Unit will automatically convert into one USAC Common Unit. The transaction is expected to close in the first half of 2018, subject to customary closing conditions.
In connection with the CDM Contribution Agreement, ETP entered into a purchase agreement with ETE, Energy Transfer Partners, L.L.C. (together with ETE, the “GP Purchasers”), USAC Holdings and, solely for certain purposes therein, R/C IV USACP Holdings, L.P., pursuant to which, among other things, the GP Purchasers will acquire from USAC Holdings (i) all of the outstanding limited liability company interests in USA Compression GP, LLC, the general partner of USAC (“USAC GP”), and (ii) 12,466,912 USAC Common Units for cash consideration equal to $250 million.
ETP Credit Facilities
On December 1, 2017 the Partnership entered into a five-year, $4.0 billion unsecured revolving credit facility, which matures December 1, 2022 (the “ETP Five-Year Facility”) and a $1.0 billion 364-day revolving credit facility that matures on November 30, 2018 (the “ETP 364-Day Facility”) (collectively, the “ETP Credit Facilities”).
ETPSeries G Preferred Units Issuance
In November 2017, ETPOn January 22, 2020, ETO issued 950,000500,000 of its 6.250%6.750% Series AF Preferred Units at a price of $1,000 per unit and 550,0001,100,000 of its 6.625%7.125% Series BG Preferred Units at a price of $1,000 per unit. See additional information included in “Description of Units – ETPThe net proceeds were used to repay amounts outstanding under ETO’s revolving credit facility and for general partnership purposes.
Preferred Units” in “Item 5. Market for Registrant’s Common Units, Related Unitholder Matters and Issuer Purchases of Equity Securities.”
ETPETO January 2020 Senior Notes Offering and Redemption
In September 2017,On January 22, 2020, ETO completed a registered offering (the “January 2020 Senior Notes Offering”) of $1.00 billion aggregate principal amount of the Partnership’s 2.900% Senior Notes due 2025, $1.50 billion aggregate principal amount of the Partnership’s 3.750% Senior Notes due 2030 and $2.00 billion aggregate principal amount of the Partnership’s 5.000% Senior Notes due 2050, (collectively, the “Notes”). The Notes are fully and unconditionally guaranteed by the Partnership’s wholly owned subsidiary, Sunoco Logistics Partners Operations L.P., on a senior unsecured basis.
Utilizing proceeds from the January 2020 Senior Notes Offering, ETO redeemed its $400 million aggregate principal amount of 5.75% Senior Notes due September 1, 2020, its $1.05 billion aggregate principal amount of 4.15% Senior Notes due October 1, 2020, its $1.14 billion aggregate principal amount of 7.50% Senior Notes due October 15, 2020, its $250 million aggregate principal amount of 5.50% Senior Notes due February 15, 2020, ET’s $52 million aggregate principal amount of 7.50% Senior Notes due October 15, 2020 and Transwestern’s $175 million aggregate principal amount of 5.36% Senior Notes due December 9, 2020.
ETO Term Loan
On October 17, 2019, ETO entered into a term loan credit agreement (the “ETO Term Loan”) providing for a $2.00 billion three-year term loan credit facility. Borrowings under the term loan agreement mature on October 17, 2022 and are available for working capital purposes and for general partnership purposes. The term loan agreement is unsecured and is guaranteed by our subsidiary, Sunoco Logistics Partners Operations L.P.
As of ETP,December 31, 2019, the ETO Term Loan had $2.00 billion outstanding and was fully drawn. The weighted average interest rate on the total amount outstanding as of December 31, 2019 was 2.78%.
ET Contribution of SemGroup Assets to ETO
On December 5, 2019, ET completed the acquisition of SemGroup. During the first quarter of 2020, ET contributed certain SemGroup assets to ETO through sale and contribution transactions. The Partnership and SemGroup are under common control by ET subsequent to ET’s acquisition of SemGroup; therefore, we will account for these transactions as reorganizations of entities under common control. Accordingly, beginning with the quarter ending March 31, 2020, the Partnership’s consolidated financial statements will be retrospectively adjusted to reflect the consolidation of the contributed SemGroup businesses beginning December 5, 2019 (the date ET acquired SemGroup).
JC Nolan Pipeline
On July 1, 2019, ETO and Sunoco LP entered into a joint venture on the JC Nolan diesel fuel pipeline to West Texas and the JC Nolan terminal. ETO operates the pipeline for the joint venture, which transports diesel fuel from Hebert, Texas to a terminal in the Midland, Texas area. The diesel fuel pipeline has an initial capacity of 30,000 barrels per day and was successfully commissioned in August 2019.
Series E Preferred Units Issuance
In April 2019, ETO issued 32 million of its 7.600% Series E Preferred Units at a price of $25 per unit, including 4 million Series E Preferred Units pursuant to the underwriters’ exercise of their option to purchase additional preferred units. The total gross proceeds from the Series E Preferred Unit issuance were $800 million, including $100 million from the underwriters’ exercise of their option to purchase additional preferred units. The net proceeds were used to repay amounts outstanding under ETO’s revolving credit facility and for general partnership purposes.
ET-ETO Senior Notes Exchange
In March 2019, ETO issued approximately $4.21 billion aggregate principal amount of senior notes to settle and exchange approximately 97% of ET’s outstanding senior notes. In connection with this exchange, ETO issued $1.14 billion aggregate principal amount of 7.50% senior notes due 2020, $995 million aggregate principal amount of 4.25% senior notes due 2023, $1.13 billion aggregate principal amount of 5.875% senior notes due 2024 and $956 million aggregate principal amount of 5.50% senior notes due 2027.
ETO 2019 Senior Notes Offering and Redemption
In January 2019, ETO issued $750 million aggregate principal amount of 4.00%4.50% senior notes due 2027 and2024, $1.50 billion aggregate principal amount of 5.40%5.25% senior notes due 2047.2029 and $1.75 billion aggregate principal amount of 6.25% senior notes due 2049. The $2.22$3.96 billion net proceeds from the offering were used to repay in full ET’s outstanding senior secured term loan, to redeem alloutstanding senior notes, to repay a portion of the $500borrowings under the Partnership’s revolving credit facility and for general partnership purposes.
Panhandle Senior Notes Redemption
In June 2019, Panhandle’s $150 million aggregate principal amount of ETLP’s 6.5%8.125% senior notes matured and were repaid with borrowings under an affiliate loan agreement with ETO.
Bakken Senior Notes Offering
In March 2019, Midwest Connector Capital Company LLC, a wholly-owned subsidiary of Dakota Access, issued $650 million aggregate principal amount of 3.625% senior notes due 2021,2022, $1.00 billion aggregate principal amount of 3.90% senior notes due 2024 and $850 million aggregate principal amount of 4.625% senior notes due 2029. The $2.48 billion in net proceeds from the offering were used to repay in full all amounts outstanding on the Bakken credit facility and the facility was terminated.
Sunoco LP Senior Notes Offering
In March 2019, Sunoco LP issued $600 million aggregate principal amount of 6.00% senior notes due 2027 in a private placement to eligible purchasers. The net proceeds from this offering were used to repay a portion of Sunoco LP’s existing borrowings outstandingunder its credit facility. In July 2019, Sunoco LP completed an exchange of these notes for registered notes with substantially identical terms.
USAC Senior Notes Offering
In March 2019, USAC issued $750 million aggregate principal amount of 6.875% senior notes due 2027 in a private placement, and in December 2019, USAC exchanged those notes for substantially identical senior notes registered under the Sunoco Logistics Credit FacilitySecurities Act.
The net proceeds from this offering were used to repay a portion of USAC’s existing borrowings under its credit facility and for general partnership purposes.
AugustRegulatory Update
Interstate Natural Gas Transportation Regulation
Rate Regulation
Effective January 2018, the 2017 Units Offering
In August 2017,Tax and Jobs Act (the “Tax Act”) changed several provisions of the Partnershipfederal tax code, including a reduction in the maximum corporate tax rate. On March 15, 2018, in a set of related proposals, the FERC addressed treatment of federal income tax allowances in regulated entity rates. The FERC issued 54 million ETP common unitsa Revised Policy Statement on Treatment of Income Taxes (“Revised Policy Statement”) stating that it will no longer permit master limited partnerships to recover an income tax allowance in an underwritten public offering. Net proceedstheir cost of $997 millionservice rates. The FERC issued the Revised Policy Statement in response to a remand from the offeringUnited States Court of Appeals for the District of Columbia Circuit in United Airlines v. FERC, in which the court determined that the FERC had not justified its conclusion that a pipeline organized as a master limited partnership would not “double recover” its taxes under the current policy by both including an income-tax allowance in its cost of service and earning a return on equity calculated using the discounted cash flow methodology. On July 18, 2018, the FERC issued an order denying requests for rehearing and clarification of its Revised Policy Statement. In the rehearing order, the FERC clarified that a pipeline organized as a master limited partnership will not be not be precluded in a future proceeding from arguing and providing evidentiary support that it is entitled to an income tax allowance and demonstrating that its recovery of an income tax allowance does not result in a double-recovery of investors’ income tax costs. In light of the rehearing order, the impacts of the FERC’s policy on the treatment of income taxes may have on the rates ETO can charge for the FERC-regulated transportation services are unknown at this time.
The FERC also issued a Notice of Inquiry (“2017 Tax Law NOI”) on March 15, 2018, requesting comments on the effect of the Tax Act on FERC jurisdictional rates. The 2017 Tax Law NOI states that of particular interest to the FERC is whether, and if so how, the FERC should address changes relating to accumulated deferred income taxes and bonus depreciation. Comments in response to the 2017 Tax Law NOI were due on or before May 21, 2018.
In March 2019, following the decision of the D.C. Circuit in Emera Maine v. Federal Energy Regulatory Commission, the FERC issued a Notice of Inquiry regarding its policy for determining return on equity (“ROE”). The FERC specifically sought information and stakeholder views to help the FERC explore whether, and if so how, it should modify its policies concerning the determination of ROE to be used in designing jurisdictional rates charged by public utilities. The FERC also expressly sought comment on whether any changes to its policies concerning public utility ROEs should be applied to interstate natural gas and oil pipelines. Initial comments were due in June 2019, and reply comments were due in July 2019. The FERC has not taken any further action with respect to the Notice of Inquiry as of this time, and therefore we cannot predict what effect, if any, such development could have on our cost-of-service rates in the future.
Also included in the March 15, 2018 proposals is a Notice of Proposed Rulemaking (“NOPR”) proposing rules for implementation of the Revised Policy Statement and the corporate income tax rate reduction with respect to natural gas pipeline rates. On July 18, 2018, the FERC issued a Final Rule adopting procedures that are generally the same as proposed in the NOPR with a few clarifications and modifications. With limited exceptions, the Final Rule requires all FERC-regulated natural gas pipelines that have cost-based rates for service to make a one-time Form No. 501-G filing providing certain financial information and to make an election on how to treat its existing rates. The Final Rule suggests that this information will allow the FERC and other stakeholders to evaluate the impacts of the Tax Act and the Revised Policy Statement on each individual pipeline’s rates. The Final Rule also requires that each FERC-regulated natural gas pipeline select one of four options to address changes to the pipeline’s revenue requirements as a result of the tax reductions: file a limited Natural Gas Act (“NGA”) Section 4 filing reducing its rates to reflect the reduced tax rates, commit to filing a general NGA Section 4 rate case in the near future, file a statement explaining why an adjustment to rates is not needed, or take no other action. For the limited NGA Section 4 option, the FERC clarified that, notwithstanding the Revised Policy Statement, a pipeline organized as a master limited partnership does not need to eliminate its income tax allowance but, instead, can reduce its rates to reflect the reduction in the maximum corporate tax rate. Trunkline, ETC Tiger Pipeline, LLC and Panhandle filed their respective FERC Form No. 501-Gs on October 11, 2018. FEP, Lake Charles LNG and certain other operating subsidiaries filed their respective FERC Form No. 501-Gs on or about November 8, 2018, and Rover, FGT, Transwestern and MEP filed their respective FERC Form No. 501-Gs on or about December 6, 2018.
By order issued January 16, 2019, the FERC initiated a review of Panhandle’s existing rates pursuant to Section 5 of the Natural Gas Act to determine whether the rates currently charged by Panhandle are just and reasonable and set the matter for hearing. Panhandle filed a cost and revenue study on April 1, 2019. Panhandle filed a NGA Section 4 rate case on August 30, 2019.
By order issued October 1, 2019, the Panhandle Section 5 and Section 4 cases were consolidated. An initial decision is expected to be issued in the first quarter of 2021. By order issued February 19, 2019, the FERC initiated a review of Southwest Gas’ existing
rates pursuant to Section 5 of the Natural Gas Act to determine whether the rates currently charged by Southwest Gas are just and reasonable and set the matter for hearing. Southwest Gas filed a cost and revenue study on May 6, 2019. On July 10, 2019, Southwest filed an Offer of Settlement in this Section 5 proceeding, which settlement was supported or not opposed by Commission Trial Staff and all active parties. The settlement was approved on October 29, 2019.
Sea Robin Pipeline Company filed a Section 4 rate case on November 30, 2018. A procedural schedule was ordered with a hearing date in the 4th quarter of 2019. Sea Robin Pipeline Company has reached a settlement of this proceeding, with a settlement filed July 22, 2019. The settlement was approved by the FERC by order dated October 17, 2019.
Even without action on the 2017 Tax Law NOI or as contemplated in the Final Rule, the FERC or our shippers may challenge the cost of service rates we charge. The FERC’s establishment of a just and reasonable rate is based on many components, and tax-related changes will affect two such components, the allowance for income taxes and the amount for accumulated deferred income taxes, while other pipeline costs also will continue to affect the FERC’s determination of just and reasonable cost of service rates. Although changes in these two tax related components may decrease, other components in the cost of service rate calculation may increase and result in a newly calculated cost of service rate that is the same as or greater than the prior cost of service rate. Moreover, we receive revenues from our pipelines based on a variety of rate structures, including cost of service rates, negotiated rates, discounted rates and market-based rates. Many of our interstate pipelines, such as ETC Tiger Pipeline, LLC, MEP and FEP, have negotiated market rates that were agreed to by customers in connection with long-term contracts entered into to support the construction of the pipelines. Other systems, such as FGT, Transwestern and Panhandle, have a mix of tariff rate, discount rate, and negotiated rate agreements. We do not expect market-based rates, negotiated rates or discounted rates that are not tied to the cost of service rates to be affected by the Revised Policy Statement or any final regulations that may result from the March 15, 2018 proposals. The revenues we receive from natural gas transportation services we provide pursuant to cost of service based rates may decrease in the future as a result of the ultimate outcome of the NOI, the Final Rule, and the Revised Policy Statement, combined with the reduced corporate federal income tax rate established in the Tax Act. The extent of any revenue reduction related to our cost of service rates, if any, will depend on a detailed review of all of ETO’s cost of service components and the outcomes of any challenges to our rates by the FERC or our shippers.
Pipeline Certification
The FERC issued a Notice of Inquiry on April 19, 2018 (“Pipeline Certification NOI”), thereby initiating a review of its policies on certification of natural gas pipelines, including an examination of its long-standing Policy Statement on Certification of New Interstate Natural Gas Pipeline Facilities, issued in 1999, that is used to determine whether to grant certificates for new pipeline projects. We are unable to predict what, if any, changes may be proposed as a result of the Pipeline Certification NOI that will affect our natural gas pipeline business or when such proposals, if any, might become effective. Comments in response to the Pipeline Certification NOI were due on or before July 25, 2018. We do not expect that any change in this policy would affect us in a materially different manner than any other natural gas pipeline company operating in the United States.
Interstate Common Carrier Regulation
The FERC utilizes an indexing rate methodology which, as currently in effect, allows common carriers to change their rates within prescribed ceiling levels that are tied to changes in the Producer Price Index, or PPI. The indexing methodology is applicable to existing rates, with the exclusion of market-based rates. The FERC’s indexing methodology is subject to review every five years. During the five-year period commencing July 1, 2016 and ending June 30, 2021, common carriers charging indexed rates are permitted to adjust their indexed ceilings annually by PPI plus 1.23 percent. Many existing pipelines utilize the FERC liquids index to change transportation rates annually every July 1. With respect to liquids and refined products pipelines subject to FERC jurisdiction, the Revised Policy Statement requires the pipeline to reflect the impacts to its cost of service from the Revised Policy Statement and the Tax Act on Page 700 of FERC Form No. 6. This information will be used by the PartnershipFERC in its next five year review of the liquids pipeline index to repay amounts outstanding undergenerate the index level to be effective July 1, 2021, thereby including the effect of the Revised Policy Statement and the Tax Act in the determination of indexed rates prospectively, effective July 1, 2021. The FERC’s establishment of a just and reasonable rate, including the determination of the appropriate liquids pipeline index, is based on many components, and tax related changes will affect two such components, the allowance for income taxes and the amount for accumulated deferred income taxes, while other pipeline costs also will continue to affect the FERC’s determination of the appropriate pipeline index. Accordingly, depending on the FERC’s application of its revolving credit facilities,indexing rate methodology for the next five year term of index rates, the Revised Policy Statement and tax effects related to fund capital expenditures and for general partnership purposes.
Rover Contribution Agreement
In October 2017, ETP completed the previously announced contribution transactionTax Act may impact our revenues associated with a fund managed by Blackstone Energy Partners and Blackstone Capital Partners,any transportation services we may provide pursuant to which ETP exchanged a 49.9% interest in the holding company that owns 65%cost of the Rover pipeline (“Rover Holdco”). As a result, Rover Holdco is now owned 50.1% by ETP and 49.9% by Blackstone. Upon closing, Blackstone contributed funds to reimburse ETP for its pro rata share of the Rover construction costs incurred by ETP through the closing date, along with the payment of additional amounts subject to certain adjustments.
PennTex Tender Offer and Limited Call Right Exercise
In June 2017, ETP purchased all of the outstanding PennTex common units not previously owned by ETP for $20.00 per common unit in cash. ETP now owns all of the economic interests of PennTex, and PennTex common units are no longer publicly traded or listed on the NASDAQ.
ETP and Sunoco Logistics Merger
In April 2017, Energy Transfer Partners, L.P. and Sunoco Logistics completed a merger transaction (the “Sunoco Logistics Merger”) in which Sunoco Logistics acquired Energy Transfer Partners, L.P. in a unit-for-unit transaction, with the Energy Transfer Partners, L.P. unitholders receiving 1.5 common units of Sunoco Logistics for each Energy Transfer Partners, L.P. common unit they owned. Under the terms of the merger agreement, Sunoco Logistics’ general partner was merged with and into ETP GP, with ETP GP surviving as an indirect wholly-owned subsidiary of ETE.
Permian Express Partners
In February 2017, Sunoco Logistics formed PEP, a strategic joint venture with ExxonMobil. Sunoco Logistics contributed its Permian Express 1, Permian Express 2, Permian Longview and Louisiana Access pipelines. ExxonMobil contributed its Longview to Louisiana and Pegasus pipelines, Hawkins gathering system, an idle pipeline in southern Oklahoma, and its Patoka, Illinois terminal. Assets contributed to PEP by ExxonMobil were reflected at fair value on the Partnership’s consolidated balance sheet at the date of the contribution, including $547 million of intangible assets and $435 million of property, plant and equipment.
In July 2017, ETP contributed an approximate 15% ownership interest in Dakota Access and ETCO to PEP, which resulted in an increase in ETP’s ownership interest in PEP to approximately 88%. ETP maintains a controlling financial and voting interest in PEP and is the operator of all of the assets. As such, PEP is reflected as a consolidated subsidiary of the Partnership. ExxonMobil’s interest in PEP is reflected as noncontrolling interest in the consolidated balance sheets. ExxonMobil’s contribution resulted in an increase of $988 million in noncontrolling interest, which is reflected in “Capital contributions from noncontrolling interest” in the consolidated statement of equity.
Bakken Equity Sale
In February 2017, Bakken Holdings Company LLC, an entity in which ETP indirectly owns a 100% membership interest, sold a 49% interest in its wholly-owned subsidiary, Bakken Pipeline Investments LLC, to MarEn Bakken Company LLC, an entity jointly owned by MPLX LP and Enbridge Energy Partners, L.P., for $2.00 billion in cash. Bakken Pipeline Investments LLC indirectly owns a 75% interest in each of Dakota Access and ETCO. The remaining 25% of each of Dakota Access and ETCO is owned by wholly-owned subsidiaries of Phillips 66. ETP continues to consolidate Dakota Access and ETCO subsequent to this transaction.
General
Our primary objective is to increase the level of our distributable cash flow to our Unitholders over time by pursuing a business strategy that is focused on growing our businesses through, among other things, pursuing construction and expansion opportunities and acquiring strategic operations and businesses or assets as demonstrated by our recent acquisitions and organic growth projects. The actual amounts of cash that we will have available for distribution will primarily depend on the amount of cash we generate from our operations.
During the past several years, we have been successful in completing several transactions that have significantly increased our distributable cash flow. We have also made, and are continuing to make, significant investments in internal growth projects, primarily the construction of pipelines, gathering systems and natural gas treating and processing plants, which we believe will provide additional distributable cash flow to our Partnership for years to come. Lastly, we have established and executed on cost control measures to drive cost savings across our operations to generate additional distributable cash flow.
Our principal operations as of December 31, 2017 included the following segments:
Intrastate transportation and storage – Revenue is principally generated from fees charged to customers to reserve firm capacity on or move gas through our pipelines on an interruptible basis. Our interruptible or short-term business is generally impacted by basis differentials between delivery points on our system and the price of natural gas. The basis differentials that primarily impact our interruptible business are primarily among receipt points between West Texas to East Texas or segments thereof. When narrow or flat spreads exist, our open capacity may be underutilized and go unsold. Conversely, when basis differentials widen, our interruptible volumes and fees generally increase. The fee structure normally consists of a monetary fee and fuel retention. Excess fuel retained after consumption, if any, is typically sold at market prices. In addition to transport fees, we generate revenue from purchasing natural gas and transporting it across our system. The natural gas is then sold to electric utilities, independent power plants, local distribution companies, industrial end-users and other marketing companies. The HPL System purchases natural gas at the wellhead for transport and selling. Other pipelines with access to West Texas supply, such as Oasis and ET Fuel, may also purchase gas at the wellhead and other supply sources for transport across our system to be sold at market on the east side of our system. This activity allows our intrastate transportation and storage segment to capture the current basis differentials between delivery points on our system or to capture basis differentials that were previously locked in through hedges. Firm capacity long-term contracts are typically not subject to price differentials between shipping locations.
We also generate fee-based revenue from our natural gas storage facilities by contracting with third parties for their use of our storage capacity. From time to time, we inject and hold natural gas in our Bammel storage facility to take advantage of contango markets, a term used to describe a pricing environment when the price of natural gas is higherservice based rates in the future, than the current spot price. We use financial derivatives to hedge the natural gas held in connection with these arbitrage opportunities. Our earnings from natural gas storage we purchase, store and sell are subject to the current market prices (spot price in relation to forward price) at the time the storage gas is hedged. At the inception of the hedge, we lock in a margin by purchasing gas in the spot market and entering into a financial derivative to lock in the forward sale price. If we designate the related financial derivative as a fair value hedge for accounting purposes, we value the hedged natural gas inventory at current spot market prices whereas the financial derivative is valued using forward natural gas prices. As a result of fair value hedge accounting, we have elected to exclude the spot forward premium from the measurement of effectiveness and changes in the spread between forward natural gas prices and spot market prices result in unrealized gains or losses until the underlying physical gas is withdrawn and the related financial derivatives are settled. Once the gas is withdrawn and the designated derivatives are settled, the previously unrealized gains or losses associated with these positions are realized. If the spread narrows between spot and forward prices, we will record unrealized gains or lower unrealized losses. If the spread widens prior to withdrawal of the gas, we will record unrealized losses or lower unrealized gains.including indexed rates.
As noted above, any excess retained fuel is sold at market prices. To mitigate commodity price exposure, we may use financial derivatives to hedge prices on a portion of natural gas volumes retained. For certain contracts that qualify for hedge accounting, we designate them as cash flow hedges of the forecasted sale of gas. The change in value, to the extent the contracts are effective, remains in accumulated other comprehensive income until the forecasted transaction occurs. When the forecasted transaction occurs, any gain or loss associated with the derivative is recorded in cost of products sold in the consolidated statement of operations.In addition, we use financial derivatives to lock in price differentials between market hubs connected to our assets on a portion of our intrastate transportation system’s unreserved capacity. Gains and losses on these financial derivatives are dependent on price differentials at market locations, primarily points in West Texas and East Texas. We account for these derivatives using mark-to-market accounting, and the change in the value of these derivatives is recorded in earnings. During the fourth quarter of 2011, we began using derivatives for trading purposes.
Interstate transportation and storage – The majority of our interstate transportation and storage revenues are generated through firm reservation charges that are based on the amount of firm capacity reserved for our firm shippers regardless of usage. Tiger, FEP, Transwestern, Panhandle, MEP and Gulf States shippers have made long-term commitments to pay reservation charges for the firm capacity reserved for their use. In addition to reservation revenues, additional revenue sources include interruptible transportation charges as well as usage rates and overrun rates paid by firm shippers based on their actual capacity usage.
Midstream – Revenue is principally dependent upon the volumes of natural gas gathered, compressed, treated, processed, purchased and sold through our pipelines as well as the level of natural gas and NGL prices.
In addition to fee-based contracts for gathering, treating and processing, we also have percent-of-proceeds and keep-whole contracts, which are subject to market pricing. For percent-of-proceeds contracts, we retain a portion of the natural gas and NGLs processed, or a portion of the proceeds of the sales of those commodities, as a fee. When natural gas and NGL prices increase, the value of the portion we retain as a fee increases. Conversely, when prices of natural gas and NGLs decrease, so does the value of the portion we retain as a fee. For wellhead (keep-whole) contracts, we retain the difference between the price of NGLs and the cost of the gas to process the NGLs. In periods of high NGL prices relative to natural gas, our margins increase. During periods of low NGL prices relative to natural gas, our margins decrease or could become negative. Our processing contracts and wellhead purchases in rich natural gas areas provide that we earn and take title to specified volumes of NGLs, which we also refer to as equity NGLs. Equity NGLs in our midstream segment are derived from performing a service in a percent-of-proceeds contract or produced under a keep-whole arrangement.
In addition to NGL price risk, our processing activity is also subject to price risk from natural gas because, in order to process the gas, in some cases we must purchase it. Therefore, lower gas prices generally result in higher processing margins.
NGL and refined products transportation and services – Liquids transportation revenue is principally generated from fees charged to customers under dedicated contracts or take-or-pay contracts. Under a dedicated contract, the customer agrees to deliver the total output from particular processing plants that are connected to the NGL pipeline. Take-or-pay contracts have minimum throughput commitments requiring the customer to pay regardless of whether a fixed volume is transported. Transportation fees are market-based, negotiated with customers and competitive with regional regulated pipelines.
NGL storage revenues are derived from base storage fees and throughput fees. Base storage fees are based on the volume of capacity reserved, regardless of the capacity actually used. Throughput fees are charged for providing ancillary services, including receipt and delivery, custody transfer, rail/truck loading and unloading fees. Storage contracts may be for dedicated storage or fungible storage. Dedicated storage enables a customer to reserve an entire storage cavern, which allows the customer to inject and withdraw proprietary and often unique products. Fungible storage allows a customer to store specified quantities of NGL products that are commingled in a storage cavern with other customers’ products of the same type and grade. NGL storage contracts may be entered into on a firm or interruptible basis. Under a firm basis contract, the customer obtains the right to store products in the storage caverns throughout the term of the contract; whereas, under an interruptible basis contract, the customer receives only limited assurance regarding the availability of capacity in the storage caverns. Revenues are also generated by charging fees for terminalling services for NGLs and refined products and by acquiring and marketing NGLs and refined products. Generally, NGL and refined products purchases are entered into in contemplation of or simultaneously with corresponding sale transactions involving physical deliveries, which enables us to secure a profit on the transaction at the time of purchase.
Our refined products terminals derive revenues from terminalling fees paid by customers. A fee is charged for receiving products into the terminal and delivering them to trucks, barges, or pipelines. In addition to terminalling fees, our refined products terminals generate revenues by charging customers fees for blending services, including certain ethanol and biodiesel blending, injecting additives, and filtering jet fuel. Our refined products pipelines provide supply to the majority of our refined products terminals, with third-party pipelines and barges supplying the remainder.
Our refined products acquisition and marketing activities include the acquisition, marketing and selling of bulk refined products such as gasoline products and distillates. These activities utilize our refined products pipeline and terminal assets, as well as third-party assets and facilities. The operating results of our refined products acquisition and marketing activities are dependent on our ability to execute sales in excess of the aggregate cost, and therefore we structure our acquisition and marketing operations to optimize the sources and timing of purchases and minimize the transportation and storage costs. In order to manage exposure to volatility in refined products prices, our policy is to (i) only purchase products for which sales contracts have been executed or for which ready markets exist, (ii) structure sales contracts so that price fluctuations do not materially impact the margins earned, and (iii) not acquire and hold physical inventory, futures contracts or other derivative instruments for the purpose of speculating on commodity price changes. However, we do utilize a hedge program involving swaps, future and other derivative instruments to mitigate the risk associated with unfavorable market movements in the price of refined products. These derivative contracts act as a hedging mechanism against the volatility of prices.
This segment also includes revenues earned from processing and fractionating refinery off-gas. Under these contracts we receive an O-grade stream from cryogenic processing plants located at refineries and fractionate the products into their pure components. We deliver purity products to customers through pipelines and across a truck rack located at the fractionation complex. In addition to revenues for fractionating the O-grade stream, we have percentage-of-proceeds and income sharing contracts, which are subject to market pricing of olefins and NGLs. For percentage-of-proceeds contracts, we retain a portion of the purity NGLs and olefins processed, or a portion of the proceeds from the sales of those commodities, as a fee. When NGLs and olefin prices increase, the value of the portion we retain as a fee increases. Conversely, when NGLs and olefin prices decrease, so does the value of the portion we retain as a fee. Under our income sharing contracts, we pay the producer the equivalent energy value for their liquids, similar to a traditional keep-whole processing agreement, and then share in the residual income created by the difference between NGLs and olefin prices as compared to natural gas prices. As NGLs and olefins prices increase in relation to natural gas prices, the value of the percent we retain as a fee increases. Conversely, when NGLs and olefins prices decrease as compared to natural gas prices, so does the value of the percent we retain as a fee.
Crude oil transportation and services – Revenues are generated by charging tariffs for transporting crude oil though our pipelines as well as by charging fees for terminalling services at our facilities. Revenues are also generated by acquiring and marketing crude oil. Generally, crude oil purchases are entered into in contemplation of or simultaneously with corresponding sale transactions involving physical deliveries, which enables us to secure a profit on the transaction at the time of purchase.
Trends and Outlook
We continue to evaluate and execute strategies to enhance unitholder value throughanticipate continued earnings growth in 2020 from the recently completed projects, as well as the integration and optimization of our diversified asset portfolio. We intend to target a minimum distribution coverage ratio of 1.10x, thereby promoting a prudent balance between distribution rate increases and enhanced financial flexibility and strength while maintaining our investment grade ratings. We anticipate significant earnings growth in 2018 from the completion of ourcurrent project backlog. We also continue to seek asset optimization opportunities through strategic transactions among us and our subsidiaries and/or affiliates, and we expect to continue to evaluate and execute on such opportunities. As we have in the past, we will evaluate growth projects and acquisitions as such opportunities may be identified in the future, and we believe that the current capital markets are conducive to funding such future projects.
With respect to commodity prices, natural gas prices have remained comparatively low in recent months as associated gas from shale oil resources has provided additional supply to the market, increasing domestic supply to highs above 100 Bcf/d. Global oil and natural gas demand growth is likely to continue into the foreseeable future and will support U.S. production increases and, in turn U.S. natural gas export projects to Mexico as well as LNG exports.
For crude oil, and NGL pricesnew pipelines that came online during 2019 have rebounded sharplyresulted in Permian barrels now pricing closer to other regional hubs, which is a departure from the lows experienced in early 2016. Current commodity pricing has increased activities in several basins, as reflected by current rig counts. The addition of several ethane crackers and export projects currently under construction should helpsubstantial discounts seen a year ago. These pipelines have enabled Permian producers to volumetrically balance this market. Other factors such as reduced wet gas extraction will also help to balance this market and positively impact prices. Bakkenrealize higher crude oil output isrevenues, supporting continued growth in the region. Crude oil exports from the U.S. are continuing to increase supporting strong spreads between North Dakota and the Gulf Coast.
Natural gas pricing is expected to remain withinas a range similar to recent history as increased supply continues to outpace demand. Texas intrastate natural gas spreads are strong mostly due to increased production in the Permian Basin; Permian production is expected to continue growing considerably over the next several years, and most new takeaway capacity projects are not scheduled to go into service until beyond 2018. New demand occurring in several areas such as exports to Mexico and Canada, LNG exports, nuclear power plant de-commissioning, as well as continued coal to gas switchingresult, providing additional opportunity for power generation, will help pricing; however, supply is continuing to increase.U.S. midstream sector growth.
Results of Operations
We report Segment Adjusted EBITDA and consolidated Adjusted EBITDA as a measuremeasures of segment performance. We define Segment Adjusted EBITDA and consolidated Adjusted EBITDA as total Partnership earnings before interest, taxes, depreciation, depletion, amortization and other non-cash items, such as non-cash compensation expense, gains and losses on disposals of assets, the allowance for equity funds used during construction, unrealized gains and losses on commodity risk management activities, inventory valuation adjustments, non-cash impairment charges, losses on extinguishments of debt and other non-operating income or expense items. Unrealized gains and losses on commodity risk management activities include unrealized gains and losses on commodity derivatives and inventory fair value adjustments (excluding lower of cost or market adjustments). Segment Adjusted EBITDA reflectsand consolidated Adjusted EBITDA reflect amounts for unconsolidated affiliates based on the Partnership’s proportionate ownership.same recognition and measurement methods used to record equity in earnings of unconsolidated affiliates. Adjusted EBITDA related to unconsolidated affiliates excludes the same items with respect to the unconsolidated affiliate as those excluded from the calculation of Segment Adjusted EBITDA and consolidated Adjusted EBITDA, such as interest, taxes, depreciation, depletion, amortization and other non-cash items. Although these amounts are excluded from Adjusted EBITDA related to unconsolidated affiliates, such exclusion should not be understood to imply that we have control over the operations and resulting revenues and expenses of such affiliates. We do not control our unconsolidated affiliates; therefore, we do not control the earnings or cash flows of such affiliates. The use of Segment Adjusted EBITDA or Adjusted EBITDA related to unconsolidated affiliates as an analytical tool should be limited accordingly.
Segment Adjusted EBITDA, as reported for each segment in the table below, is analyzed for each segment in the section titled “Segment Operating Results.” Adjusted EBITDA is a non-GAAP measure. Although we include Segment Adjusted EBITDA in this report, we have not included an analysismeasure used by industry analysts, investors, lenders and rating agencies to assess the financial performance and the operating results of the consolidated measure, Adjusted EBITDA. We have includedPartnership’s fundamental business activities and should not be considered in isolation or as a total of Segment Adjusted EBITDAsubstitution for all segments, which is reconcilednet income, income from operations, cash flows from operating activities or other GAAP measures.
As discussed in Note 1 to the GAAP measure of net incomeconsolidated financial statements in “Item 8. Financial Statements and Supplementary Data,” the Energy Transfer Merger in October 2018 resulted in the retrospective adjustment of the Partnership’s consolidated results sections that follow.financial statements to reflect consolidation beginning January 1, 2017 of Sunoco LP and Lake Charles LNG and April 2, 2018 for USAC.
As discussed in Note 1 to the consolidated financial statements in “Item 8. Financial Statements and Supplementary Data,” the merger of legacy ETPETO (the entity named Energy Transfer Partners, L.P. prior to the merger) and legacy Sunoco Logistics in April 2017 resulted in legacy ETPETO being treated as the surviving entity from an accounting perspective. Accordingly, the financial data below reflects the consolidated financial information of legacy ETP.ETO.
As discussed in Note 2Year Ended December 31, 2019 Compared to the Partnership’s Year Ended December 31, 2018
Consolidated Results
|
| | | | | | | | | | | |
| | Years Ended December 31, | | |
| | 2019 | | 2018 | | Change |
| Segment Adjusted EBITDA: | | | | | |
| Intrastate transportation and storage | $ | 999 |
| | $ | 927 |
| | $ | 72 |
|
| Interstate transportation and storage | 1,792 |
| | 1,680 |
| | 112 |
|
| Midstream | 1,599 |
| | 1,627 |
| | (28 | ) |
| NGL and refined products transportation and services | 2,663 |
| | 1,979 |
| | 684 |
|
| Crude oil transportation and services | 2,949 |
| | 2,330 |
| | 619 |
|
| Investment in Sunoco LP | 665 |
| | 638 |
| | 27 |
|
| Investment in USAC | 420 |
| | 289 |
| | 131 |
|
| All other | 104 |
| | 76 |
| | 28 |
|
| Total Segment Adjusted EBITDA | 11,191 |
| | 9,546 |
| | 1,645 |
|
| Depreciation, depletion and amortization | (3,124 | ) | | (2,843 | ) | | (281 | ) |
| Interest expense, net of interest capitalized | (2,257 | ) | | (1,709 | ) | | (548 | ) |
| Impairment losses | (74 | ) | | (431 | ) | | 357 |
|
| Gains (losses) on interest rate derivatives | (241 | ) | | 47 |
| | (288 | ) |
| Non-cash compensation expense | (111 | ) | | (105 | ) | | (6 | ) |
| Unrealized losses on commodity risk management activities | (4 | ) | | (11 | ) | | 7 |
|
| Inventory valuation adjustments | 79 |
| | (85 | ) | | 164 |
|
| Losses on extinguishments of debt | (2 | ) | | (109 | ) | | 107 |
|
| Adjusted EBITDA related to unconsolidated affiliates | (621 | ) | | (655 | ) | | 34 |
|
| Equity in earnings of unconsolidated affiliates | 298 |
| �� | 344 |
| | (46 | ) |
| Adjusted EBITDA related to discontinued operations | — |
| | 25 |
| | (25 | ) |
| Other, net | 252 |
| | 30 |
| | 222 |
|
| Income from continuing operations before income tax expense | 5,386 |
| | 4,044 |
| | 1,342 |
|
| Income tax expense from continuing operations | (200 | ) | | (5 | ) | | (195 | ) |
| Income from continuing operations | 5,186 |
| | 4,039 |
| | 1,147 |
|
| Loss from discontinued operations, net of income taxes | — |
| | (265 | ) | | 265 |
|
| Net income | $ | 5,186 |
| | $ | 3,774 |
| | $ | 1,412 |
|
Adjusted EBITDA (consolidated financial statements included). For the year ended December 31, 2019 compared to the prior year, Adjusted EBITDA increased approximately $1.65 billion, or 17%. The increase was primarily due to the impact of multiple revenue-generating assets being placed in “Item 8. Financial Statementsservice and Supplementary Data,”recent acquisitions, as well as increased demand for services on existing assets. The impact of new assets and acquisitions was approximately $784 million, of which the largest increases were from increased volumes to our Mariner East pipeline and terminal assets due to the addition of pipeline capacity in the fourth quarter of 2017,2018 (a $274 million impact to the Partnership changed its accounting policy relatedNGL and refined products transportation and services segment), the commissioning of our fifth and sixth fractionators (a $131 million impact to certain inventories. Certainthe NGL and refined products transportation and services segment), the ramp up of volumes on our Bayou Bridge system due to placing phase II in service in the second quarter of 2019 (a $60 million impact to our crude oil refined producttransportation and NGL inventories were changed from last-in, first-out (“LIFO”) methodservices segment), the Rover pipeline (a $78 million impact to the weighted average cost method. These changes have been applied retrospectivelyinterstate transportation and storage segment), the addition of gas processing capacity to all periods presented,our Arrowhead gas plant (a $31 million impact to our midstream segment), placing our Permian Express 4 pipeline in service in October 2019 (a $26 million impact to our crude oil transportation and services segment) and the prior period amounts reflected below have been adjusted from those amounts previously reported.
Year Ended December 31, 2017 Comparedacquisition of USAC (a net impact of $131 million among the investment in USAC and all other segments). The remainder of the increase in Adjusted EBITDA was primarily due to stronger demand on existing assets, particularly due to increased throughput on our Bakken Pipeline system as well as increased production in the Year Ended December 31, 2016
Consolidated Results
|
| | | | | | | | | | | |
| | Years Ended December 31, | | |
| | 2017 | | 2016* | | Change |
| Segment Adjusted EBITDA: | | | | | |
| Intrastate transportation and storage | $ | 626 |
| | $ | 613 |
| | $ | 13 |
|
| Interstate transportation and storage | 1,098 |
| | 1,117 |
| | (19 | ) |
| Midstream | 1,481 |
| | 1,133 |
| | 348 |
|
| NGL and refined products transportation and services | 1,641 |
| | 1,496 |
| | 145 |
|
| Crude oil transportation and services | 1,379 |
| | 834 |
| | 545 |
|
| All other | 487 |
| | 540 |
| | (53 | ) |
| Total | 6,712 |
| | 5,733 |
| | 979 |
|
| Depreciation, depletion and amortization | (2,332 | ) | | (1,986 | ) | | (346 | ) |
| Interest expense, net | (1,365 | ) | | (1,317 | ) | | (48 | ) |
| Gains on acquisitions | — |
| | 83 |
| | (83 | ) |
| Impairment losses | (920 | ) | | (813 | ) | | (107 | ) |
| Losses on interest rate derivatives | (37 | ) | | (12 | ) | | (25 | ) |
| Non-cash unit-based compensation expense | (74 | ) | | (80 | ) | | 6 |
|
| Unrealized gain (loss) on commodity risk management activities | 56 |
| | (131 | ) | | 187 |
|
| Losses on extinguishments of debt | (42 | ) | | — |
| | (42 | ) |
| Adjusted EBITDA related to unconsolidated affiliates | (984 | ) | | (946 | ) | | (38 | ) |
| Equity in earnings of unconsolidated affiliates | 156 |
| | 59 |
| | 97 |
|
| Impairment of investments in unconsolidated affiliates | (313 | ) | | (308 | ) | | (5 | ) |
| Other, net | 148 |
| | 115 |
| | 33 |
|
| Income before income tax benefit | 1,005 |
| | 397 |
| | 608 |
|
| Income tax benefit | 1,496 |
| | 186 |
| | 1,310 |
|
| Net income | $ | 2,501 |
| | $ | 583 |
| | $ | 1,918 |
|
* As adjusted.
SeePermian, which impacted multiple segments. Additional discussion of these and other factors affecting Adjusted EBITDA is included in the detailed discussionanalysis of Segment Adjusted EBITDA in the “Segment Operating Results” section below.
Depreciation, Depletion and Amortization. Depreciation, depletion and amortization expense increased primarily due to additional depreciation from assets recently placed in service and recent acquisitions.
Interest Expense, Net of Interest Capitalized. Interest expense, net of interest capitalized, increased during the year ended December 31, 2019 compared to the prior year primarily due to the following:
an increase of $470 million recognized by the Partnership (excluding Sunoco LP and USAC) primarily related to an increase in long-term debt, which included $4.2 billion of senior notes issued in the ET-ETO senior note exchange (discussed below under “Description of Indebtedness”), as well as additional senior note issuances and borrowings under our revolving credit facilities;
an increase of $49 million recognized by USAC primarily attributable to higher overall debt balances and higher interest rates on borrowings under the credit agreement. These increases were partially offset by the decrease in borrowings under the credit agreement; and
an increase of $29 million recognized by Sunoco LP due to an increase in total long-term debt.
Impairment Losses. During the year ended December 31, 2017,2019, the Partnership recordedrecognized goodwill impairments of $12 million related to goodwill associated with the compression business of $223 million,Southwest Gas operations within the entity that owns the general partner of Panhandle of $229 million, interstate transportation and storage segment and $9 million related to our North Central operations within the midstream segment, both of $262 million,which were primarily due to changes in assumptions related to projected future revenues and refined products transportation and services operations of $79 million.cash flows. Also during the year ended December 31, 2017, the Partnership recorded an2019, Sunoco LP recognized a $47 million write-down on assets held for sale related to its ethanol plant in Fulton, New York, and USAC recognized a $6 million fixed asset impairment related to the property, plant and equipment of Sea Robin of $127 million. certain idle compressor assets.
During the year ended December 31, 2016,2018, the Partnership recordedrecognized goodwill impairments to goodwill associated with the interstate transportation and storage operations $638of $378 million and theasset impairments of $4 million related to our midstream operations $32 million. Also, during the year ended December 31, 2016, the Partnership recordedand asset impairments of $9 million related to the property, plant and equipmentidle leased assets in the interstate transportation and storage segment $133our crude operations. Sunoco LP recognized a $30 million and in the midstream segment $10 million.indefinite-lived intangible asset impairment related to contractual rights. USAC recognized a $9 million fixed asset impairment related to certain idle compressor assets. Additional discussion on these impairments is included in “Estimates and Critical Accounting Policies” below.
LossesGains (Losses) on Interest Rate Derivatives. Our interest rate derivatives are not designated as hedges for accounting purposes; therefore, changes in fair value are recorded in earnings each period. Losses on interest rate derivatives during the yearsyear ended December 31, 2017 and 20162019 resulted from decreasesa decrease in forward interest rates which caused our forward-starting swaps to changeand gains in value.2018 resulted from an increase in forward interest rates.
Unrealized Gain (Loss)Losses on Commodity Risk Management Activities. See additional informationThe unrealized losses on unrealized gain (loss) onour commodity risk management activities include changes in fair value of commodity derivatives and the hedged inventory included in designated fair value hedging relationships. Information on the unrealized gains and losses within each segment are included in “Segment Operating Results” below.below, and additional information on the commodity-related derivatives, including notional volumes, maturities and fair values, is available in “Item 7A. Quantitative and Qualitative Disclosures About Market Risk” and in Note 13 to our consolidated financial statements included in “Item 8. Financial Statements and Supplementary Data.”
Inventory Valuation Adjustments. Inventory valuation reserve adjustments were recorded for the inventory associated with Sunoco LP primarily driven by changes in fuel prices between periods.
Losses on Extinguishments of Debt. Amounts were related to Sunoco LP’s senior note and term loan redemption in January 2018.
Adjusted EBITDA Related to Unconsolidated Affiliates and Equity in Earnings of Unconsolidated Affiliates. See additional information in “Supplemental Information on Unconsolidated Affiliates” and “Segment Operation Results” below.
ImpairmentAdjusted EBITDA Related to Discontinued Operations. Amounts were related to the operations of InvestmentsSunoco LP’s retail business that were disposed of in Unconsolidated Affiliates. During the year ended December 31, 2017, the Partnership recorded impairments to its investments in FEP of $141 million and HPC of $172 million. During the year ended December 31, 2016, the Partnership recorded an impairment to its investment in MEP of $308 million. Additional discussion on these impairments is included in “Estimates and Critical Accounting Policies” below.January 2018.
Other, net. Other, net primarily includes amortization of regulatory assets and other income and expense amounts.
Income Tax Benefit. On December 22, 2017, the Tax Cuts and Jobs Act was signed into law. Among other provisions, the highest corporate federal income tax rate was reduced from 35% to 21% for taxable years beginning after December 31, 2017. As a result, the Partnership recognized a deferred tax benefit of $1.56 billion in December 2017. Expense. For the year ended December 2016,31, 2019 compared to the Partnership recorded anprior year, income tax benefitexpense increased due to pre-tax lossesan increase in income at itsour corporate subsidiaries.subsidiaries and the recognition of a favorable state tax rate change in the prior period.
Supplemental Information on Unconsolidated Affiliates
The following table presents financial information related to unconsolidated affiliates:
| | | | Years Ended December 31, | | | Years Ended December 31, | | |
| | 2017 | | 2016 | | Change | 2019 | | 2018 | | Change |
| Equity in earnings (losses) of unconsolidated affiliates: | | | | | | |
| Equity in earnings of unconsolidated affiliates: | | | | | | |
| Citrus | $ | 144 |
| | $ | 102 |
| | $ | 42 |
| $ | 148 |
| | $ | 141 |
| | $ | 7 |
|
| FEP | 53 |
| | 51 |
| | 2 |
| 59 |
| | 55 |
| | 4 |
|
| MEP | 38 |
| | 40 |
| | (2 | ) | 15 |
| | 31 |
| | (16 | ) |
HPC(1) | (168 | ) | | 31 |
| | (199 | ) | |
Sunoco LP(2) | 12 |
| | (211 | ) | | 223 |
| |
| Other | 77 |
| | 46 |
| | 31 |
| 76 |
| | 117 |
| | (41 | ) |
| Total equity in earnings of unconsolidated affiliates | $ | 156 |
| | $ | 59 |
| | $ | 97 |
| $ | 298 |
| | $ | 344 |
| | $ | (46 | ) |
| | | | | | | | | | | |
Adjusted EBITDA related to unconsolidated affiliates(3): | | | | | | |
Adjusted EBITDA related to unconsolidated affiliates(1): | | | | | | |
| Citrus | $ | 336 |
| | $ | 329 |
| | $ | 7 |
| $ | 342 |
| | $ | 337 |
| | $ | 5 |
|
| FEP | 74 |
| | 75 |
| | (1 | ) | 75 |
| | 74 |
| | 1 |
|
| MEP | 88 |
| | 90 |
| | (2 | ) | 60 |
| | 81 |
| | (21 | ) |
| HPC | 46 |
| | 61 |
| | (15 | ) | |
| Sunoco LP | 268 |
| | 271 |
| | (3 | ) | |
| Other | 172 |
| | 120 |
| | 52 |
| 144 |
| | 163 |
| | (19 | ) |
| Total Adjusted EBITDA related to unconsolidated affiliates | $ | 984 |
| | $ | 946 |
| | $ | 38 |
| $ | 621 |
| | $ | 655 |
| | $ | (34 | ) |
| | | | | | | | | | | |
| Distributions received from unconsolidated affiliates: | | | | | | | | | | |
| Citrus | $ | 156 |
| | $ | 144 |
| | $ | 12 |
| $ | 178 |
| | $ | 171 |
| | $ | 7 |
|
| FEP | 47 |
| | 65 |
| | (18 | ) | 73 |
| | 68 |
| | 5 |
|
| MEP | 114 |
| | 74 |
| | 40 |
| 36 |
| | 48 |
| | (12 | ) |
| HPC | 35 |
| | 51 |
| | (16 | ) | |
| Sunoco LP | 144 |
| | 138 |
| | 6 |
| |
| Other | 80 |
| | 69 |
| | 11 |
| 96 |
| | 110 |
| | (14 | ) |
| Total distributions received from unconsolidated affiliates | $ | 576 |
| | $ | 541 |
| | $ | 35 |
| $ | 383 |
| | $ | 397 |
| | $ | (14 | ) |
| |
(1) | For the year ended December 31, 2017, equity in earnings (losses) of unconsolidated affiliates includes the impact of non-cash impairments recorded by HPC, which reduced the Partnership’s equity in earnings by $185 million. |
| |
(2)
| For the years ended December 31, 2017 and 2016, equity in earnings (losses) of unconsolidated affiliates includes the impact of non-cash impairments recorded by Sunoco LP, which reduced the Partnership’s equity in earnings by $176 million and $277 million, respectively. |
| |
(3)
| These amounts represent our proportionate share of the Adjusted EBITDA of our unconsolidated affiliates and are based on our equity in earnings or losses of our unconsolidated affiliates adjusted for our proportionate share of the unconsolidated affiliates’ interest, depreciation, depletion, amortization, non-cash items and taxes. |
Segment Operating Results
We evaluate segment performance based on Segment Adjusted EBITDA, which we believe is an important performance measure of the core profitability of our operations. This measure represents the basis of our internal financial reporting and is one of the performance measures used by senior management in deciding how to allocate capital resources among business segments.
The tables below identify the components of Segment Adjusted EBITDA, which is calculated as follows:
| |
| • | Segment margin, operating expenses, and selling, general and administrative expenses. These amounts represent the amounts included in our consolidated financial statements that are attributable to each segment. |
| |
| • | Unrealized gains or losses on commodity risk management activities and inventory valuation adjustments. These are the unrealized amounts that are included in cost of products sold to calculate segment margin. These amounts are not included in Segment Adjusted EBITDA; therefore, the unrealized losses are added back and the unrealized gains are subtracted to calculate the segment measure. |
| |
| • | Non-cash compensation expense. These amounts represent the total non-cash compensation recorded in operating expenses and selling, general and administrative expenses. This expense is not included in Segment Adjusted EBITDA and therefore is added back to calculate the segment measure. |
| |
| • | Adjusted EBITDA related to unconsolidated affiliates. Adjusted EBITDA related to unconsolidated affiliates excludes the same items with respect to the unconsolidated affiliate as those excluded from the calculation of Segment Adjusted EBITDA, such as interest, taxes, depreciation, depletion, amortization and other non-cash items. Although these amounts are excluded from Adjusted EBITDA related to unconsolidated affiliates, such exclusion should not be understood to imply that we have |
Segment margin, operating expenses, and selling, general and administrative expenses. These amounts represent the amounts included in our consolidated financial statements that are attributable to each segment.
Unrealized gains or losses on commodity risk management activities and inventory valuation adjustments. These arecontrol over the unrealized amounts that are included in costoperations and resulting revenues and expenses of products sold to calculate segment margin. These amounts aresuch affiliates. We do not included in Segment Adjusted EBITDA; therefore, the unrealized losses are added back and the unrealized gains are subtracted to calculate the segment measure.
Non-cash compensation expense. These amounts represent the total non-cash compensation recorded in operating expenses and selling, general and administrative expenses. This expense is not included in Segment Adjusted EBITDA and therefore is added back to calculate the segment measure.
Adjusted EBITDA related to unconsolidated affiliates. These amounts represent our proportionate share of the Adjusted EBITDA ofcontrol our unconsolidated affiliates. Amounts reflected are calculated consistently with our definitionaffiliates; therefore, we do not control the earnings or cash flows of Adjusted EBITDA.
such affiliates.In the following analysis of segment operating results, a measure of segment margin is reported for segments with sales revenues. Segment Marginmargin is a non-GAAP financial measure and is presented herein to assist in the analysis of segment operating results and particularly to facilitate an understanding of the impacts that changes in sales revenues have on the segment performance measure of Segment Adjusted EBITDA. Segment Marginmargin is similar to the GAAP measure of gross margin, except that Segment Marginsegment margin excludes charges for depreciation, depletion and amortization. Among the GAAP measures reported by the Partnership, the most directly comparable measure to segment margin is Segment Adjusted EBITDA; a reconciliation of segment margin to Segment Adjusted EBITDA is included in the following tables for each segment where segment margin is presented.
In addition, for certain segments, the sections below include information on the components of Segment Marginsegment margin by sales type, which components are included in order to provide additional disaggregated information to facilitate the analysis of Segment Marginsegment margin and Segment Adjusted EBITDA. For example, these components include transportation margin, storage margin, and other margin. These components of Segment Marginsegment margin are calculated consistent with the calculation of Segment Margin;segment margin; therefore, these components also exclude charges for depreciation, depletion and amortization.
For additional information regarding our business segments, see “Item 1. Business” and Notes 1 and 1516 to our consolidated financial statements in “Item 8. Financial Statements and Supplementary Data.”
Following is a reconciliation of Segment Margin to operating income, as reported in the Partnership’s consolidated statements of operations:
|
| | | | | | | |
| | Years Ended December 31, |
| | 2017 | | 2016 |
| Intrastate transportation and storage | $ | 756 |
| | $ | 716 |
|
| Interstate transportation and storage | 934 |
| | 969 |
|
| Midstream | 2,182 |
| | 1,798 |
|
| NGL and refined products transportation and services | 2,140 |
| | 1,856 |
|
| Crude oil transportation and services | 1,877 |
| | 1,123 |
|
| All other | 392 |
| | 330 |
|
| Intersegment eliminations | (28 | ) | | (45 | ) |
| Total segment margin | 8,253 |
| | 6,747 |
|
| Less: | | | |
| Operating expenses | 2,170 |
| | 1,839 |
|
| Depreciation, depletion and amortization | 2,332 |
| | 1,986 |
|
| Selling, general and administrative | 434 |
| | 348 |
|
| Impairment losses | 920 |
| | 813 |
|
| Operating income | $ | 2,397 |
| | $ | 1,761 |
|
Operating Results
Intrastate Transportation and Storage
| | | | Years Ended December 31, | | | Years Ended December 31, | | |
| | 2017 | | 2016 | | Change | 2019 | | 2018 | | Change |
| Natural gas transported (BBtu/d) | 8,760 |
| | 8,328 |
| | 432 |
| 12,442 |
| | 10,873 |
| | 1,569 |
|
| Revenues | $ | 3,083 |
| | $ | 2,613 |
| | $ | 470 |
| $ | 3,099 |
| | $ | 3,737 |
| | $ | (638 | ) |
| Cost of products sold | 2,327 |
| | 1,897 |
| | 430 |
| 1,909 |
| | 2,665 |
| | (756 | ) |
| Segment margin | 756 |
| | 716 |
| | 40 |
| 1,190 |
| | 1,072 |
| | 118 |
|
| Unrealized (gains) losses on commodity risk management activities | (5 | ) | | 19 |
| | (24 | ) | |
| Unrealized losses on commodity risk management activities | | 2 |
| | 38 |
| | (36 | ) |
| Operating expenses, excluding non-cash compensation expense | (168 | ) | | (162 | ) | | (6 | ) | (190 | ) | | (189 | ) | | (1 | ) |
| Selling, general and administrative expenses, excluding non-cash compensation expense | (22 | ) | | (22 | ) | | — |
| (29 | ) | | (27 | ) | | (2 | ) |
| Adjusted EBITDA related to unconsolidated affiliates | 64 |
| | 61 |
| | 3 |
| 25 |
| | 32 |
| | (7 | ) |
| Other | 1 |
| | 1 |
| | — |
| 1 |
| | 1 |
| | — |
|
| Segment Adjusted EBITDA | $ | 626 |
| | $ | 613 |
| | $ | 13 |
| $ | 999 |
| | $ | 927 |
| | $ | 72 |
|
Volumes. For the year ended December 31, 20172019 compared to the prior year, transported volumes increased primarily due to higher demand for exports to Mexico, morethe impact of reflecting RIGS as a consolidated subsidiary beginning April 2018 and the impact of the Red Bluff Express pipeline coming online in May 2018, as well as the impact of favorable market pricing and the addition of new pipelines to our intrastate pipeline system. These increases were partially offset by lower production volumes in the Barnett Shale region.spreads.
Segment Margin. The components of our intrastate transportation and storage segment margin were as follows:
|
| | | | | | | | | | | |
| | Years Ended December 31, | | |
| | 2017 | | 2016 | | Change |
| Transportation fees | $ | 448 |
| | $ | 505 |
| | $ | (57 | ) |
| Natural gas sales and other | 193 |
| | 113 |
| | 80 |
|
| Retained fuel revenues | 62 |
| | 48 |
| | 14 |
|
| Storage margin, including fees | 53 |
| | 50 |
| | 3 |
|
| Total segment margin | $ | 756 |
| | $ | 716 |
| | $ | 40 |
|
|
| | | | | | | | | | | |
| | Years Ended December 31, | | |
| | 2019 | | 2018 | | Change |
| Transportation fees | $ | 614 |
| | $ | 525 |
| | $ | 89 |
|
| Natural gas sales and other (excluding unrealized gains and losses) | 505 |
| | 510 |
| | (5 | ) |
| Retained fuel revenues (excluding unrealized gains and losses) | 50 |
| | 59 |
| | (9 | ) |
| Storage margin, including fees (excluding unrealized gains and losses) | 23 |
| | 16 |
| | 7 |
|
| Unrealized losses on commodity risk management activities | (2 | ) | | (38 | ) | | 36 |
|
| Total segment margin | $ | 1,190 |
| | $ | 1,072 |
| | $ | 118 |
|
Segment Adjusted EBITDA. For the year ended December 31, 20172019 compared to the prior year, Segment Adjusted EBITDA related to our intrastate transportation and storage segment increased due to the net impacts of the following:
an increase of $74 million in natural gas sales and other (excluding net changes in unrealized gains and losses of $6 million) primarily due to higher realized gains from pipeline optimization activity;
an increase of $10 million in retained fuel sales (excluding net changes in unrealized gains and losses of $4 million) primarily due to higher market prices. The average spot price at the Houston Ship Channel location increased 22% for the year ended December 31, 2017 compared to the prior year; and
an increase of $3 million in adjusted EBITDA related to unconsolidated affiliates primarily due to an increase of $16 million related to two new joint venture pipelines placed in service in 2017, offset by a decrease of $6 million due to lower demand volumes related to renegotiation of a contract on our Louisiana intrastate pipeline system in 2017 and a decrease of $7 million due to a reserve recorded in 2017 pursuant to the bankruptcy filing of a transport customer on our Louisiana intrastate system; offset by
a decrease in transportation fees of $57 million due to renegotiated contracts resulting in lower billed volumes. This decrease was offset by increased margin from optimization activity recorded in natural gas sales and other;
a decrease of $11 million in storage margin (excluding net changes in unrealized gains and losses of $14 million related to fair value inventory adjustments and unrealized gains and losses on derivatives), as discussed below; and
an increase of $6 million in operating expenses primarily due to higher compression fuel expense relating to increased market price and run times at various compressor stations.
Storage margin was comprised of the following:
|
| | | | | | | | | | | |
| | Years Ended December 31, | | |
| | 2017 | | 2016 | | Change |
| Withdrawals from storage natural gas inventory (BBtu) | 27,195 |
| | 38,905 |
| | (11,710 | ) |
| Realized margin on natural gas inventory transactions | $ | 24 |
| | $ | 36 |
| | $ | (12 | ) |
| Fair value inventory adjustments | (35 | ) | | 76 |
| | (111 | ) |
| Unrealized gains (losses) on derivatives | 38 |
| | (87 | ) | | 125 |
|
| Margin recognized on natural gas inventory, including related derivatives | 27 |
| | 25 |
| | 2 |
|
| Revenues from fee-based storage | 26 |
| | 25 |
| | 1 |
|
| Total storage margin | $ | 53 |
| | $ | 50 |
| | $ | 3 |
|
The changes in storage margin were primarily due to the movement in market price of the physical storage gas and the financial derivatives used to hedge that gas. | |
| • | an increase of $64 million in transportation fees, excluding the impact of consolidating RIGS beginning April 2018 as discussed below, primarily due to the Red Bluff Express pipeline coming online in May 2018, as well as new contracts; |
| |
| • | a net increase of $11 million primarily due to the consolidation of RIGS beginning April 2018, resulting in increases in transportation fees, retained fuel revenues and operating expenses of $24 million, $2 million and $6 million, respectively, partially offset by a decrease in Adjusted EBITDA related to unconsolidated affiliates of $9 million; and |
| |
| • | an increase of $7 million in realized storage margin primarily due to a realized adjustment to the Bammel storage inventory of $25 million in 2018 and higher storage fees, partially offset by a $20 million decrease due to lower physical withdrawals; partially offset by |
| |
| • | a decrease of $9 million in retained fuel revenues primarily due to lower gas prices; and |
| |
| • | a decrease of $5 million in realized natural gas sales and other due to lower realized gains from pipeline optimization activity. |
Interstate Transportation and Storage
| | | | Years Ended December 31, | | | Years Ended December 31, | | |
| | 2017 | | 2016 | | Change | 2019 | | 2018 | | Change |
| Natural gas transported (BBtu/d) | 6,082 |
| | 5,476 |
| | 606 |
| 11,346 |
| | 9,542 |
| | 1,804 |
|
| Natural gas sold (BBtu/d) | 18 |
| | 19 |
| | (1 | ) | 17 |
| | 17 |
| | — |
|
| Revenues | $ | 934 |
| | $ | 969 |
| | $ | (35 | ) | $ | 1,963 |
| | $ | 1,682 |
| | $ | 281 |
|
| Operating expenses, excluding non-cash compensation, amortization and accretion expenses | (296 | ) | | (302 | ) | | 6 |
| (569 | ) | | (431 | ) | | (138 | ) |
| Selling, general and administrative expenses, excluding non-cash compensation, amortization and accretion expenses | (46 | ) | | (47 | ) | | 1 |
| (72 | ) | | (63 | ) | | (9 | ) |
| Adjusted EBITDA related to unconsolidated affiliates | 498 |
| | 494 |
| | 4 |
| 477 |
| | 492 |
| | (15 | ) |
| Other | 8 |
| | 3 |
| | 5 |
| (7 | ) | | — |
| | (7 | ) |
| Segment Adjusted EBITDA | $ | 1,098 |
| | $ | 1,117 |
| | $ | (19 | ) | $ | 1,792 |
| | $ | 1,680 |
| | $ | 112 |
|
Volumes. For the year ended December 31, 20172019 compared to the prior year, transported volumes increased 283 BBtu/d due to the partial in serviceas a result of the Rover pipeline, 148 BBtu/d on the Tiger pipeline due to an increase in production inaddition of new contracted volumes for delivery out of the Haynesville Shale, higher volumes on our Rover pipeline as a result of the full year availability of new supply connections, and deliveries into third party storage and the intrastate markets, and 128 BBtu/d and 78 BBtu/dhigher throughput on the Trunkline and Panhandle pipelines, respectively, due to increased utilization of higher demand resulting from colder weather.contracted capacity.
Segment Adjusted EBITDA. For the year ended December 31, 20172019 compared to the prior year, Segment Adjusted EBITDA related to our interstate transportation and storage segment decreasedincreased due to the net impacts of the following:
a net decreasean increase in margin of $35$231 million in revenues primarily due to a decrease in reservation revenues of $45 million onfrom the Panhandle, Trunkline, and Transwestern pipelines, a decrease of $17 million in gas parking service related revenues on the Panhandle and Trunkline pipelines primarily due to lack of customer demand resulting from weak spreads, a decrease of $19 million in revenues on the TigerRover pipeline due to contract restructuring,higher reservation and a decreaseusage resulting from additional connections and utilization of $5additional compression;
an increase of $40 million in reservation and usage fees due to improved market conditions allowing us to successfully bring new volumes to the system at improved rates, primarily on our Transwestern, Tiger and Panhandle Eastern systems; and
an increase of $6 million from the Sea Robin pipeline due to producer maintenance and production declines. These decreases werehigher rates resulting from the rate case filed in June 2019, as well as fewer third party supply interruptions on the Sea Robin system; partially offset by $55
an increase of $138 million in operating expense primarily due to an increase in ad valorem taxes of incremental revenues from the placement in partial service of$126 million on the Rover pipeline effective August 31, 2017; offset by
a decreasesystem resulting from placing the final portions of this asset into service in operating expensesNovember 2018, an increase of $6$24 million primarilyin transportation expense on Rover due to loweran increase in transportation volumes, an increase of $5 million in allocated overhead costs of $8 million and lower lease storageadditional operating expense of $4 million due to expiration of a lease. These decreases were partially offset by higher ad valorem taxes resulting from higher valuations;
an increasefor assets acquired in adjusted EBITDA from unconsolidated affiliates of $4 million due to an increase of $6 million related to a legal settlement, an increase of $3 million resulting from higher sales of short term firm capacity on Citrus and $2 million related to higher tax gross up income from reimbursable projects on Citrus. These increases wereJune 2019, partially offset by lower reservation revenuesgas imbalance and system gas activity of $15 million and lower storage capacity leased on MEP primarily due to a contract modification and expiring contracts; and
an increase in otherthe Panhandle Eastern system of $5 million primarily due to higher tax gross up income from reimbursable projects.$8 million;
| |
| • | an increase of $9 million in selling, general and administrative expenses primarily due to an increase in insurance expense of $8 million, an increase in employee cost of $4 million, and an increase in allocated overhead costs of $3 million, partially offset by lower Ohio excise tax on our Rover system; and |
a decrease of $15 million in adjusted EBITDA related to unconsolidated affiliates primarily resulting from a $20 million decrease due to lower earnings from MEP as a result of lower capacity being re-contracted at lower rates on expiring contracts, partially offset by a $5 million increase from our Citrus joint venture as we brought new volumes to the system in 2019.
Midstream
| | | | Years Ended December 31, | | | Years Ended December 31, | | |
| | 2017 | | 2016 | | Change | 2019 | | 2018 | | Change |
| Gathered volumes (BBtu/d) | 10,956 |
| | 9,814 |
| | 1,142 |
| 13,431 |
| | 12,126 |
| | 1,305 |
|
| NGLs produced (MBbls/d) | 457 |
| | 438 |
| | 19 |
| 570 |
| | 540 |
| | 30 |
|
| Equity NGLs (MBbls/d) | 27 |
| | 31 |
| | (4 | ) | 31 |
| | 29 |
| | 2 |
|
| Revenues | $ | 6,943 |
| | $ | 5,179 |
| | $ | 1,764 |
| $ | 6,019 |
| | $ | 7,522 |
| | $ | (1,503 | ) |
| Cost of products sold | 4,761 |
| | 3,381 |
| | 1,380 |
| 3,570 |
| | 5,145 |
| | (1,575 | ) |
| Segment margin | 2,182 |
| | 1,798 |
| | 384 |
| 2,449 |
| | 2,377 |
| | 72 |
|
| Unrealized (gains) losses on commodity risk management activities | (15 | ) | | 15 |
| | (30 | ) | |
| Operating expenses, excluding non-cash compensation expense | (638 | ) | | (621 | ) | | (17 | ) | (789 | ) | | (705 | ) | | (84 | ) |
| Selling, general and administrative expenses, excluding non-cash compensation expense | (78 | ) | | (84 | ) | | 6 |
| (90 | ) | | (81 | ) | | (9 | ) |
| Adjusted EBITDA related to unconsolidated affiliates | 28 |
| | 24 |
| | 4 |
| 27 |
| | 33 |
| | (6 | ) |
| Other | 2 |
| | 1 |
| | 1 |
| 2 |
| | 3 |
| | (1 | ) |
| Segment Adjusted EBITDA | $ | 1,481 |
| | $ | 1,133 |
| | $ | 348 |
| $ | 1,599 |
| | $ | 1,627 |
| | $ | (28 | ) |
Volumes. Gathered volumes and NGL production increased during For the year ended December 31, 20172019 compared to the prior year, gathered volumes increased primarily due to recent acquisitions, including PennTex,increases in the Northeast, Permian, Ark-La-Tex, South Texas and gainsNorth Texas regions. NGL production increased due to increases in the Permian Northeast and SouthNorth Texas regions partially offset by basin declinesethane rejection in Norththe South Texas and Mid-Continent/Panhandle regions.region.
Segment Margin. The table below presents the components of our midstream segment margin were as follows:
|
| | | | | | | | | | | |
| | Years Ended December 31, | | |
| | 2017 | | 2016 | | Change |
| Gathering and processing fee-based revenues | $ | 1,695 |
| | $ | 1,551 |
| | $ | 144 |
|
| Non-fee based contracts and processing | 487 |
| | 247 |
| | 240 |
|
| Total segment margin | $ | 2,182 |
| | $ | 1,798 |
| | $ | 384 |
|
Segment Adjusted EBITDA.margin. For the year ended December 31, 20172018, the amounts previously reported for fee-based and non-fee-based margin have been adjusted to reflect reclassification of certain contractual minimum fees from fee-based margin to non-fee-based margin in order to conform to the current period classification.
|
| | | | | | | | | | | |
| | Years Ended December 31, | | |
| | 2019 | | 2018 | | Change |
| Gathering and processing fee-based revenues | $ | 1,998 |
| | $ | 1,788 |
| | $ | 210 |
|
| Non-fee based contracts and processing | 451 |
| | 589 |
| | (138 | ) |
| Total segment margin | $ | 2,449 |
| | $ | 2,377 |
| | $ | 72 |
|
Segment Adjusted EBITDA. For the year ended December 31, 2019 compared to the prior year, Segment Adjusted EBITDA related to our midstream segment increaseddecreased due to the net impacts of the following:
| |
| • | a decrease of $138 million in non fee-based margin due to lower NGL prices of $131 million and lower gas prices of $58 million, offset by an increase of $51 million in non fee-based margin due to increased throughput volume in North Texas, South Texas and Permian regions; |
an increase of $84 million in operating expenses due to increases of $33 million in outside services, $29 million in maintenance project costs, $17 million in employee costs and $6 million in office expenses and materials; and
an increase of $150$9 million in non-fee based margins due to higher crude oil and NGL prices;
an increase of $60 million in non-fee based margin (excluding net changes in unrealized gains and losses of $30 million) due to volume increases in the Permian, Northeast and South Texas regions, partially offset by volume declines in the North Texas and the Mid-Continent/Panhandle regions;
an increase of $80 million in fee-based revenue due to minimum volume commitments in the South Texas region, as well as volume increases in the Permian and Northeast regions. These increases were partially offset by volume declines in the North Texas and the Mid-Continent/Panhandle regions;
an increase of $64 million in fee-based revenue due to recent acquisitions, including PennTex; and
a decrease in selling, general and administrative expenses of $6 million primarily due to a favorable impact from the adjustmentdecrease of certain reserves that had previously been recorded$5 million in connection with contingent matters. This decrease wascapitalized overhead and an increase of $4 million in insurance expense; partially offset by a decrease in capitalized overhead of $11 million and an increase in shared services allocation of $14 million; partially offset by
| |
| • | an increase of $210 million in fee-based margin due to volume growth in the Northeast, Permian, Ark-La-Tex, North Texas and South Texas regions. |
an increase in operating expenses of $17 million primarily due to recent acquisitions, including PennTex.
NGL and Refined Products Transportation and Services
| | | | Years Ended December 31, | | | Years Ended December 31, | | |
| | 2017 | | 2016 | | Change | 2019 | | 2018 | | Change |
| NGL transportation volumes (MBbls/d) | 863 |
| | 754 |
| | 109 |
| 1,289 |
| | 1,027 |
| | 262 |
|
| Refined products transportation volumes (MBbls/d) | 624 |
| | 599 |
| | 25 |
| 583 |
| | 621 |
| | (38 | ) |
| NGL and refined products terminal volumes (MBbls/d) | 793 |
| | 791 |
| | 2 |
| 944 |
| | 812 |
| | 132 |
|
| NGL fractionation volumes (MBbls/d) | 427 |
| | 361 |
| | 66 |
| 706 |
| | 527 |
| | 179 |
|
| Revenues | $ | 8,648 |
| | $ | 6,409 |
| | $ | 2,239 |
| $ | 11,641 |
| | $ | 11,123 |
| | $ | 518 |
|
| Cost of products sold | 6,508 |
| | 4,553 |
| | 1,955 |
| 8,393 |
| | 8,462 |
| | (69 | ) |
| Segment margin | 2,140 |
| | 1,856 |
| | 284 |
| 3,248 |
| | 2,661 |
| | 587 |
|
| Unrealized (gains) losses on commodity risk management activities | (26 | ) | | 69 |
| | (95 | ) | 81 |
| | (86 | ) | | 167 |
|
| Operating expenses, excluding non-cash compensation expense | (478 | ) | | (441 | ) | | (37 | ) | (656 | ) | | (604 | ) | | (52 | ) |
| Selling, general and administrative expenses, excluding non-cash compensation expense | (64 | ) | | (56 | ) | | (8 | ) | (93 | ) | | (74 | ) | | (19 | ) |
| Adjusted EBITDA related to unconsolidated affiliates | 68 |
| | 67 |
| | 1 |
| 83 |
| | 82 |
| | 1 |
|
| Other | 1 |
| | 1 |
| | — |
| |
| Segment Adjusted EBITDA | $ | 1,641 |
| | $ | 1,496 |
| | $ | 145 |
| $ | 2,663 |
| | $ | 1,979 |
| | $ | 684 |
|
Volumes. For the year ended December 31, 2019 compared to the prior year, throughput barrels on our Texas NGL pipeline system increased due to higher receipt of liquids production from both wholly-owned and third-party gas plants primarily in the Permian and North Texas regions. In addition, NGL transportation volumes on our Northeast assets increased due to the initiation of service on the Mariner East 2 pipeline system.
Refined products transportation volumes decreased for the year ended December 31, 20172019 compared to the prior year NGL anddue to the closure of a third party refinery during the third quarter of 2019, negatively impacting supply to our refined productproducts transportation system. These decreases in volumes increased fromare partially offset by the Permian, Barnett/East Texas, Eagle Ford, Southeast Texas, Marcellus and Louisiana. initiation of service on the JC Nolan Pipeline in the third quarter of 2019.
NGL and refined products terminal volumes increased slightly for the year ended December 31, 20172019 compared to the prior year primarily due to increased throughput atthe initiation of service on our Marcus Hook Industrial Complex fromMariner East 2 pipeline system which commenced operations in the Northeast producing region, the impactfourth quarter of which was partially offset by the sale of one of our refined product terminals in April 2017.2018.
Average volumes fractionated at our Mont Belvieu, Texas fractionation facility increased 22% for the year ended December 31, 20172019 compared to the prior year primarily due to the commissioning of our fourth fractionatorfifth and sixth fractionators in October of 2016, which has a capacity of 120 MBbls/d, as well as increased producer volumes as mentioned above.July 2018 and February 2019, respectively.
Segment Margin. The components of our NGL and refined products transportation and services segment margin were as follows:
| | | | Years Ended December 31, | | | Years Ended December 31, | | |
| | 2017 | | 2016 | | Change | 2019 | | 2018 | | Change |
| Fractionators and Refinery services margin | $ | 488 |
| | $ | 404 |
| | $ | 84 |
| |
| Fractionators and refinery services margin | | $ | 664 |
| | $ | 511 |
| | $ | 153 |
|
| Transportation margin | 990 |
| | 866 |
| | 124 |
| 1,716 |
| | 1,233 |
| | 483 |
|
| Storage margin | 214 |
| | 208 |
| | 6 |
| 223 |
| | 211 |
| | 12 |
|
| Terminal Services margin | 351 |
| | 322 |
| | 29 |
| 630 |
| | 494 |
| | 136 |
|
| Marketing margin | 97 |
| | 56 |
| | 41 |
| 96 |
| | 126 |
| | (30 | ) |
| Unrealized gains (losses) on commodity risk management activities | | (81 | ) | | 86 |
| | (167 | ) |
| Total segment margin | $ | 2,140 |
| | $ | 1,856 |
| | $ | 284 |
| $ | 3,248 |
| | $ | 2,661 |
| | $ | 587 |
|
Segment Adjusted EBITDA. For the year ended December 31, 20172019 compared to the prior year, Segment Adjusted EBITDA related to our NGL and refined products transportation and services segment increased due to the net impacts of the following:
an increase of $483 million in transportation margin of $124 million primarily due to increased throughput on our Texas NGL pipelinesa $265 million increase resulting from increased producer services as noted above and the ramp upinitiation of volumesservice on our Mariner East system;
an increase2 pipeline in fractionation and refinery services marginthe fourth quarter of $81 million (excluding changes in unrealized gains and losses of $3 million) primarily due to higher NGL volumes from most major producing regions feeding our Mont Belvieu fractionation facility, the first full year of service for our fourth fractionator at Mont Belvieu, Texas, and2018, a $17 million increase from blending gains as a result of improved market pricing, as noted above;
an increase in terminal services margin of $29 million due to a $43$212 million increase resulting from higher throughput volumes atreceived from the Permian region on our Marcus HookTexas NGL pipelines, a $29 million increase due to higher throughput volumes from the Barnett region, a $9 million increase from the Eagle Ford region, and Nederlanda $9 million increase due to the
initiation of service on the JC Nolan Pipeline. These increases were partially offset by a $21 million decrease resulting from Mariner East 1 pipeline downtime, a $13 million decrease due to the closure of a third-party refinery during the third quarter of 2019, negatively impacting refined product supply to our system, and a $5 million decrease due to the timing of deficiency fees on Mariner West;
an increase of $153 million in fractionation and refinery services margin primarily due to a $167 million increase resulting from the commissioning of our fifth and sixth fractionators in July 2018 and February 2019, respectively, and higher NGL terminals.volumes from the Permian region feeding our Mont Belvieu fractionation facility. This increase was partially offset by a $14 million decrease resulting from lower refined products terminal throughputreclassification between our fractionation and the sale of one of our refined product terminals in April of 2017; and
storage margins;
an increase of $136 million in storageterminal services margin of $6 million primarily due to a $4$171 million increase from Hattiesburg storage caverns asthe initiation of service of our Mariner East 2 pipeline which commenced operations in the fourth quarter of 2018 and a result$7 million increase due to increased tank lease revenue from third-party customers. These increases were partially offset by a $16 million decrease in volumes and expense reimbursements from third parties on Mariner East 1, a $16 million decrease due to lower volumes from third party pipeline, truck and rail deliveries into our Marcus Hook terminal, a $5 million decrease due to fewer vessels exported out of our Nederland terminal, and a $4 million decrease due to the closure of a newthird party refinery during the third quarter of 2019; and
an increase of $12 million in storage contract effective in April 2017 as well asmargin primarily due to a $2 million increase from propanereclassification between our storage and butane blending gains as a result of improved market pricing;fractionation margins; partially offset by
a decrease of $30 million in marketing margin primarily due to capacity lease fees incurred by our marketing affiliate on our Mariner East 2 pipeline, offset by increased gains from our butane blending business due to more favorable market conditions and increased volumes, as well as increased optimization gains from the sale of $54NGL component products at our Mont Belvieu facility;
an increase of $52 million (excluding changes in unrealized gains of $95 million)operating expenses primarily due to a $26 million increase in employee and ad valorem tax expenses on our terminals, fractionation, and transportation operations, a $14 million increase in utility costs to operate our pipelines and our fifth and sixth fractionators which commenced July 2018 and February 2019, respectively, and an $8 million increase in maintenance project costs due to the timing of the recognition of margin from optimization activities;multiple projects on our transportation assets; and
an increase in operating expenses of $37$19 million due to a $16 million increase related to the fourth fractionator being placed into service in October 2016, a $11 million increase related to higher utility expenses on our Texas NGL pipes, a $5 million increase due to higher right-of-way expenses primarily on our legacy Sunoco Logistics assets, and a $4 million increase from our Mont Belvieu storage assets primarily due to higher employee costs; and
an increase in general and administrative expenses of $8 millionprimarily due to higher allocations.a $10 million increase in allocated overhead costs, a $5 million increase in insurance expenses, a $4 million increase in legal fees, and a $2 million increase in employee costs.
Crude Oil Transportation and Services
| | | | Years Ended December 31, | | | Years Ended December 31, | | |
| | 2017 | | 2016 | | Change | 2019 | | 2018 | | Change |
| Crude Transportation Volumes (MBbls/d) | 3,491 |
| | 2,652 |
| | 839 |
| |
| Crude Terminals Volumes (MBbls/d) | 1,928 |
| | 1,537 |
| | 391 |
| |
| Crude transportation volumes (MBbls/d) | | 4,662 |
| | 4,172 |
| | 490 |
|
| Crude terminals volumes (MBbls/d) | | 2,068 |
| | 2,096 |
| | (28 | ) |
| Revenue | $ | 11,703 |
| | $ | 7,539 |
| | $ | 4,164 |
| $ | 18,307 |
| | $ | 17,332 |
| | $ | 975 |
|
| Cost of products sold | 9,826 |
| | 6,416 |
| | 3,410 |
| 14,649 |
| | 14,439 |
| | 210 |
|
| Segment margin | 1,877 |
| | 1,123 |
| | 754 |
| 3,658 |
| | 2,893 |
| | 765 |
|
| Unrealized losses on commodity risk management activities | 1 |
| | 2 |
| | (1 | ) | |
| Unrealized (gains) losses on commodity risk management activities | | (70 | ) | | 55 |
| | (125 | ) |
| Operating expenses, excluding non-cash compensation expense | (430 | ) | | (247 | ) | | (183 | ) | (560 | ) | | (547 | ) | | (13 | ) |
| Selling, general and administrative expenses, excluding non-cash compensation expense | (82 | ) | | (58 | ) | | (24 | ) | (84 | ) | | (86 | ) | | 2 |
|
| Adjusted EBITDA related to unconsolidated affiliates | 13 |
| | 14 |
| | (1 | ) | 6 |
| | 15 |
| | (9 | ) |
| Other | | (1 | ) | | — |
| | (1 | ) |
| Segment Adjusted EBITDA | $ | 1,379 |
| | $ | 834 |
| | $ | 545 |
| $ | 2,949 |
| | $ | 2,330 |
| | $ | 619 |
|
Segment Adjusted EBITDA. For the year ended December 31, 20172019 compared to the prior year, Segment Adjusted EBITDA related to our crude oil transportation and services segment increased due to the net impacts of the following:
an increase of $724$640 million in segment margin (excluding unrealized gains and losses on commodity risk management activities) primarily due to a $282 million increase resulting from higher throughput on our Texas crude pipeline system primarily due to increased production from the Permian region and contributions from capacity expansion projects placed into service, a $219 million increase in throughput on our Bakken pipeline, a favorable inventory valuation adjustment of
$111 million for the 2019 year as compared to an unfavorable inventory valuation adjustment of $54 million for the 2018 year, partially offset by a $50 million reduction due to lower pipeline basis spreads net of hedges. We also realized a $66 million increase from higher volumes on our Bayou Bridge Pipeline and a $26 million increase primarily from placinghigher throughput, ship loading and tank rental fees at our Bakken Pipeline in service inNederland terminal; partially offset by a $54 million decrease from our Oklahoma assets resulting from lower volumes to the second quarter of 2017,system as well as from the acquisitiontiming of a crude oil gathering systemdeficiency payment made in West Texas, and the additionprior year, a $12 million decrease due to the closure of a joint venturethird party refinery which was the primary customer utilizing one of our northeast crude transportation assets;terminals. The remainder of the offsetting decrease was primarily attributable to a change in the presentation of certain intrasegment transactions, which were eliminated in the current period presentation but were shown on a gross basis in revenues and operating expenses in the prior period; partially offset by
an increase of $90 million from existing transport assets due to increased volumes throughout the system; and
an increase of $16 million from increased throughput fees and tank rentals, primarily from increased activity at our Nederland, Texas crude terminal; offset by
a decrease of $78 million in margin from our crude oil acquisition and marketing business resulting from less favorable market price spreads particularly in the first three quarters of 2017;
an increase of $183$13 million in operating expenses primarily due to ana $30 million increase of $130in throughput-related costs on existing assets, partially offset by a $14 million resulting primarily from placing the Bakken Pipelinedecrease in management fees as well as the impact of certain joint venture crude transportation assetsintrasegment transactions discussed above; and
a decrease of $9 million in service in the first and second quarters of 2017, an increase of $46 millionAdjusted EBITDA related to unconsolidated affiliates due to higher utilities, line testing, and environmental costslower margin from existing transport assets, an increasejet fuel sales by our joint ventures.
Investment in Sunoco LP
|
| | | | | | | | | | | |
| | Years Ended December 31, | | |
| | 2019 | | 2018 | | Change |
| Revenues | $ | 16,596 |
| | $ | 16,994 |
| | $ | (398 | ) |
| Cost of products sold | 15,380 |
| | 15,872 |
| | (492 | ) |
| Segment margin | 1,216 |
| | 1,122 |
| | 94 |
|
| Unrealized (gains) losses on commodity risk management activities | (5 | ) | | 6 |
| | (11 | ) |
| Operating expenses, excluding non-cash compensation expense | (365 | ) | | (435 | ) | | 70 |
|
| Selling, general and administrative, excluding non-cash compensation expense | (123 | ) | | (129 | ) | | 6 |
|
| Adjusted EBITDA related to unconsolidated affiliates | 4 |
| | — |
| | 4 |
|
| Inventory valuation adjustments | (79 | ) | | 85 |
| | (164 | ) |
| Adjusted EBITDA from discontinued operations | — |
| | (25 | ) | | 25 |
|
| Other, net | 17 |
| | 14 |
| | 3 |
|
| Segment Adjusted EBITDA | $ | 665 |
| | $ | 638 |
| | $ | 27 |
|
The Investment in Sunoco LP segment reflects the consolidated results of $6 million for lossesSunoco LP.
Segment Adjusted EBITDA. For the year ended December 31, 2019 compared to the prior year, Segment Adjusted EBITDA related to Hurricane Harvey;the Investment in Sunoco LP segment increased due to the net impacts of the following:
| |
| • | a decrease in operating costs of $76 million, primarily as a result of the conversion of 207 retail sites to commission agent sites during April 2018. These expenses include other operating expense, general and administrative expense and lease expense; and |
| |
| • | an increase of $25 million related to Adjusted EBITDA from discontinued operations related to the divestment of 1,030 company-operated fuel sites to 7-Eleven in January 2018; and |
| |
| • | an increase of $4 million in Adjusted EBITDA related to unconsolidated affiliates due to Sunoco LP’s investment in the JC Nolan joint venture; partially offset by |
| |
| • | a decrease in the gross profit on motor fuel sales of $76 million (excluding the change in inventory fair value adjustments and unrealized gains and losses on commodity risk management activities) primarily due to lower fuel margins, a one-time benefit of approximately $25 million related to a cash settlement with a fuel supplier recorded in 2018 and an $8 million one-time charge related to a reserve for an open contractual dispute recorded in 2019, partially offset by an increase in gallons sold. |
Investment in selling, general and administrative expensesUSAC
|
| | | | | | | | | | | |
| | Years Ended December 31, | | |
| | 2019 | | 2018 | | Change |
| Revenues | $ | 698 |
| | $ | 508 |
| | $ | 190 |
|
| Cost of products sold | 91 |
| | 67 |
| | 24 |
|
| Segment margin | 607 |
| | 441 |
| | 166 |
|
| Operating expenses, excluding non-cash compensation expense | (134 | ) | | (110 | ) | | (24 | ) |
| Selling, general and administrative, excluding non-cash compensation expense | (53 | ) | | (50 | ) | | (3 | ) |
| Other, net | — |
| | 8 |
| | (8 | ) |
| Segment Adjusted EBITDA | $ | 420 |
| | $ | 289 |
| | $ | 131 |
|
The investment in USAC segment reflects the consolidated results of USAC from April 2, 2018, the date ET obtained control of USAC. Changes between periods are primarily due to merger fees and legal and environmental reserves.
USAC beginning April 2, 2018.
All Other
| | | | Years Ended December 31, | | | Years Ended December 31, | | |
| | 2017 | | 2016 | | Change | 2019 | | 2018 | | Change |
| Revenue | $ | 2,901 |
| | $ | 3,272 |
| | $ | (371 | ) | $ | 1,660 |
| | $ | 2,228 |
| | $ | (568 | ) |
| Cost of products sold | 2,509 |
| | 2,942 |
| | (433 | ) | 1,496 |
| | 2,006 |
| | (510 | ) |
| Segment margin | 392 |
| | 330 |
| | 62 |
| 164 |
| | 222 |
| | (58 | ) |
| Unrealized (gains) losses on commodity risk management activities | (11 | ) | | 26 |
| | (37 | ) | |
| Unrealized gains on commodity risk management activities | | (4 | ) | | (2 | ) | | (2 | ) |
| Operating expenses, excluding non-cash compensation expense | (117 | ) | | (79 | ) | | (38 | ) | (62 | ) | | (56 | ) | | (6 | ) |
| Selling, general and administrative expenses, excluding non-cash compensation expense | (103 | ) | | (86 | ) | | (17 | ) | (55 | ) | | (87 | ) | | 32 |
|
| Adjusted EBITDA related to unconsolidated affiliates | 313 |
| | 286 |
| | 27 |
| 3 |
| | 1 |
| | 2 |
|
| Other | 14 |
| | 95 |
| | (81 | ) | |
| Elimination | (1 | ) | | (32 | ) | | 31 |
| |
| Other and eliminations | | 58 |
| | (2 | ) | | 60 |
|
| Segment Adjusted EBITDA | $ | 487 |
| | $ | 540 |
| | $ | (53 | ) | $ | 104 |
| | $ | 76 |
| | $ | 28 |
|
Amounts reflected in our all other segment primarily include:
our equity method investment in limited partnership units of Sunoco LP. As of December 31, 2017, our investment consisted of 43.5 million units, representing 43.6% of Sunoco LP’s total outstanding common units. Subsequent to Sunoco LP’s repurchase of a portion of its common units on February 7, 2018, our investment consists of 26.2 million units, representing 31.8% of Sunoco LP’s total outstanding common units;
our natural gas marketing and compression operations;
a non-controlling interest in PES, comprising 33% of PES’ outstanding common units; and
| |
| • | our natural gas marketing operations; |
| |
| • | our wholly-owned natural gas compression operations; |
| |
| • | a non-controlling interest in PES. Prior to PES’s reorganization in August 2018, ETO’s 33% interest in PES was reflected as an unconsolidated affiliate; subsequent the August 2018 reorganization, ETO holds an approximately 7.4% interest in PES and no longer reflects PES as an affiliate; and |
our investment in coal handling facilities.
Segment Adjusted EBITDA. For the year ended December 31, 20172019 compared to the prior year, Segment Adjusted EBITDA decreasedincreased due to the net impactimpacts of the following:
an increase of $8 million in gains from park and loan and storage activity;
an increase of $11 million in optimized gains on residue gas sales;
an increase of $7 million from settled derivatives;
an increase of $15 million from a legal settlement;
an increase of $12 million from payments related to the PES bankruptcy;
an increase of $6 million from the recognition of deferred revenue related to a bankruptcy;
an increase of $3 million from power trading activities; and
a decrease of $90 million related to the termination of management fees paid by ETE that ended in 2016;
an increase of $17$21 million in selling, generalmerger and administrative expenses primarily from higher transaction-relatedacquisition expenses; andpartially offset by
a decrease of $31$36 million fromdue to the mark-to-marketcontribution of physical system gas and settled derivatives; partially offset by
an increase of $33 millionCDM to USAC in Adjusted EBITDA relatedApril 2018, subsequent to our investmentwhich CDM is reflected in PES;the Investment in USAC segment;
a one-time feedecrease of $15$8 million received from a joint venture affiliate;
an increase of $20 million in crudedue to lower gas prices and increased power trading activates, primarily from the liquidation of crude inventories;costs; and
a decrease of $11 million in expenses relateddue to lower revenue from our compressioncompressor equipment business.
Year Ended December 31, 20162018 Compared to the Year Ended December 31, 20152017
Consolidated Results
| | | | Years Ended December 31, | | | Years Ended December 31, | | |
| | 2016* | | 2015* | | Change | 2018 | | 2017 | | Change |
| Segment Adjusted EBITDA: | | | | | | | | | | |
| Intrastate transportation and storage | $ | 613 |
| | $ | 543 |
| | $ | 70 |
| $ | 927 |
| | $ | 626 |
| | $ | 301 |
|
| Interstate transportation and storage | 1,117 |
| | 1,155 |
| | (38 | ) | 1,680 |
| | 1,274 |
| | 406 |
|
| Midstream | 1,133 |
| | 1,237 |
| | (104 | ) | 1,627 |
| | 1,481 |
| | 146 |
|
| NGL and refined products transportation and services | 1,496 |
| | 1,179 |
| | 317 |
| 1,979 |
| | 1,641 |
| | 338 |
|
| Crude oil transportation and services | 834 |
| | 521 |
| | 313 |
| 2,330 |
| | 1,379 |
| | 951 |
|
| Investment in Sunoco LP | | 638 |
| | 732 |
| | (94 | ) |
| Investment in USAC | | 289 |
| | — |
| | 289 |
|
| All other | 540 |
| | 882 |
| | (342 | ) | 76 |
| | 219 |
| | (143 | ) |
| Total | 5,733 |
| | 5,517 |
| | 216 |
| 9,546 |
| | 7,352 |
| | 2,194 |
|
| Depreciation, depletion and amortization | (1,986 | ) | | (1,929 | ) | | (57 | ) | (2,843 | ) | | (2,541 | ) | | (302 | ) |
| Interest expense, net | (1,317 | ) | | (1,291 | ) | | (26 | ) | |
| Gains on acquisitions | 83 |
| | — |
| | 83 |
| |
| Interest expense, net of interest capitalized | | (1,709 | ) | | (1,575 | ) | | (134 | ) |
| Impairment losses | (813 | ) | | (339 | ) | | (474 | ) | (431 | ) | | (1,039 | ) | | 608 |
|
| Losses on interest rate derivatives | (12 | ) | | (18 | ) | | 6 |
| |
| Gains (losses) on interest rate derivatives | | 47 |
| | (37 | ) | | 84 |
|
| Non-cash compensation expense | (80 | ) | | (79 | ) | | (1 | ) | (105 | ) | | (99 | ) | | (6 | ) |
| Unrealized losses on commodity risk management activities | (131 | ) | | (65 | ) | | (66 | ) | |
| Unrealized gains (losses) on commodity risk management activities | | (11 | ) | | 59 |
| | (70 | ) |
| Inventory valuation adjustments | — |
| | 58 |
| | (58 | ) | (85 | ) | | 24 |
| | (109 | ) |
| Losses on extinguishments of debt | — |
| | (43 | ) | | 43 |
| (109 | ) | | (42 | ) | | (67 | ) |
| Adjusted EBITDA related to unconsolidated affiliates | (946 | ) | | (937 | ) | | (9 | ) | (655 | ) | | (716 | ) | | 61 |
|
| Equity in earnings of unconsolidated affiliates | 59 |
| | 469 |
| | (410 | ) | 344 |
| | 144 |
| | 200 |
|
| Impairment of investment in an unconsolidated affiliate | (308 | ) | | — |
| | (308 | ) | |
| Impairment of investments in unconsolidated affiliates | | — |
| | (313 | ) | | 313 |
|
| Adjusted EBITDA related to discontinued operations | | 25 |
| | (223 | ) | | 248 |
|
| Other, net | 115 |
| | 23 |
| | 92 |
| 30 |
| | 154 |
| | (124 | ) |
| Income before income tax benefit | 397 |
| | 1,366 |
| | (969 | ) | |
| Income tax benefit | 186 |
| | 123 |
| | 63 |
| |
| Income from continuing operations before income tax (expense) benefit | | 4,044 |
| | 1,148 |
| | 2,896 |
|
| Income tax (expense) benefit from continuing operations | | (5 | ) | | 1,804 |
| | (1,809 | ) |
| Income from continuing operations | | 4,039 |
| | 2,952 |
| | 1,087 |
|
| Loss from discontinued operations, net of income taxes | | (265 | ) | | (177 | ) | | (88 | ) |
| Net income | $ | 583 |
| | $ | 1,489 |
| | $ | (906 | ) | $ | 3,774 |
| | $ | 2,775 |
| | $ | 999 |
|
* As adjusted.Adjusted EBITDA (consolidated). For the year ended December 31, 2018 compared to the prior year, Adjusted EBITDA increased approximately $2.2 billion, or 30%. The increase was primarily due to the impact of multiple revenue-generating assets being placed in service and recent acquisitions, as well as increased demand for services on existing assets. The impact of new assets and acquisitions was approximately $1.2 billion, of which the largest increases were from the Bakken pipeline (a $546 million impact to the crude oil transportation and services segment), the Rover pipeline (a $359 million impact to the interstate transportation and storage segment) and the acquisition of USAC (a net impact of $191 million among the investment in USAC and all other segments). The remainder of the increase in Adjusted EBITDA was primarily due to stronger demand on existing assets, particularly due to increased production in the Permian, which impacted multiple segments. Additional discussion of these and other factors
See
affecting Adjusted EBITDA is included in the detailed discussionanalysis of Segment Adjusted EBITDA in the “Segment Operating Results” section below.
Depreciation, Depletion and Amortization. Depreciation, depletion and amortization expense increased primarily due to increasesadditional depreciation from assets recently placed in service partiallyand recent acquisitions.
Interest Expense, Net of Interest Capitalized. Interest expense, net of interest capitalized, increased during the year ended December 31, 2018 compared to December 31, 2017 primarily due to the following:
an increase of $121 million recognized by the Partnership primarily related to an increase in long-term debt, including additional senior note issuances and borrowings under our revolving credit facilities; and
an increase of $78 million due to the acquisition of USAC on April 2, 2018; offset by
a decrease of $191$65 million recognized by Sunoco LP primarily due to the repayment in full of its term loan and lower interest rates on its senior notes as a result of Sunoco LP’s January 23, 2018 issuance of senior notes which paid off in full Sunoco LP’s previously outstanding senior notes which had higher interest rates.
Impairment Losses. During the year ended December 31, 2018, the Partnership recognized goodwill impairments of $378 million and asset impairments of $4 million related to our midstream operations and asset impairments of $9 million related to our crude operations idle leased assets. Sunoco LP recognized a $30 million indefinite-lived intangible impairment related to its contractual rights. USAC recognized a $9 million fixed asset impairment related to certain idle compressor assets.
During the year ended December 31, 2017, the Partnership recorded goodwill impairments of $223 million related to the deconsolidation of Sunoco, LLC and the legacy Sunoco, Inc. retail business.
Gains on Acquisitions. Gains on acquisitions include gains of $83 million in connection with recent acquisitions during 2016, including $41compression business, $229 million related to legacy Sunoco Logistics’ acquisition of the remaining interest in SunVit.
Impairment Losses. In 2016, we recorded goodwill impairments of $638Panhandle, $262 million inrelated to the interstate transportation and storage segment and $32$79 million related to the NGL and refined products transportation and services segment. Sunoco LP recognized goodwill impairments of $387 million in the midstream segment. These goodwill impairments were primarily due2017, of which $102 million was allocated to decreases in projected future revenues and cash flows driven by declines in commodity prices and changes in the markets that these assets serve.continuing operations. In addition, impairment losses for 2016 also include a $133 millionduring the year ended December 31, 2017, the Partnership recorded an impairment to the property, plant and equipment of Sea Robin of $127 million. Additional discussion on these impairments is included in the interstate transportation“Estimates and storage segment due to a decrease in projected future cash flows as well as a $10 million impairment to property, plant and equipment in the midstream segment. In 2015, we recorded goodwill impairments of (i) $99 million related to Transwestern due primarily to the market declines in current and expected future commodity prices in the fourth quarter of 2015, (ii) $106 million related to Lone Star Refinery Services due primarily to changes in assumptions related to potential future revenues as well as the market declines in current and expected future commodity prices, (iii) $110 million of fixed asset impairments related to Lone Star NGL Refinery Services primarily due to the economic obsolescence identified as a result of low utilization and expectedCritical Accounting Policies” below.
decrease in future cash flows, and (iv) $24 million of intangible asset impairments related to Lone Star NGL Refinery Services primarily due to the economic obsolescence identified as a result of expected decrease in future cash flows.
LossesGains (Losses) on Interest Rate Derivatives. Our interest rate derivatives are not designated as hedges for accounting purposes; therefore, changes in fair value are recorded in earnings each period. LossesGains (losses) on interest rate derivatives during the years ended December 31, 20162018 and 20152017 resulted from decreasesan increase in forward interest rates in 2018 and a decrease in forward interest rates in 2017, which caused our forward-starting swaps to decreasechange in value.
Unrealized LossesGains (Losses) on Commodity Risk Management Activities. See discussion of the unrealized gains (losses) on commodity risk management activities included in “Segment Operating Results” below.
Inventory Valuation Adjustments. Inventory valuation reserve adjustments were recorded for the inventory associated with our retail marketing operationsSunoco LP as a result of commodity price changes between periods.
Adjusted EBITDA Related to Unconsolidated Affiliates and Equity in Earnings of Unconsolidated Affiliates. See additional information in “Supplemental Information on Unconsolidated Affiliates” and “Segment Operation Results” below.
Impairment of InvestmentInvestments in an Unconsolidated Affiliate. In 2016,Affiliates. During the year ended December 31, 2017, the Partnership impairedrecorded impairments to its investmentinvestments in MEPFEP of $141 million and recorded a non-cash impairment lossHPC of $308 million based$172 million. Additional discussion on commercial discussions with currentthese impairments is included in “Estimates and potential shippers on MEP regardingCritical Accounting Policies” below.
Adjusted EBITDA Related to Discontinued Operations. Amounts were related to the outlook for long-term transportation contract rates.operations of Sunoco LP’s retail business that were disposed of in January 2018.
Other, net. Other, net in 20162018 and 20152017 primarily includes amortization of regulatory assets and other income and expense amounts.
Income Tax (Expense) Benefit. On December 22, 2017, the Tax Cuts and Jobs Act was signed into law. Among other provisions, the highest corporate federal income tax rate was reduced from 35% to 21% for taxable years beginning after December 31, 2017. As a result, the Partnership recognized a deferred tax benefit of $1.78 billion in December 2017. For the yearsyear ended December 31, 2016 and 2015,2018, the Partnership recorded an income tax benefitexpense due to pre-tax lossesincome at its corporate subsidiaries. The year ended December 31, 2015 also reflectedsubsidiaries, partially offset by a benefit of $24 million of net state tax benefit attributable to statutory state rate changes resulting from the Regency Merger and sale of Susser to Sunoco LP, as well as a favorable impact of $11 million due to a reduction in the statutory Texas franchise tax rate which was enacted by the Texas legislature during the second quarter of 2015.reduction.
Supplemental Information on Unconsolidated Affiliates
The following table presents financial information related to unconsolidated affiliates:
| | | | Years Ended December 31, | | | Years Ended December 31, | | |
| | 2016 | | 2015 | | Change | 2018 | | 2017 | | Change |
| Equity in earnings (losses) of unconsolidated affiliates: | | | | | | | | | | |
| Citrus | $ | 102 |
| | $ | 97 |
| | $ | 5 |
| $ | 141 |
| | $ | 144 |
| | $ | (3 | ) |
| FEP | 51 |
| | 55 |
| | (4 | ) | 55 |
| | 53 |
| | 2 |
|
| MEP | 40 |
| | 45 |
| | (5 | ) | 31 |
| | 38 |
| | (7 | ) |
| HPC | 31 |
| | 32 |
| | (1 | ) | |
| Sunoco, LLC | — |
| | (10 | ) | | 10 |
| |
Sunoco LP (1) | (211 | ) | | 202 |
| | (413 | ) | |
HPC (1)(2) | | 3 |
| | (168 | ) | | 171 |
|
| Other | 46 |
| | 48 |
| | (2 | ) | 114 |
| | 77 |
| | 37 |
|
| Total equity in earnings of unconsolidated affiliates | $ | 59 |
| | $ | 469 |
| | $ | (410 | ) | $ | 344 |
| | $ | 144 |
| | $ | 200 |
|
| | | | | | | | | | | |
Adjusted EBITDA related to unconsolidated affiliates (2): | | | | | | |
Adjusted EBITDA related to unconsolidated affiliates(3): | | | | | | |
| Citrus | $ | 329 |
| | $ | 315 |
| | $ | 14 |
| $ | 337 |
| | $ | 336 |
| | $ | 1 |
|
| FEP | 75 |
| | 75 |
| | — |
| 74 |
| | 74 |
| | — |
|
| MEP | 90 |
| | 96 |
| | (6 | ) | 81 |
| | 88 |
| | (7 | ) |
| HPC | 61 |
| | 61 |
| | — |
| |
| Sunoco, LLC | — |
| | 91 |
| | (91 | ) | |
| Sunoco LP | 271 |
| | 137 |
| | 134 |
| |
HPC (2) | | 9 |
| | 46 |
| | (37 | ) |
| Other | 120 |
| | 162 |
| | (42 | ) | 154 |
| | 172 |
| | (18 | ) |
| Total Adjusted EBITDA related to unconsolidated affiliates | $ | 946 |
| | $ | 937 |
| | $ | 9 |
| $ | 655 |
| | $ | 716 |
| | $ | (61 | ) |
| | | | | | | | | | | |
| Distributions received from unconsolidated affiliates: | | | | | | | | | | |
| Citrus | $ | 144 |
| | $ | 182 |
| | $ | (38 | ) | $ | 171 |
| | $ | 156 |
| | $ | 15 |
|
| FEP | 65 |
| | 69 |
| | (4 | ) | 68 |
| | 47 |
| | 21 |
|
| MEP | 74 |
| | 80 |
| | (6 | ) | 48 |
| | 114 |
| | (66 | ) |
| HPC | 51 |
| | 52 |
| | (1 | ) | |
| Sunoco LP | 138 |
| | 39 |
| | 99 |
| |
HPC (2) | | — |
| | 35 |
| | (35 | ) |
| Other | 69 |
| | 142 |
| | (73 | ) | 110 |
| | 80 |
| | 30 |
|
| Total distributions received from unconsolidated affiliates | $ | 541 |
| | $ | 564 |
| | $ | (23 | ) | $ | 397 |
| | $ | 432 |
| | $ | (35 | ) |
| |
(1) | The partnership previously owned a 49.99% interest in HPC, which owns RIGS. In April 2018, we acquired the remaining 50.01% interest in HPC. Prior to April 2018, HPC was reflected as an unconsolidated affiliate in our financial statements; beginning in April 2018, RIGS is reflected as a wholly-owned subsidiary in our financial statements. |
| |
(2) | For the year ended December 31, 2016,2017, equity in earnings (losses) of unconsolidated affiliates includes the impact of non-cash impairments recorded by Sunoco LP,HPC, which reduced the Partnership’s equity in earnings by $277$185 million. |
| |
(2)(3)
| These amounts represent our proportionate share of the Adjusted EBITDA of our unconsolidated affiliates and are based on our equity in earnings or losses of our unconsolidated affiliates adjusted for our proportionate share of the unconsolidated affiliates’ interest, depreciation, depletion, amortization, non-cash items and taxes. |
Segment Operating Results
Following is a reconciliation of Segment Margin to operating income, as reported in the Partnership’s consolidated statements of operations:
|
| | | | | | | |
| | Years Ended December 31, |
| | 2016 | | 2015 |
| Intrastate transportation and storage | $ | 716 |
| | $ | 696 |
|
| Interstate transportation and storage | 969 |
| | 1,025 |
|
| Midstream | 1,798 |
| | 1,792 |
|
| NGL and refined products transportation and services | 1,856 |
| | 1,566 |
|
| Crude oil transportation and services | 1,123 |
| | 822 |
|
| All other | 330 |
| | 1,745 |
|
| Intersegment eliminations | (45 | ) | | (68 | ) |
| Total segment margin | 6,747 |
| | 7,578 |
|
| Less: | | | |
| Operating expenses | 1,839 |
| | 2,608 |
|
| Depreciation, depletion and amortization | 1,986 |
| | 1,929 |
|
| Selling, general and administrative | 348 |
| | 475 |
|
| Impairment losses | 813 |
| | 339 |
|
| Operating income | $ | 1,761 |
| | $ | 2,227 |
|
Intrastate Transportation and Storage
| | | | Years Ended December 31, | | | Years Ended December 31, | | |
| | 2016 | | 2015 | | Change | 2018 | | 2017 | | Change |
| Natural gas transported (BBtu/d) | 8,328 |
| | 8,427 |
| | (99 | ) | 10,873 |
| | 8,760 |
| | 2,113 |
|
| Revenues | $ | 2,613 |
| | $ | 2,250 |
| | $ | 363 |
| $ | 3,737 |
| | $ | 3,083 |
| | $ | 654 |
|
| Cost of products sold | 1,897 |
| | 1,554 |
| | 343 |
| 2,665 |
| | 2,327 |
| | 338 |
|
| Segment margin | 716 |
| | 696 |
| | 20 |
| 1,072 |
| | 756 |
| | 316 |
|
| Unrealized (gains) losses on commodity risk management activities | 19 |
| | (26 | ) | | 45 |
| 38 |
| | (5 | ) | | 43 |
|
| Operating expenses, excluding non-cash compensation expense | (162 | ) | | (163 | ) | | 1 |
| (189 | ) | | (168 | ) | | (21 | ) |
| Selling, general and administrative, excluding non-cash compensation expense | (22 | ) | | (25 | ) | | 3 |
| (27 | ) | | (22 | ) | | (5 | ) |
| Adjusted EBITDA related to unconsolidated affiliates | 61 |
| | 61 |
| | — |
| 32 |
| | 64 |
| | (32 | ) |
| Other | 1 |
| | — |
| | 1 |
| 1 |
| | 1 |
| | — |
|
| Segment Adjusted EBITDA | $ | 613 |
| | $ | 543 |
| | $ | 70 |
| $ | 927 |
| | $ | 626 |
| | $ | 301 |
|
Volumes. For the year ended December 31, 20162018 compared to the prior year, transported volumes decreasedincreased primarily due to lower production volumes in the Barnett Shale region, partially offset by increased volumes related to significant new long-term transportation contracts,favorable market pricing spreads, as well as the additionimpact of reflecting RIGS assets as a new short-haul transport pipeline delivering volumes into our Houston Pipeline system.consolidated subsidiary beginning in April 2018.
GrossSegment Margin. The components of our intrastate transportation and storage segment gross margin were as follows:
|
| | | | | | | | | | | |
| | Years Ended December 31, | | |
| | 2016 | | 2015 | | Change |
| Transportation fees | $ | 505 |
| | $ | 502 |
| | $ | 3 |
|
| Natural gas sales and other | 113 |
| | 96 |
| | 17 |
|
| Retained fuel revenues | 48 |
| | 57 |
| | (9 | ) |
| Storage margin, including fees | 50 |
| | 41 |
| | 9 |
|
| Total segment margin | $ | 716 |
| | $ | 696 |
| | $ | 20 |
|
|
| | | | | | | | | | | |
| | Years Ended December 31, | | |
| | 2018 | | 2017 | | Change |
| Transportation fees | $ | 525 |
| | $ | 448 |
| | $ | 77 |
|
| Natural gas sales and other (excluding unrealized gains and losses) | 510 |
| | 196 |
| | 314 |
|
| Retained fuel revenues (excluding unrealized gains and losses) | 59 |
| | 58 |
| | 1 |
|
| Storage margin, including fees (excluding unrealized gains and losses) | 16 |
| | 49 |
| | (33 | ) |
| Unrealized gains (losses) on commodity risk management activities | (38 | ) | | 5 |
| | (43 | ) |
| Total segment margin | $ | 1,072 |
| | $ | 756 |
| | $ | 316 |
|
Segment Adjusted EBITDA. For the year ended December 31, 20162018 compared to the prior year, Segment Adjusted EBITDA related to our intrastate transportation and storage segment increased due to the net impacts of the following:
an increase of $3$314 million in transportation fees, despite lower throughput volumes, due to fees from renegotiated and newly initiated fixed fee contracts primarily on our Houston Pipeline system;
an increase of $34 million inrealized natural gas sales (excluding changes in unrealized losses of $17 million) primarilyand other due to higher realized gains from pipeline optimization activity;
a net increase of $14 million due to the buyingconsolidation of RIGS beginning in April 2018, resulting in increases in transportation fees, operating expenses, and selling, general and administrative expenses of gas along our system;$73 million, $16 million and $6 million, respectively, and a decrease of $37 million in Adjusted EBITDA related to unconsolidated affiliates; and
an increase of $4 million in transportation fees, excluding the impact of consolidating RIGS as discussed above, primarily due to new contracts and the impact of the Red Bluff Express pipeline coming online in May 2018; partially offset by
a decrease of $9$33 million from the sale of retained fuel,in realized storage margin primarily due to an adjustment to the Bammel storage inventory, lower market pricesstorage fees and lower volumes. The average spot price at the Houston Ship Channel location decreased 5% for the year ended December 31, 2016 compared to the prior year;realized derivative gains.
an increase of $37 million in storage margin (excluding net changes in unrealized amounts of $28 million related to fair value inventory adjustments and unrealized gains and losses on derivatives), as discussed below; and
a decrease of $3 million in general and administrative expenses primarily due to lower legal fees and insurance costs, as well as allocations between segments.
Storage margin was comprised of the following:
|
| | | | | | | | | | | |
| | Years Ended December 31, | | |
| | 2016 | | 2015 | | Change |
| Withdrawals from storage natural gas inventory (BBtu) | 38,905 |
| | 15,783 |
| | 23,122 |
|
| Realized margin on natural gas inventory transactions | $ | 36 |
| | $ | (2 | ) | | $ | 38 |
|
| Fair value inventory adjustments | 76 |
| | 4 |
| | 72 |
|
| Unrealized gains (losses) on derivatives | (87 | ) | | 12 |
| | (99 | ) |
| Margin recognized on natural gas inventory, including related derivatives | 25 |
| | 14 |
| | 11 |
|
| Revenues from fee-based storage | 25 |
| | 27 |
| | (2 | ) |
| Total storage margin | $ | 50 |
| | $ | 41 |
| | $ | 9 |
|
The changes in storage margin were primarily driven by the timing of withdrawals and sales of natural gas from our Bammel storage cavern, as well as the timing of settlement of related derivative hedging contracts.
Interstate Transportation and Storage
| | | | Years Ended December 31, | | | Years Ended December 31, | | |
| | 2016 | | 2015 | | Change | 2018 | | 2017 | | Change |
| Natural gas transported (BBtu/d) | 5,476 |
| | 6,074 |
| | (598 | ) | 9,542 |
| | 6,058 |
| | 3,484 |
|
| Natural gas sold (BBtu/d) | 19 |
| | 17 |
| | 2 |
| 17 |
| | 18 |
| | (1 | ) |
| Revenues | $ | 969 |
| | $ | 1,025 |
| | $ | (56 | ) | $ | 1,682 |
| | $ | 1,131 |
| | $ | 551 |
|
| Operating expenses, excluding non-cash compensation, amortization and accretion expenses | (302 | ) | | (304 | ) | | 2 |
| (431 | ) | | (315 | ) | | (116 | ) |
| Selling, general and administrative, excluding non-cash compensation, amortization and accretion expenses | (47 | ) | | (52 | ) | | 5 |
| (63 | ) | | (41 | ) | | (22 | ) |
| Adjusted EBITDA related to unconsolidated affiliates | 494 |
| | 486 |
| | 8 |
| 492 |
| | 498 |
| | (6 | ) |
| Other | 3 |
| | — |
| | 3 |
| — |
| | 1 |
| | (1 | ) |
| Segment Adjusted EBITDA | $ | 1,117 |
| | $ | 1,155 |
| | $ | (38 | ) | $ | 1,680 |
| | $ | 1,274 |
| | $ | 406 |
|
Volumes. For the year ended December 31, 20162018 compared to the prior year, transported volumes decreased 424reflected increases of 1,919 BBtu/d as a result of the initiation of service on the Rover pipeline; increases of 572 BBtu/d and 439 BBtu/d on the Panhandle and Trunkline pipelinepipelines, respectively, due to the transfer of one of the pipelines at Trunkline which was repurposed from natural gas service to crude oil service and lower utilizationhigher demand resulting from lower customer demand. Transported volumes decreased 82colder weather and increased utilization by the Rover pipeline; 375 BBtu/d on the Tiger pipeline as a result of production increases in the Haynesville Shale, and 145 BBtu/d on the Transwestern pipe line due to milder weatherpipeline resulting from favorable market opportunities in the West, midcontinent and decreased 76 BBtu/d onWaha areas from the Sea Robin pipeline due to reducedPermian supply as a result of producer system maintenance and overall lower production.basin.
Segment Adjusted EBITDA. For the year ended December 31, 20162018 compared to the prior year, Segment Adjusted EBITDA related to our interstate transportation and storage segment decreasedincreased due to the net impacts of the following:
a decreasean increase of $26$359 million associated with the Rover pipeline with increases of $485 million in revenues, $105 million in net operating expenses and $21 million in selling, general and administrative expenses and other; and
an aggregate increase of $66 million in revenues, excluding the incremental revenue related to the Rover pipeline discussed above, primarily due to contract restructuring on the Tiger pipeline, a decrease of $17 million due to lower reservation revenues on the Panhandle and Trunkline pipelines from capacity sold at lowerhigher rates and lower sales of capacity in the Phoenix and San Juan areas on the Transwestern pipeline, a decrease of $14 million due to the transfer of one of the Trunkline pipelines which was repurposed from natural gas service to crude oil service, a decrease of $11 million due to the expiration of a transportation rate schedule on the Transwestern pipeline, and a decrease of $10 million on the Sea Robin pipeline due to declines in production and third-party maintenance. These decreases were partially offset by higher reservation revenues on the Transwestern pipeline of $18 million, primarily from a growth project, and higher parking revenues of $9 million, primarily on the Panhandle and Trunkline pipelines; partially offset by
an increase of $8$11 million in operating expenses, excluding the incremental expenses related to the Rover pipeline discussed above, primarily due to increases in maintenance project costs due to scope and level of activity; and
a decrease of $6 million in Adjusted EBITDA related to unconsolidated affiliates primarily due to higher margins from sales of additional capacity on Citrus of $6 million and lower operating expenses of $5 million, offset by lower margins on MEP of $4 million due to a customer bankruptcy;
a decrease of $2 million in operating expenses primarily due to lower maintenance project costsrates on renewals of $5 million and lower allocated costs of $3 million. These decreases were partially offset by an increase of $7 million in ad valorem tax expense due to higher current year assessments of $2 million and a prior period credit and settlement of ad valorem taxes in 2015 of $5 million;
a decrease of $5 million in selling, general and administrative expenses primarily due to $5 million in lower allocated costs; and
an increase of $3 million in other primarily due to the tax gross-up associated with reimbursable projects on the Transwestern and Panhandle pipelines.
expiring long term contracts.
Midstream
| | | | Years Ended December 31, | | | Years Ended December 31, | | |
| | 2016 | | 2015 | | Change | 2018 | | 2017 | | Change |
| Gathered volumes (BBtu/d): | 9,814 |
| | 9,981 |
| | (167 | ) | 12,126 |
| | 10,956 |
| | 1,170 |
|
| NGLs produced (MBbls/d): | 438 |
| | 406 |
| | 32 |
| 540 |
| | 472 |
| | 68 |
|
| Equity NGLs (MBbls/d): | 31 |
| | 28 |
| | 3 |
| 29 |
| | 27 |
| | 2 |
|
| Revenues | $ | 5,179 |
| | $ | 5,056 |
| | $ | 123 |
| $ | 7,522 |
| | $ | 6,943 |
| | $ | 579 |
|
| Cost of products sold | 3,381 |
| | 3,264 |
| | 117 |
| 5,145 |
| | 4,761 |
| | 384 |
|
| Segment margin | 1,798 |
| | 1,792 |
| | 6 |
| 2,377 |
| | 2,182 |
| | 195 |
|
| Unrealized losses on commodity risk management activities | 15 |
| | 82 |
| | (67 | ) | |
| Unrealized gains on commodity risk management activities | | — |
| | (15 | ) | | 15 |
|
| Operating expenses, excluding non-cash compensation expense | (621 | ) | | (616 | ) | | (5 | ) | (705 | ) | | (638 | ) | | (67 | ) |
| Selling, general and administrative, excluding non-cash compensation expense | (84 | ) | | (44 | ) | | (40 | ) | (81 | ) | | (78 | ) | | (3 | ) |
| Adjusted EBITDA related to unconsolidated affiliates | 24 |
| | 20 |
| | 4 |
| 33 |
| | 28 |
| | 5 |
|
| Other | 1 |
| | 3 |
| | (2 | ) | 3 |
| | 2 |
| | 1 |
|
| Segment Adjusted EBITDA | $ | 1,133 |
| | $ | 1,237 |
| | $ | (104 | ) | $ | 1,627 |
| | $ | 1,481 |
| | $ | 146 |
|
Volumes. Gathered volumes decreasedand NGL production increased during the year ended December 31, 20162018 compared to the prior year primarily due to declinesincreases in the South Texas, North Texas, Permian and Mid-Continent/PanhandleNortheast regions, partially offset by increases in the Permian region and the impact of recent acquisitions, including PennTex. NGL production increased due to increased gathering and processing capacities in the Permian region, partially offset bysmaller declines in the South Texas, North Texas, and Mid-Continent/Panhandleother regions.
Segment Margin. The table below presents the components of our midstream segment margin. For the years ended December 31, 2018 and 2017, the amounts previously reported for fee-based and non-fee-based margin were as follows:have been adjusted to reflect reclassification of certain contractual minimum fees from fee-based margin to non-fee-based margin in order to conform to the current period classification.
| | | | Years Ended December 31, | | | Years Ended December 31, | | |
| | 2016 | | 2015 | | Change | 2018 | | 2017 | | Change |
| Gathering and processing fee-based revenues | $ | 1,551 |
| | $ | 1,570 |
| | $ | (19 | ) | $ | 1,788 |
| | $ | 1,690 |
| | $ | 98 |
|
| Non-fee based contracts and processing | 247 |
| | 222 |
| | 25 |
| |
| Non-fee based contracts and processing (excluding unrealized gains and losses) | | 589 |
| | 477 |
| | 112 |
|
| Unrealized gains on commodity risk management activities | | — |
| | 15 |
| | (15 | ) |
| Total segment margin | $ | 1,798 |
| | $ | 1,792 |
| | $ | 6 |
| $ | 2,377 |
| | $ | 2,182 |
| | $ | 195 |
|
Segment Adjusted EBITDA. For the year ended December 31, 20162018 compared to the prior year, Segment Adjusted EBITDA related to our midstream segment decreasedincreased due to the net impacts of the following:
a decreasean increase of $16$98 million in fee-based margin due to volumegrowth in the North Texas, Permian and Northeast regions, offset by declines in the South Texas, North Texas,Ark-La-Tex and Mid-Continent/midcontinent/Panhandle regions, partially offset by increased gathering and processing volumes in the Permian region and the impact of recent acquisitions, including PennTex and the King Ranch assets;regions;
an increase of $40$79 million in general and administrative expenses primarilynon fee-based margin due to costs associated withincreased throughput volume in the acquisitionNorth Texas and Permian regions;
an increase of PennTex$33 million in non fee-based margin due to higher crude oil and changes in capitalized overheadNGL prices; and accruals;
an increase of $5 million in operating expenses primarilyAdjusted EBITDA related to unconsolidated affiliates due to the Kinghigher earnings from our Aqua, Mi Vida and Ranch acquisition in the second quarter of 2015 and assets recently placed in service in the Permian and Eagle Ford regions; and
a decrease of $92 million (excluding unrealized gains of $67 million) in non-fee based margin due to lower benefit from settled derivatives used to hedge commodity margins;joint ventures; partially offset by
an increase of $44$67 million in non-fee based marginoperating expenses primarily due to volume increases of $20 million in the Permian region, partially offset by volume declinesoutside services, $19 million in the South Texas, North Texas,materials, $8 million in maintenance project costs, $7 million in ad valorem taxes, $6 million in employee costs and Mid-Continent/Panhandle regions;$6 million in office expenses; and
an increase of $3 million in non-fee based marginselling, general and administrative expenses due to higher crude oil and NGL prices, partially offset by lower natural gas prices.
professional fees.
NGL and Refined Products Transportation and Services
| | | | Years Ended December 31, | | | Years Ended December 31, | | |
| | 2016 | | 2015 | | Change | 2018 | | 2017 | | Change |
| NGL transportation volumes (MBbls/d) | 754 |
| | 617 |
| | 137 |
| 1,027 |
| | 863 |
| | 164 |
|
| Refined products transportation volumes (MBbls/d) | 599 |
| | 518 |
| | 81 |
| 621 |
| | 624 |
| | (3 | ) |
| NGL and refined products terminal volumes (MBbls/d) | 791 |
| | 718 |
| | 73 |
| 812 |
| | 783 |
| | 29 |
|
| NGL fractionation volumes (MBbls/d) | 361 |
| | 236 |
| | 125 |
| 527 |
| | 427 |
| | 100 |
|
| Revenues | $ | 6,409 |
| | $ | 4,997 |
| | $ | 1,412 |
| $ | 11,123 |
| | $ | 8,648 |
| | $ | 2,475 |
|
| Cost of products sold | 4,553 |
| | 3,431 |
| | 1,122 |
| 8,462 |
| | 6,508 |
| | 1,954 |
|
| Segment margin | 1,856 |
| | 1,566 |
| | 290 |
| 2,661 |
| | 2,140 |
| | 521 |
|
| Unrealized losses on commodity risk management activities | 69 |
| | 10 |
| | 59 |
| |
| Unrealized gains on commodity risk management activities | | (86 | ) | | (26 | ) | | (60 | ) |
| Operating expenses, excluding non-cash compensation expense | (441 | ) | | (408 | ) | | (33 | ) | (604 | ) | | (478 | ) | | (126 | ) |
| Selling, general and administrative expenses, excluding non-cash compensation expense | (56 | ) | | (56 | ) | | — |
| (74 | ) | | (64 | ) | | (10 | ) |
| Adjusted EBITDA related to unconsolidated affiliates | 67 |
| | 67 |
| | — |
| 82 |
| | 68 |
| | 14 |
|
| Other | 1 |
| | — |
| | 1 |
| — |
| | 1 |
| | (1 | ) |
| Segment Adjusted EBITDA | $ | 1,496 |
| | $ | 1,179 |
| | $ | 317 |
| $ | 1,979 |
| | $ | 1,641 |
| | $ | 338 |
|
Volumes. For the year ended December 31, 20162018 compared to the prior year, NGL and refined products transportation volumes increased due to the ramp-up of our Mariner East 1, Mariner South and Allegheny Access growth projects as well as increased volumes from Permian, North Texas, and Southeast Texas. For the year ended December 31, 2016 compared to the prior year, NGL and refined products terminal volumes increased primarily due to increased volumes from the ramp-up ofPermian region resulting from a ramp up in production from existing customers, higher throughput volumes on Mariner West driven by end-user facility constraints in the previously mentioned growth projects.prior year and higher throughput from Mariner South resulting from increased export volumes.
Average daily fractionatedRefined products transportation volumes increased approximately 125 MBbls/ddecreased for the year ended December 31, 20162018 compared to prior year, primarily due to timing of turnarounds at third-party refineries in the Midwest and Northeast regions.
NGL and Refined products terminal volumes increased for the year ended December 31, 2018 compared to prior year, primarily due to more volumes loaded at our Nederland terminal as propane export demand increased and higher throughput volumes at our refined products terminals in the Northeast.
Average volumes fractionated at our Mont Belvieu, Texas fractionation facility increased for the year ended December 31, 2018 compared to the prior year primarily due to increased volumes from the ramp-up ofPermian region, as well as an increase in fractionation capacity as our thirdfifth fractionator at Mont Belvieu Texas, which was commissionedcame online in late December 2015, as well as increased producer volumes mentioned above. Additionally, we placed our fourth fractionator in-service in November 2016, providing an additional 18 MBbls/d of throughput volume for the year.July 2018.
Segment Margin. The components of our NGL and refined products transportation and services segment margin were as follows:
| | | | Years Ended December 31, | | | Years Ended December 31, | | |
| | 2016 | | 2015 | | Change | 2018 | | 2017 | | Change |
| Fractionators and Refinery services margin | $ | 404 |
| | $ | 297 |
| | $ | 107 |
| |
| Fractionators and refinery services margin | | $ | 511 |
| | $ | 415 |
| | $ | 96 |
|
| Transportation margin | 866 |
| | 696 |
| | 170 |
| 1,233 |
| | 990 |
| | 243 |
|
| Storage margin | 208 |
| | 172 |
| | 36 |
| 211 |
| | 214 |
| | (3 | ) |
| Terminal Services margin | 322 |
| | 253 |
| | 69 |
| 494 |
| | 424 |
| | 70 |
|
| Marketing margin | 56 |
| | 148 |
| | (92 | ) | 126 |
| | 71 |
| | 55 |
|
| Unrealized gains on commodity risk management activities | | 86 |
| | 26 |
| | 60 |
|
| Total segment margin | $ | 1,856 |
| | $ | 1,566 |
| | $ | 290 |
| $ | 2,661 |
| | $ | 2,140 |
| | $ | 521 |
|
Segment Adjusted EBITDA. For the year ended December 31, 20162018 compared to the prior year, Segment Adjusted EBITDA related to our NGL and refined products transportation and services segment increased due to the net impacts of the following:
an increase in transportation margin of $36$243 million in storage margin primarily due to a $216 million increase resulting from increased producer volumes from our Mont Belvieu fractionators. Throughput volumes, on which we earn a fee in our storage assets, increased 34% resulting in an increase of $18 million compared to the prior year. We also realized an increase of $8 million due to increased demand for our leased storage capacity as a result of more favorable market conditions. Finally, we realized increased terminal fees and pipeline lease fees of $8 million, as well as increased blending gains of $2 million resulting from higher volumes during the 2016 period;
an increase of $239 million in NGL and refined product transportation and terminal margin due to the ramp-up of several organic growth projects, including Mariner East 1, Mariner South and Allegheny Access as well as increased volumes from all producing regions, with the Permian region beingon our Texas NGL pipelines, a $31 million increase due to higher throughput volumes on Mariner West driven by end-user facility constraints in the most significant among them;
prior period, a $15 million increase resulting from a reclassification between our transportation and fractionation margins, a $9 million increase due to higher throughput volumes from the Barnett region, a $5 million increase due to higher throughput volumes on Mariner South due to system downtime in the prior period and a $4 million increase in contributionsprior period customer credits. These increases were partially offset by a $16 million decrease resulting from joint venture interestslower throughput volumes on Mariner East 1 due to system downtime in 2018, a $14 million decrease due to lower throughput volumes from the Southeast Texas region and a $7 million decrease resulting from the timing of deficiency fee revenue recognition;
an increase in fractionation and refinery services margin of $96 million primarily drivendue to a $106 million increase resulting from the commissioning of our fifth fractionator in July 2018 and a $7 million increase from blending gains as a result of improved market pricing. These increases were partially offset by a $16 million decrease resulting from a reclassification between our transportation and fractionation margins and a $2 million decrease from higher affiliate storage fees paid;
an increase in terminal services margin of $70 million due to a $36 million increase resulting from a change in the acquisitionclassification of certain customer reimbursements previously recorded in operating expenses, a $23 million increase at our Nederland terminal due to increased export demand and a $12 million increase due to higher throughput at our Marcus Hook Industrial Complex. These increases were partially offset by lower terminal throughput fees in part due to the sale of one of our terminals in April 2017;
an additional 1.7% ownership interestincrease in Explorer Pipeline Company;marketing margin of $55 million due to a $48 million increase from our butane blending operations and a $22 million increase in sales of NGLs and other products at our Marcus Hook Industrial Complex due to more favorable market prices. These increases were partially offset by a $15 million decrease from the timing of optimization gains from our Mont Belvieu fractionators; and
an increase of $118$14 million in NGL processing and fractionation margin (excluding net changes in unrealized gains and losses of $11 million) primarilyto adjusted EBITDA related to unconsolidated affiliates due to higher NGL volumes from all producing regions, as detailed in our transport fees explanation above. We placed approximately 118 MBbls/d of fractionation capacity in-service in 2016, allowing our Mont Belvieu fractionators to handle the significant increase in volumes from year to year. Additional barrels fractionated and an associated increase in blending gains at our fractionators resulted in a margin increase of $101 million. We delivered approximately 26% more barrels to our Mariner South LPG export terminal in the 2016 period, which resulted in an increase of $22 million in cargo loading fees and blending fees compared to the prior year. These gains were offset by an increase in storage fees paid of $2 million, and a decrease in marginimproved contributions from our refinery services operations of $3 million;unconsolidated refined products joint venture interests; partially offset by
a decrease in marketing margin
an increase of $33$126 million in operating expenses primarily due to increaseda $30 million increase in costs associated with organic growth projects suchto operate our fractionators and a $20 million increase in operating costs on our NGL pipelines as a result of higher throughput and the commissioning of our thirdfifth fractionator in July 2018, a $36 million increase resulting from a change in the classification of certain customer reimbursements previously recorded as a reduction to operating expenses that are now classified as revenue following the adoption of ASC 606 on January 1, 2018, increases of $24 million and $7 million to operating costs at Mont Belvieu, Mariner East 1, Mariner Southour Marcus Hook and Allegheny Access.Nederland terminals, respectively, as a result of significantly higher volumes through both terminals in 2018, an $8 million increase to environmental reserves and a $1 million increase to overhead allocations and maintenance repairs performed on our refinery services assets; and
an increase of $10 million in selling, general and administrative expenses primarily due to a $6 million increase in overhead costs allocated to the segment, a $2 million increase in legal fees, a $1 million increase in management fees previously recorded in operating expenses and a $1 million increase in employee costs.
Crude Oil Transportation and Services
| | | | Years Ended December 31, | | | Years Ended December 31, | | |
| | 2016 | | 2015 | | Change | 2018 | | 2017 | | Change |
| Crude Transportation Volumes (MBbls/d) | 2,652 |
| | 2,276 |
| | 376 |
| |
| Crude Terminals Volumes (MBbls/d) | 1,537 |
| | 1,400 |
| | 137 |
| |
| Crude transportation volumes (MBbls/d) | | 4,172 |
| | 3,538 |
| | 634 |
|
| Crude terminals volumes (MBbls/d) | | 2,096 |
| | 1,928 |
| | 168 |
|
| Revenue | $ | 7,539 |
| | $ | 8,980 |
| | $ | (1,441 | ) | $ | 17,332 |
| | $ | 11,703 |
| | $ | 5,629 |
|
| Cost of products sold | 6,416 |
| | 8,158 |
| | (1,742 | ) | 14,439 |
| | 9,826 |
| | 4,613 |
|
| Segment margin | 1,123 |
| | 822 |
| | 301 |
| 2,893 |
| | 1,877 |
| | 1,016 |
|
| Unrealized losses on commodity risk management activities | 2 |
| | — |
| | 2 |
| 55 |
| | 1 |
| | 54 |
|
| Operating expenses, excluding non-cash compensation expense | (247 | ) | | (246 | ) | | (1 | ) | (547 | ) | | (430 | ) | | (117 | ) |
| Selling, general and administrative expenses, excluding non-cash compensation expense | (58 | ) | | (53 | ) | | (5 | ) | (86 | ) | | (82 | ) | | (4 | ) |
| Adjusted EBITDA related to unconsolidated affiliates | 14 |
| | (2 | ) | | 16 |
| 15 |
| | 13 |
| | 2 |
|
| Segment Adjusted EBITDA | $ | 834 |
| | $ | 521 |
| | $ | 313 |
| $ | 2,330 |
| | $ | 1,379 |
| | $ | 951 |
|
Segment Adjusted EBITDA. For the year ended December 31, 20162018 compared to the prior year, Segment Adjusted EBITDA related to our crude oil transportation and services segment increased due to the net impacts of the following:
an increase of $158$1.07 billion in segment margin (excluding unrealized losses on commodity risk management activities) primarily due to the following: a $586 million increase resulting primarily from placing our Permian Express IIthe Bakken pipeline in service in the thirdsecond quarter of 2015, as well as the acquisition of2017, a $266 million increase resulting from higher throughput on our Texas crude oil gatheringpipeline system in West Texas;
an increase of $49 million from existing assetsprimarily due to increased volumes throughoutproduction from Permian producers; and gains of $355 million due to more favorable basis spreads; partially offset by an unfavorable inventory valuation adjustment of $54 million for the system;
an increase2018 year as compared to a favorable inventory valuation adjustment of $31$82 million from our crude terminals assets, largely related tofor the Nederland facility;2017 year; and
an increase of $74$2 million in Adjusted EBITDA related to unconsolidated affiliates due to increased jet fuel sales from our crude oil acquisition and marketing activity;joint ventures; partially offset by
an increase of $117 million in operating expenses primarily due to a $67 million increase to throughput related costs on existing assets; a $36 million increase resulting from placing the Bakken pipeline in service in the second quarter of 2017; a $26 million increase resulting from the addition of certain joint venture transportation assets in the second quarter of 2017; and a $5 million increase from ad valorem taxes; partially offset by an $17 million decrease in insurance and environmental related expenses; and
an increase of $4 million in selling, general and administrative expenses.expenses primarily due to increases associated with placing our Bakken Pipeline in service in the second quarter of 2017.
Investment in Sunoco LP
|
| | | | | | | | | | | |
| | Years Ended December 31, | | |
| | 2018 | | 2017 | | Change |
| Revenues | $ | 16,994 |
| | $ | 11,723 |
| | $ | 5,271 |
|
| Cost of products sold | 15,872 |
| | 10,615 |
| | 5,257 |
|
| Segment margin | 1,122 |
| | 1,108 |
| | 14 |
|
| Unrealized (gains) losses on commodity risk management activities | 6 |
| | (3 | ) | | 9 |
|
| Operating expenses, excluding non-cash compensation expense | (435 | ) | | (456 | ) | | 21 |
|
| Selling, general and administrative, excluding non-cash compensation expense | (129 | ) | | (116 | ) | | (13 | ) |
| Inventory valuation adjustments | 85 |
| | (24 | ) | | 109 |
|
| Adjusted EBITDA from discontinued operations | (25 | ) | | 223 |
| | (248 | ) |
| Other, net | 14 |
| | — |
| | 14 |
|
| Segment Adjusted EBITDA | $ | 638 |
| | $ | 732 |
| | $ | (94 | ) |
The Investment in Sunoco LP segment reflects the consolidated results of Sunoco LP.
Segment Adjusted EBITDA. For the year ended December 31, 2018 compared to the prior year, Segment Adjusted EBITDA related to the Investment in Sunoco LP segment decreased due to the net impacts of the following:
a decrease of $248 million in Adjusted EBITDA from discontinued operations primarily due to Sunoco LP’s retail divestment in January 2018; partially offset by
an increase of $109 million in inventory fair value adjustments due to changes in fuel prices between periods;
an increase of $14 million in margin primarily due to an increase in rental income as a result of the increase in commission agent sites in the current year, offset by decreases in the gross profit on motor fuel sales; and
a net decrease of $8 million in operating and selling, general and administrative expenses primarily due to decreased rent expense.
Investment in USAC
|
| | | | | | | | | | | |
| | Years Ended December 31, | | |
| | 2018 | | 2017 | | Change |
| Revenues | $ | 508 |
| | $ | — |
| | $ | 508 |
|
| Cost of products sold | 67 |
| | — |
| | 67 |
|
| Segment margin | 441 |
| | — |
| | 441 |
|
| Operating expenses, excluding non-cash compensation expense | (110 | ) | | — |
| | (110 | ) |
| Selling, general and administrative, excluding non-cash compensation expense | (50 | ) | | — |
| | (50 | ) |
| Other, net | 8 |
| | — |
| | 8 |
|
| Segment Adjusted EBITDA | $ | 289 |
| | $ | — |
| | $ | 289 |
|
The investment in USAC segment reflects the consolidated results of USAC from April 2, 2018, the date ET obtained control of USAC, through December 31, 2018. Changes between periods are due to the consolidation of USAC beginning April 2, 2018.
All Other
| | | | Years Ended December 31, | | | Years Ended December 31, | | |
| | 2016 | | 2015 | | Change | 2018 | | 2017 | | Change |
| Revenue | $ | 3,272 |
| | $ | 15,774 |
| | $ | (12,502 | ) | $ | 2,228 |
| | $ | 2,901 |
| | $ | (673 | ) |
| Cost of products sold | 2,942 |
| | 14,029 |
| | (11,087 | ) | 2,006 |
| | 2,509 |
| | (503 | ) |
| Segment margin | 330 |
| | 1,745 |
| | (1,415 | ) | 222 |
| | 392 |
| | (170 | ) |
| Unrealized (gains) losses on commodity risk management activities | 26 |
| | (1 | ) | | 27 |
| |
| Unrealized gains on commodity risk management activities | | (2 | ) | | (11 | ) | | 9 |
|
| Operating expenses, excluding non-cash compensation expense | (79 | ) | | (896 | ) | | 817 |
| (56 | ) | | (117 | ) | | 61 |
|
| Selling, general and administrative expenses, excluding non-cash compensation expense | (86 | ) | | (254 | ) | | 168 |
| (87 | ) | | (103 | ) | | 16 |
|
| Adjusted EBITDA related to unconsolidated affiliates | 286 |
| | 313 |
| | (27 | ) | 1 |
| | 45 |
| | (44 | ) |
| Inventory valuation adjustments | — |
| | (58 | ) | | 58 |
| |
| Other | 95 |
| | 95 |
| | — |
| |
| Elimination | (32 | ) | | (62 | ) | | 30 |
| |
| Other and eliminations | | (2 | ) | | 13 |
| | (15 | ) |
| Segment Adjusted EBITDA | $ | 540 |
| | $ | 882 |
| | $ | (342 | ) | $ | 76 |
| | $ | 219 |
| | $ | (143 | ) |
Amounts reflected in our all other segment during the periods presented above primarily include:
our retail marketing operations prior to the transfer of the general partner interest of Sunoco LP from ETP to ETE in 2015 and completion of the dropdown of remaining Retail Marketing interests from ETP to Sunoco LP in March 2016;
our equity method investment in limited partnership units of Sunoco LP consisting of 43.5 million units, representing 44.3% of Sunoco LP’s total outstanding common units;
our natural gas marketing andoperations;
our wholly-owned natural gas compression operations;
a non-controlling interest in PES. Prior to PES’s reorganization in August 2018, ETO’s 33% interest in PES comprising 33% of PES’ outstanding common units;was reflected as an unconsolidated affiliate; subsequent the August 2018 reorganization, ETO holds an approximately 8% interest in PES and no longer reflects PES as an affiliate; and
our investment in coal handling facilities.
Segment Adjusted EBITDA. For the year ended December 31, 20162018 compared to the prior year, Segment Adjusted EBITDA decreased due to the net impactimpacts of the following:
a decrease of $308$98 million due to the transfer and contribution of our retail marketing assetsCDM to Sunoco LP. The consolidated results of Sunoco LP areUSAC in April 2018, subsequent to which CDM is reflected in the results for All Other above through June 2015. Effective July 1, 2015, Sunoco LP was deconsolidated, and the results for All Other reflect Adjusted EBITDA related to unconsolidated affiliates for our limited partner interestsInvestment in Sunoco LP. The impactUSAC segment;
a decrease of the deconsolidation of Sunoco LP reduced segment margin, operating expenses and selling, general and administrative expenses; the impact to Segment Adjusted EBITDA is offset by the incremental$38 million in Adjusted EBITDA related to unconsolidated affiliates from our equity method investment in Sunoco LPPES primarily due to our lower ownership in PES subsequent to its reorganization, which resulted in PES no longer being reflected as an affiliate beginning in the deconsolidation;third quarter of 2018;
a decrease of $4 million due to merger and acquisition expenses related to the Energy Transfer Merger in 2018; and
a decrease of $76$15 million due to a one-time fee received from a joint venture affiliate in Adjusted EBITDA related2017; partially offset by
an increase of $7 million due to our investmentlower transport fees resulting from the expiration of a capacity commitment on Trunkline pipeline;
an increase of $6 million due to a decrease in PES.losses from mark-to-market of physical system gas; and
ETP provides management services for ETE for which ETE has agreedan increase of $7 million due to pay management fees to ETP of $95 million per year for the years ending December 31, 2016 and 2015. These fees were reflected in “Other” in the “All other” segment and for the years ended December 31, 2016 and 2015 were reflected as an offset to operating expenses of $32 million and selling, general and administrative expenses of $63 million in the consolidated statements of operations.increased margin from ETO’s compression equipment business.
Liquidity and Capital Resources
Our ability to satisfy our obligations and pay distributions to our Unitholderspreferred unitholders will depend on our future performance, which will be subject to prevailing economic, financial, business and weather conditions, and other factors, many of which are beyond management’s control.
We
The Partnership currently expectexpects capital expenditures in 20182020 to be within the following ranges:ranges (excluding capital expenditures related to our investments in Sunoco LP and USAC:
| | | | Growth | | Maintenance | Growth | | Maintenance |
| | Low | | High | | Low | | High | Low | | High | | Low | | High |
| Intrastate transportation and storage | $ | 225 |
| | $ | 250 |
| | $ | 30 |
| | $ | 35 |
| $ | 20 |
| | $ | 30 |
| | $ | 40 |
| | $ | 45 |
|
Interstate transportation and storage (1) | 450 |
| | 500 |
| | 115 |
| | 120 |
| 100 |
| | 125 |
| | 140 |
| | 145 |
|
| Midstream | 750 |
| | 800 |
| | 120 |
| | 130 |
| 625 |
| | 650 |
| | 125 |
| | 130 |
|
NGL and refined products transportation and services | 2,425 |
| | 2,475 |
| | 65 |
| | 75 |
| 2,550 |
| | 2,650 |
| | 100 |
| | 110 |
|
Crude oil transportation and services (1) | 425 |
| | 525 |
| | 90 |
| | 100 |
| 500 |
| | 525 |
| | 165 |
| | 175 |
|
| All other (including eliminations) | 75 |
| | 100 |
| | 60 |
| | 65 |
| 25 |
| | 50 |
| | 75 |
| | 80 |
|
| Total capital expenditures | $ | 4,350 |
| | $ | 4,650 |
| | $ | 480 |
| | $ | 525 |
| $ | 3,820 |
| | $ | 4,030 |
| | $ | 645 |
| | $ | 685 |
|
| |
(1) | Includes capital expenditures related to our proportionate ownership of the Bakken, Rover, and Bayou Bridge pipeline projects.projects and our proportionate ownership of the Orbit Gulf Coast NGL export project. |
The assets used in our natural gas and liquids operations, including pipelines, gathering systems and related facilities, are generally long-lived assets and do not require significant maintenance capital expenditures. Accordingly, we do not have any significant financial commitments for maintenance capital expenditures in our businesses. From time to time we experience increases in pipe costs due to a number of reasons, including but not limited to, delays from steel mills, limited selection of mills capable of producing large diameter pipe timely, higher steel prices and other factors beyond our control. However, we include these factors in our anticipated growth capital expenditures for each year.
We generally fund maintenance capital expenditures and distributions with cash flows from operating activities. We generally expect to fund growth capital expenditures with proceeds of borrowings under ETO credit facilities, long-term debt, the issuance of additional Common Units or a combination thereof.along with cash from operations.
As of December 31, 2017,2019, in addition to $306$253 million of cash on hand, we had available capacity under the ETPETO Credit Facilities of $2.51$1.71 billion. Based on our current estimates, we expect to utilize capacity under the ETPETO Credit Facilities, along with cash from operations, to fund our announced growth capital expenditures and working capital needs through the end of 2018;2020; however, we may issue debt or equity securities prior to that time as we deem prudent to provide liquidity for new capital projects, to maintain investment grade credit metrics or other partnership purposes.
Sunoco LP
Sunoco LP’s primary sources of liquidity consist of cash generated from operating activities, borrowings under its $1.50 billion credit facility and the issuance of additional long-term debt or partnership units as appropriate given market conditions. At December 31, 2019, Sunoco LP had available borrowing capacity of $1.33 billion under its revolving credit facility and $21 million of cash and cash equivalents on hand.
In 2020, Sunoco LP expects to invest approximately $130 million in growth capital expenditures and approximately $45 million on maintenance capital expenditures. Sunoco LP may revise the timing of these expenditures as necessary to adapt to economic conditions.
USAC
USAC currently plans to spend approximately $32 million in maintenance capital expenditures during 2020, including parts consumed from inventory.
Without giving effect to any equipment USAC may acquire pursuant to any future acquisitions, it currently has budgeted between $110 million and $120 million in expansion capital expenditures during 2020. As of December 31, 2019, USAC has binding commitments to purchase $49 million of additional compression units, all of which USAC expects to be delivered in 2020.
Cash Flows
Our internally generated cash flows may change in the future due to a number of factors, some of which we cannot control. These include regulatory changes, the price forof our products and services, the demand for such products and services, margin requirements resulting from significant changes in commodity prices, operational risks, the successful integration of our acquisitions, and other factors.
Operating Activities
Changes in cash flows from operating activities between periods primarily result from changes in earnings (as discussed in “Results of Operations” above), excluding the impacts of non-cash items and changes in operating assets and liabilities. Non-cash items include recurring non-cash expenses, such as depreciation, depletion and amortization expense and non-cash compensation expense. The increase in depreciation, depletion and amortization expense during the periods presented primarily resulted from construction and acquisitions of assets, while changes in non-cash unit-based compensation expense resulted from changes in the number of units granted and changes in the grant date fair value estimated for such grants. Cash flows from operating activities also differ from earnings as a result of non-cash charges that may not be recurring such as impairment charges and allowance for equity funds used during construction. The allowance for equity funds used during construction increases in periods when we have a significant amount of interstate pipeline construction in progress. Changes in operating assets and liabilities between periods result from factors such as the changes in the value of derivative assets and liabilities, timing of accounts receivable collection, payments on accounts payable, the timing of purchasepurchases and sales of inventories, and the timing of advances and deposits received from customers.
Following is a summary of operating activities by period:
Year Ended December 31, 2019
Cash provided by operating activities in 2019 was $8.25 billion and income from continuing operations was $5.19 billion. The difference between net income and cash provided by operating activities in 2019 primarily consisted of non-cash items totaling $3.27 billion offset by net changes in operating assets and liabilities of $479 million. The non-cash activity in 2019 consisted primarily of depreciation, depletion and amortization of $3.12 billion, impairment losses of $74 million, non-cash compensation expense of $111 million, equity in earnings of unconsolidated affiliates of $298 million, inventory valuation adjustments of $79 million, losses on extinguishment of debt of $2 million, and deferred income tax expense of $221 million. The Partnership also received distributions of $285 million from unconsolidated affiliates.
Year Ended December 31, 2018
Cash provided by operating activities in 2018 was $7.56 billion and income from continuing operations was $4.04 billion. The difference between net income and cash provided by operating activities in 2018 primarily consisted of non-cash items totaling $3.11 billion offset by net changes in operating assets and liabilities of $117 million. The non-cash activity in 2018 consisted primarily of depreciation, depletion and amortization of $2.84 billion, impairment losses of $431 million, non-cash compensation expense of $105 million, equity in earnings of unconsolidated affiliates of $344 million, inventory valuation adjustments of $85 million, losses on extinguishment of debt of $109 million and a deferred income tax expense of $8 million. The Partnership also received distributions of $328 million from unconsolidated affiliates.
Year Ended December 31, 2017
Cash provided by operating activities in 2017 was $4.49$4.82 billion and net income from continuing operations was $2.50$2.95 billion. The difference between net income and cash provided by operating activities in 2017 primarily consisted of non-cash items totaling $1.74$1.78 billion offset by net changes in operating assets and liabilities of $160$173 million. The non-cash activity in 2017 consisted primarily of depreciation, depletion and amortization of $2.33$2.54 billion, impairment losses of $920 million,$1.04 billion, impairment in unconsolidated affiliates of $313 million, non-cash compensation expense of $74$99 million, equity in earnings of unconsolidated affiliates of $156$144 million, and deferred income taxes benefit of $1.53 billion.
Year Ended December 31, 2016
Cash provided by operating activities in 2016 was $3.30 billion and net income was $583 million. The difference between net income and cash provided by operating activities in 2016 primarily consisted of non-cash items totaling $2.59 billion offset by net changes in operating assets and liabilities of $246 million. The non-cash activity in 2016 consisted primarily of depreciation, depletion and amortization of $1.99 billion, impairment losses of $813 million, impairment of an unconsolidated affiliate of $308 million, non-cash compensation expense of $80 million, equity in earnings of unconsolidated affiliates of $59 million, and deferred income taxes benefit of $169 million.
Year Ended December 31, 2015
Cash provided by operating activities in 2015 was $2.75 billion and net income was $1.49 billion. The difference between net income and cash provided by operating activities in 2015 primarily consisted of non-cash items totaling $2.01 billion offset by net changes in operating assets and liabilities of $1.17 billion. The non-cash activity in 2015 consisted primarily of depreciation, depletion and amortization of $1.93 billion, impairment losses of $339 million and inventory valuation adjustments of $58 million.$24 million, losses on extinguishment of debt of $42 million and a deferred income tax benefit of $1.84 billion. The Partnership also received distributions of $297 million from unconsolidated affiliates.
Investing Activities
Cash flows from investing activities primarily consist of cash amounts paid for acquisitions, capital expenditures, cash distributions from our joint ventures, and cash proceeds from sales or contributions of assets or businesses. Changes in capital expenditures between periods primarily result from increases or decreases in our growth capital expenditures to fund our construction and expansion projects.
Following is a summary of investing activities by period:
Year Ended December 31, 20172019
Cash used in investing activities in 20172019 was $5.47$6.12 billion. Total capital expenditures (excluding the allowance for equity funds used during construction and net of contributions in aid of construction costs) were $8.31$5.86 billion. Additional detail related to our capital expenditures is provided in the table below. WeDuring 2019, we received $2.00 billion and $1.48 billion$93 million of cash proceeds from the sale of a
noncontrolling interest in cash related to the Bakken equity sale to MarEn Bakken Company and the Rover equity sale to Blackstone Capital Partners, respectively,a subsidiary and paid $264$7 million in cash for all other acquisitions. We received $54 million of cash proceeds from the sale of assets. The Partnership also received distributions of $98 million from unconsolidated affiliates.
Year Ended December 31, 20162018
Cash used in investing activities in 20162018 was $6.39$6.90 billion. Total capital expenditures (excluding the allowance for equity funds used during construction and net of contributions in aid of construction costs) were $7.48$7.30 billion. Additional detail related to our capital expenditures is provided in the table below. We paidreceived $711 million of net cash of $1.23 billion for acquisitions, including legacy Sunoco Logistics’ Vitol Acquisition and the PennTex Acquisition, and received $2.20 billion in cashproceeds related to the contributionUSAC acquisition and paid $429 million in cash for all other acquisitions. We received $87 million of our Sunoco, Inc. retail business to Sunoco LP.cash proceeds from the sale of assets. The Partnership also received distributions of $69 million from unconsolidated affiliates.
Year Ended December 31, 20152017
Cash used in investing activities in 20152017 was $7.82$5.61 billion. Total capital expenditures (excluding the allowance for equity funds used during construction and net of contributions in aid of construction costs) were $9.02$8.42 billion. Additional detail related to our capital expenditures is provided in the table below. We paid net$280 million in cash of $804 million for acquisitions, includingrelated to the acquisition of aPennTex’s remaining noncontrolling interest.interest and $303 million in cash for all other acquisitions. We received $2.00 billion in cash related to the Bakken equity sale to MarEn Bakken Company LLC, $1.48 billion in cash related to the Rover equity sale to Blackstone Capital Partners. We received $45 million of cash proceeds from the sale of assets. The Partnership also received distributions of $135 million from unconsolidated affiliates.
The following is a summary of ourthe Partnership’s capital expenditures (net(including only our proportionate share of the Bakken, Rover, and Bayou Bridge pipeline projects, our proportionate share of the Orbit Gulf Coast NGL export project, and net of contributions in aid of construction costs) by period:
| | | | Capital Expenditures Recorded During Period | Capital Expenditures Recorded During Period |
| Growth | | Maintenance | | Total |
| Year Ended December 31, 2019: | | | | | | |
| Intrastate transportation and storage | | $ | 87 |
| | $ | 37 |
| | $ | 124 |
|
| Interstate transportation and storage | | 239 |
| | 136 |
| | 375 |
|
| Midstream | | 669 |
| | 157 |
| | 826 |
|
| NGL and refined products transportation and services | | 2,854 |
| | 122 |
| | 2,976 |
|
| Crude oil transportation and services | | 310 |
| | 82 |
| | 392 |
|
| Investment in Sunoco LP | | 108 |
| | 40 |
| | 148 |
|
| Investment in USAC | | 170 |
| | 30 |
| | 200 |
|
| All other (including eliminations) | | 165 |
| | 48 |
| | 213 |
|
| Total capital expenditures | | $ | 4,602 |
| | $ | 652 |
| | $ | 5,254 |
|
| | | | | | | |
| Year Ended December 31, 2018: | | | | | | |
| Intrastate transportation and storage | | $ | 311 |
| | $ | 33 |
| | $ | 344 |
|
| Interstate transportation and storage | | 695 |
| | 117 |
| | 812 |
|
| Midstream | | 1,026 |
| | 135 |
| | 1,161 |
|
| NGL and refined products transportation and services | | 2,303 |
| | 78 |
| | 2,381 |
|
| Crude oil transportation and services | | 414 |
| | 60 |
| | 474 |
|
Investment in Sunoco LP (1) | | 72 |
| | 31 |
| | 103 |
|
| Investment in USAC | | 182 |
| | 23 |
| | 205 |
|
| All other (including eliminations) | | 117 |
| | 33 |
| | 150 |
|
| Total capital expenditures | | $ | 5,120 |
| | $ | 510 |
| | $ | 5,630 |
|
| | Growth | | Maintenance | | Total | | | | | |
| | Intrastate transportation and storage | $ | 155 |
| | $ | 20 |
| | $ | 175 |
| $ | 155 |
| | $ | 20 |
| | $ | 175 |
|
| Interstate transportation and storage | 645 |
| | 81 |
| | 726 |
| 645 |
| | 83 |
| | 728 |
|
| Midstream | 1,185 |
| | 123 |
| | 1,308 |
| 1,185 |
| | 123 |
| | 1,308 |
|
| NGL and refined products transportation and services | 2,899 |
| | 72 |
| | 2,971 |
| 2,899 |
| | 72 |
| | 2,971 |
|
| Crude oil transportation and services | 392 |
| | 61 |
| | 453 |
| 392 |
| | 61 |
| | 453 |
|
Investment in Sunoco LP (1) | | 129 |
| | 48 |
| | 177 |
|
| All other (including eliminations) | 196 |
| | 72 |
| | 268 |
| 196 |
| | 72 |
| | 268 |
|
| Total capital expenditures | $ | 5,472 |
| | $ | 429 |
| | $ | 5,901 |
| $ | 5,601 |
| | $ | 479 |
| | $ | 6,080 |
|
| | | | | | | |
| Year Ended December 31, 2016: | | | | | | |
| Intrastate transportation and storage | $ | 53 |
| | $ | 23 |
| | $ | 76 |
| |
| Interstate transportation and storage | 191 |
| | 89 |
| | 280 |
| |
| Midstream | 1,133 |
| | 122 |
| | 1,255 |
| |
| NGL and refined products transportation and services | 2,150 |
| | 48 |
| | 2,198 |
| |
| Crude oil transportation and services | 1,806 |
| | 35 |
| | 1,841 |
| |
| All other (including eliminations) | 109 |
| | 51 |
| | 160 |
| |
| Total capital expenditures | $ | 5,442 |
| | $ | 368 |
| | $ | 5,810 |
| |
| | | | | | | |
| Year Ended December 31, 2015: | | | | | | |
| Intrastate transportation and storage | $ | 74 |
| | $ | 31 |
| | $ | 105 |
| |
| Interstate transportation and storage | 741 |
| | 125 |
| | 866 |
| |
| Midstream | 2,055 |
| | 119 |
| | 2,174 |
| |
| NGL and refined products transportation and services | 2,798 |
| | 55 |
| | 2,853 |
| |
| Crude oil transportation and services | 1,315 |
| | 43 |
| | 1,358 |
| |
| All other (including eliminations) | 699 |
| | 112 |
| | 811 |
| |
| Total capital expenditures | $ | 7,682 |
| | $ | 485 |
| | $ | 8,167 |
| |
| |
(1) | Amounts related to Sunoco LP’s capital expenditures include capital expenditures related to discontinued operations. |
Financing Activities
Changes in cash flows from financing activities between periods primarily result from changes in the levels of borrowings and equity issuances, which are primarily used to fund our acquisitions and growth capital expenditures. Distributions to partners increased between the periods as a result of increases in the number of Common Unitscommon units outstanding.
Following is a summary of financing activities by period:
Year Ended December 31, 20172019
Cash provided byused in financing activities was $934$2.29 billion in 2019. During 2019, we received net proceeds of $780 million from the issuance of preferred units. Net proceeds from the offering were used to repay outstanding borrowings under the ETO Credit
Facilities, to fund capital expenditures and acquisitions, as well as for general partnership purposes. In 2019, we had a net increase in in our debt level of $4.38 billion. In 2019, we paid distributions of $6.28 billion to our partners and we paid distributions of $1.40 billion to noncontrolling interests. In addition, we received capital contributions of $348 million in 2017. Wecash from noncontrolling interests. During 2019, we incurred debt issuance costs of $117 million.
Year Ended December 31, 2018
Cash used in financing activities was $3.31 billion in 2018. During 2018, we received $2.28 billion$58 million in net proceeds from Common Unitcommon unit offerings and $1.48 billion$867 million in net proceeds from the issuance of Preferred Units.preferred units. Net proceeds from the offerings were used to repay outstanding borrowings under the ETPETO Credit Facilities,Facility, to fund capital expenditures and acquisitions as well as for general partnership purposes. In 2018, we had a net increase in our debt level of $801 million. In 2018, we paid distributions of $4.56 billion to our partners and distributions of $1.17 billion to noncontrolling interests, including predecessor distributions. During 2018, we incurred debt issuance costs of $162 million, and our subsidiaries repurchased $300 million of common units in cash. In addition, we received capital contributions from noncontrolling interests of $649 million. Additionally, in 2018, our subsidiary received $465 million related to redeemable noncontrolling interests.
Year Ended December 31, 2017
Cash provided by financing activities was $572 million in 2017. We received $2.28 billion in net proceeds from common unit offerings, $1.48 billion in net proceeds from the issuance of preferred units and we received $333 million in net proceeds from predecessor equity offerings. Net proceeds from the offerings and issuances were used to repay outstanding borrowings under the ETO Credit Facility, to fund capital expenditures and acquisitions as well as for general partnership purposes. In 2017, we had a net decrease in our debt level of $421 million. In addition, we incurred debt issuance costs of $83 million. In 2017, we paid distributions of $3.47 billion to our partners and we paid distributions of $430$714 million to noncontrolling interests.interests, including predecessor distributions. In addition, we received capital contributions from noncontrolling interests of $1.21 billion. During 2017, we repurchased our outstanding Legacy Preferred Units for
Discontinued Operations
Cash flows from discontinued operations reflect cash of $53 million and incurred debt issuance costs of $83 million.flows related to Sunoco LP’s retail divestment.
Year Ended December 31, 20162019
Cash provided by financing activities was $2.92 billion in 2016. We received $1.10 billion in net proceeds from Common Unit offerings, and our subsidiaries received $1.39 billion in net proceeds from the issuance of common units. Net proceeds from the offeringsThere were usedno cash flows related to repay outstanding borrowings under the ETLP Credit Facility, to fund capital expenditures and acquisitions,
as well as for general partnership purposes. In 2016, we had a net increase in our debt level of $4.24 billion primarily due to borrowings under our credit facilities in aggregate of $4.04 billion, legacy Sunoco Logistics’ issuance of $550 million in aggregate principal amount of senior notes in July 2016 and $168 million of debt assumed by the Partnership in connection with the PennTex Acquisition, partially offset by repayments of long-term debt. In addition, we incurred debt issuance costs of $22 million. In 2016, we paid distributions of $3.54 billion to our partners and we paid distributions of $481 million to noncontrolling interests. In addition, we received capital contributions from noncontrolling interests of $236 million.discontinued operations during 2019.
Year Ended December 31, 20152018
Cash provided by discontinued operations was $2.73 billion for the year ended December 31, 2018resulting from cash used in operating activities of $484 million, cash provided by investing activities of $3.21 billion, and changes in cash included in current assets held for sale of $11 million.
Year Ended December 31, 2017
Cash provided by financingdiscontinued operations was $93 million for the year ended December 31, 2017 resulting from cash provided by operating activities was $4.94 billionof $136 million, cash used in 2015. We received $1.43 billioninvesting activities of $38 million, and changes in net proceeds from Common Unit offerings, and our subsidiaries received $1.52 billioncash included in net proceeds from the issuancecurrent assets held for sale of common units. Net proceeds from the offerings were used to repay outstanding borrowings under the ETLP Credit Facility, to fund capital expenditures and acquisitions, as well as for general partnership purposes. In 2015, we had a net increase in our debt level of $4.85 billion primarily due to ETP’s issuance of $2.50 billion and $3.00 billion in aggregate principal amount of senior notes in March 2015 and June 2015, respectively, and legacy Sunoco Logistics’ issuance of $1.00 billion in aggregate principal amount of senior notes in November 2015. In addition, we incurred debt issuance costs of $63$5 million. In 2015, we paid distributions of $3.13 billion to our partners and we paid distributions of $338 million to noncontrolling interests. In addition, we received capital contributions from noncontrolling interest of $841 million.
Description of Indebtedness
Our outstanding consolidated indebtedness was as follows:
| | | | December 31, | December 31, |
| | 2017 | | 2016 | 2019 | | 2018 |
| ETP Senior Notes | $ | 27,005 |
| | $ | 24,855 |
| |
| ETO Senior Notes | | $ | 36,118 |
| | $ | 28,755 |
|
| Transwestern Senior Notes | 575 |
| | 657 |
| 575 |
| | 575 |
|
| Panhandle Senior Notes | 785 |
| | 1,085 |
| 235 |
| | 385 |
|
| Sunoco, Inc. Senior Notes | — |
| | 400 |
| |
| Bakken Senior Notes | | 2,500 |
| | — |
|
| Sunoco LP Senior Notes, Term Loan and lease-related obligations | | 2,935 |
| | 2,307 |
|
| USAC Senior Notes | | 1,475 |
| | 725 |
|
| Revolving credit facilities: | | | | | | |
| ETP $4.0 billion Revolving Credit Facility due December 2022 | 2,292 |
| | — |
| |
ETP $1.0 billion 364-Day Credit Facility due November 2018 (1) | 50 |
| | — |
| |
| ETLP $3.75 billion Revolving Credit Facility due November 2019 | — |
| | 2,777 |
| |
| Legacy Sunoco Logistics $2.50 billion Revolving Credit Facility due March 2020 | — |
| | 1,292 |
| |
| Legacy Sunoco Logistics $1.0 billion 364-Day Credit Facility due December 2017 | — |
| | 630 |
| |
| Bakken Project $2.50 billion Credit Facility due August 2019 | 2,500 |
| | 1,100 |
| |
| PennTex $275 million Revolving Credit Facility due December 2019 | — |
| | 168 |
| |
| ETO $2.00 billion Term Loan facility due October 2022 | | 2,000 |
| | — |
|
| ETO $5.00 billion Revolving Credit Facility due December 2023 | | 4,214 |
| | 3,694 |
|
| Sunoco LP $1.50 billion Revolving Credit Facility due July 2023 | | 162 |
| | 700 |
|
| USAC $1.60 billion Revolving Credit Facility due April 2023 | | 403 |
| | 1,050 |
|
| Bakken $2.50 billion Credit Facility due August 2019 | | — |
| | 2,500 |
|
| Other long-term debt | 5 |
| | 30 |
| 2 |
| | 7 |
|
| Unamortized premiums, net of discounts and fair value adjustments | 61 |
| | 116 |
| 3 |
| | 31 |
|
| Deferred debt issuance costs | (179 | ) | | (180 | ) | (276 | ) | | (221 | ) |
| Total debt | 33,094 |
| | 32,930 |
| 50,346 |
| | 40,508 |
|
| Less: current maturities of long-term debt | 407 |
| | 1,189 |
| 12 |
| | 2,655 |
|
| Long-term debt, less current maturities | $ | 32,687 |
| | $ | 31,741 |
| $ | 50,334 |
| | $ | 37,853 |
|
| |
(1)
| Borrowings under 364-day credit facilities were classified as long-term debt based on the Partnership’s ability and intent to refinance such borrowings on a long-term basis. |
The terms of our consolidated indebtedness and that of our subsidiaries are described in more detail below and in Note 65 to our consolidated financial statements.statements included in “Item 8. Financial Statements and Supplementary Data.”
Recent Transactions
ETO January 2020 Senior Notes Offering and Redemption
On January 22, 2020, ETO completed a registered offering (the “January 2020 Senior Notes Offering”) of $1.00 billion aggregate principal amount of the Partnership’s 2.900% Senior Notes due 2025, $1.50 billion aggregate principal amount of the Partnership’s 3.750% Senior Notes due 2030 and $2.00 billion aggregate principal amount of the Partnership’s 5.000% Senior Notes due 2050, (collectively, the “Notes”). The Notes are fully and unconditionally guaranteed by the Partnership’s wholly owned subsidiary, Sunoco Logistics Partners Operations L.P., on a senior unsecured basis.
Utilizing proceeds from the January 2020 Senior Notes Offering, ETO redeemed its $400 million aggregate principal amount of 5.75% Senior Notes due September 1, 2020, its $1.05 billion aggregate principal amount of 4.15% Senior Notes due October 1, 2020, its $1.14 billion aggregate principal amount of 7.50% Senior Notes due October 15, 2020, its $250 million aggregate principal amount of 5.50% Senior Notes due February 15, 2020, ET’s $52 million aggregate principal amount of 7.50% Senior Notes due October 15, 2020 and Transwestern’s $175 million aggregate principal amount of 5.36% Senior Notes due December 9, 2020.
ETO Term Loan
On October 17, 2019, ETO entered into a term loan credit agreement (the “ETO Term Loan”) providing for a $2.00 billion three-year term loan credit facility. Borrowings under the term loan agreement mature on October 17, 2022 and are available for working capital purposes and for general partnership purposes. The term loan agreement is unsecured and is guaranteed by our subsidiary, Sunoco Logistics Partners Operations L.P.
ET-ETO Senior Notes Exchange
In February 2019, ETO commenced offers to exchange all of ET’s outstanding senior notes for senior notes issued by ETO (the “ET-ETO senior notes exchange”). Approximately 97% of ET’s outstanding senior notes were tendered and accepted, and substantially all the exchanges settled on March 25, 2019. In connection with the exchange, ETO issued approximately $4.21 billion aggregate principal amount of the following senior notes:
•$1.14 billion aggregate principal amount of 7.50% senior notes due 2020;
•$995 million aggregate principal amount of 4.25% senior notes due 2023;
•$1.13 billion aggregate principal amount of 5.875% senior notes due 2024; and
•$956 million aggregate principal amount of 5.50% senior notes due 2027.
ETO 2019 Senior Notes Offering and Redemption
In January 2019, ETO issued the following senior notes:
$750 million aggregate principal amount of 4.50% senior notes due 2024;
$1.50 billion aggregate principal amount of 5.25% senior notes due 2029; and
$1.75 billion aggregate principal amount of 6.25% senior notes due 2049.
The $3.96 billion net proceeds from the offering were used to make an intercompany loan to ET (which ET used to repay its term loan in full), for general partnership purposes and to redeem at maturity all of the following:
ETO’s $400 million aggregate principal amount of 9.70% senior notes due March 15, 2019;
ETO’s $450 million aggregate principal amount of 9.00% senior notes due April 15, 2019; and
Panhandle’s $150 million aggregate principal amount of 8.125% senior notes due June 1, 2019.
Panhandle Senior Notes Redemption
In June 2019, Panhandle’s $150 million aggregate principal amount of 8.125% senior notes matured and were repaid with borrowings under an affiliate loan agreement with ETO.
Bakken Senior Notes Offering
In March 2019, Midwest Connector Capital Company LLC, a wholly-owned subsidiary of Dakota Access, issued the following senior notes related to the Bakken pipeline:
$650 million aggregate principal amount of 3.625% senior notes due 2022;
$1.00 billion aggregate principal amount of 3.90% senior notes due 2024; and
$850 million aggregate principal amount of 4.625% senior notes due 2029.
The $2.48 billion in net proceeds from the offering were used to repay in full all amounts outstanding on the Bakken credit facility and the facility was terminated.
Sunoco LP Senior Notes Offering
In March 2019, Sunoco LP issued $600 million aggregate principal amount of 6.00% senior notes due 2027 in a private placement to eligible purchasers. The net proceeds from this offering were used to repay a portion of Sunoco LP’s existing borrowings under its credit facility. In July 2019, Sunoco LP completed an exchange of these notes for registered notes with substantially identical terms.
USAC Senior Notes Offering
In March 2019, USAC issued $750 million aggregate principal amount of 6.875% senior notes due 2027 in a private placement, and in December 2019, USAC exchanged those notes for substantially identical senior notes registered under the Securities Act. The net proceeds from this offering were used to repay a portion of USAC’s existing borrowings under its credit facility and for general partnership purposes.
Credit Facilities and Commercial Paper
ETPETO Credit Facilities
On December 1, 2017 the Partnership entered into a five-year, $4.0 billion unsecured revolving credit facility, which matures December 1, 2022 (the “ETP Five-Year Facility”) and a $1.0 billion 364-day revolving credit facility that matures on November
30, 2018 (the “ETP 364-Day Facility”) (collectively, the “ETP Credit Facilities”). The ETP Five-Year Facility contains an accordion feature, under which the total aggregate commitments may be increased up to $6.0 billion under certain conditions. We use the ETP Credit Facilities to provide temporary financing for our growth projects, as well as for general partnership purposes.
Borrowings under the ETPETO Credit Facilities are unsecured and initially guaranteed by Sunoco Logistics Partners Operations L.P. Borrowings under the ETPETO Credit Facilities will bear interest at a eurodollar rate or a base rate, at our option, plus an applicable margin. In addition, we will be required to pay a quarterly commitment fee to each lender equal to the product of the applicable rate and such lender’s applicable percentage of the unused portion of the aggregate commitments under the ETPETO Credit Facilities. Concurrent with the closing of the ETP Credit Facilities, we repaid the entire amount outstanding and terminated our previously existing $3.75 billion ETLP Credit Facility and $2.50 billion Sunoco Logistics Credit Facility.
We typically repay amounts outstanding under the ETPETO Credit Facilities with proceeds from common unit offerings or long-term notes offerings. The timing of borrowings depends on the Partnership’s activities and the cash available to fund those activities. The repayments of amounts outstanding under the ETPETO Credit Facilities depend on multiple factors, including market conditions and expectations of future working capital needs, and ultimately are a financing decision made by management. Therefore, the balance outstanding under the ETPETO Credit Facilities may vary significantly between periods. We do not believe that such fluctuations indicate a significant change in our liquidity position, because we expect to continue to be able to repay amounts outstanding under the ETPETO Credit Facilities with proceeds from common unit offerings or long-term note offerings.
ETO Term Loan
On October 17, 2019, ETO entered into a term loan credit agreement (the “ETO Term Loan”) providing for a $2.00 billion three-year term loan credit facility. Borrowings under the term loan agreement mature on October 17, 2022 and are available for working capital purposes and for general partnership purposes. The term loan agreement is unsecured and is guaranteed by our subsidiary, Sunoco Logistics Partners Operations L.P.
As of December 31, 2017,2019, the ETPETO Term Loan had $2.00 billion outstanding and was fully drawn. The weighted average interest rate on the total amount outstanding as of December 31, 2019 was 2.78%.
ETO Five-Year Credit Facility
ETO’s revolving credit facility (the “ETO Five-Year Credit Facility”) allows for unsecured borrowings up to $5.00 billion and matures on December 1, 2023. The ETO Five-Year Credit Facility contains an accordion feature, under which the total aggregate commitment may be increased up to $6.00 billion under certain conditions.
As of December 31, 2019, the ETO Five-Year Credit Facility had $2.29$4.21 billion outstanding, of which $2.01$1.64 billion was commercial paper. The amount available for future borrowings was $1.56 billion$709 million after taking into account letters of credit of $150$77 million. The weighted average interest rate on the total amount outstanding as of December 31, 20172019 was 2.48%2.88%.
ETO 364-Day Facility
ETO’s 364-day revolving credit facility (the “ETO 364-Day Facility”) allows for unsecured borrowings up to $1.00 billion and matures on November 27, 2020. As of December 31, 2019, the ETO 364-Day Facility had no outstanding borrowings.
Sunoco LP Credit Facility
As of December 31, 2017,2019, the ETP 364-DaySunoco LP Credit Facility had $50$162 million outstanding borrowings and the$8 million in standby letters of credit. The amount available for future borrowings was $950 million.$1.33 billion at December 31, 2019. The weighted average interest rate on the total amount outstanding as of December 31, 20172019 was 5.00%3.75%.
BakkenUSAC Credit Facility
In August 2016, Energy Transfer Partners, L.P., Sunoco Logistics and Phillips 66 completed project-level financing of the Bakken Pipeline. The $2.50 billion credit facility is anticipated to provide substantially all of the remaining capital necessary to complete the projects and matures in August 2019 (the “Bakken Credit Facility”). As of December 31, 2017,2019, USAC had $403 million of outstanding borrowings and no outstanding letters of credit under the Bakken Credit Facilitycredit agreement. As of December 31, 2019, USAC had $2.50$1.20 billion of outstanding borrowings.availability under its credit facility. The weighted average interest rate on the total amount outstanding as of December 31, 20172019 was 3.00%4.31%.
Covenants Related to Our Credit Agreements
Covenants Related to ETPETO
The agreements relating to the ETPETO senior notes contain restrictive covenants customary for an issuer with an investment-grade rating from the rating agencies, which covenants include limitations on liens and a restriction on sale-leaseback transactions.
The ETPETO Credit Facilities containscontain covenants that limit (subject to certain exceptions) the Partnership’s and certain of the Partnership’s subsidiaries’ ability to, among other things:
make certain investments;
make Distributions (as defined in the ETP Credit Facilities) during certain Defaults (as defined in the ETP Credit Facilities) and during any Event of Default (as defined in the ETP Credit Facilities);
engage in business substantially different in nature than the business currently conducted by the Partnership and its subsidiaries;
engage in transactions with affiliates; and
enter into restrictive agreements.
| |
| • | make certain investments; |
| |
| • | make Distributions (as defined in the ETO Credit Facilities) during certain Defaults (as defined in the ETO Credit Facilities) and during any Event of Default (as defined in the ETO Credit Facilities); |
| |
| • | engage in business substantially different in nature than the business currently conducted by the Partnership and its subsidiaries; |
| |
| • | engage in transactions with affiliates; and |
| |
| • | enter into restrictive agreements. |
The ETPETO Credit Facilities applicable margin and rate used in connection with the interest rates and commitment fees, respectively, are based on the credit ratings assigned to our senior, unsecured, non-credit enhanced long-term debt. The applicable margin for eurodollar rate loans under the ETPETO Five-Year Facility ranges from 1.125% to 2.000% and the applicable margin for base rate
loans ranges from 0.125% to 1.000%. The applicable rate for commitment fees under the ETPETO Five-Year Facility ranges from 0.125% to 0.300%. The applicable margin for eurodollar rate loans under the ETPETO 364-Day Facility ranges from 1.125%1.250% to 1.750% and the applicable margin for base rate loans ranges from 0.250% to 0.750%. The applicable rate for commitment fees under the ETPETO 364-Day Facility ranges from 0.125% to 0.225%.
The ETPETO Credit Facilities contain various covenants including limitations on the creation of indebtedness and liens, and related to the operation and conduct of our business. The ETPETO Credit Facilities also limit us, on a rolling four quarter basis, to a maximum Consolidated Funded Indebtedness to Consolidated EBITDA ratio, as defined in the underlying credit agreements, of 5.0 to 1, which can generally be increased to 5.5 to 1 during a Specified Acquisition Period. Our Leverage Ratio was 3.964.04 to 1 at December 31, 2017,2019, as calculated in accordance with the credit agreements.
The agreements relating to the Transwestern senior notes contain certain restrictions that, among other things, limit the incurrence of additional debt, the sale of assets and the payment of dividends and specify a maximum debt to capitalization ratio.
Failure to comply with the various restrictive and affirmative covenants of our revolving credit facilities could require us to pay debt balances prior to scheduled maturity and could negatively impact the Operating Companies’Partnership’s or our subsidiaries’ ability to incur additional debt and/or our ability to pay distributions.distributions to Unitholders.
Covenants Related to Panhandle
Panhandle is not party to any lending agreement that would accelerate the maturity date of any obligation due to a failure to maintain any specific credit rating, nor would a reduction in any credit rating, by itself, cause an event of default under any of Panhandle’s lending agreements. Financial covenants exist in certain of Panhandle’s debt agreements that require Panhandle to maintain a certain level of net worth, to meet certain debt to total capitalization ratios and to meet certain ratios of earnings before depreciation, interest and taxes to cash interest expense. A failure by Panhandle to satisfy any such covenant would give rise to an event of default under the associated debt, which could become immediately due and payable if Panhandle did not cure such default within any permitted cure period or if Panhandle did not obtain amendments, consents or waivers from its lenders with respect to such covenants.
Panhandle’s restrictive covenants include restrictions on debt levels, restrictions on liens securing debt and guarantees and restrictions on mergers and on the sales of assets, capitalization requirements, dividend restrictions, cross default and cross-acceleration and prepayment of debt provisions.assets. A breach of any of these covenants could result in acceleration of Panhandle’s debt and other financial obligations and that of its subsidiaries.
In addition, Panhandle and/or its subsidiaries are subject to certain additional restrictions and covenants. These restrictions and covenants include limitations on additional debt at some of its subsidiaries; limitations on the use of proceeds from borrowing at some of its subsidiaries; limitations, in some cases, on transactions with its affiliates; limitations on the incurrence of liens; potential limitations on the abilities of some of its subsidiaries to declare and pay dividends and potential limitations on some of its subsidiaries to participate in Panhandle’s cash management program; and limitations on Panhandle’s ability to prepay debt.
Covenants Related to Bakken Credit FacilitySunoco LP
The BakkenSunoco LP Credit Facility contains standardvarious customary representations, warranties, covenants and customary covenantsevents of default, including a change of control event of default, as defined therein. Sunoco LP’s Credit Facility requires Sunoco LP to maintain a Net Leverage Ratio of not more than 5.5 to 1. The maximum Net Leverage Ratio is subject to upwards adjustment of not more than 6.0 to 1 for a financing of this type, subjectperiod not to materiality, knowledge and other qualifications, thresholds, reasonableness and other exceptions. These standard and customary covenants include, but are not limited to:
prohibition of certain incremental secured indebtedness;
prohibition of certain liens / negative pledge;
limitations on uses of loan proceeds;
limitations on asset sales and purchases;
limitations on permitted business activities;
limitations on mergers and acquisitions;
limitations on investments;
limitations on transactions with affiliates; and
maintenance of commercially reasonable insurance coverage.
A restricted payment covenant is also includedexceed three fiscal quarters in the Bakken Credit Facility which requires a minimum historic debt service coverage ratio (“DSCR”)event Sunoco LP engages in certain specified acquisitions of not less than 1.20$50 million (as permitted under Sunoco LP’s Credit Facility agreement). The Sunoco LP Credit Facility also requires Sunoco LP to 1 (the “Minimum Historic DSCR”) with respect each 12-month periodmaintain an Interest Coverage Ratio (as defined in the Sunoco LP’s Credit Facility agreement) of not less than 2.25 to 1.
Covenants Related to USAC
The USAC Credit Facility contains covenants that limit (subject to certain exceptions) USAC’s ability to, among other things:
| |
| • | make certain loans or investments; |
| |
| • | incur additional indebtedness or guarantee other indebtedness; |
| |
| • | make certain acquisitions. |
The credit facility is also subject to the following the commercial in-service date of the Dakota Access and ETCO Project in orderfinancial covenants, including covenants requiring us to make certain restricted payments thereunder.maintain:
| |
| • | a minimum EBITDA to interest coverage ratio of 2.5 to 1.0, determined as of the last day of each fiscal quarter; and |
| |
| • | a maximum funded debt to EBITDA ratio, determined as of the last day of each fiscal quarter, for the annualized trailing three months of (i) 5.5 to 1 through the end of the fiscal quarter ending December 31, 2019 and (ii) 5.0 to 1.0 thereafter, in each case subject to a provision for increases to such thresholds by 0.50 in connection with certain future acquisitions for the six consecutive month period following the period in which any such acquisition occurs. |
Compliance with our Covenants
We and our subsidiaries were in compliance with all requirements, tests, limitations, and covenants related to our debt agreements as of December 31, 2017.
Off-Balance Sheet Arrangements
Contingent Residual Support Agreement – AmeriGas
In connection with the closing of the contribution of its propane operations in January 2012, ETP previously provided contingent residual support of certain debt obligations of AmeriGas. AmeriGas has subsequently repaid the remainder of the related obligations and ETP no longer provides contingent residual support for any AmeriGas notes.
Guarantee of Sunoco LP Notes
In connection with previous transactions whereby Retail Holdings contributed assets to Sunoco LP, Retail Holdings provided a limited contingent guarantee of collection, but not of payment, to Sunoco LP with respect to (i) $800 million principal amount of 6.375% senior notes due 2023 issued by Sunoco LP, (ii) $800 million principal amount of 6.25% senior notes due 2021 issued by Sunoco LP and (iii) $2.035 billion aggregate principal for Sunoco LP’s term loan due 2019. In December 2016, Retail Holdings contributed its interests in Sunoco LP, along with the assignment of the guarantee of Sunoco LP’s senior notes, to its subsidiary, ETC M-A Acquisition LLC (“ETC M-A”).
On January 23, 2018, Sunoco LP redeemed the previously guaranteed senior notes and issued the following notes for which ETC M-A has also guaranteed collection with respect to the payment of principal amounts:
$1.00 billion aggregate principal amount of 4.875%, senior notes due 2023;
$800 million aggregate principal amount of 5.50% senior notes due 2026; and
$400 million aggregate principal amount of 5.875% senior notes due 2028.
Under the guarantee of collection, ETC M-A would have the obligation to pay the principal of each series of notes once all remedies, including in the context of bankruptcy proceedings, have first been fully exhausted against Sunoco LP with respect to such payment obligation, and holders of the notes are still owed amounts in respect of the principal of such notes. ETC M-A will not otherwise be subject to the covenants of the indenture governing the notes.
Contractual Obligations
The following table summarizes our long-term debt and other contractual obligations as of December 31, 2017:2019:
| | | | | Payments Due by Period | | Payments Due by Period |
| Contractual Obligations | | Total | | Less Than 1 Year | | 1-3 Years | | 3-5 Years | | More Than 5 Years | | Total | | Less Than 1 Year | | 1-3 Years | | 3-5 Years | | More Than 5 Years |
| Long-term debt | | $ | 33,212 |
| | $ | 1,700 |
| | $ | 5,375 |
| | $ | 6,746 |
| | $ | 19,391 |
| | $ | 50,619 |
| | $ | 3,021 |
| | $ | 7,204 |
| | $ | 13,297 |
| | $ | 27,097 |
|
Interest on long-term debt(1) | | 22,204 |
| | 1,626 |
| | 2,873 |
| | 2,447 |
| | 15,258 |
| | 40,939 |
| | 2,522 |
| | 4,917 |
| | 4,276 |
| | 29,224 |
|
| Payments on derivatives | | 223 |
| | 84 |
| | 139 |
| | — |
| | — |
| | 401 |
| | 150 |
| | 251 |
| | — |
| | — |
|
Purchase commitments(2) | | 3,605 |
| | 3,443 |
| | 99 |
| | 35 |
| | 28 |
| | 2,133 |
| | 2,053 |
| | 57 |
| | 7 |
| | 16 |
|
| Transportation, natural gas storage and fractionation contracts | | 25 |
| | 19 |
| | 6 |
| | — |
| | — |
| | 16 |
| | 5 |
| | 6 |
| | 5 |
| | — |
|
| Operating lease obligations | | 257 |
| | 39 |
| | 73 |
| | 53 |
| | 92 |
| | 1,548 |
| | 98 |
| | 166 |
| | 140 |
| | 1,144 |
|
Other(3) | | 185 |
| | 32 |
| | 56 |
| | 45 |
| | 52 |
| |
Total(4) | | $ | 59,711 |
| | $ | 6,943 |
| | $ | 8,621 |
| | $ | 9,326 |
| | $ | 34,821 |
| |
Service concession arrangement(3) | | | 379 |
| | 15 |
| | 30 |
| | 32 |
| | 302 |
|
Other(4) | | | 190 |
| | 25 |
| | 48 |
| | 40 |
| | 77 |
|
Total(5) | | | $ | 96,225 |
| | $ | 7,889 |
| | $ | 12,679 |
| | $ | 17,797 |
| | $ | 57,860 |
|
| |
(1) | Interest payments on long-term debt are based on the principal amount of debt obligations as of December 31, 2017.2019. With respect to variable rate debt, the interest payments were estimated using the interest rate as of December 31, 2017.2019. To the extent interest rates change, our contractual obligations for interest payments will change. See “Item 7A. Quantitative and Qualitative Disclosures About Market Risk” for further discussion. |
| |
(2) | We define a purchase commitment as an agreement to purchase goods or services that is enforceable and legally binding (unconditional) on us that specifies all significant terms, including: fixed or minimum quantities to be purchased; fixed, minimum or variable price provisions; and the approximate timing of the transactions. We have long and short-term product purchase obligations for refined product and energy commodities with third-party suppliers. These purchase obligations are entered into at either variable or fixed prices. The purchase prices that we are obligated to pay under variable price contracts approximate market prices at the time we take delivery of the volumes. Our estimated future variable price contract payment obligations are based on the December 31, 20172019 market price of the applicable commodity applied to future volume commitments. Actual future payment obligations may vary depending on market prices at the time of delivery. The purchase prices that we are obligated to pay under fixed price contracts are established at the inception of the contract. Our estimated future fixed price contract payment obligations are based on the contracted fixed price under each commodity contract. Obligations shown in the table represent estimated payment obligations under these contracts for the periods indicated. |
| |
(3) | Includes minimum guaranteed payments under service concession arrangements with New Jersey Turnpike Authority and New York Thruway Authority. |
| |
(4) | Expected contributions to fund our pension and postretirement benefit plans were included in “Other” above. Environmental liabilities, asset retirement obligations,AROs, unrecognized tax benefits, contingency accruals and deferred revenue, which were included in “Other non-current liabilities” in our consolidated balance sheets, were excluded from the table above as the amounts do not represent contractual obligations or, in some cases, the amount and/or timing of the cash payments is uncertain. |
| |
(4)(5)
| Excludes non-current deferred tax liabilities of $2.88$3.11 billion due to uncertainty of the timing of future cash flows for such liabilities. |
Cash Distributions
CashETO Preferred Unit Distributions Paid by ETP
UnderDistributions on the Partnership’s limited partnership agreement, within 45 days after the end of each quarter,Series A, Series B, Series C, Series D and Series E preferred units declared and/or paid by the Partnership distributes all cash on hand at the end of the quarter, less reserves established by the general partner in its discretion. This is definedwere as “available cash” in the partnership agreement. The general partner has broad discretion to establish cash reserves that it determines are necessary or appropriate to properly conduct the Partnership’s business. The Partnership will make quarterly distributions to the extent there is sufficient cash from operations after establishment of cash reserves and payment of fees and expenses, including payments to the general partner.
If cash distributions exceed $0.0833 per unit in a quarter, the holders of the incentive distribution rights receive increasing percentages, up to 48 percent, of the cash distributed in excess of that amount. These distributions are referred to as “incentive distributions.”
The following table shows the target distribution levels and distribution “splits” between the general and limited partners and the holders of the Partnership’s incentive distribution rights (”IDRs”):follows:
|
| | | | | | |
| | | | | Marginal Percentage Interest in Distributions |
| | | Total Quarterly Distribution Target Amount | | IDRs | | Partners (1) |
| Minimum Quarterly Distribution | | $0.0750 | | —% | | 100% |
| First Target Distribution | | up to $0.0833 | | —% | | 100% |
| Second Target Distribution | | above $0.0833 up to $0.0958 | | 13% | | 87% |
| Third Target Distribution | | above $0.0958 up to $0.2638 | | 35% | | 65% |
| Thereafter | | above $0.2638 | | 48% | | 52% |
|
| | | | | | | | | | | | | | | | | | | | | | | | | |
| Period Ended | | Record Date | | Payment Date | | Series A (1) | | Series B (1) | | Series C | | Series D | | Series E | |
| December 31, 2017 | | February 1, 2018 | | February 15, 2018 | | $ | 15.4510 |
| * | $ | 16.3780 |
| * | $ | — |
| | $ | — |
| | $ | — |
| |
| June 30, 2018 | | August 1, 2018 | | August 15, 2018 | | 31.2500 |
| | 33.1250 |
| | 0.5634 |
| * | — |
| | — |
| |
| September 30, 2018 | | November 1, 2018 | | November 15, 2018 | | — |
| | — |
| | 0.4609 |
| | 0.5931 |
| * | — |
| |
| December 31, 2018 | | February 1, 2019 | | February 15, 2019 | | 31.2500 |
| | 33.1250 |
| | 0.4609 |
| | 0.4766 |
| | — |
| |
| March 31, 2019 | | May 1, 2019 | | May 15, 2019 | | — |
| | — |
| | 0.4609 |
| | 0.4766 |
| | — |
| |
| June 30, 2019 | | August 1, 2019 | | August 15, 2019 | | 31.2500 |
| | 33.1250 |
| | 0.4609 |
| | 0.4766 |
| | 0.5806 |
| * |
| September 30, 2019 | | November 1, 2019 | | November 15, 2019 | | — |
| | — |
| | 0.4609 |
| | 0.4766 |
| | 0.4750 |
| |
| December 31, 2019 | | February 3, 2020 | | February 18, 2020 | | 31.2500 |
| | 33.1250 |
| | 0.4609 |
| | 0.4766 |
| | 0.4750 |
| |
| |
(1)*
| Includes general partner and limited partner interests, basedRepresent prorated initial distributions. Prorated initial distributions on the proportionate ownership of each.recently issued Series F and Series G preferred units will be payable in May 2020. |
(1) Series A Preferred Units and Series B Preferred Unit distributions are paid on a semi-annual basis.
Sunoco LP Cash Distributions
The following table illustrates the percentage allocations of available cash from operating surplus between Sunoco LP’s common unitholders and the holder of its IDRs based on the specified target distribution levels, after the payment of distributions to Class C unitholders. The amounts set forth under “marginal percentage interest in distributions” are the percentage interests of the IDR holder and the common unitholders in any available cash from operating surplus which Sunoco LP distributes up to and including the corresponding amount in the column “total quarterly distribution per unit target amount.” The percentage interests shown for common unitholders and IDR holder for the minimum quarterly distribution are also applicable to quarterly distribution amounts that are less than the minimum quarterly distribution.
101 |
| | | | | | |
| | | | | Marginal Percentage Interest in Distributions |
| | | Total Quarterly Distribution Target Amount | | Common Unitholders | | Holder of IDRs |
| Minimum Quarterly Distribution | | $0.4375 | | 100% | | —% |
| First Target Distribution | | $0.4375 to $0.503125 | | 100% | | —% |
| Second Target Distribution | | $0.503125 to $0.546875 | | 85% | | 15% |
| Third Target Distribution | | $0.546875 to $0.656250 | | 75% | | 25% |
| Thereafter | | Above $0.656250 | | 50% | | 50% |
Distributions on commonSunoco LP’s units declared andand/or paid by ETP and Sunoco Logistics during the pre-merger periodsLP were as follows:
|
| | | | | | | | |
| Quarter Ended | | ETP | | Sunoco Logistics |
| December 31, 2014 | | $ | 0.6633 |
| | $ | 0.4000 |
|
| March 31, 2015 | | 0.6767 |
| | 0.4190 |
|
| June 30, 2015 | | 0.6900 |
| | 0.4380 |
|
| September 30, 2015 | | 0.7033 |
| | 0.4580 |
|
| December 31, 2015 | | 0.7033 |
| | 0.4790 |
|
| March 31, 2016 | | 0.7033 |
| | 0.4890 |
|
| June 30, 2016 | | 0.7033 |
| | 0.5000 |
|
| September 30, 2016 | | 0.7033 |
| | 0.5100 |
|
| December 31, 2016 | | 0.7033 |
| | 0.5200 |
|
|
| | | | | | | | |
| Quarter Ended | | Record Date | | Payment Date | | Rate |
| December 31, 2016 | | February 13, 2017 | | February 21, 2017 | | $ | 0.8255 |
|
| March 31, 2017 | | May 9, 2017 | | May 16, 2017 | | 0.8255 |
|
| June 30, 2017 | | August 7, 2017 | | August 15, 2017 | | 0.8255 |
|
| September 30, 2017 | | November 7, 2017 | | November 14, 2017 | | 0.8255 |
|
| December 31, 2017 | | February 6, 2018 | | February 14, 2018 | | 0.8255 |
|
| March 31, 2018 | | May 7, 2018 | | May 15, 2018 | | 0.8255 |
|
| June 30, 2018 | | August 7, 2018 | | August 15, 2018 | | 0.8255 |
|
| September 30, 2018 | | November 6, 2018 | | November 14, 2018 | | 0.8255 |
|
| December 31, 2018 | | February 6, 2019 | | February 14, 2019 | | 0.8255 |
|
| March 31, 2019 | | May 7, 2019 | | May 15, 2019 | | 0.8255 |
|
| June 30, 2019 | | August 6, 2019 | | August 14, 2019 | | 0.8255 |
|
| September 30, 2019 | | November 5, 2019 | | November 19, 2019 | | 0.8255 |
|
| December 31, 2019 | | February 7, 2020 | | February 19, 2020 | | 0.8255 |
|
USAC Cash Distributions
Subsequent to the Energy Transfer Merger and USAC Transactions described in Note 1 and Note 3, respectively, ETO owned approximately 39.7 million USAC common units and 6.4 million USAC Class B units. Subsequent to the conversion of the USAC Class B Units to USAC common units on July 30, 2019, ETO owns approximately 46.1 million USAC common units. As of December 31, 2019, USAC had approximately 96.6 million common units outstanding. USAC currently has a non-economic general partner interest and no outstanding IDRs.
Distributions on commonUSAC’s units declared andand/or paid by Post-Merger ETPUSAC subsequent to the USAC transaction on April 2, 2018 were as follows:
|
| | | | | | | | |
| Quarter Ended | | Record Date | | Payment Date | | Rate |
| March 31, 2017 | | May 10, 2017 | | May 16, 2017 | | $ | 0.5350 |
|
| June 30, 2017 | | August 7, 2017 | | August 15, 2017 | | 0.5500 |
|
| September 30, 2017 | | November 7, 2017 | | November 14, 2017 | | 0.5650 |
|
| December 31, 2017 | | February 8, 2018 | | February 14, 2018 | | 0.5650 |
|
Distributions declared and paid by ETP to the preferred unitholders were as follows:
|
| | | | | | | | | | | | |
| | Distribution per Preferred Unit |
| Quarter Ended | | Record Date | | Payment Date | | Series A | | Series B |
| December 31, 2017 | | February 1, 2018 | | February 15, 2018 | | $ | 15.451 |
| | $ | 16.378 |
|
The total amounts of distributions declared and paid during the periods presented (all from Available Cash from our operating surplus and are shown in the year with respect to which they relate):
|
| | | | | | | | | | | | | | | | | | | |
| | Years Ended December 31, |
| | ETP | | Energy Transfer Partners, L.P. | | Sunoco Logistics |
| | 2017 | | 2016 | | 2015 | | 2016 | | 2015 |
| Common Units held by public | $ | 2,435 |
| | $ | 2,168 |
| | $ | 1,970 |
| | $ | 485 |
| | $ | 344 |
|
| Common Units held by ETP | — |
| | — |
| | — |
| | 135 |
| | 120 |
|
| Common Units held by ETE | 61 |
| | 28 |
| | 54 |
| | — |
| | — |
|
| Class H Units held by ETE | — |
| | 357 |
| | 263 |
| | — |
| | — |
|
| General Partner interest | 16 |
| | 32 |
| | 31 |
| | 15 |
| | 12 |
|
| Incentive distributions | 1,638 |
| | 1,363 |
| | 1,261 |
| | 397 |
| | 281 |
|
IDR relinquishments (1) | (656 | ) | | (409 | ) | | (111 | ) | | (15 | ) | | — |
|
| Series A Preferred Units | 15 |
| | — |
| | — |
| | — |
| | — |
|
| Series B Preferred Units | 9 |
| | — |
| | — |
| | — |
| | — |
|
| Total distributions declared to partners | $ | 3,518 |
| | $ | 3,539 |
| | $ | 3,468 |
| | $ | 1,017 |
| | $ | 757 |
|
| |
(1)
| Net of Class I unit distributions |
In connection with previous transactions, ETE has agreed to relinquish certain amounts of incentive distributions, including the following amounts of incentive distributions in future periods. These amounts include incentive distribution relinquishments related to both legacy ETP and legacy Sunoco Logistics, both of which are applicable to the combined post-merger ETP:
|
| | | | |
| | | Total Year |
| 2018 | | $ | 153 |
|
| 2019 | | 128 |
|
| Each year beyond 2019 | | 33 |
|
|
| | | | | | | | |
| Quarter Ended | | Record Date | | Payment Date | | Rate |
| March 31, 2018 | | May 1, 2018 | | May 11, 2018 | | $ | 0.5250 |
|
| June 30, 2018 | | July 30, 2018 | | August 10, 2018 | | 0.5250 |
|
| September 30, 2018 | | October 29, 2018 | | November 09, 2018 | | 0.5250 |
|
| December 31, 2018 | | January 28, 2019 | | February 8, 2019 | | 0.5250 |
|
| March 31, 2019 | | April 29, 2019 | | May 10, 2019 | | 0.5250 |
|
| June 30, 2019 | | July 29, 2019 | | August 9, 2019 | | 0.5250 |
|
| September 30, 2019 | | October 28, 2019 | | November 8, 2019 | | 0.5250 |
|
| December 31, 2019 | | January 27, 2020 | | February 7, 2020 | | 0.5250 |
|
Recent Accounting Pronouncements
ASU 2014-09
In May 2014, the Financial Accounting Standards Board (“FASB”) issued Accounting Standards Update No. 2014-09, Revenue from Contracts with Customers (Topic 606) (“ASU 2014-09”), which clarifies the principles for recognizing revenue based on the core principle that an entity should recognize revenue to depict the transfer of promised goods or services to customers in an amount that reflects the consideration to which the entity expects to be entitled in exchange for those goods or services. The Partnership adopted ASU 2014-09 on January 1, 2018. The Partnership applied the cumulative catchup transition method and recognized the cumulative effect of the retrospective application of the standard. The effect of the retrospective application of the standard was not material.
For future periods, we expect that the adoption of this standard will result in a change to revenues with offsetting changes to costs associated primarily with the designation of certain of our midstream segment agreements to be in-substance supply agreements, requiring amounts that had previously been reported as revenue under these agreements to be reclassified to a reduction of cost of sales. Changes to revenues along with offsetting changes to costs will also occur due to changes in the accounting for noncash consideration in multiple of our reportable segments, as well as fuel usage and loss allowances. None of these changes is expected to have a material impact on net income.
ASU 2016-02
In February 2016, the FASB issued Accounting Standards Update No. 2016-02, Leases (Topic 842) (“ASU 2016-02”), which establishes the principles that lessees and lessors shall apply to report useful information to users of financial statements about the amount, timing, and uncertainty of cash flows arising from a lease. The Partnership expects to adopt ASU 2016-02 in the first quarter of 2019 and is currently evaluating the impact that adopting this new standard will have on the consolidated financial statements and related disclosures.
ASU 2016-16
On January 1, 2018, the Partnership adopted Accounting Standards Update No. 2016-16, Income Taxes (Topic 740): Intra-entity Transfers of Assets Other Than Inventory (“ASU 2016-16”), which requires that entities recognize the income tax consequences of an intra-entity transfer of an asset other than inventory when the transfer occurs. The amendments in this update do not change GAAP for the pre-tax effects of an intra-entity asset transfer under Topic 810, Consolidation, or for an intra-entity transfer of inventory. We do not anticipate a material impact to our financial position or results of operations as a result of the adoption of this standard.
ASU 2017-04
In January 2017, the FASB issued ASU No. 2017-04 “Intangibles-Goodwill and other (Topic 350): Simplifying the test for goodwill impairment.” The amendments in this update remove the second step of the two-step test currently required by Topic 350. An entity will apply a one-step quantitative test and record the amount of goodwill impairment as the excess of a reporting unit’s carrying amount over its fair value, not to exceed the total amount of goodwill allocated to the reporting unit. The new guidance did not amend the optional qualitative assessment of goodwill impairment. The standard requires prospective application and therefore will only impact periods subsequent to the adoption. The Partnership adopted this ASU for its annual goodwill impairment test in the fourth quarter of 2017.
ASU 2017-12
In August 2017, the FASB issued ASU No. 2017-12 “Derivatives and Hedging (Topic 815): Targeted Improvements to Accounting for Hedging Activities.” The amendments in this update improve the financial reporting of hedging relationships to better portray the economic results of an entity’s risk management activities in its financial statements. In addition, the amendments in this update
make certain targeted improvements to simplify the application of the hedge accounting guidance in current GAAP. This ASU is effective for financial statements issued for fiscal years, and interim periods within those fiscal years, beginning after December 15, 2018, with early adoption permitted. The Partnership is currently evaluating the impact that adopting this new standard will have on the consolidated financial statements and related disclosures.
Estimates and Critical Accounting Policies
The selection and application of accounting policies is an important process that has developed as our business activities have evolved and as the accounting rules have developed. Accounting rules generally do not involve a selection among alternatives, but involve an implementation and interpretation of existing rules, and the use of judgment applied to the specific set of circumstances existing in our business. We make every effort to properly comply with all applicable rules, and we believe the proper implementation and consistent application of the accounting rules are critical. Our critical accounting policies are discussed below. For further details on our accounting policies see Note 2 to our consolidated financial statements.
Use of Estimates. The preparation of financial statements in conformity with GAAP requires management to make estimates and assumptions that affect the reported amounts of assets and liabilities and the accrual for and disclosure of contingent assets and liabilities at the date of the financial statements and the reported amounts of revenues and expenses during the reporting period. The natural gas industry conducts its business by processing actual transactions at the end of the month following the month of
delivery. Consequently, the most current month’s financial results for the midstream, NGL and intrastate transportation and storage segments are estimated using volume estimates and market prices. Any differences between estimated results and actual results are recognized in the following month’s financial statements. Management believes that the operating results estimated for the year ended December 31, 20172019 represent the actual results in all material respects.
Some of the other significant estimates made by management include, but are not limited to, the timing of certain forecasted transactions that are hedged, the fair value of derivative instruments, useful lives for depreciation, depletion and amortization, purchase accounting allocations and subsequent realizability of intangible assets, fair value measurements used in the goodwill impairment test, market value of inventory, assets and liabilities resulting from the regulated ratemaking process, contingency reserves and environmental reserves. Actual results could differ from those estimates.
Revenue Recognition. Revenues for sales of natural gas and NGLs are recognized at the later of the time of delivery of the product to the customer or the time of sale. Revenues from service labor, transportation, treating, compression and gas processing, are recognized upon completion of the service. Transportation capacity payments are recognized when earned in the period the capacity is made available.
Our intrastate transportation and storage and interstate transportation and storage segments’ results are determined primarily by the amount of capacity our customers reserve as well as the actual volume of natural gas that flows through the transportation pipelines. Under transportation contracts, our customers are charged (i) a demand fee, which is a fixed fee for the reservation of an agreed amount of capacity on the transportation pipeline for a specified period of time and which obligates the customer to pay even if the customer does not transport natural gas on the respective pipeline, (ii) a transportation fee, which is based on the actual throughput of natural gas by the customer, (iii) fuel retention based on a percentage of gas transported on the pipeline, or (iv) a combination of the three, generally payable monthly. Excess fuel retained after consumption is typically valued at market prices.
Our intrastate transportation and storage segment also generates revenues and margin from the sale of natural gas to electric utilities, independent power plants, local distribution companies, industrial end-users and other marketing companies on the HPL System. Generally, we purchase natural gas from the market, including purchases from our marketing operations, and from producers at the wellhead.
In addition, our intrastate transportation and storage segment generates revenues and margin from fees charged for storing customers’ working natural gas in our storage facilities. We also engage in natural gas storage transactions in which we seek to find and profit from pricing differences that occur over time utilizing the Bammel storage reservoir. We purchase physical natural gas and then sell financial contracts at a price sufficient to cover our carrying costs and provide for a gross profit margin. We expect margins from natural gas storage transactions to be higher during the periods from November to March of each year and lower during the period from April through October of each year due to the increased demand for natural gas during colder weather. However, we cannot assure that management’s expectations will be fully realized in the future and in what time period, due to various factors including weather, availability of natural gas in regions in which we operate, competitive factors in the energy industry, and other issues.
Lake Charles LNG’s revenues from storage and re-gasification of natural gas are based on capacity reservation charges and, to a lesser extent, commodity usage charges. Reservation revenues are based on contracted rates and capacity reserved by the customers and recognized monthly. Revenues from commodity usage charges are also recognized monthly and represent the recovery of electric power charges at Lake Charles LNG’s terminal.
Results from the midstream segment are determined primarily by the volumes of natural gas gathered, compressed, treated, processed, purchased and sold through our pipeline and gathering systems and the level of natural gas and NGL prices. We generate midstream revenues and segment margins principally under fee-based or other arrangements in which we receive a fee for natural
gas gathering, compressing, treating or processing services. The revenue earned from these arrangements is directly related to the volume of natural gas that flows through our systems and is not directly dependent on commodity prices. Our midstream segment also generates revenues from the sale of residue gas and NGLs at the tailgate of our processing facilities primarily to affiliates and some third-party customers.
We also utilize other types of arrangements in our midstream segment, including (i) discount-to-index price arrangements, which involve purchases of natural gas at either (1) a percentage discount to a specified index price, (2) a specified index price less a fixed amount or (3) a percentage discount to a specified index price less an additional fixed amount, (ii) percentage-of-proceeds arrangements under which we gather and process natural gas on behalf of producers, sell the resulting residue gas and NGL volumes at market prices and remit to producers an agreed upon percentage of the proceeds based on an index price, and (iii) keep-whole arrangements where we gather natural gas from the producer, process the natural gas and sell the resulting NGLs to third parties at market prices. In many cases, we provide services under contracts that contain a combination of more than one of the arrangements described above. The terms of our contracts vary based on gas quality conditions, the competitive environment at the time the
contracts are signed and customer requirements. Our contract mix may change as a result of changes in producer preferences, expansion in regions where some types of contracts are more common and other market factors.
We conduct marketing activities in which we market the natural gas that flows through our assets, referred to as on-system gas. We also attract other customers by marketing volumes of natural gas that do not move through our assets, referred to as off-system gas. For both on-system and off-system gas, we purchase natural gas from natural gas producers and other supply points and sell that natural gas to utilities, industrial consumers, other marketers and pipeline companies, thereby generating gross margins based upon the difference between the purchase and resale prices.
We have a risk management policy that provides for oversight over our marketing activities. These activities are monitored independently by our risk management function and must take place within predefined limits and authorizations. As a result of our use of derivative financial instruments that may not qualify for hedge accounting, the degree of earnings volatility that can occur may be significant, favorably or unfavorably, from period to period. We attempt to manage this volatility through the use of daily position and profit and loss reports provided to senior management and predefined limits and authorizations set forth in our risk management policy.
We inject and hold natural gas in our Bammel storage facility to take advantage of contango markets, when the price of natural gas is higher in the future than the current spot price. We use financial derivatives to hedge the natural gas held in connection with these arbitrage opportunities. At the inception of the hedge, we lock in a margin by purchasing gas in the spot market or off peak season and entering a financial contract to lock in the sale price. If we designate the related financial contract as a fair value hedge for accounting purposes, we value the hedged natural gas inventory at current spot market prices along with the financial derivative we use to hedge it. Changes in the spread between the forward natural gas prices designated as fair value hedges and the physical inventory spot prices result in unrealized gains or losses until the underlying physical gas is withdrawn and the related designated derivatives are settled. Once the gas is withdrawn and the designated derivatives are settled, the previously unrealized gains or losses associated with these positions are realized. Unrealized margins represent the unrealized gains or losses from our derivative instruments using mark-to-market accounting, with changes in the fair value of our derivatives being recorded directly in earnings. These margins fluctuate based upon changes in the spreads between the physical spot prices and forward natural gas prices. If the spread narrows between the physical and financial prices, we will record unrealized gains or lower unrealized losses. If the spread widens, we will record unrealized losses or lower unrealized gains. Typically, as we enter the winter months, the spread converges so that we recognize in earnings the original locked in spread, either through mark-to-market or the physical withdrawal of natural gas.
NGL storage and pipeline transportation revenues are recognized when services are performed or products are delivered, respectively. Fractionation and processing revenues are recognized when product is either loaded into a truck or injected into a third-party pipeline, which is when title and risk of loss pass to the customer.
In our natural gas compression business, revenue is recognized for compressor packages and technical service jobs using the completed contract method which recognizes revenue upon completion of the job. Costs incurred on a job are deducted at the time revenue is recognized.
Terminalling and storage revenues are recognized at the time the services are provided. Pipeline revenues are recognized upon delivery of the barrels to the location designated by the shipper. Crude oil acquisition and marketing revenues, as well as refined product marketing revenues, are recognized when title to the product is transferred to the customer. Revenues are not recognized for crude oil exchange transactions, which are entered into primarily to acquire crude oil of a desired quality or to reduce transportation costs by taking delivery closer to end markets. Any net differential for exchange transactions is recorded as an adjustment of inventory costs in the purchases component of cost of products sold and operating expenses in the statements of operations.
Regulatory Assets and Liabilities. Our interstate transportation and storage segmentInvestment in Sunoco LP
Sunoco LP’s revenues from motor fuel are recognized either at the time fuel is subject to regulation by certain state and federal authorities, and certain subsidiaries in that segment have accounting policies that conformdelivered to the accounting requirementscustomer or at the time of sale. Shipment and delivery of motor fuel generally occurs on the same day. Sunoco LP charges wholesale customers for third-party transportation costs, which are recorded net in cost of sales. Through PropCo, Sunoco LP’s wholly-owned corporate subsidiary, Sunoco LP may sell motor fuel to customers on a commission agent basis, in which Sunoco LP retains title to inventory, controls access to and sale of fuel inventory, and recognizes revenue at the time the fuel is sold to the ultimate customer. In Sunoco LP’s fuel distribution and marketing operations, Sunoco LP derives other income from rental income, propane and lubricating oils, and other ancillary product and service offerings. In Sunoco LP’s other operations, Sunoco LP derives other income from merchandise, lottery ticket sales, money orders, prepaid phone cards and wireless services, ATM transactions, car washes, movie rentals, and other ancillary product and service offerings. Sunoco LP records revenue from other retail transactions on a net commission basis when a product is sold and/or services are rendered.
Investment in USAC
USAC’s revenue from contracted compression, station, gas treating and ratemaking practicesmaintenance services is recognized ratably under its fixed-fee contracts over the term of the regulatory authorities.contract as services are provided to its customers. Initial contract terms typically range from six months to five years. However, USAC usually continues to provide compression services at a specific location beyond the initial contract term, either through contract renewal or on a month-to-month or longer basis. USAC primarily enters into fixed-fee contracts whereby its customers are required to pay its monthly fee even during periods of limited or disrupted throughput. Services are generally billed monthly, one month in advance of the commencement of the service month, except for certain customers who are billed at the beginning of the service month, and payment is generally due 30 days after receipt of the invoice. Amounts invoiced in advance are recorded as deferred revenue until earned, at which time they are recognized as revenue. The applicationamount of these accounting policies allows certainconsideration USAC receives and revenue it recognizes is based upon the fixed fee rate stated in each service contract.
USAC’s retail parts and services revenue is earned primarily on freight and crane charges that are directly reimbursable by its customers and maintenance work on units at its customers’ locations that are outside the scope of our regulated entitiesUSAC’s core maintenance activities. Revenue from retail parts and services is recognized at the point in time the part is transferred or service is provided and control is transferred to defer expensesthe customer. At such time, the customer has the ability to direct the use of the benefits of such part or service after USAC has performed its services. USAC bills upon completion of the service or transfer of the parts, and revenuespayment is generally due 30 days after receipt of the invoice. The amount of consideration USAC receives and revenue it recognizes is based upon the invoice amount.
Lease Accounting. At the inception of each lease arrangement, we determine if the arrangement is a lease or contains an embedded lease and review the facts and circumstances of the arrangement to classify lease assets as operating or finance leases under Topic 842. The Partnership has elected not to record any leases with terms of 12 months or less on the balance sheet as regulatory assets and liabilities when it is probable that those expenses and revenues will be allowed in the ratemaking process in a period different from the period in which they would have been reflected in the consolidated statement of operations by an unregulated company. These deferred assets and liabilities will be reported in results of operations in the period in which the same amountssheet.
Balances related to operating leases are included in ratesoperating lease ROU assets, accrued and recovered from or refunded to customers. Management’s assessmentother current liabilities, operating lease current liabilities and non-current operating lease liabilities in our consolidated balance sheets. Finance leases represent a small portion of the probabilityactive lease agreements and are included in finance lease ROU assets, current maturities of recoverylong-term debt and long-term debt, less current maturities in our consolidated balance sheets. The ROU assets represent the Partnership’s right to use an underlying asset for the lease term and lease liabilities represent the obligation of the Partnership to make minimum lease payments arising from the lease for the duration of the lease term.
Most leases include one or pass throughmore options to renew, with renewal terms that can extend the lease term from one to 20 years or greater. The exercise of regulatorylease renewal options is typically at the sole discretion of the Partnership and lease extensions are evaluated on a lease-by-lease basis. Leases containing early termination clauses typically require the agreement of both parties to the lease. At the inception of a lease, all renewal options reasonably certain to be exercised are considered when determining the lease term. The depreciable life of lease assets and liabilities will require judgment and interpretationleasehold improvements are limited by the expected lease term.
To determine the present value of laws and regulatory commission orders. If, for any reason,future minimum lease payments, we cease to meetuse the criteria for application of regulatory accounting treatment for all or partimplicit rate when readily determinable. Presently, because many of our operations,leases do not provide an implicit rate, the regulatoryPartnership applies its incremental borrowing rate based on the information available at the lease commencement date to determine the present value of minimum lease payments. The operating and finance lease ROU assets include any lease payments made and liabilities relatedexclude lease incentives.
Minimum rent payments are expensed on a straight-line basis over the term of the lease. In addition, some leases require additional contingent or variable lease payments, which are based on the factors specific to those portions ceasing to meet such criteria would be assessedthe individual agreement. Variable lease payments the Partnership is typically responsible for include payment of real estate taxes, maintenance expenses and potentially eliminated from the consolidated balance sheet for the period in which the discontinuanceinsurance.
For short-term leases (leases that have term of regulatory accounting treatment occurs.twelve months or less upon commencement), lease payments are recognized on a straight-line basis and no ROU assets are recorded.
Accounting for Derivative Instruments and Hedging Activities. We utilize various exchange-traded and over-the-counterOTC commodity financial instrument contracts to limit our exposure to margin fluctuations in natural gas, NGL, crude oil and refined products. These contracts consist primarily of futures and swaps. In addition, prior to the contribution of our retail propane activities to AmeriGas, we used derivatives to limit our exposure to propane market prices.
If we designate a derivative financial instrument as a cash flow hedge and it qualifies for hedge accounting, the change in the fair value is deferred in AOCI until the underlying hedged transaction occurs. Any ineffective portion of a cash flow hedge’s change in fair value is recognized each period in earnings. Gains and losses deferred in AOCI related to cash flow hedges remain in AOCI until the underlying physical transaction occurs, unless it is probable that the forecasted transaction will not occur by the end of the originally specified time period or within an additional two-month period of time thereafter. For financial derivative instruments that do not qualify for hedge accounting, the change in fair value is recorded in cost of products sold in the consolidated statements of operations.
If we designate a hedging relationship as a fair value hedge, we record the changes in fair value of the hedged asset or liability in cost of products sold in our consolidated statement of operations. This amount is offset by the changes in fair value of the related hedging instrument. Any ineffective portion or amount excluded from the assessment of hedge ineffectiveness is also included in the cost of products sold in the consolidated statement of operations.
We utilize published settlement prices for exchange-traded contracts, quotes provided by brokers, and estimates of market prices based on daily contract activity to estimate the fair value of these contracts. Changes in the methods used to determine the fair value of these contracts could have a material effect on our results of operations. We do not anticipate future changes in the methods used to determine the fair value of these derivative contracts. See “Item 7A. Quantitative and Qualitative Disclosures about Market Risk” for further discussion regarding our derivative activities.
Fair Value of Financial Instruments. We have commodity derivatives, interest rate derivatives and embedded derivatives in our preferred units that are accounted for as assets and liabilities at fair value in our consolidated balance sheets. We determine the fair value of our assets and liabilities subject to fair value measurement by using the highest possible “level” of inputs. Level 1 inputs are observable quotes in an active market for identical assets and liabilities. We consider the valuation of marketable securities and commodity derivatives transacted through a clearing broker with a published price from the appropriate exchange as a Level 1 valuation. Level 2 inputs are inputs observable for similar assets and liabilities. We consider OTC commodity derivatives entered into directly with third parties as a Level 2 valuation since the values of these derivatives are quoted on an exchange for similar transactions. Additionally, we consider our options transacted through our clearing broker as having Level 2 inputs due to the level of activity of these contracts on the exchange in which they trade. We consider the valuation of our interest rate derivatives as Level 2 as the primary input, the LIBOR curve, is based on quotes from an active exchange of Eurodollar futures for the same period as the future interest swap settlements. Level 3 inputs are unobservable. Derivatives related to the embedded derivatives in our preferred units are valued using a binomial lattice model. The market inputs utilized in the model include credit spread, probabilities of the occurrence of certain events, common unit price, dividend yield, and expected value, and are considered level 3. See further information on our fair value assets and liabilities in Note 2 of our consolidated financial statements.
Impairment of Long-Lived Assets, Goodwill, Intangible Assets and Investments in Unconsolidated Affiliates. Long-lived assets are required to be tested for recoverability whenever events or changes in circumstances indicate that the carrying amount of the asset may not be recoverable. Goodwill and intangibles with indefinite lives must be tested for impairment annually or more frequently if events or changes in circumstances indicate that the related asset might be impaired. An impairment of an investment in an unconsolidated affiliate is recognized when circumstances indicate that a decline in the investment value is other than temporary. An impairment loss should be recognized only if the carrying amount of the asset/goodwill is not recoverable and exceeds its fair value.
In order to test for recoverability when performing a quantitative impairment test, we must make estimates of projected cash flows related to the asset, which include, but are not limited to, assumptions about the use or disposition of the asset, estimated remaining life of the asset, and future expenditures necessary to maintain the asset’s existing service potential. In order to determine fair value, we make certain estimates and assumptions, including, among other things, changes in general economic conditions in regions in which our markets are located, the availability and prices of natural gas, our ability to negotiate favorable sales agreements, the risks that natural gas exploration and production activities will not occur or be successful, our dependence on certain significant customers and producers of natural gas, and competition from other companies, including major energy producers. While we believe we have made reasonable assumptions to calculate the fair value, if future results are not consistent with our estimates, we could be exposed to future impairment losses that could be material to our results of operations.
The Partnership determined the fair value of its reporting units using a weighted combination of the discounted cash flow method and the guideline company method. Determining the fair value of a reporting unit requires judgment and the use of significant estimates and assumptions. Such estimates and assumptions include revenue growth rates, operating margins, weighted average costs of capital and future market conditions, among others. The Partnership believes the estimates and assumptions used in our impairment assessments are reasonable and based on available market information, but variations in any of the assumptions could result in materially different calculations of fair value and determinations of whether or not an impairment is indicated. Under the discounted cash flow method, the Partnership determined fair value based on estimated future cash flows of each reporting unit including estimates for capital expenditures, discounted to present value using the risk-adjusted industry rate, which reflect the overall level of inherent risk of the reporting unit. Cash flow projections are derived from one year budgeted amounts and five year operating forecasts plus an estimate of later period cash flows, all of which are evaluated by management. Subsequent period cash flows are developed for each reporting unit using growth rates that management believes are reasonably likely to occur. Under the guideline company method, the Partnership determined the estimated fair value of each of our reporting units by applying valuation multiples of comparable publicly-traded companies to each reporting unit’s projected EBITDA and then averaging that estimate with similar historical calculations using a three year average. In addition, the Partnership estimated a reasonable control
premium representing the incremental value that accrues to the majority owner from the opportunity to dictate the strategic and operational actions of the business.
One key assumption for the measurement of an impairment is management’s estimate of future cash flows and EBITDA. These estimates are based on the annual budget for the upcoming year and forecasted amounts for multiple subsequent years. The annual budget process is typically completed near the annual goodwill impairment testing date, and management uses the most recent information for the annual impairment tests. The forecast is also subjected to a comprehensive update annually in conjunction with the annual budget process and is revised periodically to reflect new information and/or revised expectations. The estimates of future cash flows and EBITDA are subjective in nature and are subject to impacts from the business risks described in “Item 1A. Risk Factors.” Therefore, the actual results could differ significantly from the amounts used for goodwill impairment testing, and significant changes in fair value estimates could occur in a given period. Such changes in fair value estimates could result in additional impairments in future periods; however, management does not believe that any of the goodwill balances in its reporting units as of December 31, 2017 is at significant risk of impairment. Therefore,therefore, the actual results could differ significantly from the amounts used for goodwill impairment testing, and significant changes in fair value estimates could occur in a given period, resulting in additional impairments.
Management does not believe that any of the goodwill balances in its reporting units is currently at significant risk of impairment; however, of the $3.1$4.90 billion of goodwill on the Partnership’s consolidated balance sheet as of December 31, 2017,2019, approximately $1.0 billion$380 million is recorded in reporting units for which the estimated fair value exceeded the carrying value by less than 20% in the most recent quantitative test.
During the year ended December 31, 2019, the Partnership recorded the following impairments:
A $12 million impairment was recorded related to the goodwill associated with the Partnership’s Southwest Gas operations within the interstate segment primarily due to decreases in projected future revenues and cash flows. Additionally, the Partnership recorded a $9 million impairment related to the goodwill associated with the Partnership’s North Central operations within the midstream segment primarily due to changes in assumptions related to projected future revenues and cash flows.
Sunoco LP recognized a $47 million write-down on assets held for sale related to its ethanol plant in Fulton, New York.
USAC also recognized a $6 million fixed asset impairment related to certain idle compressor assets.
During the year ended December 31, 2018, the Partnership recorded the following impairments:
a $378 million impairment was recorded related to the goodwill associated with the Partnership’s Northeast operations within the midstream segment primarily due to changes in assumptions related to projected future revenues and cash flows from the dates the goodwill was originally recorded. These changes in assumptions reflect delays in the construction of third-party takeaway capacity in the Northeast. Additionally, the Partnership recorded asset impairments of $4 million related to our midstream operations and asset impairments $9 million related to our crude operations idle leased assets.
| |
| • | Sunoco LP also recognized a $30 million impairment charge on its contractual rights primarily due to decreases in projected future revenues and cash flows from the date the intangible assets were originally recorded. |
USAC also recognized a $9 million fixed asset impairment related to certain idle compressor assets.
During the year ended December 31, 2017, the Partnership recorded the following impairments:
Aa $223 million impairment was recorded related to the goodwill associated with CDM. In January 2018, the Partnership announced the contribution of CDM to USAC. Based on the Partnership’s anticipated proceeds in the contribution transaction, the implied fair value of the CDM reporting unit was less than the Partnership’s carrying value. As the Partnership believes that the contribution consideration also represented an appropriate estimate of fair value as of the 2017 annual impairment test date, the Partnership recorded an impairment for the difference between the carrying value and the fair value of the reporting unit. Subsequent to the impairment, a total of $253 million of goodwill remains in the CDM reporting unit, which amount is subject to further impairment based on changes in the contribution transaction prior to closing or any other factors affecting the fair value of the CDM reporting unit. Assuming the contribution transaction closes, the remaining CDM goodwill balance will be derecognized; if the transaction does not close, then the CDM goodwill balance will remain on the Partnership’s consolidated balance sheet and will continue to be tested for impairment in the future.
Aa $262 million impairment was recorded related to the goodwill associated with the Partnership’s interstate transportation and storage reporting units, and a $229 million impairment was recorded related to the goodwill associated with the general partner of Panhandle in the all other segment. These impairments were due to a reduction in management’s forecasted future
cash flows from the related reporting units, which reduction reflected the impacts discussed in “Results of Operations” above, along with the impacts of re-contracting assumptions related to future periods.
| |
| • | a $79 million impairment was recorded related to the goodwill associated the Partnership’s refined products transportation and services reporting unit. Subsequent to the Sunoco Logistics Merger, the Partnership restructured the internal reporting of legacy Sunoco Logistics’ business to be consistent with the internal reporting of legacy ETO. Subsequent to this reallocation the carrying value of certain refined products reporting units was less than the estimated fair value due to a reduction in management’s forecasted future cash flows from the related reporting units, and the goodwill associated with those reporting units was fully impaired. No goodwill remained in the respective reporting units subsequent to the impairment. |
A $79 million impairment was recorded related to the goodwill associated the Partnership’s refined products transportation and services reporting unit. Subsequent to the Sunoco Logistics Merger, the Partnership restructured the internal reporting
116
| |
| • | a $127 million impairment of property, plant and equipment related to Sea Robin primarily due to a reduction in expected future cash flows due to an increase during 2017 in insurance costs related to offshore assets. |
A $127 million impairment of property, plant and equipment related to Sea Robin primarily due to a reduction in expected future cash flows due to an increase during 2017 in insurance costs related to offshore assets.
A $141 million impairment of the Partnership’s equity method investment in FEP. The Partnership concluded that the carrying value of its investment in FEP was other than temporarily impaired based on an anticipated decrease in production in the Fayetteville basin and a customer re-contracting with a competitor during 2017.
Aa $172 million impairment of the Partnership’s equity method investment in HPC primarily due to a decrease in projected future revenues and cash flows driven be the bankruptcy of one of HPC’s major customers in 2017 and an expectation that contracts expiring in the next few years will be renewed at lower tariff rates and lower volumes.
During the year ended December 31, 2016, the Partnership recorded following goodwill impairments:
A $638 million goodwill impairment and a $133 million impairment to property, plant and equipment were recorded in the interstate transportation and storage segment primarily due to decreases in projected future revenues and cash flows driven by changes in the markets that these assets serve.
A $32 million goodwill impairment was recorded in the midstream segment primarily due to decreases in projected future revenues and cash flows driven by declines in commodity prices.
A $308 million impairment of the Partnership’s equity method investment in MEP. The Partnership concluded that the carrying value of its investment in MEP was other than temporarily impaired based on commercial discussions with current and potential shippers on MEP during 2016, which negatively affected the outlook for long-term transportation contract rates.
During the year ended December 31, 2015, the Partnership recorded following goodwill impairments:
A $99 million goodwill impairment related to Transwestern primarily due to market declines in current and expected future commodity prices in the fourth quarter of 2015.
A $106 million goodwill impairment, a $24 million impairment of intangible assets, and a $110 million impairment to property, plant and equipment related to Lone Star Refinery Services primarily due to changes in assumptions related to potential future revenues and market declines in current and expected future commodity prices, as well as economic obsolescence identified as a result of low utilization. | |
| • | For 2017, Sunoco LP also recognized impairments of $404 million, of which $119 million was allocated to continuing operations, as discussed further below. |
Except for the 2017 impairment of the goodwill associated with CDM, as discussed above, the goodwill impairments recorded by the Partnership during the years ended December 31, 2017, 20162019, 2018 and 20152017 represented all of the goodwill within the respective reporting units.
During 2017, Sunoco LP announced the sale of a majority of the assets in its retail and Stripes reporting units. These reporting units include the retail operations in the continental United States but excludes the retail convenience store operations in Hawaii that comprise the Aloha reporting unit. Upon the classification of assets and related liabilities as held for sale, Sunoco LP’s management applied the measurement guidance in ASC 360, Property, Plant and Equipment, to calculate the fair value less cost to sell of the disposal group. In accordance with ASC 360-10-35-39, Sunoco LP’s management first tested the goodwill included within the disposal group for impairment prior to measuring the disposal group’s fair value less the cost to sell. In the determination of the classification of assets held for sale and the related liabilities, Sunoco LP’s management allocated a portion of the goodwill balance previously included in the Sunoco LP retail and Stripes reporting units to assets held for sale based on the relative fair values of the business to be disposed of and the portion of the respective reporting unit that will be retained in accordance with ASC 350-20-40-3.
Sunoco LP recognized goodwill impairments of $387 million in 2017, of which $102 million was allocated to continuing operations,primarily due to changes in assumptions related to projected future revenues and cash flows from the dates the goodwill was originally recorded.
Additionally, Sunoco LP performed impairment tests on its indefinite-lived intangible assets during the fourth quarter of 2017 and recognized a total of $17 million in impairment charges on their contractual rights and liquor licenses primarily due to decreases in projected future revenues and cash flows from the date the intangible assets were originally recorded.
Property, Plant and Equipment. Expenditures for maintenance and repairs that do not add capacity or extend the useful life are expensed as incurred. Expenditures to refurbish assets that either extend the useful lives of the asset or prevent environmental contamination are capitalized and depreciated over the remaining useful life of the asset. Additionally, we capitalize certain costs directly related to the construction of assets including internal labor costs, interest and engineering costs. Upon disposition or retirement of pipeline components or natural gas plant components, any gain or loss is recorded to accumulated depreciation. When entire pipeline systems, gas plants or other property and equipment are retired or sold, any gain or loss is included in the consolidated statement of operations. Depreciation of property, plant and equipment is provided using the straight-line method based on their estimated useful lives ranging from 1 to 99 years. Changes in the estimated useful lives of the assets could have a material effect on our results of operation. We do not anticipate future changes in the estimated useful lives of our property, plant and equipment.
Asset Retirement Obligations. We have determined that we are obligated by contractual or regulatory requirements to remove facilities or perform other remediation upon retirement of certain assets. The fair value of any ARO is determined based on estimates and assumptions related to retirement costs, which the Partnership bases on historical retirement costs, future inflation rates and credit-adjusted risk-free interest rates. These fair value assessments are considered to be Level 3 measurements, as they
are based on both observable and unobservable inputs. Changes in the liability are recorded for the passage of time (accretion) or for revisions to cash flows originally estimated to settle the ARO.
An ARO is required to be recorded when a legal obligation to retire an asset exists and such obligation can be reasonably estimated. We will record an asset retirement obligationARO in the periods in which management can reasonably estimate the settlement dates.
Except for certain amounts discussed below, management was not able to reasonably measure the fair value of asset retirement obligationsAROs as of December 31, 20172019 and 2016,2018, in most cases because the settlement dates were indeterminable. Although a number of other onshore assets in Panhandle’s system are subject to agreements or regulations that give rise to an ARO upon Panhandle’s discontinued use of these assets, AROs were not recorded because these assets have an indeterminate removal or abandonment date given the
expected continued use of the assets with proper maintenance or replacement. ETC Sunoco Inc. has legal asset retirement obligationsAROs for several other assets at its previously owned refineries, pipelines and terminals, for which it is not possible to estimate when the obligations will be settled. Consequently, the retirement obligations for these assets cannot be measured at this time. At the end of the useful life of these underlying assets, ETC Sunoco Inc. is legally or contractually required to abandon in place or remove the asset. We believe we may have additional asset retirement obligationsAROs related to itsETC Sunoco’s pipeline assets and storage tanks, for which it is not possible to estimate whether or when the retirement obligationsAROs will be settled. Consequently, these retirement obligationsAROs cannot be measured at this time. Sunoco LP has AROs related to the estimated future cost to remove underground storage tanks.
Individual component assets have been and will continue to be replaced, but the pipeline and the natural gas gathering and processing systems will continue in operation as long as supply and demand for natural gas exists. Based on the widespread use of natural gas in industrial and power generation activities, management expects supply and demand to exist for the foreseeable future. We have in place a rigorous repair and maintenance program that keeps the pipelines and the natural gas gathering and processing systems in good working order. Therefore, although some of the individual assets may be replaced, the pipelines and the natural gas gathering and processing systems themselves will remain intact indefinitely.
Long-livedOther non-current assets related to AROs aggregated $2on the Partnership’s consolidated balance sheet included $31 million and $14 million, and were reflected as property, plant and equipment on our balance sheet as of December 31, 2017 and 2016, respectively. In addition, the Partnership had $21 million and $13$26 million of legally restricted funds for the purpose of settling AROs that was reflected as other non-current assets as of December 31, 20172019 and 2016,2018, respectively.
Pensions and Other Postretirement Benefit Plans. We are required to measure plan assets and benefit obligations as of its fiscal year-end balance sheet date. We recognize the changes in the funded status of our defined benefit postretirement plans through AOCI or are reflected as a regulatory asset or regulatory liability for regulated subsidiaries.
The calculation of the net periodic benefit cost and benefit obligation requires the use of a number of assumptions. Changes in these assumptions can have a significant effect on the amounts reported in the financial statements. The Partnership believes that the two most critical assumptions are the assumed discount rate and the expected rate of return on plan assets.
The discount rate is established by using a hypothetical portfolio of high-quality debt instruments that would provide the necessary cash flows to pay the benefits when due. Net periodic benefit cost and benefit obligation increases and equity correspondingly decreases as the discount rate is reduced.
The expected rate of return on plan assets is based on long-term expectations given current investment objectives and historical results. Net periodic benefit cost increases as the expected rate of return on plan assets is correspondingly reduced.
Legal Matters. We are subject to litigation and regulatory proceedings as a result of our business operations and transactions. We utilize both internal and external counsel in evaluating our potential exposure to adverse outcomes from claims, orders, judgments or settlements. To the extent that actual outcomes differ from our estimates, or additional facts and circumstances cause us to revise our estimates, our earnings will be affected. We expense legal costs as incurred, and all recorded legal liabilities are revised, as required, as better information becomes available to us. The factors we consider when recording an accrual for contingencies include, among others: (i) the opinions and views of our legal counsel; (ii) our previous experience; and (iii) the decision of our management as to how we intend to respond to the complaints.
For more information on our litigation and contingencies, see Note 1110 to our consolidated financial statements included in “Item 8. Financial Statements and Supplementary Data” in this report.
Environmental Remediation Activities. The Partnership’s accrual for environmental remediation activities reflects anticipated work at identified sites where an assessment has indicated that cleanup costs are probable and reasonably estimable. The accrual for known claims is undiscounted and is based on currently available information, estimated timing of remedial actions and related inflation assumptions, existing technology and presently enacted laws and regulations. It is often extremely difficult to develop reasonable estimates of future site remediation costs due to changing regulations, changing technologies and their associated costs,
and changes in the economic environment. Engineering studies, historical experience and other factors are used to identify and evaluate remediation alternatives and their related costs in determining the estimated accruals for environmental remediation activities.
Losses attributable to unasserted claims are generally reflected in the accruals on an undiscounted basis, to the extent they are probable of occurrence and reasonably estimable. We have established a wholly-owned captive insurance company to bear certain risks associated with environmental obligations related to certain sites that are no longer operating. The premiums paid to the captive insurance company include estimates for environmental claims that have been incurred but not reported, based on an actuarially determined fully developed claims expense estimate. In such cases, we accrue losses attributable to unasserted claims based on the discounted estimates that are used to develop the premiums paid to the captive insurance company.
In general, each remediation site/issue is evaluated individually based upon information available for the site/issue and no pooling or statistical analysis is used to evaluate an aggregate risk for a group of similar items (e.g., service station sites) in determining the amount of probable loss accrual to be recorded. The Partnership’s estimates of environmental remediation costs also frequently involve evaluation of a range of estimates. In many cases, it is difficult to determine that one point in the range of loss estimates is more likely than any other. In these situations, existing accounting guidance requires that the minimum of the range be accrued. Accordingly, the low end of the range often represents the amount of loss which has been recorded.
In addition to the probable and estimable losses which have been recorded, management believes it is reasonably possible (i.e., less than probable but greater than remote) that additional The Partnership’s consolidated balance sheet reflected $317 million in environmental remediation losses will be incurred. Ataccruals as of December 31, 2017, the aggregate of the estimated maximum reasonably possible losses, which relate to numerous individual sites, totaled approximately $5 million. This estimate of reasonably possible losses comprises estimates for remediation activities at current logistics and retail assets and, in many cases, reflects the upper end of the loss ranges which are described above. Such estimates include potentially higher contractor costs for expected remediation activities, the potential need to use more costly or comprehensive remediation methods and longer operating and monitoring periods, among other things.2019.
Total future costs for environmental remediation activities will depend upon, among other things, the identification of any additional sites, the determination of the extent of the contamination at each site, the timing and nature of required remedial actions, the nature of operations at each site, the technology available and needed to meet the various existing legal requirements, the nature and terms of cost-sharing arrangements with other potentially responsible parties, the availability of insurance coverage, the nature and extent of future environmental laws and regulations, inflation rates, terms of consent agreements or remediation permits with regulatory agencies and the determination of the Partnership’s liability at the sites, if any, in light of the number, participation level and financial viability of the other parties. The recognition of additional losses, if and when they were to occur, would likely extend over many years. Management believes that the Partnership’s exposure to adverse developments with respect to any individual
site is not expected to be material. However, if changes in environmental laws or regulations occur or the assumptions used to estimate losses at multiple sites are adjusted, such changes could impact multiple facilities, formerly owned facilities and third-party sites at the same time. As a result, from time to time, significant charges against income for environmental remediation may occur; however, management does not believe that any such charges would have a material adverse impact on the Partnership’s consolidated financial position.
Deferred Income Taxes. ETPETO recognizes benefits in earnings and related deferred tax assets for net operating loss carryforwards (“NOLs”) and tax credit carryforwards. If necessary, a charge to earnings and a related valuation allowance are recorded to reduce deferred tax assets to an amount that is more likely than not to be realized by the Partnership in the future. Deferred income tax assets attributable to state and federal NOLs and federal tax alternative minimum tax credit carryforwards totaling $604$669 million have been included in ETP’sETO’s consolidated balance sheet as of December 31, 2017. All of the deferred income tax assets attributable to state and federal NOL benefits expire before 2037 as more fully described below.2019. The state NOL carryforward benefits of $266$120 million ($21095 million net of federal benefit) begin to expire in 20182019 with a substantial portion expiring between 2033 and 2039. ETP Holdco has federal NOLs of $2.65 billion ($557 million in benefits) of which $1.10 billion will expire between 2031 and 2037. TheAny federal NOLs of $1.57 billion ($331 millionNOL generated in benefits) will expire in 20312018 and 2037.future years can be carried forward indefinitely. Federal alternative minimum tax credit carryforwards of $62$15 million remained at December 31, 2017.2019. We have determined that a valuation allowance totaling $236$62 million ($18649 million net of federal income tax effects) is required for the state NOLs at December 31, 20172019 primarily due to significant restrictions on their use in the Commonwealth of Pennsylvania. In making the assessment of the future realization of the deferred tax assets, we rely on future reversals of existing taxable temporary differences, tax planning strategies and forecasted taxable income based on historical and projected future operating results. The potential need for valuation allowances is regularly reviewed by management. If it is more likely than not that the recorded asset will not be realized, additional valuation allowances which increase income tax expense may be recognized in the period such determination is made. Likewise, if it is more likely than not that additional deferred tax assets will be realized, an adjustment to the deferred tax asset will increase income in the period such determination is made.
Forward-Looking Statements
This annual report contains various forward-looking statements and information that are based on our beliefs and those of our General Partner, as well as assumptions made by and information currently available to us. These forward-looking statements are identified as any statement that does not relate strictly to historical or current facts. When used in this annual report, words such as “anticipate,” “project,” “expect,” “plan,” “goal,” “forecast,” “estimate,” “intend,” “could,” “believe,” “may,” “will” and similar expressions and statements regarding our plans and objectives for future operations, are intended to identify forward-looking statements. Although we and our General Partner believe that the expectations on which such forward-looking statements are based are reasonable, neither we nor our General Partner can give assurances that such expectations will prove to be correct. Forward-looking statements are subject to a variety of risks, uncertainties and assumptions. If one or more of these risks or uncertainties materialize, or if underlying assumptions prove incorrect, our actual results may vary materially from those anticipated, estimated, projected or expected. Among the key risk factors that may have a direct bearing on our results of operations and financial condition are:
the volumes transported on our pipelines and gathering systems;
the level of throughput in our processing and treating facilities;
the fees we charge and the margins we realize for our gathering, treating, processing, storage and transportation services;
the prices and market demand for, and the relationship between, natural gas and NGLs;
energy prices generally;
the prices of natural gas and NGLs compared to the price of alternative and competing fuels;
the general level of petroleum product demand and the availability and price of NGL supplies;
the level of domestic oil, natural gas and NGL production;
the availability of imported oil, natural gas and NGLs;
actions taken by foreign oil and gas producing nations;
the political and economic stability of petroleum producing nations;
the effect of weather conditions on demand for oil, natural gas and NGLs;
availability of local, intrastate and interstate transportation systems;
the continued ability to find and contract for new sources of natural gas supply;
availability and marketing of competitive fuels;
the impact of energy conservation efforts;
energy efficiencies and technological trends;
governmental regulation and taxation;
changes to, and the application of, regulation of tariff rates and operational requirements related to our interstate and intrastate pipelines;
hazards or operating risks incidental to the gathering, treating, processing and transporting of natural gas and NGLs;
competition from other midstream companies and interstate pipeline companies;
loss of key personnel;
loss of key natural gas producers or the providers of fractionation services;
reductions in the capacity or allocations of third-party pipelines that connect with our pipelines and facilities;
the effectiveness of risk-management policies and procedures and the ability of our liquids marketing counterparties to satisfy their financial commitments;
the nonpayment or nonperformance by our customers;
regulatory, environmental, political and legal uncertainties that may affect the timing and cost of our internal growth projects, such as our construction of additional pipeline systems;
risks associated with the construction of new pipelines and treating and processing facilities or additions to our existing pipelines and facilities, including difficulties in obtaining permits and rights-of-way or other regulatory approvals and the performance by third-party contractors;
the availability and cost of capital and our ability to access certain capital sources;
a deterioration of the credit and capital markets;
risks associated with the assets and operations of entities in which we own less than a controlling interests, including risks related to management actions at such entities that we may not be able to control or exert influence;
the ability to successfully identify and consummate strategic acquisitions at purchase prices that are accretive to our financial results and to successfully integrate acquired businesses;
changes in laws and regulations to which we are subject, including tax, environmental, transportation and employment regulations or new interpretations by regulatory agencies concerning such laws and regulations; and
the costs and effects of legal and administrative proceedings.
You should not put undue reliance on any forward-looking statements. When considering forward-looking statements, please review the risks described under “Item 1A. Risk Factors” in this annual report. Any forward-looking statement made by us in this Annual Report on Form 10-K is based only on information currently available to us and speaks only as of the date on which it is made. We undertake no obligation to publicly update any forward-looking statement, whether written or oral, that may be made from time to time, whether as a result of new information, future developments or otherwise.
Inflation
Interest rates on existing and future credit facilities and future debt offerings could be significantly higher than current levels, causing our financing costs to increase accordingly. Although increased financing costs could limit our ability to raise funds in the capital markets, we expect to remain competitive with respect to acquisitions and capital projects since our competitors would face similar circumstances.
Inflation in the United States has been relatively low in recent years and has not had a material effect on our results of operations. It may in the future, however, increase the cost to acquire or replace property, plant and equipment and may increase the costs of labor and supplies. Our operating revenues and costs are influenced to a greater extent by commodity price changes. To the extent permitted by competition, regulation and our existing agreements, we have and will continue to pass along a portion of increased costs to our customers in the form of higher fees.
ITEM 7A. QUANTITATIVE AND QUALITATIVE DISCLOSURES ABOUT MARKET RISK
We are exposed to market risks related to the volatility of commodity prices. To manage the impact of volatility from these prices, we utilize various exchange-traded and OTC commodity financial instrument contracts. These contracts consist primarily of futures, swaps and options and are recorded at fair value in our consolidated balance sheets.
We use futures and basis swaps, designated as fair value hedges, to hedge our natural gas inventory stored in our Bammel storage facility. At hedge inception, we lock in a margin by purchasing gas in the spot market or off peak season and entering into a financial contract. Changes in the spreads between the forward natural gas prices and the physical inventory spot price result in unrealized gains or losses until the underlying physical gas is withdrawn and the related designated derivatives are settled. Once the gas is withdrawn and the designated derivatives are settled, the previously unrealized gains or losses associated with these positions are realized.
We use futures, swaps and options to hedge the sales price of natural gas we retain for fees in our intrastate transportation and storage segment and operational gas sales on our interstate transportation and storage segment. These contracts are not designated as hedges for accounting purposes.
We use NGL and crude derivative swap contracts to hedge forecasted sales of NGL and condensate equity volumes we retain for fees in our midstream segment whereby our subsidiaries generally gather and process natural gas on behalf of producers, sell the resulting residue gas and NGL volumes at market prices and remit to producers an agreed upon percentage of the proceeds based on an index price for the residue gas and NGL. These contracts are not designated as hedges for accounting purposes.
We utilize swaps, futures and other derivative instruments to mitigate the risk associated with market movements in the price of refined products and NGLs to manage our storage facilities and the purchase and sale of purity NGL. These contracts are not designated as hedges for accounting purposes.
We use futures and swaps to achieve ratable pricing of crude oil purchases, to convert certain expected refined product sales to fixed or floating prices, to lock in margins for certain refined products and to lock in the price of a portion of natural gas purchases or sales. These contracts are not designated as hedges for accounting purposes.
We use financial commodity derivatives to take advantage of market opportunities in our trading activities which complement our transportation and storage segment’s operations and are netted in cost of products sold in our consolidated statements of operations. We also have trading and marketing activities related to power and natural gas in our all other segment which are also netted in cost of products sold. As a result of our trading activities and the use of derivative financial instruments in our transportation and storage segment, the degree of earnings volatility that can occur may be significant, favorably or unfavorably, from period to period. We attempt to manage this volatility through the use of daily position and profit and loss reports provided to our risk oversight committee, which includes members of senior management, and the limits and authorizations set forth in our commodity risk management policy.
The table below summarizes our commodity-related financial derivative instruments and fair values, including derivatives related to our consolidated subsidiaries, as well as the effect of an assumed hypothetical 10% change in the underlying price of the commodity. Dollar amounts are presented in millions.
| | | | December 31, 2017 | | December 31, 2016 | December 31, 2019 | | December 31, 2018 |
| | Notional Volume | | Fair Value Asset (Liability) | | Effect of Hypothetical 10% Change | | Notional Volume | | Fair Value Asset (Liability) | | Effect of Hypothetical 10% Change | Notional Volume | | Fair Value Asset (Liability) | | Effect of Hypothetical 10% Change | | Notional Volume | | Fair Value Asset (Liability) | | Effect of Hypothetical 10% Change |
| Mark-to-Market Derivatives | | | | | | | | | | | | | | | | | | | | | | |
| (Trading) | | | | | | | | | | | | | | | | | | | | | | |
| Natural Gas (BBtu): | | | | | | | | | | | | | | | | | | | | | | |
| Fixed Swaps/Futures | 1,078 |
| | $ | — |
| | $ | — |
| | (683 | ) | | $ | — |
| | $ | — |
| 1,483 |
| | $ | — |
| | $ | — |
| | 468 |
| | $ | — |
| | $ | — |
|
Basis Swaps IFERC/NYMEX(1) | 48,510 |
| | 2 |
| | 1 |
| | 2,243 |
| | (1 | ) | | — |
| (35,208 | ) | | 2 |
| | 5 |
| | 16,845 |
| | 7 |
| | 1 |
|
| Options – Puts | 13,000 |
| | — |
| | — |
| | — |
| | — |
| | — |
| — |
| | — |
| | — |
| | 10,000 |
| | — |
| | — |
|
| Power (Megawatt): | | | | | | | | | | | | | | | | | | | | | | |
| Forwards | 435,960 |
| | 1 |
| | 1 |
| | 391,880 |
| | (1 | ) | | 1 |
| 3,213,450 |
| | 6 |
| | 8 |
| | 3,141,520 |
| | 6 |
| | 8 |
|
| Futures | (25,760 | ) | | — |
| | — |
| | 109,564 |
| | — |
| | — |
| (353,527 | ) | | 1 |
| | 2 |
| | 56,656 |
| | — |
| | — |
|
| Options – Puts | (153,600 | ) | | — |
| | 1 |
| | (50,400 | ) | | — |
| | — |
| 51,615 |
| | 1 |
| | — |
| | 18,400 |
| | — |
| | — |
|
| Options – Calls | 137,600 |
| | — |
| | — |
| | 186,400 |
| | 1 |
| | — |
| (2,704,330 | ) | | 1 |
| | — |
| | 284,800 |
| | 1 |
| | — |
|
| Crude (MBbls) – Futures | — |
| | 1 |
| | — |
| | (617 | ) | | (4 | ) | | 6 |
| — |
| | — |
| | — |
| | — |
| | — |
| | — |
|
| (Non-Trading) | | | | | | | | | | | | | | | | | | | | | | |
| Natural Gas (BBtu): | | | | | | | | | | | | | | | | | | | | | | |
| Basis Swaps IFERC/NYMEX | 4,650 |
| | (13 | ) | | 4 |
| | 10,750 |
| | 2 |
| | — |
| (18,923 | ) | | (35 | ) | | 15 |
| | (30,228 | ) | | (52 | ) | | 13 |
|
| Swing Swaps IFERC | 87,253 |
| | (2 | ) | | 1 |
| | (5,663 | ) | | (1 | ) | | 1 |
| (9,265 | ) | | — |
| | 4 |
| | 54,158 |
| | 12 |
| | — |
|
| Fixed Swaps/Futures | (4,700 | ) | | (1 | ) | | 2 |
| | (52,653 | ) | | (27 | ) | | 19 |
| (3,085 | ) | | (1 | ) | | 1 |
| | (1,068 | ) | | 19 |
| | 1 |
|
| Forward Physical Contracts | (145,105 | ) | | 6 |
| | 41 |
| | (22,492 | ) | | 1 |
| | 8 |
| (13,364 | ) | | 3 |
| | 3 |
| | (123,254 | ) | | (1 | ) | | 32 |
|
| Natural Gas Liquid (MBbls) – Forwards/Swaps | 6,679 |
| | 1 |
| | 25 |
| | (5,787 | ) | | (40 | ) | | 35 |
| |
| NGL (MBbls) – Forwards/Swaps | | (1,300 | ) | | (18 | ) | | 18 |
| | (2,135 | ) | | 67 |
| | 67 |
|
| Crude (MBbls) – Forwards/Swaps | | 4,465 |
| | 13 |
| | 2 |
| | 20,888 |
| | (60 | ) | | 29 |
|
| Refined Products (MBbls) – Futures | (3,783 | ) | | (25 | ) | | 4 |
| | (2,240 | ) | | (16 | ) | | 17 |
| (2,473 | ) | | (2 | ) | | 16 |
| | (1,403 | ) | | (8 | ) | | 6 |
|
| Corn (thousand bushels) | | (1,210 | ) | | — |
| | — |
| | (1,920 | ) | | — |
| | 1 |
|
| Fair Value Hedging Derivatives | | | | | | | | | | | | | | | | | | | | | | |
| (Non-Trading) | | | | | | | | | | | | | | | | | | | | | | |
| Natural Gas (BBtu): | | | | | | | | | | | | | | | | | | | | | | |
| Basis Swaps IFERC/NYMEX | (39,770 | ) | | (2 | ) | | — |
| | (36,370 | ) | | 2 |
| | 1 |
| (31,780 | ) | | 1 |
| | 7 |
| | (17,445 | ) | | (4 | ) | | — |
|
| Fixed Swaps/Futures | (39,770 | ) | | 14 |
| | 11 |
| | (36,370 | ) | | (26 | ) | | 14 |
| (31,780 | ) | | 23 |
| | 7 |
| | (17,445 | ) | | (10 | ) | | 6 |
|
| |
(1) | Includes aggregate amounts for open positions related to Houston Ship Channel, Waha Hub, NGPL TexOk, West Louisiana Zone and Henry Hub locations. |
The fair values of the commodity-related financial positions have been determined using independent third-party prices, readily available market information and appropriate valuation techniques. Non-trading positions offset physical exposures to the cash market; none of these offsetting physical exposures are included in the above tables. Price-risk sensitivities were calculated by assuming a theoretical 10% change (increase or decrease) in price regardless of term or historical relationships between the contractual price of the instruments and the underlying commodity price. Results are presented in absolute terms and represent a potential gain or loss in net income or in other comprehensive income. In the event of an actual 10% change in prompt month
natural gas prices, the fair value of our total derivative portfolio may not change by 10% due to factors such as when the financial instrument settles and the location to which the financial instrument is tied (i.e., basis swaps) and the relationship between prompt month and forward months.
Interest Rate Risk
As of December 31, 2017,2019, we and our subsidiaries had $5.11$7.38 billion of floating rate debt outstanding. A hypothetical change of 100 basis points would result in a maximum potential change to interest expense of $51$74 million annually; however, our actual
change in interest expense may be less in a given period due to interest rate floors included in our variable rate debt instruments. We manage a portion of our interest rate exposure by utilizing interest rate swaps, including forward-starting interest rate swaps to lock-in the rate on a portion of anticipated debt issuances.
The following table summarizes our interest rate swaps outstanding, none of which were designated as hedges for accounting purposes:purposes (dollar amounts presented in millions):
|
| | | | | | | | | | |
| Term | | Type(1) | | Notional Amount Outstanding |
| December 31, 2017 | | December 31, 2016 |
July 2017(2) | | Forward-starting to pay a fixed rate of 3.90% and receive a floating rate | | $ | — |
| | $ | 500 |
|
July 2018(2) | | Forward-starting to pay a fixed rate of 3.76% and receive a floating rate | | 300 |
| | 200 |
|
July 2019(2) | | Forward-starting to pay a fixed rate of 3.64% and receive a floating rate | | 300 |
| | 200 |
|
July 2020(2) | | Forward-starting to pay a fixed rate of 3.52% and receive a floating rate | | 400 |
| | — |
|
| December 2018 | | Pay a floating rate based on a 3-month LIBOR and receive a fixed rate of 1.53% | | 1,200 |
| | 1,200 |
|
| March 2019 | | Pay a floating rate based on a 3-month LIBOR and receive a fixed rate of 1.42% | | 300 |
| | 300 |
|
|
| | | | | | | | | | |
| Term | | Type(1) | | Notional Amount Outstanding |
| December 31, 2019 | | December 31, 2018 |
| March 2019 | | Pay a floating rate and receive a fixed rate of 1.42% | | $ | — |
| | $ | 300 |
|
July 2019 (2) | | Forward-starting to pay a fixed rate of 3.56% and receive a floating rate | | — |
| | 400 |
|
July 2020 (2)(3) | | Forward-starting to pay a fixed rate of 3.52% and receive a floating rate | | 400 |
| | 400 |
|
July 2021 (2) | | Forward-starting to pay a fixed rate of 3.55% and receive a floating rate | | 400 |
| | 400 |
|
July 2022 (2) | | Forward-starting to pay a fixed rate of 3.80% and receive a floating rate | | 400 |
| | — |
|
| |
(1) | Floating rates are based on 3-month LIBOR. |
| |
(2) | Represents the effective date. These forward-starting swaps have terms of 30 years with a mandatory termination date the same as the effective date. |
| |
(3) | The July 2020 interest rate swaps were terminated in January 2020. |
A hypothetical change of 100 basis points in interest rates for these interest rate swaps would result in a net change in the fair value of interest rate derivatives and earnings (recognized in gains and losses(losses) on interest rate derivatives) of $236$327 million as of December 31, 2017. For the $1.50 billion of interest rate swaps whereby we pay a floating rate and receive a fixed rate, a hypothetical change of 100 basis points in interest rates would result in a net change in annual cash flows of $15 million.2019. For the forward-starting interest rate swaps, a hypothetical change of 100 basis points in interest rates would not affect cash flows until the swaps are settled.
Credit Risk
Credit risk refers to the risk that a counterparty may default on its contractual obligations resulting in a loss to the Partnership. Credit policies have been approved and implemented to govern the Partnership’s portfolio of counterparties with the objective of mitigating credit losses. These policies establish guidelines, controls and limits to manage credit risk within approved tolerances by mandating an appropriate evaluation of the financial condition of existing and potential counterparties, monitoring agency credit ratings, and by implementing credit practices that limit exposure according to the risk profiles of the counterparties. Furthermore, the Partnership may, at times, require collateral under certain circumstances to mitigate credit risk as necessary. The Partnership also uses industry standard commercial agreements which allow for the netting of exposures associated with transactions executed under a single commercial agreement. Additionally, we utilize master netting agreements to offset credit exposure across multiple commercial agreements with a single counterparty or affiliated group of counterparties.
The Partnership’s counterparties consist of a diverse portfolio of customers across the energy industry, including petrochemical companies, commercial and industrials,industrial end-users, oil and gas producers, municipalities, gas and electric utilities, midstream companies and independent power generators. Our overall exposure may be affected positively or negatively by macroeconomic or regulatory changes that impact our counterparties to one extent or another. Currently, management does not anticipate a material adverse effect in our financial position or results of operations as a consequence of counterparty non-performance.
For financial instruments, failure of a counterparty to perform on a contract could result in our inability to realize amounts that have been recorded on our consolidated balance sheets and recognized in net income or other comprehensive income.
ITEM 8. FINANCIAL STATEMENTS AND SUPPLEMENTARY DATA
The financial statements starting on page F-1 of this report are incorporated by reference.
ITEM 9. CHANGES IN AND DISAGREEMENTS WITH ACCOUNTANTS ON ACCOUNTING
AND FINANCIAL DISCLOSURE
None.
ITEM 9A. CONTROLS AND PROCEDURES
Evaluation of Disclosure Controls and Procedures
An evaluation was performed under the supervision and with the participation of our management, including the Chief Executive Officer and Chief Financial Officer of ETP LLC, of the effectiveness of the design and operation of our disclosure controls and procedures (as such terms are defined in Rules 13a–15(e) and 15d–15(e) of the Exchange Act) as of the end of the period covered by this report. Based upon that evaluation, management, including the Chief Executive Officer and Chief Financial Officer of ETP LLC, concluded that our disclosure controls and procedures were adequate and effective as of December 31, 20172019.
Management’s Report on Internal Control over Financial Reporting
The management of Energy Transfer Partners,Operating, L.P. and subsidiaries is responsible for establishing and maintaining adequate internal control over financial reporting, as such term is defined in Exchange Act Rule 13a-15(f). Under the supervision and with the participation of our management, including the Chief Executive Officer and Chief Financial Officer of ETP LLC, we conducted an evaluation of the effectiveness of our internal control over financial reporting based on the framework in the 2013 Internal Control – Integrated Framework issued by the Committee of Sponsoring Organizations of the Treadway Commission (“COSO framework”).
Based on our evaluation under the COSO framework, our management concluded that our internal control over financial reporting was effective as of December 31, 2017.2019.
Grant Thornton LLP, an independent registered public accounting firm, has audited the effectiveness of our internal control over financial reporting as of December 31, 2017, as stated in their report, which is included herein.
REPORT OF INDEPENDENT REGISTERED PUBLIC ACCOUNTING FIRM
Board of Directors of Energy Transfer Partners, L.L.C. and
Unitholders of Energy Transfer Partners, L.P.
Opinion on internal control over financial reporting
We have audited the internal control over financial reporting of Energy Transfer Partners, L.P. (a Delaware limited partnership) and subsidiaries (the “Partnership”) as of December 31, 2017, based on criteria established in the 2013 Internal Control – Integrated Framework issued by the Committee of Sponsoring Organizations of the Treadway Commission (“COSO”). In our opinion, the Partnership maintained, in all material respects, effective internal control over financial reporting as of December 31, 2017, based on criteria established in the 2013 Internal Control – Integrated Framework issued by COSO.
We also have audited, in accordance with the standards of the Public Company Accounting Oversight Board (United States) (“PCAOB”), the consolidated financial statements of the Partnership as of and for the year ended December 31, 2017, and our report dated February 23, 2018 expressed an unqualified opinion on those financial statements.
Basis for opinion
The Partnership’s management is responsible for maintaining effective internal control over financial reporting and for its assessment of the effectiveness of internal control over financial reporting, included in the accompanying Management’s Report on Internal Control over Financial Reporting. Our responsibility is to express an opinion on the Partnership’s internal control over financial reporting based on our audit.
We are a public accounting firm registered with the PCAOB and are required to be independent with respect to the Partnership in accordance with the U.S. federal securities laws and the applicable rules and regulations of the Securities and Exchange Commission and the PCAOB.
We conducted our audit in accordance with the standards of the PCAOB. Those standards require that we plan and perform the audit to obtain reasonable assurance about whether effective internal control over financial reporting was maintained in all material respects. Our audit included obtaining an understanding of internal control over financial reporting, assessing the risk that a material weakness exists, testing and evaluating the design and operating effectiveness of internal control based on the assessed risk, and performing such other procedures as we considered necessary in the circumstances. We believe that our audit provides a reasonable basis for our opinion.
Definition and limitations of internal control over financial reporting
A company’s internal control over financial reporting is a process designed to provide reasonable assurance regarding the reliability of financial reporting and the preparation of financial statements for external purposes in accordance with generally accepted accounting principles. A company’s internal control over financial reporting includes those policies and procedures that (1) pertain to the maintenance of records that, in reasonable detail, accurately and fairly reflect the transactions and dispositions of the assets of the company; (2) provide reasonable assurance that transactions are recorded as necessary to permit preparation of financial statements in accordance with generally accepted accounting principles, and that receipts and expenditures of the company are being made only in accordance with authorizations of management and directors of the company; and (3) provide reasonable assurance regarding prevention or timely detection of unauthorized acquisition, use, or disposition of the company’s assets that could have a material effect on the financial statements.
Because of its inherent limitations, internal control over financial reporting may not prevent or detect misstatements. Also, projections of any evaluation of effectiveness to future periods are subject to the risk that controls may become inadequate because of changes in conditions, or that the degree of compliance with the policies or procedures may deteriorate.
/s/ GRANT THORNTON LLP
Dallas, Texas
February 23, 2018
Changes in Internal Control over Financial Reporting
There has been no change in our internal control over financial reporting (as defined in Rules 13a–15(f) or Rule 15d–15(f)) that occurred in the three months ended December 31, 20172019 that has materially affected, or is reasonably likely to materially affect, our internal control over financial reporting.
ITEM 9B. OTHER INFORMATION
None.
PART III
ITEM 10. DIRECTORS, EXECUTIVE OFFICERS AND CORPORATE GOVERNANCE
Board of Directors
Our General Partner, manages and directs all of our activities. On April 28, 2017, concurrent with the merger of legacy ETP and legacy Sunoco Logistics, the general partner of legacy Sunoco Logistics, Sunoco Partners LLC, merged with and into the general partner of legacy ETP, Energy Transfer Partners GP, L.P. (“ETP GP”), with ETP GP surviving as the new general partnermanages and directs all of the Partnership.our activities. The activities of ETP GP are managed and directed by its general partner, ETP LLC, which we refer to in this Item as “our General Partner.” Our officers and directors are officers and directors of ETP LLC. ETE,ET, as the sole member of ETP LLC, is entitled under the limited liability company agreement of ETP LLC to appoint all of the directors of ETP LLC. This agreement provides that the Board of Directors of ETP LLC shall consist of not more than 13 persons, at least three of whom are required to qualify as independent directors.
As of December 31, 2017,January 1, 2020, our Board of Directors wasis comprised of six persons, three of whom qualified as “independent” under the NYSE’s corporate governance standards. Our Board of Directors determined that Messrs. Collins, GrimmSmith, Skidmore and SkidmoreWilliams all met the NYSE’s independence requirements. Our current directors who are not independent consist of Kelcy L. Warren, ETP LLC’s Chief Executive Officer, and Matthew S. Ramsey, ETP LLC’s President and Chief Operating Officer as well asand Marshall S. McCrea, III, the Group Chief Operating Officer andETP LLC’s Chief Commercial Officer of ETE’s general partner.Officer.
As a limited partnership, we are not required by the rules of the NYSE to seek Unitholder approval for the election of any of our directors. We believe that ETEET has appointed as directors individuals with experience, skills and qualifications relevant to the business of the Partnership, such as experience in energy or related industries or with financial markets, expertise in natural gas operations or finance, and a history of service in senior leadership positions. We do not have a formal process for identifying director nominees, nor do we have a formal policy regarding consideration of diversity in identifying director nominees, but we believe ETEET has endeavored to assemble a group of individuals with the qualities and attributes required to provide effective oversight of the Partnership.
Board Leadership Structure. We have no policy requiring either that the positions of the Chairman of the Board and the Chief Executive Officer, or CEO, be separate or that they be occupied by the same individual. The Board of Directors believes that this issue is properly addressed as part of the succession planning process and that a determination on this subject should be made when it elects a new chief executive officer or at such other times as when consideration of the matter is warranted by circumstances. Currently, the Board of Directors believes that the CEO is best situated to serve as Chairman because he is the director most familiar with the Partnership’s business and industry, and most capable of effectively identifying strategic priorities and leading the discussion and execution of strategy. Independent directors and management have different perspectives and roles in strategy development. Our independent directors bring experience, oversight and expertise from outside the Partnership and from a variety of industries, while the CEO brings extensive experience and expertise specifically related to the Partnership’s business. The Board of Directors believes that the current combined role of Chairman and CEO promotes strategy development and execution, and facilitates information flow between management and the Board of Directors, which are essential to effective governance.
One of the key responsibilities of the Board of Directors is to develop strategic direction and hold management accountable for the execution of strategy once it is developed. The Board of Directors believes the current combined role of Chairman and CEO, together with a majority of independent board members, is in the best interest of Unitholders because it provides the appropriate balance between strategy development and independent oversight of management.
Risk Oversight. Our Board of Directors generally administers its risk oversight function through the board as a whole. Our CEO, who reports to the Board of Directors, and the other executive officers, who report to our CEO, have day-to-day risk management responsibilities. Each of these executives attends the meetings of our Board of Directors, where the Board of Directors routinely receives reports on our financial results, the status of our operations, and other aspects of implementation of our business strategy, with ample opportunity for specific inquiries of management. In addition, at each regular meeting of the Board, management provides a report of the Partnership’s financial and operational performance, which often prompts questions or feedback from the Board of Directors. The Audit Committee provides additional risk oversight through its quarterly meetings, where it receives a report from the Partnership’s internal auditor, who reports directly to the Audit Committee, and reviews the Partnership’s contingencies with management and our independent auditors.
Corporate Governance
The Board of Directors has adopted both a Code of Business Conduct and Ethics applicable to our directors, officers and employees, and Corporate Governance Guidelines for directors and the Board. Current copies of our Code of Business Conduct and Ethics, Corporate Governance Guidelines and charters of the Audit and Compensation Committees of our Board of Directors are available on our website at www.energytransfer.com and will be provided in print form to any Unitholder requesting such information.www.energytransfer.com.
Please note that the preceding Internet address is for information purposes only and is not intended to be a hyperlink. Accordingly, no information found and/or provided at such Internet addresses or at our website in general is intended or deemed to be incorporated by reference herein.
Annual Certification
In 2017,2019, our CEO provided to the NYSE the annual CEO certification regarding our compliance with the NYSE corporate governance listing standards.
Conflicts Committee
Our Partnership Agreement provides that the Board of Directors may, from time to time, appoint members of the Board to serve on the Conflicts Committee with the authority to review specific matters for which the Board of Directors believes there may be a conflict of interest in order to determine if the resolution of such conflict proposed by the General Partner is fair and reasonable to the Partnership and its Unitholders. As a policy matter, the Conflicts Committee generally reviews any proposed related-party transaction that may be material to the Partnership to determine if the transaction presents a conflict of interest and whether the transaction is fair and reasonable to the Partnership. Pursuant to the terms of our partnership agreement,Partnership Agreement, any matters approved by the Conflicts Committee will be conclusively deemed to be fair and reasonable to the Partnership, approved by all partners of the Partnership and not a breach by the General Partner or its Board of Directors of any duties they may owe the Partnership or the Unitholders. These duties are limited by our Partnership Agreement (see “Risks Related to Conflicts of Interest” in “Item 1A. Risk Factors” in this annual report).
Audit Committee
The Board of Directors has established an Audit Committee in accordance with Section 3(a)(58)(A) of the Exchange Act. The Board of Directors appoints persons who are independent under the NYSE’s standards for audit committee members to serve on its Audit Committee. In addition, the Board determines that at least one member of the Audit Committee has such accounting or related financial management expertise sufficient to qualify such person as the audit committee financial expert in accordance with Item 407 (d)(5) of Regulation S-K. The Board has determined that based on relevant experience, Audit Committee member David K. Skidmore qualified as Audit Committee financial expert during 2017.2019. A description of the qualifications of Mr. Skidmore may be found elsewhere in this Item under “Directors and Executive Officers of our General Partner.”
The Audit Committee meets on a regularly scheduled basis with our independent accountants at least four times each year and is available to meet at their request. The Audit Committee has the authority and responsibility to review our external financial reporting, review our procedures for internal auditing and the adequacy of our internal accounting controls, consider the qualifications and independence of our independent accountants, engage and direct our independent accountants, including the letter of engagement and statement of fees relating to the scope of the annual audit work and special audit work which may be recommended or required by the independent accountants, and to engage the services of any other advisors and accountants as the Audit Committee deems advisable. The Audit Committee reviews and discusses the audited financial statements with management, discusses with our independent auditors matters required to be discussed by auditing standards, and makes recommendations to the Board of Directors relating to our audited financial statements. The Audit Committee periodically recommends to the Board of Directors any changes or modifications to its charter that may be required. The Board of Directors adopts the charter for the Audit Committee. In February 2018, W. BrettMessrs. Skidmore, Smith was appointed to the Board of Directors and the Audit Committee to replace Mr. Collins. Messrs. Grimm and Skidmore alsoWilliams currently serve on the Audit Committee. Mr. Collins served on the Audit Committee until he passed away on January 28, 2018.
Compensation and Nominating/Corporate Governance Committees
Although weWe are not required under NYSE rules to appoint a Compensation Committeecompensation committee or a Nominating/Corporate Governance Committeenominating/corporate governance committee because we are a limited partnership,partnership; however, our Board of Directors haspreviously established a Compensation Committee to establish standards and make recommendations concerning the compensation of our officers and directors. In addition,Following the Energy Transfer Merger, the duties of the ETO compensation committee have been delegated to the Compensation Committee determines and establishes the standards for any awards to our employees and officers under the equity compensation plans adopted by our Unitholders, including the performance standards or other restrictions pertaining to the vesting of any such awards. Pursuant to the charter of the Compensation Committee, a director serving as a member of the Compensation Committee may not be an officer of or employed by the General Partner, the Partnership or its subsidiaries. Michael K. Grimm and David K. Skidmore serve as the members of the Compensation Committee and Mr. Grimm serves as the chairman of the Compensation Committee. Our Board of Directors has determined that both Messrs. Grimm and Skidmore are “independent” (as that term is defined in the applicable NYSE corporate governance standards).ET.
The Compensation Committee’s responsibilities include, among other duties, the following:
annually review and approve goals and objectives relevant to compensation of the CEO, if applicable;
annually evaluate the CEO’s performance in light of these goals and objectives, and make recommendations to the Board of Directors with respect to the CEO’s compensation levels, if applicable, based on this evaluation;
based on input from, and discussion with, the CEO, make recommendations to the Board of Directors with respect to non-CEO executive officer compensation, including incentive compensation and compensation under equity- based plans;
make determinations with respect to the grant of equity-based awards to executive officers under our equity incentive plans;
periodically evaluate the terms and administration of ETP’s short-term and long-term incentive plans to assure that they are structured and administered in a manner consistent with ETP’s goals and objectives;
periodically evaluate incentive compensation and equity-related plans and consider amendments, if appropriate;
periodically evaluate the compensation of the directors;
retain and terminate any compensation consultant to be used to assist in the evaluation of director, CEO or executive officer compensation; and
perform other duties as deemed appropriate by the Board of Directors.
Matters relating to the nomination of directors or corporate governance matters are addressed to and determined by the full Board of Directors.
Code of Business Conduct and Ethics
The Board of Directors has adopted a Code of Business Conduct and Ethics applicable to our officers, directors and employees. Specific provisions are applicable to the principal executive officer, principal financial officer, principal accounting officer and controller, or those persons performing similar functions, of our General Partner. Amendments to, or waivers from, the Code of Business Conduct and Ethics will be available on our website and reported as may be required under SEC rules. Any technical, administrative or other non-substantive amendments to the Code of Business Conduct and Ethics may not be posted.
Meetings of Non-management Directors and Communications with Directors
Our non-management directors meet in regularly scheduled sessions. The Chairman of each of our Audit and Compensation Committee alternateacts as the presiding director of such meetings.
We have established a procedure by which Unitholders or interested parties may communicate directly with the Board of Directors, any committee of the Board, any independent directors, or any one director serving on the Board of Directors by sending written correspondence addressed to the desired person or entity to the attention of our General Counsel at Energy Transfer Partners,Operating, L.P., 8111 Westchester Drive, Suite 600, Dallas, Texas 75225 or generalcounsel@energytransfer.com. Communications are distributed to the Board of Directors, or to any individual director or directors as appropriate, depending on the facts and circumstances outlined in the communication.
Directors and Executive Officers of Our General Partner
The following table sets forth certain information with respect to the executive officers and members of the Board of Directors of our General Partner as of February 23, 2018.21, 2020. Executive officers and directors are elected for one-year terms.
|
| | | | | |
| Name | | Age |
| | Position with Our General Partner |
| Kelcy L. Warren | | 6264 |
| | Chief Executive Officer and Chairman of the Board of Directors |
| Matthew S. Ramsey | | 6264 |
| | Director, President and Chief Operating Officer |
| Thomas E. Long | | 6163 |
| | Chief Financial Officer |
| Marshall S. (Mackie) McCrea, III | | 5860 |
| | Director and ETE Group Chief Operating OfficerET President and Chief Commercial Officer |
| James M. Wright, Jr. | | 4951 |
| | General Counsel |
| A. Troy Sturrock | | 4749 |
| | Senior Vice President, Controller and Principal Accounting Officer |
Ray C. Davis | | 76 |
| | Director |
Michael K. Grimm | | 63 |
| | Director |
| David K. Skidmore | | 6264 |
| | Director |
| W. Brett Smith | | 5860 |
| | Director |
| William P. Williams | | 82 |
| | Director |
Messrs. Warren, McCrea and Ramsey also serve as directors of ETE’sET’s general partner.
the board of the general partner of Sunoco LP, and Mr. Ted Collins, Jr. servedLong serves as a director until he passed away on January 28, 2018. Messrs. Davis and Smith were appointed toof the Boardboard of Directors in February, 2018.the general partner of Sunoco LP.
Set forth below is biographical information regarding the foregoing officers and directors of our General Partner:
Kelcy L. Warren. Mr. Warren is the Chief Executive Officer and Chairman of the Board of Directors of the general partner of ETP.ETO. Mr. Warren also serves as Chairman of the Board of Directors of theET’s general partner of Energy Transfer Equity, L. P.partner. Mr. Warren also served as the Chief Executive Officer of PennTex Midstream Partners, LP’s general partner from November 2016 to July 2017. Prior to the combination of the operations of ETPETO and Heritage Propane in 2004, Mr. Warren co-founded the entities that acquired and operated the midstream assets that were contributed in the merger. From 1996 to 2000, Mr. Warren served as a Director of Crosstex Energy, Inc. and from 1993 to 1996, he served as President, Chief Operating Officer and a Director of Cornerstone Natural Gas, Inc. Mr. Warren has more than 30 years of business experience in the energy industry. The member of our general partner selected Mr. Warren to serve as a director and as Chairman because he is the Partnership’s Chief Executive Officer and has more than 30 years in the natural gas industry. Mr. Warren also has relationships with chief executives and other senior management at natural gas transportation companies throughout the United States, and brings a unique and valuable perspective to the Board of Directors.
Matthew S. Ramsey. Mr. Ramsey was appointed as a director of ETE’sET’s general partner in July 2012 and as a director of ETP’sETO’s general partner in November 2015. Mr. Ramsey was named President and Chief Operating Officer of ETP’sETO’s general partner in November 2015. He became the Chief Operating Officer of ET’s general partner in October 2018 following the merger of Energy Transfer Equity, L.P. and Energy Transfer Partners, L.P. Mr. Ramsey is also a director of Sunoco LP, servinghaving served as chairman of Sunoco LP’s board since April 2015.2015, and of USAC, having served on that board since April 2018. Mr. Ramsey also served as President and Chief Operating Officer and Chairman of the board of directors of PennTex Midstream Partners, LP’s general partner, from November 2016 to July 2017. Mr. Ramsey previously served as President of RPM Exploration, Ltd., a private oil and gas exploration partnership, generating and drilling 3-D seismic prospects on the Gulf Coast of Texas. Mr. Ramsey is currentlypreviously served as a director of RSP Permian, Inc. (NYSE: RSPP), where he serves as chairman of the compensation committee and as a member ofserved on the audit committee.and compensation committees. Mr. Ramsey formerly served as President of DDD Energy, Inc. until its sale in 2002. From 1996 to 2000, Mr. Ramsey served as President and Chief Executive Officer of OEC Compression Corporation, Inc., a publicly traded oil field service company, providing gas compression services to a variety of energy clients. Previously, Mr. Ramsey served as Vice President of Nuevo Energy Company, an independent energy company. Additionally, he was employed by Torch Energy Advisors, Inc., a company providing management and operations services to energy companies including Nuevo Energy, last serving as Executive Vice President. Mr. Ramsey joined Torch Energy as Vice President of Land and was named Senior Vice President of Land in 1992.
Mr. Ramsey holds a B.B.A. in Marketing from the University of Texas at Austin and a J.D. from South Texas College of Law. Mr. Ramsey is a graduate of Harvard Business School Advanced Management Program. Mr. Ramsey is licensed to practice law in the State of Texas. He is qualified to practice in the Western District of Texas and the United States Court of Appeals for the Fifth Circuit. Mr. Ramsey formerly served as a director of Southern Union Company. The member of our General Partnergeneral partner recognize Mr. Ramsey’s vast experience in the oil and gas space and believe that he provides valuable industry insight as a member of our Board of Directors.
Thomas E. Long. Mr. Long ishas served as the Group Chief Financial Officer of ETEour general partner since February 2016.2016 and a director of our general partner since April 2019. He also joined the Board of Directors of ET’s general partner in April 2019. Mr. Long also served as the Chief Financial Officer and as a director of PennTex Midstream Partners, LP’s general partner from November 2016 to July 2017. Mr. Long has served as a director of Sunoco LP since May 2016. Mr. Long previously servedalso serves as Chief Financial Officer of our General Partner since April 2015ETO and aswas previously Executive Vice President and Chief Financial Officer of Regency GP LLC from November 2010 to April 2015. From May 2008 to November 2010, Mr. Long served as Vice President and Chief Financial Officer of Matrix Service Company. Prior to joining Matrix, he served as Vice President and Chief Financial Officer of DCP Midstream Partners, LP, a publicly traded natural gas and natural gas liquids midstream business company located in Denver, CO.Colorado. In that position, he was responsible for all financial aspects of the company since its formation in December 2005. From 1998 to 2005, Mr. Long served in several executive positions with subsidiaries of Duke Energy Corp., one of the nation’s largest electric power companies. Mr. Long has served as a director of Sunoco LP since May 2016, and as Chairman of the Board of USAC since April 2018.
Marshall S. (Mackie) McCrea, III. Mr. McCrea is the President and Chief Commercial Officer of our general partner, having served in that role since October 2018 following the merger of Energy Transfer Equity, L.P. and Energy Transfer Partners, L.P. Prior to that time, he had been the Group Chief Operating Officer and Chief Commercial Officer forof the Energy Transfer family and has served in that capacity since November 2015. Mr. McCrea was appointed as a director of the general partner of ETPETO and as a a director of ET’s general partner in December 2009. Prior to that, he served as President and Chief Operating Officer of ETP’sETO’s general partner from June 2008 to November 2015 and President – Midstream from March 2007 to June 2008. Previously he served as the Senior Vice President – Commercial Development since January 2004. In March 2005, Mr. McCrea was named President of La Grange Acquisition LP, ETP’sETO’s primary operating subsidiary, after serving as Senior Vice President-Business Development and Producer Services since 1997. Mr. McCrea also currently serves on the Board of Directors of the general partner of ETE. Mr. McCrea also served as the Chairman of the Board of Directors of the general partner of Sunoco Logistics from October 2012 to April 2017. The member of our general partner selected Mr. McCrea to serve as a director because he brings extensive project development and operational experience to the Board. He has held various positions in the natural gas business over the past 25 years and is able to assist the Board of Directors in creating and executing the Partnership’s strategic plan.
James M. Wright, Jr. JimMr. Wright was elected General Counsel of our General Partnergeneral partner in December 2015. He became Executive Vice President - Legal and Chief Compliance Officer of ET’s general partner in October 2018 following the merger of Energy Transfer Equity, L.P. and Energy Transfer Partners, L.P. Mr. Wright has been a part of the Energy Transfer legal team with increasing levels of responsibility since July 2005, and served as its Deputy General Counsel sincefrom May 2008.2008 to December 2015. Prior to joining Energy Transfer, Mr. Wright gained significant experience at Enterprise Products Partners, L.P., El Paso Corp., Sonat Exploration Company and KPMG Peat Marwick LLP. Mr. Wright earned a Bachelor of Business Administration degree in Accounting and Finance from Texas A&M University and a JD from South Texas College of Law.
A. Troy Sturrock. Mr. Sturrock has served as the Senior Vice President and Controller of the general partner of ETPETO since August 2016 and previously served as Vice President and Controller of our General Partner since June 2015. Mr. Sturrock also served as a Senior Vice President of PennTex Midstream Partners, LP’s general partner, from November 2016 until July 2017, and as its Controller and Principal Accounting Officer from January 2017 until July 2017. He became Senior Vice President, Controller and Principal Accounting Officer of ET’s general partner in October 2018 following the merger of Energy Transfer Equity, L.P. and Energy Transfer Partners, L.P. Mr. Sturrock previously served as Vice President and Controller of Regency GP LLC from February 2008, and in November 2010 was appointed as the principal accounting officer. From June 2006 to February 2008, Mr. Sturrock served as the Assistant Controller and Director of financial reporting and tax for Regency GP LLC. Mr. Sturrock is a Certified Public Accountant.
Ray C. Davis. David K. Skidmore.Mr. Davis was appointed to the Board of DirectorsSkidmore has served as a director of our general partner in February 2018. From February 2013 until February 2018, Mr. Davis was an independent investor.since March 2013. He has also been a principal owner, and served as co-chairman of the board of directors, of the Texas Rangers major league baseball club since August 2010. Mr. Davis previously served on the Board of Directors of the general partner of ETE, effective upon the closing of ETE’s initial public offering in February 2006 until his resignation in February 2013. Mr. Davis also served as ETP’s Co-Chief Executive Officer from the combination of the midstream and transportation operations of ETC OLP and the retail propane operations in January 2004 until his retirement from these positions in August 2007, and as Co-Chairman of the Board of Directors of our general partner from January 2004 until June 2011. Mr. Davis also held various executive positions with Energy Transfer prior to 2004. From 1996 to 2000, he served as a Director of Crosstex Energy, Inc. From 1993 to 1996, he served as Chairman of the Board of Directors and Chief Executive Officer of Cornerstone Natural Gas, Inc. The member of our general partner selected Mr. Davis to serve as a director based on his over 40 years of business experience in the energy industry and his expertise in the Partnership’s asset portfolio.
Michael K. Grimm. Mr. Grimm is one of the original founders of Rising Star Energy, L.L.C., a privately held upstream exploration and production company active in onshore continental United States, and served as its President and Chief Executive Officer from 1995 until 2006 when it was sold. Mr. Grimm is President of Rising Star Petroleum, LLC and is Chairman of the Board of RSP Permian, Inc. (NYSE: RSPP), which is active in the drilling and developing of West Texas Permian Basin oil reserves. Prior to the formation of Rising Star, Mr. Grimm was Vice President of Worldwide Exploration and Land for Placid Oil Company from 1990 to 1994. Prior to joining Placid Oil Company, Mr. Grimm was employed by Amoco Production Company for thirteen years where he held numerous positions throughout the exploration department in Houston, New Orleans and Chicago. Mr. Grimm has been an active member of the Independent Petroleum Association of America, the American Association of Professional Landmen, Dallas Producers Club, Houston Producers Forum, and Fort Worth Wildcatters. Mr. Grimm has served as a Director of our General Partner since December 2005 and is the Chairman of the Audit Committee and of the Compensation Committee. He has a B.B.A. from the University of Texas at Austin. The member of our general partner selected Mr. Grimm to serve as a director because of his extensive experience in the energy industry and his service as a senior executive at several energy-related companies, in addition to his contacts in the industry gained through his involvement in energy-related organizations.
David K. Skidmore. Mr. Skidmore has served as Vice President of Ventex Oil & Gas, Inc. since 1995 and has been actively involved in exploration and production throughout the Gulf Coast and mid-Continent regions for over 35 years. He founded Skidmore Exploration, Inc. in 1981 and has been an independent oil and gas producer since that time. From 1977 to 1981, he worked for Paraffine Oil Corporation and Texas Oil & Gas in Houston. He holds BS degrees in both Geology and Petroleum Engineering, is a Certified Petroleum Geologist and Registered Professional Engineer, and active member of the AAPG, and SPE. Mr. Skidmore was appointed to the Board of Directors of our general partner in March 2013. Mr. Skidmore is also a member of both the Audit Committee and Compensation Committee. The member of our general partner selectedETO’s audit committee. Mr. Skidmore was selected to serve as a director because of his continual involvement in geological, geophysical, legal, engineering and accounting aspects of an active oil and gas exploration and production company. As an energy professional, active oil and gas producer and successful business owner, Mr. Skidmore possesses valuable first-hand knowledge of the energy transportation business and market conditions affecting its economics.
W. Brett Smith. Mr. Smith was appointed to the Board of Directors of our general partner in February 2018 and has served on the audit committee since that time. He has served as President and Managing Partner of Rubicon Oil & Gas, LLC since October 2000. He has also served as President of Rubicon Oil & Gas II, LP since May 2005, President of Quientesa Royalty LP since February 2005 and President of Action Energy LP since October 2008. Mr. Smith was President of Rubicon Oil & Gas, LP from October 2000 to May 2005. Previously, he served as Vice President with Collins & Ware, Inc. from 1998 to September 2000 and was responsible for land and exploration since the firm’s inception. For more than 30 years Mr. Smith has been active in assembling exploration prospects in the Permian Basin, Oklahoma, New Mexico and the Rocky Mountain areas. Mr. Smith received a Bachelor of Science Degree from the University of Texas. Mr. Smith servespreviously served on the board of directors of Sunoco LP and iswas a member of its
audit and compensation committees. Mr. Smith was selected to serve on the Board of Directors of our Boardgeneral partner based on his extensiveexperience as an executive in the oil and gas exploration and production business, which gives him unique insight into the Partnership’s business, as well as his recent experience on the board of another publicly traded limited partnership.
William P. Williams. Mr. Williams began his career in the oil and gas industry in 1967 with Texas Power and Light Company as Manager of Pipeline Construction for Bi-Stone Fuel Company, a predecessor of Texas Utilities Fuel Company. In 1980, he was employed by Endevco as Vice President of Pipeline and Plant Construction, Engineering, and Operations. Prior to Endevco, he worked for Cornerstone Natural Gas followed by Vice President of Engineering and Operations at Energy Transfer Partners, L.P., ending his career as Vice President of Measurement on May 1, 2011. The member of our general partner selected Mr. Williams due to his experience in the energypipeline industry includingand his past experiences as an executivefamiliarity with various energy companies.our business.
Compensation of the General Partner
Our General Partner does not receive any management fee or other compensation in connection with its management of the Partnership and the Operating Companies.Partnership. Our General Partner and its affiliates performing services for the Partnership and the Operating Companies are reimbursed at cost for all expenses incurred on behalf of the Partnership, including the costs of employee compensation allocable to, but not paid directly by, the Partnership, if any, and all other expenses necessary or appropriate to the conduct of the business of, and allocable to, the Partnership. Our employees are employed by our Operating Companies,subsidiaries, and thus, our General Partner does not incur additional reimbursable costs.
Our General Partner is ultimately controlled by the general partner of ETE,ET, which general partner entity is partially-owned by certain of our current and prior named executive officers. We pay quarterly distributions to our General Partner in accordance with our Partnership Agreement with respect to its ownership of a general partner interest and the incentive distribution rights specified in our Partnership Agreement. The amount of each quarterly distribution that we must pay to our General Partner is based solely on the provisions of our Partnership Agreement, which agreement specifies the amount of cash we distribute to our General Partner based on the amount of cash that we distribute to our limited partners each quarter. Accordingly, the cash distributions we make to our General Partner bear no relationship to the level or components of compensation of our General Partner’s executive officers. Our General Partner’s distribution rights are described in detail in Note 87 to our consolidated financial statements. Our named executive officers also own directly and indirectly certain of our limited partner interests and, accordingly, receive quarterly distributions. Such per unit distributions equal the per unit distributions made to all our limited partners and bear no relationship to the level of compensation of the named executive officers.
Section 16(a) Beneficial Ownership Reporting Compliance
Section 16(a) of the Securities Exchange Act of 1934 requires the directors and executive officers of our general partner, as well as persons who own more than ten percent of the common units representing limited partnership interests in us, to file reports of ownership and changes of ownership on Forms 3, 4 and 5 with the SEC. The SEC regulations also require that copies of these Section 16(a) reports be furnished to us by such reporting persons. Based upon a review of copies of these reports, we believe all applicable Section 16(a) reports were timely filed in 2017. Certain amendments to these Section 16(a) reports were filed as set forth below:
On June 26, 2017, an amendment to the original Form 3 for Mr. Warren on May 5, 2017 was filed to correct an inadvertent clerical error in the number of ETP common units indirectly owned by Mr. Warren;
On June 26, 2017, an amendment to the Form 4 filed for Mr. Warren on May 2, 2017 was filed to correct an inadvertent clerical error in the number of ETP common units indirectly owned by Mr. Warren;
On May 12, 2017, an amendment to the original Form 3 for Mr. Ramsey on May 5, 2017 was filed to correct an inadvertent clerical error in the number of ETP common units beneficially owned by Mr. Ramsey;
On May 12, 2017, an amendment to the Form 4 filed for Mr. Ramsey on May 2, 2017 was filed to correct an inadvertent clerical error in the number of ETP common units beneficially owned by Mr. Ramsey;
On May 19, 2017, an amendment to the original Form 3 filed for Mr. Grimm on May 5, 2017 was filed to correct an inadvertent clerical error in the number of ETP common units beneficially owned by Mr. Grimm;
On May 19, 2017, an amendment to the Form 4 filed for Mr. Grimm on May 2, 2017 was filed to correct an inadvertent clerical error in the number of ETP common units and ETP restricted units acquired and beneficially owned by Mr. Grimm;
On May 12, 2017, an amendment to the original Form 3 filed for Mr. Sturrock on May 5, 2017 was filed to correct an inadvertent clerical error in the number of ETP common units beneficially owned by Mr. Sturrock;
On May 12, 2017, an amendment to the Form 4 filed for Mr. Sturrock on May 2, 2017 was filed to correct an inadvertent clerical error in the number of ETP common units and ETP restricted units beneficially owned by Mr. Sturrock;
On May 12, 2017, an amendment to the original Form 3 filed for Mr. Wright on May 5, 2017 was filed to correct an inadvertent clerical error in the number of ETP common units beneficially owned by Mr. Wright; and
On May 12, 2017, an amendment to the Form 4 filed for Mr. Wright on May 2, 2017 was filed to correct an inadvertent clerical error in the number of ETP common units beneficially owned by Mr. Wright.
ITEM 11. EXECUTIVE COMPENSATION
Overview
As a limited partnership, we are managed by our General Partner, which in turn is managed by its general partner, ETP LLC, which we refer to in this Item as “our General Partner.” As of December 31, 2017, ETE owned 100% of our Our General Partner approximately 27.5 million of our outstanding Common Units and 100% of our outstanding Class H and Class I Units. All of our employees are employedis owned by and receive employee benefits from our Operating Companies.
Effective April 28, 2017, ETP GP replaced SXL GP as the general partner of the former Sunoco Logistics Partners, L.P. (now renamed Energy Transfer Partners, L.P.).ET.
Compensation Discussion and Analysis
Named Executive Officers
TheETO does not have officers or directors. Instead, we are managed by the board of directors of our General Partner, and the executive officers referredof our General Partner perform all of ETO’s management functions. In addition, our executive officers are also executive officers of ET. The board of directors of our General Partner does not have a separate compensation committee. Therefore, we do not administer any policies or programs relating to the compensation of ET’s named executive officers. The compensation of our executive officers is administered by the compensation committee of the board of directors of ET’s general partner (the “ET Compensation Committee”). This Compensation Discussion and Analysis is, therefore, focused on the total compensation of the executive officers of ET’s General Partner as set forth below. Compensation amounts discussed herein include all compensation paid to ET’s named executive officers, including amounts attributable to services performed for us. The persons we refer to in this discussion as the “named executive officers” are the following officers with the roles they held for 2017:following:
Kelcy L. Warren, Chairman and Chief Executive Officer;
Thomas E. Long, Chief Financial Officer and Group Chief Financial Officer of ETE’s general partner;Officer;
Marshall S. (Mackie) McCrea, III, Group Chief Operating OfficerPresident and Chief Commercial OfficerOfficer;
Matthew S. Ramsey, President and Chief Operating Officer; and
James M. Wright,Thomas P. Mason, Executive Vice President, General Counsel and Assistant Secretary;President — LNG.
Michael J. Hennigan, Former President and Chief Executive Officer of Sunoco Partners LLC; and
Peter J. Gvazdauskas, Former Chief Financial Officer and Treasurer of Sunoco Partners LLC.
During 2017, Mr. McCrea, Group Chief Operating Officer and Chief Commercial Officer of ETE’s general partner and Mr. Long, as Group Chief Financial Officer of ETE’s general partner provided services to each of ETE, ETP (formerly named “Sunoco Logistics Partners L.P.”), Energy Transfer, LP (formerly named “Energy Transfer Partners, L.P.”) and, in the case of Mr. Long, Sunoco LP. Decisions with respect to Messrs. McCrea’s and Long’s compensation during 2017 were made by the ETE Compensation Committee in consultation, as appropriate, with the ETP Compensation Committee or the Energy Transfer, LP Compensation Committee as applicable prior to the Sunoco Logistics Merger.
Prior to the Sunoco Logistics Merger in April 2017, Mr. Hennigan’s and Mr. Gvazdauskas’ primary business responsibilities related to Sunoco Logistics and its consolidated subsidiaries. Prior to the Sunoco Logistics Merger, the compensation committee of Sunoco Partners LLC set the components of Mr. Hennigan’s and Mr. Gvazdauskas’ compensation, including salary, long-term incentive awards and annual bonus utilizing the same philosophy and methodology adopted by our General Partner.
OurET’s General Partner’s Philosophy for Compensation of Executives
In general, our General Partner’s philosophy for executive compensation philosophy is based on the premise that a significant portion of each executive’s compensation should be incentive-based or “at-risk” compensation and that executives’ total compensation levels should be highly competitive in the marketplace for executive talent and abilities. ETP LLCOur General Partner seeks a total compensation program for its executive officers, including the named executive officers that provides for a slightly below the median market annual base compensation rate (i.e. approximately the 40th30th to 40th percentile of market) but incentive-based compensation composed of a combination of compensation vehicles to reward both short and long-term performance that are both targeted to pay-out at approximately the top-quartile of market. ETP LLCOur General Partner believes the incentive-based balance is achieved by (i) the payment of annual discretionary cash bonuses that consider the achievement of ETP’sthe Partnership’s financial performance objectives for a fiscal year set at the beginning of such fiscal year and the individual contributions of its executive officers, including the named executive officers to the success of ETPthe Partnership and the achievement of the annual financial performance objectives and (ii) the annual grant of time-based restricted unit or phantom unit awards under the Partnership’s equity incentive plan(s), or the equity incentive programs of Sunoco LP, as applicable based on the allocation of executive officers awards, including awards to the named executive officers, which awards are intended to provide a longer term incentive and retention value to theits key employees to focus their efforts on increasing the market price of theits publicly traded units and to increase the cash distribution paidthe Partnership and/or the other affiliated partnerships pay to their respective unitholders.
ETP LLCET’s General Partner grants restricted unit and/or phantom unit awards that vest, based generally upon continued employment, at a rate of 60% after the third anniversaryyear of the awardservice and the remaining 40% after the fifth anniversaryyear of the award. ETP LLCservice. ET’s General Partner believes that these equity-based incentive arrangements are important in attracting and retaining executives, including the named executive officers and key employees as well as motivating these individuals to achieve stated business objectives. The equity-based compensation also reflects the importance ofET’s General Partner places on aligning the interests of the executives, including theits named executive officers with those of ETP’s unitholders.
While ETPAs discussed below, the ET Compensation Committee, the ETO Compensation Committee (prior to the Energy Transfer Merger) is responsible for the direct paymentcompensation policies and compensation level of the compensation ofour executive officers, including the named executive officers as employees of ETP LLC, ETP or its controlled affiliates, ETP does not participate or have any input in any decisions asofficers. In this discussion, we refer to ET Compensation Committee and the ETO Compensation Committee prior to the compensation policies of ETP LLC orEnergy Transfer Merger as the compensation levels of the executive officers of ETP LLC. The compensation committee of the board of directors of ETP LLC (the “ETP“ET Compensation Committee”) is responsible for the approval of the compensation policies and the compensation levels of these executive officers. ETP directly pays these executive officers in lieu of receiving an allocation of overhead related to executive compensation from ETP LLC. Committee.”
For a more detailed description of the compensation ofto the Partnership’s named executive officers, please see “Compensation“– Compensation Tables” below. Both the ETE Compensation Committee and the compensation committee of Sunoco Partners LLC (the “Sunoco Logistics Compensation Committee”) follow a substantially similar executive compensation philosophy for executives as the ETP Compensation Committee.
Compensation Philosophy
OurET’s compensation program isprograms are structured to achieve the following:
reward executives with an industry-competitive total compensation package of targeted base salaries and significant incentive opportunities yielding a total compensation package approaching the top-quartile of the market;
attract, retain and reward talented executive officers and key management employees by providing total compensation competitive with that of other executive officers and key management employees employed by publicly traded limited partnerships of similar size and in similar lines of business;
motivate executive officers and key employees to achieve strong financial and operational performance;
emphasize performance-based, or “at-risk”“at-risk,” compensation; and
reward individual performance.
Components of Executive Compensation
For the year ended December 31, 2017,2019, the compensation paid to ourthe named executive officers other than our Chief Executive Officer, consisted of the following components:
annual base salary;
non-equity incentive plan compensation consisting solely of discretionary cash bonuses;
time-vested restrictedrestricted/phantom unit or phantom awards under the equity incentive plan(s);
payment of distribution equivalent rights (“DERs”) on unvested time-based restricted unit or phantom unit awards under theour equity incentive plan(s);plan;
vesting of previously issued time-based restricted unit/unit and/or phantom unit awards issued pursuant to the ETPET’s equity incentive plan(s)plans or the equity incentive plan(s)plans(s) of its affiliates; and
401(k) plan employer contributions; and
severance payments where applicable.
Mr. Warren, our Chief Executive Officer, has voluntarily elected not to accept any salary, bonus or equity incentive compensation (other than a salary of $1.00 per year plus an amount sufficient to cover his allocated employee premium contributions for health and welfare benefits).contributions.
Methodology
The ETPET Compensation Committee considers relevant data available to it to assess our competitive position with respect to base salary, annual short-term incentives and long-term incentive compensation for the executive officers of its General Partner, including the named executive officers. The ETPET Compensation Committee also considers individual performance, levels of responsibility, skills and experience.
Periodically, the compensation committee of the general partner of ETE (the “ETE Compensation Committee”) or the ETPET Compensation Committee engages a third-party consultant to provide a full market informationcompetitive compensation analysis for compensation levels at peer companies in order to assist in the determination of compensation levels for the executives,our executive officers, including the named executive officers. Most recently, Longnecker & Associates (“Longnecker”) evaluated the market competitiveness of total compensation levels of a number of executivesofficers of ETE, ETP and Sunoco Logisticsthe Partnership to provide market information with respect to compensation of those executives during the year ended December 31, 2017.2019. In particular, the 2017 review by Longnecker was designed to (i) evaluate the market competitiveness of total compensation levels for certain members of senior management, including the named executive officers; (ii) assist in the determination of appropriate compensation levels for our senior management, including the named executive
officers; and (iii) confirm that theour compensation programs were yielding compensation packages consistent with theour overall compensation philosophy.
In conducting its review, Longnecker specifically considered the larger size of the combined ETE and ETPET entities from an energy industry perspective. During 2017,2019, Longnecker assisted in the development of the final “peer group” of leading companies in the energy industry that most closely reflect ETP’sthe profile of ET in terms of revenues, assets and market value as well as competition for talent at the senior management level and similarly situated general industry companies with similar revenues, assets and market value. In setting such peer group, both ETP and Longnecker considered the size of ETE and ETPET on a combined basis. Unlike in prior evaluationsbasis was considered. As part of the evaluation conducted by Longnecker, a determination was made to focus the analysis specifically on the energy industry peers. This decision was based on a determination that an energy industry peer group provided a more than sufficient amount of comparative data to consider and evaluate total compensation. This decisionfocus allowed Longnecker to report on specific industry related data comparing the levels of annual base salary, annual short-term cash bonus and long-term equity incentive awards at industry peer group companies with those of the named executive officers to ensure that compensation of the named executive officers is both consistent with the compensation philosophy and competitive with the compensation for executive officers of these other companies. The identified companies were:
|
| | |
| Energy Peer Group: | | |
| • Conoco Phillips | | • AnadarkoMarathon Petroleum Corporation |
| • Enterprise Products Partners, L.P. | | • Marathon Petroleum CorporationKinder Morgan, Inc. |
| • Plains All American Pipeline, L.P. | | • Kinder Morgan, Inc. |
• Halliburton Company | | • The Williams Companies, Inc. |
| • Valero Energy Corporation | | • Phillips 66 |
The compensation analysis provided by Longnecker in 20172019 covered all major components of total compensation, including annual base salary, annual short-term cash bonus and long-term incentive awards for the senior executives of these companies. In preparing the review materials, Longnecker utilized generally accepted compensation principles as determined by WorldatWork and gathered data from the public disclosures of peer companies, including 10-K and proxy data and published salary surveys.survey data from multiple sources that are relevant to ET’s peer group, industry, financial size and operational breadth. The Longnecker review process also included significant engagement with management to fully understand job scope, responsibilities and roles of each of the executive officers, which discussions allow Longnecker the ability to completely evaluate specific aspects of an executive officer’s position to allow for more accurate benchmarking.
Following Longnecker’s 20172019 review, both the ETE Compensation Committee and the ETPET Compensation Committee reviewed the information provided, including Longnecker’s specific conclusions and recommended considerations for all compensation going forward. The ETE Compensation Committee and ETPET Compensation Committee considered and reviewed the results of the study performed by Longnecker to determine if the results indicated that the compensation programs were yielding a competitive total compensation model prioritizing incentive-based compensation and rewarding achievement of short and long-term performance objectives and considered Longnecker’s conclusions and
recommendations. While Longnecker found that ETPthe Partnership is achieving its stated objectives with respect to the “at-risk” approach, they also found that certain adjustments shouldcould be implementedconsidered moving forward to allow ETPthe Partnership to continue to achieve its targeted percentiles on base compensation and incentive compensation (short and long-term). Those adjustments are being considered by the ET Compensation Committee and management, and will, as described below.deemed appropriate, be implemented.
WithIn addition to the pending Sunoco Logistics Merger,information received as part of Longnecker’s 2019 review, the Sunoco LogisticsET Compensation Committee’s onlyCommittee also utilizes information obtained from other sources in its determination of compensation actions during 2017 priorlevels for our named executive officers, such as annual third party surveys, although third party survey data is not used by the ET Compensation Committee to closing relatedbenchmark the amount of total compensation or any specific element of compensation for the named executive officers.
In addition to 2016the 2019 compensation analysis for executive officers, Longnecker also provided advice and feedback on certain other matters, including the appropriateness, targets and composition of the annual equity award pools and the annual bonus awards under the Energy Transfer Annual Bonus Plan (the “Bonus Plan”) and are not reportedbenchmarking on in this report oncertain non-named executive compensation.officer hires and promotions.
Base Salary. Base salary is designed to provide for a competitive fixed level of pay that attracts and retains executive officers, and compensates them for their level of responsibility and sustained individual performance (including experience, scope of responsibility and results achieved). The salaries of the named executive officers are reviewed on an annual basis. As discussed above, the base salaries of theour named executive officers are targeted to yield an annual base salary slightly below the median level of market (i.e. approximately the 40th30th to 40th percentile of market) and are determined by the ETPET Compensation Committee after taking into account the recommendations of Mr. Warren.
During the 20172019 merit review process, the ETPET Compensation Committee considered the recommendations of Mr. Warren, the results ofexisting Longnecker study (with the Longnecker studydata aged as appropriate) and the merit increase pool set for all employees of ETP LLC, ETP and Sunoco Logistics.
the Partnership and/or its employing affiliates. The ETPET Compensation Committee approved ana 3.5% increase to Mr. Ramsey’sthe base salary of 2.5%Mr. McCrea to $653,438$1,114,555 from its prior level of $637,500, Mr. Wrights$1,076,865; an approximately 10% base salary was initially increased 2.5%increase to $392,063 at the timeMr. Long to $600,000 from its prior level of merit increases, but was subsequently increased$545,900; a 3.5% base salary increase to $415,000 based largely upon the resultsMr. Ramsey to $696,598 from its prior level of the Longnecker study. The CEO (who$673,041; and a 3.5% base salary increase to Mr. Mason to $631,396 from its prior level of $610,044. Mr. Warren has voluntarily electeddetermined that his salary will be $1.00 per year (plus an amount sufficient to forgo nearly all base compensation)cover his allocated payroll deductions for health and welfare benefits), and, as such, did not receive any base salary or adjustment during 2017.in 2019.
In the case of Mr. McCrea, the ETE Compensation Committee approved an increase of 2.5% to Mr. McCrea’s base salary to $1,045,500 from its prior level of $1,020,000.
In the case of Mr. Long, the ETE Compensation Committee approved anThe 3.5% increase to Mr. Long’s base salary to $530,000 from its prior level of $459,000, which represents an approximately 15.5% increase and was based largely on the recommendation of Mr. Warren and the results of the Longnecker study.
Messrs. Hennigan and Gvazdauskas did not receive a base salary adjustment during 2017, as Mr. Hennigan had left ETP prior to merit increases and Mr. Gvazdauskas had been determined to be a transition employee remaining with ETP only for a short period of time.
The 2.5% increase to Mr.McCrea, Ramsey and the initial 2.5% increase to Mr. WrightMason reflected a base salary increase consistent withsubstantially the 2.5%same as the annual merit increase pool establishedset for all employees of the ETP LLC, ETP, Sunoco LogisticsET and theirits affiliates for 2017 by2019. The 10% increase for Mr. Long was undertaken to continue the ETP Compensation Committee.process to more closely align Mr. Long with the targeted total compensation of similarly situated officers of peer group companies and the market data.
Annual Bonus. In addition to base salary, the ETEET Compensation Committee and the ETP Compensation Committee makemakes determinations whether to make discretionary annual cash bonus awards to executives, including theour named executive officers, other than the CEO (who has voluntarily elected to forgo any annual bonuses), following the end of the year under the Energy Transfer Partners, L.L.C. AnnualBonus Plan.
The Bonus Plan is a discretionary annual cash bonus plan available to all employees, including the named executive officers. The purpose of the Bonus Plan is to reward employees for contributions towards the Partnership’s business goals and to aid in motivating employees. The Bonus Plan is administered by the ET Compensation Committee and the ET Compensation Committee has the authority to establish and interpret the rules and regulations relating to the Bonus Plan, to select participants, to determine and approve the size of any actual award amount, to make all determinations, including factual determinations, under the Bonus Plan, and to take all other actions necessary or appropriate for the proper administration of the Bonus Plan.
For each calendar year (the “Bonus Plan”“Performance Period”). The ETE, the ET Compensation Committee will consider a 2017 annualevaluate and determine an overall funded cash bonus for Messrs. McCreapool based on achievement of (i) an internal Adjusted EBITDA target (“Adjusted EBITDA Target”), (ii) an internal distributable cash flow target (“DCF Target”) and Long(iii) performance of each department compared to the applicable departmental budget (“Departmental Budget Target”). The Adjusted EBITDA Target and the ETP Compensation CommitteeDCF Target are defined for purposes of the Bonus Plan using the same definitions as used in the Partnership’s audited financial statements included in its annual and quarterly filings on Forms 10-K and 10-Q for the terms Adjusted EBITDA and Distributable Cash Flow. The performance criteria are weighted 60% on the achievement of the Adjusted EBITDA Target, 20% on the achievement of the DCF Target and 20% on the achievement of the Departmental Budget Target (collectively, “Budget Targets”). The total amount of cash to be allocated to the funded bonus pool will consider 2017 annualrange from 0% to 120% for each of the budgeted DCF Target and Adjusted EBITDA Target and will range from 0% to 100% of the Departmental Budget Target. The maximum funding of the bonus pool is 116% of the total pool target and to achieve such funding each of the Adjusted EBITDA and the DCF Target must achieve 120% funding and the Department Budget target must achieve its 100% target. While the funded bonus pool will reflect an aggregation of performance under each target, in the event performance under the Adjusted EBITDA Target is below 80% of its target, no bonus pool will be funded. If the bonus pool is funded, a participant may earn a cash award for the Performance Period based upon the level of attainment of
the Budget Targets and his or her individual performance. Awards are paid in cash as soon as practicable after the end of the Performance Period but in no event later than two and one-half months after the end of the Performance Period.
While the achievement of the Budget Targets sets a bonus pool under the Bonus Plan, actual bonus awards for Messrs. Ramsey and Wright.
are discretionary. These discretionary bonuses, if awarded, are intended to reward theour named executive officers for the achievement of financial performance objectivesthe Budget Targets during the year for which the bonuses are awardedPerformance Period in light of the contribution of each individual to our profitability and success during such year. The ETE Compensation Committee and the ETPET Compensation Committee also considerconsiders the recommendation of the CEOMr. Warren in determining the specific annual cash bonus amounts for each of the other named executive officers. The ETEET Compensation Committee and the ETP Compensation Committee dodoes not establish theirits own financial performance objectives in advance for purposes of determining whether to approve any annual bonuses, and doit does not utilize any formulaic approach to determine annual bonuses.
For 2017, annual bonuses to be awarded to Messrs. McCrea, Ramsey, Long, McCrea and Wright will be determined under2019, the Bonus Plan. The ETE Compensation Committee’s and the ETP Compensation Committee’s evaluation of performance and determination of an overall available bonus pool is based on an internal earnings target generally based on targeted EBITDA (the “Earnings Target”) budget and the performance of each department compared to the applicable departmental budget (with such performance measured based on the specific dollar amount of general and administrative expenses set for each department). The two performance criteria are weighted 75% on the internal Earnings Target budget criteria and 25% on internal department financial budget criteria. Internal Earnings Target is the primary performance factor in determining annual bonuses, while internal department financial budget criteria is considered to ensure that general and administrative costs are being effectively managed in a prudent manner.
The internal financial budgets are generally developed for each business segment, and then aggregated with appropriate corporate level adjustments, to reflect an overall performance objective that is reasonable in light of market conditions and opportunities based on a high level of effort and dedication across all segments of the business. The evaluation of performance versus the internal financial budget is based on EBITDA for a calendar year.
In general, both the ETEET Compensation Committee and the ETP Compensation Committee believe that performance at or above the internal Earnings Target and at or below internal department financial budgets would support bonus pools to the named executive officers ranging from 105% to 160% of their annual base earnings (which amount reflects the actual base salary earned during the calendar year to reflect periods before and after any base salary adjustments), with the ability to fund up to an additional 20% above each named executive officer’s target bonus pool upon achievement of 110% of the internal Earnings Target and 110% of the internal department financial budgets. For 2017, theapproved short-term annual cash bonus pool targets for each of the named executive officers were as follows: for Mr. McCrea of 160% of his annual base earnings;earnings and for Mr.Messrs. Long, Ramsey and Mason of 130% of histheir annual base earnings, which represented an adjustment from his previous target of 140%;earnings. The named executive officer bonus pool targets remained the same for Mr. Long, 130% of his annual base earnings; andthe 2019 Performance Period as they were for Mr. Wright, 115% of his annual base earnings, which represents an increase from his previous target of 105%. The adjustment to Mr. Ramsey’s base target represented a desire on the part of the Chairman and CEO to align the senior officers that report to him, other than Mr. McCrea, with a consistent bonus target. The increase for Mr. Wright was based on recognition of his role as General Counsel of ETP and the results of the Longnecker study.2018 period.
In February 2018,2020, the ETPET Compensation Committee certified 20172019 performance results under the Bonus Plan, which resulted in a bonus payout of 100% of the bonus pool target, which reflected achievement of 101.6%100.3% of the internal EarningsAdjusted EBITDA Target, 99.7% of the DCF Target and 100% of101.6% or $13 million under the budget criteria.Department Budget Target. Based on the approved results, the ETPET Compensation Committee approved a cash bonus relating to the 2017 calendar year to Messrs. Ramsey and Wright in the amounts of $835,125 and $453,067, respectively.
The ETE Compensation Committee approved a cash bonus relating to the 20172019 calendar year to Messrs. McCrea, Long, Ramsey, and LongMason in the amounts of $1,644,554$1,750,817, $900,000, $889,100 and $625,100,$805,900, respectively.
In approving the case of Mr. Hennigan, he received no bonus award in respect of 2017 as he had left ETP prior to consideration of bonus awards. Mr. Gvazdauskas will receive a cash bonus of $336,000, which amount reflects a target payout at his bonus pool target of 105%. The bonus paid to Mr. Gvazdauskas was approved outside of the process2019 bonuses of the named executive officers, as he no longer serves as athe ET Compensation Committee took into account the achievement by the Partnership of all of the targeted performance objectives for 2019 and the individual performances of each of the named executive officers. The cash bonuses awarded to each of the named executive officers but was consideredfor 2019 performance were materially consistent with their applicable bonus pool targets, except Mr. Long who received approximately 120% of his targeted bonus award in consideration of (i) a recommendation to increase his award by Mr. Warren in recognition of Mr. Long’s efforts on certain key financial objectives during 2019 and (ii) a further alignment of Mr. Long with the process used to evaluate bonustargeted total compensation of similarly situated officers of peer group companies and the market data. As with base salary and equity awards, to other executives of ETP.Mr. Warren does not accept or receive an annual bonus.
Equity Awards. In 2017, ETE’S Board of Directors adoptedAwards. ET maintains and operates (i) the Second Amended and Restated Energy Transfer LP 2008 Incentive Plan (the “2008 Incentive Plan”); (ii) the Energy Transfer LP 2011 Long-Term Incentive Plan (the “2011 Incentive Plan”); the (iii) Energy Transfer LP 2015 Long-Term Incentive Plan (the “2015 Plan”); (iv) the Amended and Restated Energy Transfer Equity, L.P.LP Long-Term Incentive Plan (the “ETE Plan”“ET Plan,” together with the 2008 Incentive Plan, the 2011 Incentive Plan and the 2015 Plan, the “ET Incentive Plans”). The ETE Plan authorizesET Incentive Plans authorize the ETEET Compensation Committee, in its discretion, to grant awards, as applicable, under each respective plan of restricted units, phantom units, unit options, unit appreciation rights and other awards related to ETEET common units upon such terms and conditions as it may determine appropriate and in accordance with general guidelines as defined by the ETE Plan. The ETE PlanET Incentive Plans. ET has not been approved by a majority of ETE unitholders.
ETP currently has three incentive plans: (i) the Second Amended and Restated Energy Transfer Partners, L.P. 2008 Incentive Plan (the “2008 Incentive Plan”); (ii) the Energy Transfer Partners, L.P. Amended and Restated 2011 Long-Term Incentive Plan (the “2011 Incentive Plan”) and the (iii) Energy Transfer Partners, L.L.C. Long-Term Incentive Plan, as amended and restated (the “ETP Plan”). Each of the 2008 Incentive Plan, 2011 Incentive Plan and the ETP Plan authorizes the ETP Compensation Committee, in its discretion, to grant awards ofgenerally used time-vested restricted units and/or phantom units unit options and otheras the vehicle for its annual equity awards related to ETP common units upon such terms and conditions as it may determine appropriate and in accordance with general guidelines as defined by each such plan. The ETP Compensation Committee determined and/or approved the terms of the unit grants awarded toeligible employees, including the named executive officers, including the number of common units subject to the restricted unit award and the vesting structure of those restricted unit awards. All of the awards granted to the named executive officers under these equity incentive plans have consisted of restricted unit awards that are subject to vesting over a specified time period. Upon vesting of any restricted unit award, ETP common units are issued.officers.
Prior to the Sunoco Logistics Merger, Messrs. Hennigan and Gvazdauskas participated in the Sunoco Partners LLC Long-Term Incentive Plan, as amended, (the “Sunoco Logistics Plan”), which became the ETP Plan after the Sunoco Logistics Merger.
For 2017,2019, the annual long-term incentive targets set by the ET Compensation Committee for the named executive officers were 900% of annual base salary for Mr. McCrea 600% of annual base salary for Mr. Ramsey,and 500% of annual base salary for Mr.Messrs. Long, 300%Ramsey and Mason. The targets of the named executive officers were the same as the prior year’s targets.
The annual long-term incentive targets are used as the basis to determine the target number of units to be awarded to the eligible participant, including the named executive officers. A multiple of base salary is used to set the pool target, that number is then divided by a weighted average price determined by considering ET’s modified total unitholder return “(TUR”) performance as measured against the average return of ET’s identified peer group over defined time periods. For purposes of establishing an initial price, ET utilizes a 60 trading-day trailing weighted average price of ET common units prior to November 1, 2019. This average trading price is then subject to adjustment when ET’s TUR is more than 5% greater or less than that of its identified peer group. If the TUR analysis yields a result that is within 5% percent of its identified peer group, the ET Compensation Committee will simply use the 60 trading day trailing weighted average price divided by the applicable salary multiple to establish a target pool for Mr. Wright which represented an increase from his prior targeteach eligible participant, including the named executive officers. If ET’s TUR is outside of 250%. Messrs. Henniganthe 5% deviation, the 60 trading day trailing weighted average will be adjusted up or down based on ET’s performance as compared to the identified group. For 2019, the peer group included the following:
|
| | |
| • Enterprise Products Partners, L.P. | | • Kinder Morgan, Inc. |
| • The Williams Companies, Inc. | | • Plains All American Pipeline, L.P. |
| • Phillips 66 | | • MPLX LP |
For 2019, the Partnership’s TUR underperformed the identified peer group based on the average of the identified three comparison periods: (i) year-to-date 2019, (ii) trailing twelve months, and Gvazdauskas did not receive(iii) full-year 2018. Consequently, the 2019 long-term incentive awards in 2017. The ETP Compensation Committee approvedbase price was increased to reduce the increase to Mr. Wright’s long-term incentive target in recognition of his work as General Counsel of ETP and the results of the Longnecker study. In approving long-term incentive awards for Mr. Long, the ETP Compensation Committee and the compensation committee of Sunoco LP’s general partner utilized the targets settotal available restricted pool by the ETE Compensation Committee.approximately 13%.
In December 2017,2019, the ETEET Compensation Committee in consultation with ETE’s Chairman determined to issue long-term incentive awards under the ETE Plan to the ETE named executive officers, including Messrs. McCrea and Long and Mr. Ramsey. This determination was made in consideration of limiting the number of units issued under the ETP unit plans for 2017. In December of 2017, the ETE Compensation CommitteeWarren approved grants of phantom unit awards to Messrs. McCrea, Long, Ramsey and LongMason of 537,379682,400 units, 223,908215,000 units, 189,600 units and 121,074214,800 units, respectively. As with base salary and annual bonus, Mr. Warren does not accept or receive annual long-term incentive awards. Mr. Long’s award of 215,000 units represents an increase of approximately 30% over his pool target number. The increase for Mr. Long reflected (i) a recommendation to increase his award by Mr. Warren in recognition of Mr. Long’s efforts on certain key financial objectives during 2019 and (ii) a further alignment of Mr. Long with the targeted total compensation of similarly situated officers of peer group companies and the market data.
As more fully described below in the section titled Affiliate and Subsidiary Equity Awards, for 2019, in discussions between the General Partner, the ET Compensation Committee and the compensation committee of the general partner of Sunoco LP, it was determined that for 2019 the value of Messrs. McCrea’sLong and Ramsey’s 2017awards would be comprised of restricted unit awards under the ET Incentive Plans and the Sunoco LP 2018 Long-Term Incentive Plan (the “2018 Sunoco LP Plan”) in consideration of their roles and responsibilities for Sunoco LP and their status, as members of the Boards of Directors of the general partner of Sunoco LP. Messrs. Long and Ramsey’s total 2019 long-term incentive awards were allocated approximately 80% to the ET Incentive Plans and approximately 20% to the 2018 Sunoco LP Plan. The awards of Messrs. McCrea and Mason for 2019 were allocated entirely to the ETE Plan.ET Incentive Plans. It is expected that future long-term incentive awards to Messrs. Long and Ramsey of ET will recognize an aggregation of restricted units under the ET Incentive Plans and the 2018 Sunoco LP Plan, as applicable. For purposes of establishing a pool value for awards to eligible participants, including Messrs. Ramsey and Long, Sunoco LP utilized the same practices in terms of utilizing a peer group TUR analysis to set a grant date valuation.
The phantomrestricted unit awards granted in 2019 provide for incremental vesting over a five-year period, with 60% vesting at the end of the third year and the remaining 40% vesting at the end of the fifth year. Vesting of the awards are generally subject to continued employment through each specified vesting date. The restricted unit awards entitle the recipients to receive, with respect to each ET unit subject to such award that has not either vested or been forfeited, a DER cash payment promptly following each such distribution by ET to its unitholders. In approving the grant of such restricted unit awards, including to the named executive officers, the ET Compensation Committee considered several factors, including the long-term objective of retaining such individuals as key drivers of ET’s future success, the existing level of equity ownership of such individuals and the previous awards to such individuals of equity awards subject to vesting. Vesting of the 2019 awards would accelerate in the event of the death or disability of the recipient, including the named executive officers, or in the event of a change in control of ET as that term is defined under the ET Incentive Plans.
As discussed below under “Potential Payments Upon a Termination or Change of Control,” all outstanding equity awards would automatically accelerate upon a change in control event, which means vesting automatically accelerates upon a change of control irrespective of whether the officer is terminated. In addition, the award agreements for the restricted units awarded in 2019, as well as other awards outstanding held by Partnership employees, including the named executive officers, also include certain acceleration provisions upon retirement with the ability to accelerate 40% of outstanding unvested awards under the ET Incentive Plans at age 65 and 50% at age 68. These acceleration provisions require that the participant have not less than five (5) years of employment service to the Partnership or an affiliate and require a six (6) month delay in the vesting after retirement pursuant to the requirements of Section 409(A) of the Code.
We believe that permitting the accelerated vesting of equity awards upon a change in control creates an important retention tool for us by enabling employees to realize value from these awards in the event that we undergo a change in control transaction. In addition, we believe permitting acceleration of vesting upon a change in control creates a sense of stability in the course of transactions that could create uncertainty regarding their future employment and encourage these officers to remain focused on their job responsibilities.
Affiliate and Subsidiary Equity Awards. In addition to their roles for ET and ETO during 2019, Messrs. Long and Ramsey have certain responsibilities for Sunoco LP, including as members of the Board of Directors of the general partner of Sunoco LP.
The Sunoco LP Compensation Committee in December 2019 approved grants of restricted unit awards to Messrs. Long and Ramsey of 19,500 and 22,600 restricted units, respectively, under the 2018 Sunoco LP Plan. The terms and conditions of the restricted unit to Messrs. Long and Ramsey under the 2018 Sunoco LP Plan, as applicable, were the same and provided for vesting over a five-year period, with 60% vesting at the end of the third year and the remaining 40% vesting at the end of the fifth year, subject generally subject to continued employment through each specified vesting date. The phantom unit awards entitle the recipientsAll of the phantom unit awards to receive, with respect to each ETE unit subject to such award that has not either vested or been forfeited, a DER cash payment promptly following each such distribution by ETE to its unitholders. In approving the grant of such restricted unit awards, the ETE Compensation Committee considered several factors, including the long-term objective of retaining such individuals as key drivers of ETE’s and ETP’s future success, the existing level of equity ownership of such individuals and the previous awards to such individuals of equity awards subject to vesting. Vesting of the 2017 awards would accelerate in the event of the death or disability of the named executive officer or in the event of a change in control of ETE as that term is defined under the ETE Plan.
Upon vesting of the phantom units awarded under the ETE Plan, the ETE Compensation Committee reserves the right to determine if, upon vesting, such Phantom units shall be settled in (i) common units of ETE (subject to the approval of the ETE Plan prior to the first vesting date by a majority of ETE’s unitholders pursuant to the rules of the New York Stock Exchange); (ii) cash equal to the Fair Market Value (as such term is defined in the ETE Plan) of the ETE common units that would otherwise be delivered pursuant to the terms of each named executive officers grant agreement; or (iii) other securities or property (including, without limitation, delivery of common units of ETP purchased by ETE in the open market) in an amount equal to the Fair Market Value
of ETE common units that would otherwise be delivered pursuant to the terms of the grant agreement, or a combination thereof as determined by the ETE Compensation Committee in its discretion
Additionally, with respect to Mr. Long, in 2017, in discussions between the ETE Compensation Committee and the compensation committees of the general partner of Sunoco LP, it was determined that a portion of Mr. Long’s total long-term incentive award target value would be composed of phantom units awarded under the ETE Plan as well as restricted phantom units under the Sunoco LP equity plan in consideration for his role and responsibilities at those partnerships. Mr. Long’s total 2017 long-term awards were allocated 80% to the ETE Plan and 20% to the Sunoco LP equity plan. Mr. Long serves as a financial advisor in matters related to mergers and acquisitions and financing activities to Sunoco LP, and certain personnel responsible for the accounting and financial reporting functions provided to Sunoco LP report into his organization.
In connection with his role at Sunoco LP, in December 2017, the compensation committee of Sunoco LP’s general partner awarded Mr. Long time-based restricted phantom units of Sunoco LP in the amount of 17,097 units. The terms and conditions of the restricted unit/restricted phantom unit awards to Mr. Long under the Sunoco LP equity plan are identical to the terms and conditions of the restricted unit awards under ETP’s equity plans and the phantom units awarded under the ETE Plan to other named executive officers.
In December 2017, the ETP Compensation Committee approved grants of restricted unit awards to Mr. Wright of 62,250 units under the 2008 Incentive Plan related to ETP common units.
The restricted unit awards under the 2008 Incentive Plan, the 2011 Incentive Plan and the ETP Plan provide for vesting over a five-year period, with 60% vesting at the end of the third year and the remaining 40% vesting at the end of the fifth year, generally subject to continued employment through each specified vesting date. The restricted unit awards entitle the recipients of the restricted unit awards to receive, with respect to each ETP common unit subject to such award that has not either vested or been forfeited, a DER cash payment promptly following each such distribution by ETP to its unitholders. In approving the grant of such restricted unit awards, the ETP Compensation Committee considered several factors, including the long-term objective of retaining such individuals as key drivers of ETP’s future success, the existing level of equity ownership of such individuals and the previous awards to such individuals of equity awards subject to vesting. Vesting of the 2014, 2015, 2016 and 2017 awards would accelerate in the event of the death or disability of the named executive officer or in the event of a change in control of ETP as that term is defined under the 2008 Incentive Plan and 2011 Incentive Plan. For awards previously granted under the 2008 Incentive Plan and 2011 Incentive Plan prior to December 2014, unvested awards may also become vested upon a change in control at the discretion of the ETP Compensation Committee. Under the ETP Plan, awards granted in 2014 and 2015 would be accelerated in the event of a change in control of the applicable partnership (other than a change in control of an affiliate).
The restricted phantom unit awards for 2016 and 2017 under the Sunoco LP equity incentive plan generally require the continued employment of the recipient during the vesting period, provided however, the unvested awards will be accelerated in the event of a change in control of the applicable partnership (other than a change in control to an affiliate) or thetheir death, or disability, of the award recipient prior to the applicable vesting period being satisfied. Under the Sunoco LP equity incentive plan, awards granted in 2014 and 2015 would be accelerated in the event of a change in control of the applicable partnership (other than a change in control of an affiliate).
Messrs. Hennigan and Gvazdauskas did not receive a long-term incentive awards for 2017 as Mr. Hennigan had left ETP prior to merit increases and Mr. Gvazdauskas had been determined to be a transition employee remaining with ETP only for a short period of time.
As discussed below under “Potential Payments Upon a Termination or Change of Control,” certain equity awards automatically accelerate upon a change in control event, which means vesting automatically accelerates upon a change in control irrespective of whether the officer is terminated. In addition, the 2015 award to Mr. Ramsey in accordance with the terms of his offer letter and the 2014 award to Mr. Hennigan included a provision in the applicable award agreement for acceleration of unvested restricted unit awards upon a termination of employment without “cause” by the general partner of the applicable partnership issuing the award. For purposes of the awards the term “cause” shall mean: (i) a conviction (treating a nolo contendere plea as a conviction) of a felony (whether or not any right to appeal has beenretirement at ages 65 or may be exercised), (ii) willful refusal without proper cause to perform duties (other than any such refusal resulting from incapacity due to physical or mental impairment), (iii) misappropriation, embezzlement or reckless or willful destruction of property of the partnership or any of its affiliates, (iv) knowing breach of any statutory or common law duty of loyalty to the partnership or any of its or their affiliates, (v) improper conduct materially prejudicial to the business of the partnership or any of its or their affiliates, (vi) material breach of the provisions of any agreement regarding confidential information entered into with the partnership or any of its or their affiliates or (vii) the continuing failure or refusal to satisfactorily perform essential duties to the partnership or any of its or their affiliate. Mr. Hennigan’s 2014 award became fully vested upon his termination of employment in 2017.68.
Permitting the accelerated vesting of equity awards upon a change in control creates an important retention tool by enabling employees to realize value from these awards in the event of a change in control transaction.
Unit Ownership Guidelines. In December 2013, the ETPThe Board of Directors of ET’s General Partner has adopted the ETP Executive Unit Ownership Guidelines (the “Guidelines”), which set forth minimum ownership guidelines applicable to certain executives of ETPET with respect to ETPET and Sunoco LP common units.units representing limited partnership interests, as applicable. The applicable unit ownership guidelinesGuidelines are denominated as a multiple of base salary, and the amount of common units required to be owned increases with the level of responsibility. Under these Guidelines, the President and Chief Commercial Officer and the Chief Operating Officer isare expected to own common units having a minimum value of five times his base salary, while each of the remaining named executive officers (other than the CEO) are expected to own common units having a minimum value of four times their respective base salary. In addition to the named executive officers, these Guidelines also apply to other covered executives, which executives are expected to own either directly or indirectly in accordance with the terms of the Guidelines, common units having minimum values ranging from two to four times their respective base salary.
The Guidelines do not apply to the CEO, who receives a salary of $1.00 per year plus an amount sufficient to cover his allocated payroll deductions for health and welfare benefits.
ETP LLC and the ETPET Compensation Committee believebelieves that the ownership of theET and/or Sunoco LP common units, as reflected in thethese Guidelines, is an important means of tying the financial risks and rewards for theits executives to ET’s total unitholder return, aligning the interests of such executives with those of ETP’s unitholders,ET’s Unitholders, and promoting ETP’sET’s interest in good corporate governance.
Covered executives are generally required to achieve their ownership level within five years of becoming subject to the Guidelines; however, certain covered executives, based on their tenure as an executive, were required to achieve compliance within two years of the December 2013 effective date of the Guidelines. Thus, compliance with the Guidelines was required for Messrs. McCrea and Mason beginning in December 2015, and they were compliant. Compliance for Mr. Long was required in December 2018, and he was compliant. Compliance for Mr. Ramsey will be required to be compliant with the Guidelines in November 2020 and Mr. Wright for his current role in 2021.December 2020.
Covered executives may satisfy the Guidelines through direct ownership of ET and/or Sunoco LP common units or indirect ownership by certain immediate family members. Direct or indirect ownership of ETE andET and/or Sunoco LP common units shall count on a one-to-one ratio for purposes of satisfying minimum ownership requirements; however, unvested unit awards may not be used to satisfy the minimum ownership requirements.
Covered executivesExecutive officers, including the named executive officers, who have not yet met their respective guideline must retain and hold all common units (less common units sold to cover the executive’s applicable taxes and withholding obligation) received in connection with long-term incentive awards. Once the required ownership level is achieved, ownership of the required common units must be maintained for as long as the covered executive is subject to the Guidelines. However, those individuals who have met or exceeded their applicable ownership level guideline may dispose of the common units in a manner consistent with applicable laws, rules and regulations, including regulations of the SEC and ETP’sour internal policies, but only to the extent that such individual’s remaining ownership of common units would continue to exceed the applicable ownership guideline.level.
Qualified Retirement Plan Benefits. Benefits. The Energy Transfer Partners GP, L.P.LP 401(k) Plan (the “ETP“ET 401(k) Plan”) is a defined contribution 401(k) plan, which covers substantially all of ETP’sour employees, including the named executive officers. Employees may elect to defer up to 100% of their eligible compensation after applicable taxes, as limited under the Internal Revenue Code. Matching contributions areWe make a matching contribution that is not less than the aggregate amount of matching contributions that would be credited to a participant’s account based on a rate of match equal to 100% of each participant’s elective deferrals up to 5% of covered compensation. The amounts deferred by the participant are fully vested at all times, and the amounts contributed by ETPthe Partnership become vested based on years of service. ThisWe provide this benefit is provided as a means to incentivize employees and provide them with an opportunity to save for their retirement.
ETPThe Partnership provides a 3% profit sharing contribution to employee 401(k) accounts for all employees with a base compensation below a specified threshold. The contribution is in addition to the 401(k) matching contribution and employees become vested based on years of service.
Health and Welfare Benefits. All full-time employees, including theour named executive officers may participate in theETP GP’s health and welfare benefit programs including medical, dental, vision, flexible spending, life insurance and disability insurance.
Termination Benefits. The Our named executive officers do not have any employment agreements that call for payments of termination or severance benefits or that provide for any payments in the event of a change in control of ETP LLC. The 2008our General Partner; however, the award agreement to the named executive officers under the ET Incentive Plans, the 2018 Sunoco LP Plan and the Sunoco LP 2012 Long-Term Incentive Plan and 2011 Incentive Plan provide the ETP Compensation Committee with the discretion, unless otherwise specified in the applicable award agreement, to(the “2012 Sunoco LP Plan”) provide for immediate vesting of all unvested restricted unit awards in the event of a (i) a change of control, as defined in the applicable plan; (ii) death or (iii) disability, as defined in the applicable plan. In the case of the December 2014, 2015 and 2016 long-term incentive awards to the named executive officers under the 2008 Incentive Plan or, as applicable, the Sunoco Logistics Plan and the Sunoco LP equity plan, the unvested portion of restricted unit awards would immediately and fully vest in the event of a change of control, as defined in the applicable plan. Please refer to “Compensation Tables - Potential Payments Upon a Termination or Change of Control” for additional information.
In addition, ETP LLCGP has also adopted the ETP GP Severance Plan and Summary Plan Description effective as of June 12, 2013, (the “Severance Plan”), which provides for payment of certain severance benefits in the event of Qualifying Termination (as that term is defined in the Severance Plan) and related to the Sunoco Logistics Merger, the Energy Transfer/SXL Merger Severance Plan (the “Severance Plan”). In general, the Severance Plan provides payment of two weeks of annual base salary for each year or partial year of employment service up to a maximum of fifty-two weeks or one year of annual base salary (with a
minimum of four weeks of annual base salary) and up to three months of continued group health insurance coverage. The Severance Plan also provides that additionalwe may determine to pay benefits in addition to those provided under the Severance Plan may be paid based on special circumstances, which additional benefits shall be unique and non-precedent setting. The Severance Plan is available to all salaried employees on a nondiscriminatory basis; therefore, amounts that would be payable to theour named executive officers upon a Qualified Termination have been excluded from “Compensation Tables -– Potential Payments Upon a Termination or Change of Control” below. The SXL Severance Plan, which was adopted in connection with the Sunoco Logistics Merger, provided for an enhanced minimum severance benefit for personnel terminated in connection with the Sunoco Logistics Merger. The SXL Severance Plan provided for two weeks of annual base salary for each year or partial year up to certain maximum levels depending on the employees title. The benefit levels are summarized below:
|
| | | | |
Employee Level | | Minimum Severance Pay | | Maximum Severance Pay |
Senior Manager or below | | 8 weeks of Base Pay | | 26 weeks of Base Pay |
Director or Senior Director | | 16 weeks of Base Pay | | 39 weeks of Base Pay |
Vice President and above | | 26 weeks of Base Pay | | 52 weeks of Base Pay |
The SXL Severance Plan also provided up to three months of continued group health insurance coverage. In addition, for employees terminated in connection with the Sunoco Logistics Merger received certain accelerated vesting of awards long-term incentive awards under the 2008 Incentive Plan, the 2011 Incentive Plan and the ETP Plan as follows:
|
| | |
Employee Level | | Accelerated Vesting of Outstanding LTIP Awards |
Senior Manager or below | | 30% of the unvested outstanding LTIP awards |
Director or Senior Director | | 40% of the unvested outstanding LTIP awards |
Vice President and above | | 50% of the unvested outstanding LTIP awards |
In 2017, in connection with Mr. Hennigan’s termination of employment, Mr. Hennigan received certain benefits under the SXL Severance Plan, which provided Mr. Hennigan with (i) a severance payment of $637,500.00, which is an amount equal to twelve (12) months of Mr. Hennigan’s base salary; and (ii) payment by ETP of the full cost of Mr. Hennigan’s premium for continued health insurance coverage under ETP's health insurance plan for a period of three (3) months. In addition, Mr. Hennigan became entitled to acceleration of the vesting of 262,652 unvested restricted units (the “Accelerated Units”) awarded to Mr. Hennigan pursuant to the terms of the ETP Plan (formerly the Sunoco Partners LLC Long-Term Incentive Plan, as amended and restated). The Accelerated Units represented consideration of Mr. Hennigan’s non-solicit/non-hire covenant in the Separation Agreement and Full Release of Claims executed by Mr. Hennigan after his termination of employment (the “Hennigan Separation Agreement”). As of his termination date, Mr. Hennigan had a total of 415,261 unvested restricted units under the ETP Plan and other than the Accelerated Units, the remaining 152,609 were immediately forfeited upon his termination. Mr. Hennigan also received payout of his DC Plan (as that term is defined below) account in the amount of $4,381,604, this payment was processed in January 2018 as payout from the DC Plan to Mr. Hennigan was subject to the deferred payment rule of IRC Section 409(a).
In the case of Mr. Gvazdauskas, he became a transition employee as of the closing of the Sunoco Logistics Merger and is expected to remain as such until sometime during the latter part of the first quarter of 2018. Upon his termination, Mr. Gvazdauskas will be entitled to receive (i) a severance payment of $221,538.46, which is an amount equal to thirty-six (36) weeks of Mr. Gvazdauskas base salary; and (ii) payment by ETP of the full cost of his premium for continued health insurance coverage under ETP's health insurance plan for a period of three (3) months. In addition, Mr. Gvazdauskas will become entitled to acceleration of the vesting of 30,180 unvested restricted units (the “Accelerated Units”) awarded to Mr. Gvazdauskas pursuant to the terms of the ETP Plan. The Accelerated Units will represent consideration for his non-solicit/non-hire covenant in the Separation Agreement and Full Release of Claims to be executed by Mr. Gvazdauskas after his termination of employment (the “Gvazdauskas Separation Agreement”). As of December 31, 2017, Mr. Gvazdauskas had a total of 60,359 unvested restricted units under the ETP Plan and other than the Accelerated Units, the remaining 30,179 will be immediately forfeited upon his termination. All payments to Mr. Gvazdauskas will be subject to his execution and non-revocation of the Gvazdauskas Separation Agreement.
ETPEnergy Transfer LP Non-Qualified Deferred Compensation Plan. ETP maintains (the “ET NQDC Plan”) is a deferred compensation plan, (“DC Plan”), which permits eligible highly compensated employees to defer a portion of their salary, bonus, and/or bonusquarterly non-vested phantom unit distribution equivalent income until retirement, or termination of employment or other
designated distribution. Underdistribution event. Each year under the DCET NQDC Plan, each year eligible employees are permitted to make an irrevocable election to defer up to 50% of their annual base salary, 50% of their quarterly non-vested phantom unit distribution income, and/or 50% of their discretionary performance bonus compensation to be earned for services performed during the following year. Pursuant to the DCET NQDC Plan, ETPET may make annual discretionary matching contributions to participants’ accounts; however, ETPET has not made any discretionary contributions to participants’ accounts and currently has no plans to make any discretionary contributions to participants’ accounts. All amounts credited under the DCET NQDC Plan (other than discretionary credits) are immediately 100% vested. Participant accounts are credited with deemed earnings or losses based on hypothetical investment fund choices made by the participants among available funds.
Participants may elect to have their accountsaccount balances distributed in one lump sum payment or in annual installments over a period of three or five years upon retirement, and in a lump sum upon other termination.termination events. Participants may also elect to take lump-sum in-service withdrawals five years or longer in the future, and such scheduled in-service withdrawals may be further deferred prior to the withdrawal date. Upon a change in control (as defined in the DCET NQDC Plan) of ETP,ET, all DCET NQDC Plan accounts are immediately vested in full. However, distributions are not accelerated and, instead, are made in accordance with the DCET NQDC Plan’s normal distribution provisions unless a participant has elected to receive a change of control distribution pursuant to his deferral agreement.
ETP Deferred Compensation Plan for Former Sunoco Executives. The ETP Deferred Compensation Plan for Former Sunoco Executives (“Sunoco Logistics DC Plan”) is a deferred compensation plan established by ETP in connection with ETP’s acquisition None of Sunoco Logistics. In 2012, Mr. Hennigan waived any future rights or benefits to which he otherwise would have been entitled under both the Sunoco, Inc. Executive Retirement Plan (“SERP”), a non-qualified, unfunded plan that provided supplemental pension benefits over and above the benefits under the Sunoco, Inc. Retirement Plan (“SCIRP”), a qualified defined benefit plan sponsored by Sunoco, Inc., under which benefits are subject to IRS limits for pay and amount, and Sunoco Logistics’ pension restoration plan, in return for which, $2,789,413 of such deferred compensation benefits was credited to Mr. Hennigan’s account under the Sunoco Logistics DC Plan. Mr. Hennigan is the onlyour named executive officer eligible toofficers currently participate in the Sunoco Logistics DC Plan. Mr. Hennigan’s account is 100 percent vested and will be distributed in one lump sum payment upon his retirement or termination of employment, or other designated distribution event, including a change of control (as defined in the Sunoco Logistics DC Plan). His account is credited with deemed earnings (or losses) based on hypothetical investment fund choices made by him among available funds. As noted above, Mr. Hennigan received payout of $4,381,604 in connection with his termination. This payment was processed in January 2018 as Mr. Hennigan’s payout from the DC Plan was subject to deferred payment rule of IRC Section 409(a).this plan.
Risk Assessment Related to our Compensation Structure. ETP believesStructure. We believe that the compensation plans and programs for theour named executive officers, as well as our other employees, are appropriately structured and are not reasonably likely to result in material risk to ETP. ETP believes theus. We believe these compensation plans and programs are structured in a manner that does not promote excessive risk-taking that could harm our value or reward poor judgment. ETPWe also believes thatbelieve we have allocated compensation is allocated among base salary and short and long-term compensation in such a way as to not encourage excessive risk-taking. In particular, ETPwe generally doesdo not adjust base annual salaries for the executive officers and other employees significantly from year to year, and therefore the annual base salary of our employees is not generally impacted by ETP’sour overall financial performance or the financial performance of an operating segment. Whether,a portion of our operations. Our subsidiaries generally determine whether, and to what extent, thetheir respective named executive officers receive a cash bonus is generally determined based on the achievement of specified financial performance objectives as well as the individual contributions of theour named executive officers to ETP’sthe Partnership’s success. RestrictedWe and our subsidiaries use restricted units orand phantom units rather than unit options are used for equity awards because restricted units orand phantom units retain value even in a depressed market so that employees are less likely to take unreasonable risks to get, or keep, options “in-the-money.” Finally, the time-based vesting over five years for our long-term incentive awards ensures that employees’the interests of employees align with those of the unitholders.our unitholders and our subsidiaries’ unitholders for our long-term performance.
Tax and Accounting Implications of Equity-Based Compensation Arrangements
Deductibility of Executive Compensation
We are a limited partnership and not a corporation for United States federal income tax purposes. Therefore, we believe that the compensation paid to the named executive officers is not subject to the deduction limitations under Section 162(m) of the Internal Revenue Code and therefore is generally fully deductible for United States federal income tax purposes.
Accounting for Unit-BasedNon-Cash Compensation
For our unit-basednon-cash compensation arrangements including equity-based awards issued to certain of our named executive officers by an affiliate (as discussed above), we record compensation expense over the vesting period of the awards, as discussed further in Note 98 to our consolidated financial statements.
Compensation Committee Interlocks and Insider Participation
We do not have a compensation committee and have not since the time of the Energy Transfer Merger. Messrs. Anderson, Grimm and SkidmoreWashburne are the only members of the ET Compensation Committee. During 2017,2019, no member of the ET Compensation Committee was an officer or employee of usET, ETO or any of our subsidiaries or served as an officer of any company with respect to which any of ournamed executive officers served on such company’s board of directors. In addition, neither Mr. Grimm nor Mr. Skidmore is not a former employee of ours or any of our subsidiaries. Mr. Anderson was previously an employee of the Partnership until his retirement in October 2009.
Board Report on Compensation
Following the Energy Transfer Merger, the duties of the ETO Compensation Committee
The have been delegated to the ET Compensation Committee of theCommittee. The board of directors of our General Partner has reviewed and discussed the section entitled “Compensation Discussion and Analysis” with the management of ETP.management. Based on this review and discussion, we have recommended to the board of directors of our General Partner that the Compensation Discussion and Analysis be included in this annual report on Form 10-K.
The Compensation Committee of the
Board of Directors of Energy Transfer Partners, L.L.C., the
general partner of Energy Transfer Partners GP, L.P., the
general partner of Energy Transfer Partners,Operating, L.P.
Michael K. Grimm
Kelcy L. Warren
Matthew S. Ramsey
Marshall S. (Mackie) McCrea, III
David K. Skidmore
W. Brett Smith
William P. Williams
The foregoing report shall not be deemed to be incorporated by reference by any general statement or reference to this annual report on Form 10-K into any filing under the Securities Act of 1933, as amended, or the Securities Exchange Act of 1934, as amended, except to the extent that we specifically incorporate this information by reference, and shall not otherwise be deemed filed under those Acts.
Compensation Tables
Summary Compensation Table
|
| | | | | | | | | | | | | | | | | | | | | | | | | | | | | | | | | | |
| Name and Principal Position | | Year | | Salary ($) | | Bonus (1) ($) | | Equity Awards (2) ($) | | Option Awards ($) | | Non-Equity Incentive Plan Compensation ($) | | Change in Pension Value and Nonqualified Deferred Compensation Earnings (3) ($) | | All Other Compensation (4) ($) | | Total ($) |
Kelcy L. Warren (5) | | 2017 | | $ | 5,926 |
| | $ | — |
| | $ | — |
| | $ | — |
| | $ | — |
| | $ | — |
| | $ | — |
| | $ | 5,926 |
|
| Chief Executive Officer | | 2016 | | 5,920 |
| | — |
| | — |
| | — |
| | — |
| | — |
| | 58 |
| | 5,978 |
|
| | 2015 | | 6,338 |
| | — |
| | — |
| | — |
| | — |
| | — |
| | — |
| | 6,338 |
|
| Thomas E. Long | | 2017 | | 480,846 |
| | 625,100 |
| | 2,519,954 |
| | — |
| | — |
| | — |
| | 18,320 |
| | 3,644,220 |
|
| Chief Financial Officer | | 2016 | | 454,154 |
| | 560,865 |
| | 2,007,697 |
| | — |
| | — |
| | — |
| | 14,679 |
| | 3,037,395 |
|
| | 2015 | | 399,207 |
| | 480,296 |
| | 1,447,063 |
| | — |
| | — |
| | — |
| | 14,282 |
| | 2,340,848 |
|
| Marshall S. (Mackie) McCrea, III | | 2017 | | 1,027,846 |
| | 1,644,554 |
| | 9,033,341 |
| | — |
| | — |
| | — |
| | 16,834 |
| | 11,722,575 |
|
| Group Chief Operating Officer and Chief Commercial Officer | | 2016 | | 1,009,231 |
| | 1,533,990 |
| | 8,059,413 |
| | — |
| | — |
| | — |
| | 14,818 |
| | 10,617,452 |
|
| | 2015 | | 840,385 |
| | 1,294,192 |
| | 6,646,354 |
| | — |
| | — |
| | — |
| | 14,282 |
| | 8,795,213 |
|
| | | | | | | | | | | | | | | | | | |
Matthew S. Ramsey (6) | | 2017 | | 642,404 |
| | 835,125 |
| | 3,763,893 |
| | — |
| | — |
| | — |
| | 18,618 |
| | 5,260,040 |
|
| President and Chief Operating Officer | | 2016 | | 630,769 |
| | 838,901 |
| | 3,433,894 |
| | — |
| | — |
| | — |
| | 87,375 |
| | 4,990,939 |
|
| | 2015 | | 72,115 |
| | 200,000 |
| | 2,749,161 |
| | — |
| | — |
| | — |
| | 2,587 |
| | 3,023,863 |
|
| James M. Wright, Jr. | | 2017 | | 393,971 |
| | 453,067 |
| | 1,087,508 |
| | — |
| | — |
| | — |
| | 14,402 |
| | 1,948,948 |
|
| General Counsel | | 2016 | | 378,462 |
| | 377,506 |
| | 858,464 |
| | — |
| | — |
| | 47,766 |
| | 14,447 |
| | 1,676,645 |
|
| | | | | | | | | | | | | | | | | |
|
|
Michael J. Hennigan(7) | | 2017 | | 318,750 |
| | — |
| | — |
| | — |
| | — |
| | 699,022 |
| | 6,127,145 |
| | 7,144,917 |
|
| Former President and Chief Executive Officer of Sunoco Partners LLC | | 2016 | | 630,769 |
| | 830,092 |
| | 3,088,040 |
| | — |
| | — |
| | 360,066 |
| | 14,818 |
| | 4,923,785 |
|
| | 2015 | | 611,537 |
| | 856,152 |
| | 3,009,815 |
| | — |
| | — |
| | — |
| | 16,770 |
| | 4,494,274 |
|
| | | | | | | | | | | | | | | | | | |
| Peter J. Gvazdauskas | | 2017 | | 320,000 |
| | — |
| | — |
| | — |
| | — |
| | — |
| | 10,275 |
| | 330,275 |
|
| Former Chief Financial Officer and Treasurer of Sunoco Partners LLC | | 2016 | | 310,384 |
| | 306,000 |
| | 686,221 |
| | — |
| | — |
| | — |
| | 103,651 |
| | 1,406,256 |
|
| | 2015 | | 261,223 |
| | 274,283 |
| | 601,963 |
| | — |
| | — |
| | — |
| | 80,363 |
| | 1,217,832 |
|
| | | | | | | | | | | | | | | | | | |
|
| | | | | | | | | | | | | | | | | | | | | | | | | | | | | | |
| Name and Principal Position | | Year | | Salary ($) | | Bonus ($) | | Equity Awards (1) ($) | | Non-Equity Incentive Plan Compensation(2) ($) | | Change in Pension Value and Nonqualified Deferred Compensation Earnings ($) | | All Other Compensation(3) ($) | | Total ($) |
Kelcy L. Warren (4) | | 2019 | | $ | 6,156 |
| | $ | — |
| | $ | — |
| | $ | — |
| | $ | — |
| | $ | — |
| | $ | 6,156 |
|
| Chief Executive Officer | | 2018 | | 6,138 |
| | — |
| | — |
| | — |
| | — |
| | — |
| | 6,138 |
|
| | 2017 | | 5,926 |
| | — |
| | — |
| | — |
| | — |
| | — |
| | 5,926 |
|
| Thomas E. Long | | 2019 | | 570,869 |
| | — |
| | 3,352,795 |
| | 900,000 |
| | — |
| | 21,544 |
| | 4,845,208 |
|
| Chief Financial Officer | | 2018 | | 537,338 |
| | 1,000,000 |
| | 4,251,335 |
| | 800,000 |
| | — |
| | 21,294 |
| | 6,609,967 |
|
| | 2017 | | 480,846 |
| | — |
| | 2,519,954 |
| | 625,100 |
| | — |
| | 18,320 |
| | 3,644,220 |
|
| Marshall S. (Mackie) McCrea, III | | 2019 | | 1,094,260 |
| | — |
| | 8,734,720 |
| | 1,750,817 |
| | — |
| | 21,544 |
| | 11,601,341 |
|
| President and Chief Commercial Officer | | 2018 | | 1,059,976 |
| | — |
| | 7,834,782 |
| | 1,866,000 |
| | — |
| | 19,362 |
| | 10,780,120 |
|
| | 2017 | | 1,027,846 |
| | — |
| | 9,033,341 |
| | 1,644,554 |
| | — |
| | 16,834 |
| | 11,722,575 |
|
| Matthew S. Ramsey | | 2019 | | 683,913 |
| | — |
| | 3,123,186 |
| | 889,100 |
| | — |
| | 19,544 |
| | 4,715,743 |
|
| Chief Operating Officer | | 2018 | | 662,486 |
| | — |
| | 2,818,415 |
| | 900,000 |
| | — |
| | 19,294 |
| | 4,400,195 |
|
| | 2017 | | 642,404 |
| | — |
| | 3,763,893 |
| | 835,125 |
| | — |
| | 18,618 |
| | 5,260,040 |
|
| Thomas P. Mason | | 2019 | | 619,899 |
| | — |
| | 2,749,440 |
| | 805,900 |
| | — |
| | 19,544 |
| | 4,194,783 |
|
| Executive Vice President, General Counsel and President – LNG | | 2018 | | 600,477 |
| | — |
| | 2,466,882 |
| | 858,700 |
| | — |
| | 19,294 |
| | 3,945,353 |
|
| | 2017 | | 582,275 |
| | — |
| | 2,816,048 |
| | 756,958 |
| | — |
| | 18,618 |
| | 4,173,899 |
|
| |
(1) | The discretionary cash bonus amounts for named executive officers for 2017 reflect cash bonuses approved by the ETE Compensation Committee and the ETP Compensation Committee, as applicable, in February 2018 that are expected to be paid on or before March 15, 2018. |
| |
(2)
| Equity award amounts reflect the aggregate grant date fair value of unit awards granted for the periods presented, computed in accordance with FASB ASC Topic 718. For Messrs. Long McCrea and Ramsey amounts include equity awards of our subsidiaries and/or affiliates, as reflected in the “Grants of Plan-Based Awards Table.” See Note 9 to our consolidated financial statements included in “Item 8. Financial Statements and Supplementary Data” for additional assumptions underlying the value of the equity awards. |
| |
(3)(2)
| During 2017, Mr. Wright had an unrealized lossET maintains the Bonus Plan which provides for discretionary bonuses. Awards of $3,245discretionary bonuses are tied to achievement of targeted performance objectives and described in his account balance under the DC Plan.Compensation Discussion and Analysis. The |
discretionary cash bonus amounts earned by the named executive officers for 2019 reflect cash bonuses approved by the ET Compensation Committee in February 2020 that are expected to be paid on or before March 15, 2020.
| |
(4)(3)
| The amounts reflected for 20172019 in this column include (i) matching contributions to the ET 401(k) planPlan made by ETP on behalf of the named executive officers of $13,500$14,000 each for each of Messrs. Long, McCrea, Ramsey and Mason, (ii) health savings account contributions made on behalf of the named executive officers of $2,000 each for Messrs. Long and McCrea, and Wright, $12,750 for Mr. Hennigan and $9,846 for Mr. Gvazdauskas, (ii)(iii) the dollar value of life insurance premiums paid for the benefit of the named executive officers, (iii) $348,173 in severance payments for Mr. Hennigan, and (iv) $5,475,506 to Mr. Hennigan, which represents the value of the accelerated restricted common units under the ETP Plan as consideration for the restrictive covenant contained in the Hennigan Separation Agreement.officers. The amounts reflected for all periods exclude distribution payments in connection with distribution equivalent rights on unvested unit awards, because the dollar value of such distributions are factored into the grant date fair value reported in the “Unit“Equity Awards” column of the Summary Compensation Table at the time that the unit awards and distribution equivalent rights were originally granted. For 2017,2019, distribution payments in connection with distribution equivalent rights totaled $796,382 for Mr. Long, $2,178,361 for Mr. McCrea, $857,108 for Mr. Ramsey, and $756,879 for Mr. Mason. |
distribution equivalent rights totaled $423,809 for Mr. Long, $1,928,181 for Mr. McCrea, $619,224 for Mr. Ramsey, $187,055 for Mr. Wright, $438,100 for Mr. Hennigan and $147,237 for Mr. Gvazdauskas.
| |
(5)(4)
| Mr. Warren has voluntarily determined that his salary wouldwill be reduced to $1.00 per year (plus an amount sufficient to cover his allocated payroll deductions for health and welfare benefits). He also does not accept a cash bonus or any equity awards under the equity incentive plans. |
| |
(6)
| Mr. Ramsey serves as a member of the board of directors of ETE, the owner of our General Partner. Mr. Ramsey’s other compensation for 2015 does not include $104,400 of director fees paid in cash by ETE. Mr. Ramsey was also a non-employee director of Sunoco LP during 2015, until his November appointment to our General Partner, and his 2015 other compensation does not include $354,210 of director fees paid in cash by Sunoco LP. |
| |
(7)
| The amounts shown for Mr. Hennigan reflect the change in present value for all defined benefit pension plans and supplemental executive retirement plans in which he participated. The applicable disclosure rules require the change in pension value be shown as “$0” if the actual calculation of the change in pension value is less than zero (i.e., a decrease). The decrease in SCIRP pension value for Mr. Hennigan was $49,762 for 2015. The year-over-year change in actuarial present value of Mr. Hennigan’s pension benefits under the SCIRP for 2015 was negative because Sunoco, Inc. terminated the SCIRP on October 31, 2014. Mr. Hennigan elected to receive his accrued SCIRP benefit in the form of a lump sum. Because the estimate of the present value of his SCIRP benefit at year-end 2014 assumed that Mr. Hennigan (under the Final Average Pay formula) had a 90 percent probability of electing a lump sum rather than an annuity (which would be transferred to an insurance company with a premium of 47.5%) at December 1, 2015 as part of the plan termination, the change in actuarial present value from the estimate at year-end 2014 was negative because no such premium was paid, resulting in a lower present value of his benefit. Mr. Hennigan did not have any above market preferential payments on deferred compensation during 2017, 2016 or 2015.
|
Grants of Plan-Based Awards Tablein 2019
| | | Name | | Grant Date | | All Other Unit Awards: Number of Units (#) | | All Other Option Awards: Number of Securities Underlying Options (#) | | Exercise or Base Price of Option Awards ($ / Unit) | | Grant Date Fair Value of Unit Awards(1) | | Grant Date | | All Other Unit Awards: Number of Units (#) | | Grant Date Fair Value of Unit Awards (1) |
| ETP Unit Awards: | | | | | | | | | |
| ET Unit Awards: | | | | | |
| Kelcy L. Warren | | N/A | | — |
| | — |
| | $ | — |
| | $ | — |
| | N/A | | — |
| | $ | — |
|
| Thomas E. Long | | N/A | | — |
| | — |
| | — |
| | — |
| | 12/16/2019 | | 215,000 |
| | 2,752,000 |
|
| Marshall S. (Mackie) McCrea, III | | N/A | | — |
| | — |
| | — |
| | — |
| |
| Marshal S. (Mackie) McCrea, III | | | 12/16/2019 | | 682,400 |
| | 8,734,720 |
|
| Matthew S. Ramsey | | N/A | | — |
| | — |
| | — |
| | — |
| | 12/16/2019 | | 189,600 |
| | 2,426,880 |
|
| James M. Wright, Jr. | | 12/21/2017 | | 62,250 |
| | — |
| | — |
| | 1,087,508 |
| |
| Michael J. Hennigan | | N/A | | — |
| | — |
| | — |
| | — |
| |
| Peter J. Gvazdauskas | | N/A | | — |
| | — |
| | — |
| | — |
| |
| ETE Unit Awards: | | | | | | | | | |
| Thomas E. Long | | 12/20/2017 | | 121,074 |
| | — |
| | — |
| | 2,035,254 |
| |
| Marshall S. (Mackie) McCrea, III | | 12/20/2017 | | 537,379 |
| | — |
| | — |
| | 9,033,341 |
| |
| Matthew S. Ramsey | | 12/20/2017 | | 223,908 |
| | — |
| | — |
| | 3,763,893 |
| |
| Thomas P. Mason | | | 12/16/2019 | | 214,800 |
| | 2,749,440 |
|
| Sunoco LP Unit Awards: | | | | | | | | | | | | |
| Thomas E. Long | | 12/21/2017 | | 17,097 |
| | — |
| | — |
| | 484,700 |
| | 12/16/2019 | | 19,500 |
| | 600,795 |
|
| Matthew S. Ramsey | | | 12/16/2019 | | 22,600 |
| | 696,306 |
|
| |
(1) | We have computed the grant date fair value of unit awards in accordance with FASB ASC Topic 718, as further described above and in Note 98 to our consolidated financial statements. |
Narrative Disclosure to Summary Compensation Table and Grants of the Plan-Based Awards Table
A description of material factors necessary to understand the information disclosed in the tables above with respect to salaries, bonuses, equity awards nonqualified deferred compensation earnings (and losses), and 401(k) plan contributions can be found in the Compensation Discussion and Analysis that precedes these tables.
Outstanding Equity Awards at 20172019 Fiscal Year-End Table
|
| | | | | | | | | |
| | | | | Unit Awards (1) |
| Name | | Grant Date(1) | | Number of Units That Have Not Vested(2) (#) | | Market or Payout Value of Units That Have Not Vested (3) ($) |
| ETP Unit Awards: | | | | | | |
| Kelcy L. Warren | | — | | — |
| | $ | — |
|
| Thomas E. Long | | 12/29/2016 | | 59,053 |
| | 1,058,229 |
|
| | | 12/9/2015 | | 27,788 |
| | 497,952 |
|
| | | 12/4/2015 | | 11,208 |
| | 200,847 |
|
| | | 12/16/2014 | | 8,192 |
| | 146,792 |
|
| | | 12/5/2013 | | 6,516 |
| | 116,767 |
|
| Marshall S. (Mackie) McCrea, III | | 12/29/2016 | | 336,386 |
| | 6,028,028 |
|
| | | 12/9/2015 | | 185,261 |
| | 3,319,868 |
|
| | | 12/4/2015 | | 93,390 |
| | 1,673,549 |
|
| | | 12/16/2014 | | 37,590 |
| | 673,613 |
|
| | | 12/5/2014 | | 16,454 |
| | 294,863 |
|
| | | 12/30/2013 | | 41,625 |
| | 745,920 |
|
| | | 12/3/2013 | | 21,840 |
| | 391,373 |
|
| Matthew S. Ramsey | | 12/29/2016 | | 143,438 |
| | 2,570,400 |
|
| | | 12/9/2015 | | 115,785 |
| | 2,074,867 |
|
| James M. Wright, Jr. | | 12/21/2017 | | 62,250 |
| | 1,115,520 |
|
| | | 12/29/2016 | | 35,859 |
| | 642,593 |
|
| | | 12/9/2015 | | 21,930 |
| | 392,986 |
|
| | | 12/16/2014 | | 5,462 |
| | 97,886 |
|
| | | 12/30/2013 | | 4,440 |
| | 79,565 |
|
| Michael J. Hennigan | | N/A | | — |
| | — |
|
| Peter J. Gvazdauskas | | 12/12/2016 | | 29,668 |
| | 531,651 |
|
| | | 12/5/2015 | | 23,350 |
| | 418,432 |
|
| | | 12/5/2014 | | 3,661 |
| | 65,605 |
|
| | | 12/5/2013 | | 3,680 |
| | 65,946 |
|
| | | | | | | |
| Sunoco LP Unit Awards: | | | | | | |
| Thomas E. Long | | 12/21/2017 | | 17,097 |
| | 485,555 |
|
| | | 12/29/2016 | | 22,210 |
| | 630,764 |
|
| | | 12/16/2015 | | 14,125 |
| | 401,150 |
|
| Matthew S. Ramsey | | 1/2/2015 | | 2,035 |
| | 57,794 |
|
| | | 11/10/2014 | | 299 |
| | 8,486 |
|
| | | | | | | |
| ETE Unit Awards: | | | | | | |
| Thomas E. Long | | 12/20/2017 | | 121,074 |
| | 2,089,737 |
|
| Matthew S. Ramsey | | 12/20/2017 | | 223,908 |
| | 3,864,652 |
|
| Marshall S. (Mackie) McCrea, III | | 12/20/2017 | | 537,379 |
| | 9,275,162 |
|
|
| | | | | | | | | |
| Name | | Grant Date(1) | | Unit Awards (1) |
Number of Units That Have Not Vested(2) (#) | | Market or Payout Value of Units That Have Not Vested (3) ($) |
| ET Unit Awards: | | | | | | |
| Kelcy L. Warren | | N/A | | — |
| | $ | — |
|
| Thomas E. Long | | 12/16/2019 | | 215,000 |
| | 2,758,450 |
|
| | | 12/18/2018 | | 136,475 |
| | 1,750,974 |
|
| | | 10/19/2018 | | 115,200 |
| | 1,478,016 |
|
| | | 12/20/2017 | | 121,074 |
| | 1,553,379 |
|
| | | 12/29/2016 | | 30,235 |
| | 387,918 |
|
| | | 12/9/2015 | | 14,227 |
| | 182,535 |
|
| | | 12/4/2015 | | 5,739 |
| | 73,635 |
|
| Marshal S. (Mackie) McCrea, III | | 12/16/2019 | | 682,400 |
| | 8,755,192 |
|
| | | 12/18/2018 | | 605,740 |
| | 7,771,644 |
|
| | | 12/20/2017 | | 537,379 |
| | 6,894,573 |
|
|
| | | | | | | | | |
| | | 12/29/2016 | | 172,231 |
| | 2,209,729 |
|
| | | 12/9/2015 | | 94,855 |
| | 1,216,987 |
|
| | | 12/4/2015 | | 47,816 |
| | 613,480 |
|
| Matthew S. Ramsey | | 12/16/2019 | | 189,600 |
| | 2,432,568 |
|
| | | 12/18/2018 | | 168,260 |
| | 2,158,776 |
|
| | | 12/20/2017 | | 223,908 |
| | 2,872,740 |
|
| | | 12/29/2016 | | 73,440 |
| | 942,235 |
|
| | | 12/9/2015 | | 59,282 |
| | 760,592 |
|
| Thomas P. Mason | | 12/16/2019 | | 214,800 |
| | 2,755,884 |
|
| | | 12/18/2018 | | 190,640 |
| | 2,445,911 |
|
| | | 12/20/2017 | | 135,300 |
| | 1,735,899 |
|
| | | 12/29/2016 | | 40,645 |
| | 521,474 |
|
| | | 12/9/2015 | | 22,391 |
| | 287,277 |
|
| | | 12/4/2015 | | 11,287 |
| | 144,812 |
|
| | | | | | | |
| Sunoco LP Unit Awards: | | | | | | |
| Thomas E. Long | | 12/16/2019 | | 19,500 |
| | $ | 596,700 |
|
| | | 12/19/2018 | | 19,325 |
| | 591,345 |
|
| | | 12/21/2017 | | 17,097 |
| | 523,168 |
|
| | | 12/29/2016 | | 8,884 |
| | 271,850 |
|
| | | 12/16/2015 | | 5,650 |
| | 172,890 |
|
| Matthew S. Ramsey | | 12/16/2019 | | 22,600 |
| | 691,560 |
|
| | | 12/19/2018 | | 23,825 |
| | 729,045 |
|
| | | 1/2/2015 | | 814 |
| | 24,908 |
|
| Thomas P. Mason | | 12/21/2017 | | 19,106 |
| | 584,644 |
|
| | | 12/29/2016 | | 9,320 |
| | 285,192 |
|
| | | 12/16/2015 | | 7,410 |
| | 226,752 |
|
| |
(1) | In connection with the April 28, 2017 merger between ETP and Sunoco Logistics, each outstanding unvested ETP restricted unit converted into 1.5 units of Sunoco Logistics, maintaining the same terms as the original ETP award. In connection with the merger, Sunoco Logistics changed its name to Energy Transfer Partners, L.P. Certain of these outstanding awards represent ETPEnergy Transfer Partners, L.P. awards that converted into Sunoco LogisticsET awards upon the merger of Energy Transfer Equity, L.P. and Energy Transfer Partners, L.P. in October 2018. Furthermore, some of those converted awards had previously been converted in connection with the merger.merger of Energy Transfer Partners, L.P. and Sunoco Logistics in April 2017. |
| |
(2) | ETP and Sunoco LP commonET unit awards outstanding vest at a rate of 60% in December 2022 and 40% in December 2024 for awards granted in December 2019. Such awards may be settledat the election of the ET Compensation Committee in (i) common units of ET (subject to the approval of the ET Incentive Plans prior to the first vesting date by a majority of ET’s unitholders pursuant to the rules of the New York Stock Exchange); (ii) cash equal to the Fair Market Value (as such term is defined in the ET Incentive Plans) of the ET common units that would otherwise be delivered pursuant to the terms of each named executive officers grant agreement; or (iii) other securities or property in an amount equal to the Fair Market Value of ET common units that would otherwise be delivered pursuant to the terms of the grant agreement, or a combination thereof as follows:determined by the ET Compensation Committee in its discretion. |
Other unit awards outstanding vest as follows:
at a rate of 60% in December 2021 and 40% in December 2023 for awards granted in October and December 2018;
at a rate of 60% in December 2020 and 40% in December 2022 for awards granted in December 2017;
at a rate of 60% in December 2019 and 40% in December 2021 for awards granted in December 2016;
at a rate of 60% in December 2018 and 40% in December 2020 for awards granted in January 2015 and December 2015;
100% in December 20192021 for the remaining outstanding portion of awards granted in December 2014 and November 2015;2016; and
100% in December 20182020 for the remaining outstanding portion of all other awards.
ETE common unit awards outstanding vest at a rate of 60% in December 2020 and 40% in December 2022 for awards granted in December 2017.2015.
| |
(3) | Market value was computed as the number of unvested awards as of December 31, 20172019 multiplied by the closing price of our Common Units or Sunoco LP or ETErespective common units accordingly, on December 31, 2017. of ET and Sunoco LP. |
Option Exercises and
Units Vested Tablein 2019
| | | | | Unit Awards | | Unit Awards |
| Name | | Number of Units Acquired on Vesting (1) (#) | | Value Realized on Vesting(1) ($) | | Number of Units Acquired on Vesting (#) | | Value Realized on Vesting ($) (1) |
| ETP Unit Awards: | | | | | |
| ET Unit Awards: | | | | | |
| Kelcy L. Warren | | — |
| | $ | — |
| | N/A |
| | $ | — |
|
| Thomas E. Long | | 18,471 |
| | 301,576 |
| | 55,839 |
| | 647,730 |
|
| Marshall S. (Mackie) McCrea, III | | | 327,520 |
| | 3,799,236 |
|
Matthew S. Ramsey | | — |
| | — |
| | 110,161 |
| | 1,277,868 |
|
| Marshall S. (Mackie) McCrea, III | | 107,733 |
| | 1,758,957 |
| |
| James M. Wright, Jr. | | 11,794 |
| | 192,544 |
| |
| Michael J. Hennigan | | 262,652 |
| | 5,475,506 |
| |
| Peter J. Gvazdauskas | | 7,492 |
| | 122,322 |
| |
| Thomas P. Mason | | | 85,300 |
| | 989,482 |
|
| Sunoco LP Unit Awards: | | | | | |
| Thomas E. Long | | | 13,326 |
| | 401,779 |
|
| Matthew S. Ramsey | | | 299 |
| | 9,033 |
|
| Thomas P. Mason | | | 13,980 |
| | 421,497 |
|
| |
(1) | Amounts presented represent the number of units subject to awards that vested during 2017 and the value realized upon vesting of such units,these awards, which is calculated as the number of units subject to vestingvested multiplied by the applicable closing market price of our Common Unitsapplicable common units upon the vesting date. |
We have not issued option awards.
Nonqualified Deferred Compensation
The following table provides the voluntary salary deferrals made by the named executive officers in 2017 under the DC Plan and, in the case of Mr. Hennigan, the Sunoco Logistics DC Plan.
|
| | | | | | | | | | | | | | | | | | | | |
| Name | | Executive Contributions in Last FY ($) | | Registrant Contributions in Last FY ($) | | Aggregate Earnings in Last FY ($) | | Aggregate Withdrawals/Distributions ($) | | Aggregate Balance at Last FYE ($) |
| Kelcy L. Warren | | $ | — |
| | $ | — |
| | $ | — |
| | $ | — |
| | $ | — |
|
| Thomas E. Long | | — |
| | — |
| | — |
| | — |
| | — |
|
| Matthew S. Ramsey | | — |
| | — |
| | — |
| | — |
| | — |
|
| James M. Wright, Jr. | | — |
| | — |
| | (3,245 | ) | | — |
| | 70,202 |
|
| Michael J. Hennigan | | — |
| | — |
| | 699,022 |
| | (4,381,604 | ) | | — |
|
A description of the key provisions of the DC Plan and the Sunoco Logistics DC Plan can be found in the Compensation Discussion and Analysis that precedes these tables above.
Potential Payments Upon a Termination or Change of Control
Equity Awards. As discussed in our Compensation Discussion and Analysis above, any unvested equity awards granted pursuant the ET Incentive Plans will automatically become vested upon a change of control, which is generally defined as the occurrence of one or more of the following events: (i) any person or group becomes the beneficial owner of 50% or more of the voting power or voting securities of ET or its general partner; (ii) LE GP, LLC or an affiliate of LE GP, LLC ceases to be the general partner of ET; or (iii) the sale or other disposition, including by liquidation or dissolution, of all or substantially all of the assets of ET in one or more transactions to anyone other than an affiliate of ET.
In addition, as explained in Equity Awards section of our Compensation Discussion and Analysis above, the restricted unit awards and phantom unit awards under the 2008ET Incentive Plan,Plans, the 2011 Incentive Plan, as well as, the ETPSunoco LP Plan and the 2012 Sunoco LP equity plan,Plan generally require the continued employment of the recipient during the vesting period, provided however, the unvested awards will be accelerated in the event of the death or disability of the award recipient prior to the applicable vesting period being satisfied. In addition,All awards outstanding to the named executive officers under the ET Incentive Plans, the 2018 Sunoco LP Plan or the 2012 Sunoco LP Plan would be accelerated in the event of a change in control all awards granted in 2014, 2015 and 2016 underof the 2008 Incentive Plan or the 2011 Incentive Plan, as applicable, and/or the ETP Plan and the Sunoco LPPartnership.
The October 20108 equity plan would be accelerated. For awards granted under the 2008 Incentive Plan or the ETP Plan and the Sunoco LP equity plan prioraward to December 2014, unless otherwise specifiedMr. Long included a provision in the applicable award agreement for acceleration of unvested restricted unit/restricted phantom unit awards may also become vested upon a change in control attermination of employment by the discretiongeneral partner of the applicable compensation committee. This discussion assumespartnership issuing the award without “cause.” For purposes of the awards the term “cause” shall mean: (i) a scenario in whichconviction (treating a nolo contendere plea as a conviction) of a felony (whether or not any right to appeal has been or may be exercised), (ii) willful refusal without proper cause to perform duties (other than any such refusal resulting from incapacity due to physical or mental impairment), (iii) misappropriation, embezzlement or reckless or willful destruction of property of the ETPpartnership or any of its affiliates, (iv) knowing breach of any statutory or common law duty of loyalty to the partnership or any of its or their affiliates, (v) improper conduct materially prejudicial to the business of the partnership or any of its or their affiliates, (vi) material breach of the provisions of any agreement regarding confidential information entered into with the partnership or any of its or their affiliates or (vii) the continuing failure or refusal to satisfactorily perform essential duties to the partnership or any of its or their affiliates.
In addition, the ET Compensation Committee the Sunoco Logistics Compensation Committee
orand the compensation committee of the general partner of Sunoco LP, did not exercise their discretion to accelerate unvested awards in connection with a change in control of the Partnership.
The awards under the 2008 Incentive Plan, the 2011 Incentive Plan and the 2014, 2015 and 2016 awards under the ETP Plan (formerly the Sunoco Logistics Plan) and Sunoco LP equity incentive plan all provide for acceleration of vesting in the event of the death or disability of the award recipient. In addition, the ETP Compensation Committee hashave approved a retirement provision, which provides that employees, including the named executive officers with at least ten years of service with the general partner, who leave the respective general partner voluntarily due to retirement (i) after age 65 but prior to age 68 are eligible for accelerated vesting of 40% of his or her award for named executive officers age 65 toaward; or (ii) after 68 or 50% of his or her award for named executive officers over age 68. Under the assumption described above, none of the restricted units granted in December 2016 would vest upon a named executive officer’s retirement because none of such officers met the age criteria for vesting at such time. For 2015 and 2016, the Sunoco Logistics Compensation Committee included a provision in their award agreements which provided that an employee with at least ten years of service, who leaves employment voluntarily due to retirement, isare eligible for accelerated vesting of 40% of50% his or her award from age 65 to 68 or 50% of his or her award over age 68.award. The acceleration of the awards is subject to the applicable provisions of IRC Section 409(A).
In the event of death, the named executive officers participateFebruary 2016, Mr. Mason received a one-time special incentive retention bonus in the life insurance plans offered to all employees (i.e., life insurance benefits equal to one and one-half timesamount of $6,300,000 (the “Special Bonus”). The approval of the named executive officer’s annual base salary, up toSpecial Bonus was conditioned upon entry by Mr. Mason into a maximum of $750,000 plus any supplemental life insurance elected and paid for by the named executive officer).
In 2017, in connection with Mr. Hennigan’s termination of employment, Mr. Hennigan received certain benefits under the SXL Severance Plan,Retention Agreement (the “Retention Agreement”) which provided Mr. Hennigan with acceleratedcertain requirements for continued employment, including the following requirements that are still in effect: (i) if, after the third (3rd) anniversary but prior to the fourth (4th) anniversary of the vestingeffective date of 262,652 unvested restricted units (the “Accelerated Units”the Retention Agreement, Mr. Mason’s employment terminates (other than as a result of (x) a termination without cause by ET or by Mr. Mason
for Good Reason; (y) his death; or (z) his permanent disability), he will be obligated to remit and repay seventy-five percent (75%) awarded to Mr. Hennigan pursuantof the Special Bonus; and (ii) if, after the fourth (4th) anniversary but prior to the termsfifth (5th) anniversary of the ETP Plan. The Accelerated Units represented considerationeffective date of the Retention Agreement, Mr. Hennigan’s non-solicit/non-hire covenant in the Separation Agreement and Full ReleaseMason’s employment terminates (other than as a result of Claims executed(x) a termination without cause by ET or by Mr. Hennigan afterMason for Good Reason; (y) his termination of employment (the “Hennigan Separation Agreement”). As ofdeath; or (z) his termination date, Mr. Hennigan had a total of 415,261 unvested restricted units under the ETP Planpermanent disability), he will be obligated to remit and other than the Accelerated Units, the remaining 170,609 were immediately forfeited upon his termination.
In the case of Mr. Gvazdauskas, he became a transition employee asrepay fifty percent (50%) of the closing ofSpecial Bonus. Mr. Mason entered into the Sunoco Logistics Merger and is expected to remain as such until the latter part of the first quarter 2018. Upon his termination, Mr. Gvazdauskas will be entitled to receive acceleration of the vesting of 30,180 unvested restricted units (the “Accelerated Units”) awarded to Mr. Gvazdauskas pursuant to the terms of the ETP Plan. The Accelerated Units will represent consideration for his non-solicit/non-hire covenant in the SeparationRetention Agreement and Full Release of Claims to be executed by Mr. Gvazdauskas after his termination of employment (the “Gvazdauskas Separation Agreement”). As of December 31, 2017, Mr. Gvazdauskas had a total of 60,359 unvested restricted units under the ETP Plan and other than the Accelerated Units, the remaining 30,179 will be immediately forfeited upon his termination.on February 24, 2016.
Deferred Compensation PlansPlan. As discussed in theour Compensation Discussion and Analysis above, all amounts under the DC Plan and the Sunoco LogisticsET NQDC Plan (other than discretionary credits) are immediately 100% vested. Upon a change inof control (as defined in the DC Plan and/or the Sunoco Logistics DCET NQDC Plan), distributions from the respective plansplan would be made in accordance with the normal distribution provisions of the respective plan. A change inof control is generally defined in the DC Plan and the Sunoco LogisticsET NQDC Plan as any change inof control event within the meaning of Treasury Regulation Section 1.409A-3(i)(5).
As noted above, Mr. Hennigan received payout of $4,381,604 in connection with his termination. This payment was processed in January 2018 as Mr. Hennigan’s payout from the DC Plan was subject to deferred payment rule of IRC Section 409(a).
CEO Pay Ratio
In accordance with Section 953(b) of the Dodd-Frank Wall Street Reform and Consumer Protection Act, and Item 402(u) of Regulation S-K, set forth below is information about the relationship of the annual total compensation of Mr. Warren, ETP’sthe Chairman and Chief Executive Officer and the annual total compensation of our employees.
For the 20172019 calendar year:
The annual total compensation of Mr. Warren, as reported in the Summary Compensation Tables of this Item 11was $5,926;$6,156; and
TheFor 2019, the median total compensation of the employees supporting ETPETO (other than Mr. Warren) was $115,226.$124,622, which amount was updated from 2017 for the designated “median employee.”
Based on this information, for 20172019 the rationratio of the annual total compensation of Mr. Warren to the median of the annual total compensation of the 8,4948,256 employees supporting ETPETO as of December 31, 20172019 was approximately 1 to 1920 as Mr. Warren has voluntarily elected not to accept any salary, bonus or equity incentive compensation (other than a salary of $1.00 per year plus an amount sufficient to cover his allocated employee premium contributions for health and welfare benefits).
To identify the median of the annual total compensation of the employees supporting ETP,ETO, the following steps were taken:
| |
| 1. | It was determined that, as of December 31, 2017,2019, the applicable employee populations consisted of 8,4948,256 with all of the identified individuals being employed in the United States. This population consisted of all of our full-time and part-time employees. We did not engage any independent contractors in 20172018 or 2019 that are required to be included in our employee population for the CEO pay ratio evaluation. |
| |
| 2. | To identify the “median employee” from our employee population, we compared the total earnings of our employees as reflected in our payroll records as reported on Form W-2 for 2017.2017 and, for 2019, updated with compensation of the “median employee” as reflected in our payroll records as reported on Form W-2 for 2019. |
| |
| 3. | We identified our median employee using W-2 reporting and applied this compensation measure consistently to all of our employees required to be included in the calculation. We did not make any cost of living adjustments in identifying the “median employee”.employee.” |
| |
| 4. | Once we identified our median employee, we combined all elements of the employee’s compensation for 20172019 resulting in an annual compensation of $115,226.$124,622. The difference between such employee’s total earnings and the employee’s total compensation represents the estimated value of the employee’s health care benefits (estimated for the employee and such employee’s eligible dependents at $10,800)$10,989) and the employee’s 401(k) matching contribution and profit sharing contribution (estimated at $5,846$6,040 per employee, includes $3,633$3,775 per employee on average matching contribution and $2,213$2,265 per employee on average profit sharing contribution (employees earning over $175,000 in base are ineligible for profit sharing)). |
| |
| 5. | With respect to Mr. Warren, we used the amount reported in the “Total” column of our 20172019 Summary Compensation Table under this Item 11. |
Director Compensation
The Compensation Committee periodically reviews and makes recommendations regardingIn 2019, the compensation ofarrangements for outside directors included a $100,000 annual retainer for services on the directors of our General Partner. In 2017, non-employee directors each received an annual fee of $50,000 in cash. Additionally, the Chairman ofboard. If a director served on the Audit Committee, receives an annual fee of $15,000 and the members of the Audit Committeesuch director would receive an annual feecash retainer of $10,000. The Chairman$15,000 or $25,000 in the case of the ETPchairman. If a director served on the ET Compensation Committee, receives an annual fee of $7,500 and the members of the ETP Compensation Committeesuch director would receive an annual feeretainer of $5,000. In 2017, members$7,500 or $15,000 in the case of the chairman. The fees for membership on the Conflicts Committee received cash paymentsare determined on a to-be-determinedper instance basis for each Conflicts Committee assignment. Employee
The outside directors including Mr. Warren, do not receive any fees for service as directors. In addition,of our General Partner are also entitled to an annual restricted unit award under the non-employee directors participate in the 2008ET Incentive Plan. Each director who is not also (i) a shareholder or a direct or indirect employee of any parent, or (ii) a direct or indirect employee of ETP LLC, ETP, or a subsidiary, who is elected or appointed to the Board for the first time shall automatically receive, on the date of his or her election or appointment, an award of 2,500 unvested ETP Common Units. In 2017, non-employee directors received annual grants of restricted Common UnitsPlans equal to an aggregate of $100,000 divided by the closing price of our Common UnitsET common units on the date of grant, whichgrant. These ET common units will vest 60% after the third year and the remaining 40% after the fifth year after the grant date. The compensation expense recorded is based on the grant-date market value of ET common units and is recognized over the vesting period. Distributions are paid during the vesting period.
The compensation paid to the non-employee directors of our General Partner in 20172019 is reflected in the following table:
|
| | | | | | | | | | | | | | | | |
| Name | | Fees Paid in Cash(1) ($) | | Unit Awards(2) ($) | | All Other Compensation ($) | | Total ($) |
| Ted Collins, Jr. | | $ | 94,010 |
| | $ | 100,372 |
| | $ | — |
| | $ | 194,382 |
|
| Michael K. Grimm | | 147,310 |
| | 100,372 |
| | — |
| | 247,682 |
|
| David K. Skidmore | | 141,844 |
| | 100,372 |
| | — |
| | 242,216 |
|
Former Sunoco Logistics Board Members (3): | | | | | | |
| Steven R. Anderson | | 84,125 |
| | 100,372 |
| | — |
| | 184,497 |
|
| Scott A. Angelle | | 66,308 |
| | 100,372 |
| | — |
| | 166,680 |
|
| Basil Leon Bray | | 67,141 |
| | 100,372 |
| | — |
| | 167,513 |
|
|
| | | | | | | | | | | | |
| Name | | Fees Paid in Cash(1) ($) | | Unit Awards(2) ($) | | All Other Compensation ($) | | Total ($) |
| David K. Skidmore | | 125,000 |
| | 99,998 |
| | — |
| | 224,998 |
|
| W. Brett Smith | | 115,000 |
| | 99,998 |
| | — |
| | 214,998 |
|
| William P. Williams | | 115,000 |
| | 99,998 |
| | — |
| | 214,998 |
|
| |
(1) | Fees paid in cash are based on amounts paid during the period. |
| |
(2) | Unit award amounts reflect the aggregate grant date fair value of awards granted based on the market price of Common UnitsET common units or ETO common units (prior to the Energy Transfer Merger), accordingly, as of the grant date. |
| |
(3)
| Upon completion of the Sunoco Logistics Merger, the unvested unit awards of the former board members of the general partner of Sunoco Logistics were vested in full. |
As of December 31, 2017, Messrs. Collins and Grimm each2019, Mr. Skidmore had 12,455 unit awards23,136 unvested ET restricted units outstanding, Mr. Smith had 10,747 unvested ET restricted units outstanding and Mr. SkidmoreWilliams had 13,319 unit awards21,243 unvested ET restricted units outstanding.
For 2018, the Board of our General Partner has approved modifications to the compensation of non-employee directors of our General Partner. The directors will receive an annual retainer fee of $100,000 in cash, up from $50,000 in 2017. In addition, the
Chairman of the Audit Committee will receive an annual fee of $25,000, up from $15,000 in 2017 and the members of the Audit Committee will receive an annual fee of $15,000, up from $10,000. The Chairman of the ETP Compensation Committee will receive an annual fee of $15,000, up from 7,500 in 2017 and the members of the ETP Compensation Committee receive an annual fee of $7,500, up from $5,000 in 2017. The fees for membership on the Conflicts Committee will continue to be determined on a per instance basis for each Conflicts Committee assignment.
Additionally for 2018, annual grants of restricted Common Units will remain equal to an aggregate of $100,000 to be divided by the closing price of our Common Units on the date of grant, which will vest 60% after the third year and the remaining 40% after the fifth year after the grant date.
The proposed compensation changes for the non-employee directors for 2018 were developed in consultation with Mr. Warren after considering the results of a review of directors’ compensation by Longnecker during 2017.
ITEM 12. SECURITY OWNERSHIP OF CERTAIN BENEFICIAL OWNERS AND MANAGEMENT AND RELATED UNITHOLDER MATTERS
Equity Compensation Plan Information
The following table sets forth,Partnership does not currently have any equity compensation plans. In connection with the Energy Transfer Merger in tabular format, a summaryOctober 2018, all of certain information related to ourthe Partnership’s equity incentivecompensation plans, as well as the Partnership’s obligations under those plans, were assumed by ET.
Energy Transfer Operating, L.P. Units
All of the Partnership’s common units are owned by ET and its subsidiaries as of December 31, 2017:
|
| | | | | | | | | | |
| Plan Category | | Number of securities to be issued upon exercise of outstanding options, warrants and rights(a) | | Weighted-average exercise price of outstanding options, warrants and rights(b) | | Number of securities remaining available for future issuance under equity compensation plans (excluding securities reflected in column(a))(c) |
| Equity compensation plans approved by security holders | | 14,201,612 |
| | $ | — |
| | 8,393,837 |
|
| Equity compensation plans not approved by security holders | | — |
| | — |
| | — |
|
| Total | | 14,201,612 |
| | $ | — |
| | 8,393,837 |
|
Energy Transfer Partners, L.P. Units
The following table sets forth certain information as of February 16, 2018, regarding2019. In addition, the beneficial ownership of our securities by certain beneficial owners, each directorPartnership has Class K, Class L and named executive officer of our General Partner and all directors and executive officers of our General Partner as a group. The General Partner knows of no other person not disclosed herein who beneficially owns more than 5% of our Common Units.
|
| | | | | | | | |
| Title of Class | | Name and Address of Beneficial Owner(1) | | Beneficially Owned(2)(3) | | Percent of Class |
| Common Units | | Kelcy L. Warren | | 2,031,646 |
| | * |
|
| | | Thomas E. Long | | 51,868 |
| | * |
|
| | | Marshall S. (Mackie) McCrea, III | | 330,430 |
| | * |
|
| | | Matthew S. Ramsey | | 23,033 |
| | * |
|
| | | James M. Wright, Jr. | | 33,893 |
| | * |
|
| | | A. Troy Sturrock | | 19,937 |
| | * |
|
| | | Michael J. Hennigan | | 573,543 |
| | * |
|
| | | Peter J. Gvazdauskas | | 35,232 |
| | * |
|
| | | Michael K. Grimm | | 61,246 |
| | * |
|
| | | David K. Skidmore (4) | | 33,250 |
| | * |
|
| | | Ray C. Davis (5) | | 544,200 |
| | * |
|
| | | W. Brett Smith | | 14,800 |
| | * |
|
| | | All Directors and Executive Officers as a Group (12 Persons) | | 3,753,078 |
| | * |
|
| | | ETE (6) | | 27,535,127 |
| | 2.4 | % |
| | | ALPS Advisors, Inc. (7) | | 59,554,331 |
| | 5.1 | % |
| Class E Units | | Heritage Holdings, Inc.(8) | | 8,853,832 |
| | 100 | % |
| Class G Units | | Sunoco, Inc. (9) | | 90,706,000 |
| | 100 | % |
| Class K Units | | Sunoco, Inc. (9) | | 64,102,567 |
| | 100 | % |
| Class K Units | | Heritage Holdings, Inc. (8) | | 19,509,477 |
| | 100 | % |
| Class K Units | | SUG Holding Company LLC | | 17,913,385 |
| | 100 | % |
| |
(1)
| Unless otherwise indicated, the address for all beneficial owners listed above is 8111 Westchester Drive, Suite 600, Dallas, Texas 75225. The address for Mr. McCrea is 800 E. Sonterra Blvd., San Antonio, Texas 78258. The address for Mr. Hennigan is 3807 West Chester Pike, Newtown Square, Pennsylvania 19073. The address for Sunoco, Inc. is 3801 West Chester Pike, Newtown Square, Pennsylvania, 19073. The address for ALPS Advisors, Inc. is 1290 Broadway, Suite 1100, Denver, Colorado 80203. |
| |
(2)
| Beneficial ownership for the purposes of the foregoing table is defined by Rule 13d-3 under the Exchange Act. Under that rule, a person is generally considered to be the beneficial owner of a security if he has or shares the power to vote or direct the voting thereof or to dispose or direct the disposition thereof or has the right to acquire either of those powers within sixty (60) days. |
| |
(3)
| Due to the ownership by certain officers and directors of the general partner of ETE of equity interests in ETE (either directly or through one or more entities) and due to their positions as directors of the general partner of ETE, they may be deemed to beneficially own the limited partnership interests held by ETE, to the extent of their respective interests therein. Any such deemed ownership is not reflected in the table. |
| |
(4)
| Total includes 4,443 commonClass M units, held in a trust for the benefit of Mr. Skidmore’s daughter over which Mr. Skidmore has voting power. Mr. Skidmore disclaims beneficial ownership of such units. |
| |
(5)
| Includes 85,605 units held by RCD Stock Holdings, LLC and 458,595 units held by Avatar BW, Ltd. |
| |
(6)
| ETE owns all member interests of Energy Transfer Partners, L.L.C and all of the Class A limited partner interests and Class B limited partner interests in Energy Transfer Partners GP, L.P. Energy Transfer Partners, L.L.C. is the general partner of Energy Transfer Partners GP, L.P. with a 0.01% general partner interest. LE GP, LLC, the general partner of ETE, may be |
deemed to beneficially own the Common Units owned of record by ETE. The members of LE GP, LLC are Ray C. Davis and Kelcy L. Warren.
| |
(7)
| Information reflected herein for ALPS Advisors, Inc. (“AAI”) is based on its Schedule 13G filed on February 6, 2018. AAI, a registered investment adviser, furnishes investment advice to investment companies registered under the Investment Company Act of 1940 (collectively referred to as the “Funds”). In its role as investment advisor, AAI has voting and/or investment power over the ETP common units that are owned by the Funds, and may be deemed to be the beneficial owner of the ETP common units held by the Funds. However, all units reported in this table are owned by the Funds. AAI disclaims beneficial ownership of such common units. The Funds have the right to receive or the power to direct the receipt of dividends from, or the proceeds from the sale of ETP common units held in their respective accounts. Alerian MLP ETF is an investment company registered under the Investment Company Act of 1940 and is one of the Funds to which AAI provides investment advice. The interest of Alerian MLP ETF, as reported in its February 6, 2018 Schedule 13G, amounted to 59,348,430 common units, or 5.1% of the total outstanding ETP common units. |
| |
(8)
| The Partnership indirectly owns 100% of the common stock of Heritage Holdings, Inc. |
| |
(9)
| The Partnership indirectly owns 100% of the common stock of Sunoco, Inc. |
In connection with the Parent Company Credit Agreement, ETE and certain of its subsidiaries entered into a Pledge and Security Agreement (the “Security Agreement”) with Credit Suisse AG, Cayman Islands Branch, as collateral agent (the “Collateral Agent”). The Security Agreement secures all of ETE’s obligations underwhich are held by wholly-owned subsidiaries of the Parent Company Credit Agreement and grants to the Collateral Agent a continuing first priority lien on, and security interest in, all of ETE’s and the other grantors’ tangible and intangible assets.Partnership.
ITEM 13. CERTAIN RELATIONSHIPS AND RELATED TRANSACTIONS, AND DIRECTOR INDEPENDENCE
For a discussion of director independence, see Item 10. “Directors, Executive Officers and Corporate Governance.”
As a policy matter, the Conflicts Committee generally reviews any proposed related-party transaction that may be material to the Partnership to determine whether the transaction is fair and reasonable to the Partnership. The Partnership’s board of directors makes the determinations as to whether there exists a related-party transaction in the normal course of reviewing transactions for approval as the Partnership’s board of directors is advised by its management of the parties involved in each material transaction as to which the board of directors’ approval is sought by the Partnership’s management. In addition, the Partnership’s board of directors makes inquiries to independently ascertain whether related parties may have an interest in the proposed transaction. While there are no written policies or procedures for the board of directors to follow in making these determinations, the Partnership’s board makes those determinations in light of its contractually-limited fiduciary duties to the Unitholders. The Partnership Agreement provides that any matter approved by the Conflicts Committee will be conclusively deemed to be fair and reasonable to the Partnership, approved by all the partners of the Partnership and not a breach by the General Partner or its Board of Directors of any duties they may owe the Partnership or the Unitholders (see “Risks Related to Conflicts of Interest” in “Item 1A. Risk Factors” in this annual report).
ETEET owns directly and indirectly the general partner interest in ETP GP 100%and all of the ETP Incentive Distribution Rights and 27.5 million ETPoutstanding ETO Common Units.
We have a shared services agreement in which we provide various general and administrative services for ETE. See discussion in Note 1415 to our consolidated financial statements.
We previously had an operating lease agreement with the former ownersstatements, included in “Item 8. Financial Statements and Supplementary Data” for a discussion of ETG, including Mr. Warren and Mr. Davis. We paid these former owners $5 million in annual operating lease payments during the term of the lease and made a one-time payment of $8.8 million in August 2017 and we retained the equipment when the lease expired at that time. With respect to theour related party transaction with ETG, the Conflicts Committee of ETP met numerous times prior to the consummation of the transaction to discuss the terms of the transaction. The committee made the determination that the sale of ETG to ETP was fair and reasonable to ETP and that the terms of the operating lease between ETP and the former owners of ETG are fair and reasonable to ETP.transactions.
We received $6 million, $21 million and $23 million in management fees from ETE for the provision of various general and administrative services for ETE’s benefit for the years ended December 31, 2017, 2016, and 2015, respectively.Class M Units
On July 27, 2016, the Partnership1, 2019, ETO issued to ETE an aggregate amounta total of 180 Class J220.5 million units representingof a new class of limited partner interests in the Partnership (the “Class J Units”). A portion of the additionaltitled Class JM Units will be issued during each of 2016, 2017 and 2018. Each Class J Unit is entitled to an allocation of $10.0 million of depreciation, amortization, depletion or other form of cost-recovery during the year in which such Class J Unit was issued; no Class J Unit is entitled to any other allocations of depreciation, amortization, depletion or other cost-recovery in any other year, and such units are not entitled to any cash distributions at any time. In exchange for the issuance of the Class J Units, ETP’s partnership agreement was amended to further reduce incentive
distributions commencing with the quarter ended June 30, 2016 and ending with the quarter ending December 31, 2017, in an aggregate amount of $720 million.
In March 2016, ETP contributed to Sunoco LP its remaining 68.42% interest in Sunoco, LLC and 100% interest in the legacy Sunoco, Inc. retail business for $2.23 billion. Sunoco LP paid $2.20 billion in cash, including a working capital adjustment and issued 5.7 million Sunoco LP common units to Retail Holdings,Holdco, a wholly-owned subsidiary of the Partnership.
Class K Units
On December 29, 2016, the Partnership, issued to certain of its indirect subsidiaries, in exchange for cash contributions and the exchangecontribution of outstanding common units representing limited partner interestsETP Holdco’s equity ownership interest in PEPL to the Partnership,Partnership.
The Class KM Units each of which isgenerally do not have any voting rights. The Class M Units are entitled to a quarterly cash distributiondistributions of $0.67275$0.20 per Class K Unit prior to ETP making distributionsM Unit. Distributions shall be paid quarterly, in arrears, within 45 days after the end of available cash to any class of units, excluding any cash available distributions or dividends or capital stock sales proceeds received by ETP from ETP Holdco. If the Partnership is unable to payeach quarter. As the Class K Unit quarterly distribution with respect to any quarter,M Units are owned by a wholly-owned subsidiary, the accrued and unpaidcash distributions will accumulate until paid and any accumulated balance will accrue 1.5% per annum until paid. As of December 31, 2017, a total of 101.5 million Class K Units were held by wholly-owned subsidiaries of ETP.on those units are eliminated in our consolidated financial statements.
ITEM 14. PRINCIPAL ACCOUNTING FEES AND SERVICES
The following sets forth fees billed by Grant Thornton LLP for the audit of our annual financial statements and other services rendered (dollars in millions):
| | | | Years Ended December 31, | Years Ended December 31, |
| | 2017 | | 2016 | 2019 | | 2018 |
Audit fees(1) | $ | 7.5 |
| | $ | 6.4 |
| $ | 10.8 |
| | $ | 11.1 |
|
Audit related fees(2) | — |
| | 0.4 |
| 0.1 |
| | 0.5 |
|
Tax fees(3)(2) | — |
| | 0.1 |
| — |
| | 0.1 |
|
| Total | $ | 7.5 |
| | $ | 6.9 |
| $ | 10.9 |
| | $ | 11.7 |
|
| |
(1) | Includes fees for audits of annual financial statements of our companies, reviews of the related quarterly financial statements, and services that are normally provided by the independent accountants in connection with statutory and regulatory filings or engagements, including reviews of documents filed with the SEC and services related to the audit of our internal control over financial reporting. |
| |
(2) | Includes fees in 2016 for financial statement audits and interim reviews of subsidiary entities in connection with contribution and sale transactions. Includes fees in 2016 in connection with the service organization control report on Panhandle’s centralized data center. |
| |
(3)
| Includes fees2018 related to state and local tax consultation. |
Pursuant to the charter of the Audit Committee, the Audit Committee is responsible for the oversight of our accounting, reporting and financial practices. The Audit Committee has the responsibility to select, appoint, engage, oversee, retain, evaluate and terminate our external auditors; pre-approve all audit and non-audit services to be provided, consistent with all applicable laws, to us by our external auditors; and establish the fees and other compensation to be paid to our external auditors. The Audit Committee also oversees and directs our internal auditing program and reviews our internal controls.
The Audit Committee has adopted a policy for the pre-approval of audit and permitted non-audit services provided by our principal independent accountants. The policy requires that all services provided by Grant Thornton LLP, including audit services, audit-related services, tax services and other services, must be pre-approved by the Audit Committee. All fees paid or expected to be paid to Grant Thornton LLP for fiscal years 20172019 and 20162018 were pre-approved by the Audit Committee in accordance with this policy.
The Audit Committee reviews the external auditors’ proposed scope and approach as well as the performance of the external auditors. It also has direct responsibility for and sole authority to resolve any disagreements between our management and our external auditors regarding financial reporting, regularly reviews with the external auditors any problems or difficulties the auditors encountered in the course of their audit work, and, at least annually, uses its reasonable efforts to obtain and review a report from the external auditors addressing the following (among other items):
the auditors’ internal quality-control procedures;
any material issues raised by the most recent internal quality-control review, or peer review, of the external auditors;
the independence of the external auditors;
the aggregate fees billed by our external auditors for each of the previous two years; and
the rotation of the lead partner.
PART IV
ITEM 15. EXHIBITS AND FINANCIAL STATEMENT SCHEDULES
|
| | |
| The following documents are filed as a part of this Report: | Page |
| | | |
| | (1) Financial Statements – see Index to Financial Statements | |
| | | |
| | (2) Financial Statement Schedules – None | |
| | | |
| | (3) Exhibits – see Index to Exhibits | |
ITEM 16. FORM 10-K SUMMARY
None.
INDEX TO EXHIBITS
The exhibits listed on the following Exhibit Index are filed as part of this report. Exhibits required by Item 601 of Regulation S-K, but which are not listed below, are not applicable.
|
| | |
| Exhibit Number | | Description |
| 2.1 | | |
2.2 | | Amendment No. 1, dated December 1, 2011, to the Contribution and Redemption Agreement by and among Energy Transfer Partners, L.P., Energy Transfer Partners GP, L.P., Heritage ETC, L.P. and AmeriGas Partners, L.P. dated October 15, 2011 (incorporated by reference to Exhibit 2.1 to the Registrant’s Form 8-K filed December 7, 2011). |
2.3 | | Amendment No. 2, dated January 11, 2012, to the Contribution and Redemption Agreement by and among Energy Transfer Partners, L.P., Energy Transfer Partners GP, L.P., Heritage ETC, L.P. and AmeriGas Partners, L.P. dated October 15, 2011 (incorporated by reference to Exhibit 10.1 to Exhibit 2.1 to Registrant’s Form 8-K filed on January 13, 2012). |
2.4 | | Agreement and Plan of Merger, dated as of April 29, 2012 by and among Energy Transfer Partners, L.P., Sam Acquisition Corporation, Energy Transfer Partners GP, L.P., Sunoco, Inc. and, for certain limited purposes set forth therein, Energy Transfer Equity, L.P. (incorporated by reference to Exhibit 2.1 to Registrant’s Form 8-K filed on May 1, 2012). |
2.5 | | Amendment No. 1, dated as of June 15, 2012, to the Agreement and Plan of Merger, dated as of April 29, 2012, by and among Energy Transfer Partners, L.P., Sam Acquisition Corporation, Energy Transfer Partners GP, L.P., Sunoco, Inc., and, for certain limited purposes set forth therein, Energy Transfer Equity, L.P. (incorporated by reference to Exhibit 2.2 to Registrant’s Form 8-K filed on June 20, 2012). |
2.6 | | Transaction Agreement, dated as of June 15, 2012, by and among Energy Transfer Partners, L.P., Energy Transfer Partners GP, L.P., Heritage Holdings, Inc., Energy Transfer Equity, L.P., ETE Sigma Holdco, LLC and ETE Holdco Corporation (incorporated by reference to Exhibit 2.1 to Registrant’s Form 8-K filed on June 20, 2012). |
2.7 | | Agreement and Plan of Merger, dated as of April 27, 2014 by and among Energy Transfer Partners, L.P., Drive Acquisition Corporation, Heritage Holdings, Inc., Energy Transfer Partners GP, L.P., Susser Holdings Corporation, and, for certain limited purposes set forth therein, Energy Transfer Equity, L.P. (incorporated by reference to Exhibit 2.1 to Registrant’s Form 8-K filed on April 28, 2014). |
2.8 | | Agreement and Plan of Merger, dated as of January 25, 2015, by and among Energy Transfer Partners, L.P., Energy Transfer Partners GP, L.P., Regency Energy Partners LP, Regency GP LP and, solely for purposes of certain provisions therein, Energy Transfer Equity, L.P. (incorporated by reference to Exhibit 2.1 to Registrant’s Form 8-K filed on January 26, 2015). |
2.92.2 | | Amendment No. 1 to Agreement and Plan of Merger, dated as of February 18, 2015, by and among Energy Transfer Partners, L.P., Energy Transfer Partners GP, L.P., Rendezvous I LLC, Rendezvous II LLC, Regency Energy Partners LP, Regency GP LP, ETE GP Acquirer LLC and, solely for purposes of certain provisions therein, Energy Transfer Equity, L.P. (incorporated by reference to Exhibit 2.2 to Registrant’s Form 8-K filed on February 19, 2015). |
2.102.3 | | |
2.112.4 | | |
2.122.5 | | |
2.132.6 | | Agreement and Plan of Merger, dated as of November 20, 2016, by and among Energy Transfer Partners, L.P., Energy Transfer Partners GP, L.P., Sunoco Logistics Partners L.P., Sunoco Partners LLC and, solely for purposes of certain provisions therein, Energy Transfer Equity, L.P. (incorporate by reference to Exhibit 2.1 of Form 8-K File No. 1-11727, filed November 21, 2016). |
|
| | |
Exhibit Number | | Description |
2.142.7 | | Amendment No. 1 to Agreement and Plan of Merger, dated as of December 16, 2016, by and among Sunoco Logistics Partners L.P., Sunoco Partners LLC, SXL Acquisition Sub LLC, SXL Acquisition Sub LP, Energy Transfer Partners, L.P., Energy Transfer Partners GP, L.P., ETP Acquisition Sub, LLC and, solely for purposes of certain provisions therein, Energy Transfer Equity, L.P. (incorporated by reference to Exhibit 2.2 of Form 8-K File No. 1-11727, filed December 21, 2016). |
2.152.8 | | Contribution Agreement, dated as of January 15, 2018, by and among USA Compression Partners, LP, Energy Transfer Partners, L.P., Energy Transfer Partners GP, L.P., ETC Compression, LLC and, solely for certain purposes therein, Energy Transfer Equity, L.P. (incorporated by reference to Exhibit 2.1 to the Registrant’s Form 8-K filed January 16, 2018). |
2.162.9 | | Purchase Agreement, dated as of January 15, 2018, by and among USA Compression Holdings, LLC, Energy Transfer Equity, L.P., Energy Transfer Partners, L.L.C. and, solely for certain purposes therein, R/C IV USACP Holdings, L.P. and Energy Transfer Partners, L.P. (incorporated by reference to Exhibit 2.2 to the Registrant’s Form 8-K filed January 16, 2018). |
2.172.10 | | |
| 2.11 | | Agreement and Plan of Merger, dated as of August 1, 2018, by and among LE GP, LLC, Energy Transfer Equity, L.P., Streamline Merger Sub, LLC, Energy Transfer Partners, L.L.C. and Energy Transfer Partners, L.P. (incorporated by reference to Exhibit 2.1 to the Form 8-K filed August 3, 2018). |
| 3.1 | | |
3.1.1 | | |
3.2 | | |
3.33.2 | | |
3.3.13.2.1 | | |
3.43.3 | | |
3.4.1 |
| | |
| Exhibit Number | | Description |
| 3.3.1 | | |
3.53.4 | | |
3.5.13.4.1 | | |
3.5.23.4.2 | | |
3.63.5 | | |
3.7 | | |
3.8 | | |
3.8.13.5.1 | | |
3.93.6 | | |
| 3.7 | | |
| 3.8 | | |
| 3.8.1 | | |
| 3.8.2 | | |
| 3.8.3 | | |
| 4.1 | | |
| 4.2 | | |
|
| | |
Exhibit Number | | Description |
| 4.3 | | |
4.4 | | |
4.5 | | |
4.64.4 | | |
4.74.5 | | |
4.8 | | |
4.94.6 | | |
4.104.7 | | |
4.10.1 | | |
4.11 | | |
4.124.8 | | |
4.134.9 | | |
4.14 |
| | |
| Exhibit Number | | Description |
| 4.10 | | |
4.154.11 | | |
4.164.12 | | |
4.174.13 | | |
4.184.14 | | |
4.194.15 | | |
|
| | |
Exhibit Number | | Description |
4.204.16 | | |
4.21 | | First Supplemental Indenture, dated as of March 31, 2009, between Sunoco, Inc. and U.S. Bank National Association, as trustee, to the Indenture, dated as of March 31, 2009, relating to Sunoco, Inc.’s 9.625% Senior Notes due 2015 (incorporated by reference to Exhibit 4.2 to the Registrant’s Form 8-K filed October 5, 2012). |
4.22 | | Second Supplemental Indenture, dated as of October 5, 2012, among Energy Transfer Partners, L.P., Sunoco, Inc. and U.S. Bank National Association, as trustee, to Indenture, dated as of March 31, 2009 (incorporated by reference to Exhibit 4.3 to the Registrant’s Form 8-K filed October 5, 2012). |
4.23 | | |
4.24 | | First Supplemental Indenture, dated as of October 5, 2012, among Energy Transfer Partners, L.P., Sunoco, Inc. and U.S. Bank National Association, as successor trustee to Citibank, N.A., to the Indenture, dated as of June 30, 2000 (incorporated by reference to Exhibit 4.7 to the Registrant’s Form 8-K filed October 5, 2012). |
4.25 | | |
4.264.17 | | |
4.274.18 | | First Supplemental Indenture, dated as of October 5, 2012, among Energy Transfer Partners, L.P., Sunoco, Inc. and U.S. Bank National Association, as successor trustee to Citibank, N.A., to the Indenture, dated as of May 15, 1994 (incorporated by reference to Exhibit 4.9 to the Registrant’s Form 8-K filed October 5, 2012). |
4.284.19 | | Sixteenth Supplemental Indenture, dated as of September 21, 2017, by and among Sunoco Logistics Partners Operations L.P., as issuer, Energy Transfer Partners, L.P., as guarantor, and U.S. Bank National Association, as successor trustee (incorporated by reference to Exhibit 4.4 of Form 8-K filed September 25, 2017). |
4.294.20 | | Fifteenth Supplemental Indenture, dated as of September 21, 2017, by and among Sunoco Logistics Partners Operations L.P., as issuer, Energy Transfer Partners, L.P., as guarantor, and U.S. Bank National Association, as successor trustee (incorporated by reference to Exhibit 4.2 of Form 8-K filed September 25, 2017). |
4.304.21 | | |
4.314.22 | | |
4.324.23 | | |
4.334.24 | | |
4.344.25 | | |
10.1.1+4.26 | | Second Amended and RestatedIndenture, dated as of June 8, 2018, among Energy Transfer Partners, L.P. 2008 Long-Term Incentive Planas issuer, Sunoco Logistics Partners Operations L.P., as guarantor, and U.S. Bank National Association, as trustee (incorporated by reference to Exhibit A4.1 to the Registrant’s Definitive Proxy StatementCurrent Report on Schedule 14AForm 8-K filed October 24, 2014)June 8, 2018). |
10.1.2+4.27 | | |
10.2+4.28 | | |
|
| | |
| Exhibit Number | | Description |
| 4.29 | | Second Supplemental Indenture, dated as of January 15, 2019, by and among Energy Transfer Partners,Operating, L.P. Amended, as issuer, the subsidiary guarantors named therein, and Restated 2004 Unit PlanU.S. Bank National Association, as trustee (incorporated by reference to Exhibit 10.6.64.2 to the Registrant’s Current Report on Form 10-Q for the quarter ended June 30, 2008)8-K filed January 15, 2019). |
10.3+4.30 | | |
| 4.31* | | |
| 4.32* | | |
| 4.33* | | |
| 4.34* | | |
| 10.1+ | | |
|
| | |
Exhibit Number | | Description |
10.4+10.2+ | | |
10.5+10.3+ | | |
10.610.3.1+ | | |
| 10.4 | | |
10.710.5 | | |
10.810.6 | | Cushion Gas Litigation Agreement, dated January 26, 2005, by and among AEP Energy Services Gas Holding Company II, L.L.C. and HPL Storage LP, as Sellers, and La Grange Acquisition, L.P., as Buyer, and AEP Asset Holdings LP, AEP Leaseco LP, Houston Pipe Line Company, LP and HPL Resources Company LP, as Companies (incorporated by reference to Exhibit 10.2 to the Registrant’s Form 8-K filed February 1, 2005). |
10.910.7 | | Purchase and Sale Agreement, dated as of September 14, 2006, among Energy Transfer Partners, L.P. and EFS-PA, LLC (a/k/a GE Energy Financial Services), CDPQ Investments (U.S.), Inc., Lake Bluff, Inc., Merrill Lynch Ventures, L.P. and Kings Road Holdings I, LLC (incorporated by reference to Exhibit 10.1 to the Registrant’s Form 8-K filed September 18, 2006). |
10.1010.8 | | |
10.10.1 | | |
10.11 | | |
10.11.110.8.1 | | |
10.1210.9 | | |
10.1310.10 | | Amendment No. 1 to Five-Year Credit Agreement, Joinder and Increase and Extension Agreement, dated as of October 19, 2018, by and among Energy Transfer Partners, L.P., Sunoco Logistics Partners Operations L.P., and Wells Fargo Bank, National Association, as administrative agent (incorporated by reference to Exhibit 10.1 to the Registrant’s Current Report on Form 8-K filed October 19, 2018). |
| 10.11 | | |
10.1410.11.1 | | Amendment No. 1 to 364-Day Credit Agreement, Joinder and Increase and Extension Agreement, dated as of October 19, 2018, by and among Energy Transfer Partners, L.P., Sunoco Logistics Partners Operations L.P., and Wells Fargo Bank, National Association, as administrative agent (incorporated by reference to Exhibit 10.2 to the Registrant’s Current Report on Form 8-K filed October 19, 2018). |
|
| | |
| Exhibit Number | | Description |
| 10.11.2 | | |
| 10.12 | | |
10.1510.13 | | |
10.1610.14 | | |
10.1710.15 | | |
10.1810.16 | | Contingent Residual Support Agreement by and among Energy Transfer Partners, L.P., AmeriGas Finance LLC, AmeriGas Finance Corp., AmeriGas Partners, L.P. and, for certain limited purposes, UGI Corporation, dated January 12, 2012 (incorporated by reference to Exhibit 10.1 to Registrant’s Form 8-K filed on January 13, 2012). |
10.1910.17 | | Unitholder Agreement by and among Energy Transfer Equity, L.P., Energy Transfer Partners, L.P., Energy Transfer Partners GP, L.P., Heritage ETC, L.P. and AmeriGas Partners, L.P. dated January 12, 2012 (incorporated by reference to Exhibit 10.2 to Registrant’s Form 8-K filed on January 13, 2012). |
|
| | |
Exhibit Number | | Description |
10.20 | | |
10.21 | | |
10.2210.18 | | |
10.2310.19 | | |
10.2410.20 | | |
10.2510.21 | | Eleventh Supplemental Indenture, dated as of April 30, 2015, by and among Regency Energy Partners LP, Regency Energy Finance Corp., the subsidiary guarantors party thereto, Energy Transfer Partners, L.P., as parent guarantor, and U.S. Bank National Association, as trustee (incorporated by reference to Exhibit 10.1 to the Registrant’s Form 8-K filed April 30, 2015). |
10.26 | | Ninth Supplemental Indenture, dated as of April 30, 2015, by and among Regency Energy Partners LP, Regency Energy Finance Corp., the subsidiary guarantors party thereto, Energy Transfer Partners, L.P., as parent guarantor, and Wells Fargo Bank, National Association, as trustee (incorporated by reference to Exhibit 10.2 to the Registrant’s Form 8-K filed April 30, 2015). |
10.27 | | Sixth Supplemental Indenture, dated as of April 30, 2015, by and among Regency Energy Partners LP, Regency Energy Finance Corp., the subsidiary guarantors party thereto, Panhandle Eastern Pipe Line Company, LP, as guarantor, and Wells Fargo Bank, National Association, as trustee (incorporated by reference to Exhibit 10.3 to the Registrant’s Form 8-K filed April 30, 2015). |
10.2810.22 | | Eighth Supplemental Indenture, dated as of April 30, 2015, by and among Regency Energy Partners LP, Regency Energy Finance Corp., the subsidiary guarantors party thereto, Energy Transfer Partners, L.P., as parent guarantor, and Wells Fargo Bank, National Association, as trustee (incorporated by reference to Exhibit 10.4 to the Registrant’s Form 8-K filed April 30, 2015). |
10.2910.23+ | | Second Supplemental Indenture, dated as of April 30, 2015, by and among Regency Energy Partners LP, Regency Energy Finance Corp., the subsidiary guarantors party thereto, Energy Transfer Partners, L.P., as parent guarantor, and Wells Fargo Bank, National Association, as trustee (incorporated by reference to Exhibit 10.5 to the Registrant’s Form 8-K filed April 30, 2015). |
10.30 | | |
10.3110.24 | | Seventh Supplemental Indenture, dated as of May 28, 2015, by and among Regency Energy Partners LP, Regency Energy Finance Corp., the subsidiary guarantors party thereto, Panhandle Eastern Pipe Line Company, LP, Energy Transfer Partners, L.P., as co-obligor, and Wells Fargo Bank, National Association, as trustee (incorporated by reference to Exhibit 10.1 to the Registrant’s Form 8-K filed June 1, 2015). |
10.3210.25 | | |
10.33 | | |
10.34 | | |
10.3510.26 | | |
10.3610.27 | | |
10.3710.28 | | |
|
| | |
| Exhibit Number | | Description |
10.3810.29 | | Contribution Agreement, dated as of July 14, 2015, by and among Susser Holdings Corporation, Heritage Holdings, Inc., ETP Holdco Corporation, Sunoco LP, Sunoco GP LLC and Energy Transfer Partners, L.P. (incorporated by reference to Exhibit 10.1 to the Registrant’s Form 8-K filed July 15, 2015). |
10.3910.30 | | |
10.4010.31 | | Contribution Agreement dated as of November 15, 2015, by and among Sunoco, LLC, Sunoco, Inc., ETP Retail Holdings, LLC, Sunoco LP, Sunoco GP LLC, and solely with respect to Section 11.19 and other provisions related thereto, Energy Transfer Partners, L.P. (incorporated by reference to Exhibit 10.1 to the Registrant’s Form 8-K filed November 19, 2015). |
10.4110.32 | | |
10.4210.33 | | |
10.4310.34 | | |
10.4410.35 | | |
10.4510.36 | | |
12.1*10.37 | | ComputationRegistration Rights Agreement, dated as of Ratio of EarningsApril 2, 2018, by and among Energy Transfer Partners, L.P., Energy Transfer Equity, L.P., USA Compression Partners, LP and USA Compression Holdings, LLC. (incorporated by reference to Fixed Charges.Exhibit 10.1 to the Current Report on Form 8-K filed April 3, 2018). |
12.2*10.38 | | |
18.1*10.39 | | |
| 10.40 | | |
| 21.1* | | |
| 23.1* | | |
| 31.1* | | |
| 31.2* | | |
| 32.1** | | |
| 32.2** | | |
| 101* | | Interactive data files pursuant to Rule 405 of Regulation S-T: (i) our Consolidated Balance Sheets as of December 31, 20172019 and December 31, 2016;2018; (ii) our Consolidated Statements of Operations for the years ended December 31, 2017, 20162019, 2018 and 2015;2017; (iii) our Consolidated Statements of Comprehensive Income for the years ended December 31, 2017, 20162019, 2018 and 2015;2017; (iv) our Consolidated Statement of Partners’ Capital for the years ended December 31, 2017, 20162019, 2018 and 2015;2017; (v) our Consolidated Statements of Cash Flows for the years ended December 31, 2017, 20162019, 2018 and 2015;2017; and (vi) the notes to our Consolidated Financial Statements. |
| 104 | | Cover Page Interactive Data File (embedded within the Inline XBRL document) |
|
| | |
| * | | Filed herewith. |
| ** | | Furnished herewith. |
| + | | Denotes a management contract or compensatory plan or arrangement. |
SIGNATURES
Pursuant to the requirements of Section 13 or 15(d) of the Securities Exchange Act of 1934, the registrant has duly caused this report to be signed on its behalf by the undersigned, thereunto duly authorized.
|
| | |
ENERGY TRANSFER PARTNERS,OPERATING, L.P. |
| | | |
| By: | | Energy Transfer Partners GP, L.P, |
| | | its general partner. |
| By: | | Energy Transfer Partners, L.L.C., |
| | | its general partner |
| | | |
| By: | | /s/ Kelcy L. Warren |
| | | Kelcy L. Warren |
| | | Chief Executive Officer and officer duly authorized to sign on behalf of the registrant |
Dated: February 23, 201821, 2020
Pursuant to the requirements of the Securities Exchange Act of 1934, this report has been signed by the following persons in the capacities and on the dates indicated:
|
| | | | |
| Signature | | Title | | Date |
| | | | | |
| /s/ Kelcy L. Warren | | Chief Executive Officer and Chairman of the Board | | February 23, 201821, 2020 |
| Kelcy L. Warren | | of Directors (Principal Executive Officer) | | |
| | | | | |
| /s/ Thomas E. Long | | Chief Financial Officer | | February 23, 201821, 2020 |
| Thomas E. Long | | (Principal Financial Officer) | | |
| | | | | |
| /s/ A. Troy Sturrock | | Senior Vice President and Controller | | February 23, 201821, 2020 |
| A. Troy Sturrock | | (Principal Accounting Officer) | | |
| | | | | |
| /s/ Matthew S. Ramsey | | President, Chief Operating Officer and Director | | February 23, 201821, 2020 |
| Matthew S. Ramsey | | | | |
| | | | | |
| /s/ Marshall S. McCrea, III | | Chief Commercial Officer and Director | | February 23, 201821, 2020 |
| Marshall S. McCrea, III | | | | |
| | | | |
/s/ Ray C. Davis | | Director | | February 23, 2018 |
Ray C. Davis | | | | |
| | | | |
/s/ Michael K. Grimm | | Director | | February 23, 2018 |
Michael K. Grimm | | | | |
| | | | | |
| /s/ David K. Skidmore | | Director | | February 23, 201821, 2020 |
| David K. Skidmore | | | | |
| | | | | |
| /s/ W. Brett Smith | | Director | | February 23, 201821, 2020 |
| W. Brett Smith | | | | |
| | | | |
| /s/ William P. Williams | | Director | | February 21, 2020 |
| William P. Williams | | | | |
INDEX TO FINANCIAL STATEMENTS
Energy Transfer Partners,Operating, L.P. and Subsidiaries
REPORT OF INDEPENDENT REGISTERED PUBLIC ACCOUNTING FIRM
Board of Directors of Energy Transfer Partners, L.L.C. and
Unitholders of Energy Transfer Partners,Operating, L.P.
Opinion on the financial statements
We have audited the accompanying consolidated balance sheets of Energy Transfer Partners,Operating, L.P. (a Delaware limited partnership) and subsidiaries (the “Partnership”) as of December 31, 20172019 and 2016,2018, the related consolidated statements of operations, comprehensive income, equity, and cash flows for each of the three years in the period ended December 31, 2017,2019, and the related notes (collectively referred to as the “financial statements”). In our opinion, thefinancial statements present fairly, in all material respects, the financial position of the Partnershipas of December 31, 20172019 and 2016,2018, and the results of itsoperations and itscash flows for each of the three years in the period ended December 31, 2017,2019, in conformity with accounting principles generally accepted in the United States of America.
We also have audited, in accordance with the standards of the Public Company Accounting Oversight Board (United States) (“PCAOB”), the Partnership’s internal control over financial reporting as of December 31, 2017, based on criteria established in the 2013 Internal Control-Integrated Framework issued by the Committee of Sponsoring Organizations of the Treadway Commission (“COSO”), and our report dated February 23, 2018 expressed an unqualified opinion thereon.
Change in accounting principle
As discussed in Note 2 to the consolidated financial statements, the Partnership has changed its method of accounting for certain inventories.leases due to the adoption of the new leasing standard. The Partnership adopted the new leasing standard by recognizing a cumulative catch-up adjustment to the opening balance sheet as of January 1, 2019.
Basis for opinion
These financial statements are the responsibility of the Partnership’s management. Our responsibility is to express an opinion on the Partnership’s financial statements based on our audits. We are a public accounting firm registered with the PCAOBPublic Company Accounting Board (United States) (“PCAOB”) and are required to be independent with respect to the Partnership in accordance with the U.S. federal securities laws and the applicable rules and regulations of the Securities and Exchange Commission and the PCAOB.
We conducted our audits in accordance with the standards of the PCAOB. Those standards require that we plan and perform the audit to obtain reasonable assurance about whether the financial statements are free of material misstatement, whether due to error or fraud. The Partnership is not required to have an audit of its internal control over financial reporting. As part of our audits we are required to obtain an understanding of internal control over financial reporting but not for the purpose of expressing an opinion on the effectiveness of the Partnership’s internal control over financial reporting. Accordingly, we express no such opinion.
Our audits included performing procedures to assess the risks of material misstatement of the financial statements, whether due to error or fraud, and performing procedures that respond to those risks. Such procedures included examining, on a test basis, evidence supporting the amounts and disclosures in the financial statements. Our audits also included evaluating the accounting principles used and significant estimates made by management, as well as evaluating the overall presentation of the financial statements. We believe that our audits provide a reasonable basis for our opinion.
Critical audit matters
The critical audit matters communicated below are matters arising from the current period audit of the consolidated financial statements that were communicated or required to be communicated to the audit committee and that: (1) relate to accounts or disclosures that are material to the consolidated financial statements and (2) involved our especially challenging, subjective, or complex judgments. The communication of critical audit matters does not alter in any way our opinion on the consolidated financial statements, taken as a whole, and we are not, by communicating the critical audit matters below, providing separate opinions on the critical audit matters or on the accounts or disclosures to which they relate.
Goodwill Impairment Assessment (Note 2)
Of the $4.9 billion of goodwill on the Partnership’s consolidated balance sheet as of December 31, 2019, approximately $380.0 million is recorded in a reporting unit for which the estimated fair value exceeded the carrying value by less than 20% in the most recent quantitative test. The Partnership engaged third party valuation specialists for the estimation of the fair value of this reporting unit. We identified the estimation of the fair value of the reporting unit as a critical audit matter.
The principal considerations for our determination that the estimation of the fair value of the reporting unit was a critical audit matter are that the extent to which the fair value of the reporting unit exceeds its carrying value is relatively low, the estimate of the future cash flows, including projected growth rates, forecasted costs, discount rates and future market conditions requires a high degree of judgement, and the application of valuation methodologies can be complex.
Our audit procedures related to the estimation of the fair value of the reporting unit included the following procedures, among others. We tested the effectiveness of controls relating to management’s review of the assumptions used to develop the future cash flows, the reconciliation of cash flows prepared by management to the data used in the third party valuation reports, the discount rates used, and valuation methodologies applied. In addition to testing the effectiveness of controls, we also performed the following:
Compared the actual current results of the relevant reporting unit to the expected performance of that reporting unit based on prior period financial forecasts, as applicable.
Utilized an internal valuation specialist to evaluate:
| |
| ◦ | The methodologies used and whether they were acceptable for the underlying assets or operations and being applied correctly by performing independent calculations, |
| |
| ◦ | The appropriateness of the discount rates by recalculating the weighted average costs of capital, and |
| |
| ◦ | The qualifications of the third party valuation specialists engaged by the Partnership based on their credentials and experience. |
Tested the reasonableness of the projected growth rate and forecasted costs by comparing such items to historical operating results of the relevant reporting unit and by assessing the likelihood or capability of the reporting unit to undertake activities or initiatives underpinning significant drivers of growth in the forecasted period.
Environmental Remediation (Note 10)
The Partnership’s operations are subject to extensive federal, tribal, state and local environmental and safety laws and regulations that require expenditures for remediation at current and former facilities. We identified the identification, assessment and estimation of the environmental exposure associated with certain sites of ETC Sunoco Holdings LLC as a critical audit matter.
The principal considerations for our determination that the identification, assessment and estimation of the environmental exposure was a critical audit matter are that there was a high estimation uncertainty due to the complexity of the actuarial methods utilized, the discount rate applied and the potential for changes in the timing and extent of remediation. This required an increased extent of effort when performing audit procedures, related to identification, assessment and estimation of the environmental exposure, including the need to involve actuarial specialists.
Our audit procedures related to the identification, assessment and estimation of the Partnership’s environmental exposure included the following procedures, among others. We tested the effectiveness of controls relating to the identification and review of the historical claims, payments and reserve data provided to the third party actuary specialist and the reconciliation of that data to that used in the actuary report, and the review of the discount rate and actuarial methods applied. In addition to testing the effectiveness of controls, we performed the following procedures:
Utilized an external actuarial specialist to evaluate:
| |
| ◦ | The methodologies used and whether they were acceptable for the underlying operations, |
| |
| ◦ | The qualifications of the third party actuary specialist engaged by the Partnership based on their credentials and experience. |
Evaluated the appropriateness of the discount rate used by comparing it to the historical rate of return from the captive insurance company’s investment portfolio used to fund the underlying liabilities, and
Evaluated the life-to-date payments, reserves, and payment patterns by agreeing the historical claims and payment amounts to the underlying claims or general ledger.
/s/ GRANT THORNTON LLP
We have served as the Partnership’s auditor since 2004.
Dallas, Texas
February 23, 201821, 2020
ENERGY TRANSFER PARTNERS,OPERATING, L.P. AND SUBSIDIARIES
CONSOLIDATED BALANCE SHEETS
(Dollars in millions)
| | | | December 31, | December 31, |
| | 2017 | | 2016* | 2019 | | 2018 |
| ASSETS | | | | | | |
| Current assets: | | | | | | |
| Cash and cash equivalents | $ | 306 |
| | $ | 360 |
| $ | 253 |
| | $ | 418 |
|
| Accounts receivable, net | 3,946 |
| | 3,002 |
| 4,439 |
| | 4,009 |
|
| Accounts receivable from related companies | 318 |
| | 209 |
| 175 |
| | 176 |
|
| Inventories | 1,589 |
| | 1,626 |
| 1,847 |
| | 1,677 |
|
| Income taxes receivable | 135 |
| | 128 |
| 141 |
| | 73 |
|
| Derivative assets | 24 |
| | 20 |
| 23 |
| | 111 |
|
| Other current assets | 210 |
| | 298 |
| 282 |
| | 356 |
|
| Total current assets | 6,528 |
| | 5,643 |
| 7,160 |
| | 6,820 |
|
| | | | | | | |
| Property, plant and equipment | 67,699 |
| | 58,220 |
| 85,359 |
| | 79,280 |
|
| Accumulated depreciation and depletion | (9,262 | ) | | (7,303 | ) | (15,388 | ) | | (12,625 | ) |
| | 58,437 |
| | 50,917 |
| 69,971 |
| | 66,655 |
|
| | | | | | | |
| Advances to and investments in unconsolidated affiliates | 3,816 |
| | 4,280 |
| 3,018 |
| | 2,636 |
|
| Lease right-of-use assets, net | | 877 |
| | — |
|
| Other non-current assets, net | 758 |
| | 672 |
| 976 |
| | 1,006 |
|
| Long-term affiliate receivable | | 5,926 |
| | 440 |
|
| Intangible assets, net | 5,311 |
| | 4,696 |
| 5,695 |
| | 6,000 |
|
| Goodwill | 3,115 |
| | 3,897 |
| 4,902 |
| | 4,885 |
|
| Total assets | $ | 77,965 |
| | $ | 70,105 |
| $ | 98,525 |
| | $ | 88,442 |
|
* As adjusted. See Note 2.
The accompanying notes are an integral part of these consolidated financial statements.
F - 3
4
ENERGY TRANSFER PARTNERS,OPERATING, L.P. AND SUBSIDIARIES
CONSOLIDATED BALANCE SHEETS
(Dollars in millions)
| | | | December 31, | December 31, |
| | 2017 | | 2016* | 2019 | | 2018 |
| LIABILITIES AND EQUITY | | | | | | |
| Current liabilities: | | | | | | |
| Accounts payable | $ | 4,126 |
| | $ | 2,900 |
| $ | 3,625 |
| | $ | 3,491 |
|
| Accounts payable to related companies | 209 |
| | 43 |
| 27 |
| | 119 |
|
| Derivative liabilities | 109 |
| | 166 |
| 147 |
| | 185 |
|
| Operating lease current liabilities | | 54 |
| | — |
|
| Accrued and other current liabilities | 2,143 |
| | 1,905 |
| 3,216 |
| | 2,847 |
|
| Current maturities of long-term debt | 407 |
| | 1,189 |
| 12 |
| | 2,655 |
|
| Total current liabilities | 6,994 |
| | 6,203 |
| 7,081 |
| | 9,297 |
|
| | | | | | | |
| Long-term debt, less current maturities | 32,687 |
| | 31,741 |
| 50,334 |
| | 37,853 |
|
| Long-term notes payable – related company | — |
| | 250 |
| |
| Non-current derivative liabilities | 145 |
| | 76 |
| 273 |
| | 104 |
|
| Non-current operating lease liabilities | | 816 |
| | — |
|
| Deferred income taxes | 2,883 |
| | 4,394 |
| 3,113 |
| | 2,884 |
|
| Other non-current liabilities | 1,084 |
| | 952 |
| 1,109 |
| | 1,184 |
|
| | | | | | | |
| Commitments and contingencies |
| |
|
|
| |
|
| Legacy ETP Preferred Units | — |
| | 33 |
| |
| Redeemable noncontrolling interests | 21 |
| | 15 |
| 492 |
| | 499 |
|
| | | | | | | |
| Equity: | | | | | | |
| Series A Preferred Units (950,000 units authorized, issued and outstanding as of December 31, 2017) | 944 |
| | — |
| |
| Series B Preferred Units (550,000 units authorized, issued and outstanding as of December 31, 2017) | 547 |
| | — |
| |
| Limited Partners: | | | | | | |
| Common Unitholders (1,164,112,575 and 794,803,854 units authorized, issued and outstanding as of December 31, 2017 and 2016, respectively) | 26,531 |
| | 14,925 |
| |
| Class E Unitholder (8,853,832 units authorized, issued and outstanding – held by subsidiary) | — |
| | — |
| |
| Class G Unitholder (90,706,000 units authorized, issued and outstanding – held by subsidiary) | — |
| | — |
| |
| Class H Unitholder (81,001,069 units authorized, issued and outstanding as of December 31, 2016) | — |
| | 3,480 |
| |
| Class I Unitholder (100 units authorized, issued and outstanding) | — |
| | 2 |
| |
| Class K Unitholders (101,525,429 units authorized, issued and outstanding – held by subsidiaries) | — |
| | — |
| |
| General Partner | 244 |
| | 206 |
| |
| Accumulated other comprehensive income | 3 |
| | 8 |
| |
| Series A Preferred Unitholders (950,000 units authorized, issued and outstanding as of December 31, 2019 and 2018, respectively) | | 958 |
| | 958 |
|
| Series B Preferred Unitholders (550,000 units authorized, issued and outstanding as of December 31, 2019 and 2018, respectively) | | 556 |
| | 556 |
|
| Series C Preferred Unitholders (18,000,000 units authorized, issued and outstanding as of December 31, 2019 and 2018, respectively) | | 440 |
| | 440 |
|
| Series D Preferred Unitholders (17,800,000 units authorized, issued and outstanding as of December 31, 2019 and 2018, respectively) | | 434 |
| | 434 |
|
| Series E Preferred Unitholders (32,000,000 units authorized, issued and outstanding as of December 31, 2019) | | 786 |
| | — |
|
| Common Unitholders and Other | | 24,133 |
| | 26,372 |
|
| Accumulated other comprehensive loss | | (18 | ) | | (42 | ) |
| Total partners’ capital | 28,269 |
| | 18,621 |
| 27,289 |
| | 28,718 |
|
| Noncontrolling interest | 5,882 |
| | 7,820 |
| |
| Noncontrolling interests | | 8,018 |
| | 7,903 |
|
| Total equity | 34,151 |
| | 26,441 |
| 35,307 |
| | 36,621 |
|
| Total liabilities and equity | $ | 77,965 |
| | $ | 70,105 |
| $ | 98,525 |
| | $ | 88,442 |
|
* As adjusted. See Note 2.
The accompanying notes are an integral part of these consolidated financial statements.
F - 4
5
ENERGY TRANSFER PARTNERS,OPERATING, L.P. AND SUBSIDIARIES
CONSOLIDATED STATEMENTS OF OPERATIONS
(Dollars in millions, except per unit data)
|
| | | | | | | | | | | |
| | Years Ended December 31, |
| | 2017 | | 2016* | | 2015* |
| REVENUES: | | | | | |
| Natural gas sales | $ | 4,172 |
| | $ | 3,619 |
| | $ | 3,671 |
|
| NGL sales | 6,972 |
| | 4,841 |
| | 3,936 |
|
| Crude sales | 10,184 |
| | 6,766 |
| | 8,378 |
|
| Gathering, transportation and other fees | 4,265 |
| | 4,003 |
| | 3,997 |
|
| Refined product sales (see Note 3) | 1,515 |
| | 1,047 |
| | 9,958 |
|
| Other (see Note 3) | 1,946 |
| | 1,551 |
| | 4,352 |
|
| Total revenues | 29,054 |
| | 21,827 |
| | 34,292 |
|
| COSTS AND EXPENSES: | | | | | |
| Cost of products sold (see Note 3) | 20,801 |
| | 15,080 |
| | 26,714 |
|
| Operating expenses (see Note 3) | 2,170 |
| | 1,839 |
| | 2,608 |
|
| Depreciation, depletion and amortization | 2,332 |
| | 1,986 |
| | 1,929 |
|
| Selling, general and administrative (see Note 3) | 434 |
| | 348 |
| | 475 |
|
| Impairment losses | 920 |
| | 813 |
| | 339 |
|
| Total costs and expenses | 26,657 |
| | 20,066 |
| | 32,065 |
|
| OPERATING INCOME | 2,397 |
| | 1,761 |
| | 2,227 |
|
| OTHER INCOME (EXPENSE): | | | | | |
| Interest expense, net | (1,365 | ) | | (1,317 | ) | | (1,291 | ) |
| Equity in earnings from unconsolidated affiliates | 156 |
| | 59 |
| | 469 |
|
| Impairment of investments in unconsolidated affiliates | (313 | ) | | (308 | ) | | — |
|
| Gains on acquisitions | — |
| | 83 |
| | — |
|
| Losses on extinguishments of debt | (42 | ) | | — |
| | (43 | ) |
| Losses on interest rate derivatives | (37 | ) | | (12 | ) | | (18 | ) |
| Other, net | 209 |
| | 131 |
| | 22 |
|
| INCOME BEFORE INCOME TAX BENEFIT | 1,005 |
| | 397 |
| | 1,366 |
|
| Income tax benefit | (1,496 | ) | | (186 | ) | | (123 | ) |
| NET INCOME | 2,501 |
| | 583 |
| | 1,489 |
|
| Less: Net income attributable to noncontrolling interest | 420 |
| | 295 |
| | 134 |
|
| Less: Net loss attributable to predecessor | — |
| | — |
| | (34 | ) |
| NET INCOME ATTRIBUTABLE TO PARTNERS | 2,081 |
| | 288 |
| | 1,389 |
|
| General Partner’s interest in net income | 990 |
| | 948 |
| | 1,064 |
|
| Preferred Unitholders’ interest in net income | 12 |
| | — |
| | — |
|
| Class H Unitholder’s interest in net income | 93 |
| | 351 |
| | 258 |
|
| Class I Unitholder’s interest in net income | — |
| | 8 |
| | 94 |
|
| Common Unitholders’ interest in net income (loss) | $ | 986 |
| | $ | (1,019 | ) | | $ | (27 | ) |
| NET INCOME (LOSS) PER COMMON UNIT: | | | | | |
| Basic | $ | 0.94 |
| | $ | (1.38 | ) | | $ | (0.07 | ) |
| Diluted | $ | 0.93 |
| | $ | (1.38 | ) | | $ | (0.08 | ) |
|
| | | | | | | | | | | |
| | Years Ended December 31, |
| | 2019 | | 2018 | | 2017 |
| REVENUES: | | | | | |
| Refined product sales | $ | 16,634 |
| | $ | 17,458 |
| | $ | 11,166 |
|
| Crude sales | 15,917 |
| | 14,425 |
| | 10,706 |
|
| NGL sales | 8,290 |
| | 9,986 |
| | 7,781 |
|
| Gathering, transportation and other fees | 9,042 |
| | 6,797 |
| | 4,435 |
|
| Natural gas sales | 3,295 |
| | 4,452 |
| | 4,172 |
|
| Other | 854 |
| | 969 |
| | 2,263 |
|
| Total revenues | 54,032 |
| | 54,087 |
| | 40,523 |
|
| COSTS AND EXPENSES: | | | | | |
| Cost of products sold | 39,603 |
| | 41,658 |
| | 30,966 |
|
| Operating expenses | 3,267 |
| | 3,089 |
| | 2,644 |
|
| Depreciation, depletion and amortization | 3,124 |
| | 2,843 |
| | 2,541 |
|
| Selling, general and administrative | 679 |
| | 664 |
| | 568 |
|
| Impairment losses | 74 |
| | 431 |
| | 1,039 |
|
| Total costs and expenses | 46,747 |
| | 48,685 |
| | 37,758 |
|
| OPERATING INCOME | 7,285 |
| | 5,402 |
| | 2,765 |
|
| OTHER INCOME (EXPENSE): | | | | | |
| Interest expense, net of interest capitalized | (2,257 | ) | | (1,709 | ) | | (1,575 | ) |
| Equity in earnings of unconsolidated affiliates | 298 |
| | 344 |
| | 144 |
|
| Impairment of investments in unconsolidated affiliates | — |
| | — |
| | (313 | ) |
| Losses on extinguishments of debt | (2 | ) | | (109 | ) | | (42 | ) |
| Gains (losses) on interest rate derivatives | (241 | ) | | 47 |
| | (37 | ) |
| Other, net | 303 |
| | 69 |
| | 206 |
|
| INCOME FROM CONTINUING OPERATIONS BEFORE INCOME TAX EXPENSE (BENEFIT) | 5,386 |
| | 4,044 |
| | 1,148 |
|
| Income tax expense (benefit) from continuing operations | 200 |
| | 5 |
| | (1,804 | ) |
| INCOME FROM CONTINUING OPERATIONS | 5,186 |
| | 4,039 |
| | 2,952 |
|
| Loss from discontinued operations, net of income taxes | — |
| | (265 | ) | | (177 | ) |
| NET INCOME | 5,186 |
| | 3,774 |
| | 2,775 |
|
| Less: Net income attributable to noncontrolling interests | 1,051 |
| | 715 |
| | 420 |
|
| Less: Net income attributable to redeemable noncontrolling interests | 51 |
| | 39 |
| | — |
|
| Less: Net income (loss) attributable to predecessor | — |
| | (5 | ) | | 274 |
|
| NET INCOME ATTRIBUTABLE TO PARTNERS | $ | 4,084 |
| | $ | 3,025 |
| | $ | 2,081 |
|
* As adjusted. See Note 2.
The accompanying notes are an integral part of these consolidated financial statements.
F - 5
6
ENERGY TRANSFER PARTNERS,OPERATING, L.P. AND SUBSIDIARIES
CONSOLIDATED STATEMENTS OF COMPREHENSIVE INCOME
(Dollars in millions)
| | | | Years Ended December 31, | Years Ended December 31, |
| | 2017 | | 2016* | | 2015* | 2019 | | 2018 | | 2017 |
| Net income | $ | 2,501 |
| | $ | 583 |
| | $ | 1,489 |
| $ | 5,186 |
| | $ | 3,774 |
| | $ | 2,775 |
|
| Other comprehensive income (loss), net of tax: | | | | | | | | | | |
| Change in value of available-for-sale securities | 6 |
| | 2 |
| | (3 | ) | 11 |
| | (4 | ) | | 6 |
|
| Actuarial gain (loss) relating to pension and other postretirement benefits | (12 | ) | | (1 | ) | | 65 |
| 23 |
| | (43 | ) | | (12 | ) |
| Foreign currency translation adjustment | — |
| | (1 | ) | | (1 | ) | |
| Change in other comprehensive income (loss) from unconsolidated affiliates | 1 |
| | 4 |
| | (1 | ) | |
| Change in other comprehensive income from unconsolidated affiliates | | (10 | ) | | 4 |
| | 1 |
|
| | (5 | ) | | 4 |
| | 60 |
| 24 |
| | (43 | ) | | (5 | ) |
| Comprehensive income | 2,496 |
| | 587 |
| | 1,549 |
| 5,210 |
| | 3,731 |
| | 2,770 |
|
| Less: Comprehensive income attributable to noncontrolling interest | 420 |
| | 295 |
| | 134 |
| |
| Less: Comprehensive loss attributable to predecessor | — |
| | — |
| | (34 | ) | |
| Less: Comprehensive income attributable to noncontrolling interests | | 1,051 |
| | 715 |
| | 420 |
|
| Less: Comprehensive income attributable to redeemable noncontrolling interests | | 51 |
| | 39 |
| | — |
|
| Less: Comprehensive income (loss) attributable to predecessor | | — |
| | (5 | ) | | 274 |
|
| Comprehensive income attributable to partners | $ | 2,076 |
| | $ | 292 |
| | $ | 1,449 |
| $ | 4,108 |
| | $ | 2,982 |
| | $ | 2,076 |
|
* As adjusted. See Note 2.
The accompanying notes are an integral part of these consolidated financial statements.
F - 6
7
ENERGY TRANSFER PARTNERS,OPERATING, L.P. AND SUBSIDIARIES
CONSOLIDATED STATEMENTS OF EQUITY
(Dollars in millions)
|
| | | | | | | | | | | | | | | | | | | | | | | | | | | | | | | | | | | | | | | |
| | | | | | Limited Partners | | | | | | | | | | |
| | Series A Preferred Units | | Series B Preferred Units | | Common Unit holders | | Class H Units | | Class I Units | | General
Partner | | Accumulated Other Comprehensive Income (Loss) | | Non-controlling Interest | | Predecessor Equity | | Total |
| Balance, December 31, 2014* | $ | — |
| | $ | — |
| | $ | 10,427 |
| | $ | 1,512 |
| | $ | — |
| | $ | 184 |
| | $ | (56 | ) | | $ | 5,143 |
| | $ | 8,088 |
| | $ | 25,298 |
|
| Distributions to partners | — |
| | — |
| | (1,863 | ) | | (247 | ) | | (80 | ) | | (944 | ) | | — |
| | — |
| | — |
| | (3,134 | ) |
| Distributions to noncontrolling interest | — |
| | — |
| | — |
| | — |
| | — |
| | — |
| | — |
| | (338 | ) | | — |
| | (338 | ) |
| Units issued for cash | — |
| | — |
| | 1,428 |
| | — |
| | — |
| | — |
| | — |
| | — |
| | — |
| | 1,428 |
|
| Subsidiary units issued for cash | — |
| | — |
| | 298 |
| | — |
| | — |
| | 2 |
| | — |
| | 1,219 |
| | — |
| | 1,519 |
|
| Capital contributions from noncontrolling interest | — |
| | — |
| | — |
| | — |
| | — |
| | — |
| | — |
| | 875 |
| | — |
| | 875 |
|
| Bakken Pipeline Transaction | — |
| | — |
| | (999 | ) | | 1,946 |
| | — |
| | — |
| | — |
| | 72 |
| | — |
| | 1,019 |
|
| Sunoco LP Exchange Transaction | — |
| | — |
| | (52 | ) | | — |
| | — |
| | — |
| | — |
| | (940 | ) | | — |
| | (992 | ) |
| Susser Exchange Transaction | — |
| | — |
| | (68 | ) | | — |
| | — |
| | — |
| | — |
| | — |
| | — |
| | (68 | ) |
| Acquisition and disposition of noncontrolling interest | — |
| | — |
| | (26 | ) | | — |
| | — |
| | — |
| | — |
| | (39 | ) | | — |
| | (65 | ) |
| Predecessor distributions to partners | — |
| | — |
| | — |
| | — |
| | — |
| | — |
| | — |
| | — |
| | (202 | ) | | (202 | ) |
| Predecessor units issued for cash | — |
| | — |
| | — |
| | — |
| | — |
| | — |
| | — |
| | — |
| | 34 |
| | 34 |
|
| Regency Merger | — |
| | — |
| | 7,890 |
| | — |
| | — |
| | — |
| | — |
| | — |
| | (7,890 | ) | | — |
|
| Other comprehensive income, net of tax | — |
| | — |
| | — |
| | — |
| | — |
| | — |
| | 60 |
| | — |
| | — |
| | 60 |
|
| Other, net | — |
| | — |
| | 23 |
| | — |
| | — |
| | — |
| | — |
| | 36 |
| | 4 |
| | 63 |
|
| Net income (loss) | — |
| | — |
| | (27 | ) | | 258 |
| | 94 |
| | 1,064 |
| | — |
| | 134 |
| | (34 | ) | | 1,489 |
|
| Balance, December 31, 2015* | — |
| | — |
| | 17,031 |
| | 3,469 |
| | 14 |
| | 306 |
| | 4 |
| | 6,162 |
| | — |
| | 26,986 |
|
| Distributions to partners | — |
| | — |
| | (2,134 | ) | | (340 | ) | | (20 | ) | | (1,048 | ) | | — |
| | — |
| | — |
| | (3,542 | ) |
| Distributions to noncontrolling interest | — |
| | — |
| | — |
| | — |
| | — |
| | — |
| | — |
| | (481 | ) | | — |
| | (481 | ) |
| Units issued for cash | — |
| | — |
| | 1,098 |
| | — |
| | — |
| | — |
| | — |
| | — |
| | — |
| | 1,098 |
|
| Subsidiary units issued | — |
| | — |
| | 37 |
| | — |
| | — |
| | — |
| | — |
| | 1,351 |
| | — |
| | 1,388 |
|
|
| | | | | | | | | | | | | | | | | | | | | | | | | | | |
| | Limited Partners | | | | | | | | | | |
| | Preferred Unitholders | | Common Unitholders and Other | | General
Partner | | AOCI | | Non-controlling Interest | | Predecessor Equity | | Total |
| Balance, December 31, 2016 | $ | — |
| | $ | 18,407 |
| | $ | 206 |
| | $ | 8 |
| | $ | 7,820 |
| | $ | 2,497 |
| | $ | 28,938 |
|
| Distributions to partners | — |
| | (2,516 | ) | | (952 | ) | | — |
| | — |
| | — |
| | (3,468 | ) |
| Distributions to noncontrolling interests | — |
| | — |
| | — |
| | — |
| | (430 | ) | | (284 | ) | | (714 | ) |
| Partnership units issued for cash | 1,479 |
| | 2,283 |
| | — |
| | — |
| | — |
| | — |
| | 3,762 |
|
| Subsidiary units issued for cash | — |
| | — |
| | — |
| | — |
| | — |
| | 333 |
| | 333 |
|
| Sunoco Logistics Merger | — |
| | 5,938 |
| | — |
| | — |
| | (5,938 | ) | | — |
| | — |
|
| Capital contributions from noncontrolling interests | — |
| | — |
| | — |
| | — |
| | 2,202 |
| | — |
| | 2,202 |
|
| Sale of Bakken pipeline interest | — |
| | 1,260 |
| | — |
| | — |
| | 740 |
| | — |
| | 2,000 |
|
| Sale of Rover pipeline interest | — |
| | 93 |
| | — |
| | — |
| | 1,385 |
| | — |
| | 1,478 |
|
| Acquisition of PennTex noncontrolling interest | — |
| | (48 | ) | | — |
| | — |
| | (232 | ) | | — |
| | (280 | ) |
| Other comprehensive loss, net of tax | — |
| | — |
| | — |
| | (5 | ) | | — |
| | — |
| | (5 | ) |
| Other, net | — |
| | 35 |
| | — |
| | — |
| | (85 | ) | | (4 | ) | | (54 | ) |
| Net income | 12 |
| | 1,079 |
| | 990 |
| | — |
| | 420 |
| | 274 |
| | 2,775 |
|
| Balance, December 31, 2017 | 1,491 |
| | 26,531 |
| | 244 |
| | 3 |
| | 5,882 |
| | 2,816 |
| | 36,967 |
|
| Distributions to partners | (100 | ) | | (3,376 | ) | | (1,080 | ) | | — |
| | — |
| | — |
| | (4,556 | ) |
| Distributions to noncontrolling interests | — |
| | — |
| | — |
| | — |
| | (891 | ) | | (276 | ) | | (1,167 | ) |
| Partnership units issued for cash | 867 |
| | 58 |
| | — |
| | — |
| | — |
| | — |
| | 925 |
|
| Subsidiary units repurchased | — |
| | — |
| | — |
| | — |
| | — |
| | (300 | ) | | (300 | ) |
| Energy Transfer Merger | — |
| | 1,370 |
| | (340 | ) | | — |
| | 1,474 |
| | (2,504 | ) | | — |
|
| Capital contributions from noncontrolling interests | — |
| | — |
| | — |
| | — |
| | 649 |
| | — |
| | 649 |
|
| Cumulative effect adjustment due to change in accounting principle | — |
| | — |
| | — |
| | — |
| | — |
| | (54 | ) | | (54 | ) |
| Deemed distribution, net | — |
| | 37 |
| | — |
| | — |
| | 58 |
| | (497 | ) | | (402 | ) |
| Acquisition of USAC | — |
| | — |
| | — |
| | — |
| | — |
| | 832 |
| | 832 |
|
| Other comprehensive loss, net of tax | — |
| | — |
| | — |
| | (43 | ) | | — |
| | — |
| | (43 | ) |
| Other, net | (3 | ) | | 53 |
| | (17 | ) | | (2 | ) | | 16 |
| | (12 | ) | | 35 |
|
| Net income (loss), excluding amounts attributable to redeemable noncontrolling interests | 133 |
| | 1,699 |
| | 1,193 |
| | — |
| | 715 |
| | (5 | ) | | 3,735 |
|
| Balance, December 31, 2018 | 2,388 |
| | 26,372 |
| | — |
| | (42 | ) | | 7,903 |
| | — |
| | 36,621 |
|
| Distributions to partners | (197 | ) | | (6,087 | ) | | — |
| | — |
| | — |
| | — |
| | (6,284 | ) |
| Distributions to noncontrolling interests | — |
| | — |
| | — |
| | — |
| | (1,399 | ) | | — |
| | (1,399 | ) |
| Partnership units issued for cash | 780 |
| | — |
| | — |
| | — |
| | — |
| | — |
| | 780 |
|
| Capital contributions from noncontrolling interests | — |
| | — |
| | — |
| | — |
| | 348 |
| | — |
| | 348 |
|
| Sale of noncontrolling interest in subsidiary | — |
| | — |
| | — |
| | — |
| | 93 |
| | — |
| | 93 |
|
| Other comprehensive loss, net of tax | — |
| | — |
| | — |
| | 24 |
| | — |
| | — |
| | 24 |
|
| Other, net | (1 | ) | | (32 | ) | | — |
| | — |
| | 22 |
| | — |
| | (11 | ) |
| Net income, excluding amounts attributable to redeemable noncontrolling interests | 204 |
| | 3,880 |
| | — |
| | — |
| | 1,051 |
| | — |
| | 5,135 |
|
| Balance, December 31, 2019 | $ | 3,174 |
| | $ | 24,133 |
| | $ | — |
| | $ | (18 | ) | | $ | 8,018 |
| | $ | — |
| | $ | 35,307 |
|
The accompanying notes are an integral part of these consolidated financial statements.
F - 7
|
| | | | | | | | | | | | | | | | | | | | | | | | | | | | | | | | | | | | | | | |
| Capital contributions from noncontrolling interest | — |
| | — |
| | — |
| | — |
| | — |
| | — |
| | — |
| | 236 |
| | — |
| | 236 |
|
| Sunoco, Inc. retail business to Sunoco LP transaction | — |
| | — |
| | (405 | ) | | — |
| | — |
| | — |
| | — |
| | — |
| | — |
| | (405 | ) |
| PennTex Acquisition | — |
| | — |
| | 307 |
| | — |
| | — |
| | — |
| | — |
| | 236 |
| | — |
| | 543 |
|
| Other comprehensive income, net of tax | — |
| | — |
| | — |
| | — |
| | — |
| | — |
| | 4 |
| | — |
| | — |
| | 4 |
|
| Other, net | — |
| | — |
| | 10 |
| | — |
| | — |
| | — |
| | — |
| | 21 |
| | — |
| | 31 |
|
| Net income (loss) | — |
| | — |
| | (1,019 | ) | | 351 |
| | 8 |
| | 948 |
| | — |
| | 295 |
| | — |
| | 583 |
|
| Balance, December 31, 2016* | — |
| | — |
| | 14,925 |
| | 3,480 |
| | 2 |
| | 206 |
| | 8 |
| | 7,820 |
| | — |
| | 26,441 |
|
| Distributions to partners | — |
| | — |
| | (2,419 | ) | | (95 | ) | | (2 | ) | | (952 | ) | | — |
| | — |
| | — |
| | (3,468 | ) |
| Distributions to noncontrolling interest | — |
| | — |
| | — |
| | — |
| | — |
| | — |
| | — |
| | (430 | ) | | — |
| | (430 | ) |
| Units issued for cash | 937 |
| | 542 |
| | 2,283 |
| | — |
| | — |
| | — |
| | — |
| | — |
| | — |
| | 3,762 |
|
| Sunoco Logistics Merger | — |
| | — |
| | 9,416 |
| | (3,478 | ) | | — |
| | — |
| | — |
| | (5,938 | ) | | — |
| | — |
|
| Capital contributions from noncontrolling interest | — |
| | — |
| | — |
| | — |
| | — |
| | — |
| | — |
| | 2,202 |
| | — |
| | 2,202 |
|
| Sale of Bakken Pipeline interest | — |
| | — |
| | 1,260 |
| | — |
| | — |
| | — |
| | — |
| | 740 |
| | — |
| | 2,000 |
|
| Sale of Rover Pipeline interest | — |
| | — |
| | 93 |
| | — |
| | — |
| | — |
| | — |
| | 1,385 |
| | — |
| | 1,478 |
|
| Acquisition of PennTex noncontrolling interest | — |
| | — |
| | (48 | ) | | — |
| | — |
| | — |
| | — |
| | (232 | ) | | — |
| | (280 | ) |
| Other comprehensive loss, net of tax | — |
| | — |
| | — |
| | — |
| | — |
| | — |
| | (5 | ) | | — |
| | — |
| | (5 | ) |
| Other, net | — |
| | — |
| | 35 |
| | — |
| | — |
| | — |
| | — |
| | (85 | ) | | — |
| | (50 | ) |
| Net income | 7 |
| | 5 |
| | 986 |
| | 93 |
| | — |
| | 990 |
| | — |
| | 420 |
| | — |
| | 2,501 |
|
| Balance, December 31, 2017 | $ | 944 |
| | $ | 547 |
| | $ | 26,531 |
| | $ | — |
| | $ | — |
| | $ | 244 |
| | $ | 3 |
| | $ | 5,882 |
| | $ | — |
| | $ | 34,151 |
|
* As adjusted. See Note 2.
The accompanying notes are an integral part of these consolidated financial statements.
F - 8
ENERGY TRANSFER PARTNERS,OPERATING, L.P. AND SUBSIDIARIES
CONSOLIDATED STATEMENTS OF CASH FLOWS
(Dollars in millions)
| | | | Years Ended December 31, | Years Ended December 31, |
| | 2017 | | 2016* | | 2015* | 2019 | | 2018 | | 2017 |
| OPERATING ACTIVITIES: | | | | | | | | | | |
| Net income | $ | 2,501 |
| | $ | 583 |
| | $ | 1,489 |
| $ | 5,186 |
| | $ | 3,774 |
| | $ | 2,775 |
|
| Reconciliation of net income to net cash provided by operating activities: | | | | | | | | | | |
| Loss from discontinued operations | | — |
| | 265 |
| | 177 |
|
| Depreciation, depletion and amortization | 2,332 |
| | 1,986 |
| | 1,929 |
| 3,124 |
| | 2,843 |
| | 2,541 |
|
| Deferred income taxes | (1,531 | ) | | (169 | ) | | 202 |
| 221 |
| | (8 | ) | | (1,841 | ) |
| Amortization included in interest expense | 2 |
| | (20 | ) | | (36 | ) | |
| Inventory valuation adjustments | — |
| | — |
| | (58 | ) | (79 | ) | | 85 |
| | (24 | ) |
| Unit-based compensation expense | 74 |
| | 80 |
| | 79 |
| |
| Non-cash compensation expense | | 111 |
| | 105 |
| | 99 |
|
| Impairment losses | 920 |
| | 813 |
| | 339 |
| 74 |
| | 431 |
| | 1,039 |
|
| Gains on acquisitions | — |
| | (83 | ) | | — |
| |
| Losses on extinguishments of debt | 42 |
| | — |
| | 43 |
| |
| Impairment of investments in unconsolidated affiliates | 313 |
| | 308 |
| | — |
| — |
| | — |
| | 313 |
|
| Losses on extinguishment of debt | | 2 |
| | 109 |
| | 42 |
|
| Distributions on unvested awards | (31 | ) | | (25 | ) | | (16 | ) | (9 | ) | | (33 | ) | | (35 | ) |
| Equity in earnings of unconsolidated affiliates | (156 | ) | | (59 | ) | | (469 | ) | (298 | ) | | (344 | ) | | (144 | ) |
| Distributions from unconsolidated affiliates | 440 |
| | 406 |
| | 440 |
| 285 |
| | 328 |
| | 297 |
|
| Other non-cash | (261 | ) | | (271 | ) | | (22 | ) | 113 |
| | (113 | ) | | (249 | ) |
| Net change in operating assets and liabilities, net of effects of acquisitions and deconsolidations | (160 | ) | | (246 | ) | | (1,173 | ) | |
| Net change in operating assets and liabilities, net of effects of acquisitions | | (479 | ) | | 117 |
| | (173 | ) |
| Net cash provided by operating activities | 4,485 |
| | 3,303 |
| | 2,747 |
| 8,251 |
| | 7,559 |
| | 4,817 |
|
| INVESTING ACTIVITIES: | | | | | | | | | | |
| Cash proceeds from sale of Bakken Pipeline interest | 2,000 |
| | — |
| | — |
| |
| Cash proceeds from sale of Rover Pipeline interest | 1,478 |
| | — |
| | — |
| |
| Proceeds from the Sunoco, Inc. retail business to Sunoco LP transaction | — |
| | 2,200 |
| | — |
| |
| Proceeds from Bakken Pipeline Transaction | — |
| | — |
| | 980 |
| |
| Proceeds from Susser Exchange Transaction | — |
| | — |
| | 967 |
| |
| Proceeds from sale of noncontrolling interest | — |
| | — |
| | 64 |
| |
| Cash proceeds from sale of noncontrolling interest in subsidiary | | 93 |
| | — |
| | — |
|
| Cash proceeds from USAC acquisition, net of cash received | | — |
| | 711 |
| | — |
|
| Cash proceeds from Bakken pipeline transaction | | — |
| | — |
| | 2,000 |
|
| Cash proceeds from Rover pipeline transaction | | — |
| | — |
| | 1,478 |
|
| Cash paid for acquisition of PennTex noncontrolling interest | (280 | ) | | — |
| | — |
| — |
| | — |
| | (280 | ) |
| Cash paid for Vitol Acquisition, net of cash received | — |
| | (769 | ) | | — |
| |
| Cash paid for PennTex Acquisition, net of cash received | — |
| | (299 | ) | | — |
| |
| Cash transferred to ETE in connection with the Sunoco LP Exchange | — |
| | — |
| | (114 | ) | |
| Cash paid for acquisition of a noncontrolling interest | — |
| | — |
| | (129 | ) | |
| Cash paid for all other acquisitions | (264 | ) | | (159 | ) | | (675 | ) | (7 | ) | | (429 | ) | | (303 | ) |
| Capital expenditures, excluding allowance for equity funds used during construction | (8,335 | ) | | (7,550 | ) | | (9,098 | ) | (5,936 | ) | | (7,407 | ) | | (8,444 | ) |
| Contributions in aid of construction costs | 24 |
| | 71 |
| | 80 |
| 80 |
| | 109 |
| | 24 |
|
| Contributions to unconsolidated affiliates | (268 | ) | | (59 | ) | | (45 | ) | (523 | ) | | (26 | ) | | (268 | ) |
| Distributions from unconsolidated affiliates in excess of cumulative earnings | 136 |
| | 135 |
| | 124 |
| 98 |
| | 69 |
| | 135 |
|
| Proceeds from the sale of assets | 35 |
| | 25 |
| | 23 |
| 54 |
| | 87 |
| | 45 |
|
| Change in restricted cash | — |
| | 14 |
| | 19 |
| |
| Other | 1 |
| | 1 |
| | (16 | ) | 18 |
| | (16 | ) | | 1 |
|
| Net cash used in investing activities | (5,473 | ) | | (6,390 | ) | | (7,820 | ) | (6,123 | ) | | (6,902 | ) | | (5,612 | ) |
| | | | | | | | | | | |
The accompanying notes are an integral part of these consolidated financial statements.
F - 9
| | | FINANCING ACTIVITIES: | | | | | | | | | | |
| Proceeds from borrowings | 26,736 |
| | 19,916 |
| | 22,462 |
| 22,583 |
| | 28,538 |
| | 29,389 |
|
| Repayments of long-term debt | (26,494 | ) | | (15,799 | ) | | (17,843 | ) | |
| Cash (paid to) received from affiliate notes | (255 | ) | | 124 |
| | 233 |
| |
| Common Units issued for cash | 2,283 |
| | 1,098 |
| | 1,428 |
| |
| Preferred Units issued for cash | 1,479 |
| | — |
| | — |
| |
| Subsidiary units issued for cash | — |
| | 1,388 |
| | 1,519 |
| |
| Repayments of debt | | (16,874 | ) | | (27,297 | ) | | (29,387 | ) |
| Repayments of notes payable to related party | | (1,328 | ) | | (440 | ) | | (423 | ) |
| Common units issued for cash | | — |
| | 58 |
| | 2,283 |
|
| Preferred units issued for cash | | 780 |
| | 867 |
| | 1,479 |
|
| Redeemable noncontrolling interests issued for cash | | — |
| | 465 |
| | — |
|
| Predecessor units issued for cash | — |
| | — |
| | 34 |
| — |
| | — |
| | 333 |
|
| Capital contributions from noncontrolling interest | 1,214 |
| | 236 |
| | 841 |
| |
| Capital contributions from noncontrolling interests | | 348 |
| | 649 |
| | 1,214 |
|
| Distributions to partners | (3,468 | ) | | (3,542 | ) | | (3,134 | ) | (6,284 | ) | | (4,556 | ) | | (3,468 | ) |
| Predecessor distributions to partners | — |
| | — |
| | (202 | ) | — |
| | (276 | ) | | (284 | ) |
| Distributions to noncontrolling interest | (430 | ) | | (481 | ) | | (338 | ) | |
| Distributions to noncontrolling interests | | (1,399 | ) | | (891 | ) | | (430 | ) |
| Distributions to redeemable noncontrolling interests | | — |
| | (24 | ) | | — |
|
| Repurchases of common units | | — |
| | (24 | ) | | — |
|
| Subsidiary repurchases of common units | | — |
| | (300 | ) | | — |
|
| Redemption of Legacy ETP Preferred Units | (53 | ) | | — |
| | — |
| — |
| | — |
| | (53 | ) |
| Debt issuance costs | (83 | ) | | (22 | ) | | (63 | ) | (117 | ) | | (162 | ) | | (83 | ) |
| Other | 5 |
| | 2 |
| | — |
| (2 | ) | | 85 |
| | 2 |
|
| Net cash provided by financing activities | 934 |
| | 2,920 |
| | 4,937 |
| |
| Decrease in cash and cash equivalents | (54 | ) | | (167 | ) | | (136 | ) | |
| Net cash provided by (used in) financing activities | | (2,293 | ) | | (3,308 | ) | | 572 |
|
| DISCONTINUED OPERATIONS: | | | | | | |
| Operating activities | | — |
| | (484 | ) | | 136 |
|
| Investing activities | | — |
| | 3,207 |
| | (38 | ) |
| Changes in cash included in current assets held for sale | | — |
| | 11 |
| | (5 | ) |
| Net increase in cash and cash equivalents of discontinued operations | | — |
| | 2,734 |
| | 93 |
|
| Increase (decrease) in cash and cash equivalents | | (165 | ) | | 83 |
| | (130 | ) |
| Cash and cash equivalents, beginning of period | 360 |
| | 527 |
| | 663 |
| 418 |
| | 335 |
| | 465 |
|
| Cash and cash equivalents, end of period | $ | 306 |
| | $ | 360 |
| | $ | 527 |
| $ | 253 |
| | $ | 418 |
| | $ | 335 |
|
* As adjusted. See Note 2.
The accompanying notes are an integral part of these consolidated financial statements.
F - 10
ENERGY TRANSFER PARTNERS,OPERATING, L.P. AND SUBSIDIARIES
NOTES TO CONSOLIDATED FINANCIAL STATEMENTS
(Tabular dollar and unit amounts except per unit data, are in millions)
| |
| 1. | OPERATIONS AND BASIS OF PRESENTATION: |
Organization. The consolidated financial statements presented herein contain the results of Energy Transfer Partners,Operating, L.P. and its subsidiaries (the “Partnership,” “we,” “us,” “our” or “ETP”“ETO”).
ETO is a consolidated subsidiary of Energy Transfer LP. In October 2018, we completed the merger of ETO with a wholly-owned subsidiary of ET in a unit-for-unit exchange (the “Energy Transfer Merger”). The Partnership is managed by our general partner, ETP GP, which is in turn managed byIn connection with the transaction, the former common unitholders (other than ET and its general partner, ETP LLC. ETE, a publicly traded master limited partnership, owns ETP LLC, subsidiaries) received 1.28 common units of ET for each common unit of ETO they owned.
Immediately prior to the closing of the Energy Transfer Merger, the following also occurred:
| |
| • | the IDRs in ETO were converted into 1,168,205,710 ETO common units; and |
the general partner interest in ETO was converted to a non-economic general partner interest and ETO issued 18,448,341 ETO common units to ETP GP.
The Energy Transfer Merger was a combination of our General Partner.entities under common control; therefore, Sunoco LP, Lake Charles LNG and USAC’s (see Note 3 for more information) assets and liabilities were not adjusted. The Partnership’s consolidated financial statements have been retrospectively adjusted to reflect consolidation beginning January 1, 2017 of Sunoco LP and Lake Charles LNG and April 2, 2018 of USAC (the date ET acquired USAC, see Note 3). Predecessor equity included on the consolidated financial statements represents Sunoco LP, Lake Charles LNG and USAC’s equity prior to the Energy Transfer Merger.
Following the closing of the Energy Transfer Merger, Energy Transfer Equity, L.P. changed its name to “Energy Transfer LP” and its common units began trading on the New York Stock Exchange under the “ET” ticker symbol on Friday, October 19, 2018. In addition, Energy Transfer Partners, L.P. changed its name to “Energy Transfer Operating, L.P.” For purposes of maintaining clarity, the following references are used herein:
References to “ETO” refer to the entity named Energy Transfer Partners, L.P. prior to the close of the Energy Transfer Merger and Energy Transfer Operating, L.P. subsequent to the close of the Energy Transfer Merger; and
References to “ET” refer to the entity named Energy Transfer Equity, L.P. prior to the close of the Energy Transfer Merger and Energy Transfer LP subsequent to the close of the Energy Transfer Merger.
In April 2017, ETPEnergy Transfer Partners, L.P. and Sunoco Logistics completed the previously announced merger transaction in which Sunoco Logistics acquired ETPEnergy Transfer Partners, L.P. in a unit-for-unit transaction (the “Sunoco Logistics Merger”). Under the terms of the transaction, ETPEnergy Transfer Partners, L.P. unitholders received 1.5 common units of Sunoco Logistics for each common unit of ETPEnergy Transfer Partners, L.P. they owned. Under the terms of the merger agreement, Sunoco Logistics’ general partner was merged with and into ETP GP, with ETP GP surviving as an indirect wholly-owned subsidiary of ETE.ET. In connection with the merger, the ETPEnergy Transfer Partners, L.P. Class H units were cancelled. The outstanding ETPEnergy Transfer Partners, L.P. Class E units, Class G units, Class I units and Class K units at the effective time of the merger were converted into an equal number of newly created classes of Sunoco Logistics units, with the same rights, preferences, privileges, duties and obligations as such classes of ETPEnergy Transfer Partners, L.P. units had immediately prior to the closing of the merger. Additionally, the outstanding Sunoco Logistics common units and Sunoco Logistics Class B units owned by ETPEnergy Transfer Partners, L.P. at the effective time of the merger were cancelled.
In connection with the Sunoco Logistics Merger, Energy Transfer Partners, L.P. changed its name from “Energy Transfer Partners, L.P.” to “Energy Transfer, LP” and Sunoco Logistics Partners L.P. changed its name to “Energy Transfer Partners, L.P.” For purposes of maintaining clarity, the following references are used herein:
References to “ETLP” refer to Energy Transfer, LP subsequent to the close of the merger;
References to “Sunoco Logistics” refer to the entity named Sunoco Logistics Partners L.P. and its subsidiaries prior to the close of the merger;Sunoco Logistics Merger; and
References to “ETP”“ETO” for periods prior to the Sunoco Logistics Merger refer to the consolidated entity named Energy Transfer Partners, L.P. subsequentand its subsidiaries prior to the close of the merger.Sunoco Logistics Merger.
The Sunoco Logistics Merger resulted in Energy Transfer Partners, L.P. being treated as the surviving consolidated entity from an accounting perspective, while Sunoco Logistics (prior to changing its name to “Energy Transfer Partners, L.P.”) was the surviving consolidated entity from a legal and reporting perspective. Therefore, for the pre-merger periods, the consolidated
financial statements reflect the consolidated financial statements of the legal acquiree (i.e., the entity that was named “Energy Transfer Partners, L.P.” prior to the merger and name changes).
The Sunoco Logistics Merger was accounted for as an equity transaction. The Sunoco Logistics Merger did not result in any changes to the carrying values of assets and liabilities in the consolidated financial statements, and no gain or loss was recognized. For the periods prior to the Sunoco Logistics Merger, the Sunoco Logistics limited partner interests that were owned by third parties (other than Energy Transfer Partners, L.P. or its consolidated subsidiaries) are presented as noncontrolling interestinterests in these consolidated financial statements.
The historical common units and net income (loss) per limited partner unit amountsamount presented in these consolidated financial statements have been retrospectively adjusted to reflect the 1.5 to one unit-for-unit exchange in connection with the Sunoco Logistics Merger.
The Partnership is engaged in the gathering and processing, compression, treating and transportation of natural gas, focusing on providing midstream services in some of the most prolific natural gas producing regions in the United States, including the Eagle Ford, Haynesville, Barnett, Fayetteville, Marcellus, Utica, Bone Spring and Avalon shales.
The Partnership is engaged inowns and operates intrastate transportation and storage natural gas operations that own and operate natural gas pipeline systems and storage facilities that are engaged in the business of purchasing, gathering, transporting, processing, and marketing natural gas and NGLs in the states of Texas, Louisiana, New Mexico and West Virginia.
The Partnership owns and operates interstate pipelines, either directly or through equity method investments, that transport natural gas to various markets in the United States.
The Partnership owns a controlling interest in Sunoco Logistics Partners Operations L.P., which owns and operates a logistics business, consisting of a geographically diverse portfolio of complementary pipeline, terminalling, and acquisition and marketing assets, which are used to facilitate the purchase and sale of crude oil, NGLs and refined products.
The Partnership owns a controlling interest in Sunoco LP which is engaged in the wholesale distribution of motor fuels to convenience stores, independent dealers, commercial customers, and distributors, as well as the retail sale of motor fuels and merchandise through Sunoco LP operated convenience stores and retail fuel sites. As of December 31, 2019, our interest in Sunoco LP consisted of 100% of the general partner and IDRs, as well as 28.5 million common units.
The Partnership owns a controlling interest in USAC which provides compression services to producers, processors, gatherers and transporters of natural gas and crude oil. As of December 31, 2019, our interest in USAC consisted of 100% of the general partner and 46.1 million common units.
Basis of Presentation. The consolidated financial statements of the Partnership have been prepared in accordance with GAAP and include the accounts of all controlled subsidiaries after the elimination of all intercompany accounts and transactions. Certain prior year amounts have been conformed to the current year presentation. These reclassifications had no impact on net income or total equity. Management evaluated subsequent events through the date the financial statements were issued.
The consolidated financial statements of the Partnership presented herein include the results of operations of our controlled subsidiaries, including Sunoco LP and USAC.
For prior periods reported herein, certain transactions related to the business of legacy Sunoco Logisticsbalances have been reclassified from cost of products sold to operating expenses; these transactions include sales between operating subsidiariesassets and their marketing affiliates.liabilities held for sale and certain revenues and expenses to discontinued operations. These reclassifications had no impact on net income or total equity.
The Partnership owns varying undivided interests in certain pipelines. Ownership of these pipelines has been structured as an ownership of an undivided interest in assets, not as an ownership interest in a partnership, limited liability company, joint venture or other forms of entities. Each owner controls marketing and invoices separately, and each owner is responsible for any loss, damage or injury that may occur to their own customers. As a result, these undivided interests are consolidated proportionately.
| |
| 2. | ESTIMATES, SIGNIFICANT ACCOUNTING POLICIES AND BALANCE SHEET DETAIL: |
Change in Accounting Policy
During the fourth quarter of 2017, the Partnership elected to change its method of inventory costing to weighted-average cost for certain inventory that had previously been accounted for using the last-in, first-out (“LIFO”) method. The inventory impacted by this change included the crude oil, refined products and NGLs associated with the legacy Sunoco Logistics business. Management believes that the weighted-average cost method is preferable to the LIFO method as it more closely aligns the accounting policies across the consolidated entity, given that the legacy ETP inventory has been accounted for using the weighted-average cost method.
As a result of this change in accounting policy, prior periods have been retrospectively adjusted, as follows:
|
| | | | | | | | | | | | | | | | | | | | | | | |
| | Year Ended December 31, 2016 | | Year Ended December 31, 2015 |
| | As Originally Reported* | | Effect of Change | | As Adjusted | | As Originally Reported* | | Effect of Change | | As Adjusted |
| Consolidated Statement of Operations and Comprehensive Income: | | | | | | | | | | | |
| Cost of products sold | $ | 15,039 |
| | $ | 41 |
| | $ | 15,080 |
| | $ | 26,682 |
| | $ | 32 |
| | $ | 26,714 |
|
| Operating income | 1,802 |
| | (41 | ) | | 1,761 |
| | 2,259 |
| | (32 | ) | | 2,227 |
|
| Income before income tax benefit | 438 |
| | (41 | ) | | 397 |
| | 1,398 |
| | (32 | ) | | 1,366 |
|
| Net income | 624 |
| | (41 | ) | | 583 |
| | 1,521 |
| | (32 | ) | | 1,489 |
|
| Net income attributable to partners | 297 |
| | (9 | ) | | 288 |
| | 1,398 |
| | (9 | ) | | 1,389 |
|
| Net loss per common unit - basic | (1.37 | ) | | (0.01 | ) | | (1.38 | ) | | (0.06 | ) | | (0.01 | ) | | (0.07 | ) |
| Net loss per common unit - diluted | (1.37 | ) | | (0.01 | ) | | (1.38 | ) | | (0.07 | ) | | (0.01 | ) | | (0.08 | ) |
| Comprehensive income | 628 |
| | (41 | ) | | 587 |
| | 1,581 |
| | (32 | ) | | 1,549 |
|
| Comprehensive income attributable to partners | 301 |
| | (9 | ) | | 292 |
| | 1,458 |
| | (9 | ) | | 1,449 |
|
| | | | | | | | | | | | |
| Consolidated Statements of Cash Flows: | | | | | | | | | | | |
| Net income | 624 |
| | (41 | ) | | 583 |
| | 1,521 |
| | (32 | ) | | 1,489 |
|
| Inventory valuation adjustments | (170 | ) | | 170 |
| | — |
| | 104 |
| | (162 | ) | | (58 | ) |
| Net change in operating assets and liabilities (change in inventories) | (117 | ) | | (129 | ) | | (246 | ) | | (1,367 | ) | | 194 |
| | (1,173 | ) |
| | | | | | | | | | | | |
| Consolidated Balance Sheets (at period end): | | | | | | | | | | | |
| Inventories | 1,712 |
| | (86 | ) | | 1,626 |
| | 1,213 |
| | (45 | ) | | 1,168 |
|
| Total partners' capital | 18,642 |
| | (21 | ) | | 18,621 |
| | 20,836 |
| | (12 | ) | | 20,824 |
|
* Amounts reflect certain reclassifications made to conform to the current year presentation.
Use of Estimates
The preparation of financial statements in conformity with GAAP requires management to make estimates and assumptions that affect the reported amounts of assets and liabilities and the accrual for and disclosure of contingent assets and liabilities at the date of the financial statements and the reported amounts of revenues and expenses during the reporting period.
The natural gas industry conducts its business by processing actual transactions at the end of the month following the month of delivery. Consequently, the most current month’s financial results for the midstream, NGL and intrastate transportation and storage operations are estimated using volume estimates and market prices. Any differences between estimated results and actual results are recognized in the following month’s financial statements. Management believes that the estimated operating results represent the actual results in all material respects.
Some of the other significant estimates made by management include, but are not limited to, the timing of certain forecasted transactions that are hedged, the fair value of derivative instruments, useful lives for depreciation and amortization, purchase
accounting allocations and subsequent realizability of intangible assets, fair value measurements used in the goodwill impairment test, market value of inventory, assets and liabilities resulting from the regulated ratemaking process, contingency reserves and environmental reserves. Actual results could differ from those estimates.
RecentLease Accounting Pronouncements
ASU 2014-09
In May 2014,February 2016, the Financial Accounting Standards Board (“FASB”) issued Accounting Standards Update (“ASU”) No. 2014-09, Revenue from Contracts with Customers2016-02, Leases (Topic 606) (“ASU 2014-09”842), which has amended the FASB Accounting Standards Codification (“ASC”) and introduced Topic 842, Leases. On January 1, 2019, the Partnership has adopted ASC Topic 842 (“Topic 842”), which clarifies the principlesis effective for recognizing revenue basedinterim and annual reporting periods beginning on or after December 15, 2018. Topic 842 requires entities to recognize lease assets and liabilities on the core principle that an entity should recognize revenuebalance sheet for all leases with a term of more than one year, including operating leases, which historically were not recorded on the balance sheet in accordance with the prior standard.
To adopt Topic 842, the Partnership recognized a cumulative catch-up adjustment to depict the transferopening balance sheet as of promised goods or services to
customers in an amount that reflects the consideration to which the entity expects to be entitled in exchange for those goods or services. The Partnership adopted ASU 2014-09 on January 1, 2018.2019 related to certain leases that existed as of that date. As permitted, we have not retrospectively modified our consolidated financial statements for comparative purposes. The Partnership applied the cumulative catchup transition method and recognized the cumulative effect of the retrospective application of the standard. The effect of the retrospective applicationadoption of the standard was not material.
For future periods, we expect that the adoption of this standard will result in a change to revenues with offsetting changes to costs associated primarily with the designation of certain of our midstream segment agreements to be in-substance supply agreements, requiring amounts that had previously been reported as revenue under these agreements to be reclassified to a reduction of cost of sales. Changes to revenues along with offsetting changes to costs will also occur due to changes in the accounting for noncash consideration in multiple of our reportable segments, as well as fuel usage and loss allowances. None of these changes is expected to have a material impact on net income.
ASU 2016-02
In February 2016, the FASB issued Accounting Standards Update No. 2016-02, Leases (Topic 842) (“ASU 2016-02”), which establishes the principles that lessees and lessors shall apply to report useful information to users of financialour consolidated balance sheet, but did not have an impact on our consolidated statements about the amount, timing, and uncertainty of cash flows arising from a lease. The Partnership expects to adopt ASU 2016-02 in the first quarter of 2019 and is currently evaluating the impact that adopting this new standard will have on the consolidated financial statements and related disclosures.
ASU 2016-16
On January 1, 2018, the Partnership adopted Accounting Standards Update No. 2016-16, Income Taxes (Topic 740): Intra-entity Transfers of Assets Other Than Inventory (“ASU 2016-16”), which requires that entities recognize the income tax consequences of an intra-entity transfer of an asset other than inventory when the transfer occurs. The amendments in this update do not change GAAP for the pre-tax effects of an intra-entity asset transfer under Topic 810, Consolidation, or for an intra-entity transfer of inventory. We do not anticipate a material impact to our financial position or results of operations, ascomprehensive income or cash flows. As a result of adoption, we have recorded additional net right-of-use (“ROU”) lease assets and lease liabilities of approximately $888 million and $888 million, respectively, as of January 1, 2019. In addition, we have updated our business processes, systems, and internal controls to support the adoptionon-going reporting requirements under the new standard.
To adopt Topic 842, the Partnership elected the package of thispractical expedients permitted under the transition guidance within the standard.
ASU 2017-04
In January 2017, the FASB issued ASU No. 2017-04 “Intangibles-Goodwill and other (Topic 350): Simplifying the test for goodwill impairment.” The amendments in this update remove the second step of the two-step test currently required by Topic 350. An entity will apply a one-step quantitative test and record the amount of goodwill impairment as the excess of a reporting unit’s carrying amount over its fair value,expedient package allowed us not to exceedreassess whether existing contracts contained a lease, the total amountlease classification of goodwill allocatedexisting leases and initial direct cost for existing leases. In addition to the reporting unit. The new guidance didpackage of practical expedients, the Partnership has elected not amendto capitalize amounts pertaining to leases with terms less than twelve months, to use the optional qualitative assessmentportfolio approach to determine discount rates, not to separate non-lease components from lease components and not to apply the use of goodwill impairment. The standard requires prospective application and therefore will only impact periods subsequenthindsight to the adoption. The Partnership adopted this ASU for its annual goodwill impairment test in the fourth quarter of 2017.active lease population.
ASU 2017-12
In August 2017, the FASB issued ASU No. 2017-12 “Derivatives and Hedging (Topic 815): Targeted Improvements to Accounting for Hedging Activities.” The amendments in this update improve the financial reporting of hedging relationships to better portray the economic results of an entity’s risk management activities in its financial statements. In addition, the amendments in this update make certain targeted improvements to simplify the application of the hedge accounting guidance in current GAAP. This ASU is effective for financial statements issued for fiscal years, and interim periods within those fiscal years, beginning after December 15, 2018, with early adoption permitted. The Partnership is currently evaluating the impact that adopting this new standard will have on the consolidated financial statements and related disclosures.
Revenue Recognition
Revenues for sales of natural gas and NGLs are recognized at the later of the time of delivery of the productCumulative-effect adjustments made to the customer or the time of sale. Revenues from service labor, transportation, treating, compression and gas processing are recognized upon completion of the service. Transportation capacity payments are recognized when earned in the period the capacity is made available.
Our intrastate transportation and storage and interstate transportation and storage segments’ results are determined primarily by the amount of capacity our customers reserveopening balance sheet at January 1, 2019 were as well as the actual volume of natural gas that flows through the transportation pipelines. Under transportation contracts, our customers are charged (i) a demand fee, which is a fixed fee for the reservation of an agreed amount of capacity on the transportation pipeline for a specified period of time and which obligates the customer to pay even if the customer does not transport natural gas on the respective pipeline, (ii) a transportation fee, which is based on the actual throughput of natural gas by the customer, (iii) fuel retention based on a percentage of gas transported on the
follows:
|
| | | | | | | | | | | |
| | Balance at December 31, 2018, as previously reported | | Adjustments due to Topic 842 (Leases) | | Balance at January 1, 2019 |
| Assets: | | | | | |
| Property, plant and equipment, net | $ | 66,655 |
| | $ | (1 | ) | | $ | 66,654 |
|
| Lease right-of-use assets, net | — |
| | 889 |
| | 889 |
|
| Liabilities: | | | | | |
| Operating lease current liabilities | $ | — |
| | $ | 71 |
| | $ | 71 |
|
| Accrued and other current liabilities | 2,847 |
| | (1 | ) | | 2,846 |
|
| Current maturities of long-term debt | 2,655 |
| | 1 |
| | 2,656 |
|
| Long-term debt, less current maturities | 37,853 |
| | 6 |
| | 37,859 |
|
| Non-current operating lease liabilities | — |
| | 823 |
| | 823 |
|
| Other non-current liabilities | 1,184 |
| | (12 | ) | | 1,172 |
|
F - 14
pipeline, or (iv) a combination of the three, generally payable monthly. Fuel retained for a fee is typically valued at market prices.
Our intrastate transportation and storage segment also generates revenues and margin from the sale of natural gas to electric utilities, independent power plants, local distribution companies, industrial end-users and other marketing companies on the HPL System. Generally, we purchase natural gas from the market, including purchases from our marketing operations, and from producers at the wellhead.
In addition, our intrastate transportation and storage segment generates revenues and margin from fees charged for storing customers’ working natural gas in our storage facilities. We also engage in natural gas storage transactions in which we seek to find and profit from pricing differences that occur over time utilizing the Bammel storage reservoir. We purchase physical natural gas and then sell financial contracts at a price sufficient to cover our carrying costs and provide for a gross profit margin. We expect margins from natural gas storage transactions to be higher during the periods from November to March of each year and lower during the period from April through October of each year due to the increased demand for natural gas during colder weather. However, we cannot assure that management’s expectations will be fully realized in the future and in what time period, due to various factors including weather, availability of natural gas in regions in which we operate, competitive factors in the energy industry, and other issues.
Results from the midstream segment are determined primarily by the volumes of natural gas gathered, compressed, treated, processed, purchased and sold through our pipeline and gathering systems and the level of natural gas and NGL prices. We generate midstream revenues and segment margins principally under fee-based or other arrangements in which we receive a fee for natural gas gathering, compressing, treating or processing services. The revenue earned from these arrangements is directlyAdditional disclosures related to the volume of natural gas that flows through our systems and is not directly dependent on commodity prices.
We also utilize other types of arrangementslease accounting are included in our midstream segment, including (i) discount-to-index price arrangements, which involve purchases of natural gas at either (1) a percentage discount to a specified index price, (2) a specified index price less a fixed amount or (3) a percentage discount to a specified index price less an additional fixed amount, (ii) percentage-of-proceeds arrangements under which we gather and process natural gas on behalf of producers, sell the resulting residue gas and NGL volumes at market prices and remit to producers an agreed upon percentage of the proceeds based on an index price, (iii) keep-whole arrangements where we gather natural gas from the producer, process the natural gas and sell the resulting NGLs to third parties at market prices, (iv) purchasing all or a specified percentage of natural gas and/or NGL delivered from producers and treating or processing our plant facilities, and (v) making other direct purchases of natural gas and/or NGL at specified delivery points to meet operational or marketing obligations. In many cases, we provide services under contracts that contain a combination of more than one of the arrangements described above. The terms of our contracts vary based on gas quality conditions, the competitive environment at the time the contracts are signed and customer requirements. Our contract mix may change as a result of changes in producer preferences, expansion in regions where some types of contracts are more common and other market factors.
NGL storage and pipeline transportation revenues are recognized when services are performed or products are delivered, respectively. Fractionation and processing revenues are recognized when product is either loaded into a truck or injected into a third-party pipeline, which is when title and risk of loss pass to the customer.
In our natural gas compression business, revenue is recognized for compressor packages and technical service jobs using the completed contract method which recognizes revenue upon completion of the job. Costs incurred on a job are deducted at the time revenue is recognized.
We conduct marketing activities in which we market the natural gas that flows through our assets, referred to as on-system gas. We also attract other customers by marketing volumes of natural gas that do not move through our assets, referred to as off-system gas. For both on-system and off-system gas, we purchase natural gas from natural gas producers and other supply points and sell that natural gas to utilities, industrial consumers, other marketers and pipeline companies, thereby generating gross margins based upon the difference between the purchase and resale prices.
Terminalling and storage revenues are recognized at the time the services are provided. Pipeline revenues are recognized upon delivery of the barrels to the location designated by the shipper. Crude oil acquisition and marketing revenues, as well as refined product marketing revenues, are recognized when title to the product is transferred to the customer. Revenues are not recognized for crude oil exchange transactions, which are entered into primarily to acquire crude oil of a desired quality or to reduce transportation costs by taking delivery closer to end markets. Any net differential for exchange transactions is recorded as an adjustment of inventory costs in the purchases component of cost of products sold and operating expenses in the statements of operations.
Note 12.
Regulatory Accounting – Regulatory Assets and Liabilities
Our interstate transportation and storage segment is subject to regulation by certain state and federal authorities, and certain subsidiaries in that segment have accounting policies that conform to the accounting requirements and ratemaking practices of the regulatory authorities. The application of these accounting policies allows certain of our regulated entities to defer expenses and revenues on the balance sheet as regulatory assets and liabilities when it is probable that those expenses and revenues will be allowed in the ratemaking process in a period different from the period in which they would have been reflected in the consolidated statement of operations by an unregulated company. These deferred assets and liabilities will be reported in results of operations in the period in which the same amounts are included in rates and recovered from or refunded to customers. Management’s assessment of the probability of recovery or pass through of regulatory assets and
liabilities will require judgment and interpretation of laws and regulatory commission orders. If, for any reason, we cease to meet the criteria for application of regulatory accounting treatment for these entities, the regulatory assets and liabilities related to those portions ceasing to meet such criteria would be eliminated from the consolidated balance sheet for the period in which the discontinuance of regulatory accounting treatment occurs.
Although Panhandle’s natural gas transmission systems and storage operations are subject to the jurisdiction of the FERC in accordance with the Natural Gas Act of 1938 and Natural Gas Policy Act of 1978, it does not currently apply regulatory accounting policies in accounting for its operations. Panhandle does not apply regulatory accounting policies primarily due to the level of discounting from tariff rates and its inability to recover specific costs.
Cash, Cash Equivalents and Supplemental Cash Flow Information
Cash and cash equivalents include all cash on hand, demand deposits, and investments with original maturities of three months or less. We consider cash equivalents to include short-term, highly liquid investments that are readily convertible to known amounts of cash and that are subject to an insignificant risk of changes in value.
We place our cash deposits and temporary cash investments with high credit quality financial institutions. At times, our cash and cash equivalents may be uninsured or in deposit accounts that exceed the Federal Deposit Insurance Corporation insurance limit.
The net change in operating assets and liabilities (net of effects of acquisitions and deconsolidations)acquisitions) included in cash flows from operating activities is comprised as follows:
|
| | | | | | | | | | | |
| | Years Ended December 31, |
| | 2017 | | 2016 | | 2015 |
| Accounts receivable | $ | (950 | ) | | $ | (919 | ) | | $ | 819 |
|
| Accounts receivable from related companies | 67 |
| | 30 |
| | (243 | ) |
| Inventories | 37 |
| | (497 | ) | | (157 | ) |
| Other current assets | 39 |
| | 83 |
| | (178 | ) |
| Other non-current assets, net | (94 | ) | | (78 | ) | | 188 |
|
| Accounts payable | 758 |
| | 972 |
| | (1,215 | ) |
| Accounts payable to related companies | (3 | ) | | 29 |
| | (160 | ) |
| Accrued and other current liabilities | (47 | ) | | 39 |
| | (83 | ) |
| Other non-current liabilities | 24 |
| | 33 |
| | (219 | ) |
| Price risk management assets and liabilities, net | 9 |
| | 62 |
| | 75 |
|
| Net change in operating assets and liabilities, net of effects of acquisitions and deconsolidations | $ | (160 | ) | | $ | (246 | ) | | $ | (1,173 | ) |
|
| | | | | | | | | | | |
| | Years Ended December 31, |
| | 2019 | | 2018 | | 2017 |
| Accounts receivable | $ | (423 | ) | | $ | 506 |
| | $ | (951 | ) |
| Accounts receivable from related companies | (25 | ) | | 128 |
| | (462 | ) |
| Inventories | (98 | ) | | 282 |
| | 58 |
|
| Other current assets | 100 |
| | 7 |
| | 40 |
|
| Other non-current assets, net | (126 | ) | | (109 | ) | | (88 | ) |
| Accounts payable | 101 |
| | (769 | ) | | 713 |
|
| Accounts payable to related companies | (94 | ) | | (206 | ) | | 486 |
|
| Accrued and other current liabilities | 50 |
| | 365 |
| | (56 | ) |
| Other non-current liabilities | (183 | ) | | (34 | ) | | 78 |
|
| Price risk management assets and liabilities, net | 219 |
| | (53 | ) | | 9 |
|
| Net change in operating assets and liabilities, net of effects of acquisitions | $ | (479 | ) | | $ | 117 |
| | $ | (173 | ) |
Non-cash investing and financing activities and supplemental cash flow information are as follows:
|
| | | | | | | | | | | |
| | Years Ended December 31, |
| | 2017 | | 2016 | | 2015 |
| NON-CASH INVESTING ACTIVITIES: | | | | | |
| Accrued capital expenditures | $ | 1,059 |
| | $ | 822 |
| | $ | 896 |
|
| Sunoco LP limited partner interest received in exchange for contribution of the Sunoco, Inc. retail business to Sunoco LP | — |
| | 194 |
| | — |
|
| Net gains from subsidiary common unit transactions | — |
| | 37 |
| | 300 |
|
| NON-CASH FINANCING ACTIVITIES: | | | | | |
| Issuance of Common Units in connection with the PennTex Acquisition | $ | — |
| | $ | 307 |
| | $ | — |
|
| Issuance of Common Units in connection with the Regency Merger | — |
| | — |
| | 9,250 |
|
| Issuance of Class H Units in connection with the Bakken Pipeline Transaction | — |
| | — |
| | 1,946 |
|
| Contribution of assets from noncontrolling interest | 988 |
| | — |
| | 34 |
|
| Redemption of Common Units in connection with the Bakken Pipeline Transaction | — |
| | — |
| | 999 |
|
| Redemption of Common Units in connection with the Sunoco LP Exchange | — |
| | — |
| | 52 |
|
| SUPPLEMENTAL CASH FLOW INFORMATION: | | | | | |
| Cash paid for interest, net of interest capitalized | $ | 1,329 |
| | $ | 1,411 |
| | $ | 1,467 |
|
| Cash paid for (refund of) income taxes | 50 |
| | (229 | ) | | 71 |
|
|
| | | | | | | | | | | |
| | Years Ended December 31, |
| | 2019 | | 2018 | | 2017 |
| NON-CASH INVESTING ACTIVITIES: | | | | | |
| Accrued capital expenditures | $ | 1,265 |
| | $ | 1,030 |
| | $ | 1,060 |
|
| Lease assets obtained in exchange for new lease liabilities | 67 |
| | — |
| | — |
|
| Net gains (losses) from subsidiary common unit transactions | — |
| | (127 | ) | | 5 |
|
| NON-CASH FINANCING ACTIVITIES: | | | | | |
| Contribution of assets from noncontrolling interests | $ | — |
| | $ | — |
| | $ | 988 |
|
| SUPPLEMENTAL CASH FLOW INFORMATION: | | | | | |
| Cash paid for interest, net of interest capitalized | $ | 1,798 |
| | $ | 1,537 |
| | $ | 1,516 |
|
| Cash paid for income taxes | 30 |
| | 508 |
| | 50 |
|
Accounts Receivable
Our operations deal with a variety of counterparties across the energy sector, some of which are investment grade, and most of which are not. Internal credit ratings and credit limits are assigned to all counterparties and limits are monitored against credit exposure. Letters of credit or prepayments may be required from those counterparties that are not investment grade depending on the internal credit rating and level of commercial activity with the counterparty.
We have a diverse portfolio of customers; however, because of the midstream and transportation services we provide, many of our customers are engaged in the exploration and production segment. We manage trade credit risk to mitigate credit losses and exposure to uncollectible trade receivables. Prospective and existing customers are reviewed regularly for creditworthiness to manage credit risk within approved tolerances. Customers that do not meet minimum credit standards are required to provide additional credit support in the form of a letter of credit, prepayment, or other forms of security. We establish an allowance for doubtful accounts on trade receivables based on the expected ultimate recovery of these receivables and considersconsider many factors including historical customer collection experience, general and specific economic trends, and known specific issues related to individual customers, sectors, and transactions that might impact collectability. Increases in the allowance are recorded as a component of operating expenses; reductions in the allowance are recorded when receivables are subsequently collected or written-off. Past due receivable balances are written-off when our efforts have been unsuccessful in collecting the amount due.
We enter into netting arrangements with counterparties to the extent possible to mitigate credit risk. Transactions are confirmed with the counterparty and the net amount is settled when due. Amounts outstanding under these netting arrangements are presented on a net basis in the consolidated balance sheets.
Inventories
As discussed under “Change in Accounting Policy” in Note 2, the Partnership changed its accounting policy for certain inventory in the fourth quarter of 2017.
Inventories consist principally of natural gas held in storage, NGLs and refined products, crude oil and spare parts, all of which are valued at the lower of cost or net realizable value utilizing the weighted-average cost method.
Inventories consisted of the following:
|
| | | | | | | |
| | December 31, |
| | 2019 | | 2018 |
Natural gas, NGLs and refined products (1) | $ | 833 |
| | $ | 833 |
|
| Crude oil | 566 |
| | 506 |
|
| Spare parts and other | 448 |
| | 338 |
|
| Total inventories | $ | 1,847 |
| | $ | 1,677 |
|
| |
(1) | Due to changes in fuel prices, Sunoco LP recorded a write-down on the value of its fuel inventory of $85 million as of December 31, 2018. |
|
| | | | | | | |
| | December 31, |
| | 2017 | | 2016 |
| Natural gas, NGLs, and refined products | $ | 733 |
| | $ | 758 |
|
| Crude oil | 551 |
| | 651 |
|
| Spare parts and other | 305 |
| | 217 |
|
| Total inventories | $ | 1,589 |
| | $ | 1,626 |
|
We utilize commodity derivatives to manage price volatility associated with our natural gas inventory. Changes in fair value of designated hedged inventory are recorded in inventory on our consolidated balance sheets and cost of products sold in our consolidated statements of operations.
Other Current Assets
Other current assets consisted of the following:
| | | | December 31, | December 31, |
| | 2017 | | 2016 | 2019 | | 2018 |
| Deposits paid to vendors | $ | 64 |
| | $ | 74 |
| $ | 95 |
| | $ | 141 |
|
| Prepaid expenses and other | 146 |
| | 224 |
| 187 |
| | 215 |
|
| Total other current assets | $ | 210 |
| | $ | 298 |
| $ | 282 |
| | $ | 356 |
|
Property, Plant and Equipment
Property, plant and equipment are stated at cost less accumulated depreciation. Depreciation is computed using the straight-line method over the estimated useful or FERC mandatedFERC-mandated lives of the assets, if applicable. Expenditures for maintenance and repairs that do not add capacity or extend the useful life are expensed as incurred. Expenditures to refurbish assets that either extend the useful lives of the asset or prevent environmental contamination are capitalized and depreciated over the remaining useful life of the asset. Additionally, we capitalize certain costs directly related to the construction of assets
including internal labor costs, interest and engineering costs. Upon disposition or retirement of pipeline components or natural gas plant components, any gain or loss is recorded to accumulated depreciation. When entire pipeline systems, gas plants or other property and equipment are retired or sold, any gain or loss is included in our consolidated statements of operations.
Property, plant and equipment is reviewed for impairment whenever events or changes in circumstances indicate that the carrying amount of such assets may not be recoverable. If such a review should indicate that the carrying amount of long-lived assets is not recoverable, we reduce the carrying amount of such assets to fair value.
In 2019, USAC recognized a $6 million fixed asset impairment related to certain idle compressor assets. Sunoco LP recognized a $47 million write-down on assets held for sale related to its ethanol plant in Fulton, New York.
In 2018, USAC recognized a $9 million fixed asset impairment related to certain idle compressor assets.
In 2017, the Partnership recorded a $127 million fixed asset impairment related to Sea Robin primarily due to a reduction in expected future cash flows due to an increase during 2017 in insurance costs related to offshore assets. In 2016, the Partnership recorded a $133 million fixed asset impairment related to the interstate transportation and storage segment primarily due to expected decreases in future cash flows driven by declines in commodity prices as well as a $10 million impairment to property, plant and equipment in the midstream segment. In 2015, the Partnership recorded a $110 million fixed asset impairment related to the NGL and refined products transportation and services segment primarily due to an expected decrease in future cash flows. No other fixed asset impairments were identified or recorded for our reporting units during the periods presented.
Capitalized interest is included for pipeline construction projects, except for certain interstate projects for which an allowance for funds used during construction (“AFUDC”) is accrued. Interest is capitalized based on the current borrowing rate of our revolving credit facilityfacilities when the related costs are incurred. AFUDC is calculated under guidelines prescribed by the FERC and capitalized as part of the cost of utility plant for interstate projects. It represents the cost of servicing the capital invested in construction work-in-process. AFUDC is segregated into two component parts – borrowed funds and equity funds.
Components and useful lives of property, plant and equipment were as follows:
| | | | December 31, | December 31, |
| | 2017 | | 2016 | 2019 | | 2018 |
| Land and improvements | $ | 1,706 |
| | $ | 676 |
| $ | 1,075 |
| | $ | 1,168 |
|
| Buildings and improvements (1 to 45 years) | 1,960 |
| | 1,617 |
| 2,581 |
| | 2,636 |
|
| Pipelines and equipment (5 to 83 years) | 44,050 |
| | 36,356 |
| 62,508 |
| | 58,783 |
|
| Natural gas and NGL storage facilities (5 to 46 years) | 1,681 |
| | 1,452 |
| |
| Bulk storage, equipment and facilities (2 to 83 years) | 3,036 |
| | 3,701 |
| |
| Vehicles (1 to 25 years) | 124 |
| | 217 |
| |
| Product storage and related facilities and equipment (2 to 83 years) | | 4,739 |
| | 4,978 |
|
| Right of way (20 to 83 years) | 3,424 |
| | 3,349 |
| 4,736 |
| | 4,533 |
|
| Natural resources | 434 |
| | 434 |
| |
| Other (1 to 40 years) | 534 |
| | 484 |
| |
| Other (1 to 48 years) | | 1,499 |
| | 1,115 |
|
| Construction work-in-process | 10,750 |
| | 9,934 |
| 8,221 |
| | 6,067 |
|
| | 67,699 |
| | 58,220 |
| |
| Less – Accumulated depreciation and depletion | (9,262 | ) | | (7,303 | ) | |
| Property, plant and equipment, gross | | 85,359 |
| | 79,280 |
|
| Less: Accumulated depreciation and depletion | | (15,388 | ) | | (12,625 | ) |
| Property, plant and equipment, net | $ | 58,437 |
| | $ | 50,917 |
| $ | 69,971 |
| | $ | 66,655 |
|
We recognized the following amounts for the periods presented:
|
| | | | | | | | | | | |
| | Years Ended December 31, |
| | 2019 | | 2018 | | 2017 |
| Depreciation, depletion and amortization expense | $ | 2,816 |
| | $ | 2,522 |
| | $ | 2,199 |
|
| Capitalized interest | 166 |
| | 294 |
| | 286 |
|
|
| | | | | | | | | | | |
| | Years Ended December 31, |
| | 2017 | | 2016 | | 2015 |
| Depreciation and depletion expense | $ | 2,060 |
| | $ | 1,793 |
| | $ | 1,713 |
|
| Capitalized interest | 283 |
| | 199 |
| | 163 |
|
Advances to and Investments in Unconsolidated Affiliates
We own interests in a number of related businesses that are accounted for by the equity method. In general, we use the equity method of accounting for an investment for which we exercise significant influence over, but do not control, the investee’s operating and financial policies. An impairment of an investment in an unconsolidated affiliate is recognized when circumstances indicate that a decline in the investment value is other than temporary.
Other Non-Current Assets, net
Other non-current assets, net are stated at cost less accumulated amortization. Other non-current assets, net consisted of the following:
|
| | | | | | | |
| | December 31, |
| | 2019 | | 2018 |
| Regulatory assets | $ | 42 |
| | $ | 43 |
|
| Pension assets | 84 |
| | 68 |
|
| Deferred charges | 178 |
| | 178 |
|
| Restricted funds | 178 |
| | 178 |
|
| Other | 494 |
| | 539 |
|
| Total other non-current assets, net | $ | 976 |
| | $ | 1,006 |
|
|
| | | | | | | |
| | December 31, |
| | 2017 | | 2016 |
| Regulatory assets | $ | 85 |
| | $ | 86 |
|
| Deferred charges | 210 |
| | 217 |
|
| Restricted funds | 192 |
| | 190 |
|
| Long-term affiliated receivable | 85 |
| | 90 |
|
| Other | 186 |
| | 89 |
|
| Total other non-current assets, net | $ | 758 |
| | $ | 672 |
|
Restricted funds primarily consistedincludes an immaterial amount of restricted cash primarily held in our wholly-owned captive insurance companies.
Intangible Assets
Intangible assets are stated at cost, net of amortization computed on the straight-line method. The Partnership removes the gross carrying amount and the related accumulated amortization for any fully amortized intangibles in the year they are fully amortized.
Components and useful lives of intangible assets were as follows:
|
| | | | | | | | | | | | | | | |
| | December 31, 2019 | | December 31, 2018 |
| | Gross Carrying Amount | | Accumulated Amortization | | Gross Carrying Amount | | Accumulated Amortization |
| Amortizable intangible assets: | | | | | | | |
| Customer relationships, contracts and agreements (3 to 46 years) | $ | 7,074 |
| | $ | (1,741 | ) | | $ | 7,106 |
| | $ | (1,493 | ) |
| Patents (10 years) | 48 |
| | (35 | ) | | 48 |
| | (30 | ) |
| Trade Names (20 years) | 66 |
| | (31 | ) | | 66 |
| | (28 | ) |
| Other (5 to 20 years) | 19 |
| | (12 | ) | | 33 |
| | (9 | ) |
| Total amortizable intangible assets | 7,207 |
| | (1,819 | ) | | 7,253 |
| | (1,560 | ) |
| Non-amortizable intangible assets: | | | | | | | |
| Trademarks | 295 |
| | — |
| | 295 |
| | — |
|
| Other | 12 |
| | — |
| | 12 |
| | — |
|
| Total non-amortizable intangible assets | 307 |
| | — |
| | 307 |
| | — |
|
| Total intangible assets | $ | 7,514 |
| | $ | (1,819 | ) | | $ | 7,560 |
| | $ | (1,560 | ) |
|
| | | | | | | | | | | | | | | |
| | December 31, 2017 | | December 31, 2016 |
| | Gross Carrying Amount | | Accumulated Amortization | | Gross Carrying Amount | | Accumulated Amortization |
| Amortizable intangible assets: | | | | | | | |
| Customer relationships, contracts and agreements (3 to 46 years) | $ | 6,250 |
| | $ | (1,003 | ) | | $ | 5,362 |
| | $ | (737 | ) |
| Patents (10 years) | 48 |
| | (26 | ) | | 48 |
| | (21 | ) |
| Trade Names (20 years) | 66 |
| | (25 | ) | | 66 |
| | (22 | ) |
| Other (5 to 20 years) | 1 |
| | — |
| | 2 |
| | (2 | ) |
| Total intangible assets | $ | 6,365 |
| | $ | (1,054 | ) | | $ | 5,478 |
| | $ | (782 | ) |
Aggregate amortization expense of intangible assets was as follows:
|
| | | | | | | | | | | |
| | Years Ended December 31, |
| | 2019 | | 2018 | | 2017 |
| Reported in depreciation, depletion and amortization expense | $ | 308 |
| | $ | 321 |
| | $ | 336 |
|
|
| | | | | | | | | | | |
| | Years Ended December 31, |
| | 2017 | | 2016 | | 2015 |
| Reported in depreciation, depletion and amortization | $ | 272 |
| | $ | 193 |
| | $ | 216 |
|
Estimated aggregate amortization expense for the next five years is as follows:
|
| | | |
| Years Ending December 31: | |
| 2020 | $ | 371 |
|
| 2021 | 367 |
|
| 2022 | 337 |
|
| 2023 | 297 |
|
| 2024 | 284 |
|
|
| | | |
| Years Ending December 31: | |
| 2018 | $ | 280 |
|
| 2019 | 278 |
|
| 2020 | 278 |
|
| 2021 | 268 |
|
| 2022 | 256 |
|
We review amortizable intangible assets for impairment whenever events or changes in circumstances indicate that the carrying amount of such assets may not be recoverable. If such a review should indicate that the carrying amount of amortizable intangible assets is not recoverable, we reduce the carrying amount of such assets to fair value. We review non-amortizable intangible assets for impairment annually, or more frequently if circumstances dictate.
In 2015, we recorded $24Sunoco LP performed impairment tests on its indefinite-lived intangible assets during the fourth quarter of 2018 and recognized a $30 million of intangible asset impairments related toimpairment charge on its contractual rights, included in other in the NGL and refined products transportation and services segmenttable above, primarily due to an expected decreasedecreases in projected future revenues and cash flows.flows from the date the intangible assets were originally recorded.
Sunoco LP performed impairment tests on its indefinite-lived intangible assets during the fourth quarter of 2017 and recognized a total of $17 million in impairment charges on their contractual rights and liquor licenses primarily due to decreases in projected future revenues and cash flows from the date the intangible assets were originally recorded.
Goodwill
Goodwill is tested for impairment annually or more frequently if circumstances indicate that goodwill might be impaired. The annual impairment test is performed during the fourth quarter.
Changes in the carrying amount of goodwill were as follows:
|
| | | | | | | | | | | | | | | | | | | | | | | | | | | | | | | | | | | |
| | Intrastate Transportation and Storage | | Interstate Transportation and Storage | | Midstream | | NGL and Refined Products Transportation and Services | | Crude Oil Transportation and Services | | Investment in Sunoco LP | | Investment in USAC | | All Other | | Total |
| Balance, December 31, 2017 | $ | 10 |
| | $ | 196 |
| | $ | 870 |
| | $ | 693 |
| | $ | 1,167 |
| | $ | 1,430 |
| | $ | — |
| | $ | 363 |
| | $ | 4,729 |
|
| Acquired | — |
| | — |
| | — |
| | — |
| | — |
| | 129 |
| | 366 |
| | — |
| | 495 |
|
| CDM Contribution | — |
| | — |
| | — |
| | — |
| | — |
| | — |
| | 253 |
| | (253 | ) | | — |
|
| Impaired | — |
| | — |
| | (378 | ) | | — |
| | — |
| | — |
| | — |
| | — |
| | (378 | ) |
| Other | — |
| | — |
| | — |
| | — |
| | — |
| | — |
| | — |
| | 39 |
| | 39 |
|
| Balance, December 31, 2018 | 10 |
| | 196 |
| | 492 |
| | 693 |
| | 1,167 |
| | 1,559 |
| | 619 |
| | 149 |
| | 4,885 |
|
| Acquired | — |
| | 42 |
| | — |
| | — |
| | — |
| | — |
| | — |
| | — |
| | 42 |
|
| Impaired | — |
| | (12 | ) | | (9 | ) | | — |
| | — |
| | — |
| | — |
| | — |
| | (21 | ) |
| Other | — |
| | — |
| | — |
| | — |
| | — |
| | (4 | ) | | — |
| | — |
| | (4 | ) |
| Balance, December 31, 2019 | $ | 10 |
| | $ | 226 |
| | $ | 483 |
| | $ | 693 |
| | $ | 1,167 |
| | $ | 1,555 |
| | $ | 619 |
| | $ | 149 |
| | $ | 4,902 |
|
|
| | | | | | | | | | | | | | | | | | | | | | | | | | | |
| | Intrastate Transportation and Storage | | Interstate Transportation and Storage | | Midstream | | NGL and Refined Products Transportation and Services | | Crude Oil Transportation and Services | | All Other | | Total |
| Balance, December 31, 2015 | $ | 10 |
| | $ | 912 |
| | $ | 718 |
| | $ | 772 |
| | $ | 912 |
| | $ | 2,104 |
| | $ | 5,428 |
|
| Reduction due to contribution of legacy Sunoco, Inc. retail business | — |
| | — |
| | — |
| | — |
| | — |
| | (1,289 | ) | | (1,289 | ) |
| Acquired | — |
| | — |
| | 177 |
| | — |
| | 251 |
| | — |
| | 428 |
|
| Impaired | — |
| | (638 | ) | | (32 | ) | | — |
| | — |
| | — |
| | (670 | ) |
| Balance, December 31, 2016 | 10 |
| | 274 |
| | 863 |
| | 772 |
| | 1,163 |
| | 815 |
| | 3,897 |
|
| Acquired | — |
| | — |
| | 8 |
| | — |
| | 4 |
| | — |
| | 12 |
|
| Impaired | — |
| | (262 | ) | | — |
| | (79 | ) | | — |
| | (452 | ) | | (793 | ) |
| Other | — |
| | — |
| | (1 | ) | | — |
| | — |
| | — |
| | (1 | ) |
| Balance, December 31, 2017 | $ | 10 |
| | $ | 12 |
| | $ | 870 |
| | $ | 693 |
| | $ | 1,167 |
| | $ | 363 |
| | $ | 3,115 |
|
Goodwill is recorded at the acquisition date based on a preliminary purchase price allocation and generally may be adjusted when the purchase price allocation is finalized.
During the third quarter of 2019, the Partnership recognized a goodwill impairment of $12 million related to the Southwest Gas operations within the interstate segment primarily due to decreases in projected future revenues and cash flows. During the fourth quarter of 2019, the Partnership recognized a goodwill impairment of $9 million related to our North Central operations within the midstream segment primarily due to changes in assumptions related to projected future revenues and cash flows.
During the fourth quarter of 2018, the Partnership recognized goodwill impairments of $378 million related to our Northeast operations within the midstream segment primarily due to changes in assumptions related to projected future revenues and cash flows from the dates the goodwill was originally recorded. These changes in assumptions reflect delays in the construction of third-party takeaway capacity in the Northeast.
During the fourth quarter of 2017, the Partnership performed goodwill impairment tests on our reporting units and recognized goodwill impairments of $262 million in the interstate transportation and storage segment, $79 million in the NGL and refined products transportation and services segment and $452 million in the all other segment primarily due to changes in assumptions related to projected future revenues and cash flows from the dates the goodwill was originally recorded.
During the fourth quarter of 2016, the Partnership performed goodwill impairment tests on our reporting units and Sunoco LP recognized goodwill impairments of $638$387 million, the interstate transportation and storage segment and $32of which $102 million in the midstream segment was allocated to continuing operations,primarily due to decreaseschanges in assumptions related to projected future revenues and cash flows driven by declines in commodity prices and changes infrom the markets that these assets serve.dates the goodwill was originally recorded.
DuringIn connection with aforementioned impairments, the fourth quarter of 2015, the Partnership performed goodwill impairment tests on our reporting units and recognized goodwill impairments of $99 million in the interstate transportation and storage segment and $106 million in the NGL and refined products transportation and services segment primarily due to market declines in current and expected future commodity prices in the fourth quarter of 2015.
The Partnership determined the fair value of our reporting units using a weighted combination of the discounted cash flow method and the guideline company method. Determining the fair value of a reporting unit requires judgment and the use of significant estimates and assumptions. Such estimates and assumptions include revenue growth rates, operating margins, weighted average costs of capital and future market conditions, among others. The Partnership believes the estimates and assumptions used in our impairment assessments are reasonable and based on available market information, but variations in any of the assumptions could result in materially different calculations of fair value and determinations of whether or not an impairment is indicated. Under the discounted cash flow method, the Partnership determined fair value based on estimated future cash flows of each reporting unit including estimates for capital expenditures, discounted to present value using the risk-adjusted industry rate, which reflect the overall level of inherent risk of the reporting unit. Cash flow projections are derived from one year budgeted amounts and five year operating forecasts plus an estimate of later period cash flows, all of which are evaluated by management. Subsequent period cash flows are developed for each reporting unit using growth rates that management believes are reasonably likely to occur. Under the guideline company method, the Partnership determined the estimated fair value of each of our reporting units by applying valuation multiples of comparable publicly-traded companies to each reporting unit’s projected EBITDA and then averaging that estimate with similar historical calculations using a three year average. In addition, the Partnership estimated a reasonable control premium representing the incremental value that accrues to the majority owner from the opportunity to dictate the strategic and operational actions of the business.
Management does not believe that any of the goodwill balances in its reporting units is currently at significant risk of impairment; however, of the $4.90 billion of goodwill on the Partnership’s consolidated balance sheet as of December 31, 2019, approximately $380 million is recorded in reporting units for which the estimated fair value exceeded the carrying value by less than 20% in the most recent quantitative test.
Asset Retirement Obligations
We have determined that we are obligated by contractual or regulatory requirements to remove facilities or perform other remediation upon retirement of certain assets. The fair value of any ARO is determined based on estimates and assumptions related to retirement costs, which the Partnership bases on historical retirement costs, future inflation rates and credit-adjusted
risk-free interest rates. These fair value assessments are considered to be Level 3 measurements, as they are based on both observable and unobservable inputs. Changes in the liability are recorded for the passage of time (accretion) or for revisions to cash flows originally estimated to settle the ARO.
An ARO is required to be recorded when a legal obligation to retire an asset exists and such obligation can be reasonably estimated. We will record an asset retirement obligationARO in the periods in which management can reasonably estimate the settlement dates.
Except for certain amounts discussed below, management was not able to reasonably measure the fair value of asset retirement obligationsAROs as of December 31, 20172019 and 2016,2018, in most cases because the settlement dates were indeterminable. Although a number of other onshore assets in Panhandle’s system are subject to agreements or regulations that give rise to an ARO upon Panhandle’s discontinued use of these assets, AROs were not recorded because these assets have an indeterminate removal or abandonment date given the expected continued use of the assets with proper maintenance or replacement. ETC Sunoco Inc. has legal asset retirement obligationsAROs for several other assets at its previously owned refineries, pipelines and terminals, for which it is not possible to estimate when the obligations will be settled. Consequently, the retirement obligations for these assets cannot be measured at this time. At the end of the useful life of these underlying assets, ETC Sunoco Inc. is legally or contractually required to abandon in place or remove the asset. We believe we may have additional asset retirement obligationsAROs related to itsETC Sunoco’s pipeline assets and storage tanks, for which it is not possible to estimate whether or when the retirement obligationsAROs will be settled. Consequently, these retirement obligationsAROs cannot be measured at this time. Sunoco LP has AROs related to the estimated future cost to remove underground storage tanks.
As of December 31, 20172019 and 2016,2018, other non-current liabilities in the Partnership’s consolidated balance sheets included AROs of $165$223 million and $170$193 million, respectively. For the years ended December 31, 2019, 2018 and 2017 aggregate accretion expense related to AROs was $5 million, $13 million and $9 million, respectively.
Individual component assets have been and will continue to be replaced, but the pipeline and the natural gas gathering and processing systems will continue in operation as long as supply and demand for natural gas exists. Based on the widespread use of natural gas in industrial and power generation activities, management expects supply and demand to exist for the
foreseeable future. We have in place a rigorous repair and maintenance program that keeps the pipelines and the natural gas gathering and processing systems in good working order. Therefore, although some of the individual assets may be replaced, the pipelines and the natural gas gathering and processing systems themselves will remain intact indefinitely.
Long-livedOher non-current assets related to AROs aggregated $2on the Partnership’s consolidated balance sheet included $31 million and $14$26 million and were reflected as property, plant and equipment on our balance sheet as of December 31, 2017 and 2016, respectively. In addition, the Partnership had $21 million and $13 million legally restricted funds for the purpose of settling AROs that was reflected as other non-current assets as of December 31, 20172019 and 2016,2018, respectively.
Accrued and Other Current Liabilities
Accrued and other current liabilities consisted of the following:
|
| | | | | | | |
| | December 31, |
| | 2019 | | 2018 |
| Interest payable | $ | 576 |
| | $ | 503 |
|
| Customer advances and deposits | 123 |
| | 128 |
|
| Accrued capital expenditures | 1,265 |
| | 1,030 |
|
| Accrued wages and benefits | 217 |
| | 283 |
|
| Taxes payable other than income taxes | 263 |
| | 256 |
|
| Exchanges payable | 67 |
| | 112 |
|
| Other | 705 |
| | 535 |
|
| Total accrued and other current liabilities | $ | 3,216 |
| | $ | 2,847 |
|
|
| | | | | | | |
| | December 31, |
| | 2017 | | 2016 |
| Interest payable | $ | 443 |
| | $ | 440 |
|
| Customer advances and deposits | 59 |
| | 56 |
|
| Accrued capital expenditures | 1,006 |
| | 749 |
|
| Accrued wages and benefits | 208 |
| | 212 |
|
| Taxes payable other than income taxes | 108 |
| | 63 |
|
| Exchanges payable | 154 |
| | 208 |
|
| Other | 165 |
| | 177 |
|
| Total accrued and other current liabilities | $ | 2,143 |
| | $ | 1,905 |
|
Deposits or advances are received from our customers as prepayments for natural gas deliveries in the following month. Prepayments and security deposits may also be required when customers exceed their credit limits or do not qualify for open credit.
Redeemable Noncontrolling Interests
TheOur redeemable noncontrolling interests relate to certain preferred unitholders of one of our consolidated subsidiaries that have the option to convert their preferred units to such subsidiary’s common units at the election of the holders and the noncontrolling interest holders in one of our consolidated subsidiaries hasthat have the option to sell itstheir interests to us. In accordance with applicable accounting guidance, the noncontrolling interest is excluded from total equity and reflected as redeemable interestnoncontrolling interests on ETP’sour consolidated balance sheet. See Note 6 for further information.
Environmental Remediation
We accrue environmental remediation costs for work at identified sites where an assessment has indicated that cleanup costs are probable and reasonably estimable. Such accruals are undiscounted and are based on currently available information, estimated timing of remedial actions and related inflation assumptions, existing technology and presently enacted laws and regulations. If a range of probable environmental cleanup costs exists for an identified site, the minimum of the range is accrued unless some other point in the range is more likely in which case the most likely amount in the range is accrued.
Fair Value of Financial Instruments
The carrying amounts of cash and cash equivalents, accounts receivable and accounts payable approximate their fair value.
Based on the estimated borrowing rates currently available to us and our subsidiaries for loans with similar terms and average maturities, the aggregate fair value and carrying amount of our debt obligations as of December 31, 20172019 was $34.28$54.08 billion and $33.09and$50.35 billion , respectively. As of December 31, 2016,2018, the aggregate fair value and carrying amount of our debt obligations was $33.85$39.54 billion and $32.93$40.51 billion, respectively. The fair value of our consolidated debt obligations is a Level 2 valuation based on the observable inputs used for similar liabilities.
We have commodity derivatives, interest rate derivatives and embedded derivatives in our preferred units that are accounted for as assets and liabilities at fair value in our consolidated balance sheets. We determine the fair value of our assets and liabilities subject to fair value measurement by using the highest possible “level” of inputs. Level 1 inputs are observable quotes in an active market for identical assets and liabilities. We consider the valuation of marketable securities and commodity derivatives transacted through a clearing broker with a published price from the appropriate exchange as a Level 1 valuation. Level 2 inputs are inputs observable for similar assets and liabilities. We consider OTC commodity derivatives entered into directly with third parties as a Level 2 valuation since the values of these derivatives are quoted on an exchange for similar
transactions. Additionally, we consider our options transacted through our clearing broker as having Level 2 inputs due to the level of activity of these contracts on the exchange in which they trade. We consider the valuation of our interest rate derivatives as Level 2 as the primary input, the LIBOR curve, is based on quotes from an active exchange of Eurodollar futures for the same period as the future interest swap settlements. Level 3 inputs are unobservable. During the year ended December 31, 2017, no2019, 0 transfers were made between any levels within the fair value hierarchy.
The following tables summarize the fair value of our financial assets and liabilities measured and recorded at fair value on a recurring basis as of December 31, 20172019 and 20162018 based on inputs used to derive their fair values:
| | | | Fair Value Total | | Fair Value Measurements at December 31, 2017 | Fair Value Total | | Fair Value Measurements at December 31, 2019 |
| | Level 1 | | Level 2 | Level 1 | | Level 2 |
| Assets: | | | | | | | | | | |
| Commodity derivatives: | | | | | | | | | | |
| Natural Gas: | | | | | | | | | | |
| Basis Swaps IFERC/NYMEX | $ | 11 |
| | $ | 11 |
| | $ | — |
| $ | 17 |
| | $ | 17 |
| | $ | — |
|
| Swing Swaps IFERC | 13 |
| | — |
| | 13 |
| 1 |
| | — |
| | 1 |
|
| Fixed Swaps/Futures | 70 |
| | 70 |
| | — |
| 65 |
| | 65 |
| | — |
|
| Forward Physical Swaps | 8 |
| | — |
| | 8 |
| |
| Forward Physical Contracts | | 3 |
| | — |
| | 3 |
|
| Power: | | | | | | | | | | |
| Forwards | 23 |
| | — |
| | 23 |
| 11 |
| | — |
| | 11 |
|
| Natural Gas Liquids – Forwards/Swaps | 193 |
| | 193 |
| | — |
| |
| Crude – Futures | 2 |
| | 2 |
| | — |
| |
| Futures | | 4 |
| | 4 |
| | — |
|
| Options – Puts | | 1 |
| | 1 |
| | — |
|
| Options – Calls | | 1 |
| | 1 |
| | — |
|
| NGLs – Forwards/Swaps | | 260 |
| | 260 |
| | — |
|
| Refined Products – Futures | | 8 |
| | 8 |
| | — |
|
| Crude – Forwards/Swaps | | 13 |
| | 13 |
| | — |
|
| Total commodity derivatives | 320 |
| | 276 |
| | 44 |
| 384 |
| | 369 |
| | 15 |
|
| Other non-current assets | 21 |
| | 14 |
| | 7 |
| 31 |
| | 20 |
| | 11 |
|
| Total assets | $ | 341 |
| | $ | 290 |
| | $ | 51 |
| $ | 415 |
| | $ | 389 |
| | $ | 26 |
|
| Liabilities: | | | | | | | | | | |
| Interest rate derivatives | $ | (219 | ) | | $ | — |
| | $ | (219 | ) | $ | (399 | ) | | $ | — |
| | $ | (399 | ) |
| Commodity derivatives: | | | | | | | | | | |
| Natural Gas: | | | | | | | | | | |
| Basis Swaps IFERC/NYMEX | (24 | ) | | (24 | ) | | — |
| (49 | ) | | (49 | ) | | — |
|
| Swing Swaps IFERC | (15 | ) | | (1 | ) | | (14 | ) | (1 | ) | | — |
| | (1 | ) |
| Fixed Swaps/Futures | (57 | ) | | (57 | ) | | — |
| (43 | ) | | (43 | ) | | — |
|
| Forward Physical Swaps | (2 | ) | | — |
| | (2 | ) | |
| Power – Forwards | (22 | ) | | — |
| | (22 | ) | |
| Natural Gas Liquids – Forwards/Swaps | (192 | ) | | (192 | ) | | — |
| |
| Power: | | | | | | |
| Forwards | | (5 | ) | | — |
| | (5 | ) |
| Futures | | (3 | ) | | (3 | ) | | — |
|
| NGLs – Forwards/Swaps | | (278 | ) | | (278 | ) | | — |
|
| Refined Products – Futures | (25 | ) | | (25 | ) | | — |
| (10 | ) | | (10 | ) | | — |
|
| Crude – Futures | (1 | ) | | (1 | ) | | — |
| |
| Total commodity derivatives | (338 | ) | | (300 | ) | | (38 | ) | (389 | ) | | (383 | ) | | (6 | ) |
| Total liabilities | $ | (557 | ) | | $ | (300 | ) | | $ | (257 | ) | $ | (788 | ) | | $ | (383 | ) | | $ | (405 | ) |
|
| | | | | | | | | | | |
| | Fair Value Total | | Fair Value Measurements at December 31, 2018 |
| | Level 1 | | Level 2 |
| Assets: | | | | | |
| Commodity derivatives: | | | | | |
| Natural Gas: | | | | | |
| Basis Swaps IFERC/NYMEX | $ | 42 |
| | $ | 42 |
| | $ | — |
|
| Swing Swaps IFERC | 52 |
| | 8 |
| | 44 |
|
| Fixed Swaps/Futures | 97 |
| | 97 |
| | — |
|
| Forward Physical Contracts | 20 |
| | — |
| | 20 |
|
| Power: | | | | | |
| Power – Forwards | 48 |
| | — |
| | 48 |
|
| Futures | 1 |
| | 1 |
| | — |
|
| Options – Calls | 1 |
| | 1 |
| | — |
|
| NGLs – Forwards/Swaps | 291 |
| | 291 |
| | — |
|
| Refined Products – Futures | 7 |
| | 7 |
| | — |
|
| Crude - Forwards/Swaps | 1 |
| | 1 |
| | — |
|
| Total commodity derivatives | 560 |
| | 448 |
| | 112 |
|
| Other non-current assets | 26 |
| | 17 |
| | 9 |
|
| Total assets | $ | 586 |
| | $ | 465 |
| | $ | 121 |
|
| Liabilities: | | | | | |
| Interest rate derivatives | $ | (163 | ) | | $ | — |
| | $ | (163 | ) |
| Commodity derivatives: | | | | | |
| Natural Gas: | | | | | |
| Basis Swaps IFERC/NYMEX | (91 | ) | | (91 | ) | | — |
|
| Swing Swaps IFERC | (40 | ) | | — |
| | (40 | ) |
| Fixed Swaps/Futures | (88 | ) | | (88 | ) | | — |
|
| Forward Physical Contracts | (21 | ) | | — |
| | (21 | ) |
| Power: | | | | | |
| Forwards | (42 | ) | | — |
| | (42 | ) |
| Futures | (1 | ) | | (1 | ) | | — |
|
| NGLs – Forwards/Swaps | (224 | ) | | (224 | ) | | — |
|
| Refined Products – Futures | (15 | ) | | (15 | ) | | — |
|
| Crude - Forwards/Swaps | (61 | ) | | (61 | ) | | — |
|
| Total commodity derivatives | (583 | ) | | (480 | ) | | (103 | ) |
| Total liabilities | $ | (746 | ) | | $ | (480 | ) | | $ | (266 | ) |
|
| | | | | | | | | | | | | | | |
| | Fair Value Total | | Fair Value Measurements at December 31, 2016 |
| | Level 1 | | Level 2 | | Level 3 |
| Assets: | | | | | | | |
| Commodity derivatives: | | | | | | | |
| Natural Gas: | | | | | | | |
| Basis Swaps IFERC/NYMEX | $ | 14 |
| | $ | 14 |
| | $ | — |
| | $ | — |
|
| Swing Swaps IFERC | 2 |
| | — |
| | 2 |
| | — |
|
| Fixed Swaps/Futures | 96 |
| | 96 |
| | — |
| | — |
|
| Forward Physical Swaps | 1 |
| | — |
| | 1 |
| | — |
|
| Power: | | | | | | | |
| Forwards | 4 |
| | — |
| | 4 |
| | — |
|
| Futures | 1 |
| | 1 |
| | — |
| | — |
|
| Options – Calls | 1 |
| | 1 |
| | — |
| | — |
|
| Natural Gas Liquids – Forwards/Swaps | 233 |
| | 233 |
| | — |
| | — |
|
| Refined Products – Futures | 1 |
| | 1 |
| | — |
| | — |
|
| Crude – Futures | 9 |
| | 9 |
| | — |
| | — |
|
| Total commodity derivatives | 362 |
| | 355 |
| | 7 |
| | — |
|
| Other non-current assets | 13 |
| | 8 |
| | 5 |
| | — |
|
| Total assets | $ | 375 |
| | $ | 363 |
| | $ | 12 |
| | $ | — |
|
| Liabilities: | | | | | | | |
| Interest rate derivatives | $ | (193 | ) | | $ | — |
| | $ | (193 | ) | | $ | — |
|
| Embedded derivatives in the Legacy ETP Preferred Units | (1 | ) | | — |
| | — |
| | (1 | ) |
| Commodity derivatives: | | | | | | | |
| Natural Gas: | | | | | | | |
| Basis Swaps IFERC/NYMEX | (11 | ) | | (11 | ) | | — |
| | — |
|
| Swing Swaps IFERC | (3 | ) | | — |
| | (3 | ) | | — |
|
| Fixed Swaps/Futures | (149 | ) | | (149 | ) | | — |
| | — |
|
| Power: | | | | | | | |
| Forwards | (5 | ) | | — |
| | (5 | ) | | — |
|
| Futures | (1 | ) | | (1 | ) | | — |
| | — |
|
| Natural Gas Liquids – Forwards/Swaps | (273 | ) | | (273 | ) | | — |
| | — |
|
| Refined Products – Futures | (17 | ) | | (17 | ) | | — |
| | — |
|
| Crude – Futures | (13 | ) | | (13 | ) | | — |
| | — |
|
| Total commodity derivatives | (472 | ) | | (464 | ) | | (8 | ) | | — |
|
| Total liabilities | $ | (666 | ) | | $ | (464 | ) | | $ | (201 | ) | | $ | (1 | ) |
Contributions in Aid of Construction Costs
On certain of our capital projects, third parties are obligated to reimburse us for all or a portion of project expenditures. The majority of such arrangements are associated with pipeline construction and production well tie-ins. Contributions in aid of construction costs (“CIAC”) are netted against our project costs as they are received, and any CIAC which exceeds our total project costs, is recognized as other income in the period in which it is realized.
Shipping and Handling Costs
Shipping and handling costs are included in cost of products sold, except for shipping and handling costs related to fuel consumed for compression and treating which are included in operating expenses.
Costs and Expenses
Cost of products sold include actual cost of fuel sold, adjusted for the effects of our hedging and other commodity derivative activities, and the cost of appliances, parts and fittings. Operating expenses include all costs incurred to provide products to customers, including compensation for operations personnel, insurance costs, vehicle maintenance, advertising costs, purchasing costs and plant operations. Selling, general and administrative expenses include all partnership related expenses and compensation for executive, partnership, and administrative personnel.
We record the collection of taxes to be remitted to government authorities on a net basis except for our all other segment in which consumer excise taxes on sales of refined products and merchandise are included in both revenues and costs and expenses in the consolidated statements of operations, with no effect on net income (loss).income. For the yearyears ended December 31, 2015,2019, 2018 and 2017, excise taxes collected by Sunoco LP were $1.85 billion. The Partnership deconsolidated Sunoco LP effective July 1, 2015$386 million, $370 million and no excise taxes were collected by our consolidated operations subsequent to that date.$234 million, respectively.
Issuances of Subsidiary Units
We record changes in our ownership interest of our subsidiaries as equity transactions, with no gain or loss recognized in consolidated net income or comprehensive income. For example, upon our subsidiary’s issuance of common units in a public offering, we record any difference between the amount of consideration received or paid and the amount by which the noncontrolling interest isinterests are adjusted as a change in partners’ capital.
Income Taxes
ETPETO is a publicly traded limited partnership and is not taxable for federal and most state income tax purposes. As a result, our earnings or losses, to the extent not included in a taxable subsidiary, for federal and most state purposes are included in the tax returns of the individual partners. Net earnings for financial statement purposes may differ significantly from taxable income reportable to Unitholdersour preferred unitholders as a result of differences between the tax basis and financial basis of assets and liabilities, differences between the tax accounting and financial accounting treatment of certain items, and due to allocation requirements related to taxable income under our SecondFifth Amended and Restated Agreement of Limited Partnership (the “Partnership Agreement”).
As a publicly traded limited partnership, we are subject to a statutory requirement that our “qualifying income” (as defined by the Internal Revenue Code, related Treasury Regulations, and IRSInternal Revenue Service (“IRS”) pronouncements) exceed 90% of our total gross income, determined on a calendar year basis. If our qualifying income does not meet this statutory requirement, ETPETO would be taxed as a corporation for federal and state income tax purposes. For the years ended December 31, 2017, 2016,2019, 2018 and 2015,2017, our qualifying income met the statutory requirement.
The Partnership conducts certain activities through corporate subsidiaries which are subject to federal, state and local income taxes. These corporate subsidiaries include ETP Holdco, Inland Corporation, Oasis PipelineSunoco Property Company LLC and until July 31, 2015, Susser Holding Corporation.Aloha. The Partnership and its corporate subsidiaries account for income taxes under the asset and liability method.
Under this method, deferred tax assets and liabilities are recognized for the estimated future tax consequences attributable to differences between the financial statement carrying amounts of existing assets and liabilities and their respective tax basis. Deferred tax assets and liabilities are measured using enacted tax rates in effect for the year in which those temporary differences are expected to be recovered or settled. The effect on deferred tax assets and liabilities of a change in tax rate is recognized in earnings in the period that includes the enactment date. Valuation allowances are established when necessary to reduce deferred tax assets to the amounts more likely than not to be realized.
The determination of the provision for income taxes requires significant judgment, use of estimates, and the interpretation and application of complex tax laws. Significant judgment is required in assessing the timing and amounts of deductible and taxable items and the probability of sustaining uncertain tax positions. The benefits of uncertain tax positions are recorded in our financial statements only after determining a more-likely-than-not probability that the uncertain tax positions will withstand challenge, if any, from taxing authorities. When facts and circumstances change, we reassess these probabilities and record any changes through the provision for income taxes.
Accounting for Derivative Instruments and Hedging Activities
For qualifying hedges, we formally document, designate and assess the effectiveness of transactions that receive hedge accounting treatment and the gains and losses offset related results on the hedged item in the statement of operations. The market prices used to value our financial derivatives and related transactions have been determined using independent third-party prices, readily available market information, broker quotes and appropriate valuation techniques.
At inception of a hedge, we formally document the relationship between the hedging instrument and the hedged item, the risk management objectives, and the methods used for assessing and testing effectiveness and how any ineffectiveness will be measured and recorded. We also assess, both at the inception of the hedge and on a quarterly basis, whether the derivatives that are used in our hedging transactions are highly effective in offsetting changes in cash flows. If we determine that a derivative is no longer highly effective as a hedge, we discontinue hedge accounting prospectively by including changes in the fair value of the derivative in net income for the period.
If we designate a commodity hedging relationship as a fair value hedge, we record the changes in fair value of the hedged asset or liability in cost of products sold in our consolidated statements of operations. This amount is offset by the changes in fair value of the related hedging instrument. Any ineffective portion or amount excluded from the assessment of hedge ineffectiveness is also included in the cost of products sold in the consolidated statements of operations.
Cash flows from derivatives accounted for as cash flow hedges are reported as cash flows from operating activities, in the same category as the cash flows from the items being hedged.
If we designate a derivative financial instrument as a cash flow hedge and it qualifies for hedge accounting, the change in the fair value is deferred in AOCI until the underlying hedged transaction occurs. Any ineffective portion of a cash flow hedge’s change in fair value is recognized each period in earnings. Gains and losses deferred in AOCI related to cash flow hedges remain in AOCI until the underlying physical transaction occurs, unless it is probable that the forecasted transaction will not occur by the end of the originally specified time period or within an additional two-month period of time thereafter. For financial derivative instruments that do not qualify for hedge accounting, the change in fair value is recorded in cost of products sold in the consolidated statements of operations.
We manage a portion of our interest rate exposures by utilizing interest rate swaps and similar instruments. Certain of our interest rate derivatives are accounted for as either cash flow hedges or fair value hedges. For interest rate derivatives accounted for as either cash flow or fair value hedges, we report realized gains and losses and ineffectiveness portions of those hedges in interest expense. For interest rate derivatives not designated as hedges for accounting purposes, we report realized and unrealized gains and losses on those derivatives in “Gains (losses) on interest rate derivatives” in the consolidated statements of operations.
Unit-BasedIn August 2017, the FASB issued ASU No. 2017-12, Derivatives and Hedging (Topic 815): Targeted Improvements to Accounting for Hedging Activities. The amendments in this update improve the financial reporting of hedging relationships to better portray the economic results of an entity’s risk management activities in its financial statements. In addition, the amendments in this update make certain targeted improvements to simplify the application of the hedge accounting guidance in current GAAP. The Partnership adopted the new rules in the first quarter of 2019, and the adoption of the new accounting rules did not have a material impact on the consolidated financial statements and related disclosures.
Non-Cash Compensation
For awards of restricted units, we recognize compensation expense over the vesting period based on the grant-date fair value, which is determined based on the market price of our Common Unitsthe underlying common units on the grant date. For awards of cash restricted units, we remeasure the fair value of the award at the end of each reporting period based on the market price of our Common Unitsthe underlying common units as of the reporting date, and the fair value is recorded in other non-current liabilities on our consolidated balance sheets.
Pensions and Other Postretirement Benefit Plans
The Partnership recognizes the overfunded or underfunded status of defined benefit pension and other postretirement plans, measured as the difference between the fair value of the plan assets and the benefit obligation (the projected benefit obligation for pension plans and the accumulated postretirement benefit obligation for other postretirement plans). Each overfunded plan is recognized as an asset and each underfunded plan is recognized as a liability. Changes in the funded status of the plan are recorded in the year in which the change occurs within AOCI in equity or, for entities applying regulatory accounting, as a regulatory asset or regulatory liability.
Allocation of Income
For purposes of maintaining partner capital accounts, the Partnership Agreement specifies that items of income and loss shall generally be allocated among the partners in accordance with their percentage interests. The capital account provisions of our Partnership Agreement incorporate principles established for United States Federal income tax purposes and aremay not be comparable to the partners’ capital balances reflected under GAAP in our consolidated financial statements. OurSubsequent to
the Energy Transfer Merger, our general partner owns a non-economic interest in us and, therefore, our net income for partners’ capital and statement of operations presentation purposes is allocated entirely to the General Partner and Limited Partners in accordance with their respective partnership percentages, after giving effect to priority income allocations for incentive distributions, if any, to our General Partner, the holder of the IDRs pursuant to our Partnership Agreement, which are declared and paid following the close of each quarter. Earnings in excess of distributions are allocated to the General Partner and Limited Partners based on their respective ownership interests.Partners.
| |
| 3. | ACQUISITIONS, DIVESTITURES AND RELATED TRANSACTIONS: |
2019 and 2020 Transactions
ET Contribution of SemGroup Assets to ETO
On December 5, 2019, ET completed the acquisition of SemGroup. During the first quarter of 2020, ET contributed certain SemGroup assets to ETO through sale and contribution transactions. The Partnership and SemGroup are under common control by ET subsequent to ET’s acquisition of SemGroup; therefore, we will account for these transactions as reorganizations of entities under common control. Accordingly, beginning with the quarter ending March 31, 2020, the Partnership’s consolidated financial statements will be retrospectively adjusted to reflect the consolidation of the contributed SemGroup businesses beginning December 5, 2019 (the date ET acquired SemGroup).
The following table represents the preliminary fair value, as of December 5, 2019, of the SemGroup assets and liabilities transferred from ET to ETO:
|
| | | |
| | At December 5, 2019 |
| Total current assets | $ | 548 |
|
| Property, plant and equipment | 2,544 |
|
| Other non-current assets | 574 |
|
| Goodwill | 230 |
|
| Intangible assets | 280 |
|
| Total assets | 4,176 |
|
| | |
| Total current liabilities | 480 |
|
| Long-term debt, less current maturities | 812 |
|
| Other non-current liabilities | 109 |
|
| Total liabilities | 1,401 |
|
| | |
| Noncontrolling interest | 335 |
|
| | |
| Partners’ capital | 2,440 |
|
| Total liabilities and partners’ capital | $ | 4,176 |
|
2018 Transactions
CDMET Contribution Agreementof Assets to ETO
In JanuaryImmediately prior to the closing of the Energy Transfer Merger discussed in Note 1, ET contributed the following to ETO:
| |
| • | 2,263,158 common units representing limited partner interests in Sunoco LP to ETO in exchange for 2,874,275 ETO common units; |
| |
| • | 100 percent of the limited liability company interests in Sunoco GP LLC, the sole general partner of Sunoco LP, and all of the IDRs in Sunoco LP, to ETO in exchange for 42,812,389 ETO common units; |
| |
| • | 12,466,912 common units representing limited partner interests in USAC and 100 percent of the limited liability company interests in USA Compression GP, LLC, the general partner of USAC, to ETO in exchange for 16,134,903 ETO common units; and |
| |
| • | a 100 percent limited liability company interest in Lake Charles LNG and a 60 percent limited liability company interest in each of Energy Transfer LNG Export, LLC, ET Crude Oil Terminals, LLC and ETC Illinois LLC to ETO in exchange for 37,557,815 ETO common units. |
USAC Acquisition
On April 2, 2018, ETP enteredET acquired a controlling interest in USAC, a publicly traded partnership that provides compression services in the United States. Specifically the Partnership acquired (i) all of the outstanding limited liability company interests in USA Compression GP, LLC (“USAC GP”), the general partner of USAC, and (ii) 12,466,912 USAC common units representing limited partner interests in USAC for cash consideration equal to $250 million (the “USAC Transaction”). Concurrently, USAC cancelled its IDRs and converted its economic general partner interest into a contribution agreement (“CDM Contribution Agreement”) with ETP GP, ETC Compression, LLC,non-economic general partner interest in exchange for the issuance of 8,000,000 USAC and ETE, pursuant to which, among other things, ETP will contributecommon units to USAC andGP.
Concurrent with these transactions, ETO contributed to USAC will acquire from ETP all of the issued and outstanding membership interests of CDM and CDM E&T for aggregate consideration of approximately $1.7 billion, consisting of (i) 19,191,351 USAC common units, representing limited partner interests in USAC (“USAC Common Units”), with a value of approximately $335 million, (ii) 6,397,965 units of a newly authorized and established class of units representing limited partner interests in USAC (“USAC Class B Units”), with a value of approximately $112 million and (iii) an amount$1.23 billion in cash, equal to $1.225 billion, subject to certain adjustments.including customary closing adjustments (the “CDM Contribution”). The USAC Class B Units that ETP will receive will beare a new class of partnership interests of USAC that will have substantially all of the rights and obligations of a USAC Common Unit,common unit, except the USAC Class B Units will not participate in distributions made prior tofor the one year anniversary offirst four quarters following the closing date of the CDM Contribution Agreement (such date, the “Class B Conversion Date”) with respect toApril 2, 2018. Each USAC Common Units. On the Class B Conversion Date, each Class B Unit will automatically convert into one USAC Common Unit. The transaction is expected to close incommon unit on the first halfbusiness day following the record date attributable to the quarter ending June 30, 2019.
As noted above, ET contributed its interests in USAC to ETO in October 2018. ET’s contribution of its interests in USAC was a transaction between entities under common control; therefore, the Partnership’s consolidated financial statements reflect USAC on a consolidated basis beginning April 2, 2018, subjectthe date that ET obtained control of USAC. The Partnership had previously deconsolidated CDM upon its contribution to customary closing conditions.USAC on April 2, 2018; however, due to the retrospective consolidation of USAC as of that date, CDM is reflected as a consolidated subsidiary for all periods presented herein.
Summary of Assets Acquired and Liabilities Assumed
The USAC Transaction was recorded using the acquisition method of accounting, which requires, among other things, that assets acquired and liabilities assumed be recognized on the balance sheet at their fair values as of the acquisition date.
The total purchase price was allocated as follows:
|
| | | |
| | At April 2, 2018 |
| Total current assets | $ | 786 |
|
| Property, plant and equipment | 1,332 |
|
| Other non-current assets | 15 |
|
Goodwill(1) | 366 |
|
| Intangible assets | 222 |
|
| Total assets | 2,721 |
|
| | |
| Total current liabilities | 110 |
|
| Long-term debt, less current maturities | 1,527 |
|
| Other non-current liabilities | 2 |
|
| Total liabilities | 1,639 |
|
| | |
| Noncontrolling interest | 832 |
|
| | |
| Total consideration | 250 |
|
Cash received(2) | 711 |
|
Total consideration, net of cash received(2) | $ | (461 | ) |
| |
(1) | None of the goodwill is expected to be deductible for tax purposes. Goodwill recognized from the business combination primarily relates to the value attributed to additional growth opportunities, synergies and operating leverage within USAC’s operations. |
| |
(2) | Cash received represents cash and cash equivalents held by USAC as of the acquisition date. |
The fair values of the assets acquired and liabilities assumed were determined using various valuation techniques, including the income and market approaches.
Sunoco LP Retail Store Divestment
On January 23, 2018, Sunoco LP completed the disposition of assets pursuant to the purchase agreement with 7-Eleven, Inc. (the “7-Eleven Transaction”). As a result of the 7-Eleven Transaction, previously eliminated wholesale motor fuel sales to Sunoco LP’s retail locations are reported as wholesale motor fuel sales to third parties. Also, the related accounts receivable from such sales are no longer eliminated from the Partnership’s consolidated balance sheets and are reported as accounts receivable.
In connection with the CDM Contribution Agreement, ETP7-Eleven Transaction, Sunoco LP entered into a purchase agreementDistributor Motor Fuel Agreement dated as of January 23, 2018 (“Supply Agreement”), with ETE, Energy Transfer Partners, L.L.C. (together with ETE,7-Eleven and SEI Fuel (collectively, “Distributor”). The Supply Agreement consists of a 15-year take-or-pay fuel supply arrangement under which Sunoco LP has agreed to supply approximately 2.0 billion gallons of fuel annually plus additional aggregate growth volumes of up to 500 million gallons to be added incrementally over the “GP Purchasers”), USAC Holdingsfirst four years. For the period from January 1, 2018 through January 22, 2018 and solelythe years ended December 31, 2017, Sunoco LP recorded sales to the sites that were subsequently sold to 7-Eleven of $199 million and $3.2 billion, respectively, which were eliminated in consolidation. Sunoco LP received payments on trade receivables of $3.7 billion and $3.4 billion, respectively, from 7-Eleven for certain purposes therein, R/C IV USACP Holdings, L.P., pursuantthe years ended December 31, 2019 and December 31, 2018 subsequent to which, among other things, the GP Purchasers will acquire from USAC Holdings (i) allclosing of the outstanding limited liability company interestssale.
The Partnership has concluded that it meets the accounting requirements for reporting the financial position, results of operations and cash flows of Sunoco LP’s retail divestment as discontinued operations.
There were no results of operations associated with discontinued operations for the year ended December 31, 2019. The results of operations associated with discontinued operations for the years ended December 31, 2018 and 2017 are presented in USA Compression GP, LLC, the general partner of USAC (“USAC GP”), and (ii) 12,466,912 USAC Common Units for cash consideration equal to $250 million.following table:
|
| | | | | | | |
| | Years Ended December 31, |
| | 2018 | | 2017 |
| REVENUES | $ | 349 |
| | $ | 6,964 |
|
| | | | |
| COSTS AND EXPENSES | | | |
| Cost of products sold | 305 |
| | 5,806 |
|
| Operating expenses | 61 |
| | 763 |
|
| Depreciation, depletion and amortization | — |
| | 34 |
|
| Selling, general and administrative | 7 |
| | 168 |
|
| Impairment losses | — |
| | 285 |
|
| Total costs and expenses | 373 |
| | 7,056 |
|
| OPERATING LOSS | (24 | ) | | (92 | ) |
| OTHER EXPENSE | | | |
| Interest expense, net | 2 |
| | 36 |
|
| Loss on extinguishment of debt | 20 |
| | — |
|
| Other, net | 61 |
| | 1 |
|
| LOSS FROM DISCONTINUED OPERATIONS BEFORE INCOME TAX EXPENSE | (107 | ) | | (129 | ) |
| Income tax expense | 158 |
| | 48 |
|
| LOSS FROM DISCONTINUED OPERATIONS, NET OF INCOME TAXES | $ | (265 | ) | | $ | (177 | ) |
2017 Transactions
Rover Contribution Agreement
In October 2017, ETPETO completed the previously announced contribution transaction with a fund managed by Blackstone Energy Partners and Blackstone Capital Partners, pursuant to which ETPETO exchanged a 49.9% interest in the holding company that owns 65% of the Rover pipeline (“Rover Holdco”). As a result, Rover Holdco is now owned 50.1% by ETPETO and 49.9%
by Blackstone. Upon closing, Blackstone contributed funds to reimburse ETPETO for its pro rata share of the Rover construction costs incurred by ETPETO through the closing date, along with the payment of additional amounts subject to certain adjustments.
ETPETO and Sunoco Logistics Merger
As discussed in Note 1, in April 2017, Energy Transfer Partners, L.P. and Sunoco Logistics completed the Sunoco Logistics Merger.
Permian Express Partners
In February 2017, Sunoco Logisticsthe Partnership formed PEP, a strategic joint venture with ExxonMobil. Sunoco LogisticsThe Partnership contributed its Permian Express 1, Permian Express 2, Permian Longview and Louisiana Access pipelines. ExxonMobil contributed its Longview to Louisiana and Pegasus pipelines, Hawkins gathering system, an idle pipeline in southern Oklahoma, and its Patoka, Illinois terminal. Assets contributed to PEP by ExxonMobil were reflected at fair value on the Partnership’s consolidated balance sheet at the date of the contribution, including $547 million of intangible assets and $435 million of property, plant and equipment.
In July 2017, ETPETO contributed an approximate 15% ownership interest in Dakota Access and ETCO to PEP, which resulted in an increase in ETP’sETO’s ownership interest in PEP to approximately 88%. ETPETO maintains a controlling financial and voting interest in PEP and is the operator of all of the assets. As such, PEP is reflected as a consolidated subsidiary of the Partnership. ExxonMobil’s interest in PEP is reflected as noncontrolling interest in the consolidated balance sheets. ExxonMobil’s contribution resulted in an increase of $988 million in noncontrolling interest, which is reflected in “Capital contributions from noncontrolling interest” in the consolidated statement of equity.
Bakken Equity Sale
In February 2017, Bakken Holdings Company LLC, an entity in which ETPETO indirectly owns a 100% membership interest, sold a 49% interest in its wholly-owned subsidiary, Bakken Pipeline Investments LLC, to MarEn Bakken Company LLC, an entity jointly owned by MPLX LP and Enbridge Energy Partners, L.P., for $2.00 billion in cash. Bakken Pipeline Investments LLC indirectly owns a 75% interest in each of Dakota Access and ETCO. The remaining 25% of each of Dakota Access and
ETCO is owned by wholly-owned subsidiaries of Phillips 66. ETPETO continues to consolidate Dakota Access and ETCO subsequent to this transaction.
2016 Transactions
PennTex Acquisition
On November 1, 2016, ETP acquired certain interests in PennTex from various parties for total consideration of approximately $627 million in ETP units and cash. Through this transaction, ETP acquired a controlling financial interest in PennTex, whose assets complement ETP’s existing midstream footprint in northern Louisiana. As discussed in Note 8, the Partnership purchased PennTex’s remaining outstanding common units in June 2017.
Summary of Assets Acquired and Liabilities Assumed
We accounted for the PennTex acquisition using the acquisition method of accounting, which requires, among other things, that assets acquired and liabilities assumed be recognized on the balance sheet at their fair values as of the acquisition date.
The total purchase price was allocated as follows:
|
| | | | |
| | | At November 1, 2016 |
| Total current assets | | $ | 34 |
|
| Property, plant and equipment | | 393 |
|
Goodwill(1) | | 177 |
|
| Intangible assets | | 446 |
|
| | | 1,050 |
|
| | | |
| Total current liabilities | | 6 |
|
| Long-term debt, less current maturities | | 164 |
|
| Other non-current liabilities | | 17 |
|
| Noncontrolling interest | | 236 |
|
| | | 423 |
|
| Total consideration | | 627 |
|
| Cash received | | 21 |
|
| Total consideration, net of cash received | | $ | 606 |
|
| |
(1)
| None of the goodwill is expected to be deductible for tax purposes. |
The fair values of the assets acquired and liabilities assumed were determined using various valuation techniques, including the income and market approaches.
Sunoco Logistics’ Vitol Acquisition
In November 2016, Sunoco Logistics completed an acquisition from Vitol, Inc. (“Vitol”) of an integrated crude oil business in West Texas for $760 million plus working capital. The acquisition provides Sunoco Logistics with an approximately 2 million barrel crude oil terminal in Midland, Texas, a crude oil gathering and mainline pipeline system in the Midland Basin, including a significant acreage dedication from an investment-grade Permian producer, and crude oil inventories related to Vitol’s crude oil purchasing and marketing business in West Texas. The acquisition also included the purchase of a 50% interest in SunVit Pipeline LLC (“SunVit”), which increased Sunoco Logistics’ overall ownership of SunVit to 100%. The $769 million purchase price, net of cash received, consisted primarily of net working capital of $13 million largely attributable to inventory and receivables; property, plant and equipment of $286 million primarily related to pipeline and terminalling assets; intangible assets of $313 million attributable to customer relationships; and goodwill of $251 million.
Bakken Financing
In August 2016, ETP, Sunoco Logistics and Phillips 66 announced the completion of the project-level financing of the Bakken Pipeline. The $2.50 billion credit facility provided substantially all of the remaining capital necessary to complete the projects. As of December 31, 2017, $2.50 billion was outstanding under this credit facility.
Bayou Bridge
In April 2016, Bayou Bridge Pipeline, LLC (“Bayou Bridge”), a joint venture among ETP, Sunoco Logistics and Phillips 66, began commercial operations on the 30-inch segment of the pipeline from Nederland, Texas to Lake Charles, Louisiana. ETP and Sunoco Logistics each hold a 30% interest in the entity and Sunoco Logistics is the operator of the system.
Sunoco Retail to Sunoco LP
In March 2016, ETP contributed to Sunoco LP its remaining 68.42% interest in Sunoco, LLC and 100% interest in the legacy Sunoco, Inc. retail business for $2.23 billion. Sunoco LP paid $2.20 billion in cash, including a working capital adjustment and issued 5.7 million Sunoco LP common units to Retail Holdings, a wholly-owned subsidiary of the Partnership. The transaction was effective January 1, 2016. In connection with this transaction, the Partnership deconsolidated the legacy Sunoco, Inc. retail business, including goodwill of $1.29 billion and intangible assets of $294 million. The results of Sunoco, LLC and the legacy Sunoco, Inc. retail business’ operations have not been presented as discontinued operations and Sunoco, Inc.’s retail business assets and liabilities have not been presented as held for sale in the Partnership’s consolidated financial statements.
Following is a summary of amounts reflected for the prior periods in ETP’s consolidated statements of operations related to Sunoco, LLC and the legacy Sunoco, Inc. retail business, which operations are no longer consolidated:
|
| | | |
| | Year Ended December 31, 2015 |
| Revenues | $ | 12,482 |
|
| Cost of products sold | 11,174 |
|
| Operating expenses | 798 |
|
| Selling, general and administrative expenses | 106 |
|
2015 Transactions
Sunoco LP
In April 2015, Sunoco LP acquired a 31.58% equity interest in Sunoco, LLC from Retail Holdings for $816 million. Sunoco, LLC distributes approximately 5.3 billion gallons per year of motor fuel to customers in the east, midwest and southwest regions of the United States. Sunoco LP paid $775 million in cash and issued a value of $41 million in Sunoco LP common units to Retail Holdings, based on the five-day volume weighted average price of Sunoco LP’s common units as of March 20, 2015.
In July 2015, in exchange for the contribution of 100% of Susser from ETP to Sunoco LP, Sunoco LP paid $970 million in cash and issued to ETP subsidiaries 22 million Sunoco LP Class B units valued at $970 million. The Sunoco Class B units did not receive second quarter 2015 cash distributions from Sunoco LP and converted on a one-for-one basis into Sunoco LP common units on the day immediately following the record date for Sunoco LP’s second quarter 2015 distribution. In addition, (i) a Susser subsidiary exchanged its 79,308 Sunoco LP common units for 79,308 Sunoco LP Class A units, (ii) 10.9 million Sunoco LP subordinated units owned by Susser subsidiaries were converted into 10.9 million Sunoco LP Class A units and (iii) Sunoco LP issued 79,308 Sunoco LP common units and 10.9 million Sunoco LP subordinated units to subsidiaries of ETP. The Sunoco LP Class A units owned by the Susser subsidiaries were contributed to Sunoco LP as part of the transaction. Sunoco LP subsequently contributed its interests in Susser to one of its subsidiaries.
Effective July 1, 2015, ETE acquired 100% of the membership interests of Sunoco GP, the general partner of Sunoco LP, and all of the IDRs of Sunoco LP from ETP, and in exchange, ETP repurchased from ETE 31.5 million ETP common units owned by ETE (the “Sunoco LP Exchange”). In connection with ETP’s 2014 acquisition of Susser, ETE agreed to provide ETP a $35 million annual IDR subsidy for 10 years, which terminated upon the closing of ETE’s acquisition of Sunoco GP. In connection with the exchange and repurchase, ETE provided ETP a $35 million annual IDR subsidy for two years beginning with the quarter ended September 30, 2015. In connection with this transaction, the Partnership deconsolidated Sunoco LP, including goodwill of $1.81 billion and intangible assets of $982 million related to Sunoco LP. At December 31, 2017, the Partnership held 37.8 million Sunoco LP common units accounted for under the equity method. Subsequent to Sunoco LP’s repurchase of a portion of its common units on February 7, 2018, as discussed in Note 4, our investment in Sunoco LP consists of 26.2 million units. The results of Sunoco LP’s operations have not been presented as discontinued operations and Sunoco LP’s assets and liabilities have not been presented as held for sale in the Partnership’s consolidated financial statements.
Bakken Pipeline
In March 2015, ETE transferred 46.2 million Partnership common units, ETE’s 45% interest in the Bakken Pipeline project, and $879 million in cash to the Partnership in exchange for 30.8 million newly issued Class H Units of ETP that, when combined with the 50.2 million previously issued Class H Units, generally entitled ETE to receive 90.05% of the cash distributions and other economic attributes of the general partner interest and IDRs of Sunoco Logistics (the “Bakken Pipeline Transaction”). In connection with this transaction, the Partnership also issued to ETE 100 Class I Units that provided distributions to ETE to offset IDR subsidies previously provided to ETP. These IDR subsidies, including the impact from distributions on Class I Units, were reduced by $55 million in 2015 and $30 million in 2016. The Class H Units were cancelled in connection with the Sunoco Logistics Merger in April 2017.
In October 2015, Sunoco Logistics completed the acquisition of a 40% membership interest (the “Bakken Membership Interest”) in Bakken Holdings Company LLC (“Bakken Holdco”). Bakken Holdco, through its wholly-owned subsidiaries, owns a 75% membership interest in each of Dakota Access and ETCO, which together intend to develop the Bakken Pipeline system to deliver crude oil from the Bakken/Three Forks production area in North Dakota to the Gulf Coast. ETP transferred the Bakken Membership Interest to Sunoco Logistics in exchange for approximately 9.4 million Class B Units representing limited partner interests in Sunoco Logistics and the payment by Sunoco Logistics to ETP of $382 million of cash, which represented reimbursement for its proportionate share of the total cash contributions made in the Bakken Pipeline project as of the date of closing of the exchange transaction.
Regency Merger
On April 30, 2015, a wholly-owned subsidiary of the Partnership merged with Regency, with Regency surviving as a wholly-owned subsidiary of the Partnership (the “Regency Merger”). Each Regency common unit and Class F unit was converted into the right to receive 0.6186 Partnership common units. ETP issued 258.3 million Partnership common units to Regency unitholders, including 23.3 million units issued to Partnership subsidiaries. Regency’s 1.9 million outstanding Series A Convertible Preferred Units were converted into corresponding Legacy ETP Preferred Units on a one-for-one basis.
In connection with the Regency Merger, ETE agreed to reduce the incentive distributions it receives from the Partnership by a total of $320 million over a five-year period. The IDR subsidy was $80 million for the year ended December 31, 2015 and will total $60 million per year for the following four years.
The Regency Merger was a combination of entities under common control; therefore, Regency’s assets and liabilities were not adjusted. The Partnership’s consolidated financial statements have been retrospectively adjusted to reflect consolidation of Regency for all prior periods subsequent to May 26, 2010 (the date ETE acquired Regency’s general partner). Predecessor equity included on the consolidated financial statements represents Regency’s equity prior to the Regency Merger.
ETP has assumed all of the obligations of Regency and Regency Energy Finance Corp., of which ETP was previously a co-obligor or parent guarantor.
| |
| 4. | ADVANCES TO AND INVESTMENTS IN UNCONSOLIDATED AFFILIATES: |
Citrus
ETP ownsWe own CrossCountry Energy, LLC, a wholly-owned subsidiary of ETO, which in turn owns a 50% interest in Citrus. The other 50% interest in Citrus is owned by a subsidiary of KMI. Citrus owns 100% of FGT, an approximately 5,360-mile5,362-mile natural gas pipeline system that originates in Texas and delivers natural gas to the Florida peninsula. Our investment in Citrus is reflected in our interstate transportation and storage segment.
FEP
We have a 50% interest in FEP which owns an approximately 185-mile natural gas pipeline that originates in Conway County, Arkansas, continues eastward through White County, Arkansas and terminates at an interconnect with Trunkline Gas Company in Panola County, Mississippi. Our investment in FEP is reflected in the interstate transportation and storage segment. The Partnership evaluated its investment in FEP for impairment as of December 31, 2017, based on FASB Accounting Standards Codification 323, Investments - Equity Method and Joint Ventures. The Partnership recorded an impairment of its investment in FEP of $141 million during the year ended December 31, 2017 due to a negative outlook for long-term transportation contracts as a result of a decrease in production in the Fayetteville basin and a customer re-contracting with a competitor.
MEP
We own a 50% interest in MEP, which owns approximately 500 miles of natural gas pipeline that extends from Southeast Oklahoma, across Northeast Texas, Northern Louisiana and Central Mississippi to an interconnect with the Transcontinental natural gas pipeline system in Butler, Alabama. Our investment in MEP is reflected in the interstate transportation and storage segment. The Partnership evaluated its investment in MEP for impairment as
HPC
We own a 49.99% interest in HPC, which, through its ownership of RIGS, delivers natural gas from northwest Louisiana to downstream pipelines and markets through a 450-mile intrastate pipeline system. Our investment in HPC is reflected in the intrastate transportation and storage segment. The Partnership evaluated its investment in HPC for impairment as of December 31, 2017, based on FASB Accounting Standards Codification 323, Investments - Equity Method and Joint Ventures. During the year ended December 31, 2017, the Partnership recorded a $172 million impairment of its equity method investment in HPC primarily due to a decrease in projected future revenues and cash flows driven by the bankruptcy of one of HPC’s major customers in 2017 and an expectation that contracts expiring in the next few years will be renewed at lower tariff rates and lower volumes.
Sunoco LP
Effective July 1, 2015, ETE acquired 100% of the membership interests of Sunoco GP, the general partner of Sunoco LP, and all of the IDRs of Sunoco LP from the Partnership. As a result, the Partnership deconsolidated Sunoco LP, and its remaining investment in Sunoco LP is accounted for under the equity method. As of December 31, 2017, the Partnership’s interest in Sunoco LP common units consisted of 43.5 million units, representing 43.6% of Sunoco LP’s total outstanding common units, and is reflected in the all other segment.
In February 2018, after the record date for Sunoco LP’s fourth quarter 2017 cash distributions, Sunoco LP repurchased 17,286,859 Sunoco LP common units owned by ETP for aggregate cash consideration of approximately $540 million. ETP used the proceeds from the sale of the Sunoco LP common units to repay amounts outstanding under its revolving credit facility.
The carrying values of the Partnership’s advances to and investments in unconsolidated affiliates as of December 31, 20172019 and 20162018 were as follows:
|
| | | | | | | |
| | December 31, |
| | 2017 | | 2016 |
| Citrus | $ | 1,754 |
| | $ | 1,729 |
|
| FEP | 121 |
| | 101 |
|
| MEP | 242 |
| | 318 |
|
| HPC | 28 |
| | 382 |
|
| Sunoco LP | 1,095 |
| | 1,225 |
|
| Others | 576 |
| | 525 |
|
| Total | $ | 3,816 |
| | $ | 4,280 |
|
|
| | | | | | | |
| | December 31, |
| | 2019 | | 2018 |
| Citrus | $ | 1,876 |
| | $ | 1,737 |
|
| FEP | 218 |
| | 107 |
|
| MEP | 429 |
| | 225 |
|
| Others | 495 |
| | 567 |
|
| Total | $ | 3,018 |
| | $ | 2,636 |
|
The following table presents equity in earnings (losses) of unconsolidated affiliates:
|
| | | | | | | | | | | |
| | Years Ended December 31, |
| | 2019 | | 2018 | | 2017 |
| Citrus | $ | 148 |
| | $ | 141 |
| | $ | 144 |
|
| FEP | 59 |
| | 55 |
| | 53 |
|
| MEP | 15 |
| | 31 |
| | 38 |
|
| Other | 76 |
| | 117 |
| | (91 | ) |
| Total equity in earnings of unconsolidated affiliates | $ | 298 |
| | $ | 344 |
| | $ | 144 |
|
|
| | | | | | | | | | | |
| | Years Ended December 31, |
| | 2017 | | 2016 | | 2015 |
| Citrus | $ | 144 |
| | $ | 102 |
| | $ | 97 |
|
| FEP | 53 |
| | 51 |
| | 55 |
|
| MEP | 38 |
| | 40 |
| | 45 |
|
HPC(1) | (168 | ) | | 31 |
| | 32 |
|
| Sunoco, LLC | — |
| | — |
| | (10 | ) |
Sunoco LP(2) | 12 |
| | (211 | ) | | 202 |
|
| Other | 77 |
| | 46 |
| | 48 |
|
| Total equity in earnings of unconsolidated affiliates | 156 |
| | 59 |
| | 469 |
|
| |
(1)
| For the year ended December 31, 2017, equity in earnings (losses) of unconsolidated affiliates includes the impact of non-cash impairments recorded by HPC, which reduced the Partnership’s equity in earnings by $185 million. |
| |
(2)
| For the years ended December 31, 2017 and 2016, equity in earnings (losses) of unconsolidated affiliates includes the impact of non-cash impairments recorded by Sunoco LP, which reduced the Partnership’s equity in earnings by $176 million and $277 million, respectively. |
Summarized Financial Information
The following tables present aggregated selected balance sheet and income statement data for our unconsolidated affiliates, Citrus, FEP MEP, HPC and Sunoco LPMEP (on a 100% basis) for all periods presented:presented, except as noted below:
| | | | December 31, | December 31, |
| | 2017 | | 2016 | 2019 | | 2018 |
| Current assets | $ | 4,750 |
| | $ | 1,532 |
| $ | 247 |
| | $ | 212 |
|
| Property, plant and equipment, net | 9,893 |
| | 10,310 |
| 7,680 |
| | 7,800 |
|
| Other assets | 2,286 |
| | 5,980 |
| 40 |
| | 39 |
|
| Total assets | $ | 16,929 |
| | $ | 17,822 |
| $ | 7,967 |
| | $ | 8,051 |
|
| | | | | | | |
| Current liabilities | $ | 2,075 |
| | $ | 1,918 |
| $ | 738 |
| | $ | 1,534 |
|
| Non-current liabilities | 9,375 |
| | 10,343 |
| 3,242 |
| | 3,439 |
|
| Equity | 5,479 |
| | 5,561 |
| 3,987 |
| | 3,078 |
|
| Total liabilities and equity | $ | 16,929 |
| | $ | 17,822 |
| $ | 7,967 |
| | $ | 8,051 |
|
|
| | | | | | | | | | | |
| | Years Ended December 31, |
| | 2019 | | 2018 | | 2017 |
| Revenue | $ | 1,192 |
| | $ | 1,249 |
| | $ | 1,358 |
|
| Operating income | 683 |
| | 723 |
| | 407 |
|
| Net income | 443 |
| | 460 |
| | 145 |
|
|
| | | | | | | | | | | |
| | Years Ended December 31, |
| | 2017 | | 2016 | | 2015 |
| Revenue | $ | 13,081 |
| | $ | 11,150 |
| | $ | 13,815 |
|
| Operating income | 636 |
| | 859 |
| | 1,052 |
|
| Net income (loss) | 294 |
| | (22 | ) | | 664 |
|
In addition to the equity method investments described above we have other equity method investments which are not significant to our consolidated financial statements.
| |
5. | NET INCOME (LOSS) PER LIMITED PARTNER UNIT: |
The following table provides a reconciliation of the numerator and denominator of the basic and diluted income (loss) per unit.
The historical common units and net income (loss) per limited partner unit amounts presented in these consolidated financial statements have been retrospectively adjusted to reflect the 1.5 to one unit-for-unit exchange in connection with the Sunoco Logistics Merger.
|
| | | | | | | | | | | |
| | Years Ended December 31, |
| | 2017 | | 2016 | | 2015 |
| Net income | $ | 2,501 |
| | $ | 583 |
| | $ | 1,489 |
|
| Less: Income attributable to noncontrolling interest | 420 |
| | 295 |
| | 134 |
|
| Less: Loss attributable to predecessor | — |
| | — |
| | (34 | ) |
| Net income, net of noncontrolling interest | 2,081 |
| | 288 |
| | 1,389 |
|
| General Partner’s interest in net income | 990 |
| | 948 |
| | 1,064 |
|
| Preferred Unitholders’ interest in net income | 12 |
| | — |
| | — |
|
| Class H Unitholder’s interest in net income | 93 |
| | 351 |
| | 258 |
|
| Class I Unitholder’s interest in net income | — |
| | 8 |
| | 94 |
|
| Common Unitholders’ interest in net income (loss) | 986 |
| | (1,019 | ) | | (27 | ) |
| Additional earnings allocated from (to) General Partner | 9 |
| | (10 | ) | | (5 | ) |
| Distributions on employee unit awards, net of allocation to General Partner | (27 | ) | | (19 | ) | | (16 | ) |
| Net income (loss) available to Common Unitholders | $ | 968 |
| | $ | (1,048 | ) | | $ | (48 | ) |
| Weighted average Common Units – basic | 1,032.7 |
| | 758.2 |
| | 649.2 |
|
| Basic net income (loss) per Common Unit | $ | 0.94 |
| | $ | (1.38 | ) | | $ | (0.07 | ) |
| | | | | | |
| Income (loss) available to Common Unitholders | $ | 968 |
| | $ | (1,048 | ) | | $ | (48 | ) |
| Loss attributable to Legacy ETP Preferred Units | — |
| | — |
| | (6 | ) |
| Diluted income (loss) available to Common Unitholders | $ | 968 |
| | $ | (1,048 | ) | | $ | (54 | ) |
| Weighted average Common Units – basic | 1,032.7 |
| | 758.2 |
| | 649.2 |
|
| Dilutive effect of unvested Unit Awards | 5.1 |
| | — |
| | — |
|
| Dilutive effect of Legacy ETP Preferred Units | — |
| | — |
| | 1.0 |
|
| Weighted average Common Units – diluted | 1,037.8 |
| | 758.2 |
| | 650.2 |
|
| Diluted income (loss) per Common Unit | $ | 0.93 |
| | $ | (1.38 | ) | | $ | (0.08 | ) |
Our debt obligations consist of the following:
|
| | | | | | | |
| | December 31, |
| | 2017 | | 2016 |
| ETP Debt | | | |
| 6.125% Senior Notes due February 15, 2017 | $ | — |
| | $ | 400 |
|
2.50% Senior Notes due June 15, 2018 (1) | 650 |
| | 650 |
|
6.70% Senior Notes due July 1, 2018 (1) | 600 |
| | 600 |
|
| 9.70% Senior Notes due March 15, 2019 | 400 |
| | 400 |
|
| 9.00% Senior Notes due April 15, 2019 | 450 |
| | 450 |
|
| 5.50% Senior Notes due February 15, 2020 | 250 |
| | 250 |
|
| 5.75% Senior Notes due September 1, 2020 | 400 |
| | 400 |
|
| 4.15% Senior Notes due October 1, 2020 | 1,050 |
| | 1,050 |
|
|
| | | | | | | |
| | December 31, |
| | 2019 | | 2018 |
| ETO Debt | | | |
| 9.70% Senior Notes due March 15, 2019 | $ | — |
| | $ | 400 |
|
| 9.00% Senior Notes due April 15, 2019 | — |
| | 450 |
|
5.50% Senior Notes due February 15, 2020 (1) | 250 |
| | 250 |
|
5.75% Senior Notes due September 1, 2020 (1) | 400 |
| | 400 |
|
4.15% Senior Notes due October 1, 2020 (1) | 1,050 |
| | 1,050 |
|
7.50% Senior Notes due October 15, 2020 (1) | 1,135 |
| | — |
|
| 4.40% Senior Notes due April 1, 2021 | 600 |
| | 600 |
|
| 4.65% Senior Notes due June 1, 2021 | 800 |
| | 800 |
|
| 5.20% Senior Notes due February 1, 2022 | 1,000 |
| | 1,000 |
|
| 4.65% Senior Notes due February 15, 2022 | 300 |
| | 300 |
|
| 5.875% Senior Notes due March 1, 2022 | 900 |
| | 900 |
|
| 5.00% Senior Notes due October 1, 2022 | 700 |
| | 700 |
|
| 3.45% Senior Notes due January 15, 2023 | 350 |
| | 350 |
|
| 3.60% Senior Notes due February 1, 2023 | 800 |
| | 800 |
|
| 4.25% Senior Notes due March 15, 2023 | 995 |
| | — |
|
| 4.20% Senior Notes due September 15, 2023 | 500 |
| | 500 |
|
| 4.50% Senior Notes due November 1, 2023 | 600 |
| | 600 |
|
| 5.875% Senior Notes due January 15, 2024 | 1,127 |
| | — |
|
| 4.90% Senior Notes due February 1, 2024 | 350 |
| | 350 |
|
| 7.60% Senior Notes due February 1, 2024 | 277 |
| | 277 |
|
| 4.25% Senior Notes due April 1, 2024 | 500 |
| | 500 |
|
| 4.50% Senior Notes due April 15, 2024 | 750 |
| | — |
|
| 9.00% Debentures due November 1, 2024 | 65 |
| | 65 |
|
| 4.05% Senior Notes due March 15, 2025 | 1,000 |
| | 1,000 |
|
| 5.95% Senior Notes due December 1, 2025 | 400 |
| | 400 |
|
| 4.75% Senior Notes due January 15, 2026 | 1,000 |
| | 1,000 |
|
| 3.90% Senior Notes due July 15, 2026 | 550 |
| | 550 |
|
| 4.20% Senior Notes due April 15, 2027 | 600 |
| | 600 |
|
| 5.50% Senior Notes due June 1, 2027 | 956 |
| | — |
|
| 4.00% Senior Notes due October 1, 2027 | 750 |
| | 750 |
|
| 4.95% Senior Notes due June 15, 2028 | 1,000 |
| | 1,000 |
|
| 5.25% Senior Notes due April 15, 2029 | 1,500 |
| | — |
|
| 8.25% Senior Notes due November 15, 2029 | 267 |
| | 267 |
|
| 4.90% Senior Notes due March 15, 2035 | 500 |
| | 500 |
|
| 6.625% Senior Notes due October 15, 2036 | 400 |
| | 400 |
|
| 5.80% Senior Notes due June 15, 2038 | 500 |
| | 500 |
|
| 7.50% Senior Notes due July 1, 2038 | 550 |
| | 550 |
|
| 6.85% Senior Notes due February 15, 2040 | 250 |
| | 250 |
|
| 6.05% Senior Notes due June 1, 2041 | 700 |
| | 700 |
|
| 6.50% Senior Notes due February 1, 2042 | 1,000 |
| | 1,000 |
|
| 6.10% Senior Notes due February 15, 2042 | 300 |
| | 300 |
|
| 4.95% Senior Notes due January 15, 2043 | 350 |
| | 350 |
|
| 5.15% Senior Notes due February 1, 2043 | 450 |
| | 450 |
|
| 5.95% Senior Notes due October 1, 2043 | 450 |
| | 450 |
|
| 5.30% Senior Notes due April 1, 2044 | 700 |
| | 700 |
|
| 5.15% Senior Notes due March 15, 2045 | 1,000 |
| | 1,000 |
|
| 5.35% Senior Notes due May 15, 2045 | 800 |
| | 800 |
|
| 6.125% Senior Notes due December 15, 2045 | 1,000 |
| | 1,000 |
|
| 5.30% Senior Notes due April 15, 2047 | 900 |
| | 900 |
|
| 5.40% Senior Notes due October 1, 2047 | 1,500 |
| | 1,500 |
|
| 6.00% Senior Notes due June 15, 2048 | 1,000 |
| | 1,000 |
|
| 6.25% Senior Notes due April 15, 2049 | 1,750 |
| | — |
|
| Floating Rate Junior Subordinated Notes due November 1, 2066 | 546 |
| | 546 |
|
| ETO $2.00 billion Term Loan facility due October 2022 | 2,000 |
| | — |
|
| ETO $5.00 billion Revolving Credit Facility due December 2023 | 4,214 |
| | 3,694 |
|
|
| | | | | | | |
| 4.40% Senior Notes due April 1, 2021 | 600 |
| | 600 |
|
| 6.50% Senior Notes due July 15, 2021 | — |
| | 500 |
|
| 4.65% Senior Notes due June 1, 2021 | 800 |
| | 800 |
|
| 5.20% Senior Notes due February 1, 2022 | 1,000 |
| | 1,000 |
|
| 4.65% Senior Notes due February 15, 2022 | 300 |
| | 300 |
|
| 5.875% Senior Notes due March 1, 2022 | 900 |
| | 900 |
|
| 5.00% Senior Notes due October 1, 2022 | 700 |
| | 700 |
|
| 3.45% Senior Notes due January 15, 2023 | 350 |
| | 350 |
|
| 3.60% Senior Notes due February 1, 2023 | 800 |
| | 800 |
|
| 5.50% Senior Notes due April 15, 2023 | — |
| | 700 |
|
| 4.50% Senior Notes due November 1, 2023 | 600 |
| | 600 |
|
| 4.90% Senior Notes due February 1, 2024 | 350 |
| | 350 |
|
| 7.60% Senior Notes due February 1, 2024 | 277 |
| | 277 |
|
| 4.25% Senior Notes due April 1, 2024 | 500 |
| | 500 |
|
| 9.00% Debentures due November 1, 2024 | 65 |
| | 65 |
|
| 4.05% Senior Notes due March 15, 2025 | 1,000 |
| | 1,000 |
|
| 5.95% Senior Notes due December 1, 2025 | 400 |
| | 400 |
|
| 4.75% Senior Notes due January 15, 2026 | 1,000 |
| | 1,000 |
|
| 3.90% Senior Notes due July 15, 2026 | 550 |
| | 550 |
|
| 4.20% Senior Notes due April 15, 2027 | 600 |
| | — |
|
| 4.00% Senior Notes due October 1, 2027 | 750 |
| | — |
|
| 8.25% Senior Notes due November 15, 2029 | 267 |
| | 267 |
|
| 4.90% Senior Notes due March 15, 2035 | 500 |
| | 500 |
|
| 6.625% Senior Notes due October 15, 2036 | 400 |
| | 400 |
|
| 7.50% Senior Notes due July 1, 2038 | 550 |
| | 550 |
|
| 6.85% Senior Notes due February 15, 2040 | 250 |
| | 250 |
|
| 6.05% Senior Notes due June 1, 2041 | 700 |
| | 700 |
|
| 6.50% Senior Notes due February 1, 2042 | 1,000 |
| | 1,000 |
|
| 6.10% Senior Notes due February 15, 2042 | 300 |
| | 300 |
|
| 4.95% Senior Notes due January 15, 2043 | 350 |
| | 350 |
|
| 5.15% Senior Notes due February 1, 2043 | 450 |
| | 450 |
|
| 5.95% Senior Notes due October 1, 2043 | 450 |
| | 450 |
|
| 5.30% Senior Notes due April 1, 2044 | 700 |
| | 700 |
|
| 5.15% Senior Notes due March 15, 2045 | 1,000 |
| | 1,000 |
|
| 5.35% Senior Notes due May 15, 2045 | 800 |
| | 800 |
|
| 6.125% Senior Notes due December 15, 2045 | 1,000 |
| | 1,000 |
|
| 5.30% Senior Notes due April 15, 2047 | 900 |
| | — |
|
| 5.40% Senior Notes due October 1, 2047 | 1,500 |
| | — |
|
| Floating Rate Junior Subordinated Notes due November 1, 2066 | 546 |
| | 546 |
|
| ETP $4.0 billion Revolving Credit Facility due December 2022 | 2,292 |
| | — |
|
ETP $1.0 billion 364-Day Credit Facility due November 2018 (2) | 50 |
| | — |
|
| ETLP $3.75 billion Revolving Credit Facility due November 2019 | — |
| | 2,777 |
|
| Legacy Sunoco Logistics $2.50 billion Revolving Credit Facility due March 2020 | — |
| | 1,292 |
|
| Legacy Sunoco Logistics $1.0 billion 364-Day Credit Facility due December 2017 | — |
| | 630 |
|
| Unamortized premiums, discounts and fair value adjustments, net | 33 |
| | 66 |
|
| Deferred debt issuance costs | (170 | ) | | (166 | ) |
| | 29,210 |
| | 29,454 |
|
| Transwestern Debt | | | |
| 5.64% Senior Notes due May 24, 2017 | — |
| | 82 |
|
| 5.36% Senior Notes due December 9, 2020 | 175 |
| | 175 |
|
| 5.89% Senior Notes due May 24, 2022 | 150 |
| | 150 |
|
| 5.66% Senior Notes due December 9, 2024 | 175 |
| | 175 |
|
| 6.16% Senior Notes due May 24, 2037 | 75 |
| | 75 |
|
| Deferred debt issuance costs | (1 | ) | | (1 | ) |
| | 574 |
| | 656 |
|
| Panhandle Debt | | | |
| 6.20% Senior Notes due November 1, 2017 | — |
| | 300 |
|
| 7.00% Senior Notes due June 15, 2018 | 400 |
| | 400 |
|
|
| | | | | | | |
| Unamortized premiums, discounts and fair value adjustments, net | (5 | ) | | 17 |
|
| Deferred debt issuance costs | (207 | ) | | (178 | ) |
| | 42,120 |
| | 32,288 |
|
| Transwestern Debt | | | |
| 5.36% Senior Notes due December 9, 2020 (1) | 175 |
| | 175 |
|
| 5.89% Senior Notes due May 24, 2022 | 150 |
| | 150 |
|
| 5.66% Senior Notes due December 9, 2024 | 175 |
| | 175 |
|
| 6.16% Senior Notes due May 24, 2037 | 75 |
| | 75 |
|
| Deferred debt issuance costs | (1 | ) | | (1 | ) |
| | 574 |
| | 574 |
|
| Panhandle Debt | | | |
| 8.125% Senior Notes due June 1, 2019 | — |
| | 150 |
|
| 7.60% Senior Notes due February 1, 2024 | 82 |
| | 82 |
|
| 7.00% Senior Notes due July 15, 2029 | 66 |
| | 66 |
|
| 8.25% Senior Notes due November 15, 2029 | 33 |
| | 33 |
|
| Floating Rate Junior Subordinated Notes due November 1, 2066 | 54 |
| | 54 |
|
| Unamortized premiums, discounts and fair value adjustments, net | 11 |
| | 14 |
|
| | 246 |
| | 399 |
|
| Bakken Project Debt | | | |
| 3.625% Senior Notes due April 1, 2022 | 650 |
| | — |
|
| 3.90% Senior Notes due April 1, 2024 | 1,000 |
| | — |
|
| 4.625% Senior Notes due April 1, 2029 | 850 |
| | — |
|
| Bakken $2.50 billion Credit Facility due August 2019 | — |
| | 2,500 |
|
| Unamortized premiums, discounts and fair value adjustments, net | (3 | ) | | — |
|
| Deferred debt issuance costs | (16 | ) | | (3 | ) |
| | 2,481 |
| | 2,497 |
|
| Sunoco LP Debt | | | |
| 4.875% Senior Notes Due January 15, 2023 | 1,000 |
| | 1,000 |
|
| 5.50% Senior Notes Due February 15, 2026 | 800 |
| | 800 |
|
| 6.00% Senior Notes Due April 15, 2027 | 600 |
| | — |
|
| 5.875% Senior Notes Due March 15, 2028 | 400 |
| | 400 |
|
| Sunoco LP $1.50 billion Revolving Credit Facility due July 2023 | 162 |
| | 700 |
|
| Lease-related obligations | 135 |
| | 107 |
|
| Deferred debt issuance costs | (26 | ) | | (23 | ) |
| | 3,071 |
| | 2,984 |
|
| USAC Debt | | | |
| 6.875% Senior Notes due April 1, 2026 | 725 |
| | 725 |
|
| 6.875% Senior Notes due September 1, 2027 | 750 |
| | — |
|
| USAC $1.60 billion Revolving Credit Facility due April 2023 | 403 |
| | 1,050 |
|
| Deferred debt issuance costs | (26 | ) | | (16 | ) |
| | 1,852 |
| | 1,759 |
|
| | | | |
| Other | 2 |
| | 7 |
|
| Total debt | 50,346 |
| | 40,508 |
|
| Less: Current maturities of long-term debt | 12 |
| | 2,655 |
|
| Long-term debt, less current maturities | $ | 50,334 |
| | $ | 37,853 |
|
|
| | | | | | | |
| 8.125% Senior Notes due June 1, 2019 | 150 |
| | 150 |
|
| 7.60% Senior Notes due February 1, 2024 | 82 |
| | 82 |
|
| 7.00% Senior Notes due July 15, 2029 | 66 |
| | 66 |
|
| 8.25% Senior Notes due November 15, 2029 | 33 |
| | 33 |
|
| Floating Rate Junior Subordinated Notes due November 1, 2066 | 54 |
| | 54 |
|
| Unamortized premiums, discounts and fair value adjustments, net | 28 |
| | 50 |
|
| | 813 |
| | 1,135 |
|
| Sunoco, Inc. Debt | | | |
| 5.75% Senior Notes due January 15, 2017 | — |
| | 400 |
|
| | | | |
| Bakken Project Debt | | | |
| Bakken Project $2.50 billion Credit Facility due August 2019 | 2,500 |
| | 1,100 |
|
| Deferred debt issuance costs | (8 | ) | | (13 | ) |
| | 2,492 |
| | 1,087 |
|
| PennTex Debt | | | |
| PennTex $275 million Revolving Credit Facility due December 2019 | — |
| | 168 |
|
| | | | |
| Other | 5 |
| | 30 |
|
| Total debt | 33,094 |
| | 32,930 |
|
| Less: Current maturities of long-term debt | 407 |
| | 1,189 |
|
| Long-term debt, less current maturities | $ | 32,687 |
| | $ | 31,741 |
|
| |
(1) | As of December 31, 20172019, these notes were classified as long-term as management had the intent and ability to refinance the $650 million 2.50% senior notes due June 15, 2018 and the $600 million 6.70% senior notes due July 1, 2018, and therefore neither was classified as current. |
| |
(2)
| Borrowings under 364-day credit facilities were classified as long-term debt based on the Partnership’s ability and intent to refinance such borrowings on a long-term basis. The notes were redeemed in January 2020. |
The following table reflects future maturities of long-term debt for each of the next five years and thereafter. These amounts exclude $118$273 million in unamortized net premiums, fair value adjustments and deferred debt issuance costs:
|
| | | | |
| 2020 | | $ | 3,021 |
|
| 2021 | | 1,412 |
|
| 2022 | | 5,792 |
|
| 2023 | | 8,960 |
|
| 2024 | | 4,337 |
|
| Thereafter | | 27,097 |
|
| Total | | $ | 50,619 |
|
|
| | | | |
| 2018 | | $ | 1,700 |
|
| 2019 | | 3,500 |
|
| 2020 | | 1,875 |
|
| 2021 | | 1,400 |
|
| 2022 | | 5,346 |
|
| Thereafter | | 19,391 |
|
| Total | | $ | 33,212 |
|
Long-term debt reflected on our consolidated balance sheets includes fair value adjustments related to interest rate swaps, which represent fair value adjustments that had been recorded in connection with fair value hedge accounting prior to the termination of the interest rate swap.
ETPETO Senior Notes
The ETPETO senior notes were registered under the Securities Act of 1933 (as amended). The Partnership may redeem some or all of the ETPETO senior notes at any time, or from time to time, pursuant to the terms of the indenture and related indenture supplements related to the ETPETO senior notes. The balance is payable upon maturity. Interest on the ETPETO senior notes is paid semi-annually.
The ETPETO senior notes are unsecured obligations of the Partnership and as a result, the ETPETO senior notes effectively rank junior to any future indebtedness of ours or our subsidiaries that is both secured and unsubordinated to the extent of the value of the assets securing such indebtedness, and the ETPETO senior notes effectively rank junior to all indebtedness and other liabilities of our existing and future subsidiaries.
ETO January 2020 Senior Notes Offering and Redemption
On January 22, 2020, ETO completed a registered offering (the “January 2020 Senior Notes Offering”) of $1.00 billion aggregate principal amount of the Partnership’s 2.900% Senior Notes due 2025, $1.50 billion aggregate principal amount of the Partnership’s 3.750% Senior Notes due 2030 and $2.00 billion aggregate principal amount of the Partnership’s 5.000% Senior Notes due 2050, (collectively, the “Notes”). The Notes are fully and unconditionally guaranteed by the Partnership’s wholly owned subsidiary, Sunoco Logistics Partners Operations L.P., on a senior unsecured basis.
Utilizing proceeds from the January 2020 Senior Notes Offering, ETO redeemed its $400 million aggregate principal amount of 5.75% Senior Notes due September 1, 2020, its $1.05 billion aggregate principal amount of 4.15% Senior Notes due October 1, 2020, its $1.14 billion aggregate principal amount of 7.50% Senior Notes due October 15, 2020, its $250 million aggregate principal amount of 5.50% Senior Notes due February 15, 2020, ET’s $52 million aggregate principal amount of 7.50% Senior Notes due October 15, 2020 and Transwestern’s $175 million aggregate principal amount of 5.36% Senior Notes due December 9, 2020.
ET-ETO Senior Notes Exchange
In February 2019, ETO commenced offers to exchange all of ET’s outstanding senior notes for senior notes issued by ETO (the “ET-ETO senior notes exchange”). Approximately 97% of ET’s outstanding senior notes were tendered and accepted, and substantially all the exchanges settled on March 25, 2019. In connection with the exchange, ETO issued approximately $4.21 billion aggregate principal amount of the following senior notes:
•$1.14 billion aggregate principal amount of 7.50% senior notes due 2020;
•$995 million aggregate principal amount of 4.25% senior notes due 2023;
•$1.13 billion aggregate principal amount of 5.875% senior notes due 2024; and
•$956 million aggregate principal amount of 5.50% senior notes due 2027.
2019 Senior Notes Offering and Redemption
In January 2019, ETO issued the following senior notes:
•$750 million aggregate principal amount of 4.50% senior notes due 2024;
•$1.50 billion aggregate principal amount of 5.25% senior notes due 2029; and
•$1.75 billion aggregate principal amount of 6.25% senior notes due 2049.
The $3.96 billion net proceeds from the offering were used to make an intercompany loan to ET (which ET used to repay its term loan in full), for general partnership purposes and to redeem at maturity all of the following:
•ETO’s $400 million aggregate principal amount of 9.70% senior notes due March 15, 2019;
•ETO’s $450 million aggregate principal amount of 9.00% senior notes due April 15, 2019; and
•Panhandle’s $150 million aggregate principal amount of 8.125% senior notes due June 1, 2019.
Panhandle Senior Notes Redemption
In June 2019, Panhandle’s $150 million aggregate principal amount of 8.125% senior notes matured and were repaid with borrowings under an affiliate loan agreement with ETO.
Bakken Senior Notes Offering
In March 2019, Midwest Connector Capital Company LLC, a wholly-owned subsidiary of Dakota Access, issued the following senior notes related to the Bakken pipeline:
•$650 million aggregate principal amount of 3.625% senior notes due 2022;
•$1.00 billion aggregate principal amount of 3.90% senior notes due 2024; and
•$850 million aggregate principal amount of 4.625% senior notes due 2029.
The $2.48 billion in net proceeds from the offering were used to repay in full all amounts outstanding on the Bakken credit facility and the facility was terminated.
Sunoco LP Senior Notes Offering
In March 2019, Sunoco LP issued $600 million aggregate principal amount of 6.00% senior notes due 2027 in a private placement to eligible purchasers. The net proceeds from this offering were used to repay a portion of Sunoco LP’s existing borrowings under its credit facility. In July 2019, Sunoco LP completed an exchange of these notes for registered notes with substantially identical terms.
USAC Senior Notes Offering
In March 2019, USAC issued $750 million aggregate principal amount of 6.875% senior notes due 2027 in a private placement, and in December 2019, USAC exchanged those notes for substantially identical senior notes registered under the Securities Act. The net proceeds from this offering were used to repay a portion of USAC’s existing borrowings under its credit facility and for general partnership purposes.
Transwestern Senior Notes
The Transwestern senior notes are redeemable at any time in whole or pro rata, subject to a premium or upon a change of control event or an event of default, as defined. The balance is payable upon maturity. Interest is paid semi-annually.
Credit Facilities, Term Loan and Commercial Paper
ETO Term Loan
F - 36On October 17, 2019, ETO entered into a term loan credit agreement (the “ETO Term Loan”) providing for a $2.00 billion three-year term loan credit facility. Borrowings under the term loan agreement mature on October 17, 2022 and are available for working capital purposes and for general partnership purposes. The term loan agreement is unsecured and is guaranteed by our subsidiary, Sunoco Logistics Partners Operations L.P.
Panhandle Junior Subordinated Notes
December 31, 2019, the ETO Term Loan had $2.00 billion outstanding and was fully drawn. The weighted average interest rate on the remaining portiontotal amount outstanding as of Panhandle’s junior subordinated notes due 2066 is a variable rate based upon the three-month LIBOR rate plus 3.0175%. The balance of the variable rate portion of the junior subordinated notes was $54 million at an effective interest rate of 4.39% at December 31, 2017.2019 was 2.78%.
ETO Five-Year Credit Facilities and Commercial PaperFacility
ETP Credit Facilities
On December 1, 2017 the Partnership entered into a five-year, $4.0 billion unsecuredETO’s revolving credit facility which(the “ETO Five-Year Credit Facility”) allows for unsecured borrowings up to $5.00 billion and matures on December 1, 2022 (the “ETP2023. The ETO Five-Year Facility”) and a $1.0 billion 364-day revolving credit facility that matures on November 30, 2018 (the “ETP 364-Day Facility”) (collectively, the “ETP Credit Facilities”). The ETP Five-Year Facility contains an accordion feature, under which the total aggregate commitmentscommitment may be increased up to $6.0$6.00 billion under certain conditions. We use the ETP Credit Facilities to provide temporary financing for our growth projects, as well as for general partnership purposes.
As of December 31, 2017,2019, the ETPETO Five-Year Credit Facility had $2.29$4.21 billion outstanding, of which $2.01$1.64 billion was commercial paper. The amount available for future borrowings was $1.56 billion$709 million after taking into account letters of credit of $150$77 million. The weighted average interest rate on the total amount outstanding as of December 31, 20172019 was 2.48%2.88%.
ETO 364-Day Facility
ETO’s 364-day revolving credit facility (the “ETO 364-Day Facility”) allows for unsecured borrowings up to $1.00 billion and matures on November 27, 2020. As of December 31, 2017,2019, the ETPETO 364-Day Facility had $500 outstanding borrowings.
Sunoco LP Credit Facility
Sunoco LP maintains a $1.50 billion revolving credit facility (the “Sunoco LP Credit Facility”). As of December 31, 2019, the Sunoco LP Credit Facility had $162 million outstanding borrowings and the$8 million in standby letters of credit. The amount available for future borrowings was $950 million.$1.33 billion at December 31, 2019. The weighted average interest rate on the total amount outstanding as of December 31, 20172019 was 5.00%3.75%.
ETLPUSAC Credit Facility
The ETLP Credit Facility allowed for borrowings of up to $3.75USAC maintains a $1.60 billion and was used to provide temporary financing for our growth projects, as well as for general partnership purposes. This facility was repaid and terminated concurrent with the establishment of the ETP Credit Facilities on December 1, 2017.
Sunoco Logistics Credit Facilities
ETP maintained a $2.50 billion unsecured revolving credit agreementfacility (the “Sunoco Logistics Credit Facility”). This facility was repaid and terminated concurrent with the establishment of the ETP Credit Facilities on December 1, 2017.
In December 2016, Sunoco Logistics entered into an agreement for a 364-day maturity credit facility (“364-Day“USAC Credit Facility”), duewhich matures on April 2, 2023 and permits up to mature on the earlier$400 million of the occurrence of the Sunoco Logistics Merger orfuture increases in December 2017, with a total lending capacity of $1.00 billion. In connection with the Sunoco Logistics Merger, the 364-Day Credit Facility was terminated and repaid in May 2017.
Bakken Credit Facility
In August 2016, Energy Transfer Partners, L.P., Sunoco Logistics and Phillips 66 completed project-level financing of the Bakken Pipeline. The $2.50 billion credit facility is anticipated to provide substantially all of the remaining capital necessary to complete the projects and matures in August 2019 (the “Bakken Credit Facility”).borrowing capacity. As of December 31, 2017,2019, USAC had $403 million of outstanding borrowings and 0 outstanding letters of credit under the Bakken Credit Facilitycredit agreement. As of December 31, 2019, USAC had $2.50$1.2 billion of outstanding borrowings.availability under its credit facility. The weighted average interest rate on the total amount outstanding as of December 31, 20172019 was 3.00%4.31%.
PennTex Revolving Credit Facility
PennTex previously maintained a $275 million revolving credit commitment (the “PennTex Revolving Credit Facility”). In August 2017, the PennTex Revolving Credit Facility was repaid and terminated.
Covenants Related to Our Credit Agreements
Covenants Related to ETPETO
The agreements relating to the ETPETO senior notes contain restrictive covenants customary for an issuer with an investment-grade rating from the rating agencies, which covenants include limitations on liens and a restriction on sale-leaseback transactions.
The ETPETO Credit Facilities containscontain covenants that limit (subject to certain exceptions) the Partnership’s and certain of the Partnership’s subsidiaries’ ability to, among other things:
make certain investments;
make Distributions (as defined in the ETP Credit Facilities) during certain Defaults (as defined in the ETP Credit Facilities) and during any Event of Default (as defined in the ETP Credit Facilities);
engage in business substantially different in nature than the business currently conducted by the Partnership and its subsidiaries;
engage in transactions with affiliates; and
enter into restrictive agreements.
| |
| • | make certain investments; |
| |
| • | make Distributions (as defined in the ETO Credit Facilities) during certain Defaults (as defined in the ETO Credit Facilities) and during any Event of Default (as defined in the ETO Credit Facilities); |
| |
| • | engage in business substantially different in nature than the business currently conducted by the Partnership and its subsidiaries; |
| |
| • | engage in transactions with affiliates; and |
| |
| • | enter into restrictive agreements. |
The ETPETO Credit Facilities applicable margin and rate used in connection with the interest rates and commitment fees, respectively, are based on the credit ratings assigned to our senior, unsecured, non-credit enhanced long-term debt. The applicable margin for eurodollar rate loans under the ETPETO Five-Year Facility ranges from 1.125% to 2.000% and the applicable margin for base rate loans ranges from 0.125% to 1.000%. The applicable rate for commitment fees under the ETPETO Five-Year Facility ranges from 0.125% to 0.300%. The applicable margin for eurodollar rate loans under the ETPETO 364-Day Facility
ranges from 1.125%1.250% to 1.750% and the applicable margin for base rate loans ranges from 0.250% to 0.750%. The applicable rate for commitment fees under the ETPETO 364-Day Facility ranges from 0.125% to 0.225%.
The ETPETO Credit Facilities contain various covenants including limitations on the creation of indebtedness and liens, and related to the operation and conduct of our business. The ETPETO Credit Facilities also limit us, on a rolling four quarter basis, to a maximum Consolidated Funded Indebtedness to Consolidated EBITDA ratio, as defined in the underlying credit agreements, of 5.0 to 1, which can generally be increased to 5.5 to 1 during a Specified Acquisition Period. Our Leverage Ratio was 3.964.04 to 1 at December 31, 2017,2019, as calculated in accordance with the credit agreements.
The agreements relating to the Transwestern senior notes contain certain restrictions that, among other things, limit the incurrence of additional debt, the sale of assets and the payment of dividends and specify a maximum debt to capitalization ratio.
Failure to comply with the various restrictive and affirmative covenants of our revolving credit facilities could require us to pay debt balances prior to scheduled maturity and could negatively impact the Operating Companies’Partnership’s or our subsidiaries’ ability to incur additional debt and/or our ability to pay distributions.distributions to Unitholders.
Covenants Related to Panhandle
Panhandle is not party to any lending agreement that would accelerate the maturity date of any obligation due to a failure to maintain any specific credit rating, nor would a reduction in any credit rating, by itself, cause an event of default under any of Panhandle’s lending agreements. Financial covenants exist in certain of Panhandle’s debt agreements that require Panhandle to maintain a certain level of net worth, to meet certain debt to total capitalization ratios and to meet certain ratios of earnings before depreciation, interest and taxes to cash interest expense. A failure by Panhandle to satisfy any such covenant would give rise to an event of default under the associated debt, which could become immediately due and payable if Panhandle did not cure such default within any permitted cure period or if Panhandle did not obtain amendments, consents or waivers from its lenders with respect to such covenants.
Panhandle’s restrictive covenants include restrictions on debt levels, restrictions on liens securing debt and guarantees and restrictions on mergers and on the sales of assets, capitalization requirements, dividend restrictions, cross default and cross-acceleration and prepayment of debt provisions.assets. A breach of any of these covenants could result in acceleration of Panhandle’s debt and other financial obligations and that of its subsidiaries.debt.
In addition, Panhandle and/or its subsidiaries are subject to certain additional restrictions and covenants. These restrictions and covenants include limitations on additional debt at some of its subsidiaries; limitations on the use of proceeds from borrowing at some of its subsidiaries; limitations, in some cases, on transactions with its affiliates; limitations on the incurrence of liens; potential limitations on the abilities of some of its subsidiaries to declare and pay dividends and potential limitations
on some of its subsidiaries to participate in Panhandle’s cash management program; and limitations on Panhandle’s ability to prepay debt.
Covenants Related to Bakken Credit FacilitySunoco LP
The BakkenSunoco LP Credit Facility contains standardvarious customary representations, warranties, covenants and customary covenantsevents of default, including a change of control event of default, as defined therein. Sunoco LP’s Credit Facility requires Sunoco LP to maintain a Net Leverage Ratio of not more than 5.5 to 1. The maximum Net Leverage Ratio is subject to upwards adjustment of not more than 6.0 to 1 for a financing of this type, subjectperiod not to materiality, knowledge and other qualifications, thresholds, reasonableness and other exceptions. These standard and customary covenants include, but are not limited to:
prohibition of certain incremental secured indebtedness;
prohibition of certain liens / negative pledge;
limitations on uses of loan proceeds;
limitations on asset sales and purchases;
limitations on permitted business activities;
limitations on mergers and acquisitions;
limitations on investments;
limitations on transactions with affiliates; and
maintenance of commercially reasonable insurance coverage.
A restricted payment covenant is also includedexceed three fiscal quarters in the Bakken Credit Facility which requires a minimum historic debt service coverage ratio (“DSCR”)event Sunoco LP engages in certain specified acquisitions of not less than 1.20$50 million (as permitted under Sunoco LP’s Credit Facility agreement). The Sunoco LP Credit Facility also requires Sunoco LP to 1 (the “Minimum Historic DSCR”) with respect each 12-month periodmaintain an Interest Coverage Ratio (as defined in the Sunoco LP’s Credit Facility agreement) of not less than 2.25 to 1.
Covenants Related to USAC
The USAC Credit Facility contains covenants that limit (subject to certain exceptions) USAC’s ability to, among other things:
| |
| • | make certain loans or investments; |
| |
| • | incur additional indebtedness or guarantee other indebtedness; |
| |
| • | make certain acquisitions. |
The credit facility is also subject to the following the commercial in-service date of the Dakota Access and ETCO Project in orderfinancial covenants, including covenants requiring us to make certain restricted payments thereunder.maintain:
| |
| • | a minimum EBITDA to interest coverage ratio of 2.5 to 1.0, determined as of the last day of each fiscal quarter; and |
| |
| • | a maximum funded debt to EBITDA ratio, determined as of the last day of each fiscal quarter, for the annualized trailing three months of (i) 5.5 to 1 through the end of the fiscal quarter ending December 31, 2019 and (ii) 5.0 to 1.0 thereafter, in each case subject to a provision for increases to such thresholds by 0.50 in connection with certain future acquisitions for the six consecutive month period following the period in which any such acquisition occurs. |
Compliance with our Covenants
We and our subsidiaries were in compliance with all requirements, tests, limitations, and covenants related to our debt agreements as of December 31, 2017.2019.
| |
| 6. | REDEEMABLE NONCONTROLLING INTERESTS |
Certain redeemable noncontrolling interests in the Partnership’s subsidiaries are reflected as mezzanine equity on the consolidated balance sheet. Redeemable noncontrolling interests as of December 31, 2019 included a balance of $477 million related to the USAC Preferred Units described below and a balance of $15 million related to noncontrolling interest holders in one of the Partnership’s consolidated subsidiaries that have the option to sell their interests to the Partnership.
USAC Series A Preferred Units
In 2018, USAC issued 500,000 USAC Preferred Units in a private placement at a price of $1,000 per USAC Preferred Unit, for total gross proceeds of $500 million in a private placement.
The USAC Preferred Units are entitled to receive cumulative quarterly distributions equal to $24.375 per USAC Preferred Unit, subject to increase in certain limited circumstances. The USAC Preferred Units will have a perpetual term, unless converted or redeemed. Certain portions of the USAC Preferred Units will be convertible into USAC common units at the election of the holders beginning in 2021. To the extent the holders of the USAC Preferred Units have not elected to convert their preferred units by the fifth anniversary of the issue date, USAC will have the option to redeem all or any portion of the USAC Preferred Units for cash. In addition, at any time on or after the tenth anniversary of the issue date, the holders of the USAC Preferred Units will have the right to require USAC to redeem all or any portion of the USAC Preferred Units, and the Partnership may elect to pay up to 50% of such redemption amount in USAC common units.
| |
| 7. | LEGACY ETP PREFERRED UNITS: |
The Legacy ETP Preferred Units were mandatorily redeemable on September 2, 2029 for $35 million plus all accrued but unpaid distributions and interest thereon and were reflected as long-term liabilities in our consolidated balance sheets. The Legacy ETP Preferred Units were entitled to a preferential quarterly cash distribution of $0.445 per Preferred Unit if outstanding on the record dates of the Partnership’s common unit distributions. In January 2017, ETP repurchased all of its 1.9 million outstanding Legacy ETP Preferred Units for cash in the aggregate amount of $53 million.
Limited Partner interests are represented by Common Class E Units, Class G Units, Class I Units, Class J Units and Class Kother classes of units described below, as well as Series A Preferred Units, Series B Preferred Units, Series C Preferred Units, Series D Preferred Units, Series E Preferred Units, Series F Preferred Units, and Series G Preferred Units that entitle the holders thereof to the rights and privileges specified in the Partnership Agreement. The Partnership’s outstanding securities also include preferred units, as described below. No person is entitled to preemptive rights in respect of issuances of equity securities by us, except that ETP GP has the right, in connection with the issuance of any equity security by us, to purchase equity securities on the same terms as equity securities are issued to third parties sufficient to enable ETP GP and its affiliates to maintain the aggregate percentage equity interest in us as ETP GP and its affiliates owned immediately prior to such issuance.
IDRs represent the contractual right to receive an increasing percentage of quarterly distributions of Available Cash (as defined in our Partnership Agreement) from operating surplus after the minimum quarterly distribution has been paid. Please read “Quarterly Distributions of Available Cash” below. ETP GP, a wholly-owned subsidiary of ETE, owns all of the IDRs.
Common Units
The change in Common Units was as follows:
|
| | | | | | | | |
| | Years Ended December 31, |
| | 2017 (1) | | 2016 (1) | | 2015 (1) |
| Number of Common Units, beginning of period | 794.8 |
| | 758.5 |
| | 533.4 |
|
| Common Units redeemed in connection with certain transactions | — |
| | (26.7 | ) | | (77.8 | ) |
| Common Units issued in connection with public offerings | 54.0 |
| | — |
| | — |
|
| Common Units issued in connection with certain acquisitions | — |
| | 13.3 |
| | 258.2 |
|
| Common Units issued in connection with the Distribution Reinvestment Plan | 12.0 |
| | 9.9 |
| | 11.7 |
|
| Common Units issued in connection with Equity Distribution Agreements | 22.6 |
| | 39.0 |
| | 31.7 |
|
| Common Units issued to ETE in a private placement transaction | 23.7 |
| | — |
| | — |
|
Common Unit increase from Sunoco Logistics Merger (2) | 255.4 |
| | — |
| | — |
|
| Issuance of Common Units under equity incentive plans | 1.6 |
| | 0.8 |
| | 1.3 |
|
| Number of Common Units, end of period | 1,164.1 |
| | 794.8 |
| | 758.5 |
|
| |
(1)
| The historical common units presented have been retrospectively adjusted to reflect the 1.5 to one unit-for-unit exchange in connection with the Sunoco Logistics Merger. |
| |
(2)
| Represents the Sunoco Logistics common units outstanding at the close of the Sunoco Logistics Merger. See Note 1 for discussion on the accounting treatment of the Sunoco Logistics Merger. |
Our Common Units are registered under the Securities Exchange Act of 1934 (as amended) and are listed for trading on the NYSE. Each holder of a Common Unit is entitled to one vote per unit on all matters presented to the Limited Partners for a vote. In addition, if at any time any person or group (other than our General Partner and its affiliates) owns beneficially 20% or more of all Common Units, any Common Units owned by that person or group may not be voted on any matter and are not considered to be outstanding when sending notices of a meeting of Unitholders (unless otherwise required by law), calculating required votes, determining the presence of a quorum or for other similar purposes under the Partnership Agreement. The Common Units are entitled to distributions of Available Cash as described below under “Quarterly Distributions of Available Cash.”
Equity Distribution Program
From time to time, we have sold Common Units through equity distribution agreements. Such sales of Common Units are made by means of ordinary brokers’ transactions on the NYSE at market prices, in block transactions or as otherwise agreed between us and the sales agent which is the counterparty to the equity distribution agreements.
In connection with the Sunoco Logistics Merger, the previous Energy Transfer Partners, L.P. equity distribution agreement was terminated. In May 2017, the Partnership entered into an equity distribution agreement with an aggregate offering price up to $1.00 billion.
During the year ended December 31, 2017, we issued 22.6 million units for $503 million, net of commissions of $5 million. As of December 31, 2017, $752 million of our Common Units remained available to be issued under our currently effective equity distribution agreement.
Equity Incentive Plan Activity
We issue Common Units to employees and directors upon vesting of awards granted under our equity incentive plans. Upon vesting, participants in the equity incentive plans may elect to have a portion of the Common Units to which they are entitled withheld by the Partnership to satisfy tax-withholding obligations.
Distribution Reinvestment Program
Our Distribution Reinvestment Plan (the “DRIP”) provides Unitholders of record and beneficial owners of our Common Units a voluntary means by which they can increase the number of ETP Common Units they own by reinvesting the quarterly cash distributions they would otherwise receive in the purchase of additional Common Units.
In connection with the Sunoco Logistics Merger, the previous Energy Transfer Partners, L.P. distribution reinvestment plan was terminated. In July 2017, the Partnership initiated a new distribution reinvestment plan.
During the years ended December 31, 2017, 2016 and 2015, aggregate distributions of $228 million, $216 million, and $360 million, respectively, were reinvested under the DRIP resulting in the issuance in aggregate of 25.5 million Common Units.
As of December 31, 2017, a total of 20.8 million Common Units remain available to be issued under the existing registration statement.
August 2017 Units Offering
In August 2017, the Partnership issued 54 million ETP common units in an underwritten public offering. Net proceeds of $997 million from the offering were used by the Partnership to repay amounts outstanding under its revolving credit facilities, to fund capital expenditures and for general partnership purposes.
January 2017 Private Placement
In January 2017, the Partnership sold 23.7 million ETP Common Units to ETE in a private placement transaction for gross proceeds of approximately $568 million.
Class E Units
There are currently 8.9 million Class E Units outstanding, all of which are currently owned by HHI. The Class E Units generally do not have any voting rights. The Class E Units are entitled to aggregate cash distributions equal to 11.1% of the total amount of cash distributed to all Unitholders, including the Class E Unitholders, up to $1.41 per unit per year. As the Class E Units are owned by a wholly-owned subsidiary, the cash distributions on those units are eliminated in our consolidated financial statements. Although no plans are currently in place, management may evaluate whether to retire the Class E Units at a future date.
Class G Units
There are currently 90.7 million Class G Units outstanding, all of which are held by a wholly-owned subsidiary of the Partnership. The Class G Units generally do not have any voting rights. The Class G Units are entitled to aggregate cash distributions equal to 35% of the total amount of cash generated by us and our subsidiaries, other than ETP Holdco, and available for distribution, up to a maximum of $3.75 per Class G Unit per year. Allocations of depreciation and amortization to the Class G Units for tax purposes are based on a predetermined percentage and are not contingent on whether ETP has net income or loss. These units are reflected as treasury units in the consolidated financial statements.
Class H Units
Pursuant to an Exchange and Redemption Agreement previously entered into between ETP, ETE and ETE Holdings, ETP redeemed and cancelled 50.2 million of its Common Units representing limited partner interests (the “Redeemed Units”) owned by ETE Holdings on October 31, 2013 in exchange for the issuance by ETP to ETE Holdings of a new class of limited partner interest in ETP (the “Class H Units”), which were generally entitled to (i) allocations of profits, losses and other items from ETP corresponding to 90.05% of the profits, losses, and other items allocated to ETP by Sunoco Partners with respect to the IDRs and general partner interest in Sunoco Logistics held by Sunoco Partners and (ii) distributions from available cash at ETP for each quarter equal to 90.05% of the cash distributed to ETP by Sunoco Partners with respect to the IDRs and general partner interest in Sunoco Logistics held by Sunoco Partners for such quarter and, to the extent not previously distributed to holders of the Class H Units, for any previous quarters. The Class H units were cancelled in connection with the merger of ETP and Sunoco Logistics in April 2017.
Class I Units
In connection with the Bakken Pipeline Transaction discussed in Note 3, in April 2015, ETP issued 100 Class I Units. The Class I Units are generally entitled to: (i) pro rata allocations of gross income or gain until the aggregate amount of such items allocated to the holders of the Class I Units for the current taxable period and all previous taxable periods is equal to the
cumulative amount of all distributions made to the holders of the Class I Units and (ii) after making cash distributions to Class H Units, any additional available cash deemed to be either operating surplus or capital surplus with respect to any quarter will be distributed to the Class I Units in an amount equal to the excess of the distribution amount set forth in our Partnership Agreement, as amended, (the “Partnership Agreement”) for such quarter over the cumulative amount of available cash previously distributed commencing with the quarter ended March 31, 2015 until the quarter ending December 31, 2016. The impact of (i) the IDR subsidy adjustments and (ii) the Class I Unit distributions, along with the currently effective IDR subsidies, is included in the table below under “Quarterly Distributions of Available Cash.” Subsequent to the April 2017 merger of ETP and Sunoco Logistics, 100 Class I Units remain outstanding.
Bakken Equity Sale
In February 2017, Bakken Holdings Company LLC, an entity in which ETP indirectly owns a 100% membership interest, sold a 49% interest in its wholly-owned subsidiary, Bakken Pipeline Investments LLC, to MarEn Bakken Company LLC, an entity jointly owned by MPLX LP and Enbridge Energy Partners, L.P., for $2.00 billion in cash. Bakken Pipeline Investments LLC indirectly owns a 75% interest in each of Dakota Access and ETCO. The remaining 25% of each of Dakota Access and ETCO is owned by wholly-owned subsidiaries of Phillips 66. ETP continues to consolidate Dakota Access and ETCO subsequent to this transaction.
Class K Units
OnAs of December 29, 2016, the Partnership issued to certain31, 2019, a total of its indirect subsidiaries, in exchange for cash contributions and the exchange of outstanding common units representing limited partner interests in the Partnership,101.5 million Class K Units eachwere held by wholly-owned subsidiaries of whichETO. Each Class K Unit is entitled to a quarterly cash distribution of $0.67275 per Class K Unit prior to ETPETO making distributions of available cash to any class of units, excluding any cash available distributions or dividends or capital stock sales proceeds received by ETPETO from ETP Holdco. If the Partnership is unable to pay the Class K Unit quarterly distribution with respect to any quarter, the accrued and unpaid distributions will accumulate until paid and any accumulated balance will accrue 1.5% per annum until paid. As of
Class L Units
On December 31, 2017,2018, ETO issued a totalnew class of 101.5 millionlimited partner interests titled Class KL Units were held byto two wholly-owned subsidiaries of ETP.the Partnership when the Partnership’s previously outstanding Class E units and Class G units held by such subsidiaries were converted into Class L Units. As a result of the conversion, the Class E units and Class G units were cancelled.
SalesThe Class L Units generally do not have any voting rights. The Class L Units are entitled to aggregate cash distributions equal to 7.65% per annum of Commonthe total amount of cash generated by us and our subsidiaries, other than ETP Holdco, and available for distribution. Distributions shall be paid quarterly, in arrears, within 45 days after the end of each quarter. As the Class L Units are owned by legacy Sunoco Logisticsa wholly-owned subsidiary, the cash distributions on those units are eliminated in our consolidated financial statements.
PriorClass M Units
On July 1, 2019, ETO issued a new class of limited partner interests titled Class M Units to ETP Holdco, a wholly-owned subsidiary of the Partnership, in exchange for the contribution of ETP Holdco’s equity ownership interest in Panhandle to the Sunoco Logistics Merger, we accounted forPartnership.
The Class M Units generally do not have any voting rights. The Class M Units are entitled to aggregate cash distributions equal to 8.00% per annum of the difference between the carryingtotal amount of cash generated by us and our investmentsubsidiaries, other than ETP Holdco, and available for distribution. Distributions shall be paid quarterly, in Sunoco Logistics andarrears, within 45 days after the underlying book value arising from end of each quarter. As
the issuance or redemption ofClass M Units are owned by a wholly-owned subsidiary, the cash distributions on those units by the respective subsidiary (excluding transactions with us) as capital transactions.are eliminated in our consolidated financial statements.
In September and October 2016, a total of 24.2 million common units were issued for net proceeds of $644 million in connection with a public offering and related option exercise. The proceeds from this offering were used to partially fund the acquisition from Vitol.
In March and April 2015, a total of 15.5 million common units were issued in connection with a public offering and related option exercise. Net proceeds of $629 million were used to repay outstanding borrowings under Sunoco Logistics’ $2.50 billion Credit Facility and for general partnership purposes.
In 2014, Sunoco Logistics entered into equity distribution agreements pursuant to which Sunoco Logistics may sell from time to time common units having aggregate offering prices of up to $1.25 billion. In connection with the Sunoco Logistics Merger, the previous Sunoco Logistics equity distribution agreement was terminated.
ETPETO Preferred Units
In November 2017, ETPETO issued 950,000 of its 6.250% Series A Preferred Units at a price of $1,000 per unit and 550,000 of its 6.625% Series B Preferred Units at a price of $1,000 per unit. In April 2018, ETO issued 18 million of its 7.375% Series C Preferred Units at a price of $25 per unit. In July 2018, ETO issued 17.8 million of its 7.625% Series D Preferred Units at a price of $25 per unit. In April 2019, ETO issued 32 million of its 7.600% Series E Preferred Units at a price of $25 per unit. As of December 31, 2019 all of our Series A, Series B, Series C, Series D and Series E Preferred Units issued remain outstanding.
The following table summarizes changes in the amounts of our Series A, Series B, Series C, Series D and Series E preferred units for the years ended December 31, 2019, 2018 and 2017 were as follows:
|
| | | | | | | | | | | | | | | | | | | | | | | |
| | Preferred Unitholders | | |
| | Series A | | Series B | | Series C | | Series D | | Series E | | Total |
| Balance, December 31, 2016 | $ | — |
| | $ | — |
| | $ | — |
| | $ | — |
| | $ | — |
| | $ | — |
|
| Distributions to partners | — |
| | — |
| | — |
| | — |
| | — |
| | — |
|
| Partnership units issued for cash | 937 |
| | 542 |
| | — |
| | — |
| | — |
| | 1,479 |
|
| Other, net | — |
| | — |
| | — |
| | — |
| | — |
| | — |
|
| Net income | 7 |
| | 5 |
| | — |
| | — |
| | — |
| | 12 |
|
| Balance, December 31, 2017 | 944 |
| | 547 |
| | — |
| | — |
| | — |
| | 1,491 |
|
| Distributions to partners | (44 | ) | | (27 | ) | | (18 | ) | | (11 | ) | | — |
| | (100 | ) |
| Partnership units issued for cash | — |
| | — |
| | 436 |
| | 431 |
| | — |
| | 867 |
|
| Other, net | (1 | ) | | — |
| | (1 | ) | | (1 | ) | | — |
| | (3 | ) |
| Net income | 59 |
| | 36 |
| | 23 |
| | 15 |
| | — |
| | 133 |
|
| Balance, December 31, 2018 | 958 |
| | 556 |
| | 440 |
| | 434 |
| | — |
| | 2,388 |
|
| Distributions to partners | (59 | ) | | (37 | ) | | (33 | ) | | (34 | ) | | (34 | ) | | (197 | ) |
| Partnership units issued for cash | — |
| | — |
| | — |
| | — |
| | 780 |
| | 780 |
|
| Other, net | — |
| | — |
| | — |
| | — |
| | (1 | ) | | (1 | ) |
| Net income | 59 |
| | 37 |
| | 33 |
| | 34 |
| | 41 |
| | 204 |
|
| Balance, December 31, 2019 | $ | 958 |
| | $ | 556 |
| | $ | 440 |
| | $ | 434 |
| | $ | 786 |
| | $ | 3,174 |
|
ETO Series A Preferred Units
Distributions on the Series A Preferred Units will accrue and be cumulative from and including the date of original issue to, but excluding, February 15, 2023, at a rate of 6.250% per annum of the stated liquidation preference of $1,000. On and after February 15, 2023, distributions on the Series A Preferred Units will accumulate at a percentage of the $1,000 liquidation preference equal to an annual floating rate of the three-month LIBOR, determined quarterly, plus a spread of 4.028% per annum. The Series A Preferred Units are redeemable at ETP’sETO’s option on or after February 15, 2023 at a redemption price of $1,000 per Series A Preferred Unit, plus an amount equal to all accumulated and unpaid distributions thereon to, but excluding, the date of redemption.
ETO Series B Preferred Units
Distributions on the Series B Preferred Units will accrue and be cumulative from and including the date of original issue to, but excluding, February 15, 2028, at a rate of 6.625% per annum of the stated liquidation preference of $1,000. On and after February 15, 2028, distributions on the Series B Preferred Units will accumulate at a percentage of the $1,000 liquidation
preference equal to an annual floating rate of the three-month LIBOR, determined quarterly, plus a spread of 4.155% per annum. The Series B Preferred Units are redeemable at ETP’sETO’s option on or after February 15, 2028 at a redemption price of $1,000 per Series B Preferred Unit, plus an amount equal to all accumulated and unpaid distributions thereon to, but excluding, the date of redemption.
ETO Series C Preferred Units
Distributions on the Series C Preferred Units will accrue and be cumulative from and including the date of original issue to, but excluding, May 15, 2023, at a rate of 7.375% per annum of the stated liquidation preference of $25. On and after May 15, 2023, distributions on the Series C Preferred Units will accumulate at a percentage of the $25 liquidation preference equal to an annual floating rate of the three-month LIBOR, determined quarterly, plus a spread of 4.530% per annum. The Series C Preferred Units are redeemable at ETO’s option on or after May 15, 2023 at a redemption price of $25 per Series C Preferred Unit, plus an amount equal to all accumulated and unpaid distributions thereon to, but excluding, the date of redemption.
ETO Series D Preferred Units
Distributions on the Series D Preferred Units will accrue and be cumulative from and including the date of original issue to, but excluding, August 15, 2023, at a rate of 7.625% per annum of the stated liquidation preference of $25. On and after August 15, 2023, distributions on the Series D Preferred Units will accumulate at a percentage of the $25 liquidation preference equal to an annual floating rate of the three-month LIBOR, determined quarterly, plus a spread of 4.738% per annum. The Series D Preferred Units are redeemable at ETO’s option on or after August 15, 2023 at a redemption price of $25 per Series D Preferred Unit, plus an amount equal to all accumulated and unpaid distributions thereon to, but excluding, the date of redemption.
ETO Series E Preferred Units
Distributions on the Series E Preferred Units will accrue and be cumulative from and including the date of original issue to, but excluding, May 15, 2024, at a rate of 7.600% per annum of the stated liquidation preference of $25. On and after May 15, 2024, distributions on the Series E Preferred Units will accumulate at a percentage of the $25 liquidation preference equal to an annual floating rate of the three-month LIBOR, determined quarterly, plus a spread of 5.161% per annum. The Series E Preferred Units are redeemable at ETO’s option on or after May 15, 2024 at a redemption price of $25 per Series E Preferred Unit, plus an amount equal to all accumulated and unpaid distributions thereon to, but excluding, the date of redemption.
ETO Series F Preferred Units
On January 22, 2020, the Partnership issued 500,000 of its 6.750% Series F Fixed-Rate Reset Cumulative Redeemable Perpetual Preferred Units representing limited partner interest in the Partnership, at a price to the public of $1,000 per unit. Distributions on the Series F Preferred Units are cumulative from and including the original issue date and will be payable semi-annually in arrears on the 15th day of May and November of each year, commencing on May 15, 2020 to, but excluding, May 15, 2025, at a rate equal to 6.750% per annum of the $1,000 liquidation preference. On and after May 15, 2025, the distribution rate on the Series F Preferred Units will equal a percentage of the $1,000 liquidation preference equal to the five-year U.S. treasury rate plus a spread of 5.134% per annum. The Series F Preferred Units are redeemable at ETO’s option on or after May 15, 2025 at a redemption price of $1,000 per Series F Preferred Unit, plus an amount equal to all accumulated and unpaid distributions thereon to, but excluding, the date of redemption.
ETO Series G Preferred Units
On January 22, 2020, the Partnership issued 1,100,000 of its 7.125% Series G Fixed-Rate Reset Cumulative Redeemable Perpetual Preferred Units representing limited partner interest in the Partnership, at a price to the public of $1,000 per unit. Distributions on the Series G Preferred Units are cumulative from and including the original issue date and will be payable semi-annually in arrears on the 15th day of May and November of each year, commencing on May 15, 2020 to, but excluding, May 15, 2030, at a rate equal to 7.125% per annum of the $1,000 liquidation preference. On and after May 15, 2030, the distribution rate on the Series G Preferred Units will equal a percentage of the $1,000 liquidation preference equal to the five-year U.S. treasury rate plus a spread of 5.306% per annum. The Series G Preferred Units are redeemable at ETO’s option on or after May 15, 2030 at a redemption price of $1,000 per Series G Preferred Unit, plus an amount equal to all accumulated and unpaid distributions thereon to, but excluding, the date of redemption.
PennTex Tender Offer and Limited Call Right Exercise
In June 2017, ETPETO purchased all of the outstanding PennTex common units not previously owned by ETPETO for $20.00 per common unit in cash. ETPETO now owns all of the economic interests of PennTex, and PennTex common units are no longer publicly traded or listed on the NASDAQ.
Quarterly
Subsidiary Equity Transactions
Sunoco LP’s Common Unit Repurchase
In February 2018, after the record date for Sunoco LP’s fourth quarter 2017 cash distributions, Sunoco LP repurchased 17,286,859 Sunoco LP common units owned by ETO for aggregate cash consideration of approximately $540 million. ETO used the proceeds from the sale of the Sunoco LP common units to repay amounts outstanding under its revolving credit facility.
Sunoco LP’s Equity Distribution Program
Sunoco LP is party to an equity distribution agreement for an at-the-market (“ATM”) offering pursuant to which Sunoco LP may sell its common units from time to time. For the years ended December 31, 2019 and 2018, Sunoco LP issued 0 units under its ATM program. For the year ended December 31, 2017, Sunoco LP issued an additional 1.3 million units with total net proceeds of $33 million , net of commissions of $0.3 million. As of December 31, 2019, $295 million of Sunoco LP common units remained available to be issued under the currently effective equity distribution agreement.
Sunoco LP’s Series A Preferred Units
On March 30, 2017, the Partnership purchased 12.0 million Sunoco LP Series A Preferred Units representing limited partner interests in Sunoco LP in a private placement transaction for an aggregate purchase price of $300 million. The distribution rate of the Sunoco LP Series A Preferred Units is 10.00%, per annum, of the $25.00 liquidation preference per unit until March 30, 2022, at which point the distribution rate will become a floating rate of 8.00% plus three-month LIBOR of the liquidation preference.
In January 2018, Sunoco LP redeemed all outstanding Sunoco LP Series A Preferred Units held by ET for an aggregate redemption amount of approximately $313 million. The redemption amount included the original consideration of $300 million and a 1% call premium plus accrued and unpaid quarterly distributions.
USAC’s Distribution Reinvestment Program
During the year ended December 31, 2019 and 2018, distributions of $1 million and $0.6 million, respectively, were reinvested under the USAC distribution reinvestment program resulting in the issuance of approximately 60,584 and 39,280 USAC common units, respectively.
USAC’s Warrant Private Placement
On April 2, 2018, USAC issued two tranches of warrants to purchase USAC common units (the “USAC Warrants”), which included USAC Warrants to purchase 5,000,000 common units with a strike price of $17.03 per unit and USAC Warrants to purchase 10,000,000 common units with a strike price of $19.59 per unit. The USAC Warrants may be exercised by the holders thereof at any time beginning on the one year anniversary of the closing date and before the tenth anniversary of the closing date. Upon exercise of the USAC Warrants, USAC may, at its option, elect to settle the USAC Warrants in common units on a net basis.
USAC’s Class B Units
The USAC Class B Units, all of which are owned by ETO, are a new class of partnership interests of USAC that have substantially all of the rights and obligations of a USAC common unit, except the USAC Class B Units will not participate in distributions for the first four quarters following the closing date of the USAC Transaction on April 2, 2018. Each USAC Class B Unit automatically converted into one USAC common unit on the first business day following the record date attributable to the quarter ending June 30, 2019.
On July 30, 2019, the 6,397,965 USAC Class B units held by the Partnership converted into 6,397,965 common units representing limited partner interests in USAC. These common units participate in distributions declared by USAC.
Cash Distributions of Available Cash
UnderETO Preferred Unit Distributions
Distributions on the Partnership’s limited partnership agreement, within 45 days after the end of each quarter,Series A, Series B, Series C, Series D and Series E preferred units declared and/or paid by the Partnership distributes all cash on hand at the end of the quarter, less reserves established by the general partner in its discretion. This is definedwere as “available cash” in the partnership agreement. The general partner has broad discretion to establish cash reserves that it determines are necessary or appropriate to properly conduct the Partnership’s business. The Partnership will make quarterly distributions to the extent there is sufficient cash from operations after establishment of cash reservesfollows:
|
| | | | | | | | | | | | | | | | | | | | | | | | | |
| Period Ended | | Record Date | | Payment Date | | Series A (1) | | Series B (1) | | Series C | | Series D | | Series E | |
| December 31, 2017 | | February 1, 2018 | | February 15, 2018 | | $ | 15.4510 |
| * | $ | 16.3780 |
| * | $ | — |
| | $ | — |
| | $ | — |
| |
| June 30, 2018 | | August 1, 2018 | | August 15, 2018 | | 31.2500 |
| | 33.1250 |
| | 0.5634 |
| * | — |
| | — |
| |
| September 30, 2018 | | November 1, 2018 | | November 15, 2018 | | — |
| | — |
| | 0.4609 |
| | 0.5931 |
| * | — |
| |
| December 31, 2018 | | February 1, 2019 | | February 15, 2019 | | 31.2500 |
| | 33.1250 |
| | 0.4609 |
| | 0.4766 |
| | — |
| |
| March 31, 2019 | | May 1, 2019 | | May 15, 2019 | | — |
| | — |
| | 0.4609 |
| | 0.4766 |
| | — |
| |
| June 30, 2019 | | August 1, 2019 | | August 15, 2019 | | 31.2500 |
| | 33.1250 |
| | 0.4609 |
| | 0.4766 |
| | 0.5806 |
| * |
| September 30, 2019 | | November 1, 2019 | | November 15, 2019 | | — |
| | — |
| | 0.4609 |
| | 0.4766 |
| | 0.4750 |
| |
| December 31, 2019 | | February 3, 2020 | | February 18, 2020 | | 31.2500 |
| | 33.1250 |
| | 0.4609 |
| | 0.4766 |
| | 0.4750 |
| |
| |
* | Represent prorated initial distributions. Prorated initial distributions on the recently issued Series F and Series G preferred units will be payable in May 2020. |
(1) Series A Preferred Units and payment of fees and expenses, including payments to the general partner.
If cash distributions exceed $0.0833 per unit in a quarter, the holders of the incentive distribution rights receive increasing percentages, up to 48 percent, of the cash distributed in excess of that amount. TheseSeries B Preferred Unit distributions are referred to as “incentive distributions.”paid on a semi-annual basis.
Sunoco LP Cash Distributions
The following table showsillustrates the percentage allocations of available cash from operating surplus between Sunoco LP’s common unitholders and the holder of its IDRs based on the specified target distribution levels, and distribution “splits” betweenafter the general and limited partnerspayment of distributions to Class C unitholders. The amounts set forth under “marginal percentage interest in distributions” are the percentage interests of the IDR holder and the holders ofcommon unitholders in any available cash from operating surplus which Sunoco LP distributes up to and including the Partnership’s incentivecorresponding amount in the column “total quarterly distribution rights (”IDRs”):
|
| | | | | | |
| | | | | Marginal Percentage Interest in Distributions |
| | | Total Quarterly Distribution Target Amount | | IDRs | | Partners (1) |
| Minimum Quarterly Distribution | | $0.0750 | | —% | | 100% |
| First Target Distribution | | up to $0.0833 | | —% | | 100% |
| Second Target Distribution | | above $0.0833 up to $0.0958 | | 13% | | 87% |
| Third Target Distribution | | above $0.0958 up to $0.2638 | | 35% | | 65% |
| Thereafter | | above $0.2638 | | 48% | | 52% |
(1) Includes general partner and limited partner interests, based on the proportionate ownership of each.
per unit target amount.” The percentage interests shown for thecommon unitholders and the general partnerIDR holder for the minimum quarterly distribution are also applicable to quarterly distribution amounts that are less than the minimum quarterly distribution.
|
| | | | | | |
| | | | | Marginal Percentage Interest in Distributions |
| | | Total Quarterly Distribution Target Amount | | Common Unitholders | | Holder of IDRs |
| Minimum Quarterly Distribution | | $0.4375 | | 100% | | —% |
| First Target Distribution | | $0.4375 to $0.503125 | | 100% | | —% |
| Second Target Distribution | | $0.503125 to $0.546875 | | 85% | | 15% |
| Third Target Distribution | | $0.546875 to $0.656250 | | 75% | | 25% |
| Thereafter | | Above $0.656250 | | 50% | | 50% |
Distributions on commonSunoco LP’s units declared andand/or paid by ETP and Sunoco Logistics during the pre-merger periodsLP were as follows:
|
| | | | | | | | |
| Quarter Ended | | Record Date | | Payment Date | | Rate |
| December 31, 2016 | | February 13, 2017 | | February 21, 2017 | | $ | 0.8255 |
|
| March 31, 2017 | | May 9, 2017 | | May 16, 2017 | | 0.8255 |
|
| June 30, 2017 | | August 7, 2017 | | August 15, 2017 | | 0.8255 |
|
| September 30, 2017 | | November 7, 2017 | | November 14, 2017 | | 0.8255 |
|
| December 31, 2017 | | February 6, 2018 | | February 14, 2018 | | 0.8255 |
|
| March 31, 2018 | | May 7, 2018 | | May 15, 2018 | | 0.8255 |
|
| June 30, 2018 | | August 7, 2018 | | August 15, 2018 | | 0.8255 |
|
| September 30, 2018 | | November 6, 2018 | | November 14, 2018 | | 0.8255 |
|
| December 31, 2018 | | February 6, 2019 | | February 14, 2019 | | 0.8255 |
|
| March 31, 2019 | | May 7, 2019 | | May 15, 2019 | | 0.8255 |
|
| June 30, 2019 | | August 6, 2019 | | August 14, 2019 | | 0.8255 |
|
| September 30, 2019 | | November 5, 2019 | | November 19, 2019 | | 0.8255 |
|
| December 31, 2019 | | February 7, 2020 | | February 19, 2020 | | 0.8255 |
|
|
| | | | | | | | |
| Quarter Ended | | ETP | | Sunoco Logistics |
| December 31, 2014 | | $ | 0.6633 |
| | $ | 0.4000 |
|
| March 31, 2015 | | 0.6767 |
| | 0.4190 |
|
| June 30, 2015 | | 0.6900 |
| | 0.4380 |
|
| September 30, 2015 | | 0.7033 |
| | 0.4580 |
|
| December 31, 2015 | | 0.7033 |
| | 0.4790 |
|
| March 31, 2016 | | 0.7033 |
| | 0.4890 |
|
| June 30, 2016 | | 0.7033 |
| | 0.5000 |
|
| September 30, 2016 | | 0.7033 |
| | 0.5100 |
|
| December 31, 2016 | | 0.7033 |
| | 0.5200 |
|
Subsequent to the Energy Transfer Merger and USAC Transactions described in Note 1 and Note 3, respectively, ETO owned approximately 39.7 million USAC common units and 6.4 million USAC Class B units. Subsequent to the conversion of the USAC Class B Units to USAC common units on July 30, 2019, ETO owns approximately 46.1 million USAC common units. As of December 31, 2019, USAC had approximately 96.6 million common units outstanding. USAC currently has a non-economic general partner interest and no outstanding IDRs.
Distributions on USAC’s units declared and/or paid by USAC subsequent to the USAC transaction on April 2, 2018 were as follows:
|
| | | | | | | | |
| Quarter Ended | | Record Date | | Payment Date | | Rate |
| March 31, 2018 | | May 1, 2018 | | May 11, 2018 | | $ | 0.5250 |
|
| June 30, 2018 | | July 30, 2018 | | August 10, 2018 | | 0.5250 |
|
| September 30, 2018 | | October 29, 2018 | | November 09, 2018 | | 0.5250 |
|
| December 31, 2018 | | January 28, 2019 | | February 8, 2019 | | 0.5250 |
|
| March 31, 2019 | | April 29, 2019 | | May 10, 2019 | | 0.5250 |
|
| June 30, 2019 | | July 29, 2019 | | August 9, 2019 | | 0.5250 |
|
| September 30, 2019 | | October 28, 2019 | | November 8, 2019 | | 0.5250 |
|
| December 31, 2019 | | January 27, 2020 | | February 7, 2020 | | 0.5250 |
|
Distributions on common units declared and paid by Post-Merger ETP were as follows:
|
| | | | | | | | |
| Quarter Ended | | Record Date | | Payment Date | | Rate |
| March 31, 2017 | | May 10, 2017 | | May 16, 2017 | | $ | 0.5350 |
|
| June 30, 2017 | | August 7, 2017 | | August 15, 2017 | | 0.5500 |
|
| September 30, 2017 | | November 7, 2017 | | November 14, 2017 | | 0.5650 |
|
| December 31, 2017 | | February 8, 2018 | | February 14, 2018 | | 0.5650 |
|
In connection with previous transactions, ETE has agreed to relinquish its right to the following amounts of incentive distributions in future periods:
|
| | | | |
| | | Total Year |
| 2018 | | $ | 153 |
|
| 2019 | | 128 |
|
| Each year beyond 2019 | | 33 |
|
Distributions declared and paid by ETP to the preferred unitholders were as follows:
|
| | | | | | | | | | | | |
| | Distribution per Preferred Unit |
| Quarter Ended | | Record Date | | Payment Date | | Series A | | Series B |
| December 31, 2017 | | February 1, 2018 | | February 15, 2018 | | $ | 15.451 |
| | $ | 16.378 |
|
Accumulated Other Comprehensive Income
The following table presents the components of AOCI, net of tax:
|
| | | | | | | |
| | December 31, |
| | 2019 | | 2018 |
| Available-for-sale securities | $ | 13 |
| | $ | 2 |
|
| Foreign currency translation adjustment | (5 | ) | | (5 | ) |
| Actuarial loss related to pensions and other postretirement benefits | (25 | ) | | (48 | ) |
| Investments in unconsolidated affiliates, net | (1 | ) | | 9 |
|
| Total AOCI, net of tax | $ | (18 | ) | | $ | (42 | ) |
|
| | | | | | | |
| | December 31, |
| | 2017 | | 2016 |
| Available-for-sale securities | $ | 8 |
| | $ | 2 |
|
| Foreign currency translation adjustment | (5 | ) | | (5 | ) |
| Actuarial gain related to pensions and other postretirement benefits | (5 | ) | | 7 |
|
| Investments in unconsolidated affiliates, net | 5 |
| | 4 |
|
| Total AOCI, net of tax | $ | 3 |
| | $ | 8 |
|
The table below sets forth the tax amounts included in the respective components of other comprehensive income:
|
| | | | | | | |
| | December 31, |
| | 2019 | | 2018 |
| Available-for-sale securities | $ | (1 | ) | | $ | (1 | ) |
| Foreign currency translation adjustment | 2 |
| | 2 |
|
| Actuarial loss relating to pension and other postretirement benefits | 8 |
| | 12 |
|
| Total | $ | 9 |
| | $ | 13 |
|
|
| | | | | | | |
| | December 31, |
| | 2017 | | 2016 |
| Available-for-sale securities | $ | (2 | ) | | $ | (2 | ) |
| Foreign currency translation adjustment | 3 |
| | 3 |
|
| Actuarial loss relating to pension and other postretirement benefits | 3 |
| | — |
|
| Total | $ | 4 |
| | $ | 1 |
|
| |
9.8. | UNIT-BASEDNON-CASH COMPENSATION PLANS: |
ETP Unit-Based CompensationETO Long-Term Incentive Plan
We have previously issued equity incentive plans for employees, officers and directors, which provide for various types of awards, including options to purchase ETPETO Common Units, restricted units, phantom units, Common Units, distribution equivalent rights (“DERs”), Common Unit appreciation rights, and other unit-based awards. As
The Partnership does not currently have any equity compensation plans. In connection with the Energy Transfer Merger in October 2018, all of the Partnership’s equity compensation plans, as well as the Partnership’s obligations under those plans, were assumed by ET. The Partnership recorded stock compensation expenses of $111 million, $105 million and $99 million for the years ended December 31, 2019, 2018 and 2017, an aggregate totalrespectively.
Subsidiary Long-Term Incentive Plans
Each of 8.4 million ETP Common Units remain available to be awarded under our equity incentive plans.
Restricted Units
We haveSunoco LP and USAC has granted restricted or phantom unit awards (collectively, the “Subsidiary Unit Awards”) to employees and directors that entitle the grantees to receive common units of the respective subsidiary. In some cases, at the discretion of the respective subsidiary’s compensation committee, the grantee may instead receive an amount of cash equivalent to the value of common units upon vesting. Substantially all of the Subsidiary Unit Awards are time-vested grants, which generally vest over a specified timethree or five-year period, typically a five-year service vesting requirement, with vesting based on continued employment as of each applicable vesting date. Upon vesting, ETP Common Units are issued. These unit awards entitlethat entitles the recipientsgrantees of the unit awards to receive with respect to each Common Unit subject to such award that has not either vested or been forfeited, aan amount of cash payment equal to eachthe per unit cash distribution per Common Unitdistributions made by us on our Common Units promptly following each such distribution by us to our Unitholders. We refer to these rights as “distribution equivalent rights.” Under our equity incentive plans, our non-employee directors each receive grants with a five-year service vesting requirement.the respective subsidiaries during the period the restricted unit is outstanding.
The following table showssummarizes the activity of the awards granted to employees and non-employee directors:Subsidiary Unit Awards:
|
| | | | | | | | | | | | | |
| | Sunoco LP | | USAC |
| | Number of Units | | Weighted Average Grant-Date Fair Value Per Unit | | Number of Units | | Weighted Average Grant-Date Fair Value Per Unit |
| Unvested awards as of December 31, 2018 | 2.1 |
| | $ | 29.15 |
| | 1.4 |
| | $ | 14.98 |
|
| Awards granted | 0.7 |
| | 30.70 |
| | 0.7 |
| | 15.88 |
|
| Awards vested | (0.5 | ) | | 30.04 |
| | (0.3 | ) | | 13.06 |
|
| Awards forfeited | (0.2 | ) | | 28.16 |
| | — |
| | 16.78 |
|
| Unvested awards as of December 31, 2019 | 2.1 |
| | 29.21 |
| | 1.8 |
| | 15.09 |
|
|
| | | | | | |
| | Number of Units | | Weighted Average Grant-Date Fair Value Per Unit |
| Unvested awards as of December 31, 2016 | 9.4 |
| | $ | 27.68 |
|
| Legacy Sunoco Logistics unvested awards as of December 31, 2016 | 3.2 |
| | 28.57 |
|
| Awards granted | 4.9 |
| | 17.69 |
|
| Awards vested | (2.3 | ) | | 34.22 |
|
| Awards forfeited | (1.1 | ) | | 25.03 |
|
| Unvested awards as of December 31, 2017 | 14.1 |
| | 23.18 |
|
During the years ended December 31, 2017, 2016, and 2015,The following table summarizes the weighted average grant-date fair value per unit award granted was $17.69, $23.82 and $23.47, respectively. granted:
|
| | | | | | | | | | | |
| | Years Ended December 31, |
| | 2019 | | 2018 | | 2017 |
| Sunoco LP | $ | 30.70 |
| | $ | 27.67 |
| | $ | 28.31 |
|
| USAC | 15.88 |
| | 15.47 |
| | N/A |
|
The total fair value of awardsSubsidiary Unit Awards vested for the years ended December 31, 2019, 2018 and 2017 was $40$17 million, $40$22 million and $57$9 million, respectively, based on the market price of ETP Common UnitsSunoco LP and USAC common units as of the vesting date.date for the years ended December 31, 2019 and 2018 and Sunoco LP for the year ended December 31, 2017. As of December 31, 2017, a total of 14.12019, estimated compensation cost related to Subsidiary Unit Awards not yet recognized was $57 million, unit awards remain unvested, for which ETP expects to recognize a total of $189 million in compensation expense over aand the weighted average period of 2.7over which this cost is expected to be recognized in expense is 3.6 years.
Cash Restricted Units. The Partnership previously granted cash restricted units, which entitled the award recipient to receive cash equal to the market value of one ETP Common Unit upon vesting. The Partnership does not currently have any cash restricted units outstanding.
As a partnership, we are not subject to United States federal income tax and most state income taxes. However, the Partnership conducts certain activities through corporate subsidiaries which are subject to federal and state income taxes. The components of the federal and state income tax expense (benefit) areof our taxable subsidiaries were summarized as follows:
|
| | | | | | | | | | | |
| | Years Ended December 31, |
| | 2019 | | 2018 | | 2017 |
| Current expense (benefit): | | | | | |
| Federal | $ | (20 | ) | | $ | (7 | ) | | $ | 53 |
|
| State | (1 | ) | | 20 |
| | (16 | ) |
| Total | (21 | ) | | 13 |
| | 37 |
|
| Deferred expense (benefit): | | | | | |
| Federal | 176 |
| | 183 |
| | (2,025 | ) |
| State | 45 |
| | (191 | ) | | 184 |
|
| Total | 221 |
| | (8 | ) | | (1,841 | ) |
| Total income tax expense (benefit) | $ | 200 |
| | $ | 5 |
| | $ | (1,804 | ) |
|
| | | | | | | | | | | |
| | Years Ended December 31, |
| | 2017 | | 2016 | | 2015 |
| Current expense (benefit): | | | | | |
| Federal | $ | 53 |
| | $ | 18 |
| | $ | (274 | ) |
| State | (18 | ) | | (35 | ) | | (51 | ) |
| Total | 35 |
| | (17 | ) | | (325 | ) |
| Deferred expense (benefit): | | | | | |
| Federal | (1,723 | ) | | (173 | ) | | 231 |
|
| State | 192 |
| | 4 |
| | (29 | ) |
| Total | (1,531 | ) | | (169 | ) | | 202 |
|
| Total income tax benefit | $ | (1,496 | ) | | $ | (186 | ) | | $ | (123 | ) |
Historically, our effective tax rate has differed from the statutory rate primarily due to Partnership earnings that are not subject to United States federal and most state income taxes at the partnership level. A reconciliation of income tax expense at the United States statutory rate to the Partnership’s income tax benefit for the years ended December 31, 20172019, 20162018 and 20152017 is as follows:
|
| | | | | | | | | | | |
| | Years Ended December 31, |
| | 2019 | | 2018 | | 2017 |
| Income tax expense at United States statutory rate | $ | 1,131 |
| | $ | 849 |
| | $ | 402 |
|
| Increase (reduction) in income taxes resulting from: | | | | | |
| Partnership earnings not subject to tax | (940 | ) | | (718 | ) | | (626 | ) |
| Federal rate change | — |
| | — |
|
| (1,784 | ) |
| Goodwill impairments | — |
| | — |
| | 208 |
|
| State income taxes (net of federal income tax effects) | 14 |
| | (125 | ) | | 123 |
|
| Dividend received deduction | (3 | ) | | (5 | ) | | (14 | ) |
| Change in tax status of subsidiary | — |
| | — |
| | (124 | ) |
| Other | (2 | ) | | 4 |
| | 11 |
|
| Income tax expense (benefit) | $ | 200 |
| | $ | 5 |
| | $ | (1,804 | ) |
|
| | | | | | | | | | | |
| | Years Ended December 31, |
| | 2017 | | 2016* | | 2015* |
| Income tax expense at United States statutory rate of 35 percent | $ | 352 |
| | $ | 139 |
| | $ | 479 |
|
| Increase (reduction) in income taxes resulting from: | | | | | |
| Partnership earnings not subject to tax | (457 | ) | | (504 | ) | | (504 | ) |
| Federal rate change | (1,559 | ) | | — |
|
| — |
|
| Goodwill impairments | 172 |
| | 223 |
| | — |
|
| State income taxes (net of federal income tax effects) | 131 |
| | (17 | ) | | (37 | ) |
| Dividend received deduction | (14 | ) | | (15 | ) | | (24 | ) |
| Audit settlement | — |
| | — |
| | (7 | ) |
| Change in tax status of subsidiary | (124 | ) | | — |
| | — |
|
| Other | 3 |
| | (12 | ) | | (30 | ) |
| Income tax benefit | $ | (1,496 | ) | | $ | (186 | ) | | $ | (123 | ) |
* As adjusted. See Note 2.
Deferred taxes result from the temporary differences between financial reporting carrying amounts and the tax basis of existing assets and liabilities. The table below summarizes the principal components of the deferred tax assets (liabilities) as follows:
|
| | | | | | | |
| | December 31, |
| | 2019 | | 2018 |
| Deferred income tax assets: | | | |
| Net operating losses, alternative minimum tax credit and other carryforwards | $ | 669 |
| | $ | 768 |
|
| Pension and other postretirement benefits | — |
| | 34 |
|
| Long-term debt | — |
| | 13 |
|
| Other | 62 |
| | 181 |
|
| Total deferred income tax assets | 731 |
| | 996 |
|
| Valuation allowance | (49 | ) | | (96 | ) |
| Net deferred income tax assets | $ | 682 |
| | $ | 900 |
|
| | | | |
| Deferred income tax liabilities: | | | |
| Property, plant and equipment | $ | (258 | ) | | $ | (742 | ) |
| Investments in affiliates | (3,452 | ) | | (2,869 | ) |
| Trademarks | (72 | ) | | (63 | ) |
| Other | (13 | ) | | (110 | ) |
| Total deferred income tax liabilities | (3,795 | ) | | (3,784 | ) |
| Net deferred income taxes | $ | (3,113 | ) | | $ | (2,884 | ) |
|
| | | | | | | |
| | December 31, |
| | 2017 | | 2016 |
| Deferred income tax assets: | | | |
| Net operating losses and alternative minimum tax credit | $ | 604 |
| | $ | 380 |
|
| Pension and other postretirement benefits | 21 |
| | 30 |
|
| Long-term debt | 14 |
| | 32 |
|
| Other | 93 |
| | 84 |
|
| Total deferred income tax assets | 732 |
| | 526 |
|
| Valuation allowance | (189 | ) | | (118 | ) |
| Net deferred income tax assets | $ | 543 |
| | $ | 408 |
|
| | | | |
| Deferred income tax liabilities: | | | |
| Property, plant and equipment | $ | (664 | ) | | $ | (1,054 | ) |
| Investment in unconsolidated affiliates | (2,664 | ) | | (3,728 | ) |
| Other | (98 | ) | | (20 | ) |
| Total deferred income tax liabilities | (3,426 | ) | | (4,802 | ) |
| Net deferred income taxes | $ | (2,883 | ) | | $ | (4,394 | ) |
The table below provides a rollforward of the net deferred income tax liability as follows:
|
| | | | | | | |
| | December 31, |
| | 2017 | | 2016 |
| Net deferred income tax liability, beginning of year | $ | (4,394 | ) | | $ | (4,082 | ) |
| Goodwill associated with Sunoco Retail to Sunoco LP transaction (see Note 3) | — |
| | (460 | ) |
| Tax provision | 1,531 |
| | 169 |
|
| Other | (20 | ) | | (21 | ) |
| Net deferred income tax liability, end of year | $ | (2,883 | ) | | $ | (4,394 | ) |
December 31, 2019, ETP Holdco and other corporate subsidiaries havehad a federal net operating loss carryforward of $1.57$2.65 billion, all of which $1.10 billion will expire in 2031 through 2037. 2037 while the remaining can be carried forward indefinitely. As of December 31, 2019, Sunoco Property Company LLC, a corporate subsidiary of Sunoco LP, has no federal net operating loss carryforward.
Our corporate subsidiaries have $62$15 million of federal alternative minimum tax credits at December 31, 2017,2019, of which $29$8 million is expected to be reclassified to current income tax receivable in 20182020 pursuant to the Tax Cuts and Jobs Act. Our corporate subsidiaries have state net operating loss carryforward benefits of $210$95 million, net of federal tax, some of which will expire between 20182020 and 2036.2038, while others are carried forward indefinitely. A valuation allowance of $186$49 million is applicable to the state net operating loss carryforward benefits primarily attributable to significant restrictions on their use in the Commonwealth of Pennsylvania and the remaining $3 million valuation allowance is applicable to the federal net operating loss carryforward benefit.Pennsylvania.
The following table sets forth the changes in unrecognized tax benefits:
|
| | | | | | | | | | | |
| | Years Ended December 31, |
| | 2019 | | 2018 | | 2017 |
| Balance at beginning of year | $ | 624 |
| | $ | 609 |
| | $ | 615 |
|
| Additions attributable to tax positions taken in the current year | — |
| | 8 |
| | — |
|
| Additions attributable to tax positions taken in prior years | 11 |
| | 7 |
| | 28 |
|
| Reduction attributable to tax positions taken in prior years | (541 | ) | | — |
| | (25 | ) |
| Lapse of statute | — |
| | — |
| | (9 | ) |
| Balance at end of year | $ | 94 |
| | $ | 624 |
| | $ | 609 |
|
|
| | | | | | | | | | | |
| | Years Ended December 31, |
| | 2017 | | 2016 | | 2015 |
| Balance at beginning of year | $ | 615 |
| | $ | 610 |
| | $ | 440 |
|
| Additions attributable to tax positions taken in the current year | — |
| | 8 |
| | — |
|
| Additions attributable to tax positions taken in prior years | 28 |
| | 18 |
| | 178 |
|
| Reduction attributable to tax positions taken in prior years | (25 | ) | | (20 | ) | | — |
|
| Lapse of statute | (9 | ) | | (1 | ) | | (8 | ) |
| Balance at end of year | $ | 609 |
| | $ | 615 |
| | $ | 610 |
|
As of December 31, 2017,2019, we have $605$90 million ($57672 million after federal income tax benefits) related to tax positions which, if recognized, would impact our effective tax rate.
Our policy is to accrue interest expense and penalties on income tax underpayments (overpayments) as a component of income tax expense. During 2017,2019, we recognized interest and penalties of less than $3$1 million. At December 31, 2017,2019, we have interest and penalties accrued of $9$3 million, net of tax.
Sunoco, Inc. has historically included certain government incentive payments as taxable income on its federal and state income tax returns. In connection with Sunoco, Inc.’s 2004 through 2011 years, Sunoco, Inc. filed amended returns withWe appealed the IRS excluding these government incentive payments from federal taxable income. The IRS denied the amended returns, and Sunoco, Inc. petitioned theadverse Court of Federal Claims (“CFC”) in June 2015 on this issue. In November 2016,decision against ETC Sunoco regarding the CFC ruled against Sunoco, Inc., and Sunoco, Inc. is appealing this decisionIRS' denial of ethanol blending credits claims under Section 6426 to the Federal Circuit. IfThe Federal Circuit affirmed the CFC's denial on November 1, 2018. ETC Sunoco Inc. is ultimately fully successful in this litigation, it will receivefiled a petition for certiorari with the Supreme Court on May 24, 2019 to review the Federal Circuit's affirmation of the CFC's ruling, and the Court denied Sunoco's petition on October 7, 2019. The petition for certiorari applied to ETC Sunoco's 2004 through 2009 tax refunds of approximately $530 million. However, dueyears, and 2010 through 2011 are on extension with the IRS through March 30, 2020. Due to the uncertainty surrounding the litigation, a reserve of $530 million was previously established for the full amount of the litigation. Due to the timing of the litigationpending refund claims, and the related reserve, the receivable and the reserve for this issue have beenwere netted in the consolidated balance sheet. Subsequent to the Supreme Court's denial of the petition in October 2019, the receivable and reserve have been reversed, with no impact to the Partnership's financial statements asposition and results of December 31, 2017.operations.
In DecemberNovember 2015, the Pennsylvania Commonwealth Court determined in Nextel Communications v. Commonwealth (“Nextel”) that the Pennsylvania limitation on NOL carryforward deductions violated the uniformity clause of the Pennsylvania Constitution and struck the NOL limitation in its entirety. In October 2017, the Pennsylvania Supreme Court affirmed the decision with respect to the uniformity clause violation; however, the Court reversed with respect to the remedy and instead severed the flat-dollar limitation, leaving the percentage-based limitation intact. Nextel has until April 4, 2018 to filesubsequently filed a petition for writ of certiorari with the U.S.United States Supreme Court.Court, and this was denied on June 11, 2018. Now certain Pennsylvania taxpayers are proceeding with litigation in Pennsylvania state courts on issues not addressed by the Pennsylvania Supreme Court in Nextel, specifically, whether the Due Process and Equal Protection Clauses of the United States Constitution and the Remedies Clause of the Pennsylvania Constitution require a court to grant the taxpayer relief. ETC Sunoco Inc. has recognized approximately $67 million ($53 million after federal income tax benefits) in tax benefit based on previously filed tax returns and certain previously filed protective claims as relates to its cases currently held pending the Nextel matter. However, based upon the Pennsylvania Supreme Court’s
October 2017 decision, and because of uncertainty in the breadth of the application of the decision, we have reserved $27$34 million ($2127 million after federal income tax benefits) against the receivable.
In general, ETP and its subsidiaries are no longer subject to examination by the Internal Revenue Service (“IRS”), and most state jurisdictions, for the 2013 and prior tax years. However, Sunoco, Inc.ETO and its subsidiaries are no longer subject to examination by the IRS, and most state jurisdictions, for the 2014 and prior tax years prior to 2007.years.
Sunoco, Inc. has been examined by the IRS for tax years through 2013. However, statutes remain open for tax years 2007 and forward due to carryback of net operating losses and/or claims regarding government incentive payments discussed above. All other issues are resolved. Though we believe the tax years are closed by statute, tax years 2004 through 2006 are impacted by the carryback of net operating losses and under certain circumstances may be impacted by adjustments for government incentive payments.
ETPETO and its subsidiaries also have various state and local income tax returns in the process of examination or administrative appeal in various jurisdictions. We believe the appropriate accruals or unrecognized tax benefits have been recorded for any potential assessment with respect to these examinations.
On December 22, 2017, the Tax Cuts and Jobs Act was signed into law. Among other provisions, the highest corporate federal income tax rate was reduced from 35% to 21% for taxable years beginning after December 31, 2017. As a result, the Partnership recognized a deferred tax benefit
| |
11.10. | REGULATORY MATTERS, COMMITMENTS, CONTINGENCIES AND ENVIRONMENTAL LIABILITIES: |
Contingent Residual Support Agreement – AmeriGasFERC Proceedings
In connection withBy Order issued January 16, 2019, the closingFERC initiated a review of Panhandle’s existing rates pursuant to Section 5 of the contribution of its propane operations in January 2012, ETP previously provided contingent residual support of certain debt obligations of AmeriGas. AmeriGas has subsequently repaidNatural Gas Act to determine whether the remainderrates currently charged by Panhandle are just and reasonable and set the matter for hearing. On August 30, 2019, Panhandle filed a general rate proceeding under Section 4 of the related obligationsNatural Gas Act. The Natural Gas Act Section 5 and ETP no longer provides contingent residual supportSection 4 proceedings were consolidated by the Order dated October 1, 2019. A hearing in the combined proceedings is scheduled for any AmeriGas notes.August 2020, with an initial decision expected in early 2021.
GuaranteeBy Order issued February 19, 2019, the FERC initiated a review of Sunoco LP Notes
In connection with previous transactions whereby Retail Holdings contributed assetsSouthwest Gas’ existing rates pursuant to Sunoco LP, Retail Holdings provided a limited contingent guarantee of collection, but not of payment, to Sunoco LP with respect to (i) $800 million principal amount of 6.375% senior notes due 2023 issued by Sunoco LP, (ii) $800 million principal amount of 6.25% senior notes due 2021 issued by Sunoco LP and (iii) $2.035 billion aggregate principal for Sunoco LP’s term loan due 2019. In December 2016, Retail Holdings contributed its interests in Sunoco LP, along with the assignmentSection 5 of the guaranteeNatural Gas Act to determine whether the rates currently charged by Southwest Gas are just and reasonable and set the matter for hearing. Southwest Gas filed a cost and revenue study on May 6, 2019. On July 10, 2019, Southwest Gas filed an Offer of Sunoco LP’s senior notes,Settlement in this Section 5 proceeding, which settlement was supported or not opposed by Commission Trial Staff and all active parties. By order dated October 29, 2019, the FERC approved the settlement as filed, and there is not a material impact on revenue.
In addition, on November 30, 2018, Sea Robin filed a rate case pursuant to its subsidiary, ETC M-A Acquisition LLC (“ETC M-A”).
On January 23, 2018, Sunoco LP redeemed the previously guaranteed senior notes and issued the following notes for which ETC M-A has also guaranteed collection with respect to the payment of principal amounts:
$1.00 billion aggregate principal amount of 4.875%, senior notes due 2023;
$800 million aggregate principal amount of 5.50% senior notes due 2026; and
$400 million aggregate principal amount of 5.875% senior notes due 2028.
Under the guarantee of collection, ETC M-A would have the obligation to pay the principal of each series of notes once all remedies, including in the context of bankruptcy proceedings, have first been fully exhausted against Sunoco LP with respect to such payment obligation, and holdersSection 4 of the notes are still owed amountsNatural Gas Act. On July 22, 2019, Sea Robin filed an Offer of Settlement in respect of the principal of such notes. ETC M-A willthis Section 4 proceeding, which settlement was supported or not otherwise be subject to the covenants of the indenture governing the notes.
FERC Audit
In March 2016,opposed by Commission Trial Staff and all active parties. By order dated October 17, 2019, the FERC commenced an audit of Trunkline forapproved the period from January 1, 2013 to present to evaluate Trunkline’s compliance with the requirements of its FERC gas tariff, the accounting regulations of the Uniform System of Accountssettlement as prescribed by the FERC,filed, and the FERC’s annual reporting requirements. The auditthere is ongoing.not a material impact on revenue.
Commitments
In the normal course of business, ETPETO purchases, processes and sells natural gas pursuant to long-term contracts and enters into long-term transportation and storage agreements. Such contracts contain terms that are customary in the industry. ETP
ETO believes that the terms of these agreements are commercially reasonable and will not have a material adverse effect on its financial position or results of operations.
ETP’sOur joint venture agreements require that itwe funds itsour proportionate share of capital contributions to its unconsolidated affiliates. Such contributions will depend upon ETP’sour unconsolidated affiliates’ capital requirements, such as for funding capital projects or repayment of long-term obligations.
We have certain non-cancelable leases for property and equipment,rights-of-way (“ROW”) commitments, which require fixed monthly rental payments and either expire upon our chosen abandonment or at various dates through 2034.in the future. The table below reflects rentalROW expense under these operating leases included in operating expenses in the accompanying statements of operations,operations:
|
| | | | | | | | | | | |
| | Years Ended December 31, |
| | 2019 | | 2018 | | 2017 |
| ROW expense | $ | 45 |
| | $ | 46 |
| | $ | 46 |
|
PES Refinery Fire and Bankruptcy
We own an approximately 7.4% non-operating interest in PES, which include contingent rentals,owns a refinery in Philadelphia. In addition, the Partnership provides logistics services to PES under commercial contracts and rental expense recoveredSunoco LP has historically purchased refined products from PES. In June 2019, an explosion and fire occurred at the refinery complex.
On July 21, 2019, PES Holdings, LLC and seven of its subsidiaries (collectively, the "Debtors") filed voluntary petitions in the United States Bankruptcy Court for the District of Delaware seeking relief under the provisions of Chapter 11 of the United States Bankruptcy Code, as a result of the explosion and fire at the Philadelphia refinery complex. The Debtors have also defaulted on a $75 million note payable to a subsidiary of the Partnership. The Partnership has not recorded a valuation allowance related to the note receivable as of December 31, 2019, because management is not yet able to determine the collectability of the note in bankruptcy.
In addition, the Partnership’s subsidiaries retained certain environmental remediation liabilities when the refinery was sold to PES. As of December 31, 2019, the Partnership has funded these environmental remediation liabilities through related sublease rental income:
|
| | | | | | | | | | | | |
| | | Years Ended December 31, |
| | | 2017 | | 2016 | | 2015 |
Rental expense(1) | | $ | 90 |
| | $ | 81 |
| | $ | 176 |
|
| Less: Sublease rental income | | — |
| | (1 | ) | | (16 | ) |
| Rental expense, net | | $ | 90 |
| | $ | 80 |
| | $ | 160 |
|
| |
(1)
| Includes contingent rentals totaling $26 million for the year ended December 31, 2015. |
Future minimum lease commitmentsits wholly-owned captive insurance company, based upon actuarially determined estimates for such leases are:costs, and these liabilities are included in the total environmental liabilities discussed below under “Environmental Remediation.” In the event that the PES property is sold in connection with the bankruptcy proceeding, it may be necessary for the Partnership to record additional environmental
|
| | | |
| Years Ending December 31: | |
| 2018 | $ | 39 |
|
| 2019 | 36 |
|
| 2020 | 37 |
|
| 2021 | 30 |
|
| 2022 | 23 |
|
| Thereafter | 92 |
|
| Future minimum lease commitments | 257 |
|
| Less: Sublease rental income | (8 | ) |
| Net future minimum lease commitments | $ | 249 |
|
remediation liabilities in the future depending upon the proposed use of such property by the buyer of the property; however, management is not currently able to estimate such additional liabilities.
PES has rejected certain of the Partnership’s commercial contracts pursuant to Section 365 of the Bankruptcy Code; however, the impact of the bankruptcy on the Partnership’s commercial contracts and related revenue loss (temporary or permanent) is unknown at this time. In addition, Sunoco LP has been successful at acquiring alternative supplies to replace fuel volume lost from PES and does not anticipate any material impact to its business going forward.
Litigation and Contingencies
We may, from time to time, be involved in litigation and claims arising out of our operations in the normal course of business. Natural gas and crude oil are flammable and combustible. Serious personal injury and significant property damage can arise in connection with their transportation, storage or use. In the ordinary course of business, we are sometimes threatened with or named as a defendant in various lawsuits seeking actual and punitive damages for product liability, personal injury and property damage. We maintain liability insurance with insurers in amounts and with coverage and deductibles management believes are reasonable and prudent, and which are generally accepted in the industry. However, there can be no assurance that the levels of insurance protection currently in effect will continue to be available at reasonable prices or that such levels will remain adequate to protect us from material expenses related to product liability, personal injury or property damage in the future.
Dakota Access Pipeline
On July 25,27, 2016, the United States Army Corps of Engineers (“USACE”) issued permits to Dakota Access consistent with environmental and historic preservation statutes for the pipeline to make two crossings of the Missouri River in North Dakota, including a crossing of the Missouri River at Lake Oahe. After significant delay, the USACE also issued easements to allow the pipeline to cross land owned by the USACE adjacent to the Missouri River in two locations. Also in July, the Standing Rock Sioux Tribe (“SRST”) filed a lawsuit in the United States District Court for the District of Columbia against the USACE that challenged the legality of thechallenging permits issued for the construction of the Dakota Access pipeline across those waterways and claimed violations of the National Historic Preservation Act (“NHPA”). The SRST also sought a preliminary injunction to rescind the USACE permits while the case is pending. Dakota Access intervened in the case. The SRST soon added a
request for an emergency temporary restraining order (“TRO”) to stop construction on the pipeline project. On September 9, 2016, the Court denied SRST’s motion for a preliminary injunction, rendering the TRO request moot.
After the September 9, 2016 ruling, the Department of the Army, the DOJ, and the Department of the Interior released a joint statement that the USACE would not grant the easement for the land adjacent to Lake Oahe until the Department of the Army completed a review to determine whether it was necessary to reconsider the USACE’s decision under various federal statutes relevant to the pipeline approval.
The SRST appealed the denial of the preliminary injunction toby the United States CourtArmy Corps of Appeals forEngineers (“USACE”) permitting Dakota Access, LLC (“Dakota Access”) to cross the D.C. Circuit and filed an emergency motion in the United States District Court for an injunction pending the appeal, which was denied. The D.C. Circuit then denied the SRST’s application for an injunction pending appeal and later dismissed SRST’s appeal of the order denying the preliminary injunction motion. The SRST filed an amended complaint and added claims based on treaties between the tribes and the United States and statutes governing the use of government property.
In December 2016, the Department of the Army announced that, although its prior actions complied with the law, it intended to conduct further environmental review of the crossingMissouri River at Lake Oahe. In February 2017,Oahe in responseNorth Dakota. The case was subsequently amended to a presidential memorandum, the Department of the Army decided that no further environmental review was necessary and deliveredchallenge an easement to Dakota Accessissued by the USACE allowing the pipeline to cross Lake Oahe. Almost immediately,land owned by the USACE adjacent to the Missouri River. Dakota Access and the Cheyenne River Sioux Tribe (“CRST”), which had intervened in the lawsuit in August 2016, moved for a preliminary injunction and TRO to block operation of the pipeline. These motions raised, for the first time, claims based on the religious rights of the Tribe. The District Court denied the TRO and preliminary injunction, and the CRST appealed and requested an injunction pending appeal in the district court and the D.C. Circuit. Both courts denied the CRST’s request for an injunction pending appeal. Shortly thereafter, at CRST’s request, the D.C. Circuit dismissed CRST’s appeal.
The SRST and the CRST amended their complaints to incorporate religious freedom and other claims. In addition, intervened. Separate lawsuits filed by the Oglala and Yankton Sioux tribes (collectively, “Tribes”) have filed related lawsuits to prevent construction of the Dakota Access pipeline project. These lawsuits have been consolidated into the action initiated by the SRST. Several individual members of the Tribes have also intervened in the lawsuit asserting claims that overlap with those brought by the four Tribes.
On June 14, 2017, the Court ruled on SRST’s and CRST’s motions for partial summary judgment and the USACE’s cross-motions for partial summary judgment. The Court rejected the majority of the Tribes’ assertions and granted summary judgment on most claims in favor of the USACE and Dakota Access. In particular, the Court concluded that the USACE had not violated any trust duties owed to the Tribes and had generally complied with its obligations under the Clean Water Act, the Rivers and Harbors Act, the Mineral Leasing Act, the National Environmental Policy ActTribe (“NEPA”OST”) and other related statutes; however, the Court remanded to the USACE three discrete issues for further analysis and explanation of its prior determinations under certain of these statutes. The Court ordered briefing to determine whether the pipeline should remain in operation during the pendency of the USACE’s review process or whether to vacate the existing permits. The USACE and Dakota Access opposed any shutdown of operations of the pipeline during this review process. On October 11, 2017, the Court issued an order allowing the pipeline to remain in operation during the pendency of the USACE’s review process. In early October 2017, USACE advised the Court that it expects to complete the additional analysis and explanation of its prior determinations requested by the Court by April 2018.
On December 4, 2017, the Court imposed three conditions on continued operation of the pipeline during the remand process. First, Dakota Access must retain an independent auditor to review its compliance with the conditions and regulations governing its easements and to assess integrity threats to the pipeline. The auditor’s report is required to be filed with the Court by April 1, 2018. Second, the Court has directed Dakota Access to continue its work with the Tribes and the USACE to revise and finalize its emergency spill response planning for the section of the pipeline crossing Lake Oahe. Dakota Access is required to file the revised plan with the Court by April 1, 2018. And third, the Court has directed Dakota Access to submit bi-monthly reports during the remand period disclosing certain inspection and maintenance information related to the segment of the pipeline running between the valves on either side of the Lake Oahe crossing. The first report was filed with the court on December 29, 2017.
In November 2017, the Yankton Sioux Tribe (“YST”), moved were consolidated with this action and several individual tribal members intervened (collectively with SRST and CRST, the “Tribes”). Plaintiffs and Defendants filed cross motions for partial summary judgment, asserting claims similar to those already litigated and decided by the Court in its June 14, 2017 decision on similar motions by CRST and SRST. YST argues that the USACE and Fish and Wildlife Service violated NEPA, the Mineral Leasing Act, the Rivers and Harbors Act, and YST’s treaty and trust rights when the government granted the permits and easements necessary for the pipeline. Briefing on YST’s motion is ongoing.parties await a ruling.
While we believe that the pending lawsuits are unlikely to halt or suspend the operation of the pipeline, we cannot assure this outcome. WeEnergy Transfer cannot determine when or how these lawsuits will be resolved or the impact they may have on the Dakota Access project.
Mont Belvieu Incident
On June 26, 2016, a hydrocarbon storage well located on another operator’s facility adjacent to Lone Star NGL Mont Belvieu’s (“Lone Star”) facilities in Mont Belvieu, Texas, experienced an over-pressurization resulting in a subsurface release. The subsurface release caused a fire at Lone Star’s South Terminal and damage to Lone Star’s storage well operations at its South and North Terminals. Normal operations have resumed at the facilities with the exception of one of Lone Star’s storage wells.wells, however, Lone Star is still quantifying the extent of its incurred and ongoing damages and has orobtained, and will be seekingcontinue to seek, reimbursement for these losses.
MTBE Litigation
ETC Sunoco Inc. and/or Sunoco, Inc. (R&M), (now known asHoldings LLC and Sunoco (R&M), LLC) along with other members of the petroleum industry,LLC (collectively, “Sunoco”) are defendants in lawsuits alleging MTBE contamination of groundwater. The plaintiffs, state-level governmental entities, assert product liability, claims and additional claims including nuisance, trespass, negligence, violation of environmental laws, and/or deceptive business practices.practices claims. The plaintiffs seek to recover compensatory damages, and in some cases also seek natural resource damages, injunctive relief, punitive damages, and attorneys’ fees.
As of December 31, 2017,2019, Sunoco Inc. is a defendant in sevenfive cases, including one case each initiated by the States of Maryland New Jersey, Vermont,and Rhode Island, one by the Commonwealth of Pennsylvania and two by the Commonwealth of Puerto Rico. The more recent Puerto Rico action is a companion case alleging damages for additional sites beyond those at issue in the initial Puerto Rico action. The actions brought by the State of Maryland and Commonwealth of Pennsylvania have also named as defendants Energy Transfer Partners, L.P.,ETO, ETP Holdco Corporation, and Sunoco Partners Marketing & Terminals L.P. Four of these cases are pending in a multidistrict litigation proceeding in a New York federal court; one is pending in federal court in Rhode Island, one is pending in state court in Vermont, and one is pending in state court in Maryland.(“SPMT”).
Sunoco, Inc. and Sunoco, Inc. (R&M) have reached a settlement with the State of New Jersey. The Court approved the Judicial Consent Order on December 5, 2017. Dismissal of the case against Sunoco, Inc. and Sunoco, Inc. (R&M) is expected shortly. The Maryland complaint was filed in December 2017 but was not served until January 2018.
It is reasonably possible that a loss may be realized in the remaining cases; however, we are unable to estimate the possible loss or range of loss in excess of amounts accrued. An adverse determination with respect to one or more of the MTBE cases could have a significant impact on results of operations during the period in which any such adverse determination occurs,
but such an adverse determination likely would not have a material adverse effect on the Partnership’s consolidated financial position.
RegencyEnvironmental Remediation
We accrue environmental remediation costs for work at identified sites where an assessment has indicated that cleanup costs are probable and reasonably estimable. Such accruals are undiscounted and are based on currently available information, estimated timing of remedial actions and related inflation assumptions, existing technology and presently enacted laws and regulations. If a range of probable environmental cleanup costs exists for an identified site, the minimum of the range is accrued unless some other point in the range is more likely in which case the most likely amount in the range is accrued.
Fair Value of Financial Instruments
The carrying amounts of cash and cash equivalents, accounts receivable and accounts payable approximate their fair value.
Based on the estimated borrowing rates currently available to us and our subsidiaries for loans with similar terms and average maturities, the aggregate fair value and carrying amount of our debt obligations as of December 31, 2019 was $54.08 billion and$50.35 billion , respectively. As of December 31, 2018, the aggregate fair value and carrying amount of our debt obligations was $39.54 billion and $40.51 billion, respectively. The fair value of our consolidated debt obligations is a Level 2 valuation based on the observable inputs used for similar liabilities.
We have commodity derivatives, interest rate derivatives and embedded derivatives in our preferred units that are accounted for as assets and liabilities at fair value in our consolidated balance sheets. We determine the fair value of our assets and liabilities subject to fair value measurement by using the highest possible “level” of inputs. Level 1 inputs are observable quotes in an active market for identical assets and liabilities. We consider the valuation of marketable securities and commodity derivatives transacted through a clearing broker with a published price from the appropriate exchange as a Level 1 valuation. Level 2 inputs are inputs observable for similar assets and liabilities. We consider OTC commodity derivatives entered into directly with third parties as a Level 2 valuation since the values of these derivatives are quoted on an exchange for similar
transactions. Additionally, we consider our options transacted through our clearing broker as having Level 2 inputs due to the level of activity of these contracts on the exchange in which they trade. We consider the valuation of our interest rate derivatives as Level 2 as the primary input, the LIBOR curve, is based on quotes from an active exchange of Eurodollar futures for the same period as the future interest swap settlements. Level 3 inputs are unobservable. During the year ended December 31, 2019, 0 transfers were made between any levels within the fair value hierarchy.
The following tables summarize the fair value of our financial assets and liabilities measured and recorded at fair value on a recurring basis as of December 31, 2019 and 2018 based on inputs used to derive their fair values:
|
| | | | | | | | | | | |
| | Fair Value Total | | Fair Value Measurements at December 31, 2019 |
| | Level 1 | | Level 2 |
| Assets: | | | | | |
| Commodity derivatives: | | | | | |
| Natural Gas: | | | | | |
| Basis Swaps IFERC/NYMEX | $ | 17 |
| | $ | 17 |
| | $ | — |
|
| Swing Swaps IFERC | 1 |
| | — |
| | 1 |
|
| Fixed Swaps/Futures | 65 |
| | 65 |
| | — |
|
| Forward Physical Contracts | 3 |
| | — |
| | 3 |
|
| Power: | | | | | |
| Forwards | 11 |
| | — |
| | 11 |
|
| Futures | 4 |
| | 4 |
| | — |
|
| Options – Puts | 1 |
| | 1 |
| | — |
|
| Options – Calls | 1 |
| | 1 |
| | — |
|
| NGLs – Forwards/Swaps | 260 |
| | 260 |
| | — |
|
| Refined Products – Futures | 8 |
| | 8 |
| | — |
|
| Crude – Forwards/Swaps | 13 |
| | 13 |
| | — |
|
| Total commodity derivatives | 384 |
| | 369 |
| | 15 |
|
| Other non-current assets | 31 |
| | 20 |
| | 11 |
|
| Total assets | $ | 415 |
| | $ | 389 |
| | $ | 26 |
|
| Liabilities: | | | | | |
| Interest rate derivatives | $ | (399 | ) | | $ | — |
| | $ | (399 | ) |
| Commodity derivatives: | | | | | |
| Natural Gas: | | | | | |
| Basis Swaps IFERC/NYMEX | (49 | ) | | (49 | ) | | — |
|
| Swing Swaps IFERC | (1 | ) | | — |
| | (1 | ) |
| Fixed Swaps/Futures | (43 | ) | | (43 | ) | | — |
|
| Power: | | | | | |
| Forwards | (5 | ) | | — |
| | (5 | ) |
| Futures | (3 | ) | | (3 | ) | | — |
|
| NGLs – Forwards/Swaps | (278 | ) | | (278 | ) | | — |
|
| Refined Products – Futures | (10 | ) | | (10 | ) | | — |
|
| Total commodity derivatives | (389 | ) | | (383 | ) | | (6 | ) |
| Total liabilities | $ | (788 | ) | | $ | (383 | ) | | $ | (405 | ) |
|
| | | | | | | | | | | |
| | Fair Value Total | | Fair Value Measurements at December 31, 2018 |
| | Level 1 | | Level 2 |
| Assets: | | | | | |
| Commodity derivatives: | | | | | |
| Natural Gas: | | | | | |
| Basis Swaps IFERC/NYMEX | $ | 42 |
| | $ | 42 |
| | $ | — |
|
| Swing Swaps IFERC | 52 |
| | 8 |
| | 44 |
|
| Fixed Swaps/Futures | 97 |
| | 97 |
| | — |
|
| Forward Physical Contracts | 20 |
| | — |
| | 20 |
|
| Power: | | | | | |
| Power – Forwards | 48 |
| | — |
| | 48 |
|
| Futures | 1 |
| | 1 |
| | — |
|
| Options – Calls | 1 |
| | 1 |
| | — |
|
| NGLs – Forwards/Swaps | 291 |
| | 291 |
| | — |
|
| Refined Products – Futures | 7 |
| | 7 |
| | — |
|
| Crude - Forwards/Swaps | 1 |
| | 1 |
| | — |
|
| Total commodity derivatives | 560 |
| | 448 |
| | 112 |
|
| Other non-current assets | 26 |
| | 17 |
| | 9 |
|
| Total assets | $ | 586 |
| | $ | 465 |
| | $ | 121 |
|
| Liabilities: | | | | | |
| Interest rate derivatives | $ | (163 | ) | | $ | — |
| | $ | (163 | ) |
| Commodity derivatives: | | | | | |
| Natural Gas: | | | | | |
| Basis Swaps IFERC/NYMEX | (91 | ) | | (91 | ) | | — |
|
| Swing Swaps IFERC | (40 | ) | | — |
| | (40 | ) |
| Fixed Swaps/Futures | (88 | ) | | (88 | ) | | — |
|
| Forward Physical Contracts | (21 | ) | | — |
| | (21 | ) |
| Power: | | | | | |
| Forwards | (42 | ) | | — |
| | (42 | ) |
| Futures | (1 | ) | | (1 | ) | | — |
|
| NGLs – Forwards/Swaps | (224 | ) | | (224 | ) | | — |
|
| Refined Products – Futures | (15 | ) | | (15 | ) | | — |
|
| Crude - Forwards/Swaps | (61 | ) | | (61 | ) | | — |
|
| Total commodity derivatives | (583 | ) | | (480 | ) | | (103 | ) |
| Total liabilities | $ | (746 | ) | | $ | (480 | ) | | $ | (266 | ) |
Contributions in Aid of Construction Costs
On certain of our capital projects, third parties are obligated to reimburse us for all or a portion of project expenditures. The majority of such arrangements are associated with pipeline construction and production well tie-ins. Contributions in aid of construction costs (“CIAC”) are netted against our project costs as they are received, and any CIAC which exceeds our total project costs, is recognized as other income in the period in which it is realized.
Shipping and Handling Costs
Shipping and handling costs are included in cost of products sold, except for shipping and handling costs related to fuel consumed for compression and treating which are included in operating expenses.
Costs and Expenses
Cost of products sold include actual cost of fuel sold, adjusted for the effects of our hedging and other commodity derivative activities, and the cost of appliances, parts and fittings. Operating expenses include all costs incurred to provide products to customers, including compensation for operations personnel, insurance costs, vehicle maintenance, advertising costs, purchasing costs and plant operations. Selling, general and administrative expenses include all partnership related expenses and compensation for executive, partnership, and administrative personnel.
We record the collection of taxes to be remitted to government authorities on a net basis except for our all other segment in which consumer excise taxes on sales of refined products and merchandise are included in both revenues and costs and expenses in the consolidated statements of operations, with no effect on net income. For the years ended December 31, 2019, 2018 and 2017, excise taxes collected by Sunoco LP were $386 million, $370 million and $234 million, respectively.
Issuances of Subsidiary Units
We record changes in our ownership interest of our subsidiaries as equity transactions, with no gain or loss recognized in consolidated net income or comprehensive income. For example, upon our subsidiary’s issuance of common units in a public offering, we record any difference between the amount of consideration received or paid and the amount by which the noncontrolling interests are adjusted as a change in partners’ capital.
Income Taxes
ETO is a publicly traded limited partnership and is not taxable for federal and most state income tax purposes. As a result, our earnings or losses, to the extent not included in a taxable subsidiary, for federal and most state purposes are included in the tax returns of the individual partners. Net earnings for financial statement purposes may differ significantly from taxable income reportable to our preferred unitholders as a result of differences between the tax basis and financial basis of assets and liabilities, differences between the tax accounting and financial accounting treatment of certain items, and due to allocation requirements related to taxable income under our Fifth Amended and Restated Agreement of Limited Partnership (the “Partnership Agreement”).
As a publicly traded limited partnership, we are subject to a statutory requirement that our “qualifying income” (as defined by the Internal Revenue Code, related Treasury Regulations, and Internal Revenue Service (“IRS”) pronouncements) exceed 90% of our total gross income, determined on a calendar year basis. If our qualifying income does not meet this statutory requirement, ETO would be taxed as a corporation for federal and state income tax purposes. For the years ended December 31, 2019, 2018 and 2017, our qualifying income met the statutory requirement.
The Partnership conducts certain activities through corporate subsidiaries which are subject to federal, state and local income taxes. These corporate subsidiaries include ETP Holdco, Inland Corporation, Sunoco Property Company LLC and Aloha. The Partnership and its corporate subsidiaries account for income taxes under the asset and liability method.
Under this method, deferred tax assets and liabilities are recognized for the estimated future tax consequences attributable to differences between the financial statement carrying amounts of existing assets and liabilities and their respective tax basis. Deferred tax assets and liabilities are measured using enacted tax rates in effect for the year in which those temporary differences are expected to be recovered or settled. The effect on deferred tax assets and liabilities of a change in tax rate is recognized in earnings in the period that includes the enactment date. Valuation allowances are established when necessary to reduce deferred tax assets to the amounts more likely than not to be realized.
The determination of the provision for income taxes requires significant judgment, use of estimates, and the interpretation and application of complex tax laws. Significant judgment is required in assessing the timing and amounts of deductible and taxable items and the probability of sustaining uncertain tax positions. The benefits of uncertain tax positions are recorded in our financial statements only after determining a more-likely-than-not probability that the uncertain tax positions will withstand challenge, if any, from taxing authorities. When facts and circumstances change, we reassess these probabilities and record any changes through the provision for income taxes.
Accounting for Derivative Instruments and Hedging Activities
For qualifying hedges, we formally document, designate and assess the effectiveness of transactions that receive hedge accounting treatment and the gains and losses offset related results on the hedged item in the statement of operations. The market prices used to value our financial derivatives and related transactions have been determined using independent third-party prices, readily available market information, broker quotes and appropriate valuation techniques.
At inception of a hedge, we formally document the relationship between the hedging instrument and the hedged item, the risk management objectives, and the methods used for assessing and testing effectiveness and how any ineffectiveness will be measured and recorded. We also assess, both at the inception of the hedge and on a quarterly basis, whether the derivatives that are used in our hedging transactions are highly effective in offsetting changes in cash flows. If we determine that a derivative is no longer highly effective as a hedge, we discontinue hedge accounting prospectively by including changes in the fair value of the derivative in net income for the period.
If we designate a commodity hedging relationship as a fair value hedge, we record the changes in fair value of the hedged asset or liability in cost of products sold in our consolidated statements of operations. This amount is offset by the changes in fair value of the related hedging instrument. Any ineffective portion or amount excluded from the assessment of hedge ineffectiveness is also included in the cost of products sold in the consolidated statements of operations.
Cash flows from derivatives accounted for as cash flow hedges are reported as cash flows from operating activities, in the same category as the cash flows from the items being hedged.
If we designate a derivative financial instrument as a cash flow hedge and it qualifies for hedge accounting, the change in the fair value is deferred in AOCI until the underlying hedged transaction occurs. Any ineffective portion of a cash flow hedge’s change in fair value is recognized each period in earnings. Gains and losses deferred in AOCI related to cash flow hedges remain in AOCI until the underlying physical transaction occurs, unless it is probable that the forecasted transaction will not occur by the end of the originally specified time period or within an additional two-month period of time thereafter. For financial derivative instruments that do not qualify for hedge accounting, the change in fair value is recorded in cost of products sold in the consolidated statements of operations.
We manage a portion of our interest rate exposures by utilizing interest rate swaps and similar instruments. Certain of our interest rate derivatives are accounted for as either cash flow hedges or fair value hedges. For interest rate derivatives accounted for as either cash flow or fair value hedges, we report realized gains and losses and ineffectiveness portions of those hedges in interest expense. For interest rate derivatives not designated as hedges for accounting purposes, we report realized and unrealized gains and losses on those derivatives in “Gains (losses) on interest rate derivatives” in the consolidated statements of operations.
In August 2017, the FASB issued ASU No. 2017-12, Derivatives and Hedging (Topic 815): Targeted Improvements to Accounting for Hedging Activities. The amendments in this update improve the financial reporting of hedging relationships to better portray the economic results of an entity’s risk management activities in its financial statements. In addition, the amendments in this update make certain targeted improvements to simplify the application of the hedge accounting guidance in current GAAP. The Partnership adopted the new rules in the first quarter of 2019, and the adoption of the new accounting rules did not have a material impact on the consolidated financial statements and related disclosures.
Non-Cash Compensation
For awards of restricted units, we recognize compensation expense over the vesting period based on the grant-date fair value, which is determined based on the market price of the underlying common units on the grant date. For awards of cash restricted units, we remeasure the fair value of the award at the end of each reporting period based on the market price of the underlying common units as of the reporting date, and the fair value is recorded in other non-current liabilities on our consolidated balance sheets.
Pensions and Other Postretirement Benefit Plans
The Partnership recognizes the overfunded or underfunded status of defined benefit pension and other postretirement plans, measured as the difference between the fair value of the plan assets and the benefit obligation (the projected benefit obligation for pension plans and the accumulated postretirement benefit obligation for other postretirement plans). Each overfunded plan is recognized as an asset and each underfunded plan is recognized as a liability. Changes in the funded status of the plan are recorded in the year in which the change occurs within AOCI in equity or, for entities applying regulatory accounting, as a regulatory asset or regulatory liability.
Allocation of Income
For purposes of maintaining partner capital accounts, the Partnership Agreement specifies that items of income and loss shall generally be allocated among the partners in accordance with their percentage interests. The capital account provisions of our Partnership Agreement incorporate principles established for United States Federal income tax purposes and may not be comparable to the partners’ capital balances reflected under GAAP in our consolidated financial statements. Subsequent to
the Energy Transfer Merger, Litigationour general partner owns a non-economic interest in us and, therefore, our net income for partners’ capital and statement of operations presentation purposes is allocated entirely to the Limited Partners.
| |
| 3. | ACQUISITIONS, DIVESTITURES AND RELATED TRANSACTIONS: |
2019 and 2020 Transactions
ET Contribution of SemGroup Assets to ETO
On December 5, 2019, ET completed the acquisition of SemGroup. During the first quarter of 2020, ET contributed certain SemGroup assets to ETO through sale and contribution transactions. The Partnership and SemGroup are under common control by ET subsequent to ET’s acquisition of SemGroup; therefore, we will account for these transactions as reorganizations of entities under common control. Accordingly, beginning with the quarter ending March 31, 2020, the Partnership’s consolidated financial statements will be retrospectively adjusted to reflect the consolidation of the contributed SemGroup businesses beginning December 5, 2019 (the date ET acquired SemGroup).
The following table represents the preliminary fair value, as of December 5, 2019, of the SemGroup assets and liabilities transferred from ET to ETO:
|
| | | |
| | At December 5, 2019 |
| Total current assets | $ | 548 |
|
| Property, plant and equipment | 2,544 |
|
| Other non-current assets | 574 |
|
| Goodwill | 230 |
|
| Intangible assets | 280 |
|
| Total assets | 4,176 |
|
| | |
| Total current liabilities | 480 |
|
| Long-term debt, less current maturities | 812 |
|
| Other non-current liabilities | 109 |
|
| Total liabilities | 1,401 |
|
| | |
| Noncontrolling interest | 335 |
|
| | |
| Partners’ capital | 2,440 |
|
| Total liabilities and partners’ capital | $ | 4,176 |
|
2018 Transactions
ET Contribution of Assets to ETO
Immediately prior to the closing of the Energy Transfer Merger discussed in Note 1, ET contributed the following to ETO:
| |
| • | 2,263,158 common units representing limited partner interests in Sunoco LP to ETO in exchange for 2,874,275 ETO common units; |
| |
| • | 100 percent of the limited liability company interests in Sunoco GP LLC, the sole general partner of Sunoco LP, and all of the IDRs in Sunoco LP, to ETO in exchange for 42,812,389 ETO common units; |
| |
| • | 12,466,912 common units representing limited partner interests in USAC and 100 percent of the limited liability company interests in USA Compression GP, LLC, the general partner of USAC, to ETO in exchange for 16,134,903 ETO common units; and |
| |
| • | a 100 percent limited liability company interest in Lake Charles LNG and a 60 percent limited liability company interest in each of Energy Transfer LNG Export, LLC, ET Crude Oil Terminals, LLC and ETC Illinois LLC to ETO in exchange for 37,557,815 ETO common units. |
USAC Acquisition
On April 2, 2018, ET acquired a controlling interest in USAC, a publicly traded partnership that provides compression services in the United States. Specifically the Partnership acquired (i) all of the outstanding limited liability company interests in USA Compression GP, LLC (“USAC GP”), the general partner of USAC, and (ii) 12,466,912 USAC common units representing limited partner interests in USAC for cash consideration equal to $250 million (the “USAC Transaction”). Concurrently, USAC cancelled its IDRs and converted its economic general partner interest into a non-economic general partner interest in exchange for the issuance of 8,000,000 USAC common units to USAC GP.
Concurrent with these transactions, ETO contributed to USAC all of the issued and outstanding membership interests of CDM for aggregate consideration of approximately $1.7 billion, consisting of (i) 19,191,351 USAC common units, (ii) 6,397,965 units of a newly authorized and established class of units representing limited partner interests in USAC (“USAC Class B Units”) and (iii) $1.23 billion in cash, including customary closing adjustments (the “CDM Contribution”). The USAC Class B Units are a new class of partnership interests of USAC that have substantially all of the rights and obligations of a USAC common unit, except the USAC Class B Units will not participate in distributions for the first four quarters following the closing date of April 2, 2018. Each USAC Class B Unit will automatically convert into one USAC common unit on the first business day following the record date attributable to the quarter ending June 30, 2019.
As noted above, ET contributed its interests in USAC to ETO in October 2018. ET’s contribution of its interests in USAC was a transaction between entities under common control; therefore, the Partnership’s consolidated financial statements reflect USAC on a consolidated basis beginning April 2, 2018, the date that ET obtained control of USAC. The Partnership had previously deconsolidated CDM upon its contribution to USAC on April 2, 2018; however, due to the retrospective consolidation of USAC as of that date, CDM is reflected as a consolidated subsidiary for all periods presented herein.
Summary of Assets Acquired and Liabilities Assumed
The USAC Transaction was recorded using the acquisition method of accounting, which requires, among other things, that assets acquired and liabilities assumed be recognized on the balance sheet at their fair values as of the acquisition date.
The total purchase price was allocated as follows:
|
| | | |
| | At April 2, 2018 |
| Total current assets | $ | 786 |
|
| Property, plant and equipment | 1,332 |
|
| Other non-current assets | 15 |
|
Goodwill(1) | 366 |
|
| Intangible assets | 222 |
|
| Total assets | 2,721 |
|
| | |
| Total current liabilities | 110 |
|
| Long-term debt, less current maturities | 1,527 |
|
| Other non-current liabilities | 2 |
|
| Total liabilities | 1,639 |
|
| | |
| Noncontrolling interest | 832 |
|
| | |
| Total consideration | 250 |
|
Cash received(2) | 711 |
|
Total consideration, net of cash received(2) | $ | (461 | ) |
| |
(1) | None of the goodwill is expected to be deductible for tax purposes. Goodwill recognized from the business combination primarily relates to the value attributed to additional growth opportunities, synergies and operating leverage within USAC’s operations. |
| |
(2) | Cash received represents cash and cash equivalents held by USAC as of the acquisition date. |
The fair values of the assets acquired and liabilities assumed were determined using various valuation techniques, including the income and market approaches.
Sunoco LP Retail Store Divestment
On January 23, 2018, Sunoco LP completed the disposition of assets pursuant to the purchase agreement with 7-Eleven, Inc. (the “7-Eleven Transaction”). As a result of the 7-Eleven Transaction, previously eliminated wholesale motor fuel sales to Sunoco LP’s retail locations are reported as wholesale motor fuel sales to third parties. Also, the related accounts receivable from such sales are no longer eliminated from the Partnership’s consolidated balance sheets and are reported as accounts receivable.
In connection with the 7-Eleven Transaction, Sunoco LP entered into a Distributor Motor Fuel Agreement dated as of January 23, 2018 (“Supply Agreement”), with 7-Eleven and SEI Fuel (collectively, “Distributor”). The Supply Agreement consists of a 15-year take-or-pay fuel supply arrangement under which Sunoco LP has agreed to supply approximately 2.0 billion gallons of fuel annually plus additional aggregate growth volumes of up to 500 million gallons to be added incrementally over the first four years. For the period from January 1, 2018 through January 22, 2018 and the years ended December 31, 2017, Sunoco LP recorded sales to the sites that were subsequently sold to 7-Eleven of $199 million and $3.2 billion, respectively, which were eliminated in consolidation. Sunoco LP received payments on trade receivables of $3.7 billion and $3.4 billion, respectively, from 7-Eleven for the years ended December 31, 2019 and December 31, 2018 subsequent to the closing of the sale.
The Partnership has concluded that it meets the accounting requirements for reporting the financial position, results of operations and cash flows of Sunoco LP’s retail divestment as discontinued operations.
There were no results of operations associated with discontinued operations for the year ended December 31, 2019. The results of operations associated with discontinued operations for the years ended December 31, 2018 and 2017 are presented in the following table:
|
| | | | | | | |
| | Years Ended December 31, |
| | 2018 | | 2017 |
| REVENUES | $ | 349 |
| | $ | 6,964 |
|
| | | | |
| COSTS AND EXPENSES | | | |
| Cost of products sold | 305 |
| | 5,806 |
|
| Operating expenses | 61 |
| | 763 |
|
| Depreciation, depletion and amortization | — |
| | 34 |
|
| Selling, general and administrative | 7 |
| | 168 |
|
| Impairment losses | — |
| | 285 |
|
| Total costs and expenses | 373 |
| | 7,056 |
|
| OPERATING LOSS | (24 | ) | | (92 | ) |
| OTHER EXPENSE | | | |
| Interest expense, net | 2 |
| | 36 |
|
| Loss on extinguishment of debt | 20 |
| | — |
|
| Other, net | 61 |
| | 1 |
|
| LOSS FROM DISCONTINUED OPERATIONS BEFORE INCOME TAX EXPENSE | (107 | ) | | (129 | ) |
| Income tax expense | 158 |
| | 48 |
|
| LOSS FROM DISCONTINUED OPERATIONS, NET OF INCOME TAXES | $ | (265 | ) | | $ | (177 | ) |
2017 Transactions
Rover Contribution Agreement
In October 2017, ETO completed the previously announced contribution transaction with a fund managed by Blackstone Energy Partners and Blackstone Capital Partners, pursuant to which ETO exchanged a 49.9% interest in the holding company that owns 65% of the Rover pipeline (“Rover Holdco”). As a result, Rover Holdco is now owned 50.1% by ETO and 49.9%
by Blackstone. Upon closing, Blackstone contributed funds to reimburse ETO for its pro rata share of the Rover construction costs incurred by ETO through the closing date, along with the payment of additional amounts subject to certain adjustments.
ETO and Sunoco Logistics Merger
As discussed in Note 1, in April 2017, Energy Transfer Partners, L.P. and Sunoco Logistics completed the Sunoco Logistics Merger.
Permian Express Partners
In February 2017, the Partnership formed PEP, a strategic joint venture with ExxonMobil. The Partnership contributed its Permian Express 1, Permian Express 2, Permian Longview and Louisiana Access pipelines. ExxonMobil contributed its Longview to Louisiana and Pegasus pipelines, Hawkins gathering system, an idle pipeline in southern Oklahoma, and its Patoka, Illinois terminal. Assets contributed to PEP by ExxonMobil were reflected at fair value on the Partnership’s consolidated balance sheet at the date of the contribution, including $547 million of intangible assets and $435 million of property, plant and equipment.
In July 2017, ETO contributed an approximate 15% ownership interest in Dakota Access and ETCO to PEP, which resulted in an increase in ETO’s ownership interest in PEP to approximately 88%. ETO maintains a controlling financial and voting interest in PEP and is the operator of all of the assets. As such, PEP is reflected as a consolidated subsidiary of the Partnership. ExxonMobil’s interest in PEP is reflected as noncontrolling interest in the consolidated balance sheets. ExxonMobil’s contribution resulted in an increase of $988 million in noncontrolling interest, which is reflected in “Capital contributions from noncontrolling interest” in the consolidated statement of equity.
Bakken Equity Sale
In February 2017, Bakken Holdings Company LLC, an entity in which ETO indirectly owns a 100% membership interest, sold a 49% interest in its wholly-owned subsidiary, Bakken Pipeline Investments LLC, to MarEn Bakken Company LLC, an entity jointly owned by MPLX LP and Enbridge Energy Partners, L.P., for $2.00 billion in cash. Bakken Pipeline Investments LLC indirectly owns a 75% interest in each of Dakota Access and ETCO. The remaining 25% of each of Dakota Access and ETCO is owned by wholly-owned subsidiaries of Phillips 66. ETO continues to consolidate Dakota Access and ETCO subsequent to this transaction.
| |
| 4. | ADVANCES TO AND INVESTMENTS IN UNCONSOLIDATED AFFILIATES: |
Citrus
We own CrossCountry Energy, LLC, a wholly-owned subsidiary of ETO, which in turn owns a 50% interest in Citrus. The other 50% interest in Citrus is owned by a subsidiary of KMI. Citrus owns 100% of FGT, an approximately 5,362-mile natural gas pipeline system that originates in Texas and delivers natural gas to the Florida peninsula. Our investment in Citrus is reflected in our interstate transportation and storage segment.
FEP
We have a 50% interest in FEP which owns an approximately 185-mile natural gas pipeline that originates in Conway County, Arkansas, continues eastward through White County, Arkansas and terminates at an interconnect with Trunkline in Panola County, Mississippi. Our investment in FEP is reflected in the interstate transportation and storage segment. The Partnership evaluated its investment in FEP for impairment as of December 31, 2017, based on FASB Accounting Standards Codification 323, Investments - Equity Method and Joint Ventures. The Partnership recorded an impairment of its investment in FEP of $141 million during the year ended December 31, 2017 due to a negative outlook for long-term transportation contracts as a result of a decrease in production in the Fayetteville basin and a customer re-contracting with a competitor.
MEP
We own a 50% interest in MEP, which owns approximately 500 miles of natural gas pipeline that extends from Southeast Oklahoma, across Northeast Texas, Northern Louisiana and Central Mississippi to an interconnect with the Transcontinental natural gas pipeline system in Butler, Alabama. Our investment in MEP is reflected in the interstate transportation and storage segment.
The carrying values of the Partnership’s advances to and investments in unconsolidated affiliates as of December 31, 2019 and 2018 were as follows:
|
| | | | | | | |
| | December 31, |
| | 2019 | | 2018 |
| Citrus | $ | 1,876 |
| | $ | 1,737 |
|
| FEP | 218 |
| | 107 |
|
| MEP | 429 |
| | 225 |
|
| Others | 495 |
| | 567 |
|
| Total | $ | 3,018 |
| | $ | 2,636 |
|
The following table presents equity in earnings (losses) of unconsolidated affiliates:
|
| | | | | | | | | | | |
| | Years Ended December 31, |
| | 2019 | | 2018 | | 2017 |
| Citrus | $ | 148 |
| | $ | 141 |
| | $ | 144 |
|
| FEP | 59 |
| | 55 |
| | 53 |
|
| MEP | 15 |
| | 31 |
| | 38 |
|
| Other | 76 |
| | 117 |
| | (91 | ) |
| Total equity in earnings of unconsolidated affiliates | $ | 298 |
| | $ | 344 |
| | $ | 144 |
|
Summarized Financial Information
The following tables present aggregated selected balance sheet and income statement data for our unconsolidated affiliates, Citrus, FEP and MEP (on a 100% basis) for all periods presented, except as noted below:
|
| | | | | | | |
| | December 31, |
| | 2019 | | 2018 |
| Current assets | $ | 247 |
| | $ | 212 |
|
| Property, plant and equipment, net | 7,680 |
| | 7,800 |
|
| Other assets | 40 |
| | 39 |
|
| Total assets | $ | 7,967 |
| | $ | 8,051 |
|
| | | | |
| Current liabilities | $ | 738 |
| | $ | 1,534 |
|
| Non-current liabilities | 3,242 |
| | 3,439 |
|
| Equity | 3,987 |
| | 3,078 |
|
| Total liabilities and equity | $ | 7,967 |
| | $ | 8,051 |
|
|
| | | | | | | | | | | |
| | Years Ended December 31, |
| | 2019 | | 2018 | | 2017 |
| Revenue | $ | 1,192 |
| | $ | 1,249 |
| | $ | 1,358 |
|
| Operating income | 683 |
| | 723 |
| | 407 |
|
| Net income | 443 |
| | 460 |
| | 145 |
|
In addition to the equity method investments described above we have other equity method investments which are not significant to our consolidated financial statements.
Our debt obligations consist of the following:
|
| | | | | | | |
| | December 31, |
| | 2019 | | 2018 |
| ETO Debt | | | |
| 9.70% Senior Notes due March 15, 2019 | $ | — |
| | $ | 400 |
|
| 9.00% Senior Notes due April 15, 2019 | — |
| | 450 |
|
5.50% Senior Notes due February 15, 2020 (1) | 250 |
| | 250 |
|
5.75% Senior Notes due September 1, 2020 (1) | 400 |
| | 400 |
|
4.15% Senior Notes due October 1, 2020 (1) | 1,050 |
| | 1,050 |
|
7.50% Senior Notes due October 15, 2020 (1) | 1,135 |
| | — |
|
| 4.40% Senior Notes due April 1, 2021 | 600 |
| | 600 |
|
| 4.65% Senior Notes due June 1, 2021 | 800 |
| | 800 |
|
| 5.20% Senior Notes due February 1, 2022 | 1,000 |
| | 1,000 |
|
| 4.65% Senior Notes due February 15, 2022 | 300 |
| | 300 |
|
| 5.875% Senior Notes due March 1, 2022 | 900 |
| | 900 |
|
| 5.00% Senior Notes due October 1, 2022 | 700 |
| | 700 |
|
| 3.45% Senior Notes due January 15, 2023 | 350 |
| | 350 |
|
| 3.60% Senior Notes due February 1, 2023 | 800 |
| | 800 |
|
| 4.25% Senior Notes due March 15, 2023 | 995 |
| | — |
|
| 4.20% Senior Notes due September 15, 2023 | 500 |
| | 500 |
|
| 4.50% Senior Notes due November 1, 2023 | 600 |
| | 600 |
|
| 5.875% Senior Notes due January 15, 2024 | 1,127 |
| | — |
|
| 4.90% Senior Notes due February 1, 2024 | 350 |
| | 350 |
|
| 7.60% Senior Notes due February 1, 2024 | 277 |
| | 277 |
|
| 4.25% Senior Notes due April 1, 2024 | 500 |
| | 500 |
|
| 4.50% Senior Notes due April 15, 2024 | 750 |
| | — |
|
| 9.00% Debentures due November 1, 2024 | 65 |
| | 65 |
|
| 4.05% Senior Notes due March 15, 2025 | 1,000 |
| | 1,000 |
|
| 5.95% Senior Notes due December 1, 2025 | 400 |
| | 400 |
|
| 4.75% Senior Notes due January 15, 2026 | 1,000 |
| | 1,000 |
|
| 3.90% Senior Notes due July 15, 2026 | 550 |
| | 550 |
|
| 4.20% Senior Notes due April 15, 2027 | 600 |
| | 600 |
|
| 5.50% Senior Notes due June 1, 2027 | 956 |
| | — |
|
| 4.00% Senior Notes due October 1, 2027 | 750 |
| | 750 |
|
| 4.95% Senior Notes due June 15, 2028 | 1,000 |
| | 1,000 |
|
| 5.25% Senior Notes due April 15, 2029 | 1,500 |
| | — |
|
| 8.25% Senior Notes due November 15, 2029 | 267 |
| | 267 |
|
| 4.90% Senior Notes due March 15, 2035 | 500 |
| | 500 |
|
| 6.625% Senior Notes due October 15, 2036 | 400 |
| | 400 |
|
| 5.80% Senior Notes due June 15, 2038 | 500 |
| | 500 |
|
| 7.50% Senior Notes due July 1, 2038 | 550 |
| | 550 |
|
| 6.85% Senior Notes due February 15, 2040 | 250 |
| | 250 |
|
| 6.05% Senior Notes due June 1, 2041 | 700 |
| | 700 |
|
| 6.50% Senior Notes due February 1, 2042 | 1,000 |
| | 1,000 |
|
| 6.10% Senior Notes due February 15, 2042 | 300 |
| | 300 |
|
| 4.95% Senior Notes due January 15, 2043 | 350 |
| | 350 |
|
| 5.15% Senior Notes due February 1, 2043 | 450 |
| | 450 |
|
| 5.95% Senior Notes due October 1, 2043 | 450 |
| | 450 |
|
| 5.30% Senior Notes due April 1, 2044 | 700 |
| | 700 |
|
| 5.15% Senior Notes due March 15, 2045 | 1,000 |
| | 1,000 |
|
| 5.35% Senior Notes due May 15, 2045 | 800 |
| | 800 |
|
| 6.125% Senior Notes due December 15, 2045 | 1,000 |
| | 1,000 |
|
| 5.30% Senior Notes due April 15, 2047 | 900 |
| | 900 |
|
| 5.40% Senior Notes due October 1, 2047 | 1,500 |
| | 1,500 |
|
| 6.00% Senior Notes due June 15, 2048 | 1,000 |
| | 1,000 |
|
| 6.25% Senior Notes due April 15, 2049 | 1,750 |
| | — |
|
| Floating Rate Junior Subordinated Notes due November 1, 2066 | 546 |
| | 546 |
|
| ETO $2.00 billion Term Loan facility due October 2022 | 2,000 |
| | — |
|
| ETO $5.00 billion Revolving Credit Facility due December 2023 | 4,214 |
| | 3,694 |
|
|
| | | | | | | |
| Unamortized premiums, discounts and fair value adjustments, net | (5 | ) | | 17 |
|
| Deferred debt issuance costs | (207 | ) | | (178 | ) |
| | 42,120 |
| | 32,288 |
|
| Transwestern Debt | | | |
| 5.36% Senior Notes due December 9, 2020 (1) | 175 |
| | 175 |
|
| 5.89% Senior Notes due May 24, 2022 | 150 |
| | 150 |
|
| 5.66% Senior Notes due December 9, 2024 | 175 |
| | 175 |
|
| 6.16% Senior Notes due May 24, 2037 | 75 |
| | 75 |
|
| Deferred debt issuance costs | (1 | ) | | (1 | ) |
| | 574 |
| | 574 |
|
| Panhandle Debt | | | |
| 8.125% Senior Notes due June 1, 2019 | — |
| | 150 |
|
| 7.60% Senior Notes due February 1, 2024 | 82 |
| | 82 |
|
| 7.00% Senior Notes due July 15, 2029 | 66 |
| | 66 |
|
| 8.25% Senior Notes due November 15, 2029 | 33 |
| | 33 |
|
| Floating Rate Junior Subordinated Notes due November 1, 2066 | 54 |
| | 54 |
|
| Unamortized premiums, discounts and fair value adjustments, net | 11 |
| | 14 |
|
| | 246 |
| | 399 |
|
| Bakken Project Debt | | | |
| 3.625% Senior Notes due April 1, 2022 | 650 |
| | — |
|
| 3.90% Senior Notes due April 1, 2024 | 1,000 |
| | — |
|
| 4.625% Senior Notes due April 1, 2029 | 850 |
| | — |
|
| Bakken $2.50 billion Credit Facility due August 2019 | — |
| | 2,500 |
|
| Unamortized premiums, discounts and fair value adjustments, net | (3 | ) | | — |
|
| Deferred debt issuance costs | (16 | ) | | (3 | ) |
| | 2,481 |
| | 2,497 |
|
| Sunoco LP Debt | | | |
| 4.875% Senior Notes Due January 15, 2023 | 1,000 |
| | 1,000 |
|
| 5.50% Senior Notes Due February 15, 2026 | 800 |
| | 800 |
|
| 6.00% Senior Notes Due April 15, 2027 | 600 |
| | — |
|
| 5.875% Senior Notes Due March 15, 2028 | 400 |
| | 400 |
|
| Sunoco LP $1.50 billion Revolving Credit Facility due July 2023 | 162 |
| | 700 |
|
| Lease-related obligations | 135 |
| | 107 |
|
| Deferred debt issuance costs | (26 | ) | | (23 | ) |
| | 3,071 |
| | 2,984 |
|
| USAC Debt | | | |
| 6.875% Senior Notes due April 1, 2026 | 725 |
| | 725 |
|
| 6.875% Senior Notes due September 1, 2027 | 750 |
| | — |
|
| USAC $1.60 billion Revolving Credit Facility due April 2023 | 403 |
| | 1,050 |
|
| Deferred debt issuance costs | (26 | ) | | (16 | ) |
| | 1,852 |
| | 1,759 |
|
| | | | |
| Other | 2 |
| | 7 |
|
| Total debt | 50,346 |
| | 40,508 |
|
| Less: Current maturities of long-term debt | 12 |
| | 2,655 |
|
| Long-term debt, less current maturities | $ | 50,334 |
| | $ | 37,853 |
|
| |
(1) | As of December 31, 2019, these notes were classified as long-term as management had the intent and ability to refinance the borrowings on a long-term basis. The notes were redeemed in January 2020. |
The following table reflects future maturities of long-term debt for each of the next five years and thereafter. These amounts exclude $273 million in unamortized net premiums, fair value adjustments and deferred debt issuance costs:
|
| | | | |
| 2020 | | $ | 3,021 |
|
| 2021 | | 1,412 |
|
| 2022 | | 5,792 |
|
| 2023 | | 8,960 |
|
| 2024 | | 4,337 |
|
| Thereafter | | 27,097 |
|
| Total | | $ | 50,619 |
|
Long-term debt reflected on our consolidated balance sheets includes fair value adjustments related to interest rate swaps, which represent fair value adjustments that had been recorded in connection with fair value hedge accounting prior to the termination of the interest rate swap.
ETO Senior Notes
The ETO senior notes were registered under the Securities Act of 1933 (as amended). The Partnership may redeem some or all of the ETO senior notes at any time, or from time to time, pursuant to the terms of the indenture and related indenture supplements related to the ETO senior notes. The balance is payable upon maturity. Interest on the ETO senior notes is paid semi-annually.
The ETO senior notes are unsecured obligations of the Partnership and as a result, the ETO senior notes effectively rank junior to any future indebtedness of ours or our subsidiaries that is both secured and unsubordinated to the extent of the value of the assets securing such indebtedness, and the ETO senior notes effectively rank junior to all indebtedness and other liabilities of our existing and future subsidiaries.
ETO January 2020 Senior Notes Offering and Redemption
On January 22, 2020, ETO completed a registered offering (the “January 2020 Senior Notes Offering”) of $1.00 billion aggregate principal amount of the Partnership’s 2.900% Senior Notes due 2025, $1.50 billion aggregate principal amount of the Partnership’s 3.750% Senior Notes due 2030 and $2.00 billion aggregate principal amount of the Partnership’s 5.000% Senior Notes due 2050, (collectively, the “Notes”). The Notes are fully and unconditionally guaranteed by the Partnership’s wholly owned subsidiary, Sunoco Logistics Partners Operations L.P., on a senior unsecured basis.
Utilizing proceeds from the January 26, 2015 announcement2020 Senior Notes Offering, ETO redeemed its $400 million aggregate principal amount of 5.75% Senior Notes due September 1, 2020, its $1.05 billion aggregate principal amount of 4.15% Senior Notes due October 1, 2020, its $1.14 billion aggregate principal amount of 7.50% Senior Notes due October 15, 2020, its $250 million aggregate principal amount of 5.50% Senior Notes due February 15, 2020, ET’s $52 million aggregate principal amount of 7.50% Senior Notes due October 15, 2020 and Transwestern’s $175 million aggregate principal amount of 5.36% Senior Notes due December 9, 2020.
ET-ETO Senior Notes Exchange
In February 2019, ETO commenced offers to exchange all of ET’s outstanding senior notes for senior notes issued by ETO (the “ET-ETO senior notes exchange”). Approximately 97% of ET’s outstanding senior notes were tendered and accepted, and substantially all the exchanges settled on March 25, 2019. In connection with the exchange, ETO issued approximately $4.21 billion aggregate principal amount of the Regency-ETP mergerfollowing senior notes:
•$1.14 billion aggregate principal amount of 7.50% senior notes due 2020;
•$995 million aggregate principal amount of 4.25% senior notes due 2023;
•$1.13 billion aggregate principal amount of 5.875% senior notes due 2024; and
•$956 million aggregate principal amount of 5.50% senior notes due 2027.
2019 Senior Notes Offering and Redemption
In January 2019, ETO issued the following senior notes:
•$750 million aggregate principal amount of 4.50% senior notes due 2024;
•$1.50 billion aggregate principal amount of 5.25% senior notes due 2029; and
•$1.75 billion aggregate principal amount of 6.25% senior notes due 2049.
The $3.96 billion net proceeds from the offering were used to make an intercompany loan to ET (which ET used to repay its term loan in full), for general partnership purposes and to redeem at maturity all of the following:
•ETO’s $400 million aggregate principal amount of 9.70% senior notes due March 15, 2019;
•ETO’s $450 million aggregate principal amount of 9.00% senior notes due April 15, 2019; and
•Panhandle’s $150 million aggregate principal amount of 8.125% senior notes due June 1, 2019.
Panhandle Senior Notes Redemption
In June 2019, Panhandle’s $150 million aggregate principal amount of 8.125% senior notes matured and were repaid with borrowings under an affiliate loan agreement with ETO.
Bakken Senior Notes Offering
In March 2019, Midwest Connector Capital Company LLC, a wholly-owned subsidiary of Dakota Access, issued the following senior notes related to the Bakken pipeline:
•$650 million aggregate principal amount of 3.625% senior notes due 2022;
•$1.00 billion aggregate principal amount of 3.90% senior notes due 2024; and
•$850 million aggregate principal amount of 4.625% senior notes due 2029.
The $2.48 billion in net proceeds from the offering were used to repay in full all amounts outstanding on the Bakken credit facility and the facility was terminated.
Sunoco LP Senior Notes Offering
In March 2019, Sunoco LP issued $600 million aggregate principal amount of 6.00% senior notes due 2027 in a private placement to eligible purchasers. The net proceeds from this offering were used to repay a portion of Sunoco LP’s existing borrowings under its credit facility. In July 2019, Sunoco LP completed an exchange of these notes for registered notes with substantially identical terms.
USAC Senior Notes Offering
In March 2019, USAC issued $750 million aggregate principal amount of 6.875% senior notes due 2027 in a private placement, and in December 2019, USAC exchanged those notes for substantially identical senior notes registered under the Securities Act. The net proceeds from this offering were used to repay a portion of USAC’s existing borrowings under its credit facility and for general partnership purposes.
Transwestern Senior Notes
The Transwestern senior notes are redeemable at any time in whole or pro rata, subject to a premium or upon a change of control event or an event of default, as defined. The balance is payable upon maturity. Interest is paid semi-annually.
Credit Facilities, Term Loan and Commercial Paper
ETO Term Loan
On October 17, 2019, ETO entered into a term loan credit agreement (the “Regency Merger”“ETO Term Loan”) providing for a $2.00 billion three-year term loan credit facility. Borrowings under the term loan agreement mature on October 17, 2022 and are available for working capital purposes and for general partnership purposes. The term loan agreement is unsecured and is guaranteed by our subsidiary, Sunoco Logistics Partners Operations L.P.
As of December 31, 2019, the ETO Term Loan had $2.00 billion outstanding and was fully drawn. The weighted average interest rate on the total amount outstanding as of December 31, 2019 was 2.78%.
ETO Five-Year Credit Facility
ETO’s revolving credit facility (the “ETO Five-Year Credit Facility”) allows for unsecured borrowings up to $5.00 billion and matures on December 1, 2023. The ETO Five-Year Credit Facility contains an accordion feature, under which the total aggregate commitment may be increased up to $6.00 billion under certain conditions.
As of December 31, 2019, the ETO Five-Year Credit Facility had $4.21 billion outstanding, of which $1.64 billion was commercial paper. The amount available for future borrowings was $709 million after taking into account letters of credit of $77 million. The weighted average interest rate on the total amount outstanding as of December 31, 2019 was 2.88%.
ETO 364-Day Facility
ETO’s 364-day revolving credit facility (the “ETO 364-Day Facility”) allows for unsecured borrowings up to $1.00 billion and matures on November 27, 2020. As of December 31, 2019, the ETO 364-Day Facility had 0 outstanding borrowings.
Sunoco LP Credit Facility
Sunoco LP maintains a $1.50 billion revolving credit facility (the “Sunoco LP Credit Facility”). As of December 31, 2019, the Sunoco LP Credit Facility had $162 million outstanding borrowings and $8 million in standby letters of credit. The amount available for future borrowings was $1.33 billion at December 31, 2019. The weighted average interest rate on the total amount outstanding as of December 31, 2019 was 3.75%.
USAC Credit Facility
USAC maintains a $1.60 billion revolving credit facility (the “USAC Credit Facility”), purported Regency unitholders filed lawsuitswhich matures on April 2, 2023 and permits up to $400 million of future increases in stateborrowing capacity. As of December 31, 2019, USAC had $403 million of outstanding borrowings and federal courts in Dallas and Delaware asserting claims0 outstanding letters of credit under the credit agreement. As of December 31, 2019, USAC had $1.2 billion of availability under its credit facility. The weighted average interest rate on the total amount outstanding as of December 31, 2019 was 4.31%.
Covenants Related to Our Credit Agreements
Covenants Related to ETO
The agreements relating to the Regency Merger. All but one Regency Merger-related lawsuits have been dismissed. On June 10, 2015, Adrian Dieckman (“Dieckman”),ETO senior notes contain restrictive covenants customary for an issuer with an investment-grade rating from the rating agencies, which covenants include limitations on liens and a purported Regency unitholder, filed a class action complaint, Dieckman v. Regency GP LP, et al., C.A. No. 11130-CB, inrestriction on sale-leaseback transactions.
The ETO Credit Facilities contain covenants that limit (subject to certain exceptions) the Court of ChanceryPartnership’s and certain of the State of Delaware (the “Regency Merger Litigation”), on behalf of Regency’s common unitholders against Regency GP, LP; Regency GP LLC; ETE, ETP, ETP GP,Partnership’s subsidiaries’ ability to, among other things:
| |
| • | make certain investments; |
| |
| • | make Distributions (as defined in the ETO Credit Facilities) during certain Defaults (as defined in the ETO Credit Facilities) and during any Event of Default (as defined in the ETO Credit Facilities); |
| |
| • | engage in business substantially different in nature than the business currently conducted by the Partnership and its subsidiaries; |
| |
| • | engage in transactions with affiliates; and |
| |
| • | enter into restrictive agreements. |
The ETO Credit Facilities applicable margin and the members of Regency’s board of directors (the “Regency Litigation Defendants”).
The Regency Merger litigation alleges that the Regency Merger breached the Regency partnership agreement because Regency’s conflicts committee was not properly formed, and the Regency Merger was not approved in good faith. On March 29, 2016, the Delaware Court of Chancery granted the Regency Litigation Defendants’ motion to dismiss the lawsuit in its entirety. Dieckman appealed. On January 20, 2017, the Delaware Supreme Court reversed the judgment of the Court of Chancery. On May 5, 2017, Plaintiff filed an Amended Verified Class Action Complaint. The Regency Litigation Defendants then filed Motions to Dismiss the Amended Complaint and a Motion to Stay Discovery on May 19, 2017. On February 20, 2018, the Court of Chancery issued an Order granting in part and denying in part the motions to dismiss, dismissing the claims against all defendants other than Regency GP, LP and Regency GP LLC.
The Regency Litigation Defendants cannot predict the outcome of the Regency Merger Litigation or any lawsuits that might be filed subsequent to the date of this filing; nor can the Regency Litigation Defendants predict the amount of time and expense that will be required to resolve the Regency Merger Litigation. The Regency Litigation Defendants believe the Regency Merger Litigation is without merit and intend to vigorously defend against it and any others that may be filedrate used in connection with the Regency Merger.interest rates and commitment fees, respectively, are based on the credit ratings assigned to our senior, unsecured, non-credit enhanced long-term debt. The applicable margin for eurodollar rate loans under the ETO Five-Year Facility ranges from 1.125% to 2.000% and the applicable margin for base rate loans ranges from 0.125% to 1.000%. The applicable rate for commitment fees under the ETO Five-Year Facility ranges from 0.125% to 0.300%. The applicable margin for eurodollar rate loans under the ETO 364-Day Facility
Enterprise Products Partners, L.P.ranges from 1.250% to 1.750% and Enterprise Products Operating LLC Litigationthe applicable margin for base rate loans ranges from 0.250% to 0.750%. The applicable rate for commitment fees under the ETO 364-Day Facility ranges from 0.125% to 0.225%.
The ETO Credit Facilities contain various covenants including limitations on the creation of indebtedness and liens, and related to the operation and conduct of our business. The ETO Credit Facilities also limit us, on a rolling four quarter basis, to a maximum Consolidated Funded Indebtedness to Consolidated EBITDA ratio, as defined in the underlying credit agreements, of 5.0 to 1, which can generally be increased to 5.5 to 1 during a Specified Acquisition Period. Our Leverage Ratio was 4.04 to 1 at December 31, 2019, as calculated in accordance with the credit agreements.
The agreements relating to the Transwestern senior notes contain certain restrictions that, among other things, limit the incurrence of additional debt, the sale of assets and the payment of dividends and specify a maximum debt to capitalization ratio.
Failure to comply with the various restrictive and affirmative covenants of our revolving credit facilities could require us to pay debt balances prior to scheduled maturity and could negatively impact the Partnership’s or our subsidiaries’ ability to incur additional debt and/or our ability to pay distributions to Unitholders.
Covenants Related to Panhandle
Panhandle is not party to any lending agreement that would accelerate the maturity date of any obligation due to a failure to maintain any specific credit rating, nor would a reduction in any credit rating, by itself, cause an event of default under any of Panhandle’s lending agreements.
Panhandle’s restrictive covenants include restrictions on liens securing debt and guarantees and restrictions on mergers and on the sales of assets. A breach of any of these covenants could result in acceleration of Panhandle’s debt.
Covenants Related to Sunoco LP
The Sunoco LP Credit Facility contains various customary representations, warranties, covenants and events of default, including a change of control event of default, as defined therein. Sunoco LP’s Credit Facility requires Sunoco LP to maintain a Net Leverage Ratio of not more than 5.5 to 1. The maximum Net Leverage Ratio is subject to upwards adjustment of not more than 6.0 to 1 for a period not to exceed three fiscal quarters in the event Sunoco LP engages in certain specified acquisitions of not less than $50 million (as permitted under Sunoco LP’s Credit Facility agreement). The Sunoco LP Credit Facility also requires Sunoco LP to maintain an Interest Coverage Ratio (as defined in the Sunoco LP’s Credit Facility agreement) of not less than 2.25 to 1.
Covenants Related to USAC
The USAC Credit Facility contains covenants that limit (subject to certain exceptions) USAC’s ability to, among other things:
| |
| • | make certain loans or investments; |
| |
| • | incur additional indebtedness or guarantee other indebtedness; |
| |
| • | make certain acquisitions. |
The credit facility is also subject to the following financial covenants, including covenants requiring us to maintain:
| |
| • | a minimum EBITDA to interest coverage ratio of 2.5 to 1.0, determined as of the last day of each fiscal quarter; and |
| |
| • | a maximum funded debt to EBITDA ratio, determined as of the last day of each fiscal quarter, for the annualized trailing three months of (i) 5.5 to 1 through the end of the fiscal quarter ending December 31, 2019 and (ii) 5.0 to 1.0 thereafter, in each case subject to a provision for increases to such thresholds by 0.50 in connection with certain future acquisitions for the six consecutive month period following the period in which any such acquisition occurs. |
Compliance with our Covenants
We and our subsidiaries were in compliance with all requirements, tests, limitations, and covenants related to our debt agreements as of December 31, 2019.
| |
| 6. | REDEEMABLE NONCONTROLLING INTERESTS |
Certain redeemable noncontrolling interests in the Partnership’s subsidiaries are reflected as mezzanine equity on the consolidated balance sheet. Redeemable noncontrolling interests as of December 31, 2019 included a balance of $477 million related to the USAC Preferred Units described below and a balance of $15 million related to noncontrolling interest holders in one of the Partnership’s consolidated subsidiaries that have the option to sell their interests to the Partnership.
USAC Series A Preferred Units
In 2018, USAC issued 500,000 USAC Preferred Units in a private placement at a price of $1,000 per USAC Preferred Unit, for total gross proceeds of $500 million in a private placement.
The USAC Preferred Units are entitled to receive cumulative quarterly distributions equal to $24.375 per USAC Preferred Unit, subject to increase in certain limited circumstances. The USAC Preferred Units will have a perpetual term, unless converted or redeemed. Certain portions of the USAC Preferred Units will be convertible into USAC common units at the election of the holders beginning in 2021. To the extent the holders of the USAC Preferred Units have not elected to convert their preferred units by the fifth anniversary of the issue date, USAC will have the option to redeem all or any portion of the USAC Preferred Units for cash. In addition, at any time on or after the tenth anniversary of the issue date, the holders of the USAC Preferred Units will have the right to require USAC to redeem all or any portion of the USAC Preferred Units, and the Partnership may elect to pay up to 50% of such redemption amount in USAC common units.
Limited Partner interests are represented by Common Units and other classes of units described below, as well as Series A Preferred Units, Series B Preferred Units, Series C Preferred Units, Series D Preferred Units, Series E Preferred Units, Series F Preferred Units, and Series G Preferred Units that entitle the holders thereof to the rights and privileges specified in the Partnership Agreement. No person is entitled to preemptive rights in respect of issuances of equity securities by us, except that ETP GP has the right, in connection with the issuance of any equity security by us, to purchase equity securities on the same terms as equity securities are issued to third parties sufficient to enable ETP GP and its affiliates to maintain the aggregate percentage equity interest in us as ETP GP and its affiliates owned immediately prior to such issuance.
Class K Units
As of December 31, 2019, a total of 101.5 million Class K Units were held by wholly-owned subsidiaries of ETO. Each Class K Unit is entitled to a quarterly cash distribution of $0.67275 per Class K Unit prior to ETO making distributions of available cash to any class of units, excluding any cash available distributions or dividends or capital stock sales proceeds received by ETO from ETP Holdco. If the Partnership is unable to pay the Class K Unit quarterly distribution with respect to any quarter, the accrued and unpaid distributions will accumulate until paid and any accumulated balance will accrue 1.5% per annum until paid.
Class L Units
On December 31, 2018, ETO issued a new class of limited partner interests titled Class L Units to two wholly-owned subsidiaries of the Partnership when the Partnership’s previously outstanding Class E units and Class G units held by such subsidiaries were converted into Class L Units. As a result of the conversion, the Class E units and Class G units were cancelled.
The Class L Units generally do not have any voting rights. The Class L Units are entitled to aggregate cash distributions equal to 7.65% per annum of the total amount of cash generated by us and our subsidiaries, other than ETP Holdco, and available for distribution. Distributions shall be paid quarterly, in arrears, within 45 days after the end of each quarter. As the Class L Units are owned by a wholly-owned subsidiary, the cash distributions on those units are eliminated in our consolidated financial statements.
Class M Units
On July 1, 2019, ETO issued a new class of limited partner interests titled Class M Units to ETP Holdco, a wholly-owned subsidiary of the Partnership, in exchange for the contribution of ETP Holdco’s equity ownership interest in Panhandle to the Partnership.
The Class M Units generally do not have any voting rights. The Class M Units are entitled to aggregate cash distributions equal to 8.00% per annum of the total amount of cash generated by us and our subsidiaries, other than ETP Holdco, and available for distribution. Distributions shall be paid quarterly, in arrears, within 45 days after the end of each quarter. As
the Class M Units are owned by a wholly-owned subsidiary, the cash distributions on those units are eliminated in our consolidated financial statements.
ETO Preferred Units
In November 2017, ETO issued 950,000 of its 6.250% Series A Preferred Units at a price of $1,000 per unit and 550,000 of its 6.625% Series B Preferred Units at a price of $1,000 per unit. In April 2018, ETO issued 18 million of its 7.375% Series C Preferred Units at a price of $25 per unit. In July 2018, ETO issued 17.8 million of its 7.625% Series D Preferred Units at a price of $25 per unit. In April 2019, ETO issued 32 million of its 7.600% Series E Preferred Units at a price of $25 per unit. As of December 31, 2019 all of our Series A, Series B, Series C, Series D and Series E Preferred Units issued remain outstanding.
The following table summarizes changes in the amounts of our Series A, Series B, Series C, Series D and Series E preferred units for the years ended December 31, 2019, 2018 and 2017 were as follows:
|
| | | | | | | | | | | | | | | | | | | | | | | |
| | Preferred Unitholders | | |
| | Series A | | Series B | | Series C | | Series D | | Series E | | Total |
| Balance, December 31, 2016 | $ | — |
| | $ | — |
| | $ | — |
| | $ | — |
| | $ | — |
| | $ | — |
|
| Distributions to partners | — |
| | — |
| | — |
| | — |
| | — |
| | — |
|
| Partnership units issued for cash | 937 |
| | 542 |
| | — |
| | — |
| | — |
| | 1,479 |
|
| Other, net | — |
| | — |
| | — |
| | — |
| | — |
| | — |
|
| Net income | 7 |
| | 5 |
| | — |
| | — |
| | — |
| | 12 |
|
| Balance, December 31, 2017 | 944 |
| | 547 |
| | — |
| | — |
| | — |
| | 1,491 |
|
| Distributions to partners | (44 | ) | | (27 | ) | | (18 | ) | | (11 | ) | | — |
| | (100 | ) |
| Partnership units issued for cash | — |
| | — |
| | 436 |
| | 431 |
| | — |
| | 867 |
|
| Other, net | (1 | ) | | — |
| | (1 | ) | | (1 | ) | | — |
| | (3 | ) |
| Net income | 59 |
| | 36 |
| | 23 |
| | 15 |
| | — |
| | 133 |
|
| Balance, December 31, 2018 | 958 |
| | 556 |
| | 440 |
| | 434 |
| | — |
| | 2,388 |
|
| Distributions to partners | (59 | ) | | (37 | ) | | (33 | ) | | (34 | ) | | (34 | ) | | (197 | ) |
| Partnership units issued for cash | — |
| | — |
| | — |
| | — |
| | 780 |
| | 780 |
|
| Other, net | — |
| | — |
| | — |
| | — |
| | (1 | ) | | (1 | ) |
| Net income | 59 |
| | 37 |
| | 33 |
| | 34 |
| | 41 |
| | 204 |
|
| Balance, December 31, 2019 | $ | 958 |
| | $ | 556 |
| | $ | 440 |
| | $ | 434 |
| | $ | 786 |
| | $ | 3,174 |
|
ETO Series A Preferred Units
Distributions on the Series A Preferred Units will accrue and be cumulative from and including the date of original issue to, but excluding, February 15, 2023, at a rate of 6.250% per annum of the stated liquidation preference of $1,000. On and after February 15, 2023, distributions on the Series A Preferred Units will accumulate at a percentage of the $1,000 liquidation preference equal to an annual floating rate of the three-month LIBOR, determined quarterly, plus a spread of 4.028% per annum. The Series A Preferred Units are redeemable at ETO’s option on or after February 15, 2023 at a redemption price of $1,000 per Series A Preferred Unit, plus an amount equal to all accumulated and unpaid distributions thereon to, but excluding, the date of redemption.
ETO Series B Preferred Units
Distributions on the Series B Preferred Units will accrue and be cumulative from and including the date of original issue to, but excluding, February 15, 2028, at a rate of 6.625% per annum of the stated liquidation preference of $1,000. On and after February 15, 2028, distributions on the Series B Preferred Units will accumulate at a percentage of the $1,000 liquidation preference equal to an annual floating rate of the three-month LIBOR, determined quarterly, plus a spread of 4.155% per annum. The Series B Preferred Units are redeemable at ETO’s option on or after February 15, 2028 at a redemption price of $1,000 per Series B Preferred Unit, plus an amount equal to all accumulated and unpaid distributions thereon to, but excluding, the date of redemption.
ETO Series C Preferred Units
Distributions on the Series C Preferred Units will accrue and be cumulative from and including the date of original issue to, but excluding, May 15, 2023, at a rate of 7.375% per annum of the stated liquidation preference of $25. On and after May 15, 2023, distributions on the Series C Preferred Units will accumulate at a percentage of the $25 liquidation preference equal to an annual floating rate of the three-month LIBOR, determined quarterly, plus a spread of 4.530% per annum. The Series C Preferred Units are redeemable at ETO’s option on or after May 15, 2023 at a redemption price of $25 per Series C Preferred Unit, plus an amount equal to all accumulated and unpaid distributions thereon to, but excluding, the date of redemption.
ETO Series D Preferred Units
Distributions on the Series D Preferred Units will accrue and be cumulative from and including the date of original issue to, but excluding, August 15, 2023, at a rate of 7.625% per annum of the stated liquidation preference of $25. On and after August 15, 2023, distributions on the Series D Preferred Units will accumulate at a percentage of the $25 liquidation preference equal to an annual floating rate of the three-month LIBOR, determined quarterly, plus a spread of 4.738% per annum. The Series D Preferred Units are redeemable at ETO’s option on or after August 15, 2023 at a redemption price of $25 per Series D Preferred Unit, plus an amount equal to all accumulated and unpaid distributions thereon to, but excluding, the date of redemption.
ETO Series E Preferred Units
Distributions on the Series E Preferred Units will accrue and be cumulative from and including the date of original issue to, but excluding, May 15, 2024, at a rate of 7.600% per annum of the stated liquidation preference of $25. On and after May 15, 2024, distributions on the Series E Preferred Units will accumulate at a percentage of the $25 liquidation preference equal to an annual floating rate of the three-month LIBOR, determined quarterly, plus a spread of 5.161% per annum. The Series E Preferred Units are redeemable at ETO’s option on or after May 15, 2024 at a redemption price of $25 per Series E Preferred Unit, plus an amount equal to all accumulated and unpaid distributions thereon to, but excluding, the date of redemption.
ETO Series F Preferred Units
On January 22, 2020, the Partnership issued 500,000 of its 6.750% Series F Fixed-Rate Reset Cumulative Redeemable Perpetual Preferred Units representing limited partner interest in the Partnership, at a price to the public of $1,000 per unit. Distributions on the Series F Preferred Units are cumulative from and including the original issue date and will be payable semi-annually in arrears on the 15th day of May and November of each year, commencing on May 15, 2020 to, but excluding, May 15, 2025, at a rate equal to 6.750% per annum of the $1,000 liquidation preference. On and after May 15, 2025, the distribution rate on the Series F Preferred Units will equal a percentage of the $1,000 liquidation preference equal to the five-year U.S. treasury rate plus a spread of 5.134% per annum. The Series F Preferred Units are redeemable at ETO’s option on or after May 15, 2025 at a redemption price of $1,000 per Series F Preferred Unit, plus an amount equal to all accumulated and unpaid distributions thereon to, but excluding, the date of redemption.
ETO Series G Preferred Units
On January 22, 2020, the Partnership issued 1,100,000 of its 7.125% Series G Fixed-Rate Reset Cumulative Redeemable Perpetual Preferred Units representing limited partner interest in the Partnership, at a price to the public of $1,000 per unit. Distributions on the Series G Preferred Units are cumulative from and including the original issue date and will be payable semi-annually in arrears on the 15th day of May and November of each year, commencing on May 15, 2020 to, but excluding, May 15, 2030, at a rate equal to 7.125% per annum of the $1,000 liquidation preference. On and after May 15, 2030, the distribution rate on the Series G Preferred Units will equal a percentage of the $1,000 liquidation preference equal to the five-year U.S. treasury rate plus a spread of 5.306% per annum. The Series G Preferred Units are redeemable at ETO’s option on or after May 15, 2030 at a redemption price of $1,000 per Series G Preferred Unit, plus an amount equal to all accumulated and unpaid distributions thereon to, but excluding, the date of redemption.
PennTex Tender Offer and Limited Call Right Exercise
In June 2017, ETO purchased all of the outstanding PennTex common units not previously owned by ETO for $20.00 per common unit in cash. ETO now owns all of the economic interests of PennTex, and PennTex common units are no longer publicly traded or listed on the NASDAQ.
Subsidiary Equity Transactions
Sunoco LP’s Common Unit Repurchase
In February 2018, after the record date for Sunoco LP’s fourth quarter 2017 cash distributions, Sunoco LP repurchased 17,286,859 Sunoco LP common units owned by ETO for aggregate cash consideration of approximately $540 million. ETO used the proceeds from the sale of the Sunoco LP common units to repay amounts outstanding under its revolving credit facility.
Sunoco LP’s Equity Distribution Program
Sunoco LP is party to an equity distribution agreement for an at-the-market (“ATM”) offering pursuant to which Sunoco LP may sell its common units from time to time. For the years ended December 31, 2019 and 2018, Sunoco LP issued 0 units under its ATM program. For the year ended December 31, 2017, Sunoco LP issued an additional 1.3 million units with total net proceeds of $33 million , net of commissions of $0.3 million. As of December 31, 2019, $295 million of Sunoco LP common units remained available to be issued under the currently effective equity distribution agreement.
Sunoco LP’s Series A Preferred Units
On January 27, 2014, a trial commenced between ETP against Enterprise Products Partners, L.P. and Enterprise Products Operating LLC (collectively, “Enterprise”) and Enbridge (US) Inc. Trial resultedMarch 30, 2017, the Partnership purchased 12.0 million Sunoco LP Series A Preferred Units representing limited partner interests in Sunoco LP in a verdict in favorprivate placement transaction for an aggregate purchase price of ETP against Enterprise that consisted$300 million. The distribution rate of $319the Sunoco LP Series A Preferred Units is 10.00%, per annum, of the $25.00 liquidation preference per unit until March 30, 2022, at which point the distribution rate will become a floating rate of 8.00% plus three-month LIBOR of the liquidation preference.
In January 2018, Sunoco LP redeemed all outstanding Sunoco LP Series A Preferred Units held by ET for an aggregate redemption amount of approximately $313 million. The redemption amount included the original consideration of $300 million in compensatory damages and $595 million in disgorgement to ETP. The jury also found that ETP owed Enterprisea 1% call premium plus accrued and unpaid quarterly distributions.
USAC’s Distribution Reinvestment Program
During the year ended December 31, 2019 and 2018, distributions of $1 million and $0.6 million, respectively, were reinvested under the USAC distribution reinvestment program resulting in the issuance of approximately 60,584 and 39,280 USAC common units, respectively.
USAC’s Warrant Private Placement
On April 2, 2018, USAC issued two tranches of warrants to purchase USAC common units (the “USAC Warrants”), which included USAC Warrants to purchase 5,000,000 common units with a reimbursement agreement. strike price of $17.03 per unit and USAC Warrants to purchase 10,000,000 common units with a strike price of $19.59 per unit. The USAC Warrants may be exercised by the holders thereof at any time beginning on the one year anniversary of the closing date and before the tenth anniversary of the closing date. Upon exercise of the USAC Warrants, USAC may, at its option, elect to settle the USAC Warrants in common units on a net basis.
USAC’s Class B Units
The USAC Class B Units, all of which are owned by ETO, are a new class of partnership interests of USAC that have substantially all of the rights and obligations of a USAC common unit, except the USAC Class B Units will not participate in distributions for the first four quarters following the closing date of the USAC Transaction on April 2, 2018. Each USAC Class B Unit automatically converted into one USAC common unit on the first business day following the record date attributable to the quarter ending June 30, 2019.
On July 29, 2014,30, 2019, the trial court entered6,397,965 USAC Class B units held by the Partnership converted into 6,397,965 common units representing limited partner interests in USAC. These common units participate in distributions declared by USAC.
Cash Distributions
ETO Preferred Unit Distributions
Distributions on the Partnership’s Series A, Series B, Series C, Series D and Series E preferred units declared and/or paid by the Partnership were as follows:
|
| | | | | | | | | | | | | | | | | | | | | | | | | |
| Period Ended | | Record Date | | Payment Date | | Series A (1) | | Series B (1) | | Series C | | Series D | | Series E | |
| December 31, 2017 | | February 1, 2018 | | February 15, 2018 | | $ | 15.4510 |
| * | $ | 16.3780 |
| * | $ | — |
| | $ | — |
| | $ | — |
| |
| June 30, 2018 | | August 1, 2018 | | August 15, 2018 | | 31.2500 |
| | 33.1250 |
| | 0.5634 |
| * | — |
| | — |
| |
| September 30, 2018 | | November 1, 2018 | | November 15, 2018 | | — |
| | — |
| | 0.4609 |
| | 0.5931 |
| * | — |
| |
| December 31, 2018 | | February 1, 2019 | | February 15, 2019 | | 31.2500 |
| | 33.1250 |
| | 0.4609 |
| | 0.4766 |
| | — |
| |
| March 31, 2019 | | May 1, 2019 | | May 15, 2019 | | — |
| | — |
| | 0.4609 |
| | 0.4766 |
| | — |
| |
| June 30, 2019 | | August 1, 2019 | | August 15, 2019 | | 31.2500 |
| | 33.1250 |
| | 0.4609 |
| | 0.4766 |
| | 0.5806 |
| * |
| September 30, 2019 | | November 1, 2019 | | November 15, 2019 | | — |
| | — |
| | 0.4609 |
| | 0.4766 |
| | 0.4750 |
| |
| December 31, 2019 | | February 3, 2020 | | February 18, 2020 | | 31.2500 |
| | 33.1250 |
| | 0.4609 |
| | 0.4766 |
| | 0.4750 |
| |
| |
* | Represent prorated initial distributions. Prorated initial distributions on the recently issued Series F and Series G preferred units will be payable in May 2020. |
(1) Series A Preferred Units and Series B Preferred Unit distributions are paid on a final judgmentsemi-annual basis.
Sunoco LP Cash Distributions
The following table illustrates the percentage allocations of available cash from operating surplus between Sunoco LP’s common unitholders and the holder of its IDRs based on the specified target distribution levels, after the payment of distributions to Class C unitholders. The amounts set forth under “marginal percentage interest in favordistributions” are the percentage interests of ETPthe IDR holder and awarded ETP $536the common unitholders in any available cash from operating surplus which Sunoco LP distributes up to and including the corresponding amount in the column “total quarterly distribution per unit target amount.” The percentage interests shown for common unitholders and IDR holder for the minimum quarterly distribution are also applicable to quarterly distribution amounts that are less than the minimum quarterly distribution.
|
| | | | | | |
| | | | | Marginal Percentage Interest in Distributions |
| | | Total Quarterly Distribution Target Amount | | Common Unitholders | | Holder of IDRs |
| Minimum Quarterly Distribution | | $0.4375 | | 100% | | —% |
| First Target Distribution | | $0.4375 to $0.503125 | | 100% | | —% |
| Second Target Distribution | | $0.503125 to $0.546875 | | 85% | | 15% |
| Third Target Distribution | | $0.546875 to $0.656250 | | 75% | | 25% |
| Thereafter | | Above $0.656250 | | 50% | | 50% |
Distributions on Sunoco LP’s units declared and/or paid by Sunoco LP were as follows:
|
| | | | | | | | |
| Quarter Ended | | Record Date | | Payment Date | | Rate |
| December 31, 2016 | | February 13, 2017 | | February 21, 2017 | | $ | 0.8255 |
|
| March 31, 2017 | | May 9, 2017 | | May 16, 2017 | | 0.8255 |
|
| June 30, 2017 | | August 7, 2017 | | August 15, 2017 | | 0.8255 |
|
| September 30, 2017 | | November 7, 2017 | | November 14, 2017 | | 0.8255 |
|
| December 31, 2017 | | February 6, 2018 | | February 14, 2018 | | 0.8255 |
|
| March 31, 2018 | | May 7, 2018 | | May 15, 2018 | | 0.8255 |
|
| June 30, 2018 | | August 7, 2018 | | August 15, 2018 | | 0.8255 |
|
| September 30, 2018 | | November 6, 2018 | | November 14, 2018 | | 0.8255 |
|
| December 31, 2018 | | February 6, 2019 | | February 14, 2019 | | 0.8255 |
|
| March 31, 2019 | | May 7, 2019 | | May 15, 2019 | | 0.8255 |
|
| June 30, 2019 | | August 6, 2019 | | August 14, 2019 | | 0.8255 |
|
| September 30, 2019 | | November 5, 2019 | | November 19, 2019 | | 0.8255 |
|
| December 31, 2019 | | February 7, 2020 | | February 19, 2020 | | 0.8255 |
|
USAC Cash Distributions
Subsequent to the Energy Transfer Merger and USAC Transactions described in Note 1 and Note 3, respectively, ETO owned approximately 39.7 million consistingUSAC common units and 6.4 million USAC Class B units. Subsequent to the conversion of compensatory damages, disgorgement, and pre-judgment interest. The trial court also ordered that ETP shall be entitledthe USAC Class B Units to recover post-judgmentUSAC common units on July 30, 2019, ETO owns approximately 46.1 million USAC common units. As of December 31, 2019, USAC had approximately 96.6 million common units outstanding. USAC currently has a non-economic general partner interest and costsno outstanding IDRs.
Distributions on USAC’s units declared and/or paid by USAC subsequent to the USAC transaction on April 2, 2018 were as follows:
|
| | | | | | | | |
| Quarter Ended | | Record Date | | Payment Date | | Rate |
| March 31, 2018 | | May 1, 2018 | | May 11, 2018 | | $ | 0.5250 |
|
| June 30, 2018 | | July 30, 2018 | | August 10, 2018 | | 0.5250 |
|
| September 30, 2018 | | October 29, 2018 | | November 09, 2018 | | 0.5250 |
|
| December 31, 2018 | | January 28, 2019 | | February 8, 2019 | | 0.5250 |
|
| March 31, 2019 | | April 29, 2019 | | May 10, 2019 | | 0.5250 |
|
| June 30, 2019 | | July 29, 2019 | | August 9, 2019 | | 0.5250 |
|
| September 30, 2019 | | October 28, 2019 | | November 8, 2019 | | 0.5250 |
|
| December 31, 2019 | | January 27, 2020 | | February 7, 2020 | | 0.5250 |
|
Accumulated Other Comprehensive Income
The following table presents the components of AOCI, net of tax:
|
| | | | | | | |
| | December 31, |
| | 2019 | | 2018 |
| Available-for-sale securities | $ | 13 |
| | $ | 2 |
|
| Foreign currency translation adjustment | (5 | ) | | (5 | ) |
| Actuarial loss related to pensions and other postretirement benefits | (25 | ) | | (48 | ) |
| Investments in unconsolidated affiliates, net | (1 | ) | | 9 |
|
| Total AOCI, net of tax | $ | (18 | ) | | $ | (42 | ) |
The table below sets forth the tax amounts included in the respective components of other comprehensive income:
|
| | | | | | | |
| | December 31, |
| | 2019 | | 2018 |
| Available-for-sale securities | $ | (1 | ) | | $ | (1 | ) |
| Foreign currency translation adjustment | 2 |
| | 2 |
|
| Actuarial loss relating to pension and other postretirement benefits | 8 |
| | 12 |
|
| Total | $ | 9 |
| | $ | 13 |
|
| |
| 8. | NON-CASH COMPENSATION PLANS: |
ETO Long-Term Incentive Plan
We have previously issued equity incentive plans for employees, officers and that Enterprise isdirectors, which provide for various types of awards, including options to purchase ETO Common Units, restricted units, phantom units, distribution equivalent rights (“DERs”), Common Unit appreciation rights, and other unit-based awards.
The Partnership does not entitled tocurrently have any net recovery on its counterclaims. Enterprise filed a notice of appealequity compensation plans. In connection with the Energy Transfer Merger in October 2018, all of the Partnership’s equity compensation plans, as well as the Partnership’s obligations under those plans, were assumed by ET. The Partnership recorded stock compensation expenses of $111 million, $105 million and $99 million for the years ended December 31, 2019, 2018 and 2017, respectively.
Subsidiary Long-Term Incentive Plans
Each of Sunoco LP and USAC has granted restricted or phantom unit awards (collectively, the “Subsidiary Unit Awards”) to employees and directors that entitle the grantees to receive common units of the respective subsidiary. In some cases, at the discretion of the respective subsidiary’s compensation committee, the grantee may instead receive an amount of cash equivalent to the value of common units upon vesting. Substantially all of the Subsidiary Unit Awards are time-vested grants, which generally vest over a three or five-year period, that entitles the grantees of the unit awards to receive an amount of cash equal to the per unit cash distributions made by the respective subsidiaries during the period the restricted unit is outstanding.
The following table summarizes the activity of the Subsidiary Unit Awards:
|
| | | | | | | | | | | | | |
| | Sunoco LP | | USAC |
| | Number of Units | | Weighted Average Grant-Date Fair Value Per Unit | | Number of Units | | Weighted Average Grant-Date Fair Value Per Unit |
| Unvested awards as of December 31, 2018 | 2.1 |
| | $ | 29.15 |
| | 1.4 |
| | $ | 14.98 |
|
| Awards granted | 0.7 |
| | 30.70 |
| | 0.7 |
| | 15.88 |
|
| Awards vested | (0.5 | ) | | 30.04 |
| | (0.3 | ) | | 13.06 |
|
| Awards forfeited | (0.2 | ) | | 28.16 |
| | — |
| | 16.78 |
|
| Unvested awards as of December 31, 2019 | 2.1 |
| | 29.21 |
| | 1.8 |
| | 15.09 |
|
The following table summarizes the weighted average grant-date fair value per unit award granted:
|
| | | | | | | | | | | |
| | Years Ended December 31, |
| | 2019 | | 2018 | | 2017 |
| Sunoco LP | $ | 30.70 |
| | $ | 27.67 |
| | $ | 28.31 |
|
| USAC | 15.88 |
| | 15.47 |
| | N/A |
|
The total fair value of Subsidiary Unit Awards vested for the years ended December 31, 2019, 2018 and 2017 was $17 million, $22 million and $9 million, respectively, based on the market price of Sunoco LP and USAC common units as of the vesting date for the years ended December 31, 2019 and 2018 and Sunoco LP for the year ended December 31, 2017. As of December 31, 2019, estimated compensation cost related to Subsidiary Unit Awards not yet recognized was $57 million, and the weighted average period over which this cost is expected to be recognized in expense is 3.6 years.
As a partnership, we are not subject to United States federal income tax and most state income taxes. However, the Partnership conducts certain activities through corporate subsidiaries which are subject to federal and state income taxes. The components of the federal and state income tax expense (benefit) of our taxable subsidiaries were summarized as follows:
|
| | | | | | | | | | | |
| | Years Ended December 31, |
| | 2019 | | 2018 | | 2017 |
| Current expense (benefit): | | | | | |
| Federal | $ | (20 | ) | | $ | (7 | ) | | $ | 53 |
|
| State | (1 | ) | | 20 |
| | (16 | ) |
| Total | (21 | ) | | 13 |
| | 37 |
|
| Deferred expense (benefit): | | | | | |
| Federal | 176 |
| | 183 |
| | (2,025 | ) |
| State | 45 |
| | (191 | ) | | 184 |
|
| Total | 221 |
| | (8 | ) | | (1,841 | ) |
| Total income tax expense (benefit) | $ | 200 |
| | $ | 5 |
| | $ | (1,804 | ) |
Historically, our effective tax rate has differed from the statutory rate primarily due to Partnership earnings that are not subject to United States federal and most state income taxes at the partnership level. A reconciliation of income tax expense at the United States statutory rate to the Partnership’s income tax benefit for the years ended December 31, 2019, 2018 and 2017 is as follows:
|
| | | | | | | | | | | |
| | Years Ended December 31, |
| | 2019 | | 2018 | | 2017 |
| Income tax expense at United States statutory rate | $ | 1,131 |
| | $ | 849 |
| | $ | 402 |
|
| Increase (reduction) in income taxes resulting from: | | | | | |
| Partnership earnings not subject to tax | (940 | ) | | (718 | ) | | (626 | ) |
| Federal rate change | — |
| | — |
|
| (1,784 | ) |
| Goodwill impairments | — |
| | — |
| | 208 |
|
| State income taxes (net of federal income tax effects) | 14 |
| | (125 | ) | | 123 |
|
| Dividend received deduction | (3 | ) | | (5 | ) | | (14 | ) |
| Change in tax status of subsidiary | — |
| | — |
| | (124 | ) |
| Other | (2 | ) | | 4 |
| | 11 |
|
| Income tax expense (benefit) | $ | 200 |
| | $ | 5 |
| | $ | (1,804 | ) |
Deferred taxes result from the temporary differences between financial reporting carrying amounts and the tax basis of existing assets and liabilities. The table below summarizes the principal components of the deferred tax assets (liabilities) as follows:
|
| | | | | | | |
| | December 31, |
| | 2019 | | 2018 |
| Deferred income tax assets: | | | |
| Net operating losses, alternative minimum tax credit and other carryforwards | $ | 669 |
| | $ | 768 |
|
| Pension and other postretirement benefits | — |
| | 34 |
|
| Long-term debt | — |
| | 13 |
|
| Other | 62 |
| | 181 |
|
| Total deferred income tax assets | 731 |
| | 996 |
|
| Valuation allowance | (49 | ) | | (96 | ) |
| Net deferred income tax assets | $ | 682 |
| | $ | 900 |
|
| | | | |
| Deferred income tax liabilities: | | | |
| Property, plant and equipment | $ | (258 | ) | | $ | (742 | ) |
| Investments in affiliates | (3,452 | ) | | (2,869 | ) |
| Trademarks | (72 | ) | | (63 | ) |
| Other | (13 | ) | | (110 | ) |
| Total deferred income tax liabilities | (3,795 | ) | | (3,784 | ) |
| Net deferred income taxes | $ | (3,113 | ) | | $ | (2,884 | ) |
As of December 31, 2019, ETP Holdco had a federal net operating loss carryforward of $2.65 billion, of which $1.10 billion will expire in 2031 through 2037 while the remaining can be carried forward indefinitely. As of December 31, 2019, Sunoco Property Company LLC, a corporate subsidiary of Sunoco LP, has no federal net operating loss carryforward.
Our corporate subsidiaries have $15 million of federal alternative minimum tax credits at December 31, 2019, of which $8 million is expected to be reclassified to current income tax receivable in 2020 pursuant to the Tax Cuts and Jobs Act. Our corporate subsidiaries have state net operating loss carryforward benefits of $95 million, net of federal tax, some of which will expire between 2020 and 2038, while others are carried forward indefinitely. A valuation allowance of $49 million is applicable to the state net operating loss carryforward benefits primarily attributable to significant restrictions on their use in the Commonwealth of Pennsylvania.
The following table sets forth the changes in unrecognized tax benefits:
|
| | | | | | | | | | | |
| | Years Ended December 31, |
| | 2019 | | 2018 | | 2017 |
| Balance at beginning of year | $ | 624 |
| | $ | 609 |
| | $ | 615 |
|
| Additions attributable to tax positions taken in the current year | — |
| | 8 |
| | — |
|
| Additions attributable to tax positions taken in prior years | 11 |
| | 7 |
| | 28 |
|
| Reduction attributable to tax positions taken in prior years | (541 | ) | | — |
| | (25 | ) |
| Lapse of statute | — |
| | — |
| | (9 | ) |
| Balance at end of year | $ | 94 |
| | $ | 624 |
| | $ | 609 |
|
As of December 31, 2019, we have $90 million ($72 million after federal income tax benefits) related to tax positions which, if recognized, would impact our effective tax rate.
Our policy is to accrue interest expense and penalties on income tax underpayments (overpayments) as a component of income tax expense. During 2019, we recognized interest and penalties of $1 million. At December 31, 2019, we have interest and penalties accrued of $3 million, net of tax.
We appealed the adverse Court of Appeals. On July 18, 2017,Federal Claims decision against ETC Sunoco regarding the CourtIRS' denial of Appeals issued its opinion and reversed the trial court’s judgment. ETP’s motion for rehearingethanol blending credits claims under Section 6426 to the Court of Appeals was denied. ETPFederal Circuit. The Federal Circuit affirmed the CFC's denial on November 1, 2018. ETC Sunoco filed a petition for reviewcertiorari with the Texas Supreme Court. Enterprise’s response is due February 26, 2018.
Sunoco Logistics Merger Litigation
Seven purported Energy Transfer Partners, L.P. common unitholders (the “ETP Unitholder Plaintiffs”) separately filed seven putative unitholder class action lawsuits against ETP, ETP GP, ETP LLC,Court on May 24, 2019 to review the membersFederal Circuit's affirmation of the ETP Board,CFC's ruling, and ETE (the “ETP-SXL Defendants”the Court denied Sunoco's petition on October 7, 2019. The petition for certiorari applied to ETC Sunoco's 2004 through 2009 tax years, and 2010 through 2011 are on extension with the IRS through March 30, 2020. Due to the uncertainty surrounding the litigation, a reserve of $530 million was previously established for the full amount of the pending refund claims, and the receivable and reserve for this issue were netted in the consolidated balance sheet. Subsequent to the Supreme Court's denial of the petition in October 2019, the receivable and reserve have been reversed, with no impact to the Partnership's financial position and results of operations.
In November 2015, the Pennsylvania Commonwealth Court determined in Nextel Communications v. Commonwealth (“Nextel”) that the Pennsylvania limitation on NOL carryforward deductions violated the uniformity clause of the Pennsylvania Constitution and struck the NOL limitation in its entirety. In October 2017, the Pennsylvania Supreme Court affirmed the decision with respect to the uniformity clause violation; however, the Court reversed with respect to the remedy and instead severed the flat-dollar limitation, leaving the percentage-based limitation intact. Nextel subsequently filed a petition for writ of certiorari with the United States Supreme Court, and this was denied on June 11, 2018. Now certain Pennsylvania taxpayers are proceeding with litigation in Pennsylvania state courts on issues not addressed by the Pennsylvania Supreme Court in Nextel, specifically, whether the Due Process and Equal Protection Clauses of the United States Constitution and the Remedies Clause of the Pennsylvania Constitution require a court to grant the taxpayer relief. ETC Sunoco has recognized approximately $67 million ($53 million after federal income tax benefits) in tax benefit based on previously filed tax returns and certain previously filed protective claims as relates to its cases currently held pending the Nextel matter. However, based upon the Pennsylvania Supreme Court’s October 2017 decision, and because of uncertainty in the breadth of the application of the decision, we have reserved $34 million ($27 million after federal income tax benefits) against the receivable.
In general, ETO and its subsidiaries are no longer subject to examination by the IRS, and most state jurisdictions, for the 2014 and prior tax years.
ETO and its subsidiaries also have various state and local income tax returns in the process of examination or administrative appeal in various jurisdictions. We believe the appropriate accruals or unrecognized tax benefits have been recorded for any potential assessment with respect to these examinations.
| |
| 10. | REGULATORY MATTERS, COMMITMENTS, CONTINGENCIES AND ENVIRONMENTAL LIABILITIES: |
FERC Proceedings
By Order issued January 16, 2019, the FERC initiated a review of Panhandle’s existing rates pursuant to Section 5 of the Natural Gas Act to determine whether the rates currently charged by Panhandle are just and reasonable and set the matter for hearing. On August 30, 2019, Panhandle filed a general rate proceeding under Section 4 of the Natural Gas Act. The Natural Gas Act Section 5 and Section 4 proceedings were consolidated by the Order dated October 1, 2019. A hearing in the combined proceedings is scheduled for August 2020, with an initial decision expected in early 2021.
By Order issued February 19, 2019, the FERC initiated a review of Southwest Gas’ existing rates pursuant to Section 5 of the Natural Gas Act to determine whether the rates currently charged by Southwest Gas are just and reasonable and set the matter for hearing. Southwest Gas filed a cost and revenue study on May 6, 2019. On July 10, 2019, Southwest Gas filed an Offer of Settlement in this Section 5 proceeding, which settlement was supported or not opposed by Commission Trial Staff and all active parties. By order dated October 29, 2019, the FERC approved the settlement as filed, and there is not a material impact on revenue.
In addition, on November 30, 2018, Sea Robin filed a rate case pursuant to Section 4 of the Natural Gas Act. On July 22, 2019, Sea Robin filed an Offer of Settlement in this Section 4 proceeding, which settlement was supported or not opposed by Commission Trial Staff and all active parties. By order dated October 17, 2019, the FERC approved the settlement as filed, and there is not a material impact on revenue.
Commitments
In the normal course of business, ETO purchases, processes and sells natural gas pursuant to long-term contracts and enters into long-term transportation and storage agreements. Such contracts contain terms that are customary in the industry. ETO believes that the terms of these agreements are commercially reasonable and will not have a material adverse effect on its financial position or results of operations.
Our joint venture agreements require that we funds our proportionate share of capital contributions to its unconsolidated affiliates. Such contributions will depend upon our unconsolidated affiliates’ capital requirements, such as for funding capital projects or repayment of long-term obligations.
We have certain non-cancelable rights-of-way (“ROW”) commitments, which require fixed payments and either expire upon our chosen abandonment or at various dates in the future. The table below reflects ROW expense included in operating expenses in the accompanying statements of operations:
|
| | | | | | | | | | | |
| | Years Ended December 31, |
| | 2019 | | 2018 | | 2017 |
| ROW expense | $ | 45 |
| | $ | 46 |
| | $ | 46 |
|
PES Refinery Fire and Bankruptcy
We own an approximately 7.4% non-operating interest in PES, which owns a refinery in Philadelphia. In addition, the Partnership provides logistics services to PES under commercial contracts and Sunoco LP has historically purchased refined products from PES. In June 2019, an explosion and fire occurred at the refinery complex.
On July 21, 2019, PES Holdings, LLC and seven of its subsidiaries (collectively, the "Debtors") filed voluntary petitions in the United States Bankruptcy Court for the District of Delaware seeking relief under the provisions of Chapter 11 of the United States Bankruptcy Code, as a result of the explosion and fire at the Philadelphia refinery complex. The Debtors have also defaulted on a $75 million note payable to a subsidiary of the Partnership. The Partnership has not recorded a valuation allowance related to the note receivable as of December 31, 2019, because management is not yet able to determine the collectability of the note in bankruptcy.
In addition, the Partnership’s subsidiaries retained certain environmental remediation liabilities when the refinery was sold to PES. As of December 31, 2019, the Partnership has funded these environmental remediation liabilities through its wholly-owned captive insurance company, based upon actuarially determined estimates for such costs, and these liabilities are included in the total environmental liabilities discussed below under “Environmental Remediation.” In the event that the PES property is sold in connection with the announcementbankruptcy proceeding, it may be necessary for the Partnership to record additional environmental
remediation liabilities in the future depending upon the proposed use of such property by the buyer of the property; however, management is not currently able to estimate such additional liabilities.
PES has rejected certain of the Partnership’s commercial contracts pursuant to Section 365 of the Bankruptcy Code; however, the impact of the bankruptcy on the Partnership’s commercial contracts and related revenue loss (temporary or permanent) is unknown at this time. In addition, Sunoco Logistics Merger. TwoLP has been successful at acquiring alternative supplies to replace fuel volume lost from PES and does not anticipate any material impact to its business going forward.
Litigation and Contingencies
We may, from time to time, be involved in litigation and claims arising out of theseour operations in the normal course of business. Natural gas and crude oil are flammable and combustible. Serious personal injury and significant property damage can arise in connection with their transportation, storage or use. In the ordinary course of business, we are sometimes threatened with or named as a defendant in various lawsuits were voluntarily dismissedseeking actual and punitive damages for product liability, personal injury and property damage. We maintain liability insurance with insurers in March 2017. The five remaining lawsuits were consolidated as In re Energy Transfer Partners, L.P. Shareholder Litig., C.A. No. 1:17-cv-00044-CCC,amounts and with coverage and deductibles management believes are reasonable and prudent, and which are generally accepted in the industry. However, there can be no assurance that the levels of insurance protection currently in effect will continue to be available at reasonable prices or that such levels will remain adequate to protect us from material expenses related to product liability, personal injury or property damage in the future.
Dakota Access Pipeline
On July 27, 2016, the Standing Rock Sioux Tribe (“SRST”) filed a lawsuit in the United States District Court for the District of Delaware (the “Sunoco Logistics Merger Litigation”Columbia challenging permits issued by the United States Army Corps of Engineers (“USACE”). permitting Dakota Access, LLC (“Dakota Access”) to cross the Missouri River at Lake Oahe in North Dakota. The ETP Unitholder Plaintiffs allege causes of action challengingcase was subsequently amended to challenge an easement issued by the mergerUSACE allowing the pipeline to cross land owned by the USACE adjacent to the Missouri River. Dakota Access and the proxy statement/prospectus filed in connection with the Sunoco Logistics Merger (the “ETP-SXL Merger Proxy”). The ETP Unitholder Plaintiffs sought rescission of the Sunoco Logistics Merger or rescissory damages for ETP unitholders, as well as an award of costs and attorneys’ fees. On October 5, 2017, the ETP-SXL Defendants filed a Motion to Dismiss the ETP Unitholder Plaintiffs’ claims. Rather than respond to the Motion to Dismiss, the ETP Unitholder Plaintiffs chose to voluntarily dismiss their claims without prejudice in November 2017.
The ETP-SXL Defendants cannot predict whether the ETP Unitholder Plaintiffs will refile their claims against the ETP-SXL Defendants or what the outcome of any such lawsuits might be. Nor can the ETP-SXL Defendants predict the amount of time and expense that would be required to resolve such lawsuits. The ETP-SXL Defendants believe the Sunoco Logistics Merger Litigation was without merit and intend to defend vigorously against any future lawsuits challenging the Sunoco Logistics Merger.
Litigation filed by BP Products
On April 30, 2015, BP Products North America Inc.Cheyenne River Sioux Tribe (“BP”CRST”) filed a complaint with the FERC, BP Products North America Inc. v. Sunoco Pipeline L.P., FERC Docket No. OR15-25-000, alleging that Sunoco Pipeline L.P. (“SPLP”), a wholly-owned subsidiary of ETP, entered into certain throughput and deficiency (“T&D”) agreements with shippers other than BP regarding SPLP’s crude oil pipeline between Marysville, Michigan and Toledo, Ohio, and revised its proration policy relating to that pipeline in an unduly discriminatory manner in violation of the Interstate Commerce Act (“ICA”). The complaint asked FERC to (1) terminate the agreements with the other shippers, (2) revise the proration policy, (3) order SPLP to restore BP’s volume history to the level that existed prior to the execution of the agreements with the other shippers, and (4) order damages to BP of approximately $62 million, a figure that BP reduced in subsequent filings to approximately $41 million.
SPLP denied the allegations in the complaint and asserted that neither its contracts nor proration policy were unlawful and that BP’s complaint was barred by the ICA’s two-year statute of limitations provision. Interventions wereintervened. Separate lawsuits filed by the two companies with which SPLP entered into T&D agreements, Marathon Petroleum CompanyOglala Sioux Tribe (“Marathon”OST”) and PBF Holding Companythe Yankton Sioux Tribe (“YST”) were consolidated with this action and Toledo Refining Companyseveral individual tribal members intervened (collectively “PBF”with SRST and CRST, the “Tribes”). A hearingPlaintiffs and Defendants filed cross motions for summary judgment, and the parties await a ruling.
While we believe that the pending lawsuits are unlikely to halt or suspend operation of the pipeline, we cannot assure this outcome. Energy Transfer cannot determine when or how these lawsuits will be resolved or the impact they may have on the matter was heldDakota Access project.
Mont Belvieu Incident
On June 26, 2016, a hydrocarbon storage well located on another operator’s facility adjacent to Lone Star NGL Mont Belvieu’s (“Lone Star”) facilities in November 2016.
On May 26, 2017,Mont Belvieu, Texas, experienced an over-pressurization resulting in a subsurface release. The subsurface release caused a fire at Lone Star’s South Terminal and damage to Lone Star’s storage well operations at its South and North Terminals. Normal operations have resumed at the Administrative Law Judge Patricia E. Hurt (“ALJ”) issued its initial decision (“Initial Decision”) and found that SPLP had acted discriminatorily by entering into T&D agreementsfacilities with the two shippers other than BPexception of one of Lone Star’s storage wells, however, Lone Star is still quantifying the extent of its incurred and recommended that the FERC (1) adopt the FERC Trial Staff’s $13 million alternativeongoing damages proposal, (2) void the T&D agreements with Marathon and PBF, (3) re-set each shipper’s volume historyhas obtained, and will continue to the level prior to the effective dateseek, reimbursement for these losses.
MTBE Litigation
ETC Sunoco Holdings LLC and Sunoco (R&M), LLC (collectively, “Sunoco”) are defendants in lawsuits alleging MTBE contamination of the proration policy, and (4) investigate the proration policy.groundwater. The ALJ held that BP’s claim for damages was not time-barred in its entirety, but that it was not entitled to damages more than two years prior to the filingplaintiffs, state-level governmental entities, assert product liability, nuisance, trespass, negligence, violation of the complaint.
On July 26, 2017, each of the parties filed with the FERC a brief on exceptions to the Initial Decision. SPLP challenged all of the Initial Decision’s primary findings (except for the adjustment to the individual shipper volume histories). BP and FERC Trial Staff challenged various aspects of the Initial Decision related to remedies and the statute of limitations issue. On September 18 and 19, 2017, all parties filed briefs opposing the exceptions of the other parties. The matter is now awaiting a decision by FERC.
Other Litigation and Contingencies
We or our subsidiaries are a party to various legal proceedingsenvironmental laws, and/or regulatory proceedings incidentaldeceptive business practices claims. The plaintiffs seek to our businesses. For each of these matters, we evaluate the merits of the case, our exposure to the matter, possible legal or settlement strategies, the likelihood of an unfavorable outcomerecover compensatory damages, and the availability of insurance coverage. If we determine that an unfavorable outcome of a particular matter is probablein some cases also seek natural resource damages, injunctive relief, punitive damages, and can be estimated, we accrue the contingent obligation, as well as any expected insurance recoverable amounts related to the contingency. attorneys’ fees.
As of December 31, 20172019, Sunoco is a defendant in five cases, including one case each initiated by the States of Maryland and 2016, accrualsRhode Island, one by the Commonwealth of approximately $33 millionPennsylvania and $77 million, respectively, were reflected on our consolidated balance sheets related to these contingent obligations. As new information becomes available, our estimates may change.two by the Commonwealth of Puerto Rico. The impact of these changes may havemore recent Puerto Rico action is a significant effect on our results of operations in a single period.
The outcome of these matters cannot be predicted with certainty and there can be no assurance that the outcome of a particular matter will not resultcompanion case alleging damages for additional sites beyond those at issue in the paymentinitial Puerto Rico action. The actions brought by the State of amountsMaryland and Commonwealth of Pennsylvania have also named as defendants ETO, ETP Holdco Corporation, and Sunoco Partners Marketing & Terminals L.P. (“SPMT”).
It is reasonably possible that have not been accrued for the matter. Furthermore, wea loss may revise accrual amounts prior to resolution of a particular contingency based on changes in facts and circumstances or changesbe realized in the expected outcome. Currently,remaining cases; however, we are not ableunable to estimate the possible lossesloss or a range of possible lossesloss in excess of amounts accrued.
No amounts An adverse determination with respect to one or more of the MTBE cases could have been recorded in our December 31, 2017 or 2016 consolidated balance sheets for contingencies and current litigation, other than amounts disclosed herein.
Environmental Matters
Our operations are subject to extensive federal, tribal, state and local environmental and safety laws and regulations that require expenditures to ensure compliance, including related to air emissions and wastewater discharges, at operating facilities and for remediation at current and former facilities as well as waste disposal sites. Historically, our environmental compliance costs have not had a material adverse effectsignificant impact on our results of operations during the period in which any such adverse determination occurs,
but there can be no assurance that such costs will not be material in the future or that such future compliance with existing, amended or new legal requirements willan adverse determination likely would not have a material adverse effect on our business and operating results. Costs of planning, designing, constructing and operating pipelines, plants and other facilities must incorporate compliance with environmental laws and regulations and safety standards. Failure to comply with these laws and regulations may result in the assessment of administrative, civil and criminal penalties, the imposition of investigatory, remedial and corrective action obligations, the issuance of injunctions in affected areas and the filing of federally authorized citizen suits. Contingent losses related to all significant known environmental matters have been accrued and/or separately disclosed. However, we may revise accrual amounts prior to resolution of a particular contingency based on changes in facts and circumstances or changes in the expected outcome.
Environmental exposures and liabilities are difficult to assess and estimate due to unknown factors such as the magnitude of possible contamination, the timing and extent of remediation, the determination of our liability in proportion to other parties, improvements in cleanup technologies and the extent to which environmental laws and regulations may change in the future. Although environmental costs may have a significant impact on the results of operations for any single period, we believe that such costs will not have a material adverse effect on ourPartnership’s consolidated financial position.
Based on information available at this time and reviews undertaken to identify potential exposure, we believe the amount reserved for environmental matters is adequate to cover the potential exposure for cleanup costs.
In February 2017, we received letters from the DOJ and Louisiana Department of Environmental Quality notifying Sunoco Pipeline L.P. (“SPLP”) and Mid-Valley Pipeline Company (“Mid-Valley”) that enforcement actions were being pursued for three crude oil releases: (a) an estimated 550 barrels released from the Colmesneil-to-Chester pipeline in Tyler County, Texas (“Colmesneil”) operated and owned by SPLP in February of 2013; (b) an estimated 4,509 barrels released from the Longview-to-Mayersville pipeline in Caddo Parish, Louisiana (a/k/a Milepost 51.5) operated by SPLP and owned by Mid-Valley in October of 2014; and (c) an estimated 40 barrels released from the Wakita 4-inch gathering line in Oklahoma operated and owned by SPLP in January of 2015. In May of this year, we presented to the DOJ, EPA and Louisiana Department of Environmental Quality a summary of the emergency response and remedial efforts taken by SPLP after the releases occurred as well as operational changes instituted by SPLP to reduce the likelihood of future releases. In July, we had a follow-up meeting with the DOJ, EPA and Louisiana Department of Environmental Quality during which the agencies presented their initial demand for civil penalties and injunctive relief. In short, the DOJ and EPA proposed federal penalties totaling $7 million for the three releases along with a demand for injunctive relief, and Louisiana Department of Environmental Quality proposed a state penalty of approximately $1 million to resolve the Caddo Parish release. Neither Texas nor Oklahoma state agencies have joined the penalty discussions at this point. We are currently working on a counteroffer to the Louisiana Department of Environmental Quality.
On January 3, 2018, PADEP issued an Administrative Order to Sunoco Pipeline L.P. directing that work on the Mariner East 2 and 2X pipelines be stopped. The Administrative Order detailed alleged violations of the permits issued by PADEP in
February of 2017, during the construction of the project. Sunoco Pipeline L.P. began working with PADEP representatives immediately after the Administrative Order was issued to resolve the compliance issues. Those compliance issues could not be fully resolved by the deadline to appeal the Administrative Order, so Sunoco Pipeline L.P. took an appeal of the Administrative Order to the Pennsylvania Environmental Hearing Board on February 2, 2018. On February 8, 2018, Sunoco Pipeline L.P. entered into a Consent Order and Agreement with PADEP that (1) withdraws the Administrative Order; (2) establishes requirements for compliance with permits on a going forward basis; (3) resolves the non-compliance alleged in the Administrative Order; and (4) conditions restart of work on an agreement by Sunoco Pipeline L.P. to pay a $12.6 million civil penalty to the Commonwealth of Pennsylvania. In the Consent Order and agreement, Sunoco Pipeline L.P. admits to the factual allegations, but does not admit to the conclusions of law that were made by PADEP. PADEP also found in the Consent Order and Agreement that Sunoco Pipeline L.P. had adequately addressed the issues raised in the Administrative Order and demonstrated an ability to comply with the permits. Sunoco Pipeline L.P. concurrently filed a request to the Pennsylvania Environmental Hearing Board to discontinue the appeal of the Administrative Order. That request was granted on February 8, 2018.
Environmental Remediation
We accrue environmental remediation costs for work at identified sites where an assessment has indicated that cleanup costs are probable and reasonably estimable. Such accruals are undiscounted and are based on currently available information, estimated timing of remedial actions and related inflation assumptions, existing technology and presently enacted laws and regulations. If a range of probable environmental cleanup costs exists for an identified site, the minimum of the range is accrued unless some other point in the range is more likely in which case the most likely amount in the range is accrued.
Fair Value of Financial Instruments
The carrying amounts of cash and cash equivalents, accounts receivable and accounts payable approximate their fair value.
Based on the estimated borrowing rates currently available to us and our subsidiaries for loans with similar terms and average maturities, the aggregate fair value and carrying amount of our debt obligations as of December 31, 2019 was $54.08 billion and$50.35 billion , respectively. As of December 31, 2018, the aggregate fair value and carrying amount of our debt obligations was $39.54 billion and $40.51 billion, respectively. The fair value of our consolidated debt obligations is a Level 2 valuation based on the observable inputs used for similar liabilities.
We have commodity derivatives, interest rate derivatives and embedded derivatives in our preferred units that are accounted for as assets and liabilities at fair value in our consolidated balance sheets. We determine the fair value of our assets and liabilities subject to fair value measurement by using the highest possible “level” of inputs. Level 1 inputs are observable quotes in an active market for identical assets and liabilities. We consider the valuation of marketable securities and commodity derivatives transacted through a clearing broker with a published price from the appropriate exchange as a Level 1 valuation. Level 2 inputs are inputs observable for similar assets and liabilities. We consider OTC commodity derivatives entered into directly with third parties as a Level 2 valuation since the values of these derivatives are quoted on an exchange for similar
transactions. Additionally, we consider our options transacted through our clearing broker as having Level 2 inputs due to the level of activity of these contracts on the exchange in which they trade. We consider the valuation of our interest rate derivatives as Level 2 as the primary input, the LIBOR curve, is based on quotes from an active exchange of Eurodollar futures for the same period as the future interest swap settlements. Level 3 inputs are unobservable. During the year ended December 31, 2019, 0 transfers were made between any levels within the fair value hierarchy.
The following tables summarize the fair value of our financial assets and liabilities measured and recorded at fair value on a recurring basis as of December 31, 2019 and 2018 based on inputs used to derive their fair values:
|
| | | | | | | | | | | |
| | Fair Value Total | | Fair Value Measurements at December 31, 2019 |
| | Level 1 | | Level 2 |
| Assets: | | | | | |
| Commodity derivatives: | | | | | |
| Natural Gas: | | | | | |
| Basis Swaps IFERC/NYMEX | $ | 17 |
| | $ | 17 |
| | $ | — |
|
| Swing Swaps IFERC | 1 |
| | — |
| | 1 |
|
| Fixed Swaps/Futures | 65 |
| | 65 |
| | — |
|
| Forward Physical Contracts | 3 |
| | — |
| | 3 |
|
| Power: | | | | | |
| Forwards | 11 |
| | — |
| | 11 |
|
| Futures | 4 |
| | 4 |
| | — |
|
| Options – Puts | 1 |
| | 1 |
| | — |
|
| Options – Calls | 1 |
| | 1 |
| | — |
|
| NGLs – Forwards/Swaps | 260 |
| | 260 |
| | — |
|
| Refined Products – Futures | 8 |
| | 8 |
| | — |
|
| Crude – Forwards/Swaps | 13 |
| | 13 |
| | — |
|
| Total commodity derivatives | 384 |
| | 369 |
| | 15 |
|
| Other non-current assets | 31 |
| | 20 |
| | 11 |
|
| Total assets | $ | 415 |
| | $ | 389 |
| | $ | 26 |
|
| Liabilities: | | | | | |
| Interest rate derivatives | $ | (399 | ) | | $ | — |
| | $ | (399 | ) |
| Commodity derivatives: | | | | | |
| Natural Gas: | | | | | |
| Basis Swaps IFERC/NYMEX | (49 | ) | | (49 | ) | | — |
|
| Swing Swaps IFERC | (1 | ) | | — |
| | (1 | ) |
| Fixed Swaps/Futures | (43 | ) | | (43 | ) | | — |
|
| Power: | | | | | |
| Forwards | (5 | ) | | — |
| | (5 | ) |
| Futures | (3 | ) | | (3 | ) | | — |
|
| NGLs – Forwards/Swaps | (278 | ) | | (278 | ) | | — |
|
| Refined Products – Futures | (10 | ) | | (10 | ) | | — |
|
| Total commodity derivatives | (389 | ) | | (383 | ) | | (6 | ) |
| Total liabilities | $ | (788 | ) | | $ | (383 | ) | | $ | (405 | ) |
|
| | | | | | | | | | | |
| | Fair Value Total | | Fair Value Measurements at December 31, 2018 |
| | Level 1 | | Level 2 |
| Assets: | | | | | |
| Commodity derivatives: | | | | | |
| Natural Gas: | | | | | |
| Basis Swaps IFERC/NYMEX | $ | 42 |
| | $ | 42 |
| | $ | — |
|
| Swing Swaps IFERC | 52 |
| | 8 |
| | 44 |
|
| Fixed Swaps/Futures | 97 |
| | 97 |
| | — |
|
| Forward Physical Contracts | 20 |
| | — |
| | 20 |
|
| Power: | | | | | |
| Power – Forwards | 48 |
| | — |
| | 48 |
|
| Futures | 1 |
| | 1 |
| | — |
|
| Options – Calls | 1 |
| | 1 |
| | — |
|
| NGLs – Forwards/Swaps | 291 |
| | 291 |
| | — |
|
| Refined Products – Futures | 7 |
| | 7 |
| | — |
|
| Crude - Forwards/Swaps | 1 |
| | 1 |
| | — |
|
| Total commodity derivatives | 560 |
| | 448 |
| | 112 |
|
| Other non-current assets | 26 |
| | 17 |
| | 9 |
|
| Total assets | $ | 586 |
| | $ | 465 |
| | $ | 121 |
|
| Liabilities: | | | | | |
| Interest rate derivatives | $ | (163 | ) | | $ | — |
| | $ | (163 | ) |
| Commodity derivatives: | | | | | |
| Natural Gas: | | | | | |
| Basis Swaps IFERC/NYMEX | (91 | ) | | (91 | ) | | — |
|
| Swing Swaps IFERC | (40 | ) | | — |
| | (40 | ) |
| Fixed Swaps/Futures | (88 | ) | | (88 | ) | | — |
|
| Forward Physical Contracts | (21 | ) | | — |
| | (21 | ) |
| Power: | | | | | |
| Forwards | (42 | ) | | — |
| | (42 | ) |
| Futures | (1 | ) | | (1 | ) | | — |
|
| NGLs – Forwards/Swaps | (224 | ) | | (224 | ) | | — |
|
| Refined Products – Futures | (15 | ) | | (15 | ) | | — |
|
| Crude - Forwards/Swaps | (61 | ) | | (61 | ) | | — |
|
| Total commodity derivatives | (583 | ) | | (480 | ) | | (103 | ) |
| Total liabilities | $ | (746 | ) | | $ | (480 | ) | | $ | (266 | ) |
Contributions in Aid of Construction Costs
On certain of our capital projects, third parties are obligated to reimburse us for all or a portion of project expenditures. The majority of such arrangements are associated with pipeline construction and production well tie-ins. Contributions in aid of construction costs (“CIAC”) are netted against our project costs as they are received, and any CIAC which exceeds our total project costs, is recognized as other income in the period in which it is realized.
Shipping and Handling Costs
Shipping and handling costs are included in cost of products sold, except for shipping and handling costs related to fuel consumed for compression and treating which are included in operating expenses.
Costs and Expenses
Cost of products sold include actual cost of fuel sold, adjusted for the effects of our hedging and other commodity derivative activities, and the cost of appliances, parts and fittings. Operating expenses include all costs incurred to provide products to customers, including compensation for operations personnel, insurance costs, vehicle maintenance, advertising costs, purchasing costs and plant operations. Selling, general and administrative expenses include all partnership related expenses and compensation for executive, partnership, and administrative personnel.
We record the collection of taxes to be remitted to government authorities on a net basis except for our all other segment in which consumer excise taxes on sales of refined products and merchandise are included in both revenues and costs and expenses in the consolidated statements of operations, with no effect on net income. For the years ended December 31, 2019, 2018 and 2017, excise taxes collected by Sunoco LP were $386 million, $370 million and $234 million, respectively.
Issuances of Subsidiary Units
We record changes in our ownership interest of our subsidiaries as equity transactions, with no gain or loss recognized in consolidated net income or comprehensive income. For example, upon our subsidiary’s issuance of common units in a public offering, we record any difference between the amount of consideration received or paid and the amount by which the noncontrolling interests are adjusted as a change in partners’ capital.
Income Taxes
ETO is a publicly traded limited partnership and is not taxable for federal and most state income tax purposes. As a result, our earnings or losses, to the extent not included in a taxable subsidiary, for federal and most state purposes are included in the tax returns of the individual partners. Net earnings for financial statement purposes may differ significantly from taxable income reportable to our preferred unitholders as a result of differences between the tax basis and financial basis of assets and liabilities, differences between the tax accounting and financial accounting treatment of certain items, and due to allocation requirements related to taxable income under our Fifth Amended and Restated Agreement of Limited Partnership (the “Partnership Agreement”).
As a publicly traded limited partnership, we are subject to a statutory requirement that our “qualifying income” (as defined by the Internal Revenue Code, related Treasury Regulations, and Internal Revenue Service (“IRS”) pronouncements) exceed 90% of our total gross income, determined on a calendar year basis. If our qualifying income does not meet this statutory requirement, ETO would be taxed as a corporation for federal and state income tax purposes. For the years ended December 31, 2019, 2018 and 2017, our qualifying income met the statutory requirement.
The Partnership conducts certain activities through corporate subsidiaries which are subject to federal, state and local income taxes. These corporate subsidiaries include ETP Holdco, Inland Corporation, Sunoco Property Company LLC and Aloha. The Partnership and its corporate subsidiaries account for income taxes under the asset and liability method.
Under this method, deferred tax assets and liabilities are recognized for the estimated future tax consequences attributable to differences between the financial statement carrying amounts of existing assets and liabilities and their respective tax basis. Deferred tax assets and liabilities are measured using enacted tax rates in effect for the year in which those temporary differences are expected to be recovered or settled. The effect on deferred tax assets and liabilities of a change in tax rate is recognized in earnings in the period that includes the enactment date. Valuation allowances are established when necessary to reduce deferred tax assets to the amounts more likely than not to be realized.
The determination of the provision for income taxes requires significant judgment, use of estimates, and the interpretation and application of complex tax laws. Significant judgment is required in assessing the timing and amounts of deductible and taxable items and the probability of sustaining uncertain tax positions. The benefits of uncertain tax positions are recorded in our financial statements only after determining a more-likely-than-not probability that the uncertain tax positions will withstand challenge, if any, from taxing authorities. When facts and circumstances change, we reassess these probabilities and record any changes through the provision for income taxes.
Accounting for Derivative Instruments and Hedging Activities
For qualifying hedges, we formally document, designate and assess the effectiveness of transactions that receive hedge accounting treatment and the gains and losses offset related results on the hedged item in the statement of operations. The market prices used to value our financial derivatives and related transactions have been determined using independent third-party prices, readily available market information, broker quotes and appropriate valuation techniques.
At inception of a hedge, we formally document the relationship between the hedging instrument and the hedged item, the risk management objectives, and the methods used for assessing and testing effectiveness and how any ineffectiveness will be measured and recorded. We also assess, both at the inception of the hedge and on a quarterly basis, whether the derivatives that are used in our hedging transactions are highly effective in offsetting changes in cash flows. If we determine that a derivative is no longer highly effective as a hedge, we discontinue hedge accounting prospectively by including changes in the fair value of the derivative in net income for the period.
If we designate a commodity hedging relationship as a fair value hedge, we record the changes in fair value of the hedged asset or liability in cost of products sold in our consolidated statements of operations. This amount is offset by the changes in fair value of the related hedging instrument. Any ineffective portion or amount excluded from the assessment of hedge ineffectiveness is also included in the cost of products sold in the consolidated statements of operations.
Cash flows from derivatives accounted for as cash flow hedges are reported as cash flows from operating activities, in the same category as the cash flows from the items being hedged.
If we designate a derivative financial instrument as a cash flow hedge and it qualifies for hedge accounting, the change in the fair value is deferred in AOCI until the underlying hedged transaction occurs. Any ineffective portion of a cash flow hedge’s change in fair value is recognized each period in earnings. Gains and losses deferred in AOCI related to cash flow hedges remain in AOCI until the underlying physical transaction occurs, unless it is probable that the forecasted transaction will not occur by the end of the originally specified time period or within an additional two-month period of time thereafter. For financial derivative instruments that do not qualify for hedge accounting, the change in fair value is recorded in cost of products sold in the consolidated statements of operations.
We manage a portion of our interest rate exposures by utilizing interest rate swaps and similar instruments. Certain of our interest rate derivatives are accounted for as either cash flow hedges or fair value hedges. For interest rate derivatives accounted for as either cash flow or fair value hedges, we report realized gains and losses and ineffectiveness portions of those hedges in interest expense. For interest rate derivatives not designated as hedges for accounting purposes, we report realized and unrealized gains and losses on those derivatives in “Gains (losses) on interest rate derivatives” in the consolidated statements of operations.
In August 2017, the FASB issued ASU No. 2017-12, Derivatives and Hedging (Topic 815): Targeted Improvements to Accounting for Hedging Activities. The amendments in this update improve the financial reporting of hedging relationships to better portray the economic results of an entity’s risk management activities in its financial statements. In addition, the amendments in this update make certain targeted improvements to simplify the application of the hedge accounting guidance in current GAAP. The Partnership adopted the new rules in the first quarter of 2019, and the adoption of the new accounting rules did not have a material impact on the consolidated financial statements and related disclosures.
Non-Cash Compensation
For awards of restricted units, we recognize compensation expense over the vesting period based on the grant-date fair value, which is determined based on the market price of the underlying common units on the grant date. For awards of cash restricted units, we remeasure the fair value of the award at the end of each reporting period based on the market price of the underlying common units as of the reporting date, and the fair value is recorded in other non-current liabilities on our consolidated balance sheets.
Pensions and Other Postretirement Benefit Plans
The Partnership recognizes the overfunded or underfunded status of defined benefit pension and other postretirement plans, measured as the difference between the fair value of the plan assets and the benefit obligation (the projected benefit obligation for pension plans and the accumulated postretirement benefit obligation for other postretirement plans). Each overfunded plan is recognized as an asset and each underfunded plan is recognized as a liability. Changes in the funded status of the plan are recorded in the year in which the change occurs within AOCI in equity or, for entities applying regulatory accounting, as a regulatory asset or regulatory liability.
Allocation of Income
For purposes of maintaining partner capital accounts, the Partnership Agreement specifies that items of income and loss shall generally be allocated among the partners in accordance with their percentage interests. The capital account provisions of our Partnership Agreement incorporate principles established for United States Federal income tax purposes and may not be comparable to the partners’ capital balances reflected under GAAP in our consolidated financial statements. Subsequent to
the Energy Transfer Merger, our general partner owns a non-economic interest in us and, therefore, our net income for partners’ capital and statement of operations presentation purposes is allocated entirely to the Limited Partners.
| |
| 3. | ACQUISITIONS, DIVESTITURES AND RELATED TRANSACTIONS: |
2019 and 2020 Transactions
ET Contribution of SemGroup Assets to ETO
On December 5, 2019, ET completed the acquisition of SemGroup. During the first quarter of 2020, ET contributed certain SemGroup assets to ETO through sale and contribution transactions. The Partnership and SemGroup are under common control by ET subsequent to ET’s acquisition of SemGroup; therefore, we will account for these transactions as reorganizations of entities under common control. Accordingly, beginning with the quarter ending March 31, 2020, the Partnership’s consolidated financial statements will be retrospectively adjusted to reflect the consolidation of the contributed SemGroup businesses beginning December 5, 2019 (the date ET acquired SemGroup).
The following table represents the preliminary fair value, as of December 5, 2019, of the SemGroup assets and liabilities transferred from ET to ETO:
|
| | | |
| | At December 5, 2019 |
| Total current assets | $ | 548 |
|
| Property, plant and equipment | 2,544 |
|
| Other non-current assets | 574 |
|
| Goodwill | 230 |
|
| Intangible assets | 280 |
|
| Total assets | 4,176 |
|
| | |
| Total current liabilities | 480 |
|
| Long-term debt, less current maturities | 812 |
|
| Other non-current liabilities | 109 |
|
| Total liabilities | 1,401 |
|
| | |
| Noncontrolling interest | 335 |
|
| | |
| Partners’ capital | 2,440 |
|
| Total liabilities and partners’ capital | $ | 4,176 |
|
2018 Transactions
ET Contribution of Assets to ETO
Immediately prior to the closing of the Energy Transfer Merger discussed in Note 1, ET contributed the following to ETO:
| |
| • | 2,263,158 common units representing limited partner interests in Sunoco LP to ETO in exchange for 2,874,275 ETO common units; |
| |
| • | 100 percent of the limited liability company interests in Sunoco GP LLC, the sole general partner of Sunoco LP, and all of the IDRs in Sunoco LP, to ETO in exchange for 42,812,389 ETO common units; |
| |
| • | 12,466,912 common units representing limited partner interests in USAC and 100 percent of the limited liability company interests in USA Compression GP, LLC, the general partner of USAC, to ETO in exchange for 16,134,903 ETO common units; and |
| |
| • | a 100 percent limited liability company interest in Lake Charles LNG and a 60 percent limited liability company interest in each of Energy Transfer LNG Export, LLC, ET Crude Oil Terminals, LLC and ETC Illinois LLC to ETO in exchange for 37,557,815 ETO common units. |
USAC Acquisition
On April 2, 2018, ET acquired a controlling interest in USAC, a publicly traded partnership that provides compression services in the United States. Specifically the Partnership acquired (i) all of the outstanding limited liability company interests in USA Compression GP, LLC (“USAC GP”), the general partner of USAC, and (ii) 12,466,912 USAC common units representing limited partner interests in USAC for cash consideration equal to $250 million (the “USAC Transaction”). Concurrently, USAC cancelled its IDRs and converted its economic general partner interest into a non-economic general partner interest in exchange for the issuance of 8,000,000 USAC common units to USAC GP.
Concurrent with these transactions, ETO contributed to USAC all of the issued and outstanding membership interests of CDM for aggregate consideration of approximately $1.7 billion, consisting of (i) 19,191,351 USAC common units, (ii) 6,397,965 units of a newly authorized and established class of units representing limited partner interests in USAC (“USAC Class B Units”) and (iii) $1.23 billion in cash, including customary closing adjustments (the “CDM Contribution”). The USAC Class B Units are a new class of partnership interests of USAC that have substantially all of the rights and obligations of a USAC common unit, except the USAC Class B Units will not participate in distributions for the first four quarters following the closing date of April 2, 2018. Each USAC Class B Unit will automatically convert into one USAC common unit on the first business day following the record date attributable to the quarter ending June 30, 2019.
As noted above, ET contributed its interests in USAC to ETO in October 2018. ET’s contribution of its interests in USAC was a transaction between entities under common control; therefore, the Partnership’s consolidated financial statements reflect USAC on a consolidated basis beginning April 2, 2018, the date that ET obtained control of USAC. The Partnership had previously deconsolidated CDM upon its contribution to USAC on April 2, 2018; however, due to the retrospective consolidation of USAC as of that date, CDM is reflected as a consolidated subsidiary for all periods presented herein.
Summary of Assets Acquired and Liabilities Assumed
The USAC Transaction was recorded using the acquisition method of accounting, which requires, among other things, that assets acquired and liabilities assumed be recognized on the balance sheet at their fair values as of the acquisition date.
The total purchase price was allocated as follows:
|
| | | |
| | At April 2, 2018 |
| Total current assets | $ | 786 |
|
| Property, plant and equipment | 1,332 |
|
| Other non-current assets | 15 |
|
Goodwill(1) | 366 |
|
| Intangible assets | 222 |
|
| Total assets | 2,721 |
|
| | |
| Total current liabilities | 110 |
|
| Long-term debt, less current maturities | 1,527 |
|
| Other non-current liabilities | 2 |
|
| Total liabilities | 1,639 |
|
| | |
| Noncontrolling interest | 832 |
|
| | |
| Total consideration | 250 |
|
Cash received(2) | 711 |
|
Total consideration, net of cash received(2) | $ | (461 | ) |
| |
(1) | None of the goodwill is expected to be deductible for tax purposes. Goodwill recognized from the business combination primarily relates to the value attributed to additional growth opportunities, synergies and operating leverage within USAC’s operations. |
| |
(2) | Cash received represents cash and cash equivalents held by USAC as of the acquisition date. |
The fair values of the assets acquired and liabilities assumed were determined using various valuation techniques, including the income and market approaches.
Sunoco LP Retail Store Divestment
On January 23, 2018, Sunoco LP completed the disposition of assets pursuant to the purchase agreement with 7-Eleven, Inc. (the “7-Eleven Transaction”). As a result of the 7-Eleven Transaction, previously eliminated wholesale motor fuel sales to Sunoco LP’s retail locations are reported as wholesale motor fuel sales to third parties. Also, the related accounts receivable from such sales are no longer eliminated from the Partnership’s consolidated balance sheets and are reported as accounts receivable.
In connection with the 7-Eleven Transaction, Sunoco LP entered into a Distributor Motor Fuel Agreement dated as of January 23, 2018 (“Supply Agreement”), with 7-Eleven and SEI Fuel (collectively, “Distributor”). The Supply Agreement consists of a 15-year take-or-pay fuel supply arrangement under which Sunoco LP has agreed to supply approximately 2.0 billion gallons of fuel annually plus additional aggregate growth volumes of up to 500 million gallons to be added incrementally over the first four years. For the period from January 1, 2018 through January 22, 2018 and the years ended December 31, 2017, Sunoco LP recorded sales to the sites that were subsequently sold to 7-Eleven of $199 million and $3.2 billion, respectively, which were eliminated in consolidation. Sunoco LP received payments on trade receivables of $3.7 billion and $3.4 billion, respectively, from 7-Eleven for the years ended December 31, 2019 and December 31, 2018 subsequent to the closing of the sale.
The Partnership has concluded that it meets the accounting requirements for reporting the financial position, results of operations and cash flows of Sunoco LP’s retail divestment as discontinued operations.
There were no results of operations associated with discontinued operations for the year ended December 31, 2019. The results of operations associated with discontinued operations for the years ended December 31, 2018 and 2017 are presented in the following table:
|
| | | | | | | |
| | Years Ended December 31, |
| | 2018 | | 2017 |
| REVENUES | $ | 349 |
| | $ | 6,964 |
|
| | | | |
| COSTS AND EXPENSES | | | |
| Cost of products sold | 305 |
| | 5,806 |
|
| Operating expenses | 61 |
| | 763 |
|
| Depreciation, depletion and amortization | — |
| | 34 |
|
| Selling, general and administrative | 7 |
| | 168 |
|
| Impairment losses | — |
| | 285 |
|
| Total costs and expenses | 373 |
| | 7,056 |
|
| OPERATING LOSS | (24 | ) | | (92 | ) |
| OTHER EXPENSE | | | |
| Interest expense, net | 2 |
| | 36 |
|
| Loss on extinguishment of debt | 20 |
| | — |
|
| Other, net | 61 |
| | 1 |
|
| LOSS FROM DISCONTINUED OPERATIONS BEFORE INCOME TAX EXPENSE | (107 | ) | | (129 | ) |
| Income tax expense | 158 |
| | 48 |
|
| LOSS FROM DISCONTINUED OPERATIONS, NET OF INCOME TAXES | $ | (265 | ) | | $ | (177 | ) |
2017 Transactions
Rover Contribution Agreement
In October 2017, ETO completed the previously announced contribution transaction with a fund managed by Blackstone Energy Partners and Blackstone Capital Partners, pursuant to which ETO exchanged a 49.9% interest in the holding company that owns 65% of the Rover pipeline (“Rover Holdco”). As a result, Rover Holdco is now owned 50.1% by ETO and 49.9%
by Blackstone. Upon closing, Blackstone contributed funds to reimburse ETO for its pro rata share of the Rover construction costs incurred by ETO through the closing date, along with the payment of additional amounts subject to certain adjustments.
ETO and Sunoco Logistics Merger
As discussed in Note 1, in April 2017, Energy Transfer Partners, L.P. and Sunoco Logistics completed the Sunoco Logistics Merger.
Permian Express Partners
In February 2017, the Partnership formed PEP, a strategic joint venture with ExxonMobil. The Partnership contributed its Permian Express 1, Permian Express 2, Permian Longview and Louisiana Access pipelines. ExxonMobil contributed its Longview to Louisiana and Pegasus pipelines, Hawkins gathering system, an idle pipeline in southern Oklahoma, and its Patoka, Illinois terminal. Assets contributed to PEP by ExxonMobil were reflected at fair value on the Partnership’s consolidated balance sheet at the date of the contribution, including $547 million of intangible assets and $435 million of property, plant and equipment.
In July 2017, ETO contributed an approximate 15% ownership interest in Dakota Access and ETCO to PEP, which resulted in an increase in ETO’s ownership interest in PEP to approximately 88%. ETO maintains a controlling financial and voting interest in PEP and is the operator of all of the assets. As such, PEP is reflected as a consolidated subsidiary of the Partnership. ExxonMobil’s interest in PEP is reflected as noncontrolling interest in the consolidated balance sheets. ExxonMobil’s contribution resulted in an increase of $988 million in noncontrolling interest, which is reflected in “Capital contributions from noncontrolling interest” in the consolidated statement of equity.
Bakken Equity Sale
In February 2017, Bakken Holdings Company LLC, an entity in which ETO indirectly owns a 100% membership interest, sold a 49% interest in its wholly-owned subsidiary, Bakken Pipeline Investments LLC, to MarEn Bakken Company LLC, an entity jointly owned by MPLX LP and Enbridge Energy Partners, L.P., for $2.00 billion in cash. Bakken Pipeline Investments LLC indirectly owns a 75% interest in each of Dakota Access and ETCO. The remaining 25% of each of Dakota Access and ETCO is owned by wholly-owned subsidiaries of Phillips 66. ETO continues to consolidate Dakota Access and ETCO subsequent to this transaction.
| |
| 4. | ADVANCES TO AND INVESTMENTS IN UNCONSOLIDATED AFFILIATES: |
Citrus
We own CrossCountry Energy, LLC, a wholly-owned subsidiary of ETO, which in turn owns a 50% interest in Citrus. The other 50% interest in Citrus is owned by a subsidiary of KMI. Citrus owns 100% of FGT, an approximately 5,362-mile natural gas pipeline system that originates in Texas and delivers natural gas to the Florida peninsula. Our investment in Citrus is reflected in our interstate transportation and storage segment.
FEP
We have a 50% interest in FEP which owns an approximately 185-mile natural gas pipeline that originates in Conway County, Arkansas, continues eastward through White County, Arkansas and terminates at an interconnect with Trunkline in Panola County, Mississippi. Our investment in FEP is reflected in the interstate transportation and storage segment. The Partnership evaluated its investment in FEP for impairment as of December 31, 2017, based on FASB Accounting Standards Codification 323, Investments - Equity Method and Joint Ventures. The Partnership recorded an impairment of its investment in FEP of $141 million during the year ended December 31, 2017 due to a negative outlook for long-term transportation contracts as a result of a decrease in production in the Fayetteville basin and a customer re-contracting with a competitor.
MEP
We own a 50% interest in MEP, which owns approximately 500 miles of natural gas pipeline that extends from Southeast Oklahoma, across Northeast Texas, Northern Louisiana and Central Mississippi to an interconnect with the Transcontinental natural gas pipeline system in Butler, Alabama. Our investment in MEP is reflected in the interstate transportation and storage segment.
The carrying values of the Partnership’s advances to and investments in unconsolidated affiliates as of December 31, 2019 and 2018 were as follows:
|
| | | | | | | |
| | December 31, |
| | 2019 | | 2018 |
| Citrus | $ | 1,876 |
| | $ | 1,737 |
|
| FEP | 218 |
| | 107 |
|
| MEP | 429 |
| | 225 |
|
| Others | 495 |
| | 567 |
|
| Total | $ | 3,018 |
| | $ | 2,636 |
|
The following table presents equity in earnings (losses) of unconsolidated affiliates:
|
| | | | | | | | | | | |
| | Years Ended December 31, |
| | 2019 | | 2018 | | 2017 |
| Citrus | $ | 148 |
| | $ | 141 |
| | $ | 144 |
|
| FEP | 59 |
| | 55 |
| | 53 |
|
| MEP | 15 |
| | 31 |
| | 38 |
|
| Other | 76 |
| | 117 |
| | (91 | ) |
| Total equity in earnings of unconsolidated affiliates | $ | 298 |
| | $ | 344 |
| | $ | 144 |
|
Summarized Financial Information
The following tables present aggregated selected balance sheet and income statement data for our unconsolidated affiliates, Citrus, FEP and MEP (on a 100% basis) for all periods presented, except as noted below:
|
| | | | | | | |
| | December 31, |
| | 2019 | | 2018 |
| Current assets | $ | 247 |
| | $ | 212 |
|
| Property, plant and equipment, net | 7,680 |
| | 7,800 |
|
| Other assets | 40 |
| | 39 |
|
| Total assets | $ | 7,967 |
| | $ | 8,051 |
|
| | | | |
| Current liabilities | $ | 738 |
| | $ | 1,534 |
|
| Non-current liabilities | 3,242 |
| | 3,439 |
|
| Equity | 3,987 |
| | 3,078 |
|
| Total liabilities and equity | $ | 7,967 |
| | $ | 8,051 |
|
|
| | | | | | | | | | | |
| | Years Ended December 31, |
| | 2019 | | 2018 | | 2017 |
| Revenue | $ | 1,192 |
| | $ | 1,249 |
| | $ | 1,358 |
|
| Operating income | 683 |
| | 723 |
| | 407 |
|
| Net income | 443 |
| | 460 |
| | 145 |
|
In addition to the equity method investments described above we have other equity method investments which are not significant to our consolidated financial statements.
Our debt obligations consist of the following:
|
| | | | | | | |
| | December 31, |
| | 2019 | | 2018 |
| ETO Debt | | | |
| 9.70% Senior Notes due March 15, 2019 | $ | — |
| | $ | 400 |
|
| 9.00% Senior Notes due April 15, 2019 | — |
| | 450 |
|
5.50% Senior Notes due February 15, 2020 (1) | 250 |
| | 250 |
|
5.75% Senior Notes due September 1, 2020 (1) | 400 |
| | 400 |
|
4.15% Senior Notes due October 1, 2020 (1) | 1,050 |
| | 1,050 |
|
7.50% Senior Notes due October 15, 2020 (1) | 1,135 |
| | — |
|
| 4.40% Senior Notes due April 1, 2021 | 600 |
| | 600 |
|
| 4.65% Senior Notes due June 1, 2021 | 800 |
| | 800 |
|
| 5.20% Senior Notes due February 1, 2022 | 1,000 |
| | 1,000 |
|
| 4.65% Senior Notes due February 15, 2022 | 300 |
| | 300 |
|
| 5.875% Senior Notes due March 1, 2022 | 900 |
| | 900 |
|
| 5.00% Senior Notes due October 1, 2022 | 700 |
| | 700 |
|
| 3.45% Senior Notes due January 15, 2023 | 350 |
| | 350 |
|
| 3.60% Senior Notes due February 1, 2023 | 800 |
| | 800 |
|
| 4.25% Senior Notes due March 15, 2023 | 995 |
| | — |
|
| 4.20% Senior Notes due September 15, 2023 | 500 |
| | 500 |
|
| 4.50% Senior Notes due November 1, 2023 | 600 |
| | 600 |
|
| 5.875% Senior Notes due January 15, 2024 | 1,127 |
| | — |
|
| 4.90% Senior Notes due February 1, 2024 | 350 |
| | 350 |
|
| 7.60% Senior Notes due February 1, 2024 | 277 |
| | 277 |
|
| 4.25% Senior Notes due April 1, 2024 | 500 |
| | 500 |
|
| 4.50% Senior Notes due April 15, 2024 | 750 |
| | — |
|
| 9.00% Debentures due November 1, 2024 | 65 |
| | 65 |
|
| 4.05% Senior Notes due March 15, 2025 | 1,000 |
| | 1,000 |
|
| 5.95% Senior Notes due December 1, 2025 | 400 |
| | 400 |
|
| 4.75% Senior Notes due January 15, 2026 | 1,000 |
| | 1,000 |
|
| 3.90% Senior Notes due July 15, 2026 | 550 |
| | 550 |
|
| 4.20% Senior Notes due April 15, 2027 | 600 |
| | 600 |
|
| 5.50% Senior Notes due June 1, 2027 | 956 |
| | — |
|
| 4.00% Senior Notes due October 1, 2027 | 750 |
| | 750 |
|
| 4.95% Senior Notes due June 15, 2028 | 1,000 |
| | 1,000 |
|
| 5.25% Senior Notes due April 15, 2029 | 1,500 |
| | — |
|
| 8.25% Senior Notes due November 15, 2029 | 267 |
| | 267 |
|
| 4.90% Senior Notes due March 15, 2035 | 500 |
| | 500 |
|
| 6.625% Senior Notes due October 15, 2036 | 400 |
| | 400 |
|
| 5.80% Senior Notes due June 15, 2038 | 500 |
| | 500 |
|
| 7.50% Senior Notes due July 1, 2038 | 550 |
| | 550 |
|
| 6.85% Senior Notes due February 15, 2040 | 250 |
| | 250 |
|
| 6.05% Senior Notes due June 1, 2041 | 700 |
| | 700 |
|
| 6.50% Senior Notes due February 1, 2042 | 1,000 |
| | 1,000 |
|
| 6.10% Senior Notes due February 15, 2042 | 300 |
| | 300 |
|
| 4.95% Senior Notes due January 15, 2043 | 350 |
| | 350 |
|
| 5.15% Senior Notes due February 1, 2043 | 450 |
| | 450 |
|
| 5.95% Senior Notes due October 1, 2043 | 450 |
| | 450 |
|
| 5.30% Senior Notes due April 1, 2044 | 700 |
| | 700 |
|
| 5.15% Senior Notes due March 15, 2045 | 1,000 |
| | 1,000 |
|
| 5.35% Senior Notes due May 15, 2045 | 800 |
| | 800 |
|
| 6.125% Senior Notes due December 15, 2045 | 1,000 |
| | 1,000 |
|
| 5.30% Senior Notes due April 15, 2047 | 900 |
| | 900 |
|
| 5.40% Senior Notes due October 1, 2047 | 1,500 |
| | 1,500 |
|
| 6.00% Senior Notes due June 15, 2048 | 1,000 |
| | 1,000 |
|
| 6.25% Senior Notes due April 15, 2049 | 1,750 |
| | — |
|
| Floating Rate Junior Subordinated Notes due November 1, 2066 | 546 |
| | 546 |
|
| ETO $2.00 billion Term Loan facility due October 2022 | 2,000 |
| | — |
|
| ETO $5.00 billion Revolving Credit Facility due December 2023 | 4,214 |
| | 3,694 |
|
|
| | | | | | | |
| Unamortized premiums, discounts and fair value adjustments, net | (5 | ) | | 17 |
|
| Deferred debt issuance costs | (207 | ) | | (178 | ) |
| | 42,120 |
| | 32,288 |
|
| Transwestern Debt | | | |
| 5.36% Senior Notes due December 9, 2020 (1) | 175 |
| | 175 |
|
| 5.89% Senior Notes due May 24, 2022 | 150 |
| | 150 |
|
| 5.66% Senior Notes due December 9, 2024 | 175 |
| | 175 |
|
| 6.16% Senior Notes due May 24, 2037 | 75 |
| | 75 |
|
| Deferred debt issuance costs | (1 | ) | | (1 | ) |
| | 574 |
| | 574 |
|
| Panhandle Debt | | | |
| 8.125% Senior Notes due June 1, 2019 | — |
| | 150 |
|
| 7.60% Senior Notes due February 1, 2024 | 82 |
| | 82 |
|
| 7.00% Senior Notes due July 15, 2029 | 66 |
| | 66 |
|
| 8.25% Senior Notes due November 15, 2029 | 33 |
| | 33 |
|
| Floating Rate Junior Subordinated Notes due November 1, 2066 | 54 |
| | 54 |
|
| Unamortized premiums, discounts and fair value adjustments, net | 11 |
| | 14 |
|
| | 246 |
| | 399 |
|
| Bakken Project Debt | | | |
| 3.625% Senior Notes due April 1, 2022 | 650 |
| | — |
|
| 3.90% Senior Notes due April 1, 2024 | 1,000 |
| | — |
|
| 4.625% Senior Notes due April 1, 2029 | 850 |
| | — |
|
| Bakken $2.50 billion Credit Facility due August 2019 | — |
| | 2,500 |
|
| Unamortized premiums, discounts and fair value adjustments, net | (3 | ) | | — |
|
| Deferred debt issuance costs | (16 | ) | | (3 | ) |
| | 2,481 |
| | 2,497 |
|
| Sunoco LP Debt | | | |
| 4.875% Senior Notes Due January 15, 2023 | 1,000 |
| | 1,000 |
|
| 5.50% Senior Notes Due February 15, 2026 | 800 |
| | 800 |
|
| 6.00% Senior Notes Due April 15, 2027 | 600 |
| | — |
|
| 5.875% Senior Notes Due March 15, 2028 | 400 |
| | 400 |
|
| Sunoco LP $1.50 billion Revolving Credit Facility due July 2023 | 162 |
| | 700 |
|
| Lease-related obligations | 135 |
| | 107 |
|
| Deferred debt issuance costs | (26 | ) | | (23 | ) |
| | 3,071 |
| | 2,984 |
|
| USAC Debt | | | |
| 6.875% Senior Notes due April 1, 2026 | 725 |
| | 725 |
|
| 6.875% Senior Notes due September 1, 2027 | 750 |
| | — |
|
| USAC $1.60 billion Revolving Credit Facility due April 2023 | 403 |
| | 1,050 |
|
| Deferred debt issuance costs | (26 | ) | | (16 | ) |
| | 1,852 |
| | 1,759 |
|
| | | | |
| Other | 2 |
| | 7 |
|
| Total debt | 50,346 |
| | 40,508 |
|
| Less: Current maturities of long-term debt | 12 |
| | 2,655 |
|
| Long-term debt, less current maturities | $ | 50,334 |
| | $ | 37,853 |
|
| |
(1) | As of December 31, 2019, these notes were classified as long-term as management had the intent and ability to refinance the borrowings on a long-term basis. The notes were redeemed in January 2020. |
The following table reflects future maturities of long-term debt for each of the next five years and thereafter. These amounts exclude $273 million in unamortized net premiums, fair value adjustments and deferred debt issuance costs:
|
| | | | |
| 2020 | | $ | 3,021 |
|
| 2021 | | 1,412 |
|
| 2022 | | 5,792 |
|
| 2023 | | 8,960 |
|
| 2024 | | 4,337 |
|
| Thereafter | | 27,097 |
|
| Total | | $ | 50,619 |
|
Long-term debt reflected on our consolidated balance sheets includes fair value adjustments related to interest rate swaps, which represent fair value adjustments that had been recorded in connection with fair value hedge accounting prior to the termination of the interest rate swap.
ETO Senior Notes
The ETO senior notes were registered under the Securities Act of 1933 (as amended). The Partnership may redeem some or all of the ETO senior notes at any time, or from time to time, pursuant to the terms of the indenture and related indenture supplements related to the ETO senior notes. The balance is payable upon maturity. Interest on the ETO senior notes is paid semi-annually.
The ETO senior notes are unsecured obligations of the Partnership and as a result, the ETO senior notes effectively rank junior to any future indebtedness of ours or our subsidiaries that is both secured and unsubordinated to the extent of the value of the assets securing such indebtedness, and the ETO senior notes effectively rank junior to all indebtedness and other liabilities of our existing and future subsidiaries.
ETO January 2020 Senior Notes Offering and Redemption
On January 22, 2020, ETO completed a registered offering (the “January 2020 Senior Notes Offering”) of $1.00 billion aggregate principal amount of the Partnership’s 2.900% Senior Notes due 2025, $1.50 billion aggregate principal amount of the Partnership’s 3.750% Senior Notes due 2030 and $2.00 billion aggregate principal amount of the Partnership’s 5.000% Senior Notes due 2050, (collectively, the “Notes”). The Notes are fully and unconditionally guaranteed by the Partnership’s wholly owned subsidiary, Sunoco Logistics Partners Operations L.P., on a senior unsecured basis.
Utilizing proceeds from the January 2020 Senior Notes Offering, ETO redeemed its $400 million aggregate principal amount of 5.75% Senior Notes due September 1, 2020, its $1.05 billion aggregate principal amount of 4.15% Senior Notes due October 1, 2020, its $1.14 billion aggregate principal amount of 7.50% Senior Notes due October 15, 2020, its $250 million aggregate principal amount of 5.50% Senior Notes due February 15, 2020, ET’s $52 million aggregate principal amount of 7.50% Senior Notes due October 15, 2020 and Transwestern’s $175 million aggregate principal amount of 5.36% Senior Notes due December 9, 2020.
ET-ETO Senior Notes Exchange
In February 2019, ETO commenced offers to exchange all of ET’s outstanding senior notes for senior notes issued by ETO (the “ET-ETO senior notes exchange”). Approximately 97% of ET’s outstanding senior notes were tendered and accepted, and substantially all the exchanges settled on March 25, 2019. In connection with the exchange, ETO issued approximately $4.21 billion aggregate principal amount of the following senior notes:
•$1.14 billion aggregate principal amount of 7.50% senior notes due 2020;
•$995 million aggregate principal amount of 4.25% senior notes due 2023;
•$1.13 billion aggregate principal amount of 5.875% senior notes due 2024; and
•$956 million aggregate principal amount of 5.50% senior notes due 2027.
2019 Senior Notes Offering and Redemption
In January 2019, ETO issued the following senior notes:
•$750 million aggregate principal amount of 4.50% senior notes due 2024;
•$1.50 billion aggregate principal amount of 5.25% senior notes due 2029; and
•$1.75 billion aggregate principal amount of 6.25% senior notes due 2049.
The $3.96 billion net proceeds from the offering were used to make an intercompany loan to ET (which ET used to repay its term loan in full), for general partnership purposes and to redeem at maturity all of the following:
•ETO’s $400 million aggregate principal amount of 9.70% senior notes due March 15, 2019;
•ETO’s $450 million aggregate principal amount of 9.00% senior notes due April 15, 2019; and
•Panhandle’s $150 million aggregate principal amount of 8.125% senior notes due June 1, 2019.
Panhandle Senior Notes Redemption
In June 2019, Panhandle’s $150 million aggregate principal amount of 8.125% senior notes matured and were repaid with borrowings under an affiliate loan agreement with ETO.
Bakken Senior Notes Offering
In March 2019, Midwest Connector Capital Company LLC, a wholly-owned subsidiary of Dakota Access, issued the following senior notes related to the Bakken pipeline:
•$650 million aggregate principal amount of 3.625% senior notes due 2022;
•$1.00 billion aggregate principal amount of 3.90% senior notes due 2024; and
•$850 million aggregate principal amount of 4.625% senior notes due 2029.
The $2.48 billion in net proceeds from the offering were used to repay in full all amounts outstanding on the Bakken credit facility and the facility was terminated.
Sunoco LP Senior Notes Offering
In March 2019, Sunoco LP issued $600 million aggregate principal amount of 6.00% senior notes due 2027 in a private placement to eligible purchasers. The net proceeds from this offering were used to repay a portion of Sunoco LP’s existing borrowings under its credit facility. In July 2019, Sunoco LP completed an exchange of these notes for registered notes with substantially identical terms.
USAC Senior Notes Offering
In March 2019, USAC issued $750 million aggregate principal amount of 6.875% senior notes due 2027 in a private placement, and in December 2019, USAC exchanged those notes for substantially identical senior notes registered under the Securities Act. The net proceeds from this offering were used to repay a portion of USAC’s existing borrowings under its credit facility and for general partnership purposes.
Transwestern Senior Notes
The Transwestern senior notes are redeemable at any time in whole or pro rata, subject to a premium or upon a change of control event or an event of default, as defined. The balance is payable upon maturity. Interest is paid semi-annually.
Credit Facilities, Term Loan and Commercial Paper
ETO Term Loan
On October 17, 2019, ETO entered into a term loan credit agreement (the “ETO Term Loan”) providing for a $2.00 billion three-year term loan credit facility. Borrowings under the term loan agreement mature on October 17, 2022 and are available for working capital purposes and for general partnership purposes. The term loan agreement is unsecured and is guaranteed by our subsidiary, Sunoco Logistics Partners Operations L.P.
As of December 31, 2019, the ETO Term Loan had $2.00 billion outstanding and was fully drawn. The weighted average interest rate on the total amount outstanding as of December 31, 2019 was 2.78%.
ETO Five-Year Credit Facility
ETO’s revolving credit facility (the “ETO Five-Year Credit Facility”) allows for unsecured borrowings up to $5.00 billion and matures on December 1, 2023. The ETO Five-Year Credit Facility contains an accordion feature, under which the total aggregate commitment may be increased up to $6.00 billion under certain conditions.
As of December 31, 2019, the ETO Five-Year Credit Facility had $4.21 billion outstanding, of which $1.64 billion was commercial paper. The amount available for future borrowings was $709 million after taking into account letters of credit of $77 million. The weighted average interest rate on the total amount outstanding as of December 31, 2019 was 2.88%.
ETO 364-Day Facility
ETO’s 364-day revolving credit facility (the “ETO 364-Day Facility”) allows for unsecured borrowings up to $1.00 billion and matures on November 27, 2020. As of December 31, 2019, the ETO 364-Day Facility had 0 outstanding borrowings.
Sunoco LP Credit Facility
Sunoco LP maintains a $1.50 billion revolving credit facility (the “Sunoco LP Credit Facility”). As of December 31, 2019, the Sunoco LP Credit Facility had $162 million outstanding borrowings and $8 million in standby letters of credit. The amount available for future borrowings was $1.33 billion at December 31, 2019. The weighted average interest rate on the total amount outstanding as of December 31, 2019 was 3.75%.
USAC Credit Facility
USAC maintains a $1.60 billion revolving credit facility (the “USAC Credit Facility”), which matures on April 2, 2023 and permits up to $400 million of future increases in borrowing capacity. As of December 31, 2019, USAC had $403 million of outstanding borrowings and 0 outstanding letters of credit under the credit agreement. As of December 31, 2019, USAC had $1.2 billion of availability under its credit facility. The weighted average interest rate on the total amount outstanding as of December 31, 2019 was 4.31%.
Covenants Related to Our Credit Agreements
Covenants Related to ETO
The agreements relating to the ETO senior notes contain restrictive covenants customary for an issuer with an investment-grade rating from the rating agencies, which covenants include limitations on liens and a restriction on sale-leaseback transactions.
The ETO Credit Facilities contain covenants that limit (subject to certain exceptions) the Partnership’s and certain of the Partnership’s subsidiaries’ ability to, among other things:
| |
| • | make certain investments; |
| |
| • | make Distributions (as defined in the ETO Credit Facilities) during certain Defaults (as defined in the ETO Credit Facilities) and during any Event of Default (as defined in the ETO Credit Facilities); |
| |
| • | engage in business substantially different in nature than the business currently conducted by the Partnership and its subsidiaries; |
| |
| • | engage in transactions with affiliates; and |
| |
| • | enter into restrictive agreements. |
The ETO Credit Facilities applicable margin and rate used in connection with the interest rates and commitment fees, respectively, are based on the credit ratings assigned to our senior, unsecured, non-credit enhanced long-term debt. The applicable margin for eurodollar rate loans under the ETO Five-Year Facility ranges from 1.125% to 2.000% and the applicable margin for base rate loans ranges from 0.125% to 1.000%. The applicable rate for commitment fees under the ETO Five-Year Facility ranges from 0.125% to 0.300%. The applicable margin for eurodollar rate loans under the ETO 364-Day Facility
ranges from 1.250% to 1.750% and the applicable margin for base rate loans ranges from 0.250% to 0.750%. The applicable rate for commitment fees under the ETO 364-Day Facility ranges from 0.125% to 0.225%.
The ETO Credit Facilities contain various covenants including limitations on the creation of indebtedness and liens, and related to the operation and conduct of our business. The ETO Credit Facilities also limit us, on a rolling four quarter basis, to a maximum Consolidated Funded Indebtedness to Consolidated EBITDA ratio, as defined in the underlying credit agreements, of 5.0 to 1, which can generally be increased to 5.5 to 1 during a Specified Acquisition Period. Our Leverage Ratio was 4.04 to 1 at December 31, 2019, as calculated in accordance with the credit agreements.
The agreements relating to the Transwestern senior notes contain certain restrictions that, among other things, limit the incurrence of additional debt, the sale of assets and the payment of dividends and specify a maximum debt to capitalization ratio.
Failure to comply with the various restrictive and affirmative covenants of our revolving credit facilities could require us to pay debt balances prior to scheduled maturity and could negatively impact the Partnership’s or our subsidiaries’ ability to incur additional debt and/or our ability to pay distributions to Unitholders.
Covenants Related to Panhandle
Panhandle is not party to any lending agreement that would accelerate the maturity date of any obligation due to a failure to maintain any specific credit rating, nor would a reduction in any credit rating, by itself, cause an event of default under any of Panhandle’s lending agreements.
Panhandle’s restrictive covenants include restrictions on liens securing debt and guarantees and restrictions on mergers and on the sales of assets. A breach of any of these covenants could result in acceleration of Panhandle’s debt.
Covenants Related to Sunoco LP
The Sunoco LP Credit Facility contains various customary representations, warranties, covenants and events of default, including a change of control event of default, as defined therein. Sunoco LP’s Credit Facility requires Sunoco LP to maintain a Net Leverage Ratio of not more than 5.5 to 1. The maximum Net Leverage Ratio is subject to upwards adjustment of not more than 6.0 to 1 for a period not to exceed three fiscal quarters in the event Sunoco LP engages in certain specified acquisitions of not less than $50 million (as permitted under Sunoco LP’s Credit Facility agreement). The Sunoco LP Credit Facility also requires Sunoco LP to maintain an Interest Coverage Ratio (as defined in the Sunoco LP’s Credit Facility agreement) of not less than 2.25 to 1.
Covenants Related to USAC
The USAC Credit Facility contains covenants that limit (subject to certain exceptions) USAC’s ability to, among other things:
| |
| • | make certain loans or investments; |
| |
| • | incur additional indebtedness or guarantee other indebtedness; |
| |
| • | make certain acquisitions. |
The credit facility is also subject to the following financial covenants, including covenants requiring us to maintain:
| |
| • | a minimum EBITDA to interest coverage ratio of 2.5 to 1.0, determined as of the last day of each fiscal quarter; and |
| |
| • | a maximum funded debt to EBITDA ratio, determined as of the last day of each fiscal quarter, for the annualized trailing three months of (i) 5.5 to 1 through the end of the fiscal quarter ending December 31, 2019 and (ii) 5.0 to 1.0 thereafter, in each case subject to a provision for increases to such thresholds by 0.50 in connection with certain future acquisitions for the six consecutive month period following the period in which any such acquisition occurs. |
Compliance with our Covenants
We and our subsidiaries were in compliance with all requirements, tests, limitations, and covenants related to our debt agreements as of December 31, 2019.
| |
| 6. | REDEEMABLE NONCONTROLLING INTERESTS |
Certain redeemable noncontrolling interests in the Partnership’s subsidiaries are reflected as mezzanine equity on the consolidated balance sheet. Redeemable noncontrolling interests as of December 31, 2019 included a balance of $477 million related to the USAC Preferred Units described below and a balance of $15 million related to noncontrolling interest holders in one of the Partnership’s consolidated subsidiaries that have the option to sell their interests to the Partnership.
USAC Series A Preferred Units
In 2018, USAC issued 500,000 USAC Preferred Units in a private placement at a price of $1,000 per USAC Preferred Unit, for total gross proceeds of $500 million in a private placement.
The USAC Preferred Units are entitled to receive cumulative quarterly distributions equal to $24.375 per USAC Preferred Unit, subject to increase in certain limited circumstances. The USAC Preferred Units will have a perpetual term, unless converted or redeemed. Certain portions of the USAC Preferred Units will be convertible into USAC common units at the election of the holders beginning in 2021. To the extent the holders of the USAC Preferred Units have not elected to convert their preferred units by the fifth anniversary of the issue date, USAC will have the option to redeem all or any portion of the USAC Preferred Units for cash. In addition, at any time on or after the tenth anniversary of the issue date, the holders of the USAC Preferred Units will have the right to require USAC to redeem all or any portion of the USAC Preferred Units, and the Partnership may elect to pay up to 50% of such redemption amount in USAC common units.
Limited Partner interests are represented by Common Units and other classes of units described below, as well as Series A Preferred Units, Series B Preferred Units, Series C Preferred Units, Series D Preferred Units, Series E Preferred Units, Series F Preferred Units, and Series G Preferred Units that entitle the holders thereof to the rights and privileges specified in the Partnership Agreement. No person is entitled to preemptive rights in respect of issuances of equity securities by us, except that ETP GP has the right, in connection with the issuance of any equity security by us, to purchase equity securities on the same terms as equity securities are issued to third parties sufficient to enable ETP GP and its affiliates to maintain the aggregate percentage equity interest in us as ETP GP and its affiliates owned immediately prior to such issuance.
Class K Units
As of December 31, 2019, a total of 101.5 million Class K Units were held by wholly-owned subsidiaries of ETO. Each Class K Unit is entitled to a quarterly cash distribution of $0.67275 per Class K Unit prior to ETO making distributions of available cash to any class of units, excluding any cash available distributions or dividends or capital stock sales proceeds received by ETO from ETP Holdco. If the Partnership is unable to pay the Class K Unit quarterly distribution with respect to any quarter, the accrued and unpaid distributions will accumulate until paid and any accumulated balance will accrue 1.5% per annum until paid.
Class L Units
On December 31, 2018, ETO issued a new class of limited partner interests titled Class L Units to two wholly-owned subsidiaries of the Partnership when the Partnership’s previously outstanding Class E units and Class G units held by such subsidiaries were converted into Class L Units. As a result of the conversion, the Class E units and Class G units were cancelled.
The Class L Units generally do not have any voting rights. The Class L Units are entitled to aggregate cash distributions equal to 7.65% per annum of the total amount of cash generated by us and our subsidiaries, other than ETP Holdco, and available for distribution. Distributions shall be paid quarterly, in arrears, within 45 days after the end of each quarter. As the Class L Units are owned by a wholly-owned subsidiary, the cash distributions on those units are eliminated in our consolidated financial statements.
Class M Units
On July 1, 2019, ETO issued a new class of limited partner interests titled Class M Units to ETP Holdco, a wholly-owned subsidiary of the Partnership, in exchange for the contribution of ETP Holdco’s equity ownership interest in Panhandle to the Partnership.
The Class M Units generally do not have any voting rights. The Class M Units are entitled to aggregate cash distributions equal to 8.00% per annum of the total amount of cash generated by us and our subsidiaries, other than ETP Holdco, and available for distribution. Distributions shall be paid quarterly, in arrears, within 45 days after the end of each quarter. As
the Class M Units are owned by a wholly-owned subsidiary, the cash distributions on those units are eliminated in our consolidated financial statements.
ETO Preferred Units
In November 2017, ETO issued 950,000 of its 6.250% Series A Preferred Units at a price of $1,000 per unit and 550,000 of its 6.625% Series B Preferred Units at a price of $1,000 per unit. In April 2018, ETO issued 18 million of its 7.375% Series C Preferred Units at a price of $25 per unit. In July 2018, ETO issued 17.8 million of its 7.625% Series D Preferred Units at a price of $25 per unit. In April 2019, ETO issued 32 million of its 7.600% Series E Preferred Units at a price of $25 per unit. As of December 31, 2019 all of our Series A, Series B, Series C, Series D and Series E Preferred Units issued remain outstanding.
The following table summarizes changes in the amounts of our Series A, Series B, Series C, Series D and Series E preferred units for the years ended December 31, 2019, 2018 and 2017 were as follows:
|
| | | | | | | | | | | | | | | | | | | | | | | |
| | Preferred Unitholders | | |
| | Series A | | Series B | | Series C | | Series D | | Series E | | Total |
| Balance, December 31, 2016 | $ | — |
| | $ | — |
| | $ | — |
| | $ | — |
| | $ | — |
| | $ | — |
|
| Distributions to partners | — |
| | — |
| | — |
| | — |
| | — |
| | — |
|
| Partnership units issued for cash | 937 |
| | 542 |
| | — |
| | — |
| | — |
| | 1,479 |
|
| Other, net | — |
| | — |
| | — |
| | — |
| | — |
| | — |
|
| Net income | 7 |
| | 5 |
| | — |
| | — |
| | — |
| | 12 |
|
| Balance, December 31, 2017 | 944 |
| | 547 |
| | — |
| | — |
| | — |
| | 1,491 |
|
| Distributions to partners | (44 | ) | | (27 | ) | | (18 | ) | | (11 | ) | | — |
| | (100 | ) |
| Partnership units issued for cash | — |
| | — |
| | 436 |
| | 431 |
| | — |
| | 867 |
|
| Other, net | (1 | ) | | — |
| | (1 | ) | | (1 | ) | | — |
| | (3 | ) |
| Net income | 59 |
| | 36 |
| | 23 |
| | 15 |
| | — |
| | 133 |
|
| Balance, December 31, 2018 | 958 |
| | 556 |
| | 440 |
| | 434 |
| | — |
| | 2,388 |
|
| Distributions to partners | (59 | ) | | (37 | ) | | (33 | ) | | (34 | ) | | (34 | ) | | (197 | ) |
| Partnership units issued for cash | — |
| | — |
| | — |
| | — |
| | 780 |
| | 780 |
|
| Other, net | — |
| | — |
| | — |
| | — |
| | (1 | ) | | (1 | ) |
| Net income | 59 |
| | 37 |
| | 33 |
| | 34 |
| | 41 |
| | 204 |
|
| Balance, December 31, 2019 | $ | 958 |
| | $ | 556 |
| | $ | 440 |
| | $ | 434 |
| | $ | 786 |
| | $ | 3,174 |
|
ETO Series A Preferred Units
Distributions on the Series A Preferred Units will accrue and be cumulative from and including the date of original issue to, but excluding, February 15, 2023, at a rate of 6.250% per annum of the stated liquidation preference of $1,000. On and after February 15, 2023, distributions on the Series A Preferred Units will accumulate at a percentage of the $1,000 liquidation preference equal to an annual floating rate of the three-month LIBOR, determined quarterly, plus a spread of 4.028% per annum. The Series A Preferred Units are redeemable at ETO’s option on or after February 15, 2023 at a redemption price of $1,000 per Series A Preferred Unit, plus an amount equal to all accumulated and unpaid distributions thereon to, but excluding, the date of redemption.
ETO Series B Preferred Units
Distributions on the Series B Preferred Units will accrue and be cumulative from and including the date of original issue to, but excluding, February 15, 2028, at a rate of 6.625% per annum of the stated liquidation preference of $1,000. On and after February 15, 2028, distributions on the Series B Preferred Units will accumulate at a percentage of the $1,000 liquidation preference equal to an annual floating rate of the three-month LIBOR, determined quarterly, plus a spread of 4.155% per annum. The Series B Preferred Units are redeemable at ETO’s option on or after February 15, 2028 at a redemption price of $1,000 per Series B Preferred Unit, plus an amount equal to all accumulated and unpaid distributions thereon to, but excluding, the date of redemption.
ETO Series C Preferred Units
Distributions on the Series C Preferred Units will accrue and be cumulative from and including the date of original issue to, but excluding, May 15, 2023, at a rate of 7.375% per annum of the stated liquidation preference of $25. On and after May 15, 2023, distributions on the Series C Preferred Units will accumulate at a percentage of the $25 liquidation preference equal to an annual floating rate of the three-month LIBOR, determined quarterly, plus a spread of 4.530% per annum. The Series C Preferred Units are redeemable at ETO’s option on or after May 15, 2023 at a redemption price of $25 per Series C Preferred Unit, plus an amount equal to all accumulated and unpaid distributions thereon to, but excluding, the date of redemption.
ETO Series D Preferred Units
Distributions on the Series D Preferred Units will accrue and be cumulative from and including the date of original issue to, but excluding, August 15, 2023, at a rate of 7.625% per annum of the stated liquidation preference of $25. On and after August 15, 2023, distributions on the Series D Preferred Units will accumulate at a percentage of the $25 liquidation preference equal to an annual floating rate of the three-month LIBOR, determined quarterly, plus a spread of 4.738% per annum. The Series D Preferred Units are redeemable at ETO’s option on or after August 15, 2023 at a redemption price of $25 per Series D Preferred Unit, plus an amount equal to all accumulated and unpaid distributions thereon to, but excluding, the date of redemption.
ETO Series E Preferred Units
Distributions on the Series E Preferred Units will accrue and be cumulative from and including the date of original issue to, but excluding, May 15, 2024, at a rate of 7.600% per annum of the stated liquidation preference of $25. On and after May 15, 2024, distributions on the Series E Preferred Units will accumulate at a percentage of the $25 liquidation preference equal to an annual floating rate of the three-month LIBOR, determined quarterly, plus a spread of 5.161% per annum. The Series E Preferred Units are redeemable at ETO’s option on or after May 15, 2024 at a redemption price of $25 per Series E Preferred Unit, plus an amount equal to all accumulated and unpaid distributions thereon to, but excluding, the date of redemption.
ETO Series F Preferred Units
On January 22, 2020, the Partnership issued 500,000 of its 6.750% Series F Fixed-Rate Reset Cumulative Redeemable Perpetual Preferred Units representing limited partner interest in the Partnership, at a price to the public of $1,000 per unit. Distributions on the Series F Preferred Units are cumulative from and including the original issue date and will be payable semi-annually in arrears on the 15th day of May and November of each year, commencing on May 15, 2020 to, but excluding, May 15, 2025, at a rate equal to 6.750% per annum of the $1,000 liquidation preference. On and after May 15, 2025, the distribution rate on the Series F Preferred Units will equal a percentage of the $1,000 liquidation preference equal to the five-year U.S. treasury rate plus a spread of 5.134% per annum. The Series F Preferred Units are redeemable at ETO’s option on or after May 15, 2025 at a redemption price of $1,000 per Series F Preferred Unit, plus an amount equal to all accumulated and unpaid distributions thereon to, but excluding, the date of redemption.
ETO Series G Preferred Units
On January 22, 2020, the Partnership issued 1,100,000 of its 7.125% Series G Fixed-Rate Reset Cumulative Redeemable Perpetual Preferred Units representing limited partner interest in the Partnership, at a price to the public of $1,000 per unit. Distributions on the Series G Preferred Units are cumulative from and including the original issue date and will be payable semi-annually in arrears on the 15th day of May and November of each year, commencing on May 15, 2020 to, but excluding, May 15, 2030, at a rate equal to 7.125% per annum of the $1,000 liquidation preference. On and after May 15, 2030, the distribution rate on the Series G Preferred Units will equal a percentage of the $1,000 liquidation preference equal to the five-year U.S. treasury rate plus a spread of 5.306% per annum. The Series G Preferred Units are redeemable at ETO’s option on or after May 15, 2030 at a redemption price of $1,000 per Series G Preferred Unit, plus an amount equal to all accumulated and unpaid distributions thereon to, but excluding, the date of redemption.
PennTex Tender Offer and Limited Call Right Exercise
In June 2017, ETO purchased all of the outstanding PennTex common units not previously owned by ETO for $20.00 per common unit in cash. ETO now owns all of the economic interests of PennTex, and PennTex common units are no longer publicly traded or listed on the NASDAQ.
Subsidiary Equity Transactions
Sunoco LP’s Common Unit Repurchase
In February 2018, after the record date for Sunoco LP’s fourth quarter 2017 cash distributions, Sunoco LP repurchased 17,286,859 Sunoco LP common units owned by ETO for aggregate cash consideration of approximately $540 million. ETO used the proceeds from the sale of the Sunoco LP common units to repay amounts outstanding under its revolving credit facility.
Sunoco LP’s Equity Distribution Program
Sunoco LP is party to an equity distribution agreement for an at-the-market (“ATM”) offering pursuant to which Sunoco LP may sell its common units from time to time. For the years ended December 31, 2019 and 2018, Sunoco LP issued 0 units under its ATM program. For the year ended December 31, 2017, Sunoco LP issued an additional 1.3 million units with total net proceeds of $33 million , net of commissions of $0.3 million. As of December 31, 2019, $295 million of Sunoco LP common units remained available to be issued under the currently effective equity distribution agreement.
Sunoco LP’s Series A Preferred Units
On March 30, 2017, the Partnership purchased 12.0 million Sunoco LP Series A Preferred Units representing limited partner interests in Sunoco LP in a private placement transaction for an aggregate purchase price of $300 million. The distribution rate of the Sunoco LP Series A Preferred Units is 10.00%, per annum, of the $25.00 liquidation preference per unit until March 30, 2022, at which point the distribution rate will become a floating rate of 8.00% plus three-month LIBOR of the liquidation preference.
In January 2018, Sunoco LP redeemed all outstanding Sunoco LP Series A Preferred Units held by ET for an aggregate redemption amount of approximately $313 million. The redemption amount included the original consideration of $300 million and a 1% call premium plus accrued and unpaid quarterly distributions.
USAC’s Distribution Reinvestment Program
During the year ended December 31, 2019 and 2018, distributions of $1 million and $0.6 million, respectively, were reinvested under the USAC distribution reinvestment program resulting in the issuance of approximately 60,584 and 39,280 USAC common units, respectively.
USAC’s Warrant Private Placement
On April 2, 2018, USAC issued two tranches of warrants to purchase USAC common units (the “USAC Warrants”), which included USAC Warrants to purchase 5,000,000 common units with a strike price of $17.03 per unit and USAC Warrants to purchase 10,000,000 common units with a strike price of $19.59 per unit. The USAC Warrants may be exercised by the holders thereof at any time beginning on the one year anniversary of the closing date and before the tenth anniversary of the closing date. Upon exercise of the USAC Warrants, USAC may, at its option, elect to settle the USAC Warrants in common units on a net basis.
USAC’s Class B Units
The USAC Class B Units, all of which are owned by ETO, are a new class of partnership interests of USAC that have substantially all of the rights and obligations of a USAC common unit, except the USAC Class B Units will not participate in distributions for the first four quarters following the closing date of the USAC Transaction on April 2, 2018. Each USAC Class B Unit automatically converted into one USAC common unit on the first business day following the record date attributable to the quarter ending June 30, 2019.
On July 30, 2019, the 6,397,965 USAC Class B units held by the Partnership converted into 6,397,965 common units representing limited partner interests in USAC. These common units participate in distributions declared by USAC.
Cash Distributions
ETO Preferred Unit Distributions
Distributions on the Partnership’s Series A, Series B, Series C, Series D and Series E preferred units declared and/or paid by the Partnership were as follows:
|
| | | | | | | | | | | | | | | | | | | | | | | | | |
| Period Ended | | Record Date | | Payment Date | | Series A (1) | | Series B (1) | | Series C | | Series D | | Series E | |
| December 31, 2017 | | February 1, 2018 | | February 15, 2018 | | $ | 15.4510 |
| * | $ | 16.3780 |
| * | $ | — |
| | $ | — |
| | $ | — |
| |
| June 30, 2018 | | August 1, 2018 | | August 15, 2018 | | 31.2500 |
| | 33.1250 |
| | 0.5634 |
| * | — |
| | — |
| |
| September 30, 2018 | | November 1, 2018 | | November 15, 2018 | | — |
| | — |
| | 0.4609 |
| | 0.5931 |
| * | — |
| |
| December 31, 2018 | | February 1, 2019 | | February 15, 2019 | | 31.2500 |
| | 33.1250 |
| | 0.4609 |
| | 0.4766 |
| | — |
| |
| March 31, 2019 | | May 1, 2019 | | May 15, 2019 | | — |
| | — |
| | 0.4609 |
| | 0.4766 |
| | — |
| |
| June 30, 2019 | | August 1, 2019 | | August 15, 2019 | | 31.2500 |
| | 33.1250 |
| | 0.4609 |
| | 0.4766 |
| | 0.5806 |
| * |
| September 30, 2019 | | November 1, 2019 | | November 15, 2019 | | — |
| | — |
| | 0.4609 |
| | 0.4766 |
| | 0.4750 |
| |
| December 31, 2019 | | February 3, 2020 | | February 18, 2020 | | 31.2500 |
| | 33.1250 |
| | 0.4609 |
| | 0.4766 |
| | 0.4750 |
| |
| |
* | Represent prorated initial distributions. Prorated initial distributions on the recently issued Series F and Series G preferred units will be payable in May 2020. |
(1) Series A Preferred Units and Series B Preferred Unit distributions are paid on a semi-annual basis.
Sunoco LP Cash Distributions
The following table illustrates the percentage allocations of available cash from operating surplus between Sunoco LP’s common unitholders and the holder of its IDRs based on the specified target distribution levels, after the payment of distributions to Class C unitholders. The amounts set forth under “marginal percentage interest in distributions” are the percentage interests of the IDR holder and the common unitholders in any available cash from operating surplus which Sunoco LP distributes up to and including the corresponding amount in the column “total quarterly distribution per unit target amount.” The percentage interests shown for common unitholders and IDR holder for the minimum quarterly distribution are also applicable to quarterly distribution amounts that are less than the minimum quarterly distribution.
|
| | | | | | |
| | | | | Marginal Percentage Interest in Distributions |
| | | Total Quarterly Distribution Target Amount | | Common Unitholders | | Holder of IDRs |
| Minimum Quarterly Distribution | | $0.4375 | | 100% | | —% |
| First Target Distribution | | $0.4375 to $0.503125 | | 100% | | —% |
| Second Target Distribution | | $0.503125 to $0.546875 | | 85% | | 15% |
| Third Target Distribution | | $0.546875 to $0.656250 | | 75% | | 25% |
| Thereafter | | Above $0.656250 | | 50% | | 50% |
Distributions on Sunoco LP’s units declared and/or paid by Sunoco LP were as follows:
|
| | | | | | | | |
| Quarter Ended | | Record Date | | Payment Date | | Rate |
| December 31, 2016 | | February 13, 2017 | | February 21, 2017 | | $ | 0.8255 |
|
| March 31, 2017 | | May 9, 2017 | | May 16, 2017 | | 0.8255 |
|
| June 30, 2017 | | August 7, 2017 | | August 15, 2017 | | 0.8255 |
|
| September 30, 2017 | | November 7, 2017 | | November 14, 2017 | | 0.8255 |
|
| December 31, 2017 | | February 6, 2018 | | February 14, 2018 | | 0.8255 |
|
| March 31, 2018 | | May 7, 2018 | | May 15, 2018 | | 0.8255 |
|
| June 30, 2018 | | August 7, 2018 | | August 15, 2018 | | 0.8255 |
|
| September 30, 2018 | | November 6, 2018 | | November 14, 2018 | | 0.8255 |
|
| December 31, 2018 | | February 6, 2019 | | February 14, 2019 | | 0.8255 |
|
| March 31, 2019 | | May 7, 2019 | | May 15, 2019 | | 0.8255 |
|
| June 30, 2019 | | August 6, 2019 | | August 14, 2019 | | 0.8255 |
|
| September 30, 2019 | | November 5, 2019 | | November 19, 2019 | | 0.8255 |
|
| December 31, 2019 | | February 7, 2020 | | February 19, 2020 | | 0.8255 |
|
USAC Cash Distributions
Subsequent to the Energy Transfer Merger and USAC Transactions described in Note 1 and Note 3, respectively, ETO owned approximately 39.7 million USAC common units and 6.4 million USAC Class B units. Subsequent to the conversion of the USAC Class B Units to USAC common units on July 30, 2019, ETO owns approximately 46.1 million USAC common units. As of December 31, 2019, USAC had approximately 96.6 million common units outstanding. USAC currently has a non-economic general partner interest and no outstanding IDRs.
Distributions on USAC’s units declared and/or paid by USAC subsequent to the USAC transaction on April 2, 2018 were as follows:
|
| | | | | | | | |
| Quarter Ended | | Record Date | | Payment Date | | Rate |
| March 31, 2018 | | May 1, 2018 | | May 11, 2018 | | $ | 0.5250 |
|
| June 30, 2018 | | July 30, 2018 | | August 10, 2018 | | 0.5250 |
|
| September 30, 2018 | | October 29, 2018 | | November 09, 2018 | | 0.5250 |
|
| December 31, 2018 | | January 28, 2019 | | February 8, 2019 | | 0.5250 |
|
| March 31, 2019 | | April 29, 2019 | | May 10, 2019 | | 0.5250 |
|
| June 30, 2019 | | July 29, 2019 | | August 9, 2019 | | 0.5250 |
|
| September 30, 2019 | | October 28, 2019 | | November 8, 2019 | | 0.5250 |
|
| December 31, 2019 | | January 27, 2020 | | February 7, 2020 | | 0.5250 |
|
Accumulated Other Comprehensive Income
The following table presents the components of AOCI, net of tax:
|
| | | | | | | |
| | December 31, |
| | 2019 | | 2018 |
| Available-for-sale securities | $ | 13 |
| | $ | 2 |
|
| Foreign currency translation adjustment | (5 | ) | | (5 | ) |
| Actuarial loss related to pensions and other postretirement benefits | (25 | ) | | (48 | ) |
| Investments in unconsolidated affiliates, net | (1 | ) | | 9 |
|
| Total AOCI, net of tax | $ | (18 | ) | | $ | (42 | ) |
The table below sets forth the tax amounts included in the respective components of other comprehensive income:
|
| | | | | | | |
| | December 31, |
| | 2019 | | 2018 |
| Available-for-sale securities | $ | (1 | ) | | $ | (1 | ) |
| Foreign currency translation adjustment | 2 |
| | 2 |
|
| Actuarial loss relating to pension and other postretirement benefits | 8 |
| | 12 |
|
| Total | $ | 9 |
| | $ | 13 |
|
| |
| 8. | NON-CASH COMPENSATION PLANS: |
ETO Long-Term Incentive Plan
We have previously issued equity incentive plans for employees, officers and directors, which provide for various types of awards, including options to purchase ETO Common Units, restricted units, phantom units, distribution equivalent rights (“DERs”), Common Unit appreciation rights, and other unit-based awards.
The Partnership does not currently have any equity compensation plans. In connection with the Energy Transfer Merger in October 2018, all of the Partnership’s equity compensation plans, as well as the Partnership’s obligations under those plans, were assumed by ET. The Partnership recorded stock compensation expenses of $111 million, $105 million and $99 million for the years ended December 31, 2019, 2018 and 2017, respectively.
Subsidiary Long-Term Incentive Plans
Each of Sunoco LP and USAC has granted restricted or phantom unit awards (collectively, the “Subsidiary Unit Awards”) to employees and directors that entitle the grantees to receive common units of the respective subsidiary. In some cases, at the discretion of the respective subsidiary’s compensation committee, the grantee may instead receive an amount of cash equivalent to the value of common units upon vesting. Substantially all of the Subsidiary Unit Awards are time-vested grants, which generally vest over a three or five-year period, that entitles the grantees of the unit awards to receive an amount of cash equal to the per unit cash distributions made by the respective subsidiaries during the period the restricted unit is outstanding.
The following table summarizes the activity of the Subsidiary Unit Awards:
|
| | | | | | | | | | | | | |
| | Sunoco LP | | USAC |
| | Number of Units | | Weighted Average Grant-Date Fair Value Per Unit | | Number of Units | | Weighted Average Grant-Date Fair Value Per Unit |
| Unvested awards as of December 31, 2018 | 2.1 |
| | $ | 29.15 |
| | 1.4 |
| | $ | 14.98 |
|
| Awards granted | 0.7 |
| | 30.70 |
| | 0.7 |
| | 15.88 |
|
| Awards vested | (0.5 | ) | | 30.04 |
| | (0.3 | ) | | 13.06 |
|
| Awards forfeited | (0.2 | ) | | 28.16 |
| | — |
| | 16.78 |
|
| Unvested awards as of December 31, 2019 | 2.1 |
| | 29.21 |
| | 1.8 |
| | 15.09 |
|
The following table summarizes the weighted average grant-date fair value per unit award granted:
|
| | | | | | | | | | | |
| | Years Ended December 31, |
| | 2019 | | 2018 | | 2017 |
| Sunoco LP | $ | 30.70 |
| | $ | 27.67 |
| | $ | 28.31 |
|
| USAC | 15.88 |
| | 15.47 |
| | N/A |
|
The total fair value of Subsidiary Unit Awards vested for the years ended December 31, 2019, 2018 and 2017 was $17 million, $22 million and $9 million, respectively, based on the market price of Sunoco LP and USAC common units as of the vesting date for the years ended December 31, 2019 and 2018 and Sunoco LP for the year ended December 31, 2017. As of December 31, 2019, estimated compensation cost related to Subsidiary Unit Awards not yet recognized was $57 million, and the weighted average period over which this cost is expected to be recognized in expense is 3.6 years.
As a partnership, we are not subject to United States federal income tax and most state income taxes. However, the Partnership conducts certain activities through corporate subsidiaries which are subject to federal and state income taxes. The components of the federal and state income tax expense (benefit) of our taxable subsidiaries were summarized as follows:
|
| | | | | | | | | | | |
| | Years Ended December 31, |
| | 2019 | | 2018 | | 2017 |
| Current expense (benefit): | | | | | |
| Federal | $ | (20 | ) | | $ | (7 | ) | | $ | 53 |
|
| State | (1 | ) | | 20 |
| | (16 | ) |
| Total | (21 | ) | | 13 |
| | 37 |
|
| Deferred expense (benefit): | | | | | |
| Federal | 176 |
| | 183 |
| | (2,025 | ) |
| State | 45 |
| | (191 | ) | | 184 |
|
| Total | 221 |
| | (8 | ) | | (1,841 | ) |
| Total income tax expense (benefit) | $ | 200 |
| | $ | 5 |
| | $ | (1,804 | ) |
Historically, our effective tax rate has differed from the statutory rate primarily due to Partnership earnings that are not subject to United States federal and most state income taxes at the partnership level. A reconciliation of income tax expense at the United States statutory rate to the Partnership’s income tax benefit for the years ended December 31, 2019, 2018 and 2017 is as follows:
|
| | | | | | | | | | | |
| | Years Ended December 31, |
| | 2019 | | 2018 | | 2017 |
| Income tax expense at United States statutory rate | $ | 1,131 |
| | $ | 849 |
| | $ | 402 |
|
| Increase (reduction) in income taxes resulting from: | | | | | |
| Partnership earnings not subject to tax | (940 | ) | | (718 | ) | | (626 | ) |
| Federal rate change | — |
| | — |
|
| (1,784 | ) |
| Goodwill impairments | — |
| | — |
| | 208 |
|
| State income taxes (net of federal income tax effects) | 14 |
| | (125 | ) | | 123 |
|
| Dividend received deduction | (3 | ) | | (5 | ) | | (14 | ) |
| Change in tax status of subsidiary | — |
| | — |
| | (124 | ) |
| Other | (2 | ) | | 4 |
| | 11 |
|
| Income tax expense (benefit) | $ | 200 |
| | $ | 5 |
| | $ | (1,804 | ) |
Deferred taxes result from the temporary differences between financial reporting carrying amounts and the tax basis of existing assets and liabilities. The table below summarizes the principal components of the deferred tax assets (liabilities) as follows:
|
| | | | | | | |
| | December 31, |
| | 2019 | | 2018 |
| Deferred income tax assets: | | | |
| Net operating losses, alternative minimum tax credit and other carryforwards | $ | 669 |
| | $ | 768 |
|
| Pension and other postretirement benefits | — |
| | 34 |
|
| Long-term debt | — |
| | 13 |
|
| Other | 62 |
| | 181 |
|
| Total deferred income tax assets | 731 |
| | 996 |
|
| Valuation allowance | (49 | ) | | (96 | ) |
| Net deferred income tax assets | $ | 682 |
| | $ | 900 |
|
| | | | |
| Deferred income tax liabilities: | | | |
| Property, plant and equipment | $ | (258 | ) | | $ | (742 | ) |
| Investments in affiliates | (3,452 | ) | | (2,869 | ) |
| Trademarks | (72 | ) | | (63 | ) |
| Other | (13 | ) | | (110 | ) |
| Total deferred income tax liabilities | (3,795 | ) | | (3,784 | ) |
| Net deferred income taxes | $ | (3,113 | ) | | $ | (2,884 | ) |
As of December 31, 2019, ETP Holdco had a federal net operating loss carryforward of $2.65 billion, of which $1.10 billion will expire in 2031 through 2037 while the remaining can be carried forward indefinitely. As of December 31, 2019, Sunoco Property Company LLC, a corporate subsidiary of Sunoco LP, has no federal net operating loss carryforward.
Our corporate subsidiaries have $15 million of federal alternative minimum tax credits at December 31, 2019, of which $8 million is expected to be reclassified to current income tax receivable in 2020 pursuant to the Tax Cuts and Jobs Act. Our corporate subsidiaries have state net operating loss carryforward benefits of $95 million, net of federal tax, some of which will expire between 2020 and 2038, while others are carried forward indefinitely. A valuation allowance of $49 million is applicable to the state net operating loss carryforward benefits primarily attributable to significant restrictions on their use in the Commonwealth of Pennsylvania.
The following table sets forth the changes in unrecognized tax benefits:
|
| | | | | | | | | | | |
| | Years Ended December 31, |
| | 2019 | | 2018 | | 2017 |
| Balance at beginning of year | $ | 624 |
| | $ | 609 |
| | $ | 615 |
|
| Additions attributable to tax positions taken in the current year | — |
| | 8 |
| | — |
|
| Additions attributable to tax positions taken in prior years | 11 |
| | 7 |
| | 28 |
|
| Reduction attributable to tax positions taken in prior years | (541 | ) | | — |
| | (25 | ) |
| Lapse of statute | — |
| | — |
| | (9 | ) |
| Balance at end of year | $ | 94 |
| | $ | 624 |
| | $ | 609 |
|
As of December 31, 2019, we have $90 million ($72 million after federal income tax benefits) related to tax positions which, if recognized, would impact our effective tax rate.
Our policy is to accrue interest expense and penalties on income tax underpayments (overpayments) as a component of income tax expense. During 2019, we recognized interest and penalties of $1 million. At December 31, 2019, we have interest and penalties accrued of $3 million, net of tax.
We appealed the adverse Court of Federal Claims decision against ETC Sunoco regarding the IRS' denial of ethanol blending credits claims under Section 6426 to the Federal Circuit. The Federal Circuit affirmed the CFC's denial on November 1, 2018. ETC Sunoco filed a petition for certiorari with the Supreme Court on May 24, 2019 to review the Federal Circuit's affirmation of the CFC's ruling, and the Court denied Sunoco's petition on October 7, 2019. The petition for certiorari applied to ETC Sunoco's 2004 through 2009 tax years, and 2010 through 2011 are on extension with the IRS through March 30, 2020. Due to the uncertainty surrounding the litigation, a reserve of $530 million was previously established for the full amount of the pending refund claims, and the receivable and reserve for this issue were netted in the consolidated balance sheet. Subsequent to the Supreme Court's denial of the petition in October 2019, the receivable and reserve have been reversed, with no impact to the Partnership's financial position and results of operations.
In November 2015, the Pennsylvania Commonwealth Court determined in Nextel Communications v. Commonwealth (“Nextel”) that the Pennsylvania limitation on NOL carryforward deductions violated the uniformity clause of the Pennsylvania Constitution and struck the NOL limitation in its entirety. In October 2017, the Pennsylvania Supreme Court affirmed the decision with respect to the uniformity clause violation; however, the Court reversed with respect to the remedy and instead severed the flat-dollar limitation, leaving the percentage-based limitation intact. Nextel subsequently filed a petition for writ of certiorari with the United States Supreme Court, and this was denied on June 11, 2018. Now certain Pennsylvania taxpayers are proceeding with litigation in Pennsylvania state courts on issues not addressed by the Pennsylvania Supreme Court in Nextel, specifically, whether the Due Process and Equal Protection Clauses of the United States Constitution and the Remedies Clause of the Pennsylvania Constitution require a court to grant the taxpayer relief. ETC Sunoco has recognized approximately $67 million ($53 million after federal income tax benefits) in tax benefit based on previously filed tax returns and certain previously filed protective claims as relates to its cases currently held pending the Nextel matter. However, based upon the Pennsylvania Supreme Court’s October 2017 decision, and because of uncertainty in the breadth of the application of the decision, we have reserved $34 million ($27 million after federal income tax benefits) against the receivable.
In general, ETO and its subsidiaries are no longer subject to examination by the IRS, and most state jurisdictions, for the 2014 and prior tax years.
ETO and its subsidiaries also have various state and local income tax returns in the process of examination or administrative appeal in various jurisdictions. We believe the appropriate accruals or unrecognized tax benefits have been recorded for any potential assessment with respect to these examinations.
| |
| 10. | REGULATORY MATTERS, COMMITMENTS, CONTINGENCIES AND ENVIRONMENTAL LIABILITIES: |
FERC Proceedings
By Order issued January 16, 2019, the FERC initiated a review of Panhandle’s existing rates pursuant to Section 5 of the Natural Gas Act to determine whether the rates currently charged by Panhandle are just and reasonable and set the matter for hearing. On August 30, 2019, Panhandle filed a general rate proceeding under Section 4 of the Natural Gas Act. The Natural Gas Act Section 5 and Section 4 proceedings were consolidated by the Order dated October 1, 2019. A hearing in the combined proceedings is scheduled for August 2020, with an initial decision expected in early 2021.
By Order issued February 19, 2019, the FERC initiated a review of Southwest Gas’ existing rates pursuant to Section 5 of the Natural Gas Act to determine whether the rates currently charged by Southwest Gas are just and reasonable and set the matter for hearing. Southwest Gas filed a cost and revenue study on May 6, 2019. On July 10, 2019, Southwest Gas filed an Offer of Settlement in this Section 5 proceeding, which settlement was supported or not opposed by Commission Trial Staff and all active parties. By order dated October 29, 2019, the FERC approved the settlement as filed, and there is not a material impact on revenue.
In addition, on November 30, 2018, Sea Robin filed a rate case pursuant to Section 4 of the Natural Gas Act. On July 22, 2019, Sea Robin filed an Offer of Settlement in this Section 4 proceeding, which settlement was supported or not opposed by Commission Trial Staff and all active parties. By order dated October 17, 2019, the FERC approved the settlement as filed, and there is not a material impact on revenue.
Commitments
In the normal course of business, ETO purchases, processes and sells natural gas pursuant to long-term contracts and enters into long-term transportation and storage agreements. Such contracts contain terms that are customary in the industry. ETO believes that the terms of these agreements are commercially reasonable and will not have a material adverse effect on its financial position or results of operations.
Our joint venture agreements require that we funds our proportionate share of capital contributions to its unconsolidated affiliates. Such contributions will depend upon our unconsolidated affiliates’ capital requirements, such as for funding capital projects or repayment of long-term obligations.
We have certain non-cancelable rights-of-way (“ROW”) commitments, which require fixed payments and either expire upon our chosen abandonment or at various dates in the future. The table below reflects ROW expense included in operating expenses in the accompanying statements of operations:
|
| | | | | | | | | | | |
| | Years Ended December 31, |
| | 2019 | | 2018 | | 2017 |
| ROW expense | $ | 45 |
| | $ | 46 |
| | $ | 46 |
|
PES Refinery Fire and Bankruptcy
We own an approximately 7.4% non-operating interest in PES, which owns a refinery in Philadelphia. In addition, the Partnership provides logistics services to PES under commercial contracts and Sunoco LP has historically purchased refined products from PES. In June 2019, an explosion and fire occurred at the refinery complex.
On July 21, 2019, PES Holdings, LLC and seven of its subsidiaries (collectively, the "Debtors") filed voluntary petitions in the United States Bankruptcy Court for the District of Delaware seeking relief under the provisions of Chapter 11 of the United States Bankruptcy Code, as a result of the explosion and fire at the Philadelphia refinery complex. The Debtors have also defaulted on a $75 million note payable to a subsidiary of the Partnership. The Partnership has not recorded a valuation allowance related to the note receivable as of December 31, 2019, because management is not yet able to determine the collectability of the note in bankruptcy.
In addition, the Partnership’s subsidiaries retained certain environmental remediation liabilities when the refinery was sold to PES. As of December 31, 2019, the Partnership has funded these environmental remediation liabilities through its wholly-owned captive insurance company, based upon actuarially determined estimates for such costs, and these liabilities are included in the total environmental liabilities discussed below under “Environmental Remediation.” In the event that the PES property is sold in connection with the bankruptcy proceeding, it may be necessary for the Partnership to record additional environmental
remediation liabilities in the future depending upon the proposed use of such property by the buyer of the property; however, management is not currently able to estimate such additional liabilities.
PES has rejected certain of the Partnership’s commercial contracts pursuant to Section 365 of the Bankruptcy Code; however, the impact of the bankruptcy on the Partnership’s commercial contracts and related revenue loss (temporary or permanent) is unknown at this time. In addition, Sunoco LP has been successful at acquiring alternative supplies to replace fuel volume lost from PES and does not anticipate any material impact to its business going forward.
Litigation and Contingencies
We may, from time to time, be involved in litigation and claims arising out of our operations in the normal course of business. Natural gas and crude oil are flammable and combustible. Serious personal injury and significant property damage can arise in connection with their transportation, storage or use. In the ordinary course of business, we are sometimes threatened with or named as a defendant in various lawsuits seeking actual and punitive damages for product liability, personal injury and property damage. We maintain liability insurance with insurers in amounts and with coverage and deductibles management believes are reasonable and prudent, and which are generally accepted in the industry. However, there can be no assurance that the levels of insurance protection currently in effect will continue to be available at reasonable prices or that such levels will remain adequate to protect us from material expenses related to product liability, personal injury or property damage in the future.
Dakota Access Pipeline
On July 27, 2016, the Standing Rock Sioux Tribe (“SRST”) filed a lawsuit in the United States District Court for the District of Columbia challenging permits issued by the United States Army Corps of Engineers (“USACE”) permitting Dakota Access, LLC (“Dakota Access”) to cross the Missouri River at Lake Oahe in North Dakota. The case was subsequently amended to challenge an easement issued by the USACE allowing the pipeline to cross land owned by the USACE adjacent to the Missouri River. Dakota Access and the Cheyenne River Sioux Tribe (“CRST”) intervened. Separate lawsuits filed by the Oglala Sioux Tribe (“OST”) and the Yankton Sioux Tribe (“YST”) were consolidated with this action and several individual tribal members intervened (collectively with SRST and CRST, the “Tribes”). Plaintiffs and Defendants filed cross motions for summary judgment, and the parties await a ruling.
While we believe that the pending lawsuits are unlikely to halt or suspend operation of the pipeline, we cannot assure this outcome. Energy Transfer cannot determine when or how these lawsuits will be resolved or the impact they may have on the Dakota Access project.
Mont Belvieu Incident
On June 26, 2016, a hydrocarbon storage well located on another operator’s facility adjacent to Lone Star NGL Mont Belvieu’s (“Lone Star”) facilities in Mont Belvieu, Texas, experienced an over-pressurization resulting in a subsurface release. The subsurface release caused a fire at Lone Star’s South Terminal and damage to Lone Star’s storage well operations at its South and North Terminals. Normal operations have resumed at the facilities with the exception of one of Lone Star’s storage wells, however, Lone Star is still quantifying the extent of its incurred and ongoing damages and has obtained, and will continue to seek, reimbursement for these losses.
MTBE Litigation
ETC Sunoco Holdings LLC and Sunoco (R&M), LLC (collectively, “Sunoco”) are defendants in lawsuits alleging MTBE contamination of groundwater. The plaintiffs, state-level governmental entities, assert product liability, nuisance, trespass, negligence, violation of environmental laws, and/or deceptive business practices claims. The plaintiffs seek to recover compensatory damages, and in some cases also seek natural resource damages, injunctive relief, punitive damages, and attorneys’ fees.
As of December 31, 2019, Sunoco is a defendant in five cases, including one case each initiated by the States of Maryland and Rhode Island, one by the Commonwealth of Pennsylvania and two by the Commonwealth of Puerto Rico. The more recent Puerto Rico action is a companion case alleging damages for additional sites beyond those at issue in the initial Puerto Rico action. The actions brought by the State of Maryland and Commonwealth of Pennsylvania have also named as defendants ETO, ETP Holdco Corporation, and Sunoco Partners Marketing & Terminals L.P. (“SPMT”).
It is reasonably possible that a loss may be realized in the remaining cases; however, we are unable to estimate the possible loss or range of loss in excess of amounts accrued. An adverse determination with respect to one or more of the MTBE cases could have a significant impact on results of operations during the period in which any such adverse determination occurs,
but such an adverse determination likely would not have a material adverse effect on the Partnership’s consolidated financial position.
Regency Merger Litigation
On June 10, 2015, Adrian Dieckman (“Dieckman”), a purported Regency unitholder, filed a class action complaint related to the Regency-ETO merger (the “Regency Merger”) in the Court of Chancery of the State of Delaware (the “Regency Merger Litigation”), on behalf of Regency’s common unitholders against Regency GP LP, Regency GP LLC, ET, ETO, ETP GP, and the members of Regency’s board of directors.
The Regency Merger Litigation alleges that the Regency Merger breached the Regency partnership agreement. On March 29, 2016, the Delaware Court of Chancery granted the defendants’ motion to dismiss the lawsuit in its entirety. Plaintiff appealed, and the Delaware Supreme Court reversed the judgment of the Court of Chancery. Plaintiff then filed an Amended Verified Class Action Complaint, which defendants moved to dismiss. The Court of Chancery granted in part and denied in part the motions to dismiss, dismissing the claims against all defendants other than Regency GP, LP and Regency GP LLC (the “Regency Defendants”). The Court of Chancery later granted Plaintiff’s unopposed motion for class certification. Trial was held on December 10-16, 2019, and the parties await a ruling from the court.
The Regency Defendants cannot predict the outcome of the Regency Merger Litigation or any lawsuits that might be filed subsequent to the date of this filing; nor can the Regency Defendants predict the amount of time and expense that will be required to resolve the Regency Merger Litigation. The Regency Defendants believe the Regency Merger Litigation is without merit and intend to vigorously defend against it.
Enterprise Products Partners, L.P. and Enterprise Products Operating LLC Litigation
On January 27, 2014, a trial commenced between ETO against Enterprise Products Partners, L.P. and Enterprise Products Operating LLC (collectively, “Enterprise”) and Enbridge (US) Inc. Trial resulted in a verdict in favor of ETO against Enterprise that consisted of $319 million in compensatory damages and $595 million in disgorgement to ETO. The jury also found that ETO owed Enterprise $1 million under a reimbursement agreement. On July 29, 2014, the trial court entered a final judgment in favor of ETO and awarded ETO $536 million, consisting of compensatory damages, disgorgement, and pre-judgment interest. The trial court also ordered that ETO shall be entitled to recover post-judgment interest and costs of court and that Enterprise is not entitled to any net recovery on its counterclaims. Enterprise filed a notice of appeal with the Court of Appeals. On July 18, 2017, the Court of Appeals issued its opinion and reversed the trial court’s judgment. ETO’s motion for rehearing to the Court of Appeals was denied. On November 27, 2017, ETO filed a Petition for Review with the Texas Supreme Court. On June 8, 2018, the Texas Supreme Court ordered briefing on the merits. On June 28, 2019, the Texas Supreme Court granted ETO’s petition for review and oral argument was heard on October 8, 2019. On January 31, 2020, the Texas Supreme Court affirmed the judgment of the Court of Appeals.
Rover
On November 3, 2017, the State of Ohio and the Ohio Environmental Protection Agency (“Ohio EPA”) filed suit against Rover and other defendants (collectively, the Defendants”) seeking to recover approximately $2.6 million in civil penalties allegedly owed and certain injunctive relief related to permit compliance. The Defendants filed several motions to dismiss, which were granted on all counts. The Ohio EPA appealed, and on December 9, 2019, the Fifth District Court of Appeals entered a unanimous judgment affirming the trial court. The Ohio EPA sought review from the Ohio Supreme Court, which Defendants intend to oppose.
Bayou Bridge
On January 11, 2018, environmental groups and a trade association filed suit against the U.S. Army Corps of Engineers (“USACE”) in the United States District Court for the Middle District of Louisiana alleging violations of the National Environmental Policy Act, the Clean Water Act, and the Rivers and Harbors Act. ETO, through its subsidiary Bayou Bridge Pipeline, LLC (“Bayou Bridge”), intervened.
In February 2018, the District Court initially granted Plaintiffs’ motion for a preliminary injunction, but the Fifth Circuit Court of Appeals subsequently vacated that decision. The Fifth Circuit’s ruling allowed construction to continue and be completed during the pendency of the case. Plaintiffs filed a second motion for preliminary injunction in January 2019, which was denied. Plaintiffs and Defendants filed cross motions for summary judgment, and the parties await a ruling.
Revolution
On September 10, 2018, a pipeline release and fire (the “Incident”) occurred on the Revolution pipeline, a natural gas gathering line located in Center Township, Beaver County, Pennsylvania. There were no injuries. On February 8, 2019, the Pennsylvania Department of Environmental Protection (“PADEP”) issued a Permit Hold on any requests for approvals/permits or permit amendments for any project in Pennsylvania pursuant to the state’s water laws. The Partnership filed an appeal of the Permit Hold with the Pennsylvania Environmental Hearing Board. On January 3, 2020, the Partnership entered into a Consent Order and Agreement with the Department in which, among other things, the Permit Hold was lifted, the Partnership agreed to pay a $28.6 million civil penalty and fund a $2 million community environmental project, and all related appeals were withdrawn.
The Pennsylvania Office of Attorney General has commenced an investigation regarding the Incident, and the United States Attorney for the Western District of Pennsylvania has issued a federal grand jury subpoena for documents relevant to the Incident. The scope of these investigations is not further known at this time.
Chester County, Pennsylvania Investigation
In December 2018, the former Chester County District Attorney (“DA”) sent a letter to the Partnership stating that his office was investigating the Partnership and related entities for “potential crimes” related to the Mariner East pipelines.
Subsequently, the matter was submitted to an Investigating Grand Jury in Chester County, Pennsylvania, which has issued subpoenas seeking documents and testimony. On September 24, 2019, the former DA sent a Notice of Intent to the Partnership of its intent to pursue an abatement action if certain conditions were not remediated. The Partnership responded to the Notice of Intent within the proscribed time period. To date, the Partnership is not aware of any further action with regard to this Notice.
In December 2019, the former DA announced charges against a current employee related to the provision of security services. The Partnership has secured independent counsel for the employee. While the Partnership will continue to cooperate with the investigation, it intends to vigorously defend itself.
Delaware County, Pennsylvania Investigation
On March 11, 2019, the Delaware County District Attorney’s Office (“DA”) announced that the DA and the Pennsylvania Attorney General’s Office, at the request of the DA, are conducting an investigation of alleged criminal misconduct involving the construction and related activities of the Mariner East pipelines in Delaware County. The Partnership has not been appraised of the specific conduct under investigation. While the Partnership will cooperate with the investigation, it intends to vigorously defend itself.
Other Litigation and Contingencies
We or our subsidiaries are a party to various legal proceedings and/or regulatory proceedings incidental to our businesses. For each of these matters, we evaluate the merits of the case, our exposure to the matter, possible legal or settlement strategies, the likelihood of an unfavorable outcome and the availability of insurance coverage. If we determine that an unfavorable outcome of a particular matter is probable and can be estimated, we accrue the contingent obligation, as well as any expected insurance recoverable amounts related to the contingency. As of December 31, 2019 and 2018, accruals of approximately $98 million and $53 million, respectively, were reflected on our consolidated balance sheets related to these contingent obligations. As new information becomes available, our estimates may change. The impact of these changes may have a significant effect on our results of operations in a single period.
The outcome of these matters cannot be predicted with certainty and there can be no assurance that the outcome of a particular matter will not result in the payment of amounts that have not been accrued for the matter. Furthermore, we may revise accrual amounts prior to resolution of a particular contingency based on changes in facts and circumstances or changes in the expected outcome. Currently, we are not able to estimate possible losses or a range of possible losses in excess of amounts accrued.
In addition, other legal proceedings exist that are considered reasonably possible to result in unfavorable outcomes. For those where possible losses can be estimated, the range of possible losses related to these contingent obligations is estimated to be up to $80 million; however, 0 accruals have been recorded as of December 31, 2019.
Environmental Matters
Our operations are subject to extensive federal, tribal, state and local environmental and safety laws and regulations that require expenditures to ensure compliance, including related to air emissions and wastewater discharges, at operating facilities and for remediation at current and former facilities as well as waste disposal sites. Historically, our environmental compliance
costs have not had a material adverse effect on our results of operations but there can be no assurance that such costs will not be material in the future or that such future compliance with existing, amended or new legal requirements will not have a material adverse effect on our business and operating results. Costs of planning, designing, constructing and operating pipelines, plants and other facilities must incorporate compliance with environmental laws and regulations and safety standards. Failure to comply with these laws and regulations may result in the assessment of administrative, civil and criminal penalties, the imposition of investigatory, remedial and corrective action obligations, natural resource damages, the issuance of injunctions in affected areas and the filing of federally authorized citizen suits. Contingent losses related to all significant known environmental matters have been accrued and/or separately disclosed. However, we may revise accrual amounts prior to resolution of a particular contingency based on changes in facts and circumstances or changes in the expected outcome.
Environmental exposures and liabilities are difficult to assess and estimate due to unknown factors such as the magnitude of possible contamination, the timing and extent of remediation, the determination of our liability in proportion to other parties, improvements in cleanup technologies and the extent to which environmental laws and regulations may change in the future. Although environmental costs may have a significant impact on the results of operations for any single period, we believe that such costs will not have a material adverse effect on our financial position.
Based on information available at this time and reviews undertaken to identify potential exposure, we believe the amount reserved for environmental matters is adequate to cover the potential exposure for cleanup costs.
In February 2017, we received letters from the DOJ on behalf of EPA and Louisiana Department of Environmental Quality (“LDEQ”) notifying SPLP and Mid-Valley that enforcement actions were being pursued for three separate crude oil releases: (a) an estimated 550 barrels released from the Colmesneil-to-Chester pipeline in Tyler County, Texas (“Colmesneil”) which allegedly occurred in February 2013; (b) an estimated 4,509 barrels released from the Longview-to-Mayersville pipeline in Caddo Parish, Louisiana (a/k/a Milepost 51.5) which allegedly occurred in October 2014; and (c) an estimated 40 barrels released from the Wakita 4-inch gathering line in Oklahoma which allegedly occurred in January 2015. In January 2019, a Consent Decree approved by all parties as well as an accompanying Complaint was filed in the United States District Court for the Western District of Louisiana seeking public comment and final court approval to resolve all penalties with DOJ and LDEQ for the three releases. Subsequently, the court approved the Consent Decree and the penalty payment of $5.4 million was satisfied. The Consent Decree requires certain injunctive relief to be completed on the Longview-to-Mayersville pipeline within three years but the injunctive relief is not expected to have any material impact on operations. In addition to resolution of the civil penalty and injunctive relief, we continue to discuss natural resource damages with the Louisiana trustees related to the Caddo Parish, Louisiana release.
In October 2018, Pipeline Hazardous Materials Safety Administration (“PHMSA”) issued a notice of proposed safety order (the “Notice”) to SPMT, a wholly owned subsidiary of ETO. The Notice alleged that conditions exist on certain pipeline facilities owned and operated by SPMT in Nederland, Texas that pose a pipeline integrity risk to public safety, property or the environment. The Notice also made preliminary findings of fact and proposed corrective measures. SPMT responded to the Notice by submitting a timely written response on November 2, 2018, attended an informal consultation held on January 30, 2019 and entered into a consent agreement with PHMSA resolving the issues in the Notice as of March 2019. SPMT is currently awaiting response from PHMSA regarding the approval status of the submitted Remedial Work Plan.
On June 4, 2019, the Oklahoma Corporation Commission’s (“OCC”) Transportation Division filed a complaint against SPLP seeking a penalty of up to $1 million related to a May 2018 rupture near Edmond, Oklahoma. The release occurred on the Noble to Douglas 8” pipeline in an area of external corrosion and caused the release of approximately fifteen barrels of crude oil. SPLP responded immediately to the release and remediated the surrounding environment and pipeline in cooperation with the OCC. The OCC filed the complaint alleging that SPLP failed to provide adequate cathodic protection to the pipeline causing the failure. SPLP is negotiating a settlement agreement with the OCC for a lesser penalty. The OCC has accepted our counter offer in conjunction with a proposed consent order. The Consent Order will be presented to the OCC at a final hearing the date of which is to be determined.
Environmental Remediation
Our subsidiaries are responsible for environmental remediation at certain sites, including the following:
| |
| • | certain of our interstate pipelines conduct soil and groundwater remediation related to contamination from past uses of PCBs. PCB assessments are ongoing and, in some cases, our subsidiaries could be contractually responsible for contamination caused by other parties. |
| |
| • | certain gathering and processing systems are responsible for soil and groundwater remediation related to releases of hydrocarbons. |
Certain
Certain gathering and processing systems are responsible for soil and groundwater remediation related to releases of hydrocarbons.
| |
| • | legacy sites related to Sunoco that are subject to environmental assessments, including formerly owned terminals and other logistics assets, retail sites that Sunoco no longer operates, closed and/or sold refineries and other formerly owned sites. |
Legacy sites related to Sunoco Inc. that are subject to environmental assessments, including formerly owned terminals and other logistics assets, retail sites that Sunoco, Inc. no longer operates, closed and/or sold refineries and other formerly owned sites.
Sunoco, Inc. is potentially subject to joint and several liability for the costs of remediation at sites at which it has been identified as a potentially responsible party (“PRP”). As of December 31, 2017,2019, Sunoco Inc. had been named as a PRP at approximately 4340 identified or potentially identifiable “Superfund” sites under federal and/or comparable state law. Sunoco Inc. is usually one of a number of companies identified as a PRP at a site. Sunoco Inc. has reviewed the nature and extent of its involvement at each site and other relevant circumstances and, based upon Sunoco, Inc.’sSunoco’s purported nexus to the sites, believes that its potential liability associated with such sites will not be significant.
To the extent estimable, expected remediation costs are included in the amounts recorded for environmental matters in our consolidated balance sheets. In some circumstances, future costs cannot be reasonably estimated because remediation activities are undertaken as claims are made by customers and former customers. To the extent that an environmental remediation obligation is recorded by a subsidiary that applies regulatory accounting policies, amounts that are expected to be recoverable through tariffs or rates are recorded as regulatory assets on our consolidated balance sheets.
The table below reflects the amounts of accrued liabilities recorded in our consolidated balance sheets related to environmental matters that are considered to be probable and reasonably estimable. Currently, we are not able to estimate possible losses or a range of possible losses in excess of amounts accrued. Except for matters discussed above, we do not have any material environmental matters assessed as reasonably possible that would require disclosure in our consolidated financial statements.
|
| | | | | | | |
| | December 31, |
| | 2019 | | 2018 |
| Current | $ | 43 |
| | $ | 42 |
|
| Non-current | 274 |
| | 295 |
|
| Total environmental liabilities | $ | 317 |
| | $ | 337 |
|
|
| | | | | | | |
| | December 31, |
| | 2017 | | 2016 |
| Current | $ | 36 |
| | $ | 26 |
|
| Non-current | 314 |
| | 283 |
|
| Total environmental liabilities | $ | 350 |
| | $ | 309 |
|
In 2013, weWe have established a wholly-owned captive insurance company to bear certain risks associated with environmental obligations related to certain sites that are no longer operating. The premiums paid to the captive insurance company include estimates for environmental claims that have been incurred but not reported, based on an actuarially determined fully developed claims expense estimate. In such cases, we accrue losses attributable to unasserted claims based on the discounted estimates that are used to develop the premiums paid to the captive insurance company.
During the years ended December 31, 20172019 and 2016,2018, the Partnership recorded $23$39 million and $43$48 million, respectively, of expenditures related to environmental cleanup programs.
On December 2, 2010, Sunoco, Inc. entered an Asset Sale and Purchase Agreement to sell the Toledo Refinery to Toledo Refining Company LLC (“TRC”) wherein Sunoco, Inc. retained certain liabilities associated with the pre-closing time period. On January 2, 2013, USEPA issued a Finding of Violation (“FOV”) to TRC and, on September 30, 2013, EPA issued a Notice of Violation (“NOV”)/ FOV to TRC alleging Clean Air Act violations. To date, EPA has not issued an FOV or NOV/FOV to Sunoco, Inc. directly but some of EPA’s claims relate to the time period that Sunoco, Inc. operated the refinery. Specifically, EPA has claimed that the refinery flares were not operated in a manner consistent with good air pollution control practice for minimizing emissions and/or in conformance with their design, and that Sunoco, Inc. submitted semi-annual compliance reports in 2010 and 2011 to the EPA that failed to include all of the information required by the regulations. EPA has proposed penalties in excess of $200,000 to resolve the allegations and discussions continue between the parties. The timing or outcome of this matter cannot be reasonably determined at this time, however, we do not expect there to be a material impact to our results of operations, cash flows or financial position.
Our pipeline operations are subject to regulation by the United States Department of Transportation under the PHMSA, pursuant to which the PHMSA has established requirements relating to the design, installation, testing, construction, operation, replacement and management of pipeline facilities. Moreover, the PHMSA, through the Office of Pipeline Safety, has promulgated a rule requiring pipeline operators to develop integrity management programs to comprehensively evaluate their pipelines, and take measures to protect pipeline segments located in what the rule refers to as “high consequence areas.” Activities under these integrity management programs involve the performance of internal pipeline inspections, pressure testing or other effective means to assess the integrity of these regulated pipeline segments, and the regulations require prompt action to address integrity issues raised by the assessment and analysis. Integrity testing and assessment of all of these assets will continue, and the potential exists that results of such testing and assessment could cause us to incur future capital and operating expenditures for repairs or upgrades deemed necessary to ensure the continued safe and reliable operation of our pipelines; however, no estimate can be made at this time of the likely range of such expenditures.
In January 2012, we experienced a release on our products pipeline in Wellington, Ohio. In connection with this release, the PHMSA issued a Corrective Action Order under which we are obligated to follow specific requirements in the investigation of the release and the repair and reactivation of the pipeline. This PHMSA Corrective Action Order was closed via correspondence dated November 4, 2016. No civil penalties were associated with the PHMSA Order. We also entered into an Order on Consent with the EPA regarding the environmental remediation of the release site. All requirements of the Order on Consent with the EPA have been fulfilled and the Order has been satisfied and closed. We have also received a “No Further Action” approval from the Ohio EPA for all soil and groundwater remediation requirements. In May 2016, we received a proposed penalty from the EPA and DOJ associated with this release, and continues to work with the involved parties to bring this matter to closure. The timing and outcome of this matter cannot be reasonably determined at this time. However, we do not expect there to be a material impact to our results of operations, cash flows or financial position.
In October 2016, the PHMSA issued a Notice of Probable Violation (“NOPVs”) and a Proposed Compliance Order (“PCO”) related to our West Texas Gulf pipeline in connection with repairs being carried out on the pipeline and other administrative and procedural findings. The proposed penalty is in excess of $100,000. The case went to hearing in March 2017 and remains open with PHMSA. We do not expect there to be a material impact to our results of operations, cash flows or financial position.
In April 2016, the PHMSA issued a NOPV, PCO and Proposed Civil Penalty related to certain procedures carried out during construction of our Permian Express 2 pipeline system in Texas. The proposed penalties are in excess of $100,000. The case went to Hearing in November 2016 and remains open with PHMSA. We do not expect there to be a material impact to our results of operations, cash flows or financial position.
In July 2016, the PHMSA issued a NOPV and PCO to our West Texas Gulf pipeline in connection with inspection and maintenance activities related to a 2013 incident on our crude oil pipeline near Wortham, Texas. The proposed penalties are in excess of $100,000. The case went to hearing in March 2017 and remains open with PHMSA. We do not expect there to be a material impact to our results of operations, cash flows, or financial position.
In August 2017, the PHMSA issued a NOPV and a PCO in connection with alleged violations on our Nederland to Kilgore pipeline in Texas. The case remains open with PHMSA and the proposed penalties are in excess of $100,000. We do not expect there to be a material impact to our results of operations, cash flows or financial position.
Our operations are also subject to the requirements of the federal OSHA, and comparable state laws that regulate the protection of the health and safety of employees. In addition, the Occupational Safety and Health Administration’s hazardous communication standard requires that information be maintained about hazardous materials used or produced in our operations and that this information be provided to employees, state and local government authorities and citizens. We believe that our past costs for
OSHA required activities, including general industry standards, record keeping requirements, and monitoring of occupational exposure to regulated substances have not had a material adverse effect on our results of operations but there is no assurance that such costs will not be material in the future.
The following disclosures discuss the Partnership’s revised revenue recognition policies upon the adoption of ASU 2014-09 on January 1, 2018. These policies were applied to the amounts reflected in the Partnership’s consolidated financial statements for the years ended December 31, 2019 and 2018, while the amounts reflected in the Partnership’s consolidated financial statements for the year ended December 31, 2017 were recorded under the Partnership’s previous accounting policies.
Disaggregation of revenue
The major types of revenue within our reportable segments, are as follows:
•intrastate transportation and storage;
•interstate transportation and storage;
•midstream;
•NGL and refined products transportation and services;
•crude oil transportation and services;
•investment in Sunoco LP;
fuel distribution and marketing;
all other;
•investment in USAC;
contract operations;
retail parts and services; and
•all other.
Note 16 depicts the disaggregation of revenue by segment, with revenue amounts reflected in accordance with ASC Topic 606 for 2019 and 2018 and ASC Topic 605 for 2017.
Intrastate transportation and storage revenue
Our intrastate transportation and storage segment’s revenues are determined primarily by the volume of capacity our customers reserve as well as the actual volume of natural gas that flows through the transportation pipelines or that is injected or withdrawn into or out of our storage facilities. Firm transportation and storage contracts require customers to pay certain minimum fixed fees regardless of the volume of commodity they transport or store. These contracts typically include a variable incremental charge based on the actual volume of transportation commodity throughput or stored commodity injected/withdrawn. Under interruptible transportation and storage contracts, customers are not required to pay any fixed minimum amounts, but are instead billed based on actual volume of commodity they transport across our pipelines or inject/withdraw into or out of our storage facilities. Payment for services under these contracts are typically due the month after the services have been performed.
The performance obligation with respect to firm contracts is a promise to provide a single type of service (transportation or storage) daily over the life of the contract, which is fundamentally a “stand-ready” service. While there can be multiple activities required to be performed, these activities are not separable because such activities in combination are required to successfully transfer the overall service for which the customer has contracted. The fixed consideration of the transaction price is allocated ratably over the life of the contract and revenue for the fixed consideration is recognized over time, because the customer simultaneously receives and consumes the benefit of this “stand-ready” service. Incremental fees associated with actual volume for each respective period are recognized as revenue in the period the incremental volume of service is performed.
The performance obligation with respect to interruptible contracts is also a promise to provide a single type of service, but such promise is made on a case-by-case basis at the time the customer requests the service and we accept the customer’s request. Revenue is recognized for interruptible contracts at the time the services are performed.
Our intrastate transportation and storage segment also generates revenues and margin from the sale of natural gas to electric utilities, independent power plants, local distribution companies, industrial end-users and other marketing companies on the HPL System. Generally, we purchase natural gas from the market, including purchases from our marketing operations, and from producers at the wellhead.
Interstate transportation and storage revenue
Our interstate transportation and storage segment’s revenues are determined primarily by the amount of capacity our customers reserve as well as the actual volume of natural gas that flows through the transportation pipelines or that is injected into or withdrawn out of our storage facilities. Our interstate transportation and storage segment’s contracts can be firm or interruptible. Firm transportation and storage contracts require customers to pay certain minimum fixed fees regardless of the volume of commodity transported or stored. In exchange for such fees, we must stand ready to perform a contractually agreed-upon minimum volume of services whenever the customer requests such services. These contracts typically include a variable incremental charge based on the actual volume of transportation commodity throughput or stored commodity injected or withdrawn. Under interruptible transportation and storage contracts, customers are not required to pay any fixed minimum amounts, but are instead billed based on actual volume of commodity they transport across our pipelines or inject into or withdraw out of our storage facilities. Consequently, we are not required to stand ready to provide any contractually agreed-upon volume of service, but instead provides the services based on existing capacity at the time the customer requests the services. Payment for services under these contracts are typically due the month after the services have been performed.
The performance obligation with respect to firm contracts is a promise to provide a single type of service (transportation or storage) daily over the life of the contract, which is fundamentally a “stand-ready” service. While there can be multiple activities required to be performed, these activities are not separable because such activities in combination are required to successfully transfer the overall service for which the customer has contracted. The fixed consideration of the transaction price is allocated ratably over the life of the contract and revenue for the fixed consideration is recognized over time, because the customer simultaneously receives and consumes the benefit of this “stand-ready” service. Incremental fees associated with actual volume for each respective period are recognized as revenue in the period the incremental volume of service is performed.
The performance obligation with respect to interruptible contracts is also a promise to provide a single type of services, but such promise is made on a case-by-case basis at the time the customer requests the service and we accept the customer’s request. Revenue is recognized for interruptible contracts at the time the services are performed.
Lake Charles LNG’s revenues are primarily derived from terminalling services for shippers by receiving LNG at the facility for storage and delivering such LNG to shippers, either in liquid state or gaseous state after regasification. Lake Charles LNG derives all of its revenue from a series of long term contracts with a wholly-owned subsidiary of Royal Dutch Shell plc (“Shell”). Terminalling revenue is generated from fees paid by Shell for storage and other associated services at the terminal. Payment for services under these contracts are typically due the month after the services have been performed.
The terminalling agreements are considered to be firm agreements, because they include fixed fee components that are charged regardless of the volumes transported by Shell or services provided at the terminal.
The performance obligation with respect to firm contracts is a promise to provide a single type of service (terminalling) daily over the life of the contract, which is fundamentally a “stand-ready” service. While there can be multiple activities required to be performed, these activities are not separable because such activities in combination are required to successfully transfer the overall service for which the customer has contracted. The fixed consideration of the transaction price is allocated ratably over the life of the contract and revenue for the fixed consideration is recognized over time, because the customer simultaneously receives and consumes the benefit of this “stand-ready” service. Incremental fees associated with actual volume for each respective period are recognized as revenue in the period the incremental volume of service is performed.
Midstream revenue
Our midstream segment’s revenues are derived primarily from margins we earn for natural gas volumes that are gathered, processed, and/or transported. The various types of revenue contracts our midstream segment enters into include:
Fixed fee gathering and processing: Contracts under which we provide gathering and processing services in exchange for a fixed cash fee per unit of volume. Revenue for cash fees is recognized when the service is performed.
Keepwhole: Contracts under which we gather raw natural gas from a third party producer, process the gas to convert it to pipeline quality natural gas, and redeliver to the producer a thermal-equivalent volume of pipeline quality natural gas. In exchange for these services, we retain the NGLs extracted from the raw natural gas received from the producer as well as cash fees paid by the producer. The value of NGLs retained as well as cash fees is recognized as revenue when the services are performed.
Percent of Proceeds (“POP”): Contracts under which we provide gathering and processing services in exchange for a specified percentage of the producer’s commodity (“POP percentage”) and also in some cases additional cash fees. The two types of POP revenue contracts are described below:
| |
| • | In-Kind POP: We retain our POP percentage (non-cash consideration) and also any additional cash fees in exchange for providing the services. We recognize revenue for the non-cash consideration and cash fees at the time the services are performed. |
| |
| • | Mixed POP: We purchase NGLs from the producer and retain a portion of the residue gas as non-cash consideration for services provided. We may also receive cash fees for such services. Under Topic 606, these agreements were determined to be hybrid agreements which were partially supply agreements (for the NGLs we purchased) and customer agreements (for the services provided related to the product that was returned to the customer). Given that these are hybrid agreements, we split the cash and non-cash consideration between revenue and a reduction of costs based on the value of the service provided vs. the value of the supply received. |
Payment for services under these contracts are typically due the month after the services have been performed.
The performance obligations with respect to our midstream segment’s contracts are to provide gathering, transportation and processing services, each of which would be completed on or about the same time, and each of which would be recognized on the same line item on the income statement, therefore identification of separate performance obligations would not impact the timing or geography of revenue recognition.
Certain contracts of our midstream segment include throughput commitments under which customers commit to purchasing a certain minimum volume of service over a specified time period. If such volume of service is not purchased by the customer, deficiency fees are billed to the customer. In some cases, the customer is allowed to apply any deficiency fees paid to future purchases of services. In such cases, we defer revenue recognition until the customer uses the deficiency fees for services provided or becomes unable to use the fees as payment for future services due to expiration of the contractual period the fees can be applied or physical inability of the customer to utilize the fees due to capacity constraints.
Our midstream segment also generates revenues from the sale of residue gas and NGLs at the tailgate of our processing facilities primarily to affiliates and some third-party customers.
NGL and refined products transportation and services revenue
Our NGL and refined products segment’s revenues are primarily derived from transportation, fractionation, blending, and storage of NGL and refined products as well as acquisition and marketing activities. Revenues are generated utilizing a complementary network of pipelines, storage and blending facilities, and strategic off-take locations that provide access to multiple NGL markets. Transportation, fractionation, and storage revenue is generated from fees charged to customers under a combination of firm and interruptible contracts. Firm contracts are in the form of take-or-pay arrangements where certain fees will be charged to customers regardless of the volume of service they request for any given period. Under interruptible contracts, customers are not required to pay any fixed minimum amounts, but are instead billed based on actual volume of service provided for any given period. Payment for services under these contracts are typically due the month after the services have been performed.
The performance obligation with respect to firm contracts is a promise to provide a single type of service (transportation, fractionation, blending, or storage) daily over the life of the contract, which is fundamentally a “stand-ready” service. While there can be multiple activities required to be performed, these activities are not separable because such activities in combination are required to successfully transfer the overall service for which the customer has contracted. The fixed consideration of the transaction price is allocated ratably over the life of the contract and revenue for the fixed consideration is recognized over time, because the customer simultaneously receives and consumes the benefit of this “stand-ready” service. Incremental fees associated with actual volume for each respective period are recognized as revenue in the period the incremental volume of service is performed.
The performance obligation with respect to interruptible contracts is also a promise to provide a single type of services, but such promise is made on a case-by-case basis at the time the customer requests the service and we accept the customer’s request. Revenue is recognized for interruptible contracts at the time the services are performed.
Acquisition and marketing contracts are in most cases short-term agreements involving purchase and/or sale of NGLs and other related hydrocarbons at market rates. These contracts were not affected by ASC 606.
Crude oil transportation and services revenue
Our crude oil transportation and services segment revenues are primarily derived from providing transportation, terminalling and acquisition and marketing services to crude oil markets throughout the southwest, midwest and northeastern United States. Crude oil transportation revenue is generated from tariffs paid by shippers utilizing our transportation services and is generally recognized as the related transportation services are provided. Crude oil terminalling revenue is generated from fees paid by customers for storage and other associated services at the terminal. Crude oil acquisition and marketing revenue is generated from sale of crude oil acquired from a variety of suppliers to third parties. Payment for services under these contracts are typically due the month after the services have been performed.
Certain transportation and terminalling agreements are considered to be firm agreements, because they include fixed fee components that are charged regardless of the volume of crude oil transported by the customer or services provided at the terminal. For these agreements, any fixed fees billed in excess of services provided are not recognized as revenue until the earlier of (i) the time at which the customer applies the fees against cost of service provided in a later period, or (ii) the customer becomes unable to apply the fees against cost of future service due to capacity constraints or contractual terms.
The performance obligation with respect to firm contracts is a promise to provide a single type of service (transportation or terminalling) daily over the life of the contract, which is fundamentally a “stand-ready” service. While there can be multiple activities required to be performed, these activities are not separable because such activities in combination are required to successfully transfer the overall service for which the customer has contracted. The fixed consideration of the transaction price is allocated ratably over the life of the contract and revenue for the fixed consideration is recognized over time, because the customer simultaneously receives and consumes the benefit of this “stand-ready” service. Incremental fees associated with actual volume for each respective period are recognized as revenue in the period the incremental volume of service is performed.
The performance obligation with respect to interruptible contracts is also a promise to provide a single type of service, but such promise is made on a case-by-case basis at the time the customer requests the service and/or product and we accept the customer’s request. Revenue is recognized for interruptible contracts at the time the services are performed.
Acquisition and marketing contracts are in most cases short-term agreements involving purchase and/or sale of crude oil at market rates. These contracts were not affected by ASC 606.
Sunoco LP’s fuel distribution and marketing revenue
Sunoco LP’s fuel distribution and marketing operations earn revenue from the following channels: sales to Dealers, sales to Distributors, Unbranded Wholesale Revenue, Commission Agent Revenue, Rental Income and Other Income. Motor fuel revenue consists primarily of the sale of motor fuel under supply agreements with third party customers and affiliates. Fuel supply contracts with Sunoco LP’s customers generally provide that Sunoco LP distribute motor fuel at a formula price based on published rates, volume-based profit margin, and other terms specific to the agreement. The customer is invoiced the agreed-upon price with most payment terms ranging less than 30 days. If the consideration promised in a contract includes a variable amount, Sunoco LP estimates the variable consideration amount and factors in such an estimate to determine the transaction price under the expected value method.
Revenue is recognized under the motor fuel contracts at the point in time the customer takes control of the fuel. At the time control is transferred to the customer the sale is considered final, because the agreements do not grant customers the right to return motor fuel. Under the new standard, to determine when control transfers to the customer, the shipping terms of the contract are assessed as shipping terms are considered a primary indicator of the transfer of control. For FOB shipping point terms, revenue is recognized at the time of shipment. The performance obligation with respect to the sale of goods is satisfied at the time of shipment since the customer gains control at this time under the terms. Shipping and/or handling costs that occur before the customer obtains control of the goods are deemed to be fulfillment activities and are accounted for as fulfillment costs. Once the goods are shipped, Sunoco LP is precluded from redirecting the shipment to another customer and revenue is recognized.
Commission agent revenue consists of sales from commission agent agreements between Sunoco LP and select operators. Sunoco LP supplies motor fuel to sites operated by commission agents and sells the fuel directly to the end customer. In commission agent arrangements, control of the product is transferred at the point in time when the goods are sold to the end customer. To reflect the transfer of control, Sunoco LP recognizes commission agent revenue at the point in time fuel is sold to the end customer.
Sunoco LP receives rental income from leased or subleased properties. Revenue from leasing arrangements for which Sunoco LP is the lessor are recognized ratably over the term of the underlying lease.
Sunoco LP’s all other revenue
Sunoco LP’s all other operations earn revenue from the following channels: Motor Fuel Sales, Rental Income and Other Income. Motor Fuel Sales consist of fuel sales to consumers at company-operated retail stores. Other income includes merchandise revenue that comprises the in-store merchandise and food service sales at company-operated retail stores, and other revenue that represents a variety of other services within Sunoco LP’s all other operations including credit card processing, car washes, lottery, automated teller machines, money orders, prepaid phone cards and wireless services. Revenue from all other operations is recognized when (or as) the performance obligations are satisfied (i.e. when the customer obtains control of the good or the service is provided).
USAC’s contract operations revenue
USAC’s revenue from contracted compression, station, gas treating and maintenance services is recognized ratably under its fixed-fee contracts over the term of the contract as services are provided to its customers. Initial contract terms typically range from six months to five years, however USAC usually continues to provide compression services at a specific location beyond the initial contract term, either through contract renewal or on a month-to-month or longer basis. USAC primarily enters into fixed-fee contracts whereby its customers are required to pay the monthly fee even during periods of limited or disrupted throughput. Services are generally billed monthly, one month in advance of the commencement of the service month, except for certain customers who are billed at the beginning of the service month, and payment is generally due 30 days after receipt of the invoice. Amounts invoiced in advance are recorded as deferred revenue until earned, at which time they are recognized as revenue. The amount of consideration USAC receives and revenue it recognizes is based upon the fixed fee rate stated in each service contract.
Variable consideration exists in select contracts when billing rates vary based on actual equipment availability or volume of total installed horsepower.
USAC’s contracts with customers may include multiple performance obligations. For such arrangements, USAC allocates revenues to each performance obligation based on its relative standalone service fee. USAC generally determine standalone service fees based on the service fees charged to customers or using expected cost plus margin.
The majority of USAC’s service performance obligations are satisfied over time as services are rendered at selected customer locations on a monthly basis and based upon specific performance criteria identified in the applicable contract. The monthly service for each location is substantially the same service month to month and is promised consecutively over the service contract term. USAC measures progress and performance of the service consistently using a straight-line, time-based method as each month passes, because its performance obligations are satisfied evenly over the contract term as the customer simultaneously receives and consumes the benefits provided by its service. If variable consideration exists, it is allocated to the distinct monthly service within the series to which such variable consideration relates. USAC has elected to apply the invoicing practical expedient to recognize revenue for such variable consideration, as the invoice corresponds directly to the value transferred to the customer based on its performance completed to date.
There are typically no material obligations for returns or refunds. USAC’s standard contracts do not usually include material non-cash consideration.
USAC’s retail parts and services revenue
USAC’s retail parts and service revenue is earned primarily on freight and crane charges that are directly reimbursable by USAC’s customers and maintenance work on units at its customers’ locations that are outside the scope of its core maintenance activities. Revenue from retail parts and services is recognized at the point in time the part is transferred or service is provided and control is transferred to the customer. At such time, the customer has the ability to direct the use of the benefits of such part or service after USAC has performed its services. USAC bills upon completion of the service or transfer of the parts, and payment is generally due 30 days after receipt of the invoice. The amount of consideration USAC receives and revenue it recognizes is based upon the invoice amount. There are typically no material obligations for returns, refunds, or warranties. USAC’s standard contracts do not usually include material variable or non-cash consideration.
All other revenue
Our all other segment primarily includes our compression equipment business which provides full-service compression design and manufacturing services for the oil and gas industry. It also includes the management of coal and natural resources properties and the related collection of royalties. We also earn revenues from other land management activities, such as selling standing timber, leasing coal-related infrastructure facilities, and collecting oil and gas royalties. These operations also include end-
user coal handling facilities. There were no material changes to the manner in which revenues within this segment are recorded under the new standard.
Contract Balances with Customers
The Partnership satisfies its obligations by transferring goods or services in exchange for consideration from customers. The timing of performance may differ from the timing the associated consideration is paid to or received from the customer, thus resulting in the recognition of a contract asset or a contract liability.
The Partnership recognizes a contract asset when making upfront consideration payments to certain customers or when providing services to customers prior to the time at which the Partnership is contractually allowed to bill for such services.
The Partnership recognizes a contract liability if the customer's payment of consideration precedes the Partnership’s fulfillment of the performance obligations. Certain contracts contain provisions requiring customers to pay a fixed fee for a right to use our assets, but allows customers to apply such fees against services to be provided at a future point in time. These amounts are reflected as deferred revenue until the customer applies the deficiency fees to services provided or becomes unable to use the fees as payment for future services due to expiration of the contractual period the fees can be applied or physical inability of the customer to utilize the fees due to capacity constraints. Additionally, Sunoco LP maintains some franchise agreements requiring dealers to make one-time upfront payments for long term license agreements. Sunoco LP recognizes a contract liability when the upfront payment is received and recognizes revenue over the term of the license.
The following table summarizes the consolidated activity of our contract liabilities:
|
| | | |
| | Contract Liabilities |
| Balance, January 1, 2018 | $ | 221 |
|
| Additions | 765 |
|
| Revenue recognized | (592 | ) |
| Balance, December 31, 2018 | 394 |
|
| Additions | 643 |
|
| Revenue recognized | (679 | ) |
| Balance, December 31, 2019 | $ | 358 |
|
The balances of receivables from contracts with customers listed in the table below include both current trade receivables and long-term receivables, net of allowance for doubtful accounts. The allowance for receivables represents Sunoco LP’s best estimate of the probable losses associated with potential customer defaults. Sunoco LP determines the allowance based on historical experience and on a specific identification basis.
The balances of Sunoco LP’s contract assets and contract liabilities as of December 31, 2019 and 2018 were as follows:
|
| | | | | | | |
| | December 31, 2019 | | December 31, 2018 |
| Contract balances: | | | |
| Contract asset | $ | 117 |
| | $ | 75 |
|
| Accounts receivable from contracts with customers | 366 |
| | 347 |
|
| Contract liability | — |
| | 1 |
|
Costs to Obtain or Fulfill a Contract
Sunoco LP recognizes an asset from the costs incurred to obtain a contract (e.g. sales commissions) only if it expects to recover those costs. On the other hand, the costs to fulfill a contract are capitalized if the costs are specifically identifiable to a contract, would result in enhancing resources that will be used in satisfying performance obligations in future and are expected to be recovered. These capitalized costs are recorded as a part of other current assets and other non-current assets and are amortized on a systematic basis consistent with the pattern of transfer of the goods or services to which such costs relate. The amount of amortization expense that Sunoco LP recognized for the years ended December 31, 2019 and 2018 was $17 million and $14 million, respectively. Sunoco LP has also made a policy election of expensing the costs to obtain a contract, as and when they are incurred, in cases where the expected amortization period is one year or less.
Performance Obligations
At contract inception, the Partnership assesses the goods and services promised in its contracts with customers and identifies a performance obligation for each promise to transfer a good or service (or bundle of goods or services) that is distinct. To identify the performance obligations, the Partnership considers all the goods or services promised in the contract, whether explicitly stated or implied based on customary business practices. For a contract that has more than one performance obligation, the Partnership allocates the total contract consideration it expects to be entitled to, to each distinct performance obligation based on a standalone-selling price basis. Revenue is recognized when (or as) the performance obligations are satisfied, that is, when the customer obtains control of the good or service. Certain of our contracts contain variable components, which, when combined with the fixed component are considered a single performance obligation. For these types of contracts, only the fixed component of the contracts are included in the table below.
Sunoco LP distributes fuel under long-term contracts to branded distributors, branded and unbranded third party dealers, and branded and unbranded retail fuel outlets. Sunoco LP branded supply contracts with distributors generally have both time and volume commitments that establish contract duration. These contracts have an initial term of approximately nine years, with an estimated, volume-weighted term remaining of approximately four years.
As part of the asset purchase agreement with 7-Eleven, Sunoco LP and 7-Eleven and SEI Fuel (collectively, the “Distributor”) have entered into a 15-year take-or-pay fuel supply agreement in which the Distributor is required to purchase a volume of fuel that provides Sunoco LP a minimum amount of gross profit annually. Sunoco LP expects to recognize this revenue in accordance with the contract as Sunoco LP transfers control of the product to the customer. However, in case of annual shortfall Sunoco LP will recognize the amount payable by the Distributor at the sooner of the time at which the Distributor makes up the shortfall or becomes contractually or operationally unable to do so. The transaction price of the contract is variable in nature, fluctuating based on market conditions. The Partnership has elected to take the practical expedient not to estimate the amount of variable consideration allocated to wholly unsatisfied performance obligations.
In some contractual arrangements, Sunoco LP grants dealers a franchise license to operate Sunoco LP’s retail stores over the life of a franchise agreement. In return for the grant of the retail store license, the dealer makes a one-time nonrefundable franchise fee payment to Sunoco LP plus sales based royalties payable to Sunoco LP at a contractual rate during the period of the franchise agreement. Under the requirements of ASC Topic 606, the franchise license is deemed to be a symbolic license for which recognition of revenue over time is the most appropriate measure of progress toward complete satisfaction of the performance obligation. Revenue from this symbolic license is recognized evenly over the life of the franchise agreement.
As of December 31, 2019, the aggregate amount of transaction price allocated to unsatisfied (or partially satisfied) performance obligations is $40.70 billion and the Partnership expects to recognize this amount as revenue within the time bands illustrated below:
|
| | | | | | | | | | | | | | | | | | | | |
| | | Years Ending December 31, | | | | |
| | | 2020 | | 2021 | | 2022 | | Thereafter | | Total |
| Revenue expected to be recognized on contracts with customers existing as of December 31, 2019 | | $ | 5,913 |
| | $ | 5,056 |
| | $ | 4,672 |
| | $ | 25,059 |
| | $ | 40,700 |
|
Practical Expedients Utilized by the Partnership
The Partnership elected the following practical expedients in accordance with Topic 606:
| |
| • | Right to invoice: The Partnership elected to utilize an output method to recognize revenue that is based on the amount to which the Partnership has a right to invoice a customer for services performed to date, if that amount corresponds directly with the value provided to the customer for the related performance or its obligation completed to date. As such, the Partnership recognized revenue in the amount to which it had the right to invoice customers. |
| |
| • | Significant financing component: The Partnership elected not to adjust the promised amount of consideration for the effects of significant financing component if the Partnership expects, at contract inception, that the period between the transfer of a promised good or service to a customer and when the customer pays for that good or service will be one year or less. |
| |
| • | Unearned variable consideration: The Partnership elected to only disclose the unearned fixed consideration associated with unsatisfied performance obligations related to our various customer contracts which contain both fixed and variable components. |
| |
| • | Incremental costs of obtaining a contract: The Partnership generally expenses sales commissions when incurred because the amortization period would have been less than one year. We record these costs within general and administrative expenses. The Partnership elected to expense the incremental costs of obtaining a contract when the amortization period for such contracts would have been one year or less. |
| |
| • | Shipping and handling costs:The Partnership elected to account for shipping and handling activities that occur after the customer has obtained control of a good as fulfillment activities (i.e., an expense) rather than as a promised service. |
| |
| • | Measurement of transaction price: The Partnership has elected to exclude from the measurement of transaction price all taxes assessed by a governmental authority that are both imposed on and concurrent with a specific revenue-producing transaction and collected by the Partnership from a customer (i.e., sales tax, value added tax, etc.). |
| |
| • | Variable consideration of wholly unsatisfied performance obligations:The Partnership has elected to exclude the estimate of variable consideration to the allocation of wholly unsatisfied performance obligations. |
Lessee Accounting
The Partnership leases terminal facilities, tank cars, office space, land and equipment under non-cancelable operating leases whose initial terms are typically five to 15 years, with some real estate leases having terms of 40 years or more, along with options that permit renewals for additional periods. At the inception of each, we determine if the arrangement is a lease or contains an embedded lease and review the facts and circumstances of the arrangement to classify lease assets as operating or finance leases under Topic 842. The Partnership has elected not to record any leases with terms of 12 months or less on the balance sheet.
At present, the majority of the Partnership’s active leases are classified as operating in accordance with Topic 842. Balances related to operating leases are included in operating lease ROU assets, accrued and other current liabilities, operating lease current liabilities and non-current operating lease liabilities in our consolidated balance sheets. Finance leases represent a small portion of the active lease agreements and are included in finance lease ROU assets, current maturities of long-term debt and long-term debt, less current maturities in our consolidated balance sheets. The ROU assets represent the Partnership’s right to use an underlying asset for the lease term and lease liabilities represent the obligation of the Partnership to make minimum lease payments arising from the lease for the duration of the lease term.
Most leases include one or more options to renew, with renewal terms that can extend the lease term from one to 20 years or greater. The exercise of lease renewal options is typically at the sole discretion of the Partnership and lease extensions are evaluated on a lease-by-lease basis. Leases containing early termination clauses typically require the agreement of both parties to the lease. At the inception of a lease, all renewal options reasonably certain to be exercised are considered when determining the lease term. Presently, the Partnership does not have leases that include options to purchase or automatic transfer of ownership of the leased property to the Partnership. The depreciable life of lease assets and leasehold improvements are limited by the expected lease term.
To determine the present value of future minimum lease payments, we use the implicit rate when readily determinable. Presently, because many of our leases do not provide an implicit rate, the Partnership applies its incremental borrowing rate based on the information available at the lease commencement date to determine the present value of minimum lease payments. The operating and finance lease ROU assets include any lease payments made and exclude lease incentives.
Minimum rent payments are expensed on a straight-line basis over the term of the lease. In addition, some leases require additional contingent or variable lease payments, which are based on the factors specific to the individual agreement. Variable lease payments the Partnership is typically responsible for include payment of real estate taxes, maintenance expenses and insurance.
For short-term leases (leases that have term of twelve months or less upon commencement), lease payments are recognized on a straight-line basis and no ROU assets are recorded.
The components of operating and finance lease amounts recognized in the accompanying consolidated balance sheet as of December 31, 2019 were as follows:
|
| | | |
| | December 31, 2019 |
| Operating leases: | |
| Lease right-of-use assets, net | $ | 848 |
|
| Operating lease current liabilities | 54 |
|
| Accrued and other current liabilities | 1 |
|
| Non-current operating lease liabilities | 816 |
|
| Finance leases: | |
| Property, plant and equipment, net | $ | 1 |
|
| Lease right-of-use assets, net | 29 |
|
| Accrued and other current liabilities | 1 |
|
| Current maturities of long-term debt | 6 |
|
| Long-term debt, less current maturities | 26 |
|
| Other non-current liabilities | 2 |
|
The components of lease expense for the year ended December 31, 2019 were as follows:
|
| | | | | | |
| | | Income Statement Location | | Year Ended December 31, 2019 |
| Operating lease costs: | | |
| Operating lease cost | | Cost of goods sold | | $ | 28 |
|
| Operating lease cost | | Operating expenses | | 72 |
|
| Operating lease cost | | Selling, general and administrative | | 16 |
|
| Total operating lease costs | | 116 |
|
| Finance lease costs: | | |
| Amortization of lease assets | | Depreciation, depletion and amortization | | 6 |
|
| Interest on lease liabilities | | Interest expense, net of capitalized interest | | 1 |
|
| Total finance lease costs | | 7 |
|
| Short-term lease cost | | Operating expenses | | 42 |
|
| Variable lease cost | | Operating expenses | | 17 |
|
| Lease costs, gross | | 182 |
|
| Less: Sublease income | | Other revenue | | 47 |
|
| Lease costs, net | | $ | 135 |
|
The weighted average remaining lease terms and weighted average discount rates as of December 31, 2019 were as follows:
|
| | |
| December 31, 2019 |
| Weighted-average remaining lease term (years): | |
| Operating leases | 22 |
|
| Finance leases | 5 |
|
| Weighted-average discount rate (%): | |
| Operating leases | 5 | % |
| Finance leases | 5 | % |
Cash flows and non-cash activity related to leases for the year ended December 31, 2019 were as follows:
|
| | | |
| | Year Ended December 31, 2019 |
| Operating cash flows from operating leases | $ | (158 | ) |
| Lease assets obtained in exchange for new finance lease liabilities | 28 |
|
| Lease assets obtained in exchange for new operating lease liabilities | 39 |
|
Maturities of lease liabilities as of December 31, 2019 are as follows:
|
| | | | | | | | | | | |
| | Operating leases | | Finance leases | | Total |
| 2020 | $ | 98 |
| | $ | 8 |
| | $ | 106 |
|
| 2021 | 89 |
| | 8 |
| | 97 |
|
| 2022 | 77 |
| | 8 |
| | 85 |
|
| 2023 | 71 |
| | 7 |
| | 78 |
|
| 2024 | 68 |
| | 4 |
| | 72 |
|
| Thereafter | 1,141 |
| | 5 |
| | 1,146 |
|
| Total lease payments | 1,544 |
| | 40 |
| | 1,584 |
|
| Less: present value discount | 674 |
| | 5 |
| | 679 |
|
| Present value of lease liabilities | $ | 870 |
| | $ | 35 |
| | $ | 905 |
|
Lessor Accounting
The Partnership leases or subleases a portion of its real estate portfolio to third-party companies as a stable source of long-term revenue. Our lessor and sublease portfolio consists mainly of operating leases with convenience store operators. At this time, most lessor agreements contain five-year terms with renewal options to extend and early termination options based on established terms specific to the individual agreement.
Rental income included in other revenue in our consolidated statement of operations for the year ended December 31, 2019 was $146 million.
Future minimum operating lease payments receivable as of December 31, 2019 are as follows:
|
| | | |
| | Lease Payments |
| 2020 | $ | 125 |
|
| 2021 | 99 |
|
| 2022 | 62 |
|
| 2023 | 7 |
|
| 2024 | 2 |
|
| Thereafter | 7 |
|
| Total undiscounted cash flows | $ | 302 |
|
| |
12.13. | DERIVATIVE ASSETS AND LIABILITIES: |
Commodity Price Risk
We are exposed to market risks related to the volatility of commodity prices. To manage the impact of volatility from these prices, we utilize various exchange-traded and OTC commodity financial instrument contracts. These contracts consist primarily of futures, swaps and options and are recorded at fair value in our consolidated balance sheets.
We use futures and basis swaps, designated as fair value hedges, to hedge our natural gas inventory stored in our Bammel storage facility. At hedge inception, we lock in a margin by purchasing gas in the spot market or off peak season and entering into a financial contract. Changes in the spreads between the forward natural gas prices and the physical inventory spot price result in unrealized gains or losses until the underlying physical gas is withdrawn and the related designated derivatives are settled. Once the gas is withdrawn and the designated derivatives are settled, the previously unrealized gains or losses associated with these positions are realized.
We use futures, swaps and options to hedge the sales price of natural gas we retain for fees in our intrastate transportation and storage segment and operational gas sales on our interstate transportation and storage segment. These contracts are not designated as hedges for accounting purposes.
We use NGL and crude derivative swap contracts to hedge forecasted sales of NGL and condensate equity volumes we retain for fees in our midstream segment whereby our subsidiaries generally gather and process natural gas on behalf of producers, sell the resulting residue gas and NGL volumes at market prices and remit to producers an agreed upon percentage of the proceeds based on an index price for the residue gas and NGL. These contracts are not designated as hedges for accounting purposes.
We utilize swaps, futures and other derivative instruments to mitigate the risk associated with market movements in the price of refined products and NGLs to manage our storage facilities and the purchase and sale of purity NGL. These contracts are not designated as hedges for accounting purposes.
We use futures and swaps to achieve ratable pricing of crude oil purchases, to convert certain expected refined product sales to fixed or floating prices, to lock in margins for certain refined products and to lock in the price of a portion of natural gas purchases or sales. These contracts are not designated as hedges for accounting purposes.
We use financial commodity derivatives to take advantage of market opportunities in our trading activities which complement our transportation and storage segment’s operations and are netted in cost of products sold in our consolidated statements of operations. We also have trading and marketing activities related to power and natural gas in our all other segment which are also netted in cost of products sold. As a result of our trading activities and the use of derivative financial instruments in our transportation and storage segment, the degree of earnings volatility that can occur may be significant, favorably or unfavorably, from period to period. We attempt to manage this volatility through the use of daily position and profit and loss reports provided to our risk oversight committee, which includes members of senior management, and the limits and authorizations set forth in our commodity risk management policy.
The following table details our outstanding commodity-related derivatives:
| | | | December 31, 2017 | | December 31, 2016 | December 31, 2019 | | December 31, 2018 |
| | Notional Volume | | Maturity | | Notional Volume | | Maturity | Notional Volume | | Maturity | | Notional Volume | | Maturity |
| Mark-to-Market Derivatives | | | | | | | | | | | | | | |
| (Trading) | | | | | | | | |
| Natural Gas (BBtu): | | | | | | | | |
| Fixed Swaps/Futures | 1,078 |
| | 2018 | | (683 | ) | | 2017 | 1,483 |
| | 2020 | | 468 |
| | 2019 |
Basis Swaps IFERC/NYMEX(1) | 48,510 |
| | 2018-2020 | | 2,243 |
| | 2017 | (35,208 | ) | | 2020-2024 | | 16,845 |
| | 2019-2020 |
| Options – Calls | 13,000 |
| | 2018 | | — |
| | — | |
| Options – Puts | | — |
| | — | | 10,000 |
| | 2019 |
| Power (Megawatt): | | | | | | | | |
| Forwards | 435,960 |
| | 2018-2019 | | 391,880 |
| | 2017-2018 | 3,213,450 |
| | 2020-2029 | | 3,141,520 |
| | 2019 |
| Futures | (25,760 | ) | | 2018 | | 109,564 |
| | 2017-2018 | (353,527 | ) | | 2020 | | 56,656 |
| | 2019-2021 |
| Options – Puts | (153,600 | ) | | 2018 | | (50,400 | ) | | 2017 | 51,615 |
| | 2020 | | 18,400 |
| | 2019 |
| Options – Calls | 137,600 |
| | 2018 | | 186,400 |
| | 2017 | (2,704,330 | ) | | 2020-2021 | | 284,800 |
| | 2019 |
| Crude (MBbls) – Futures | — |
| | — | | (617 | ) | | 2017 | |
| (Non-Trading) | | | | | | | | |
| Natural Gas (BBtu): | | | | | | | | |
| Basis Swaps IFERC/NYMEX | 4,650 |
| | 2018-2020 | | 10,750 |
| | 2017-2018 | (18,923 | ) | | 2020-2022 | | (30,228 | ) | | 2019-2021 |
| Swing Swaps IFERC | 87,253 |
| | 2018-2019 | | (5,663 | ) | | 2017 | (9,265 | ) | | 2020 | | 54,158 |
| | 2019-2020 |
| Fixed Swaps/Futures | (4,700 | ) | | 2018-2019 | | (52,653 | ) | | 2017-2019 | (3,085 | ) | | 2020-2021 | | (1,068 | ) | | 2019-2021 |
| Forward Physical Contracts | (145,105 | ) | | 2018-2020 | | (22,492 | ) | | 2017 | (13,364 | ) | | 2020-2021 | | (123,254 | ) | | 2019-2020 |
| Natural Gas Liquid (MBbls) – Forwards/Swaps | 6,679 |
| | 2018-2019 | | (5,787 | ) | | 2017 | |
| NGL (MBbls) – Forwards/Swaps | | (1,300 | ) | | 2020-2021 | | (2,135 | ) | | 2019 |
| Crude (MBbls) – Forwards/Swaps | | 4,465 |
| | 2020 | | 20,888 |
| | 2019 |
| Refined Products (MBbls) – Futures | (3,783 | ) | | 2018-2019 | | (2,240 | ) | | 2017 | (2,473 | ) | | 2020-2021 | | (1,403 | ) | | 2019 |
| Corn (thousand bushels) | | (1,210 | ) | | 2020 | | (1,920 | ) | | 2019 |
| Fair Value Hedging Derivatives | | | | | | | | |
| (Non-Trading) | | | | | | | | |
| Natural Gas (BBtu): | | | | | | | | |
| Basis Swaps IFERC/NYMEX | (39,770 | ) | | 2018 | | (36,370 | ) | | 2017 | (31,780 | ) | | 2020 | | (17,445 | ) | | 2019 |
| Fixed Swaps/Futures | (39,770 | ) | | 2018 | | (36,370 | ) | | 2017 | (31,780 | ) | | 2020 | | (17,445 | ) | | 2019 |
| Hedged Item – Inventory | 39,770 |
| | 2018 | | 36,370 |
| | 2017 | 31,780 |
| | 2020 | | 17,445 |
| | 2019 |
| |
(1) | Includes aggregate amounts for open positions related to Houston Ship Channel, Waha Hub, NGPL TexOk, West Louisiana Zone and Henry Hub locations. |
Interest Rate Risk
We are exposed to market risk for changes in interest rates. To maintain a cost effective capital structure, we borrow funds using a mix of fixed rate debt and variable rate debt. We also manage our interest rate exposure by utilizing interest rate swaps to achieve a desired mix of fixed and variable rate debt. We also utilize forward starting interest rate swaps to lock in the rate on a portion of our anticipated debt issuances.
The following table summarizes our interest rate swaps outstanding, none of which were designated as hedges for accounting purposes:
|
| | | | | | | | | | |
| Term | | Type (1) | | Notional Amount Outstanding |
| December 31, 2019 | | December 31, 2018 |
| March 2019 | | Pay a floating rate and receive a fixed rate of 1.42% | | $ | — |
| | $ | 300 |
|
July 2019 (2) | | Forward-starting to pay a fixed rate of 3.56% and receive a floating rate | | — |
| | 400 |
|
July 2020 (2)(3) | | Forward-starting to pay a fixed rate of 3.52% and receive a floating rate | | 400 |
| | 400 |
|
July 2021 (2) | | Forward-starting to pay a fixed rate of 3.55% and receive a floating rate | | 400 |
| | 400 |
|
July 2022 (2) | | Forward-starting to pay a fixed rate of 3.80% and receive a floating rate | | 400 |
| | — |
|
|
| | | | | | | | | | |
| Term | | Type(1) | | Notional Amount Outstanding |
| December 31, 2017 | | December 31, 2016 |
July 2017(2) | | Forward-starting to pay a fixed rate of 3.90% and receive a floating rate | | $ | — |
| | $ | 500 |
|
July 2018(2) | | Forward-starting to pay a fixed rate of 3.76% and receive a floating rate | | 300 |
| | 200 |
|
July 2019(2) | | Forward-starting to pay a fixed rate of 3.64% and receive a floating rate | | 300 |
| | 200 |
|
July 2020(2) | | Forward-starting to pay a fixed rate of 3.52% and receive a floating rate | | 400 |
| | — |
|
| December 2018 | | Pay a floating rate based on a 3-month LIBOR and receive a fixed rate of 1.53% | | 1,200 |
| | 1,200 |
|
| March 2019 | | Pay a floating rate based on a 3-month LIBOR and receive a fixed rate of 1.42% | | 300 |
| | 300 |
|
| |
(1) | Floating rates are based on 3-month LIBOR. |
| |
(2) | Represents the effective date. These forward-starting swaps have terms of 30 years with a mandatory termination date the same as the effective date. |
| |
(3) | The July 2020 interest rate swaps were terminated in January 2020. |
Credit Risk
Credit risk refers to the risk that a counterparty may default on its contractual obligations resulting in a loss to the Partnership. Credit policies have been approved and implemented to govern the Partnership’s portfolio of counterparties with the objective of mitigating credit losses. These policies establish guidelines, controls and limits to manage credit risk within approved tolerances by mandating an appropriate evaluation of the financial condition of existing and potential counterparties, monitoring agency credit ratings, and by implementing credit practices that limit exposure according to the risk profiles of the counterparties. Furthermore, the Partnership may, at times, require collateral under certain circumstances to mitigate credit risk as necessary. The Partnership also uses industry standard commercial agreements which allow for the netting of exposures associated with transactions executed under a single commercial agreement. Additionally, we utilize master netting agreements to offset credit exposure across multiple commercial agreements with a single counterparty or affiliated group of counterparties.
The Partnership’s counterparties consist of a diverse portfolio of customers across the energy industry, including petrochemical companies, commercial and industrials,industrial end-users, oil and gas producers, municipalities, gas and electric utilities, midstream companies and independent power generators. Our overall exposure may be affected positively or negatively by macroeconomic or regulatory changes that impact our counterparties to one extent or another. Currently, management does not anticipate a material adverse effect in our financial position or results of operations as a consequence of counterparty non-performance.
The Partnership has maintenance margin deposits with certain counterparties in the OTC market, primarily with independent system operators and with clearing brokers. Payments on margin deposits are required when the value of a derivative exceeds our pre-established credit limit with the counterparty. Margin deposits are returned to us on or about the settlement date for non-exchange traded derivatives, and we exchange margin calls on a daily basis for exchange traded transactions. Since the margin calls are made daily with the exchange brokers, the fair value of the financial derivative instruments are deemed current and netted in deposits paid to vendors within other current assets in the consolidated balance sheets.
For financial instruments, failure of a counterparty to perform on a contract could result in our inability to realize amounts that have been recorded on our consolidated balance sheets and recognized in net income or other comprehensive income.
Derivative Summary
The following table provides a summary of our derivative assets and liabilities:
|
| | | | | | | | | | | | | | | |
| | Fair Value of Derivative Instruments |
| | Asset Derivatives | | Liability Derivatives |
| | December 31, 2019 | | December 31, 2018 | | December 31, 2019 | | December 31, 2018 |
| Derivatives designated as hedging instruments: | | | | | | | |
| Commodity derivatives (margin deposits) | $ | 24 |
| | $ | — |
| | $ | — |
| | $ | (13 | ) |
| | 24 |
| | — |
| | — |
| | (13 | ) |
| Derivatives not designated as hedging instruments: | | | | | | | |
| Commodity derivatives (margin deposits) | 319 |
| | 402 |
| | (350 | ) | | (397 | ) |
| Commodity derivatives | 41 |
| | 158 |
| | (39 | ) | | (173 | ) |
| Interest rate derivatives | — |
| | — |
| | (399 | ) | | (163 | ) |
| | 360 |
| | 560 |
| | (788 | ) | | (733 | ) |
| Total derivatives | $ | 384 |
| | $ | 560 |
| | $ | (788 | ) | | $ | (746 | ) |
|
| | | | | | | | | | | | | | | |
| | Fair Value of Derivative Instruments |
| | Asset Derivatives | | Liability Derivatives |
| | December 31, 2017 | | December 31, 2016 | | December 31, 2017 | | December 31, 2016 |
| Derivatives designated as hedging instruments: | | | | | | | |
| Commodity derivatives (margin deposits) | $ | 14 |
| | $ | — |
| | $ | (2 | ) | | $ | (4 | ) |
| | 14 |
| | — |
| | (2 | ) | | (4 | ) |
| Derivatives not designated as hedging instruments: | | | | | | | |
| Commodity derivatives (margin deposits) | 262 |
| | 338 |
| | (281 | ) | | (416 | ) |
| Commodity derivatives | 44 |
| | 24 |
| | (55 | ) | | (52 | ) |
| Interest rate derivatives | — |
| | — |
| | (219 | ) | | (193 | ) |
| Embedded derivatives in Legacy ETP Preferred Units | — |
| | — |
| | — |
| | (1 | ) |
| | 306 |
| | 362 |
| | (555 | ) | | (662 | ) |
| Total derivatives | $ | 320 |
| | $ | 362 |
| | $ | (557 | ) | | $ | (666 | ) |
The following table presents the fair value of our recognized derivative assets and liabilities on a gross basis and amounts offset on the consolidated balance sheets that are subject to enforceable master netting arrangements or similar arrangements:
|
| | | | | | | | | | | | | | | | | | |
| | | | | Asset Derivatives | | Liability Derivatives |
| | | Balance Sheet Location | | December 31, 2019 | | December 31, 2018 | | December 31, 2019 | | December 31, 2018 |
| Derivatives without offsetting agreements | | Derivative liabilities | | $ | — |
| | $ | — |
| | $ | (399 | ) | | $ | (163 | ) |
| Derivatives in offsetting agreements: | | | | | | | | |
| OTC contracts | | Derivative assets (liabilities) | | 41 |
| | 158 |
| | (39 | ) | | (173 | ) |
| Broker cleared derivative contracts | | Other current assets (liabilities) | | 343 |
| | 402 |
| | (350 | ) | | (410 | ) |
| | | 384 |
| | 560 |
| | (788 | ) | | (746 | ) |
| Offsetting agreements: | | | | | | | | |
| Counterparty netting | | Derivative assets (liabilities) | | (18 | ) | | (47 | ) | | 18 |
| | 47 |
|
| Counterparty netting | | Other current assets (liabilities) | | (318 | ) | | (397 | ) | | 318 |
| | 397 |
|
| Total net derivatives | | $ | 48 |
| | $ | 116 |
| | $ | (452 | ) | | $ | (302 | ) |
|
| | | | | | | | | | | | | | | | | | |
| | | | | Asset Derivatives | | Liability Derivatives |
| | | Balance Sheet Location | | December 31, 2017 | | December 31, 2016 | | December 31, 2017 | | December 31, 2016 |
| Derivatives without offsetting agreements | | Derivative liabilities | | $ | — |
| | $ | — |
| | $ | (219 | ) | | $ | (194 | ) |
| Derivatives in offsetting agreements: | | | | | | | | |
| OTC contracts | | Derivative assets (liabilities) | | 44 |
| | 24 |
| | (55 | ) | | (52 | ) |
| Broker cleared derivative contracts | | Other current assets (liabilities) | | 276 |
| | 338 |
| | (283 | ) | | (420 | ) |
| | | 320 |
| | 362 |
| | (557 | ) | | (666 | ) |
| Offsetting agreements: | | | | | | | | |
| Counterparty netting | | Derivative assets (liabilities) | | (20 | ) | | (4 | ) | | 20 |
| | 4 |
|
| Counterparty netting | | Other current assets (liabilities) | | (263 | ) | | (338 | ) | | 263 |
| | 338 |
|
| Total net derivatives | | $ | 37 |
| | $ | 20 |
| | $ | (274 | ) | | $ | (324 | ) |
We disclose the non-exchange traded financial derivative instruments as price risk managementderivative assets and liabilities on our consolidated balance sheets at fair value with amounts classified as either current or long-term depending on the anticipated settlement date.
The following tables summarize the amounts recognized with respect to our derivative financial instruments:
|
| | | | | | | | | | | | | |
| | Location of Gain (Loss) Recognized in Income on Derivatives | | Amount of Gain (Loss) Recognized in Income Representing Hedge Ineffectiveness and Amount Excluded from the Assessment of Effectiveness |
| | | | Years Ended December 31, |
| | | | 2019 | | 2018 | | 2017 |
| Derivatives in fair value hedging relationships (including hedged item): | | | | | | | |
| Commodity derivatives | Cost of products sold | | $ | — |
| | $ | (3 | ) | | $ | 26 |
|
|
| | | | | | | | | | | | | |
| | Location of Gain/(Loss) Recognized in Income on Derivatives | | Amount of Gain (Loss) Recognized in Income Representing Hedge Ineffectiveness and Amount Excluded from the Assessment of Effectiveness |
| | | | Years Ended December 31, |
| | | | 2017 | | 2016 | | 2015 |
| Derivatives in fair value hedging relationships (including hedged item): | | | | | | | |
| Commodity derivatives | Cost of products sold | | $ | 26 |
| | $ | 14 |
| | $ | 21 |
|
| Total | | | $ | 26 |
| | $ | 14 |
| | $ | 21 |
|
|
| | | | | | | | | | | | | |
| | Location of Gain (Loss) Recognized in Income on Derivatives | | Amount of Gain (Loss) Recognized in Income on Derivatives |
| | | | Years Ended December 31, |
| | | | 2019 | | 2018 | | 2017 |
| Derivatives not designated as hedging instruments: | | | | | | | |
| Commodity derivatives – Trading | Cost of products sold | | $ | 21 |
| | $ | 32 |
| | $ | 31 |
|
| Commodity derivatives – Non-trading | Cost of products sold | | (78 | ) | | (102 | ) | | 5 |
|
| Interest rate derivatives | Gains (losses) on interest rate derivatives | | (241 | ) | | 47 |
| | (37 | ) |
| Embedded derivatives | Other, net | | — |
| | — |
| | 1 |
|
| Total | | | $ | (298 | ) | | $ | (23 | ) | | $ | — |
|
|
| | | | | | | | | | | | | |
| | Location of Gain/(Loss) Recognized in Income on Derivatives | | Amount of Gain (Loss) Recognized in Income on Derivatives |
| | | | Years Ended December 31, |
| | | | 2017 | | 2016 | | 2015 |
| Derivatives not designated as hedging instruments: | | | | | | | |
| Commodity derivatives – Trading | Cost of products sold | | $ | 31 |
| | $ | (35 | ) | | $ | (11 | ) |
| Commodity derivatives – Non-trading | Cost of products sold | | 3 |
| | (173 | ) | | 23 |
|
| Interest rate derivatives | Losses on interest rate derivatives | | (37 | ) | | (12 | ) | | (18 | ) |
| Embedded derivatives | Other, net | | 1 |
| | 4 |
| | 12 |
|
| Total | | | $ | (2 | ) | | $ | (216 | ) | | $ | 6 |
|
| |
13.14. | RETIREMENT BENEFITS: |
Savings and Profit Sharing Plans
We and our subsidiaries sponsor defined contribution savings and profit sharing plans, which collectively cover virtually all eligible employees.employees, including those of ETO, Lake Charles LNG, Sunoco LP and USAC. Employer matching contributions are calculated using a formula based on employee contributions. We and our subsidiaries made matching contributions of $38$66 million, $44$62 million and $39$59 million to these 401(k) savings plans for the years ended December 31, 2017, 2016,2019, 2018 and 20152017, respectively.
Pension and Other Postretirement Benefit Plans
Panhandle
Postretirement benefits expense for the years ended December 31, 2017, 20162019, 2018 and 20152017 reflect the impact of changes Panhandle or its affiliates adopted as of September 30, 2013, to modify its retiree medical benefits program, effective January 1, 2014. The modification placed all eligible retirees on a common medical benefit platform, subject to limits on Panhandle’s annual contribution toward eligible retirees’ medical premiums. Prior to January 1, 2013, affiliates of Panhandle offered postretirement health care and life insurance benefit plans (other postretirement plans) that covered substantially all employees. Effective January 1, 2013, participation in the plan was frozen and medical benefits were no longer offered to non-union employees. Effective January 1, 2014, retiree medical benefits were no longer offered to union employees.
Sunoco, Inc.
Sunoco, Inc. sponsors a defined benefit pension plan, which was frozen for most participants on June 30, 2010. On October 31, 2014, Sunoco, Inc. terminatedEffective January 1, 2018, the plan and paid lump sumswas amended to eligible active and terminated vested participants in December 2015.extend coverage to a closed group of former employees based on certain criteria.
ETC Sunoco Inc. also
ETC Sunoco has a plan which provides health care benefits for substantially all of its current retirees. The cost to provide the postretirement benefit plan is shared by Sunoco, Inc.ETC Sunoco. and its retirees. Access to postretirement medical benefits was phased
out or eliminated for all employees retiring after July 1, 2010. In March, 2012, ETC Sunoco Inc. established a trust for its postretirement benefit liabilities. ETC Sunoco made a tax-deductible contribution of approximately $200 million to the
trust. The funding of the trust eliminated substantially all of Sunoco, Inc.’sETC Sunoco’s future exposure to variances between actual results and assumptions used to estimate retiree medical plan obligations.
Obligations and Funded Status
Pension and other postretirement benefit liabilities are accrued on an actuarial basis during the years an employee provides services. The following table contains information at the dates indicated about the obligations and funded status of pension and other postretirement plans on a combined basis:
|
| | | | | | | | | | | | | | | | | | | | | | | |
| | December 31, 2019 | | December 31, 2018 |
| | Pension Benefits | | | | Pension Benefits | | |
| | Funded Plans | | Unfunded Plans | | Other Postretirement Benefits | | Funded Plans | | Unfunded Plans | | Other Postretirement Benefits |
| Change in benefit obligation: | | | | | | | | | | | |
| Benefit obligation at beginning of period | $ | 1 |
| | $ | 37 |
| | $ | 198 |
| | $ | 1 |
| | $ | 47 |
| | $ | 156 |
|
| Service cost | — |
| | — |
| | 1 |
| | — |
| | — |
| | 1 |
|
| Interest cost | — |
| | 1 |
| | 7 |
| | — |
| | 1 |
| | 5 |
|
| Amendments | — |
| | — |
| | — |
| | — |
| | — |
| | 60 |
|
| Benefits paid, net | — |
| | (7 | ) | | (16 | ) | | — |
| | (7 | ) | | (17 | ) |
| Actuarial (gain) loss and other | — |
| | — |
| | 18 |
| | — |
| | (4 | ) | | (7 | ) |
| Benefit obligation at end of period | 1 |
| | 31 |
| | 208 |
| | 1 |
| | 37 |
| | 198 |
|
| | | | | | | | | | | | |
| Change in plan assets: | | | | | | | | | | | |
| Fair value of plan assets at beginning of period | 1 |
| | — |
| | 241 |
| | 1 |
| | — |
| | 257 |
|
| Return on plan assets and other | — |
| | — |
| | 35 |
| | — |
| | — |
| | (8 | ) |
| Employer contributions | — |
| | — |
| | 10 |
| | — |
| | — |
| | 9 |
|
| Benefits paid, net | — |
| | — |
| | (16 | ) | | — |
| | — |
| | (17 | ) |
| Fair value of plan assets at end of period | 1 |
| | — |
| | 270 |
| | 1 |
| | — |
| | 241 |
|
| | | | | | | | | | | | |
| Amount underfunded (overfunded) at end of period | $ | — |
| | $ | 31 |
| | $ | (62 | ) | | $ | — |
| | $ | 37 |
| | $ | (43 | ) |
| | | | | | | | | | | | |
| Amounts recognized in the consolidated balance sheets consist of: | | | | | | | | | | | |
| Non-current assets | $ | — |
| | $ | — |
| | $ | 88 |
| | $ | — |
| | $ | — |
| | $ | 68 |
|
| Current liabilities | — |
| | (5 | ) | | (2 | ) | | — |
| | (6 | ) | | (2 | ) |
| Non-current liabilities | — |
| | (26 | ) | | (24 | ) | | — |
| | (31 | ) | | (23 | ) |
| | $ | — |
| | $ | (31 | ) | | $ | 62 |
| | $ | — |
| | $ | (37 | ) | | $ | 43 |
|
| | | | | | | | | | | | |
| Amounts recognized in accumulated other comprehensive income (loss) (pre-tax basis) consist of: | | | | | | | | | | | |
| Net actuarial gain (loss) | $ | — |
| | $ | 1 |
| | $ | (5 | ) | | $ | — |
| | $ | 1 |
| | $ | (7 | ) |
| Prior service cost | — |
| | — |
| | 40 |
| | — |
| | — |
| | 66 |
|
| | $ | — |
| | $ | 1 |
| | $ | 35 |
| | $ | — |
| | $ | 1 |
| | $ | 59 |
|
|
| | | | | | | | | | | | | | | | | | | | | | | |
| | December 31, 2017 | | December 31, 2016 |
| | Pension Benefits | | | | Pension Benefits | | |
| | Funded Plans | | Unfunded Plans | | Other Postretirement Benefits | | Funded Plans | | Unfunded Plans | | Other Postretirement Benefits |
| Change in benefit obligation: | | | | | | | | | | | |
| Benefit obligation at beginning of period | $ | 18 |
| | $ | 51 |
| | $ | 165 |
| | $ | 20 |
| | $ | 57 |
| | $ | 180 |
|
| Interest cost | 1 |
| | 1 |
| | 4 |
| | 1 |
| | 2 |
| | 4 |
|
| Amendments | — |
| | — |
| | 7 |
| | — |
| | — |
| | — |
|
| Benefits paid, net | (2 | ) | | (6 | ) | | (20 | ) | | (1 | ) | | (7 | ) | | (21 | ) |
| Actuarial (gain) loss and other | 2 |
| | 1 |
| | (1 | ) | | (2 | ) | | (1 | ) | | 2 |
|
| Settlements | (18 | ) | | — |
| | — |
| | — |
| | — |
| | — |
|
| Benefit obligation at end of period | 1 |
| | 47 |
| | 155 |
| | 18 |
| | 51 |
| | 165 |
|
| | | | | | | | | | | | |
| Change in plan assets: | | | | | | | | | | | |
| Fair value of plan assets at beginning of period | 12 |
| | — |
| | 248 |
| | 15 |
| | — |
| | 253 |
|
| Return on plan assets and other | 3 |
| | — |
| | 11 |
| | (2 | ) | | — |
| | 6 |
|
| Employer contributions | 6 |
| | — |
| | 10 |
| | — |
| | — |
| | 10 |
|
| Benefits paid, net | (2 | ) | | — |
| | (20 | ) | | (1 | ) | | — |
| | (21 | ) |
| Settlements | (18 | ) | | — |
| | — |
| | — |
| | — |
| | — |
|
| Fair value of plan assets at end of period | 1 |
| | — |
| | 249 |
| | 12 |
| | — |
| | 248 |
|
| | | | | | | | | | | | |
| Amount underfunded (overfunded) at end of period | $ | — |
| | $ | 47 |
| | $ | (94 | ) | | $ | 6 |
| | $ | 51 |
| | $ | (83 | ) |
| | | | | | | | | | | | |
| Amounts recognized in the consolidated balance sheets consist of: | | | | | | | | | | | |
| Non-current assets | $ | — |
| | $ | — |
| | $ | 120 |
| | $ | — |
| | $ | — |
| | $ | 108 |
|
| Current liabilities | — |
| | (8 | ) | | (2 | ) | | — |
| | (7 | ) | | (2 | ) |
| Non-current liabilities | — |
| | (39 | ) | | (24 | ) | | (6 | ) | | (44 | ) | | (23 | ) |
| | $ | — |
| | $ | (47 | ) | | $ | 94 |
| | $ | (6 | ) | | $ | (51 | ) | | $ | 83 |
|
| | | | | | | | | | | | |
| Amounts recognized in accumulated other comprehensive income (loss) (pre-tax basis) consist of: | | | | | | | | | | | |
| Net actuarial gain | $ | — |
| | $ | 5 |
| | $ | (17 | ) | | $ | — |
| | $ | — |
| | $ | (12 | ) |
| Prior service cost | — |
| | — |
| | 20 |
| | — |
| | — |
| | 14 |
|
| | $ | — |
| | $ | 5 |
| | $ | 3 |
| | $ | — |
| | $ | — |
| | $ | 2 |
|
The following table summarizes information at the dates indicated for plans with an accumulated benefit obligation in excess of plan assets:
|
| | | | | | | | | | | | | | | | | | | | | |
| | December 31, 2019 | | December 31, 2018 |
| | Pension Benefits | | | | Pension Benefits | | |
| | Funded Plans | | Unfunded Plans | | Other Postretirement Benefits | | Funded Plans | | Unfunded Plans | | Other Postretirement Benefits |
| Projected benefit obligation | $ | — |
| | $ | 31 |
| | N/A |
| | $ | — |
| | $ | 37 |
| | N/A |
|
| Accumulated benefit obligation | 1 |
| | 31 |
| | 208 |
| | 1 |
| | 37 |
| | 198 |
|
| Fair value of plan assets | 1 |
| | — |
| | 270 |
| | 1 |
| | — |
| | 241 |
|
|
| | | | | | | | | | | | | | | | | | | | | | | |
| | December 31, 2017 | | December 31, 2016 |
| | Pension Benefits | | | | Pension Benefits | | |
| | Funded Plans | | Unfunded Plans | | Other Postretirement Benefits | | Funded Plans | | Unfunded Plans | | Other Postretirement Benefits |
| Projected benefit obligation | $ | 1 |
| | $ | 47 |
| | N/A |
| | $ | 18 |
| | $ | 51 |
| | N/A |
|
| Accumulated benefit obligation | 1 |
| | 47 |
| | $ | 155 |
| | 18 |
| | 51 |
| | $ | 165 |
|
| Fair value of plan assets | 1 |
| | — |
| | 249 |
| | 12 |
| | — |
| | 248 |
|
Components of Net Periodic Benefit Cost
|
| | | | | | | | | | | | | | | |
| | December 31, 2019 | | December 31, 2018 |
| | Pension Benefits | | Other Postretirement Benefits | | Pension Benefits | | Other Postretirement Benefits |
| Net periodic benefit cost: | | | | | | | |
| Service cost | $ | — |
| | $ | 1 |
| | $ | — |
| | $ | 1 |
|
| Interest cost | 1 |
| | 7 |
| | 1 |
| | 5 |
|
| Expected return on plan assets | — |
| | (10 | ) | | — |
| | (10 | ) |
| Prior service cost amortization | — |
| | 26 |
| | — |
| | 16 |
|
| Net periodic benefit cost | $ | 1 |
| | $ | 24 |
| | $ | 1 |
| | $ | 12 |
|
|
| | | | | | | | | | | | | | | |
| | December 31, 2017 | | December 31, 2016 |
| | Pension Benefits | | Other Postretirement Benefits | | Pension Benefits | | Other Postretirement Benefits |
| Net periodic benefit cost: | | | | | | | |
| Interest cost | $ | 2 |
| | $ | 4 |
| | $ | 3 |
| | $ | 4 |
|
| Expected return on plan assets | — |
| | (9 | ) | | (1 | ) | | (8 | ) |
| Prior service cost amortization | — |
| | 2 |
| | — |
| | 1 |
|
| Net periodic benefit cost | $ | 2 |
| | $ | (3 | ) | | $ | 2 |
| | $ | (3 | ) |
Assumptions
The weighted-average assumptions used in determining benefit obligations at the dates indicated are shown in the table below:
|
| | | | | | | | | | | |
| | December 31, 2019 | | December 31, 2018 |
| | Pension Benefits | | Other Postretirement Benefits | | Pension Benefits | | Other Postretirement Benefits |
| Discount rate | 4.07 | % | | 2.71 | % | | 4.02 | % | | 3.40 | % |
| Rate of compensation increase | — |
| | — |
| | N/A |
| | N/A |
|
|
| | | | | | | | | | | |
| | December 31, 2017 | | December 31, 2016 |
| | Pension Benefits | | Other Postretirement Benefits | | Pension Benefits | | Other Postretirement Benefits |
| Discount rate | 3.27 | % | | 2.34 | % | | 3.65 | % | | 2.34 | % |
| Rate of compensation increase | N/A |
| | N/A |
| | N/A |
| | N/A |
|
The weighted-average assumptions used in determining net periodic benefit cost for the periods presented are shown in the table below:
|
| | | | | | | | | | | |
| | December 31, 2019 | | December 31, 2018 |
| | Pension Benefits | | Other Postretirement Benefits | | Pension Benefits | | Other Postretirement Benefits |
| Discount rate | 3.29 | % | | 3.76 | % | | 3.52 | % | | 3.51 | % |
| Expected return on assets: | | | | | | | |
| Tax exempt accounts | 3.26 | % | | 7.00 | % | | 3.26 | % | | 6.63 | % |
| Taxable accounts | — |
| | 4.75 | % | | N/A |
| | 4.50 | % |
| Rate of compensation increase | — |
| | — |
| | N/A |
| | N/A |
|
|
| | | | | | | | | | | |
| | December 31, 2017 | | December 31, 2016 |
| | Pension Benefits | | Other Postretirement Benefits | | Pension Benefits | | Other Postretirement Benefits |
| Discount rate | 3.52 | % | | 3.10 | % | | 3.60 | % | | 3.06 | % |
| Expected return on assets: | | | | | | | |
| Tax exempt accounts | 3.50 | % | | 7.00 | % | | 3.50 | % | | 7.00 | % |
| Taxable accounts | N/A |
| | 4.50 | % | | N/A |
| | 4.50 | % |
| Rate of compensation increase | N/A |
| | N/A |
| | N/A |
| | N/A |
|
The long-term expected rate of return on plan assets was estimated based on a variety of factors including the historical investment return achieved over a long-term period, the targeted allocation of plan assets and expectations concerning future
returns in the marketplace for both equity and fixed income securities. Current market factors such as inflation and interest rates are evaluated before long-term market assumptions are determined. Peer data and historical returns are reviewed to ensure reasonableness and appropriateness.
The assumed health care cost trend weighted-average rates used to measure the expected cost of benefits covered by Panhandle and Sunoco, Inc.’s other postretirement benefitthe plans are shown in the table below:
|
| | | | | |
| | December 31, |
| | 2019 | | 2018 |
| Health care cost trend rate | 7.25 | % | | 7.15 | % |
| Rate to which the cost trend is assumed to decline (the ultimate trend rate) | 4.83 | % | | 4.82 | % |
| Year that the rate reaches the ultimate trend rate | 2026 |
| | 2024 |
|
|
| | | | | | |
| | | December 31, |
| | | 2017 | | 2016 |
| Health care cost trend rate | | 7.20 | % | | 6.73 | % |
| Rate to which the cost trend is assumed to decline (the ultimate trend rate) | | 4.99 | % | | 4.96 | % |
| Year that the rate reaches the ultimate trend rate | | 2023 |
| | 2021 |
|
Changes in the health care cost trend rate assumptions are not expected to have a significant impact on postretirement benefits.
Plan Assets
For the Panhandle plans, the overall investment strategy is to maintain an appropriate balance of actively managed investments with the objective of optimizing longer-term returns while maintaining a high standard of portfolio quality and achieving proper diversification. To achieve diversity within its other postretirement plan asset portfolio, Panhandle has targeted the following asset allocations: equity of 25% to 35%, fixed income of 65% to 75%.
The investment strategy of ETC Sunoco Inc. funded defined benefit plans is to achieve consistent positive returns, after adjusting for inflation, and to maximize long-term total return within prudent levels of risk through a combination of income and capital appreciation. The objective of this strategy is to reduce the volatility of investment returns and maintain a sufficient funded status of the plans. In anticipation of the pension plan termination, ETC Sunoco Inc. targeted the asset allocations to a more stable position by investing in growth assets and liability hedging assets.
The fair value of the pension plan assets by asset category at the dates indicated is as follows:
|
| | | | | | | | | | | | | | | |
| | | | Fair Value Measurements at December 31, 2017 |
| | Fair Value Total | | Level 1 | | Level 2 | | Level 3 |
| Asset category: | | | | | | | |
Mutual funds(1) | $ | 1 |
| | $ | 1 |
| | $ | — |
| | $ | — |
|
| Total | $ | 1 |
| | $ | 1 |
| | $ | — |
| | $ | — |
|
|
| | | | | | | | | | | | | | | |
| | | | Fair Value Measurements at December 31, 2019 |
| | Fair Value Total | | Level 1 | | Level 2 | | Level 3 |
Mutual funds(1) | $ | 1 |
| | $ | 1 |
| | $ | — |
| | $ | — |
|
| |
(1) | Comprised of approximately 100% equities as of December 31, 2017.2019. |
|
| | | | | | | | | | | | | | | |
| | | | Fair Value Measurements at December 31, 2016 |
| | Fair Value Total | | Level 1 | | Level 2 | | Level 3 |
| Asset category: | | | | | | | |
Mutual funds(1) | $ | 12 |
| | $ | 12 |
| | $ | — |
| | $ | — |
|
| Total | $ | 12 |
| | $ | 12 |
| | $ | — |
| | $ | — |
|
|
| | | | | | | | | | | | | | | |
| | | | Fair Value Measurements at December 31, 2018 |
| | Fair Value Total | | Level 1 | | Level 2 | | Level 3 |
Mutual funds(1) | $ | 1 |
| | $ | 1 |
| | $ | — |
| | $ | — |
|
| |
(1) | Comprised of approximately 100% equities as of December 31, 2016.2018. |
The fair value of other postretirement plan assets by asset category at the dates indicated is as follows:
| | | | | | Fair Value Measurements at December 31, 2017 | | | Fair Value Measurements at December 31, 2019 |
| | Fair Value Total | | Level 1 | | Level 2 | | Level 3 | Fair Value Total | | Level 1 | | Level 2 | | Level 3 |
| Asset category: | | | | | | | | | | | | | | |
| Cash and cash equivalents | $ | 33 |
| | $ | 33 |
| | $ | — |
| | $ | — |
| $ | 14 |
| | $ | 14 |
| | $ | — |
| | $ | — |
|
Mutual funds(1) | 146 |
| | 146 |
| | — |
| | — |
| 177 |
| | 177 |
| | — |
| | — |
|
| Fixed income securities | 70 |
| | — |
| | 70 |
| | — |
| 79 |
| | — |
| | 79 |
| | — |
|
| Total | $ | 249 |
| | $ | 179 |
| | $ | 70 |
| | $ | — |
| $ | 270 |
| | $ | 191 |
| | $ | 79 |
| | $ | — |
|
| |
(1) | Primarily comprised of approximately 48%59% equities, 51%40% fixed income securities and 1% cash as of December 31, 2017.2019. |
| | | | | | Fair Value Measurements at December 31, 2016 | | | Fair Value Measurements at December 31, 2018 |
| | Fair Value Total | | Level 1 | | Level 2 | | Level 3 | Fair Value Total | | Level 1 | | Level 2 | | Level 3 |
| Asset category: | | | | | | | | | | | | | | |
| Cash and cash equivalents | $ | 23 |
| | $ | 23 |
| | $ | — |
| | $ | — |
| $ | 20 |
| | $ | 20 |
| | $ | — |
| | $ | — |
|
Mutual funds(1) | 134 |
| | 134 |
| | — |
| | — |
| 144 |
| | 144 |
| | — |
| | — |
|
| Fixed income securities | 91 |
| | — |
| | 91 |
| | — |
| 77 |
| | — |
| | 77 |
| | — |
|
| Total | $ | 248 |
| | $ | 157 |
| | $ | 91 |
| | $ | — |
| $ | 241 |
| | $ | 164 |
| | $ | 77 |
| | $ | — |
|
| |
(1) | Primarily comprised of approximately 31%53% equities, 66%46% fixed income securities and 3%1% cash as of December 31, 2016.2018. |
The Level 1 plan assets are valued based on active market quotes. The Level 2 plan assets are valued based on the net asset value per share (or its equivalent) of the investments, which was not determinable through publicly published sources but was calculated consistent with authoritative accounting guidelines.
Contributions
We expect to contribute $8$5 million to pension plans and $10$8 million to other postretirement plans in 2018.2020. The cost of the plans are funded in accordance with federal regulations, not to exceed the amounts deductible for income tax purposes.
Benefit Payments
Panhandle and Sunoco, Inc.’sETC Sunoco’s estimate of expected benefit payments, which reflect expected future service, as appropriate, in each of the next five years and in the aggregate for the five years thereafter are shown in the table below:
|
| | | | | | | | |
| Years | | Pension Benefits - Unfunded Plans (1) | | Other Postretirement Benefits (Gross, Before Medicare Part D) |
| 2020 | | $ | 5 |
| | $ | 20 |
|
| 2021 | | 5 |
| | 20 |
|
| 2022 | | 4 |
| | 19 |
|
| 2023 | | 4 |
| | 18 |
|
| 2024 | | 3 |
| | 15 |
|
| 2025 - 2029 | | 10 |
| | 67 |
|
|
| | | | | | | | |
| Years | | Pension Benefits - Unfunded Plans (1) | | Other Postretirement Benefits (Gross, Before Medicare Part D) |
| 2018 | | $ | 8 |
| | $ | 24 |
|
| 2019 | | 6 |
| | 23 |
|
| 2020 | | 6 |
| | 21 |
|
| 2021 | | 5 |
| | 19 |
|
| 2022 | | 4 |
| | 17 |
|
| 2023 – 2027 | | 15 |
| | 37 |
|
(1) Expected benefit payments of funded pension plans are less than $1 million for the next ten years.
The Medicare Prescription Drug Act provides for a prescription drug benefit under Medicare (“Medicare Part D”) as well as a federal subsidy to sponsors of retiree health care benefit plans that provide a prescription drug benefit that is at least actuarially equivalent to Medicare Part D.
Panhandle does not expect to receive any Medicare Part D subsidies in any future periods.
| |
14.15. | RELATED PARTY TRANSACTIONS: |
In June 2017, the Partnership acquired all of the publicly held PennTex common units through a tender offer and exercise of a limited call right, as further discussed in Note 8.7.
ETE previously paid usET-ETO Long-Term Notes
In October 2018, in connection with the Energy Transfer Merger, ET and ETO entered into an intercompany promissory note (“ET-ETO Promissory Note A”) for an aggregate amount up to provide services$2.20 billion that accrues interest at a weighted average rate based on interest payable by ETO on its behalfoutstanding indebtedness. The balance outstanding on this note receivable from ET as of December 31, 2018 was $440 million. On August 19, 2019, the entire outstanding balance of $268 million was paid off.
In March 2019, in connection with the ET-ETO senior notes exchange, ET and ETO entered into an intercompany promissory note (“ET-ETO Promissory Note B”) for an aggregate amount up to $4.25 billion that accrues interest at a weighted average rate based on behalfinterest payable by ETO on its outstanding indebtedness. The ET-ETO Promissory Note B matures on December 31, 2024. As of other subsidiariesDecember 31, 2019 the ET-ETO Promissory Note B had an outstanding balance of ETE,$3.71 billion.
As of December 31, 2019, ETO has a long-term intercompany payable due to ET of $104 million, which includedhas been netted against the reimbursementoutstanding promissory notes receivable in our consolidated balance sheet.
ETO-SemGroup Long-Term Notes
In December 2019, in connection with the SemGroup acquisition, ETO and SemGroup entered into an intercompany promissory note for an aggregate amount up to $2.5 billion that accrues interest at 5.20% per annum. The ETO-SemGroup promissory note matures on December 31, 2029. As of various operating and general and administrative expenses incurred by usDecember 31, 2019 the ETO-SemGroup Promissory Note B had an outstanding balance of $2.32 billion.
For the year ended December 31, 2019, ETO recognized $191 million in interest income related to these notes, recorded in Other, net on behalfits consolidated statements of ETE and its subsidiaries. These agreements expired in 2016.operations.
The Partnership also has related party transactions with several of its equity method investees. In addition to commercial transactions, these transactions include the provision of certain management services and leases of certain assets.
The following table summarizes the affiliate revenues from related companies on our consolidated statements of operations:
|
| | | | | | | | | | | |
| | Years Ended December 31, |
| | 2019 | | 2018 | | 2017 |
| Revenues from related companies | $ | 492 |
| | $ | 431 |
| | $ | 303 |
|
|
| | | | | | | | | | | |
| | Years Ended December 31, |
| | 2017 | | 2016 | | 2015 |
| Affiliated revenues | $ | 697 |
| | $ | 377 |
| | $ | 417 |
|
The following table summarizes the related company accounts receivable and accounts payable balances on our consolidated balance sheets:
|
| | | | | | | |
| | December 31, |
| | 2019 | | 2018 |
| Accounts receivable from related companies: | | | |
| ET | $ | 8 |
| | $ | 65 |
|
| FGT | 50 |
| | 25 |
|
| Phillips 66 | 36 |
| | 42 |
|
| Traverse Rover LLC | 42 |
| | — |
|
| Other | 39 |
| | 44 |
|
| Total accounts receivable from related companies | $ | 175 |
| | $ | 176 |
|
| | | | |
| Accounts payable to related companies: | | | |
| ET | $ | — |
| | $ | 59 |
|
| Other | 27 |
| | 60 |
|
| Total accounts payable to related companies | $ | 27 |
| | $ | 119 |
|
|
| | | | | | | |
| | December 31, |
| | 2017 | | 2016 |
| Accounts receivable from related companies: | | | |
| ETE | $ | — |
| | $ | 22 |
|
| Sunoco LP | 219 |
| | 96 |
|
| FGT | 11 |
| | 15 |
|
| Other | 88 |
| | 76 |
|
| Total accounts receivable from related companies | $ | 318 |
| | $ | 209 |
|
| | | | |
| Accounts payable to related companies: | | | |
| Sunoco LP | 195 |
| | 20 |
|
| Other | 14 |
| | 23 |
|
| Total accounts payable to related companies | $ | 209 |
| | $ | 43 |
|
|
| | | | | | | |
| | December 31, |
| | 2017 | | 2016 |
| Long-term notes receivable (payable) – related companies: | | | |
| Sunoco LP | $ | 85 |
| | $ | 87 |
|
| Phillips 66 | — |
| | (250 | ) |
| Net long-term notes receivable (payable) – related companies | $ | 85 |
| | $ | (163 | ) |
| |
15.16. | REPORTABLE SEGMENTS: |
Our financial statementsreportable segments currently reflect the following reportable segments, which conduct their business primarily in the United States, as follows:States:
•intrastate transportation and storage;
•interstate transportation and storage;
•midstream;
•NGL and refined products transportation and services;
•crude oil transportation and services;
•investment in Sunoco LP;
•investment in USAC; and
•all other.
•all other.
The Partnership previously presented its retail marketing business as a separate reportable segment. Due to the transfer of the general partner interest of Sunoco LP from ETP to ETE in 2015 and completion of the dropdown of remaining Retail Marketing interests from ETP to Sunoco LP in March 2016, all of the Partnership’s retail marketing business has been deconsolidated. The only remaining retail marketing assets are the limited partner units of Sunoco LP. As of December 31, 2017, the Partnership’s interest in Sunoco LP common units consisted of 43.5 million units, representing 43.6% of Sunoco LP’s total outstanding common units. Subsequent to Sunoco LP’s repurchase of a portion of its common units on February 7, 2018, our investment consists of 26.2 million units, representing 31.8% of Sunoco LP’s total outstanding common units. This equity method investment in Sunoco LP has now been aggregated into the all other segment. Consequently, the retail marketing business that was previously consolidated has also been aggregated in the all other segment for all periods presented.
Consolidated revenues and expenses reflect the elimination of all material intercompany transactions.
The investment in USAC segment reflects the results of USAC beginning April 2018, the date that the Partnership obtained control of USAC.
Revenues from our intrastate transportation and storage segment are primarily reflected in natural gas sales and gathering, transportation and other fees. Revenues from our interstate transportation and storage segment are primarily reflected in gathering, transportation and other fees. Revenues from our midstream segment are primarily reflected in natural gas sales, NGL sales and gathering, transportation and other fees. Revenues from our NGL and refined products transportation and services segment are primarily reflected in NGL sales and gathering, transportation terminalling and other fees. Revenues from our crude oil transportation and services segment are primarily reflected in crude sales. Revenues from our all otherinvestment in Sunoco LP segment are primarily reflected in refined product sales. Revenues from our investment in USAC segment are primarily reflected in gathering, transportation and other fees. Revenues from our all other segment are primarily reflected in natural gas sales.
We report Segment Adjusted EBITDA as a measure of segment performance. We define Segment Adjusted EBITDA as total Partnership earnings before interest, taxes, depreciation, depletion, amortization and other non-cash items, such as non-cash compensation expense, gains and losses on disposals of assets, the allowance for equity funds used during construction, unrealized gains and losses on commodity risk management activities, inventory valuation adjustments, non-cash impairment charges, losses on extinguishments of debt and other non-operating income or expense items. Unrealized gains and losses on commodity risk management activities include unrealized gains and losses on commodity derivatives and inventory fair value adjustments (excluding lower of cost or market adjustments). Segment Adjusted EBITDA reflectsreflect amounts for unconsolidated affiliates based on the Partnership’s proportionate ownership.same recognition and measurement methods used to record equity in earnings of unconsolidated affiliates. Adjusted EBITDA related to unconsolidated affiliates excludes the same items with respect to the unconsolidated affiliate as those excluded from the calculation of Segment Adjusted EBITDA and consolidated Adjusted EBITDA, such as interest, taxes, depreciation, depletion, amortization and other non-cash items. Although these amounts are excluded from Adjusted EBITDA related to unconsolidated affiliates, such exclusion should not be understood to imply that we have control over the operations and resulting revenues and expenses of such affiliates. We do not control our unconsolidated affiliates; therefore, we do not control the earnings or cash flows of such affiliates. The use of Segment Adjusted EBITDA or Adjusted EBITDA related to unconsolidated affiliates as an analytical tool should be limited accordingly.
The following tables present financial information by segment:
| | | | Years Ended December 31, | Years Ended December 31, |
| | 2017 | | 2016 | | 2015 | 2019 | | 2018 | | 2017 |
| Revenues: | | | | | | | | | | |
| Intrastate transportation and storage: | | | | | | | | | | |
| Revenues from external customers | $ | 2,891 |
| | $ | 2,155 |
| | $ | 1,912 |
| $ | 2,749 |
| | $ | 3,428 |
| | $ | 2,891 |
|
| Intersegment revenues | 192 |
| | 458 |
| | 338 |
| 350 |
| | 309 |
| | 192 |
|
| | 3,083 |
| | 2,613 |
| | 2,250 |
| 3,099 |
| | 3,737 |
| | 3,083 |
|
| Interstate transportation and storage: | | | | | | | | | | |
| Revenues from external customers | 915 |
| | 946 |
| | 1,008 |
| 1,941 |
| | 1,664 |
| | 1,112 |
|
| Intersegment revenues | 19 |
| | 23 |
| | 17 |
| 22 |
| | 18 |
| | 19 |
|
| | 934 |
| | 969 |
| | 1,025 |
| 1,963 |
| | 1,682 |
| | 1,131 |
|
| Midstream: | | | | | | | | | | |
| Revenues from external customers | 2,510 |
| | 2,342 |
| | 2,607 |
| 2,268 |
| | 2,090 |
| | 2,510 |
|
| Intersegment revenues | 4,433 |
| | 2,837 |
| | 2,449 |
| 3,751 |
| | 5,432 |
| | 4,433 |
|
| | 6,943 |
| | 5,179 |
| | 5,056 |
| 6,019 |
| | 7,522 |
| | 6,943 |
|
| NGL and refined products transportation and services: | | | | | | | | | | |
| Revenues from external customers | 8,326 |
| | 5,973 |
| | 4,569 |
| 9,920 |
| | 10,119 |
| | 7,885 |
|
| Intersegment revenues | 322 |
| | 436 |
| | 428 |
| 1,721 |
| | 1,004 |
| | 763 |
|
| | 8,648 |
| | 6,409 |
| | 4,997 |
| 11,641 |
| | 11,123 |
| | 8,648 |
|
| Crude oil transportation and services: | | | | | | | | | | |
| Revenues from external customers | 11,672 |
| | 7,539 |
| | 8,980 |
| 18,307 |
| | 17,236 |
| | 11,672 |
|
| Intersegment revenues | 31 |
| | — |
| | — |
| — |
| | 96 |
| | 31 |
|
| | 11,703 |
| | 7,539 |
| | 8,980 |
| 18,307 |
| | 17,332 |
| | 11,703 |
|
| Investment in Sunoco LP: | | | | | | |
| Revenues from external customers | | 16,590 |
| | 16,982 |
| | 11,713 |
|
| Intersegment revenues | | 6 |
| | 12 |
| | 10 |
|
| | | 16,596 |
| | 16,994 |
| | 11,723 |
|
| Investment in USAC: | | | | | | |
| Revenues from external customers | | 678 |
| | 495 |
| | — |
|
| Intersegment revenues | | 20 |
| | 13 |
| | — |
|
| | | 698 |
| | 508 |
| | — |
|
| All other: | | | | | | | | | | |
| Revenues from external customers | 2,740 |
| | 2,872 |
| | 15,216 |
| 1,579 |
| | 2,073 |
| | 2,740 |
|
| Intersegment revenues | 161 |
| | 400 |
| | 558 |
| 81 |
| | 155 |
| | 161 |
|
| | 2,901 |
| | 3,272 |
| | 15,774 |
| 1,660 |
| | 2,228 |
| | 2,901 |
|
| Eliminations | (5,158 | ) | | (4,154 | ) | | (3,790 | ) | (5,951 | ) | | (7,039 | ) | | (5,609 | ) |
| Total revenues | $ | 29,054 |
| | $ | 21,827 |
| | $ | 34,292 |
| $ | 54,032 |
| | $ | 54,087 |
| | $ | 40,523 |
|
| | | | Years Ended December 31, | Years Ended December 31, |
| | 2017 | | 2016 | | 2015 | 2019 | | 2018 | | 2017 |
| Cost of products sold: | | | | | | | | | | |
| Intrastate transportation and storage | $ | 2,327 |
| | $ | 1,897 |
| | $ | 1,554 |
| $ | 1,909 |
| | $ | 2,665 |
| | $ | 2,327 |
|
| Midstream | 4,761 |
| | 3,381 |
| | 3,264 |
| 3,570 |
| | 5,145 |
| | 4,761 |
|
| NGL and refined products transportation and services | 6,508 |
| | 4,553 |
| | 3,431 |
| 8,393 |
| | 8,462 |
| | 6,508 |
|
| Crude oil transportation and services | 9,826 |
| | 6,416 |
| | 8,158 |
| 14,649 |
| | 14,439 |
| | 9,826 |
|
| Investment in Sunoco LP | | 15,380 |
| | 15,872 |
| | 10,615 |
|
| Investment in USAC | | 91 |
| | 67 |
| | — |
|
| All other | 2,509 |
| | 2,942 |
| | 14,029 |
| 1,496 |
| | 2,006 |
| | 2,509 |
|
| Eliminations | (5,130 | ) | | (4,109 | ) | | (3,722 | ) | (5,885 | ) | | (6,998 | ) | | (5,580 | ) |
| Total cost of products sold | $ | 20,801 |
| | $ | 15,080 |
| | $ | 26,714 |
| $ | 39,603 |
| | $ | 41,658 |
| | $ | 30,966 |
|
|
| | | | | | | | | | | |
| | Years Ended December 31, |
| | 2019 | | 2018 | | 2017 |
| Depreciation, depletion and amortization: | | | | | |
| Intrastate transportation and storage | $ | 184 |
| | $ | 169 |
| | $ | 147 |
|
| Interstate transportation and storage | 387 |
| | 334 |
| | 254 |
|
| Midstream | 1,065 |
| | 1,006 |
| | 954 |
|
| NGL and refined products transportation and services | 613 |
| | 466 |
| | 401 |
|
| Crude oil transportation and services | 430 |
| | 445 |
| | 402 |
|
| Investment in Sunoco LP | 181 |
| | 167 |
| | 169 |
|
| Investment in USAC | 231 |
| | 169 |
| | — |
|
| All other | 33 |
| | 87 |
| | 214 |
|
| Total depreciation, depletion and amortization | $ | 3,124 |
| | $ | 2,843 |
| | $ | 2,541 |
|
|
| | | | | | | | | | | |
| | Years Ended December 31, |
| | 2019 | | 2018 | | 2017 |
| Equity in earnings (losses) of unconsolidated affiliates: | | | | | |
| Intrastate transportation and storage | $ | 18 |
| | $ | 19 |
| | $ | (156 | ) |
| Interstate transportation and storage | 222 |
| | 227 |
| | 236 |
|
| Midstream | 20 |
| | 26 |
| | 20 |
|
| NGL and refined products transportation and services | 51 |
| | 64 |
| | 33 |
|
| Crude oil transportation and services | (3 | ) | | 6 |
| | 4 |
|
| All other | (10 | ) | | 2 |
| | 7 |
|
| Total equity in earnings of unconsolidated affiliates | $ | 298 |
| | $ | 344 |
| | $ | 144 |
|
| | | | Years Ended December 31, | Years Ended December 31, |
| | 2017 | | 2016 | | 2015 | 2019 | | 2018 | | 2017 |
| Depreciation, depletion and amortization: | | | | | | |
| Segment Adjusted EBITDA: | | | | | | |
| Intrastate transportation and storage | $ | 147 |
| | $ | 144 |
| | $ | 129 |
| $ | 999 |
| | $ | 927 |
| | $ | 626 |
|
| Interstate transportation and storage | 214 |
| | 207 |
| | 210 |
| 1,792 |
| | 1,680 |
| | 1,274 |
|
| Midstream | 954 |
| | 840 |
| | 720 |
| 1,599 |
| | 1,627 |
| | 1,481 |
|
| NGL and refined products transportation and services | 401 |
| | 355 |
| | 290 |
| 2,663 |
| | 1,979 |
| | 1,641 |
|
| Crude oil transportation and services | 402 |
| | 251 |
| | 218 |
| 2,949 |
| | 2,330 |
| | 1,379 |
|
| Investment in Sunoco LP | | 665 |
| | 638 |
| | 732 |
|
| Investment in USAC | | 420 |
| | 289 |
| | — |
|
| All other | 214 |
| | 189 |
| | 362 |
| 104 |
| | 76 |
| | 219 |
|
| Total depreciation, depletion and amortization | $ | 2,332 |
| | $ | 1,986 |
| | $ | 1,929 |
| |
| Total Segment Adjusted EBITDA | | 11,191 |
| | 9,546 |
| | 7,352 |
|
| Depreciation, depletion and amortization | | (3,124 | ) | | (2,843 | ) | | (2,541 | ) |
| Interest expense, net of interest capitalized | | (2,257 | ) | | (1,709 | ) | | (1,575 | ) |
| Impairment losses | | (74 | ) | | (431 | ) | | (1,039 | ) |
| Gains (losses) on interest rate derivatives | | (241 | ) | | 47 |
| | (37 | ) |
| Non-cash compensation expense | | (111 | ) | | (105 | ) | | (99 | ) |
| Unrealized gains (losses) on commodity risk management activities | | (4 | ) | | (11 | ) | | 59 |
|
| Inventory valuation adjustments | | 79 |
| | (85 | ) | | 24 |
|
| Losses on extinguishments of debt | | (2 | ) | | (109 | ) | | (42 | ) |
| Adjusted EBITDA related to unconsolidated affiliates | | (621 | ) | | (655 | ) | | (716 | ) |
| Equity in earnings of unconsolidated affiliates | | 298 |
| | 344 |
| | 144 |
|
| Impairment of investments in unconsolidated affiliates | | — |
| | — |
| | (313 | ) |
| Adjusted EBITDA related to discontinued operations | | — |
| | 25 |
| | (223 | ) |
| Other, net | | 252 |
| | 30 |
| | 154 |
|
| Income from continuing operations before income tax expense | | 5,386 |
| | 4,044 |
| | 1,148 |
|
| Income tax expense from continuing operations | | (200 | ) | | (5 | ) | | 1,804 |
|
| Income from continuing operations | | 5,186 |
| | 4,039 |
| | 2,952 |
|
| Loss from discontinued operations, net of income taxes | | — |
| | (265 | ) | | (177 | ) |
| Net income | | $ | 5,186 |
| | $ | 3,774 |
| | $ | 2,775 |
|
| | | | Years Ended December 31, | December 31, |
| | 2017 | | 2016 | | 2015 | 2019 | | 2018 | | 2017 |
| Equity in earnings (losses) of unconsolidated affiliates: | | | | | | |
| Segment assets: | | | | | | |
| Intrastate transportation and storage | $ | (156 | ) | | $ | 35 |
| | $ | 32 |
| $ | 6,648 |
| | $ | 6,365 |
| | $ | 5,020 |
|
| Interstate transportation and storage | 236 |
| | 193 |
| | 197 |
| 18,111 |
| | 15,081 |
| | 15,316 |
|
| Midstream | 20 |
| | 19 |
| | (19 | ) | 20,070 |
| | 19,745 |
| | 20,004 |
|
| NGL and refined products transportation and services | 33 |
| | 41 |
| | 29 |
| 19,145 |
| | 18,267 |
| | 17,600 |
|
| Crude oil transportation and services | 4 |
| | (4 | ) | | (9 | ) | 18,915 |
| | 18,022 |
| | 17,730 |
|
| All other | 19 |
| | (225 | ) | | 239 |
| |
| Total equity in earnings of unconsolidated affiliates | $ | 156 |
| | $ | 59 |
| | $ | 469 |
| |
| Investment in Sunoco LP | | 5,438 |
| | 4,879 |
| | 8,344 |
|
| Investment in USAC | | 3,730 |
| | 3,775 |
| | — |
|
| All other and eliminations | | 6,468 |
| | 2,308 |
| | 2,470 |
|
| Total segment assets | | $ | 98,525 |
| | $ | 88,442 |
| | $ | 86,484 |
|
|
| | | | | | | | | | | |
| | Years Ended December 31, |
| | 2017 | | 2016 | | 2015 |
| Segment Adjusted EBITDA: | | | | | |
| Intrastate transportation and storage | $ | 626 |
| | $ | 613 |
| | $ | 543 |
|
| Interstate transportation and storage | 1,098 |
| | 1,117 |
| | 1,155 |
|
| Midstream | 1,481 |
| | 1,133 |
| | 1,237 |
|
| NGL and refined products transportation and services | 1,641 |
| | 1,496 |
| | 1,179 |
|
| Crude oil transportation and services | 1,379 |
| | 834 |
| | 521 |
|
| All other | 487 |
| | 540 |
| | 882 |
|
| Total Segment Adjusted EBITDA | 6,712 |
| | 5,733 |
| | 5,517 |
|
| Depreciation, depletion and amortization | (2,332 | ) | | (1,986 | ) | | (1,929 | ) |
| Interest expense, net | (1,365 | ) | | (1,317 | ) | | (1,291 | ) |
| Gains on acquisitions | — |
| | 83 |
| | — |
|
| Impairment losses | (920 | ) | | (813 | ) | | (339 | ) |
| Losses on interest rate derivatives | (37 | ) | | (12 | ) | | (18 | ) |
| Non-cash unit-based compensation expense | (74 | ) | | (80 | ) | | (79 | ) |
| Unrealized gains (losses) on commodity risk management activities | 56 |
| | (131 | ) | | (65 | ) |
| Inventory valuation adjustments | — |
| | — |
| | 58 |
|
| Losses on extinguishments of debt | (42 | ) | | — |
| | (43 | ) |
| Adjusted EBITDA related to unconsolidated affiliates | (984 | ) | | (946 | ) | | (937 | ) |
| Equity in earnings from unconsolidated affiliates | 156 |
| | 59 |
| | 469 |
|
| Impairment of investments in unconsolidated affiliates | (313 | ) | | (308 | ) | | — |
|
| Other, net | 148 |
| | 115 |
| | 23 |
|
| Income before income tax benefit | $ | 1,005 |
| | $ | 397 |
| | $ | 1,366 |
|
|
| | | | | | | | | | | |
| | December 31, |
| | 2017 | | 2016 | | 2015 |
| Assets: | | | | | |
| Intrastate transportation and storage | $ | 5,020 |
| | $ | 5,176 |
| | $ | 4,882 |
|
| Interstate transportation and storage | 13,518 |
| | 10,833 |
| | 11,345 |
|
| Midstream | 20,004 |
| | 17,873 |
| | 17,039 |
|
| NGL and refined products transportation and services | 17,600 |
| | 14,074 |
| | 11,568 |
|
| Crude oil transportation and services | 17,736 |
| | 15,909 |
| | 10,941 |
|
| All other | 4,087 |
| | 6,240 |
| | 9,353 |
|
| Total assets | $ | 77,965 |
| | $ | 70,105 |
| | $ | 65,128 |
|
|
| | | | | | | | | | | |
| | Years Ended December 31, |
| | 2017 | | 2016 | | 2015 |
| Additions to property, plant and equipment excluding acquisitions, net of contributions in aid of construction costs (capital expenditures related to the Partnership’s proportionate ownership on an accrual basis): | | | | | |
| Intrastate transportation and storage | $ | 175 |
| | $ | 76 |
| | $ | 105 |
|
| Interstate transportation and storage | 726 |
| | 280 |
| | 866 |
|
| Midstream | 1,308 |
| | 1,255 |
| | 2,174 |
|
| NGL and refined products transportation and services | 2,971 |
| | 2,198 |
| | 2,853 |
|
| Crude oil transportation and services | 453 |
| | 1,841 |
| | 1,358 |
|
| All other | 268 |
| | 160 |
| | 811 |
|
| Total additions to property, plant and equipment excluding acquisitions, net of contributions in aid of construction costs (accrual basis) | $ | 5,901 |
| | $ | 5,810 |
| | $ | 8,167 |
|
|
| | | | | | | | | | | |
| | December 31, |
| | 2017 | | 2016 | | 2015 |
| Advances to and investments in unconsolidated affiliates: | | | | | |
| Intrastate transportation and storage | $ | 85 |
| | $ | 399 |
| | $ | 406 |
|
| Interstate transportation and storage | 2,118 |
| | 2,149 |
| | 2,516 |
|
| Midstream | 126 |
| | 111 |
| | 117 |
|
| NGL and refined products transportation and services | 234 |
| | 235 |
| | 258 |
|
| Crude oil transportation and services | 22 |
| | 18 |
| | 21 |
|
| All other | 1,231 |
| | 1,368 |
| | 1,685 |
|
| Total advances to and investments in unconsolidated affiliates | $ | 3,816 |
| | $ | 4,280 |
| | $ | 5,003 |
|
|
| | | | | | | | | | | |
| | Years Ended December 31, |
| | 2019 | | 2018 | | 2017 |
Additions to property, plant and equipment (1): | | | | | |
| Intrastate transportation and storage | $ | 124 |
| | $ | 344 |
| | $ | 175 |
|
| Interstate transportation and storage | 375 |
| | 812 |
| | 728 |
|
| Midstream | 826 |
| | 1,161 |
| | 1,308 |
|
| NGL and refined products transportation and services | 2,976 |
| | 2,381 |
| | 2,971 |
|
| Crude oil transportation and services | 392 |
| | 474 |
| | 453 |
|
| Investment in Sunoco LP | 148 |
| | 103 |
| | 103 |
|
| Investment in USAC | 200 |
| | 205 |
| | — |
|
| All other | 213 |
| | 150 |
| | 268 |
|
Total additions to property, plant and equipment (1) | $ | 5,254 |
| | $ | 5,630 |
| | $ | 6,006 |
|
| |
16.(1) | Excluding acquisitions, net of contributions in aid of construction costs (capital expenditures related to the Partnership’s proportionate ownership on an accrual basis). |
|
| | | | | | | | | | | |
| | December 31, |
| | 2019 | | 2018 | | 2017 |
| Advances to and investments in unconsolidated affiliates: | | | | | |
| Intrastate transportation and storage | $ | 88 |
| | $ | 83 |
| | $ | 85 |
|
| Interstate transportation and storage | 2,524 |
| | 2,070 |
| | 2,118 |
|
| Midstream | 112 |
| | 124 |
| | 126 |
|
| NGL and refined products transportation and services | 243 |
| | 243 |
| | 234 |
|
| Crude oil transportation and services | 24 |
| | 28 |
| | 22 |
|
| All other | 27 |
| | 88 |
| | 113 |
|
| Total advances to and investments in unconsolidated affiliates | $ | 3,018 |
| | $ | 2,636 |
| | $ | 2,698 |
|
| |
| 17. | QUARTERLY FINANCIAL DATA (UNAUDITED): |
Summarized unaudited quarterly financial data is presented below. The sum
|
| | | | | | | | | | | | | | | | | | | |
| | Quarters Ended | | |
| | March 31 | | June 30 | | September 30 | | December 31 | | Total Year |
| 2019: | | | | | | | | | |
| Revenues | $ | 13,121 |
| | $ | 13,877 |
| | $ | 13,495 |
| | $ | 13,539 |
| | $ | 54,032 |
|
| Operating income | 1,928 |
| | 1,827 |
| | 1,834 |
| | 1,696 |
| | 7,285 |
|
| Net income | 1,281 |
| | 1,281 |
| | 1,224 |
| | 1,400 |
| | 5,186 |
|
| Net income attributable to partners | 1,012 |
| | 1,002 |
| | 951 |
| | 1,119 |
| | 4,084 |
|
|
| | | | | | | | | | | | | | | | | | | |
| | Quarters Ended | | |
| | March 31 | | June 30 | | September 30 | | December 31 | | Total Year |
| 2018: | | | | | | | | | |
| Revenues | $ | 11,882 |
| | $ | 14,118 |
| | $ | 14,514 |
| | $ | 13,573 |
| | $ | 54,087 |
|
| Operating income | 1,105 |
| | 1,138 |
| | 1,715 |
| | 1,444 |
| | 5,402 |
|
| Income from continuing operations | 814 |
| | 760 |
| | 1,494 |
| | 971 |
| | 4,039 |
|
| Net income | 577 |
| | 734 |
| | 1,492 |
| | 971 |
| | 3,774 |
|
| Net income attributable to partners | 715 |
| | 432 |
| | 1,135 |
| | 743 |
| | 3,025 |
|
|
| | | | | | | | | | | | | | | | | | | | |
| | | Quarters Ended | | |
| | | March 31* | | June 30* | | September 30* | | December 31 | | Total Year |
| 2017: | | | | | | | | | | |
| Revenues | | $ | 6,895 |
| | $ | 6,576 |
| | $ | 6,973 |
| | $ | 8,610 |
| | $ | 29,054 |
|
| Operating income | | 683 |
| | 736 |
| | 779 |
| | 199 |
| | 2,397 |
|
| Net income | | 393 |
| | 296 |
| | 715 |
| | 1,097 |
| | 2,501 |
|
| Common Unitholders’ interest in net income (loss) | | 32 |
| | (49 | ) | | 335 |
| | 668 |
| | 986 |
|
| Basic net income (loss) per Common Unit | | $ | 0.03 |
| | $ | (0.04 | ) | | $ | 0.29 |
| | $ | 0.57 |
| | $ | 0.94 |
|
| Diluted net income (loss) per Common Unit | | $ | 0.03 |
| | $ | (0.04 | ) | | $ | 0.29 |
| | $ | 0.57 |
| | $ | 0.93 |
|
|
| | | | | | | | | | | | | | | | | | | | |
| | | Quarters Ended | | |
| | | March 31* | | June 30* | | September 30* | | December 31* | | Total Year* |
| 2016: | | | | | | | | | | |
| Revenues | | $ | 4,481 |
| | $ | 5,289 |
| | $ | 5,531 |
| | $ | 6,526 |
| | $ | 21,827 |
|
| Operating income | | 598 |
| | 708 |
| | 594 |
| | (139 | ) | | 1,761 |
|
| Net income | | 360 |
| | 465 |
| | 94 |
| | (336 | ) | | 583 |
|
| Common Unitholders’ interest in net income (loss) | | (71 | ) | | 58 |
| | (252 | ) | | (754 | ) | | (1,019 | ) |
| Basic net income (loss) per Common Unit | | $ | (0.11 | ) | | $ | 0.06 |
| | $ | (0.34 | ) | | $ | (0.97 | ) | | $ | (1.38 | ) |
| Diluted net income (loss) per Common Unit | | $ | (0.11 | ) | | $ | 0.06 |
| | $ | (0.34 | ) | | $ | (0.97 | ) | | $ | (1.38 | ) |
* As adjusted. See Note 2. A reconciliation of amounts previously reported in Forms 10-Q to the quarterly data has not been presented due to immateriality.
The three months ended December 31, 2017 and 2016 reflected the recognition of impairment losses of $920 million and $813 million, respectively. Impairment losses in 2017 were primarily related to our Trunkline, SUG Holding Company, LLC, CDM, Sea Robin and refined products reporting units. Impairment losses in 2016 were primarily related to our PEPL reporting unit, Sea Robin reporting unit and midstream midcontinent operations. The three months ended December 31, 2017 and September 30, 2016 reflected the recognition of a non-cash impairment of our investments in subsidiaries of $313 million and $308 million, respectively, in our interstate transportation and storage segment.
For certain periods reflected above, distributions paid for the period exceeded net income attributable to partners. Accordingly, the distributions paid to the General Partner, including incentive distributions, further exceeded net income, and as a result, a net loss was allocated to the Limited Partners for the period.
| |
17.18. | CONSOLIDATING GUARANTOR FINANCIAL INFORMATION |
Prior to the Sunoco Logistics Merger, Sunoco Logistics Partners Operations L.P., a subsidiary of Sunoco Logistics was the issuer of multiple series of senior notes that were guaranteed by Sunoco Logistics. Subsequent to the Sunoco Logistics Merger, these notes continue to be guaranteed by the parent company.Sunoco Logistics.
These guarantees are full and unconditional. For the purposes of this footnote, Energy Transfer Partners, L.P.ETO is referred to as “Parent Guarantor” and Sunoco Logistics Partners Operations L.P. is referred to as “Subsidiary Issuer.” All other consolidated subsidiaries of the Partnership are collectively referred to as “Non-Guarantor Subsidiaries.”
The following supplemental condensed consolidating financial information reflects the Parent Guarantor’s separate accounts, the Subsidiary Issuer’s separate accounts, the combined accounts of the Non-Guarantor Subsidiaries, the combined consolidating adjustments and eliminations, and the Parent Guarantor’s consolidated accounts for the dates and periods indicated. For purposes of the following condensed consolidating information, the Parent Guarantor’s investments in its subsidiaries and the Subsidiary Issuer’s investments in its subsidiaries are accounted for under the equity method of accounting. To present the supplemental condensed consolidating financial information on a comparable basis, the prior period financial information has been recast as if the Sunoco Logistics Merger occurred on January 1, 2015.
The consolidating financial information for the Parent Guarantor, Subsidiary Issuer and Non-Guarantor Subsidiaries are as follows:
|
| | | | | | | | | | | | | | | | | | | |
| | December 31, 2019 |
| | Parent Guarantor | | Subsidiary Issuer | | Non-Guarantor Subsidiaries | | Eliminations | | Consolidated Partnership |
| Cash and cash equivalents | $ | — |
| | $ | — |
| | $ | 253 |
| | $ | — |
| | $ | 253 |
|
| All other current assets | 4,905 |
| | 44,047 |
| | 45,997 |
| | (88,042 | ) | | 6,907 |
|
| Property, plant and equipment | — |
| | — |
| | 69,971 |
| | — |
| | 69,971 |
|
| Investments in unconsolidated affiliates | 57,383 |
| | 15,045 |
| | 3,033 |
| | (72,443 | ) | | 3,018 |
|
| All other assets | 5,786 |
| | 131 |
| | 12,459 |
| | — |
| | 18,376 |
|
| Total assets | $ | 68,074 |
| | $ | 59,223 |
| | $ | 131,713 |
| | $ | (160,485 | ) | | $ | 98,525 |
|
| | | | | | | | | | |
| Current liabilities | $ | 3,394 |
| | $ | 41,148 |
| | $ | 48,350 |
| | $ | (85,811 | ) | | $ | 7,081 |
|
| Non-current liabilities | 34,782 |
| | 7,602 |
| | 13,753 |
| | — |
| | 56,137 |
|
| Noncontrolling interests | — |
| | — |
| | 8,018 |
| | — |
| | 8,018 |
|
| Total partners’ capital | 29,898 |
| | 10,473 |
| | 61,592 |
| | (74,674 | ) | | 27,289 |
|
| Total liabilities and equity | $ | 68,074 |
| | $ | 59,223 |
| | $ | 131,713 |
| | $ | (160,485 | ) | | $ | 98,525 |
|
|
| | | | | | | | | | | | | | | | | | | |
| | December 31, 2017 |
| | Parent Guarantor | | Subsidiary Issuer | | Non-Guarantor Subsidiaries | | Eliminations | | Consolidated Partnership |
| Cash and cash equivalents | $ | — |
| | $ | (3 | ) | | $ | 309 |
| | $ | — |
| | $ | 306 |
|
| All other current assets | — |
| | 159 |
| | 6,063 |
| | — |
| | 6,222 |
|
| Property, plant and equipment | — |
| | — |
| | 58,437 |
| | — |
| | 58,437 |
|
| Investments in unconsolidated affiliates | 48,378 |
| | 11,648 |
| | 3,816 |
| | (60,026 | ) | | 3,816 |
|
| All other assets | — |
| | — |
| | 9,184 |
| | — |
| | 9,184 |
|
| Total assets | $ | 48,378 |
| | $ | 11,804 |
| | $ | 77,809 |
| | $ | (60,026 | ) | | $ | 77,965 |
|
| | | | | | | | | | |
| Current liabilities | (1,496 | ) | | (3,660 | ) | | 12,150 |
| | — |
| | 6,994 |
|
| Non-current liabilities | 21,604 |
| | 7,607 |
| | 7,609 |
| | — |
| | 36,820 |
|
| Noncontrolling interest | — |
| | — |
| | 5,882 |
| | — |
| | 5,882 |
|
| Total partners’ capital | 28,270 |
| | 7,857 |
| | 52,168 |
| | (60,026 | ) | | 28,269 |
|
| Total liabilities and equity | $ | 48,378 |
| | $ | 11,804 |
| | $ | 77,809 |
| | $ | (60,026 | ) | | $ | 77,965 |
|
|
| | | | | | | | | | | | | | | | | | | |
| | December 31, 2018 |
| | Parent Guarantor | | Subsidiary Issuer | | Non-Guarantor Subsidiaries | | Eliminations | | Consolidated Partnership |
| Cash and cash equivalents | $ | — |
| | $ | — |
| | $ | 418 |
| | $ | — |
| | $ | 418 |
|
| All other current assets | 4,070 |
| | 36,889 |
| | 73,336 |
| | (107,893 | ) | | 6,402 |
|
| Property, plant and equipment | — |
| | — |
| | 66,655 |
| | — |
| | 66,655 |
|
| Investments in unconsolidated affiliates | 51,876 |
| | 13,090 |
| | 2,636 |
| | (64,966 | ) | | 2,636 |
|
| All other assets | 12 |
| | 75 |
| | 12,244 |
| | — |
| | 12,331 |
|
| Total assets | $ | 55,958 |
| | $ | 50,054 |
| | $ | 155,289 |
| | $ | (172,859 | ) | | $ | 88,442 |
|
| | | | | | | | | | |
| Current liabilities | $ | 3,430 |
| | $ | 33,517 |
| | $ | 80,731 |
| | $ | (108,381 | ) | | $ | 9,297 |
|
| Non-current liabilities | 24,787 |
| | 7,605 |
| | 10,132 |
| | — |
| | 42,524 |
|
| Noncontrolling interests | — |
| | — |
| | 7,903 |
| | — |
| | 7,903 |
|
| Total partners’ capital | 27,741 |
| | 8,932 |
| | 56,523 |
| | (64,478 | ) | | 28,718 |
|
| Total liabilities and equity | $ | 55,958 |
| | $ | 50,054 |
| | $ | 155,289 |
| | $ | (172,859 | ) | | $ | 88,442 |
|
|
| | | | | | | | | | | | | | | | | | | |
| | December 31, 2016 |
| | Parent Guarantor | | Subsidiary Issuer | | Non-Guarantor Subsidiaries | | Eliminations | | Consolidated Partnership |
| Cash and cash equivalents | $ | — |
| | $ | 41 |
| | $ | 319 |
| | $ | — |
| | $ | 360 |
|
| All other current assets | — |
| | 2 |
| | 5,281 |
| | — |
| | 5,283 |
|
| Property, plant and equipment | — |
| | — |
| | 50,917 |
| | — |
| | 50,917 |
|
| Investments in unconsolidated affiliates | 23,350 |
| | 10,664 |
| | 4,280 |
| | (34,014 | ) | | 4,280 |
|
| All other assets | — |
| | 5 |
| | 9,260 |
| | — |
| | 9,265 |
|
| Total assets | $ | 23,350 |
| | $ | 10,712 |
| | $ | 70,057 |
| | $ | (34,014 | ) | | $ | 70,105 |
|
| | | | | | | | | | |
| Current liabilities | (1,761 | ) | | (3,800 | ) | | 11,764 |
| | — |
| | 6,203 |
|
| Non-current liabilities | 299 |
| | 7,313 |
| | 30,148 |
| | (299 | ) | | 37,461 |
|
| Noncontrolling interest | — |
| | — |
| | 1,232 |
| | — |
| | 1,232 |
|
| Total partners’ capital | 24,812 |
| | 7,199 |
| | 26,913 |
| | (33,715 | ) | | 25,209 |
|
| Total liabilities and equity | $ | 23,350 |
| | $ | 10,712 |
| | $ | 70,057 |
| | $ | (34,014 | ) | | $ | 70,105 |
|
|
| | | | | | | | | | | | | | | | | | | |
| | Year Ended December 31, 2019 |
| | Parent Guarantor | | Subsidiary Issuer | | Non-Guarantor Subsidiaries | | Eliminations | | Consolidated Partnership |
| Revenues | $ | — |
| | $ | — |
| | $ | 54,032 |
| | $ | — |
| | $ | 54,032 |
|
| Operating costs, expenses, and other | — |
| | — |
| | 46,747 |
| | — |
| | 46,747 |
|
| Operating income | — |
| | — |
| | 7,285 |
| | — |
| | 7,285 |
|
| Interest expense, net | (1,612 | ) | | (374 | ) | | (271 | ) | | — |
| | (2,257 | ) |
| Equity in earnings of unconsolidated affiliates | 5,623 |
| | 1,938 |
| | 298 |
| | (7,561 | ) | | 298 |
|
| Losses on debt extinguishment | — |
| | — |
| | (2 | ) | |
| | (2 | ) |
| Losses on interest rate derivatives | (241 | ) | | — |
| | — |
| | — |
| | (241 | ) |
| Other, net | 314 |
| | 3 |
| | (14 | ) | | — |
| | 303 |
|
| Income before income tax expense | 4,084 |
| | 1,567 |
| | 7,296 |
| | (7,561 | ) | | 5,386 |
|
| Income tax expense | — |
| | — |
| | 200 |
| | — |
| | 200 |
|
| Net income | 4,084 |
| | 1,567 |
| | 7,096 |
| | (7,561 | ) | | 5,186 |
|
| Less: Net income attributable to noncontrolling interests | — |
| | — |
| | 1,051 |
| | — |
| | 1,051 |
|
| Less: Net income attributable to redeemable noncontrolling interests |
| |
| | 51 |
| |
| | 51 |
|
| Net income attributable to partners | $ | 4,084 |
| | $ | 1,567 |
| | $ | 5,994 |
| | $ | (7,561 | ) | | $ | 4,084 |
|
| | | | | | | | | | |
| Other comprehensive income | $ | — |
| | $ | — |
| | $ | 24 |
| | $ | — |
| | $ | 24 |
|
| Comprehensive income | 4,084 |
| | 1,567 |
| | 7,120 |
| | (7,561 | ) | | 5,210 |
|
| Comprehensive income attributable to noncontrolling interests | — |
| | — |
| | 1,051 |
| | — |
| | 1,051 |
|
| Comprehensive income attributable to redeemable noncontrolling interests |
| |
| | 51 |
| |
| | 51 |
|
| Comprehensive income attributable to partners | $ | 4,084 |
| | $ | 1,567 |
| | $ | 6,018 |
| | $ | (7,561 | ) | | $ | 4,108 |
|
| | | | Year Ended December 31, 2017 | Year Ended December 31, 2018 |
| | Parent Guarantor | | Subsidiary Issuer | | Non-Guarantor Subsidiaries | | Eliminations | | Consolidated Partnership | Parent Guarantor | | Subsidiary Issuer | | Non-Guarantor Subsidiaries | | Eliminations | | Consolidated Partnership |
| Revenues | $ | — |
| | $ | — |
| | $ | 29,054 |
| | $ | — |
| | $ | 29,054 |
| $ | — |
| | $ | — |
| | $ | 54,087 |
| | $ | — |
| | $ | 54,087 |
|
| Operating costs, expenses, and other | — |
| | 1 |
| | 26,656 |
| | — |
| | 26,657 |
| — |
| | — |
| | 48,685 |
| | — |
| | 48,685 |
|
| Operating income (loss) | — |
| | (1 | ) | | 2,398 |
| | — |
| | 2,397 |
| |
| Operating income | | — |
| | — |
| | 5,402 |
| | — |
| | 5,402 |
|
| Interest expense, net | — |
| | (156 | ) | | (1,209 | ) | | — |
| | (1,365 | ) | (1,196 | ) | | (176 | ) | | (337 | ) | | — |
| | (1,709 | ) |
| Equity in earnings of unconsolidated affiliates | 2,564 |
| | 1,242 |
| | 156 |
| | (3,806 | ) | | 156 |
| 4,170 |
| | 1,430 |
| | 344 |
| | (5,600 | ) | | 344 |
|
| Impairment of investments in unconsolidated affiliate | — |
| | — |
| | (313 | ) | | — |
| | (313 | ) | |
| Losses on interest rate derivatives | — |
| | — |
| | (37 | ) | | — |
| | (37 | ) | |
| Losses on extinguishments of debt | | — |
| | — |
| | (109 | ) | | — |
| | (109 | ) |
| Gains on interest rate derivatives | | 47 |
| | — |
| | — |
| | — |
| | 47 |
|
| Other, net | — |
| | — |
| | 168 |
| | (1 | ) | | 167 |
| — |
| | — |
| | 69 |
| | — |
| | 69 |
|
| Income before income tax benefit | 2,564 |
| | 1,085 |
| | 1,163 |
| | (3,807 | ) | | 1,005 |
| |
| Income tax benefit | — |
| | — |
| | (1,496 | ) | | — |
| | (1,496 | ) | |
| Income from continuing operations before income tax expense | | 3,021 |
| | 1,254 |
| | 5,369 |
| | (5,600 | ) | | 4,044 |
|
| Income tax expense from continuing operations | | — |
| | — |
| | 5 |
| | — |
| | 5 |
|
| Net income from continuing operations | | 3,021 |
| | 1,254 |
| | 5,364 |
| | (5,600 | ) | | 4,039 |
|
| Loss from discontinued operations, net of income taxes | | — |
| | — |
| | (265 | ) | | — |
| | (265 | ) |
| Net income | 2,564 |
| | 1,085 |
| | 2,659 |
| | (3,807 | ) | | 2,501 |
| 3,021 |
| | 1,254 |
| | 5,099 |
| | (5,600 | ) | | 3,774 |
|
| Less: Net income attributable to noncontrolling interest | — |
| | — |
| | 420 |
| | — |
| | 420 |
| |
| Less: Net income attributable to noncontrolling interests | | — |
| | — |
| | 715 |
| | — |
| | 715 |
|
| Less: Net income attributable to redeemable noncontrolling interests | | — |
| | — |
| | 39 |
| | — |
| | 39 |
|
| Less: Net loss attributable to predecessor | | — |
| | — |
| | (5 | ) | | — |
| | (5 | ) |
| Net income attributable to partners | $ | 2,564 |
| | $ | 1,085 |
| | $ | 2,239 |
| | $ | (3,807 | ) | | $ | 2,081 |
| $ | 3,021 |
| | $ | 1,254 |
| | $ | 4,350 |
| | $ | (5,600 | ) | | $ | 3,025 |
|
| | | | | | | | | | | | | | | | | | | |
| Other comprehensive income (loss) | $ | — |
| | $ | — |
| | $ | (5 | ) | | $ | — |
| | $ | (5 | ) | |
| Other comprehensive loss | | $ | — |
| | $ | — |
| | $ | (43 | ) | | $ | — |
| | $ | (43 | ) |
| Comprehensive income | 2,564 |
| | 1,085 |
| | 2,654 |
| | (3,807 | ) | | 2,496 |
| 3,021 |
| | 1,254 |
| | 5,056 |
| | (5,600 | ) | | 3,731 |
|
| Comprehensive income attributable to noncontrolling interest | — |
| | — |
| | 420 |
| | — |
| | 420 |
| |
| Less: Comprehensive income attributable to noncontrolling interests | | — |
| | — |
| | 715 |
| | — |
| | 715 |
|
| Less: Comprehensive income attributable to redeemable noncontrolling interests | | — |
| | — |
| | 39 |
| | — |
| | 39 |
|
| Less: Comprehensive loss attributable to predecessor | | — |
| | — |
| | (5 | ) | | — |
| | (5 | ) |
| Comprehensive income attributable to partners | $ | 2,564 |
| | $ | 1,085 |
| | $ | 2,234 |
| | $ | (3,807 | ) | | $ | 2,076 |
| $ | 3,021 |
| | $ | 1,254 |
| | $ | 4,307 |
| | $ | (5,600 | ) | | $ | 2,982 |
|
|
| | | | | | | | | | | | | | | | | | | |
| | Year Ended December 31, 2017 |
| | Parent Guarantor | | Subsidiary Issuer | | Non-Guarantor Subsidiaries | | Eliminations | | Consolidated Partnership |
| Revenues | $ | — |
| | $ | — |
| | $ | 40,523 |
| | $ | — |
| | $ | 40,523 |
|
| Operating costs, expenses, and other | — |
| | 1 |
| | 37,757 |
| | — |
| | 37,758 |
|
| Operating income (loss) | — |
| | (1 | ) | | 2,766 |
| | — |
| | 2,765 |
|
| Interest expense, net | — |
| | (156 | ) | | (1,419 | ) | | — |
| | (1,575 | ) |
| Equity in earnings of unconsolidated affiliates | 2,564 |
| | 1,242 |
| | 144 |
| | (3,806 | ) | | 144 |
|
| Impairment of investments in unconsolidated affiliates | — |
| | — |
| | (313 | ) | | — |
| | (313 | ) |
| Losses on extinguishments of debt | — |
| | — |
| | (42 | ) | | — |
| | (42 | ) |
| Losses on interest rate derivatives | — |
| | — |
| | (37 | ) | | — |
| | (37 | ) |
| Other, net | — |
| | — |
| | 207 |
| | (1 | ) | | 206 |
|
| Income from continuing operations before income tax benefit | 2,564 |
| | 1,085 |
| | 1,306 |
| | (3,807 | ) | | 1,148 |
|
| Income tax benefit from continuing operations | — |
| | — |
| | (1,804 | ) | | — |
| | (1,804 | ) |
| Net income from continuing operations | 2,564 |
| | 1,085 |
| | 3,110 |
| | (3,807 | ) | | 2,952 |
|
| Loss from discontinued operations, net of income taxes | — |
| | — |
| | (177 | ) | | — |
| | (177 | ) |
| Net income | 2,564 |
| | 1,085 |
| | 2,933 |
| | (3,807 | ) | | 2,775 |
|
| Less: Net income attributable to noncontrolling interests | — |
| | — |
| | 420 |
| | — |
| | 420 |
|
| Less: Net income attributable to predecessor | — |
| | — |
| | 274 |
| | — |
| | 274 |
|
| Net income attributable to partners | $ | 2,564 |
| | $ | 1,085 |
| | $ | 2,239 |
| | $ | (3,807 | ) | | $ | 2,081 |
|
| | | | | | | | | | |
| Other comprehensive loss | $ | — |
| | $ | — |
| | $ | (5 | ) | | $ | — |
| | $ | (5 | ) |
| Comprehensive income | 2,564 |
| | 1,085 |
| | 2,928 |
| | (3,807 | ) | | 2,770 |
|
| Less: Comprehensive income attributable to noncontrolling interests | — |
| | — |
| | 420 |
| | — |
| | 420 |
|
| Less: Comprehensive income attributable to predecessor | — |
| | — |
| | 274 |
| | — |
| | 274 |
|
| Comprehensive income attributable to partners | $ | 2,564 |
| | $ | 1,085 |
| | $ | 2,234 |
| | $ | (3,807 | ) | | $ | 2,076 |
|
|
| | | | | | | | | | | | | | | | | | | |
| | Year Ended December 31, 2016 |
| | Parent Guarantor | | Subsidiary Issuer | | Non-Guarantor Subsidiaries | | Eliminations | | Consolidated Partnership |
| Revenues | $ | — |
| | $ | — |
| | $ | 21,827 |
| | $ | — |
| | $ | 21,827 |
|
| Operating costs, expenses, and other | — |
| | 1 |
| | 20,065 |
| | — |
| | 20,066 |
|
| Operating income (loss) | — |
| | (1 | ) | | 1,762 |
| | — |
| | 1,761 |
|
| Interest expense, net | — |
| | (157 | ) | | (1,160 | ) | | — |
| | (1,317 | ) |
| Equity in earnings of unconsolidated affiliates | 554 |
| | 863 |
| | 59 |
| | (1,417 | ) | | 59 |
|
| Impairment of investment in unconsolidated affiliate | — |
| | — |
| | (308 | ) | | — |
| | (308 | ) |
| Losses on interest rate derivatives | — |
| | — |
| | (12 | ) | | — |
| | (12 | ) |
| Other, net | — |
| | — |
| | 214 |
| | — |
| | 214 |
|
| Income before income tax benefit | 554 |
| | 705 |
| | 555 |
| | (1,417 | ) | | 397 |
|
| Income tax benefit | — |
| | — |
| | (186 | ) | | — |
| | (186 | ) |
| Net income | 554 |
| | 705 |
| | 741 |
| | (1,417 | ) | | 583 |
|
| Less: Net income attributable to noncontrolling interest | — |
| | — |
| | 41 |
| | — |
| | 41 |
|
| Net income attributable to partners | $ | 554 |
| | $ | 705 |
| | $ | 700 |
| | $ | (1,417 | ) | | $ | 542 |
|
| | | | | | | | | | |
| Other comprehensive income | $ | — |
| | $ | — |
| | $ | 4 |
| | $ | — |
| | $ | 4 |
|
| Comprehensive income | 554 |
| | 705 |
| | 745 |
| | (1,417 | ) | | 587 |
|
| Comprehensive income attributable to noncontrolling interest | — |
| | — |
| | 41 |
| | — |
| | 41 |
|
| Comprehensive income attributable to partners | $ | 554 |
| | $ | 705 |
| | $ | 704 |
| | $ | (1,417 | ) | | $ | 546 |
|
|
| | | | | | | | | | | | | | | | | | | |
| | Year Ended December 31, 2019 |
| | Parent Guarantor | | Subsidiary Issuer | | Non-Guarantor Subsidiaries | | Eliminations | | Consolidated Partnership |
| Cash flows provided by operating activities | $ | 3,372 |
| | $ | 2,732 |
| | $ | 8,988 |
| | $ | (6,841 | ) | | $ | 8,251 |
|
| Cash flows used in investing activities | (2,044 | ) | | (2,732 | ) | | (8,188 | ) | | 6,841 |
| | (6,123 | ) |
| Cash flows used in financing activities | (1,328 | ) | | — |
| | (965 | ) | | — |
| | (2,293 | ) |
| Change in cash | — |
| | — |
| | (165 | ) | | — |
| | (165 | ) |
| Cash at beginning of period | — |
| | — |
| | 418 |
| | — |
| | 418 |
|
| Cash at end of period | $ | — |
| | $ | — |
| | $ | 253 |
| | $ | — |
| | $ | 253 |
|
|
| | | | | | | | | | | | | | | | | | | |
| | Year Ended December 31, 2015 |
| | Parent Guarantor | | Subsidiary Issuer | | Non-Guarantor Subsidiaries | | Eliminations | | Consolidated Partnership |
| Revenues | $ | — |
| | $ | — |
| | $ | 34,292 |
| | $ | — |
| | $ | 34,292 |
|
| Operating costs, expenses, and other | — |
| | 1 |
| | 32,064 |
| | — |
| | 32,065 |
|
| Operating income (loss) | — |
| | (1 | ) | | 2,228 |
| | — |
| | 2,227 |
|
| Interest expense, net | — |
| | (133 | ) | | (1,158 | ) | | — |
| | (1,291 | ) |
| Equity in earnings of unconsolidated affiliates | 1,441 |
| | 526 |
| | 469 |
| | (1,967 | ) | | 469 |
|
| Losses on interest rate derivatives | — |
| | — |
| | (18 | ) | | — |
| | (18 | ) |
| Other, net | — |
| | — |
| | (21 | ) | | — |
| | (21 | ) |
| Income before income tax benefit | 1,441 |
| | 392 |
| | 1,500 |
| | (1,967 | ) | | 1,366 |
|
| Income tax benefit | — |
| | — |
| | (123 | ) | | — |
| | (123 | ) |
| Net income | 1,441 |
| | 392 |
| | 1,623 |
| | (1,967 | ) | | 1,489 |
|
| Less: Net income attributable to noncontrolling interest | — |
| | — |
| | 53 |
| | — |
| | 53 |
|
| Net income attributable to partners | $ | 1,441 |
| | $ | 392 |
| | $ | 1,570 |
| | $ | (1,967 | ) | | $ | 1,436 |
|
| | | | | | | | | | |
| Other comprehensive income | $ | — |
| | $ | — |
| | $ | 60 |
| | $ | — |
| | $ | 60 |
|
| Comprehensive income | 1,441 |
| | 392 |
| | 1,683 |
| | (1,967 | ) | | 1,549 |
|
| Comprehensive income attributable to noncontrolling interest | — |
| | — |
| | 53 |
| | — |
| | 53 |
|
| Comprehensive income attributable to partners | $ | 1,441 |
| | $ | 392 |
| | $ | 1,630 |
| | $ | (1,967 | ) | | $ | 1,496 |
|
|
| | | | | | | | | | | | | | | | | | | |
| | Year Ended December 31, 2018 |
| | Parent Guarantor | | Subsidiary Issuer | | Non-Guarantor Subsidiaries | | Eliminations | | Consolidated Partnership |
| Cash flows provided by operating activities | $ | 4,041 |
| | $ | 1,521 |
| | $ | 5,641 |
| | $ | (3,644 | ) | | $ | 7,559 |
|
| Cash flows used in investing activities | (3,408 | ) | | (1,519 | ) | | (5,619 | ) | | 3,644 |
| | (6,902 | ) |
| Cash flows provided by (used in) financing activities | (633 | ) | | — |
| | (2,675 | ) | | — |
| | (3,308 | ) |
| Net increase in cash and cash equivalents of discontinued operations | — |
| | — |
| | 2,734 |
| | — |
| | 2,734 |
|
| Change in cash | — |
| | 2 |
| | 81 |
| | — |
| | 83 |
|
| Cash at beginning of period | — |
| | (2 | ) | | 337 |
| | — |
| | 335 |
|
| Cash at end of period | $ | — |
| | $ | — |
| | $ | 418 |
| | $ | — |
| | $ | 418 |
|
|
| | | | | | | | | | | | | | | | | | | |
| | Year Ended December 31, 2017 |
| | Parent Guarantor | | Subsidiary Issuer | | Non-Guarantor Subsidiaries | | Eliminations | | Consolidated Partnership |
| Cash flows provided by operating activities | $ | 2,564 |
| | $ | 1,047 |
| | $ | 5,013 |
| | $ | (3,807 | ) | | $ | 4,817 |
|
| Cash flows used in investing activities | (2,240 | ) | | (1,368 | ) | | (5,811 | ) | | 3,807 |
| | (5,612 | ) |
| Cash flows provided by financing activities | (324 | ) | | 277 |
| | 619 |
| | — |
| | 572 |
|
| Net decrease in cash and cash equivalents of discontinued operations | — |
| | — |
| | 93 |
| | — |
| | 93 |
|
| Change in cash | — |
| | (44 | ) | | (86 | ) | | — |
| | (130 | ) |
| Cash at beginning of period | — |
| | 42 |
| | 423 |
| | — |
| | 465 |
|
| Cash at end of period | $ | — |
| | $ | (2 | ) | | $ | 337 |
| | $ | — |
| | $ | 335 |
|
|
| | | | | | | | | | | | | | | | | | | |
| | Year Ended December 31, 2017 |
| | Parent Guarantor | | Subsidiary Issuer | | Non-Guarantor Subsidiaries | | Eliminations | | Consolidated Partnership |
| Cash flows from operating activities | $ | 2,564 |
| | $ | 1,047 |
| | $ | 4,681 |
| | $ | (3,807 | ) | | $ | 4,485 |
|
| Cash flows from investing activities | (2,240 | ) | | (1,368 | ) | | (5,672 | ) | | 3,807 |
| | (5,473 | ) |
| Cash flows from financing activities | (324 | ) | | 277 |
| | 981 |
| | — |
| | 934 |
|
| Change in cash | — |
| | (44 | ) | | (10 | ) | | — |
| | (54 | ) |
| Cash at beginning of period | — |
| | 41 |
| | 319 |
| | — |
| | 360 |
|
| Cash at end of period | $ | — |
| | $ | (3 | ) | | $ | 309 |
| | $ | — |
| | $ | 306 |
|
|
| | | | | | | | | | | | | | | | | | | |
| | Year Ended December 31, 2016 |
| | Parent Guarantor | | Subsidiary Issuer | | Non-Guarantor Subsidiaries | | Eliminations | | Consolidated Partnership |
| Cash flows from operating activities | $ | 553 |
| | $ | 675 |
| | $ | 3,492 |
| | $ | (1,417 | ) | | $ | 3,303 |
|
| Cash flows from investing activities | (976 | ) | | (2,400 | ) | | (4,431 | ) | | 1,417 |
| | (6,390 | ) |
| Cash flows from financing activities | 423 |
| | 1,729 |
| | 768 |
| | — |
| | 2,920 |
|
| Change in cash | — |
| | 4 |
| | (171 | ) | | — |
| | (167 | ) |
| Cash at beginning of period | — |
| | 37 |
| | 490 |
| | — |
| | 527 |
|
| Cash at end of period | $ | — |
| | $ | 41 |
| | $ | 319 |
| | $ | — |
| | $ | 360 |
|
|
| | | | | | | | | | | | | | | | | | | |
| | Year Ended December 31, 2015 |
| | Parent Guarantor | | Subsidiary Issuer | | Non-Guarantor Subsidiaries | | Eliminations | | Consolidated Partnership |
| Cash flows from operating activities | $ | 1,441 |
| | $ | 388 |
| | $ | 2,886 |
| | $ | (1,968 | ) | | $ | 2,747 |
|
| Cash flows from investing activities | (2,271 | ) | | (1,815 | ) | | (5,702 | ) | | 1,968 |
| | (7,820 | ) |
| Cash flows from financing activities | 830 |
| | 1,363 |
| | 2,744 |
| | — |
| | 4,937 |
|
| Change in cash | — |
| | (64 | ) | | (72 | ) | | — |
| | (136 | ) |
| Cash at beginning of period | — |
| | 101 |
| | 562 |
| | — |
| | 663 |
|
| Cash at end of period | $ | — |
| | $ | 37 |
| | $ | 490 |
| | $ | — |
| | $ | 527 |
|