20222023
UNITED STATES
SECURITIES AND EXCHANGE COMMISSION
Washington, D.C. 20549
Form 10-K
(Mark One)
| | | | | |
| ☒ | ANNUAL REPORT PURSUANT TO SECTION 13 OR 15(d) OF THE SECURITIES EXCHANGE ACT OF 1934 |
For the fiscal year ended December 31, 20222023
OR
| | | | | |
| ☐ | TRANSITION REPORT PURSUANT TO SECTION 13 OR 15(d) OF THE SECURITIES EXCHANGE ACT OF 1934 |
| For the transition period from _______________ to _______________ |
Commission file number: 001-32395
ConocoPhillips
(Exact name of registrant as specified in its charter)
| | | | | |
| Delaware | 01-0562944 |
| (State or other jurisdiction of incorporation or organization) | (I.R.S. Employer identification No.) |
925 N. Eldridge Parkway, Houston, TX 77079
(Address of principal executive offices) (Zip Code)
Registrant's telephone number, including area code: 281-293-1000
Securities registered pursuant to Section 12(b) of the Act:
| | | | | | | | |
| Title of each class | Trading symbols | Name of each exchange on which registered |
| Common Stock, $.01 Par Value | COP | New York Stock Exchange |
| 7% Debentures due 2029 | CUSIP—718507BK1 | New York Stock Exchange |
Securities registered pursuant to Section 12(g) of the Act: None
Indicate by check mark if the registrant is a well-known seasoned issuer, as defined in Rule 405 of the Securities Act. ☒ Yes ☐ No
Indicate by check mark if the registrant is not required to file reports pursuant to Section 13 or Section 15(d) of the Act. ☐ Yes ☒ No
Indicate by check mark whether the registrant (1) has filed all reports required to be filed by Section 13 or 15(d) of the Securities Exchange Act of 1934 during the preceding 12 months (or for such shorter period that the registrant was required to file such reports), and (2) has been subject to such filing requirements for the past 90 days. ☒ Yes ☐ No
Indicate by check mark whether the registrant has submitted electronically every Interactive Data File required to be submitted pursuant to Rule 405 of Regulation S-T (§ 232.405 of this chapter) during the preceding 12 months (or for such shorter period that the registrant was required to submit such files). ☒ Yes ☐ No
Indicate by check mark whether the registrant is a large accelerated filer, an accelerated filer, a non-accelerated filer, a smaller reporting company, or an emerging growth company. See the definitions of “large accelerated filer,” “accelerated filer,” “smaller reporting company” and “emerging growth company” in Rule 12b-2 of the Exchange Act.
| | | | | | | | | | | | | | | | | | | | | | | | | | | | | |
| Large Accelerated Filer | ☒ | Accelerated filer | ☐ | Non-accelerated filer | ☐ | Smaller reporting company | ☐ | Emerging growth company | ☐ |
If an emerging growth company, indicate by check mark if the registrant has elected not to use the extended transition period for complying with any new or revised financial accounting standards provided pursuant to Section 13(a) of the Exchange Act. ☐
Indicate by check mark whether the registrant has filed a report on and attestation to its management’s assessment of the effectiveness of its internal control over financial reporting under Section 404(b) of the Sarbanes-Oxley Act (15 U.S.C. 7262(b)) by the registered public accounting firm that prepared or issued its audit report. ☒
If securities are registered pursuant to Section 12(b) of the Act, indicate by checkmark whether the financial statements of the registrant included in the filing reflect the correction of an error to previously issued financial statements. ☐
Indicate by check mark whether any of those error corrections are restatements that required a recovery analysis of incentive-based compensation received by any of the registrant's executive officers during the relevant recovery period pursuant to §240.10D-1(b). ☐
Indicate by check mark whether the registrant is a shell company (as defined in Rule 12b-2 of the Act). ☐ Yes ☒ No
The aggregate market value of common stock held by non-affiliates of the registrant on June 30, 2022,2023, the last business day of the registrant’s most recently completed second fiscal quarter, based on the closing price on that date of $89.81,$103.61, was $114.2$124.0 billion.
The registrant had 1,218,776,4941,176,408,368 shares of common stock outstanding at January 31, 2023.2024.
Documents incorporated by reference:
Portions of the Proxy Statement for the Annual Meeting of Stockholders to be held on May 16, 202314, 2024 (Part III)
Table of Contents
| | Page |
| | Page | | | | Page |
| Commonly Used Abbreviations | Commonly Used Abbreviations | | Commonly Used Abbreviations | |
| | Item | Item | |
| | |
| Item | |
| Item | |
| | |
| | |
| | |
| | | | |
| | | |
| |
| | | |
| | |
| | |
| | |
| | |
| | |
| | |
| | |
| | |
| | |
| | |
| | |
| | | |
| | | | | |
| | | | | |
| | | | | |
| | | | | |
| | | | | |
| | | | | |
| | | | | |
| | | | | |
| | | | | |
| | | | | |
| | | | | |
| | | | | |
| | | | | |
| | | | | | |
| | | | | | |
| 1C. | | 1C. | | |
| | | | | | |
| | | | | | |
| | | | | |
| | | |
| | |
| | |
| | |
| | |
| | | |
| |
| | | | | | |
| | | |
| | | |
| |
| | | |
| | |
| |
| | | | | |
| | | | | | |
| | | | | | |
| | | | | | |
| | | | | | |
| | | | | | |
| | | |
| | |
| | |
| | | |
| |
| | |
| | | | | | |
| | | | | | |
| | | | | | |
| | | | | | |
| | | | | | |
| | | |
| | |
| | |
| | |
| | | | |
| | | |
| |
| | | | |
| | | | | |
| | | | | |
| Commonly Used Abbreviations | |
Commonly Used Abbreviations
The following industry-specific, accounting and other terms and abbreviations may be commonly used in this report.
| | | | | | | | | | | |
| Currencies | | Accounting | |
| $ or USD | U.S. dollar | ARO | asset retirement obligation |
| CAD | Canadian dollar | ASC | accounting standards codification |
| EUR | Euro | ASU | accounting standards update |
| GBP | British pound | DD&A | depreciation, depletion and |
| NOK | Norwegian kroner | | amortization |
| Units of Measurement | FASB | Financial Accounting Standards |
| Units of Measurement | | | Board |
| BBL | barrel | FIFO | Boardfirst-in, first-out |
| BCF | billion cubic feet | FIFOG&A | first-in, first-outgeneral and administrative |
| BOE | barrels of oil equivalent | G&AGAAP | general and administrativegenerally accepted accounting |
| MBD | thousands of barrels per day | | GAAPgenerally accepted accountingprinciples |
| MCF | thousand cubic feet | | principles |
MBOD | thousand barrels of oil per day | LIFO | last-in, first-out |
| MM | million | NPNS | normal purchase normal sale |
| MMBOE | million barrels of oil equivalent | PP&E | properties, plants and equipment |
MMBODMBOED | millionthousand of barrels of oil per day | VIE | variable interest entity |
| MBOEDthousands of barrels of oil | | |
| equivalent per day | | |
| MMBOED | millionsmillion of barrels of oil | Miscellaneous | |
| equivalent per day | DEICERCLA | diversity, equity and inclusionFederal Comprehensive |
| MMBTU | million British thermal units | | EPAEnvironmental Protection AgencyResponse |
| MMCFD | million cubic feet per day | | Compensation and Liability Act |
| MTPA | million tonnes per annum | DEI | diversity, equity and inclusion |
| | EPA | Environmental Protection Agency |
| Industry | | ESG | environmental, social and governance |
| | EU | European Union |
Industry | | FERC | Federal Energy Regulatory |
| BLM | Bureau of Land Management | EU | CommissionEuropean Union |
| CBM | coalbed methane | GHGFERC | greenhouse gasFederal Energy Regulatory |
| CCS | carbon capture and storage | | Commission |
| E&P | exploration and production | GHG | greenhouse gas |
| FEED | front-end engineering and design | HSE | health, safety and environment |
CCSFID | carbon capture and storagefinal investment decision | ICC | International Chamber of Commerce |
FEEDFPS | front-end engineering and designfloating production system | ICSID | World Bank’s International |
FPS | floating production system | | Centre for Settlement of |
| FPSO | floating production, storage and | | Investment DisputesCentre for Settlement of |
| offloading | | IRSInternal Revenue ServiceInvestment Disputes |
| G&G | geological and geophysical | OTCIRS | over-the-counterInternal Revenue Service |
| JOA | joint operating agreement | OTC | over-the-counter |
| LNG | liquefied natural gas | NYSE | New York Stock Exchange |
LNGNGLs | liquefied natural gas liquids | SEC | U.S. Securities and Exchange |
NGLs | natural gas liquids | | Commission |
| OPEC | Organization of Petroleum | | Commission |
| Exporting Countries | TSR | total shareholder return |
| PSC | Exporting Countriesproduction sharing contract | U.K. | United Kingdom |
PSCPUDs | production sharing contractproved undeveloped reserves | U.S. | United States of America |
PUDsSAGD | proved undeveloped reservessteam-assisted gravity drainage | VROC | variable return of cash |
SAGD | steam-assisted gravity drainage | | |
| WCS | Western Canadian Select | | |
| WTI | West Texas Intermediate | | |
| | | | | |
| 1 | ConocoPhillips 20222023 10-K |
Part I
Unless otherwise indicated, “the company,” “we,” “our,” “us” and “ConocoPhillips” are used in this report to refer to the businesses of ConocoPhillips and its consolidated subsidiaries. Items 1 and 2—Business and Properties, contain forward-looking statements including, without limitation, statements relating to our plans, strategies, objectives, expectations and intentions that are made pursuant to the “safe harbor” provisions of the Private Securities Litigation Reform Act of 1995. The words “ambition,”“anticipate,” “believe,” “budget,” “continue,” “could,” “effort,” “estimate,” “expect,” “forecast,” “goal,” “guidance,” “intend,” “may,” “objective,” “outlook,” “plan,” “potential,” “predict,” “projection,” “seek,” “should,” “target,” “will,” “would,”“would” and similar expressions identify forward-looking statements. The company does not undertake to update, revise or correct any forward-looking information unless required to do so under the federal securities laws. Readers are cautioned that such forward-looking statements should be read in conjunction with the company’s disclosures under the headings “Risk Factors” beginning on page 20 and “CAUTIONARY STATEMENT FOR THE PURPOSES OF THE ‘SAFE HARBOR’ PROVISIONS OF THE PRIVATE SECURITIES LITIGATION REFORM ACT OF 1995,” beginning on page 6365. Items 1 and 2. Business and Properties
Corporate Structure
ConocoPhillips is an independent E&P company headquartered in Houston, Texas with operations and activities in 13 countries. Our diverse, low cost of supply portfolio includes resource-rich unconventional plays in North America; conventional assets in North America, Europe, Africa and Asia; LNG developments; oil sands assets in Canada; and an inventory of global exploration prospects. On December 31, 2022,2023, we employed approximately 9,5009,900 people worldwide and had total assets of about $94$96 billion. Total company production for the year was 1,7381,826 MBOED.
ConocoPhillips was incorporated in the state of Delaware in 2001, in connection with, and in anticipation of, the merger between Conoco Inc. and Phillips Petroleum Company. The merger between Conoco and Phillips was consummated on August 30, 2002. In April 2012, ConocoPhillips completed the separation of the downstream business into an independent, publicly traded energy company, Phillips 66.
Segment and Geographic Information
We manage our operations through six operating segments, defined by geographic region: Alaska; Lower 48; Canada; Europe, Middle East and North Africa; Asia Pacific; and Other International. For operating segment and geographic information, see Note 24. | | | | | |
ConocoPhillips 20222023 10-K | 2 |
We explore for, produce, transport and market crude oil, bitumen, natural gas, LNGNGLs and NGLsLNG on a worldwide basis. At December 31, 2022,2023, our operations were producing in the U.S., Norway, Canada, Australia, Malaysia, Libya, China and Qatar.
•Proved worldwide crude oil, NGLs, natural gas and bitumen reserves.
•Net production of crude oil, NGLs, natural gas and bitumen.
•Average sales prices of crude oil, NGLs, natural gas and bitumen.
•Average production costs per BOE.
•Net wells completed, wells in progress and productive wells.
•Developed and undeveloped acreage.
| | Millions of Barrels of Oil Equivalent |
| Millions of Barrels of Oil Equivalent | | | Millions of Barrels of Oil Equivalent |
| Net Proved Reserves at December 31 | Net Proved Reserves at December 31 | 2022 | 2021 | 2020 | Net Proved Reserves at December 31 | 2023 | 2022 | 2021 |
| Crude oil | Crude oil | |
| Consolidated operations | |
| Consolidated operations | |
| Consolidated operations | Consolidated operations | 2,975 | | 2,964 | | 2,051 | |
| Equity affiliates | Equity affiliates | 93 | | 63 | | 68 | |
| Total Crude Oil | Total Crude Oil | 3,068 | | 3,027 | | 2,119 | |
| | Natural gas liquids | Natural gas liquids | |
| Natural gas liquids | |
| Natural gas liquids | |
| Consolidated operations | |
| Consolidated operations | |
| Consolidated operations | Consolidated operations | 845 | | 644 | | 340 | |
| Equity affiliates | Equity affiliates | 50 | | 33 | | 36 | |
| Total Natural Gas Liquids | Total Natural Gas Liquids | 895 | | 677 | | 376 | |
| | Natural gas | Natural gas | |
| Natural gas | |
| Natural gas | |
| Consolidated operations | |
| Consolidated operations | |
| Consolidated operations | Consolidated operations | 1,461 | | 1,523 | | 1,011 | |
| Equity affiliates | Equity affiliates | 959 | | 617 | | 621 | |
| Total Natural Gas | Total Natural Gas | 2,420 | | 2,140 | | 1,632 | |
| | Bitumen | Bitumen | |
| Bitumen | |
| Bitumen | |
| Consolidated operations | |
| Consolidated operations | |
| Consolidated operations | Consolidated operations | 216 | | 257 | | 332 | |
| Total Bitumen | Total Bitumen | 216 | | 257 | | 332 | |
| | Total consolidated operations | Total consolidated operations | 5,497 | | 5,388 | | 3,734 | |
| Total consolidated operations | |
| Total consolidated operations | |
| Total equity affiliates | Total equity affiliates | 1,102 | | 713 | | 725 | |
| Total company | Total company | 6,599 | | 6,101 | | 4,459 | |
| | | | | |
| 3 | ConocoPhillips 20222023 10-K |
Alaska
The Alaska segment primarily explores for, produces, transports and markets crude oil, natural gas and NGLs. We are the largest crude oil producer in Alaska and have major ownership interests in two of North America’s largest oil fields located on Alaska’s North Slope: Prudhoe Bay and Kuparuk. We operate Kuparuk in addition to several fields on the Western North Slope, in which we have 100 percent interest. Additionally, we are one of Alaska’s largest owners of state, federal and fee exploration leases, with approximately 1.2one million net undeveloped acres at year-end 2022.2023. Alaska operations contributed 1615 percent of our consolidated liquids production and two percent of our consolidated natural gas production.
| | 2022 |
| Interest | | Operator | | Crude Oil
MBD | NGL
MBD | Natural Gas
MMCFD | Total
MBOED |
| | | | | 2023 | | | | | | | 2023 |
| Interest | | | Interest | | Operator | | Crude Oil
MBD | NGL
MBD | Natural Gas
MMCFD | Total
MBOED |
| Average Daily Net Production | Average Daily Net Production | | | | | |
| Greater Prudhoe Area | |
| Greater Prudhoe Area | |
| Greater Prudhoe Area | Greater Prudhoe Area | 36.1 | % | | Hilcorp | | 67 | | 17 | | 32 | | 90 | |
| Greater Kuparuk Area | Greater Kuparuk Area | 89.2-94.7 | | ConocoPhillips | | 66 | | — | | 1 | | 66 | |
| Western North Slope | Western North Slope | 100.0 | | ConocoPhillips | | 44 | | — | | 1 | | 44 | |
| Total Alaska | Total Alaska | | 177 | | 17 | | 34 | | 200 | |
Greater Prudhoe Area
The Greater Prudhoe Area includes the Prudhoe Bay Unit, which consists of the Prudhoe Bay Field and five satellite fields, as well as the Greater Point McIntyre Area fields. Prudhoe Bay, the largest conventional oil field in North America, is the site of a large waterflood and enhanced oil recovery operation, supported by a large gas and water processing operation. Prudhoe Bay’s western satellite fields are Aurora, Borealis, Polaris, Midnight Sun and Orion, while the Point McIntyre, Niakuk, Raven, Lisburne and North Prudhoe Bay State fields are part of the Greater Point McIntyre Area. Field installations include seven production facilities, two gas plants, two seawater plants and a central power station. Activity in 2022 consisted of rotary and coil tubingIn 2023, on average, there were two rigs drilling throughout the year.
Greater Kuparuk Area
We operate theThe Greater Kuparuk Area which includes the Kuparuk River Unit, consistingwhich consists of the Kuparuk Field and foursix satellite fields: Tarn, Tabasco, Meltwater and West Sak. Kuparuk is located 40 miles west of the Prudhoe Bay Field.fields. Field installations include three central production facilities which separate oil, natural gas and water, as well asand a seawater treatment plant. DevelopmentIn 2023, we operated one drilling at Kuparuk consists of rotary-drilledrig and two workover rigs. The Nuna project, which targets the Moraine reservoir, was sanctioned in 2023 with first oil anticipated by early 2025. The Coyote reservoir discovered in 2021 progressed to development in 2023 with additional wells planned in 2024 and horizontal multi-laterals from existing wellbores utilizing coiled-tubing drilling.2025.
| | | | | |
ConocoPhillips 20222023 10-K | 4 |
Western North Slope
On theThe Western North Slope we operateincludes the Colville River Unit, and the Greater Mooses Tooth Unit and the Bear Tooth Unit. In 2023, on average, there were two rigs drilling throughout the year.
The Colville River Unit includes the Alpine Field and threefour satellite fields: Nanuq, Fiord and Qannik, which are located approximately 34 miles west of the Kuparuk Field.fields. Field installations include one central production facility, which separates oil, natural gas and water. In May 2022, Fiord West Kuparuk achieved first production.2023, we focused our development activities on the Narwhal trend, a reservoir within the Alpine Field, and anticipate completing the current phase in 2024. The results will help inform the design and optimization of future development.
The Greater Mooses Tooth Unit is the first unit established entirely within the National Petroleum Reserve Alaska (NPR-A). In 2017, we began constructionThe unit was constructed in the unit with two phases: Greater Mooses Tooth #1 (GMT1) and Greater Mooses Tooth #2 (GMT2). GMT1 achieved first oilDevelopment activity continued in 2018 and completed drilling in 2019. First oil for GMT2 was achieved in late 2021.2023.
2022 activity onOn March 12, 2023, the Western North Slope consistedDepartment of rotarythe Interior issued a Record of Decision (ROD) approving the Willow project, and extended reach drilling throughout the year.in December 2023, we announced FID. The project will consist of three drill sites, an operations center and camp, and a processing facility. First production is anticipated in 2029.
Exploration
Appraisal activities of the Willow Discovery in the Bear Tooth Unit in the NPR-A concluded in 2020. A Final Supplemental Environmental Impact Statement was released on February 1,In 2023, and published in the Federal Register on February 3, 2023, with a record of decision to follow no sooner than 30 days afterwards.
We continued evaluating the Narwhal trend throughout 2022, purchasing additional seismic data and drilling a second injector well to allow a fully supported production test. We are planning future Narwhal development from the existing Alpine CD4 infrastructure to help inform the design and optimization of the future CD8 pad.
We plan to drill the Bear-1 exploration well was drilled at a location 30 miles south of the Greater Kuparuk River UnitArea and east of the Colville River on state lands in early 2023. The well will testlands. No commercial hydrocarbons were found, and the Brookian topset play.
In late 2021, the Coyote Brookian topset exploration prospect in the Kuparuk River Unit was tested with a near vertical sidetrack from an existing wellbore. The well was fracture stimulateddeemed a dry hole and tested in early 2022. We are planning further appraisal drilling in 2023.permanently plugged and abandoned.
Transportation
We transport the petroleum liquids produced on the North Slope to Valdez, Alaska through an 800-mile pipeline that is part of Trans-Alaska Pipeline System (TAPS). We have a 29.5 percent ownership interest in TAPS, and we also have ownership interests in and operate the Alpine, Kuparuk and Oliktok pipelines on the North Slope.
Our wholly owned subsidiary, Polar Tankers, Inc., manages the marine transportation of our North Slope production, using five company-owned, double-hulled tankers, and charters third-party vessels, as necessary. The tankers deliver oil from Valdez, Alaska, primarily to refineries on the west coast of the U.S.
| | | | | |
| 5 | ConocoPhillips 20222023 10-K |
Lower 48
The Lower 48 segment consists of operations located in the 48 contiguous U.S. states and the Gulf of Mexico, with a portfolio mainly consisting of low cost of supply, short cycle time, resource-rich unconventional plays and commercial operations. Based on 20222023 production volumes, the Lower 48 is the company’sour largest segment and contributed 64 percent of our consolidated liquids production and 7276 percent of our consolidated natural gas production.
| | | | | | | | | | | | | | |
| 2022 |
| Crude Oil
MBD | NGL
MBD | Natural Gas
MMCFD | Total
MBOED |
| Average Daily Net Production | | | | |
| Delaware Basin | 258 | | 114 | | 752 | | 498 | |
| Eagle Ford | 117 | | 58 | | 271 | | 220 | |
| Midland Basin | 91 | | 31 | | 196 | | 155 | |
| Bakken | 59 | | 15 | | 127 | | 95 | |
| Other* | 9 | | 3 | | 56 | | 21 | |
| Total Lower 48 | 534 | | 221 | | 1,402 | | 989 | |
| *Other also includes select noncore assets that were divested in 2022. |
At December 31, 2022, we held 10.3 million net acres of onshore unconventional and conventional acreage in the Lower 48, the majority of which is either held by production or owned by the company. Our significant unconventional holdings are in the following areas: | | | | | | | | | | | | | | |
| 2023 |
| Crude Oil
MBD | NGL
MBD | Natural Gas
MMCFD | Total
MBOED |
| Average Daily Net Production | | | | |
| Delaware Basin | 274 | | 135 | | 768 | | 537 | |
| Eagle Ford | 114 | | 61 | | 306 | | 226 | |
| Midland Basin | 105 | | 42 | | 205 | | 182 | |
| Bakken | 66 | | 16 | | 150 | | 106 | |
| Other | 10 | | 2 | | 28 | | 16 | |
| Total Lower 48 | 569 | | 256 | | 1,457 | | 1,067 | |
|
•
659,000
Delaware Basin
We hold approximately 654,000 unconventional net acres in the Delaware Basin located in Westspanning west Texas and southeasternthrough southeast New Mexico.
•199,000 net acres Current development activity targets prospects in the Eagle Ford, located in South Texas.
•251,000 net acres in the Midland Basin, located in West Texas.
•560,000 net acres in the Bakken, located in North DakotaAvalon, Bone Springs and eastern Montana.
The majority of our 2022 production activities were centered on continued development of onshore assets, with an emphasis on areas with low cost of supply, particularly in growing unconventional plays. Our major focus in 2022 included the following areas:
•Delaware Basin—Wolfcamp formations while balancing leasehold obligations and permit terms. We operated ten rigs and three frac crews on average during 2022,2023, resulting in 186160 operated wells drilled and 153148 operated wells brought online.
Eagle Ford
We also participatedhold approximately 199,000 unconventional net acres in partner operated wells. Production increasedthe Eagle Ford located in 2022 compared with 2021 primarily related to our Shell Permian acquisition, averaging 498 MBOEDsouth Texas. The current focus is on full-field development, using customized well spacing and 286 MBOED, respectively.
•Eagle Ford—stacking patterns adapted through reservoir analysis. We operated six rigs and threetwo frac crews on average during 2022,2023, resulting in 125143 operated wells drilled and 153123 operated wells brought online. Production increased
Midland Basin
We hold approximately 248,000 unconventional net acres in 2022 compared with 2021, averaging 220 MBOEDthe Midland Basin located in west Texas. The current development strategy is focused on full-field development utilizing multi-well pad projects targeting both Spraberry and 211 MBOED, respectively.
•Midland Basin—Wolfcamp reservoir targets. We operated five rigs and two frac crews on average during 2022,2023, resulting in 9998 operated wells drilled and 111106 operated wells brought online. Production increased
Bakken
We hold approximately 562,000 unconventional net acres in 2022 compared with 2021, averaging 155 MBOEDthe Williston Basin located in North Dakota and 136 MBOED, respectively.
•Bakken—eastern Montana. The primary producing zones are the Middle Bakken and Three Forks formations. We operated twothree rigs and one frac crew on average during 2022,2023, resulting in 3361 operated wells drilled and 4337 operated wells brought online.
Partner-Operated
We alsoparticipate in partner-operated wells when they align with our investment decision criteria and development strategies. In 2023, we participated in partner operated wells. Production increased in 2022 comparedpartner-operated wells with 2021, averaging 95 MBOED and 94 MBOED, respectively.
Acquisitions and Dispositions
Throughout 2022, we completed sales of certain noncore assets, executed multiple acreage swaps and completed an acquisition that cored up acreage in Eagle Ford. See Note 3.varying working interests across our Lower 48 portfolio.Facilities
We operate and own, with varying interests, centralized condensate processing facilities in Texas and New Mexico in support of our Eagle Ford, Delaware and Midland assets.
| | | | | |
ConocoPhillips 20222023 10-K | 6 |
Canada
Our Canadian operations consist of the Surmont oil sands development in Alberta, and the liquids-rich Montney unconventional play in British Columbia and commercial operations. In 2022,2023, operations in Canada contributed sixseven percent of our consolidated liquids production and three percent of our consolidated natural gas production.
| | | | | | | | | | | | | | | | | | | | | | | | | | | | | |
| | | | | 2022 |
| Interest | | Operator | | Crude Oil
MBD | NGL
MBD | Natural Gas
MMCFD | Bitumen
MBD | Total
MBOED |
| Average Daily Net Production | | | | | | | | | |
| Surmont | 50.0 | % | | ConocoPhillips | | — | | — | | — | | 66 | | 66 | |
| Montney | 100.0 | | ConocoPhillips | | 6 | | 3 | | 61 | | — | | 19 | |
| Total Canada | | | | | 6 | | 3 | | 61 | | 66 | | 85 | |
Surmont | | | | | | | | | | | | | | | | | | | | | | | | | | | | | |
| | | | | 2023 |
| Interest | | Operator | | Crude Oil
MBD | NGL
MBD | Natural Gas
MMCFD | Bitumen
MBD | Total
MBOED |
| Average Daily Net Production | | | | | | | | | |
| Surmont* | 100.0 | % | | ConocoPhillips | | — | | — | | — | | 81 | | 81 | |
| Montney | 100.0 | | ConocoPhillips | | 9 | | 3 | | 65 | | — | | 23 | |
| Total Canada | | | | | 9 | | 3 | | 65 | | 81 | | 104 | |
*Acquired remaining 50 percent working interest in Surmont in October 2023. See Note 3. |
Our bitumen resources in Canada are produced via SAGD, an enhanced thermal oil recovery method called SAGD, wherebywhere steam is injected into the reservoir, effectively liquefying the heavy bitumen, which is recovered and pumped to the surface for further processing. Operations include two central processing facilities for treatment and blending of bitumen.bitumen, and a diluent recovery unit. These facilities have allowed the asset to lower blend ratio and diluent supply costs, while gaining protection from diluent supply disruptions and increased market access for our product. At December 31, 2022,2023, we held approximately 600,000684,000 net acres of land in the Athabasca Region of northeastern Alberta.
Surmont
The Surmont oil sands leases are located approximately 35 miles south of Fort McMurray, Alberta. Surmont is a 50/50 joint venture with Total Energies SE100 percent working interest asset that offers long-lived, sustained, long-life production. We are focused on keeping facilities full, structurally lowering costs, reducing GHG intensity and optimizing asset performance.
In 2022,October 2023, we began construction oncompleted our acquisition of the asset's next pad (Pad 267), which included the drilling of 24 well pairs. Firstremaining 50 percent working interest in Surmont from TotalEnergies EP Canada Ltd. We achieved first production on Pad 267 is expected in early 2024.
In 2021, we began processing a portion of Surmont’s blended bitumen at the Diluent Recovery Unit constructedDecember. We expect first production in Alberta, unlocking additional value for the asset by providing additional market access to2025 on our heavy crude oil. In 2019, Surmont implemented the use of condensate for bitumen blending through the central processing facility 2; enabling the asset to lower blend ratio and diluent supply costs, gain protection from synthetic crude oil supply disruptions and gain optionality on sales products. The alternative blend project was completed in 2021 at central processing facility 1. Full Surmont Heavy Dilbit (condensate bitumen blend) was first produced across both facilities in the fourth quarter of 2021.next pad, Pad 104.
Montney
The Montney is an unconventional resource play located in northeastern British Columbia. At December 31, 2022,2023, we held approximately 300,000297,000 net acres of land with 100 percent working interest in the liquids-rich section of the Montney.
In 2022,2023, we continued development activity consisted of the asset with the next series of pads, which included drilling 1716 horizontal wells and bringing 1215 wells online. In addition, we are progressing development of additional pads along with construction on theThe second phase of our central processing facility with start-up scheduled forwas successfully started in the third quarter of 2023.
Exploration
Our primary exploration focus is assessing our Montney acreage. In 2023, appraisal drilling and completions activity within the Montney will continue to explore the area’s resource potential.quarter.
| | | | | |
| 7 | ConocoPhillips 20222023 10-K |
Europe, Middle East and North Africa
The Europe, Middle East and North Africa segment consists of operations principally located in the Norwegian sector of the North Sea;Sea, the Norwegian Sea; Qatar; Libya;Sea, Qatar, Libya, and commercial and terminalling operations in the U.K. In 2022,2023, operations in Europe, Middle East and North Africa contributed nine percent of our consolidated liquids production and 1716 percent of our consolidated natural gas production.
Norway
| | 2022 |
| Interest | | Operator | | Crude Oil
MBD | NGL
MBD | Natural Gas
MMCFD | Total
MBOED |
| | | | | 2023 | | | | | | | 2023 |
| Interest | | | Interest | | Operator | | Crude Oil
MBD | NGL
MBD | Natural Gas
MMCFD | Total
MBOED |
| Average Daily Net Production | Average Daily Net Production | | | | | |
| Greater Ekofisk Area | |
| Greater Ekofisk Area | |
| Greater Ekofisk Area | Greater Ekofisk Area | 30.7-35.1% | | ConocoPhillips | | 43 | | 2 | | 37 | | 51 | |
| Heidrun | Heidrun | 24.0 | | | Equinor | | 11 | | — | | 42 | | 19 | |
| Aasta Hansteen | Aasta Hansteen | 10.0 | | | Equinor | | — | | — | | 84 | | 14 | |
| Troll | Troll | 1.6 | | | Equinor | | 1 | | — | | 62 | | 12 | |
| Visund | Visund | 9.1 | | | Equinor | | 2 | | 1 | | 50 | | 11 | |
| Alvheim | Alvheim | 20.0 | | | Aker BP | | 8 | | — | | 14 | | 10 | |
| Other | Other | Various | | Equinor | | 6 | | — | | 17 | | 8 | |
| Total Norway | Total Norway | | 71 | | 3 | | 306 | | 125 | |
Greater Ekofisk Area
The Greater Ekofisk Area is located approximately 200 miles offshore Stavanger, Norway, in the North Sea, and comprises fouris comprised of five producing fields: Ekofisk, Eldfisk, Embla and Tor.fields. Crude oil is exported to our operated terminal located at Teesside, England,U.K., and the natural gas is exported to Emden, Germany. The Ekofisk and Eldfisk fields consist of several production platforms and facilities, with development drilling continuing over the coming years. Currently there are two development projects, Tommeliten A development, a new subsea tieback to Ekofisk, achieved first production in 2023, and the Eldfisk North within the Greater Ekofisk Area. These subsea developmentsdevelopment will be tied back to Ekofisk and Eldfisk, respectively, with first production expected in 2024. Additionally in 2022, we received a 20-year extension on our production licenses in the Greater Ekofisk Area until 2048.
Heidrun Field
The Heidrun Field is located in the Norwegian Sea. Produced crude oil is stored in a floating storage unit and exported via shuttle tankers. Most of the gas is transported to Europe via gas processing terminals in Norway with some reinjected for pressure support if required. A portion of the gas is also transported for use as feedstock in a methanol plant in Norway, in which we have an 18 percent interest.
Aasta Hansteen Field
The Aasta Hansteen Field is a gas and condensate field located in the Norwegian Sea. Produced condensate is loaded onto shuttle tankers and transported to market. Gas is transported through the Polarled gas pipeline to the onshore Nyhamna processing plant for final processing prior to export to market.
Troll Field
The Troll Field lies in the northern part of the North Sea and consists of the Troll A, B and C platforms. The natural gas from Troll A is transported to Kollsnes, Norway. Crude oil from floating platforms Troll B and Troll C is transported to Mongstad, Norway, for storage and export.
| | | | | |
ConocoPhillips 20222023 10-K | 8 |
Visund Field
The Visund Field is an oil and gas field located in the northern part of the North Sea and consists of a floating drilling, production and processing unit and subsea installations. Crude oil is transported by pipeline to a nearby third-party field for storage and export via tankers. The natural gas is transported to athe gas processing plantplants at Kollsnes Norway,and Kårstø, through the Gassled transportation system.
The Alvheim Field is located in the northern part of the North Sea near the border with the U.K. sector, and consists of a FPSO vessel and subsea installations. Produced crude oil is exported via shuttle tankers and natural gas is transported to the Scottish Area Gas Evacuation (SAGE) Terminal at St. Fergus, Scotland,U.K., through the SAGE Pipeline. The Kobra East and Gekko (KEG) project, a new subsea tieback to the Alvheim FPSO, is currently being developed, withachieved first production expected in 2024.2023.
Other Fields
We also have varying ownership interests in twothree other producing fields in the NorwayNorwegian sector of the North Sea. In 2023, the partner-operated Breidablikk project achieved first production.
Exploration
In 2022, we executed a four-well exploration and appraisal campaign which included the Slagugle appraisal well and exploration of the Peder, Bounty and Lamba prospects. Additionally in 2022,2023, we participated in the Othello partner operatedpartner-operated Ve exploration well. None ofwell on PL919 located in the exploration wells resulted in commercial discovery of hydrocarbons, and allNorth Sea. We were permanently plugged and abandoned. Slagugle is a discovery that we are continuing to evaluate. In 2022, we werealso awarded threetwo new exploration licenses, PL1146, PL1163,PL1146B and PL1166,PL036G located in the North Sea and executedtraded into two licenses, PL886 and PL886B located in the Norwegian Sea. In the third quarter of 2023, we recorded the investment in the suspended Warka discovery well on license PL1009, located in the Norwegian Sea and drilled in 2020, as dry hole expense. In 2024, we plan to drill the second appraisal well in the 2020 Slagugle discovery located in the Norwegian Sea and participate in a trade to enter license PL1099.partner-operated exploration well in the Alvheim Deep prospect.
Transportation
We have a 35.1 percent interest in the Norpipe Oil Pipeline System, a 220-mile pipeline which carries crude oil from Ekofisk to a crude oil stabilization and NGLs processing facility in Teesside, England.U.K.
Facilities
We operate and have a 40.25 percent ownership interest in a crude oil stabilization and NGLs processing facility at Teesside, EnglandU.K. to support our Norway operations.
| | | | | |
| 9 | ConocoPhillips 20222023 10-K |
Qatar
| | 2022 |
| Interest | | Operator | | Crude Oil
MBD | NGL
MBD | Natural Gas
MMCFD | Total
MBOED |
| | | | | 2023 | | | | | | | 2023 |
| Interest | | | Interest | | Operator | | Crude Oil
MBD | NGL
MBD | Natural Gas
MMCFD | Total
MBOED |
| Average Daily Net Production | Average Daily Net Production | | | | | |
| QG3 | 30.0 | % | | Qatargas Operating Company Limited | | 13 | | 8 | | 374 | | 83 | |
| QatarEnergy LNG N(3) | |
| QatarEnergy LNG N(3) | |
| QatarEnergy LNG N(3) | |
QG3QatarEnergy LNG N(3) (N3), formerly Qatar Liquefied Gas Company Limited (3) (QG3), is an integrated development jointly owned by QatarEnergy (68.5 percent), ConocoPhillips (30 percent) and Mitsui & Co., Ltd. (1.5 percent). QG3N3 consists of upstream natural gas production facilities, which produce approximately 1.4 billion gross cubic feetBCF per day of natural gas from Qatar’s North Field over a 25-year life, in addition to a 7.8 million gross tonnes per year LNG facility. LNG is shipped in leased LNG carriers destined for sale globally.
QG3N3 executed the development of the onshore and offshore assets as a single integrated development with QatarEnergy LNG N(4) (N4), formerly Qatargas 4 (QG4), a joint venture between QatarEnergy and Shell plc. This included the joint development of offshore facilities situated in a common offshore block in the North Field, as well as the construction of two identical LNG process trains and associated gas treating facilities for both the QG3N3 and QG4N4 joint ventures. Production from the LNG trains and associated facilities is combined and shared.
During 2022, we were awarded a 25 percent interest in each of two new joint ventures with QatarEnergy that willto participate in the North Field East (NFE) and North Field South (NFS) LNG projects. Formation of the NFE joint venture, QatarEnergy LNG NFE (4) (NFE4), formerly Qatar Liquefied Gas Company Limited (8) (QG8), closed in December 2022 and we anticipate that the formation of the NFS joint venture, QatarEnergy LNG NFS (3) (NFS3), formerly Qatar Liquefied Gas Company Limited (12) (QG12) will close, closed in earlyJune 2023. See Note 3 and Note 4. Libya
| | 2022 |
| Interest | | Operator | | Crude Oil
MBD | NGL
MBD | Natural Gas
MMCFD | Total
MBOED |
| | | | | 2023 | | | | | | | 2023 |
| Interest | | | Interest | | Operator | | Crude Oil
MBD | NGL
MBD | Natural Gas
MMCFD | Total
MBOED |
| Average Daily Net Production | Average Daily Net Production | | | | | |
| Waha Concession | Waha Concession | 20.4 | % | | Waha Oil Co. | | 36 | | — | | 22 | | 40 | |
| Waha Concession | |
| Waha Concession | |
The Waha Concession consistsis made up of multiple concessions for exploration and production activity and encompasses nearlyapproximately 13 million gross acres onshore in the Sirte Basin. In 2022, we had 26 crude liftings fromBasin for exploration and production activity. Oil is transported by pipeline to the Es Sider terminal.
In November 2022, ConocoPhillipsterminal for export. Natural gas is transported and TotalEnergies completed the joint acquisition of Hess Libya Waha Ltd., which increased our interest insold domestically. Current production comes from 13 existing fields within the Waha Concession by 4.1 percent to 20.4 percent.Concession.
| | | | | |
ConocoPhillips 20222023 10-K | 10 |
Asia Pacific
The Asia Pacific segment has exploration and production operations in China, Malaysia, Australia and commercial operations in China, Singapore and Japan. In 2022,2023, operations in the Asia Pacific segment contributed five percent of our consolidated liquids production and sixthree percent of our consolidated natural gas production.
Australia | | 2022 |
| Interest | | Operator | | Crude Oil
MBD | NGL
MBD | Natural Gas
MMCFD | Total
MBOED |
| | | | | 2023 | | | | | | | 2023 |
| Interest | | | Interest | | Operator | | Crude Oil
MBD | NGL
MBD | Natural Gas
MMCFD | Total
MBOED |
| Average Daily Net Production | Average Daily Net Production | | | | | |
| Australia Pacific LNG | Australia Pacific LNG | 47.5 | % | | ConocoPhillips/Origin Energy | | — | | — | | 817 | | 136 | |
| Australia Pacific LNG | |
| Australia Pacific LNG | |
Australia Pacific LNG Pty Ltd. (APLNG), our joint venture with Origin Energy Limited and China Petrochemical Corporation (Sinopec), is focused on producing CBM from the Bowen and Surat basins in Queensland, Australia, to supply the domestic gas market and convert the CBM into LNG for export. Origin operates APLNG’s upstream production and pipeline system, and we operate the downstream LNG facility, located on Curtis Island near Gladstone, Queensland, as well as the LNG export sales business.
We operate two fully subscribed 4.5 million metric tonnes per yearMTPA LNG trains. Approximately 3,500 net wells are ultimately expected to supply both the LNG sales contracts and domestic gas market. The wells are supported by gathering systems, central gas processing and compression stations, water treatment facilities and an export pipeline connecting the gas fields to the LNG facilities. The LNG is being sold to Sinopec under 20-year sales agreements for 7.6 million metric tonnesMTPA of LNG, per year, and Japan-based Kansai Electric Power Co., Inc. under a 20-year sales agreement for approximately 1 million metric tonnesMTPA of LNG per year.
In February 2022, we completed the acquisition of an additional 10 percent interest in APLNG from Origin Energy, increasing our ownership to 47.5 percent, with Origin and Sinopec retaining 27.5 percent and 25 percent interests, respectively.LNG.
Exploration
In 2019, we entered intoWe own an agreement with 3D Oil to acquire a 7580 percent working interest in and operatorship of an offshoreboth Exploration Permit (T/49P) and (VIC/P79) located in the Otway Basin, Australia. We obtained an additional five percent interest, increasing our interest to 80 percent, in June 2020. A 3DExisting seismic survey acquisition was completed in October 2021, and this data for both permits is being evaluated for future exploration drilling opportunities.
In October 2022,During 2023, we entered intoexecuted a Joint Operating Agreementdrilling consortium agreement with 3D Oilother operators in Australia and secured a contract for an 80 percent interest in Exploration Permit (VIC/P79) in the Otway Basin, Australia.a semi-sub drilling rig. The transaction is pending final regulatory approvals which are expected in the first half of 2023. Existing seismic data is currently being reprocessedproposed exploration program involves seabed surveys and will be evaluatedtwo exploration wells planned for future exploration drilling opportunities.2025.
| | | | | |
| 11 | ConocoPhillips 20222023 10-K |
Indonesia | | | | | | | | | | | | | | | | | | | | | | | | | | |
| | | | | 2022 |
| Interest | | Operator | | Crude Oil
MBD | NGL
MBD | Natural Gas
MMCFD | Total
MBOED |
| Average Daily Net Production | | | | | | | | |
| South Sumatra | 54.0 | % | | ConocoPhillips | | — | | — | | 48 | | 8 | |
In March 2022, we completed the sale of our subsidiary that indirectly held the company’s 54 percent interest in the Indonesia Corridor Block PSC and a 35 percent shareholding interest in the Transasia Pipeline Company. See Note 3.China | | 2022 |
| Interest | | Operator | | Crude Oil
MBD | NGL
MBD | Natural Gas
MMCFD | Total
MBOED |
| | | | | 2023 | | | | | | | 2023 |
| Interest | | | Interest | | Operator | | Crude Oil
MBD | NGL
MBD | Natural Gas
MMCFD | Total
MBOED |
| Average Daily Net Production | Average Daily Net Production | | | | | |
| Penglai | Penglai | 49.0 | % | | CNOOC | | 30 | | — | | — | | 30 | |
| Penglai | |
| Penglai | |
Penglai
In 2022, Chinese National Offshore Oil Corporation (CNOOC) and ConocoPhillips approved adjustments to our Bohai PSC production licenses, aligning all three Penglai Field licenses to expire in 2039.
The Penglai 19-3, 19-9 and 25-6 fields are located in the Bohai Bay Block 11/05 and are being developed in stages.stages from large offshore platforms and a FPSO. Most crude oil produced from the block is sold to the China domestic market, with the remainder exported to international markets.
Phase 3 consists of three new wellhead platforms and a central processing platform. First production from Phase 3 was achieved in 2018. This project could include up to 186 wells, 157175 of which have been completed and brought online as of December 2022.2023.
Phase 4A consists of one new wellhead platform and achieved first production in 2020. This project could include up to 62 new wells, 3354 of which have been completed and brought online as of December 2022.2023.
Phase4Biscurrentlyunderconstruction consists of two wellhead platforms, WHP-H andconsists WHP-N, both oftwonewwellheadplatforms. which achieved first production in the fourth quarter of 2023. Thisprojectcouldincludeupto160 144 new wells.wells, 3 of which have been completed and brought online as of December 2023.
Malaysia
| | 2022 |
| Interest | | Operator | | Crude Oil
MBD | NGL
MBD | Natural Gas
MMCFD | Total
MBOED |
| | | | | 2023 | | | | | | | 2023 |
| Interest | | | Interest | | Operator | | Crude Oil
MBD | NGL
MBD | Natural Gas
MMCFD | Total
MBOED |
| Average Daily Net Production | Average Daily Net Production | | | | | |
| Gumusut | |
| Gumusut | |
| Gumusut | Gumusut | 29.5 | % | | Shell | | 14 | | — | | — | | 14 | |
| Malikai | Malikai | 35.0 | | | Shell | | 13 | | — | | — | | 13 | |
| Kebabangan (KBB) | Kebabangan (KBB) | 30.0 | | | KPOC | | 1 | | — | | 65 | | 12 | |
| Siakap North-Petai | Siakap North-Petai | 21.0 | | | PTTEP | | 3 | | — | | 1 | | 3 | |
| Total Malaysia | Total Malaysia | | 31 | | — | | 66 | | 42 | |
We have varying stages of exploration, development and production activities across approximately 2.7 million net acres in Malaysia, with working interests in six PSCs. Four of these PSCs are located in waters off the eastern Malaysian state of Sabah: Block G, Block J, the Kebabangan Cluster (KBBC), which we do not operate, and Block SB405, an operated exploration block acquired in 2021. We also operate another two exploration blocks, Block WL4-00 and Block SK304, in waters off the eastern Malaysian state of Sarawak.
| | | | | |
ConocoPhillips �� 2022 10-K | 12 |
Block J
Gumusut
We currently haveown a 29.5 percent working interest in the unitized Gumusut Field. Gumusut Phase 3 first oil was achieved in 2022. Development drilling associated with Gumusut Phase 4, a four-well program targeting the Brunei acreage of the unitized Gumusut Field that straddles Malaysia and Brunei waters, is planned to commence in early 2024 with first oil anticipated in late 2024.early 2025. The unitized Gumusut Field is operated on a FPS with oil evacuation via a pipeline to the Sabah Oil and Gas Terminal (SOGT) for tanker liftings.
| | | | | |
| ConocoPhillips 2023 10-K | 12 |
KBBC
The KBBC PSC grants usWe own a 30 percent working interest in the KBB, Kamunsu East and Kamunsu East Upthrown Canyon gas and condensate fields.
KBB
Gas is transported from the KBB platform via pipeline for sale to the domestic gas market. During 2019, KBB tied-in to a nearby third-party floating LNG vessel, which provided increased gas offtake capacity. Production from the field has been reduced since January 2020, due to the rupture of a third-party pipeline which carries gas production from KBB to one of its markets. The third-party operator continues to progress the pipeline repair.
Block G
Malikai
We holdown a 35 percent working interest in Malikai. Malikai Phase 2 development first oil was achieved in February 2021. Malikai operates on a tension leg platform and pipes oil to the KBB platform for processing. Oil evacuation is via pipeline to SOGT for tanker liftings.
Siakap North-Petai
We holdown a 21 percent working interest in the unitized Siakap North-Petai (SNP) oil field. First oil from SNP Phase 2 was achieved in November 2021. The subsea system in the SNP oil field is tied back to a FPSO operated by PTTEP.
Exploration
In 2017, we were awarded operatorship and a 50 percent working interest in Block WL4-00, which included the existing Salam-1 oil discovery and encompassed 0.6 million gross acres. In 2018 and 2019, we drilled exploration and appraisal wells, resulting in oil discoveries under evaluation at Salam and Benum Fields. In 2022, we drilled two additional appraisal wells and one exploration well to evaluate the oil discoveries. The Gagau-1 exploration well made a sub-commercial gas discovery and was expensed as a dry hole. The information from the well results will help optimize future development plans.
In 2018, we were awardedWe own a 50 percent working interest and operatorship ofoperate both Blocks WL4-00 and SK304. Block WL4-00 encompasses 0.3 million net acres primarily in the Salam and Benum Fields. Block SK304 encompassing 2.1encompasses 1.1 million grossnet acres off the coast of Sarawak, offshore Malaysia. We acquired 3D seismic over the acreagecontinue to evaluate these blocks and completed processing of this data in 2019. The Mersing-1 explorationare using information from prior well was drilled in 2022, did not encounter any significant hydrocarbons and was expensed as a dry hole. SK304 is a block that we are continuingresults to evaluate.help optimize future development plans.
In 2021, we were awarded operatorship and an 85 percent working interest in Block SB405 encompassing 1.41.2 million grossnet acres off the coast of Sabah, offshore Malaysia. A 3D seismic survey was acquired in 2022, and processing and evaluation of this data will be ongoing through 2023.is currently ongoing.
Other International
The Other International segment includes interests in Colombia as well as contingencies associated with prior operations in other countries.
Colombia
We have an 80 percent operatedoperating interest in the Middle Magdalena Basin Block VMM-3 extending over approximately 67,000 net acres. In addition, we have an 80 percent working interest in the VMM-2 Block, which extends over approximately 58,000 net acres and is contiguous to the VMM-3 Block. The blockscontracts for this project are currently in Force Majeureforce majeure due to the lack of a defined Environmental Licensing process.environmental licensing required for the execution of unconventional exploratory activities. Additionally, the government of Colombia supports a ban on such activities.
Venezuela
For discussion of our contingencies in Venezuela, see Note 11. | | | | | |
| 13 | ConocoPhillips 20222023 10-K |
Other
Marketing Activities
Our Commercial organization manages our worldwide commodity portfolio, which mainly includes natural gas, crude oil, bitumen, NGLs, LNG and LNG.power. Marketing activities are performed through offices in the U.S., Canada, Europe and Asia. In marketing our production, we attempt to minimize flow disruptions, maximize realized prices and manage credit-risk exposure. Commodity sales are generally made at prevailing market prices at the time of sale. We also purchase and sell third-party commodity volumes to better position the company to satisfy customer demand while fully utilizing transportation and storage capacity.
Crude Oil, Bitumen and NGLs
Our crude oil, bitumen and NGL revenues are derived from production in the U.S., Canada, Asia, Africa and Europe. These commodities are primarily sold under contracts with prices based on market indices, adjusted for location, quality and transportation.
Natural Gas
Our natural gas production, along with third-party purchased gas, is primarily marketed in the U.S., Canada and Europe. Our natural gas is sold to a diverse client portfolio, which includes local distribution companies; gas and power utilities; large industrials; independent, integrated or state-owned oil and gas companies; as well as marketing companies. To reduce our market exposure and credit risk, we also transport natural gas via firm and interruptible transportation agreements to major market hubs.
Crude Oil, Bitumen and Natural Gas Liquids
Our crude oil, bitumen and NGL revenues are derived from production in the U.S., Canada, Asia, Africa and Europe. These commodities are primarily sold under contracts with prices based on market indices, adjusted for location, quality and transportation.
LNG
LNG marketing efforts are focused onWe have producing equity LNG production facilities located in Australia and Qatar. LNG isQatar, by which volumes are primarily sold under long-term contracts with prices based on market indices. In 2022,2023, we entered into several agreements with Sempra entitiescontinued to progress our global LNG strategy, acquiring a 30 percent equity interest in connection with the Port Arthur LNG (PALNG) facility includingand contracting 5 MTPA offtake capacity. We secured additional offtake capacity in North America of 2.4 MTPA, which includes a 20-year sale and purchaseofftake agreement for 5 million tonnes per annum (MTPA) of LNG offtakeapproximately 2.2 MTPA at the start-upSaguaro LNG project on the West Coast of Mexico, subject to Mexico Pacific reaching FID and other certain conditions precedent as well as a 5-year offtake agreement for 0.2 MTPA at the Energia Costa Azul Phase 1 of the PALNG facility.1. In addition, we will acquire 30 percent of the equity in Phase 1 of PALNG. Development of PALNG is subject to completing required commercial agreements and resolving a number of risks and uncertainties, obtaining financing and reaching a final investment decision, among other factors. In addition, we securedexecuted additional regasification capacity and services agreements for approximately 1.7 MTPA, including a 15-year throughput agreement for 1.5 MTPA of capacity and a 5-year services agreement for 0.2 MTPA at the GermanGate LNG terminal in Brunsbuttel that will provide access to the German natural gas market.Netherlands. Our marketing efforts are focused on further progressing the placement of our offtake volumes into Europe and Asia.
Energy Response Partnerships
We maintain memberships in several response and containment partnerships across the globe as a key element of our emergency response preparedness program in addition to internal response resources.
Marine Well Containment Company (MWCC)
We are a founding member of the MWCC, a non-profit organization formed in 2010, which provides well containment equipment and technology in the deepwater U.S. Gulf of Mexico. MWCC’s containment system meets the U.S. Bureau of Safety and Environmental Enforcement requirements for a subsea well containment system that can respond to a deepwater well control incident in the U.S. Gulf of Mexico.
Oil Spill Response Limited (OSRL) - Subsea Well Intervention Service (SWIS)
OSRL-SWIS is a non-profit organization in the U.K. that is an industry funded joint initiative providing the capability to respond to subsea well-control incidents. Through our SWIS subscription, ConocoPhillips has access to equipment that is maintained and stored in a response ready state. This provides well capping and containment capability outside the U.S.
Oil Spill Response Removal Organizations (OSROs)
We maintain memberships in several OSROs, across the globe as a key elementmany of our preparedness program in addition to internal response resources. Many of the OSROswhich are not-for-profit cooperatives owned by the member companies wherein we may actively participate as a member of the board of directors, steering committee, work group or other supporting role. In North America, our primary OSROs include the Marine Spill Response Corporation for the continental U.S. and Alaska Clean Seas and Ship Escort/Response Vessel System for the Alaska North Slope and Prince William Sound, respectively. Internationally, we maintain memberships in various OSROs including Oil Spill Response Limited, the Norwegian Clean Seas Association for Operating Companies, Australian Marine Oil Spill Center and Petroleum Industry of Malaysia Mutual Aid Group.
| | | | | |
ConocoPhillips 20222023 10-K | 14 |
Technology
We have several technology programs that improve our ability to develop unconventional reservoirs, increase recoveries from our legacy fields, improve the efficiency of our exploration program, produce heavy oil economically with lower emissions and implement sustainability measures.
LNG Liquefaction
We are the second-largest LNG liquefaction technology provider globally. Our Optimized Cascade® LNG liquefaction technology has been licensed for use in 28 LNG trains around the world, with feasibilityFEED studies ongoing for additional trains.
Low-Carbon Technologies
In 2021, we established a multi-disciplinary Low-Carbon Technologies organization, with the remit to support our net-zero ambition, understand the alternative energy landscape and prioritize opportunities for future competitive investment.
Throughout 2022, we continued We continue our focus on implementing emissions reduction projects across our global portfolio, including productionoperational efficiency measures and methane and flaring reductions. In September 2021,April 2023, we strengthenedaccelerated our 2030 GHG emissions intensity reduction target to 40-50a 50-60 percent reduction by 2030 from a 2016 baseline and expanded the target to apply on both a gross operated and net equity basis. In addition, we set a new near-zero methane intensity target of less than 1.5-kilogram carbon dioxide equivalent per BOE by 2030. We are also on track to meet the World Bank Zero Routine Flaring goal by 2025. To help achieve this goal,these targets, the Low-Carbon Technologies organization workedcontinued to work with the company's business units to begin developingdevelop and implementingimplement region-specific net-zero scenarios identifyingemission reduction initiatives and identify potential technology solutions for hard-to-abate emissions, and piloting new methodsemissions.
Over the last two years, we continued our work to reduce and accelerateidentify additional pathways to abate our Scope 1 and Scope 2 emissions reduction. Potential projects evaluated includedas well as low-carbon opportunities for future competitive investment. For example:
•We conducted CCS and electrification studies, initiated zero/low emission equipment design enhancements, installationsinstalled mechanisms to continuously monitor and detect methane emissions and implemented operational changes to reduce flaring and methane venting volumes.
Within the low-carbon opportunities landscape, the company has prioritized opportunities in CCS and hydrogen. In 2022, weWe evaluated carbon dioxide storage sites primarily along the U.S. Gulf Coast, progressed land acquisition efforts and business development work, initiated permitting activities for a potential appraisal wellwells for carbon sequestration and advanced engineering studies for multiple opportunities.
•We advanced hydrogen opportunities in the U.S., Middle East and Asia Pacific regions. In September 2023, JERA and Uniper announced a non-binding Heads of Agreement together with ConocoPhillips, for the potential sale of ammonia to Uniper. This agreement further advanced our cooperation to potentially develop a low-carbon, ammonia production facility on the U.S. Gulf Coast that would supply low-carbon fuels from the U.S. for use in the U.S., Europe, we continued evaluation of a carbon capture solution to reduce emissions at the operated Teesside Oil Terminal with engineering studiesJapan and a due diligence phase with the United Kingdom's Department for Business, Energy and Industrial Strategy.greater Asia.
Delivery Commitments
We sell crude oil and natural gas from our producing operations under a variety of contractual arrangements, some of which specify the delivery of a fixed and determinable quantity. Our commercial organization also enters into natural gas sales contracts where the source of the natural gas used to fulfill the contract can be the spot market or a combination of our reserves and the spot market. Worldwide, we are contractually committed to deliver approximately 578440 billion cubic feet of natural gas, 345275 million barrels of crude oil and 12.915.9 million megawatt hours of electricity in the future. These contracts have various expiration dates through the year 2030. We expect to fulfill these delivery commitments with third-party purchases, as supported by our gas management and power supply agreements; proved developed reserves;reserves and PUDs. See the disclosure on “Proved Undeveloped Reserves” in the “Supplementary Data - Oil and Gas Operations” section following the Notes to Consolidated Financial Statements, for information on the development of PUDs.
Competition
ConocoPhillips is one of the world’s leading E&P companies based on both production and reserves, with a globally diversified asset portfolio. We compete with private, public and state-owned companies in all facets of the E&P business. Some of our competitors are larger and have greater resources. Each of our segments is highly competitive, with no single competitor, or small group of competitors, dominating.
We compete with numerous other companies in the industry, including state-owned companies, to locate and obtain new sources of supply and to produce oil, bitumen, NGLs and natural gas in an efficient, cost-effective manner. We deliver our production into the worldwide commodity markets. Principal methods of competing include geological, geophysical and engineering research and technology; experience and expertise; equipment and personnel; economic analysis in connection with portfolio management;management and safely operating oil and gas producing properties.
| | | | | |
| 15 | ConocoPhillips 20222023 10-K |
Human Capital Management
Values, Principles and Governance
At ConocoPhillips, our strategy, performance, culture and reputation are fueled by our workforce. We recognize that attracting, retaining, and developing talent is a competitive imperative within our changing industry. Our human capital management (HCM) approach starts with a foundation in our core SPIRIT Values – Safety, People, Integrity, Responsibility, Innovation, and Teamwork. These SPIRIT Values set the tone for how we interact with all of our internal and external stakeholders. We believe a safe organization is a successful organization, and therefore, we prioritize personal and process safety across the company. Our SPIRIT Values are a source of pride. Our day-to-day work is guided by the principles of accountability and performance, which means the way we do our work is as important as the results we deliver. We believe these core values and principles set us apart, align our workforce and provide a foundation for our culture.
Our Executive Leadership Team (ELT) and our Board of Directors play a key role in setting our HCM strategy and driving accountability for meaningful progress. The ELT and Board of Directors engage often on workforce-related topics. Our HCM programs are overseen and administered by our human resources function with support from business leaders across the company.
We depend on our workforce to successfully execute our company’s strategy and we recognize the importance of creating a workplace where our people feel valued. Our HCM programs are built around three pillars that we believe are necessary for success: a compelling culture, attracting a world-class workforce and strong external engagement.valuing our people. Each of these pillars is described in more detail below.
A Compelling Culture
How we do our work is what sets us apart and drives our performance. We’reWe are experts in what we do and continuously find ways to do our jobs better. We value diversityOur different backgrounds, ideas and create an inclusive culture of belonging.views drive our success. Together, we deliver strong performance, but not at all costs. We embrace our core cultural attributes that are shared by everyone, everywhere.
Health, Safety and Environment
Our HSE organization sets expectations and provides tools and assurance to our workforce to promote and achieve HSE excellence. We manage and assure ConocoPhillips HSE policies, standards and practices, to help ensure business activities are consistently safe, healthy and conducted in an environmentally and socially responsible manner across the globe. Each business unit manages its local operational risks with particular attention to process safety, occupational safety and environmental and emergency preparedness risk. Objectives, targets and deadlines are set and tracked annually to drive strong HSE performance. Progress is tracked and reported to our ELT and the Board of Directors. HSE audits are conducted on business units and staff groups to ensure conformance with ConocoPhillips HSE policies, standards and practices where improvement actions are identified and tracked to completion.
We continuously look for ways to operate more safely, efficiently and responsibly. We focus on reducing human error by emphasizing interaction among people, equipment and work processes. By being curious about howWe believe our HSE policies such as Life Saving Rules, Process Safety Fundamentals, safety procedures and our stop work is done, recognizing error-likely situations and applying safeguards, wepolicy can reduce the likelihood and severity of unexpected incidents. We conduct thorough investigations of all serious incidents to understand the root cause and share lessons learned globally to improve our facility designs, procedures, training, maintenance programs and designs. As we integrate various assets through acquisitions, itIt is important that we drive thisan HSE culture of continuous learning and improvement, refine our existing HSE processes and tools and enhance our commitment to safe, efficient and responsible operations.
COVID-19 Response
In 2022, the number of COVID-19 cases across the company was significantly less than the prior two years. With less risk to our operations, the Crisis Management Support Team that had been in place since the beginning of the pandemic, was disbanded in August; however, our Health Services organization continues to monitor the situation and support business units and functions as needed to minimize any potential for business interruption.
Diversity, Equity and Inclusion
As our industry evolves, we will continue to face both new opportunities and challenges, requiring a workforce that is equipped to address this evolution. We also need to cultivate an environment where everyone is encouraged and able to contribute — no matter their role, level or location. This is how innovation thrives, leading to a better business outcome. That is why we have put an emphasis on, and are committed to, elevating DEI and creating a great place to work.
At ConocoPhillips, we believe our unique differences power the future of energy. Our DEI vision is to foster an inclusive culture that values the rich mixture of backgrounds, identities and workstyles of our people, built on equitable practices that support all employees in unlocking their full potential. Our commitment to DEI is foundational to our SPIRIT Values and to achieving our business objectives. All employees play a part in creating and sustaining an inclusive work environment because everyone benefits from DEI.
| | | | | |
ConocoPhillips 20222023 10-K | 16 |
The ELT has ultimate accountability for advancing our DEI commitments through a governance structure that includes a Chief Diversity Officer (CDO), a dedicated DEI organization and a global DEI Council consisting of senior leaders from across the company. The company sets goals and measures progress based on a transparent DEI strategy with four pillars that guide our focus and approach: people, programs and processes, culture and our external brand and reputation. All company leaders are accountable for setting personal DEI goals and advancing DEI through local efforts. Our DEI efforts and progress are regularly reviewed with the Board of Directors.
In 2022, we welcomed our new CDO. Over the course of the year, the CDO established the DEI organization and embarked on a global listening tour to understand the impact of current efforts, areas for improvement and the overall employee experience. Based on the insights and perspectives from employees, the company’s DEI strategy was refreshed. Highlights from our 2022 DEI accomplishments include:
•Reviewing the results of the 2022 Perspectives survey and continuing to integrate the insights into our DEI efforts;
•Staffing the newly established DEI organization;
•Launching our DEI Dashboards 2.0 internally, which feature expanded global and U.S. workforce metrics and industry benchmark data; and
•Hosting our inaugural Black Leadership Symposium to support future leadership diversity in the company.
We continue to actively monitor diversity metrics on a global basis. We are committed to being transparent as we build a more diverse, equitable and inclusive workplace. Tables of 20222023 employee demographics by gender and ethnicity, and by country, are shown below:
20222023 Employees by Gender and Race/Ethnicity
| | Global | | U.S. |
| Male | Female | | White | POC* |
| Global | | | Global | | U.S. |
| Male | | | Male | Female | | White | POC* |
| All Employees | All Employees | 73 | % | 27 | % | | 70 | % | 30 | % | All Employees | 73 | % | 27 | % | | 68 | % | 32 | % |
| All Leadership | All Leadership | 74 | | 26 | | | 77 | | 23 | |
| Top Leadership | Top Leadership | 75 | | 25 | | | 82 | | 18 | |
| Junior Leadership | Junior Leadership | 74 | | 26 | | | 75 | | 25 | |
*"POC" refers to People of Color or racial and ethnic minorities self-reported in the U.S.
| | | | | |
20222023 Employees by Country | Percent of Total |
| U.S. | 66 | % |
| Norway | 1716 | |
| Canada | 9 | |
| |
| Australia | 3 | |
| U.K. | 3 | |
| China | 1 |
| Other Global Locations | 13 | |
| 100 | % |
Attracting A World-Class Workforce
Our HCM approach addresses programs and processes necessary for ensuring we have an engaged workforce with the skills to meet our business needs. We take a holistic view of HCM that addresses each of the critical components of workforce planning. These are described in more detail below.
| | | | | |
17 | ConocoPhillips 2022 10-K |
Recruitment
Our continued success requires a strong global workforce that can contributewith the right skills inacross the right places,globe to achieve our strategic objectives. We recruit extensively for experienced hires with critical skills to help us sustain a broad range of expertise. We also offer university internships across multiple disciplines to attract the best early-career talent. Weand partner with top diversity organizations and universities including Hispanic-serving organizations and Historically Black Colleges and Universities.to create a pipeline for early-career talent. We also recruit extensively for external experienced hiresstrive to supplement our university and internal pipeline. These individuals bring critical skills and help us to maintain a broad range of expertise and experience. We have taken significant steps to embed inclusion into each stepensure equitable practices in every aspect of our recruiting practices, including adapting the way we construct job descriptions to using intentionally diverse interview panels. Werecruitment process and conduct routine talent assessments with leaders to ensure we have the organizational capacity and capabilities to successfully execute our business plans.
We closely monitor recruitment metrics through our internal university and experienced hiretalent dashboards and track voluntary turnover metrics to guide our retention activities.
| | | | | |
20222023 Hiring & Attrition Metrics | Percent of Total |
| U.S. University hire acceptance | 7073 | % |
| U.S. Interns acceptance | 6871 | |
| Diversity hiring - Women | 2927 | |
| Diversity hiring - U.S. POC | 41 | |
| Total voluntary attrition | 64 | |
| | | | | |
| 17 | ConocoPhillips 2023 10-K |
Valuing our People
Employee Engagement and Development
We focus on the engagement and development of our workforce and encourage our employees to build diverse and fulfilling careers withat ConocoPhillips. We develop our workforce through a combination of on-the-job learning, formal training, regular feedback, coaching and mentoring. Skills-based Talent Management Teams (TMTs) guide targeted employee development and career progression by skills, discipline and location. The TMTs help identify our workforce planning needs and assess the availability of critical skill sets within the company. We use a performance management program focused on objectivity, credibility and transparency. The program includes broad stakeholder feedback, real-time monetary and non-monetary recognition and a formal “how” rating to assess behaviors to ensure they align with our SPIRIT Values.
We empower our employees to grow their careers through personal and professional development opportunities, including individual development plans, annual career development conversations with supervisors, a voluntary 360-feedback tool and training on a broad range of technical and professional skills. Succession planning is a top priority for management and the Board of Directors. This work ensures we have the talent available for futurecritical leadership roles and serves to inspire employees to reach their ultimate potential and limit business interruption.
Taking steps to measure and assess employee satisfaction and engagement is at the heart of long-term business success and creating a great place to work for our global workforce. Since 2019, the ConocoPhillips Perspectives Survey has become our primary listening platform for gathering feedback on employee sentiment and promoting our “Who We Are” culture. Our leadership reviews the survey feedback to guide priorities and goals. Our employee feedback strategy is delivered through this annual engagement survey and as needed; shorter ad hoc pulse surveys are leveraged to unlock targeted insights in support of our human capital priorities.
Compensation, Benefits and Well-Being
We offer competitive, performance-based compensation packages and have global equitable pay practices. Our compensation programs are generally comprised of a base pay, the annual Variable Cash Incentive Program (VCIP) and, for eligible employees, the Restricted Stock Unit (RSU) program. From the CEO to the frontline worker, every employee participates in VCIP, our annual incentive program, which aligns employee compensation with ConocoPhillips’ success on critical performance metrics and also recognizes individual performance. Our RSU program is designed to attract and retain employees, reward performance and align employee interest with stockholders by encouraging stock ownership. Our retirement and savings plans are intended to support the financial futures of our employees and are competitive within local markets.
| | | | | |
ConocoPhillips 2022 10-K | 18 |
We routinely benchmark our global compensation and benefits programs to ensure they are competitive, inclusive, aligned with company culture and allow our employees to meet their individual needs and the needs of their families. We provide flexible work schedules and competitive time off, including parental leave policies in many locations. We also offer employees flexibility through the Hybrid Office Work (HOW) program in all of our global locations, which provides eligible employees a combination of work from both office and home. We also provide coverage for families requiring disability support, elder care and childcare, including onsite childcare, where access locally is a challenge.
Our global wellness programs include biometric screenings and fitness challenges designed to educate and promote a healthy lifestyle. All employees have access to our employee assistance program, and many of our locations offer custom programs to support mental well-being.
Compensation Risk Mitigation
We have considered the risks associated with each of our executive and broad-based compensation programs and policies. As part of the analysis, we considered the performance measures we use as well as the different types of compensation, varied performance measurement periods and extended vesting schedules that we utilize under each incentive compensation program. As a result of this review, management concluded that the risks arising from our compensation policies and practices are not reasonably likely to have a material adverse effect on the company. As part of the Board of Directors’ oversight of our risk management programs, the Human Resources Compensation Committee (HRCC) conducts a similar review with the assistance of its independent compensation consultant. The HRCC agrees with management’s conclusion that the risks arising from our compensation policies and practices are not reasonably likely to have a material adverse effect on the company.
We care about our neighbors in the communities in which we operate. We actively support and participate in leadership conferences, trade associations and minority nonprofit organizations.
Our employees make our communities stronger. We are proud to support their generous involvement in local charitable activities through employee volunteerism and giving programs that include United Way campaigns, matching gift contributions and volunteer grants.
While we have been recognized for our ESG and DEI efforts, we know that it takes ongoing commitment to make sustainable progress. | | | | | |
| ConocoPhillips 2023 10-K | 18 |
General
At the end of 2022, we held a total of 1,249 active patents in 49 countries worldwide, including 472 active U.S. patents. During 2022, we received 46 patents in the U.S. and 124 foreign patents. Our products and processes generated licensing revenues of $86 million related to activity in 2022. The overall profitability of any business segment is not dependent on any single patent, trademark, license, franchise or concession.
The environmental information contained in Management’s Discussion and Analysis of Financial Condition and Results of Operations on pages 5456 through 5658 under the captions “Environmental” and “Climate Change” is incorporated herein by reference. It includes information on expensed and capitalized environmental costs for 20222023 and those expected for 20232024 and 2024.2025. Website Access to SEC Reports
Our internet website address is www.conocophillips.com. Information contained on our internet website is not part of this report on Form 10-K.
Our Annual Reports on Form 10-K, Quarterly Reports on Form 10-Q, Current Reports on Form 8-K and any amendments to these reports filed or furnished pursuant to Section 13(a) or 15(d) of the Securities Exchange Act of 1934 are available on our website, free of charge, as soon as reasonably practicable after such reports are filed with, or furnished to, the SEC. Alternatively, you may access these reports at the SEC’s website at www.sec.gov.
| | | | | |
| 19 | ConocoPhillips 20222023 10-K |
Item 1A. Risk Factors
You should carefully consider the following risk factors in addition to the other information included in this Annual Report on Form 10-K. These risk factors are not the only risks we face. Our business could also be affected by additional risks and uncertainties not currently known to us or that we currently consider to be immaterial. If any of these risks or other risks that are yet unknown or currently considered immaterial were to occur, our business, operating results and financial condition, as well as the value of an investment in our common stock, could be materially and adversely affected.
Risks Related to Our Industry
Our operating results, our ability to execute on our strategy and the carrying value of our assets are exposed to the effects of changingvolatile commodity prices or prolonged periods of low commodity prices.
Among the most significant factors impacting the Company’sour revenues, operating results and future rate of growth are the sales prices for crude oil, bitumen, LNG, natural gas and NGL. These prices are tied to market prices that can fluctuate widely, and many of the factors influencing the prices are beyond our control. Between January 2020 and December 2022,For example, over the course of 2023, WTI crude oil prices ranged from a low of a negative $38$67 per barrel in April 2020March to a high of $124$94 per barrel in March 2022.August. Given the volatility in commodity price drivers and the worldwide political and economic environment, including potential economic slowdowns or recessions, unexpected shocks to supply and demand resulting from future global health crises such as well asthose experienced in connection with the COVID-19 pandemic or increased uncertainty generated by recent (and potential future) armed hostilities in various oil-producing regions around the globe, prices for crude oil, bitumen, LNG, natural gas and NGLs may continue to be volatile.
LowProlonged periods of low commodity prices could have a material adverse effect on our revenues, operating income, cash flows and liquidity, and may also affect the amount of dividends we elect to declare and pay on our common stock and the amount of shares we elect to acquire as part of theour share repurchase program and the timing of such acquisitions. Lower prices may also limit the amount of reserves we can produce economically, thus adversely affecting our proved reserves and reserve replacement ratio and accelerating the reduction in our existing reserve levels as we continue production from upstream fields. Prolonged depressed prices may affect strategic decisions related to our operations, including decisions to reduce capital investments or curtail operated production.
Significant reductions in crude oil, bitumen, LNG, natural gas and NGL prices could also require us to reduce our capital expenditures, impair the carrying value of our assets or discontinue the classification of certain assets as proved reserves. Although it is not reasonably practicable to quantify the impact of any future impairments or estimated change to our unit-of-production rates at this time, our results of operations could be adversely affected as a result.
Unless we successfully develop resources, the scope of our business will decline, resulting in an adverse impact to our business.
As we produce crude oil, bitumen, natural gas and NGLs from our existing portfolio, the amount of our remaining reserves declines. If we aredo not successful in replacingsuccessfully replace the resources we produce with good prospects for future organic development or through acquisitions, our business will decline. In addition, our ability to successfully develop our reserves is dependentdepends on our achievement of a number of factors,operational and strategic objectives, some aspects of which are beyond our control, including our ability to successfully navigatenavigating political and regulatory challenges to obtain and renew rights to develop and produce hydrocarbons; our success at reservoir optimization; our ability to bringbringing long-lead time, capital intensive projects to completion on budget and on schedule; and our ability to efficiently and profitably operateoperating mature properties. If we are not successful in developing the resources in our portfolio, our financial condition and results of operations may be adversely affected.
The exploration and production of oil and gas is a highly competitive industry.
The exploration and production of crude oil, bitumen, natural gas and NGLs is a highly competitive business. We compete with private, public and state-owned companies in all facets of the exploration and production business, including to locate, acquire and obtaindevelop new sources of supply and to produce crude oil, bitumen, natural gas and NGLs in an efficient, cost-effective manner. In addition, as the energy transition progresses, we anticipate the oil and gas industry will face additional competition from alternative fuels. We must also compete for the materials, equipment, services, employees and other personnel (including geologists, geophysicists, engineers and other specialists) necessary to conduct our business. If we are not successful in ourany facet of this competition, our financial condition and results of operations may be adversely affected.
| | | | | |
ConocoPhillips 20222023 10-K | 20 |
Our ability to successfully execute on our energy transition plans is subject to a number of risks and uncertainties and may be costly to achieve.
In 2020, we announced our Paris-aligned climate risk framework, including an ambition to achieve net-zero emissions on operational emissions by 2050. In 2022, we published our Plan for the Net-Zero Energy Transition (the “Plan”) and continued to set increasingly ambitious targets around operational GHG emissions intensity and reducing methane emissions and flaring. Our ability to achieve stated targets, goals and ambitions is subject to a number of risks and uncertainties out of our control, including the pace of development of currently undeveloped technologies,government policies and markets, as well as potential regulations that may impair our ability to execute on current or future plans. Such achievement also depends on the accelerated pace of development of effective emissions measurement and abatement technologies, and the actual pace of development may be inadequate, or the technologies actually developed may be insufficient. Furthermore, we are still in the planning stages, and the Plan's execution could be costly, andmay have unforeseen obstacles.obstacles, may proceed at varying paces during the timeframe allotted for the Plan and may be accomplished in a manner that we cannot predict at this time. We may be required to purchase emission credits in the future, and there may be an insufficient supply of offsets to achieve our goals.goals, or we could incur increasingly greater expenses related to our purchase of such offsets. As advanced technologies are developed to accurately measure emissions, we may be required to revise our emissions estimates and reduction goals.goals or otherwise revise our strategies outlined in the Plan. We may be adversely affected and potentially need to reduce economic end-of-field life of certain assets and impair associated net book value due to the emissions intensity of some of our assets. Even if we meet our goals, our efforts may be characterized as insufficient.
In 2021, we established our Low-Carbon Technologies organization to identify and evaluate business opportunities that address end-use emissions and early-stage low-carbon technology opportunities that would leverage our existing expertise and adjacencies. Our investments in these technologies may expose us to numerous financial, legal, operational, reputational and other risks. While we perform a thorough analysis on these investments, the related technologies and markets are at early stages of development and we do not yet know what rate of return we will achieve.achieve, if any. Furthermore, we may not be able to deploy such technologies at a commercial scale. The success of our low-carbon strategy will depend in part be dependent upon the cooperation of government agencies, the support of stakeholders, the success of our ability to research and forecast potential investments, and our ability to apply our existing strengths and expertise.expertise to new technologies, projects and markets.
AnyEstimates of crude oil, bitumen, natural gas and NGL reserves are imprecise and may be subject to revision, and any material change in the factors and assumptions underlying our estimates of crude oil, bitumen, natural gas and NGL reserves could impair the quantity and value of those reserves.
Our proved reserve information included in this annual report represents management’s best estimates based on assumptions, as of a specified date, of the volumes to be recovered from underground accumulations of crude oil, bitumen, natural gas and NGLs. Such volumes cannot be directly measured, and the estimates and underlying assumptions used by management are subject to substantial risk and uncertainty. Any material changes in the factors and assumptions underlying our estimates of these items could result in a material negative impact to the volume of reserves reported or could cause us to incur impairment expenses on property associated with the production of those reserves. Future reserve revisions could also result from changes in, among other things, governmental regulation and commodity prices. For more information on estimates used, see the "Critical Accounting Estimates" section of Management's Discussion and Analysis of Financial Condition and Results of Operations. Our business may be adversely affected by price controls,controls; government-imposed limitations on production or exports of crude oil, bitumen, LNG, natural gas and NGLs,NGLs; or the unavailability of adequate gathering, processing, compression, transportation, and pipeline facilities and equipment for our production of crude oil, bitumen, natural gas and NGLs.
As discussed herein, our operations are subject to extensive governmental regulations.regulations across numerous jurisdictions. From time to time, regulatory agencies have imposed price controls and limitations on production by restricting the rate of flow of crude oil, bitumen, natural gas and NGL wells below actual production capacity. Similarly, in response to increased domestic energy costs, circumstances determined to be in the economic interest of the country, or a declared national emergency, governments could restrict the export or import of our products which would adversely impact our business. Because legal requirements are frequently changed and subject to interpretation, we cannot predict whether future restrictions on our business may be enacted or become applicable to us.
| | | | | |
| 21 | ConocoPhillips 2023 10-K |
Our ability to sell and deliver the crude oil, bitumen, LNG, natural gas and NGLs that we produce also depends on the availability, proximity, and capacity of gathering, processing, compression, transportation and pipeline facilities and equipment, as well as any necessary diluents to prepare our crude oil, bitumen, LNG, natural gas and NGLs for transport. Furthermore, we rely on there being sufficient facilities and takeaway capacity to support our commitment to reduce routine flaring. The facilities, equipment and diluents we rely on may be temporarily unavailable to us due to market conditions, extreme weather events, permitting delays and other regulatory reasons,matters, mechanical reasons or other factors or conditions, many of which are beyond our control. In addition, in certain newer plays, the capacity of necessary facilities, equipment and diluents may not be sufficient to accommodate production from existing and new wells, and construction and permitting delays, permitting costs and regulatory or other constraints could limit or delay the construction, manufacture or other acquisition of new facilities and equipment. If any facilities, equipment or diluents, or any of the transportation methods and channels that we rely on become unavailable for any period of time, we may incur increased costs to transport our crude oil, bitumen, LNG, natural gas and NGLs for sale, orsale; we may be forced to curtail our production of crude oil, bitumen, natural gas or NGLs.
| | | | | |
21 | ConocoPhillips 2022 10-K |
NGLs or we may not be able to meet all the objectives in the Plan, such as reducing routine flaring. Our ability to manage risk or influence outcomes in joint ventures may be constrained.
We conduct many of our operations through joint ventures in which another joint venture partner is operator or we may not have majority control. In these cases, the economic, business, or legal interests or goals of the operator or the voting majority may be inconsistent with ours, and we may not be able to influence the decision making or outcomes to align with our interests or goals. Failure by an operator or a voting majority, with whom we have a joint venture interest, to adequately manage the risks associated with any operations could have an adverse effect on the financial condition or results of operations of our joint ventures and, in turn, our business and operations.
Our operations presentare subject to hazards and risks that require significant and continuous oversight.
The scope and nature of ourOur operations presentare subject to a variety of significant hazards and risks including operational hazardsthat require significant and riskscontinuous oversight, such as the monitoring, prevention or mitigation of or protection from explosions, fires, product spills, severe weather, geological events, global health crises, such as epidemics and pandemics, labor disputes, geopolitical tensions, armed hostilities, terrorist or piracy attacks, sabotage, civil unrest or cyberattacks. Our operations are subject to the additional hazards concerning exposure to and potential release of pollution,pollutants and toxic substances, andas well as other environmental hazards and risks. OffshoreFor example, offshore activities may pose incrementally greater risks because of complex subsurface conditions such as higher reservoir pressures, water depths and metocean conditions. All such hazards could result in loss of human life, significant property and equipment damage, environmental pollution, impairment of operations, substantial losses to us and damage to our reputation. Our business and operations may be disrupted if we do not respond, or are perceived not to respond, in an appropriate manner to any of these hazards and risks or any other major crisis or if we are unable to efficiently restore or replace affected operational components and capacity. Countermeasures to address global health crises, epidemics or pandemics, including future outbreaks of COVID-19, may result in reduced demand for our products; disruptions to our supply chain, the global economy or financial or commodity markets; disruptions in our contractual arrangements with our service providers, suppliers and other counterparties; failures by our suppliers, contract manufacturers, contractors, joint venture partners and external business partners, to meet their obligations to us; reduced workforce productivity; and voluntary or involuntary curtailments. Further, our insurance may not be adequate to compensate us for all resulting losses described above, and the cost to obtain adequate coverage may increase for us in the future or may not be available.
In addition, although we design and operate our business operations to accommodate expected climatic conditions, to the extent there are significant changes in the earth's climate, such as more severe or frequent weather conditions in the markets where we operate or the areas where our assets reside, we could incur increased expenses, our operations and supply chain could be adversely impacted and demand for our products could fall.
Our business has been, and may continue to be, adversely affected by the coronavirus (COVID-19) pandemic.
The COVID-19 pandemic and the measures put in place to address it negatively impacted the global economy, disrupted global supply chains, reduced global demand for oil and gas and created significant volatility and disruption of financial and commodity markets.
Our business was adversely impacted by the COVID-19 pandemic and may be impacted again in the future depending on the scope and severity of current or future outbreaks. Potential impacts to our business could include, but are not limited to, reduced demand for our products, disruptions to our supply chain, disruptions in our contractual arrangements with our service providers, suppliers and other counterparties, failures by our suppliers, contract manufacturers, contractors, joint venture partners and external business partners, to meet their obligations to us, reduced workforce productivity, and voluntary or involuntary curtailments to support oil prices or alleviate storage shortages for our products.
Any of these factors, or other cascading effects of the COVID-19 pandemic that are not currently foreseeable,such factors, could materially increase our costs,costs; negatively impact our revenues or ability to implement and advance the Plan; and damage our financial condition, results of operations, cash flows and liquidity position. The full extent and duration of any such impacts cannot be predicted at this time because of the lack of certainty surrounding the pandemic.their sources, causes and outcomes.
| | | | | |
ConocoPhillips 20222023 10-K | 22 |
Legal and Regulatory Risks
We expect to continue to incur substantial capital expenditures and operating costs as a result of our compliance with existing and future environmental laws and regulations.
Our business is subject to numerous laws and regulations relating to the protection of the environment, which are expected to continue to have an increasing impact on our operations. For a description of the most significant of these environmental laws and regulations, see the “Contingencies—Environmental”,“—Climate Change” and “Contingencies—Climate Change”"—Company Response to Climate-Related Risks"sections of Management’s Discussion and Analysis of Financial Condition and Results of Operations. These laws and regulations continue to increase in both number and complexity and affect our operations with respect to, among other things: •Permits required in connection with exploration, drilling, production and other activities, including those issued by national, subnational, and local authorities;
•The discharge of pollutants into the environment;
•Emissions into the atmosphere, such as nitrogen oxides, sulfur dioxide, mercury and GHG emissions, including methane;
•Carbon taxes;
•The handling, use, storage, transportation, disposal and cleanup of hazardous materials and hazardous and nonhazardous wastes;
•The dismantlement, abandonment and restoration of historic properties and facilities at the end of their useful lives; and
•Exploration and production activities in certain areas, such as offshore environments, arctic fields, oil sands reservoirs and unconventional plays.
We have incurred and will continue to incur substantial capital, operating and maintenance, and remediation expenditures as a result of these laws and regulations. In addition, to the extent these expenditures are assumed by a buyer as a result of a disposition, it may result in our incurring substantial costs if the buyer is unable to satisfy these obligations. Any actual or perceived failure by us to comply with existing or future laws, regulations and other requirements could result in administrative or civil penalties, criminal fines, other enforcement actions or third-party litigation against us. To the extent these expenditures, as with all costs, are not ultimately reflected in the prices of our products, our business, financial condition, results of operations and cash flows in future periods as well as our ability to implement and advance the Plan could be adversely affected.
Existing and future laws, regulations and internal initiatives relating to global climate change, such as limitations on GHG emissions, may impact or limit our business plans, result in significant expenditures, promote alternative uses of energy or reduce demand for our products.
Continuing political and societal attention to the issue of global climate change has resulted in both existing and pending international agreements and national, regional or local legislation and regulatory measures to limit GHG emissions, such as cap and trade regimes, specific emission standards, carbon taxes, restrictive permitting, increased fuel efficiency standards, and incentives or mandates for renewable and alternative energy. Although we may support the intent of legislative and regulatory measures aimed at addressing climate-related risks, the specifics of how and when they are enacted could result in a material adverse effect to our business, financial condition, results of operations and cash flows in future periods.periods as well as our ability to implement and advance the Plan.
For example, in November 2021,December 2023, the U.S. Environmental Protection AgencyEPA published a Proposed Rule (revised and republished as a Supplemental Proposal in November 2022)final rule that would reviserevises the regulations governing, among other things, the emission of GHGmethane and volatile organic compounds from new oil and gas production facilities, and emission guidelines for states to use when revising Clean Air Act implementation plans to limit GHGmethane emissions from existing oil and gas facilities. While the form and substance of the regulation is not yetThe final the new regulationrule could result in additional capital expenditures and compliance, operating and maintenance costs, any of which may have an adverse effect on our business and results of operations.
Additionally, in 2022,2023, the U.S. joined the international community at the 27th28th Conference of the Parties (COP27). At the conclusion of COP27,(COP28), where the U.S. and nearly 200 other countries, including most of the other countries in which we operate, renewed solidaritytheir commitment to deliver on the outstanding elementsaims of the 2015 Paris Agreement andAgreement. COP28 included a decision on the Glasgow Climate Pact agreedworld's first 'global stocktake' to atratchet up climate action before the 26th Conferenceend of the Partiesdecade — including a goal to triple renewable energy capacity by 2030 — and for the first time its final agreement explicitly recommended "transitioning away from fossil fuels in 2021.the energy system." The implementation of current agreements and regulatory measures, as well as any future agreements or measures addressing climate change and GHG emissions, may adversely increase our capital and operating expenses,
| | | | | |
| 23 | ConocoPhillips 2023 10-K |
impact the demand for our products, impose taxes on our products or operations, or
| | | | | |
23 | ConocoPhillips 2022 10-K |
require us to purchase emission credits or reduce emissions of GHGs from our operations. For example, in August 2022, the U.S. enacted the Inflation Reduction Act of 2022, which includes a charge on methane emissions from selected facilities in the oil and gas industry, including many of the facilities operated by ConocoPhillips. As a result, we may experience declines in commodity prices or incur substantial capital expenditures and compliance, operating, maintenance and remediation costs, any of which may have an adverse effect on our business and results of operations.
Broader investor and societal attention to and efforts to address global climate change may limit who can do business with us or our access to capitalfinancial markets and could subject us to litigation.
Increasing attention to global climate change has also resulted in pressure from and upon stockholders, financial institutions and other financial market participants to modify their relationships with oil and gas companies and topotentially limit or discontinue investments, insurance and funding to suchoil and gas companies. For example, a significant number of financial institutions are now members of the Glasgow Financial Alliance for Net Zero (GFANZ), thereby pledging to the goal of net zero by 2050, on scope 1, 2 and 3 emissions, as well as setting interim targets for 2030 or earlier. While GFANZ membersthey are not prohibited from having relationshipsdoing business with oil and gas companies, they are facing intense scrutiny for providing any sort of financial support to such companies, which may lead to greater restrictions on GFANZ members in the future.may self-impose limits. Conversely, we also face pressure from some in the investment community and certain public interest groups to limit the focus on ESG in our decision-making.decision-making, arguing that ESG considerations do not relate to financial outcomes. As public pressure continues to mount our access to capital on terms we find favorable (if it is available at all) may be limited, andthe financial sector, our costs of capital may increase, our reputation could be damaged, and our business and results of operations may be otherwise adversely affected.increase.
Furthermore, increasing attention to global climate change has resulted in an increased likelihood of governmental investigations and private litigation, which could increase our costs or otherwise adversely affect our business. Beginning in 2017 and continuing through 2023, cities, counties, governments and other entities in several states/territories in the U.S. have filed lawsuits against oil and gas companies, including ConocoPhillips, seeking compensatory damages and equitable relief to abate alleged climate change impacts. Additional lawsuits with similar allegations are expected to be filed. The amounts claimed by plaintiffs are unspecified and the legal and factual issues involved in these cases are unprecedented. ConocoPhillips believes these lawsuits are factually and legally meritless, and are an inappropriate vehicle to address the challenges associated with climate change and will vigorously defend against such lawsuits. The ultimate outcome and impact to us cannot be predicted with certainty, and we couldexpect to incur substantial legal costs associated with defending these and similar lawsuits in the future. We could also receive lawsuits alleging a failure or lack of diligence to meet our publicly stated ESG goals, or alleging misrepresentation related to our ESG activity.
Political and economic developments could damage our operations and materially reduce our profitability and cash flows.
Actions of the U.S., state, local and foreign governments, through sanctions, tax and other legislation, executive orders and commercial restrictions, could reduce our operating profitability both in the U.S. and abroad. In certain locations, restrictions on our operations; leasing restrictions; special taxes or tax assessments; and payment transparency regulations that could require us to disclose competitively sensitive information or might cause us to violate non-disclosure laws of other countries have been imposed or proposed by governments or certain interest groups. In addition, we may face regulatory changes in the U.S. including, but not limited to, the enactment of tax law changes that adversely affect the fossil fuel industry, new methane emissions standards, restrictiverequirements restricting or prohibiting flaring requirements, and subsurface water disposal, more stringent environmental impact studies and reviews. We also cannot rule out the possibility of similarreviews and policies inhibiting or curtailing LNG exports. Similar regulatory shifts, andincluding attendant costhigher costs and market access implicationsconstraints, may also occur in other international jurisdictions.jurisdictions in which we operate.
One area subject to significant political and regulatory activity is the use of hydraulic
Hydraulic fracturing, an essential completion technique that facilitates production of oil and natural gas otherwise trapped in lower permeability rock formations.formations, has historically attracted political and regulatory scrutiny. A range of local, state, federal and national laws and regulations currently govern, constrain or in some hydraulic fracturing operations, prohibit hydraulic fracturing in some jurisdictions. Although hydraulic fracturing has been conducted safely for many decades, a number of new laws, regulations and permitting requirements are under consideration which could result in increased costs, operating restrictions, operational delays or could limit the ability to develop oil and natural gas resources. Certain jurisdictions in which we operate have adopted or are considering regulations that could impose newNew or more stringent permitting, disclosure or other regulatory requirements on hydraulic fracturing or other oil and natural gas operations, including subsurface water disposal.disposal, could result in increased costs, operating restrictions or operational delays or could limit the ability to develop oil and natural gas resources.
In addition, certain interest groups have also proposed ballot initiatives, contested lease sales and challenged project permits, for example, to restrict oil and natural gas development generally as well as specific projects, including the
| | | | | |
ConocoPhillips 20222023 10-K | 24 |
In addition, certain interest groups have also proposed ballot initiatives and constitutional amendments designed to restrict oil and natural gas development generally and hydraulic fracturingWillow project in particular.Alaska. In the event that ballot initiatives, local, state, or national restrictions or prohibitions are adopted and result in more stringent limitations on the production and development of oil and natural gas in areas where we conduct operations, we may incur significant costs to comply with such requirements or may experience delays or curtailment in the permitting or pursuit of exploration, development or production activities. Such compliance costs and delays, curtailments, limitations or prohibitions could have a material adverse effect on our business, prospects, results of operations, financial condition, liquidity and liquidity.ability to implement and advance the Plan.
Local politicalPolitical and economic factors in international markets could have a material adverse effect on us.
Approximately 3231 percent of our hydrocarbon production was derived from production outside the U.S. in 2022,2023, and 3233 percent of our proved reserves, as of December 31, 2022,2023, were located outside the U.S. We are subject to risks associated with our operations in foreign jurisdictions and international markets, including changes in foreign governmental policies relating to crude oil, bitumen, LNG, natural gas or NGL pricing and taxation,taxation; other political,regulatory or economic or diplomatic developments (including the macro effects of international trade policies and disputes), potentially; disruptive geopolitical conditions, and international monetary and currency rate fluctuations. For example, in December 2022, in response to higher energy prices resulting from the conflict between Russia and Ukraine, in December 2022, Australia’s Parliament passed legislation setting a one-year price cap on natural gas. Further legislation was introduced in 2023 that extends the price cap through to at least June 2025, subject to further review and certain exemptions. Restrictions on production of oil and gas could increase to the extent governments view such measures as a viable approach for pursuing national and global energy security and climate policies. The escalation of geopolitical tension in the Middle East in late 2023 and early 2024 underscores the continued relevance of this consideration. In addition, some countries where we operate lack a fully independent judiciary system. This, coupled with changes in foreign law or policy, results in a lack of legal certainty that exposes our operations to increased risks, including increased difficulty in enforcing our agreements in those jurisdictions and increased risks of adverse actions by local government authorities, such as expropriations. Actions by host governments, such as the expropriation of our oil assets by the Venezuelan government, have affected operations significantly in the past and may continue to do so in the future.
In addition, the U.S. government has the authority to prevent or restrict us from doing business in foreign jurisdictions or with certain parties. These restrictions and similar restrictions imposed by foreign governments have in the past limited our ability to operate in, or gain access to, opportunities in various jurisdictions. Diplomatic relations or policies between the U.S. government and one or more foreign jurisdictions may impair our ability to collect awards in legal actions against such foreign jurisdictions. Changes in domestic and international policies and regulations may also restrict our ability to obtain or maintain licenses or permits necessary to operate in foreign jurisdictions, including those necessary for drilling and development of wells. Similarly, the declaration of a “climate emergency” could result in actions to limit exports of our products and other restrictions.
Any of these actions could adversely affect our business or operating results.results, including our ability to implement and advance the Plan.
Other Risk Factors Facing our Business or Operations
We may need additional capital in the future, and it may not be available on acceptable terms or at all.
We have historically relied primarily upon cash generated by our business to fund our operations and strategy; however, we have also relied from time to time on access to the capital markets for funding. There can be no assurance that additional financing will be available in the future on acceptable terms or at all. In addition, although we anticipate we will be able to repay our existing indebtedness when it matures or in accordance with our stated plans, there can be no assurance we will be able to do so. Our ability to obtain additional financing or refinance our existing indebtedness when it matures or in accordance with our plans, will be subject to a number of factors, including market conditions, our operating performance, investor sentiment, risks impacting financial institutions and the credit markets more broadly and financial institution policies regarding the oil and gas industry. If we are unable to generate sufficient funds from operations or raise additional capital for any reason, our business could be adversely affected.
In addition, we are regularly evaluated by the major rating agencies based on a number of factors, including our financial strength and conditions affecting the oil and gas industry generally. We and other industry companies have had our ratings reduced in the past due to negative commodity price outlooks. These major rating agencies are now considering ESG attributes when assessing credit profiles. While these assessments have limited impact today, they have the potential to pressure credit ratings over time. Any downgrade in our credit rating or announcement that our credit rating is under review for possible downgrade could increase the cost associated with any additional indebtedness we incur.
| | | | | |
| 25 | ConocoPhillips 20222023 10-K |
Our business may be adversely affected by deterioration in the credit quality of, or defaults under our contracts with, third-parties with whom we do business.
The operation of our business requires us to engage in transactions with numerous counterparties operating in a variety of industries, including other companies operating in the oil and gas industry. These counterparties may default on their obligations to us as a result of operational failures or a lack of liquidity, or for other reasons, including bankruptcy. Market speculation about the credit quality of these counterparties, or their ability to continue performing on their existing obligations, may also exacerbate any operational difficulties or liquidity issues they are experiencing. Any default by any of our counterparties may result in our inability to perform our obligations under agreements we have made with third-parties or may otherwise adversely affect our business or results of operations. In addition, our rights against any of our counterparties as a result of a default may not be adequate to compensate us for the resulting harm caused or may not be enforceable at all in some circumstances. We may also be forced to incur additional costs as we attempt to enforce any rights we have against a defaulting counterparty, which could further adversely impact our results of operations.
Our ability to execute our capital return program is subject to certain considerations.
In December 2021, we initiated a three-tier capital return program that consists of our ordinary dividend, share repurchases and a variable return of cash (VROC).
Ordinary dividends are authorized and determined by our Board of Directors in its sole discretion and depend upon a number of factors, including:
•Cash available for distribution;
•Our results of operations and anticipated future results of operations;
•Our financial condition, especially in relation to the anticipated future capital needs of our properties;
•The level of distributions paid by comparable companies;
•Our operating expenses; and
•Other factors our Board of Directors deems relevant.
VROC distributions are also authorized and determined by our Board of Directors in its sole discretion and depend upon a number of factors, including:
•The anticipated level of distributions required to meet our capital returns commitment;
•Forward prices;
•The amount of cash we hold;
•Total yield; and
•Other factors our Board of Directors deems relevant.
We expect to continue to pay a quarterly ordinary dividend to our stockholders. In addition, based on the current environment, we anticipate also paying a quarterly VROC to our shareholders staggered from the ordinary dividend payment, resulting in up to eight cash distributions to shareholders throughout the year;shareholders; however, the amount of dividends and VROC is variable and will depend upon the above factors, and our Board of Directors may determine not to pay a dividend or VROC in a quarter or may cease declaring a dividend or VROC at any time. For example,Since the inception of the three-tier return of capital program, the VROC has both increased and decreased across quarters, and it may continue to fluctuate in October 2022, we paid a VROC of $1.40 per share, and in January 2023, we paid a VROC of $0.70 per share.the future.
Additionally, as of December 31, 2022, $21.62023, $16.2 billion of repurchase authority remained of the $45 billion share repurchase program our Board of Directors had authorized. Our share repurchase program does not obligate us to acquire a specific number of shares during any period, and our decision to commence, discontinue or resume repurchases in any period will depend on the same factors that our Board of Directors may consider when declaring dividends, among other factors. In the past we have suspended our share repurchase program in response to market downturns, including as a result of the oil market downturn that began in early 2020, and we may do so again in the future.
Any downward revision in the amount of our ordinary dividend or VROC or the volume of shares we purchase under our share repurchase program could have an adverse effect on the market price of our common stock.
| | | | | |
ConocoPhillips 20222023 10-K | 26 |
There are substantial risks with any acquisitions or divestitures we have completed or that we may choose to undertake.
We regularly review our portfolio and pursue growth through acquisitions and seek to divest noncore assets or businesses. We may not be able to complete these transactions on favorable terms, on a timely basis, or at all. Even if we do complete such transactions, our cash flow from operations may be adversely impacted or otherwise the transactions may not result in the benefits anticipated due to various risks, including, but not limited to (i) the failure of the acquired assets or businesses to meet or exceed expected returns, including risk of impairment; (ii) the inability to dispose of noncore assets and businesses on satisfactory terms and conditions; and (iii) the discovery of unknown and unforeseen liabilities or other issues related to any acquisition for which contractual protections are inadequate or we lack insurance or indemnities, including environmental liabilities, or with regard to divested assets or businesses, claims by purchasers to whom we have provided contractual indemnification. In addition, we may face difficulties in integrating the operations, technologies, products and personnel of any acquired assets or businesses.
Our technologies, systems and networks may beare subject to cybersecurity threats.
Our business like others within the oil and gas industry, is faced with growing cybersecurity threats as we increasingly rely on digital technologies across our business. Cybersecurity risks to our business, some of which are managed byincluding our suppliers, third-party service providers, on whom we rely to help us collect, host or process information. As a result, we face various cybersecurity threats, both internalcontractors, joint venture partners and external such as attempts to gain unauthorizedbusiness partners, include but are not limited to:
•Unauthorized access to, or control of or disclosure of sensitive information about our operationsbusiness and our employees, attempts toemployees;
•Compromise of our data or systems, including corruption, sabotage, encryption or acts that otherwise render our data or systems unusable (or those of third-parties with whom we do business, including third-party cloud and ITinformation technology (IT) service providers) corrupted;
•Theft or unusable, threatsmanipulation of our proprietary information;
•Ransom;
•Extortion;
•Threats to the security of our facilities and infrastructure as well as those of third-parties with whom we do business, including third-party cloudinfrastructure; and IT service providers, and attempted cyber
•Cyber terrorism.
Cybersecurity threats could affect the security of our data and proprietary information housed internally and on third-party IT systems, including the cloud. A successful attack may result in gaining unauthorized access to, or control of, and disclosure of sensitive information about our operations and our employees and/or partners; attempts to corrupt, sabotage, or render our data or systems (or those of third parties with whom we do business, including third-party cloud and IT service providers) unusable; theft or manipulation of our proprietary business information, whether from insiders or external threat actors; and cyberextortion for the return of data. The impact to our data could subject our company to potential reputational damage, legal liability, regulatory fines and penalties, and increased compliance costs.
In addition, cybersecurity threats could also disrupt our oil and gas operations both domestically and abroad given that computers aid to control production, our equipment and monitor our distribution systems globally and are necessary to deliver our production to market. A disruption, failure, or a cyberattack of these operating systems, or of the networks, software and infrastructure on which they rely, many of which are not owned or operated by us, could damage production, distribution or storage assets, delay or prevent delivery to markets, make it difficult or impossible to accurately account for production and settle transactions, or negatively impact public health or safety, economic security, or national security.
Although we have experienced occasional cybersecurity threats, none have currently had a material effect on our business, operations or reputation. We will comply with government-imposed security requirements to implement specific mitigation measures to protect against cybersecurity threats to our information and operational technology. In addition, we must continually expend additional resources to continue to modify or enhance our protective measures or to investigate and remediate any vulnerabilities detected. We maintain an extensive network of technical security procedures and controls, training, and policy enforcement mechanisms to monitor and mitigate security threats and to increase security for our information, facilities and infrastructure. Despite our ongoing investments in security resources, talent and business practices, we are unable to assure that any security measures, or measures implemented by third parties, will be completely effective.
If our systems and infrastructure were to be breached, damaged or disrupted, we could be subject to serious negative consequences, including disruption of our operations, damage to our reputation, a loss of employee and/or third party trust, reimbursement or other costs, increased compliance costs, litigation exposure and legal liability or regulatory fines, penalties or intervention. In addition, we have exposure to cybersecurity incidents and the negative impacts of such incidents related torisks where our data and proprietary information housed onare collected, hosted, and/or processed by third-party IT systems, including the cloud. Any of these could materiallycloud and adversely affect our business, results of operations or financial condition, and any of the foregoing canservice providers. Our risks may be exacerbated by a delay or failure to detect a cybersecurity incident or understand the full extent of such incident notwithstanding reasonable security proceduresour risk management processes and controls. The prevalenceWe face risks associated with new and ever-increasing phishing techniques, hidden malware, as well as risks associated with electronic data proliferation and technology digitization. We also face increased risk with the increased sophistication of remote work has introduced additionalGenerative Artificial Intelligence capabilities, which may improve or expand the existing capabilities of cybercriminals described above in a manner we cannot predict at this time.
Our increasing reliance on IT in our production, distribution and marketing systems may allow cybersecurity threats to disrupt our oil and gas operations, both domestically and abroad. | | | | | |
27 | ConocoPhillips 2022 10-K |
If our data, IT, operational technology (OT), including industrial control and supervisory control and data acquisition (SCADA) systems were to be breached, damaged or disrupted due to a cybersecurity incident or cyber-attack (directly, indirectly through third-parties or through the IT networks, servers, software, or infrastructure on which they rely), we could be subject to serious negative consequences. These consequences could include physical damage to production, distribution or storage assets; delay or prevention of delivery to markets; disruption or prevention of accurate accounting for production and settlement of transactions; negative impacts on public health, safety, the environment, economic security, or national security; financial impacts; business interruption; reputational damage; loss of employee, supplier, contractor, partner and/or public trust; reimbursement or other costs; increased compliance costs; regulatory investigations; litigation exposure and legal liability or regulatory fines; penalties or other external intervention. cybersecurity risk. Although we have business continuity plans in place, our operations may be adversely affected by significant and widespread disruption to our systems and infrastructure that support our business. While we continue to evolve and modify our business continuity plans, there can be no assurance that they will be completely effective in avoiding disruption and business impacts. Further, our insuranceability to insure against cybersecurity risks may not be adequate to compensate us for all resulting losses,limited by the availability and the cost to obtain adequate coverage may increase for us in the future.increasing expense of sufficient coverage.
| | | | | |
| 27 | ConocoPhillips 2023 10-K |
Item 1B. Unresolved Staff Comments
None.
Item 1C. Cybersecurity
Cybersecurity Risk Management and Strategy
Cybersecurity Risk Assessment and Management
We take a multilayered approach to cybersecurity risk management and strategy. Our IT/OT Security Program integrates administrative, technical, and physical controls against evolving cybersecurity threats, and includes enterprise IT and OT security architecture, cybersecurity operations, data privacy and governance, supply chain security, and governance, risk, and compliance. Additionally, it is designed to identify, assess, and manage cybersecurity risks and protect the confidentiality, integrity, and availability of our data, IT, and OT.
Cybersecurity is a component of our IT/OT Security Program, which we periodically review and adapt to respond to new and evolving circumstances, cybersecurity threats and regulations. We evaluate security, privacy, and resiliency risks, including those related to cybersecurity, in our overall Enterprise Risk Management (ERM) program's annual risk assessment process. This annual risk assessment process takes into account broader risks based on likelihood, potential consequences, and mitigations, such as operational and economic impact; health, safety and environmental impact; and reputational and financial implications. This risk assessment is discussed with members of the ELT, Audit and Finance Committee (AFC) of the Board of Directors, and Board of Directors on at least an annual basis.
We consult recognized security frameworks, such as the National Institute of Standards and Technology Cybersecurity Framework to organize, improve, and assess our IT/OT Security Program to manage and reduce cybersecurity risk. We deploy, configure, and maintain various technologies designed to enforce security policies, detect and protect against cybersecurity threats, and help safeguard IT and OT assets. We operate a Cybersecurity Operation Center (CSOC) to ingest threat intelligence, monitor cybersecurity threats, coordinate incident response resources and manage response times.
Our Global Computer Security Incident Response Plan (CSIRP) establishes the framework for our response to cybersecurity incidents. Under the CSIRP, cybersecurity incidents are escalated based on a defined incident categorization to the Chief Information Security Officer (CISO) and senior leaders, including the Chief Digital & Information Officer (CD&IO), General Counsel, Chief Financial Officer, and other cybersecurity program stakeholders, such as the AFC and/or the full Board of Directors. We also conduct incident response exercises at least annually, which are facilitated by internal team members and, in some instances, with assistance from third-party experts.
Physical controls are designed to work in conjunction with digital and cybersecurity controls to help protect the Company’s IT and OT assets from physical threats. Our Chief Security Officer is responsible for a physical security program including site plans, cameras, security systems monitoring, and access control and badging systems to manage physical security risks.
Our governing policies, standards and procedures create a structured approach to managing cybersecurity risk. Information security requirements for employees, contractors and partners are detailed in the ConocoPhillips Information Security & Protection Policy. Our workforce is required to complete information security training annually, and we periodically communicate ways to recognize and avoid cybersecurity threats to our workforce.
| | | | | |
| ConocoPhillips 2023 10-K | 28 |
Engagement of Third Parties
We engage third-party cybersecurity consultants and experts to supplement staffing of our CSOC, as well as to help us assess, validate, and enhance our security practices, including conducting cybersecurity maturity assessments, vulnerability assessments and penetration tests.
As part of the cybersecurity incident response process described above, we engage third-party experts as needed to support incident response, such as external legal advisors, cybersecurity forensic firms and other specialists.
Third Party Service Provider Risk Management
Our third-party risk management process is designed to identify, assess, and mitigate risks associated with third-party service providers, including cybersecurity risks. An initial assessment is conducted to assess the cybersecurity risks associated with a third-party provider based on various criteria, such as whether the third-party provider has access to our network, data, and information systems. Third-party providers that are identified through the initial assessment as warranting further review are subject to additional risk assessment. In parallel, we have designed a contracting process to mitigate cybersecurity risks by specifying the rights and responsibilities of the parties.
Risks from Material Cybersecurity Threats
While we are subject to ongoing cybersecurity threats, we do not believe that the risks from previous threats have materially affected or are reasonably likely to materially affect the company, including our business strategy, results of operations or financial condition. Nevertheless, we recognize cybersecurity threats are on-going and evolving, and our program is designed to identify and manage those threats. See item 1A. Risk Factors—Our technologies, systems and networks are subject to cybersecurity threats for more information on our risks relating to our technologies, systems, and networks.
Cybersecurity Governance
Management's Role
A dedicated CISO leads the IT/OT Security Team and is responsible for our cybersecurity risk management and strategy. The CISO has over 20 years of experience in security, of which 15 years is specific to cybersecurity and has served as a CISO since 2013, having joined ConocoPhillips as CISO in 2022. The CISO holds a master’s degree and is a Certified Information Security Professional. The CISO reports to the CD&IO, who holds a master’s degree in information technology and has served as Chief Information Officer/Chief Technology Officer and various roles in information technology for over 27 years. The CD&IO reports to the Executive Vice President, Strategy, Sustainability and Technology. This management team assesses and manages risks associated with cybersecurity.
Board of Directors' Oversight
While our cybersecurity management team is responsible for the day-to-day assessment and management of material risks from cybersecurity threats, the ConocoPhillips Board of Directors has oversight responsibility for our ERM program and the individual risk management programs comprising our ERM program, including cybersecurity risk management. To help maintain effective Board of Directors' oversight across the entire enterprise, the Board of Directors delegates certain elements of its oversight function to individual committees. The AFC assists the Board of Directors in fulfilling its oversight of our ERM program and cybersecurity.
The Board of Directors receives a report on cybersecurity annually, and the AFC receives reports on cybersecurity twice a year. For meetings where cybersecurity is not on the formal agenda, the AFC will receive a pre-read that includes cybersecurity updates or discussion topics. During these reviews, management discusses various topics, including information relating to IT/OT Security strategy, program management, cybersecurity risks and threats, and provides briefings on notable cybersecurity attacks, including those relating to third-party service providers, if known. In addition to this regular reporting, significant cybersecurity risks or threats may also be escalated on an as needed basis to the AFC and Board of Directors.
| | | | | |
| 29 | ConocoPhillips 2023 10-K |
Item 3. Legal Proceedings
We are a defendant in a number of legal and administrative proceedings arising in the ordinary course of business, including those involving governmental authorities under federal, state and local laws regulating the discharge of materials into the environment. While it is not possible to accurately predict the final outcome of these pending proceedings, if any one or more of such proceedings were to be decided adversely to ConocoPhillips, we expect there would not be a material effect to our consolidated financial position.
ConocoPhillips has elected to use a $1 million threshold for disclosing certain proceedings arising under federal, state or local environmental laws when a governmental authority is a party. ConocoPhillips believes proceedings under this threshold are not material to ConocoPhillips' business and financial condition. Applying this threshold, there are no such proceedings to disclose for the year ended December 31, 2022.2023. See Note 11 for information regarding other legal and administrative proceedings. Item 4. Mine Safety Disclosures
Not applicable.
Information about our Executive Officers
| | | | | | | | |
| Name | Position Held | Age* |
| William L. Bullock, Jr. | Executive Vice President and Chief Financial Officer | 5859 |
| Christopher P. Delk | Vice President, Controller and General Tax Counsel | 5354 |
| C. William Giraud | Senior Vice President, Corporate Planning and Development | 44 |
| Heather G. Hrap | Senior Vice President, Human Resources and Real Estate and Facilities Services | 51 |
| Kirk L. Johnson | Senior Vice President, Lower 48 Assets and Operations | 48 |
| Ryan M. Lance | Chairman of the Board of Directors and Chief Executive Officer | 6061 |
| Andrew D. Lundquist | Senior Vice President, Government Affairs | 6263 |
| Dominic E. Macklon | Executive Vice President, Strategy, Sustainability and Technology | 5354 |
| Andrew M. O'Brien | Senior Vice President, Global Operations | 4849 |
| Nicholas G. Olds | Executive Vice President, Lower 48 | 5354 |
| Kelly B. Rose | Senior Vice President, Legal, General Counsel | 56 |
Heather G. Sirdashney | Senior Vice President, Human Resources and Real Estate and Facilities Services | 5057 |
_____________________
*On February 16, 2023.15, 2024.
There are no family relationships among any of the officers named above. Each officer of the company is elected by the Board of Directors at its first meeting after the Annual Meeting of Stockholders and thereafter as appropriate. Each officer of the company holds office from the date of election until the first meeting of the directors held after the next Annual Meeting of Stockholders or until a successor is elected. The date of the next annual meeting is May 16, 2023.14, 2024. Set forth below is information about the executive officers.
William L. Bullock, Jr. was appointed Executive Vice President and Chief Financial Officer as of September 2020, having previously served as President, Asia Pacific & Middle East since April 2015. Prior to that, he was Vice President, Corporate Planning & Development since May 2012.
| | | | | |
ConocoPhillips 2022 10-K | 28 |
Christopher P. Delk was appointed Vice President, Controller and General Tax Counsel in November 2022, having previously served as Vice President and General Tax Counsel since July 2015.
C. William Giraud was appointed Senior Vice President, Corporate Planning and Development in June 2023, having previously served as Vice President, Corporate Planning and Development since May 2022. Prior to that, he served as Vice President and Chief Commercial Officer from February 2021 to April 2022. Prior to joining ConocoPhillips, he was Executive Vice President and Chief Operating Officer of Concho Resources.
| | | | | |
| ConocoPhillips 2023 10-K | 30 |
Heather G. Hrap was appointed Senior Vice President, Human Resources and Real Estate and Facilities Services in March 2022, having previously served as Vice President, Human Resources from January 2019. Prior to that, she served as Human Resources General Manager from October 2015 to January 2019.
Kirk L. Johnson was appointed Senior Vice President, Lower 48 Assets and Operations in May 2022, having previously served as Vice President, Corporate Planning and Development since June 2021. Prior to that he served as President Canada from June 2018 to May 2021 and Manager, Strategy, Planning and Portfolio Management from July 2017 to June 2018.
Ryan M. Lance was appointed Chairman of the Board of Directors and Chief Executive Officer in May 2012, having previously served as Senior Vice President, Exploration and Production—International since May 2009.
Andrew D. Lundquist was appointed Senior Vice President, Government Affairs in February 2013. Prior to that, he served as managing partner of BlueWater Strategies LLC, since 2002.
Dominic E. Macklon was appointed Executive Vice President, Strategy, Sustainability and Technology in September 2021, having previously served as Senior Vice President, Strategy, Exploration and Technology since August 2020. Prior to that, he served as President, Lower 48 from June 2018 to August 2020, Vice President, Corporate Planning & Development from January 2017 to June 2018, and President, U.K. from September 2015 to January 2017. Mr. Macklon previously served as2017, and Senior Vice President, Oil Sands in Canada from July 2012 to September 2015.
Andrew M. O'Brien was appointed Senior Vice President, Global Operations in November 2022, having previously served as Vice President and Treasurer since May 2021. Prior to that, he served as Vice President of Corporate Planning and Development from August 2020 to May 2021, Lower 48 Finance Manager from August 2018 to August 2020, and Manager of Investor Relations from November 2016 to August 2018.
Nicholas G. Olds was appointed Executive Vice President, Lower 48 in November 2022, having previously served as Executive Vice President, Global Operations since September 2021. Prior to that, he served as Senior Vice President, Global Operations from August 2020 to September 2021, Vice President, Corporate Planning & Development from June 2018 to August 2020, Vice President, Mid-Continent Business Unit, Lower 48 from September 2016 to June 2018, and Vice President, North Slope Operations and Development in Alaska from August 2012 to September 2016.
Kelly B. Rose was appointed Senior Vice President, Legal, General Counsel in September 2018. Prior to that, she was a senior partner in the Houston office of an international law firm, Baker Botts L.L.P., where she counseled clients on corporate and securities matters. She began her career at the firm in 1991.
Heather G. Sirdashney was appointed Senior Vice President, Human Resources and Real Estate and Facilities Services in March 2022, having previously served as Vice President, Human Resources from January 2019. Prior to that, she served as Human Resources General Manager from October 2015 to January 2019.
| | | | | |
2931 | ConocoPhillips 20222023 10-K |
Part II
Item 5. Market for Registrant's Common Equity, Related Stockholder Matters and Issuer Purchases of Equity Securities
ConocoPhillips’ common stock is traded on the New York Stock Exchange under the symbol “COP.”
Cash Dividends Per Share
| | 2022 | | 2021 |
| Ordinary | VROC | | Ordinary | VROC |
| 2023 | | | 2023 | | 2022 |
| Ordinary | | | Ordinary | VROC | | Ordinary | VROC |
| First | First | $ | 0.46 | | 0.30 | | | 0.43 | | |
| Second | Second | 0.46 | | 0.70 | | | 0.43 | | |
| Third | Third | 0.46 | | 1.40 | | | 0.43 | | |
| Fourth | Fourth | 0.51 | | 0.70 | | | 0.46 | | 0.20 | |
| Number of Stockholders of Record at January 31, 2023* | | 36,132 |
| Number of Stockholders of Record at January 31, 2024* | | Number of Stockholders of Record at January 31, 2024* | | | | | 34,675 |
Dividends shown above reflect the quarter in which the dividend was declared.
*In determining the number of stockholders, we consider clearing agencies and security position listings as one stockholder for each agency listing.
In December 2021, we announced the addition of a VROC tier to our return of capital program. The declaration of ordinary dividends and VROC are subject to the discretion and approval of our Board of Directors. The Board has adopted a dividend declaration policy providing that the declaration of any dividends will be determined quarterly. Beginning in the first quarter of 2024, ConocoPhillips plans to pay its quarterly dividend and VROC concurrently, and will announce such payments in the same quarter they will be paid. For more information on factors considered when determining the level of these distributions, see “Item 1A —Risk Factors – Our ability to execute our capital return program is subject to certain considerations.” Issuer Purchases of Equity Securities
| | | | | | | | | | | | | | |
| Millions of Dollars |
| Period | Total Number of
Shares Purchased* | Average
Price Paid
Per Share | Shares Purchased
as Part of Publicly
Announced Plans
or Programs | Approximate Dollar
Value of Shares
that May Yet Be
Purchased Under the
Plans or Programs |
| | | | |
| October 1-31, 2022 | 6,800,856 | | $ | 117.62 | | 6,800,856 | | $ | 23,536 | |
| November 1-30, 2022 | 7,285,173 | | 129.56 | | 7,285,173 | | 22,592 | |
| December 1-31, 2022 | 8,635,020 | | 115.98 | | 8,635,020 | | 21,591 | |
| 22,721,049 | | | 22,721,049 | | |
| | | | | | | | | | | | | | |
| Millions of Dollars |
| Period | Total Number of
Shares Purchased* | Average
Price Paid
Per Share | Shares Purchased
as Part of Publicly
Announced Plans
or Programs | Approximate Dollar
Value of Shares
that May Yet Be
Purchased Under the
Plans or Programs |
| | | | |
| October 1-31, 2023 | 1,738,637 | | $ | 120.51 | | 1,738,637 | | $ | 17,081 | |
| November 1-30, 2023 | 2,850,623 | | 115.63 | | 2,850,623 | | 16,752 | |
| December 1-31, 2023 | 4,892,876 | | 114.62 | | 4,892,876 | | 16,191 | |
| 9,482,136 | | | 9,482,136 | | |
* There were no repurchases of common stock from company employees in connection with the company's broad-based employee incentive plans.
In late 2016, we initiated our current share repurchase program. In October 2022, our Board of Directors approved an increase to our authorization from $25 billion to $45 billion of common stock to support our plan for future share repurchases. As of December 31, 2022,2023, we had repurchased $23.4$28.8 billion of shares. Repurchases are made at management’s discretion, at prevailing prices, subject to market conditions and other factors. Except as limited by applicable legal requirements, repurchases may be increased, decreased or discontinued at any time without prior notice. Shares of stock repurchased under the plan are held as treasury shares. For more information, see “Item 1A—Risk Factors – Our ability to execute our capital return program is subject to certain considerations.considerations.” | | | | | |
ConocoPhillips 20222023 10-K | 3032 |
Stock Performance Graph
The following graph shows the cumulative TSR for ConocoPhillips’ common stock in each of the five years from December 31, 20172018 to December 31, 2022.2023. The graph also compares the cumulative total returns for the same five-year period with the S&P 500 Index and our performance peer group consisting of Chevron, ExxonMobil, Apache, Marathon OilAPA Corporation, Pioneer, Devon, Occidental, Hess, and EOG weighted according to the respective peer’s stock market capitalization at the beginning of each annual period. In 2023, we have updated our performance peer group, removing Marathon Oil Corporation and adding Pioneer, to better align with our business and market capitalization.
The comparison assumes $100 was invested on December 31, 2017,2018, in ConocoPhillips stock, the S&P 500 Index and ConocoPhillips’ peer group and assumes that all dividends were reinvested. The cumulative total returns of the peer group companies' common stock do not include the cumulative total return of ConocoPhillips’ common stock. The stock price performance included in this graph is not necessarily indicative of future stock price performance.
| | | | | |
3133 | ConocoPhillips 20222023 10-K |
| | | | | |
| Management’s Discussion and Analysis | |
Item 7. Management’s Discussion and Analysis of Financial Condition and
Results of Operations
Management’s Discussion and Analysis is the company’s analysis of its financial performance and of significant trends and uncertainties that may affect future performance. It should be read in conjunction with the financial statements and notes, and supplemental oil and gas disclosures included elsewhere in this report. It contains forward-looking statements including, without limitation, statements relating to the company’s plans, strategies, objectives, expectations and intentions that are made pursuant to the “safe harbor” provisions of the Private Securities Litigation Reform Act of 1995. The words “ambition,” “anticipate,” “believe,” “budget,” “continue,” “could,” “effort,” “estimate,” “expect,” “forecast,” “goal,” “guidance,” “intend,” “may,” “objective,” “outlook,” “plan,” “potential,” “predict,” “projection,” “seek,” “should,” “target,” “will,” “would,”“would” and similar expressions identify forward-looking statements. The company does not undertake to update, revise or correct any of the forward-looking information unless required to do so under the federal securities laws. Readers are cautioned that such forward-looking statements should be read in conjunction with the company’s disclosures under the heading: “CAUTIONARY STATEMENT FOR THE PURPOSES OF THE ‘SAFE HARBOR’ PROVISIONS OF THE PRIVATE SECURITIES LITIGATION REFORM ACT OF 1995,” beginning on page 6365. The terms “earnings” and “loss” as used in Management’s Discussion and Analysis refer to net income (loss) attributable to ConocoPhillips..
Business Environment and Executive Overview
ConocoPhillips is one of the world’s leading E&P companies based on both production and reserves with operations and activities in 13 countries. Our diverse, low cost of supply portfolio includes resource-rich unconventional plays in North America; conventional assets in North America, Europe, Africa and Asia; global LNG developments; oil sands assets in Canada; and an inventory of global conventional and unconventional exploration prospects. Headquartered in Houston, Texas, at December 31, 2022,2023, we employed approximately 9,5009,900 people worldwide and had total assets of $94$96 billion.
Overview
In 2022, the energy landscape continued to improve withAt ConocoPhillips, we anticipate that commodity prices ultimately reaching a 10-year high before decreasing in the second half of the year due to macroeconomic concerns. We expect prices will continue to be cyclical and volatile. Ourvolatile, and our view is that a successful business strategy in the E&P industry must be resilient in lower price environments while also retaining upside during periods of higher prices. As such, we are unhedged, remain highlycommitted to our disciplined in our investment decisionsframework and continually monitor market fundamentals, including the impacts associated with the conflict in Ukraine,geopolitical tensions and conflicts, OPEC Plus supply updates, global demand for our products, oil and gas inventory levels, governmental policies, inflation and supply chain disruptions and the fluctuating global COVID-19 impacts.disruptions.
The macro-environment of the global energy industry, including the energy transition, continues to evolve. We believe ConocoPhillips will continue to play an essential role by executing on three objectives: responsibly meeting energy transition pathway demand, delivering competitive returns on and of capital and achieving our net-zero operational emissions ambition. We call this our Triple Mandate, and it represents our commitment to create long-term value for our stakeholders.
Our Triple Mandate and our foundational principles guide our differential value proposition to deliver competitive returns to stockholders through price cycles is guided by foundational principles that support our Triple Mandate.cycles. Our foundational principles consist of maintaining balance sheet strength, providing peer-leading distributions, making disciplined investments, and demonstrating responsible and reliable ESG performance.
Our actions throughout 2022 reinforced our differential value proposition. Demonstrating our commitment to maintaining and enhancing balance sheet strength, in 2022, we executed several activities focused on debt reduction, including early retiring and refinancing some of our debt. In aggregate, these transactions along with naturally maturing debt reduced the company's total debt by $3.3 billion. These activities facilitate our ability to achieve our previously announced $5 billion debt reduction target by the end of 2026, while also reducing the company's annual cash interest expense. See Note 9. | | | | | |
ConocoPhillips 2022 10-K | 32 |
| | | | | |
Management’s Discussion and Analysis | |
Total company production in 20222023 was 1,7381,826 MBOED, yielding cash provided by operating activities of $28.3$20 billion. We invested $10.2$11.2 billion into the business in the form of capital expenditures and investments and provided returns of capital to shareholders of approximately $15.0$11 billion through our ordinary dividend, share repurchases and our VROC. For 2022,2023, we returned $2.4$2.6 billion from our ordinary dividend, which included an increase from 4651 cents per share to 5158 cents per share, effective in December. We also returned $3.3$3.0 billion to shareholders from the VROC in 2022. In the first quarter of 2022, we completed the paced monetization program of our Cenovus Energy (CVE) common shares and used the proceeds for a portion of our share repurchase program. See Note 5.2023. In total for 2022,2023, we returned $9.3$5.4 billion to shareholders through share repurchases. In October 2022, our Board of Directors approved an increase to our share repurchase authorization, increasing it from $25 billion to $45 billion to support our plan for future share repurchases. As of December 31, 2022,2023, we have repurchased $23.4$28.8 billion of the $45 billion authorized share repurchase program.
In February 2023,2024, we announced our 20232024 planned return of capital to shareholders of $11$9 billion through our three-tier return of capital framework. We also declared a first quarter ordinary dividend of $0.5158 cents per share and a VROC of $0.6020 cents per share.
In March, the Department of Interior published its ROD approving our Willow project in Alaska, which adopted a plan consisting of three core pads. In December, following a Ninth Circuit Court of Appeals denial of a request for an injunction, we reached FID on the Willow project and began winter construction.
| | | | | |
| ConocoPhillips 2023 10-K | 34 |
| | | | | |
| Management’s Discussion and Analysis | |
In 2022,October, we completed our acquisition of the remaining 50 percent working interest in Surmont, an asset in our Canada segment, for $2.7 billion of cash after customary adjustments. The transaction was funded by proceeds received via long-term debt offerings. This transaction includes a contingent payment arrangement of up to an additional $0.4 billion CAD (approximately $0.3 billion) over a five-year term. As the 100 percent owner and operator of Surmont, we will seek to optimize the asset while remaining on track to achieve our previously announced corporate emissions intensity objectives. See Note 3.
In 2023, we took several steps to expandfurther our global LNG business. In March, we completed our acquisition of 30 percent equity interest in PALNG Phase 1. In June, we completed our acquisition of a 25 percent equity interest in NFS3 in Qatar. Additionally, in June, we signed a 20-year offtake agreement at the first quarter,Saguaro LNG export facility on the west coast of Mexico, subject to Mexico Pacific reaching FID and other certain conditions precedent. Furthermore, in September, we increased our equity sharesigned a 15-year throughput agreement securing regasification capacity at the Gate LNG terminal in Australia Pacific LNG (APLNG) by 10 percent to 47.5 percent.the Netherlands. See Note 3. We were also awarded a 25 percent interest in each of two new joint ventures with QatarEnergy that will participate in the North Field East (NFE) and North Field South (NFS) LNG projects. Formation of the NFE joint venture (QG8) closed in December 2022 and we anticipate that the formation of the NFS joint venture (QG12) will close in early 2023. Also, in 2022, we executed a 15-year regasification agreement at the recently announced German LNG Terminal at Brunsbuttel.
Domestically, in November 2022,In the second quarter of 2023, we entered into several agreements with Sempra entities in connection withcompleted a strategic debt refinancing that extends the Port Arthur LNG (PALNG) facility, including a Sales and Purchase Agreement for 5 MTPA of LNG offtake at the start-up of Phase 1 of the PALNG facility, and an Equity Sale and Purchase Agreement, whereby we will acquire 30 percent of the equity in Phase 1 of Port Arthur LNG. Development of the PALNG facility is subject to completing required commercial agreements and resolving a number of risks and uncertainties, obtaining financing and reaching a final investment decision, among other factors.
As partweighted average maturity of our ongoing portfolio high-gradingfrom 15 to 17 years and optimization efforts, in the first quarter of 2022, we completed two transactions in our Asia Pacific segment, including the above-mentioned acquisition of additional interest in APLNG as well as the sale of our interests in Indonesia. In addition to those transactions, throughout 2022, we completed the sale of certain noncore assets in our Lower 48 segment. For more information on APLNG,reduces near term debt maturities. seeSee Note 4 and for more information on dispositions, 9see Note .3.In 2022,April, we reaffirmed and improved upon our commitment to demonstrate responsible and reliable ESG performance by publishing our Plan for the Net-Zero Energy Transition (the 'Plan'), which is built upon our Triple Mandate. In addition, we continue to expand upon our Paris-aligned climate risk frameworkannounced that we adoptedare accelerating our operations GHG emissions intensity reduction target through 2030. We are now targeting a reduction in 2020.gross operated and net equity operational emissions intensity of 50-60 percent from 2016 levels by 2030, an improvement from the previously announced target of 40-50 percent. In July 2022,December, we joinedachieved the Gold Standard Pathway in the Oil and Gas Methane Partnership (OGMP) 2.0 initiative. In October 2022, we demonstrated further evidence of our commitment by setting a new 2030 methane emissions intensity target of approximately 0.15 percent of gas produced, consistent with our commitment to OGMP 2.0.Initiative. For more information on our commitment to ESG and the Plan, see "Contingencies—Company Response to Climate-Related Risks" section of Management's Discussion and Analysis of Financial Condition and Results of Operation. Operationally, we remain focused on safely executing the business. Our Lower 48 segment achieved record production in 2023. Our international projects reached several key operational milestones, including first production ahead of schedule at several subsea projects in Norway and China, as well as the startup of the second phase of Montney’s central processing facility in Canada. Production increased 171for 2023 was 1,826 MBOED, representing an increase of 88 MBOED or 115 percent in 2022, compared to 2021. Production for 2022 was 1,738 MBOED.2022. After adjusting for closed acquisitions and dispositions, the conversion of previously acquired Concho-contracted volumes from a two-stream to a three-stream basis and 2021 Winter Storm Uri impacts, production decreasedincreased by 1673 MBOED or 14 percent. Organic growth from Lower 48 and other development programs more than offset decline; however, production was lower overall, primarily due to fourth quarter weather impacts and downtime in Lower 48.
| | | | | |
33 | ConocoPhillips 2022 10-K |
| | | | | |
Management’s Discussion and Analysis | |
Key Operating and Financial Summary
Significant items during 20222023 and recent announcements included the following:
•Generated cash provided by operating activities of $28.3 billion; ended the year with cash and cash equivalents and restricted cash of $6.7 billion and short-term investments of $2.8$20.0 billion;
•Distributed $15$11.0 billion to shareholders through a three-tier framework, including $5.7$5.6 billion in cash through the ordinary dividend and VROC and $9.3$5.4 billion through share repurchases, representing 53 percent of cash provided by operating activities;repurchases;
•Expanded global LNG business through participation in QatarEnergy's NFEEnded the year with cash, cash equivalents, and NFS projects; executed 15-year regasification agreement at German LNG Terminal; acquired additional 10 percent interest in APLNG; signed 20-year agreement for 5 MTPArestricted cash of LNG offtake$5.9 billion and executed agreement to purchase 30 percent equity stake in Phase 1short-term investments of Port Arthur LNG;$1.0 billion;
•Delivered record full-year total and Lower 48 segment production of 1,7381,826 MBOED and record Lower 48 production;1,067 MBOED, respectively;
•Fully integrated acquired Permian assets and executed multiple acreage swaps, coringAcquired the remaining 50 percent working interest in Surmont for approximately $2.7 billion as well as future contingent payments of up approximately 25,000 acres since acquisition to provide over a year's worth of additional two mile-plus long-lateral drilling inventory;$0.4 billion CAD ($0.3 billion);
•Received license extension for Norway's Greater Ekofisk area to 2048 and license adjustments for China's Bohai Penglai Fields to 2039;Took FID on the Willow project;
•Generated $3.5 billionProgressed global LNG strategy through expansion in disposition proceeds through monetization ofQatar, FID at PALNG and regasification agreements in the company's CVE sharesNetherlands and noncore asset sales;offtake agreements in Mexico;
•Retired $3.3 billionReached first production at several subsea tiebacks in debt toward the company's $5 billion debt reduction target;Norway, Surmont Pad 267 in Canada and Bohai Phase 4B in China;
•Joined OGMP 2.0; published a Plan forCommenced startup at the Net-Zero Energy Transition and set a new 2030 methane emissions intensity target, enhancing our commitment to ESG;second phase of Montney's central processing facility in Canada;
•Recorded 2022 year-end proved reserves of 6.6 billion BOE, withAwarded the Gold Standard Pathway designation by OGMP 2.0; and
•Accelerated the company's GHG emissions-intensity reduction target through 2030 from 40-50 percent to 50-60 percent, using a total reserve replacement ratio of 176 percent including closed acquisitions and dispositions.2016 baseline.
| | | | | |
| 35 | ConocoPhillips 2023 10-K |
| | | | | |
| Management’s Discussion and Analysis | |
Business Environment
The energy industry has historically been subject to volatility in commodity prices, which fluctuate with the global economy's supply and demand for energy. For example, WTI crude oil prices averaged $78 per barrel in 2023, compared with $94 per barrel in 2022, compared with $68 per barrel in 2021. The energy industry has periodically experienced this type of volatility due to fluctuating supply-and-demand conditions and such volatility may persist in the future. Commodity prices are the most significant factor impacting our2022. Our profitability, reinvestment of operating cash flows into our business and distributions to shareholders. Weshareholders are guidedinfluenced by ourthese fluctuations. Our Triple Mandate and our foundational principles to deliver onguide our differential value proposition to create valuedeliver competitive returns on and of capital to stockholders through price cycles. Our foundational principles includeconsist of maintaining balance sheet strength, peer leadingproviding peer-leading distributions, making disciplined investments and demonstrating responsible and reliable ESG performance, all of which support strong financial returns.returns and mitigate uncertainty associated with volatile commodity prices.
•Balance sheet strength. A strong balance sheet is a strategic asset that provides flexibility through price cycles. We strive to maintain our ‘A’-rating, as we did throughout 2023. In 2023, we initiated and completed a strategic debt refinancing to extend the weighted average maturity of our portfolio and reduced near-term debt maturities. In addition, we also funded the acquisition of the remaining 50 percent working interest in 2021 committed to reducing grossSurmont from the proceeds of new long-term debt by $5 billion by the end of 2026. In 2022 we executed several activities focused on debt reduction and, combined with naturally maturing debt, reduced the company's total debt by $3.3 billion. This will reduce interest expense and provide resilience in periods of volatility.issuances. We ended the year with cash and cash equivalents and restricted cash of $6.7$5.9 billion and short-term investments of $2.8$1.0 billion, maintaining balance sheet strength.
•Peer leading distributions. We believe in delivering value to our shareholders via our three-tiered return of capital framework, which consists of a growing, sustainable ordinary dividend, share repurchases and our VROC. This framework is how we plan to return greater than 30 percent of our net cash provided by operating activities to shareholders. In 2022,2023, we returned $5.7$5.6 billion to shareholders through our ordinary dividend and VROC and $9.3$5.4 billion through share repurchases partially sourced from monetization of our CVE common shares. See Note 5.repurchases. Our combined dividends and share repurchases of $15$11 billion represented over 50 percent of our net cash provided by operating activities. In October 2022, our Board of Directors approved an increase to our share repurchase authorization from $25 billion to $45 billion to support our plan for future share repurchases. In February 2023,2024, we announced our 20232024 planned return of capital to shareholders of $11$9 billion through our three-tier return of capital framework. See “Item“Item 1A—Risk Factors Our ability to execute our capital return program is subject to certain considerations.” •Disciplined investments. Our goal is to achieve strong free cash flow by exercising capital discipline, controlling our costs, and safely and reliably delivering production. We expect to make capital investments sufficient to at least sustain production throughout the price cycles. Free cash flow is defined as cash from operations net of capital expenditures and investments and provides funds that are available to return to shareholders, strengthen the balance sheet or reinvest back into the business for future cash flow expansion.
| | | | | |
ConocoPhillips 2022 10-K | 34 |
| | | | | |
Management’s Discussion and Analysis | |
◦Exercise capital discipline. We participate in a commodity price-driven and capital-intensive industry, with varying lead times from when an investment decision is made to when an asset is operational and generates cash flow. As a result, we must invest significant capital dollars to develop newly discovered fields, maintain existing fields and construct pipelines and LNG facilities. We allocate capital across a geographically diverse, low cost of supply resource base, which combined with legacy assets results in low overall production decline. Cost of supply is the WTI equivalent price that generates a 10 percent after-tax return on a point-forward and fully burdened basis. Fully burdened basis includes capital infrastructure, foreign currency exchange rates, cost of carbon, price-related inflation and G&A. In setting our capital plans, we exercise a rigorous approach that evaluates projects using these cost of supply criteria, which we believe will lead to value maximization and cash flow expansion using an optimized investment pace, not production growth for growth’s sake. Our cash allocation priorities call for the investment of sufficient capital to sustain production and provide returns of capital to shareholders.
◦Control our costs. Controlling operating and overheadour costs, without compromising safety or environmental stewardship, is a high priority. Using various methodologies, we monitor these costs monthly, on an absolute-dollar basis and a per-unit basis and report to management. Managing operating and overhead costs is critical to maintaining a competitive position in our industry, particularly in a low commodity price environment. The ability to control our operatingenvironment, and overhead costs positively impacts our ability to deliver strong cash from operations.
◦Optimize our portfolio. In 2022, we expanded upon our global LNG business by increasing our ownership in APLNG by 10 percent to 47.5 percent. In addition, we were also awarded interests in the NFE and NFS LNG projects in Qatar, signed agreements to purchase an interest in Port Arthur LNG in the U.S., and signed a 15-year regasification agreement with the German LNG Terminal at Brunsbuttel. See Note 4. We continue to evaluate our assets to determine whether they compete for capital within our portfolio and optimize as necessary, directing capital towards the most competitive investments and disposing of assets that do not compete. As such, in 2022
In 2023, we completed the saleacquisition of Indonesiathe remaining 50 percent working interest in Surmont and certain noncore assetscompleted our acquisitions of equity interests in both the Lower 48 segment.PALNG and NFS3 LNG projects and signed both LNG offtake and regasification agreements. See Note 3. | | | | | |
| ConocoPhillips 2023 10-K | 36 |
| | | | | |
| Management’s Discussion and Analysis | |
◦Add to our proved reserve base. We primarily add to our proved reserve base in three ways:
▪Acquire interest in existing or new fields.
▪Apply new technologies and processes to improve recovery from existing fields.
▪Successfully explore, develop and exploit new and existing fields.
As required by current authoritative guidelines, the estimated future date when an asset will reach the end of its economic life is based on historical 12-month first-of-month average prices and current costs. This date estimates when production will end and affects the amount of estimated reserves. Therefore, as prices and cost levels change from year to year, the estimate of proved reserves also changes. Generally, our proved reserves decrease as prices decline and increase as prices rise.
Reserve replacement represents the net change in proved reserves, net of production, divided by our current year production, as shown in our supplemental reserve table disclosures. Our reserve replacement was 176123 percent in 2022,2023, reflecting a net increase from development drilling activity, as well as higherextensions and discoveries and purchases, partially offset by lower prices. Our organic reserve replacement, which excludes a net decreaseincrease of 6184 MMBOE from sales and purchases, was 17796 percent in 2022.2023.
In the three years ended December 31, 2022,2023, our reserve replacement was 180219 percent. Our organic reserve replacement during the three years ended December 31, 2022,2023, which excludes a net increase of 1,1031,293 MMBOE related to sales and purchases, was 114152 percent. See "Supplementary Data - Oil and Gas Operations" for more information. Access to additional resources may become increasingly difficult as lower commodity price cycles can make projects uneconomic or unattractive. In addition, prohibition of direct investment in some nations, national fiscal terms, political instability, competition from national oil companies, and lack of access to high-potential areas due to environmental or other regulation may negatively impact our ability to increase our reserve base. As such, the timing and level at which we add to our reserve base may, or may not, allow us to fully replace our production over subsequent years.
| | | | | |
35 | ConocoPhillips 2022 10-K |
•Environmental, Social and Governance.Governance performance. ConocoPhillips seeksWe seek to fulfill our mission of delivering energy to the world through an integrated management system approach that assesses sustainability-related business risks and opportunities as part of our decision-making process. Recognizing the importance of ESG performance to our stakeholders and company success, we have a governance structure that extends from the board of directors through to executive leadership and business unit managers.
In October 2020, we became the first U.S.-based oil and natural gas company to adopt a Paris-aligned climate risk framework that includes an ambition to achieve net-zero Scope 1 and 2 emissions on a gross operated and net equity basis by 2050. We believe that this framework, combined with our success in meeting the business objectives set by our Triple Mandate, represents the most effective way for us to sustainably contribute to society’s transition to a low-carbon economy. In early 2022,2023, we reaffirmed and improvedannounced an acceleration of our commitment to demonstrate responsible and reliable ESG performance and address climate-related risks by publishing our Plan foroperational GHG emissions intensity reduction target through 2030. In December, we achieved the Net Zero Energy Transition, which outlines our approach and progress to address risks specific toGold Standard Pathway in the energy transition.OGMP 2.0 Initiative.
ConocoPhillips believesWe believe that natural gas and oil will remain essential to the energy mix throughout the energy transition, and we also recognize the need for continuous reduction in the greenhouse gas intensity of production operations. The energy transition will likely be complex, evolving over multiple decades with many possible pathways and uncertainties. By following our Triple Mandate, we intend to meet this challenge in an economically viable, accountable and actionable way that creates long-term value for our stakeholders. For more information on our commitment to responsible and reliable ESG performance through the energy transition, see "Contingencies—Company Response to Climate-Related Risks" section of Management's Discussion and Analysis of Financial Condition and Results of Operation. | | | | | |
| 37 | ConocoPhillips 2023 10-K |
| | | | | |
| Management’s Discussion and Analysis | |
Commodity Prices
Our earnings and operating cash flows generally correlate with crude oil and natural gas commodity prices. Commodity price levels are subject to factors external to the company and over which we have no control, including but not limited to global economic health, supply or demand disruptions or fears thereof caused by civil unrest, orglobal pandemics, military conflicts, actions taken by OPEC Plus and other major oil producing countries, environmental laws, tax regulations, governmental policies global health crises and weather-related disruptions. The following graph depicts the average benchmark prices for WTI crude oil, Brent crude oil and U.S. Henry Hub natural gas over the past three years:since 2021:
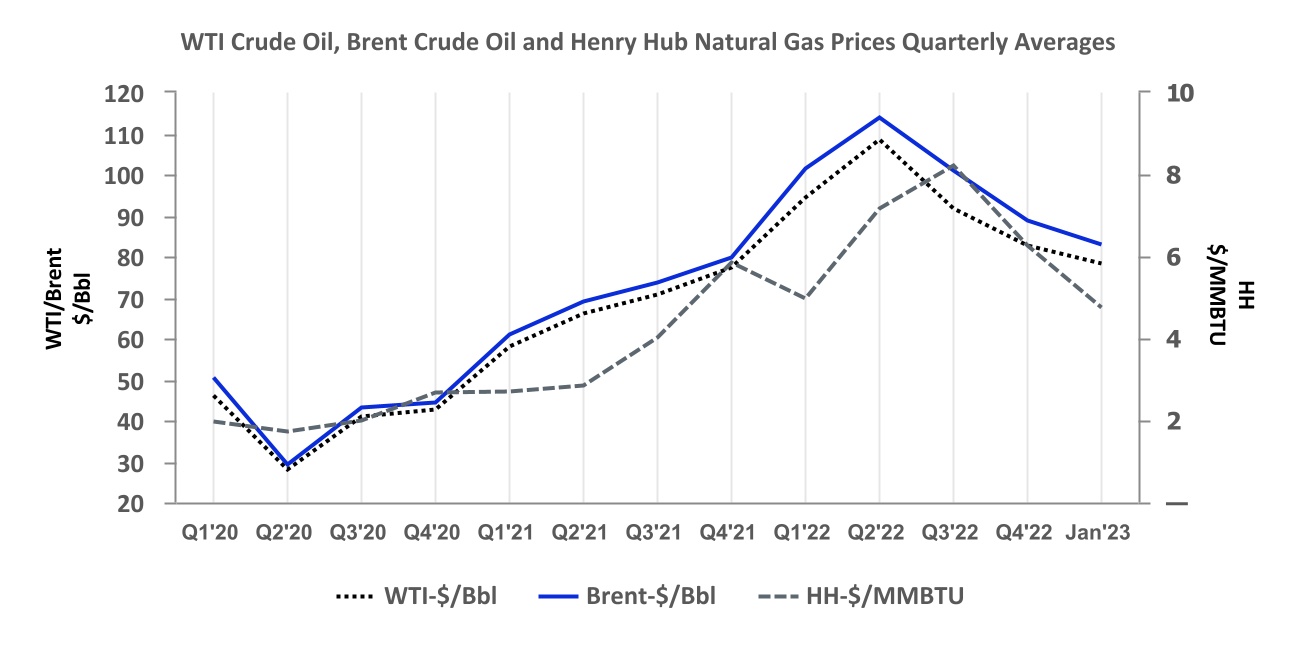

Brent crude oil prices averaged $82.62 per barrel in 2023, a decrease of 18 percent compared with $101.19 per barrel in 2022, an increase of 43 percent compared with $70.73 per barrel in 2021.2022. Similarly, average WTI crude oil prices increased 39decreased 18 percent from $67.92 per barrel in 2021 to $94.23 per barrel in 2022.2022 to $77.62 per barrel in 2023. Prices were higherlower through 2023 as rising Non-OPEC supplies and Russia's ability to redirect crude oil to destinations outside the EU more than offset OPEC Plus crude oil supply curbs.
Henry Hub natural gas prices decreased 59 percent from an average of $6.65 per MMBTU in 2022 to $2.74 per MMBTU in 2023. Natural gas prices decreased due to ongoingmild winter weather and U.S. domestic supply growth outpacing demand growth.
Our realized bitumen price decreased 24 percent from an average of $55.56 per barrel in 2022 to $42.15 per barrel in 2023. The decrease was largely driven by weakness in WTI, reflective of global economicmarkets adjusting to new trade dynamics and global crude oil demand concerns. We continue to optimize bitumen price realizations through optimizing diluent recovery following 2020's COVID impacts, supply disruptions caused by Russia's invasion of Ukraineunit operation, blending and resulting sanctions, OPEC supply restraint and supply chain bottlenecks limiting U.S. production growth.transportation strategies.
Our worldwide annual average realized price decreased 27 percent from $79.82 per BOE in 2022 to $58.39 per BOE in 2023 primarily due to lower commodity prices.
| | | | | |
ConocoPhillips 20222023 10-K | 3638 |
| | | | | |
| Management’s Discussion and Analysis | |
Henry Hub natural gas prices increased 73 percent from an average of $3.85 per MMBTU in 2021 to $6.65 per MMBTU in 2022. Natural gas prices increased due to modest growth in domestic production, healthy domestic demand and strong levels of feedgas demand for LNG exports to Europe and Asia.
Our realized bitumen price increased 48 percent from an average of $37.52 per barrel in 2021 to $55.56 per barrel in 2022. The increase was largely driven by strength in WTI, reflective of increasing global demand and sanctions on Russian exports. The weakness of WCS to WTI differential at Hardisty was primarily caused by U.S. strategic petroleum reserve release, discounted Russian crude oil and weak heavy fuel pricing. We continue to optimize bitumen price realizations through optimizing diluent recover unit operation, blending and transportation strategies.
Our worldwide annual average realized price increased 46 percent from $54.63 per BOE in 2021 to $79.82 per BOE in 2022 primarily due to higher commodity prices.
Outlook
Production and Capital
2023 operating plan2024 capital expenditure guidance is $10.7$11.0 to $11.3 billion, which includes $1.6 to $2.0 billion for anticipated major project spending at NFE, NFS, PALNG and Willow and $9.1 to $9.3 billion for ongoing development drilling programs; exploration and appraisal activities; base maintenance; and projects to reduce the company's Scope 1 and 2 emissions intensity and fund investments in several early-stage low-carbon opportunities that address end-use emissions.$11.5 billion.
Production
2024 production guidance is 1.761.91 to 1.80 MMBOED in 2023. First quarter 20231.95 MMBOED. First-quarter 2024 production is expected to be 1.72 MMBOED1.88 to 1.76 MMBOED, which includes 35 MBOED of turnaround and stabilizer expansion in Eagle Ford.1.92 MMBOED.
Operating Segments
We manage our operations through six operating segments, which are primarily defined by geographic region: Alaska; Lower 48; Canada; Europe, Middle East and North Africa; Asia Pacific; and Other International.
Corporate and Other represents income and costs not directly associated with an operating segment, such as most interest expense, premiums incurred on the early retirement ofincome and expense; impacts from certain debt transactions; corporate overhead and certain technology activities, as well asincluding licensing revenues.revenues; and unrealized holding gains or losses on equity securities. All cash and cash equivalents and short-term investments are included in Corporate and Other.
Our key performance indicators, shown in the statistical tables provided at the beginning of the operating segment sections that follow, reflect results from our operations, including commodity prices and production.
| | | | | |
3739 | ConocoPhillips 20222023 10-K |
Results of Operations
This section of the Form 10-K discusses year-to-year comparisons between 20222023 and 2021.2022. For discussion of year-to-year comparisons between 20212022 and 2020,2021, see "Management's Discussion and Analysis of Financial Condition and Results of Operations" in Part II, Item 7 of our 20212022 10-K.
Consolidated Results
A summary of the company’s net income (loss) attributable to ConocoPhillips by business segment follows:
| | Millions of Dollars |
| Millions of Dollars | | | Millions of Dollars |
| Years Ended December 31 | Years Ended December 31 | 2022 | 2021 | 2020 | Years Ended December 31 | 2023 | 2022 | 2021 |
| | Alaska | |
| Alaska | |
| Alaska | Alaska | $ | 2,352 | | 1,386 | | (719) | |
| Lower 48 | Lower 48 | 11,015 | | 4,932 | | (1,122) | |
| Canada | Canada | 714 | | 458 | | (326) | |
| Europe, Middle East and North Africa | Europe, Middle East and North Africa | 2,244 | | 1,167 | | 448 | |
| Asia Pacific | Asia Pacific | 2,736 | | 453 | | 962 | |
| Other International | Other International | (51) | | (107) | | (64) | |
| Corporate and Other | Corporate and Other | (330) | | (210) | | (1,880) | |
| Net income (loss) attributable to ConocoPhillips | $ | 18,680 | | 8,079 | | (2,701) | |
| Net income (loss) | |
Net Income (loss) attributable to ConocoPhillips increased $10,601decreased $7,723 million in 2022.2023. Earnings were positivelynegatively impacted by:
•HigherLower realized commodity prices.
•Higher sales volumes primarily dueAbsence of a $462 million gain on disposition related to the divestiture of our Shell Permian acquisition, partly offset byIndonesia assets divested.in the first quarter of 2022, contingent payments associated with a previous disposition in our Canada segment and lower contingent payments associated with a previous disposition in our Lower 48 segment. See Note 3. •Higher DD&A expenses primarily due to higher rates from reserve revisions resulting from higher costs as well as higher overall production volumes.
•Higher production and operating expenses due to increased well work activities and higher volumes, primarily in the Lower 48 segment.
•Absence of a $515 million tax benefit recognized in 2022 related to the closing of an IRS audit.See Note 17. •Lower equity in earnings of affiliates, primarily due to higherlower LNG sales prices and volumes as well as the additional 10 percent interest in APLNG we acquired in the first quarter of 2022. See Note 3.prices. •Absence of a $682 million after-tax impairment of our APLNG investment included within our Asia Pacific segment. See Note 7. •Recognition of a $515 million tax benefit related to the closing of an IRS audit. See Note 17.•Gain on dispositions primarily due to a $462 million after-tax gain related to the divestiture of our Indonesia assets, higher contingent payments related to prior dispositions in our Canada and Lower 48 segments and the absence of a $137 million after-tax loss related to the divestiture of noncore assets in our Other International segment from 2021. See Note 3.•Absence of restructuring and transaction expenses of $341 million after-tax related to our Concho and Shell Permian acquisitions.
•Absence of realized losses on hedges of $233 million after-tax related to derivative positions acquired in our Concho acquisition. See Note 12.•Lower other expenses primarily related to an after-tax gain of $62 million associated with the extinguishment of debt from the first quarter of 2022. See Note 9.These increases in net income (loss) were partly offset by:
•Higher income tax provision.
•Higher taxes other than income taxes, production and operating expenses and DD&A expenses due to higher prices, production volumes, primarily from our Shell Permian acquisition, and inflation. Partially offsetting the increase in DD&A expenses were lower rates from reserve revisions.
•A gain of $251 million after-tax onfrom the sale of our Cenovus Energy (CVE) common shares in 2022, as compared to a $1,040 million after-tax gain on those shares in 2021.2022. See Note 5.•AbsenceForeign currency transaction losses of an after-tax gain$89 million arising from forward contracts in support of $194 million recognized for a final investment decision (FID) bonus associated with our Australia-West divestiture in 2020.Surmont acquisition and lower foreign currency remeasurement gains resulting from the USD strengthening against the NOK. See Note 113. Earnings were positively impacted by:
•Higher sales volumes.
•Lower taxes other than income taxes primarily driven by lower commodity prices, partially offset by higher production volumes.
•Recognized foreign tax benefits. See Note 17. •Commercial performance and timing.
•Higher interest income and lower interest expense due to higher capitalized interest for longer term major projects.
•Lower exploration expenses primarily related to the absence of an impairment of certain aged, suspended wells in our Canada segment and increasedlower dry hole expenses inacross our Europe, Middle East and North Africa segment.portfolio. See Note 6.
| | | | | |
ConocoPhillips 20222023 10-K | 3840 |
Income Statement Analysis
Unless otherwise indicated, all results in Income Statement Analysis are before-tax.
Sales and other operating revenues increased $32,666decreased $22,353 million in 2022, mainly2023, primarily due to higherlower realized commodity prices and higher sales volumes, primarily due to our Shell Permian acquisition, partially offset by assets divested. See Note 3.higher sales volumes. Equity in earnings of affiliates increased $1,249decreased $361 million in 2022,2023, primarily due to higherlower earnings driven by higherlower LNG and crude prices as well as the additional 10 percent interest in APLNG which was acquired in the first quarter of 2022.prices. See Note 3. Gain (loss) on dispositions increased $591decreased $849 million in 2022,2023, primarily due to the recognitionabsence of a gain of $534 million from the divestiture of our Indonesia divestiture,assets, the absence of a $179 million losscontingent payments associated with the sale of noncore assets in our Other International segment and higher contingent paymentsa previous disposition in our Canada segment and lower contingent payments associated with a previous disposition in our Lower 48 segments than in 2021. These increases were partially offset by the absence of a $200 million gain for a FID bonus associated with our Australia-West divestiture recognized in the first quarter of 2021.segment. See Note 3. Other income (loss)Income decreased $699$19 million in 2022,2023 primarily due to the absence of mark-to-market gains associated witha gain of $251 million after-tax from the sale of our CVECenovus Energy (CVE) common shares which were fully divested in the first quarter of 2022. See Note 5. The decrease was partially2022, largely offset by higher interest income earned due to rising rates and investments.income.
Purchased commodities increased $15,813decreased $11,996 million in 2022,2023, primarily in line with higher gas and crudedue to lower prices and volumes.across all commodities.
Production and operating expenses increased $1,312$687 million in 2022,2023, due to increased well work activities and higher production volumes, primarily due to our Shell Permian acquisition, inflation and commodity price impacts.in the Lower 48 segment.
Selling, general and administrativeExploration expenses decreased $96$166 million in 2022,2023, primarily due to the absence of transaction and restructuring expenses associated with our Concho and Shell Permian acquisitions, partially offset by higher compensation and benefits costs, including mark-to-market impacts of certain key employee compensation programs.
Exploration expenses increased $220 million in 2022, primarily due to thean impairment of certain aged, suspended wells in our Canada segment as well as increasedlower dry hole expenses related to our 2022 exploration and appraisal campaign in Norway.expenses. See Note 6.
DD&A increased $296$766 million in 2022 mainly2023 primarily due to higher rates from reserve revisions resulting from higher operating costs as well as higher overall production volumes primarily due to development in our Shell Permian acquisition, partially offset by lower rates from reserve additions from development drilling and higher prices and the absence of DD&A from divested assets.
Impairments decreased $686 million in 2022, primarily due to the absence of an impairment of our APLNG investment included within our Asia Pacific segment in 2021. For additional information, see Note 7 and Note 13.Lower 48 segment.Taxes other than income taxes increased $1,730decreased $1,290 million in 2022,2023, caused primarily by higherlower commodity prices, andpartially offset by higher salesproduction volumes.
Other ExpensesForeign currency transaction (gain) loss decreased $149for the year was impaired by $192 million, primarily related toas a gainresult of $127losses of $112 million associated with the extinguishmentforward contracts in support of debtour Surmont acquisition and lower foreign currency remeasurement gains resulting from the first quarter of 2022.USD strengthening against the NOK. See Note 93.
See Note 17—Income Taxes for information regarding our income tax provision and effective tax rate. | | | | | |
3941 | ConocoPhillips 20222023 10-K |
Summary Operating Statistics
| | 2022 | 2021 | 2020 |
| 2023 | | | 2023 | 2022 | 2021 |
| Average Net Production | Average Net Production | |
| Crude oil (MBD) | Crude oil (MBD) | |
| Crude oil (MBD) | |
| Crude oil (MBD) | |
| Consolidated Operations | |
| Consolidated Operations | |
| Consolidated Operations | Consolidated Operations | 885 | | 816 | | 555 | |
| Equity affiliates | Equity affiliates | 13 | | 13 | | 13 | |
| Total crude oil | Total crude oil | 898 | | 829 | | 568 | |
| | Natural gas liquids (MBD) | Natural gas liquids (MBD) | |
| Natural gas liquids (MBD) | |
| Natural gas liquids (MBD) | |
| Consolidated Operations | |
| Consolidated Operations | |
| Consolidated Operations | Consolidated Operations | 244 | | 134 | | 97 | |
| Equity affiliates | Equity affiliates | 8 | | 8 | | 8 | |
| Total natural gas liquids | Total natural gas liquids | 252 | | 142 | | 105 | |
| | Bitumen (MBD) | Bitumen (MBD) | 66 | | 69 | | 55 | |
| Bitumen (MBD) | |
| Bitumen (MBD) | |
| | Natural gas (MMCFD) | Natural gas (MMCFD) | |
| Natural gas (MMCFD) | |
| Natural gas (MMCFD) | |
| Consolidated Operations | |
| Consolidated Operations | |
| Consolidated Operations | Consolidated Operations | 1,939 | | 2,109 | | 1,339 | |
| Equity affiliates | Equity affiliates | 1,191 | | 1,053 | | 1,055 | |
| Total natural gas | Total natural gas | 3,130 | | 3,162 | | 2,394 | |
| Total Production (MBOED) | Total Production (MBOED) | 1,738 | | 1,567 | | 1,127 | |
Total Production (MBOED) | |
Total Production (MBOED) | |
| | Dollars Per Unit |
| Dollars Per Unit | | | Dollars Per Unit |
| Average Sales Prices | Average Sales Prices | |
| Crude oil (per bbl) | Crude oil (per bbl) | |
| Crude oil (per bbl) | |
| Crude oil (per bbl) | |
| Consolidated Operations | |
| Consolidated Operations | |
| Consolidated Operations | Consolidated Operations | $ | 97.23 | | 67.61 | | 39.56 | |
| Equity affiliates | Equity affiliates | 97.31 | | 69.45 | | 39.02 | |
| Total crude oil | Total crude oil | 97.23 | | 67.64 | | 39.54 | |
| | Natural gas liquids (per bbl) | Natural gas liquids (per bbl) | |
| Natural gas liquids (per bbl) | |
| Natural gas liquids (per bbl) | |
| Consolidated Operations | |
| Consolidated Operations | |
| Consolidated Operations | Consolidated Operations | 35.67 | | 31.04 | | 12.90 | |
| Equity affiliates | Equity affiliates | 61.22 | | 54.16 | | 32.69 | |
| Total natural gas liquids | Total natural gas liquids | 36.50 | | 32.45 | | 14.61 | |
| | Bitumen (per bbl) | Bitumen (per bbl) | 55.56 | | 37.52 | | 8.02 | |
| Bitumen (per bbl) | |
| Bitumen (per bbl) | |
| | Natural gas (per mcf) | Natural gas (per mcf) | |
| Natural gas (per mcf) | |
| Natural gas (per mcf) | |
| Consolidated Operations | |
| Consolidated Operations | |
| Consolidated Operations | Consolidated Operations | 10.56 | | 6.00 | | 3.17 | |
| Equity affiliates | Equity affiliates | 10.67 | | 5.31 | | 3.71 | |
| Total natural gas | Total natural gas | 10.60 | | 5.77 | | 3.41 | |
| | Millions of Dollars |
| Millions of Dollars | | | Millions of Dollars |
| Worldwide Exploration Expenses | Worldwide Exploration Expenses | |
| General and administrative; geological and geophysical, lease rental, and other | |
| General and administrative; geological and geophysical, lease rental, and other | |
| General and administrative; geological and geophysical, lease rental, and other | General and administrative; geological and geophysical, lease rental, and other | $ | 224 | | 300 | | 374 | |
| Leasehold impairment | Leasehold impairment | 89 | | 10 | | 868 | |
| Dry holes | Dry holes | 251 | | 34 | | 215 | |
| Total Exploration Expenses | Total Exploration Expenses | $ | 564 | | 344 | | 1,457 | |
| | | | | |
ConocoPhillips 20222023 10-K | 4042 |
We explore for, produce, transport and market crude oil, bitumen, LNG, natural gas, NGLs and NGLsLNG on a worldwide basis. At December 31, 2022,2023, our operations were producing in the U.S., Norway, Canada, Australia, China, Malaysia, Qatar and Libya.
Total production of 1,7381,826 MBOED increased 17188 MBOED or 115 percent in 20222023 compared with 2021,2022, primarily due to:
•Newto new wells online in the Lower 48, Alaska, Australia, Canada, China, MalaysiaNorway and Canada.
•Acquisitions including Shell Permian in the Lower 48 and additional working interest at APLNG in our Asia Pacific segment. See Note 3.•Conversion of previously acquired Concho contracted volumes from a two-stream to a three-stream basis.Malaysia.
The increase in production during 20222023 was partly offset by:
•Normalby normal field decline.
•Divestiture of our Indonesia assets and noncore assets in the Lower 48 segment. See Note 3.Production for 2022 was 1,738 MBOED. After adjusting for closed acquisitions and dispositions, the conversion of previously acquired Concho-contracted volumes from a two-stream to a three-stream basis and 2021 Winter Storm Uri impacts, production decreasedincreased by 1673 MBOED or 14 percent. Organic growth from Lower 48 and other development programs more than offset decline; however, production was lower overall, primarily due to fourth quarter weather impacts and downtime in Lower 48.
| | | | | |
4143 | ConocoPhillips 20222023 10-K |
Segment Results
Unless otherwise indicated, discussion of Segment Results is after-tax.
Alaska
| | | 2022 | 2021 | 2020 |
Net Income (Loss) Attributable to ConocoPhillips ($MM) | $ | 2,352 | | 1,386 | | (719) | |
| 2023 | |
| 2023 | |
| 2023 | | 2022 | 2021 |
Net Income (Loss) ($MM) | |
| | Average Net Production | Average Net Production | |
| Average Net Production | |
| Average Net Production | |
| Crude oil (MBD) | |
| Crude oil (MBD) | |
| Crude oil (MBD) | Crude oil (MBD) | 177 | | 178 | | 181 | |
| Natural gas liquids (MBD) | Natural gas liquids (MBD) | 17 | | 16 | | 16 | |
| Natural gas (MMCFD) | Natural gas (MMCFD) | 34 | | 16 | | 10 | |
Total Production (MBOED) | Total Production (MBOED) | 200 | | 197 | | 198 | |
| | Average Sales Prices | Average Sales Prices | |
| Average Sales Prices | |
| Average Sales Prices | |
| Crude oil ($ per bbl) | |
| Crude oil ($ per bbl) | |
| Crude oil ($ per bbl) | Crude oil ($ per bbl) | $ | 101.72 | | 69.87 | | 42.12 | |
| Natural gas ($ per mcf) | Natural gas ($ per mcf) | 3.64 | | 2.81 | | 2.91 | |
The Alaska segment primarily explores for, produces, transports and markets crude oil, NGLs and natural gas. In 2022,2023, Alaska contributed 1615 percent of our consolidated liquids production and two percent of our consolidated natural gas production.
Net Income (Loss) Attributable to ConocoPhillips
Alaska reported earnings of $2,352$1,778 million in 2022,2023, compared with earnings of $1,386$2,352 million in 2021. Earnings were positively impacted by higher realized commodity prices.
2022. Earnings were negatively impacted by:
•Higher taxes other than income taxes associated with higherLower realized commodity prices and higher production volumes.crude oil prices.
•Higher production and operating expenses drivendue to higher well work and transportation related costs.
•Higher DD&A expenses due to higher rates primarily as a result of downward reserve revisions.
Earnings were positively impacted by response costslower taxes other than income taxes associated with a first quarter subsurface gas release at Alpine drill site CD1 and higher activity comprised of well workovers and gas injections.lower realized crude oil prices.
Production
Average production increased 3decreased 5 MBOED in 20222023 compared with 2021,2022, primarily due to:to normal field decline.
•NewThe production decrease was partly offset by new wells online at our Western North Slope assets.
•Increased development activity at Greater Prudhoe Area and Greater Kuparuk Area assets.
Exploration Activity
In the first quarter of 2023, we drilled the Bear-1 exploration well which was determined to be a dry hole, increasing exploration expenses by approximately $31 million before-tax. The well, located south of the Kuparuk River Unit and east of the Colville River on state lands, is in an area that we are continuing to evaluate. See Note 6. •
Higher produced gas volumes
Willow Update
In March 2023, the Department of Interior published its ROD approving our Willow project in our Greater Prudhoe Area.
The production increase was partly offset by normal field decline.Alaska, which adopted a plan consisting of three core pads. In December, following a Ninth Circuit Court of Appeals denial of a request for an injunction, we reached FID on the Willow project and began winter construction.
| | | | | |
ConocoPhillips 20222023 10-K | 4244 |
Lower 48
| | | 2022 | 2021 | 2020 |
Net Income (Loss) Attributable to ConocoPhillips ($MM) | $ | 11,015 | | 4,932 | | (1,122) | |
| 2023 | |
| 2023 | |
| 2023 | | 2022 | 2021 |
Net Income (Loss) ($MM) | |
| | Average Net Production | Average Net Production | |
| Average Net Production | |
| Average Net Production | |
| Crude oil (MBD) | |
| Crude oil (MBD) | |
| Crude oil (MBD) | Crude oil (MBD) | 534 | | 447 | | 213 | |
| Natural gas liquids (MBD)* | Natural gas liquids (MBD)* | 221 | | 110 | | 74 | |
| Natural gas (MMCFD)* | Natural gas (MMCFD)* | 1,402 | | 1,340 | | 585 | |
Total Production (MBOED) | Total Production (MBOED) | 989 | | 780 | | 385 | |
| | Average Sales Prices | Average Sales Prices | |
| Average Sales Prices | |
| Average Sales Prices | |
| Crude oil ($ per bbl) | |
| Crude oil ($ per bbl) | |
| Crude oil ($ per bbl) | Crude oil ($ per bbl) | $ | 94.46 | | 66.12 | | 35.17 | |
| Natural gas liquids ($ per bbl) | Natural gas liquids ($ per bbl) | 35.36 | | 30.63 | | 12.13 | |
| Natural gas ($ per mcf) | Natural gas ($ per mcf) | 5.92 | | 4.38 | | 1.65 | |
*Includes conversion of previously acquired Concho two-stream contracts to three-stream initiated in the fourth quarter of 2021.
The Lower 48 segment consists of operations located in the contiguous U.S. and the Gulf of Mexico and commercial operations. During 2022,2023, the Lower 48 contributed 64 percent of our consolidated liquids production and 7276 percent of our consolidated natural gas production.
Net Income (Loss) Attributable to ConocoPhillips
Lower 48 reported earnings of $11,015$6,461 million in 2022,2023, compared with earnings of $4,932$11,015 million in 2021. 2022. Earnings were negatively impacted by:
•Lower realized commodity prices.
•Higher DD&A expenses primarily due to higher rates from reserve revisions resulting from higher operating costs as well as higher production volumes.
•Higher production and operating expenses primarily due to higher production volumes and increased well work activity.
Earnings were positively impacted by:
•Higher realized prices.sales volumes.
•Higher sales volumes primarily related to our Shell Permian Acquisition. See Note 3.Improved commercial performance and timing. •Absence of one-time impacts from our Concho and Shell Permian acquisitions including realized losses on hedges related to derivative positions acquired in our Concho acquisition and higher selling, general and administrative expenses for transaction and restructuring charges. See Note 12. Earnings were negatively impacted by:
•Higher production and operating expenses, DD&A expenses andLower taxes other than income taxes primarily due todriven by lower realized prices, partially offset by higher production volumes, primarily from our Shell Permian acquisition, realized commodity prices and inflation. Partially offsetting the increase in DD&A expenses were lower rates from reserve additions, primarily from additional development drilling in our unconventional plays and certain technical revisions.volumes.
Production
Total average production increased 20978 MBOED in 20222023 compared with 2021,2022, primarily due to:
•Newto new wells online from our development programs in Delaware Basin, Midland Basin, Eagle Ford Midland Basin and Bakken.
•Higher volumes due to our Shell Permian acquisition, partially offset by assets divested. See Note 3.•Conversion of previously acquired Concho contracted volumes from a two-stream to a three-stream basis.
These production increases were partly offset by normal field decline.
Asset Acquisitions and Dispositions
We completed multiple divestitures of noncore oil and gas assets during 2022 totaling approximately $680 million in proceeds after customary adjustments. These divested assets averaged approximately 18 MBOED. We also cored up strategic positions through acquisitions of approximately $250 million after customary adjustments. See Note 3.
| | | | | |
4345 | ConocoPhillips 20222023 10-K |
Canada
| | | 2022 | 2021 | 2020 |
Net Income (Loss) Attributable to ConocoPhillips ($MM) | $ | 714 | | 458 | | (326) | |
| 2023 | |
| 2023 | |
| 2023 | | 2022 | 2021 |
Net Income (Loss) ($MM) | |
| | Average Net Production | Average Net Production | |
| Average Net Production | |
| Average Net Production | |
| Crude oil (MBD) | |
| Crude oil (MBD) | |
| Crude oil (MBD) | Crude oil (MBD) | 6 | | 8 | | 6 | |
| Natural gas liquids (MBD) | Natural gas liquids (MBD) | 3 | | 4 | | 2 | |
| Bitumen (MBD) | Bitumen (MBD) | 66 | | 69 | | 55 | |
| Natural gas (MMCFD) | Natural gas (MMCFD) | 61 | | 80 | | 40 | |
Total Production (MBOED) | Total Production (MBOED) | 85 | | 94 | | 70 | |
| | Average Sales Prices | Average Sales Prices | |
| Average Sales Prices | |
| Average Sales Prices | |
| Crude oil ($ per bbl) | |
| Crude oil ($ per bbl) | |
| Crude oil ($ per bbl) | Crude oil ($ per bbl) | $ | 79.94 | | 56.38 | | 23.57 | |
| Natural gas liquids ($ per bbl) | Natural gas liquids ($ per bbl) | 37.70 | | 31.18 | | 5.41 | |
| Bitumen ($ per bbl) | Bitumen ($ per bbl) | 55.56 | | 37.52 | | 8.02 | |
| Natural gas ($ per mcf) | 3.62 | | 2.54 | | 1.21 | |
| Natural gas ($ per mcf)* | |
*Average sales prices include unutilized transportation costs.
Our Canadian operations consist of the Surmont oil sands development in Alberta, and the liquids-rich Montney unconventional play in British Columbia and commercial operations. In 2022,2023, Canada contributed sixseven percent of our consolidated liquids production and three percent of our consolidated natural gas production.
Net Income (Loss) Attributable to ConocoPhillips
Canada operations reported earnings of $714$402 million in 20222023 compared with earnings of $458$714 million in 2021. 2022. Earnings were negatively impacted by:
•Lower realized commodity prices.
•Absence of contingent payments received associated with the prior sale of certain assets to CVE. The term of CVE contingent payments ended in the second quarter of 2022.
Earnings were positively impacted by:
•Higher realized prices.sales volumes primarily related to our Surmont acquisition which closed in October 2023. See Note 3. •Contingent paymentsAbsence of $282 million in 2022 associated with the sale of certain assets to CVE in 2017 compared with $246 million in 2021.
Earnings were negatively impacted by:
•Higherprior year exploration expenses primarily related to the impairment of certain aged, suspended wells. See Note 6.•Lower sales volumes.
•A $92 million tax benefit recognized upon the closing of a Canada Revenue Agency audit. Higher production and operating expenses primarily due to higher fuel gas and electricity prices at Surmont.See Note 17.Production
Total average production decreased 9increased 19 MBOED in 20222023 compared with 2021.2022. The production decreaseincrease was primarily due to:
•Normal field decline.Higher volumes due to our Surmont acquisition in the fourth quarter of 2023. See Note 3. •Higher royalty rates acrossNew wells online from our development program in the segment due to higher commodity prices.
•Planned turnarounds in our Montney assets and at the Surmont Central Processing Facility 1.Montney.
These production decreasesincreases were partly offset by new wells onlinenormal field decline.
Surmont Acquisition
On October 4, 2023, we completed the acquisition of the remaining 50 percent working interest in our Montney asset.Surmont. Total consideration was approximately $2.7 billion in cash after customary adjustments, as well as future contingent payments of up to approximately $0.4 billion CAD (approximately $0.3 billion). Production from the acquired interest averaged approximately 62 MBD of bitumen in the fourth quarter of 2023. See Note 3. | | | | | |
ConocoPhillips 20222023 10-K | 4446 |
Europe, Middle East and North Africa
| | | 2022 | 2021 | 2020 |
Net Income (Loss) Attributable to ConocoPhillips ($MM) | $ | 2,244 | | 1,167 | | 448 | |
| 2023 | |
| 2023 | |
| 2023 | | 2022 | 2021 |
Net Income (Loss) ($MM) | |
| | Consolidated Operations | Consolidated Operations | |
| Consolidated Operations | |
| Consolidated Operations | |
| Average Net Production | Average Net Production | |
| Average Net Production | |
| Average Net Production | |
| Crude oil (MBD) | |
| Crude oil (MBD) | |
| Crude oil (MBD) | Crude oil (MBD) | 107 | | 118 | | 86 | |
| Natural gas liquids (MBD) | Natural gas liquids (MBD) | 3 | | 4 | | 4 | |
| Natural gas (MMCFD) | Natural gas (MMCFD) | 328 | | 313 | | 275 | |
Total Production (MBOED) | Total Production (MBOED) | 165 | | 175 | | 136 | |
| | Average Sales Prices | Average Sales Prices | |
| Average Sales Prices | |
| Average Sales Prices | |
| Crude oil ($ per bbl) | |
| Crude oil ($ per bbl) | |
| Crude oil ($ per bbl) | Crude oil ($ per bbl) | $ | 99.20 | | 68.97 | | 43.30 | |
| Natural gas liquids ($ per bbl) | Natural gas liquids ($ per bbl) | 54.52 | | 43.97 | | 23.27 | |
| Natural gas ($ per mcf) | Natural gas ($ per mcf) | 33.39 | | 13.27 | | 3.23 | |
The Europe, Middle East and North Africa segment consists of operations principally located in the Norwegian sector of the North Sea;Sea, the Norwegian Sea; Qatar; Libya;Sea, Qatar, Libya, and commercial and terminalling operations in the U.K. In 2022,2023, our Europe, Middle East and North Africa operations contributed nine percent of our consolidated liquids production and 1716 percent of our consolidated natural gas production.
Net Income (Loss) Attributable to ConocoPhillips
The Europe, Middle East and North Africa segment reported earnings of $2,244$1,189 million in 20222023 compared with earnings of $1,167$2,244 million in 2021.2022. Earnings were positivelynegatively impacted by:
•HigherLower realized commodity prices.
•HigherLower equity in earnings of affiliates primarily due to higherlower LNG sale prices.
•Foreign exchange gains as the USD strengthened against the Norwegian Kroner.Lower commercial performance and timing.
Earnings were negatively impacted by:
•Lower sales volumes.volumes in Norway.
•Lower foreign exchange gains resulting from the USD strengthening against the NOK.
Consolidated Production
Average consolidated production decreased 10 MBOED in 2022, compared with 2021. The consolidated production decrease was primarily due to:
•Normal field decline.
•Field-wide turnarounds in the Greater Ekofisk Area of Norway.
•Unplanned downtime across our Norway assets.
These production decreases were partly offset by:
•New wells online, improved performance and higher gas exports in Norway.
Qatar Interest
During 2022, we were awarded a 25 percent interest in a new joint venture with QatarEnergy that will participate in the NFE LNG project. Formation of the NFE joint venture (QG8) closed in December 2022. Once complete, the NFE project will have the capacity to produce 32 MTPA. See Note 3andNote 4.Libya Acquisition
In November 2022, we, along with TotalEnergies completed the joint acquisition of Hess Libya Waha Ltd, which increased our interest in the Waha Concession by 4.1 percent to 20.4 percent.
Exploration Activity
In 2022, we drilled four operated wells and participated in one partner operated well, all of which were determined to be dry holes, including the Slagugle appraisal well which effectively delineated the 2020 discovery. Slagugle is a discovery that we are continuing to evaluate.
| | | | | |
45 | ConocoPhillips 2022 10-K |
Asia Pacific
| | | | | | | | | | | |
| | | |
| 2022 | 2021 | 2020 |
Net Income (Loss) Attributable to ConocoPhillips ($MM) | $ | 2,736 | | 453 | | 962 | |
| | | |
| Consolidated Operations | | | |
| Average Net Production | | | |
| Crude oil (MBD) | 61 | | 65 | | 69 | |
| Natural gas liquids (MBD) | — | | — | | 1 | |
| Natural gas (MMCFD) | 114 | | 360 | | 429 | |
Total Production (MBOED) | 80 | | 125 | | 141 | |
| | | |
| Average Sales Prices | | | |
| Crude oil ($ per bbl) | $ | 105.52 | | 70.36 | | 42.84 | |
| Natural gas liquids ($ per bbl) | — | | — | | 33.21 | |
| Natural gas ($ per mcf) | 5.84 | | 6.56 | | 5.39 | |
At December 31, 2022, the Asia Pacific segment had operations in China, Malaysia, and Australia, and commercial operations in China, Singapore and Japan. During 2022, Asia Pacific contributed five percent of our consolidated liquids production and six percent of our consolidated natural gas production.
Net Income (Loss) Attributable to ConocoPhillips
Asia Pacific reported earnings of $2,736 million in 2022, compared with $453 million in 2021. The increase in earnings was mainly due to:
•Higher equity in earnings of affiliates reflecting higher LNG sales prices as well as our increased interest in APLNG.
•Absence of a $688 million after-tax impairment on our APLNG investment. See Note 4 and Note 13.•Higher realized crude prices.
•After-tax gain of $534 million associated with the divestiture of our Indonesian assets. See Note 3.•Lower DD&A expenses driven by the divestiture of our Indonesia assets.
•Lower production and operating expenses primarily associated with the divestiture of our Indonesia assets and lower production costs in China.
Earnings were negatively impacted by:
•Absence of an after-tax gain of $200 million recognized in the first quarter of 2021 related to a contingent payment from our Australia-West divestiture in 2020. See Note 3 and Note 11.•Lower sales volumes primarily due to the divestiture of our Indonesia assets.
•Higher taxes other than income taxes primarily due to higher realized crude oil prices.
Consolidated Production
Average consolidated production increased 3 MBOED in 2023, compared with 2022. The consolidated production increase was primarily due to:
•Higher production in 2023 from additional interest acquired in Libya's Waha Concession in the fourth quarter of 2022.
The production increase was partly offset by:
•Normal field decline in Norway.
•Higher downtime on partner-operated assets in Norway.
Qatar Interest
During 2022, we were awarded a 25 percent interest in NFS3, a new joint venture with QatarEnergy to participate in the NFS LNG project. Formation of NFS3 closed in June 2023. See Note 3andNote 4. Exploration Activity
During 2023, we recorded $37 million before-tax as dry hole expense for the Norwegian Warka suspended discovery well on license PL1009 that was drilled in 2020.
| | | | | |
| 47 | ConocoPhillips 2023 10-K |
Asia Pacific
| | | | | | | | | | | |
| | | |
| 2023 | 2022 | 2021 |
Net Income (Loss) ($MM) | $ | 1,961 | | 2,736 | | 453 | |
| | | |
| Consolidated Operations | | | |
| Average Net Production | | | |
| Crude oil (MBD) | 60 | | 61 | | 65 | |
| | | |
| Natural gas (MMCFD) | 48 | | 114 | | 360 | |
Total Production (MBOED) | 68 | | 80 | | 125 | |
| | | |
| Average Sales Prices | | | |
| Crude oil ($ per bbl) | $ | 84.79 | | 105.52 | | 70.36 | |
| | | |
| Natural gas ($ per mcf) | 3.95 | | 5.84 | | 6.56 | |
The Asia Pacific segment consists of operations in China, Malaysia, and Australia, and commercial operations in China, Singapore and Japan. During 2023, Asia Pacific contributed five percent of our consolidated liquids production and three percent of our consolidated natural gas production.
Net Income (Loss)
Asia Pacific reported earnings of $1,961 million in 2023, compared with $2,736 million in 2022. Earnings were negatively impacted by:
•Absence of an after-tax gain of $534 million associated with the divestiture of our Indonesia assets. See Note 3. •Lower realized commodity prices.
•Lower equity in earnings of affiliates resulting from lower LNG sales prices.
•Lower sales volumes.
Earnings were positively impacted by:
•Recognized tax benefits from the reversal of a tax reserve and deepwater tax incentives. See Note 17. •Lower taxes other than income taxes primarily due to lower realized commodity prices.
Consolidated Production
Average consolidated production decreased 4512 MBOED in 2022,2023, compared with 2021.2022. The decrease was primarily due to:
•Normal field decline.
•The divestiture of our Indonesia assets in the first quarter of 2022.
•Normal field decline.
These production decreases were partly offset by development activity at Bohai Bay in China and new wells online in Malaysia.
Asset AcquisitionsPlanned Acquisition Update
In March 2023, we announced that, subject to the closing of EIG's transaction with Origin Energy, we planned to take over operatorship of the upstream assets and Dispositions
In the first quarter of 2022, we completed the acquisition ofpurchase up to an additional 102.49 percent shareholding interest in APLNG increasing our ownership to 47.5 percent. Also inAPLNG. In December 2023, Origin Energy shareholders did not approve the first quarter, we completed the divestiture of our subsidiaries that held our Indonesia assets and operations. Production from the disposed assets averaged approximately 33 MBOED in the three-months ended March 31, 2022. See Note 3.transaction.
| | | | | |
ConocoPhillips 20222023 10-K | 4648 |
Other International | | | | | | | | | | | |
| | | |
| 2022 | 2021 | 2020 |
Net Income (Loss) Attributable to ConocoPhillips ($MM) | $ | (51) | | (107) | | (64) | |
| | | | | | | | | | | |
| | | |
| 2023 | 2022 | 2021 |
Net Income (Loss) ($MM) | $ | (13) | | (51) | | (107) | |
The Other International segment includes interests in Colombia as well as contingenciesconsists of activities associated with prior operations in other countries.
Earnings from our Other International operations improved $56$38 million in 2022,2023, compared with 2021,2022, primarily due to the absence of a $137 million after-tax loss on divestiture related to our Argentina exploration interests, partially offset by higher taxes related to legal settlements in 2022.
Corporate and Other
| | Millions of Dollars |
| 2022 | 2021 | 2020 |
| Net Income (Loss) Attributable to ConocoPhillips | |
| Millions of Dollars | | | Millions of Dollars |
| 2023 | | | 2023 | 2022 | 2021 |
| Net Income (Loss) | |
| Net interest expense | Net interest expense | $ | (600) | | (801) | | (662) | |
| Corporate general and administrative expenses | (244) | | (317) | | (200) | |
| Net interest expense | |
| Net interest expense | |
| Corporate G&A expenses | |
| Technology | Technology | 32 | | 25 | | (26) | |
| Other income (expense) | Other income (expense) | 482 | | 883 | | (992) | |
| $ | (330) | | (210) | | (1,880) | |
| $ | |
Net interest consists of interest and financing expense, net of interest income and capitalized interest. Net interest expense improved $201decreased $240 million in 2022,2023, compared with 2021,2022, primarily due to higher interest income as well asin addition to lower interest expenses as a result of our debt reduction transactions.due to higher capitalized interest for longer term major projects. See Note 9. Corporate G&A expenses include compensation programs and staff costs. These expenses decreasedincreased by $73$113 million in 20222023 compared with 2021,2022, primarily due to the absence of restructuring expenses associated with our Concho acquisition, partially offset by mark-to-market adjustments associated with certain compensation programs. See Note 16. Technology includes our investmentinvestments in low-carbon technologies as well as other new technologies or businesses as well asand licensing revenues. ActivitiesOther new technologies or businesses and LNG licensing activities are focused on both conventional and tight oil reservoirs, shale gas, heavy oil, oil sands, enhanced oil recovery as well as LNG.
Other income (expense) ("Other")or "Other" includes certain corporate tax-related items, foreign currency transaction gains and losses, environmental costs associated with sites no longer in operation, other costs not directly associated with an operating segment, gains or losses on early retirement of debt, holding gains or losses on equity securities and pension settlement expense. Earnings in “Other” decreased by $401$552 million in 20222023 compared with 2021.2022. This was primarily due toto:
•Absence of a gain$474 million federal tax benefit. See Note 17. •Absence of a $251 million ongain associated with our CVE common shares, which were fully divested in the first quarter of 2022. See Note 5. •Loss of $89 million associated with forward foreign exchange contracts to buy CAD, in support of our acquisition of additional working interest in Surmont. See Note 3. •Absence of a gain of $62 million associated with 2022 compared with a $1,040 million gain in 2021. Earnings in "Other" also decreased due todebt restructuring transactions. See Note 9.
The decreases were offset by:
•Absence of a $101 million tax impact associated with the disposition of our Indonesia assets and higherin the first quarter of 2022. See Note 3. •Absence of an $81 million impact from certain legal accrualsaccruals.
Port Arthur LNG Acquisition
In March, we acquired a 30 percent direct equity holding in PALNG, a joint venture for the development of $81 million. Offsetting the decreases to earnings in "Other" include a $474 million federal tax benefit associated with the closingPhase 1 of the 2017 auditPort Arthur LNG project. In addition, we entered into a 20-year agreement to purchase 5 MTPA of our U.S. federal income tax return,LNG offtake at the absencestart of Phase 1 and a release of a $92 million deferred tax asset associated with prior dispositions and recognizing an after-tax gain of $62 million associated withnatural gas supply management agreement, whereby we will manage the debt restructuring transactions.feedgas supply requirements for Phase 1. Currently we anticipate start up in 2027. See Note 3. | | | | | |
4749 | ConocoPhillips 20222023 10-K |
| | | | | |
| Capital Resources and Liquidity | |
Capital Resources and Liquidity
Financial Indicators
| | Millions of Dollars
Except as Indicated | | | Millions of Dollars
Except as Indicated |
| 2023 | | | 2023 | 2022 | 2021 |
| | Millions of Dollars
Except as Indicated |
| 2022 | 2021 | 2020 |
| | Net cash provided by operating activities | |
| Net cash provided by operating activities | |
| Net cash provided by operating activities | Net cash provided by operating activities | $ | 28,314 | | 16,996 | | 4,802 | |
| Cash and cash equivalents | Cash and cash equivalents | 6,458 | | 5,028 | | 2,991 | |
| Short-term investments | Short-term investments | 2,785 | | 446 | | 3,609 | |
| Short-term debt | Short-term debt | 417 | | 1,200 | | 619 | |
| Total debt | Total debt | 16,643 | | 19,934 | | 15,369 | |
| Total equity | Total equity | 48,003 | | 45,406 | | 29,849 | |
| Percent of total debt to capital* | Percent of total debt to capital* | 26 | % | 31 | | 34 | |
| Percent of floating-rate debt to total debt | Percent of floating-rate debt to total debt | 2 | % | 4 | | 7 | |
*Capital includes total debt and total equity.
To meet our short- and long-term liquidity requirements, we look to a variety of funding sources, including cash generated from operating activities, proceeds from asset sales, our commercial paper and credit facility programs and our ability to sell securities using our shelf registration statement. In 2022,2023, the primary uses of our available cash were $10.2$11.2 billion to support our ongoing capital expenditures and investments program, $9.3$2.7 billion for the acquisition of an additional 50 percent working interest in Surmont, $5.4 billion to repurchase common stock, $5.7and $5.6 billion to pay the ordinary dividend and VROC, $3.4VROC. In addition to cash from operating activities, the other primary sources of additional capital were $2.7 billion in proceeds from long-term debt issuances to reduce debt through refinancing transactionsfund the Surmont acquisition and retirements and $2.6$1.4 billion net purchasessales of short-term investments. In 2022,2023, cash and cash equivalents increaseddecreased by over $1.4$0.8 billion to $6.5$5.6 billion.See Note 9. At December 31, 2022,2023, we had cash and cash equivalents of $6.5$5.6 billion, short-term investments of $2.8$1.0 billion, and available borrowing capacity under our credit facility of $5.5 billion, totaling approximately $14.8$12.1 billion of liquidity. We believe current cash balances and cash generated by operations, together with access to external sources of funds as described below in the “Significant Changes in Capital” section, will be sufficient to meet our funding requirements in the near- and long-term, including our capital spending program, dividend payments and required debt payments.
Significant Changes in Capital
Operating Activities
Cash provided by operating activities continued to increase in 2022 totaling $28.32023 totaled $20.0 billion, compared with $28.3 billion for 2022, and $17.0 billion for 2021,2021. The decrease in cash provided by operating activities from 2022 is primarily due to lower realized commodity prices across all products, partly offset by higher sales volumes, net of associated production and $4.8 billion for 2020. operating costs.
The increase in cash provided by operating activities from 2022 compared to 2021 is primarily due to higher realized commodity prices, higher sales volumes mostly due to our acquisition of Shell Permian assets and the absence of the 2021 settlement of oil and gas hedging positions acquired from Concho. The increase in cash provided by operating activities was partly offset by foreign tax and royalty payments in Libya and foreign tax payments in Norway in addition to U.S. tax payments.
The increase in cash from 2021 compared to 2020 is primarily due to higher realized commodity prices and higher sales volumes, mostly resulting from our acquisition of Concho. The increase was partly offset by the $0.8 billion in settlement of oil and gas hedging positions acquired from Concho and approximately $0.4 billion of transaction and restructuring costs.
Our short- and long-term operating cash flows are highly dependent upon prices for crude oil, bitumen, natural gas, LNG and NGLs. Prices and margins in our industry have historically been volatile and are driven by market conditions over which we have no control. Absent other mitigating factors, as these prices and margins fluctuate, we would expect a corresponding change in our operating cash flows.
| | | | | |
ConocoPhillips 20222023 10-K | 4850 |
| | | | | |
| Capital Resources and Liquidity | |
The level of absolute production volumes, as well as product and location mix, impactsis another significant factor impacting our cash flows. Full-year production averaged 1,7381,826 MBOED in 2022,2023, an increase of 17188 MBOED or 115 percent compared to 2021.2022. First quarter 20232024 production is expected to be 1.721.88 MMBOED to 1.761.92 MMBOED. Future production is subject to numerous uncertainties, including, among others, the volatile crude oil and natural gas price environment, which may impact investment decisions; the effects of price changes on production sharing and variable-royalty contracts; acquisition and disposition of fields; field production decline rates; new technologies; operating efficiencies; timing of startups and major turnarounds; political instability; weather-related disruptions; and the addition of proved reserves through exploratory success and their timely and cost-effective development. While we actively monitor and manage these factors, changes in production levels can cause variability in cash flows, although we generally thisexperience less variability has not been as significant as that caused byin our cash flows due to changes in production levels than due to changes in commodity prices.
As discussed in the “Critical Accounting Estimates” section, engineering estimates of proved reserves are imprecise; therefore, reserves may be revised upward or downward each year due to the impact of changes in commodity prices or as more technical data becomes available on reservoirs. It is not possible to reliably predict how revisions will impact future reserve quantities.
Investing Activities
In 2022,2023, we invested $10.2$11.2 billion in capital expenditures andand investments; $2.1$1.5 billion of which was acquisition capital for the additional 10 percent interestprimarily payments towards our investments in APLNG, certain Lower 48 assetsLNG projects, including PALNG, NFE4 and the payments toward our investment in QG8. NFS3. See Note 3.The remaining $8.1$9.7 billion funded our operating capital program inclusive of growth in the Lower 48 segment through the integration of Concho and Shell Permian assets.program. Capital expenditures invested in 2022 and 2021 and 2020 were $5.3$10.2 billion and $4.7$5.3 billion, respectively. See the “Capital Expenditures and Investments” section.
In October 2023, we acquired the remaining 50 percent working interest in Surmont from TotalEnergies EP Canada Ltd. for approximately $2.7 billion of cash after customary adjustments. We funded this transaction by issuing new long-term debt. See Note 3 and Note 9.
Proceeds from asset sales were $0.6 billion in 2023 compared with $3.5 billion in 2022. In 2022, we completed the monetization of our investment in CVE common shares that we began in May 2021. By the end of the first quarter of 2022, we fully divested of our investment, recognizingreceived proceeds of $1.4 billion and directing proceeds towardfor the sale of our existing share repurchase program. Since inception, we generated total remaining 91 million common shares of CVE, proceeds of $2.5 billion. See Note 5. Other proceedsapproximately $1.5 billion, primarily from dispositions receivedasset divestitures in the current year include our divestitures in Asia Pacific and Lower 48 segments, for approximately $1.5and $0.5 billion after customary adjustments and $500 million in contingent payments associated with prior divestitures. See Note 3.3 and Note 5. In December 2021, we completed our acquisition of Shell’s assets in the Delaware Basin for cash consideration of approximately $8.7 billion after customary adjustments. We funded this transaction with cash on hand. We completed our acquisition of Concho on January 15, 2021 in an all-stock transaction. The assets acquired in the transaction included $382 million of cash. The net impact of these items is recognized within “Acquisition of businesses, net of cash acquired” on our consolidated statement of cash flows. See Note 3. In 2021, total proceeds from asset dispositions were $1.7 billion. We received cash proceeds of $250 million from the sale of noncore assets in our Lower 48 segment, and $1.1 billion from sales of our investment in CVE common shares and $244 million of contingent payments related to dispositions completed before 2021. See Note 3 and Note 5. In 2020, proceeds from asset sales were $1.3 billion. We received cash proceeds of $765 million for the divestiture of our Australia-West assets and operations. We also received proceeds of $359 million and $184 million from the sale of our Niobrara interests and Waddell Ranch interests in the Lower 48, respectively. See Note 3.We invest in short-term investments as part of our cash investment strategy, the primary objective of which is to protect principal, maintain liquidity and provide yield and total returns; these investments include time deposits, commercial paper, as well as debt securities classified as available for sale. Funds for short-term needs to support our operating plan and provide resiliency to react to short-term price volatility are invested in highly liquid instruments with maturities within the year. Funds we consider available to maintain resiliency in longer term price downturns and to capture opportunities outside a given operating plan may be invested in instruments with maturities greater than one year. See Note 12 and Note 19.
Investing activities in 2023 included net sales of $1,373 million of investments. We had net sales of $2,111 million of short-term instruments and net purchases of $738 million of long-term instruments. See Note 19. | | | | | |
4951 | ConocoPhillips 20222023 10-K |
| | | | | |
| Capital Resources and Liquidity | |
Financing Activities
Our debt balance at December 31, 2023 was $18.9 billion compared with $16.6 billion at December 31, 2022. The current portion of debt, including payments for finance leases, is $1.1 billion. In February2023, we issued $2.7 billion principal amount of new debt to fund our acquisition of the remaining 50 percent working interest in Surmont and completed refinancing transactions consisting of $1.1 billion in tender offers to repurchase existing debt with cash and a $1.1 billion new debt issuance to fund the repurchases, extending the weighted average maturity of our portfolio from 15 to 17 years and reducing near-term debt maturities. SeeNote 9. In 2022, we repurchased notes, retired floating rate debt, and executed a debt refinancing comprised of concurrent transactions including new debt issuances, a cash tender offer and debt exchange offers. In aggregate, these transactions along with naturally maturing debt, reduced the company's total debt by $3.3 billion.
In 2022, we refinanced our revolving credit facility from a total aggregate principal amount of $6.0 billion to $5.5 billion with an expiration date of February 2027. Our revolving credit facility may be used for direct bank borrowings, the issuance of letters of credit totaling up to $500 million, or as support for our commercial paper program. The revolving credit facility is broadly syndicated among financial institutions and does not contain any material adverse change provisions or any covenants requiring maintenance of specified financial ratios or credit ratings. The facility agreement contains a cross-default provision relating to the failure to pay principal or interest on other debt obligations of $200 million or more by ConocoPhillips, or any of its consolidated subsidiaries. The amount of the facility is not subject to the redetermination prior to its expiration date.
Credit facility borrowings may bear interest at a margin above the Secured Overnight Financing Rate (SOFR). The agreement calls for commitment fees on available, but unused, amounts. The agreement also contains early termination rights if our current directors or their approved successors cease to be a majority of the Board of Directors.
The revolving credit facility supports ConocoPhillips Company’s ability to issue up to $5.5 billion of commercial paper, which is primarily a funding source for short-term working capital needs. Commercial paper maturities are generally limited to 90 days. With no commercial paper outstanding and no direct borrowings or letters of credit, we had access to $5.5 billion in available borrowing capacity under our revolving credit facility at December 31, 2022.2023.
Our debt balance atIn December 31, 2022 was $16.6 billion compared with $19.9 billion at December 31, 2021. The current portion of debt, including payments for finance leases, is $0.4 billion.In 2022, we repurchased notes, retired floating rate debt, and executed a debt refinancing comprised of concurrent transactions including new debt issuances, a cash tender offer and debt exchange offers. In aggregate, these transactions along with naturally maturing debt, reduced the company's total debt by $3.3 billion. The refinancing facilitates2023, Fitch affirmed our ability to achieve our previously announced $5 billion debt reduction target by the end of 2026 while also reducing the company's annual cash interest expense.
long-term credit ratings. The current credit ratings on our long-term debt are:
•Fitch: “A” with a “stable” outlook
•S&P: “A-” with a “stable” outlook
•Moody's: "A2""A2" with a "stable""stable" outlook
See Note 9 for additional information on debt and the revolving credit facility and credit ratings.facility. We do not have any ratings triggers on any of our corporate debt that would cause an automatic default, and thereby impact our access to liquidity, upon downgrade of our credit ratings. If our credit ratings are downgraded from their current levels, it could increase the cost of corporate debt available to us and restrict our access to the commercial paper markets. If our credit rating were to deteriorate to a level prohibiting us from accessing the commercial paper market, we would still be able to access funds under our revolving credit facility.
Certain of our project-related contracts, commercial contracts and derivative instruments contain provisions requiring us to post collateral. Many of these contracts and instruments permit us to post either cash or letters of credit as collateral. At December 31, 20222023 and December 31, 2021,2022, we had direct bank letters of credit of $368$340 million and $337$368 million, respectively, which secured performance obligations related to various purchase commitments incident to the ordinary conduct of business. In the event of a credit rating downgrade, we may be required to post additional letters of credit.
Shelf Registration
We have a universal shelf registration statement on file with the SEC under which we have the ability to issue and sell an indeterminate amount of various types of debt and equity securities.
| | | | | |
ConocoPhillips 20222023 10-K | 5052 |
| | | | | |
| Capital Resources and Liquidity | |
Capital Requirements
For information about our capital expenditures and investments, see the “Capital Expenditures and Investments” section.
Our debt balance at December 31, 2022,2023, was $16.6$18.9 billion, a decreasean increase of $3.3$2.3 billion from the balance at December 31, 20212022 of $19.9$16.6 billion. As partIn 2023, we issued $2.7 billion principal amount of new debt to fund our objectiveacquisition of the remaining 50 percent working interest in Surmont and completed refinancing transactions consisting of $1.1 billion in tender offers to maintainrepurchase existing debt with cash and a strong balance sheet, we announced in 2021 our intention$1.1 billion new debt issuance to reduce our total debt by $5 billion byfund the end of 2026.repurchases. In 2022, we executed concurrent debt refinancing transactions, repurchased existing notes, and retired floating rate notes upon natural maturity, that in aggregate reduced the company'sour total debt by $3.3 billion and progressed the achievement of our debt reduction target while also lowering our annual cash interest expense and extending the weighted average maturity of our debt portfolio. See See Note 9.9 for information regarding debt and Note19 for information regarding non-cash consideration of the Surmont transaction.
In February 2023,2024, we announced our 20232024 planned return of capital to shareholders of $11$9 billion through our three-tier return of capital framework. We plan to deliver a compelling, growing ordinary dividend, through-cycle share repurchases and a VROC payment. The VROC provides a flexible tool for meeting our commitment of returning greater than 30 percent of cash from operating activities during periods where commodity prices are meaningfully higher than our planning price range. Our 20222023 total capital returned was $15$11 billion.
Consistent with our commitment to deliver value to shareholders, in 2022,for the full year of 2023, we paid ordinary dividends of $1.89$2.11 per common share and VROC payments of $2.60$2.50 per common share. This was an increase over 2021 and 2020,2022 when we paid only ordinary dividends of $1.75$1.89 and $1.69VROC payments of $2.60 per common share respectively.and an increase over 2021 when we paid an ordinary dividend of $1.75 per common share. In February 2023,2024, we declared a first quarter ordinary dividend of $0.51 cents$0.58 per common share and a VROC payment of $0.60 cents$0.20 per share. The ordinary dividend of $0.51 cents percommon share, isboth payable March 1, 2023,2024, to shareholders of record on February 14, 2023. The VROC of $0.60 cents per share is payable April 14, 2023, to shareholders of record on March 29, 2023.19, 2024.
The ordinary dividend and VROC are subject to numerous considerations and will beare determined and approved each quarter by the Board of Directors. If approved, we expectAll VROC payments to announcedate have been declared along with the VROC when we announce our ordinary dividend, but the quarterly payouts will be staggered from the ordinary dividend and paid in the subsequentfollowing quarter. However, beginning in the first quarter resultingof 2024, we plan to pay any quarterly dividend and VROC payment concurrently and will announce such payments in up to eight cash distributions throughout the year.same quarter they will be paid.
In late 2016, we initiated our current share repurchase program. In October 2022, our Board of Directors approved an increase to our authorization from $25 billion to $45 billion of our common stock to support our plan for future share repurchases. Share repurchases were $5.4 billion, $9.3 billion, and $3.6 billion in 2023, 2022, and $0.9 billion in 2022, 2021, and 2020, respectively. As of December 31, 2022,2023, share repurchases since the inception of our current program totaled 334.8383.4 million shares and $23.4$28.8 billion. Repurchases are made at management’s discretion, at prevailing prices, subject to market conditions and other factors.
As of December 31, 2022,2023, in addition to the priorities described above, we have contractual obligations to purchase goods and services of approximately $19.2$29.7 billion. We expect to fulfill $8.8$7.4 billion of these obligations in 2023.2024. These figures exclude purchase commitments for jointly owned fields and facilities where we are not the operator. Purchase obligations of $5.0$9.8 billion are related to agreements to access and utilize the capacity of third-party equipment and facilities, including pipelines and LNG product terminals, to transport, process, treat and store commodities. Purchase obligations of $12.7$17.8 billion are related to market-based contracts for commodity product purchases with third parties. The remainder is primarily our net share of purchase commitments for materials and services for jointly owned fields and facilities where we are the operator.
| | | | | |
5153 | ConocoPhillips 20222023 10-K |
| | | | | |
| Capital Resources and Liquidity | |
Capital Expenditures and Investments
| | | | | | | | | | | |
| Millions of Dollars |
| 2022 | 2021 | 2020 |
| Alaska | 1,091 | | 982 | | 1,038 | |
| Lower 48 | 5,630 | | 3,129 | | 1,881 | |
| Canada | 530 | | 203 | | 651 | |
| Europe, Middle East and North Africa | 998 | | 534 | | 600 | |
| Asia Pacific | 1,880 | | 390 | | 384 | |
| Other International | — | | 33 | | 121 | |
| Corporate and Other | 30 | | 53 | | 40 | |
| Capital Program* | 10,159 | | 5,324 | | 4,715 | |
| | | | | | | | | | | |
| Millions of Dollars |
| 2023 | 2022 | 2021 |
| Alaska | $ | 1,705 | | 1,091 | | 982 | |
| Lower 48 | 6,487 | | 5,630 | | 3,129 | |
| Canada | 456 | | 530 | | 203 | |
| Europe, Middle East and North Africa | 1,111 | | 998 | | 534 | |
| Asia Pacific | 354 | | 1,880 | | 390 | |
| Other International | — | | — | | 33 | |
| Corporate and Other | 1,135 | | 30 | | 53 | |
| Capital Program* | $ | 11,248 | | 10,159 | | 5,324 | |
* Excludes capital related to acquisitions of businesses, net of capitalcash acquired.
Our capital expenditures and investments for the three-year period ended December 31, 2022,2023, totaled $20.2$26.7 billion. The 20222023 capital expenditures and investments supported key operating activities and acquisitions, primarily:
•Development activities in the Lower 48, primarily in the Delaware Basin, Eagle Ford, Midland Basin and Bakken.
•Appraisal and development activities in Alaska related to the Western North Slope and development activities in the Greater Kuparuk Area.
•Development and exploration activities in the Lower 48, primarily in the Delaware Basin, Eagle Ford, Midland Basin and Bakken.
•Appraisal and development activities at Montney as well as development and optimization and development of oil sandsSurmont in Canada.
•Development exploration and appraisal activities across assets in Norway.
•Continued development and exploration activities in Malaysia and China.
•Acquisition capitalCapital primarily associated with additional interestour investments in APLNGPALNG, NFE4 and certain Lower 48 assets as well as the payment for our investment in QG8.NFS3.
20232024 Capital Budget
In February 2023,2024, we announced our 20232024 operating plan capital is expected to be between $10.7$11.0 to $11.3$11.5 billion. The plan includes funding for ongoing development drilling programs, major projects, exploration and appraisal activities and base maintenance.
| | | | | |
ConocoPhillips 20222023 10-K | 5254 |
| | | | | |
| Capital Resources and Liquidity | |
Guarantor Summarized Financial Information
We have various cross guarantees among ConocoPhillips, ConocoPhillips Company and Burlington Resources LLC with respect to publicly held debt securities. ConocoPhillips Company is 100 percent owned by ConocoPhillips. Burlington Resources LLC is 100 percent owned by ConocoPhillips Company. ConocoPhillips and/or ConocoPhillips Company have fully and unconditionally guaranteed the payment obligations of Burlington Resources LLC with respect to its publicly held debt securities. Similarly, ConocoPhillips has fully and unconditionally guaranteed the payment obligations of ConocoPhillips Company with respect to its publicly held debt securities. In addition, ConocoPhillips Company has fully and unconditionally guaranteed the payment obligations of ConocoPhillips with respect to its publicly held debt securities. All guarantees are joint and several.
The following tables present summarized financial information for the Obligor Group, as defined below:
•The Obligor Group will reflect guarantors and issuers of guaranteed securities consisting of ConocoPhillips, ConocoPhillips Company and Burlington Resources LLC.
•Consolidating adjustments for elimination of investments in and transactions between the collective guarantors and issuers of guaranteed securities are reflected in the balances of the summarized financial information.
•Non-Obligated Subsidiaries are excluded from this presentation.
Transactions and balances reflecting activity between the Obligors and Non-Obligated Subsidiaries are presented separately below:
Summarized Income Statement Data
| | | | | |
| Millions of Dollars |
| 20222023 |
| Revenues and Other Income | $ | 55,63037,992 | |
| Income (loss) before income taxes* | 18,43810,737 | |
| Net income (loss) | 18,680 |
Net Income (Loss) Attributable to ConocoPhillips | 18,68010,957 | |
*Includes approximately $9.0$7.9 billion of purchased commodities expense for transactions with Non-Obligated Subsidiaries.
Summarized Balance Sheet Data
| | | | | |
| Millions of Dollars |
| December 31, 20222023 |
| Current assets | $ | 10,7668,008 | |
| Amounts due from Non-Obligated Subsidiaries, current | 1,8921,565 | |
| Noncurrent assets | 79,26991,155 | |
| Amounts due from Non-Obligated Subsidiaries, noncurrent | 6,5528,936 | |
| Current liabilities | 8,2017,337 | |
| Amounts due to Non-Obligated Subsidiaries, current | 3,2483,990 | |
| Noncurrent liabilities | 40,38949,105 | |
| Amounts due to Non-Obligated Subsidiaries, noncurrent | 24,59431,241 | |
| | | | | |
5355 | ConocoPhillips 20222023 10-K |
| | | | | |
| Capital Resources and Liquidity | |
Contingencies
We are subject to legal proceedings, claims and liabilities that arise in the ordinary course of business. We accrue for losses associated with legal claims when such losses are considered probable and the amounts can be reasonably estimated. See “Critical Accounting Estimates” and Note 11 for information on contingencies. Legal and Tax Matters
We are subject to various lawsuits and claims, including but not limited to matters involving oil and gas royalty and severance tax payments, gas measurement and valuation methods, contract disputes, environmental damages, climate change, personal injury, and property damage. Our primary exposures for such matters relate to alleged royalty and tax underpayments on certain federal, state and privately owned properties, claims of alleged environmental contamination and damages from historic operations, and climate change. We will continue to defend ourselves vigorously in these matters.
Our legal organization applies its knowledge, experience, and professional judgment to the specific characteristics of our cases, employing a litigation management process to manage and monitor the legal proceedings against us. Our process facilitates the early evaluation and quantification of potential exposures in individual cases. This process also enables us to track those cases that have been scheduled for trial and/or mediation. Based on professional judgment and experience in using these litigation management tools and available information about current developments in all our cases, our legal organization regularly assesses the adequacy of current accruals and determines if adjustment of existing accruals, or establishment of new accruals, is required. See Note 17. Environmental
We are subject to the same numerous international, federal, state, and local environmental laws and regulations as other companies in our industry. The most significant of these environmental laws and regulations include, among others, the:
•U.S. Federal Clean Air Act, which governs air emissions.emissions;
•U.S. Federal Clean Water Act, which governs discharges to water bodies.bodies;
•European Union Regulation for Registration, Evaluation, Authorization and Restriction of Chemicals (REACH).;
•U.S. Federal Comprehensive Environmental Response, Compensation and Liability Act (CERCLA or Superfund), which imposes liability on generators, transporters and arrangers of hazardous substances at sites where hazardous substance releases have occurred or are threatening to occur.occur;
•U.S. Federal Resource Conservation and Recovery Act (RCRA), which governs the treatment, storage, and disposal of solid waste.waste;
•U.S. Federal Oil Pollution Act of 1990 (OPA90), under which owners and operators of onshore facilities and pipelines, lessees or permittees of an area in which an offshore facility is located, and owners and operators of vessels are liable for removal costs and damages that result from a discharge of oil into navigable waters of the U.S.;
•U.S. Federal Emergency Planning and Community Right-to-Know Act (EPCRA), which requires facilities to report toxic chemical inventories with local emergency planning committees and response departments.departments;
•U.S. Federal Safe Drinking Water Act, which governs the disposal of wastewater in underground injection wells.wells;
•U.S. Department of the Interior regulations, which relate to offshore oil and gas operations in U.S. waters and impose liability for the cost of pollution cleanup resulting from operations, as well as potential liability for pollution damages.damages; and
•European Union Trading Directive resulting in European Emissions Trading Scheme.
These laws and their implementing regulations set limits on emissions and, in the case of discharges to water, establish water quality limits. They also establish standards and impose obligations for the remediation of releases of hazardous substances and hazardous wastes. In most cases, these regulations require permits in association with new or modified operations. These permits can require an applicant to collect substantial information in connection with the application process, which can be expensive and time-consuming. In addition, there can be delays associated with notice and comment periods and the agency’s processing of the application. Many of the delays associated with the permitting process are beyond the control of the applicant.
Many states and foreign countries where we operate also have or are developing, similar environmental laws and regulations governing these same types of activities. While similar, in some cases these regulations may impose additional, or more stringent, requirements that can add to the cost and difficulty of marketing or transporting products across state and international borders.
| | | | | |
ConocoPhillips 20222023 10-K | 5456 |
| | | | | |
| Capital Resources and Liquidity | |
The ultimate financial impact arising from environmental laws and regulations is neither clearly known nor easily determinable as new standards, such as air emission standards and water quality standards, continue to evolve. However, environmental laws and regulations, including those that may arise to address concerns about global climate change, are expected to continue to have an increasing impact on our operations in the U.S. and in other countries in which we operate. Notable areas of potential impacts include air emission compliance and remediation obligations in the U.S. and Canada.
An example is the use of hydraulic fracturing, an essential completion technique that facilitates production of oil and natural gas otherwise trapped in lower permeability rock formations. A range of local, state, federal, or national laws and regulations currently govern hydraulic fracturing operations, with hydraulic fracturing currently prohibited in some jurisdictions. Although hydraulic fracturing has been conducted for many decades, potential new laws, regulations and permitting requirements from various state environmental agencies, and others could result in increased costs, operating restrictions, operational delays and/or limit the ability to develop oil and natural gas resources. Governmental restrictions on hydraulic fracturing could impact the overall profitability or viability of certain of our oil and natural gas investments. We have adopted operating principles that incorporate established industry standards designed to meet or exceed government requirements. Our practices continually evolve as technology improves and regulations change.
We also are subject to certain laws and regulations relating to environmental remediation obligations associated with current and past operations. Such laws and regulations include CERCLA and RCRA and their state equivalents. Longer-term expenditures are subject to considerable uncertainty and may fluctuate significantly.
We occasionally receive requests for information or notices of potential liability from the EPA and state environmental agencies alleging that we are a potentially responsible party under CERCLA or an equivalent state statute. On occasion, we also have been made a party to cost recovery litigation by those agencies or by private parties. These requests, notices and lawsuits assert potential liability for remediation costs at various sites that typically are not owned by us, but allegedly contain waste attributable to our past operations. As of December 31, 2022,2023, there were 15 sites around the U.S. in which we were identified as a potentially responsible party under CERCLA and comparable state laws.
For most Superfund sites, our potential liability will be significantly less than the total site remediation costs because the percentage of waste attributable to us, versus that attributable to all other potentially responsible parties, is relatively low. Although liability of those potentially responsible is generally joint and several for federal sites and frequently so for state sites, other potentially responsible parties at sites where we are a party typically have had the financial strength to meet their obligations, and where they have not, or where potentially responsible parties could not be located, our share of liability has not increased materially. Many of the sites at which we are potentially responsible are still under investigation by the EPA or the state agencies concerned. Prior to actual cleanup, those potentially responsible normally assess site conditions, apportion responsibility and determine the appropriate remediation. In some instances, we may have no liability or attain a settlement of liability. Actual cleanup costs generally occur after the parties obtain EPA or equivalent state agency approval. There are relatively few sites where we are a major participant, and given the timing and amounts of anticipated expenditures, neither the cost of remediation at those sites nor such costs at all CERCLA sites, in the aggregate, is expected to have a material adverse effect on our competitive or financial condition.
Expensed environmental costs were $705$791 million in 20222023 and are expected to be approximately $669$937 million and $727$946 million in 20232024 and 2024,2025, respectively. Capitalized environmental costs were $239$393 million in 20222023 and are expected to be about $276$438 million and $314$450 million in 20232024 and 2024,2025, respectively.
Accrued liabilities for remediation activities are not reduced for potential recoveries from insurers or other third parties and are not discounted (except those assumed in a purchase business combination, which we do record on a discounted basis).
Many of these liabilities result from CERCLA, RCRA, and similar state or international laws that require us to undertake certain investigative and remedial activities at sites where we conduct or once conducted operations or at sites where ConocoPhillips-generated waste was disposed. The accrual also includes a number of sites we identified that may require environmental remediation but which are not currently the subject of CERCLA, RCRA, or other agency enforcement activities. The laws that require or address environmental remediation may apply retroactively and regardless of fault, the legality of the original activities or the current ownership or control of sites. If applicable, we accrue receivables for probable insurance or other third-party recoveries. In the future, we may incur significant costs under both CERCLA and RCRA.
| | | | | |
5557 | ConocoPhillips 20222023 10-K |
| | | | | |
| Capital Resources and Liquidity | |
Remediation activities vary substantially in duration and cost from site to site, depending on the mix of unique site characteristics, evolving remediation technologies, diverse regulatory agencies and enforcement policies, and the presence or absence of potentially liable third parties. Therefore, it is difficult to develop reasonable estimates of future site remediation costs.
At December 31, 2022,2023, our balance sheet included total accrued environmental costs of $182$184 million, compared with $187$182 million at December 31, 2021,2022, for remediation activities in the U.S. and Canada. We expect to incur a substantial amount of these expenditures within the next 30 years.
Notwithstanding any of the foregoing, and as with other companies engaged in similar businesses, environmental costs and liabilities are inherent concerns in our operations and products, and there can be no assurance that material costs and liabilities will not be incurred. However, we currently do not expect any material adverse effect upon our results of operations or financial position as a result of compliance with current environmental laws and regulations.
Climate Change
Continuing political and social attention to the issue of global climate change has resulted in a broad range of proposed or promulgated state, national and international laws focusing on GHG emissions reduction. These proposed or promulgated laws apply or could apply in countries where we have interests or may have interests in the future. Laws in this field continue to evolve, and while it is not possible to accurately estimate either a timetable for implementation or our future compliance costs relating to implementation, such laws, if enacted, could have a material impact on our results of operations and financial condition. Examples of legislation and precursors for possible regulation that do or could affect our operations include:
•European Emissions Trading Scheme (ETS), the program through which many of the EU member states are implementing the Kyoto Protocol. Our cost of compliance with the EU ETS in 20222023 was approximately $22$28 million (net share before-tax).
•U.K. Emissions Trading Scheme, the program with which the U.K. has replaced the ETS. Our cost of compliance with the U.K. ETS in 20222023 was approximately $0.6$0.8 million (net share before-tax).
•The Alberta Technology Innovation and Emissions Reduction (TIER) regulation requires any existing facility with emissions equal to or greater than 100,000 metric tonnes of carbon dioxide, or equivalent, per year to meet a facility benchmark intensity. We did not incur costsThe total cost of compliance related to this regulation in 2022.
•The U.S. Supreme Court decision in Massachusetts v. EPA, 549 U.S. 497, 127 S.Ct. 1438 (2007), confirmed that the EPA has the authority to regulate carbon dioxide as an “air pollutant” under the Federal Clean Air Act.
•The U.S. EPA’s announcement on March 29, 2010 (published as “Interpretation of Regulations that Determine Pollutants Covered by Clean Air Act Permitting Programs,” 75 Fed. Reg. 17004 (April 2, 2010)), and the EPA’s and U.S. Department of Transportation’s joint promulgation of a Final Rule on April 1, 2010, that triggers regulation of GHGs under the Clean Air Act, may trigger more climate-based claims for damages, and may result in longer agency review time for development projects.
•The U.S. EPA’s announcement on January 14, 2015, outlining a series of steps it plans to take to address methane and smog-forming volatile organic compound emissions from the oil and gas industry.2023 was approximately $3.5 million (net share before-tax).
•The U.S. government has announced on September 17, 2021 the Global Methane Pledge, a global initiative to reduce global methane emissions by at least 30 percent from 2020 levels by 2030.
•Carbon taxes in certain jurisdictions. Our cost of compliance with Norwegian carbon legislation in 2022 were fees of2023 was approximately $36$35 million (net share before-tax). We also incur a carbon tax for emissions from fossil fuel combustion in our British Columbia and Alberta operations in Canada, totaling approximately $6$8.2 million (net share before-tax).
•The agreement reached in Paris in December 2015 at the 21st Conference of the Parties to the United Nations Framework Convention on Climate Change, setting out a process for achieving global emissions reductions. The new administration has recommitted the United States to the Paris Agreement, and a significant number of U.S. state and local governments and major corporations headquartered in the U.S. have also announced related commitments. Accordingly, the U.S. administration set a new target on April 22, 2021 of a 50 to 52 percent reduction in GHG emissions from 2005 levels in 2030.
| | | | | |
ConocoPhillips 20222023 10-K | 5658 |
| | | | | |
| Capital Resources and Liquidity | |
•Governments and financial regulators are developing new reporting rules requiring increased disclosure around a range of sustainability topics. In March 2022 the U.S., SEC proposed rule changes that would require registrants to include certain climate-related disclosures in their registration statements and periodic reports; In January 2023 the EU finalized the Corporate Sustainability Reporting Directive that will require more detailed sustainability reporting; in June 2023 the International Sustainability Standards Board issued inaugural sustainability reporting standards; and in October 2023 in California multiple bills were signed into law requiring climate-related disclosures for companies that conduct business in the state. The patchwork of reporting standards that is developing may require significant increases in disclosures, which may be costly to implement.
•The U.S. Council on Environmental Quality's April 19, 2022Quality is preparing to finalize revised regulations and January 9, 2023 National Environmental Policy Act Guidance on Consideration of Greenhouse Gas Emissions and Climate Change for implementingunder the National Environmental Policy Act (NEPA) require federal agencies to evaluate, among other things,(NEPA Phase 2), along with corresponding Guidance on the direct, indirect,Consideration of GHG Emissions and cumulative effects of proposed projects subject to federal authorization, including a project's GHG emissions and potential climate change impact.Climate Change, in early 2024. The new NEPA regulations may result in longer agency review time or difficulty obtaining federal approval for development projects in our industry. Furthermore, additional regulations are forthcoming atregulatory framework’s emphasis on avoiding and minimizing climate impacts increases uncertainty associated with the federal environmental review and state levels with respect to GHG emissions, including EPA’s November 2022 supplemental proposal to strengthen methane emissions standardspermitting process for new oil and gas facilities and establishing first-time presumptive standards for existing oil and gas facilities, as well as BLM’s November 2022 proposed regulations to reduce the waste of natural gas from venting, flaring, and leaks during oil and gas production activities on Federal and Indian leases. Such regulations, when finalized, may result in the creation of additional costs in the form of taxes, royalty payments, the restriction of output, investments of capital to maintain compliance with laws and regulations, or required acquisition or trading of emission allowances. We are working to continuously improve operational and energy efficiency through resource and energy conservation throughout our operations.activities.
Compliance with changes in laws and regulations that create a GHG tax, emission trading scheme or GHG reduction policies could significantly increase our costs, reduce demand for fossil energy derived products, impact the cost and availability of capital and increase our exposure to litigation. Such laws and regulations could also increase demand for less carbon intensive energy sources, including natural gas. The ultimate impact on our financial performance, either positive or negative, will depend on a number of factors, including but not limited to:
•Whether and to what extent legislation or regulation is enacted.enacted;
•The timing of the introduction of such legislation or regulation.regulation;
•The nature of the legislation (such as a cap and trade system or a tax on emissions) or regulation.regulation;
•The price placed on GHG emissions (either by the market or through a tax).;
•The GHG reductions required.required;
•The price and availability of offsets.offsets;
•The amount and allocation of allowances.allowances;
•Technological and scientific developments leading to new products or services.services;
•Any potential significant physical effects of climate change (such as increased severe weather events, changes in sea levels and changes in temperature).; and
•Whether, and the extent to which, increased compliance costs are ultimately reflected in the prices of our products and services.
| | | | | |
57 | ConocoPhillips 2022 10-K |
| | | | | |
Capital Resources and Liquidity | |
Company Response to Climate-Related Risks
Our current Climate Risk Strategy and actions for our oil and gas operations are aligned with the aims of the Paris Agreement while being responsive to shareholder interests for long-term value and competitive returns and is also aligned with our Triple Mandate to responsibly meet energy transition pathway demand, deliver competitive returns on and of capital and achieve our net-zero operational emissions ambition.
In 2020, we became the first U.S.-based oil and gas company to adoptadopted a Paris-aligned climate-risk strategyclimate-related risk framework with an ambition to become a net-zero company forreduce our operational (Scope 1 and 2) emissions to net-zero by 2050. The objective of our Climate Risk Strategy is to manage climate-related risk, optimize opportunities and equip the company to respond to changes in key uncertainties, including government policies around the world, technologies for emissions reduction, alternative energy technologies and changes in consumer trends. The strategy sets out our choices around portfolio composition, emissions reductions, targets and incentives, emissions-related technology development, and our climate-related policy and finance sector engagement.
In early 2022, we publishedAn important component of our planClimate Risk Strategy is the Plan for the Net-Zero Energy Transition (the 'Plan'),. The Plan outlines how we intend to outlineplay a valued role in the energy transition by executing on our Triple Mandate to: reliably and responsibly meet energy transition pathway demand, deliver competitive returns on and of capital and achieve our net-zero operational emissions ambition. The Plan also outlines how we intend to apply our strategic capabilities and resources to meet the challenges posed by climate change in an economically viable, accountable and actionable way that balances the interests of our stakeholders.
| | | | | |
| 59 | ConocoPhillips 2023 10-K |
| | | | | |
| Capital Resources and Liquidity | |
Key elements of our planthe Plan include:
•Maintaining strategic flexibility
◦Building a resilient asset portfolio focusedwith a focus on resources with the low cost of supply and low greenhouse gasGHG intensity needed to remain viable in any scenario.meet transition pathway energy demand.
◦Committing to capital discipline through use of a fully burdened cost of supply, including cost of carbon, as the basis for capital allocation.
•Reducing Scope 1 and 2 emissions
◦Setting emissions-reduction targets for emissions over the near, mediumwhich we have ownership and long termscontrol, with an ambition to become a net-zero company for Scope 1 and 2 operational emissions methane emissions intensity and flaring.by 2050.
•Expanding policy advocacy beyondAddressing Scope 3 emissions
◦Advocating for a well-designed, economy-wide price on carbon pricing to include demand-sideand engaging in development of other policy and regulatory action such as direct federal regulation of methane, advocatinglegislation to address end-use emissions.
◦Working with our suppliers for alternative transportation and power generation, and national policy recommendationsalignment on natural gas across the value chain.GHG emissions reductions.
•Leveraging our assets and capabilitiesContributing to develop low-carbon technologies and identify emerging business opportunities.an orderly transition
•◦Tracking and responding to the transition through use of scenario planning to understand alternative pathways and test the resilience of our strategy.Building an attractive LNG portfolio.
•◦Continuing capital discipline by incorporating scenario planningEvaluating potential investments in emerging energy transition and a cost of carbon into our capital allocation decisions.low-carbon technologies.
Our Plan also recognizes the importance of reducing society’sdoes not include a Scope 3 (end-use) emissions target. We recognize that end-use emissions must be reduced to meet global climate objectives. However, it is our view that supply-side constraints through Scope 3 targets for North American and European upstream oil and gas producers would be counterproductive to climate goals. As an upstream producer, weIn the absence of policy measures that address global demand and with the shape and pace of technology and policy yet to be determined, setting and meeting Scope 3 targets would require a shift of production to other global operators that have established less ambitious targets or no targets to reduce their own operational emissions or do not control how the commodities we sell intohave any other ambitions or plans to manage climate-related risks, potentially eroding energy security and affordability as well as undercutting global markets are converted into different energy products or selected for use by consumers.climate change objectives. This is why we have consistently taken a prominent role in advocating for a well-designed, economy wide price on carbon and engaged in development of other policies or legislation that could address end-use emissions from high-carbon intensity energy use. We have also expanded policy advocacy beyond carbon pricing to include regulatory action, such as support for the direct regulation of methane.
In support of addressing our Scope 1 and 2 emissions, in 2022,2023, we made progress in several key areas. We continued
•Continued to refine our Paris-aligned climate risk strategy, joinedstrategy.
•Accelerated our GHG intensity reduction target to 50-60 percent by 2030 from a 2016 baseline for both gross operated and net equity emissions.
•Achieved the Oil and Gas Methane Partnership (OGMP)Gold Standard Pathway in the OGMP 2.0 Initiative and set aInitiative.
•Implemented our new near-zero 2030 methane emissions intensity target of approximately 1.5 kilogram carbon dioxide equivalent per BOE or of 0.15 percent of gas produced.
New Accounting Standards
For discussion of new accounting standards, see Note 25. | | | | | |
ConocoPhillips 20222023 10-K | 5860 |
Critical Accounting Estimates
The preparation of financial statements in conformity with GAAP requires management to select appropriate accounting policies and to make estimates and assumptions that affect the reported amounts of assets, liabilities, revenues and expenses. See Note 1 for descriptions of our major accounting policies. Certain of these accounting policies involve judgments and uncertainties to such an extent there is a reasonable likelihood materially different amounts would have been reported under different conditions, or if different assumptions had been used. These critical accounting estimates are discussed with the Audit and Finance Committee of the Board of Directors at least annually. We believe the following discussions of critical accounting estimates address all important accounting areas where the nature of accounting estimates or assumptions is material due to the levels of subjectivity and judgment necessary to account for highly uncertain matters or the susceptibility of such matters to change. Oil and Gas Accounting
Accounting for oil and gas activity is subject to special accounting rules unique to the oil and gas industry. The acquisition of G&G seismic information, prior to the discovery of proved reserves, is expensed as incurred, similar to accounting for research and development costs. However, leasehold acquisition costs and exploratory well costs are capitalized on the balance sheet pending determination of whether proved oil and gas reserves have been recognized.
Property Acquisition Costs
For individually significant leaseholds, management periodically assesses for impairment based on exploration and drilling efforts to date. For insignificant individual leasehold acquisition costs, management exercises judgment and determines a percentage probability that the prospect ultimately will fail to find proved oil and gas reserves, including estimates of future expirations, and pools that leasehold information with others in similar geographic areas. For prospects in areas with limited, or no, previous exploratory drilling, the percentage probability of ultimate failure is normally judged to be quite high. This judgmental percentage is multiplied by the leasehold acquisition cost, and that product is divided by the contractual period of the leasehold to determine a periodic leasehold impairment charge that is reported in exploration expense. This judgmental probability percentage is reassessed and adjusted throughout the contractual period of the leasehold based on favorable or unfavorable exploratory activity on the leasehold or on adjacent leaseholds, and leasehold impairment amortization expense is adjusted prospectively.
At year-end 2022,2023, we held $6.5$4.4 billion of net capitalized unproved property costs which consisted primarily of individually significant and pooled leaseholds, mineral rights held in perpetuity by title ownership, exploratory wells currently being drilled, suspended exploratory wells and capitalized interest. Of this amount, approximately $4.7$3.0 billion is concentrated in the Delaware and Midland Basins, where we have an ongoing significant and active development program. Outside of the Delaware and Midland Basins, the remaining $1.8$1.4 billion is primarily concentrated in Canada and Alaska.Canada. Management periodically assesses our unproved property for impairment based on the results of exploration and drilling efforts and the outlook for commercialization.
Exploratory Costs
For exploratory wells, drilling costs are temporarily capitalized, or “suspended,” on the balance sheet, pending a determination of whether potentially economic oil and gas reserves have been discovered by the drilling effort to justify development.
If exploratory wells encounter potentially economic quantities of oil and gas, the well costs remain capitalized on the balance sheet as long as sufficient progress assessing the reserves and the economic and operating viability of the project is being made. The accounting notion of “sufficient progress” is a judgmental area, but the accounting rules do prohibit continued capitalization of suspended well costs on the expectation future market conditions will improve or new technologies will be found that would make the development economically profitable. Often, the ability to move into the development phase and record proved reserves is dependent on obtaining permits and government or co-venturercoventurer approvals, the timing of which is ultimately beyond our control. Exploratory well costs remain suspended as long as we are actively pursuing such approvals and permits and believe they will be obtained. Once all required approvals and permits have been obtained, the projects are moved into the development phase, and the oil and gas reserves are designated as proved reserves.
At year-end 2022,2023, total suspended well costs were $527$184 million, compared with $660$527 million at year-end 2021.2022. For additional information on suspended wells, including an aging analysis, see Note 6. | | | | | |
5961 | ConocoPhillips 20222023 10-K |
Proved Reserves
Engineering estimates of the quantities of proved reserves are inherently imprecise and represent only approximate amounts because of the judgments involved in developing such information. Reserve estimates are based on geological and engineering assessments of in-place hydrocarbon volumes, the production plan, historical extraction recovery and processing yield factors, installed plant operating capacity and approved operating limits. The reliability of these estimates at any point in time depends on both the quality and quantity of the technical and economic data and the efficiency of extracting and processing the hydrocarbons.
Despite the inherent imprecision in these engineering estimates, accounting rules require disclosure of “proved” reserve estimates due to the importance of these estimates to better understand the perceived value and future cash flows of a company’s operations. There are several authoritative guidelines regarding the engineering criteria that must be met before estimated reserves can be designated as “proved.” Our geosciences and reservoir engineering organization has policies and procedures in place consistent with these authoritative guidelines. We have trained and experienced internal engineering personnel who estimate our proved reserves held by consolidated companies, as well as our share of equity affiliates. See “Supplementary Data - Oil and Gas Operations” for additional information. Proved reserve estimates are adjusted annually in the fourth quarter and during the year if significant changes occur and take into account recent production and subsurface information about each field. Also, as required by current authoritative guidelines, the estimated future date when an asset will reach the end of its economic life is based on historical 12-month first-of-month average prices and current costs. This date estimates when production will end and affects the amount of estimated reserves. Therefore, as prices and cost levels change from year to year, the estimate of proved reserves also changes. Generally, our proved reserves decrease as prices decline and increase as prices rise.
Our proved reserves include estimated quantities related to PSCs, reported under the “economic interest” method, as well as variable-royalty regimes, and are subject to fluctuations in commodity prices, recoverable operating expenses and capital costs. If costs remain stable, reserve quantities attributable to recovery of costs will change inversely to changes in commodity prices. We would expect reserves from these contracts to decrease when product prices rise and increase when prices decline.
The estimation of proved reserves is also important to the income statement because the proved reserve estimate for a field serves as the denominator in the unit-of-production calculation of the DD&A of the capitalized costs for that asset. At year-end 2022,2023, the net book value of productive PP&E subject to a unit-of-production calculation was approximately $55$62 billion and the DD&A recorded on these assets in 20222023 was approximately $7.3$8.1 billion. The estimated proved developed reserves for our consolidated operations were 4.0 billion BOE at the end of 2021 and 3.8 billion BOE at the end of 2022.2022 and 3.7 billion BOE at the end of 2023. If the estimates of proved reserves used in the unit-of-production calculations had been lower by 10 percent across all calculations, before-tax DD&A in 20222023 would have increased by an estimated $808$894 million.
Business Combination—Valuation of Oil and Gas Properties
For business combinations, management applies the principles of acquisition accounting under FASB ASC Topic 805 – “Business Combinations” and allocates the purchase price to assets acquired and liabilities assumed, based on their estimated fair values as of the acquisition date. Estimating the fair values involves making various assumptions, of which the most significant assumptions relate to the fair values assigned to proved and unproved oil and gas properties. For significant business combinations, management generally utilizes a discounted cash flow approach, based on market participant assumptions, and engagesconsiders engaging third party valuation experts in preparing fair value estimates.
Significant inputs incorporated within the valuation include future commodity price assumptions and production profiles of reserve estimates, the pace of drilling plans, future operating and development costs, inflation rates, and discount rates using a market-based weighted average cost of capital determined at the time of the acquisition. When estimating the fair value of unproved properties, additional risk-weighting adjustments are applied to probable and possible reserves.
The assumptions and inputs incorporated within the fair value estimates are subject to considerable management judgement and are based on industry, market, and economic conditions prevalent at the time of the acquisition. Although we based these estimates on assumptions believed to be reasonable, these estimates are inherently unpredictable and uncertain and actual results could differ. See Note 3. | | | | | |
ConocoPhillips 20222023 10-K | 6062 |
Impairments
Long-lived assets used in operations are assessed for impairment whenever changes in facts and circumstances indicate a possible significant deterioration in the future cash flows expected to be generated by an asset group. If there is an indication the carrying amount of an asset may not be recovered, a recoverability test is performed using management’s assumptions for prices, volumes and future development plans. If the sum of the undiscounted cash flows before income-taxes is less than the carrying value of the asset group, the carrying value is written down to estimated fair value and reported as an impairment in the periods in which the determination is made. Individual assets are grouped for impairment purposes at the lowest level for which there are identifiable cash flows that are largely independent of the cash flows of other groups of assets—generally on a field-by-field basis for E&P assets. Because there usually is a lack of quoted market prices for long-lived assets, the fair value of impaired assets is typically determined based on the present values of expected future cash flows using discount rates and prices believed to be consistent with those used by principal market participants, or based on a multiple of operating cash flow validated with historical market transactions of similar assets where possible.
The expected future cash flows used for impairment reviews and related fair value calculations are based on estimated future production volumes, commodity prices, operating costs and capital decisions, considering all available evidence at the date of review. Differing assumptions could affect the timing and the amount of an impairment in any period. See Note 6 and Note 7. Investments in nonconsolidated entities accounted for under the equity method are assessed for impairment whenever changes in the facts and circumstances indicate a loss in value has occurred. Such evidence of a loss in value might include our inability to recover the carrying amount, the lack of sustained earnings capacity which would justify the current investment amount, or a current fair value less than the investment’s carrying amount. When such a condition is judgmentally determined to be other than temporary, an impairment charge is recognized for the difference between the investment’s carrying value and its estimated fair value. When determining whether a decline in value is other than temporary, management considers factors such as the length of time and extent of the decline, the investee’s financial condition and near-term prospects, and our ability and intention to retain our investment for a period that will be sufficient to allow for any anticipated recovery in the market value of the investment. Since quoted market prices are usually not available, the fair value is typically based on the present value of expected future cash flows using discount rates and prices believed to be consistent with those used by principal market participants, plus market analysis of comparable assets owned by the investee, if appropriate. Differing assumptions could affect the timing and the amount of an impairment of an investment in any period. See the “APLNG” section of Note 4. Asset Retirement Obligations and Environmental Costs
Under various contracts, permits and regulations, we have material legal obligations to remove tangible equipment and restore the land or seabed at the end of operations at operational sites. Our largest asset removal obligations involve plugging and abandonment of wells, removal and disposal of offshore oil and gas platforms around the world, as well as oil and gas production facilities and pipelines in Alaska. Fair value is estimated using a present value approach, incorporating assumptions about estimated amounts and timing of settlements and impacts of the use of technologies. Estimating future asset removal costs requires significant judgement. Most of these removal obligations are many years, or decades, in the future and the contracts and regulations often have vague descriptions of what removal practices and criteria must be met when the removal event actually occurs. The carrying value of our asset retirement obligation estimate is sensitive to inputs such as asset removal technologies and costs, regulatory and other compliance considerations, expenditure timing, and other inputs into valuation of the obligation, including discount and inflation rates, which are all subject to change between the time of initial recognition of the liability and future settlement of our obligation.
Normally, changes in asset removal obligations are reflected in the income statement as increases or decreases to DD&A over the remaining life of the assets. However, for assets at or nearing the end of their operations, as well as previously sold assets for which we retained the asset removal obligation, an increase in the asset removal obligation can result in an immediate charge to earnings, because any increase in PP&E due to the increased obligation would immediately be subject to impairment, due to the low fair value of these properties.
In addition to asset removal obligations, under the above or similar contracts, permits and regulations, we have certain environmental-related projects. These are primarily related to remediation activities required by Canada and various states within the U.S. at exploration and production sites. Future environmental remediation costs are difficult to estimate because they are subject to change due to such factors as the uncertain magnitude of cleanup costs, the unknown time and extent of such remedial actions that may be required, and the determination of our liability in proportion to that of other responsible parties. See Note 8. | | | | | |
6163 | ConocoPhillips 20222023 10-K |
Projected Benefit Obligations
The actuarial determination of projected benefit obligations and company contribution requirements involves judgment about uncertain future events, including estimated retirement dates, salary levels at retirement, mortality rates, lump-sum election rates, rates of return on plan assets, future health care cost-trend rates, and rates of utilization of health care services by retirees. Due to the specialized nature of these calculations, we engage outside actuarial firms to assist in the determination of these projected benefit obligations and company contribution requirements. Ultimately, we will be required to fund all vested benefits under pension and postretirement benefit plans not funded by plan assets or investment returns, but the judgmental assumptions used in the actuarial calculations significantly affect periodic financial statements and funding patterns over time. Projected benefit obligations are particularly sensitive to the discount rate assumption. A 100 basis-point decrease in the discount rate assumption would increase projected benefit obligations by $600 million. Benefit expense is sensitive to the discount rate and return on plan assets assumptions. A 100 basis-point decrease in the discount rate assumption would increase annual benefit expense by $50 million, while a 100 basis-point decrease in the return on plan assets assumption would increase annual benefit expense by $40 million. In determining the discount rate, we use yields on high-quality fixed income investments matched to the estimated benefit cash flows of our plans. We are also exposed to the possibility that lump sum retirement benefits taken from pension plans during the year could exceed the total of service and interest components of annual pension expense and trigger accelerated recognition of a portion of unrecognized net actuarial losses and gains. These benefit payments are based on decisions by plan participants and are therefore difficult to predict. In the event there is a significant reduction in the expected years of future service of present employees or the elimination of the accrual of defined benefits for some or all of their future services for a significant number of employees, we could recognize a curtailment gain or loss. See Note 16. Contingencies
A number of claims and lawsuits are made against the company arising in the ordinary course of business. Management exercises judgment related to accounting and disclosure of these claims which includes losses, damages, and underpayments associated with environmental remediation, tax, contracts, and other legal disputes. As we learn new facts concerning contingencies, we reassess our position both with respect to amounts recognized and disclosed considering changes to the probability of additional losses and potential exposure. However, actual losses can and do vary from estimates for a variety of reasons including legal, arbitration, or other third-party decisions; settlement discussions; evaluation of scope of damages; interpretation of regulatory or contractual terms; expected timing of future actions; and proportion of liability shared with other responsible parties. Estimated future costs related to contingencies are subject to change as events evolve and as additional information becomes available during the administrative and litigation processes. For additional information on contingent liabilities, see the “Contingencies” section within “Capital Resources and Liquidity” and Note 11. Income Taxes
We are subject to income taxation in numerous jurisdictions worldwide. We record deferred tax assets and liabilities to account for the expected future tax consequences of events that have been recognized in our financial statements and our tax returns. We routinely assess our deferred tax assets and reduce such assets by a valuation allowance if we deem it is more likely than not that some portion, or all, of the deferred tax assets will not be realized. In assessing the need for adjustments to existing valuation allowances, we consider all available positive and negative evidence. Positive evidence includes reversals of temporary differences, forecasts of future taxable income, assessment of future business assumptions and applicable tax planning strategies that are prudent and feasible. Negative evidence includes losses in recent years as well as the forecasts of future net income (loss) in the realizable period. In making our assessment regarding valuation allowances, we weight the evidence based on objectivity. Numerous judgments and assumptions are inherent in the determination of future taxable income, including factors such as future operating conditions and the assessment of the effects of foreign taxes on our U.S. federal income taxes (particularly as related to prevailing oil and gas prices). See Note 17. We regularly assess and, if required, establish accruals for uncertain tax positions that could result from assessments of additional tax by taxing jurisdictions in countries where we operate. We recognize a tax benefit from an uncertain tax position when it is more likely than not that the position will be sustained upon examination, based on the technical merits of the position. These accruals for uncertain tax positions are subject to a significant amount of judgment and are reviewed and adjusted on a periodic basis in light of changing facts and circumstances considering the progress of ongoing tax audits, court proceedings, changes in applicable tax laws, including tax case rulings and legislative guidance, or expiration of the applicable statute of limitations. See Note 17. | | | | | |
ConocoPhillips 20222023 10-K | 6264 |
Cautionary Statement for the Purposes of the “Safe Harbor” Provisions of the Private Securities Litigation Reform Act of 1995
This report includes forward-looking statements within the meaning of Section 27A of the Securities Act of 1933 and Section 21E of the Securities Exchange Act of 1934. All statements other than statements of historical fact included or incorporated by reference in this report, including, without limitation, statements regarding our future financial position, business strategy, budgets, projected revenues, projected costs and plans, and objectives of management for future operations, are forward-looking statements. Examples of forward-looking statements contained in this report include our expected production growth and outlook on the business environment generally, our expected capital budget and capital expenditures, and discussions concerning future dividends. You can often identify our forward-looking statements by the words “anticipate,“ambition,” “believe,“anticipate,” “budget,“believe,” “continue,“budget,” “could,“continue,” “effort,“could,” “estimate,“effort,” “expect,“estimate,” “forecast,“expect,” “intend,“forecast,” “goal,“intend,” “guidance,“goal,” “may,“guidance,” “objective,“may,” “outlook,“objective,” “plan,“outlook,” “potential,“plan,” “predict,“potential,” “projection,“predict,” “seek,“projection,” “should,“seek,” “target,“should,” “will,“target,” “would”“will,” “would” and similar expressions.
We based the forward-looking statements on our current expectations, estimates and projections about ourselves and the industries in which we operate in general. We caution you these statements are not guarantees of future performance as they involve assumptions that, while made in good faith, may prove to be incorrect, and involve risks and uncertainties we cannot predict. In addition, we based many of these forward-looking statements on assumptions about future events that may prove to be inaccurate. Accordingly, our actual outcomes and results may differ materially from what we have expressed or forecast in the forward-looking statements. Any differences could result from a variety of factors and uncertainties, including, but not limited to, the following:
•Fluctuations in crude oil, bitumen, natural gas, LNG and NGLs prices, including a prolonged decline in these prices relative to historical or future expected levels.
•Global and regional changes in the demand, supply, prices, differentials or other market conditions affecting oil and gas, including changes as a result of any ongoing military conflict, including the conflict between Russiaconflicts in Ukraine and Ukraine,the Middle East, and the global response to such conflict,conflict; security threats on facilities and infrastructure, or frominfrastructure; a public health crisis or fromcrisis; the imposition or lifting of crude oil production quotas or other actions that might be imposed by OPEC and other producing countries andcountries; or the resulting company or third-party actions in response to such changes.
•The impact of significant declines in prices for crude oil, bitumen, natural gas, LNG and NGLs, which may result in recognition of impairment charges on our long-lived assets, leaseholds and nonconsolidated equity investments.
•The potential for insufficient liquidity or other factors, such as those described herein, that could impact our ability to repurchase shares and declare and pay dividends, whether fixed or variable.
•Potential failures or delays in achieving expected reserve or production levels from existing and future oil and gas developments, including due to operating hazards, drilling risks and the inherent uncertainties in predicting reserves and reservoir performance.
•Reductions in reserves replacement rates, whether as a result of the significant declines in commodity prices or otherwise.
•Unsuccessful exploratory drilling activities or the inability to obtain access to exploratory acreage.
•Unexpected changes in costs, inflationary pressures or technical requirements for constructing, modifying or operating E&P facilities.
•Legislative and regulatory initiatives addressing environmental concerns, including initiatives addressing the impact of global climate change or further regulating hydraulic fracturing, methane emissions, flaring, water disposal or water disposal.LNG exports.
•Significant operational or investment changes imposed by existing or future environmental statutes and regulations, including international agreements and national or regional legislation and regulatory measures to limit or reduce GHG emissions.
•Substantial investment in and development use of, competing or alternative energy sources, including as a result of existing or future environmental rules and regulations.
•The impact of broader societal attention to and efforts to address climate change may impact our access to capital and insurance.
•Potential failures or delays in delivering on our current or future low-carbon strategy, including our inability to develop new technologies.
•The impact of public health crises, including pandemics (such as COVID-19) and epidemics, and any related company or government policies or actions.
| | | | | |
6365 | ConocoPhillips 20222023 10-K |
•Lack of, or disruptions in, adequate and reliable transportation for our crude oil, bitumen, natural gas, LNG and NGLs.
•Inability to timely obtain or maintain permits, including those necessary for construction, drilling and/or development, or inability to make capital expenditures required to maintain compliance with any necessary permits or applicable laws or regulations.
•Failure to complete definitive agreements and feasibility studies for, and to complete construction of, announced and future E&P and LNG development in a timely manner (if at all) or on budget.
•Potential disruption or interruption of our operations and any resulting consequences due to accidents,accidents; extraordinary weather events,events; supply chain disruptions,disruptions; civil unrest,unrest; political events, war, terrorism,war; terrorism; cybersecurity threats and information technology failures, constraints or disruptions.
•Changes in international monetary conditions and foreign currency exchange rate fluctuations.
•Changes in international trade relationships, including the imposition of trade restrictions or tariffs relating to crude oil, bitumen, natural gas, LNG, NGLs, carbon and any materials or products (such as aluminum and steel) used in the operation of our business, including any sanctions imposed as a result of any ongoing military conflict, including the conflict between Russiaconflicts in Ukraine and Ukraine.the Middle East.
•Liability for remedial actions, including removal and reclamation obligations, under existing and future environmental regulations and litigation.
•Liability resulting from litigation, including litigation directly or indirectly related to the transaction with Concho Resources Inc., or our failure to comply with applicable laws and regulations.
•General domestic and international economic and political developments, including armed hostilities; expropriation of assets; changes in governmental policies relating to crude oil, bitumen, natural gas, LNG and NGLs and carbon pricing, including the imposition of price caps; regulation or taxation; and other political, economic or diplomatic developments, including as a result of any ongoing military conflict, including the conflict between Russiaconflicts in Ukraine and Ukraine.the Middle East.
•Volatility in the commodity futures markets.
•Changes in tax and other laws, regulations (including alternative energy mandates) or royalty rules applicable to our business.
•Competition and consolidation in the oil and gas E&P industry, including competition for personnel and equipment.
•Any limitations on our access to capital or increase in our cost of capital, including as a result of illiquidity or uncertainty in domestic or international financial markets or investment sentiment, including as a result of increased societal attention to and efforts to address climate change.
•Our inability to execute, or delays in the completion of, any asset dispositions or acquisitions we elect to pursue.
•Potential failure to obtain, or delays in obtaining, any necessary regulatory approvals for pending or future asset dispositions or acquisitions, or that such approvals may require modification to the terms of the transactions or the operation of our remaining business.
•Potential disruption of our operations as a result of pending or future asset dispositions or acquisitions, including the diversion of management time and attention.
•Our inability to deploy the net proceeds from any asset dispositions that are pending or that we elect to undertake in the future in the manner and timeframe we currently anticipate, if at all.
•The operation and financing of our joint ventures.
•The ability of our customers and other contractual counterparties to satisfy their obligations to us, including our ability to collect payments when due from the government of Venezuela or PDVSA.
•Our inability to realize anticipated cost savings and capital expenditure reductions.
•The inadequacy of storage capacity for our products, and ensuing curtailments, whether voluntary or involuntary, required to mitigate this physical constraint.
•The risk that we will be unable to retain and hire key personnel.
•Uncertainty as to the long-term value of our common stock.
•The factors generally described in Part I—Item 1A in this 20222023 Annual Report on Form 10-K and any additional risks described in our other filings with the SEC. | | | | | |
ConocoPhillips 20222023 10-K | 6466 |
Item 7A. Quantitative and Qualitative Disclosures about Market Risk
Financial Instrument Market Risk
We and certain of our subsidiaries hold and issue derivative contracts and financial instruments that expose our cash flows or earnings to changes in commodity prices, foreign currency exchange rates or interest rates. We may use financial and commodity-based derivative contracts to manage the risks produced by changes in the prices of natural gas, crude oil and related products; fluctuations in interest rates and foreign currency exchange rates; or to capture market opportunities.
Our use of derivative instruments is governed by an “Authority Limitations” document approved by our Board of Directors that prohibits the use of highly leveraged derivatives or derivative instruments without sufficient liquidity. The Authority Limitations document also establishes the Value at Risk (VaR) limits for the company, and compliance with these limits is monitored daily. The Executive Vice President and Chief Financial Officer, who reports to the Chief Executive Officer, monitors commodity price risk and risks resulting from foreign currency exchange rates and interest rates. The Commercial organization manages our commercial marketing, optimizes our commodity flows and positions, and monitors risks.
Commodity Price Risk
Our Commercial organization uses futures, forwards, swaps and options in various markets to accomplish the following objectives:
•Consistent with our policy to generally remain exposed to market prices, we use swap contracts to convert fixed-price sales contracts, which are often requested by natural gas consumers, to floating market prices.
•Enable us to use market knowledge to capture opportunities such as moving physical commodities to more profitable locations and storing commodities to capture seasonal or time premiums. We may use derivatives to optimize these activities.
We use a VaR model to estimate the loss in fair value that could potentially result on a single day from the effect of adverse changes in market conditions on the derivative financial instruments and derivative commodity contracts we hold or issue, including commodity purchases and sales contracts recorded on the balance sheet at December 31, 2022.2023. Using Monte Carlo simulation, a 95 percent confidence level and a one-day holding period, the VaR for those instruments issued or held for trading purposes or held for purposes other than trading at December 31, 20222023 and 2021,2022, was immaterial to our consolidated cash flows and net income attributable to ConocoPhillips.income.
| | | | | |
6567 | ConocoPhillips 20222023 10-K |
Interest Rate Risk
The following table provides information about our debt instruments that are sensitive to changes in U.S. interest rates. The table presents principal cash flows and related weighted-average interest rates by expected maturity dates. Weighted-average variable rates are based on effective rates at the reporting date. The carrying amount of our floating-rate debt approximates its fair value. A hypothetical 10 percent change in prevailing interest rates would not have a material impact on interest expense associated with our floating-rate debt. The fair value of the fixed-rate debt is measured using prices available from a pricing service that is corroborated by market data. Changes to prevailing interest rates would not impact our cash flows associated with fixed ratefixed-rate debt, unless we elect to repurchase or retire such debt prior to maturity.
| | | Millions of Dollars Except as Indicated | | | | Millions of Dollars Except as Indicated |
| | Debt | | | | Debt |
| Expected Maturity Date | | Expected Maturity Date | | Fixed
Rate
Maturity | Average
Interest
Rate | | Floating
Rate
Maturity | Average
Interest
Rate |
| Year-End 2023 | |
| 2024 | |
| 2024 | |
| 2024 | | | $ | 759 | | 2.70 | % | | $ | — | | — | % |
| 2025 | |
| 2026 | |
| 2027 | |
| 2028 | |
| Remaining years | | Remaining years | | 15,829 | | 5.45 | | | 283 | | 4.06 | % |
| Total | |
| Fair value | |
| Fair value | |
| Fair value | |
| | Millions of Dollars Except as Indicated |
| Year-End 2022 | |
| | Debt |
| Expected Maturity Date | | Fixed
Rate
Maturity | Average
Interest
Rate | | Floating
Rate
Maturity | Average
Interest
Rate |
| Year-End 2022 | Year-End 2022 | | | | |
| | Year-End 2022 | |
| 2023 | |
| 2023 | |
| 2023 | 2023 | | $ | 110 | | 7.04 | % | | | $ | 110 | | 7.04 | 7.04 | % | | $ | — | | — | — | % |
| 2024 | 2024 | | 1,359 | | 2.59 | | |
| 2025 | 2025 | | 1,268 | | 3.25 | | |
| 2026 | 2026 | | 104 | | 6.41 | | |
| 2027 | 2027 | | 438 | | 5.79 | | |
| Remaining years | Remaining years | | 12,293 | | 5.45 | | | 283 | | 3.91 | % | Remaining years | | 12,293 | | 5.45 | 5.45 | | | 283 | | 283 | | 3.91 | 3.91 | % |
| Total | Total | | $ | 15,572 | | | $ | 283 | | |
| Fair value | Fair value | | $ | 15,262 | | | $ | 283 | | |
| | Year-End 2021 | |
| 2022 | | $ | 346 | | 2.53 | % | | $ | 500 | | 1.03 | % |
| 2023 | | 116 | | 6.64 | | | — | | — | |
| 2024 | | 459 | | 3.51 | | | — | | — | |
| 2025 | | 369 | | 5.32 | | | — | | — | |
| 2026 | | 1,355 | | 5.06 | | | — | | — | |
| Remaining years | | 14,338 | | 5.80 | | | 283 | | 0.11 | |
| Total | | $ | 16,983 | | | $ | 783 | | |
| Fair value | Fair value | | $ | 21,668 | | | $ | 783 | | |
| Fair value | |
| | | | | |
ConocoPhillips 20222023 10-K | 6668 |
Foreign Currency Exchange Risk
We have foreign currency exchange rate risk resulting from international operations. We do not comprehensively hedge the exposure to currency exchange rate changes although we may choose to selectively hedge certain foreign currency exchange rate exposures, such as firm commitments for capital projects or local currency tax payments, dividends and cash returns from net investments in foreign affiliates to be remitted within the coming year investments in equity securities and acquisitions.
At December 31, 2023 and 2022, and 2021, we heldhad outstanding foreign currency exchange forwardsforward contracts hedging cross-border commercial activity and foreign currency exchange swaps for purposes of mitigating our cash-related exposures. Although these forwards and swaps hedge exposures to fluctuations in exchange rates, we elected not to utilize hedge accounting. As a result, the change in the fair value of these foreign currency exchange derivatives is recorded directly in earnings.
At December 31, 2022, we had outstanding foreign currency exchange forward swap contracts. Since the gain or loss on the swapsexchange contracts is offset by the gain or loss from remeasuring cash related balances, and since our aggregate position in the forwards was not material, there would be no material impact to our income from an adverse hypothetical 10 percent change in the December 2023 or December 2022 exchange rates.
At December 31, 2021, we had outstanding foreign currency exchange forward contracts to buy $1.9 billion AUD at $0.715 AUD against the U.S. dollar. Based on the assumed volatility in the fair value calculation, the net fair value of these foreign currency contracts at December 31, 2021, was a before-tax gain of $21 million. Based on an adverse hypothetical 10 percent change in the December 31, 2021 exchange rate, this would result in an additional before-tax loss of $134 million. The sensitivity analysis is based on changing one assumption while holding all other assumptions constant, which in practice may be unlikely to occur, as changes in some of the assumptions may be correlated. The contracts settled in the first quarter of 2022.
The gross notional and fair value of these positions at December 31, 20222023 and 2021,2022, were as follows:
| | Foreign Currency Exchange Derivatives | Foreign Currency Exchange Derivatives | In Millions | Foreign Currency Exchange Derivatives | In Millions |
| Notional | | Fair Value* |
| | 2022 | 2021 | | 2022 | 2021 |
| Notional | | | Notional | | Fair Value* |
| | 2023 | | | | 2023 | 2022 | | 2023 | 2022 |
| | Buy Canadian dollar, sell U.S. dollar | Buy Canadian dollar, sell U.S. dollar | CAD | 15 | | 77 | | | (1) | | (1) | |
| Buy Australian dollar, sell U.S. dollar | AUD | — | | 1,850 | | | — | | 21 | |
| Buy Canadian dollar, sell U.S. dollar | |
| Buy Canadian dollar, sell U.S. dollar | |
| Sell British pound, buy euro | Sell British pound, buy euro | GBP | 312 | | 239 | | | 7 | | (8) | |
| Buy British pound, sell euro | Buy British pound, sell euro | GBP | 264 | | 394 | | | (10) | | 7 | |
*Denominated in USD.
| | | | | |
6769 | ConocoPhillips 20222023 10-K |
Item 8. Financial Statements and Supplementary Data
ConocoPhillips
| | | | | |
| Index to Financial Statements |
| Page |
| |
| |
| |
| |
| |
| |
Consolidated Statement of Comprehensive Income for the years ended | |
| |
| |
| |
| |
| |
| |
| |
Consolidated Statement of Changes in Equity for the years ended | |
| |
| |
| |
| |
| |
| |
| | | | | |
ConocoPhillips 20222023 10-K | 6870 |
Management prepared, and is responsible for, the consolidated financial statements and the other information appearing in this annual report. The consolidated financial statements present fairly the company’s financial position, results of operations and cash flows in conformity with accounting principles generally accepted in the United States. In preparing its consolidated financial statements, the company includes amounts that are based on estimates and judgments management believes are reasonable under the circumstances. The company’s financial statements have been audited by Ernst & Young LLP, an independent registered public accounting firm appointed by the Audit and Finance Committee of the Board of Directors and ratified by stockholders. Management has made available to Ernst & Young LLP all of the company’s financial records and related data, as well as the minutes of stockholders’ and directors’ meetings.
Assessment of Internal Control Over Financial Reporting
Management is also responsible for establishing and maintaining adequate internal control over financial reporting. ConocoPhillips’ internal control system was designed to provide reasonable assurance to the company’s management and directors regarding the preparation and fair presentation of published financial statements.
All internal control systems, no matter how well designed, have inherent limitations. Therefore, even those systems determined to be effective can provide only reasonable assurance with respect to financial statement preparation and presentation.
Management assessed the effectiveness of the company’s internal control over financial reporting as of December 31, 2022.2023. In making this assessment, it used the criteria set forth by the Committee of Sponsoring Organizations of the Treadway Commission in Internal Control—Integrated Framework (2013). Based on our assessment, we believe the company’s internal control over financial reporting was effective as of December 31, 2022.2023.
Ernst & Young LLP has issued an audit report on the company’s internal control over financial reporting as of December 31, 2022,2023, and their report is included herein.
| | | | | |
| /s/ Ryan M. Lance | /s/ William L. Bullock, Jr. |
| |
| Ryan M. Lance | William L. Bullock, Jr. |
Chairman and Chief Executive Officer | Executive Vice President and Chief Financial Officer |
| | | | | |
6971 | ConocoPhillips 20222023 10-K |
| | |
| Report of Independent Registered Public Accounting Firm |
To the Stockholders and the Board of Directors of ConocoPhillips
Opinion on the Financial Statements
We have audited the accompanying consolidated balance sheets of ConocoPhillips (the Company) as of December 31, 20222023 and 2021,2022, the related consolidated income statement, consolidated statements of comprehensive income, changes in equity and cash flows for each of the three years in the period ended December 31, 2022,2023, and the related notes (collectively referred to as the “consolidated financial statements”). In our opinion, the consolidated financial statements present fairly, in all material respects, the financial position of the Company at December 31, 20222023 and 2021,2022, and the results of its operations and its cash flows for each of the three years in the period ended December 31, 2022,2023, in conformity with U.S. generally accepted accounting principles.
We also have audited, in accordance with the standards of the Public Company Accounting Oversight Board (United States) (PCAOB), the Company’s internal control over financial reporting as of December 31, 2022,2023, based on criteria established in Internal Control–Control—Integrated Framework issued by the Committee of Sponsoring Organizations of the Treadway Commission (2013 framework) and our report dated February 16, 202315, 2024 expressed an unqualified opinion thereon.
Basis for Opinion
These financial statements are the responsibility of the Company’s management. Our responsibility is to express an opinion on the Company’s financial statements based on our audits. We are a public accounting firm registered with the PCAOB and are required to be independent with respect to the Company in accordance with the U.S. federal securities laws and the applicable rules and regulations of the Securities and Exchange Commission and the PCAOB.
We conducted our audits in accordance with the standards of the PCAOB. Those standards require that we plan and perform the audit to obtain reasonable assurance about whether the financial statements are free of material misstatement, whether due to error or fraud. Our audits included performing procedures to assess the risks of material misstatement of the financial statements, whether due to error or fraud, and performing procedures that respond to those risks. Such procedures included examining, on a test basis, evidence regarding the amounts and disclosures in the financial statements. Our audits also included evaluating the accounting principles used and significant estimates made by management, as well as evaluating the overall presentation of the financial statements. We believe that our audits provide a reasonable basis for our opinion.
Critical Audit MattersMatter
The critical audit mattersmatter communicated below are mattersis a matter arising from the current period audit of the consolidated financial statements that werewas communicated or required to be communicated to the Audit and Finance Committee and that: (1) relaterelates to accounts or disclosures that are material to the consolidated financial statements and (2) involved our especially challenging, subjective or complex judgments. The communication of the critical audit mattersmatter does not alter in any way our opinion on the consolidated financial statements, taken as a whole, and we are not, by communicating the critical audit mattersmatter below, providing a separate opinionsopinion on the critical audit mattersmatter or on the accounts or disclosuresdisclosure to which they relate.it relates.
| | | | | |
ConocoPhillips 20222023 10-K | 7072 |
| | | | | |
| | Accounting for asset retirement obligations for certain offshore properties
| |
| Description of the Matter | At December 31, 2022, asset retirement obligations (ARO) totaled $6.4 billion. As further described in Note 8, the Company records ARO in the period in which they are incurred, typically when the asset is installed at the production location. The estimation of obligations related to certain offshore assets requires significant judgment given the magnitude and higher estimation uncertainty related to plugging and abandonment of wells and removal and disposal of offshore oil and gas platforms and facilities (collectively, removal costs). Furthermore, as certain of these assets are nearing the end of their operations, the impact of changes in these ARO may result in a material impact to earnings given the relatively short remaining useful lives of the assets.
Auditing the Company’s ARO for the obligations identified above is complex and highly judgmental due to the significant estimation required by management in determining the obligations. In particular, the estimates were sensitive to significant subjective assumptions such as removal cost estimates and end of field life, which are affected by expectations about future market or economic conditions.
| |
| How We Addressed the Matter in Our Audit | We obtained an understanding, evaluated the design and tested the operating effectiveness of the Company’s internal controls over its ARO estimation process, including management’s review of the significant assumptions that have a material effect on the determination of the obligations. We also tested management’s controls over the completeness and accuracy of the financial data used in the valuation.
To test the ARO for the obligations identified above, our audit procedures included, among others, assessing the significant assumptions and inputs used in the valuation, including removal cost estimates and end of field life assumptions. For example, we evaluated removal cost estimates by comparing to settlements and recent removal activities and costs. We also compared end of field life assumptions to production forecasts.
| |
| Depreciation, depletion and amortization of proved oil and gas properties, plants and equipment |
| |
| Description of the Matter | At December 31, 2022,2023, the net book value of the Company’s proved oil and gas properties, plants and equipment (PP&E) was $55$62 billion, and depreciation, depletion and amortization (DD&A) expense was $7.3$8.1 billion for the year then ended. As described in Note 1, under the successful efforts method of accounting, DD&A of PP&E on producing hydrocarbon properties and steam-assisted gravity drainage facilities and certain pipeline and liquified natural gas assets (those which are expected to have a declining utilization pattern) are determined by the unit-of-production method. The unit-of-production method uses proved oil and gas reserves, as estimated by the Company’s internal reservoir engineers.
Proved oil and gas reserves estimates are based on geological and engineering assessments of in-place hydrocarbon volumes, the production plan, historical extraction recovery and processing yield factors, installed plant operating capacity and approved operating limits. Significant judgment is required by the Company’s internal reservoir engineers in evaluating geological and engineeringthe data when estimatingused to estimate proved oil and gas reserves. Estimating proved oil and gas reserves also requires the selection of inputs, including historical production, oil and gas price assumptions and future operating and capital costs assumptions, and tax rates by jurisdiction, among others. Because of the complexity involved in estimating proved oil and gas reserves, management also used an independent petroleum engineering consulting firm to perform a review of the processes and controls used by the Company’s internal reservoir engineers to determine estimates of proved oil and gas reserves.
Auditing the Company’s DD&A calculation is complex because of the use of the work of the internal reservoir engineers and the independent petroleum engineering consulting firm and the evaluation of management’s determination of the inputs described above used by the internal reservoir engineers in estimating proved oil and gas reserves.
|
| |
| | | | | |
71 | ConocoPhillips 2022 10-K |
| | | | | |
| How We Addressed the Matter in Our Audit | We obtained an understanding, evaluated the design and tested the operating effectiveness of the Company’s internal controls over its processes to calculate DD&A, including management’s controls over the completeness and accuracy of the financial data provided to the internal reservoir engineers for use in estimating proved oil and gas reserves.
Our audit procedures included, among others, evaluating the professional qualifications and objectivity of the Company’s internal reservoir engineers primarily responsible for overseeing the preparation of the proved oil and gas reserves estimates and the independent petroleum engineering consulting firm used to review the Company’s processes and controls.estimates. In addition, in assessing whether we can use the work of the internal reservoir engineers, we evaluated the completeness and accuracy of the financial data and inputs described above used by the internal reservoir engineers in estimating proved oil and gas reserves by agreeing them to source documentation and we identified and evaluated corroborative and contrary evidence. We also tested the accuracy of the DD&A calculation, including comparing the proved oil and gas reserves amounts used in the calculation to the Company’s reserve report.
|
We have served as the Company's auditor since 1949.
/s/ Ernst & Young LLP
We have served as ConocoPhillips’ auditor since 1949.
Houston, Texas
February 16, 202315, 2024
| | | | | |
| 73 | ConocoPhillips 20222023 10-K | 72 |
| | |
| Report of Independent Registered Public Accounting Firm |
To the Stockholders and the Board of Directors of ConocoPhillips
Opinion on Internal Control over Financial Reporting
We have audited ConocoPhillips’ internal control over financial reporting as of December 31, 2022,2023, based on criteria established in Internal Control–Integrated Framework issued by the Committee of Sponsoring Organizations of the Treadway Commission (2013 framework) (the COSO criteria). In our opinion, ConocoPhillips (the Company) maintained, in all material respects, effective internal control over financial reporting as of December 31, 2022,2023, based on the COSO criteria.
We also have audited, in accordance with the standards of the Public Company Accounting Oversight Board (United States) (PCAOB), the consolidated balance sheets of the Company as of December 31, 20222023 and 2021,2022, the related consolidated income statement, consolidated statements of comprehensive income, changes in equity and cash flows for each of the three years in the period ended December 31, 2022,2023, and the related notes and our report dated February 16, 202315, 2024 expressed an unqualified opinion thereon.
Basis for Opinion
The Company’s management is responsible for maintaining effective internal control over financial reporting and for its assessment of the effectiveness of internal control over financial reporting included under the heading “Assessment of Internal Control Over Financial Reporting” in the accompanying “Reports of Management.” Our responsibility is to express an opinion on the Company’s internal control over financial reporting based on our audit. We are a public accounting firm registered with the PCAOB and are required to be independent with respect to the Company in accordance with the U.S. federal securities laws and the applicable rules and regulations of the Securities and Exchange Commission and the PCAOB.
We conducted our audit in accordance with the standards of the PCAOB. Those standards require that we plan and perform the audit to obtain reasonable assurance about whether effective internal control over financial reporting was maintained in all material respects.
Our audit included obtaining an understanding of internal control over financial reporting, assessing the risk that a material weakness exists, testing and evaluating the design and operating effectiveness of internal control based on the assessed risk, and performing such other procedures as we considered necessary in the circumstances. We believe that our audit provides a reasonable basis for our opinion.
Definition and Limitations of Internal Control Over Financial Reporting
A company’s internal control over financial reporting is a process designed to provide reasonable assurance regarding the reliability of financial reporting and the preparation of financial statements for external purposes in accordance with generally accepted accounting principles. A company’s internal control over financial reporting includes those policies and procedures that (1) pertain to the maintenance of records that, in reasonable detail, accurately and fairly reflect the transactions and dispositions of the assets of the company; (2) provide reasonable assurance that transactions are recorded as necessary to permit preparation of financial statements in accordance with generally accepted accounting principles, and that receipts and expenditures of the company are being made only in accordance with authorizations of management and directors of the company; and (3) provide reasonable assurance regarding prevention or timely detection of unauthorized acquisition, use, or disposition of the company’s assets that could have a material effect on the financial statements.
Because of its inherent limitations, internal control over financial reporting may not prevent or detect misstatements. Also, projections of any evaluation of effectiveness to future periods are subject to the risk that controls may become inadequate because of changes in conditions, or that the degree of compliance with the policies or procedures may deteriorate.
/s/ Ernst & Young LLP
Houston, Texas
February 16, 202315, 2024
| | | | | |
73ConocoPhillips 2023 10-K | ConocoPhillips 2022 10-K74 |
| | | | | |
| Consolidated Income Statement | ConocoPhillips |
| | Years Ended December 31 | Years Ended December 31 | Millions of Dollars | Years Ended December 31 | Millions of Dollars |
| 2022 | 2021 | 2020 |
| 2023 | | | 2023 | 2022 | 2021 |
| Revenues and Other Income | Revenues and Other Income | |
| Sales and other operating revenues | Sales and other operating revenues | $ | 78,494 | | 45,828 | | 18,784 | |
| Sales and other operating revenues | |
| Sales and other operating revenues | |
| Equity in earnings of affiliates | Equity in earnings of affiliates | 2,081 | | 832 | | 432 | |
| Gain on dispositions | 1,077 | | 486 | | 549 | |
| Other income (loss) | 504 | | 1,203 | | (509) | |
| Gain (loss) on dispositions | |
| Other income | |
| Total Revenues and Other Income | Total Revenues and Other Income | 82,156 | | 48,349 | | 19,256 | |
| | Costs and Expenses | Costs and Expenses | |
| Costs and Expenses | |
| Costs and Expenses | |
| Purchased commodities | |
| Purchased commodities | |
| Purchased commodities | Purchased commodities | 33,971 | | 18,158 | | 8,078 | |
| Production and operating expenses | Production and operating expenses | 7,006 | | 5,694 | | 4,344 | |
| Selling, general and administrative expenses | Selling, general and administrative expenses | 623 | | 719 | | 430 | |
| Exploration expenses | Exploration expenses | 564 | | 344 | | 1,457 | |
| Depreciation, depletion and amortization | Depreciation, depletion and amortization | 7,504 | | 7,208 | | 5,521 | |
| Impairments | Impairments | (12) | | 674 | | 813 | |
| Taxes other than income taxes | Taxes other than income taxes | 3,364 | | 1,634 | | 754 | |
| Accretion on discounted liabilities | Accretion on discounted liabilities | 250 | | 242 | | 252 | |
| Interest and debt expense | Interest and debt expense | 805 | | 884 | | 806 | |
| Foreign currency transaction gains | (100) | | (22) | | (72) | |
| Foreign currency transaction (gain) loss | |
| Other expenses | Other expenses | (47) | | 102 | | 13 | |
| Total Costs and Expenses | Total Costs and Expenses | 53,928 | | 35,637 | | 22,396 | |
| Income (loss) before income taxes | Income (loss) before income taxes | 28,228 | | 12,712 | | (3,140) | |
| Income tax provision (benefit) | Income tax provision (benefit) | 9,548 | | 4,633 | | (485) | |
| Net income (loss) | 18,680 | | 8,079 | | (2,655) | |
| Less: net income attributable to noncontrolling interests | — | | — | | (46) | |
| Net Income (Loss) Attributable to ConocoPhillips | $ | 18,680 | | 8,079 | | (2,701) | |
| Net Income (Loss) | |
| Net Income (Loss) Attributable to ConocoPhillips Per Share of Common Stock (dollars) | |
| Net Income (Loss) Per Share of Common Stock (dollars) | |
| Net Income (Loss) Per Share of Common Stock (dollars) | |
| Net Income (Loss) Per Share of Common Stock (dollars) | |
| Basic | |
| Basic | |
| Basic | Basic | $ | 14.62 | | 6.09 | | (2.51) | |
| Diluted | Diluted | 14.57 | | 6.07 | | (2.51) | |
| Average Common Shares Outstanding (in thousands) | Average Common Shares Outstanding (in thousands) | |
Average Common Shares Outstanding (in thousands) | |
Average Common Shares Outstanding (in thousands) | |
| Basic | |
| Basic | |
| Basic | Basic | 1,274,028 | | 1,324,194 | | 1,078,030 | |
| Diluted | Diluted | 1,278,163 | | 1,328,151 | | 1,078,030 | |
See Notes to Consolidated Financial Statements.
| | | | | |
| 75 | ConocoPhillips 20222023 10-K | 74 |
| | | | | |
| Consolidated Statement of Comprehensive Income | ConocoPhillips |
| | Years Ended December 31 | Years Ended December 31 | Millions of Dollars | Years Ended December 31 | Millions of Dollars |
| 2022 | 2021 | 2020 |
| 2023 | | | 2023 | 2022 | 2021 |
| Net Income (Loss) | Net Income (Loss) | $ | 18,680 | | 8,079 | | (2,655) | |
| Other comprehensive income (loss) | Other comprehensive income (loss) | |
| Defined benefit plans | Defined benefit plans | |
| Prior service (cost) credit arising during the period | (10) | | — | | 29 | |
| Reclassification adjustment for amortization of prior service credit included in net income (loss) | (39) | | (38) | | (32) | |
| Defined benefit plans | |
| Defined benefit plans | |
| Prior service credit (cost) arising during the period | |
| Prior service credit (cost) arising during the period | |
| Prior service credit (cost) arising during the period | |
| Reclassification adjustment for amortization of prior service cost (credit) included in net income (loss) | |
| Net change | Net change | (49) | | (38) | | (3) | |
| Net actuarial gain (loss) arising during the period | Net actuarial gain (loss) arising during the period | (623) | | 357 | | (210) | |
| Reclassification adjustment for amortization of net actuarial losses included in net income (loss) | 72 | | 178 | | 117 | |
| Reclassification adjustment for amortization of net actuarial losses (gains) included in net income (loss) | |
| Net change | Net change | (551) | | 535 | | (93) | |
| Nonsponsored plans* | Nonsponsored plans* | 5 | | 5 | | 1 | |
| Income taxes on defined benefit plans | Income taxes on defined benefit plans | 178 | | (108) | | 20 | |
| Defined benefit plans, net of tax | Defined benefit plans, net of tax | (417) | | 394 | | (75) | |
| Unrealized holding gain (loss) on securities | Unrealized holding gain (loss) on securities | (13) | | (2) | | 2 | |
| Reclassification adjustment for loss included in net income | (1) | | (1) | | — | |
| Income taxes on unrealized holding loss on securities | 3 | | 1 | | — | |
| Reclassification adjustment for (gain) loss included in net income | |
| Income taxes on unrealized holding gain (loss) on securities | |
| Unrealized holding gain (loss) on securities, net of tax | Unrealized holding gain (loss) on securities, net of tax | (11) | | (2) | | 2 | |
| Foreign currency translation adjustments | Foreign currency translation adjustments | (623) | | (124) | | 209 | |
| Income taxes on foreign currency translation adjustments | Income taxes on foreign currency translation adjustments | 1 | | — | | 3 | |
| Foreign currency translation adjustments, net of tax | Foreign currency translation adjustments, net of tax | (622) | | (124) | | 212 | |
| Unrealized gain (loss) on hedging activities | |
| Income taxes on unrealized gain (loss) on hedging activities | |
| Unrealized gain (loss) on hedging activities, net of tax | |
| Other Comprehensive Income (Loss), Net of Tax | Other Comprehensive Income (Loss), Net of Tax | (1,050) | | 268 | | 139 | |
| Comprehensive Income (Loss) | Comprehensive Income (Loss) | 17,630 | | 8,347 | | (2,516) | |
| Less: comprehensive income attributable to noncontrolling interests | — | | — | | (46) | |
| Comprehensive Income (Loss) Attributable to ConocoPhillips | $ | 17,630 | | 8,347 | | (2,562) | |
|
*Plans for which ConocoPhillips is not the primary obligor—primarily those administered by equity affiliates.
See Notes to Consolidated Financial Statements.
| | | | | |
75ConocoPhillips 2023 10-K | ConocoPhillips 2022 10-K76 |
| | | | | |
| Consolidated Balance Sheet | ConocoPhillips |
| | At December 31 | At December 31 | Millions of Dollars | At December 31 | Millions of Dollars |
| 2022 | 2021 |
| 2023 | | | 2023 | 2022 |
| Assets | Assets | |
| Cash and cash equivalents | Cash and cash equivalents | $ | 6,458 | | 5,028 | |
| Cash and cash equivalents | |
| Cash and cash equivalents | |
| Short-term investments | Short-term investments | 2,785 | | 446 | |
| Accounts and notes receivable (net of allowance of $2 and $2, respectively) | 7,075 | | 6,543 | |
| Accounts and notes receivable (net of allowance of $3 and $2, respectively) | |
| Accounts and notes receivable—related parties | Accounts and notes receivable—related parties | 13 | | 127 | |
| Investment in Cenovus Energy | — | | 1,117 | |
| | Inventories | |
| Inventories | |
| Inventories | Inventories | 1,219 | | 1,208 | |
| Prepaid expenses and other current assets | Prepaid expenses and other current assets | 1,199 | | 1,581 | |
| Total Current Assets | Total Current Assets | 18,749 | | 16,050 | |
| Investments and long-term receivables | Investments and long-term receivables | 8,225 | | 7,113 | |
| | Net properties, plants and equipment (net of accumulated DD&A of $66,630 and $64,735, respectively) | 64,866 | | 64,911 | |
| Net properties, plants and equipment (net of accumulated DD&A of $74,361 and $66,630, respectively) | |
| Net properties, plants and equipment (net of accumulated DD&A of $74,361 and $66,630, respectively) | |
| Net properties, plants and equipment (net of accumulated DD&A of $74,361 and $66,630, respectively) | |
| Other assets | Other assets | 1,989 | | 2,587 | |
| Total Assets | Total Assets | $ | 93,829 | | 90,661 | |
| | Liabilities | Liabilities | |
| Liabilities | |
| Liabilities | |
| Accounts payable | |
| Accounts payable | |
| Accounts payable | Accounts payable | $ | 6,113 | | 5,002 | |
| Accounts payable—related parties | Accounts payable—related parties | 50 | | 23 | |
| Short-term debt | Short-term debt | 417 | | 1,200 | |
| Accrued income and other taxes | Accrued income and other taxes | 3,193 | | 2,862 | |
| Employee benefit obligations | Employee benefit obligations | 728 | | 755 | |
| Other accruals | Other accruals | 2,346 | | 2,179 | |
| Total Current Liabilities | Total Current Liabilities | 12,847 | | 12,021 | |
| Long-term debt | Long-term debt | 16,226 | | 18,734 | |
| Asset retirement obligations and accrued environmental costs | Asset retirement obligations and accrued environmental costs | 6,401 | | 5,754 | |
| Deferred income taxes | Deferred income taxes | 7,726 | | 6,179 | |
| Employee benefit obligations | Employee benefit obligations | 1,074 | | 1,153 | |
| Other liabilities and deferred credits | Other liabilities and deferred credits | 1,552 | | 1,414 | |
| Total Liabilities | Total Liabilities | 45,826 | | 45,255 | |
| | Equity | Equity | |
Common stock (2,500,000,000 shares authorized at $0.01 par value) Issued (2022—2,100,885,134 shares; 2021—2,091,562,747 shares) | |
| Equity | |
| Equity | |
Common stock (2,500,000,000 shares authorized at $0.01 par value) Issued (2023—2,103,772,516 shares; 2022—2,100,885,134 shares) | |
Common stock (2,500,000,000 shares authorized at $0.01 par value) Issued (2023—2,103,772,516 shares; 2022—2,100,885,134 shares) | |
Common stock (2,500,000,000 shares authorized at $0.01 par value) Issued (2023—2,103,772,516 shares; 2022—2,100,885,134 shares) | |
| Par value | |
| Par value | |
| Par value | Par value | 21 | | 21 | |
| Capital in excess of par | Capital in excess of par | 61,142 | | 60,581 | |
| Treasury stock (at cost: 2022—877,029,062 shares; 2021—789,319,875 shares) | (60,189) | | (50,920) | |
| Accumulated other comprehensive loss | (6,000) | | (4,950) | |
| Treasury stock (at cost: 2023—925,670,961 shares; 2022—877,029,062 shares) | |
| Accumulated other comprehensive income (loss) | |
| Retained earnings | Retained earnings | 53,029 | | 40,674 | |
| Total Equity | Total Equity | 48,003 | | 45,406 | |
| Total Liabilities and Equity | Total Liabilities and Equity | $ | 93,829 | | 90,661 | |
See Notes to Consolidated Financial Statements.
| | | | | |
| 77 | ConocoPhillips 20222023 10-K | 76 |
| | | | | |
| Consolidated Statement of Cash Flows | ConocoPhillips |
| | Years Ended December 31 | Years Ended December 31 | Millions of Dollars | Years Ended December 31 | Millions of Dollars |
| 2022 | 2021 | 2020 |
| 2023 | | | 2023 | 2022 | 2021 |
| Cash Flows From Operating Activities | Cash Flows From Operating Activities | |
| Net income (loss) | Net income (loss) | $ | 18,680 | | 8,079 | | (2,655) | |
| Net income (loss) | |
| Net income (loss) | |
| Adjustments to reconcile net income (loss) to net cash provided by operating activities | Adjustments to reconcile net income (loss) to net cash provided by operating activities | |
| Depreciation, depletion and amortization | |
| Depreciation, depletion and amortization | |
| Depreciation, depletion and amortization | Depreciation, depletion and amortization | 7,504 | | 7,208 | | 5,521 | |
| Impairments | Impairments | (12) | | 674 | | 813 | |
| Dry hole costs and leasehold impairments | Dry hole costs and leasehold impairments | 340 | | 44 | | 1,083 | |
| Accretion on discounted liabilities | Accretion on discounted liabilities | 250 | | 242 | | 252 | |
| Deferred taxes | Deferred taxes | 2,086 | | 1,346 | | (834) | |
| Undistributed equity earnings | 942 | | 446 | | 645 | |
| Gain on dispositions | (1,077) | | (486) | | (549) | |
| Distributions more (less) than income from equity affiliates | |
| (Gain) loss on dispositions | |
| (Gain) loss on investment in Cenovus Energy | (Gain) loss on investment in Cenovus Energy | (251) | | (1,040) | | 855 | |
| Other | Other | 86 | | (788) | | 43 | |
| Working capital adjustments | Working capital adjustments | |
| Decrease (increase) in accounts and notes receivable | Decrease (increase) in accounts and notes receivable | (963) | | (2,500) | | 521 | |
| Increase in inventories | (38) | | (160) | | (25) | |
| Decrease (increase) in accounts and notes receivable | |
| Decrease (increase) in accounts and notes receivable | |
| Decrease (increase) in inventories | |
| Decrease (increase) in prepaid expenses and other current assets | Decrease (increase) in prepaid expenses and other current assets | (173) | | (649) | | 76 | |
| Increase (decrease) in accounts payable | Increase (decrease) in accounts payable | 901 | | 1,399 | | (249) | |
| Increase (decrease) in taxes and other accruals | Increase (decrease) in taxes and other accruals | 39 | | 3,181 | | (695) | |
| Net Cash Provided by Operating Activities | Net Cash Provided by Operating Activities | 28,314 | | 16,996 | | 4,802 | |
| Cash Flows From Investing Activities | Cash Flows From Investing Activities | |
| Capital expenditures and investments | |
| Capital expenditures and investments | |
| Capital expenditures and investments | Capital expenditures and investments | (10,159) | | (5,324) | | (4,715) | |
| Working capital changes associated with investing activities | Working capital changes associated with investing activities | 520 | | 134 | | (155) | |
| Acquisition of businesses, net of cash acquired | Acquisition of businesses, net of cash acquired | (60) | | (8,290) | | — | |
| Proceeds from asset dispositions | Proceeds from asset dispositions | 3,471 | | 1,653 | | 1,317 | |
| Net sales (purchases) of investments | Net sales (purchases) of investments | (2,629) | | 3,091 | | (658) | |
| Collection of advances/loans—related parties | Collection of advances/loans—related parties | 114 | | 105 | | 116 | |
| Other | Other | 2 | | 87 | | (26) | |
| Net Cash Used in Investing Activities | Net Cash Used in Investing Activities | (8,741) | | (8,544) | | (4,121) | |
| Cash Flows From Financing Activities | Cash Flows From Financing Activities | |
| Issuance of debt | |
| Issuance of debt | |
| Issuance of debt | Issuance of debt | 2,897 | | — | | 300 | |
| Repayment of debt | Repayment of debt | (6,267) | | (505) | | (254) | |
| Issuance of company common stock | Issuance of company common stock | 362 | | 145 | | (5) | |
| Repurchase of company common stock | Repurchase of company common stock | (9,270) | | (3,623) | | (892) | |
| Dividends paid | Dividends paid | (5,726) | | (2,359) | | (1,831) | |
| Other | Other | (49) | | 7 | | (26) | |
| Net Cash Used in Financing Activities | Net Cash Used in Financing Activities | (18,053) | | (6,335) | | (2,708) | |
| Effect of Exchange Rate Changes on Cash, Cash Equivalents and Restricted Cash | Effect of Exchange Rate Changes on Cash, Cash Equivalents and Restricted Cash | (224) | | (34) | | (20) | |
| Net Change in Cash, Cash Equivalents and Restricted Cash | Net Change in Cash, Cash Equivalents and Restricted Cash | 1,296 | | 2,083 | | (2,047) | |
| Cash, cash equivalents and restricted cash at beginning of period | Cash, cash equivalents and restricted cash at beginning of period | 5,398 | | 3,315 | | 5,362 | |
| Cash, Cash Equivalents and Restricted Cash at End of Period | Cash, Cash Equivalents and Restricted Cash at End of Period | $ | 6,694 | | 5,398 | | 3,315 | |
2022.Restricted cash of $152 million2023 and $218 million is included in the “Prepaid expenses and other current assets” and “Other assets” lines, respectively, of our Consolidated Balance Sheet as of December 31, 2021.2022, respectively.
See Notes to Consolidated Financial Statements.
| | | | | |
77ConocoPhillips 2023 10-K | ConocoPhillips 2022 10-K78 |
| | | | | |
| Consolidated Statement of Changes in Equity | ConocoPhillips |
| | Millions of Dollars | |
| Millions of Dollars | |
| Millions of Dollars | |
| | Millions of Dollars |
| Common Stock | |
| Common Stock | |
| Common Stock | |
| Par Value | |
| Par Value | |
| Par Value | | Capital in
Excess of
Par | Treasury
Stock | Accum. Other
Comprehensive
Income (Loss) | Retained
Earnings | | Total |
| | Attributable to ConocoPhillips | |
| Common Stock | | |
| Par Value | Capital in
Excess of
Par | Treasury
Stock | Accum. Other
Comprehensive
Income (Loss) | Retained
Earnings | Non-
Controlling
Interests | Total |
| | Balances at December 31, 2019 | $ | 18 | | 46,983 | | (46,405) | | (5,357) | | 39,742 | | 69 | | 35,050 | |
| Net income (loss) | | (2,701) | | 46 | | (2,655) | |
| Other comprehensive income (loss) | | 139 | | | 139 | |
| Dividends declared—ordinary ($1.69 per share of common stock) | | (1,831) | | | (1,831) | |
| Repurchase of company common stock | | (892) | | | (892) | |
| Distributions to noncontrolling interests and other | | (32) | | (32) | |
| Disposition | | (84) | | (84) | |
| Distributed under benefit plans | | 150 | | | 150 | |
| | Other | | 3 | | 1 | | 4 | |
| Balances at December 31, 2020 | |
| Balances at December 31, 2020 | |
| Balances at December 31, 2020 | Balances at December 31, 2020 | $ | 18 | | 47,133 | | (47,297) | | (5,218) | | 35,213 | | — | | 29,849 | |
| Net income (loss) | Net income (loss) | | 8,079 | | | 8,079 | |
| Other comprehensive income (loss) | Other comprehensive income (loss) | | 268 | | | 268 | |
| Dividends declared | Dividends declared | |
| Ordinary ($1.75 per share of common stock) | Ordinary ($1.75 per share of common stock) | | (2,359) | | | (2,359) | |
| Ordinary ($1.75 per share of common stock) | |
| Ordinary ($1.75 per share of common stock) | |
| Variable return of cash ($0.20 per share of common stock) | Variable return of cash ($0.20 per share of common stock) | | (260) | | | (260) | |
| Acquisition of Concho | Acquisition of Concho | 3 | | 13,122 | | | 13,125 | |
| Repurchase of company common stock | Repurchase of company common stock | | (3,623) | | | (3,623) | |
| | Distributed under benefit plans | Distributed under benefit plans | | 326 | | | 326 | |
| Other | Other | | 1 | | | 1 | |
| Balances at December 31, 2021 | Balances at December 31, 2021 | $ | 21 | | 60,581 | | (50,920) | | (4,950) | | 40,674 | | — | | 45,406 | |
| Net income (loss) | Net income (loss) | | | | | | | | | 18,680 | | | | 18,680 | |
| Other comprehensive income (loss) | Other comprehensive income (loss) | | | | | | | (1,050) | | | | | | (1,050) | |
| Dividends declared | Dividends declared | | | | | | | | | | | | | |
| Ordinary ($1.89 per share of common stock) | Ordinary ($1.89 per share of common stock) | | | | | | | | | (2,419) | | | | (2,419) | |
| Ordinary ($1.89 per share of common stock) | |
| Ordinary ($1.89 per share of common stock) | |
| Variable return of cash ($3.10 per share of common stock) | Variable return of cash ($3.10 per share of common stock) | | | | | | | | | (3,908) | | | | (3,908) | |
| | Repurchase of company common stock | Repurchase of company common stock | | | | | (9,270) | | | | | | | | (9,270) | |
| Distributed under benefit plans | Distributed under benefit plans | | | 561 | | | | | | | | | | 561 | |
| Other | Other | | | | | 1 | | | | 2 | | | | 3 | |
| Balances at December 31, 2022 | Balances at December 31, 2022 | $ | 21 | | 61,142 | | (60,189) | | (6,000) | | 53,029 | | — | | 48,003 | |
| Net income (loss) | |
| Other comprehensive income (loss) | |
| Dividends declared | |
| Ordinary ($2.11 per share of common stock) | |
| Ordinary ($2.11 per share of common stock) | |
| Ordinary ($2.11 per share of common stock) | |
| Variable return of cash ($1.80 per share of common stock) | |
| Repurchase of company common stock | |
| Excise tax on share repurchases | |
| Distributed under benefit plans | |
| Other | |
| Balances at December 31, 2023 | |
| | | | | |
| 79 | ConocoPhillips 20222023 10-K | 78 |
| | | | | |
| Notes to Consolidated Financial Statements | |
Notes to Consolidated Financial Statements
Note 1—Accounting Policies
•Consolidation Principles and Investments—Our consolidated financial statements include the accounts of majority-owned, controlled subsidiaries and, if applicable, variable interest entities where we are the primary beneficiary. The equity method is used to account for investments in affiliates in which we have the ability to exert significant influence over the affiliates’ operating and financial policies. When we do not have the ability to exert significant influence, the investment is measured at fair value except when the investment does not have a readily determinable fair value. For those exceptions, it will be measured at cost minus impairment, plus or minus observable price changes in orderly transactions for an identical or similar investment of the same issuer. Undivided interests in oil and gas joint ventures, pipelines, natural gas plants and terminals are consolidated on a proportionate basis. Other securities and investments are generally carried at cost. We manage our operations through six operating segments, defined by geographic region: Alaska; Lower 48; Canada; Europe, Middle East and North Africa; Asia Pacific; and Other International. See Note 24. •Foreign Currency Translation—Adjustments resulting from the process of translating foreign functional currency financial statements into U.S. dollars are included in accumulated other comprehensive lossincome (loss) in common stockholders’ equity. Foreign currency transaction gains and losses are included in current earnings. Some of our foreign operations use their local currency as the functional currency.
•Use of Estimates—The preparation of financial statements in conformity with U.S. GAAP requires management to make estimates and assumptions that affect the reported amounts of assets, liabilities, revenues and expenses and the disclosures of contingent assets and liabilities. Actual results could differ from these estimates.
•Revenue Recognition—Revenues associated with the sales of crude oil, bitumen, natural gas, NGLs, LNG NGLs and other items are recognized at the point in time when the customer obtains control of the asset. In evaluating when a customer has control of the asset, we primarily consider whether the transfer of legal title and physical delivery has occurred, whether the customer has significant risks and rewards of ownership and whether the customer has accepted delivery and a right to payment exists. These products are typically sold at prevailing market prices. We allocate variable market-based consideration to deliveries (performance obligations) in the current period as that consideration relates specifically to our efforts to transfer control of current period deliveries to the customer and represents the amount we expect to be entitled to in exchange for the related products. Payment is typically due within 30 days or less.
Revenues associated with transactionsTransactions commonly called buy/sell contracts, in which the purchase and sale of inventory with the same counterparty are entered into “in contemplation” of one another, are combined and reported net (i.e., on the same income statement line).
•Shipping and Handling Costs—We typically incur shipping and handling costs prior to control transferring to the customer and account for these activities as fulfillment costs. Accordingly, we include shipping and handling costs in production and operating expenses for production activities. Transportation costs related to marketing activities are recorded in purchased commodities. Freight costs billed to customers are treated as a component of the transaction price and recorded as a component of revenue when the customer obtains control.
•Cash Equivalents—Cash equivalents are highly liquid, short-term investments that are readily convertible to known amounts of cash and have original maturities of 90 days or less from their date of purchase. They are carried at cost plus accrued interest, which approximates fair value.
•Short-Term Investments—Short-term investments include investments in bank time deposits and marketable securities (commercial paper and government obligations) which are carried at cost plus accrued interest and have original maturities of greater than 90 days but within one year or when the remaining maturities are within one year. We also invest in financial instruments classified as available for sale debt securities which are carried at fair value. Those instruments are included in short-term investments when they have remaining maturities of one year or less, as of the balance sheet date.
•Long-Term Investments in Debt Securities—Long-term investments in debt securities includes financial instruments classified as available for sale debt securities with remaining maturities greater than one year as of the balance sheet date. They are carried at fair value and presented within the “Investments and long-term receivables” line of our consolidated balance sheet.
| | | | | |
79ConocoPhillips 2023 10-K | ConocoPhillips 2022 10-K80 |
| | | | | |
| Notes to Consolidated Financial Statements | |
•Inventories—We have several valuation methods for our various types of inventories and consistently use the following methods for each type of inventory. The majority of our commodity-related inventories are recorded at cost using the LIFO basis. We measure these inventories at the lower-of-cost-or-market in the aggregate. Any necessary lower-of-cost-or-market write-downs at year end are recorded as permanent adjustments to the LIFO cost basis. LIFO is used to better match current inventory costs with current revenues. Costs include both direct and indirect expenditures incurred in bringing an item or product to its existing condition and location, but not unusual/nonrecurring costs or research and development costs. Materials, supplies and other miscellaneous inventories, such as tubular goods and well equipment, are valued using various methods, including the weighted-average-cost method and the FIFO method, consistent with industry practice.
•Fair Value Measurements—Assets and liabilities measured at fair value and required to be categorized within the fair value hierarchy are categorized into one of three different levels depending on the observability of the inputs employed in the measurement. Level 1 inputs are quoted prices in active markets for identical assets or liabilities. Level 2 inputs are observable inputs other than quoted prices included within Level 1 for the asset or liability, either directly or indirectly through market-corroborated inputs. Level 3 inputs are unobservable inputs for the asset or liability reflecting significant modifications to observable related market data or our assumptions about pricing by market participants.
•Derivative Instruments—Derivative instruments are recorded on the balance sheet at fair value. If the right of offset exists and certain other criteria are met, derivative assets and liabilities with the same counterparty are netted on the balance sheet and the collateral payable or receivable is netted against derivative assets and derivative liabilities, respectively.
Recognition and classification of the gain or loss that results from recording and adjusting a derivative to fair value depends on the purpose for issuing or holding the derivative. Gains and losses from derivatives not accounted for as hedges are recognized immediately in earnings. We do not apply hedge accounting to our derivative instruments.
•Oil and Gas Exploration and Development—Oil and gas exploration and development costs are accounted for using the successful efforts method of accounting.
Property Acquisition Costs—Oil and gas leasehold acquisition costs are capitalized and included in the balance sheet caption PP&E. Leasehold impairment is recognized based on exploratory experience and management’s judgment. Upon achievement of all conditions necessary for reserves to be classified as proved, the associated leasehold costs are reclassified to proved properties.
Exploratory Costs—Geological and geophysical costs and the costs of carrying and retaining undeveloped properties are expensed as incurred. Exploratory well costs are capitalized, or “suspended,” on the balance sheet pending further evaluation of whether economically recoverable reserves have been found. If economically recoverable reserves are not found, exploratory well costs are expensed as dry holes. If exploratory wells encounter potentially economic quantities of oil and gas, the well costs remain capitalized on the balance sheet as long as sufficient progress assessing the reserves and the economic and operating viability of the project is being made. For complex exploratory discoveries, it is not unusual to have exploratory wells remain suspended on the balance sheet for several years while we perform additional appraisal drilling and seismic work on the potential oil and gas field or while we seek government or co-venturercoventurer approval of development plans or seek environmental permitting. Once all required approvals and permits have been obtained, the projects are moved into the development phase, and the oil and gas resources are designated as proved reserves.
Management reviews suspended well balances quarterly, continuously monitors the results of the additional appraisal drilling and seismic work, and expenses the suspended well costs as dry holes when it judges the potential field does not warrant further investment in the near term. See Note 6. Development Costs—Costs incurred to drill and equip development wells, including unsuccessful development wells, are capitalized.
Depletion and Amortization—Leasehold costs of producing properties are depleted using the unit-of-production method based on estimated proved oil and gas reserves. Amortization of development costs is based on the unit-of-production method using estimated proved developed oil and gas reserves.
| | | | | |
| 81 | ConocoPhillips 20222023 10-K | 80 |
| | | | | |
| Notes to Consolidated Financial Statements | |
•Capitalized Interest—Interest from external borrowings is capitalized on major projects with an expected construction period of one year or longer. Capitalized interest is added to the cost of the underlying asset and is amortized over the useful lives of the assets in the same manner as the underlying assets.
•Depreciation and Amortization—Depreciation and amortization of PP&E on producing hydrocarbon properties and SAGD facilities and certain pipeline and LNG assets (those which are expected to have a declining utilization pattern), are determined by the unit-of-production method. Depreciation and amortization of all other PP&E are determined by either the individual-unit-straight-line method or the group-straight-line method (for those individual units that are highly integrated with other units).
•Impairment of Properties, Plants and Equipment—Long-lived assets used in operations are assessed for impairment whenever changes in facts and circumstances indicate a possible significant deterioration in the future cash flows expected to be generated by an asset group. If there is an indication the carrying amount of an asset may not be recovered, a recoverability test is performed using management’s assumptions for prices, volumes and future development plans. If the sum of the undiscounted cash flows before income-taxes is less than the carrying value of the asset group, the carrying value is written down to estimated fair value and reported as an impairment in the period in which the determination is made. Individual assets are grouped for impairment purposes at the lowest level for which there are identifiable cash flows that are largely independent of the cash flows of other groups of assets—generally on a field-by-field basis for E&P assets. Because there usually is a lack of quoted market prices for long-lived assets, the fair value of impaired assets is typically determined based on the present values of expected future cash flows using discount rates and prices believed to be consistent with those used by principal market participants, or based on a multiple of operating cash flow validated with historical market transactions of similar assets where possible.
The expected future cash flows used for impairment reviews and related fair value calculations are based on estimated future production volumes, commodity prices, operating costs and capital decisions, considering all available evidence at the date of review. The impairment review includes cash flows from proved developed and undeveloped reserves, including any development expenditures necessary to achieve that production. Additionally, when probable and possible reserves exist, an appropriate risk-adjusted amount of these reserves may be included in the impairment calculation.
Long-lived assets committed by management for disposal within one year are accounted for at the lower of amortized cost or fair value, less cost to sell, with fair value determined using a binding negotiated price, if available, or present value of expected future cash flows as previously described.
•Maintenance and Repairs—Costs of maintenance and repairs, which are not significant improvements, are expensed when incurred.
•Property Dispositions—When complete units of depreciable property are sold, the asset cost and related accumulated depreciation are eliminated, with any gain or loss reflected in the “Gain (loss) on dispositions” line of our consolidated income statement. When partial units of depreciable property are disposed ofsold or retired which do not significantly alter the DD&A rate, the difference between asset cost and salvage valueaccumulated depreciation are eliminated such that no gain or loss is charged or credited to accumulated depreciation.recorded.
•Asset Retirement Obligations and Environmental Costs—The fair value of legal obligations to retire and remove long-lived assets are recorded in the period in which the obligation is incurred (typically when the asset is installed at the production location). Fair value is estimated using a present value approach, incorporating assumptions about estimated amounts and timing of settlements and impacts of the use of technologies. See Note 8. Environmental expenditures are expensed or capitalized, depending upon their future economic benefit. Expenditures relating to an existing condition caused by past operations, and those having no future economic benefit, are expensed. Liabilities for environmental expenditures are recorded on an undiscounted basis (unless acquired through a business combination, which we record on a discounted basis) when environmental assessments or cleanups are probable and the costs can be reasonably estimated. Recoveries of environmental remediation costs from other parties are recorded as assets when their receipt is probable and estimable.
| | | | | |
81ConocoPhillips 2023 10-K | ConocoPhillips 2022 10-K82 |
| | | | | |
| Notes to Consolidated Financial Statements | |
•Impairment of Investments in Nonconsolidated Entities—Investments in nonconsolidated entities are assessed for impairment whenever changes in the facts and circumstances indicate a loss in value has occurred. When such a condition is judgmentally determined to be other than temporary, the carrying value of the investment is written down to fair value. The fair value of the impaired investment is based on quoted market prices, if available, or upon the present value of expected future cash flows using discount rates and prices believed to be consistent with those used by principal market participants, plus market analysis of comparable assets owned by the investee, if appropriate.
•Guarantees—The fair value of a guarantee is determined and recorded as a liability at the time the guarantee is given. The initial liability is subsequently reduced as we are released from exposure under the guarantee. We amortize the guarantee liability over the relevant time period, if one exists, based on the facts and circumstances surrounding each type of guarantee. In cases where the guarantee term is indefinite, we reverse the liability when we have information indicating the liability is essentially relieved or amortize it over an appropriate time period as the fair value of our guarantee exposure declines over time. We amortize the guarantee liability to the related income statement line item based on the nature of the guarantee. When it becomes probable that we will have to perform on a guarantee, we accrue a separate liability if it is reasonably estimable, based on the facts and circumstances at that time. We reverse the fair value liability only when there is no further exposure under the guarantee.
•Share-Based Compensation—We recognize share-based compensation expense over the shorter of the service period (i.e., the stated period of time required to earn the award) or the period beginning at the start of the service period and ending when an employee first becomes eligible for retirement. We have elected to recognize expense on a straight-line basis over the service period for the entire award, whether the award was granted with ratable or cliff vesting.
•Income Taxes—Deferred income taxes are computed using the liability method and are provided on all temporary differences between the financial reporting basis and the tax basis of our assets and liabilities, except for deferred taxes on income and temporary differences related to the cumulative translation adjustment considered to be permanently reinvested in certain foreign subsidiaries and foreign corporate joint ventures. Allowable tax credits are applied currently as reductions of the provision for income taxes. Interest related to unrecognized tax benefits is reflected in interest and debt expense, and penalties related to unrecognized tax benefits are reflected in production and operating expenses.
•Taxes Collected from Customers and Remitted to Governmental Authorities—Sales and value-added taxes are recorded net.
•Net Income (Loss) Per Share of Common Stock—Basic net income (loss) per share (EPS) is calculated using the two-class method. Under the two-class method, all earnings (distributed and undistributed) are allocated to common stock (including fully vested stock and unit awards that have not yet been issued as common stock) and participating securities. ConocoPhillips grants RSUs under its share-based compensation programs, the majority of which entitle recipients to receive non-forfeitablenonforfeitable dividends during the vesting period on a basis equivalent to dividends paid to holders of the Company’s common stock. See Note 16. These unvested RSUs meet the definition of participating securities based on their respective rights to receive non-forfeitable dividends and are treated as a separate class of securities in computing basic EPS. Participating securities are not included as incremental shares in computing diluted EPS. Diluted EPS includes the potential impact of contingently issuable shares, including awards which require future service as a condition of delivery of the underlying common stock. Diluted EPS is calculated under both the two-class and treasury stock methods, and the more dilutive amount is reported. Diluted net loss per share does not assume conversion or exercise of securities as that would always have an antidilutive effect. Treasury stock is excluded from the daily weighted-average number of common shares outstanding in both calculations. See Note 23. | | | | | |
| 83 | ConocoPhillips 20222023 10-K | 82 |
| | | | | |
| Notes to Consolidated Financial Statements | |
Note 2—Inventories
Inventories at December 31 were:
| | Millions of Dollars | | | Millions of Dollars |
| 2023 | | | 2023 | 2022 |
| | Millions of Dollars |
| 2022 | 2021 |
| | Crude oil and natural gas | |
| Crude oil and natural gas | |
| Crude oil and natural gas | Crude oil and natural gas | $ | 641 | | 647 | |
| Materials and supplies | Materials and supplies | 578 | | 561 | |
| Total inventories | Total inventories | $ | 1,219 | | 1,208 | |
| | Inventories valued on the LIFO basis | Inventories valued on the LIFO basis | $ | 396 | | 395 | |
| Inventories valued on the LIFO basis | |
| Inventories valued on the LIFO basis | |
The estimated excess of current replacement cost over LIFO cost of inventories was approximately $149$91 million and $251$149 million at December 31, 20222023 and 2021,2022, respectively.
Note 3—Acquisitions and Dispositions
All gains or losses on asset dispositions are reported before-tax and are included net in the “Gain (loss) on dispositions” line on our consolidated income statement. All cash proceeds and payments are included in the “Cash Flows From Investing Activities” section of our consolidated statement of cash flows.
2023
Surmont Acquisition
In October 2023, we completed our acquisition of the remaining 50 percent working interest in Surmont, an asset in our Canada segment, from TotalEnergies EP Canada Ltd. Following the acquisition, we own 100 percent working interest in Surmont. The fair value of total consideration for the all-cash transaction was $3.0 billion (CAD $4.1 billion):
| | | | | |
| Fair value of consideration | Millions of Dollars |
| Cash paid | $ | 2,685 | |
| Contingent consideration | 320 | |
| Total consideration | $ | 3,005 | |
The contingent payment arrangement requires additional consideration to be paid to TotalEnergies EP Canada Ltd. up to $0.4 billion CAD over a five-year term. The contingent payments represent $2.0 million for every dollar that WCS pricing exceeds $52 per barrel during the month, subject to certain production targets being achieved. The range of the undiscounted amounts we could pay under this arrangement is between $0 and $0.3 billion. The fair value of the contingent consideration on the acquisition date was $320 million and estimated by applying the income approach. See Note 13.
The transaction is accounted for as a business combination under FASB Topic ASC 805 using the acquisition method, which requires assets acquired and liabilities assumed to be measured at their acquisition date fair values. Fair value measurements were made for acquired assets and liabilities, and adjustments to those measurements may be made in subsequent periods, up to one year from the acquisition date as we identify new information about facts and circumstances that existed as of the acquisition date to consider.
Oil and gas properties were valued using a discounted cash flow approach incorporating market participants and internally generated price assumptions, production profiles and operating and development cost assumptions. The fair values of other assets acquired and liabilities assumed, which included accounts receivable, accounts payable, and most other current assets and current liabilities, were determined to be equivalent to the carrying value due to their short-term nature. The total consideration of $3.0 billion was allocated to the identifiable assets and liabilities based on their fair values as of the acquisition date, October 4, 2023.
| | | | | |
| ConocoPhillips 2023 10-K | 84 |
| | | | | |
| Notes to Consolidated Financial Statements | |
| | | | | |
| Recognized amounts of identifiable assets acquired and liabilities assumed | Millions of Dollars |
| |
| |
| |
| Oil and gas properties | 3,129 | |
| |
| |
| |
| |
| |
| |
| |
| |
| Asset retirement obligations | (112) | |
| Other | (12) | |
| |
| Total identifiable net assets | $ | 3,005 | |
With the completion of the transaction, we acquired proved and unproved properties of approximately $2.9 billion and $0.2 billion, respectively.
In anticipation of the acquisition, we entered into, and settled, various foreign exchange forward contracts to purchase CAD and recognized a loss of $112 million in the "Foreign currency transaction (gain) loss" line on our consolidated income statement associated with these forward contracts. The related cash flows are included within "cash flows from investing activities" on our consolidated statement of cash flows.
From the acquisition date through December 31, 2023, "Total Revenues and Other Income" and "Net Income (Loss)" associated with the acquired assets were $572 million and $119 million, respectively.
Supplemental Pro Forma (unaudited)
The following tables summarize the unaudited supplemental pro forma financial information for the year ended December 31, 2023, and 2022, as if we had completed the acquisition on January 1, 2022.
| | | | | | | | | | | | | | |
| Millions of Dollars |
| Year Ended December 31, 2023 |
| As reported | | Pro forma Surmont | Pro forma Combined |
| | | | |
| Total Revenues and Other Income | $ | 58,574 | | | 2,561 | | 61,135 | |
| Income (loss) before income taxes | 16,288 | | | 659 | | 16,947 | |
| Net Income (Loss) | 10,957 | | | 501 | | 11,458 | |
| | | | |
| Earnings per share: | | | | |
| Basic net income (loss) | $ | 9.08 | | | | 9.50 | |
| Diluted net income (loss) | 9.06 | | | | 9.47 | |
| | | | |
| Millions of Dollars |
| Year Ended December 31, 2022 |
| As reported | | Pro forma Surmont | Pro forma Combined |
| Total Revenues and Other Income | $ | 82,156 | | | 3,582 | | 85,738 | |
| Income (loss) before income taxes | 28,228 | | | 947 | | 29,175 | |
| Net Income (Loss) | 18,680 | | | 720 | | 19,400 | |
| | | | |
| Earnings per share: | | | | |
| Basic net income (loss) | $ | 14.62 | | | | 15.18 | |
| Diluted net income (loss) | 14.57 | | | | 15.13 | |
The unaudited supplemental pro forma financial information is presented for illustration purposes only and is not necessarily indicative of the operating results that would have occurred had the transactions been completed on January 1, 2022, nor is it necessarily indicative of future operating results of the combined entity. The unaudited pro forma financial information for the years ending December 31, 2023 and 2022, respectively, is a result of combining the consolidated income statement of ConocoPhillips with the assets acquired from TotalEnergies EP Canada Ltd. The pro forma results do not include transaction-related costs, nor any cost savings anticipated as a result of the transaction. The pro forma results include adjustments which relate primarily to DD&A, which is based on the unit-of-production method, resulting from the purchase price allocated to properties, plants and equipment. We believe the estimates and assumptions are reasonable, and the relative effects of the transaction are properly reflected.
| | | | | |
| 85 | ConocoPhillips 2023 10-K |
| | | | | |
| Notes to Consolidated Financial Statements | |
QatarEnergy LNG NFS(3) (NFS3), formerly Qatar Liquefied Gas Company Limited (12) (QG12)
During 2022, we were awarded a 25 percent interest in NFS3, a new joint venture with QatarEnergy, to participate in the North Field South (NFS) LNG project. Formation of NFS3 closed during 2023. NFS3 has a 25 percent interest in the NFS project and is reported as an equity method investment in our Europe, Middle East and North Africa segment. See Note 4.
Port Arthur Liquefaction Holdings, LLC (PALNG)
During 2023, we acquired a 30 percent interest in PALNG, a joint venture for the development of a large-scale LNG facility for the first phase of the Port Arthur LNG project ("Phase 1"). Sempra PALNG Holdings, LLC owns the remaining 70 percent interest in the joint venture. PALNG is reported as an equity method investment in our Corporate and Other segment. See Note 4.
Contingent Payments
We recorded contingent payments related to the previous dispositions of our working interests in the Foster Creek Christina Lake Partnership and western Canada gas assets, and our San Juan assets. Contingent payments were recorded as (gain) loss on disposition on our consolidated income statement and reflected within our Canada and Lower 48 segments. In our Canada segment, the contingent payment, calculated and paid quarterly, was $6 million CAD for every $1 CAD by which the WCS quarterly average crude oil price exceeded $52 CAD per barrel. In our Lower 48 segment, the contingent payment, paid annually, was calculated monthly at $7 million per month when the U.S. Henry Hub natural gas price was at or above $3.20 per MMBTU. The term of contingent payments in our Canada segment ended in the second quarter of 2022 and the term of contingent payments in our Lower 48 segment ended at the end of 2023. Contingent payments recorded in the years 2023, 2022 and 2021 were $7 million, $451 million and $369 million, respectively.
2022
Acquisition of Additional Shareholding Interest in Australia Pacific LNG Pty Ltd (APLNG)
In February 2022, we completed the acquisition of an additional 10 percent interest in APLNG from Origin Energy for approximately $1.4 billion, after customary adjustments, in an all-cash transaction resulting from the exercise of our preemption right. This increased our ownership in APLNG to 47.5 percent, with Origin Energy and Sinopec owning
27.5 percent and 25.0 percent, respectively. APLNG is reported as an equity investment in our Asia Pacific segment.
QatarEnergy LNG NFE(4) (NFE4), formerly Qatar Liquefied Gas Company Limited (8) (QG8)
During 2022, we were awarded a 25 percent interest in NFE4, a new joint venture (QG8) with QatarEnergy that willto participate in the North Field East (NFE) LNG project. QG8NFE4 has a 12.5 percent interest in the NFE project and is reported as an equity method investment in our Europe, Middle East and North Africa segment. See Note 4.
Asset Acquisition
In September 2022, we completed the acquisition of an additional working interest in certain Eagle Ford acreage in the Lower 48 segment for cash consideration of $236 million after customary adjustments. This agreement was accounted for as an asset acquisition, with the consideration allocated primarily to PP&E.
Assets Sold
During 2022, we sold our interests in certain noncore assets in our Lower 48 segment for net proceeds of $680 million, with no gain or loss recognized on sale. At the time of disposition, our interest in these assets had a net carrying value of $680 million, consisting of $825 million of assets, primarily related to $818 million of PP&E, and $145 million of liabilities, primarily related to AROs.
In March 2022, we completed the divestiture of our subsidiaries that held our Indonesia assets and operations, and based on an effective date of January 1, 2021, we received net proceeds of $731 million after customary adjustments and recognized a $534 million before-tax and $462 million after-tax gain related to this transaction. Together, the subsidiaries sold indirectly held our 54 percent interest in the Indonesia Corridor Block Production Sharing Contract (PSC)PSC and 35 percent shareholding in the Transasia Pipeline Company. At the time of the disposition, the net carrying value was approximately $0.2 billion, excluding $0.2 billion of cash and restricted cash. The net book value consisted primarily of $0.3 billion of PP&E and $0.1 billion of ARO. The before-tax earnings associated with the subsidiaries sold, excluding the gain on disposition noted above, were $138 million and $604 million and $394 million for the years ended December 31, 2022 2021 and 2020,2021, respectively. Results of operations for the Indonesia interests sold were reported in our Asia Pacific segment.
| | | | | |
83ConocoPhillips 2023 10-K | ConocoPhillips 2022 10-K86 |
| | | | | |
| Notes to Consolidated Financial Statements | |
In 2022, we recorded contingent payments of $451 million relating to the previous dispositions of our interest in the Foster Creek Christina Lake Partnership and western Canada gas assets and our San Juan assets. The contingent payments are recorded as gain on disposition on our consolidated income statement and are reflected within our Canada and Lower 48 segments. In our Canada segment, the contingent payment, calculated and paid on a quarterly basis, is $6 million CAD for every $1 CAD by which the WCS quarterly average crude price exceeds $52 CAD per barrel. In our Lower 48 segment, the contingent payment, paid on an annual basis, is calculated monthly at $7 million per month in which the U.S. Henry Hub price is at or above $3.20 per MMBTU. The term of contingent payments in our Canada segment ended in the second quarter of 2022 and continues through 2023 for the Lower 48 segment. We recorded contingent payments of $369 million in 2021. No payments were recorded in 2020.
2021
During the year, we completed the acquisitions of Concho Resources Inc. (Concho) and of Shell Enterprises LLC’s (Shell) Permian assets. The acquisitions were accounted for as business combinations under FASB Topic ASC 805 using the acquisition method, which requires assets acquired and liabilities assumed to be measured at their acquisition date fair values. Fair value measurements were made forWe completed the final allocation of the purchase price to acquired assets and liabilities and adjustments to those measurements may be made in subsequent periods, up to one year fromof Concho by the acquisition date as we identify new information about facts and circumstances that existed asend of the acquisition date to consider.year, and by the end of the first quarter of 2022 for the Shell assets. It was based on the fair value of the long-lived assets and the conclusion of the fair value determination of all other assets and liabilities acquired.
Acquisition of Concho Resources Inc.
In January 2021, we completed our acquisition of Concho, an independent oil and gas exploration and production company with operations across New Mexico and West Texas focused in the Permian-based Delaware and Midland Basins. Total consideration for the all-stock transaction was valued at $13.1 billion, in which 1.46 shares of ConocoPhillips common stock were exchanged for each outstanding share of Concho common stock.
| | | | | |
Total Consideration | |
Number of shares of Concho common stock issued and outstanding (in thousands)* | 194,243 | |
Number of shares of Concho stock awards outstanding (in thousands)* | 1,599 | |
Number of shares exchanged | 195,842 | |
Exchange ratio | 1.46 | |
Additional shares of ConocoPhillips common stock issued as consideration (in thousands) | 285,929 | |
Average price per share of ConocoPhillips common stock** | $ | 45.9025 | |
Total Consideration (Millions) | $ | 13,125 | |
*Outstanding as of January 15, 2021.
**Based on the ConocoPhillips average stock price on January 15, 2021.
Oil and gas properties were valued using a discounted cash flow approach incorporating market participant and internally generated price assumptions; production profiles; and operating and development cost assumptions. Debt assumed in the acquisition was valued based on observable market prices. The fair values determined for accounts receivable, accounts payable, and most other current assets and current liabilities were equivalent to the carrying value due to their short-term nature. The total consideration of $13.1 billion was allocated to the identifiable assets and liabilities based on their fair values as of January 15, 2021.
| | | | | |
ConocoPhillips 2022 10-K | 84 |
| | | | | |
Notes to Consolidated Financial Statements | |
| | | | | |
Assets Acquired | Millions of Dollars |
Cash and cash equivalents | $ | 382 | |
Accounts receivable, net | 745 | |
Inventories | 45 | |
Prepaid expenses and other current assets | 37 | |
Investments and long-term receivables | 333 | |
Net properties, plants and equipment | 18,923 | |
Other assets | 62 | |
Total assets acquired | $ | 20,527 | |
| |
Liabilities Assumed | |
Accounts payable | $ | 638 | |
Accrued income and other taxes | 56 | |
Employee benefit obligations | 4 | |
Other accruals | 510 | |
Long-term debt | 4,696 | |
Asset retirement obligations and accrued environmental costs | 310 | |
Deferred income taxes | 1,071 | |
Other liabilities and deferred credits | 117 | |
Total liabilities assumed | $ | 7,402 | |
Net assets acquired | $ | 13,125 | |
With the completion of the Concho transaction, we acquired proved and unproved properties of approximately $11.8 billion and $6.9 billion, respectively.
We recognized approximately $157 million of transaction-related costs, all of which were expensed in the first quarter of 2021. These non-recurring costs related primarily to fees paid to advisors and the settlement of share-based awards for certain Concho employees based on the terms of the Merger Agreement.
In the first quarter of 2021, we commenced a company-wide restructuring program, the scope of which included combining the operations of the two companies as well as other global restructuring activities. We recognized non-recurring restructuring costs mainly for employee severance and related incremental pension benefit costs.
The impact from the transaction and restructuring costs to the lines of our consolidated income statement for the year ended December 31, 2021, are below:
| | | | | | | | | | | |
| Millions of Dollars |
| Transaction Cost | Restructuring Cost | Total Cost |
| Production and operating expenses | | 128 | | 128 | |
| Selling, general and administration expenses | 135 | | 67 | | 202 | |
| Exploration expenses | 18 | | 8 | | 26 | |
| Taxes other than income taxes | 4 | | 2 | | 6 | |
| Other expenses | — | | 29 | | 29 | |
| $ | 157 | | 234 | | 391 | |
In February 2021, we completed a debt exchange offer related to the debt assumed from Concho. As a result of the debt exchange, we recognized an additional income tax-related restructuring charge of $75 million.
| | | | | |
85 | ConocoPhillips 2022 10-K |
| | | | | |
Notes to Consolidated Financial Statements | |
From the acquisition date through December 31, 2021, “Total Revenues and Other Income” and “Net Income (Loss) Attributable to ConocoPhillips”” associated with the acquired Concho business were approximately $6,571 million and $2,330 million, respectively. The results associated with the Concho business for the same period include a before- and after-tax loss of $305 million and $233 million, respectively, on the acquired derivative contracts. The before-tax loss is recorded within “Total Revenues and Other Income” on our consolidated income statement. See Note 12. Acquisition of Shell Permian Assets
In December 2021, we completed our acquisition of Shell assets in the Permian based Delaware Basin. The accounting close date used for reporting purposes was December 31, 2021. Assets acquired include approximately 225,000 net acres and producing properties located entirely in Texas. Total consideration for the transaction was $8.6 billion.
Oil and gas properties were valued using a discounted cash flow approach incorporating market participant and internally generated price assumptions, production profiles, and operating and development cost assumptions. The fair values determined for accounts receivable, accounts payable, and most other current assets and current liabilities were equivalent to the carrying value due to their short-term nature. The total consideration of $8.6 billion was allocated to the identifiable assets and liabilities based on their fair values at the acquisition date.
| | | | | |
Assets Acquired | Millions of Dollars |
Accounts receivable, net | $ | 337 | |
Inventories | 20 | |
Net properties, plants and equipment | 8,582 | |
Other assets | 50 | |
Total assets acquired | $ | 8,989 | |
| |
Liabilities Assumed | |
Accounts payable | $ | 206 | |
Accrued income and other taxes | 6 | |
Other accruals | 20 | |
Asset retirement obligations and accrued environmental costs | 86 | |
Other liabilities and deferred credits | 36 | |
Total liabilities assumed | $ | 354 | |
Net assets acquired | $ | 8,635 | |
With the completion of the Shell Permian transaction, we acquired proved and unproved properties of approximately $4.2 billion and $4.3 billion, respectively. We recognized approximately $44 million of transaction-related costs which were expensed in 2021.
| | | | | |
| 87 | ConocoPhillips 20222023 10-K | 86 |
| | | | | |
| Notes to Consolidated Financial Statements | |
Supplemental Pro Forma (unaudited)
The following tables summarizetable summarizes the unaudited supplemental pro forma financial information for the year ended December 31, 2021, and 2020, as if we had completed the acquisitionsacquisition of Concho and the Shell Permian assets on January 1, 2020.
| | Millions of Dollars | | | Millions of Dollars |
| Year Ended December 31, 2021 | | | Year Ended December 31, 2021 |
| As reported | | | As reported | | | Pro forma
Shell | Pro forma
Combined |
| | Total Revenues and Other Income | |
| Total Revenues and Other Income | |
| Total Revenues and Other Income | |
| Income (loss) before income taxes | |
| Net Income (Loss) | |
| | Earnings per share: | |
| Earnings per share: | |
| Earnings per share: | |
| Basic net income (loss) | |
| Basic net income (loss) | |
| Basic net income (loss) | |
| Diluted net income (loss) | |
| | | Millions of Dollars |
| | Year Ended December 31, 2021 |
| | As reported | | Pro forma
Shell | Pro forma
Combined |
| | Total Revenues and Other Income | $ | 48,349 | | | 3,220 | | 51,569 | |
| Income (loss) before income taxes | 12,712 | | | 1,201 | | 13,913 | |
| Net Income (Loss) attributable to ConocoPhillips | 8,079 | | | 920 | | 8,999 | |
| | Earnings per share: | |
| Basic net income | $ | 6.09 | | | 6.78 | |
| Diluted net income | 6.07 | | | 6.76 | |
| | Millions of Dollars |
| | Year Ended December 31, 2020 |
| | As reported | Pro forma
Concho | | Pro forma
Shell | Pro forma
Combined |
| Total Revenues and Other Income | $ | 19,256 | | 3,762 | | | 1,685 | | 24,703 | |
| Income (loss) before income taxes | (3,140) | | 787 | | | (247) | | (2,600) | |
| Net Income (Loss) attributable to ConocoPhillips | (2,701) | | 498 | | | (189) | | (2,392) | |
| | Earnings per share: | |
| Basic net loss | $ | (2.51) | | | (1.75) | |
| Diluted net loss | (2.51) | | | (1.75) | |
|
The unaudited supplemental pro forma financial information is presented for illustration purposes only and is not necessarily indicative of the operating results that would have occurred had the transactionstransaction been completed on January 1, 2020, nor is it necessarily indicative of future operating results of the combined entity. The unaudited pro forma financial information for the twelve-month period ending December 31, 2020 is a result of combining the consolidated income statement of ConocoPhillips with the results of Concho and the assets acquired from Shell. The pro forma results do not include transaction-related costs, nor any cost savings anticipated as a result of the transactions.transaction. The pro forma results includeincludes adjustments from Concho’s historical results to reverse impairment expense of $10.5 billion and $1.9 billion related to oil and gas properties and goodwill, respectively. Other adjustments madewhich relate primarily to DD&A, which is based on the unit-of-production method, resulting from the purchase price allocated to properties, plants and equipment. We believe the estimates and assumptions are reasonable, and the relative effects of the transaction are properly reflected.
Assets Sold
In 2020, we completed the sale of our Australia-West assetassets and operations. The sales agreement entitled us to a $200 million payment upon a final investment decision (FID)FID of the Barossa development project. In March 2021, FID was announced and as such, we recognized a $200 million gain on disposition in the first quarter of 2021. The purchaser failed to pay the FID bonus when due. We have commencedfiled an arbitration proceeding against the purchaser to enforce our contractual right to the $200 million, plus interest accruing from the due date.date and the matter was resolved in April 2023 to our satisfaction. Results of operations related to this transaction are reflected in our Asia Pacific segment. See Note 11. In the second half of 2021, we sold our interests in certain noncore assets in our Lower 48 segment for approximately $250 million after customary adjustments, recognizing a before-tax gain on sale of approximately $58 million. We also completed the sale of our noncore exploration interests in Argentina, recognizing a before-tax loss on disposition of $179 million. Results of operations for Argentina were reported in our Other International segment.
| | | | | |
87 | ConocoPhillips 2022 10-K |
| | | | | |
Notes to Consolidated Financial Statements | |
2020
Asset Acquisition
In August 2020, we completed the acquisition of additional Montney acreage in Canada from Kelt Exploration Ltd. for $382 million after customary adjustments, plus the assumption of $31 million in financing obligations associated with partially owned infrastructure. This acquisition consisted primarily of undeveloped properties and included 140,000 net acres in the liquids-rich Inga Fireweed asset Montney zone, which is directly adjacent to our existing Montney position. The transaction increased our Montney acreage position to approximately 295,000 net acres with a 100 percent working interest. This agreement was accounted for as an asset acquisition resulting in the recognition of $490 million of PP&E; $77 million of ARO and accrued environmental costs; and $31 million of financing obligations recorded primarily to long-term debt. Results of operations for the Montney asset are reported in our Canada segment.
Assets Sold
In February 2020, we sold our Waddell Ranch interests in the Permian Basin for $184 million after customary adjustments. No gain or loss was recognized on the sale. Results of operations for the Waddell Ranch interests sold were reported in our Lower 48 segment.
In March 2020, we completed the sale of our Niobrara interests for approximately $359 million after customary adjustments and recognized a before-tax loss on disposition of $38 million. At the time of disposition, our interest in Niobrara had a net carrying value of $397 million, consisting primarily of $433 million of PP&E and $34 million of ARO. The before-tax loss associated with our interests in Niobrara, including the loss on disposition noted above, was $25 million for the year ended December 31, 2020. Results of operations for the Niobrara interests sold were reported in our Lower 48 segment.
In May 2020, we completed the divestiture of our subsidiaries that held our Australia-West assets and operations, and based on an effective date of January 1, 2019, we received proceeds of $765 million. We recognized a before-tax gain of $587 million related to this transaction in 2020. At the time of disposition, the net carrying value of the subsidiaries sold was approximately $0.2 billion, excluding $0.5 billion of cash. The net carrying value consisted primarily of $1.3 billion of PP&E and $0.1 billion of other current assets offset by $0.7 billion of ARO, $0.3 billion of deferred tax liabilities, and $0.2 billion of other liabilities. The before-tax earnings associated with the subsidiaries sold, including the gain on disposition noted above, was $851 million for the year ended December 31, 2020. The sales agreement entitled us to an additional $200 million upon FID of the Barossa development project. Results of operations for the subsidiaries sold were reported in our Asia Pacific segment.
Note 4—Investments, Loans and Long-Term Receivables
Components of investments and long-term receivables at December 31 were:
| | Millions of Dollars |
| 2022 | 2021 |
| Millions of Dollars | | | Millions of Dollars |
| 2023 | | | 2023 | 2022 |
| Equity investments | Equity investments | $ | 7,493 | | 6,701 | |
| Long-term receivables | Long-term receivables | 142 | | 98 | |
| Long-term investments in debt securities | Long-term investments in debt securities | 522 | | 248 | |
| Other investments | Other investments | 68 | | 66 | |
| $ | 8,225 | | 7,113 | |
| $ | |
| | | | | |
| ConocoPhillips 2023 10-K | 88 |
| | | | | |
| Notes to Consolidated Financial Statements | |
Equity Investments
Affiliated companies in which we had a significant equity investment at December 31, 2022,2023, included:
•APLNG—47.5 percent owned joint venture with Origin Energy (27.5 percent) and Sinopec (25 percent)—to produce CBM from the Bowen and Surat basins in Queensland, Australia, as well as process and export LNG.
•Port Arthur Liquefication Holdings, LLC (PALNG)— 30 percent owned joint venture with Sempra PALNG Holdings, LLC for the development of a large-scale LNG facility for the first phase of the Port Arthur LNG project ("Phase 1"). See Note 3. •QatarEnergy LNG N(3) (N3), formerly Qatar Liquefied Gas Company Limited (3) (QG3)—30 percent owned joint venture with affiliates of QatarEnergy (68.5 percent) and Mitsui & Co., Ltd. (1.5 percent)—produces and liquefies natural gas from Qatar’s North Field, as well as exports LNG.
•QatarEnergy LNG NFE(4) (NFE4), formerly Qatar Liquefied Gas Company Limited (8) (QG8)—25 percent owned joint venture with an affiliate of QatarEnergy (75 percent)—participant in the North Field East (NFE) LNG project.See Note 3. •QatarEnergy LNG NFS(3) (NFS3), formerly Qatar Liquefied Gas Company Limited (12) (QG12)— 25 percent owned joint venture with an affiliate of QatarEnergy (75 percent)—participant in the North Field South project. See Note 3. | | | | | |
ConocoPhillips 2022 10-K | 88 |
| | | | | |
Notes to Consolidated Financial Statements | |
Summarized 100 percent earnings information for equity method investments in affiliated companies, combined, was as follows:
| | | | | | | | | | | |
| Millions of Dollars |
| 2022 | 2021 | 2020 |
| Revenues | $ | 18,356 | | 11,824 | | 7,931 | |
| Income before income taxes | 8,234 | | 3,946 | | 1,843 | |
| Net income | 5,507 | | 2,557 | | 1,426 | |
| | | | | | | | | | | |
| Millions of Dollars |
| 2023 | 2022 | 2021 |
| Revenues | $ | 15,314 | | 18,356 | | 11,824 | |
| Income (loss) before income taxes | 6,301 | | 8,234 | | 3,946 | |
| Net income (loss) | 4,214 | | 5,507 | | 2,557 | |
Summarized 100 percent balance sheet information for equity method investments in affiliated companies, combined, was as follows:
| | Millions of Dollars |
| 2022 | 2021 |
| Millions of Dollars | | | Millions of Dollars |
| 2023 | | | 2023 | 2022 |
| Current assets | Current assets | $ | 5,001 | | 4,493 | |
| Noncurrent assets | Noncurrent assets | 37,789 | | 36,602 | |
| Current liabilities | Current liabilities | 4,169 | | 3,498 | |
| Noncurrent liabilities | Noncurrent liabilities | 17,244 | | 17,465 | |
Our share of income taxes incurred directly by an equity method investee is reported in equity in earnings of affiliates, and as such is not included in income taxes on our consolidated financial statements.
At December 31, 2022,2023, retained earnings included $42$60 million related to the undistributed earnings of affiliated companies. Dividends received from affiliates were $2,684 million, $3,045 million and $1,279 million in 2023, 2022 and $1,076 million in 2022, 2021, and 2020, respectively.
APLNG
APLNG is a joint venture focused on producing CBM from the Bowen and Surat basins in Queensland, Australia. Natural gas is sold to domestic customers and LNG is processed and exported to Asia Pacific markets. Our investment in APLNG gives us access to CBM resources in Australia and enhances our LNG position. The majority of APLNG LNG is sold under two long-term sales and purchase agreements, supplemented with sales of additional LNG cargoes targeting the Asia Pacific markets. Origin Energy, an integrated Australian energy company, is the operator of APLNG’s production and pipeline system, while we operate the LNG facility.
In 2012, APLNG executed an $8.5 billion project finance facility that became non-recourse following financial completion in 2017. The facility is currently composed of a financing agreement with the Export-Import Bank of the United States, a commercial bank facility and two United States Private Placement note facilities. APLNG principal and interest payments commenced in March 2017 and are scheduled to occur bi-annually until September 2030. At December 31, 2022,2023, a balance of $5.2$4.7 billion was outstanding on the facilities. See Note 10. | | | | | |
| 89 | ConocoPhillips 2023 10-K |
| | | | | |
| Notes to Consolidated Financial Statements | |
During the fourth quarter of 2021, Origin Energy Limited agreed to the sale of 10 percent of their interest in APLNG for $1.645 billion, before customary adjustments. ConocoPhillips announced in December 2021 that we were exercising our preemption right under the APLNG Shareholders Agreement to purchase an additional 10 percent shareholding interest in APLNG, subject to government approvals. The sales price associated with this preemption right was determined to reflect a relevant observable market participant view of APLNG’s fair value which was below the carrying value of our existing investment in APLNG. Based on a review of the facts and circumstances surrounding this decline in fair value, we concluded in the fourth quarter of 2021 the impairment was other than temporary under the guidance of FASB ASC Topic 323, and the recognition of an impairment of our existing investment was necessary. Accordingly, we recorded a noncash $688 million before-taxbefore- and after-tax impairment in the fourth quarter of 2021. The impairment was included in the “Impairments” line on our consolidated income statement. See Note 7. | | | | | |
89 | ConocoPhillips 2022 10-K |
| | | | | |
Notes to Consolidated Financial Statements | |
At December 31, 2022,2023, the carrying value of our equity method investment in APLNG was approximately $6.2$5.4 billion. The historical cost basis of our 47.5 percent share of net assets of APLNG was $6.1$5.4 billion, resulting in a basis difference of $41$33 million on our books. The basis difference, which is substantially all associated with PP&E and subject to amortization, has been allocated on a relative fair value basis to individual production license areas owned by APLNG. Any future additional payments are expected to be allocated in a similar manner. As the joint venture produces natural gas from each license, we amortize the basis difference allocated to that license using the unit-of-production method. Included in net income (loss) attributable to ConocoPhillips for 2023, 2022 2021 and 20202021 was after-tax expense of $8 million, $10 million $39 million and $41$39 million, respectively, representing the amortization of this basis difference on currently producing licenses.
QG3
QG3PALNG
PALNG is a joint venture for the development of a large-scale LNG facility. At December 31, 2023, the carrying value of our equity method investment in PALNG was approximately $1.1 billion. See Note 3. N3
N3 is a joint venture that owns an integrated large-scale LNG project located in Qatar. We provided project financing, which was fully repaid in the third quarter of 2022, as described below under “Loans.” At December 31, 2022, the book value of our equity method investment in QG3 was approximately $0.7 billion. We have terminal and pipeline use agreements with Golden Pass LNG Terminal and affiliated Golden Pass Pipeline near Sabine Pass, Texas, intended to provide us with terminal and pipeline capacity for the receipt, storage and regasification of LNG purchased from QG3.N3. Currently, the LNG from QG3N3 is being sold to markets outside of the U.S.
QG8NFE4
During 2022, we were awardedNFE4 is a 25 percent interest in a new joint venture (QG8) with QatarEnergy that will participateparticipating in the NFE LNG project. QG8NFE4 has a 12.5 percent interest in the NFE project. See Note 3.
NFS3
NFS3 is a joint venture with QatarEnergy to participate in the NFS LNG project. NFS3 has a 25 percent interest in the NFS project. See Note 3.
At December 31,
2022,2023, the
bookcarrying value of our equity method
investmentinvestments in Qatar was approximately
$0.3$1.1 billion.
See Note 3.
Loans
As part of our normal ongoing business operations and consistent with industry practice, we enter into numerous agreements with other parties to pursue business opportunities. Included in such activity are loans to certain affiliated and non-affiliated companies.
At December 31, 2022,2023, there were no outstanding loans to affiliated companies as the final loan payment related to QG3 project financing was received in the third quarter of 2022. QG3 secured project financing of $4.0 billion in December 2005, consisting of $1.3 billion of loans from export credit agencies (ECA), $1.5 billion from commercial banks and $1.2 billion from ConocoPhillips. The ConocoPhillips loan facilities had substantially the same terms as the ECA and commercial bank facilities. On December 15, 2011, QG3 achieved financial completion and all project loan facilities became nonrecourse to the project participants. Semi-annual repayments began in January 2011 and were completed in July 2022, for all loan arrangements.companies.
Note 5—Investment in Cenovus Energy
At December 31, 2021, we held 91 million common shares of Cenovus Energy (CVE), which approximated 4.5 percent of the issued and outstanding common shares of CVE. Those shares were carried on our balance sheet at fair value of $1.1 billion based on NYSE closing price of $12.28 per share on the last day of trading for the period. During the first quarter ofIn 2022, we sold our remaining 91 million shares of Cenovus Energy (CVE), recognizing proceeds of $1.4 billion.
billion and a net gain of $251 million. All gains and losses were recognized within "Other income (loss)"income" on our consolidated income statement. Proceeds related to the sale of our CVE shares were included within "Cash Flows from Investing Activities" on our consolidated statement of cash flows.See Note 13. | | | | | | | | | | | |
| Millions of Dollars |
| 2022 | 2021 | 2020 |
| Total Net gain (loss) on equity securities | $ | 251 | | 1,040 | | (855) | |
| Less: Net gain (loss) on equity securities sold during the period | 251 | | 473 | | |
| Unrealized gain (loss) on equity securities still held at the reporting date | $ | | | 567 | | (855) | |
| | | | | | | | | | | |
| Millions of Dollars |
| 2023 | 2022 | 2021 |
| Total Net gain on equity securities | | | 251 | | 1,040 | |
| Less: Net gain on equity securities sold during the period | | | 251 | | 473 | |
| Unrealized gain on equity securities still held at the reporting date | $ | | | | | 567 | |
| | | | | |
ConocoPhillips 20222023 10-K | 90 |
| | | | | |
| Notes to Consolidated Financial Statements | |
Note 6—Suspended Wells and Exploration Expenses
The following table reflects the net changes in suspended exploratory well costs during 2023, 2022 2021 and 2020:
| | | | | | | | | | | | |
| Millions of Dollars | |
| 2022 | 2021 | 2020 | |
| | | | |
| Beginning balance at January 1 | $ | 660 | | 682 | | 1,020 | | |
| Additions pending the determination of proved reserves | 5 | | 10 | | 164 | | |
| Reclassifications to proved properties | (7) | | — | | (42) | | |
| Sales of suspended wells | — | | — | | (313) | | |
| Charged to dry hole expense | (131) | | (32) | | (147) | | |
| Ending balance at December 31 | $ | 527 | | 660 | | 682 | | |
| | | | | | | | | | | | |
| Millions of Dollars | |
| 2023 | 2022 | 2021 | |
| | | | |
| Beginning balance | $ | 527 | | 660 | | 682 | | |
| Additions pending the determination of proved reserves | — | | 5 | | 10 | | |
| Reclassifications to proved properties | (285) | | (7) | | — | | |
| | | | |
| Charged to dry hole expense | (58) | | (131) | | (32) | | |
| Ending balance | $ | 184 | | 527 | | 660 | | |
The following table provides an aging of suspended well balances at December 31:
| | Millions of Dollars | | | Millions of Dollars |
| 2023 | |
| | Millions of Dollars |
| Exploratory well costs capitalized for a period of one year or less | |
| | 2022 | 2021 | 2020 | |
| Exploratory well costs capitalized for a period of one year or less | |
| | Exploratory well costs capitalized for a period of one year or less | Exploratory well costs capitalized for a period of one year or less | $ | 15 | | 4 | | 156 | | |
| Exploratory well costs capitalized for a period greater than one year | Exploratory well costs capitalized for a period greater than one year | 512 | | 656 | | 526 | | |
| Exploratory well costs capitalized for a period greater than one year | |
| Exploratory well costs capitalized for a period greater than one year | |
| Ending balance | |
| Ending balance | |
| Ending balance | Ending balance | $ | 527 | | 660 | | 682 | | |
| | Number of projects with exploratory well costs capitalized for a period greater than one year | Number of projects with exploratory well costs capitalized for a period greater than one year | 17 | | 22 | | 22 | | |
| | Number of projects with exploratory well costs capitalized for a period greater than one year | |
| | Number of projects with exploratory well costs capitalized for a period greater than one year | |
The following table provides a further aging of those exploratory well costs that have been capitalized for more than one year since the completion of drilling as of December 31, 2022:2023:
| | Millions of Dollars |
| | Suspended Since |
| Total | 2019-2021 | 2016-2018 | 2006-2015 |
Willow—Alaska(2) | 315 | | 201 | | 114 | | — | |
PL 1009—Norway(1) | 39 | | 39 | | — | | — | |
PL 891—Norway(1) | 31 | | 31 | | — | | — | |
| Millions of Dollars | | | Millions of Dollars |
| | Suspended Since | | | | Suspended Since |
| Total | | | Total | 2020-2022 | 2017-2019 | 2006-2016 |
WL4-00—Malaysia(2) | |
PL891—Norway(1) | |
West Willow—Alaska(1) | |
Narwhal Trend—Alaska(1) | Narwhal Trend—Alaska(1) | 25 | | — | | 25 | | — | |
WL4-00—Malaysia(2) | 24 | | 7 | | 17 | | — | |
PL782S—Norway(1) | PL782S—Norway(1) | 19 | | 19 | | — | | — | |
Montney—Canada(1) | Montney—Canada(1) | 12 | | 4 | | 8 | | — | |
Other of $10 million or less each(1)(2) | Other of $10 million or less each(1)(2) | 47 | | 7 | | 10 | | 30 | |
| Total | Total | $ | 512 | | 308 | | 174 | | 30 | |
(1)Additional appraisal wells planned.
(2)Appraisal drilling complete; costs being incurred to assess development.
| | | | | |
| 91 | ConocoPhillips 20222023 10-K |
| | | | | |
| Notes to Consolidated Financial Statements | |
Exploration Expenses
The charges discussed below are included in the “Exploration expenses” line on our consolidated income statement.
2023
In our Europe, Middle East and North Africa segment, after further evaluation we recognized a before-tax expense of $37 million for dry hole costs associated with the suspended Warka discovery well, drilled in 2020, on license PL1009 in the Norwegian Sea.
In our Alaska segment, we recorded a before-tax expense of approximately $31 million for dry hole costs associated with the Bear-1 exploration well.
2022
In the fourth quarter, we recorded a before-tax expense of $129 million for impairment of certain aged, suspended wells associated with Surmont in our Canada segment.
In our Europe, Middle East and North Africa segment, we recorded a before-tax expense of $102 million for dry hole costs associated with four operated exploration and appraisal wells and one partner operatedpartner-operated well that were drilled in Norway in 2022.
2020
In our Alaska segment, we recorded a before-tax impairment of $828 million for the entire associated carrying value of capitalized undeveloped leasehold costs related to our Alaska North Slope Gas asset. We had stopped participating in evaluating gas line projects and did not believe a project would advance. We remain willing to sell our Alaska North Slope gas to interested parties on a competitive basis if a market materializes in the future.
In our Other International segment, our interests in the Middle Magdalena Basin of Colombia are in force majeure. Because we had no immediate plans to perform under existing contracts, in 2020, we recorded a before-tax expense totaling $84 million for dry hole costs of a previously suspended well and an impairment of the associated capitalized undeveloped leasehold carrying value.
In our Asia Pacific segment, we recorded before-tax expense of $50 million related to dry hole costs of a previously suspended well and an impairment of the associated capitalized undeveloped leasehold carrying value associated with the Kamunsu East Field in Malaysia that is no longer in our development plans.
Note 7—Impairments
During 2023, 2022 2021 and 2020,2021, we recognized the following before-tax impairment charges:
| | Millions of Dollars | | | Millions of Dollars |
| 2023 | | | 2023 | 2022 | 2021 |
| | Millions of Dollars |
| 2022 | 2021 | 2020 |
| | Alaska | |
| Alaska | |
| Alaska | Alaska | $ | 2 | | 5 | | — | |
| Lower 48 | Lower 48 | (11) | | (8) | | 804 | |
| Canada | Canada | (2) | | 6 | | 3 | |
| Europe, Middle East and North Africa | Europe, Middle East and North Africa | (1) | | (24) | | 6 | |
| Asia Pacific | Asia Pacific | — | | 695 | | — | |
| $ | (12) | | 674 | | 813 | |
| Corporate and Other | |
| $ | |
2021
We recorded an impairment of $688 million on our APLNG investment included within the Asia Pacific segment. See Note 4 and Note 13. In our Lower 48 segment, we recorded a credit to impairment of $89 million due to a decreased ARO estimate for a previously sold asset, in which we retained the ARO liability. This was offset by recorded impairments of $84 million during the fourth quarter of 2021, related to certain noncore assets due to changes in development plans. See Note 13. In our Europe, Middle East and North Africa segment, we recorded a credit to impairment of $24 million due to decreased ARO estimates on fields in Norway which ceased production and were fully depreciated in prior years.
2020
We recorded impairments of $813 million, primarily related to certain noncore assets in the Lower 48. Due to a significant decrease in the outlook for current and long-term natural gas prices in early 2020, we recorded impairments of $523 million, primarily for the Wind River Basin operations area, consisting of developed properties in the Madden Field and the Lost Cabin Gas Plant, in the first quarter of 2020. Additionally, due primarily to changes in development plans solidified in the last quarter of 2020, we recognized additional impairments of $287 million in the Lower 48 during the fourth quarter.
| | | | | |
ConocoPhillips 20222023 10-K | 92 |
| | | | | |
| Notes to Consolidated Financial Statements | |
Note 8—Asset Retirement Obligations and Accrued Environmental Costs
Asset retirement obligations and accrued environmental costs at December 31 were:
| | Millions of Dollars | | | Millions of Dollars |
| 2023 | | | 2023 | 2022 |
| | Millions of Dollars |
| 2022 | 2021 |
| | Asset retirement obligations | |
| Asset retirement obligations | |
| Asset retirement obligations | Asset retirement obligations | $ | 6,380 | | 5,926 | |
| Accrued environmental costs | Accrued environmental costs | 182 | | 187 | |
| Total asset retirement obligations and accrued environmental costs | Total asset retirement obligations and accrued environmental costs | 6,562 | | 6,113 | |
| Asset retirement obligations and accrued environmental costs due within one year* | Asset retirement obligations and accrued environmental costs due within one year* | (161) | | (359) | |
| Long-term asset retirement obligations and accrued environmental costs | Long-term asset retirement obligations and accrued environmental costs | $ | 6,401 | | 5,754 | |
*Classified as a current liability on the balance sheet under “Other accruals.”
Asset Retirement Obligations
We record the fair value of a liability for an ARO when it is incurred (typically when the asset is installed at the production location). When the liability is initially recorded, we capitalize the associated asset retirement cost by increasing the carrying amount of the related PP&E. Over time, the liability increases for the change in its present value, while the capitalized cost depreciates over the useful life of the related asset. If in subsequent periods, our estimate of this liability changes, we will record an adjustment to both the liability and PP&E. Reductions to estimated liabilities for assets that are no longer producing are recorded as a credit to impairment.
We have numerous AROs we are required to perform under law or contract once an asset is permanently taken out of service. Most of these obligations are not expected to be paid until several years, or decades, in the future and will be funded from general company resources at the time of removal. Our largest individual obligations involve plugging and abandonment of wells and removal and disposal of offshore oil and gas platforms around the world, as well as oil and gas production facilities and pipelines in Alaska.
During 20222023 and 2021,2022, our overall ARO changed as follows:
| | Millions of Dollars | | | Millions of Dollars |
| 2023 | | | 2023 | 2022 |
| | Millions of Dollars |
| 2022 | 2021 |
| | Balance at January 1 | |
| Balance at January 1 | |
| Balance at January 1 | Balance at January 1 | $ | 5,926 | | 5,573 | |
| Accretion of discount | Accretion of discount | 245 | | 238 | |
| New obligations | New obligations | 144 | | 555 | |
| Changes in estimates of existing obligations | Changes in estimates of existing obligations | 681 | | (113) | |
| Spending on existing obligations | Spending on existing obligations | (231) | | (164) | |
| Property dispositions | Property dispositions | (203) | | (108) | |
| Foreign currency translation | Foreign currency translation | (182) | | (55) | |
| | Balance at December 31 | Balance at December 31 | $ | 6,380 | | 5,926 | |
| Balance at December 31 | |
| Balance at December 31 | |
Accrued Environmental Costs
Total accrued environmental costs at December 31, 2023 and 2022, and 2021, were $182$184 million and $187$182 million, respectively.
We had accrued environmental costs of $107$112 million and $135$107 million at December 31, 20222023 and 2021,2022, respectively, related to remediation activities in the U.S. and Canada. We had also accrued in Corporate and Other $59$55 million and $36$59 million of environmental costs associated with sites no longer in operation at December 31, 20222023 and 2021,2022, respectively. In addition, both December 31, 20222023 and 2021,2022, included a $17 million and $16 million accrual, respectively, where the company has been named a potentially responsible party under the Federal Comprehensive Environmental Response, Compensation and Liability Act, or similar state laws. Accrued environmental liabilities are expected to be paid over periods extending up to 30 years.
Expected expenditures for environmental obligations acquired in various business combinations are discounted using a weighted-average 5 percent discount factor, resulting in an accrued balance for acquired environmental liabilities of $111$116 million at December 31, 2022.2023. The total expected future undiscounted payments related to the portion of the accrued environmental costs that have been discounted are $147$151 million.
| | | | | |
| 93 | ConocoPhillips 20222023 10-K |
| | | | | |
| Notes to Consolidated Financial Statements | |
Note 9—Debt
Long-term debt at December 31 was:
| | Millions of Dollars |
| 2022 | 2021 |
| 2.40% Notes due 2022 | — | | 329 | |
| Millions of Dollars | | | Millions of Dollars |
| 2023 | | | 2023 | 2022 |
| 7.65% Debentures due 2023 | 7.65% Debentures due 2023 | 78 | | 78 | |
| 2.125% Notes due 2024 | |
| 3.35% Notes due 2024 | 3.35% Notes due 2024 | 426 | | 426 | |
| 2.125% Notes due 2024 | 900 | | — | |
| 2.4% Notes due 2025 | |
| 8.2% Notes due 2025 | 8.2% Notes due 2025 | 134 | | 134 | |
| 3.35% Debentures due 2025 | 3.35% Debentures due 2025 | 199 | | 199 | |
| 2.40% Notes due 2025 | 900 | | — | |
| 6.875% Debentures due 2026 | 6.875% Debentures due 2026 | 67 | | 67 | |
| 4.95% Notes due 2026 | — | | 1,250 | |
| 7.8% Debentures due 2027 | 7.8% Debentures due 2027 | 203 | | 203 | |
| 3.75% Notes due 2027 | 3.75% Notes due 2027 | 196 | | 1,000 | |
| 4.3% Notes due 2028 | 4.3% Notes due 2028 | 223 | | 1,000 | |
| 7.375% Debentures due 2029 | 7.375% Debentures due 2029 | 92 | | 92 | |
| 7.0% Debentures due 2029 | 7.0% Debentures due 2029 | 112 | | 200 | |
| 6.95% Notes due 2029 | 6.95% Notes due 2029 | 1,195 | | 1,549 | |
| 8.125% Notes due 2030 | 8.125% Notes due 2030 | 390 | | 390 | |
| 2.4% Notes due 2031 | |
| 7.2% Notes due 2031 | |
| 7.25% Notes due 2031 | |
| 7.4% Notes due 2031 | 7.4% Notes due 2031 | 382 | | 500 | |
| 7.25% Notes due 2031 | 400 | | 500 | |
| 7.2% Notes due 2031 | 447 | | 575 | |
| 2.4% Notes due 2031 | 227 | | 500 | |
| 5.9% Notes due 2032 | 5.9% Notes due 2032 | 505 | | 505 | |
| 5.05% Notes due 2033 | |
| 4.15% Notes due 2034 | 4.15% Notes due 2034 | 246 | | 246 | |
| 5.95% Notes due 2036 | 5.95% Notes due 2036 | 326 | | 500 | |
| 5.951% Notes due 2037 | 631 | | 645 | |
| 5.951% Notes serially maturing 2022 through 2037 | |
| 5.9% Notes due 2038 | 5.9% Notes due 2038 | 350 | | 600 | |
| 6.5% Notes due 2039 | 6.5% Notes due 2039 | 1,588 | | 2,750 | |
| 3.758% Notes due 2042 | 3.758% Notes due 2042 | 785 | | — | |
| 4.3% Notes due 2044 | 4.3% Notes due 2044 | 750 | | 750 | |
| 5.95% Notes due 2046 | 5.95% Notes due 2046 | 329 | | 500 | |
| 7.9% Debentures due 2047 | 7.9% Debentures due 2047 | 60 | | 60 | |
| 4.875% Notes due 2047 | 4.875% Notes due 2047 | 319 | | 800 | |
| 4.85% Notes due 2048 | 4.85% Notes due 2048 | 219 | | 600 | |
| 3.8% Notes due 2052 | 3.8% Notes due 2052 | 1,100 | | — | |
| 5.3% Notes due 2053 | |
| 5.55% Notes due 2054 | |
| 4.025% Notes due 2062 | 4.025% Notes due 2062 | 1,770 | | — | |
| Floating rate notes due 2022 at 1.06% – 1.41% during 2022 and 1.02% – 1.12% during 2021 | — | | 500 | |
| Marine Terminal Revenue Refunding Bonds due 2031 at 0.07% – 4.10% during 2022 and 0.04% – 0.15% during 2021 | 265 | | 265 | |
| Industrial Development Bonds due 2035 at 0.07% – 4.10% during 2022 and 0.04% – 0.12% during 2021 | 18 | | 18 | |
| 5.70% Notes due 2063 | |
| | Marine Terminal Revenue Refunding Bonds due 2031 at 1.65% – 4.70% during 2023 and 0.07% – 4.10% during 2022 | |
| Marine Terminal Revenue Refunding Bonds due 2031 at 1.65% – 4.70% during 2023 and 0.07% – 4.10% during 2022 | |
| Marine Terminal Revenue Refunding Bonds due 2031 at 1.65% – 4.70% during 2023 and 0.07% – 4.10% during 2022 | |
| Industrial Development Bonds due 2035 at 1.85% – 4.70% during 2023 and 0.07% – 4.10% during 2022 | |
| | Other | |
| Other | |
| Other | Other | 23 | | 35 | |
| Debt at face value | Debt at face value | 15,855 | | 17,766 | |
| Finance leases | Finance leases | 1,320 | | 1,261 | |
| Net unamortized premiums, discounts and debt issuance costs | Net unamortized premiums, discounts and debt issuance costs | (532) | | 907 | |
| Total debt | Total debt | 16,643 | | 19,934 | |
| Short-term debt | Short-term debt | (417) | | (1,200) | |
| Long-term debt | Long-term debt | $ | 16,226 | | 18,734 | |
| | | | | |
ConocoPhillips 20222023 10-K | 94 |
| | | | | |
| Notes to Consolidated Financial Statements | |
The principal amounts of long-term debt, excluding finance lease obligations, maturing in 2024 through 2028 are: $759 million, $735 million, $104 million, $438 million, and $265 million, respectively.
2023
In December 2023, the company retired $78 million principal amount of our 7.65 percent Notes at maturity. In the third quarter of 2023, we issued $2.7 billion in new Notes through our universal shelf registration statement and prospectus supplement. The net proceeds were used to fund the acquisition of the remaining 50 percent working interest in Surmont which closed in October 2023. See Note 3. The following Notes were issued: •5.05% Notes due 2033 with principal of $1.0 billion
•5.55%Notes due 2054 with principal of $1.0 billion
•5.70% Notes due 2063 with principal of $0.7 billion
In the second quarter of 2023, as described further below, we initiated and completed two concurrent transactions as part of our debt refinancing strategy. We issued $1.1 billion in new Notes through our universal shelf registration statement and prospectus supplement and used the proceeds to repurchase $1.1 billion of existing debt.
Debt Issuance
On May 23, 2023, we issued 5.3% Notes due 2053 with principal of $1.1 billion.
Tender Offers
On May 25, 2023, we repurchased a total of $1,133 million aggregate principal amount of debt as listed below. We paid $33 million below face value to repurchase these debt instruments and recognized a gain on debt extinguishment of $27 million, which is included in the "Other expenses" line on our consolidated income statement.
•2.125% Notes due 2024 with principal of $900 million (partial repurchase of $439 million)
•3.350% Notes due 2024 with principal of $426 million (partial repurchase of $160 million)
•2.400% Notes due 2025 with principal of $900 million (partial repurchase of $534 million)
2022
In December 2022, the company retired $329 million principal amount of our 2.40 percent Notes at the natural maturity date. maturity. In May 2022, we redeemed $1,250 million principal amount of our 4.95 percent Notes due 2026.2026. We paid premiums above face value of $79$79 million to redeem the debt and recognized a loss on debt extinguishment of $83$83 million which is included in the "Other expenses" line on our consolidated income statement. We also paid $500 million to retire the outstanding principal amount of the floating rate notes due 2022 at maturity.
In the first quarter of 2022, we completed a debt refinancing consisting of three concurrent transactions: a tender offer to repurchase existing debt for cash; exchange offers to retire certain debt in exchange for new debt and cash; and a new debt issuance to partially fund the cash paid in the tender and exchange offers.
Tender Offer
In March 2022, we repurchased a total of $2,716 million aggregate principal amount of debt as listed below. We paid premiums above face value of $333 million to repurchase these debt instruments and recognized a gain on debt extinguishment of $155 million, which is included in the "Other expenses" line on our consolidated income statement.
•3.75% Notes due 2027 with principal of $1,000 million (partial repurchase of $804 million)
•4.3% Notes due 2028 with principal of $1,000 million (partial repurchase of $777 million)
•2.4% Notes due 2031 with principal of $500 million (partial repurchase of $273 million)
•4.875% Notes due 2047 with principal of $800 million (partial repurchase of $481 million)
•4.85% Notes due 2048 with principal of $600 million (partial repurchase of $381 million)
Exchange Offers
Also in March 2022, we completed two concurrent debt exchange offers through which $2,544 million of aggregate principal of existing notes was tendered and accepted in exchange for a combination of new notes and cash. The debt exchange offers were treated as debt modifications for accounting purposes resulting in a portion of the unamortized debt discount, premiums and debt issuance costs of the existing notes being allocated to the new notes on the settlement dates of the exchange offers. We paid premiums above face value of $883 million, comprised of $872 million of cash as well as new notes, which were capitalized as additional debt discount. We incurred expenses of $28 million in the exchanges, which are included in the "Other expenses" line on our consolidated income statement.
| | | | | |
| 95 | ConocoPhillips 2023 10-K |
| | | | | |
| Notes to Consolidated Financial Statements | |
The notes tendered and accepted in the exchange offers were:
•7.0% Debentures due 2029 with principal amount of $200 million (partial exchange of $88 million)
•6.95% Notes due 2029 with principal amount of $1,549 million (partial exchange of $354 million)
•7.4% Notes due 2031 with principal amount of $500 million (partial exchange of $118 million)
•7.25% Notes due 2031 with principal amount of $500 million (partial exchange of $100 million)
•7.2% Notes due 2031 with principal amount of $575 million (partial exchange of $128 million)
•5.95% Notes due 2036 with principal amount of $500 million (partial exchange of $174 million)
•5.9% Notes due 2038 with principal amount of $600 million (partial exchange of $250 million)
•6.5% Notes due 2039 with principal amount of $2,750 million (partial exchange of $1,162 million)
•5.95% Notes due 2046 with principal amount of $500 million (partial exchange of $171 million)
The notes tendered and accepted were exchanged for the following new notes:
•3.758% Notes due 2042 with principal amount of $785 million
•4.025% Notes due 2062 with principal amount of $1,770 million
New Debt Issuance
In March 2022, we issued the following new notes consisting of:notes:
•2.125% Notes due 2024 with principal of $900 million
•2.4% NoteNotes due 2025 with principal of $900 million
•3.8% NoteNotes due 2052 with principal of $1,100 million
Revolving Credit Facility and Credit Rating Information
In February 2022, we refinanced our revolving credit facility from a total borrowing capacity of $6.0 billion down to $5.5 billion with an expiration date of February 2027. Our revolving credit facility may be used for direct bank borrowings, the issuance of letters of credit totaling up to $500 million, or as support for our commercial paper program. The revolving credit facility is broadly syndicated among financial institutions and does not contain any material adverse change provisions or any covenants requiring maintenance of specified financial ratios or credit ratings. The facility agreement contains a cross-default provision relating to the failure to pay principal or interest on other debt obligations of $200 million or more by ConocoPhillips, or any of its consolidated subsidiaries. The amount of the facility is not subject to redetermination prior to its expiration date.
| | | | | |
95 | ConocoPhillips 2022 10-K |
| | | | | |
Notes to Consolidated Financial Statements | |
Credit facility borrowings may bear interest at a margin above the Secured Overnight Financing Rate (SOFR). The facility agreement calls for commitment fees on available, but unused, amounts. The facility agreement also contains early termination rights if our current directors or their approved successors cease to be a majority of the Board of Directors.
The revolving credit facility supports our ability to issue up to $5.5 billion of commercial paper. Commercial paper is generally limited to maturities of 90 days and is included in short-term debt on our consolidated balance sheet. With no commercial paper outstanding and no direct borrowings or letters of credit, we had access to $5.5 billion in available borrowing capacity under our revolving credit facility at December 31, 2022. At2023 and December 31, 2021, we had no commercial paper outstanding and no direct borrowings or letters of credit issued.
In January 2021, we completed the acquisition of Concho in an all-stock transaction. In the acquisition, we assumed Concho’s publicly traded debt, with an outstanding principal balance of $3.9 billion, which was recorded at fair value of $4.7 billion on the acquisition date. The adjustment to fair value of the senior notes of approximately $0.8 billion on the acquisition date will be amortized as an adjustment to interest expense over the remaining contractual terms of the senior notes.
In February 2021, we completed a debt exchange offer related to the debt assumed from Concho. Of the approximately $3.9 billion in aggregate principal amount of Concho’s senior notes offered in the exchange, 98 percent, or approximately $3.8 billion, was tendered and accepted. The new debt issued by ConocoPhillips had the same interest rates and maturity dates as the Concho senior notes. The portion not exchanged, approximately $67 million, remained outstanding across five series of senior notes issued by Concho. The debt exchange was treated as a debt modification for accounting purposes resulting in a portion of the unamortized fair value adjustment of the Concho senior notes allocated to the new debt issued by ConocoPhillips on the settlement date of the exchange. The new debt issued in the exchange is fully and unconditionally guaranteed by ConocoPhillips Company. See Note 3.2022.For information on Finance Leases, see Note 15. The current credit ratings on our long-term debt are:
•Fitch: “A” with a “stable” outlook
•S&P: “A-” with a “stable” outlook
•Moody's: "A2""A2" with a "stable""stable" outlook
We do not have any ratings triggers on any of our corporate debt that would cause an automatic default, and thereby impact our access to liquidity upon downgrade of our credit ratings. If our credit ratings are downgraded from their current levels, it could increase the cost of corporate debt available to us and restrict our access to the commercial paper markets. If our credit ratings were to deteriorate to a level prohibiting us from accessing the commercial paper market, we would still be able to access funds under our revolving credit facility.
At both December 31, 20222023 and 2021,2022, we had $283 million of certain variable rate demand bonds (VRDBs) outstanding with maturities ranging through 2035. The VRDBs are redeemable at the option of the bondholders on any business day. If they are ever redeemed, we have the ability and intent to refinance on a long-term basis, therefore, the VRDBs are included in the “Long-term debt” line on our consolidated balance sheet.
| | | | | |
ConocoPhillips 20222023 10-K | 96 |
| | | | | |
| Notes to Consolidated Financial Statements | |
Note 10—Guarantees
At December 31, 2022,2023, we were liable for certain contingent obligations under various contractual arrangements as described below. We recognize a liability, at inception, for the fair value of our obligation as a guarantor for newly issued or modified guarantees. Unless the carrying amount of the liability is noted below, we have not recognized a liability because the fair value of the obligation is immaterial. In addition, unless otherwise stated, we are not currently performing with any significance under the guarantee and expect future performance to be either immaterial or have only a remote chance of occurrence.
APLNG Guarantees
At December 31, 2022,2023, we had outstanding multiple guarantees in connection with our 47.5 percent ownership interest in APLNG. The following is a description of the guarantees with values calculated utilizing December 20222023 exchange rates:
•During the third quarter of 2016, we issued a guarantee to facilitate the withdrawal of our pro-rata portion of the funds in a project finance reserve account. We estimate the remaining term of this guarantee to be eightseven years. Our maximum exposure under this guarantee is approximately $210 million and may become payable if an enforcement action is commenced by the project finance lenders against APLNG. At December 31, 2022,2023, the carrying value of this guarantee was approximately $14 million.
•In conjunction with our original purchase of an ownership interest in APLNG from Origin Energy Limited in October 2008, we agreed to reimburse Origin Energy Limited for our share of the existing contingent liability arising under guarantees of an existing obligation of APLNG to deliver natural gas under several sales agreements. The final guarantee expires in the fourth quarter of 2041. Our maximum potential liability for future payments, or cost of volume delivery, under these guarantees is estimated to be $780$730 million ($1.31.2 billion in the event of intentional or reckless breach) and would become payable if APLNG fails to meet its obligations under these agreements and the obligations cannot otherwise be mitigated. Future payments are considered unlikely, as the payments, or cost of volume delivery, would only be triggered if APLNG does not have enough natural gas to meet these sales commitments and if the co-venturesco-venturers do not make necessary equity contributions into APLNG.
•We have guaranteed the performance of APLNG with regard to certain other contracts executed in connection with the project’s continued development. The guarantees have remaining terms of 1413 to 2322 years or the life of the venture. Our maximum potential amount of future payments related to these guarantees is approximately $290$390 million and would become payable if APLNG does not perform. At December 31, 2022,2023, the carrying value of these guarantees was approximately $20$29 million.
QG8QatarEnergy LNG Limited Guarantee
We have guaranteed our portion of certain fiscal and other joint venture obligations as a shareholder in QG8.NFE4 and NFS3. This guarantee has an approximate 30-year term with no maximum limit. At December 31, 2022,2023, the carrying value of this guarantee was approximately $7$14 million.
Other Guarantees
We have other guarantees with maximum future potential payment amounts totaling approximately $600$620 million, which consist primarily of guarantees of the residual value of leased office buildings and guarantees of the residual value of corporate aircraft. These guarantees have remaining terms of threetwo to fourfive years and would become payable if certain asset values are lower than guaranteed amounts at the end of the lease or contract term, business conditions decline at guaranteed entities, or as a result of nonperformance of contractual terms by guaranteed parties. At December 31, 2022,2023, there was no carrying value associated with these guarantees.
Indemnifications
Over the years, we have entered into agreements to sell ownership interests in certain legal entities, joint ventures and assets that gave rise to qualifying indemnifications. These agreements include indemnifications for taxes and environmental liabilities. The carrying amount recorded for these indemnifications at December 31, 2022,2023, was approximately $20 million. Those related to environmental issues have terms that are generally indefinite and the maximum amounts of future payments are generally unlimited. Although it is reasonably possible future payments may exceed amounts recorded, due to the nature of the indemnifications, it is not possible to make a reasonable estimate of the maximum potential amount of future payments. See Note 11 for additional information about environmental liabilities. | | | | | |
| 97 | ConocoPhillips 20222023 10-K |
| | | | | |
| Notes to Consolidated Financial Statements | |
Note 11—Contingencies and Commitments
A number of lawsuits involving a variety of claims arising in the ordinary course of business have been filed against ConocoPhillips. We also may be required to remove or mitigate the effects on the environment of the placement, storage, disposal or release of certain chemical, mineral and petroleum substances at various active and inactive sites. We regularly assess the need for accounting recognition or disclosure of these contingencies. In the case of all known contingencies (other than those related to income taxes), we accrue a liability when the loss is probable and the amount is reasonably estimable. If a range of amounts can be reasonably estimated and no amount within the range is a better estimate than any other amount, then the low end of the range is accrued. We do not reduce these liabilities for potential insurance or third-party recoveries. We accrue receivables for insurance or other third-party recoveries when applicable. With respect to income tax-related contingencies, we use a cumulative probability-weighted loss accrual in cases where sustaining a tax position is less than certain. See Note 17, for additional information about income tax-related contingencies. Based on currently available information, we believe it is remote that future costs related to known contingent liability exposures will exceed current accruals by an amount that would have a material adverse impact on our consolidated financial statements. As we learn new facts concerning contingencies, we reassess our position both with respect to accrued liabilities and other potential exposures. Estimates particularly sensitive to future changes include contingent liabilities recorded for environmental remediation, tax and legal matters. Estimated future environmental remediation costs are subject to change due to such factors as the uncertain magnitude of cleanup costs, the unknown time and extent of such remedial actions that may be required, and the determination of our liability in proportion to that of other responsible parties. Estimated future costs related to tax and legal matters are subject to change as events evolve and as additional information becomes available during the administrative and litigation processes.
Environmental
We are subject to international, federal, state and local environmental laws and regulations and record accruals for environmental liabilities based on management’s best estimates. These estimates are based on currently available facts, existing technology, and presently enacted laws and regulations, taking into account stakeholder and business considerations. When measuring environmental liabilities, we also consider our prior experience in remediation of contaminated sites, other companies’ cleanup experience, and data released by the U.S. EPA or other organizations. We consider unasserted claims in our determination of environmental liabilities, and we accrue them in the period they are both probable and reasonably estimable.
Although liability of those potentially responsible for environmental remediation costs is generally joint and several for federal sites and frequently so for other sites, we are usually only one of many companies cited at a particular site. Due to the joint and several liabilities, we could be responsible for all cleanup costs related to any site at which we have been designated as a potentially responsible party. We have been successful to date in sharing cleanup costs with other financially sound companies. Many of the sites at which we are potentially responsible are still under investigation by the EPA or the agency concerned. Prior to actual cleanup, those potentially responsible normally assess the site conditions, apportion responsibility and determine the appropriate remediation. In some instances, we may have no liability or may attain a settlement of liability. Where it appears that other potentially responsible parties may be financially unable to bear their proportional share, we consider this inability in estimating our potential liability, and we adjust our accruals accordingly. As a result of various acquisitions in the past, we assumed certain environmental obligations. Some of these environmental obligations are mitigated by indemnifications made by others for our benefit, and some of the indemnifications are subject to dollar limits and time limits.
We are currently participating in environmental assessments and cleanups at numerous federal Superfund and comparable state and international sites. After an assessment of environmental exposures for cleanup and other costs, we make accruals on an undiscounted basis (except those acquired in a purchase business combination, which we record on a discounted basis) for planned investigation and remediation activities for sites where it is probable future costs will be incurred and these costs can be reasonably estimated. We have not reduced these accruals for possible insurance recoveries. In the future, we may be involved in additional environmental assessments, cleanups and proceedings.
See Note 8 for a summary of our accrued environmental liabilities. | | | | | |
ConocoPhillips 20222023 10-K | 98 |
| | | | | |
| Notes to Consolidated Financial Statements | |
Litigation and Other Contingencies
We are subject to various lawsuits and claims including but not limited to matters involving oil and gas royalty and severance tax payments, gas measurement and valuation methods, contract disputes, environmental damages, climate change, personal injury, and property damage. Our primary exposures for such matters relate to alleged royalty and tax underpayments on certain federal, state and privately owned properties, claims of alleged environmental contamination and damages from historic operations, and climate change. We will continue to defend ourselves vigorously in these matters.
Our legal organization applies its knowledge, experience and professional judgment to the specific characteristics of our cases, employing a litigation management process to manage and monitor the legal proceedings against us. Our process facilitates the early evaluation and quantification of potential exposures in individual cases. This process also enables us to track those cases that have been scheduled for trial and/or mediation. Based on professional judgment and experience in using these litigation management tools and available information about current developments in all our cases, our legal organization regularly assesses the adequacy of current accruals and determines if adjustment of existing accruals, or establishment of new accruals, is required.
We have contingent liabilities resulting from throughput agreements with pipeline and processing companies not associated with financing arrangements. Under these agreements, we may be required to provide any such company with additional funds through advances and penalties for fees related to throughput capacity not utilized. In addition, at December 31, 2022,2023, we had performance obligations secured by letters of credit of $368$340 million (issued as direct bank letters of credit) related to various purchase commitments for materials, supplies, commercial activities and services incident to the ordinary conduct of business.
In 2007, ConocoPhillips was unable to reach agreement with respect to the empresa mixta structure mandated by the Venezuelan government’s Nationalization Decree. As a result, Venezuela’s national oil company, Petróleos de Venezuela, S.A. (PDVSA), or its affiliates, directly assumed control over ConocoPhillips’ interests in the Petrozuata and Hamaca heavy oil ventures and the offshore Corocoro development project. In response to this expropriation, ConocoPhillips initiated international arbitration on November 2, 2007, with the ICSID. On September 3, 2013, an ICSID arbitration tribunal held that Venezuela unlawfully expropriated ConocoPhillips’ significant oil investments in June 2007. On January 17, 2017, the Tribunal reconfirmed the decision that the expropriation was unlawful. In March 2019, the Tribunal unanimously ordered the government of Venezuela to pay ConocoPhillips approximately $8.7 billion in compensation for the government’s unlawful expropriation of the company’s investments in Venezuela in 2007. On August 29, 2019, the ICSID Tribunal issued a decision rectifying the award and reducing it by approximately $227 million. The award now stands at $8.5 billion plus interest. The government of Venezuela sought annulment of the award, which automatically stayed enforcement of the award. On September 29, 2021, the ICSID annulment committee lifted the stay of enforcement of the award. The annulment proceedings are underway.
In 2014, ConocoPhillips filed a separate and independent arbitration under the rules of the ICC against PDVSA under the contracts that had established the Petrozuata and Hamaca projects. The ICC Tribunal issued an award in April 2018, finding that PDVSA owed ConocoPhillips approximately $2 billion under their agreements in connection with the expropriation of the projects and other pre-expropriation fiscal measures. In August 2018, ConocoPhillips entered into a settlement with PDVSA to recover the full amount of this ICC award, plus interest through the payment period, including initial payments totaling approximately $500 million within a period of 90 days from the time of signing of the settlement agreement. The balance of the settlement is to be paid quarterly over a period of four and a half years. Per the settlement, PDVSA recognized the ICC award as a judgment in various jurisdictions, and ConocoPhillips agreed to suspend its legal enforcement actions. ConocoPhillips sent notices of default to PDVSA on October 14 and November 12, 2019, and to date PDVSA has failed to cure its breach. As a result, ConocoPhillips has resumed legal enforcement actions. To date, ConocoPhillips has received approximately $774$777 million in connection with the ICC award. ConocoPhillips has ensured that the settlement and any actions taken in enforcement thereof meet all appropriate U.S. regulatory requirements, including those related to any applicable sanctions imposed by the U.S. against Venezuela.
In 2016, ConocoPhillips filed a separate and independent arbitration under the rules of the ICC against PDVSA under the contracts that had established the Corocoro Project. On August 2, 2019, the ICC Tribunal awarded ConocoPhillips approximately $33 million plus interest under the Corocoro contracts. ConocoPhillips is seeking recognition and enforcement of the award in various jurisdictions. ConocoPhillips has ensured that all the actions related to the award meet all appropriate U.S. regulatory requirements, including those related to any applicable sanctions imposed by the U.S. against Venezuela.
| | | | | |
| 99 | ConocoPhillips 20222023 10-K |
| | | | | |
| Notes to Consolidated Financial Statements | |
Beginning in 2017, governmental and other entities in several states/territories in the U.S. have filed lawsuits against oil and gas companies, including ConocoPhillips, seeking compensatory damages and equitable relief to abate alleged climate change impacts. Additional lawsuits with similar allegations are expected to be filed. The amounts claimed by plaintiffs are unspecified and the legal and factual issues are unprecedented, therefore, there is significant uncertainty about the scope of the claims and alleged damages and any potential impact on the Company’s financial condition. ConocoPhillips believes these lawsuits are factually and legally meritless and are an inappropriate vehicle to address the challenges associated with climate change and will vigorously defend against such lawsuits.
Several Louisiana parishes and the State of Louisiana have filed 43numerous lawsuits under Louisiana’s State and Local Coastal Resources Management Act (SLCRMA) against oil and gas companies, including ConocoPhillips, seeking compensatory damages for contamination and erosion of the Louisiana coastline allegedly caused by historical oil and gas operations. ConocoPhillips entities are defendants in 22 of the lawsuits and will vigorously defend against them. On October 17, 2022, the Fifth Circuit affirmed remand of the lead casescase to state court and the subsequent request for rehearing was denied. Accordingly, the federal district courts have issued remands to state court. Because Plaintiffs’ SLCRMA theories are unprecedented, there is uncertainty about these claims (both as to scope and damages) and we continue to evaluate our exposure in these lawsuits.
In October 2020, the Bureau of Safety and Environmental Enforcement (BSEE) ordered the prior owners of Outer Continental Shelf (OCS) Lease P-0166, including ConocoPhillips, to decommission the lease facilities, including two offshore platforms located near Carpinteria, California. This order was sent after the current owner of OCS Lease P-0166 relinquished the lease and abandoned the lease platforms and facilities. BSEE’s order to ConocoPhillips is premised on its connection to Phillips Petroleum Company, a legacy company of ConocoPhillips, which held a historical 25 percent interest in this lease and operated these facilities, but sold its interest approximately 30 years ago. ConocoPhillips continues to evaluate its exposure in this matter.
On May 10, 2021, ConocoPhillips filed arbitration under the rules of the Singapore International Arbitration Centre (SIAC) against Santos KOTN Pty Ltd. and Santos Limited for their failure to timely pay the $200 million bonus due upon FIDfinal investment decision of the Barossa development project under the sale and purchase agreement. Santos KOTN Pty Ltd.agreement for the sale of our Australia-West asset and Santos Limited have filed a response and counterclaim, and the arbitration is underway.operations. The matter was resolved in April 2023 to our satisfaction.
In July 2021, a federal securities class action was filed against Concho, certain of Concho’s officers, and ConocoPhillips as Concho’s successor in the United States District Court for the Southern District of Texas. On October 21, 2021, the court issued an order appointing Utah Retirement Systems and the Construction Laborers Pension Trust for Southern California as lead plaintiffs (Lead Plaintiffs). On January 7, 2022, the Lead Plaintiffs filed their consolidated complaint alleging that Concho made materially false and misleading statements regarding its business and operations in violation of the federal securities laws and seeking unspecified damages, attorneys’ fees, costs, equitable/injunctive relief, and such other relief that may be deemed appropriate. The defendants filed a motion to dismiss the consolidated complaint on March 8, 2022. On June 23, 2023, the court denied defendants’ motion as to most defendants including Concho/ConocoPhillips. We believe the allegations in the action are without merit and are vigorously defending this litigation.
ConocoPhillips is involved in pending disputes with commercial counterparties relating to the propriety of its force majeure notices following Winter Storm Uri in 2021. We believe these claims are without merit and are vigorously defending them.
Long-Term Unconditional Purchase Obligations and Commitments, Including Throughput Agreements and Take-or-Pay Agreements
We have certain throughput agreements and take-or-pay agreements in support of financing arrangements. The agreements typically provide for natural gas or crude oil transportation to be used inand LNG purchase commitments. The fixed and determinable portion of the ordinary course of business. The aggregate amounts ofremaining estimated payments under these various agreements as of December 31, 2023 are: 2023—$7 million; 2024—$7 million; 2025—$7 million; 2026—$7 million; 2027—$7 million; 2028—$283 million; and 20282029 and after—$33 million.11 billion. Generally, variable components of these obligations include commodity futures prices and inflation rates. Purchases of LNG under these commitments are expected to be offset in the same or approximately same periods by cash received from the related sales transactions. Total payments under the agreements were $26 million in 2023, $26 million in 2022 and $27 million in 2021 and $25 million in 2020.2021.
| | | | | |
ConocoPhillips 20222023 10-K | 100 |
| | | | | |
| Notes to Consolidated Financial Statements | |
Note 12—Derivative and Financial Instruments
We use futures, forwards, swaps and options in various markets to meet our customer needs, capture market opportunities and manage foreign exchange currency risk.
Commodity Derivative Instruments
Our commodity business primarily consists of natural gas, crude oil, bitumen, NGLs, LNG and NGLs.power.
Commodity derivative instruments are held at fair value on our consolidated balance sheet. Where these balances have the right of setoff, they are presented on a net basis. Related cash flows are recorded as operating activities on our consolidated statement of cash flows. On our consolidated income statement, gains and losses are recognized either on a gross basis if directly related to our physical business or a net basis if held for trading. Gains and losses related to contracts that meet and are designated with the NPNS exception are recognized upon settlement. We generally apply this exception to eligible crude contracts and certain gas contracts. We do not apply hedge accounting for our commodity derivatives.
The following table presents the gross fair values of our commodity derivatives, excluding collateral, and the line items where they appear on our consolidated balance sheet:
| | Millions of Dollars |
| 2022 | 2021 |
| Millions of Dollars | | | Millions of Dollars |
| 2023 | | | 2023 | 2022 |
| Assets | Assets | |
| Prepaid expenses and other current assets | |
| Prepaid expenses and other current assets | |
| Prepaid expenses and other current assets | Prepaid expenses and other current assets | $ | 1,795 | | 1,168 | |
| Other assets | Other assets | 242 | | 75 | |
| Liabilities | Liabilities | |
| Other accruals | Other accruals | 1,800 | | 1,160 | |
| Other accruals | |
| Other accruals | |
| Other liabilities and deferred credits | Other liabilities and deferred credits | 210 | | 63 | |
The gains (losses) from commodity derivatives incurred, and the line items where they appear onincluded in our consolidated income statement were:are presented in the following table:
| | Millions of Dollars |
| 2022 | 2021 | 2020 |
| Millions of Dollars | | | Millions of Dollars |
| 2023 | | | 2023 | 2022 | 2021 |
| | Sales and other operating revenues | Sales and other operating revenues | $ | (88) | | (228) | | 19 | |
| Other income (loss) | (5) | | 25 | | 4 | |
| Sales and other operating revenues | |
| Sales and other operating revenues | |
| Other income | |
| Purchased commodities | Purchased commodities | (91) | | 75 | | 11 | |
On January 15, 2021, we assumed financial derivative instruments consisting of oil and natural gas swaps in connection with the acquisition of Concho. At the acquisition date, these financial derivative instruments acquired were recognized at fair value as a net liability of $456 million with settlement dates under the contracts through December 31, 2022. During 2021, we recognized a loss on settlement of these derivatives contracts of $305 million. This loss is recorded within the “Sales and other operating revenues” line on our consolidated income statement. In connection with the settlement, we issued a cash payment of $761 million during 2021 which is included within “Cash Flows From Operating Activities” on our consolidated statement of cash flows.
The table below summarizes our net exposures resulting from outstanding commodity derivative contracts:
| | Open Position
Long/(Short) |
| 2022 | 2021 |
| Open Position
Long/(Short) | | | Open Position
Long/(Short) |
| 2023 | | | 2023 | 2022 |
| Commodity | Commodity | |
| Natural gas and power (billions of cubic feet equivalent) | Natural gas and power (billions of cubic feet equivalent) | |
| Natural gas and power (billions of cubic feet equivalent) | |
| Natural gas and power (billions of cubic feet equivalent) | |
| Fixed price | |
| Fixed price | |
| Fixed price | Fixed price | (14) | | 4 | |
| Basis | Basis | (8) | | (22) | |
| | | | | |
| 101 | ConocoPhillips 20222023 10-K |
| | | | | |
| Notes to Consolidated Financial Statements | |
Interest Rate Derivative Instruments
During 2023, PALNG executed interest rate swaps that had the effect of converting 60 percent of the projected term loans outstanding to finance the cost of development and construction of Phase 1 from floating to fixed rate. These swaps were designated and qualify for hedge accounting under ASC Topic 815, “Derivatives and Hedging,” as a cash flow hedge with changes in the fair value of the designated hedging instruments reported as a component of other comprehensive income and reclassified into earnings in the same periods that the hedged transactions will affect earnings. We recognize our proportionate share of PALNG’s adjustments for other comprehensive income as a change to our equity method investment with corresponding adjustments in equity. For the year ended December 31, 2023, we recognized an unrealized gain of $78 million in other comprehensive income related to these swaps.
Financial Instruments
We invest in financial instruments with maturities based on our cash forecasts for the various accounts and currency pools we manage. The types of financial instruments in which we currently invest include:
•Time deposits: Interest bearing deposits placed with financial institutions for a predetermined amount of time.
•Demand deposits: Interest bearing deposits placed with financial institutions. Deposited funds can be withdrawn without notice.
•Commercial paper: Unsecured promissory notes issued by a corporation, commercial bank or government agency purchased at a discount to mature at par.
•U.S. government or government agency obligations: Securities issued by the U.S. government or U.S. government agencies.
•Foreign government obligations: Securities issued by foreign governments.
•Corporate bonds: Unsecured debt securities issued by corporations.
•Asset-backed securities: Collateralized debt securities.
The following investments are carried on our consolidated balance sheet at cost, plus accrued interest and the table reflects remaining maturities at December 31, 20222023 and 2021:2022:
| | Millions of Dollars |
| Carrying Amount |
| Cash and Cash
Equivalents | Short-Term
Investments |
| 2022 | 2021 | 2022 | 2021 |
| Millions of Dollars | | | Millions of Dollars |
| Carrying Amount | | | Carrying Amount |
| Cash and Cash
Equivalents | | | Cash and Cash
Equivalents | Short-Term
Investments |
| 2023 | | | 2023 | 2022 | 2023 | 2022 |
| | Cash | Cash | $ | 593 | | 670 | | |
| Cash | |
| Cash | |
| Demand Deposits | |
| Demand Deposits | |
| Demand Deposits | Demand Deposits | 1,638 | | 1,554 | | |
| Time Deposits | Time Deposits | |
| Time Deposits | |
| Time Deposits | |
| 1 to 90 days | |
| 1 to 90 days | |
| 1 to 90 days | 1 to 90 days | 4,116 | | 2,363 | | 1,288 | | 217 | |
| 91 to 180 days | 91 to 180 days | | 883 | | 4 | |
| Within one year | Within one year | | 11 | | 4 | |
| U.S. Government Obligations | U.S. Government Obligations | |
| 1 to 90 days | 1 to 90 days | 14 | | 431 | | — | | — | |
| $ | 6,361 | | 5,018 | | 2,182 | | 225 | |
| 1 to 90 days | |
| 1 to 90 days | |
| $ | |
| | | | | |
| ConocoPhillips 2023 10-K | 102 |
| | | | | |
| Notes to Consolidated Financial Statements | |
The following investments in debt securities classified as available for sale are carried at fair value on our consolidated balance sheet at December 31, 20222023 and 2021:2022:
| | Millions of Dollars |
| Carrying Amount |
| Cash and Cash
Equivalents | Short-Term
Investments | Investments and Long-Term
Receivables |
| 2022 | 2021 | 2022 | 2021 | 2022 | 2021 |
| Millions of Dollars | | | Millions of Dollars |
| Carrying Amount | | | Carrying Amount |
| Cash and Cash
Equivalents | | | Cash and Cash
Equivalents | Short-Term
Investments | Investments and Long-Term
Receivables |
| 2023 | | | 2023 | 2022 | 2023 | 2022 | 2023 | 2022 |
| Major Security Type | Major Security Type | |
| Corporate Bonds | Corporate Bonds | $ | — | | 3 | | 323 | | 128 | | 309 | | 173 | |
| Corporate Bonds | |
| Corporate Bonds | |
| Commercial Paper | Commercial Paper | 97 | | 7 | | 156 | | 82 | | |
| U.S. Government Obligations | |
| U.S. Government Obligations | |
| U.S. Government Obligations | U.S. Government Obligations | — | | — | | 115 | | — | | 63 | | 2 | |
| U.S. Government Agency Obligations | U.S. Government Agency Obligations | | 8 | | 2 | | 5 | | 8 | |
| Foreign Government Obligations | Foreign Government Obligations | | — | | 7 | | 7 | | 2 | |
| Asset-backed Securities | Asset-backed Securities | | 1 | | 2 | | 138 | | 63 | |
| $ | 97 | | 10 | | 603 | | 221 | | 522 | | 248 | |
| $ | |
Cash and Cash Equivalents and Short-Term Investments have remaining maturities within one year.
Investments and Long-Term Receivables have remaining maturities that vary from greater than one year through five years.
| | | | | |
ConocoPhillips 2022 10-K | 102 |
| | | | | |
Notes to Consolidated Financial Statements | |
The following table summarizes the amortized cost basis and fair value of investments in debt securities classified as available for sale at December 31:
| | Millions of Dollars |
| Amortized Cost Basis | Fair Value |
| 2022 | 2021 | 2022 | 2021 |
| Millions of Dollars | | | Millions of Dollars |
| Amortized Cost Basis | | | Amortized Cost Basis | Fair Value |
| 2023 | | | 2023 | 2022 | 2023 | 2022 |
| Major Security Type | Major Security Type | |
| Corporate Bonds | |
| Corporate Bonds | |
| Corporate Bonds | Corporate Bonds | $ | 641 | | 305 | | 632 | | 304 | |
| Commercial Paper | Commercial Paper | 253 | | 88 | | 253 | | 89 | |
| U.S. Government Obligations | U.S. Government Obligations | 181 | | 2 | | 178 | | 2 | |
| U.S. Government Agency Obligations | U.S. Government Agency Obligations | 13 | | 10 | | 13 | | 10 | |
| Foreign Government Obligations | Foreign Government Obligations | 7 | | 9 | | 7 | | 9 | |
| Asset-backed Securities | Asset-backed Securities | 139 | | 65 | | 139 | | 65 | |
| $ | 1,234 | | 479 | | 1,222 | | 479 | |
| $ | |
As of December 31, 20222023, total unrealized gains for debt securities classified as available for sale with net unrealized gains were $5 million and 2021,as of December 31, 2022, total unrealized losses for debt securities classified as available for sale with net unrealized losses were $12 million and negligible, respectively.million. No allowance for credit losses has been recorded on investments in debt securities which are in an unrealized loss position.
For the years ended December 31, 20222023 and 2021,2022, proceeds from sales and redemptions of investments in debt securities classified as available for sale were $644$983 million and $594$644 million, respectively. Gross realized gains and losses included in earnings from those sales and redemptions were negligible. The cost of securities sold and redeemed is determined using the specific identification method.
| | | | | |
| 103 | ConocoPhillips 2023 10-K |
| | | | | |
| Notes to Consolidated Financial Statements | |
Credit Risk
Financial instruments potentially exposed to concentrations of credit risk consist primarily of cash equivalents, short-term investments, long-term investments in debt securities, OTC derivative contracts and trade receivables. Our cash equivalents and short-term investments are placed in high-quality commercial paper, government money market funds, U.S. government and government agency obligations, time deposits with major international banks and financial institutions, high-quality corporate bonds, foreign government obligations and asset-backed securities. Our long-term investments in debt securities are placed in high-quality corporate bonds, asset-backed securities, U.S. government and government agency obligations, foreign government obligations, and time deposits with major international banks and financial institutions.
The credit risk from our OTC derivative contracts, such as forwards, swaps and options, derives from the counterparty to the transaction. Individual counterparty exposure is managed within predetermined credit limits and includes the use of cash-call margins when appropriate, thereby reducing the risk of significant nonperformance. We also use futures, swaps and option contracts that have a negligible credit risk because these trades are cleared primarily with an exchange clearinghouse and subject to mandatory margin requirements until settled; however, we are exposed to the credit risk of those exchange brokers for receivables arising from daily margin cash calls, as well as for cash deposited to meet initial margin requirements.
Our trade receivables result primarily from our petroleum operations and reflect a broad national and international customer base, which limits our exposure to concentrations of credit risk. The majority of these receivables have payment terms of 30 days or less, and we continually monitor this exposure and the creditworthiness of the counterparties. We may require collateral to limit the exposure to loss including, letters of credit, prepayments and surety bonds, as well as master netting arrangements to mitigate credit risk with counterparties that both buy from and sell to us, as these agreements permit the amounts owed by us or owed to others to be offset against amounts due to us.
Certain of our derivative instruments contain provisions that require us to post collateral if the derivative exposure exceeds a threshold amount. We have contracts with fixed threshold amounts and other contracts with variable threshold amounts that are contingent on our credit rating. The variable threshold amounts typically decline for lower credit ratings, while both the variable and fixed threshold amounts typically revert to zero if we fall below investment grade. Cash is the primary collateral in all contracts; however, many also permit us to post letters of credit as collateral, such as transactions administered through the New York Mercantile Exchange.
| | | | | |
103 | ConocoPhillips 2022 10-K |
| | | | | |
Notes to Consolidated Financial Statements | |
The aggregate fair value of all derivative instruments with such credit risk-related contingent features that were in a liability position on December 31, 20222023 and December 31, 2021,2022, was $333$181 million and $281$333 million, respectively. For these instruments, $42 million of collateral was posted as of December 31, 2022 and no collateral was posted as of December 31, 2021.2023 and $42 million collateral was posted as of December 31, 2022. If our credit rating had been downgraded below investment grade on December 31, 2022,2023, we would have been required to post $270$152 million of additional collateral, either with cash or letters of credit.
| | | | | |
| ConocoPhillips 2023 10-K | 104 |
| | | | | |
| Notes to Consolidated Financial Statements | |
Note 13—Fair Value Measurement
We carry a portion of our assets and liabilities at fair value that are measured at the reporting date using an exit price (i.e., the price that would be received to sell an asset or paid to transfer a liability) and disclosed according to the quality of valuation inputs under the fair value hierarchy.
The classification of an asset or liability is based on the lowest level of input significant to its fair value. Those that are initially classified as Level 3 are subsequently reported as Level 2 when the fair value derived from unobservable inputs is inconsequential to the overall fair value, or if corroborated market data becomes available. Assets and liabilities initially reported as Level 2 are subsequently reported as Level 3 if corroborated market data is no longer available. There were no material transfers into or out of Level 3 during 20222023 or 2021.2022.
Recurring Fair Value Measurement
Financial assets and liabilities reported at fair value on a recurring basis primarily include our investment in CVE common shares, our investments in debt securities classified as available for sale, commodity derivatives, and commodity derivatives.our contingent consideration arrangement related to the Surmont acquisition. See Note 3. •Level 1 derivative assets and liabilities primarily represent exchange-traded futures and options that are valued using unadjusted prices available from the underlying exchange. Level 1 financial assets also includes our investment in common shares of CVE, which is valued using quotes for shares on the NYSE, andinclude our investments in U.S. government obligations classified as available for sale debt securities, which are valued using exchange prices.
•Level 2 derivative assets and liabilities primarily represent OTC swaps, options and forward purchase and sale contracts that are valued using adjusted exchange prices, prices provided by brokers or pricing service companies that are all corroborated by market data. Level 2 financial assets also includesinclude our investments in debt securities classified as available for sale including investments in corporate bonds, commercial paper, asset-backed securities, U.S. government agency obligations and foreign government obligations that are valued using pricing provided by brokers or pricing service companies that are corroborated with market data.
•Level 3 derivative assets and liabilities consist of OTC swaps, options and forward purchase and sale contracts where a significant portion of fair value is calculated from underlying market data that is not readily available. The derived value uses industry standard methodologies that may consider the historical relationships among various commodities, modeled market prices, time value, volatility factors and other relevant economic measures. The use of these inputs results in management’s best estimate of fair value. Level 3 commodity derivative activity was not material for all periods presented.
•Level 3 liabilities include the fair value of future quarterly contingent payments to Total Energies EP Canada Ltd. in connection with the acquisition of the remaining 50 percent working interest in Surmont. Contingent consideration consists of payments up to approximately $0.4 billion CAD over a five-year term ending in the fourth quarter of 2028. The contingent payments represent $2.0 million for every dollar that the monthly WCS average pricing exceeds $52 per barrel. The terms include adjustments related to not achieving certain production targets. The fair value of the contingent consideration as of December 31, 2023 is calculated using the income approach and is largely based on the estimated commodity price outlook using a combination of external pricing service companies' and our internal price outlook (unobservable input) and a discount rate consistent with those used by principal market participants (observable input). Impact of other unobservable inputs on the fair value as of December 31, 2023 was not significant.
The following table summarizes the fair value hierarchy for gross financial assets and liabilities (i.e., unadjusted where the right of setoff exists for commodity derivatives accounted for at fair value on a recurring basis):
| | Millions of Dollars | | | Millions of Dollars |
| December 31, 2023 | | | December 31, 2023 | | December 31, 2022 |
| Level 1 | | | Level 1 | Level 2 | Level 3 | Total | | Level 1 | Level 2 | Level 3 | Total |
| Assets | |
| | Millions of Dollars |
| Investments in debt securities | |
| | December 31, 2022 | | December 31, 2021 |
| Investments in debt securities | |
| | Level 1 | Level 2 | Level 3 | Total | | Level 1 | Level 2 | Level 3 | Total |
| Assets | | | |
| Investment in Cenovus Energy | $ | | | | | | | | | | 1,117 | | — | | — | | 1,117 | |
| Investments in debt securities | Investments in debt securities | 178 | | 1,044 | | — | | 1,222 | | | 2 | | 477 | | — | | 479 | |
| Commodity derivatives | Commodity derivatives | 958 | | 951 | | 128 | | 2,037 | | | 562 | | 619 | | 62 | | 1,243 | |
| Total assets | Total assets | $ | 1,136 | | 1,995 | | 128 | | 3,259 | | | 1,681 | | 1,096 | | 62 | | 2,839 | |
| | Liabilities | Liabilities | |
| Liabilities | |
| Liabilities | |
| Commodity derivatives | Commodity derivatives | $ | 906 | | 843 | | 261 | | 2,010 | | | 593 | | 543 | | 87 | | 1,223 | |
| Commodity derivatives | |
| Commodity derivatives | |
| Contingent consideration | |
| Total liabilities | Total liabilities | $ | 906 | | 843 | | 261 | | 2,010 | | | 593 | | 543 | | 87 | | 1,223 | |
| | | | | |
| 105 | ConocoPhillips 20222023 10-K | 104 |
| | | | | |
| Notes to Consolidated Financial Statements | |
The range and arithmetic average of the significant unobservable input used in the Level 3 fair value measurement was as follows:
| | | | | | | | | | | | | | |
| Fair Value
(Millions of
Dollars) | Valuation
Technique | Unobservable Input | Range (Arithmetic Average) |
| December 31, 2023 | | | | |
| Contingent consideration - Surmont | $ | 312 | | Discounted cash flow | Commodity price outlook* ($/BOE) | $45.48 - $63.04 ($57.45) |
*Commodity price outlook based on a combination of external pricing service companies' outlooks and our internal outlook.
The following table summarizes those commodity derivative balances subject to the right of setoff as presented on our consolidated balance sheet. We have elected to offset the recognized fair value amounts for multiple derivative instruments executed with the same counterparty in our financial statements when a legal right of setoff exists.
| | Millions of Dollars |
| | Amounts Subject to Right of Setoff |
| Gross
Amounts
Recognized | Amounts Not
Subject to
Right of Setoff | Gross
Amounts | Gross
Amounts
Offset | Net
Amounts
Presented | Cash
Collateral | Net
Amounts |
| December 31, 2022 | |
| Millions of Dollars | | | Millions of Dollars |
| | | Amounts Subject to Right of Setoff | | | | | Amounts Subject to Right of Setoff |
| Gross
Amounts
Recognized | | | Gross
Amounts
Recognized | Amounts Not
Subject to
Right of Setoff | Gross
Amounts | Gross
Amounts
Offset | Net
Amounts
Presented | Cash
Collateral | Net
Amounts |
| December 31, 2023 | |
| Assets | |
| Assets | |
| Assets | Assets | $ | 2,037 | | 39 | | 1,998 | | 1,176 | | 822 | | 37 | | 785 | |
| Liabilities | Liabilities | 2,010 | | 20 | | 1,990 | | 1,176 | | 814 | | 52 | | 762 | |
| | December 31, 2021 | |
| December 31, 2022 | |
| December 31, 2022 | |
| December 31, 2022 | |
| Assets | |
| Assets | |
| Assets | Assets | $ | 1,243 | | 85 | | 1,158 | | 650 | | 508 | | — | | 508 | |
| Liabilities | Liabilities | 1,223 | | 82 | | 1,141 | | 650 | | 491 | | 36 | | 455 | |
At December 31, 20222023 and December 31, 2021,2022, we did not present any amounts gross on our consolidated balance sheet where we had the right of setoff.
Non-Recurring Fair Value Measurement
The following table summarizes the fair value hierarchy by major category and date of remeasurement for assets accounted for at fair value on a non-recurring basis:
| | Millions of Dollars |
| Fair Value Measurements Using | |
| Fair Value | Level 1
Inputs | Level 2
Inputs | Level 3
Inputs | Before-Tax
Loss |
| Millions of Dollars | |
| Millions of Dollars | |
| Millions of Dollars | |
| | Fair Value Measurements Using | |
| | Fair Value Measurements Using | |
| | Fair Value Measurements Using | |
| Fair Value | |
| Fair Value | |
| Fair Value | |
| Year ended December 31, 2021 | |
| Year ended December 31, 2021 | |
| Year ended December 31, 2021 | Year ended December 31, 2021 | |
| Net PP&E (held for use) | Net PP&E (held for use) | |
| Net PP&E (held for use) | |
| Net PP&E (held for use) | |
| December 31, 2021 | |
| December 31, 2021 | |
| December 31, 2021 | December 31, 2021 | $ | 472 | | — | | — | | 472 | | 80 | |
| Equity Method Investments | Equity Method Investments | |
| Equity Method Investments | |
| Equity Method Investments | |
| December 31, 2021 | December 31, 2021 | 5,574 | | — | | 5,574 | | — | | 688 | |
| December 31, 2021 | |
| December 31, 2021 | |
| | | | | |
| ConocoPhillips 2023 10-K | 106 |
| | | | | |
| Notes to Consolidated Financial Statements | |
Net PP&E (held for use)
During 2021, the estimated fair value of certain noncore assets included in our Lower 48 segment declined to amounts below the carrying values. The carrying values were written down to fair value. The fair values were estimated based on internal discounted cash flow models using the following estimated assumptions: estimated future production, an outlook of future prices from a combination of exchanges (short-term) coupled with pricing service companies and our internal outlook (long-term), future operating costs and capital expenditures, and a discount rate believed to be consistent with those used by principal market participants. The range and arithmetic average of significant unobservable inputs used in the Level 3 fair value measurements for significant assets were as follows:
| | | | | | | | | | | | | | |
| Fair Value
(Millions of
Dollars) | Valuation
Technique | Unobservable Inputs | Range (Arithmetic Average) |
| December 31, 2021 | | | | |
| Lower 48 Gulf Coast and Rockies noncore field | $ | 472 | | Discounted cash flow | Commodity production (MBOED) | 0.2 - 17 (5.4) |
| | | Commodity price outlook* ($/BOE) | $41.45 - $93.68 ($64.39) |
| | | Discount rate** | 7.3% - 9.7% (8.7%) |
*Commodity price outlook based on a combination of external pricing service companies' and our internal outlook for years 2024-2050; future prices escalated at 2.0%2.0 percent annually after year 2050.
**Determined as the weighted average cost of capital of a group of peer companies, adjusted for risks where appropriate.
| | | | | |
105 | ConocoPhillips 2022 10-K |
| | | | | |
Notes to Consolidated Financial Statements
| |
Equity Method Investments
During the fourth quarter of 2021, Origin Energy Limited agreed to the sale of 10 percent of their interest in APLNG for $1.645 billion, before customary adjustments. ConocoPhillips announced in December 2021 that we were exercising our preemption right under the APLNG Shareholders Agreement to purchase an additional 10 percent shareholding interest in APLNG, subject to government approvals. The sales price associated with this preemption right was determined to reflect a relevant observable market participant view of APLNG’s fair value which was below the carrying value of our existing investment in APLNG. As such, our investment in APLNG was written down to its fair value of $5,574 million, resulting in a before-tax charge of $688 million. See Note 4 and NoteNote 7.
Reported Fair Values of Financial Instruments
We used the following methods and assumptions to estimate the fair value of financial instruments:
•Cash and cash equivalents and short-term investments: The carrying amount reported on the balance sheet approximates fair value. For those investments classified as available for sale debt securities, the carrying amount reported on the balance sheet is fair value.
•Accounts and notes receivable (including long-term and related parties): The carrying amount reported on the balance sheet approximates fair value. The valuation technique and methods used to estimate the fair value of the current portion of fixed-rate related party loans is consistent with Loans and advances—related parties.
•Investment in Cenovus Energy: See Note 5 for a discussion of the carrying value and fair value of our investment in CVE common shares.•Investments in debt securities classified as available for sale: The fair value of investments in debt securities categorized as Level 1 in the fair value hierarchy is measured using exchange prices. The fair value of investments in debt securities categorized as Level 2 in the fair value hierarchy is measured using pricing provided by brokers or pricing service companies that are corroborated with market data. See Note 12. •Loans and advances—related parties: The carrying amount of floating-rate loans approximates fair value. The fair value of fixed-rate loan activity is measured using market observable data and is categorized as Level 2 in the fair value hierarchy. See Note412.•Accounts payable (including related parties) and floating-rate debt: The carrying amount of accounts payable and floating-rate debt reported on the balance sheet approximates fair value.
•Fixed-rate debt: The estimated fair value of fixed-rate debt is measured using prices available from a pricing service that is corroborated by market data; therefore, these liabilities are categorized as Level 2 in the fair value hierarchy.
•Commercial paper: The carrying amount of our commercial paper instruments approximates fair value and is reported on the balance sheet as short-term debt.
| | | | | |
| 107 | ConocoPhillips 2023 10-K |
| | | | | |
| Notes to Consolidated Financial Statements | |
The following table summarizes the net fair value of financial instruments (i.e., adjusted where the right of setoff exists for commodity derivatives):
| | Millions of Dollars | | | Millions of Dollars |
| Carrying Amount | | | Carrying Amount | | Fair Value |
| 2023 | | | 2023 | 2022 | | 2023 | 2022 |
| Financial assets | |
| | Millions of Dollars |
| Commodity derivatives | |
| | Carrying Amount | | Fair Value |
| Commodity derivatives | |
| | 2022 | 2021 | | 2022 | 2021 |
| Financial assets | | | |
| Investment in CVE common shares | $ | — | | 1,117 | | | $ | — | | 1,117 | |
| Commodity derivatives | Commodity derivatives | 824 | | 593 | | | 824 | | 593 | |
| Investments in debt securities | Investments in debt securities | 1,222 | | 479 | | | 1,222 | | 479 | |
| Loans and advances—related parties | — | | 114 | | | — | | 114 | |
| | Financial liabilities | |
| Financial liabilities | |
| Financial liabilities | Financial liabilities | |
| Total debt, excluding finance leases | Total debt, excluding finance leases | 15,323 | | 18,673 | | | 15,545 | | 22,451 | |
| Total debt, excluding finance leases | |
| Total debt, excluding finance leases | |
| Commodity derivatives | Commodity derivatives | 782 | | 537 | | | 782 | | 537 | |
| | | | | |
ConocoPhillips 2022 10-K | 106 |
| | | | | |
Notes to Consolidated Financial Statements | |
Note 14—Equity
Common Stock
The changes in our shares of common stock, as categorized in the equity section of the balance sheet, were:
| | Shares |
| 2022 | 2021 | 2020 |
| Shares | | | Shares |
| 2023 | | | 2023 | 2022 | 2021 |
| Issued | Issued | |
| Beginning of year | |
| Beginning of year | |
| Beginning of year | Beginning of year | 2,091,562,747 | | 1,798,844,267 | | 1,795,652,203 | |
| Acquisition of Concho | Acquisition of Concho | — | | 285,928,872 | | — | |
| Distributed under benefit plans | Distributed under benefit plans | 9,322,387 | | 6,789,608 | | 3,192,064 | |
| End of year | End of year | 2,100,885,134 | | 2,091,562,747 | | 1,798,844,267 | |
| | Held in Treasury | Held in Treasury | |
| Held in Treasury | |
| Held in Treasury | |
| Beginning of year | |
| Beginning of year | |
| Beginning of year | Beginning of year | 789,319,875 | | 730,802,089 | | 710,783,814 | |
| Repurchase of common stock | Repurchase of common stock | 87,709,187 | | 58,517,786 | | 20,018,275 | |
| End of year | End of year | 877,029,062 | | 789,319,875 | | 730,802,089 | |
Preferred Stock
We have authorized 500 million shares of preferred stock, par value $0.01 per share, none of which was issued or outstanding at December 31, 20222023 or 2021.2022.
Noncontrolling Interests
In 2020, we completed the divestiture of our subsidiaries that held our Australia-West assets and operations. These assets included the Darwin LNG and Bayu-Darwin Pipeline operating joint ventures in which there was a noncontrolling interest. As a result, as of December 31, 2020, we had no noncontrolling interests.
Repurchase of Common Stock
In late 2016, we initiated our current share repurchase program. In October 2022, our Board of Directors approved an increase to our authorization from $25 billion to $45 billion of our common stock to support our plan for future share repurchases. Share repurchases since inception of our current program totaled 383 million shares at a cost of $29 billion through the end of December 2023.
In May 2021, we began a paced monetization of our CVE common shares, the proceeds of which have been applied to share repurchases. During the first quarter of 2022, we sold our remaining 91 million CVE common shares. Share repurchases since inception of our current program totaled 335 million shares at a cost of $23 billion through the end of December 2022.
| | | | | |
107ConocoPhillips 2023 10-K | ConocoPhillips 2022 10-K108 |
| | | | | |
| Notes to Consolidated Financial Statements | |
Note 15—Non-Mineral Leases
The company primarily leases office buildings and drilling equipment, as well as ocean transport vessels, tugboats, corporate aircraft, and other facilities and equipment. Certain leases include escalation clauses for adjusting rental payments to reflect changes in price indices, and other leases include payment provisions that vary based on the nature of usage of the leased asset. Additionally, the company has executed certain leases that provide it with the option to extend or renew the term of the lease, terminate the lease prior to the end of the lease term, or purchase the leased asset as of the end of the lease term. In other cases, the company has executed lease agreements that require it to guarantee the residual value of certain leased office buildings. For additional information about guarantees, see Note 10. There are no significant restrictions imposed on us by the lease agreements with regard to dividends, asset dispositions or borrowing ability. We determine if an arrangement is or contains a lease at contract inception. Certain contractual arrangements may contain both lease and non-lease components. Only the lease components of these contractual arrangements are subject to the provisions of ASC Topic 842, and any non-lease components are subject to other applicable accounting guidance; however, we have elected to adopt the optional practical expedient not to separate lease components apart from non-lease components for existing asset classes (as of the adoption date of ASC 842) for accounting purposes. For contractual arrangements involving a new leased asset class, we determine at contract inception whether it will apply the optional practical expedient to the new leased asset class.
Leases are evaluated for classification as operating or finance leases at the commencement date of the lease and right-of-use assets and corresponding liabilities are recognized on our consolidated balance sheet based on the present value of future lease payments relating to the use of the underlying asset during the lease term. Future lease payments include variable lease payments that depend upon an index or rate using the index or rate at the commencement date and probable amounts owed under residual value guarantees. The amount of future lease payments may be increased to include additional payments related to lease extension, termination, and/or purchase options when the company has determined, at or subsequent to lease commencement, generally due to limited asset availability or operating commitments, it is reasonably certain of exercising such options. We use our incremental borrowing rate as the discount rate in determining the present value of future lease payments, unless the interest rate implicit in the lease arrangement is readily determinable. Lease payments that vary subsequent to the commencement date based on future usage levels, the nature of leased asset activities, or certain other contingencies are not included in the measurement of lease right-of-use assets and corresponding liabilities. We have elected not to record assets and liabilities on our consolidated balance sheet for lease arrangements with terms of 12 months or less.
We often enter into leasing arrangements acting in the capacity as operator for and/or on behalf of certain oil and gas joint ventures of undivided interests. If the lease arrangement can be legally enforced only against us as operator and there is no separate arrangement to sublease the underlying leased asset to our coventurers, we recognize at lease commencement a right-of-use asset and corresponding lease liability on our consolidated balance sheet on a gross basis. While we record lease costs on a gross basis in our consolidated income statement and statement of cash flows, such costs are offset by the reimbursement we receive from our coventurers for their share of the lease cost as the underlying leased asset is utilized in joint venture activities. As a result, lease cost is presented in our consolidated income statement and statement of cash flows on a proportional basis. If we are a nonoperating coventurer, we recognize a right-of-use asset and corresponding lease liability only if we were a specified contractual party to the lease arrangement and the arrangement could be legally enforced against us. In this circumstance, we would recognize both the right-of-use asset and corresponding lease liability on our consolidated balance sheet on a proportional basis consistent with our undivided interest ownership in the related joint venture.
The company has historically recorded certain finance leases executed by investee companies accounted for under the proportionate consolidation method of accounting on its consolidated balance sheet on a proportional basis consistent with its ownership interest in the investee company. In addition, the company has historically recorded finance lease assets and liabilities associated with certain oil and gas joint ventures on a proportional basis pursuant to accounting guidance applicable prior to the adoption date of ASC 842 on January 1, 2019.842. In accordance with the transition provisions of ASC Topic 842, and since we have elected to adopt the package of optional transition-related practical expedients, the historical accounting treatment for these leases has been carried forward and is subject to reconsideration upon the modification or other required reassessment of the arrangements prior to lease term expiration.
| | | | | |
| 109 | ConocoPhillips 20222023 10-K | 108 |
| | | | | |
| Notes to Consolidated Financial Statements | |
The following table summarizes the right-of-use assets and lease liabilities for both the operating and finance leases on our consolidated balance sheet as of December 31:
| | Millions of Dollars |
| 2022 | 2021 |
| Operating
Leases | Finance
Leases | Operating
Leases | Finance
Leases |
| Millions of Dollars | | | Millions of Dollars |
| 2023 | | | 2023 | 2022 |
| Operating
Leases | | | Operating
Leases | Finance
Leases | Operating
Leases | Finance
Leases |
| Right-of-Use Assets | Right-of-Use Assets | |
| Properties, plants and equipment | Properties, plants and equipment | |
| Properties, plants and equipment | |
| Properties, plants and equipment | |
| Gross | |
| Gross | |
| Gross | Gross | | 2,043 | | | 1,812 | |
| Accumulated DD&A | Accumulated DD&A | | (1,022) | | | (857) | |
Net PP&E* | Net PP&E* | | 1,021 | | | 955 | |
| Prepaid expenses and other current assets | | 16 | | 2 | |
| | Other assets | |
| Other assets | |
| Other assets | Other assets | 536 | | | 649 | | |
| | Lease Liabilities | Lease Liabilities | |
| | Lease Liabilities | |
| | Lease Liabilities | |
| Short-term debt** | |
| Short-term debt** | |
| Short-term debt** | Short-term debt** | | 284 | | | 280 | |
| Other accruals | Other accruals | 155 | | | 188 | | |
| Long-term debt*** | Long-term debt*** | | 1,036 | | | 981 | |
| Long-term debt*** | |
| Long-term debt*** | |
| Other liabilities and deferred credits | Other liabilities and deferred credits | 390 | | | 479 | | |
| Total lease liabilities | Total lease liabilities | $ | 545 | | 1,320 | | 667 | | 1,261 | |
| Total lease liabilities | |
| Total lease liabilities | |
* Includes proportionately consolidated finance lease assets of $134 million at December 31, 2023 and $171 million at December 31, 2022 and $208 million at December 31, 2021.2022.
** Includes proportionately consolidated finance lease liabilities of $175 million at December 31, 2023 and $169 million at December 31, 2022 and $154 million at December 31, 2021.2022.
*** Includes proportionately consolidated finance lease liabilities of $326 million at December 31, 2023 and $399 million at December 31, 2022 and $462 million at December 31, 2021.2022.
The following table summarizes our lease costs:
| | Millions of Dollars |
| 2022 | 2021 | 2020 |
| Millions of Dollars | | | Millions of Dollars |
| 2023 | | | 2023 | 2022 | 2021 |
| Lease Cost* | Lease Cost* | |
| Operating lease cost | Operating lease cost | $ | 212 | | 278 | | 321 | |
| Operating lease cost | |
| Operating lease cost | |
| Finance lease cost | Finance lease cost | |
| Amortization of right-of-use assets | |
| Amortization of right-of-use assets | |
| Amortization of right-of-use assets | Amortization of right-of-use assets | 189 | | 148 | | 163 | |
| Interest on lease liabilities | Interest on lease liabilities | 32 | | 27 | | 34 | |
| Short-term lease cost** | Short-term lease cost** | 94 | | 21 | | 42 | |
| Total lease cost*** | Total lease cost*** | $ | 527 | | 474 | | 560 | |
** Short-term leases are not recorded on our consolidated balance sheet.
*** Variable lease cost and sublease income are immaterial for the periods presented and therefore are not included in the table above.
The following table summarizes the lease terms and discount rates as of December 31:
| | 2022 | 2021 |
| 2023 | | | 2023 | 2022 |
| Lease Term and Discount Rate | Lease Term and Discount Rate | |
| Weighted-average term (years) | Weighted-average term (years) | |
| Weighted-average term (years) | |
| Weighted-average term (years) | |
| Operating leases | |
| Operating leases | |
| Operating leases | Operating leases | 5.64 | 5.97 | 5.83 | 5.64 |
| Finance leases | Finance leases | 6.60 | 7.49 | Finance leases | 5.73 | 6.60 |
| | Weighted-average discount rate (percent) | Weighted-average discount rate (percent) | |
| Weighted-average discount rate (percent) | |
| Weighted-average discount rate (percent) | |
| Operating leases | |
| Operating leases | |
| Operating leases | Operating leases | 2.99 | | 2.66 | |
| Finance leases | Finance leases | 3.40 | | 3.24 | |
| | | | | |
109ConocoPhillips 2023 10-K | ConocoPhillips 2022 10-K110 |
The following table summarizes other lease information:
| | Millions of Dollars |
| 2022 | 2021 | 2020 |
| Millions of Dollars | | | Millions of Dollars |
| 2023 | | | 2023 | 2022 | 2021 |
| Other Information* | Other Information* | |
| Cash paid for amounts included in the measurement of lease liabilities | Cash paid for amounts included in the measurement of lease liabilities | |
| Cash paid for amounts included in the measurement of lease liabilities | |
| Cash paid for amounts included in the measurement of lease liabilities | |
| Operating cash flows from operating leases | |
| Operating cash flows from operating leases | |
| Operating cash flows from operating leases | Operating cash flows from operating leases | $ | 148 | | 204 | | 232 | |
| Operating cash flows from finance leases | Operating cash flows from finance leases | 30 | | 6 | | 11 | |
| Financing cash flows from finance leases | Financing cash flows from finance leases | 166 | | 73 | | 255 | |
| | Right-of-use assets obtained in exchange for operating lease liabilities | Right-of-use assets obtained in exchange for operating lease liabilities | $ | 114 | | 174 | | 250 | |
| Right-of-use assets obtained in exchange for operating lease liabilities | |
| Right-of-use assets obtained in exchange for operating lease liabilities | |
| Right-of-use assets obtained in exchange for finance lease liabilities | Right-of-use assets obtained in exchange for finance lease liabilities | 256 | | 447 | | 426 | |
*The amounts presented in the table above have not been adjusted to reflect amounts recovered or reimbursed from oil and gas coventurers. In addition, pursuant to other applicable accounting guidance, lease payments made in connection with preparing another asset for its intended use are reported in the "Cash Flows From Investing Activities" section of our consolidated statement of cash flows.
The following table summarizes future lease payments for operating and finance leases at December 31, 2022:2023:
| | Millions of Dollars |
| Operating Leases | Finance Leases |
| Millions of Dollars | | | Millions of Dollars |
| Operating Leases | | | Operating Leases | Finance Leases |
| Maturity of Lease Liabilities | Maturity of Lease Liabilities | |
| 2023 | $ | 169 | | 356 | |
| 2024 | |
| 2024 | |
| 2024 | 2024 | 126 | | 215 | |
| 2025 | 2025 | 81 | | 210 | |
| 2026 | 2026 | 59 | | 207 | |
| 2027 | 2027 | 46 | | 164 | |
| 2028 | |
| Remaining years | Remaining years | 118 | | 352 | |
| Total* | Total* | 599 | | 1,504 | |
| Less: portion representing imputed interest | Less: portion representing imputed interest | (54) | | (184) | |
| Total lease liabilities | Total lease liabilities | $ | 545 | | $ | 1,320 | |
*Future lease payments for operating and finance leases commencing on or after January 1, 2019, also include payments related to non-lease components in accordance with our election to adopt the optional practical expedient not to separate lease components apart from non-lease components for accounting purposes. In addition, future payments related to operating and finance leases proportionately consolidated by the company have been included in the table on a proportionate basis consistent with our respective ownership interest in the underlying investee company or oil and gas venture.
| | | | | |
| 111 | ConocoPhillips 20222023 10-K | 110 |
| | | | | |
| Notes to Consolidated Financial Statements | |
Note 16—Employee Benefit Plans
Pension and Postretirement Plans
An analysis of the projected benefit obligations for our pension plans and accumulated benefit obligations for our postretirement health and life insurance plans follows:
| | Millions of Dollars |
| Pension Benefits | | Other Benefits |
| 2022 | | 2021 | | 2022 | 2021 |
| U.S. | Int’l. | | U.S. | Int’l. | | |
| Millions of Dollars | | | Millions of Dollars |
| Pension Benefits | | | Pension Benefits | | Other Benefits |
| 2023 | | | 2023 | | 2022 | | 2023 | 2022 |
| U.S. | |
| Change in Benefit Obligation | Change in Benefit Obligation | | | | |
| Change in Benefit Obligation | |
| Change in Benefit Obligation | |
| Benefit obligation at January 1 | |
| Benefit obligation at January 1 | |
| Benefit obligation at January 1 | Benefit obligation at January 1 | $ | 1,924 | | 4,124 | | | 2,548 | | 4,403 | | | 137 | | 170 | |
| Service cost | Service cost | 58 | | 47 | | | 73 | | 61 | | | 1 | | 2 | |
| Interest cost | Interest cost | 62 | | 77 | | | 53 | | 79 | | | 4 | | 4 | |
| Plan participant contributions | Plan participant contributions | — | | — | | | — | | — | | | 16 | | 16 | |
| Plan amendments | Plan amendments | — | | — | | | — | | — | | | 9 | | — | |
| Actuarial (gain) loss | Actuarial (gain) loss | (325) | | (847) | | | (117) | | (176) | | | (27) | | (16) | |
| Benefits paid | Benefits paid | (241) | | (144) | | | (654) | | (162) | | | (38) | | (40) | |
| Divestiture | Divestiture | — | | (56) | | | — | | — | | | — | | — | |
| Curtailment | — | | — | | | 12 | | — | | | — | | 1 | |
| Recognition of termination benefits | — | | — | | | 9 | | — | | | — | | — | |
| | Foreign currency exchange rate change | |
| | Foreign currency exchange rate change | |
| | Foreign currency exchange rate change | Foreign currency exchange rate change | — | | (425) | | | — | | (81) | | | — | | — | |
| Benefit obligation at December 31* | Benefit obligation at December 31* | $ | 1,478 | | 2,776 | | | 1,924 | | 4,124 | | | 102 | | 137 | |
| *Accumulated benefit obligation portion of above at December 31: | *Accumulated benefit obligation portion of above at December 31: | $ | 1,384 | | 2,542 | | | 1,793 | | 3,658 | | |
| | Change in Fair Value of Plan Assets | Change in Fair Value of Plan Assets | |
| | Change in Fair Value of Plan Assets | |
| | Change in Fair Value of Plan Assets | |
| Fair value of plan assets at January 1 | |
| Fair value of plan assets at January 1 | |
| Fair value of plan assets at January 1 | Fair value of plan assets at January 1 | $ | 1,664 | | 4,812 | | | 1,770 | | 4,793 | | | — | | — | |
| Actual return on plan assets | Actual return on plan assets | (319) | | (1,372) | | | 97 | | 147 | | | — | | — | |
| Company contributions | Company contributions | 75 | | 96 | | | 451 | | 119 | | | 22 | | 24 | |
| Plan participant contributions | Plan participant contributions | — | | 1 | | | — | | 1 | | | 16 | | 16 | |
| Benefits paid | Benefits paid | (241) | | (144) | | | (654) | | (162) | | | (38) | | (40) | |
| Divestiture | Divestiture | — | | (46) | | | — | | — | | | — | | — | |
| Foreign currency exchange rate change | Foreign currency exchange rate change | — | | (468) | | | — | | (86) | | | — | | — | |
| Fair value of plan assets at December 31 | Fair value of plan assets at December 31 | $ | 1,179 | | 2,879 | | | 1,664 | | 4,812 | | | — | | — | |
| Funded Status | Funded Status | $ | (299) | | 103 | | | (260) | | 688 | | | (102) | | (137) | |
| | | | | |
111ConocoPhillips 2023 10-K | ConocoPhillips 2022 10-K112 |
| | | | | |
| Notes to Consolidated Financial Statements | |
| | Millions of Dollars |
| Pension Benefits | | Other Benefits |
| 2022 | | 2021 | | 2022 | 2021 |
| U.S. | Int’l. | | U.S. | Int’l. | | |
| Millions of Dollars | | | Millions of Dollars |
| Pension Benefits | | | Pension Benefits | | Other Benefits |
| 2023 | | | 2023 | | 2022 | | 2023 | 2022 |
| U.S. | |
| | Amounts Recognized in the Consolidated Balance Sheet at December 31 | Amounts Recognized in the Consolidated Balance Sheet at December 31 | |
| | Amounts Recognized in the Consolidated Balance Sheet at December 31 | |
| | Amounts Recognized in the Consolidated Balance Sheet at December 31 | |
| Noncurrent assets | |
| Noncurrent assets | |
| Noncurrent assets | Noncurrent assets | $ | — | | 373 | | | 1 | | 991 | | | — | | — | |
| Current liabilities | Current liabilities | (28) | | (10) | | | (29) | | (15) | | | (32) | | (34) | |
| Noncurrent liabilities | Noncurrent liabilities | (271) | | (260) | | | (232) | | (288) | | | (70) | | (103) | |
| Total recognized | Total recognized | $ | (299) | | 103 | | | (260) | | 688 | | | (102) | | (137) | |
| | Weighted-Average Assumptions Used to Determine Benefit Obligations at December 31 | Weighted-Average Assumptions Used to Determine Benefit Obligations at December 31 | |
| Weighted-Average Assumptions Used to Determine Benefit Obligations at December 31 | |
| Weighted-Average Assumptions Used to Determine Benefit Obligations at December 31 | |
| Discount rate | |
| Discount rate | |
| Discount rate | Discount rate | 5.65 | % | 4.20 | | | 2.80 | | 2.15 | | | 5.65 | | 2.65 | |
| Rate of compensation increase | Rate of compensation increase | 5.00 | | 3.65 | | | 4.00 | | 3.40 | | |
| Interest crediting rate for applicable benefits | Interest crediting rate for applicable benefits | 3.55 | | | 2.50 | | |
| Interest crediting rate for applicable benefits | |
| Interest crediting rate for applicable benefits | |
| | Weighted-Average Assumptions Used to Determine Net Periodic Benefit Cost for Years Ended December 31 | |
| | Weighted-Average Assumptions Used to Determine Net Periodic Benefit Cost for Years Ended December 31 | |
| | Weighted-Average Assumptions Used to Determine Net Periodic Benefit Cost for Years Ended December 31 | Weighted-Average Assumptions Used to Determine Net Periodic Benefit Cost for Years Ended December 31 | |
| Discount rate | Discount rate | 3.85 | % | 2.15 | | | 2.60 | | 1.80 | | | 2.65 | | 2.35 | |
| Discount rate | |
| Discount rate | |
| Expected return on plan assets | Expected return on plan assets | 3.90 | | 2.85 | | | 5.20 | | 2.50 | | |
| Rate of compensation increase | Rate of compensation increase | 4.00 | | 3.40 | | | 4.00 | | 3.40 | | |
| Rate of compensation increase | |
| Rate of compensation increase | |
| Interest crediting rate for applicable benefits | Interest crediting rate for applicable benefits | 2.50 | | | 2.10 | | |
| Interest crediting rate for applicable benefits | |
| Interest crediting rate for applicable benefits | |
For both U.S. and international pension plans, the overall expected long-term rate of return is developed from the expected future return of each asset class, weighted by the expected allocation of pension assets to that asset class. We rely on a variety of independent market forecasts in developing the expected rate of return for each class of assets.
During 2023, the actuarial losses related to the benefit obligations for U.S. and international plans were primarily related to a decrease in the discount rates. During 2022 and 2021, the actuarial gains related to the benefit obligations for U.S. and international plans were primarily related to an increase in the discount rates. During 2020, the actuarial losses related to the benefit obligations for U.S. and international plans were primarily related to a decrease in the discount rates.
The following tables summarize information related to the Company's pension plans with projected and accumulated benefit obligations in excess of the fair value of the plans' assets:
| | Millions of Dollars |
| Pension Benefits |
| 2022 | | 2021 |
| U.S. | Int’l. | | U.S. | Int’l. |
| Millions of Dollars | | | Millions of Dollars |
| Pension Benefits | | | Pension Benefits |
| 2023 | | | 2023 | | 2022 |
| U.S. | | | U.S. | Int’l. | | U.S. | Int’l. |
| | Pension Plans with Projected Benefit Obligation in Excess of Plan Assets | Pension Plans with Projected Benefit Obligation in Excess of Plan Assets | |
| Pension Plans with Projected Benefit Obligation in Excess of Plan Assets | |
| Pension Plans with Projected Benefit Obligation in Excess of Plan Assets | |
| Projected benefit obligation | |
| Projected benefit obligation | |
| Projected benefit obligation | Projected benefit obligation | $ | 1,478 | | 277 | | | 261 | | 362 | |
| Fair value of plan assets | Fair value of plan assets | 1,179 | | 6 | | | — | | 58 | |
| | Pension Plans with Accumulated Benefit Obligation in Excess of Plan Assets | Pension Plans with Accumulated Benefit Obligation in Excess of Plan Assets | |
| Pension Plans with Accumulated Benefit Obligation in Excess of Plan Assets | |
| Pension Plans with Accumulated Benefit Obligation in Excess of Plan Assets | |
| Accumulated benefit obligation | |
| Accumulated benefit obligation | |
| Accumulated benefit obligation | Accumulated benefit obligation | $ | 1,384 | | 239 | | | 234 | | 271 | |
| Fair value of plan assets | Fair value of plan assets | 1,179 | | 6 | | | — | | 9 | |
| | | | | |
| 113 | ConocoPhillips 20222023 10-K | 112 |
| | | | | |
| Notes to Consolidated Financial Statements | |
Included in accumulated other comprehensive income (loss) at December 31 were the following before-tax amounts that had not been recognized in net periodic benefit cost:
| | Millions of Dollars | | | Millions of Dollars |
| Pension Benefits | | | Pension Benefits | | Other Benefits |
| 2023 | | | 2023 | | 2022 | | 2023 | 2022 |
| U.S. | |
| | Millions of Dollars |
| Unrecognized net actuarial loss (gain) | |
| | Pension Benefits | | Other Benefits |
| 2022 | | 2021 | | 2022 | 2021 |
| U.S. | Int’l. | | U.S. | Int’l. | | |
| Unrecognized net actuarial loss (gain) | |
| | Unrecognized net actuarial loss (gain) | Unrecognized net actuarial loss (gain) | $ | 172 | | 681 | | | 188 | | 86 | | | (28) | | (1) | |
| Unrecognized prior service cost (credit) | Unrecognized prior service cost (credit) | — | | 1 | | | — | | 1 | | | (98) | | (145) | |
| | Millions of Dollars |
| Pension Benefits | | Other Benefits |
| 2022 | | 2021 | | 2022 | 2021 |
| U.S. | Int’l. | | U.S. | Int’l. | | |
| Millions of Dollars | | | Millions of Dollars |
| Pension Benefits | | | Pension Benefits | | Other Benefits |
| 2023 | | | 2023 | | 2022 | | 2023 | 2022 |
| U.S. | |
| | Sources of Change in Other Comprehensive Income (Loss) | Sources of Change in Other Comprehensive Income (Loss) | |
| | Sources of Change in Other Comprehensive Income (Loss) | |
| | Sources of Change in Other Comprehensive Income (Loss) | |
| Net gain (loss) arising during the period | |
| Net gain (loss) arising during the period | |
| Net gain (loss) arising during the period | Net gain (loss) arising during the period | $ | (44) | | (606) | | | 134 | | 207 | | | 27 | | 16 | |
| Amortization of actuarial loss included in income (loss)* | Amortization of actuarial loss included in income (loss)* | 61 | | 11 | | | 145 | | 33 | | | — | | — | |
| Net change during the period | Net change during the period | $ | 17 | | (595) | | | 279 | | 240 | | | 27 | | 16 | |
| | Prior service credit (cost) arising during the period | Prior service credit (cost) arising during the period | $ | — | | (1) | | | — | | — | | | (9) | | — | |
| Prior service credit (cost) arising during the period | |
| Prior service credit (cost) arising during the period | |
| Amortization of prior service (credit) included in income (loss) | Amortization of prior service (credit) included in income (loss) | — | | (1) | | | — | | (1) | | | (38) | | (37) | |
| Net change during the period | Net change during the period | $ | — | | (2) | | | — | | (1) | | | (47) | | (37) | |
*Includes settlement (gains) losses recognized in 20222023 and 2021.2022.
The components of net periodic benefit cost of all defined benefit plans are presented in the following table:
| | Millions of Dollars |
| Pension Benefits | | Other Benefits |
| 2022 | | 2021 | | 2020 | | 2022 | 2021 | 2020 |
| U.S. | Int’l. | | U.S. | Int’l. | | U.S. | Int’l. | | |
| Millions of Dollars | | | Millions of Dollars |
| Pension Benefits | | | Pension Benefits | | Other Benefits |
| 2023 | | | 2023 | | 2022 | | 2021 | | 2023 | 2022 | 2021 |
| U.S. | |
| | Components of Net Periodic Benefit Cost | Components of Net Periodic Benefit Cost | |
| | Components of Net Periodic Benefit Cost | |
| | Components of Net Periodic Benefit Cost | |
| Service cost | |
| Service cost | |
| Service cost | Service cost | $ | 58 | | 47 | | | 73 | | 61 | | | 85 | | 54 | | | 1 | | 2 | | 2 | |
| Interest cost | Interest cost | 62 | | 77 | | | 53 | | 79 | | | 66 | | 85 | | | 4 | | 4 | | 6 | |
| Expected return on plan assets | Expected return on plan assets | (50) | | (124) | | | (80) | | (120) | | | (85) | | (145) | | | — | | — | | — | |
| Amortization of prior service credit | Amortization of prior service credit | — | | (1) | | | — | | (1) | | | — | | (1) | | | (38) | | (37) | | (31) | |
| Recognized net actuarial loss (gain) | Recognized net actuarial loss (gain) | 24 | | 11 | | | 43 | | 33 | | | 51 | | 22 | | | — | | — | | 1 | |
| Settlements loss (gain) | Settlements loss (gain) | 37 | | — | | | 102 | | — | | | 44 | | (1) | | | — | | — | | — | |
| Curtailment loss | — | | — | | | 12 | | — | | | — | | — | | | — | | — | | — | |
| Curtailment loss (gain) | |
| Net periodic benefit cost | Net periodic benefit cost | $ | 131 | | 10 | | | 203 | | 52 | | | 161 | | 14 | | | (33) | | (31) | | (22) | |
The components of net periodic benefit cost, other than the service cost component, are included in the “Other expenses” line item on our consolidated income statement.
| | | | | |
113ConocoPhillips 2023 10-K | ConocoPhillips 2022 10-K114 |
| | | | | |
| Notes to Consolidated Financial Statements | |
We recognized pension settlement losses of $6 million in 2023, $37 million in 2022, and $102 million in 2021 and $43 million in 2020 as lump-sum benefit payments from certain U.S. and international pension plans exceeded the sum of service and interest costs for those plans and led to recognition of settlement losses.
In determining net pension and other postretirement benefit costs, we amortize prior service costs on a straight-line basis over the average remaining service period of employees expected to receive benefits under the plan. For net actuarial gains and losses, we amortize 10 percent of the unamortized balance each year.
We have multiple non-pension postretirement benefit plans for health and life insurance. The health care plans are contributory and subject to various cost sharing features, most with participant and company contributions adjusted annually; the life insurance plans are noncontributory. The measurement of the U.S. pre-65 retiree medical accumulated postretirement benefit obligation assumes a health care cost trend rate of 6.57 percent in 20232024 that declines to 5 percent by 2029.2031. The measurement of the U.S. post-65 retiree medical accumulated postretirement benefit obligation assumes a health care cost trend rate of 4.5 percent in 20232024 that increases to 5 percent by 2029.2030.
Plan Assets
We follow a policy of broadly diversifying pension plan assets across asset classes and individual holdings. As a result, our plan assets have no significant concentrations of credit risk. Asset classes that are considered appropriate include U.S. equities, non-U.S. equities, U.S. fixed income, non-U.S. fixed income, real estate and private equity investments. Plan fiduciaries may consider and add other asset classes to the investment program from time to time. The target allocations for plan assets, aggregated across U.S. and international plans, are 2524 percent equity securities, 7172 percent debt securities, and 4 percent real estate. Generally, the plan investments are publicly traded, therefore minimizing liquidity risk in the portfolio.
The following is a description of the valuation methodologies used for the pension plan assets. There have been no changes in the methodologies used at December 31, 20222023 and 2021.2022.
•Fair values of equity securities and government debt securities categorized in Level 1 are primarily based on quoted market prices in active markets for identical assets and liabilities.
•Fair values of corporate debt securities, agency and mortgage-backed securities and government debt securities categorized in Level 2 are estimated using recently executed transactions and quoted market prices for similar assets and liabilities in active markets and for identical assets and liabilities in markets that are not active. If there have been no market transactions in a particular fixed income security, its fair value is calculated by pricing models that benchmark the security against other securities with actual market prices. When observable quoted market prices are not available, fair value is based on pricing models that use something other than actual market prices (e.g., observable inputs such as benchmark yields, reported trades and issuer spreads for similar securities), and these securities are categorized in Level 3 of the fair value hierarchy.
•Fair values of investments in common/collective trusts are determined by the issuer of each fund based on the fair value of the underlying assets.
•Fair values of mutual funds are based on quoted market prices, which represent the net asset value of shares held.
•Time deposits are valued at cost, which approximates fair value.
•Cash is valued at cost, which approximates fair value. Fair values of international cash equivalents categorized in Level 2 are valued using observable yield curves, discounting and interest rates. U.S. cash balances held in the form of short-term fund units that are redeemable at the measurement date are categorized as Level 2.
•Fair values of exchange-traded derivatives classified in Level 1 are based on quoted market prices. For other derivatives classified in Level 2, the values are generally calculated from pricing models with market input parameters from third-party sources.
•Fair values of insurance contracts are valued at the present value of the future benefit payments owed by the insurance company to the plans’ participants.
•Fair values of real estate investments are valued using real estate valuation techniques and other methods that include reference to third-party sources and sales comparables where available.
| | | | | |
| 115 | ConocoPhillips 20222023 10-K | 114 |
| | | | | |
| Notes to Consolidated Financial Statements | |
•A portion of U.S. pension plan assets is held as a participating interest in an insurance annuity contract, which is calculated as the market value of investments held under this contract, less the accumulated benefit obligation covered by the contract. The participating interest is classified as Level 3 in the fair value hierarchy as the fair value is determined via a combination of quoted market prices, recently executed transactions, and an actuarial present value computation for contract obligations. At December 31, 2023, the participating interest in the annuity contract was valued at $46 million and consisted of $130 million in debt securities, less $84 million for the accumulated benefit obligation covered by the contract. At December 31, 2022, the participating interest in the annuity contract was valued at $55 million and consisted of $144 million in debt securities, less $89 million for the accumulated benefit obligation covered by the contract. At December 31, 2021, the participating interest in the annuity contract was valued at $83 million and consisted of $206 million in debt securities, less $123 million for the accumulated benefit obligation covered by the contract. The participating interest is not available for meeting general pension benefit obligations in the near term. No future company contributions are required and no new benefits are being accrued under this insurance annuity contract.
The fair values of our pension plan assets at December 31, by asset class were as follows:
| | Millions of Dollars |
| U.S. | | International |
| Level 1 | Level 2 | Level 3 | Total | | Level 1 | Level 2 | Level 3 | Total |
| 2022 | | | |
| Millions of Dollars | | | Millions of Dollars |
| U.S. | | | U.S. | | International |
| Level 1 | | | Level 1 | Level 2 | Level 3 | Total | | Level 1 | Level 2 | Level 3 | Total |
| 2023 | |
| Equity securities | Equity securities | |
| Equity securities | |
| Equity securities | |
| U.S. | |
| U.S. | |
| U.S. | U.S. | $ | 4 | | — | | — | | 4 | | | — | | — | | — | | — | |
| International | International | 36 | | — | | — | | 36 | | | — | | — | | — | | — | |
| Mutual funds | Mutual funds | 14 | | — | | — | | 14 | | | 201 | | 298 | | — | | 499 | |
| Debt securities | Debt securities | |
| Corporate | |
| Corporate | |
| Corporate | Corporate | — | | 1 | | — | | 1 | | | — | | — | | — | | — | |
| Mutual funds | Mutual funds | — | | — | | — | | — | | | 365 | | — | | — | | 365 | |
| Cash and cash equivalents | Cash and cash equivalents | — | | — | | — | | — | | | 36 | | — | | — | | 36 | |
| Real estate | Real estate | — | | — | | — | | — | | | — | | — | | 146 | | 146 | |
| Total in fair value hierarchy | Total in fair value hierarchy | $ | 54 | | 1 | | — | | 55 | | | 602 | | 298 | | 146 | | 1,046 | |
| | Investments measured at net asset value* | Investments measured at net asset value* | |
| Investments measured at net asset value* | |
| Investments measured at net asset value* | |
| Equity securities | |
| Equity securities | |
| Equity securities | Equity securities | |
| Common/collective trusts | Common/collective trusts | | 265 | | | 192 | |
| Common/collective trusts | |
| Common/collective trusts | |
| Debt securities | Debt securities | |
| Common/collective trusts | |
| Common/collective trusts | |
| Common/collective trusts | Common/collective trusts | | 759 | | | 1,637 | |
| Cash and cash equivalents | Cash and cash equivalents | | 10 | | | — | |
| Real estate | Real estate | | 34 | | | — | |
| Total** | Total** | $ | 54 | | 1 | | — | | 1,123 | | | 602 | | 298 | | 146 | | 2,875 | |
*In accordance with FASB ASC Topic 715, “Compensation—Retirement Benefits,” certain investments that are to be measured at fair value using the net asset value per share (or its equivalent) practical expedient have not been classified in the fair value hierarchy. The fair value amounts presented in this table are intended to permit reconciliation of the fair value hierarchy to the amounts presented in the Change in Fair Value of Plan Assets.
**Excludes the participating interest in the insurance annuity contract with a net asset of $46 million and net receivables related to security transactions of $5 million.
| | | | | |
| ConocoPhillips 2023 10-K | 116 |
| | | | | |
| Notes to Consolidated Financial Statements | |
The fair values of our pension plan assets at December 31, by asset class were as follows:
| | | | | | | | | | | | | | | | | | | | | | | | | | | | | |
| Millions of Dollars |
| U.S. | | International |
| Level 1 | Level 2 | Level 3 | Total | | Level 1 | Level 2 | Level 3 | Total |
| 2022 | | | | | | | | | |
| Equity securities | | | | | | | | | |
| U.S. | $ | 4 | | — | | — | | 4 | | | — | | — | | — | | — | |
| International | 36 | | — | | — | | 36 | | | — | | — | | — | | — | |
| Mutual funds | 14 | | — | | — | | 14 | | | 201 | | 298 | | — | | 499 | |
| Debt securities | | | | | | | | | |
| Corporate | — | | 1 | | — | | 1 | | | — | | — | | — | | — | |
| Mutual funds | — | | — | | — | | — | | | 365 | | — | | — | | 365 | |
| Cash and cash equivalents | — | | — | | — | | — | | | 36 | | — | | — | | 36 | |
| Derivatives | | | | | | | | | |
| Real estate | — | | — | | — | | — | | | — | | — | | 146 | | 146 | |
| Total in fair value hierarchy | $ | 54 | | 1 | | — | | 55 | | | 602 | | 298 | | 146 | | 1,046 | |
| | | | | | | | | |
| Investments measured at net asset value* | | | | | | | | | |
| Equity securities | | | | | | | | | |
| Common/collective trusts | | | | 265 | | | | | | 192 | |
| Debt securities | | | | | | | | | |
| Common/collective trusts | | | | 759 | | | | | | 1,637 | |
| Cash and cash equivalents | | | | 10 | | | | | | — | |
| Real estate | | | | 34 | | | | | | — | |
| Total** | $ | 54 | | 1 | | — | | 1,123 | | | 602 | | 298 | | 146 | | 2,875 | |
*In accordance with FASB ASC Topic 715, “Compensation—Retirement Benefits,” certain investments that are to be measured at fair value using the net asset value per share (or its equivalent) practical expedient have not been classified in the fair value hierarchy. The fair value amounts presented in this table are intended to permit reconciliation of the fair value hierarchy to the amounts presented in the Change in Fair Value of Plan Assets.
**Excludes the participating interest in the insurance annuity contract with a net asset of $55 million and net receivables related to security transactions of $5 million.
| | | | | |
115 | ConocoPhillips 2022 10-K |
| | | | | |
Notes to Consolidated Financial Statements | |
The fair values of our pension plan assets at December 31, by asset class were as follows:
| | | | | | | | | | | | | | | | | | | | | | | | | | | | | |
| Millions of Dollars |
| U.S. | | International |
| Level 1 | Level 2 | Level 3 | Total | | Level 1 | Level 2 | Level 3 | Total |
| 2021 | | | | | | | | | |
| Equity securities | | | | | | | | | |
| U.S. | $ | 3 | | — | | 5 | | 8 | | | — | | — | | — | | — | |
| International | 42 | | — | | — | | 42 | | | — | | — | | — | | — | |
| Mutual funds | 17 | | — | | — | | 17 | | | 236 | | 403 | | — | | 639 | |
| Debt securities | | | | | | | | | |
| Corporate | — | | 1 | | — | | 1 | | | — | | — | | — | | — | |
| Mutual funds | — | | — | | — | | — | | | 511 | | — | | — | | 511 | |
| Cash and cash equivalents | — | | — | | — | | — | | | 68 | | — | | — | | 68 | |
| Derivatives | — | | — | | — | | — | | | — | | — | | — | | — | |
| Real estate | — | | — | | — | | — | | | — | | — | | 157 | | 157 | |
| Total in fair value hierarchy | $ | 62 | | 1 | | 5 | | 68 | | | 815 | | 403 | | 157 | | 1,375 | |
| | | | | | | | | |
| Investments measured at net asset value* | | | | | | | | | |
| Equity securities | | | | | | | | | |
| Common/collective trusts | | | | 394 | | | | | | 417 | |
| Debt securities | | | | | | | | | |
| Common/collective trusts | | | | 1,073 | | | | | | 3,015 | |
| Cash and cash equivalents | | | | 9 | | | | | | — | |
| Real estate | | | | 36 | | | | | | 1 | |
| Total** | $ | 62 | | 1 | | 5 | | 1,580 | | | 815 | | 403 | | 157 | | 4,808 | |
*In accordance with FASB ASC Topic 715, “Compensation—Retirement Benefits,” certain investments that are to be measured at fair value using the net asset value per share (or its equivalent) practical expedient have not been classified in the fair value hierarchy. The fair value amounts presented in this table are intended to permit reconciliation of the fair value hierarchy to the amounts presented in the Change in Fair Value of Plan Assets.
**Excludes the participating interest in the insurance annuity contract with a net asset of $83 million and net receivables related to security transactions of $5 million.
Level 3 activity was not material for all periods.
Our funding policy for U.S. plans is to contribute at least the minimum required by the Employee Retirement Income Security Act of 1974 and the Internal Revenue Code of 1986, as amended. Contributions to foreign plans are dependent upon local laws and tax regulations. In 2023,2024, we expect to contribute approximately $90$125 million to our domestic qualified and nonqualified pension and postretirement benefit plans and $45$75 million to our international qualified and nonqualified pension and postretirement benefit plans.
| | | | | |
| 117 | ConocoPhillips 20222023 10-K | 116 |
| | | | | |
| Notes to Consolidated Financial Statements | |
The following benefit payments, which are exclusive of amounts to be paid from the insurance annuity contract and which reflect expected future service, as appropriate, are expected to be paid:
| | Millions of Dollars | | | Millions of Dollars |
| Pension
Benefits | | | Pension
Benefits | | Other
Benefits |
| U.S. | |
| | Millions of Dollars |
| 2024 | |
| | Pension
Benefits | | Other
Benefits |
| 2024 | |
| | U.S. | Int’l. | | |
| | 2023 | $ | 216 | | 121 | | | 17 | |
| 2024 | 2024 | 199 | | 123 | | | 15 | |
| 2025 | 2025 | 188 | | 125 | | | 14 | |
| 2026 | 2026 | 173 | | 126 | | | 12 | |
| 2027 | 2027 | 171 | | 128 | | | 11 | |
| 2028–2032 | 685 | | 677 | | | 38 | |
| 2028 | |
| 2029–2033 | |
The following table summarizes our severance accrual activity:
| | Millions of Dollars | | | Millions of Dollars |
| 2023 | | | 2023 | 2022 | 2021 |
| | Millions of Dollars |
| 2022 | 2021 | 2020 |
| | Balance at January 1 | |
| Balance at January 1 | |
| Balance at January 1 | Balance at January 1 | $ | 78 | | 24 | | 23 | |
| Accruals | Accruals | 1 | | 170 | | 14 | |
| Benefit payments | Benefit payments | (48) | | (116) | | (13) | |
| Balance at December 31 | Balance at December 31 | $ | 31 | | 78 | | 24 | |
Accruals include severance costs associated with our company-wide restructuring program. Of the remaining balance at December 31, 2022, $192023, $3 million is classified as short-term.
Defined Contribution Plans
Most U.S. employees are eligible to participate in the ConocoPhillips Savings Plan (CPSP). Employees can depositcontribute up to 75 percent of their eligible pay, subject to statutory limits, in the CPSP to a choice of 17 investment options. Employees who participate in the CPSP and contribute 1 percent of their eligible pay receive a 6 percent company cash match with a potential company discretionary cash contribution of up to 6 percent. Effective January 1, 2019, new employees, rehires and employees that elected to opt out of Title II of the ConocoPhillips Retirement Plan are eligible to receive a Company Retirement Contribution (CRC) of 6 percent of eligible pay into their CPSP. After three years of service with the company, the employee is 100 percent vested in any CRC. Company contributions charged to expense for the CPSP and predecessor plans were $151 million in 2023, $140 million in 2022 and $93 million in 2021 and $62 million in 2020.2021.
We have several defined contribution plans for our international employees, each with its own terms and eligibility depending on location. Total compensation expense recognized for these international plans was approximately $23 million in 2023, $24 million in 2022 and $26 million in 2021 and $25 million in 2020.2021.
Share-Based Compensation Plans
The 20142023 Omnibus Stock and Performance Incentive Plan of ConocoPhillips (the(Omnibus Plan) was approved by shareholders in May 2014,2023, replacing similar prior plans and providing that no new awards shall be granted under the prior plans. Over its 10-year life, the Omnibus Plan allows the issuance of up to 7936 million shares of our common stock for compensation to our employees and directors; however, as ofdirectors, but the effective date of the Plan,available shares (i) any shares of common stock available for futureare reduced by awards granted under the prior plansplan between the board adoption date (February 15, 2023) and the shareholder approval date (May 16, 2023) and (ii) are increased by any shares of common stock represented by awards granted under the Omnibus Plan or the prior plans that are forfeited, expire or are cancelled without delivery of shares of common stock or which result in the forfeiture of shares of common stock back to the company, shall be available for awards underexcluding shares surrendered in payment of the Plan. Ofexercise of a stock option or stock appreciation right, shares not issued in connection with the 79 millionstock settlement of a stock appreciation right, or shares available for issuance underreacquired by the Plan, no more than 40 million sharescompany using cash proceeds from the exercise of commona stock are available for incentive stock options.option. The Human Resources and Compensation Committee of our Board of Directors is authorized to determine the types, terms, conditions and limitations of awards granted. Awards may be granted in the form of, but not limited to, stock options, restricted stock units and performance share units to employees and non-employee directors who contribute to the company’s continued success and profitability.
| | | | | |
117ConocoPhillips 2023 10-K | ConocoPhillips 2022 10-K118 |
| | | | | |
| Notes to Consolidated Financial Statements | |
Total share-based compensation expense is measured using the grant date fair value for our equity-classified awards and the settlement date fair value for our liability-classified awards. We recognize share-based compensation expense over the shorter of the service period (i.e., the stated period of time required to earn the award); or, for awards that provide for retirement-based vesting, the period beginning at the start of the service period and ending upon the later to occur of the date when an employee first becomes eligible for retirement but not less thanor the date that is six months as this isafter the grant date (generally the minimum period of time required for an award to not be subject to forfeiture. Ourforfeiture). Other than certain retention awards, our share-based compensation programs generally provide accelerated vesting (i.e., a waiver of the remaining period of service required to earn an award) for awards held by employees at the time of their retirement. Some of our share-based awards vest ratably (i.e., portions of the award vest at different times) while some of our awards cliff vest (i.e., all of the award vests at the same time). We recognize expense on a straight-line basis over the service period for the entire award, whether the award was granted with ratable or cliff vesting.
Compensation Expense—Total share-based compensation expense recognized in net income (loss) and the associated tax benefit were:
| | Millions of Dollars |
| 2022 | 2021 | 2020 |
| Millions of Dollars | | | Millions of Dollars |
| 2023 | | | 2023 | 2022 | 2021 |
| | Compensation cost | Compensation cost | $ | 377 | | 304 | | 159 | |
| Compensation cost | |
| Compensation cost | |
| Tax benefit | Tax benefit | 95 | | 76 | | 40 | |
Stock Options—Stock options granted under the provisions of the Omnibus Plan and prior plans permit purchase of our common stock at exercise prices equivalent to the average fair market value of ConocoPhillips common stock on the date the options were granted. The options have terms of 10 years and generally vest ratably, with one-third of the options awarded vesting and becoming exercisable on each anniversary date following the date of grant. Options awarded to certain employees already eligible for retirement vest within six months of the grant date, but those options do not become exercisable until the end of the normal vesting period. Beginning in 2018, stock option grants were discontinued and replaced with three-year, time-vested restricted stock units which generally will bewere cash-settled for 2018 and 2019 awards and will be stock-settled beginning with 2020 awards.
The following summarizes our stock option activity for the year ended December 31, 2022:2023:
| | | | | | Millions of Dollars | | | | | | | Millions of Dollars |
| Options | | | Options | | Weighted-Average
Exercise Price | | Aggregate
Intrinsic Value |
| | Millions of Dollars |
| Options | | Weighted-Average
Exercise Price | | Aggregate
Intrinsic Value |
| | Outstanding at December 31, 2021 | 11,973,783 | | | $ | 56.46 | | | $ | 188 | |
| Outstanding at December 31, 2022 | |
| Outstanding at December 31, 2022 | |
| Outstanding at December 31, 2022 | |
| Exercised | Exercised | (7,670,208) | | | 57.12 | | | (308) | |
| Expired or cancelled | Expired or cancelled | — | | | — | | |
| Outstanding at December 31, 2022 | 4,303,575 | | | $ | 55.28 | | | $ | 266 | |
| Vested at December 31, 2022 | 4,303,575 | | | $ | 55.28 | | | $ | 266 | |
| Exercisable at December 31, 2022 | 4,303,575 | | | $ | 55.28 | | | $ | 266 | |
| Outstanding at December 31, 2023 | |
| Outstanding at December 31, 2023 | |
| Outstanding at December 31, 2023 | |
| Vested at December 31, 2023 | |
| Exercisable at December 31, 2023 | |
The weighted-average remaining contractual term of outstanding options, vested options and exercisable options at December 31, 2022,2023, were all 2.571.98 years. The aggregate intrinsic value of options exercised was $308 million in 2022 and $68 million in 2021 and $23 million in 2020.2021.
During 2022,2023, we received $438$66 million in cash and realized a tax benefit of $59$12 million from the exercise of options. At December 31, 2022,2023, all outstanding stock options were fully vested and there was no remaining compensation cost to be recorded.
Stock Unit ProgramPrograms—Generally, restrictedRestricted stock units (RSU) are granted annually under the provisions of the Omnibus Plan and the general and executive RSU programs vest in an aggregateone installment on the third anniversary of the grant date. In addition, RSUs granted under the Omnibus Plan for a variable long-term incentive retention program vest ratably in three equal annual installments beginning on the first anniversary of the grant date. Restricted stock units are also granted ad hoc to attract or retain key personnel, and the terms and conditions under which these restricted stock units vest vary by award.
| | | | | |
| 119 | ConocoPhillips 20222023 10-K | 118 |
| | | | | |
| Notes to Consolidated Financial Statements | |
Stock-Settled
Upon vesting, these restricted stock units are settled by issuing one share of ConocoPhillips common stock per unit. Units awarded to retirement eligible employees under the general and executive RSU programs vest six months from the grant date; however, those units are not issued assettled through the issuance of common stock until the earlier of separation from the company or the end of the regularly scheduled vesting period. Until issued as stock, most recipients of the RSUs receive a cash payment of a dividend equivalent or an accrued reinvested dividend equivalent that is charged to retained earnings. The grant date fair market value of these RSUs is deemed equal to the average ConocoPhillips stock price on the grant date. The grant date fair market value of unitsRSUs that do not receive a dividend equivalent while unvested is deemed equal to the average ConocoPhillips stock price on the grant date, less the net present value of the estimated dividends that will not be received.
The following summarizes our stock-settled stock unitRSU activity for the year ended December 31, 2022:2023:
| | Stock Units | | | Stock Units | | Weighted-Average
Grant Date Fair Value | | Millions of Dollars |
| | | Total Fair Value | | | | | Total Fair Value |
| | Stock Units | | Weighted-Average
Grant Date Fair Value | | Millions of Dollars |
| Total Fair Value |
| | Outstanding at December 31, 2021 | 7,645,311 | | | $ | 53.81 | | |
| Outstanding at December 31, 2022 | |
| Outstanding at December 31, 2022 | |
| Outstanding at December 31, 2022 | |
| Granted | |
| Granted | |
| Granted | Granted | 2,139,168 | | | 90.57 | | |
| Forfeited | Forfeited | (137,011) | | | 71.38 | | |
| Forfeited | |
| Forfeited | |
| Issued | Issued | (2,069,275) | | | 63.57 | | | $ | 193 | |
| Outstanding at December 31, 2022 | 7,578,193 | | | $ | 61.20 | | |
| Not Vested at December 31, 2022 | 5,264,282 | | | $ | 61.58 | | |
| Issued | |
| Issued | |
| Outstanding at December 31, 2023 | |
| Not Vested at December 31, 2023 | |
| Not Vested at December 31, 2023 | |
| Not Vested at December 31, 2023 | |
At December 31, 2022,2023, the remaining unrecognized compensation cost from the unvested stock-settled unitsRSUs was $135$166 million, which will be recognized over a weighted-average period of 1.671.70 years, the longest period being 2.672.58 years. The weighted-average grant date fair value of stock unit awardsstock-settled RSUs granted during 2022 and 2021 was $90.57 and 2020 was $46.56, and $57.40, respectively. The total fair value of stock unitsstock-settled RSUs issued during 2022 and 2021 and 2020 was $144$193 million and $143$144 million, respectively.
Cash-Settled
Cash settledCash-settled executive restricted stock unitsRSUs granted in 2018 and 2019 replaced the stock option program. These restricted stock units,RSUs, subject to elections to defer, will bewere settled in cash equal to the fair market value of a share of ConocoPhillips common stock per unit on the settlement date and are classified as liabilities on the balance sheet. UnitsExecutive RSUs awarded to retirement eligible employees vest six months from the grant date; however, those units arewere not settled until the earlier of separation from the company or the end of the regularly scheduled vesting period. Compensation expense iswas initially measured using the average fair market value of ConocoPhillips common stock and iswas subsequently adjusted, based on changes in the ConocoPhillips stock price through the end of each subsequent reporting period, through the settlement date. Recipients receivereceived an accrued reinvested dividend equivalent that iswas charged to compensation expense. The accrued reinvested dividend iswas paid at the time of settlement, subject to the terms and conditions of the award. Beginning with executive restricted stock unitsRSUs granted in 2020, awards will be settled in stock.
The following summarizes ourThere was no cash-settled stock unit activity for the year ended December 31, 2022:
| | | | | | | | | | | | | | | | | |
| Stock Units | | Weighted-Average Grant Date Fair Value | | Millions of Dollars |
| | | Total Fair Value |
| | | | | |
| Outstanding at December 31, 2021 | 226,476 | | | $ | 72.18 | | | |
| Granted | 531 | | | 85.37 | | | |
| Forfeited | — | | | — | | | |
| Issued | (227,007) | | | 91.47 | | | $ | 21 | |
| Outstanding at December 31, 2022 | — | | | $ | — | | | |
| | | | | |
At December 31, 2022, there wasand no remaining unrecognized compensation cost to be recorded for the unvested cash-settled units. The weighted-average grant date fair value of stock unit awards granted during 2021 and 2020 were $57.19 and $41.59, respectively.units for the year ended December 31, 2023. The total fair value of stock unitscash-settled executive RSUs issued during 2022 and 2021 were $21 million and 2020 were $20 million, and negligible, respectively.
| | | | | |
119 | ConocoPhillips 2022 10-K |
| | | | | |
Notes to Consolidated Financial Statements | |
Performance Share Program—Under the Omnibus Plan, we also annually grant restricted performance share units (PSUs) to senior management. These PSUs are authorized three years prior to their effective grant date (the performance period). Compensation expense is initially measured using the average fair market value of ConocoPhillips common stock and is subsequently adjusted, based on changes in the ConocoPhillips stock price through the end of each subsequent reporting period, through the grant date for stock-settled awards and the settlement date for cash-settled awards.
| | | | | |
| ConocoPhillips 2023 10-K | 120 |
| | | | | |
| Notes to Consolidated Financial Statements | |
Stock-Settled
Stock-settled PSUs are settled by issuing one share of ConocoPhillips common stock per unit. For performance periods beginning before 2009, PSUs do not vest until the employee becomes eligible for retirement by reaching age 55 with five years of service, and restrictions do not lapse until the employee separates from the company. With respect to awards for performance periods beginning in 2009 through 2012, PSUs do not vest until the earlier of the date the employee becomes eligible for retirement by reaching age 55 with five years of service or five years after the grant date of the award, and restrictions do not lapse until the earlier of the employee’s separation from the company or five years after the grant date (although recipients can elect to defer the lapsing of restrictions until separation). We recognize compensation expense for these awards beginning on the grant date and ending on the date the PSUs are scheduled to vest. SinceBecause these awards are authorized three years prior to the effective grant date, for employees eligible for retirement by or shortly after the grant date, we recognize compensation expense over the period beginning on the date of authorization and ending on the date of grant. Until issued as stock, recipients of the stock-settled PSUs issued prior to 2013 receive a cash payment of a dividend equivalent that is charged to retained earnings. Beginning in 2013, stock-settled PSUs authorized for future grants will vest, absent employee election to defer, upon settlement following the conclusion of the three-year performance period. We recognize compensation expense over the period beginning on the date of authorization and ending on the conclusion of the performance period. Until issued as stock, recipients of these PSUs are settled by issuing one share of ConocoPhillips common stock per unit.receive an accrued reinvested dividend equivalent that is charged to compensation expense.
The following summarizes our stock-settled Performance Share Program activity for the year ended December 31, 2022:2023:
| | | | Weighted-Average
Grant Date Fair Value | | | | | Weighted-Average
Grant Date Fair Value | | Millions of Dollars |
| Stock Units | | | Stock Units | | | Total Fair Value |
| | Weighted-Average
Grant Date Fair Value | | Millions of Dollars |
| Outstanding at December 31, 2022 | |
| Outstanding at December 31, 2022 | |
| Outstanding at December 31, 2022 | |
| Granted | |
| Granted | |
| Granted | |
| Forfeited | |
| Forfeited | |
| Forfeited | |
| Issued | |
| Issued | |
| Issued | |
| Outstanding at December 31, 2023 | |
| | Stock Units | | Weighted-Average
Grant Date Fair Value | | Total Fair Value |
| | Outstanding at December 31, 2021 | 1,448,847 | | | $ | 50.69 | | |
| Granted | 1,754 | | | 91.58 | | |
| Issued | (218,986) | | | 51.04 | | | $ | 21 | |
| Outstanding at December 31, 2022 | 1,231,615 | | | $ | 50.68 | | |
|
At December 31, 2022,2023, there was no remaining unrecognized compensation cost to be recorded on the unvested stock-settled performance shares. There were no stock-settled PSUs granted during 2021; however, theThe weighted-average grant date fair value of stock-settled PSUs granted during 20202022 was $58.61.$91.58; however, there were no stock-settled PSUs granted during 2021. The total fair value of stock-settled PSUs issued during 2022 and 2021 and 2020 were $18$21 million and $13$18 million, respectively.
Cash-Settled
In connection with and immediately following the separation of our Downstream businesses in 2012, grants of new cash-settled PSUs, subject to a shortened performance period, were authorized. Once granted, these PSUs vest, absent employee election to defer, on the earlier of five years after the grant date of the award or the date the employee becomes eligible for retirement. For employees eligible for retirement by or shortly after the grant date, we recognize compensation expense over the period beginning on the date of authorization and ending on the date of grant. Otherwise, we recognize compensation expense beginning on the grant date and ending on the date the PSUs are scheduled to vest. These PSUs are settled in cash equal to the fair market value of a share of ConocoPhillips common stock per unit on the settlement date and thus are classified as liabilities on the balance sheet. Until settlement occurs, recipients of the PSUs receive a cash payment of a dividend equivalent that is charged to compensation expense.
Beginning in 2013, cash-settled PSUs authorized for future grants will vest upon settlement following the conclusion of the three-year performance period. We recognize compensation expense over the period beginning on the date of authorization and ending at the conclusion of the performance period. These PSUs will be settled in cash equal to the fair market value of a share of ConocoPhillips common stock per unit on the settlement date and are classified as liabilities on the balance sheet. For performance periods beginning before 2018, during the performance period, recipients of the PSUs do not receive a cash payment of a dividend equivalent, but after the performance period ends, until settlement in cash occurs, recipients of the PSUs receive a cash payment of a dividend equivalent that is charged to compensation expense. For the performance periodperiods beginning in 2018 or later, recipients of the PSUs receive an accrued reinvested dividend equivalent that is charged to compensation expense. The accrued reinvested dividend is paid at the time of settlement, subject to the terms and conditions of the award.
| | | | | |
| 121 | ConocoPhillips 20222023 10-K | 120 |
| | | | | |
| Notes to Consolidated Financial Statements | |
The following summarizes our cash-settled Performance Share Program activity for the year ended December 31, 2022:2023:
| | | | Weighted-Average
Grant Date Fair Value | | | | | Weighted-Average
Grant Date Fair Value | | Millions of Dollars |
| Stock Units | | | Stock Units | | | Total Fair Value |
| | Weighted-Average
Grant Date Fair Value | | Millions of Dollars |
| Stock Units | | Total Fair Value |
| | Outstanding at December 31, 2021 | 117,679 | | | $ | 72.18 | | |
| Outstanding at December 31, 2022 | |
| Outstanding at December 31, 2022 | |
| Outstanding at December 31, 2022 | |
| Granted | |
| Granted | |
| Granted | Granted | 967,151 | | | 91.58 | | |
| Settled | Settled | (975,007) | | | 89.87 | | | $ | 88 | |
| Outstanding at December 31, 2022 | 109,823 | | | $ | 117.11 | | |
| Settled | |
| Settled | |
| Outstanding at December 31, 2023 | |
At December 31, 2022,2023, all outstanding cash-settled performance awards were fully vested and there was no remaining compensation cost to be recorded. The weighted-average grant date fair value of cash-settled PSUs granted during 2022 and 2021 was $91.58 and 2020 was $46.65, and $58.61, respectively. The total fair value of cash-settled performance share awards settled during 2022 and 2021 and 2020 was $52$88 million and $116$52 million, respectively.
From inception of the Performance Share Program through 2013, approved PSU awards were granted after the conclusion of performance periods. Beginning in February 2014, initial target PSU awards are issued near the beginning of new performance periods. These initial target PSU awards will terminate at the end of the performance periods and will be settled after the performance periods have ended. Also in 2014, initial target PSU awards were issued for open performance periods that began in prior years. For the open performance period beginning in 2012, the initial target PSU awards terminated at the end of the three-year performance period and were replaced with approved PSU awards. For the open performance period beginning in 2013, the initial target PSU awards terminated at the end of the three-year performance period and were settled after the performance period ended. There is no effect on recognition of compensation expense.
Other—In addition to the above active programs, we have outstanding shares of restricted stock and restricted stock units that were either issued as part of our non-employee director compensation program for current and former members of the company’s Board of Directors or as part of an executive compensation program that has been discontinued or acquired as a result of an acquisition. Generally, the recipients of the restricted shares or units receive a dividend or dividend equivalent.
The following summarizes the aggregate activity of these restricted shares and units for the year ended December 31, 2022:2023:
| | | | Weighted-Average
Grant Date Fair Value | | | | | Weighted-Average
Grant Date Fair Value | | Millions of Dollars |
| Stock Units | | | Stock Units | | | Total Fair Value |
| | Weighted-Average
Grant Date Fair Value | | Millions of Dollars |
| Stock Units | | Total Fair Value |
| | Outstanding at December 31, 2021 | 1,616,367 | | | $ | 47.24 | | |
| Outstanding at December 31, 2022 | |
| Outstanding at December 31, 2022 | |
| Outstanding at December 31, 2022 | |
| Granted | |
| Granted | |
| Granted | Granted | 73,450 | | | 96.20 | | |
| Cancelled | Cancelled | (1,030) | | | 24.61 | | |
| Cancelled | |
| Cancelled | |
| Issued | Issued | (449,028) | | | 48.28 | | | $ | 40 | |
| Outstanding at December 31, 2022 | 1,239,759 | | | $ | 49.78 | | |
| Not Vested at December 31, 2022 | 437,994 | | | $ | 45.90 | | |
| Issued | |
| Issued | |
| Outstanding at December 31, 2023 | |
| Not Vested at December 31, 2023 | |
| Not Vested at December 31, 2023 | |
| Not Vested at December 31, 2023 | |
At December 31, 2022,2023, the remaining compensation cost from the unvested restricted stock was $10 million,negligible, which will be recognized over a weighted-average period of 1 year.0.01 years. The weighted-average grant date fair value of awards granted during 2022 and 2021 was $96.20 and 2020 was $46.43, and $51.46, respectively. The total fair value of awards issued during 2022 and 2021 and 2020 was $8$40 million and $6$8 million, respectively.
| | | | | |
121ConocoPhillips 2023 10-K | ConocoPhillips 2022 10-K122 |
| | | | | |
| Notes to Consolidated Financial Statements | |
Note 17—Income Taxes
Components of income tax provision (benefit) were:
| | Millions of Dollars |
| 2022 | | 2021 | | 2020 |
| Millions of Dollars | | | Millions of Dollars |
| 2023 | | | 2023 | | 2022 | | 2021 |
| Income Taxes | Income Taxes | |
| Federal | Federal | |
| Federal | |
| Federal | |
| Current | |
| Current | |
| Current | Current | $ | 1,263 | | | 32 | | | 3 | |
| Deferred | Deferred | 1,629 | | | 1,161 | | | (625) | |
| Foreign | Foreign | |
| Current | Current | 5,813 | | | 3,128 | | | 350 | |
| Current | |
| Current | |
| Deferred | Deferred | 387 | | | 66 | | | (70) | |
| State and local | State and local | |
| Current | Current | 386 | | | 127 | | | (4) | |
| Current | |
| Current | |
| Deferred | Deferred | 70 | | | 119 | | | (139) | |
| Total tax provision (benefit) | Total tax provision (benefit) | $ | 9,548 | | | 4,633 | | | (485) | |
Deferred income taxes reflect the net tax effect of temporary differences between the carrying amounts of assets and liabilities for financial reporting purposes and the amounts used for tax purposes. Major components of deferred tax liabilities and assets at December 31 were:
| | Millions of Dollars |
| 2022 | 2021 |
| Millions of Dollars | | | Millions of Dollars |
| 2023 | | | 2023 | 2022 |
| Deferred Tax Liabilities | Deferred Tax Liabilities | |
| PP&E and intangibles | |
| PP&E and intangibles | |
| PP&E and intangibles | PP&E and intangibles | $ | 11,100 | | 10,170 | |
| Inventory | Inventory | 48 | | 44 | |
| Other | Other | 190 | | 213 | |
| Total deferred tax liabilities | Total deferred tax liabilities | 11,338 | | 10,427 | |
| | Deferred Tax Assets | Deferred Tax Assets | |
| Deferred Tax Assets | |
| Deferred Tax Assets | |
| Benefit plan accruals | |
| Benefit plan accruals | |
| Benefit plan accruals | Benefit plan accruals | 450 | | 321 | |
| Asset retirement obligations and accrued environmental costs | Asset retirement obligations and accrued environmental costs | 2,333 | | 2,297 | |
| Investments in joint ventures | Investments in joint ventures | 1,917 | | 1,684 | |
| Other financial accruals and deferrals | Other financial accruals and deferrals | 736 | | 827 | |
| Loss and credit carryforwards | Loss and credit carryforwards | 6,354 | | 7,402 | |
| Other | Other | 112 | | 399 | |
| Total deferred tax assets | Total deferred tax assets | 11,902 | | 12,930 | |
| Less: valuation allowance | Less: valuation allowance | (8,049) | | (8,342) | |
| Total deferred tax assets net of valuation allowance | Total deferred tax assets net of valuation allowance | 3,853 | | 4,588 | |
| Net deferred tax liabilities | Net deferred tax liabilities | $ | 7,485 | | 5,839 | |
At December 31, 2023, noncurrent assets and liabilities included deferred taxes of $255 million and $8,813 million, respectively. At December 31, 2022, noncurrent assets and liabilities included deferred taxes of $241 million and $7,726 million, respectively. At December 31, 2021, noncurrent assets and liabilities included deferred taxes of $340 million and $6,179 million, respectively.
At December 31, 2022,2023, the loss and credit carryforward deferred tax assets were primarily related to U.S. foreign tax credit carryforwards of $5.3$4.7 billion and various jurisdictions net operating loss and credit carryforwards of $1.1$0.9 billion. If not utilized, U.S. foreign tax credits and net operating losses will begin to expire in 2023.2024.
| | | | | |
| 123 | ConocoPhillips 20222023 10-K | 122 |
| | | | | |
| Notes to Consolidated Financial Statements | |
The following table shows a reconciliation of the beginning and ending deferred tax asset valuation allowance for 2023, 2022 2021 and 2020:2021:
| | Millions of Dollars | | | Millions of Dollars |
| 2023 | | | 2023 | 2022 | 2021 |
| | Millions of Dollars |
| 2022 | 2021 | 2020 |
| | Balance at January 1 | |
| Balance at January 1 | |
| Balance at January 1 | Balance at January 1 | $ | 8,342 | | 9,965 | | 10,214 | |
| Charged to expense (benefit) | Charged to expense (benefit) | 5 | | (45) | | 460 | |
| Other* | Other* | (298) | | (1,578) | | (709) | |
| Balance at December 31 | Balance at December 31 | $ | 8,049 | | 8,342 | | 9,965 | |
*Represents changes due to originating deferred tax assets that have no impact to our effective tax rate, acquisitions/dispositions/revisions and the effect of translating foreign financial statements.
Valuation allowances have been established to reduce deferred tax assets to an amount that will, more likely than not, be realized. At December 31, 2022,2023, we have maintained a valuation allowance with respect to substantially all U.S. foreign tax credit carryforwards, basis differences in our APLNG investment, and certain net operating loss carryforwards for various jurisdictions. During 2022, the valuation allowance movement charged to earnings primarily relates to the impact of 2022 changes to Norway’s Petroleum Tax System which is partly offset by the U.S. tax impact of the disposition of our CVE common shares. Other movements are primarily related to valuation allowances on expiring tax attributes. Based on our historical taxable income, expectations for the future, and available tax-planning strategies, management expects deferred tax assets, net of valuation allowances, will primarily be realized as offsets to reversing deferred tax liabilities.
During the second quarter of 2022, Norway enacted changes to the Petroleum Tax System. As a result of the enactment, a valuation allowance of $58 million was recorded during the second quarter to reflect changes to our ability to realize certain deferred tax assets under the new law.
During 2021, the valuation allowance movement charged to earnings primarily relates to the fair value measurement of our CVE common shares that are not expected to be realized, and the expected realization of certain U.S. tax attributes associated with our planned disposition of our Indonesia assets. This is partially offset by Australian tax benefits associated with our impairment of APLNG that we do not expect to be realized. Other movements are primarily related to valuation allowances on expiring tax attributes. For more information on our Indonesia disposition see Note 3. During 2020, the valuation allowance movement charged to earnings primarily related to capital losses in Australia and to the fair value measurement of our CVE common shares that are not expected to be realized. Other movements are primarily related to valuation allowances on expiring tax attributes.
At December 31, 2022,2023, unremitted income considered to be permanently reinvested in certain foreign subsidiaries and foreign corporate joint ventures totaled approximately $4,477$4,975 million. Deferred income taxes have not been provided on this amount, as we do not plan to initiate any action that would require the payment of income taxes. The estimated amount of additional tax, primarily local withholding tax, that would be payable on this income if distributed is approximately $224$249 million.
The following table shows a reconciliation of the beginning and ending unrecognized tax benefits for 2023, 2022 and 2021:
| | | | | | | | | | | |
| Millions of Dollars |
| 2023 | 2022 | 2021 |
| | | |
| Balance at January 1 | $ | 710 | | 1,345 | | 1,206 | |
| Additions based on tax positions related to the current year | 5 | | 6 | | 15 | |
| Additions for tax positions of prior years | 1 | | 6 | | 177 | |
| Reductions for tax positions of prior years | (9) | | (62) | | (5) | |
| Settlements | (96) | | (510) | | — | |
| Lapse of statute | (224) | | (75) | | (48) | |
| Balance at December 31 | $ | 387 | | 710 | | 1,345 | |
| | | |
| | | |
| | | |
| | | |
| | | |
| | | |
| | | |
| | | |
| | | |
Included in the balance of unrecognized tax benefits for 2023, 2022 and 2021 were $378 million, $701 million and $1,261 million, respectively, which, if recognized, would impact our effective tax rate.
| | | | | |
123ConocoPhillips 2023 10-K | ConocoPhillips 2022 10-K124 |
| | | | | |
| Notes to Consolidated Financial Statements | |
The following table shows a reconciliationbalance of the beginning and ending unrecognized tax benefits for 2022, 2021 and 2020:
| | | | | | | | | | | |
| Millions of Dollars |
| 2022 | 2021 | 2020 |
| | | |
| Balance at January 1 | $ | 1,345 | | 1,206 | | 1,177 | |
| Additions based on tax positions related to the current year | 6 | | 15 | | 6 | |
| Additions for tax positions of prior years | 6 | | 177 | | 67 | |
| Reductions for tax positions of prior years | (62) | | (5) | | (34) | |
| Settlements | (510) | | — | | (9) | |
| Lapse of statute | (75) | | (48) | | (1) | |
| Balance at December 31 | $ | 710 | | 1,345 | | 1,206 | |
| | | |
| | | |
| | | |
| | | |
| | | |
| | | |
| | | |
| | | |
| | | |
Included in the balance of unrecognized tax benefits for 2022, 2021 and 2020 were $701 million, $1,261 million and $1,128 million respectively, which, if recognized, would impact our effective tax rate.
The balance of the unrecognized tax benefits decreased in 2022 due to the closing of the 2017 audit of our federal income tax return. As a result, we recognized federal and state tax benefits totaling $515 million relating to the recovery of outside tax basis previously offset by a full reserve. The balance of the unrecognized tax benefits increased in 2021 mainly due to U.S. tax credits acquired through our Concho acquisition. See Note 3 and NoteNote 11. At December 31, 2023, 2022 2021 and 2020,2021, accrued liabilities for interest and penalties totaled $45 million, $35 million $47 million and $46$47 million, respectively, net of accrued income taxes. Interest and penalties resulted in a reduction to earnings of $10 million in 2023, an increase to earnings of $12 million in 2022 a reduction of $1 million in 2021 and a reduction to earnings of $4$1 million in 2020.2021.
We file tax returns in the U.S. federal jurisdiction and in many foreign and state jurisdictions. Audits in major jurisdictions are generally complete as follows: Canada (2016), Norway (2021)(2022) and U.S. (2018)(2019). Issues in dispute for audited years and audits for subsequent years are ongoing and in various stages of completion in the many jurisdictions in which we operate around the world. Consequently, the balance in unrecognized tax benefits can be expected to fluctuate from period to period. Within the next twelve months, we may have audit periods close that could significantly impact our total unrecognized tax benefits. It is reasonably possible such changes could be significant when compared with our total unrecognized tax benefits, but the amount of change is not estimable.
The amounts of U.S. and foreign income (loss) before income taxes, with a reconciliation of tax at the federal statutory rate to the provision for income taxes, were:
| | Millions of Dollars | | | Millions of Dollars | | Percent of Pre-Tax Income (Loss) |
| 2023 | | | 2023 | 2022 | 2021 | | 2023 | 2022 | 2021 |
| Income (loss) before income taxes | |
| United States | |
| United States | |
| United States | |
| Foreign | |
| $ | |
| | Federal statutory income tax | |
| Federal statutory income tax | |
| Federal statutory income tax | |
| Non-U.S. effective tax rates | |
| | | Millions of Dollars | | Percent of Pre-Tax Income (Loss) |
| | 2022 | 2021 | 2020 | | 2022 | 2021 | 2020 |
| Income (loss) before income taxes | | | |
| United States | $ | 16,739 | | 8,024 | | (3,587) | | | 59.3 | % | 63.1 | | 114.2 | |
| Foreign | 11,489 | | 4,688 | | 447 | | | 40.7 | | 36.9 | | (14.2) | |
| Recovery of outside basis | |
| | $ | 28,228 | | 12,712 | | (3,140) | | | 100.0 | % | 100.0 | | 100.0 | |
| | Federal statutory income tax | $ | 5,928 | | 2,670 | | (659) | | | 21.0 | % | 21.0 | | 21.0 | |
| Non-U.S. effective tax rates | 3,866 | | 1,915 | | 194 | | | 13.7 | | 15.1 | | (6.2) | |
| Recovery of outside basis | |
| | Australia disposition | — | | — | | (349) | | | — | | — | | 11.1 | |
| | Recovery of outside basis | Recovery of outside basis | (30) | | (55) | | (22) | | | (0.1) | | (0.4) | | 0.7 | |
| Adjustment to tax reserves | Adjustment to tax reserves | (551) | | (11) | | 18 | | | (2.0) | | (0.1) | | (0.6) | |
| Adjustment to valuation allowance | Adjustment to valuation allowance | 5 | | (45) | | 460 | | | — | | (0.4) | | (14.6) | |
| State income tax | State income tax | 405 | | 194 | | (112) | | | 1.4 | | 1.5 | | 3.6 | |
| | Enhanced oil recovery credit | Enhanced oil recovery credit | (37) | | (99) | | (6) | | | (0.1) | | (0.8) | | 0.2 | |
| Enhanced oil recovery credit | |
| Enhanced oil recovery credit | |
| Other | Other | (38) | | 64 | | (9) | | | (0.1) | | 0.5 | | 0.3 | |
| Total | Total | $ | 9,548 | | 4,633 | | (485) | | | 33.8 | % | 36.4 | | 15.5 | |
| | | | | |
ConocoPhillips 2022 10-K | 124 |
Our effective tax rate for 2023 was driven by our jurisdictional tax rates for this profit mix with a favorable impact from routine tax credits. The adjustment to tax reserves primarily relates to the lapsing of the statute of limitations on certain of our foreign subsidiaries and the closing of the 2018 Canadian domestic audit. | | | | | |
Notes to Consolidated Financial Statements
| |
Our effective tax rate for 2022 was driven by our jurisdictional tax rates for this profit mix with net favorable impacts from routine tax credits and valuation allowance adjustments. The adjustment to tax reserves primarily relates to the closing of the audit of our 2017 U.S. federal tax return and the recognition of the U.S. federal and state tax benefits described above.
Our effective tax rate for 2021 was driven by our jurisdictional tax rates for this profit mix with net favorable impacts from routine tax credits and valuation allowance adjustments. The valuation allowance adjustment is primarily related to the fair value measurement and disposition of our CVE common shares of $218 million and the ability to utilize the U.S. foreign tax credit and capital loss carryforward due to our anticipated disposition of our Indonesia entities of $29 million. This was partially offset by an increase to our valuation allowance related to the tax impact of the impairment of our APLNG investment of $206 million for which we do not expect to receive a tax benefit.
Our effective tax rate for 2020 was impacted by the disposition of our Australia-West assets as well as the valuation allowance related to the fair value measurement of our CVE common shares. The Australia-West disposition generated a before-tax gain of $587 million with an associated tax benefit of $10 million and resulted in the de-recognition of deferred tax assets resulting in $92 million of tax expense. The disposition also generated an Australia capital loss tax benefit of $313 million which has been fully offset by a valuation allowance. Due to changes in the fair market value of CVE common shares, the valuation allowance was increased by $178 million to offset the expected capital loss.
| | | | | |
| 125 | ConocoPhillips 2023 10-K |
| | | | | |
| Notes to Consolidated Financial Statements | |
On August 16, 2022, the U.S. enacted the Inflation Reduction Act of 2022, which among other things, implements a 15 percent minimum tax on book income of certain large corporations, a 1 percent excise tax on net stock repurchases and several tax incentives to promote lower carbon energy. WeBased upon our current analysis, these law changes are continuingnot expected to evaluate the impacts of this legislation as additional guidance is released; however, we do not believe any impacts will behave a material impact to our consolidated financial statements.
Note 18—Accumulated Other Comprehensive LossIncome (Loss)
Accumulated other comprehensive lossincome (loss) in the equity section of the balance sheet included:
| | Millions of Dollars | | | Millions of Dollars |
| Defined
Benefit Plans | | | Defined
Benefit Plans | Net Unrealized
Holding Gain/(Loss)
on Securities | Foreign
Currency
Translation | Unrealized Gain/(Loss) on Hedging Activities | Accumulated
Other
Comprehensive
Income/(Loss) |
| | Millions of Dollars |
| Defined
Benefit Plans | Net
Unrealized
Gain/(Loss)
on Securities | Foreign
Currency
Translation | Accumulated
Other
Comprehensive
Loss |
| | December 31, 2019 | $ | (350) | | — | | (5,007) | | (5,357) | |
| Other comprehensive income (loss) | (75) | | 2 | | 212 | | 139 | |
| December 31, 2020 | |
| December 31, 2020 | |
| December 31, 2020 | December 31, 2020 | (425) | | 2 | | (4,795) | | (5,218) | |
| Other comprehensive income (loss) | Other comprehensive income (loss) | 394 | | (2) | | (124) | | 268 | |
| December 31, 2021 | December 31, 2021 | (31) | | — | | (4,919) | | (4,950) | |
| Other comprehensive income (loss) | Other comprehensive income (loss) | (417) | | (11) | | (622) | | (1,050) | |
| December 31, 2022 | December 31, 2022 | $ | (448) | | (11) | | (5,541) | | (6,000) | |
| Other comprehensive income (loss) | |
| December 31, 2023 | |
The following table summarizes reclassifications out of accumulated other comprehensive lossincome (loss) during the years ended December 31:
| | | | | | | | |
| Millions of Dollars |
| 2022 | 2021 |
| | |
| Defined Benefit Plans | $ | 26 | | 109 | |
| Above amounts are included in the computation of net periodic benefit cost and are presented net of tax expense of: | $ | 7 | | 31 | |
| | |
| | | | | | | | |
| Millions of Dollars |
| 2023 | 2022 |
| | |
| Defined Benefit Plans* | $ | 33 | | 26 | |
| *Included in the computation of net periodic benefit cost and are presented net of tax expense of: | $ | 11 | | 7 | |
| | |
| | | | | |
125ConocoPhillips 2023 10-K | ConocoPhillips 2022 10-K126 |
| | | | | |
| Notes to Consolidated Financial Statements | |
Note 19—Cash Flow Information
| | Millions of Dollars |
| 2022 | 2021 | 2020 |
| Noncash Investing Activities | |
| Millions of Dollars | | | Millions of Dollars |
| 2023 | | | 2023 | 2022 | 2021 |
| Noncash Investing and Financing Activities | |
| Increase (decrease) in PP&E related to an increase (decrease) in asset retirement obligations | Increase (decrease) in PP&E related to an increase (decrease) in asset retirement obligations | $ | 825 | | 442 | | (116) | |
| Increase (decrease) in PP&E related to an increase (decrease) in asset retirement obligations | |
| Increase (decrease) in PP&E related to an increase (decrease) in asset retirement obligations | |
| Fair value of contingent consideration on acquisition | | Fair value of contingent consideration on acquisition | 320 | | |
| | Cash Payments | Cash Payments | |
| Cash Payments | |
| Cash Payments | |
| Interest | |
| Interest | |
| Interest | Interest | $ | 873 | | 924 | | 785 | |
| Income taxes | Income taxes | 7,368 | | 856 | | 905 | |
| | Net Sales (Purchases) of Investments | Net Sales (Purchases) of Investments | |
| Net Sales (Purchases) of Investments | |
| Net Sales (Purchases) of Investments | |
| Short-term investments purchased | |
| Short-term investments purchased | |
| Short-term investments purchased | Short-term investments purchased | $ | (5,046) | | (5,554) | | (12,435) | |
| Short-term investments sold | Short-term investments sold | 3,102 | | 8,810 | | 12,015 | |
| Investments and long-term receivables purchased | Investments and long-term receivables purchased | (775) | | (279) | | (325) | |
| Investments and long-term receivables sold | Investments and long-term receivables sold | 90 | | 114 | | 87 | |
| $ | (2,629) | | 3,091 | | (658) | |
| $ | |
Income tax payments have increased in 2022 as the company is returningreturned to a tax paying position in the U.S. as well as, increased taxes in Norway, and timing of tax payments in Libya.
See Note 3 and Note 12 forFor additional information on cash and non-cash changes to our consolidated balance sheet, associated with oursee Note 3 and Note 13 for the Surmont acquisition and see Note 3 and Note 12 for the Concho acquisition.
| | | | | |
| 127 | ConocoPhillips 20222023 10-K | 126 |
| | | | | |
| Notes to Consolidated Financial Statements | |
Note 20—Other Financial Information
| | Millions of Dollars |
| 2022 | 2021 | 2020 |
| Millions of Dollars | | | Millions of Dollars |
| 2023 | | | 2023 | 2022 | 2021 |
| Interest and Debt Expense | Interest and Debt Expense | |
| Incurred | Incurred | |
| Incurred | |
| Incurred | |
| Debt | |
| Debt | |
| Debt | Debt | $ | 791 | | 887 | | 788 | |
| Other | Other | 72 | | 59 | | 73 | |
| 863 | | 946 | | 861 | |
| 933 | |
| Capitalized | Capitalized | (58) | | (62) | | (55) | |
| Expensed | Expensed | $ | 805 | | 884 | | 806 | |
| | Other Income (Loss) | |
| Other Income | |
| Other Income | |
| Other Income | |
| Interest income | |
| Interest income | |
| Interest income | Interest income | $ | 195 | | 33 | | 100 | |
| Gain (loss) on investment in Cenovus Energy* | Gain (loss) on investment in Cenovus Energy* | 251 | | 1,040 | | (855) | |
| Other, net | Other, net | 58 | | 130 | | 246 | |
| $ | 504 | | 1,203 | | (509) | |
| $ | |
| | |
| Research and Development Expenditures—expensed | Research and Development Expenditures—expensed | $ | 71 | | 62 | | 75 | |
| Research and Development Expenditures—expensed | |
| Research and Development Expenditures—expensed | |
| | Shipping and Handling Costs | |
| Shipping and Handling Costs | |
| Shipping and Handling Costs | Shipping and Handling Costs | $ | 1,595 | | 1,047 | | 857 | |
| Foreign Currency Transaction (Gains) Losses—after-tax | Foreign Currency Transaction (Gains) Losses—after-tax | |
Foreign Currency Transaction (Gains) Losses—after-tax | |
Foreign Currency Transaction (Gains) Losses—after-tax | |
| Alaska | |
| Alaska | |
| Alaska | Alaska | $ | — | | — | | — | |
| Lower 48 | Lower 48 | — | | — | | — | |
| Canada | Canada | (20) | | (1) | | (7) | |
| Europe, Middle East and North Africa | Europe, Middle East and North Africa | (110) | | (11) | | (15) | |
| Asia Pacific | Asia Pacific | 30 | | 2 | | (11) | |
| Other International | Other International | (1) | | 1 | | 2 | |
| Corporate and Other | Corporate and Other | 21 | | (7) | | (31) | |
| $ | (80) | | (16) | | (62) | |
| $ | |
| | | | | | | | | | | |
| Millions of Dollars | |
| 2022 | 2021 | |
| Properties, Plants and Equipment | | | |
| Proved properties | $ | 119,609 | | 114,274 | | * |
| Unproved properties | 7,325 | | 10,993 | | |
| Other | 4,562 | | 4,379 | | |
| Gross properties, plants and equipment | 131,496 | | 129,646 | | |
| Less: Accumulated depreciation, depletion and amortization | (66,630) | | (64,735) | | * |
| Net properties, plants and equipment | $ | 64,866 | | 64,911 | | |
*Excludes assets classified as held for sale at December 31, 2021. See Note 3. | | | | | | | | | |
| Millions of Dollars | |
| 2023 | 2022 | |
| Properties, Plants and Equipment | | | |
| Proved properties | $ | 134,394 | | 119,609 | | |
| Unproved properties | 5,206 | | 7,325 | | |
| Other | 4,805 | | 4,562 | | |
| Gross properties, plants and equipment | 144,405 | | 131,496 | | |
| Less: Accumulated depreciation, depletion and amortization | (74,361) | | (66,630) | | |
| Net properties, plants and equipment | $ | 70,044 | | 64,866 | | |
| | | | | |
127ConocoPhillips 2023 10-K | ConocoPhillips 2022 10-K128 |
| | | | | |
| Notes to Consolidated Financial Statements | |
Note 21—Related Party Transactions
Our related parties primarily include equity method investments and certain trusts for the benefit of employees. For disclosures on trusts for the benefit of employees, see Note 16. Significant transactions with our equity affiliates were:
| | Millions of Dollars | | | Millions of Dollars |
| 2023 | | | 2023 | 2022 | 2021 |
| | Millions of Dollars |
| 2022 | 2021 | 2020 |
| | Operating revenues and other income | |
| Operating revenues and other income | |
| Operating revenues and other income | Operating revenues and other income | $ | 88 | | 88 | | 79 | |
| Purchases | Purchases | 1 | | 5 | | — | |
| Operating expenses and selling, general and administrative expenses | Operating expenses and selling, general and administrative expenses | 189 | | 196 | | 63 | |
| Net interest income* | (1) | | (2) | | (5) | |
| Net interest (income)/loss* | |
*We paid interest to, or received interest from, various affiliates. See Note 4, for additional information on loans to affiliated companies. Note 22—Sales and Other Operating Revenues
Revenue from Contracts with Customers
The following table provides further disaggregation of our consolidated sales and other operating revenues:
| | Millions of Dollars | | | Millions of Dollars |
| 2023 | | | 2023 | 2022 | 2021 |
| | Millions of Dollars |
| 2022 | 2021 | 2020 |
| | Revenue from contracts with customers | |
| Revenue from contracts with customers | |
| Revenue from contracts with customers | Revenue from contracts with customers | $ | 61,049 | | 34,590 | | 13,662 | |
| Revenue from contracts outside the scope of ASC Topic 606 | Revenue from contracts outside the scope of ASC Topic 606 | |
| Physical contracts meeting the definition of a derivative | Physical contracts meeting the definition of a derivative | 17,150 | | 11,500 | | 5,177 | |
| Physical contracts meeting the definition of a derivative | |
| Physical contracts meeting the definition of a derivative | |
| Financial derivative contracts | Financial derivative contracts | 295 | | (262) | | (55) | |
| Consolidated sales and other operating revenues | Consolidated sales and other operating revenues | $ | 78,494 | | 45,828 | | 18,784 | |
Revenues from contracts outside the scope of ASC Topic 606 relate primarily to physical gas contracts at market prices, which qualify as derivatives accounted for under ASC Topic 815, “Derivatives and Hedging,” and for which we have not elected NPNS. There is no significant difference in contractual terms or the policy for recognition of revenue from these contracts and those within the scope of ASC Topic 606. The following disaggregation of revenues is provided in conjunction with Note 24—Segment Disclosures and Related Information: | | Millions of Dollars |
| 2022 | 2021 | 2020 |
Revenue from Outside the Scope of ASC Topic 606 by Segment | |
| Millions of Dollars | | | Millions of Dollars |
| 2023 | | | 2023 | 2022 | 2021 |
Revenue from Contracts Outside the Scope of ASC Topic 606 by Segment | |
| Lower 48 | |
| Lower 48 | |
| Lower 48 | Lower 48 | $ | 13,919 | | 9,050 | | 3,966 | |
| Canada | Canada | 2,717 | | 1,457 | | 727 | |
| Europe, Middle East and North Africa | Europe, Middle East and North Africa | 514 | | 993 | | 484 | |
| Physical contracts meeting the definition of a derivative | Physical contracts meeting the definition of a derivative | $ | 17,150 | | 11,500 | | 5,177 | |
| | Millions of Dollars | | | Millions of Dollars |
| 2023 | | | 2023 | 2022 | 2021 |
Revenue from Contracts Outside the Scope of ASC Topic 606 by Product | |
| | Millions of Dollars |
| Crude oil | |
| | 2022 | 2021 | 2020 |
Revenue from Outside the Scope of ASC Topic 606 by Product | |
| Crude oil | |
| | Crude oil | Crude oil | $ | 495 | | 757 | | 395 | |
| Natural gas | Natural gas | 15,368 | | 10,034 | | 4,339 | |
| Other | Other | 1,287 | | 709 | | 443 | |
| Physical contracts meeting the definition of a derivative | Physical contracts meeting the definition of a derivative | $ | 17,150 | | 11,500 | | 5,177 | |
| | | | | |
| 129 | ConocoPhillips 20222023 10-K | 128 |
| | | | | |
| Notes to Consolidated Financial Statements | |
Practical Expedients
Typically, our commodity sales contracts are less than 12 months in duration; however, in certain specific cases may extend longer, which may be out to the end of field life. We have long-term commodity sales contracts which use prevailing market prices at the time of delivery, and under these contracts, the market-based variable consideration for each performance obligation (i.e., delivery of commodity) is allocated to each wholly unsatisfied performance obligation within the contract. Accordingly, we have applied the practical expedient allowed in ASC Topic 606 and do not disclose the aggregate amount of the transaction price allocated to performance obligations or when we expect to recognize revenues that are unsatisfied (or partially unsatisfied) as of the end of the reporting period.
Receivables and Contract Liabilities
Receivables from Contracts with Customers
At December 31, 2022,2023, the “Accounts and notes receivable” line on our consolidated balance sheet included trade receivables of $5,241$4,414 million compared with $5,268$5,241 million at December 31, 2021,2022, and included both contracts with customers within the scope of ASC Topic 606 and those that are outside the scope of ASC Topic 606. We typically receive payment within 30 days or less (depending on the terms of the invoice) once delivery is made. Revenues that are outside the scope of ASC Topic 606 relate primarily to physical gas sales contracts at market prices for which we do not elect NPNS and are therefore accounted for as a derivative under ASC Topic 815. There is little distinction in the nature of the customer or credit quality of trade receivables associated with gas sold under contracts for which NPNS has not been elected compared with trade receivables where NPNS has been elected.
Contract Liabilities from Contracts with Customers
We have entered into certain agreements under which we license our proprietary technology, including the Optimized Cascade® process technology, to customers to maximize the efficiency of LNG plants. These agreements typically provide for milestone payments to be made during and after the construction phases of the LNG plant. The payments are not directly related to our performance obligations under the contract and are recorded as deferred revenue to be recognized when the customer is able to benefit from their right to use the applicable licensed technology. DuringRevenue recognized during the year ended December 31, 2022, we recognized revenue of $57 million in the "Sales and other operating revenues" line on our consolidated income statement.2023 was immaterial. We expect to recognize the outstanding contract liabilities of $19$26 million as of December 31, 2022,2023, as revenue during 2026.the years 2026, 2028 and 2029.
| | | | | |
129 | ConocoPhillips 2022 10-K |
| | | | | |
Notes to Consolidated Financial Statements | |
Note 23—Earnings Per Share
The following table presents the calculation of net income (loss) available to common shareholders and basic and diluted EPS for the years ended December 31, 2023, 2022, 2021, and 2020.2021. For each of the periods with net income presented in the table below, diluted EPS calculated under the two-class method was more dilutive.
| | Millions of Dollars (except per share amounts) |
| Millions of Dollars (except per share amounts) | | | Millions of Dollars (except per share amounts) |
| Years Ended December 31 | Years Ended December 31 | 2022 | 2021 | 2020 | Years Ended December 31 | 2023 | 2022 | 2021 |
| | Basic earnings per share | Basic earnings per share | |
| Basic earnings per share | |
| Basic earnings per share | |
| | Net Income (Loss) Attributable to ConocoPhillips | $ | 18,680 | | 8,079 | | (2,701) | |
| Net Income (Loss) | |
| | Net Income (Loss) | |
| | Net Income (Loss) | |
| Less: Dividends and undistributed earnings | Less: Dividends and undistributed earnings | |
| allocated to participating securities | |
| allocated to participating securities | |
| allocated to participating securities | allocated to participating securities | 60 | | 19 | | 6 | |
| Net Income (Loss) available to common shareholders | Net Income (Loss) available to common shareholders | $ | 18,620 | | 8,060 | | (2,707) | |
| Average common shares outstanding (in Millions) | Average common shares outstanding (in Millions) | 1,274 | | 1,324 | | 1,078 | |
Net Income (Loss) Attributable to ConocoPhillips Per Share
of Common Stock | $ | 14.62 | | 6.09 | | (2.51) | |
| Net Income (Loss) Per Share of Common Stock | |
| | Diluted earnings per share | Diluted earnings per share | |
| Diluted earnings per share | |
| Diluted earnings per share | |
| | Net Income (Loss) available to common shareholders | |
| | Net Income (Loss) available to common shareholders | |
| | Net Income (Loss) available to common shareholders | Net Income (Loss) available to common shareholders | $ | 18,620 | | 8,060 | | (2,707) | |
| Average common shares outstanding (in Millions) | Average common shares outstanding (in Millions) | 1,274 | | 1,324 | | 1,078 | |
| Add: Dilutive impact of options and unvested | Add: Dilutive impact of options and unvested | |
| non-participating RSU/PSUs | non-participating RSU/PSUs | 4 | | 4 | | — | |
| non-participating RSU/PSUs | |
| non-participating RSU/PSUs | |
| Average diluted shares outstanding (in Millions) | Average diluted shares outstanding (in Millions) | 1,278 | | 1,328 | | 1,078 | |
Net Income (Loss) Attributable to ConocoPhillips Per Share
of Common Stock | $ | 14.57 | | 6.07 | | (2.51) | |
| Net Income (Loss) Per Share of Common Stock | |
| | | | | |
| ConocoPhillips 2023 10-K | 130 |
| | | | | |
| Notes to Consolidated Financial Statements | |
Note 24—Segment Disclosures and Related Information
We explore for, produce, transport and market crude oil, bitumen, natural gas, LNG and NGLs on a worldwide basis. We manage our operations through six operating segments, which are primarily defined by geographic region: Alaska; Lower 48; Canada; Europe, Middle East and North Africa; Asia Pacific; and Other International.
Corporate and Other represents income and costs not directly associated with an operating segment, such as most interest expense, premiums on early retirement of debt, corporate overhead and certain technology activities, including licensing revenues. Corporate assets include all cash and cash equivalents and short-term investments.
We evaluate performance and allocate resources based on net income (loss) attributable to ConocoPhillips.. Segment accounting policies are the same as those in NoteNote 1. Intersegment sales are at prices that approximate market. Analysis of Results by Operating Segment
| | | | | | | | | | | |
| Millions of Dollars |
| 2023 | 2022 | 2021 |
| Sales and Other Operating Revenues | | | |
| | | |
| | | |
| Alaska | 7,098 | | 7,905 | | 5,480 | |
| Lower 48 | 38,244 | | 52,921 | | 29,306 | |
| Intersegment eliminations | (7) | | (18) | | (12) | |
| Lower 48 | 38,237 | | 52,903 | | 29,294 | |
| Canada | 4,873 | | 6,159 | | 4,077 | |
| Intersegment eliminations | (1,867) | | (2,445) | | (1,583) | |
| Canada | 3,006 | | 3,714 | | 2,494 | |
| Europe, Middle East and North Africa | 5,854 | | 11,271 | | 5,902 | |
| Intersegment eliminations | — | | (1) | | — | |
| Europe, Middle East and North Africa | 5,854 | | 11,270 | | 5,902 | |
| Asia Pacific | 1,913 | | 2,606 | | 2,579 | |
| Other International | — | | — | | 4 | |
| Corporate and Other | 33 | | 96 | | 75 | |
| Consolidated sales and other operating revenues | $ | 56,141 | | 78,494 | | 45,828 | |
In
2021, we completed our acquisition of Concho, an independent oil and gas exploration and production company with operations across New Mexico and West Texas as well as our acquisition of Shell’s Permian assets in the Texas Delaware Basin. The accounting close date of the Shell transaction, used for reporting purposes, was December 31, 2021. Results of operations for Concho and assets acquired from Shell are included in2023, sales by our Lower 48
segment. Certain transactionsegment to a certain pipeline company accounted for approximately $5.8 billion or approximately 10 percent of our total consolidated sales and
restructuring costs associated with these acquisitions are included in our Corporate and Other segment. See Note 3.other operating revenues. | | | | | | | | | | | |
| Millions of Dollars |
| 2023 | 2022 | 2021 |
| Depreciation, Depletion, Amortization and Impairments | | | |
| Alaska | $ | 1,061 | | 941 | | 1,002 | |
| Lower 48 | 5,729 | | 4,854 | | 4,067 | |
| Canada | 425 | | 400 | | 392 | |
| Europe, Middle East and North Africa | 587 | | 735 | | 862 | |
| Asia Pacific | 455 | | 518 | | 1,483 | |
| Other International | — | | — | | — | |
| Corporate and Other | 27 | | 44 | | 76 | |
| Consolidated depreciation, depletion, amortization and impairments | $ | 8,284 | | 7,492 | | 7,882 | |
| | | | | |
| 131 | ConocoPhillips 20222023 10-K | 130 |
| | | | | |
| Notes to Consolidated Financial Statements | |
Analysis of Results by Operating Segment | | | | | | | | | | | |
| Millions of Dollars |
| 2023 | 2022 | 2021 |
| Equity in Earnings of Affiliates | | | |
| Alaska | $ | 1 | | 4 | | 5 | |
| Lower 48 | (9) | | (14) | | (18) | |
| Canada | — | | — | | — | |
| Europe, Middle East and North Africa | 580 | | 780 | | 502 | |
| Asia Pacific | 1,151 | | 1,310 | | 343 | |
| Other International | — | | 1 | | — | |
| Corporate and Other | (3) | | — | | — | |
| Consolidated equity in earnings of affiliates | $ | 1,720 | | 2,081 | | 832 | |
| | | Millions of Dollars |
| | 2022 | 2021 | 2020 |
| Sales and Other Operating Revenues | |
| Income Tax Provision (Benefit) | |
| | Income Tax Provision (Benefit) | |
| | Income Tax Provision (Benefit) | |
| Alaska | Alaska | $ | 7,905 | | 5,480 | | 3,408 | |
| Intersegment eliminations | — | | — | | (11) | |
| Alaska | |
| Alaska | Alaska | 7,905 | | 5,480 | | 3,397 | |
| Lower 48 | Lower 48 | 52,921 | | 29,306 | | 9,872 | |
| Intersegment eliminations | (18) | | (12) | | (51) | |
| Lower 48 | 52,903 | | 29,294 | | 9,821 | |
| Canada | Canada | 6,159 | | 4,077 | | 1,666 | |
| Intersegment eliminations | (2,445) | | (1,583) | | (405) | |
| Canada | 3,714 | | 2,494 | | 1,261 | |
| Europe, Middle East and North Africa | 11,271 | | 5,902 | | 1,919 | |
| Intersegment eliminations | (1) | | — | | (2) | |
| Europe, Middle East and North Africa | Europe, Middle East and North Africa | 11,270 | | 5,902 | | 1,917 | |
| Asia Pacific | Asia Pacific | 2,606 | | 2,579 | | 2,363 | |
| Other International | Other International | — | | 4 | | 7 | |
| Corporate and Other | Corporate and Other | 96 | | 75 | | 18 | |
| Consolidated sales and other operating revenues | $ | 78,494 | | 45,828 | | 18,784 | |
| Consolidated income tax provision (benefit) | |
The market for our products is large and diverse, therefore, our sales and other operating revenues are not dependent upon any single customer. | | | | | | | | | | | |
| Net Income (Loss) | | | |
| Alaska | $ | 1,778 | | 2,352 | | 1,386 | |
| Lower 48 | 6,461 | | 11,015 | | 4,932 | |
| Canada | 402 | | 714 | | 458 | |
| Europe, Middle East and North Africa | 1,189 | | 2,244 | | 1,167 | |
| Asia Pacific | 1,961 | | 2,736 | | 453 | |
| Other International | (13) | | (51) | | (107) | |
| Corporate and Other | (821) | | (330) | | (210) | |
| Consolidated net income (loss) | $ | 10,957 | | 18,680 | | 8,079 | |
| | | | | | | | | | | |
| Millions of Dollars |
| 2022 | 2021 | 2020 |
| Depreciation, Depletion, Amortization and Impairments | | | |
| Alaska | $ | 941 | | 1,002 | | 996 | |
| Lower 48 | 4,854 | | 4,067 | | 3,358 | |
| Canada | 400 | | 392 | | 342 | |
| Europe, Middle East and North Africa | 735 | | 862 | | 775 | |
| Asia Pacific | 518 | | 1,483 | | 809 | |
| Other International | — | | — | | — | |
| Corporate and Other | 44 | | 76 | | 54 | |
| Consolidated depreciation, depletion, amortization and impairments | $ | 7,492 | | 7,882 | | 6,334 | |
| | Equity in Earnings of Affiliates | |
| | Investments in and Advances to Affiliates | |
| | Investments in and Advances to Affiliates | |
| | Investments in and Advances to Affiliates | |
| Alaska | |
| Alaska | |
| Alaska | Alaska | $ | 4 | | 5 | | (7) | |
| Lower 48 | Lower 48 | (14) | | (18) | | (11) | |
| Canada | Canada | — | | — | | — | |
| Europe, Middle East and North Africa | Europe, Middle East and North Africa | 780 | | 502 | | 311 | |
| Asia Pacific | Asia Pacific | 1,310 | | 343 | | 137 | |
| Other International | Other International | 1 | | — | | 2 | |
| Corporate and Other | Corporate and Other | — | | — | | — | |
| Consolidated equity in earnings of affiliates | $ | 2,081 | | 832 | | 432 | |
| Consolidated investments in and advances to affiliates | |
| | | | | |
131ConocoPhillips 2023 10-K | ConocoPhillips 2022 10-K132 |
| | | | | |
| Notes to Consolidated Financial Statements | |
| | Millions of Dollars |
| 2022 | 2021 | 2020 |
| Income Tax Provision (Benefit) | |
| Millions of Dollars | | | Millions of Dollars |
| 2023 | | | 2023 | 2022 | 2021 |
| Total Assets | |
| Alaska | |
| Alaska | |
| Alaska | Alaska | $ | 885 | | 402 | | (256) | |
| Lower 48 | Lower 48 | 3,088 | | 1,390 | | (378) | |
| Canada | Canada | 206 | | 150 | | (185) | |
| Europe, Middle East and North Africa | Europe, Middle East and North Africa | 5,445 | | 2,543 | | 136 | |
| Asia Pacific | Asia Pacific | 480 | | 483 | | 294 | |
| Other International | Other International | 53 | | (53) | | (20) | |
| Corporate and Other | Corporate and Other | (609) | | (282) | | (76) | |
| Consolidated income tax provision (benefit) | $ | 9,548 | | 4,633 | | (485) | |
| Consolidated total assets | |
| | Net Income (Loss) Attributable to ConocoPhillips | |
| | Capital Expenditures and Investments | |
| | Capital Expenditures and Investments | |
| | Capital Expenditures and Investments | |
| Alaska | |
| Alaska | |
| Alaska | Alaska | $ | 2,352 | | 1,386 | | (719) | |
| Lower 48 | Lower 48 | 11,015 | | 4,932 | | (1,122) | |
| Canada | Canada | 714 | | 458 | | (326) | |
| Europe, Middle East and North Africa | Europe, Middle East and North Africa | 2,244 | | 1,167 | | 448 | |
| Asia Pacific | Asia Pacific | 2,736 | | 453 | | 962 | |
| Other International | Other International | (51) | | (107) | | (64) | |
| Corporate and Other | Corporate and Other | (330) | | (210) | | (1,880) | |
| Consolidated net income (loss) attributable to ConocoPhillips | $ | 18,680 | | 8,079 | | (2,701) | |
| Consolidated capital expenditures and investments | |
| | | | Investments in and Advances to Affiliates | |
| Interest Income and Expense | |
| Interest income | |
| Interest income | |
| Interest income | |
| Alaska | |
| Alaska | |
| Alaska | Alaska | $ | 55 | | 58 | | 62 | |
| Lower 48 | Lower 48 | 235 | | 242 | | 25 | |
| Canada | Canada | — | | — | | — | |
| Europe, Middle East and North Africa | Europe, Middle East and North Africa | 1,049 | | 797 | | 918 | |
| Asia Pacific | Asia Pacific | 6,154 | | 5,603 | | 6,705 | |
| Other International | Other International | — | | 1 | | — | |
| Corporate and Other | Corporate and Other | — | | — | | — | |
| Consolidated investments in and advances to affiliates | $ | 7,493 | | 6,701 | | 7,710 | |
| Interest and debt expense | |
| Corporate and Other | |
| Corporate and Other | |
| Corporate and Other | |
| | | | | | | | | | | |
| Total Assets | | | |
| Alaska | $ | 15,126 | | 14,812 | | 14,623 | |
| Lower 48 | 42,950 | | 41,699 | | 11,932 | |
| Canada | 6,971 | | 7,439 | | 6,863 | |
| Europe, Middle East and North Africa | 8,263 | | 9,125 | | 8,756 | |
| Asia Pacific | 9,511 | | 9,840 | | 11,231 | |
| Other International | — | | 1 | | 226 | |
| Corporate and Other | 11,008 | | 7,745 | | 8,987 | |
| Consolidated total assets | $ | 93,829 | | 90,661 | | 62,618 | |
| | | | | | | | | | | |
| Sales and Other Operating Revenues by Product | | | |
| Crude oil | $ | 37,833 | | 41,492 | | 23,648 | |
| Natural gas | 10,725 | | 26,941 | | 16,904 | |
| Natural gas liquids | 2,609 | | 3,650 | | 1,668 | |
| Other* | 4,974 | | 6,411 | | 3,608 | |
| Consolidated sales and other operating revenues by product | $ | 56,141 | | 78,494 | | 45,828 | |
*Includes bitumen and power.
| | | | | |
| 133 | ConocoPhillips 20222023 10-K | 132 |
| | | | | |
| Notes to Consolidated Financial Statements | |
| | | | | | | | | | | |
| Millions of Dollars |
| 2022 | 2021 | 2020 |
| Capital Expenditures and Investments | | | |
| Alaska | $ | 1,091 | | 982 | | 1,038 | |
| Lower 48 | 5,630 | | 3,129 | | 1,881 | |
| Canada | 530 | | 203 | | 651 | |
| Europe, Middle East and North Africa | 998 | | 534 | | 600 | |
| Asia Pacific | 1,880 | | 390 | | 384 | |
| Other International | — | | 33 | | 121 | |
| Corporate and Other | 30 | | 53 | | 40 | |
| Consolidated capital expenditures and investments | $ | 10,159 | | 5,324 | | 4,715 | |
| | | | | | | | | | | |
| Interest Income and Expense | | | |
| Interest income | | | |
| Alaska | $ | — | | — | | — | |
| Lower 48 | — | | — | | — | |
| Canada | — | | — | | — | |
| Europe, Middle East and North Africa | 1 | | 2 | | 5 | |
| Asia Pacific | 9 | | 9 | | 7 | |
| Other International | — | | — | | — | |
| Corporate and Other | 185 | | 22 | | 88 | |
| Interest and debt expense | | | |
| Corporate and Other | $ | 805 | | 884 | | 806 | |
| | | | | | | | | | | |
| Sales and Other Operating Revenues by Product | | | |
| Crude oil | $ | 41,492 | | 23,648 | | 9,736 | |
| Natural gas | 26,941 | | 16,904 | | 6,427 | |
| Natural gas liquids | 3,650 | | 1,668 | | 528 | |
| Other* | 6,411 | | 3,608 | | 2,093 | |
| Consolidated sales and other operating revenues by product | $ | 78,494 | | 45,828 | | 18,784 | |
*Includes LNG and bitumen.
Geographic Information
| | Millions of Dollars | | | Millions of Dollars |
| Sales and Other Operating Revenues(1) | | | Sales and Other Operating Revenues(1) | | Long-Lived Assets(2) |
| 2023 | | | 2023 | 2022 | 2021 | | 2023 | 2022 | 2021 |
| | Millions of Dollars |
| Sales and Other Operating Revenues(1) | | Long-Lived Assets(2) |
| 2022 | 2021 | 2020 | | 2022 | 2021 | 2020 |
| | United States | $ | 60,899 | | 34,847 | | 13,230 | | | 51,200 | | 50,580 | | 24,034 | |
| Australia and Timor-Leste | — | | — | | 605 | | | 6,158 | | 5,579 | | 6,676 | |
| U.S. | |
| U.S. | |
| U.S. | |
| Australia | |
| Canada | Canada | 3,714 | | 2,494 | | 1,261 | | | 6,269 | | 6,608 | | 6,385 | |
| China | China | 1,135 | | 724 | | 460 | | | 1,538 | | 1,476 | | 1,491 | |
Indonesia(3) | Indonesia(3) | 159 | | 879 | | 689 | | | — | | 28 | | 464 | |
| Libya | Libya | 1,582 | | 1,102 | | 155 | | | 714 | | 659 | | 670 | |
| Malaysia | Malaysia | 1,312 | | 975 | | 610 | | | 1,107 | | 1,252 | | 1,501 | |
| Norway | Norway | 3,415 | | 2,563 | | 1,426 | | | 4,369 | | 4,681 | | 5,294 | |
| United Kingdom | 6,273 | | 2,236 | | 336 | | | 1 | | 1 | | 1 | |
| U.K. | |
| Other foreign countries | Other foreign countries | 5 | | 8 | | 12 | | | 1,003 | | 748 | | 1,087 | |
| Worldwide consolidated | Worldwide consolidated | $ | 78,494 | | 45,828 | | 18,784 | | | 72,359 | | 71,612 | | 47,603 | |
(1)Sales and other operating revenues are attributable to countries based on the location of the selling operation.
(2)Defined as net PP&E plus equity investments and advances to affiliated companies.
Note 25—New Accounting Standards
In November 2023, the FASB issued ASU No. 2023-07, “Improvements to Reportable Segment Disclosures” which sets forth improvements to the current segment disclosure requirements in accordance with Topic 280 “Segment Reporting”. The amendments do not change how we identify our operating segments. On adoption, the disclosure improvements will be applied retrospectively to prior periods presented. The ASU is effective for fiscal years beginning after December 15, 2023, and interim periods within fiscal years beginning after December 15, 2024 and early adoption is permitted. We are currently evaluating the impact of the adoption of this ASU.
In December 2023, the FASB issued ASU No. 2023-09, “Improvements to Income Tax Disclosures” which enhances the disclosure requirements within Topic 740 “Income Taxes”. The enhancements will impact our financial statement disclosures only and will be applied prospectively with retrospective application permitted. The ASU is effective for annual periods beginning after December 15, 2024 and early adoption is permitted. We are currently evaluating the impact of the adoption of this ASU.
| | | | | |
133ConocoPhillips 2023 10-K | ConocoPhillips 2022 10-K134 |
| | |
Oil and Gas Operations (Unaudited) |
In accordance with FASB ASC Topic 932, “Extractive Activities—Oil and Gas,” and regulations of the SEC, we are making certain supplemental disclosures about our oil and gas exploration and production operations.
These disclosures include information about our consolidated oil and gas activities and our proportionate share of our equity affiliates’ oil and gas activities in our operating segments. As a result, amounts reported as equity affiliates in Oil and Gas Operations may differ from those shown in the individual segment disclosures reported elsewhere in this report. Our disclosures by geographic area include the U.S., Canada, Europe, Asia Pacific/Middle East (inclusive of equity affiliates) and Africa.
As required by current authoritative guidelines, the estimated future date when an asset will be permanently shut down for economic reasons is based on historical 12-month first-of-month average prices and current costs. This estimated date when production will end affects the amount of estimated reserves. Therefore, as prices and cost levels change from year to year, the estimate of proved reserves also changes. Generally, our proved reserves decrease as prices decline and increase as prices rise.
Our proved reserves include estimated quantities related to PSCs, which are reported under the “economic interest” method, as well as variable-royalty regimes, and are subject to fluctuations in commodity prices, recoverable operating expenses and capital costs. If costs remain stable, reserve quantities attributable to recovery of costs will change inversely to changes in commodity prices. For example, if prices increase, then our applicable reserve quantities would decline. At December 31, 2022,2023, approximately 3 percent of our total proved reserves were under PSCs, located in our Asia Pacific/Middle East geographic reporting area, and 47 percent of our total proved reserves were under a variable-royalty regime, located in our Canada geographic reporting area.
Reserves Governance
The recording and reporting of proved reserves are governed by criteria established by regulations of the SEC and FASB. Proved reserves are those quantities of oil and gas, which, by analysis of geoscience and engineering data, can be estimated with reasonable certainty to be economically producible—from a given date forward, from known reservoirs, and under existing economic conditions, operating methods, and government regulations—prior to the time at which contracts providing the right to operate expire, unless evidence indicates renewal is reasonably certain, regardless of whether deterministic or probabilistic methods are used for the estimation. The project to extract the hydrocarbons must have commenced or the operator must be reasonably certain it will commence the project within a reasonable time.
Proved reserves are further classified as either developed or undeveloped. Proved developed reserves are proved reserves that can be expected to be recovered through existing wells with existing equipment and operating methods, or in which the cost of the required equipment is relatively minor compared with the cost of a new well, and through installed extraction equipment and infrastructure operational at the time of the reserves estimate if the extraction is by means not involving a well. Proved undeveloped reserves are proved reserves expected to be recovered from new wells on undrilled acreage, or from existing wells where a relatively major expenditure is required for recompletion. Reserves on undrilled acreage are limited to those directly offsetting development spacing areas that are reasonably certain of production when drilled, unless evidence provided by reliable technologies exists that establishes reasonable certainty of economic producibility at greater distances. As defined by SEC regulations, reliable technologies may be used in reserve estimation when they have been demonstrated in the field to provide reasonably certain results with consistency and repeatability in the formation being evaluated or in an analogous formation. The technologies and data used in the estimation of our proved reserves include, but are not limited to, performance-based methods, volumetric-based methods, geologic maps, seismic interpretation, well logs, well test data, core data, analogy and statistical analysis.
| | | | | |
| 135 | ConocoPhillips 20222023 10-K | 134 |
We have a company-wide, comprehensive, SEC-compliant internal policy that governs the determination and reporting of proved reserves. This policy is applied by the geoscientists and reservoir engineers in our business units around the world. As part of our internal control process, each business unit’s reserves processes and controls are reviewed annually by an internal team which is headed by the company’s Manager of Reserves Compliance and Reporting. This team, composed of internal reservoir engineers, geoscientists, finance personnel and a senior representative from DeGolyer and MacNaughton (D&M), a third-party petroleum engineering consulting firm, reviews the business units’unit's reserves for adherence to SEC guidelines and company policy through on-site visits, teleconferences and review of documentation. In addition to providing independent reviews, this internal team also ensures reserves are calculated using consistent and appropriate standards and procedures. This team is independent of business unit line management and is responsible for reporting its findings to senior management. The team is responsible for communicating our reserves policy and procedures and is available for internal peer reviews and consultation on major projects or technical issues throughout the year. All of our proved reserves held by consolidated companies and our share of equity affiliates have been estimated by ConocoPhillips.
During 2022,2023, our processes and controls used to assess over 90 percent of proved reserves as of December 31, 2022,2023, were reviewed by D&M. The purpose of their review was to assess whether the adequacy and effectiveness of our internal processes and controls used to determine estimates of proved reserves are in accordance with SEC regulations. In such review, ConocoPhillips’ technical staff presented D&M with an overview of the reserves data, as well as the methods and assumptions used in estimating reserves. The data presented included pertinent seismic information, geologic maps, well logs, production tests, material balance calculations, reservoir simulation models, well performance data, operating procedures and relevant economic criteria. Management’s intent in retaining D&M to review its processes and controls was to provide objective third-party input on these processes and controls. D&M’s opinion was the general processes and controls employed by ConocoPhillips in estimating its December 31, 2022,2023 proved reserves for the properties reviewed are in accordance with the SEC reserves definitions. D&M’s report is included as Exhibit 99 of this Annual Report on Form 10-K.
The technical person primarily responsible for overseeing the processes and internal controls used in the preparation of the company’s reserves estimates is the Manager of Reserves Compliance and Reporting. This individual holds a master’s degree in petroleum engineering. He is a member of the Society of Petroleum Engineers with over 30 years of oil and gas industry experience and has held positions of increasing responsibility in reservoir engineering, subsurface and asset management in the U.S. and several international field locations.
Engineering estimates of the quantities of proved reserves are inherently imprecise. See the “Critical Accounting Estimates” section of Management’s Discussion and Analysis of Financial Condition and Results of Operations for additional discussion of the sensitivities surrounding these estimates.
| | | | | |
135ConocoPhillips 2023 10-K | ConocoPhillips 2022 10-K136 |
| | Proved Reserves | Proved Reserves | |
| Years Ended
December 31 | Years Ended
December 31 | Crude Oil |
| Years Ended
December 31 | Years Ended
December 31 | Millions of Barrels |
| Alaska | Lower
48 | Total
U.S. | Canada | Europe | Asia Pacific/
Middle East | Africa | Total
Consolidated | Equity
Affiliates* | Total |
Years Ended
December 31 | | Crude Oil |
| Millions of Barrels |
| Alaska | | | Alaska | Lower
48 | Total
U.S. | Canada | Europe | Asia Pacific/
Middle East | Africa | Total
Consolidated Operations | Equity
Affiliates* | Total |
| Developed and Undeveloped | Developed and Undeveloped | |
| End of 2019 | 1,231 | | 797 | | 2,028 | | 5 | | 198 | | 134 | | 197 | | 2,562 | | 73 | | 2,635 | |
| Revisions | (297) | | (126) | | (423) | | (2) | | 4 | | (4) | | (3) | | (428) | | — | | (428) | |
| Improved recovery | — | | — | | — | | — | | — | | 3 | | — | | 3 | | — | | 3 | |
| Purchases | — | | 5 | | 5 | | 3 | | — | | — | | — | | 8 | | — | | 8 | |
| Extensions and discoveries | 10 | | 108 | | 118 | | 3 | | — | | — | | — | | 121 | | — | | 121 | |
| Production | (65) | | (77) | | (142) | | (2) | | (28) | | (25) | | (3) | | (200) | | (5) | | (205) | |
| Sales | — | | (14) | | (14) | | (1) | | — | | — | | — | | (15) | | — | | (15) | |
| End of 2020 | |
| End of 2020 | |
| End of 2020 | End of 2020 | 879 | | 693 | | 1,572 | | 6 | | 174 | | 108 | | 191 | | 2,051 | | 68 | | 2,119 | |
| Revisions | Revisions | 209 | | (52) | | 157 | | 2 | | 14 | | 37 | | 6 | | 216 | | — | | 216 | |
| Improved recovery | Improved recovery | 1 | | — | | 1 | | — | | — | | — | | — | | 1 | | — | | 1 | |
| Purchases | Purchases | — | | 691 | | 691 | | — | | — | | — | | — | | 691 | | — | | 691 | |
| Extensions and discoveries | Extensions and discoveries | 10 | | 289 | | 299 | | 5 | | 2 | | 1 | | — | | 307 | | — | | 307 | |
| Production | Production | (64) | | (160) | | (224) | | (3) | | (29) | | (24) | | (13) | | (293) | | (5) | | (298) | |
| Sales | Sales | — | | (9) | | (9) | | — | | — | | — | | — | | (9) | | — | | (9) | |
| End of 2021 | End of 2021 | 1,035 | | 1,452 | | 2,487 | | 10 | | 161 | | 122 | | 184 | | 2,964 | | 63 | | 3,027 | |
| Revisions | Revisions | (31) | | 24 | | (7) | | — | | 31 | | 19 | | (3) | | 40 | | — | | 40 | |
| Improved recovery | Improved recovery | — | | — | | — | | — | | — | | 3 | | — | | 3 | | — | | 3 | |
| Purchases | Purchases | — | | 6 | | 6 | | — | | — | | — | | 42 | | 48 | | — | | 48 | |
| Extensions and discoveries | Extensions and discoveries | 15 | | 250 | | 265 | | — | | 8 | | — | | — | | 273 | | 35 | | 308 | |
| Production | Production | (64) | | (193) | | (257) | | (2) | | (25) | | (22) | | (13) | | (319) | | (5) | | (324) | |
| Sales | Sales | — | | (31) | | (31) | | — | | — | | (3) | | — | | (34) | | — | | (34) | |
| End of 2022 | End of 2022 | 955 | | 1,508 | | 2,463 | | 8 | | 175 | | 119 | | 210 | | 2,975 | | 93 | | 3,068 | |
| Revisions | |
| Improved recovery | |
| Purchases | |
| Extensions and discoveries | |
| Production | |
| Sales | |
| End of 2023 | |
| |
| Years Ended
December 31 | Years Ended
December 31 | Crude Oil | Years Ended
December 31 | Crude Oil |
| Millions of Barrels | Millions of Barrels |
| Alaska | | | Alaska | Lower
48 | Total
U.S. | Canada | Europe | Asia Pacific/
Middle East | Africa | Total
Consolidated Operations | Equity
Affiliates* | Total |
| Developed | |
| | Alaska | Lower
48 | Total
U.S. | Canada | Europe | Asia Pacific/
Middle East | Africa | Total
Consolidated | Equity
Affiliates* | Total |
| Developed | |
| Consolidated operations | |
| End of 2019 | 1,048 | | 334 | | 1,382 | | 3 | | 149 | | 94 | | 181 | | 1,809 | | 73 | | 1,882 | |
| End of 2020 | |
| | End of 2020 | |
| | End of 2020 | End of 2020 | 765 | | 263 | | 1,028 | | 6 | | 129 | | 77 | | 175 | | 1,415 | | 68 | | 1,483 | |
| End of 2021 | End of 2021 | 912 | | 916 | | 1,828 | | 4 | | 122 | | 98 | | 171 | | 2,223 | | 63 | | 2,286 | |
| End of 2022 | End of 2022 | 867 | | 828 | | 1,695 | | 5 | | 124 | | 102 | | 191 | | 2,117 | | 58 | | 2,175 | |
| End of 2023 | |
| | Undeveloped | Undeveloped | |
| Consolidated operations | |
| End of 2019 | 183 | | 463 | | 646 | | 2 | | 49 | | 40 | | 16 | | 753 | | — | | 753 | |
| Undeveloped | |
| Undeveloped | |
| | End of 2020 | |
| | End of 2020 | |
| | End of 2020 | End of 2020 | 114 | | 430 | | 544 | | — | | 45 | | 31 | | 16 | | 636 | | — | | 636 | |
| End of 2021 | End of 2021 | 123 | | 536 | | 659 | | 6 | | 39 | | 24 | | 13 | | 741 | | — | | 741 | |
| End of 2022 | End of 2022 | 88 | | 680 | | 768 | | 3 | | 51 | | 17 | | 19 | | 858 | | 35 | | 893 | |
| End of 2023 | |
|
*All Equity Affiliate reserves are located in our Asia Pacific/Middle East Region.
| | | | | |
| 137 | ConocoPhillips 20222023 10-K | 136 |
Notable changes in proved crude oil reserves in the three years ended December 31, 2022,2023, included:
•Revisions:In 2023, upward revisions in Lower 48 were due to development drilling of 161 million barrels and technical revisions in the unconventional plays of 31 million barrels, partially offset by downward revisions of 52 million barrels due to lower prices and 14 million barrels for changes in development plans. An upward revision of 10 million barrels in Africa was primarily development drilling in Libya. Upward revisions of 8 million barrels in the consolidated operations in Asia Pacific/Middle East were due to technical revisions. In Alaska, where future production is constrained by the Trans-Alaska Pipeline System minimum flow limit, updated total North Slope development phasing indicated that the flow limit will be reached earlier than previously premised, resulting in downward revisions of 25 million barrels. Further downward revisions in Alaska include development plan changes of 14 million barrels, cost escalation of 13 million barrels, and 7 million barrels due to lower prices, partially offset by 2 million barrels of technical revisions.
In 2022, upward revisions in Lower 48 were due to additional development drilling in the unconventional plays of 81 million barrels and higher prices of 33 million barrels, partially offset by increasing operating costs of 72 million barrels and technical revisions of 18 million barrels. Upward revisions in Europe were primarily due to technical revisions of 23 million barrels and 8 million barrels due to higher prices. Upward revisions of 19 million barrels in our consolidated operations in Asia Pacific/Middle East were primarily due to technical revisions.
In 2021, Alaska upward revisions were primarily driven by higher prices. Downward revisions in Lower 48 were due to development timing for specific well locations from unconventional plays of 203 million barrels and technical revisions of 35 million barrels, partially offset by upward revisions due to higher prices of 115 million barrels and additional infill drilling in the unconventional plays of 71 million barrels. Upward revisions in Europe were primarily due to higher prices. In Asia Pacific/Middle East, increases were due to higher prices of 21 million barrels and technical revisions of 16 million barrels.
In 2020, Alaska downward revisions were primarily driven by lower prices of 243 million barrels and development plan changes of 54 million barrels. Downward revisions in Lower 48 were due to lower prices of 89 million barrels and development timing for specific well locations from unconventional plays of 82 million barrels, partially offset by upward technical revisions and additional infill drilling in the unconventional plays of 45 million barrels.
•Purchases: In 2022, crude oil reserve purchases were primarily in Africa, as a result of the acquisition of additional interest in the Libya Waha Concession.
In 2021, Lower 48 purchases were due to the Concho and Shell Permian acquisitions.
•Extensions and discoveries: In 2023, extensions and discoveries in Alaska were driven primarily by the Willow and Nuna projects. Lower 48 extensions and discoveries were primarily within unconventional plays in the Permian Basin. Extensions and discoveries in Canada and Asia Pacific/Middle East were driven primarily by Montney and Bohai Phase 4B in China, respectively.
In 2022, extensions and discoveries in Lower 48 were primarily within unconventional plays in the Permian Basin. Extensions and discoveries in our equity affiliates were in the Middle East.
In 2021, extensions and discoveries in Lower 48 were due to planned development to add specific well locations from the unconventional plays which more than offset the decreases resulting from development plan timing in the revisions category.
In 2020, extensions and discoveries in Lower 48 were due to planned development to add specific well locations from the unconventional plays which more than offset the decreases resulting from development plan timing in the revisions category.
| | | | | |
137ConocoPhillips 2023 10-K | ConocoPhillips 2022 10-K138 |
| Years Ended
December 31 | Years Ended
December 31 | Natural Gas Liquids | Years Ended
December 31 | Natural Gas Liquids |
| Millions of Barrels | Millions of Barrels |
| Alaska | | | Alaska | Lower
48 | Total
U.S. | Canada | Europe | Asia Pacific/
Middle East | Total Consolidated Operations | Equity Affiliates* | Total |
| Developed and Undeveloped | |
| | Alaska | Lower
48 | Total
U.S. | Canada | Europe | Asia Pacific/
Middle East | Total Consolidated | Equity Affiliates* | Total |
| Developed and Undeveloped | |
| Consolidated operations | |
| End of 2019 | 100 | | 245 | | 345 | | 2 | | 13 | | 1 | | 361 | | 39 | | 400 | |
| Revisions | — | | (26) | | (26) | | — | | 1 | | (1) | | (26) | | — | | (26) | |
| Improved recovery | — | | — | | — | | — | | — | | — | | — | | — | | — | |
| Purchases | — | | 2 | | 2 | | 2 | | — | | — | | 4 | | — | | 4 | |
| Extensions and discoveries | — | | 41 | | 41 | | 1 | | — | | — | | 42 | | — | | 42 | |
| Production | (6) | | (27) | | (33) | | (1) | | (2) | | — | | (36) | | (3) | | (39) | |
| Sales | — | | (5) | | (5) | | — | | — | | — | | (5) | | — | | (5) | |
| End of 2020 | |
| | End of 2020 | |
| | End of 2020 | End of 2020 | 94 | | 230 | | 324 | | 4 | | 12 | | — | | 340 | | 36 | | 376 | |
| Revisions | Revisions | (6) | | 213 | | 207 | | — | | 1 | | — | | 208 | | — | | 208 | |
| Improved recovery | Improved recovery | — | | — | | — | | — | | — | | — | | — | | — | | — | |
| Purchases | Purchases | — | | 72 | | 72 | | — | | — | | — | | 72 | | — | | 72 | |
| Extensions and discoveries | Extensions and discoveries | — | | 82 | | 82 | | 2 | | — | | — | | 84 | | — | | 84 | |
| Production | Production | (6) | | (50) | | (56) | | (1) | | (2) | | — | | (59) | | (3) | | (62) | |
| Sales | Sales | — | | (1) | | (1) | | — | | — | | — | | (1) | | — | | (1) | |
| End of 2021 | End of 2021 | 82 | | 546 | | 628 | | 5 | | 11 | | — | | 644 | | 33 | | 677 | |
| Revisions | Revisions | 1 | | 208 | | 209 | | 1 | | 3 | | — | | 213 | | — | | 213 | |
| Improved recovery | Improved recovery | — | | — | | — | | — | | — | | — | | — | | — | | — | |
| Purchases | Purchases | — | | 3 | | 3 | | — | | — | | — | | 3 | | — | | 3 | |
| Extensions and discoveries | Extensions and discoveries | — | | 80 | | 80 | | — | | 1 | | — | | 81 | | 20 | | 101 | |
| Production | Production | (5) | | (81) | | (86) | | (1) | | (2) | | — | | (89) | | (3) | | (92) | |
| Sales | Sales | — | | (7) | | (7) | | — | | — | | — | | (7) | | — | | (7) | |
| End of 2022 | End of 2022 | 78 | | 749 | | 827 | | 5 | | 13 | | — | | 845 | | 50 | | 895 | |
| Revisions | |
| Improved recovery | |
| Purchases | |
| Extensions and discoveries | |
| Production | |
| Sales | |
| End of 2023 | |
| |
| Years Ended
December 31 | Years Ended
December 31 | Natural Gas Liquids | Years Ended
December 31 | Natural Gas Liquids |
| Millions of Barrels | Millions of Barrels |
| Alaska | | | Alaska | Lower
48 | Total
U.S. | Canada | Europe | Asia Pacific/
Middle East | Total Consolidated Operations | Equity Affiliates* | Total |
| Developed | |
| | Alaska | Lower
48 | Total
U.S. | Canada | Europe | Asia Pacific/
Middle East | Total Consolidated | Equity Affiliates* | Total |
| Developed | |
| Consolidated operations | |
| End of 2019 | 100 | | 99 | | 199 | | 1 | | 10 | | 1 | | 211 | | 39 | | 250 | |
| End of 2020 | |
| | End of 2020 | |
| | End of 2020 | End of 2020 | 94 | | 83 | | 177 | | 4 | | 9 | | — | | 190 | | 36 | | 226 | |
| End of 2021 | End of 2021 | 82 | | 334 | | 416 | | 3 | | 9 | | — | | 428 | | 33 | | 461 | |
| End of 2022 | End of 2022 | 78 | | 409 | | 487 | | 3 | | 10 | | — | | 500 | | 31 | | 531 | |
| End of 2023 | |
| | | Undeveloped | Undeveloped | |
| Consolidated operations | |
| End of 2019 | — | | 146 | | 146 | | 1 | | 3 | | — | | 150 | | — | | 150 | |
| End of 2020 | — | | 147 | | 147 | | — | | 3 | | — | | 150 | | — | | 150 | |
| End of 2021 | — | | 212 | | 212 | | 2 | | 2 | | — | | 216 | | — | | 216 | |
| End of 2022 | — | | 340 | | 340 | | 2 | | 3 | | — | | 345 | | 19 | | 364 | |
| | Undeveloped | |
| | Undeveloped | |
| | End of 2020 | |
| | End of 2020 | |
| | End of 2020 | |
| End of 2021 | |
| End of 2022 | |
| End of 2023 | |
|
*All Equity Affiliate reserves are located in our Asia Pacific/Middle East Region.
| | | | | |
| 139 | ConocoPhillips 20222023 10-K | 138 |
Notable changes in proved NGL reserves in the three years ended December 31, 2022,2023, included:
•Revisions: In 2023, upward revisions in Lower 48 were due to additional development drilling in the unconventional plays of 86 million barrels and technical revisions of 71 million barrels. This was partially offset by lower prices impacting 34 million barrels and development plan changes of 4 million barrels.
In 2022, upward revisions in Lower 48 were due to additional development drilling in the unconventional plays of 88 million barrels, technical revisions of 75 million barrels, continued conversion of acquired Concho Permian two-stream contracts to a three-stream (crude oil, natural gas and natural gas liquids)NGLs) basis adding 70 million barrels, and higher prices of 13 million barrels. This was partially offset by increasing operating costs of 38 million barrels.
In 2021, upward revisions in Lower 48 were due to conversion of acquired Concho Permian two-stream contracts to a three-stream (crude oil, natural gas and natural gas liquids)NGLs) basis, adding 182 million barrels, additional infill drilling in the unconventional plays of 44 million barrels, technical revisions of 21 million barrels and higher prices of 28 million barrels, partially offset by downward revisions related to development timing for specific well locations from unconventional plays of 62 million barrels.
In 2020, downward revisions in Lower 48 were due to lower prices of 33 million barrels and development timing for specific well locations from unconventional plays of 20 million barrels, partially offset by upward technical revisions and additional infill drilling in the unconventional plays of 27 million barrels.
•Purchases: In 2021, Lower 48 purchases were due to the Shell Permian acquisition.
•Extensions and discoveries: In 2023, extensions and discoveries in Lower 48 were primarily within unconventional plays in the Permian Basin. Canada extensions and discoveries were in Montney.
In 2022, extensions and discoveries in Lower 48 were primarily within unconventional plays in the Permian Basin. Extensions and discoveries in our equity affiliates were in the Middle East.
In 2021, extensions and discoveries in Lower 48 were due to planned development to add specific well locations from the unconventional plays which more than offset the decreases in the revisions category.
In 2020, extensions and discoveries in Lower 48 were due to planned development to add specific well locations from the unconventional plays which more than offset the decreases in the revisions category.
| | | | | |
139ConocoPhillips 2023 10-K | ConocoPhillips 2022 10-K140 |
| Years Ended
December 31 | Years Ended
December 31 | Natural Gas | Years Ended
December 31 | Natural Gas |
| Billions of Cubic Feet | Billions of Cubic Feet |
| Alaska | | | Alaska | Lower
48 | Total
U.S. | Canada | Europe | Asia Pacific/
Middle East | Africa | Total Consolidated Operations | Equity Affiliates* | Total |
| Developed and Undeveloped | |
| | Alaska | Lower
48 | Total
U.S. | Canada | Europe | Asia Pacific/
Middle East | Africa | Total Consolidated | Equity Affiliates* | Total |
| Developed and Undeveloped | |
| Consolidated operations | |
| End of 2019 | 2,688 | | 2,431 | | 5,119 | | 43 | | 896 | | 977 | | 224 | | 7,259 | | 4,421 | | 11,680 | |
| Revisions | (607) | | (439) | | (1,046) | | (15) | | 39 | | 103 | | 2 | | (917) | | (382) | | (1,299) | |
| Improved recovery | — | | — | | — | | — | | — | | — | | — | | — | | — | | — | |
| Purchases | — | | 74 | | 74 | | 29 | | — | | — | | — | | 103 | | 2 | | 105 | |
| Extensions and discoveries | — | | 304 | | 304 | | 33 | | 2 | | — | | — | | 339 | | 78 | | 417 | |
| Production | (85) | | (231) | | (316) | | (16) | | (112) | | (171) | | (2) | | (617) | | (395) | | (1,012) | |
| Sales | — | | (39) | | (39) | | — | | — | | (58) | | — | | (97) | | — | | (97) | |
| End of 2020 | |
| | End of 2020 | |
| | End of 2020 | End of 2020 | 1,996 | | 2,100 | | 4,096 | | 74 | | 825 | | 851 | | 224 | | 6,070 | | 3,724 | | 9,794 | |
| Revisions | Revisions | 715 | | 41 | | 756 | | 15 | | 54 | | 60 | | — | | 885 | | 247 | | 1,132 | |
| Improved recovery | Improved recovery | — | | — | | — | | — | | — | | — | | — | | — | | — | | — | |
| Purchases | Purchases | — | | 2,438 | | 2,438 | | — | | — | | — | | — | | 2,438 | | — | | 2,438 | |
| Extensions and discoveries | Extensions and discoveries | — | | 822 | | 822 | | 46 | | 2 | | — | | — | | 870 | | 116 | | 986 | |
| Production | Production | (86) | | (473) | | (559) | | (30) | | (113) | | (147) | | (7) | | (856) | | (390) | | (1,246) | |
| Sales | Sales | — | | (270) | | (270) | | — | | — | | — | | — | | (270) | | — | | (270) | |
| End of 2021 | End of 2021 | 2,625 | | 4,658 | | 7,283 | | 105 | | 768 | | 764 | | 217 | | 9,137 | | 3,697 | | 12,834 | |
| Revisions | Revisions | (35) | | 361 | | 326 | | 8 | | 108 | | (2) | | (14) | | 426 | | 898 | | 1,324 | |
| Improved recovery | Improved recovery | — | | — | | — | | — | | — | | — | | — | | — | | — | | — | |
| Purchases | Purchases | — | | 23 | | 23 | | — | | — | | — | | 48 | | 71 | | 479 | | 550 | |
| Extensions and discoveries | Extensions and discoveries | — | | 505 | | 505 | | 4 | | 103 | | — | | — | | 612 | | 1,118 | | 1,730 | |
| Production | Production | (88) | | (543) | | (631) | | (23) | | (117) | | (51) | | (10) | | (832) | | (439) | | (1,271) | |
| Sales | Sales | — | | (262) | | (262) | | — | | — | | (385) | | — | | (647) | | — | | (647) | |
| End of 2022 | End of 2022 | 2,502 | | 4,742 | | 7,244 | | 94 | | 862 | | 326 | | 241 | | 8,767 | | 5,753 | | 14,520 | |
| Revisions | |
| Improved recovery | |
| Purchases | |
| Extensions and discoveries | |
| Production | |
| Sales | |
| End of 2023 | |
| | |
| Years Ended
December 31 | Years Ended
December 31 | Natural Gas | Years Ended
December 31 | Natural Gas |
| Billions of Cubic Feet | Billions of Cubic Feet |
| Alaska | | | Alaska | Lower
48 | Total
U.S. | Canada | Europe | Asia Pacific/
Middle East | Africa | Total Consolidated Operations | Equity Affiliates* | Total |
| Developed | |
| | Alaska | Lower
48 | Total
U.S. | Canada | Europe | Asia Pacific/
Middle East | Africa | Total Consolidated | Equity Affiliates* | Total |
| Developed | |
| Consolidated operations | |
| End of 2019 | 2,601 | | 1,398 | | 3,999 | | 30 | | 697 | | 843 | | 224 | | 5,793 | | 3,898 | | 9,691 | |
| End of 2020 | |
| | End of 2020 | |
| | End of 2020 | End of 2020 | 1,961 | | 1,051 | | 3,012 | | 74 | | 598 | | 806 | | 224 | | 4,714 | | 3,293 | | 8,007 | |
| End of 2021 | End of 2021 | 2,579 | | 3,100 | | 5,679 | | 52 | | 679 | | 688 | | 217 | | 7,315 | | 3,204 | | 10,519 | |
| End of 2022 | End of 2022 | 2,474 | | 2,628 | | 5,102 | | 64 | | 641 | | 322 | | 241 | | 6,370 | | 3,974 | | 10,344 | |
| End of 2023 | |
| | | Undeveloped | Undeveloped | |
| Consolidated operations | |
| End of 2019 | 87 | | 1,033 | | 1,120 | | 13 | | 199 | | 134 | | — | | 1,466 | | 523 | | 1,989 | |
| End of 2020 | 35 | | 1,049 | | 1,084 | | — | | 227 | | 45 | | — | | 1,356 | | 431 | | 1,787 | |
| End of 2021 | 46 | | 1,558 | | 1,604 | | 53 | | 89 | | 76 | | — | | 1,822 | | 493 | | 2,315 | |
| End of 2022 | 28 | | 2,114 | | 2,142 | | 30 | | 221 | | 4 | | — | | 2,397 | | 1,779 | | 4,176 | |
| | Undeveloped | |
| | Undeveloped | |
| | End of 2020 | |
| | End of 2020 | |
| | End of 2020 | |
| End of 2021 | |
| End of 2022 | |
| End of 2023 | |
|
*All Equity Affiliate reserves are located in our Asia Pacific/Middle East Region.
Natural gas production in the reserves table may differ from gas production (delivered for sale) in our statistics disclosure, primarily because the quantities above include gas consumed in production operations. Quantities consumed in production operations are not significant in the periods presented. The value of net production consumed in operations is not reflected in net revenues and production expenses, nor do the volumes impact the respective per unit metrics.
Reserve volumes include natural gas to be consumed in operations of 2,263 BCF, 2,416 BCF 2,748 BCF and 2,2862,748 BCF, as of December 31, 2023, 2022 2021 and 2020,2021, respectively. These volumes are not included in the calculation of our Standardized Measure of Discounted Future Net Cash Flows Relating to Proved Oil and Gas Reserve Quantities.
Natural gas reserves are computed at 14.65 pounds per square inch absolute and 60 degrees Fahrenheit.
| | | | | |
| 141 | ConocoPhillips 20222023 10-K | 140 |
Notable changes in proved natural gas reserves in the three years ended December 31, 2022,2023, included:
•Revisions: In 2023, upward revisions in Lower 48 were due to additional development drilling in the unconventional plays of 502 BCF, technical revisions of 268 BCF, partly offset by lower prices of 211 BCF and development plan downward revisions of 38 BCF. In Europe, technical revisions contributed 64 BCF and development drilling of 14 BCF, partially offset by lower prices of 5 BCF. In Canada, upward revisions were driven by technical revisions of 37 BCF, partially offset by lower prices of 10 BCF. In Alaska, where future production is constrained by the Trans-Alaska Pipeline System minimum flow limit, updated total North Slope development phasing indicated that the flow limit will be reached earlier than previously premised, resulting in downward revisions of 121 BCF. Further downward revisions in Alaska included 72 BCF from operating efficiencies resulting in less gas to be consumed in operations, 22 BCF due to lower prices, 14 BCF from cost escalation, and 14 BCF due to technical revisions. Downward revisions in Africa of 57 BCF due to infrastructure constraints and sales demand revisions. In our equity affiliates, downward revisions were due to lower prices of 288 BCF, offset by upward technical revisions of 198 BCF.
In 2022, upward revisions in Lower 48 were due to additional development drilling in the unconventional plays of 544 BCF, higher prices of 109 BCF, and technical revisions of 41 BCF. These were partially offset by decreases of 233 BCF due to increasing operating costs, and 100 BCF due to the continued conversion of acquired Concho Permian two-stream contracts to a three-stream (crude oil, natural gas and natural gas liquids) basis. Upward revisions in Canada were driven by higher prices of 26 BCF, partially offset by technical revisions of 18 BCF. In Europe, technical revisions contributed 96 BCF, and higher prices 12 BCF of upward revisions. Downward revisions in Africa were primarily due to technical revisions. In our equity affiliates in Asia Pacific/Middle East, upward revisions were due to higher prices of 423 BCF, changing dynamics and improved prices in the regional LNG spot market of 331 BCF, and technical revisions of 204 BCF, partially offset by downward revisions due to increasing operating costs of 60 BCF.
In 2021, upward revisions in Alaska were due to higher prices of 587 BCF and technical revisions of 128 BCF. In Lower 48, upward revisions of 614 BCF were due to higher prices, additional infill drilling in the unconventional plays of 277 BCF and technical revisions of 60 BCF, partially offset by downward revisions due to development timing for specific well locations from unconventional plays of 498 BCF and conversion of previously acquired Permian two-stream contracted volumes to a three-stream (crude oil, natural gas and natural gas liquids) basis of 412 BCF. Upward revisions in Canada were due to higher prices of 29 BCF, partially offset by downward revisions due to technical revisions of 14 BCF. In Europe, upward revisions were primarily due to higher prices. Upward revisions in our consolidated operations in Asia Pacific/Middle East were due to technical revisions of 76 BCF, partially offset by price revisions of 16 BCF. In our equity affiliates in Asia Pacific/Middle East, upward revisions were due to higher prices of 124 BCF and technical and cost revisions of 123 BCF.
In 2020, downward revisions in Alaska were primarily due to lower prices. In Lower 48, downward revisions of 372 BCF were due to lower prices and 154 BCF were due to development timing for specific well locations from unconventional plays, partially offset by technical revisions of 87 BCF. Downward revisions in our equity affiliates in Asia Pacific/Middle East were due to lower prices of 426 BCF, partially offset by performance revisions of 44 BCF. Upward revisions in our consolidated operations in Asia Pacific/Middle East were due to technical revisions of 88 BCF and price revisions of 15 BCF.
•Purchases: In 2022, purchases in Africa were a result of the acquisition of additional interest in the Libya Waha Concession. In our equity affiliates, purchases were due to the acquisition of additional affiliate interest in Asia Pacific.
In 2021, Lower 48 purchases were due to the Concho and Shell Permian acquisitions.
In 2020, Canada purchases were due to the acquisition of additional Montney acreage.
•Extensions and discoveries: In 2023, extensions and discoveries in Lower 48 were primarily within unconventional plays in the Permian Basin. Canada extensions and discoveries were in Montney. Extensions and discoveries in our equity affiliates were in Australia.
In 2022, extensions and discoveries in Lower 48 were primarily within unconventional plays in the Permian Basin. In Europe, extensions and discoveries were due to additional planned development. Extensions and discoveries in our equity affiliates were primarily in the Middle East.
In 2021, extensions and discoveries in Lower 48 were due to planned development to add specific well locations from the unconventional plays which more than offset the decreases resulting from development plan timing in the revisions category. Extensions and discoveries in Canada were primarily driven by ongoing drilling successes in Montney.
In 2020, extensions and discoveries in Lower 48 were due to planned development to add specific well locations from the unconventional plays which more than offset the decreases resulting from development plan timing in the revisions category. Extensions and discoveries in Canada were primarily driven by ongoing drilling successes in Montney.
•Sales: In 2023, Lower 48 sales represent the disposition of noncore assets.
In 2022, Lower 48 sales represent the disposition of noncore assets. Sales in our consolidated operations in Asia Pacific/Middle East represent the disposition of our Indonesia assets.
In 2021, Lower 48 sales represent the disposition of noncore assets.
In 2020, Asia Pacific/Middle East sales represent the disposition of the Australia-West assets.
| | | | | |
141ConocoPhillips 2023 10-K | ConocoPhillips 2022 10-K142 |
| Years Ended
December 31 | Years Ended
December 31 | Bitumen |
Millions of Barrels | Years Ended
December 31 | | Years Ended
December 31 | Bitumen |
| Millions of Barrels |
| Canada | |
| Developed and Undeveloped | |
| Developed and Undeveloped | |
| Developed and Undeveloped | |
| | Canada | Total Consolidated | Equity Affiliates* | Total |
| Developed and Undeveloped | |
| Consolidated operations | |
| End of 2019 | 282 | | 282 | | — | | 282 | |
| End of 2020 | |
| | End of 2020 | |
| | End of 2020 | |
| Revisions | |
| Revisions | |
| Revisions | Revisions | (15) | | (15) | | — | | (15) | |
| Improved recovery | Improved recovery | — | | — | | — | | — | |
| Improved recovery | |
| Improved recovery | |
| Purchases | |
| Purchases | |
| Purchases | Purchases | — | | — | | — | | — | |
| Extensions and discoveries | Extensions and discoveries | 85 | | 85 | | — | | 85 | |
| Extensions and discoveries | |
| Extensions and discoveries | |
| Production | |
| Production | |
| Production | Production | (20) | | (20) | | — | | (20) | |
| Sales | Sales | — | | — | | — | | — | |
| End of 2020 | 332 | | 332 | | — | | 332 | |
| Sales | |
| Sales | |
| End of 2021 | |
| End of 2021 | |
| End of 2021 | |
| Revisions | |
| Revisions | |
| Revisions | Revisions | (50) | | (50) | | — | | (50) | |
| Improved recovery | Improved recovery | — | | — | | — | | — | |
| Improved recovery | |
| Improved recovery | |
| Purchases | |
| Purchases | |
| Purchases | Purchases | — | | — | | — | | — | |
| Extensions and discoveries | Extensions and discoveries | — | | — | | — | | — | |
| Extensions and discoveries | |
| Extensions and discoveries | |
| Production | |
| Production | |
| Production | Production | (25) | | (25) | | — | | (25) | |
| Sales | Sales | — | | — | | — | | — | |
| End of 2021 | 257 | | 257 | | — | | 257 | |
| Sales | |
| Sales | |
| End of 2022 | |
| End of 2022 | |
| End of 2022 | |
| Revisions | |
| Revisions | |
| Revisions | Revisions | (17) | | (17) | | — | | (17) | |
| Improved recovery | Improved recovery | — | | — | | — | | — | |
| Improved recovery | |
| Improved recovery | |
| Purchases | |
| Purchases | |
| Purchases | Purchases | — | | — | | — | | — | |
| Extensions and discoveries | Extensions and discoveries | — | | — | | — | | — | |
| Extensions and discoveries | |
| Extensions and discoveries | |
| Production | |
| Production | |
| Production | Production | (24) | | (24) | | — | | (24) | |
| Sales | Sales | — | | — | | — | | — | |
| End of 2022 | 216 | | 216 | | — | | 216 | |
| Sales | |
| Sales | |
| End of 2023 | |
| End of 2023 | |
| End of 2023 | |
| | |
| Years Ended
December 31 | Years Ended
December 31 | Bitumen |
Millions of Barrels | Years Ended
December 31 | | Years Ended
December 31 | Bitumen |
| Millions of Barrels |
| Canada | |
| Developed | |
| Developed | |
| Developed | |
| | Canada | Total Consolidated | Equity Affiliates* | Total |
| Developed | |
| Consolidated operations | |
| End of 2019 | 187 | | 187 | | — | | 187 | |
| End of 2020 | |
| | End of 2020 | |
| | End of 2020 | End of 2020 | 117 | | 117 | | — | | 117 | |
| End of 2021 | End of 2021 | 150 | | 150 | | — | | 150 | |
| End of 2021 | |
| End of 2021 | |
| End of 2022 | End of 2022 | 127 | | 127 | | — | | 127 | |
| End of 2022 | |
| End of 2022 | |
| End of 2023 | |
| End of 2023 | |
| End of 2023 | |
| | | Undeveloped | Undeveloped | |
| Consolidated operations | |
| End of 2019 | 95 | | 95 | | — | | 95 | |
| End of 2020 | 215 | | 215 | | — | | 215 | |
| End of 2021 | 107 | | 107 | | — | | 107 | |
| End of 2022 | 89 | | 89 | | — | | 89 | |
| | | Undeveloped | |
| | Undeveloped | |
| | End of 2020 | |
| | End of 2020 | |
| | End of 2020 | |
| End of 2021 | |
| End of 2021 | |
| End of 2021 | |
| End of 2022 | |
| End of 2022 | |
| End of 2022 | |
| End of 2023 | |
| End of 2023 | |
| End of 2023 | |
|
*AllThere are no Bitumen reserves associated with our Equity Affiliate reserves are located in our Asia Pacific/Middle East Region.
| | | | | |
ConocoPhillips 2022 10-K | 142 |
Notable changes in proved bitumen reserves in the three years ended December 31, 2022,2023, included:
•Revisions: In 2023, the upward revision of 15 million barrels is primarily due to the impact of price on variable royalties.
In 2022, the impact of variable royalties on price resulted in downward revisions of 30 million barrels, partially offset by upward revisions primarily due to changes in development timing for specific pad locations from the Surmont development program.
In 2021, downward revisions of 64 million barrels were driven by changes in carbon tax costs and 39 million barrels due to changes in development timing for specific pad locations from the Surmont development program, partially offset by upward revisions from price of 53 million barrels.
•Purchases:In 2020, downward revisions2023, purchases in Canada were due to changes in development timing for specific pad locations froma result of the Surmont development programacquisition of 12 million barrels with the remaining revisions primarily related to lower prices.50 percent working interest in Surmont.
•Extensions and discoveries: In 2021, extensions and discoveries in Canada were primarily due to planned development to add specific pad locations from the Surmont development program, which more than offset the decrease in the revisions category.
In 2020, extensions and discoveries in Canada were due to planned development to add specific pad locations from the Surmont development program, which offset the decrease in the revisions category of 31 million barrels.
| | | | | |
| 143 | ConocoPhillips 20222023 10-K |
| Years Ended
December 31 | Years Ended
December 31 | Total Proved Reserves | Years Ended
December 31 | Total Proved Reserves |
| Millions of Barrels of Oil Equivalent | Millions of Barrels of Oil Equivalent |
| Alaska | | | Alaska | Lower
48 | Total
U.S. | Canada | Europe | Asia Pacific/
Middle East | Africa | Total Consolidated Operations | Equity Affiliates* | Total |
| Developed and Undeveloped | |
| | Alaska | Lower
48 | Total
U.S. | Canada | Europe | Asia Pacific/
Middle East | Africa | Total Consolidated | Equity Affiliates* | Total |
| Developed and Undeveloped | |
| Consolidated operations | |
| End of 2019 | 1,779 | | 1,447 | | 3,226 | | 296 | | 360 | | 298 | | 234 | | 4,414 | | 848 | | 5,262 | |
| Revisions | (398) | | (226) | | (624) | | (20) | | 12 | | 13 | | (3) | | (622) | | (63) | | (685) | |
| Improved recovery | — | | — | | — | | — | | — | | 3 | | — | | 3 | | — | | 3 | |
| Purchases | — | | 19 | | 19 | | 10 | | — | | — | | — | | 29 | | — | | 29 | |
| Extensions and discoveries | 10 | | 200 | | 210 | | 95 | | — | | — | | — | | 305 | | 13 | | 318 | |
| Production | (85) | | (142) | | (227) | | (25) | | (49) | | (55) | | (3) | | (359) | | (73) | | (432) | |
| Sales | — | | (25) | | (25) | | (1) | | — | | (10) | | — | | (36) | | — | | (36) | |
| End of 2020 | |
| | End of 2020 | |
| | End of 2020 | End of 2020 | 1,306 | | 1,273 | | 2,579 | | 355 | | 323 | | 249 | | 228 | | 3,734 | | 725 | | 4,459 | |
| Revisions | Revisions | 322 | | 168 | | 490 | | (45) | | 23 | | 47 | | 6 | | 521 | | 42 | | 563 | |
| Improved recovery | Improved recovery | 1 | | — | | 1 | | — | | — | | — | | — | | 1 | | — | | 1 | |
| Purchases | Purchases | — | | 1,169 | | 1,169 | | — | | — | | — | | — | | 1,169 | | — | | 1,169 | |
| Extensions and discoveries | Extensions and discoveries | 10 | | 508 | | 518 | | 15 | | 3 | | 1 | | — | | 537 | | 19 | | 556 | |
| Production | Production | (84) | | (289) | | (373) | | (35) | | (50) | | (48) | | (14) | | (520) | | (73) | | (593) | |
| Sales | Sales | — | | (54) | | (54) | | — | | — | | — | | — | | (54) | | — | | (54) | |
| End of 2021 | End of 2021 | 1,555 | | 2,775 | | 4,330 | | 290 | | 299 | | 249 | | 220 | | 5,388 | | 713 | | 6,101 | |
| Revisions | Revisions | (35) | | 292 | | 257 | | (15) | | 52 | | 19 | | (5) | | 308 | | 149 | | 457 | |
| Improved recovery | Improved recovery | — | | — | | — | | — | | — | | 3 | | — | | 3 | | — | | 3 | |
| Purchases | Purchases | — | | 13 | | 13 | | — | | — | | — | | 50 | | 63 | | 80 | | 143 | |
| Extensions and discoveries | Extensions and discoveries | 15 | | 414 | | 429 | | 1 | | 26 | | — | | — | | 456 | | 241 | | 697 | |
| Production | Production | (85) | | (364) | | (449) | | (31) | | (46) | | (31) | | (15) | | (572) | | (81) | | (653) | |
| Sales | Sales | — | | (82) | | (82) | | — | | — | | (67) | | — | | (149) | | — | | (149) | |
| End of 2022 | End of 2022 | 1,450 | | 3,048 | | 4,498 | | 245 | | 331 | | 173 | | 250 | | 5,497 | | 1,102 | | 6,599 | |
| Revisions | |
| Improved recovery | |
| Purchases | |
| Extensions and discoveries | |
| Production | |
| Sales | |
| End of 2023 | |
| | |
| Years Ended
December 31 | Years Ended
December 31 | Total Proved Reserves | Years Ended
December 31 | Total Proved Reserves |
| Millions of Barrels of Oil Equivalent | Millions of Barrels of Oil Equivalent |
| Alaska | Lower
48 | Total
U.S. | Canada | Europe | Asia Pacific/
Middle East | Africa | Total Consolidated | Equity Affiliates* | Total | Alaska | Lower
48 | Total
U.S. | Canada | Europe | Asia Pacific/
Middle East | Africa | Total Consolidated Operations | Equity Affiliates* | Total |
| Developed | Developed | |
| Consolidated operations | |
| End of 2019 | 1,582 | | 666 | | 2,248 | | 197 | | 275 | | 236 | | 218 | | 3,174 | | 761 | | 3,935 | |
| | End of 2020 | |
| | End of 2020 | |
| | End of 2020 | End of 2020 | 1,186 | | 521 | | 1,707 | | 140 | | 238 | | 211 | | 212 | | 2,508 | | 653 | | 3,161 | |
| End of 2021 | End of 2021 | 1,424 | | 1,767 | | 3,191 | | 166 | | 244 | | 212 | | 207 | | 4,020 | | 631 | | 4,651 | |
| End of 2022 | End of 2022 | 1,357 | | 1,676 | | 3,033 | | 147 | | 240 | | 155 | | 231 | | 3,806 | | 751 | | 4,557 | |
| End of 2023 | |
| | | Undeveloped | Undeveloped | |
| Consolidated operations | |
| End of 2019 | 197 | | 781 | | 978 | | 99 | | 85 | | 62 | | 16 | | 1,240 | | 87 | | 1,327 | |
| End of 2020 | 120 | | 752 | | 872 | | 215 | | 85 | | 38 | | 16 | | 1,226 | | 72 | | 1,298 | |
| End of 2021 | 131 | | 1,008 | | 1,139 | | 124 | | 55 | | 37 | | 13 | | 1,368 | | 82 | | 1,450 | |
| End of 2022 | 93 | | 1,372 | | 1,465 | | 98 | | 91 | | 18 | | 19 | | 1,691 | | 351 | | 2,042 | |
| | Undeveloped | |
| | Undeveloped | |
| | End of 2020 | |
| | End of 2020 | |
| | End of 2020 | |
| End of 2021 | |
| End of 2022 | |
| End of 2023 | |
|
*All Equity Affiliate reserves are located in our Asia Pacific/Middle East Region.
Natural gas reserves are converted to barrels of oil equivalent (BOE) based on a 6:1 ratio: six MCF of natural gas converts to one BOE.
| | | | | |
ConocoPhillips 20222023 10-K | 144 |
Proved Undeveloped Reserves
The following table shows changes in total proved undeveloped reserves for 2022:2023:
| | | | | |
| Proved Undeveloped Reserves |
| Millions of Barrels of Oil Equivalent |
End of 20212022 | 1,4502,042 | |
| Revisions | 344354 | |
| Improved recovery | 3— | |
| Purchases | 3360 | |
| Extensions and discoveries | 627335 | |
| Sales | (24)(10) | |
| Transfers to Proved Developed | (391)(447) | |
End of 20222023 | 2,0422,334 | |
Revisions of 354 MMBOE were predominantlypredominately driven by changes inprogression of development plans in the Lower 48.
Extensions and discoveries were largely driven by the addition of 344219 MMBOE in Alaska, primarily due to Willow and Nuna projects, 44 MMBOE in the Lower 48 unconventional plays and 39 MMBOE in Canada for the continued development of unconventional plays. Equity affiliates, primarily in the Middle East, contributed 241 MMBOE.Montney development. The remaining extensions and discoveries were driven by the continued development planned in the other geographic regions.
Transfers to proved developed reserves were driven by the ongoing development of our assets. Approximately 8275 percent of the transfers were from the development of our Lower 48 unconventional plays. The remainder of transfers were from development across the other geographic regions.
At December 31, 2022,2023, our PUDs represented 3135 percent of total proved reserves, compared with 2431 percent at December 31, 2021.2022. Costs incurred for the year ended December 31, 2022,2023, relating to the development of PUDs were $5.7$7.9 billion. A portion of our costs incurred each year relates to development projects where the PUDs will be converted to proved developed reserves in future years.
At the end of 2022,2023, approximately 9386 percent of total PUDs were under development or scheduled for development within five years of initial disclosure, including all of our Lower 48 PUDs. Increases in 2023 to PUDs scheduled for development beyond five years are primarily in Alaska, due to the initial recognition of PUDs associated with the Willow project, a development that is currently underway with production anticipated in 2029 due to its large scale and remote location. The remaining PUDs to be developed beyond five years are in major development areas which are currently producing and predominantlylocated within our Canada and Asia Pacific/Middle East geographic areas.
Results of Operations
The company’s results of operations from oil and gas activities for the years 2023, 2022 2021 and 20202021 are shown in the following tables. Non-oil and gas activities, such as pipeline and marine operations, LNG operations, crude oil and gas marketing activities, and the profit element of transportation operations in which we have an ownership interest are excluded. Additional information about selected line items within the results of operations tables is shown below:
•Sales include sales to unaffiliated entities attributable primarily to the company’s net working interests and royalty interests. Sales are net of fees to transport our produced hydrocarbons beyond the production function to a final delivery point using transportation operations which are not consolidated.
•Transportation costs reflect fees to transport our produced hydrocarbons beyond the production function to a final delivery point using transportation operations which are consolidated.
•Other revenues include gains and losses from asset sales, certain amounts resulting from the purchase and sale of hydrocarbons, and other miscellaneous income.
•Production costs include costs incurred to operate and maintain wells, related equipment and facilities used in the production of petroleum liquids and natural gas.
•Taxes other than income taxes include production, property and other non-income taxes.
•Depreciation of support equipment is reclassified as applicable.
•Other related expenses include inventory fluctuations, foreign currency transaction gains and losses and other miscellaneous expenses.
| | | | | |
| 145 | ConocoPhillips 20222023 10-K |
Results of Operations
| Year Ended
December 31,2022 | Millions of Dollars |
| Alaska | Lower
48 | Total
U.S. | Canada | Europe | Asia Pacific/
Middle East | Africa | Other
Areas | Total |
Year Ended
December 31, 2023 | | Year Ended
December 31, 2023 | Millions of Dollars |
| Alaska | Lower
48 | Total
U.S. | Canada | Europe | Asia Pacific/
Middle East | Africa | Other
Areas | Total |
| Consolidated operations | Consolidated operations | |
| Sales | |
| Sales | |
| Sales | Sales | $ | 7,210 | | 24,309 | | 31,519 | | 1,622 | | 6,594 | | 2,602 | | 1,339 | | — | | 43,676 | |
| Transfers | Transfers | 6 | | — | | 6 | | — | | — | | — | | — | | — | | 6 | |
| Transportation costs | Transportation costs | (647) | | — | | (647) | | — | | — | | — | | — | | — | | (647) | |
| Other revenues | Other revenues | (1) | | 115 | | 114 | | 338 | | 1 | | 536 | | 184 | | 10 | | 1,183 | |
| Total revenues | Total revenues | 6,568 | | 24,424 | | 30,992 | | 1,960 | | 6,595 | | 3,138 | | 1,523 | | 10 | | 44,218 | |
| Production costs excluding taxes | Production costs excluding taxes | 1,160 | | 3,600 | | 4,760 | | 581 | | 511 | | 342 | | 55 | | — | | 6,249 | |
| Taxes other than income taxes | Taxes other than income taxes | 1,265 | | 1,687 | | 2,952 | | 21 | | 36 | | 243 | | 2 | | — | | 3,254 | |
| Exploration expenses | Exploration expenses | 34 | | 189 | | 223 | | 149 | | 122 | | 49 | | 19 | | 2 | | 564 | |
| Depreciation, depletion and amortization | Depreciation, depletion and amortization | 833 | | 4,843 | | 5,676 | | 354 | | 693 | | 517 | | 36 | | — | | 7,276 | |
| Impairments | Impairments | 2 | | (11) | | (9) | | (2) | | (1) | | — | | — | | — | | (12) | |
| Other related expenses | Other related expenses | (19) | | 4 | | (15) | | (41) | | (178) | | 40 | | 5 | | 6 | | (183) | |
| Accretion | Accretion | 78 | | 55 | | 133 | | 11 | | 62 | | 25 | | — | | — | | 231 | |
| 3,215 | | 14,057 | | 17,272 | | 887 | | 5,350 | | 1,922 | | 1,406 | | 2 | | 26,839 | |
| 2,449 | |
| Income tax provision (benefit) | Income tax provision (benefit) | 866 | | 3,113 | | 3,979 | | 198 | | 4,057 | | 512 | | 1,301 | | 53 | | 10,100 | |
| Results of operations | Results of operations | $ | 2,349 | | 10,944 | | 13,293 | | 689 | | 1,293 | | 1,410 | | 105 | | (51) | | 16,739 | |
| Equity affiliates | Equity affiliates | |
| Sales | |
| Sales | |
| Sales | Sales | $ | — | | — | | — | | — | | — | | 1,000 | | — | | — | | 1,000 | |
| Transfers | Transfers | — | | — | | — | | — | | — | | 4,272 | | — | | — | | 4,272 | |
| Transportation costs | Transportation costs | — | | — | | — | | — | | — | | — | | — | | — | | — | |
| Other revenues | Other revenues | — | | — | | — | | — | | — | | 41 | | — | | — | | 41 | |
| Total revenues | Total revenues | — | | — | | — | | — | | — | | 5,313 | | — | | — | | 5,313 | |
| Production costs excluding taxes | Production costs excluding taxes | — | | — | | — | | — | | — | | 491 | | — | | — | | 491 | |
| Taxes other than income taxes | Taxes other than income taxes | — | | — | | — | | — | | — | | 1,536 | | — | | — | | 1,536 | |
| Exploration expenses | Exploration expenses | — | | — | | — | | — | | — | | — | | — | | — | | — | |
| Depreciation, depletion and amortization | Depreciation, depletion and amortization | — | | — | | — | | — | | — | | 530 | | | 530 | |
| Impairments | Impairments | — | | — | | — | | — | | — | | — | | — | | — | | — | |
| Other related expenses | Other related expenses | — | | — | | — | | — | | — | | (2) | | — | | — | | (2) | |
| Accretion | Accretion | — | | — | | — | | — | | — | | 27 | | — | | — | | 27 | |
| — | | — | | — | | — | | — | | 2,731 | | — | | — | | 2,731 | |
| — | |
| Income tax provision (benefit) | Income tax provision (benefit) | — | | — | | — | | — | | — | | 836 | | — | | — | | 836 | |
| Results of operations | Results of operations | $ | — | | — | | — | | — | | — | | 1,895 | | — | | — | | 1,895 | |
| | | | | |
ConocoPhillips 20222023 10-K | 146 |
| Year Ended
December 31,2021 | Millions of Dollars |
| Alaska | Lower
48 | Total
U.S. | Canada | Europe | Asia Pacific/
Middle East | Africa | Other
Areas | Total |
Year Ended
December 31,2022 | | Year Ended
December 31,2022 | Millions of Dollars |
| Alaska | Lower
48 | Total
U.S. | Canada | Europe | Asia Pacific/
Middle East | Africa | Other
Areas | Total |
| Consolidated operations | Consolidated operations | |
| Sales | |
| Sales | |
| Sales | Sales | $ | 4,832 | | 14,093 | | 18,925 | | 1,219 | | 3,568 | | 2,525 | | 917 | | — | | 27,154 | |
| Transfers | Transfers | 4 | | — | | 4 | | — | | — | | — | | — | | — | | 4 | |
| Transportation costs | Transportation costs | (626) | | — | | (626) | | — | | — | | — | | — | | — | | (626) | |
| Other revenues | Other revenues | 14 | | 135 | | 149 | | 323 | | (5) | | 237 | | 141 | | (161) | | 684 | |
| Total revenues | Total revenues | 4,224 | | 14,228 | | 18,452 | | 1,542 | | 3,563 | | 2,762 | | 1,058 | | (161) | | 27,216 | |
| Production costs excluding taxes | Production costs excluding taxes | 1,073 | | 2,414 | | 3,487 | | 518 | | 487 | | 466 | | 43 | | — | | 5,001 | |
| Taxes other than income taxes | Taxes other than income taxes | 442 | | 937 | | 1,379 | | 23 | | 36 | | 91 | | 1 | | 1 | | 1,531 | |
| Exploration expenses | Exploration expenses | 80 | | 98 | | 178 | | 39 | | 21 | | 51 | | 2 | | 15 | | 306 | |
| Depreciation, depletion and amortization | Depreciation, depletion and amortization | 864 | | 4,053 | | 4,917 | | 383 | | 844 | | 787 | | 35 | | — | | 6,966 | |
| Impairments | Impairments | 5 | | (8) | | (3) | | 6 | | (24) | | 7 | | — | | — | | (14) | |
| Other related expenses | Other related expenses | (31) | | 12 | | (19) | | (22) | | (42) | | 4 | | 4 | | 12 | | (63) | |
| Accretion | Accretion | 71 | | 47 | | 118 | | 10 | | 70 | | 26 | | — | | — | | 224 | |
| 1,720 | | 6,675 | | 8,395 | | 585 | | 2,171 | | 1,330 | | 973 | | (189) | | 13,265 | |
| 3,215 | |
| Income tax provision (benefit) | Income tax provision (benefit) | 378 | | 1,467 | | 1,845 | | 145 | | 1,673 | | 494 | | 870 | | (53) | | 4,974 | |
| Results of operations | Results of operations | $ | 1,342 | | 5,208 | | 6,550 | | 440 | | 498 | | 836 | | 103 | | (136) | | 8,291 | |
| Equity affiliates | Equity affiliates | |
| Sales | |
| Sales | |
| Sales | Sales | $ | — | | — | | — | | — | | — | | 745 | | — | | — | | 745 | |
| Transfers | Transfers | — | | — | | — | | — | | — | | 1,797 | | — | | — | | 1,797 | |
| Transportation costs | Transportation costs | — | | — | | — | | — | | — | | — | | — | | — | | — | |
| Other revenues | Other revenues | — | | — | | — | | — | | — | | 5 | | — | | — | | 5 | |
| Total revenues | Total revenues | — | | — | | — | | — | | — | | 2,547 | | — | | — | | 2,547 | |
| Production costs excluding taxes | Production costs excluding taxes | — | | — | | — | | — | | — | | 329 | | — | | — | | 329 | |
| Taxes other than income taxes | Taxes other than income taxes | — | | — | | — | | — | | — | | 824 | | — | | — | | 824 | |
| Exploration expenses | Exploration expenses | — | | — | | — | | — | | — | | 268 | | — | | — | | 268 | |
| Depreciation, depletion and amortization | Depreciation, depletion and amortization | — | | — | | — | | — | | — | | 593 | | | 593 | |
| Impairments | Impairments | — | | — | | — | | — | | — | | 718 | | — | | — | | 718 | |
| Other related expenses | Other related expenses | — | | — | | — | | — | | — | | 3 | | — | | — | | 3 | |
| Accretion | Accretion | — | | — | | — | | — | | — | | 17 | | — | | — | | 17 | |
| — | | — | | — | | — | | — | | (205) | | — | | — | | (205) | |
| — | |
| Income tax provision (benefit) | Income tax provision (benefit) | — | | — | | — | | — | | — | | (42) | | — | | — | | (42) | |
| Results of operations | Results of operations | $ | — | | — | | — | | — | | — | | (163) | | — | | — | | (163) | |
| | | | | |
| 147 | ConocoPhillips 20222023 10-K |
| Year Ended
December 31,2020 | Millions of Dollars |
| Alaska | Lower
48 | Total
U.S. | Canada | Europe | Asia Pacific/
Middle East | Africa | Other
Areas | Total |
Year Ended
December 31,2021 | | Year Ended
December 31,2021 | Millions of Dollars |
| Alaska | Lower
48 | Total
U.S. | Canada | Europe | Asia Pacific/
Middle East | Africa | Other
Areas | Total |
| Consolidated operations | Consolidated operations | |
| Sales | |
| Sales | |
| Sales | Sales | $ | 2,944 | | 3,421 | | 6,365 | | 230 | | 1,560 | | 1,717 | | 129 | | — | | 10,001 | |
| Transfers | Transfers | 4 | | — | | 4 | | — | | — | | 191 | | — | | — | | 195 | |
| Transportation costs | Transportation costs | (587) | | — | | (587) | | — | | — | | (19) | | — | | — | | (606) | |
| Other revenues | Other revenues | (1) | | (20) | | (21) | | 40 | | (21) | | 576 | | 11 | | 10 | | 595 | |
| Total revenues | Total revenues | 2,360 | | 3,401 | | 5,761 | | 270 | | 1,539 | | 2,465 | | 140 | | 10 | | 10,185 | |
| Production costs excluding taxes | Production costs excluding taxes | 1,058 | | 1,399 | | 2,457 | | 366 | | 417 | | 478 | | 21 | | 2 | | 3,741 | |
| Taxes other than income taxes | Taxes other than income taxes | 296 | | 263 | | 559 | | 16 | | 30 | | 42 | | 3 | | 1 | | 651 | |
| Exploration expenses | Exploration expenses | 1,099 | | 73 | | 1,172 | | 40 | | 52 | | 71 | | 13 | | 108 | | 1,456 | |
| Depreciation, depletion and amortization | Depreciation, depletion and amortization | 840 | | 2,544 | | 3,384 | | 335 | | 755 | | 808 | | 8 | | — | | 5,290 | |
| Impairments | Impairments | — | | 804 | | 804 | | 3 | | 5 | | — | | — | | — | | 812 | |
| Other related expenses | Other related expenses | 46 | | 5 | | 51 | | 5 | | (58) | | (25) | | (29) | | 2 | | (54) | |
| Accretion | Accretion | 72 | | 46 | | 118 | | 8 | | 73 | | 33 | | — | | — | | 232 | |
| (1,051) | | (1,733) | | (2,784) | | (503) | | 265 | | 1,058 | | 124 | | (103) | | (1,943) | |
| 1,720 | |
| Income tax provision (benefit) | Income tax provision (benefit) | (271) | | (430) | | (701) | | (191) | | 116 | | 277 | | 88 | | (20) | | (431) | |
| Results of operations | Results of operations | $ | (780) | | (1,303) | | (2,083) | | (312) | | 149 | | 781 | | 36 | | (83) | | (1,512) | |
| Equity affiliates | Equity affiliates | |
| Sales | |
| Sales | |
| Sales | Sales | $ | — | | — | | — | | — | | — | | 483 | | — | | — | | 483 | |
| Transfers | Transfers | — | | — | | — | | — | | — | | 1,205 | | — | | — | | 1,205 | |
| Transportation costs | Transportation costs | — | | — | | — | | — | | — | | — | | — | | — | | — | |
| Other revenues | Other revenues | — | | — | | — | | — | | — | | 8 | | — | | — | | 8 | |
| Total revenues | Total revenues | — | | — | | — | | — | | — | | 1,696 | | — | | — | | 1,696 | |
| Production costs excluding taxes | Production costs excluding taxes | — | | — | | — | | — | | — | | 289 | | — | | — | | 289 | |
| Taxes other than income taxes | Taxes other than income taxes | — | | — | | — | | — | | — | | 502 | | — | | — | | 502 | |
| Exploration expenses | Exploration expenses | — | | — | | — | | — | | — | | 20 | | — | | — | | 20 | |
| Depreciation, depletion and amortization | Depreciation, depletion and amortization | — | | — | | — | | — | | — | | 569 | | | 569 | |
| Impairments | Impairments | — | | — | | — | | — | | — | | — | | — | | — | | — | |
| Other related expenses | Other related expenses | — | | — | | — | | — | | — | | (2) | | — | | — | | (2) | |
| Accretion | Accretion | — | | — | | — | | — | | — | | 15 | | — | | — | | 15 | |
| — | | — | | — | | — | | — | | 303 | | — | | — | | 303 | |
| — | |
| Income tax provision (benefit) | Income tax provision (benefit) | — | | — | | — | | — | | — | | 39 | | — | | — | | 39 | |
| Results of operations | Results of operations | $ | — | | — | | — | | — | | — | | 264 | | — | | — | | 264 | |
| | | | | |
ConocoPhillips 20222023 10-K | 148 |
Statistics
| | Net Production | Net Production | 2022 | 2021 | 2020 | Net Production | 2023 | 2022 | 2021 |
| Thousands of Barrels Daily |
| Thousands of Barrels Daily | | | Thousands of Barrels Daily |
| Crude Oil | Crude Oil | |
| Consolidated operations | Consolidated operations | |
| Consolidated operations | |
| Consolidated operations | |
| Alaska | |
| Alaska | |
| Alaska | Alaska | 177 | | 178 | | 181 | |
| Lower 48 | Lower 48 | 534 | | 447 | | 213 | |
| United States | United States | 711 | | 625 | | 394 | |
| Canada | Canada | 6 | | 8 | | 6 | |
| Europe | Europe | 71 | | 81 | | 78 | |
| Asia Pacific | Asia Pacific | 61 | | 65 | | 69 | |
| Africa | Africa | 36 | | 37 | | 8 | |
| Total consolidated operations | Total consolidated operations | 885 | | 816 | | 555 | |
| Equity affiliates—Asia Pacific/Middle East | Equity affiliates—Asia Pacific/Middle East | 13 | | 13 | | 13 | |
| Total company | Total company | 898 | | 829 | | 568 | |
| Delaware Basin Area (Lower 48)* | Delaware Basin Area (Lower 48)* | 258 | | 162 | | 28 | |
| Greater Prudhoe Area (Alaska)* | Greater Prudhoe Area (Alaska)* | 67 | | 67 | | 68 | |
| | Natural Gas Liquids | Natural Gas Liquids | |
| Natural Gas Liquids | |
| Natural Gas Liquids | |
| Consolidated operations | Consolidated operations | |
| Consolidated operations | |
| Consolidated operations | |
| Alaska | |
| Alaska | |
| Alaska | Alaska | 17 | | 16 | | 16 | |
| Lower 48 | Lower 48 | 221 | | 110 | | 74 | |
| United States | United States | 238 | | 126 | | 90 | |
| Canada | Canada | 3 | | 4 | | 2 | |
| Europe | Europe | 3 | | 4 | | 4 | |
| Asia Pacific | Asia Pacific | — | | — | | 1 | |
| Total consolidated operations | Total consolidated operations | 244 | | 134 | | 97 | |
| Equity affiliates—Asia Pacific/Middle East | Equity affiliates—Asia Pacific/Middle East | 8 | | 8 | | 8 | |
| Total company | Total company | 252 | | 142 | | 105 | |
| Delaware Basin Area (Lower 48)* | Delaware Basin Area (Lower 48)* | 114 | | 27 | | 11 | |
| Greater Prudhoe Area (Alaska)* | Greater Prudhoe Area (Alaska)* | 17 | | 16 | | 15 | |
| | Bitumen | Bitumen | |
| Bitumen | |
| Bitumen | |
| Consolidated operations—Canada | |
| Consolidated operations—Canada | |
| Consolidated operations—Canada | Consolidated operations—Canada | 66 | | 69 | | 55 | |
| Total company | Total company | 66 | | 69 | | 55 | |
| | Natural Gas | Natural Gas | Millions of Cubic Feet Daily |
| Natural Gas | |
| Natural Gas | | Millions of Cubic Feet Daily |
| Consolidated operations | Consolidated operations | |
| Alaska | |
| Alaska | |
| Alaska | Alaska | 34 | | 16 | | 10 | |
| Lower 48 | Lower 48 | 1,402 | | 1,340 | | 585 | |
| United States | United States | 1,436 | | 1,356 | | 595 | |
| Canada | Canada | 61 | | 80 | | 40 | |
| Europe | Europe | 306 | | 298 | | 270 | |
| Asia Pacific | Asia Pacific | 114 | | 360 | | 429 | |
| Africa | Africa | 22 | | 15 | | 5 | |
| Total consolidated operations | Total consolidated operations | 1,939 | | 2,109 | | 1,339 | |
| Equity affiliates—Asia Pacific/Middle East | Equity affiliates—Asia Pacific/Middle East | 1,191 | | 1,053 | | 1,055 | |
| Total company | Total company | 3,130 | | 3,162 | | 2,394 | |
| Delaware Basin Area (Lower 48)* | Delaware Basin Area (Lower 48)* | 752 | | 584 | | 99 | |
| Greater Prudhoe Area (Alaska)* | Greater Prudhoe Area (Alaska)* | 32 | | 12 | | 4 | |
*At year-end 2023, 2022 and 2021, the Delaware Basin Area in Lower 48 contained more than 15 percent of our total proved reserves. At year-end 2021, and 2020, the Greater Prudhoe Area in Alaska contained more than 15 percent of our total proved reserves.
| | | | | |
| 149 | ConocoPhillips 20222023 10-K |
| | Average Sales Prices | Average Sales Prices | 2022 | 2021 | 2020 | Average Sales Prices | 2023 | 2022 | 2021 |
| | Crude Oil Per Barrel | Crude Oil Per Barrel | |
| Crude Oil Per Barrel | |
| Crude Oil Per Barrel | |
| Consolidated operations | Consolidated operations | |
| Consolidated operations | |
| Consolidated operations | |
| Alaska* | |
| Alaska* | |
| Alaska* | Alaska* | $ | 92.58 | | 60.81 | | 33.72 | |
| Lower 48 | Lower 48 | 94.46 | | 66.12 | | 35.17 | |
| United States | United States | 93.96 | | 64.53 | | 34.48 | |
| Canada | Canada | 79.94 | | 56.38 | | 23.57 | |
| Europe | Europe | 99.88 | | 68.94 | | 42.80 | |
| Asia Pacific | Asia Pacific | 105.52 | | 70.36 | | 42.84 | |
| Africa | Africa | 97.85 | | 69.06 | | 48.64 | |
| Total international | Total international | 100.75 | | 68.85 | | 42.39 | |
| Total consolidated operations | Total consolidated operations | 95.27 | | 65.53 | | 36.69 | |
| Equity affiliates—Asia Pacific/Middle East | Equity affiliates—Asia Pacific/Middle East | 97.31 | | 69.45 | | 39.02 | |
| Total operations | Total operations | 95.30 | | 65.59 | | 36.75 | |
| | Natural Gas Liquids Per Barrel | Natural Gas Liquids Per Barrel | |
| Natural Gas Liquids Per Barrel | |
| Natural Gas Liquids Per Barrel | |
| Consolidated operations | Consolidated operations | |
| Consolidated operations | |
| Consolidated operations | |
| Lower 48 | |
| Lower 48 | |
| Lower 48 | Lower 48 | $ | 35.36 | | 30.63 | | 12.13 | |
| United States | United States | 35.36 | | 30.63 | | 12.13 | |
| Canada | Canada | 37.70 | | 31.18 | | 5.41 | |
| Europe | Europe | 54.52 | | 43.97 | | 23.27 | |
| Asia Pacific | — | | — | | 33.21 | |
| | Total international | |
| Total international | |
| Total international | Total international | 46.16 | | 37.50 | | 20.25 | |
| Total consolidated operations | Total consolidated operations | 35.67 | | 31.04 | | 12.90 | |
| Equity affiliates—Asia Pacific/Middle East | Equity affiliates—Asia Pacific/Middle East | 61.22 | | 54.16 | | 32.69 | |
| Total operations | Total operations | 36.50 | | 32.45 | | 14.61 | |
| | Bitumen Per Barrel | Bitumen Per Barrel | |
| Bitumen Per Barrel | |
| Bitumen Per Barrel | |
| Consolidated operations—Canada | |
| Consolidated operations—Canada | |
| Consolidated operations—Canada | Consolidated operations—Canada | $ | 55.56 | | 37.52 | | 8.02 ** |
| | Natural Gas Per Thousand Cubic Feet | Natural Gas Per Thousand Cubic Feet | |
| Natural Gas Per Thousand Cubic Feet | |
| Natural Gas Per Thousand Cubic Feet | |
| Consolidated operations | Consolidated operations | |
| Consolidated operations | |
| Consolidated operations | |
| Alaska | |
| Alaska | |
| Alaska | Alaska | $ | 3.64 | | 2.81 | | 2.91 | |
| Lower 48 | Lower 48 | 5.92 | | 4.38 | | 1.65 | |
| United States | United States | 5.92 | | 4.38 | | 1.66 | |
| Canada | 3.62 | | 2.54 | | 1.21 | |
| Canada** | |
| Europe | Europe | 35.33 | | 13.75 | | 3.23 | |
| Asia Pacific* | 5.84 | | 6.56 | | 5.27 | |
| Asia Pacific | |
| Africa | Africa | 6.59 | | 3.73 | | 3.71 | |
| Total international | Total international | 23.54 | | 8.91 | | 4.31 | |
| Total consolidated operations | Total consolidated operations | 10.56 | | 6.00 | | 3.13 | |
| Equity affiliates—Asia Pacific/Middle East | Equity affiliates—Asia Pacific/Middle East | 9.39 | | 5.31 | | 3.71 | |
| Total operations | Total operations | 10.60 | | 5.77 | | 3.38 | |
*Average sales prices for Alaska crude oil and Asia Pacific natural gas above reflectreflects a reduction for transportation costs in which we have an ownership interest that are incurred subsequent to the terminal point of the production function. Accordingly, the average sales prices differ from those discussed in Item 7 of Management's Discussion and Analysis of Financial Condition and Results of Operations.
**Average sales prices include unutilized transportation costs.
| | | | | |
ConocoPhillips 20222023 10-K | 150 |
| | 2022 | 2021 | 2020 |
| 2023 | | | 2023 | 2022 | 2021 |
| Average Production Costs Per Barrel of Oil Equivalent* | Average Production Costs Per Barrel of Oil Equivalent* | |
| Consolidated operations | Consolidated operations | |
| Consolidated operations | |
| Consolidated operations | |
| Alaska | |
| Alaska | |
| Alaska | Alaska | $ | 15.89 | | 14.92 | | 14.60 | |
| Lower 48 | Lower 48 | 9.97 | | 8.48 | | 9.93 | |
| United States | United States | 10.97 | | 9.78 | | 11.51 | |
| Canada | Canada | 18.73 | | 15.10 | | 14.29 | |
| Europe | Europe | 11.20 | | 9.88 | | 8.97 | |
| Asia Pacific | Asia Pacific | 11.71 | | 10.21 | | 9.26 | |
| Africa | Africa | 3.77 | | 2.95 | | 6.38 | |
| Total international | Total international | 12.36 | | 10.53 | | 10.11 | |
| Total consolidated operations | Total consolidated operations | 11.27 | | 9.99 | | 10.99 | |
| Equity affiliates—Asia Pacific/Middle East | Equity affiliates—Asia Pacific/Middle East | 6.14 | | 4.60 | | 4.01 | |
| | Average Production Costs Per Barrel—Bitumen | Average Production Costs Per Barrel—Bitumen | |
| Average Production Costs Per Barrel—Bitumen | |
| Average Production Costs Per Barrel—Bitumen | |
| Consolidated operations—Canada | |
| Consolidated operations—Canada | |
| Consolidated operations—Canada | Consolidated operations—Canada | $ | 17.62 | | 13.41 | | 12.45 | |
| | Taxes Other Than Income Taxes Per Barrel of Oil Equivalent | Taxes Other Than Income Taxes Per Barrel of Oil Equivalent | |
| Taxes Other Than Income Taxes Per Barrel of Oil Equivalent | |
| Taxes Other Than Income Taxes Per Barrel of Oil Equivalent | |
| Consolidated operations | Consolidated operations | |
| Consolidated operations | |
| Consolidated operations | |
| Alaska | |
| Alaska | |
| Alaska | Alaska | $ | 17.33 | | 6.15 | | 4.08 | |
| Lower 48 | Lower 48 | 4.67 | | 3.29 | | 1.87 | |
| United States | United States | 6.80 | | 3.87 | | 2.62 | |
| Canada | Canada | 0.68 | | 0.67 | | 0.62 | |
| Europe | Europe | 0.79 | | 0.73 | | 0.65 | |
| Asia Pacific | Asia Pacific | 8.32 | | 1.99 | | 0.81 | |
| Africa | Africa | 0.14 | | 0.07 | | 0.91 | |
| Total international | Total international | 2.51 | | 1.06 | | 0.72 | |
| Total consolidated operations | Total consolidated operations | 5.87 | | 3.06 | | 1.91 | |
| Equity affiliates—Asia Pacific/Middle East | Equity affiliates—Asia Pacific/Middle East | 19.22 | | 11.52 | | 6.96 | |
| | Depreciation, Depletion and Amortization Per Barrel of Oil Equivalent | Depreciation, Depletion and Amortization Per Barrel of Oil Equivalent | |
| Depreciation, Depletion and Amortization Per Barrel of Oil Equivalent | |
| Depreciation, Depletion and Amortization Per Barrel of Oil Equivalent | |
| Consolidated operations | Consolidated operations | |
| Consolidated operations | |
| Consolidated operations | |
| Alaska | |
| Alaska | |
| Alaska | Alaska | $ | 11.41 | | 12.02 | | 11.59 | |
| Lower 48 | Lower 48 | 13.42 | | 14.24 | | 18.05 | |
| United States | United States | 13.08 | | 13.79 | | 15.86 | |
| Canada | Canada | 11.41 | | 11.16 | | 13.08 | |
| Europe | Europe | 15.19 | | 17.13 | | 16.24 | |
| Asia Pacific | Asia Pacific | 17.71 | | 17.25 | | 15.66 | |
| Africa | Africa | 2.47 | | 2.40 | | 2.43 | |
| Total international | Total international | 13.28 | | 14.25 | | 15.01 | |
| Total consolidated operations | Total consolidated operations | 13.12 | | 13.92 | | 15.54 | |
| Equity affiliates—Asia Pacific/Middle East | Equity affiliates—Asia Pacific/Middle East | 6.63 | | 8.29 | | 7.89 | |
*Includes bitumen.
| | | | | |
| 151 | ConocoPhillips 20222023 10-K |
Development and Exploration Activities
The following two tables summarize our net interest in productive and dry exploratory and development wells in the years ended December 31, 2023, 2022 2021 and 2020.2021. A “development well” is a well drilled within the proved area of a reservoir to the depth of a stratigraphic horizon known to be productive. An “exploratory well” is a well drilled to find and produce crude oil or natural gas in an unknown field or a new reservoir within a proven field. Exploratory wells also include wells drilled in areas near or offsetting current production, or in areas where well density or production history have not achieved statistical certainty of results. Excluded from the exploratory well count are stratigraphic-type exploratory wells, primarily relating to oil sands delineation wells located in Canada and CBM test wells located in Asia Pacific/Middle East.
| | Net Wells Completed | Net Wells Completed | |
| Productive | | Dry |
| 2022 | 2021 | 2020 | | 2022 | 2021 | 2020 |
| Productive | |
| Productive | |
| Productive | | | Dry |
| 2023 | | | 2023 | 2022 | 2021 | | 2023 | 2022 | 2021 |
| Exploratory | Exploratory | | | |
| Consolidated operations | Consolidated operations | |
| Consolidated operations | |
| Consolidated operations | |
| Alaska | |
| Alaska | |
| Alaska | Alaska | — | | — | | — | | | — | | 1 | | 3 | |
| Lower 48 | Lower 48 | 118 | | 87 | | 3 | | | — | | — | | — | |
| United States | United States | 118 | | 87 | | 3 | | | — | | 1 | | 3 | |
| Canada | Canada | 6 | | 12 | | 23 | | | — | | — | | — | |
| Europe | Europe | — | | — | | — | | | 2 | | — | | * |
| Asia Pacific/Middle East | Asia Pacific/Middle East | — | | * | | 1 | | * | Asia Pacific/Middle East | — | | — | — | | * | * | | — | | 1 | 1 | | * | * |
| Africa | Africa | — | | — | | — | | | 3 | | — | | * |
| Other areas | Other areas | — | | — | | — | | | — | | — | | * |
| Total consolidated operations | Total consolidated operations | 124 | | 99 | | 26 | | | 6 | | 1 | | 3 | |
| Equity affiliates | Equity affiliates | | | |
| Asia Pacific/Middle East | Asia Pacific/Middle East | * | 3 | | 8 | | | — | | — | | — | |
| Asia Pacific/Middle East | |
| Asia Pacific/Middle East | |
| Total equity affiliates | Total equity affiliates | * | 3 | | 8 | | | — | | — | | — | |
| | Development | Development | |
| Development | |
| Development | |
| Consolidated operations | Consolidated operations | |
| Consolidated operations | |
| Consolidated operations | |
| Alaska | |
| Alaska | |
| Alaska | Alaska | 11 | | 1 | | 7 | | | — | | — | | — | |
| Lower 48 | Lower 48 | 388 | | 339 | | 127 | | | — | | — | | — | |
| United States | United States | 399 | | 340 | | 134 | | | — | | — | | — | |
| Canada | Canada | 11 | | 2 | | — | | | — | | — | | — | |
| Europe | Europe | 3 | | 7 | | 7 | | | — | | — | | — | |
| Asia Pacific/Middle East | Asia Pacific/Middle East | 22 | | 21 | | 16 | | | — | | — | | — | |
| Africa | Africa | 2 | | 1 | | 2 | | | — | | — | | — | |
| Other areas | Other areas | — | | — | | — | | | — | | — | | — | |
| Total consolidated operations | Total consolidated operations | 437 | | 371 | | 159 | | | — | | — | | — | |
| Equity affiliates | Equity affiliates | |
| Asia Pacific/Middle East | Asia Pacific/Middle East | 28 | | 30 | | 109 | | | — | | — | | — | |
| Asia Pacific/Middle East | |
| Asia Pacific/Middle East | |
| Total equity affiliates | Total equity affiliates | 28 | | 30 | | 109 | | | — | | — | | — | |
*Our total proportionate interest was less than one.
| | | | | |
ConocoPhillips 20222023 10-K | 152 |
The table below represents the status of our wells drilling at December 31, 2022,2023, and includes wells in the process of drilling or in active completion. It also represents gross and net productive wells, including producing wells and wells capable of production at December 31, 2022.2023.
Wells at December 31, 20222023
| | Productive |
| In Progress | | Oil | | Gas |
| Gross | Net | | Gross | Net | | Gross | Net |
| | | | Productive | | | | | | Productive |
| In Progress | | | In Progress | | Oil | | Gas |
| Gross | | | Gross | Net | | Gross | Net | | Gross | Net |
| Consolidated operations | Consolidated operations | | | | | |
| Alaska | |
| Alaska | |
| Alaska | Alaska | 2 | | 1 | | | 1,591 | | 929 | | | — | | — | |
| Lower 48 | Lower 48 | 615 | | 300 | | | 13,512 | | 6,382 | | | 3,716 | | 1,767 | |
| United States | United States | 617 | | 301 | | | 15,103 | | 7,311 | | | 3,716 | | 1,767 | |
| Canada | Canada | 42 | | 30 | | | 192 | | 96 | | | 147 | | 147 | |
| Europe | Europe | 22 | | 5 | | | 487 | | 84 | | | 58 | | 2 | |
| Asia Pacific/Middle East | Asia Pacific/Middle East | 4 | | 2 | | | 398 | | 188 | | | 6 | | 2 | |
| Africa | Africa | 8 | | 2 | | | 869 | | 177 | | | 10 | | 2 | |
| Other areas | Other areas | — | | — | | | — | | — | | | — | | — | |
| Total consolidated operations | Total consolidated operations | 693 | | 340 | | | 17,049 | | 7,856 | | | 3,937 | | 1,920 | |
| Equity affiliates | Equity affiliates | |
| Asia Pacific/Middle East | Asia Pacific/Middle East | 279 | | 39 | | | — | | — | | | 4,989 | | 1,505 | |
| Asia Pacific/Middle East | |
| Asia Pacific/Middle East | |
| Total equity affiliates | Total equity affiliates | 279 | | 39 | | | — | | — | | | 4,989 | | 1,505 | |
Acreage at December 31, 20222023
| | | Thousands of Acres |
| Developed | | Undeveloped |
| Gross | Net | | Gross | Net |
| Thousands of Acres | |
| Thousands of Acres | |
| Thousands of Acres | |
| Developed | | | Developed | | Undeveloped |
| Gross | | | Gross | Net | | Gross | Net |
| Consolidated operations | Consolidated operations | | | |
| Alaska | |
| Alaska | |
| Alaska | Alaska | 715 | | 531 | | | 1,261 | | 1,246 | |
| Lower 48 | Lower 48 | 3,654 | | 2,277 | | | 10,279 | | 8,064 | |
| United States | United States | 4,369 | | 2,808 | | | 11,540 | | 9,310 | |
| Canada | Canada | 289 | | 219 | | | 3,429 | | 1,944 | |
| Europe | Europe | 430 | | 50 | | | 1,195 | | 470 | |
| Asia Pacific/Middle East | Asia Pacific/Middle East | 422 | | 152 | | | 10,451 | | 6,930 | |
| Africa | Africa | 358 | | 73 | | | 12,545 | | 2,561 | |
| Other areas | Other areas | — | | — | | | 156 | | 125 | |
| Total consolidated operations | Total consolidated operations | 5,868 | | 3,302 | | | 39,316 | | 21,340 | |
| Equity affiliates | Equity affiliates | |
| Asia Pacific/Middle East | Asia Pacific/Middle East | 1,045 | | 314 | | | 3,943 | | 1,066 | |
| Asia Pacific/Middle East | |
| Asia Pacific/Middle East | |
| Total equity affiliates | Total equity affiliates | 1,045 | | 314 | | | 3,943 | | 1,066 | |
| | | | | |
| 153 | ConocoPhillips 20222023 10-K |
Costs Incurred
| Year Ended
December 31 | Year Ended
December 31 | Millions of Dollars | Year Ended
December 31 | Millions of Dollars |
| Alaska | Lower
48 | Total
U.S. | Canada | Europe | Asia Pacific/
Middle East | Africa | Other
Areas | Total | Alaska | Lower
48 | Total
U.S. | Canada | Europe | Asia Pacific/
Middle East | Africa | Other
Areas | Total |
| 2023 | |
| Consolidated operations | |
| Consolidated operations | |
| Consolidated operations | |
| Unproved property acquisition | |
| Unproved property acquisition | |
| Unproved property acquisition | |
| Proved property acquisition | |
| — | |
| Exploration | |
| Development | |
| $ | |
| | Equity affiliates | |
| Equity affiliates | |
| Equity affiliates | |
| Unproved property acquisition | |
| Unproved property acquisition | |
| Unproved property acquisition | |
| Proved property acquisition | |
| — | |
| Exploration | |
| Development | |
| $ | |
| | 2022 | |
| 2022 | |
| 2022 | 2022 | |
| Consolidated operations | Consolidated operations | |
| Consolidated operations | |
| Consolidated operations | |
| Unproved property acquisition | |
| Unproved property acquisition | |
| Unproved property acquisition | Unproved property acquisition | $ | — | | 255 | | 255 | | — | | — | | — | | — | | — | | 255 | |
| Proved property acquisition | Proved property acquisition | — | | 249 | | 249 | | — | | — | | — | | 104 | | — | | 353 | |
| — | | 504 | | 504 | | — | | — | | — | | 104 | | — | | 608 | |
| — | |
| Exploration | Exploration | 61 | | 1,278 | | 1,339 | | 99 | | 121 | | 59 | | 3 | | 2 | | 1,623 | |
| Development | Development | 1,316 | | 4,559 | | 5,875 | | 475 | | 711 | | 425 | | 4 | | — | | 7,490 | |
| $ | 1,377 | | 6,341 | | 7,718 | | 574 | | 832 | | 484 | | 111 | | 2 | | 9,721 | |
| $ | |
| | Equity affiliates | Equity affiliates | |
| Equity affiliates | |
| Equity affiliates | |
| Unproved property acquisition | |
| Unproved property acquisition | |
| Unproved property acquisition | Unproved property acquisition | $ | — | | — | | — | | — | | — | | — | | — | | — | | — | |
| Proved property acquisition | Proved property acquisition | — | | — | | — | | — | | — | | 881 | | — | | — | | 881 | |
| — | | — | | — | | — | | — | | 881 | | — | | — | | 881 | |
| — | |
| Exploration | Exploration | — | | — | | — | | — | | — | | 25 | | — | | — | | 25 | |
| Development | Development | — | | — | | — | | — | | — | | 244 | | — | | — | | 244 | |
| $ | — | | — | | — | | — | | — | | 1,150 | | — | | — | | 1,150 | |
| $ | |
| | 2021 | 2021 | |
| 2021 | |
| 2021 | |
| Consolidated operations | |
| Consolidated operations | |
| Consolidated operations | Consolidated operations | |
| Unproved property acquisition | Unproved property acquisition | $ | 1 | | 11,261 | | 11,262 | | 4 | | — | | — | | — | | — | | 11,266 | |
| Unproved property acquisition | |
| Unproved property acquisition | |
| Proved property acquisition | Proved property acquisition | — | | 16,101 | | 16,101 | | 1 | | — | | — | | — | | — | | 16,102 | |
| 1 | | 27,362 | | 27,363 | | 5 | | — | | — | | — | | — | | 27,368 | |
| 1 | |
| Exploration | Exploration | 84 | | 765 | | 849 | | 80 | | 31 | | 51 | | 2 | | 40 | | 1,053 | |
| Development | Development | 949 | | 2,461 | | 3,410 | | 175 | | 398 | | 433 | | 24 | | — | | 4,440 | |
| $ | 1,034 | | 30,588 | | 31,622 | | 260 | | 429 | | 484 | | 26 | | 40 | | 32,861 | |
| $ | |
| | Equity affiliates | Equity affiliates | |
| Equity affiliates | |
| Equity affiliates | |
| Unproved property acquisition | |
| Unproved property acquisition | |
| Unproved property acquisition | Unproved property acquisition | $ | — | | — | | — | | — | | — | | — | | — | | — | | — | |
| Proved property acquisition | Proved property acquisition | — | | — | | — | | — | | — | | — | | — | | — | | — | |
| — | | — | | — | | — | | — | | — | | — | | — | | — | |
| — | |
| Exploration | Exploration | — | | — | | — | | — | | — | | 5 | | — | | — | | 5 | |
| Development | Development | — | | — | | — | | — | | — | | 21 | | — | | — | | 21 | |
| $ | — | | — | | — | | — | | — | | 26 | | — | | — | | 26 | |
| | 2020 | |
| Consolidated operations | |
| Unproved property acquisition | $ | 4 | | 10 | | 14 | | 378 | | — | | 3 | | — | | 9 | | 404 | |
| Proved property acquisition | — | | 62 | | 62 | | 129 | | — | | — | | — | | — | | 191 | |
| 4 | | 72 | | 76 | | 507 | | — | | 3 | | — | | 9 | | 595 | |
| Exploration | 287 | | 116 | | 403 | | 218 | | 110 | | 32 | | 4 | | 38 | | 805 | |
| Development | 745 | | 1,758 | | 2,503 | | 102 | | 451 | | 427 | | 18 | | — | | 3,501 | |
| $ | 1,036 | | 1,946 | | 2,982 | | 827 | | 561 | | 462 | | 22 | | 47 | | 4,901 | |
| | Equity affiliates | |
| Unproved property acquisition | $ | — | | — | | — | | — | | — | | — | | — | | — | | — | |
| Proved property acquisition | — | | — | | — | | — | | — | | — | | — | | — | | — | |
| — | | — | | — | | — | | — | | — | | — | | — | | — | |
| Exploration | — | | — | | — | | — | | — | | 12 | | — | | — | | 12 | |
| Development | — | | — | | — | | — | | — | | 282 | | — | | — | | 282 | |
| $ | — | | — | | — | | — | | — | | 294 | | — | | — | | 294 | |
| $ | |
| | | | | |
ConocoPhillips 20222023 10-K | 154 |
Capitalized Costs
| | At December 31 | At December 31 | Millions of Dollars | At December 31 | Millions of Dollars |
| Alaska | | | Alaska | Lower
48 | Total
U.S. | Canada | Europe | Asia Pacific/
Middle East | Africa | Other
Areas | Total |
| 2023 | |
| Consolidated operations | |
| Consolidated operations | |
| Consolidated operations | |
| Proved property | |
| Proved property | |
| Proved property | |
| Unproved property | |
| 26,466 | |
| Accumulated depreciation, depletion and amortization | |
| $ | |
| | Equity affiliates | |
| Equity affiliates | |
| Equity affiliates | |
| Proved property | |
| Proved property | |
| Proved property | |
| Unproved property | |
| — | |
| Accumulated depreciation, depletion and amortization | |
| $ | |
| | Alaska | Lower
48 | Total
U.S. | Canada | Europe | Asia Pacific/
Middle East | Africa | Other
Areas | Total |
| 2022 | 2022 | |
| 2022 | |
| 2022 | |
| Consolidated operations | |
| Consolidated operations | |
| Consolidated operations | Consolidated operations | |
| Proved property | Proved property | $ | 24,041 | | 62,756 | | 86,797 | | 7,487 | | 13,716 | | 10,534 | | 1,075 | | — | | 119,609 | |
| Proved property | |
| Proved property | |
| Unproved property | Unproved property | 589 | | 5,145 | | 5,734 | | 1,291 | | 100 | | 93 | | 98 | | 9 | | 7,325 | |
| 24,630 | | 67,901 | | 92,531 | | 8,778 | | 13,816 | | 10,627 | | 1,173 | | 9 | | 126,934 | |
| 24,630 | |
| Accumulated depreciation, depletion and amortization | Accumulated depreciation, depletion and amortization | 11,906 | | 31,455 | | 43,361 | | 2,927 | | 9,774 | | 7,970 | | 458 | | 9 | | 64,499 | |
| $ | 12,724 | | 36,446 | | 49,170 | | 5,851 | | 4,042 | | 2,657 | | 715 | | — | | 62,435 | |
| $ | |
| | Equity affiliates | Equity affiliates | |
| Equity affiliates | |
| Equity affiliates | |
| Proved property | |
| Proved property | |
| Proved property | Proved property | $ | — | | — | | — | | — | | — | | 10,823 | | — | | — | | 10,823 | |
| Unproved property | Unproved property | — | | — | | — | | — | | — | | 2,162 | | — | | — | | 2,162 | |
| — | | — | | — | | — | | — | | 12,985 | | — | | — | | 12,985 | |
| — | |
| Accumulated depreciation, depletion and amortization | Accumulated depreciation, depletion and amortization | — | | — | | — | | — | | — | | 8,400 | | — | | — | | 8,400 | |
| $ | — | | — | | — | | — | | — | | 4,585 | | — | | — | | 4,585 | |
| | 2021 | |
| Consolidated operations | |
| Proved property | $ | 22,750 | | 58,561 | | 81,311 | | 7,380 | | 14,514 | | 12,226 | | 966 | | — | | 116,397 | |
| Unproved property | 1,402 | | 7,704 | | 9,106 | | 1,517 | | 155 | | 92 | | 114 | | 9 | | 10,993 | |
| 24,152 | | 66,265 | | 90,417 | | 8,897 | | 14,669 | | 12,318 | | 1,080 | | 9 | | 127,390 | |
| Accumulated depreciation, depletion and amortization | 11,945 | | 29,975 | | 41,920 | | 2,749 | | 10,166 | | 9,240 | | 422 | | 9 | | 64,506 | |
| $ | 12,207 | | 36,290 | | 48,497 | | 6,148 | | 4,503 | | 3,078 | | 658 | | — | | 62,884 | |
| | Equity affiliates | |
| Proved property | $ | — | | — | | — | | — | | — | | 10,357 | | — | | — | | 10,357 | |
| Unproved property | — | | — | | — | | — | | — | | 2,162 | | — | | — | | 2,162 | |
| — | | — | | — | | — | | — | | 12,519 | | — | | — | | 12,519 | |
| Accumulated depreciation, depletion and amortization | — | | — | | — | | — | | — | | 8,539 | | — | | — | | 8,539 | |
| $ | — | | — | | — | | — | | — | | 3,980 | | — | | — | | 3,980 | |
| $ | |
| | | | | |
| 155 | ConocoPhillips 20222023 10-K |
Standardized Measure of Discounted Future Net Cash Flows Relating to Proved Oil and Gas Reserve Quantities
In accordance with SEC and FASB requirements, amounts were computed using 12-month average prices (adjusted only for existing contractual terms) and end-of-year costs, appropriate statutory tax rates and a prescribed 10 percent discount factor. Twelve-month average prices are calculated as the unweighted arithmetic average of the first-day-of-the-month price for each month within the 12-month period prior to the end of the reporting period. For all years, continuation of year-end economic conditions was assumed. The calculations were based on estimates of proved reserves, which are revised over time as new data becomes available. Probable or possible reserves, which may become proved in the future, were not considered. The calculations also require assumptions as to the timing of future production of proved reserves and the timing and amount of future development costs, including dismantlement, and future production costs, including taxes other than income taxes.
While due care was taken in its preparation, we do not represent that this data is the fair value of our oil and gas properties, or a fair estimate of the present value of cash flows to be obtained from their development and production.
Discounted Future Net Cash Flows
| | Millions of Dollars |
| Alaska | Lower
48 | Total
U.S. | Canada | Europe | Asia Pacific/
Middle East | Africa | Total |
| 2022 | |
| Millions of Dollars | | | Millions of Dollars |
| Alaska | | | Alaska | Lower
48 | Total
U.S. | Canada | Europe | Asia Pacific/
Middle East | Africa | Total |
| 2023 | |
| Consolidated operations | |
| Consolidated operations | |
| Consolidated operations | Consolidated operations | |
| Future cash inflows | Future cash inflows | $ | 94,332 | | 195,605 | | 289,937 | | 13,768 | | 44,942 | | 13,458 | | 27,067 | | 389,172 | |
| Future cash inflows | |
| Future cash inflows | |
| Less: | Less: | |
| Future production costs | |
| Future production costs | |
| Future production costs | Future production costs | 47,979 | | 63,987 | | 111,966 | | 5,722 | | 7,559 | | 5,582 | | 1,085 | | 131,914 | |
| Future development costs | Future development costs | 8,501 | | 21,379 | | 29,880 | | 960 | | 4,378 | | 1,159 | | 531 | | 36,908 | |
| Future income tax provisions | Future income tax provisions | 8,882 | | 23,136 | | 32,018 | | 863 | | 25,416 | | 1,780 | | 23,615 | | 83,692 | |
| Future net cash flows | Future net cash flows | 28,970 | | 87,103 | | 116,073 | | 6,223 | | 7,589 | | 4,937 | | 1,836 | | 136,658 | |
| 10 percent annual discount | 10 percent annual discount | 13,733 | | 31,191 | | 44,924 | | 1,936 | | 1,827 | | 1,505 | | 746 | | 50,938 | |
| Discounted future net cash flows | Discounted future net cash flows | $ | 15,237 | | 55,912 | | 71,149 | | 4,287 | | 5,762 | | 3,432 | | 1,090 | | 85,720 | |
| | Equity affiliates | Equity affiliates | |
| Equity affiliates | |
| Equity affiliates | |
| Future cash inflows | |
| Future cash inflows | |
| Future cash inflows | Future cash inflows | $ | — | | — | | — | | — | | — | | 87,644 | | — | | 87,644 | |
| Less: | Less: | | — | | |
| Future production costs | |
| Future production costs | |
| Future production costs | Future production costs | — | | — | | — | | — | | — | | 51,912 | | — | | 51,912 | |
| Future development costs | Future development costs | — | | — | | — | | — | | — | | 2,685 | | — | | 2,685 | |
| Future income tax provisions | Future income tax provisions | — | | — | | — | | — | | — | | 8,988 | | — | | 8,988 | |
| Future net cash flows | Future net cash flows | — | | — | | — | | — | | — | | 24,059 | | — | | 24,059 | |
| 10 percent annual discount | 10 percent annual discount | — | | — | | — | | — | | — | | 10,787 | | — | | 10,787 | |
| Discounted future net cash flows | Discounted future net cash flows | $ | — | | — | | — | | — | | — | | 13,272 | | — | | 13,272 | |
| | Total company | Total company | |
| Total company | |
| Total company | |
| Discounted future net cash flows | Discounted future net cash flows | $ | 15,237 | | 55,912 | | 71,149 | | 4,287 | | 5,762 | | 16,704 | | 1,090 | | 98,992 | |
| Discounted future net cash flows | |
| Discounted future net cash flows | |
| | | | | |
ConocoPhillips 20222023 10-K | 156 |
| | Millions of Dollars |
| Alaska | Lower
48 | Total
U.S. | Canada | Europe | Asia Pacific/
Middle East | Africa | Total |
| 2021 | |
| Millions of Dollars | | | Millions of Dollars |
| Alaska | | | Alaska | Lower
48 | Total
U.S. | Canada | Europe | Asia Pacific/
Middle East | Africa | Total |
| 2022 | |
| Consolidated operations | |
| Consolidated operations | |
| Consolidated operations | Consolidated operations | |
| Future cash inflows | Future cash inflows | $ | 65,910 | | 125,197 | | 191,107 | | 10,847 | | 21,670 | | 11,583 | | 15,778 | | 250,985 | |
| Future cash inflows | |
| Future cash inflows | |
| Less: | Less: | |
| Future production costs | |
| Future production costs | |
| Future production costs | Future production costs | 34,444 | | 43,034 | | 77,478 | | 4,960 | | 6,090 | | 4,987 | | 801 | | 94,316 | |
| Future development costs | Future development costs | 8,033 | | 13,386 | | 21,419 | | 923 | | 3,960 | | 1,314 | | 413 | | 28,029 | |
| Future income tax provisions | Future income tax provisions | 5,310 | | 13,167 | | 18,477 | | 117 | | 8,345 | | 1,542 | | 13,506 | | 41,987 | |
| Future net cash flows | Future net cash flows | 18,123 | | 55,610 | | 73,733 | | 4,847 | | 3,275 | | 3,740 | | 1,058 | | 86,653 | |
| 10 percent annual discount | 10 percent annual discount | 7,963 | | 22,290 | | 30,253 | | 1,639 | | 696 | | 930 | | 440 | | 33,958 | |
| Discounted future net cash flows | Discounted future net cash flows | $ | 10,160 | | 33,320 | | 43,480 | | 3,208 | | 2,579 | | 2,810 | | 618 | | 52,695 | |
| | Equity affiliates | Equity affiliates | |
| Equity affiliates | |
| Equity affiliates | |
| Future cash inflows | |
| Future cash inflows | |
| Future cash inflows | Future cash inflows | $ | — | | — | | — | | — | | — | | 27,851 | | — | | 27,851 | |
| Less: | Less: | | — | | |
| Future production costs | |
| Future production costs | |
| Future production costs | Future production costs | — | | — | | — | | — | | — | | 15,491 | | — | | 15,491 | |
| Future development costs | Future development costs | — | | — | | — | | — | | — | | 1,649 | | — | | 1,649 | |
| Future income tax provisions | Future income tax provisions | — | | — | | — | | — | | — | | 3,071 | | — | | 3,071 | |
| Future net cash flows | Future net cash flows | — | | — | | — | | — | | — | | 7,640 | | — | | 7,640 | |
| 10 percent annual discount | 10 percent annual discount | — | | — | | — | | — | | — | | 2,640 | | — | | 2,640 | |
| Discounted future net cash flows | Discounted future net cash flows | $ | — | | — | | — | | — | | — | | 5,000 | | — | | 5,000 | |
| | Total company | Total company | |
| Total company | |
| Total company | |
| Discounted future net cash flows | Discounted future net cash flows | $ | 10,160 | | 33,320 | | 43,480 | | 3,208 | | 2,579 | | 7,810 | | 618 | | 57,695 | |
| Discounted future net cash flows | |
| Discounted future net cash flows | |
| | | | | |
| 157 | ConocoPhillips 20222023 10-K |
| | Millions of Dollars |
| Alaska | Lower
48 | Total
U.S. | Canada | Europe | Asia Pacific/
Middle East | Africa | Total |
| 2020 | |
| Millions of Dollars | | | Millions of Dollars |
| Alaska | | | Alaska | Lower
48 | Total
U.S. | Canada | Europe | Asia Pacific/
Middle East | Africa | Total |
| 2021 | |
| Consolidated operations | |
| Consolidated operations | |
| Consolidated operations | Consolidated operations | |
| Future cash inflows | Future cash inflows | $ | 30,145 | | 31,533 | | 61,678 | | 4,198 | | 9,857 | | 7,940 | | 9,997 | | 93,670 | |
| Future cash inflows | |
| Future cash inflows | |
| Less: | Less: | |
| Future production costs | |
| Future production costs | |
| Future production costs | Future production costs | 22,905 | | 17,582 | | 40,487 | | 4,316 | | 4,770 | | 3,838 | | 1,277 | | 54,688 | |
| Future development costs | Future development costs | 7,932 | | 12,799 | | 20,731 | | 750 | | 3,688 | | 1,289 | | 461 | | 26,919 | |
| Future income tax provisions | Future income tax provisions | — | | 376 | | 376 | | — | | 267 | | 1,075 | | 7,571 | | 9,289 | |
| Future net cash flows | Future net cash flows | (692) | | 776 | | 84 | | (868) | | 1,132 | | 1,738 | | 688 | | 2,774 | |
| 10 percent annual discount | 10 percent annual discount | (1,501) | | (820) | | (2,321) | | (396) | | 117 | | 406 | | 294 | | (1,900) | |
| Discounted future net cash flows | Discounted future net cash flows | $ | 809 | | 1,596 | | 2,405 | | (472) | | 1,015 | | 1,332 | | 394 | | 4,674 | |
| | Equity affiliates | Equity affiliates | |
| Equity affiliates | |
| Equity affiliates | |
| Future cash inflows | |
| Future cash inflows | |
| Future cash inflows | Future cash inflows | $ | — | | — | | — | | — | | — | | 17,284 | | — | | 17,284 | |
| Less: | Less: | |
| Future production costs | |
| Future production costs | |
| Future production costs | Future production costs | — | | — | | — | | — | | — | | 10,239 | | — | | 10,239 | |
| Future development costs | Future development costs | — | | — | | — | | — | | — | | 1,186 | | — | | 1,186 | |
| Future income tax provisions | Future income tax provisions | — | | — | | — | | — | | — | | 1,728 | | — | | 1,728 | |
| Future net cash flows | Future net cash flows | — | | — | | — | | — | | — | | 4,131 | | — | | 4,131 | |
| 10 percent annual discount | 10 percent annual discount | — | | — | | — | | — | | — | | 1,269 | | — | | 1,269 | |
| Discounted future net cash flows | Discounted future net cash flows | $ | — | | — | | — | | — | | — | | 2,862 | | — | | 2,862 | |
| | Total company | Total company | |
| Total company | |
| Total company | |
| Discounted future net cash flows | Discounted future net cash flows | $ | 809 | | $ | 1,596 | | $ | 2,405 | | $ | (472) | | $ | 1,015 | | $ | 4,194 | | $ | 394 | | $ | 7,536 | |
| Discounted future net cash flows | |
| Discounted future net cash flows | |
*Undiscounted future net cash flows related to the proved oil and gas reserves disclosed for Canada for the year ending December 31, 2020, are negative due to the inclusion of asset retirement costs and certain indirect costs in the calculation of the standardized measure of discounted future net cash flows. These costs are not required to be included in the economic limit test for proved developed reserves as defined in Regulation S-X Rule 4-10. Future net cash flows for Canada were also impacted by lower 12-month average pricing for bitumen and crude oil in 2020. Commodity prices have since improved in the current environment.
| | | | | |
ConocoPhillips 20222023 10-K | 158 |
Sources of Change in Discounted Future Net Cash Flows
| | Millions of Dollars |
| Consolidated Operations | | Equity Affiliates | | Total Company |
| 2022 | 2021 | 2020 | | 2022 | 2021 | 2020 | | 2022 | 2021 | 2020 |
| Millions of Dollars | | | Millions of Dollars |
| Consolidated Operations | | | Consolidated Operations | | Equity Affiliates | | Total Company |
| 2023 | | | 2023 | 2022 | 2021 | | 2023 | 2022 | 2021 | | 2023 | 2022 | 2021 |
| Discounted future net cash flows at the beginning of the year | Discounted future net cash flows at the beginning of the year | $ | 52,695 | | $ | 4,674 | | 27,372 | | | $ | 5,000 | | 2,862 | | 7,170 | | | $ | 57,695 | | 7,536 | | 34,542 | |
| Changes during the year | Changes during the year | |
| Revenues less production costs for the year | |
| Revenues less production costs for the year | |
| Revenues less production costs for the year | Revenues less production costs for the year | (33,532) | | (20,000) | | (5,198) | | | (3,245) | | (1,389) | | (897) | | | (36,777) | | (21,389) | | (6,095) | |
| Net change in prices, and production costs | Net change in prices, and production costs | 61,902 | | 50,956 | | (34,307) | | | 8,184 | | 3,822 | | (4,769) | | | 70,086 | | 54,778 | | (39,076) | |
| Extensions, discoveries and improved recovery, less estimated future costs | Extensions, discoveries and improved recovery, less estimated future costs | 7,882 | | 10,420 | | 887 | | | 1,472 | | (44) | | 22 | | | 9,354 | | 10,376 | | 909 | |
| Development costs for the year | Development costs for the year | 6,687 | | 4,396 | | 3,593 | | | 272 | | 91 | | 192 | | | 6,959 | | 4,487 | | 3,785 | |
| Changes in estimated future development costs | Changes in estimated future development costs | (4,088) | | (33) | | 754 | | | 189 | | (104) | | (205) | | | (3,899) | | (137) | | 549 | |
| Purchases of reserves in place, less estimated future costs | Purchases of reserves in place, less estimated future costs | 3,353 | | 17,833 | | 1 | | | 1,282 | | — | | (3) | | | 4,635 | | 17,833 | | (2) | |
| Sales of reserves in place, less estimated future costs | Sales of reserves in place, less estimated future costs | (3,847) | | (468) | | (302) | | | — | | — | | — | | | (3,847) | | (468) | | (302) | |
| Revisions of previous quantity estimates | Revisions of previous quantity estimates | 13,080 | | 2,985 | | (2,299) | | | 2,193 | | 178 | | (42) | | | 15,273 | | 3,163 | | (2,341) | |
| Accretion of discount | Accretion of discount | 7,021 | | 964 | | 3,984 | | | 616 | | 344 | | 804 | | | 7,637 | | 1,308 | | 4,788 | |
| Net change in income taxes | Net change in income taxes | (25,433) | | (19,032) | | 10,189 | | | (2,691) | | (760) | | 590 | | | (28,124) | | (19,792) | | 10,779 | |
| Total changes | Total changes | 33,025 | | 48,021 | | (22,698) | | | 8,272 | | 2,138 | | (4,308) | | | 41,297 | | 50,159 | | (27,006) | |
| Discounted future net cash flows at year end | Discounted future net cash flows at year end | $ | 85,720 | | $ | 52,695 | | 4,674 | | | $ | 13,272 | | 5,000 | | 2,862 | | | $ | 98,992 | | 57,695 | | 7,536 | |
•The net change in prices and production costs is the beginning-of-year reserve-production forecast multiplied by the net annual change in the per-unit sales price and production cost, discounted at 10 percent.
•Purchases and sales of reserves in place, along with extensions, discoveries and improved recovery, are calculated using production forecasts of the applicable reserve quantities for the year multiplied by the 12-month average sales prices, less future estimated costs, discounted at 10 percent.
•Revisions of previous quantity estimates are calculated using production forecast changes for the year, including changes in the timing of production, multiplied by the 12-month average sales prices, less future estimated costs, discounted at 10 percent.
•The accretion of discount is 10 percent of the prior year’s discounted future cash inflows, less future production and development costs.
•The net change in income taxes is the annual change in the discounted future income tax provisions.
| | | | | |
| 159 | ConocoPhillips 20222023 10-K |
Item 9. Changes in and Disagreements with Accountants on Accounting and Financial Disclosure
None.
Item 9A. Controls and Procedures
We maintain disclosure controls and procedures designed to ensure information required to be disclosed in reports we file or submit under the Securities Exchange Act of 1934, as amended (the Act), is recorded, processed, summarized and reported within the time periods specified in Securities and Exchange Commission rules and forms, and that such information is accumulated and communicated to management, including our principal executive and principal financial officers, as appropriate, to allow timely decisions regarding required disclosure. As of December 31, 2022,2023, with the participation of our management, our Chairman and Chief Executive Officer (principal executive officer) and our Executive Vice President and Chief Financial Officer (principal financial officer) carried out an evaluation, pursuant to Rule 13a-15(b) of the Act, of ConocoPhillips’ disclosure controls and procedures (as defined in Rule 13a-15(e) of the Act). Based upon that evaluation, our Chairman and Chief Executive Officer and our Executive Vice President and Chief Financial Officer concluded our disclosure controls and procedures were operating effectively as of December 31, 2022.2023.
In the third quarter of 2023, we began a multi-year implementation of an updated global enterprise resource planning system (ERP). As a result, we have made corresponding changes to our business processes and information systems, updating applicable internal controls over financial reporting where necessary. As the phased implementation of the ERP system progresses, we expect to continue to modify or change certain processes and procedures which may result in further changes to our internal controls over financial reporting.
There have been no other changes in our internal control over financial reporting, as defined in Rule 13a-15(f) of the Act, in the period covered by this report that have materially affected, or are reasonably likely to materially affect, our internal control over financial reporting.
Management’s Annual Report on Internal Control Over Financial Reporting
This report is included in Item 8 on page 6971 and is incorporated herein by reference. Report of Independent Registered Public Accounting Firm
This report is included in Item 8 on page 7072 and is incorporated herein by reference. Item 9B. Other Information
None.Insider Trading Arrangements
During the three-month period ended December 31, 2023, no officer or director of the company adopted or terminated any Rule 10b5-1 trading arrangement or non-Rule 10b5-1 trading arrangement.
Item 9C. Disclosure Regarding Foreign Jurisdictions that Prevent Inspections
Not applicable.
| | | | | |
ConocoPhillips 20222023 10-K | 160 |
Part III
Item 10. Directors, Executive Officers and Corporate Governance
Information regarding our executive officers appears in Part I of this report on page 2830. Code of Business Ethics and Conduct for Directors and Employees
We have a Code of Business Ethics and Conduct for Directors and Employees (Code of Ethics), including our principal executive officer, principal financial officer, principal accounting officer and persons performing similar functions. We have posted a copy of our Code of Ethics on the “Corporate Governance” section of our internet website at www.conocophillips.com (within the Investors>Corporate Governance section). Any waivers of the Code of Ethics must be approved, in advance, by our full Board of Directors. Any amendments to, or waivers from, the Code of Ethics that apply to our executive officers and directors will be posted on the “Corporate Governance” section of our internet website.
All other information required by Item 10 of Part III will be included in our Proxy Statement relating to our 20232024 Annual Meeting of Stockholders, to be filed pursuant to Regulation 14A on or before April 30, 2023,2024, and is incorporated herein by reference.*
Item 11. Executive Compensation
Information required by Item 11 of Part III will be included in our Proxy Statement relating to our 20232024 Annual Meeting of Stockholders, to be filed pursuant to Regulation 14A on or before April 30, 2023,2024, and is incorporated herein by reference.*
Item 12. Security Ownership of Certain Beneficial Owners and Management and Related Stockholder Matters
Information required by Item 12 of Part III will be included in our Proxy Statement relating to our 20232024 Annual Meeting of Stockholders, to be filed pursuant to Regulation 14A on or before April 30, 2023,2024, and is incorporated herein by reference.*
Item 13. Certain Relationships and Related Transactions, and Director Independence
Information required by Item 13 of Part III will be included in our Proxy Statement relating to our 20232024 Annual Meeting of Stockholders, to be filed pursuant to Regulation 14A on or before April 30, 2023,2024, and is incorporated herein by reference.*
Item 14. Principal Accounting Fees and Services
Information required by Item 14 of Part III will be included in our Proxy Statement relating to our 20232024 Annual Meeting of Stockholders, to be filed pursuant to Regulation 14A on or before April 30, 2023,2024, and is incorporated herein by reference.*
_________________________
* Except for information or data specifically incorporated herein by reference under Items 10 through 14, other information and data appearing in our 20232024 Proxy Statement are not deemed to be a part of this Annual Report on Form 10-K or deemed to be filed with the Commission as a part of this report.
| | | | | |
| 161 | ConocoPhillips 20222023 10-K |
Part IV
Item 15. Exhibits, Financial Statement Schedules
(a)1. Financial Statements and Supplementary Data
The financial statements and supplementary information listed in the Index to Financial Statements, which appears on page 6870, are filed as part of this annual report. 2. Financial Statement Schedules
All financial statement schedules are omitted because they are not required, not significant, not applicable or the information is shown in another schedule, the financial statements or the notes to consolidated financial statements.
3. Exhibits
The exhibits listed in the Index to Exhibits, which appears on pages 116363 through 167166, are filed as part of this annual report. | | | | | |
ConocoPhillips 20222023 10-K | 162 |
ConocoPhillips
Index to Exhibits
| | Incorporated by Reference |
| | Incorporated by Reference | | | | Incorporated by Reference |
Exhibit
No. | Exhibit
No. | Description | Exhibit | Form | File No. | Exhibit
No. | Description | Exhibit | Form | File No. |
| 2.1 | 2.1 | | 2.1 | 8-K | 001-32395 | 2.1 | | 2.1 | 8-K | 001-32395 |
| | 2.2†‡ | 2.2†‡ | | 2.1 | 10-Q | 001-32395 |
| 2.2†‡ | |
| 2.2†‡ | | | 2.1 | 10-Q | 001-32395 |
| | 2.3†‡ | |
| 2.3†‡ | |
| 2.3†‡ | 2.3†‡ | | 2.2 | 8-K | 001-32395 | | 2.2 | 8-K | 001-32395 |
| | 2.4 | 2.4 | | 2.1 | 8-K | 001-32395 |
| 2.4 | |
| 2.4 | | | 2.1 | 8-K | 001-32395 |
| | 3.1 | |
| 3.1 | |
| 3.1 | 3.1 | | 3.1 | 10-Q | 001-32395 | | 3.1 | 10-Q | 001-32395 |
| | 3.2 | 3.2 | | 3.2 | 8-K | 000-49987 |
| 3.2 | |
| 3.2 | | | 3.2 | 8-K | 000-49987 |
| | 3.3 | |
| 3.3 | |
| 3.3 | 3.3 | | 3.1 | 8-K | 001-32395 | | 3.1 | 8-K | 001-32395 |
| | 3.4 | 3.4 | | 3.4 | 10-K | 001-32395 |
| 3.4 | |
| 3.4 | | | 3.4 | 10-K | 001-32395 |
| | 3.5 | |
| 3.5 | |
| 3.5 | | | 3.1 | 10-Q | 001-32395 |
| | ConocoPhillips and its subsidiaries are parties to several debt instruments under which the total amount of securities authorized does not exceed 10 percent of the total assets of ConocoPhillips and its subsidiaries on a consolidated basis. Pursuant to paragraph 4(iii)(A) of Item 601(b) of Regulation S-K, ConocoPhillips agrees to furnish a copy of such instruments to the SEC upon request. | |
| ConocoPhillips and its subsidiaries are parties to several debt instruments under which the total amount of securities authorized does not exceed 10 percent of the total assets of ConocoPhillips and its subsidiaries on a consolidated basis. Pursuant to paragraph 4(iii)(A) of Item 601(b) of Regulation S-K, ConocoPhillips agrees to furnish a copy of such instruments to the SEC upon request. | |
| ConocoPhillips and its subsidiaries are parties to several debt instruments under which the total amount of securities authorized does not exceed 10 percent of the total assets of ConocoPhillips and its subsidiaries on a consolidated basis. Pursuant to paragraph 4(iii)(A) of Item 601(b) of Regulation S-K, ConocoPhillips agrees to furnish a copy of such instruments to the SEC upon request. | |
| ConocoPhillips and its subsidiaries are parties to several debt instruments under which the total amount of securities authorized does not exceed 10 percent of the total assets of ConocoPhillips and its subsidiaries on a consolidated basis. Pursuant to paragraph 4(iii)(A) of Item 601(b) of Regulation S-K, ConocoPhillips agrees to furnish a copy of such instruments to the SEC upon request. | |
| | 4.1 | |
| | 4.1 | |
| | 4.1 | 4.1 | | 4.1 | 10-K | 001-32395 | | 4.1 | 10-K | 001-32395 |
| | 10.1 | 10.1 | | 10.1 | 8-K | 001-32395 |
| 10.1 | |
| 10.1 | | | 10.1 | 8-K | 001-32395 |
| | 10.2 | |
| 10.2 | |
| 10.2 | 10.2 | | 10.2 | 8-K | 001-32395 | | 10.2 | 8-K | 001-32395 |
| | 10.3 | 10.3 | | 10.3 | 8-K | 001-32395 |
| 10.3 | |
| 10.3 | | | 10.3 | 8-K | 001-32395 |
| | 10.4 | |
| 10.4 | |
| 10.4 | 10.4 | | 10.4 | 8-K | 001-32395 | | 10.4 | 8-K | 001-32395 |
| | 10.5.1 | 10.5.1 | | 10.11 | 10-K | 001-14521 |
| 10.5.1 | |
| 10.5.1 | | | 10.17.3 | 10-K | 001-32395 |
| | 10.5.2 | 10.5.2 | | 10.39.1 | 10-K | 000-49987 |
| 10.5.2 | |
| 10.5.2 | | | 10.17.4 | 10-K | 001-32395 |
| | 10.6.1 | | 10.17.3 | 10-K | 001-32395 |
| 10.5.3 | |
| 10.5.3 | |
| 10.5.3 | | | 10.17.5 | 10-K | 001-32395 |
| | 10.6.2 | | 10.17.4 | 10-K | 001-32395 |
|
| | | | | |
| 163 | ConocoPhillips 20222023 10-K |
| | | | | | | | | | | | | | |
| 10.6.3 | | 10.17.5 | 10-K | 001-32395 |
| | | | |
| 10.6.4 | | 10.17.6 | 10-K | 001-32395 |
| | | | |
| 10.6.5 | | 10.17.7 | 10-K | 001-32395 |
| | | | |
| 10.6.6 | | 10.17.8 | 10-K | 001-32395 |
| | | | |
| 10.7.1 | | 10.1 | 10-Q | 001-32395 |
| | | | |
| 10.7.2 | | 10.2 | 10-Q | 001-32395 |
| | | | |
| 10.8 | | 10.11 | 10-K | 004-49987 |
| | | | |
| 10.9 | | 10.12 | 10-K | 004-49987 |
| | | | |
| 10.10 | | 10.19 | 10-K | 004-49987 |
| | | | |
| 10.11 | | 10.26 | 10-K | 000-49987 |
| | | | |
| 10.12.1 | | Schedule 14A | Proxy | 000-49987 |
| | | | |
| 10.12.2 | | 10.27 | 10-K | 001-32395 |
| | | | |
| 10.13 | | 10.30 | 10-K | 001-32395 |
| | | | |
| 10.14 | | Schedule 14A | Proxy | 001-32395 |
| | | | |
| 10.15.1 | | Schedule 14A | Proxy | 001-32395 |
| | | | |
| 10.15.2 | | 10 | 10-Q | 001-32395 |
| | | | |
| 10.15.3 | | 10.26.6 | 10-K | 001-32395 |
| | | | |
| 10.15.4 | | 10.26.9 | 10-K | 001-32395 |
| | | | |
| 10.15.5 | | 10.1 | 10-Q | 001-32395 |
| | | | |
| 10.15.6 | | 10.3 | 10-Q | 001-32395 |
| | | | |
| 10.15.7 | | 10.5 | 10-Q | 001-32395 |
| | | | |
| | | | | | | | | | | | | | |
| 10.5.4 | | 10.17.6 | 10-K | 001-32395 |
| | | | |
| 10.5.5 | | 10.17.7 | 10-K | 001-32395 |
| | | | |
| 10.5.6 | | 10.17.8 | 10-K | 001-32395 |
| | | | |
| 10.6.1 | | 10.1 | 10-Q | 001-32395 |
| | | | |
| 10.6.2 | | 10.2 | 10-Q | 001-32395 |
| | | | |
| 10.7 | | 10.19 | 10-K | 004-49987 |
| | | | |
| 10.8 | | 10.26 | 10-K | 000-49987 |
| | | | |
| 10.9.1 | | Schedule 14A | Proxy | 000-49987 |
| | | | |
| 10.9.2 | | 10.27 | 10-K | 001-32395 |
| | | | |
| 10.10 | | 10.30 | 10-K | 001-32395 |
| | | | |
| 10.11 | | Schedule 14A | Proxy | 001-32395 |
| | | | |
| 10.12.1 | | Schedule 14A | Proxy | 001-32395 |
| | | | |
| 10.12.2 | | 10.26.6 | 10-K | 001-32395 |
| | | | |
| 10.12.3 | | 10.26.9 | 10-K | 001-32395 |
| | | | |
| 10.12.4 | | 10.1 | 10-Q | 001-32395 |
| | | | |
| 10.12.5 | | 10.3 | 10-Q | 001-32395 |
| | | | |
| 10.12.6 | | 10.5 | 10-Q | 001-32395 |
| | | | |
| 10.13.1 | | 10.1 | 8-K | 001-32395 |
| | | | |
| 10.13.2 | | 10.26.12 | 10-K | 001-32395 |
| | | | |
| 10.13.3 | | 10.26.24 | 10-K | 001-32395 |
| | | | |
| | | | | |
ConocoPhillips 20222023 10-K | 164 |
| | | | | | | | | | | | | | |
| 10.15.8 | | 10.11 | 10-Q | 001-32395 |
| | | | |
| 10.16.1 | | 10.1 | 8-K | 001-32395 |
| | | | |
| 10.16.2 | | 10.26.12 | 10-K | 001-32395 |
| | | | |
| 10.16.3 | | 10.26.24 | 10-K | 001-32395 |
| | | | |
| 10.16.4 | | 10.1 | 10-Q | 001-32395 |
| | | | |
| 10.16.5 | | 10.27.16 | 10-K | 001-32395 |
| | | | |
| 10.16.6 | | 10.1 | 10-Q | 001-32395 |
| | | | |
| 10.16.7 | | 10.1 | 10-Q | 001-32395 |
| | | | |
| 10.16.8 | | 10.3 | 10-Q | 001-32395 |
| | | | |
| 10.16.9 | | 10.1 | 10-Q | 001-32395 |
| | | | |
| 10.16.10 | | 10.1 | 10-Q | 001-32395 |
| | | | |
| 10.17 | | 10.10.1 | 10-K | 001-32395 |
| | | | |
| 10.18.1 | | 10.11.1 | 10-K | 001-32395 |
| | | | |
| 10.18.2 | | 10.11.2 | 10-K | 001-32395 |
| | | | |
| 10.19 | | 10.39 | 10-K | 001-32395 |
| | | | |
| 10.20.1 | | 10.19.1 | 10-K | 001-32395 |
| | | | |
| 10.20.2 | | 10.19.2 | 10-K | 001-32395 |
| | | | |
| 10.20.3* | | | | |
| | | | |
| | | | | | | | | | | | | | |
| 10.13.4 | | 10.1 | 10-Q | 001-32395 |
| | | | |
| 10.13.5 | | 10.1 | 10-Q | 001-32395 |
| | | | |
| 10.14 | | 10.1 | 8-K | 001-32395 |
| | | | |
| 10.15 | | 10.10.1 | 10-K | 001-32395 |
| | | | |
| 10.16.1 | | 10.11.1 | 10-K | 001-32395 |
| | | | |
| 10.16.2* | | | | |
| | | | |
| 10.17* | | | | |
| | | | |
| 10.18.1 | | 10.19.1 | 10-K | 001-32395 |
| | | | |
| 10.18.2* | | | | |
| | | | |
| 10.19.1 | | 10.21 | 10-K | 001-32395 |
| | | | |
| 10.19.2 | | 10.20.1 | 10-K | 001-32395 |
| | | | |
| 10.20 | | 10.3 | 10-Q | 001-32395 |
| | | | |
| 10.21 | | 10.17 | 10-K | 001-32395 |
| | | | |
| 10.22.1 | | 10.40 | 10-K | 000-49987 |
| | | | |
| 10.22.2 | | 10 | 10-Q | 001-32395 |
| | | | |
| 10.23 | | 10.27 | 10-K | 001-32395 |
| | | | |
| 10.24 | | 10.47 | 10-K | 001-32395 |
| | | | |
| 10.25 | | 10.9 | 10-Q | 001-32395 |
| | | | |
| 10.26 | | 10.1 | 10-Q | 001-32395 |
| | | | |
| 10.27 | | 10.2 | 10-Q | 001-32395 |
| | | | |
| 10.28 | | 10.1 | 10-Q | 001-32395 |
| | | | |
| 10.29* | | | | |
| | | | |
| | | | | |
| 165 | ConocoPhillips 20222023 10-K |
| | | | | | | | | | | | | | |
| 10.20.4* | | | | |
| | | | |
| 10.21.1 | | 10.21 | 10-K | 001-32395 |
| | | | |
| 10.21.2 | | 10.20.1 | 10-K | 001-32395 |
| | | | |
| 10.22 | | 10.3 | 10-Q | 001-32395 |
| | | | |
| 10.23 | | 10.17 | 10-K | 001-32395 |
| | | | |
| 10.24.1 | | 10.40 | 10-K | 000-49987 |
| | | | |
| 10.24.2 | | 10 | 10-Q | 001-32395 |
| | | | |
| 10.25 | | 10.27 | 10-K | 001-32395 |
| | | | |
| 10.26 | | 10.3 | 10-Q | 001-32395 |
| | | | |
| 10.27 | | 10.47 | 10-K | 001-32395 |
| | | | |
| 10.28 | | 10.9 | 10-Q | 001-32395 |
| | | | |
| 10.29 | | 10.1 | 10-Q | 001-32395 |
| | | | |
| 10.30 | | 10.1 | 10-Q | 001-32395 |
| | | | |
| 10.31 | | 10.2 | 10-Q | 001-32395 |
| | | | |
| 10.32 | | 10.1 | 10-Q | 001-32395 |
| | | | |
| | | | | |
ConocoPhillips 2022 10-K | 166 |
| | | | | | | | | | | | | | |
| 21* | | | | |
| | | | |
| 22* | | | | |
| | | | |
| 23.1* | | | | |
| | | | |
| 23.2* | | | | |
| | | | |
| | | | |
| | | | |
| 31.1* | | | | |
| | | | |
| 31.2* | | | | |
| | | | |
| 32** | | | | |
| | | | |
| 97.1 | | | | |
| | | | |
| 97.2* | | | | |
| | | | |
| 99* | | | | |
| | | | |
| 101.INS* | Inline XBRL Instance Document. | | | |
| | | | |
| 101.SCH* | Inline XBRL Schema Document. | | | |
| | | | |
| 101.CAL* | Inline XBRL Calculation Linkbase Document. | | | |
| | | | |
| 101.DEF* | Inline XBRL Definition Linkbase Document. | | | |
| | | | |
| 101.LAB* | Inline XBRL Labels Linkbase Document. | | | |
| | | | |
| 101.PRE* | Inline XBRL Presentation Linkbase Document. | | | |
| | | | |
| 104* | Cover Page Interactive Data File (formatted as Inline XBRL and contained in Exhibit 101). |
* Filed herewith.
**Furnished herewith.
† The schedules to this exhibit have been omitted pursuant to Item 601(b)(2) of Regulation S-K. ConocoPhillips agrees to furnish a copy of any schedule omitted from this exhibit to the SEC upon request.
‡ ConocoPhillips has previously been granted confidential treatment for certain portions of this exhibit pursuant to Rule 24b-2 under the Securities Exchange Act of 1934, as amended.
| | | | | |
167ConocoPhillips 2023 10-K | ConocoPhillips 2022 10-K166 |
Signature
Pursuant to the requirements of Section 13 or 15(d) of the Securities Exchange Act of 1934, the registrant has duly caused this report to be signed on its behalf by the undersigned, thereunto duly authorized.
| | | | | |
| CONOCOPHILLIPS |
| |
| |
| |
February 16, 202315, 2024 | /s/ Ryan M. Lance |
| Ryan M. Lance Chairman of the Board of Directors and Chief Executive Officer |
Pursuant to the requirements of the Securities Exchange Act of 1934, this report has been signed, as of February 16, 2023,15, 2024, on behalf of the registrant by the following officers in the capacity indicated and by a majority of directors.
| | | | | | | | |
| Signature | | Title |
| | |
| | |
| /s/ Ryan M. Lance | | Chairman of the Board of Directors |
| Ryan M. Lance | | and Chief Executive Officer |
| | (Principal executive officer) |
| | |
| | |
| /s/ William L. Bullock, Jr. | | Executive Vice President and |
| William L. Bullock, Jr. | | Chief Financial Officer |
| | (Principal financial officer) |
| | |
| | |
| /s/ Christopher P. Delk | | Vice President, Controller |
| Christopher P. Delk | | and General Tax Counsel |
| | (Principal accounting officer) |
| | | | | |
| 167 | ConocoPhillips 20222023 10-K | 168 |
| | | | | | | | |
| /s/ Dennis V. Arriola | | Director |
| Dennis V. Arriola | | |
| | |
| | |
| /s/ Caroline M. Devine | | Director
| Caroline M. Devine | |
| | |
| | |
| /s/ Gay Huey Evans | | Director |
| Gay Huey Evans | | |
| | |
| | |
| /s/ Jody Freeman | | Director
| Jody Freeman | |
| | |
| | |
| /s/ Jeffrey A. Joerres | | Director |
| Jeffrey A. Joerres | | |
| | |
| | |
| /s/ Timothy A. Leach | | Director |
| Timothy A. Leach | | |
| | |
| | |
| /s/ William H. McRaven | | Director |
| William H. McRaven | | |
| | |
| | |
| /s/ Sharmila Mulligan | | Director |
| Sharmila Mulligan | | |
| | |
| | |
| /s/ Eric D. Mullins | | Director |
| Eric D. Mullins | | |
| | |
| | |
| /s/ Arjun N. Murti | | Director |
| Arjun N. Murti | | |
| | |
| | |
| /s/ Robert A. Niblock | | Director |
| Robert A. Niblock | | |
| | |
| | |
| /s/ David T. Seaton | | Director |
| David T. Seaton | | |
| | |
| | |
| /s/ R.A. Walker | | Director |
| R.A. Walker | | |
| | | | | |
169ConocoPhillips 2023 10-K | ConocoPhillips 2022 10-K168 |