NORTHRIM BANCORP, INC.
3111 C Street
Anchorage, Alaska 99503
(Address of principal executive offices)(Zip Code)
(907) 562-0062
(Registrant’s telephone number, including area code)
Securities registered pursuant to Section 12(b) of the Act: N/ANone
Securities registered pursuant to Section 12(g) of the Act:
|
| | | | |
| Common Stock, $1.00 par value | The NASDAQ Stock Market, LLC |
| (Title of Class) | (Name of Exchange on Which Listed) |
Indicate by check mark if the registrant is a well-known seasoned issuer, as defined in Rule 405 of the Securities Act. ¨ Yes ý No
Indicate by check mark if the registrant is not required to file reports pursuant to Section 13 or Section 15(d) of the Act. ¨ Yes ý No
Indicate by check mark whether the registrant (1) has filed all reports required to be filed by Section 13 or 15(d) of the Securities Exchange Act of 1934 during the preceding 12 months (or for such shorter period that the registrant was required to file such reports), and (2) has been subject to such filing requirements for the past 90 days. ý Yes ¨ No
Indicate by check mark whether the registrant has submitted electronically and posted on its corporate Web site, if any, every Interactive Data File required to be submitted and posted pursuant to Rule 405 of Regulation S-T (§ 232.405 of this chapter) during the preceding 12 months (or for such shorter period that the registrant was required to submit and post such files). ý Yes ¨ No
Indicate by check mark if disclosure of delinquent filers pursuant to Item 405 of Regulation S-K (§ 229.405 of this chapter) is not contained herein, and will not be contained, to the best of registrant's knowledge, in definitive proxy or information statements incorporated by reference in Part III of this Form 10-K or any amendment to this Form 10-K. ¨
Indicate by check mark whether the registrant is a large accelerated filer, an accelerated filer, a non-accelerated filer, or a smaller reporting company. See the definitions of “large accelerated filer,” “accelerated filer” and “smaller reporting company” in Rule 12b-2 of the Exchange Act.
Large Accelerated Filer ¨ Accelerated Filer ý Non-accelerated Filer ¨ (Do not check if a smaller reporting company) Smaller Reporting Company ¨ ☒ Emerging Growth Company ¨☐
If an emerging growth company, indicate by check mark if the registrant has elected not to use the extended transition period for complying with any new or revised financial accounting standards provided pursuant to Section 12(a) of the Exchange Act. ¨
Indicate by check mark whether the registrant has filed a report on and attestation to its management's assessment of the effectiveness of its internal control over financial reporting under Section 404(b) of the Sarbanes-Oxley Act (15 U.S.C. 7262(b)) by the registered public accounting firm that prepared or issued its audit report. ☒
Indicate by check mark whether the registrant is a shell company (as defined in Rule 12b-2 of the Act). ¨☐ Yes ý No
The aggregate market value of the voting and non-voting common equity held by non-affiliates of the registrant as of June 30, 20182021 (the last business day of the registrant’s most recently completed second fiscal quarter) was $267,274,985.$258,025,106.
Indicate the number of shares outstanding of each of the registrant’s classes of common stock, as of the latest practicable date. 6,879,9025,941,885 shares of Common Stock, $1.00 par value, as of March 12, 2019.4, 2022.
DOCUMENTS INCORPORATED BY REFERENCE
Portions of the registrant's Proxy Statement on Schedule 14A, relating to the registrant’s annual meeting of shareholders to be held on May 23, 2019,26, 2022, are incorporated by reference into Part III of this Form 10-K.
|
| | | | | | | |
| TABLE OF CONTENTS |
| | |
| Part I | |
| Item 1. | | |
| Item 1A. | | |
| Item 1B. | | |
| Item 2. | | |
| Item 3. | | |
| Item 4. | | |
| Part II | |
| Item 5. | | |
| Item 6. | | |
| Item 7. | | |
| Item 7A. | | |
| Item 8. | | |
| Item 9. | | |
| Item 9A. | | |
| Item 9B. | | |
| Item 9C. | Part III | |
| Part III | |
| Item 10. | | |
| Item 11. | | |
| Item 12. | | |
| Item 13. | | |
| Item 14. | | |
| Part IV | |
| Item 15. | | |
| | |
| Item 16. | | |
| | |
PART I
Cautionary Note Regarding Forward Looking Statements
This Annual Report on Form 10-K includes “forward-looking statements”, within the meaning of the Private Securities Litigation Reform Act of 1995, as amended, which are not historical facts. These forward-looking statements describe management’s expectations about future events and developments such as future operating results, growth in loans and deposits, continued success of the Northrim BanCorp Inc.’s style of banking, and the outlookstrength of the local economy in which we operate.operate, and statements related to the expected or potential impact of the novel coronavirus ("COVID-19") pandemic, including any variants of the COVID-19 virus, the timing, availability and efficacy of the COVID-19 vaccines in the jurisdictions in which the Company operates, and related responses of the government that have been, and may in the future be imposed in response to the pandemic. All statements other than statements of historical fact, including statements regarding industry prospects, and future results of operations or financial position and the expected or potential impact of COVID-19 and related responses of the government that have been, and may in the future be imposed in response to the pandemic, made in this report are forward-looking. We use words such as “anticipate,” “believe,” “expect,” “intend” and similar expressions in part to help identify forward-looking statements. Forward-looking statements reflect management’s current plans and expectations and are inherently uncertain. Our actual results may differ significantly from management’s expectations, and those variations may be both material and adverse. Forward-looking statements, whether concerning COVID-19 and the government response related thereto or otherwise, are subject to various risks and uncertainties that may cause our actual results to differ materially and adversely from our expectations as indicated in the forward-looking statements. These risks and uncertainties include: the uncertainties relating to the impact of COVID-19 on the Company's credit quality, business, operations and employees; the availability and terms of funding from government sources related to COVID-19; the timing of Paycheck Protection Program ("PPP") loan forgiveness; the impact of government response that have been, and may in the future be imposed in response to the pandemic, including the effect of previously-enacted stimulus from the federal government; the impact of potential increases in interest rates, inflation, supply-chain constraints, and potential geopolitical instability; the general condition of, and changes in, the Alaska economy; factors that impact our ability to maintain or expand our market share or net interest margin; the sufficiency of our allowance for loan losses and the accuracy of the assumptions or estimates used in preparing our financial statements, including those related to current expected credit losses accounting guidance; our ability to maintain asset quality; our ability to implement our marketing and growth strategies; and our ability to execute our business plan. Further, actual results may be affected by competition on price and other factors with other financial institutions; customer acceptance of new products and services; the regulatory environment in which we operate; and general trends in the local, regional and national banking industry and economy as those factors relate to our cost of funds and return on assets.economy. In addition, there are risks inherent in the banking industry relating to collectability of loans and changes in interest rates. Many of these risks, as well as other risks that may have a material adverse impact on our operations and business, are identified in Item 1A. Risk Factors, and in our filings with the Securities and Exchange Commission. However, you should be aware that these factors are not an exhaustive list, and you should not assume these are the only factors that may cause our actual results to differ from our expectations. In addition, you should note that we do not intend to update any of the forward-looking statements or the uncertainties that may adversely impact those statements, other than as required by law.
ITEM 1. BUSINESS
In this document, please note that references to "we", "our", "us", or the "Company" mean Northrim BanCorp, Inc. and its subsidiaries, unless the context suggests otherwise.
General
We are a publicly traded bank holding company headquartered in Anchorage, Alaska. The Company’s common stock trades on the Nasdaq Global Select Stock Market (“NASDAQ”) under the symbol, “NRIM.” The Company is regulated by the Board of Governors of the Federal Reserve System. We began banking operations in Anchorage in December 1990, and formed the Company as an Alaska corporation in connection with our reorganization into a holding company structure; that reorganization was completed effective December 31, 2001.The Company has grown to be the third largest commercial bank in Alaska and in Anchorage in terms of deposits, with $1.2$2.4 billion in total deposits and $1.5$2.7 billion in total assets at December 31, 2018.2021. Through our fifteen17 banking branches and twelve11 mortgage origination offices, we are accessible to approximately 90% of the AlaskaAlaskan population.
The Company has three direct wholly-owned subsidiaries:
•Northrim Bank (the “Bank”), a state chartered, full-service commercial bank headquartered in Anchorage, Alaska. The Bank is regulated by the Federal Deposit Insurance Corporation (the "FDIC") and the State of Alaska Department of Commerce, Community and Economic Development, Division of Banking, Securities and Corporations. The Bank has fifteen17 branch locations in Alaska; eight in Anchorage, one in Wasilla, two in Juneau, onetwo in Fairbanks, one in Ketchikan, one in Sitka, one in Eagle River, and one in Eagle River. We also operateSoldotna. Additionally, we have a commercial loan production office in Soldotna.WeKodiak. We operate in Washington State through Northrim Funding Services (“NFS”), a factoring business that the Bank started in 2004. We offer a wide array of commercial and consumer loan and deposit products, investment products, and electronic banking services over the Internet;
•Northrim Investment Services Company (“NISC”) was formed in November 2002.In the first quarter of 2006, throughThrough NISC, we purchased anown 24% of the total outstanding equity interest in Pacific Wealth Advisors, LLC (“PWA”), an investment advisory, trust, and wealth management business located in Seattle, Washington, in which we hold 24% of PWA's total outstanding equity interests.Washington. PWA is a holding company that owns Pacific Portfolio Consulting, LLC and Pacific Portfolio Trust Company;
•Northrim Statutory Trust 2 (“NST2”), an entity that we formed in December of 2005 to facilitate a trust preferred securities offering by the Company.
The Bank has three direct wholly-owned subsidiaries:
•Northrim Capital Investments Co. (“NCIC”) is a wholly-owned subsidiary of the Bank, which holds a 100% interest in a residential mortgage holding company, Residential Mortgage Holding Company, LLC, (“RML”). The predecessorthe parent company of RML, Residential Mortgage, LLC was formed in 1998 and has twelve offices throughout Alaska.(collectively “RML”). RML became a wholly-owned subsidiary of NCIC on December 1, 2014. Prior to that, the Company held a 23.5% interest in RML. RML holds a 30% investment in Homestate Mortgage, LLC. In March and December of 2005, NCIC purchased ownership interests totaling 50.1% in Northrim Benefits Group, LLC (“NBG”), an insurance brokerage company that focused on the sale and servicing of employee benefit plans. In August 2017, the Company sold all of its interest in the assets of NBG.
��Northrim Building, LLC (“NBL”) is a wholly-owned subsidiary of the Bank that owns and operates the Company’s main office facility at 3111 C Street in Anchorage.
•Northrim Building LO, LLC is a wholly-owned subsidiary of the Bank that owns and operates the Company’s community branch facility at 2270 E. 37th Avenue in Anchorage.
Segments
The Company operates in two primary segments: Community Banking and Home Mortgage Lending. Measures of the revenues, profit or loss, and total assets for each of the Company's segments are included in this report,Part II. Item 8. "Financial Statements and Supplementary Data", of this report, which is incorporated herein by reference.
Business Strategy
The Company’s primary objective is to become Alaska's most trusted financial institution by adding value for our customers, communities, and shareholders. We aspire to be Alaska's premier bank and employer of choice as a leader in financial expertise, products, and services. We value our state, and we are proud to be Alaskan. We embody Alaska's frontier spirit and values, and we support our communities. We have a sincere appreciation for our customers, and we strive to deliver superior customer first service that is reliable, ethical, and secure. We look for growth opportunities for our customers, our institution, and our employees.
Our strategy is one of value-added growth. Management believes that calculated, sustainable organic and inorganic market share growth coupled with good asset quality, an appropriate core deposit and capital base, operational efficiency, diversified sources of other operating income, and improved profitability is the most appropriate means of increasing shareholder value.
Our business strategy emphasizes commercial lending products and services through relationship banking with businesses and professional individuals. Additionally, we are a significant land development and residential construction lender and an active lender in the commercial real estate market in Alaska. Because of our relatively small size, our experienced senior management team can be more involved with serving customers and making credit decisions, all of which are made in Alaska, allowing us to compete
more favorably with larger competitors for business lending relationships. Our business strategy also emphasizes the origination of a variety of home mortgage loan products, most of which we sell to the secondary market. We retain servicing for home mortgages that we originate and sell to the Alaska Housing Finance Corporation. We believe that there is opportunity to increase the Company’s loan portfolio, particularly in the commercial portion of the portfolio, in the Company’s current market areas through existing and new customers.
Management believes that our real estate construction and term real estate loan departments have developed a strong level of expertise and will continue to compete favorably in our markets. We have also dedicated additional resources to our small business lending operations and have targeted the acquisition of new customers in professional fields including physicians, dentists, accountants, and attorneys. In addition to lending products, in many cases commercial customers also require multiple deposit and affiliateaffiliated services that add franchise value to the Company. While we expect that opportunities for growth in 2019 will be muted mainly due to the lower oil prices compared to pre-2014 levels, which has led to a slower economy in Alaska, weWe believe that these strategies will continue to benefit the Company in 2022, and we intend to continue to grow our balance sheet through increasing our market share. The Company benefits from solid capital and liquidity positions, and management believes that this provides a competitive advantage in the current business environment. (See “Liquidity and Capital Resources” in Item 7, “Management’s Discussion and Analysis of Financial Condition and Results of Operations”.)
The Company’s business strategy also stresses the importance of customer deposit relationships to support its lending activities. Our guiding principle is to serve our market areas by operating with a “Superior Customer First Service” philosophy, affording our customers the highest priority in all aspects of our operations. We believe that our successful execution ofadherence to this philosophy has created a strong core deposit franchise that provides a stable, low cost funding source for expanded growth in all of our lending areas. We have devoted significant resources to future deposit product development, expansion of electronic services for both personal and business customers, and enhancement of the Company's information security related to providing these services.
In addition to market share growth, a significant aspect of the Company’s business strategy is focused on managing the credit quality of our loan portfolio. Over the last several years,As the Company has allocatedcontinues to grow, management is committed to allocating more resources to the credit management function of the Bank to provide enhanced financial analysis of our largest, most complex loan relationships to further develop our processes for analyzing and managing various concentrations of credit within the overall loan portfolio, and to develop strategies to improve or collect our existing loans.portfolio. Continued success in maintaining or further improving the credit quality of our loan portfolio and managing our level of other real estate owned is a significant aspect of the Company’s strategy for attaining sustainable, long-term market growth to produce increased shareholder value.
EmployeesHuman Capital Resources
We believe that we provide a high level of customer service. To achieve our objective of providing “Superior Customer First Service”, in managing its human capital resources, management emphasizes the hiring and retention of competent and highly motivated employees at all levels of the organization. Management believes that a well-trained and highly motivated core of employees allows maximum personal contact with customers in order to understand and fulfill customer needs and preferences. This “Superior Customer First Service” philosophy is combined with our emphasis on personalized, local decision making. The Company continues to enhance our company-wide employee training program which focuses on Northrim culture, "Superior Customer First Service,Service", general sales skills, and various technical areas. All applicants and employees are treated with the same high level of respect regardless of their gender, ethnicity, religion, national origin, age, marital status, political affiliation, sexual orientation, gender identity, disability or protected veteran status. The Company complies with all applicable state and local laws governing nondiscrimination in employment in every location in which the Company operates.
The Company strives to continuously evaluate our human capital polices for improvement and alignment with current best practices. The Company recently added the Juneteenth National Independence Day and Indigenous People's Day to our lineup of paid holidays for employees. Additionally, effective January 1, 2022 the Company enhanced its paid parental leave program for employees following the birth of a child or the placement of a child in connection with an adoption.
Employee Profile
We consider our relations with our employees to be highly satisfactory. We had 430451 full-time equivalent employees at December 31, 2018.2021. None of our employees are covered by a collective bargaining agreement. Of the 430451 full-time equivalent employees, 320321 were Community Banking employees and 110130 were Home Mortgage Lending employees.
Among the Company's full-time equivalent employees as of December 31, 2021, 72% identify as women and 28% as men. Approximately 34% of the workforce identify as a member of a racial minority, 4% identify as individuals with a disability, and 2% identify as veterans. In executive and senior management positions, 56% identify as women and 44% as men as of December 31, 2021. Approximately 4% of those in executive and senior management positions identify as a member of a racial minority, 4% identify as individuals with a disability, and 4% identify as veterans.
Diversity, Equity, and Inclusion
We strive to ensure a respectful, diverse, and inclusive environment and experience for all of our employees. We support and cultivate an open and respectful environment where everyone can actively contribute, have equal access to opportunities and resources, be themselves, and realize their potential. This is reflected in our policies, which encourage individual values, strengths and protections to provide gender diversity and equality in the workplace and are reinforced through our annual anti-harassment training. As an Equal Opportunity Employer, we emphasize inclusion through hiring and compensation practices and consider a pool of diverse candidates for open positions and internal advancement opportunities and treat all our applicants with the same high level of respect regardless of their gender, ethnicity, religion, national origin, age, marital status, political affiliation, sexual orientation, gender identity, disability or protected veteran status. To address issues related to pay discrimination, we do not ask potential candidates about their current or previous compensation during the hiring process, and we incorporate equal and fair pay reviews into every employment compensation decision. Our annual Affirmative Action Plan continues to focus our diversity, equity, and inclusion efforts on increasing the number of veterans and persons with disabilities in our workforce.
Support of Human Capital in Response to COVID-19
COVID-19 acted as a catalyst for expanding workforce flexibility options at Northrim. We have increased the percentage of employees working remotely from less than 8% before the pandemic to approximately 50% of the Company's employees working remotely as of December 31, 2021 either on a full- or part-time basis, including employees that work remotely part-time and work in the office part-time, which we refer to as a "hybrid" work from home arrangement. However, these remote working schedules are no longer directly due to the COVID-19 pandemic. Like many other entities, the percentage of the Company's work force that works remotely in some fashion increased during the pandemic and is expected to stay approximately consistent with current levels in the future as the Company has adjusted to the new environment. We also offer our employees other flexible work options, such as variable work hours, condensed workweeks and part-time hours. There have been no material impacts to our operations due to the increase in these alternative working arrangements and we are pleased to provide our employees with more flexibility to accommodate their needs. In addition, Northrim provides for a strong work/life balance, including generous paid time off and paid parental leave.
The Company expanded tele-health and employee assistance program benefits to help employees manage their physical and emotional health during the pandemic. The Company's philosophy towards employee accommodations related to current and future consequences related to COVID-19 is to be as flexible as possible while balancing the Company's operational needs.
Throughout the pandemic, we have continued to follow all CDC approved COVID-19 safety measures to ensure the safety and wellness of our employees, customers and vendors. We provide employees paid time off to receive their COVID-19 vaccinations and recover from vaccination side effects that prevent them from working.
Products and Services
Community Banking
Lending Services:We have an emphasis on commercial and real estate lending. Our loan products include short and medium-term commercial loans, commercial credit lines, construction and real estate loans, and consumer loans. We emphasize providing financial services to small and medium-sized businesses and to individuals. These types of lending products have provided us with needed market opportunities and generally provide higher net interest margins compared to other types of lending such as consumer lending. However, they also believeinvolve greater risks, including greater exposure to changes in local economic conditions.
Additionally in 2021 and 2020, we haveoriginated a significant niche in constructionamount of Paycheck Protection Program ("PPP") loans. The Coronavirus Aid, Relief. and land developmentEconomic Security ("CARES") Act established several new temporary U.S. Small Business Administration (“SBA”) loan programs to assist U.S. small businesses through the COVID-19 pandemic. One of the new loan programs is the PPP, an expansion of the SBA’s 7(a) loan program and the Economic Injury Disaster Loan Program. The American Rescue Plan Act of 2021 ("ARP Act") provided additional funding for the PPP. PPP provides loans to small businesses who were affected by economic conditions as a result of COVID-19 to provide cash-flow assistance to employers who maintain their payroll (including healthcare and certain related expenses), mortgage interest, rent, leases, utilities and interest on existing debt during this emergency. Eligible borrowers need to make a good faith certification that the uncertainty of current economic conditions make requesting assistance necessary to support ongoing operations. Pursuant to the provisions
of Section 1106 of the CARES Act, borrowers may apply to the Bank for loan forgiveness of all or a portion of the loan, subject to certain eligibility requirements and conditions.
Our lending in Anchorage, Fairbanks,operations are guided by loan policies, approval procedures, and amount limitations. Our loan policies outline the Matanuska-Susitna Valley,basic policies and procedures by which lending operations are conducted. Generally, the Kenai Peninsula,policies address our desired loan types, target markets, underwriting and Southeast Alaska. (See “Loans” in Item 7 “Management’s Discussioncollateral requirements, terms, interest rate and Analysisyield considerations, and compliance with laws and regulations. The policies are reviewed and approved annually by the board of Financial Conditiondirectors of the Bank. Our Quality Assurance Department provides a detailed financial analysis of our largest, most complex loans. In addition, the Quality Assurance Department, along with the Chief Credit Officer of the Bank, have developed processes to analyze and Resultsmanage various concentrations of Operations”.)credit within the overall loan portfolio. The Credit Administration Department monitors the procedures and processes for both the analysis and reporting of problem loans, and also develops strategies to resolve problem loans based on the facts and circumstances for each loan. Finally, our Internal Audit Department also performs an independent review of each loan portfolio for compliance with loan policy, as well as a review of credit quality. The Internal Audit review follows the FDIC sampling guidelines, and a review of each portfolio is performed on an annual basis.
Purchase of accounts receivable: We provide short-term working capital to customers primarily in our Alaska markets as well as Washington, Oregon and some other states by purchasing their accounts receivable through NFS. Our purchased receivable activity is guided by policies that outline risk management, documentation, and approval limits. In 2019,2022, we expect NFS to continue to penetrate these markets and to continue to contribute to the Company’s profitability.
Deposit Services: Our deposit services include business and personal noninterest-bearing checking accounts and interest-bearing time deposits, checking accounts, savings accounts, and savingsindividual retirement accounts. Our interest-bearing accounts generally earn interest at rates established by management based on competitive market factors and management’s desire to increase or decrease certain types or maturities of deposits.
Several of our deposit services and products are:
•A specialized business checking account customized to account activity;
•A money market deposit account;
•A “Jump-Up” certificate of deposit (“CD”) that allows additional deposits with the opportunity to increase the rate to the current market rate for a similar term CD;
• A savings account that is priced like a money market account that allows additional deposits, quarterly withdrawals without penalty, and tailored maturity dates;
•IntraFi® Network Deposits℠ and business sweep;
Arrangements to courier noncash deposits from our customers to their local Northrim Bank branch.
•Consumer online banking, mobile app, and mobile deposit;
•Business online banking, business mobile app, and business mobile deposit; and
•Instantly issued debit cards for business and consumer accounts at account opening.
Other Services: In addition to our traditional deposit and lending services, we offer our customers several convenience services: Consumer Online Banking, Mobile App and Mobile Deposit, Mobile Web and Text Banking, Business Online Banking,
Business Mobile App and Business Mobile Deposit,consumer online account opening, Personal Finance, Online Documents, Consumer Debit Cards, Business Debit Cards, instantly issuedMy Rewards for consumer debit cards, at account opening,retail lockbox services, card controls, Consumer Credit Cards, Business Credit Cards, Business Employee Purchase Cards, home equity advantage access card,cards, telebanking, and automated teller services. Other special services include personalized checks at account opening, overdraft protection from a savings account, extended banking hours and commercial drive-up banking at many locations, automatic transfers and payments, People Pay (a peer to peerpeer-to-peer payment functionality), external transfers, Bill Pay, wire transfers, direct payroll deposit, electronic tax payments, Automated Clearing House origination and receipt, remote deposit capture, account reconciliation and positive pay, merchant services, cash management programs and sweep options to meet the specialized needs of business customers, annuity products, and long term investment portfolios.
Other Services Provided Through Affiliates and Former Affiliates Whom We Continue To Work With: Prior to August of 2017, the Company sold and serviced employee benefit plans for small and medium sized businesses in Alaska through NBG, an insurance brokerage company. In August 2017, we sold our interest in the assets of NBG, but we have continued our relationship with Acrisure, LLC, who purchased the assets of NBG, through an ongoing referral agreement. Our
affiliate PWA provides investment advisory, trust, and wealth management services for customers who are primarily located in the Pacific Northwest and Alaska. We plan to continue to leverage these affiliate relationships to strengthen our existing customer base and bring new customers into the Bank.
Significant Business Concentrations:No individual or single group of related accounts is considered material in relation to our total assets or total revenues, or to the total assets, deposits or revenues of the Bank, or in relation to our overall business. Based on classification by North American Industry Classification System ("NAICS"), there are no segments that exceed 10% of portfolio loans, except for real estate (see Note 6,5, Loans and Credit Quality, of the Notes to Consolidated Financial Statements included in Part II. Item 8 of this report for a breakout of real estate loans). In addition to its review of NAICS codes, the Company has also identified concentrations in one specialized industry.various industries that may be adversely impacted by the COVID-19 pandemic and a decline in oil prices. We estimate that as of December 31, 2018 approximately 6%2021 the Company had $117.0 million, or 8% of total loans, in the healthcare sector, $94.4 million, or 7% of portfolio loans, have direct exposure toin the tourism sector, $63.6 million, or 4%, in the oil and gas industrysector, $59.6 million, or 4% of portfolio loans, in Alaska.the aviation (non-tourism) sector, $55.8 million, or 4% of total loans in the fishing sector, $54.1 million, or 4% in the accommodations sector, and $46.6 million, or 3% in the restaurants and breweries sector and $31.9 million, or 2%, in retail loans. Additionally, approximately 40%33% of our loan portfolio at December 31, 20182021 is attributable to 2732 large borrowing relationships. Moreover, our business activities are currently focused primarily in the state of Alaska. Consequently, our results of operations and financial condition are somewhat dependent upon the general trends in the Alaska economy and, in particular, the residential and commercial real estate markets in Anchorage, Juneau, Fairbanks, the Matanuska-Susitna Valley, Ketchikan, Sitka, and to a lessorlesser extent, the Kenai Peninsula. Peninsula and Kodiak.
Home Mortgage Lending
Lending Services:The Company originates 1-4 family residential mortgages throughout Alaska most of which we sell to the secondary market. Residential mortgage choices include several products from the Alaska Housing Finance Corporation ("AHFC") including first-time homebuyer, veteran's and rural community programs; Federal Housing Authority, or "FHA" loans; Veterans Affairs, or "VA" loans; Jumbo loans; and various conventional mortgages. The Company retains servicing rights on loans sold to the Alaska Housing Finance Corporation since implementing a new loan servicing program in July 2015.
Alaska Economy
Our growth and operations depend uponare impacted by the economic conditions of Alaska and the specific markets we serve. Significant changes in the Alaska economy and the markets we serve eventually could have a positive or negative impact on the Company. Alaska is strategically located on the Pacific Rim, within nine hours by air from 95% of the northern hemisphere, and Anchorage has become a worldwide air cargo and transportation link between the United States and international business in Asia and Europe. The economy of Alaska is dependent upon natural resource industries. Key sectors of the Alaska economy are the oil industry, government and military spending, and the fishing, mining, tourism, air cargo, transportation, and construction industries, as well as health services.
Recent Economic Developments
The oil industry playsAlaska economy showed broad improvements in 2021 as it rebounded from the pandemic lows of 2020. Management noted that a significant rolesteady recovery of jobs in the economy of Alaska, and revenues for the State of Alaska are sensitive to the volatilitynearly every sector in oil prices. According to the State of Alaska Department of Revenue, in 2018 approximately 80% of the unrestricted revenues that funded the Alaska state government in the fiscal year ending June 30, 2018 were generated through various taxes and royalties on the oil industry. This is up2021 resulted from approximately 65% in 2017 and 72% in 2016 due to an increase in the price of oil compared to these periods but is still below historical levels. In 2016 and 2017, following a decrease in the price of oil in 2014 and 2015, the State of Alaska used savings from previous years to fund its budget deficits. Asimproved independent tourism, rising oil prices, have stabilized at current levels, we believe the level of revenues to support current statea strong housing market and consumer liquidity from government spending continues to be a serious concern. If oil prices remain at their current relatively low levels in the longer term, we anticipate it will be a concern for Alaska's long-term economic growth. However, we believe Alaska's economy is less sensitive to oil price volatility in the short-term than Alaska's state government budget. While state government revenue from oil royalties is immediately and directly impacted by a drop in oil prices, westimulus programs. We believe that the large scalepotential effects of rising interest rates, high inflation, and nature of oil wells in Alaskasupply chain disruptions are such that project commitments that currently exist willthe most likely not be disrupted by short-term price volatility. While we believe that subcontractors who provide oil field services
and transportation for the large, multi-national companies that produce oil in Alaska experienced a slowdown in revenues in 2017 and 2016 as a result of the decrease in prices, we are encouraged by recent announcements by several oil exploration companies announcing new oil fields on the North Slope and increased exploration activity in 2018 that could lead to future increases in oil production over time.
We believe the long-term growth of the Alaska economy will most likely be determined by large scale natural resource development projects. Several multi-billion dollar projects can potentially advance in the moderate-term. Some of these projects include copper, gold and molybdenum productionpressing issues at the Donlin mine and continued exploration in the National Petroleum Reserve Alaska and potential oil exploration in the Arctic National Wildlife Refuge. Becausestart of their size, we believe each of these projects faces tremendous challenges. We believe contentious political decisions need to be made by government regulators, issues need to be resolved in the court system, and multi-billion dollar financial commitments need to be made by the private sector if they are to advance. If none of these projects moves forward in the next ten years, we believe state revenues will probably continue to decline with falling oil production from older fields on the North Slope of Alaska. We anticipate the decline in state revenues will likely have a negative effect on Alaska’s economy.2022.
Prior to the decline in oil prices that began in 2014, Alaska's economy had been stronger relative to many other states in the nation, due largely to a natural resources based economy which has benefited from high commodity and energy prices. As of December 31, 2018, Alaska's Constitutional Budget Reserve was $1.7 billion and the Alaska Permanent Fund had a balance of $61.8 billion. The Alaska Permanent Fund pays an annual dividend to every eligible Alaskan citizen. According to a January 18, 2019 press release from the Alaska Department of Labor and Workforce Development, the seasonally adjusted unemployment rates in the United States and Alaska were 6.3% and 3.9%, respectively, in December 2018. Prior to November 2014, the unemployment rate in Alaska had been lower than that of the United States as a whole since 2009. As general economic conditions in the United States have recovered over the past several years and oil prices have significantly declined, Alaska's unemployment rate now exceeds that of the United States as a whole. The Alaska Department of Labor predicts("DOL") reports total payroll jobs in Alaska in December 2021 increased 2.7% or 8,000 jobs compared to December of 2020. Tourism related jobs were the hardest hit from travel restrictions and have also been the fastest to recover. According to the DOL, the Leisure and Hospitality sector improved 14% between December of 2020 and December of 2021. This is now only 4,500 jobs lower than the total of 31,400 jobs in this sector in December of 2019. Other major sectors showing improvement over the last 12 months include Oil & Gas (+9.8%); Trade, Transport, and Utilities (+3.1%); Construction (+2.8%); Financing Activities (+1.9%); Professional & Business Services (+0.8%) and Health Care (+0.8%). The Information sector was the only private sector to not show growth in 2021. It remained flat at 4,800 jobs at the end of 2020 and 2021. The Government sector was steady at 77,700 jobs. Based on the DOL report, gains in federal and local government employment offset declines in state government positions.
Alaska’s Gross State Product (“GSP”) seasonally adjusted at annualized rates for the third quarter of 2021 was $55.5 billion, compared to $49.7 billion in the third quarter of 2020, according to the Federal Bureau of Economic Analysis ("BEA")
in a recoveryreport that was released December 23, 2021. Alaska’s GSP declined 0.6% in the third quarter of 1,400 jobs, or an approximately 0.4%2021 after increasing 1.8% in the second quarter of 2021.
Alaska’s seasonally adjusted personal income for the third quarter of 2021 was $48.5 billion compared to $46.0 billion seasonally adjusted at annualized rates in the third quarter of 2020, according to the BEA. Alaska’s personal income grew 2.4% in the third quarter of 2021, over the second quarter, primarily due to a $662 million increase in wage earnings. This resulted from inflationary pressure on salaries and an improvement in the total employmentnumber of jobs. Wage gains more than offset the $413 million decrease in government transfer payments to Alaskans in the third quarter of 2021.
The price of Alaska North Slope crude oil began 2021 averaging $55.56 in January and climbed steadily throughout the year to a monthly average high of $84.36 a barrel in October. The monthly average for December 2021 was $76.02.
Alaska’s home mortgage delinquency and foreclosure levels continue to be better than most of the nation. According to the Mortgage Bankers Association, Alaska’s foreclosure rate improved from 0.63% at the end of 2019 followingto 0.45% at the end of 2020. The foreclosure rate continued to improve in each of the first three quarters of 2021 to 0.33% in the third quarter of 2021. The comparable national average rate was higher than Alaska at 0.46% in the third quarter of 2021. We believe that the foreclosure rates are somewhat misleading because the recently ended federal moratorium on foreclosure activity on occupied homes led to declining foreclosure numbers, even though job losses strained the economy and borrowers' ability to pay.
The Mortgage Bankers Association survey reported that the percentage of approximately 0.7%delinquent mortgage loans at the end of total employment2019 in 2018Alaska was 2.9%. This increased to 6.2% at the end of 2020 after the effects of COVID-19 impacted jobs. In the first quarter of 2021 it improved to 5.4% in Alaska and 1.3% in 2017. While it is an improvement compared to job lossesagain in the last 2 years, thesecond quarter to 5.1%. The most recent budget proposaldata available is the third quarter of 2021, which improved to 4.77%. According to the survey, the comparable delinquency rate for the entire country remains higher than Alaska at 5.04% in the third quarter of 2021.
According to the Alaska Multiple Listing Services, the average sales price of a single family home in Anchorage rose 6.9% in 2021 to $424,266. Average sales prices in the Matanuska Susitna Borough rose 15.6% in 2021 to $347,962, continuing a decade of consecutive price gains. These two markets represent where the vast majority of the Bank’s residential lending activity occurs.
The number of housing units sold in Anchorage was up significantly in 2021 by 11%, following an increase of 19.6% in 2020, as reported by the Governor may resultAlaska Multiple Listing Services. The Matanuska Susitna Borough also had strong sales activity, up 11.5% in uncertainty2021 and 9.7% in job growth. The Company anticipates these factors will have an impact on our ability to grow organically in the next few years.2020.
We believe our exposurethat the low interest rate environment has been a major factor in the strength of the housing market. According to the tourism industry, which increased following our acquisitionFederal Reserve Bank of Alaska Pacific Bancshares, Inc. ("Alaska Pacific")St. Louis, the average 30 year fixed rate mortgage in Southeast Alaskathe U.S. hit an all-time record low in 2014, diversifies2020. Rates began 2020 at 3.7% in the Company's customer base. We believe this helps mitigatefirst week of January and fell one percent to 2.7% by the effect thatend of the declineyear. Rates began to rise slightly in natural resource industries, specifically2021 and finished the oil industry, in Alaska has had on the Company's operations. Southeast Alaska is the primary destination for cruise ships that visit Alaska. Based on the latest information from Rain Coast Data, approximately one million cruise ship tourists visited Southeast Alaska in recent years.year at 3.11%.
A material portion of our loans at December 31, 2018,2021, were secured by real estate located in greater Anchorage, Matanuska-Susitna Valley, Fairbanks, and Southeast Alaska. Twenty-nine percentIn 2021, 36% of our revenue in 2018 was derived from the residential housing market in the form of loan fees and interest on residential construction and land development loans and income from RML as compared to 30%45% and 36%31% in 20172020 and 2016,2019, respectively. Real estate values generally are affected by economic and other conditions in the area where the real estate is located, fluctuations in interest rates, changes in tax and other laws, and other matters outside of our control. A decline in real estate values in the greater Anchorage, Matanuska-Susitna Valley, Fairbanks, and Southeast Alaska areas could significantly reduce the value of the real estate collateral securing our real estate loans and could increase the likelihood of defaults under these loans. At
Long Term Economic Factors
We believe the long-term growth of the Alaska economy will most likely be determined by large scale natural resource development projects. Several multi-billion dollar projects can potentially advance in the moderate-term. Some of these projects include copper, gold and molybdenum production at the proposed Donlin mine and continued exploration in the National Petroleum Reserve Alaska. Because of their size, we believe each of these projects faces tremendous challenges. We believe various political decisions need to be made by government regulators, issues need to be resolved in the court system, and multi-billion dollar financial commitments need to be made by the private sector if these large natural resource projects are to advance. If none of these projects moves forward in the next ten years, we believe state revenues will continue to decline with falling oil production from older fields on the North Slope of Alaska. We anticipate the decline in state revenues will likely have a negative effect on Alaska’s economy.
The oil industry plays a significant role in the economy of Alaska, but revenues for the State of Alaska are less dependent on the oil industry than they have been historically due to the implementation of a percent of market value ("POMV") concept that has balanced and created more certainty in state revenue streams. Part of the POMV concept creates an allocation of a portion of investment earnings to unrestricted revenue instead of restricted revenue. According to the State of Alaska Department of Revenue, approximately 5% of total state revenues of $29.8 billion in the fiscal year ending June 30, 2021 were generated through various taxes and royalties on the oil industry. Investment earnings were 66% of the total, and federal dollars were 26%. In the fiscal year ending June 30, 2020, approximately 20% of total state revenues of $8.7 billion were generated through various taxes and royalties on the oil industry while investment earnings and federal dollars accounted for 21% and 48%, respectively. In 2021 and 2020, investment earnings represented 65% and 66%, respectively, of unrestricted revenues. As of December 31, 2018, $342.42021, Alaska's Constitutional Budget Reserve was $1.1 billion and the Alaska Permanent Fund had a balance of $82 billion. Investment revenue generated by the Alaska Permanent Fund is also used to pay an annual dividend to every eligible Alaskan citizen.
Even though we believe that the implementation of the POMV concept is a positive for the state of Alaska's financial well-being, we anticipate that if oil prices drop to lower levels in the longer term it will be a concern for Alaska's long-term economic growth. However, we believe Alaska's economy is less sensitive to oil price volatility within a six- to twelve-month time frame than Alaska's state government budget. While state government revenue from oil royalties is immediately and directly impacted by a drop in oil prices, we believe that the large scale and nature of oil wells in Alaska are such that project commitments that currently exist will most likely not be disrupted by short-term price volatility.
We believe our exposure to the tourism industry diversifies the Company's customer base in the long-term. We believe this helps mitigate the effect that a decline in natural resource industries, specifically the oil industry, in Alaska would have on the Company's operations. Southeast Alaska is the primary destination for cruise ships that visit Alaska. Based on the latest information from Rain Coast Data, approximately one million or 35%,cruise ship tourists have visited Southeast Alaska annually in recent years and in 2019, this increased 7% to 1.2 million. However, in 2020, there was essentially no cruise ship activity and in 2021 there were approximately 116,000 cruise ship visitors in Alaska according to the State of our loan portfolio was represented by commercial loansAlaska Department of Labor and Workforce Development.. The decrease in Alaska. 2020 and 2021 is primarily due to the COVID-19 pandemic. However, the State of Alaska Department of Labor and Workforce Development reported in its January 2022 issue of Alaska Economic Trends Magazine that the cruise industry expects 1.5 million cruise ship visitors in Alaska in 2022, which would be an all time high if ships reach capacity.
Alaska’s residents are not subject to any state income or state sales taxes. For over 30 years, Alaska residents have received annual distributions payable in October of each year from the Alaska Permanent Fund Corporation, which is supported by royalties from oil production. The distribution was $1,600$1,114 per eligible resident in 20182021 for an aggregate distribution of approximately $726$700 million. The Anchorage Economic Development Corporation estimates that, for most Anchorage households, distributions from the Alaska Permanent Fund Corporation exceed other Alaska taxes to which those households are subject (primarily real estate taxes).subject.
Competition
We operate in a highly competitive and concentrated banking environment. We compete not only with other commercial banks, but also with many other financial competitors, including credit unions (including Alaska USA Federal Credit Union, one of the nation’s largest credit unions), finance companies, mortgage banks and brokers, securities firms, insurance companies, private lenders, and other financial intermediaries, many of which have a state-wide or regional presence, and in some cases, a national presence. Many of our competitors have substantially greater resources and capital than we do and offer products and services that are not offered by us. Our non-bank competitors also generally operate under fewer regulatory constraints, and in the case of credit unions, are not subject to income taxes. We estimate that credit unions in Alaska have a 44%42% share of total deposits held in banks and credit unions in the state as of June 30, 2018.2021. Changes in credit union regulationsoperating practices have effectively eliminated the “common bond” of membership requirement and liberalized their lending authority to include business and real estate loans on par with commercial banks. The differences in resources and regulation may make it harder for us to compete profitably, to reduce the rates that we can earn on loans and investments, to increase the rates we must offer on deposits and other funds, and adversely affect our financial condition and earnings.
As our industry becomes increasingly dependent on and oriented toward technology-driven delivery systems, permitting transactions to be conducted via a computer or wireless device,electronically, non-bank institutions are able to attract funds and provide lending and other financial services even without offices located in our primary service area. Some insurance companies and brokerage firms compete for deposits by offering rates that are higher than may be appropriate for the Company in relation to its asset and liability management objectives. However, we offer a wide array of deposit products and services and believe we can compete effectively through relationship based pricing and effective delivery of “Superior Customer First Service”. We also compete with full service investment firms for non-bank financial products and services offered by PWA and through retail investment advisory services and annuity investment products that we offer through a third-party vendor.
Currently, there are seven commercial banks operating in Alaska. At June 30, 2018,2021, the date of the most recently available information, Northrim Bank had approximately an 11%a 13% share of the Alaska commercial bank deposits, 15%18% in the Anchorage area, 14%20% in Juneau, 12%16% in Matanuska-Susitna, 13% in Sitka, 11%10% in Matanuska-Susitna,Fairbanks, 6% in Fairbanks,Ketchikan, and 5%7% in Ketchikan.the Kenai Peninsula.
The following table sets forth market share data for the commercial banks and credit unions having a presence in Alaska as of June 30, 2018,2021, the most recent date for which comparative deposit information is available.
| | | | | | | | | | | | | | |
| Financial institution | Number of branches | Total deposits (in thousands) | Market share of total financial institution deposits | Market share of total bank deposits |
Northrim Bank(1) | 17 | $2,178,080 | | 8 | % | 13.0 | % |
Wells Fargo Bank Alaska(1) | 40 | 7,529,724 | | 26 | % | 45.0 | % |
First National Bank Alaska(1) | 27 | 3,910,717 | | 14 | % | 23.4 | % |
Key Bank(1) | 12 | 1,531,444 | | 5 | % | 9.1 | % |
First Bank(1) | 9 | 686,502 | | 2 | % | 4.1 | % |
Mt. McKinley Bank(1) | 5 | 504,085 | | 2 | % | 3.0 | % |
Denali State Bank(1) | 5 | 407,560 | | 1 | % | 2.4 | % |
| Total bank branches | 118 | $16,748,112 | | 58 | % | 100 | % |
Credit unions(2) | 84 | $12,021,865 | | 42 | % | NA |
| Total financial institution branches | 202 | $28,769,977 | | 100 | % | 100 | % |
|
| | | | | | | | |
| Financial institution | Number of branches | Total deposits (in thousands) | Market share of total financial institution deposits | Market share of total bank deposits |
Northrim Bank(1) | 14(3) |
| $1,222,336 |
| 6 | % | 11 | % |
Wells Fargo Bank Alaska(1) | 47 | 5,977,132 |
| 28 | % | 50 | % |
First National Bank Alaska(1) | 28 | 2,413,401 |
| 11 | % | 20 | % |
Key Bank(1) | 15 | 1,206,420 |
| 6 | % | 10 | % |
First Bank(1) | 9 | 504,670 |
| 2 | % | 4 | % |
Mt. McKinley Bank(1) | 5 | 324,165 |
| 2 | % | 3 | % |
Denali State Bank(1) | 5 | 260,068 |
| 1 | % | 2 | % |
| Total bank branches | 123 |
| $11,908,192 |
| 56 | % | 100 | % |
Credit unions(2) | 98 |
| $9,278,777 |
| 44 | % | NA |
|
| Total financial institution branches | 221 |
| $21,186,969 |
| 100 | % | 100 | % |
(1) FDIC Summary of Deposits as of June 30, 2018.2021.
(2) SNL Financial Deposit Market Share Summary as of June 30, 2018.2021.
(3) Additional branch opened subsequent to June 30, 2018.
Supervision and Regulation
The Company is a bank holding company within the meaning of the Bank Holding Company Act of 1956 (the “BHC Act”) registered with and subject to examination by the Board of Governors of the Federal Reserve System (the “FRB”). The Company’s bank subsidiary is an Alaska-state chartered commercial bank and is subject to examination, supervision, and regulation by the Alaska Department of Commerce, Community and Economic Development, Division of Banking, Securities and Corporations (the “Division”). The FDIC insures Northrimthe Bank’s deposits and also examines, supervises, and regulates Northrimthe Bank. The Company’s affiliated investment advisory and wealth management company, Pacific Portfolio Consulting, LLC, is subject to and regulated under the Investment Advisors Act of 1940 and applicable state investment advisor rules and regulations. The Company’s affiliated trust company, Pacific Portfolio Trust Company, is regulated as a non-depository trust company under the trust company laws of the State of Washington and is subject to supervision and examination by the Department of Financial Institutions of Washington State.
The Company’s earnings and activities are affected, among other things, by legislation, by actions of the FRB, the Division, the FDIC and other regulators, by local legislative and administrative bodies, and decisions of courts. These include limitations on the ability of Northrimthe Bank to pay dividends to the Company, numerous federal and state consumer protection laws imposing requirements on the making, enforcement, and collection of consumer loans, and restrictions on and regulation of the sale of mutual funds and other uninsured investment products to customers.
Regulation of banks and the financial services industry has been undergoing major changes in recent years, including the enactment in 2010 of the Dodd-Frank Wall Street Reform and Consumer Protection Act (“Dodd-Frank Act”). and several provisions were significantly changed by enactment of the Economic Growth Regulatory Relief and Consumer Protection Act in May 2018. The Dodd-Frank Act significantly modifies and expands legal and regulatory requirements imposed on banks and other financial institutions.
The Dodd-Frank Act has significantly affected Northrimthe Bank and its business and operations. The Dodd-Frank Act permanently increased the maximum amount of deposit insurance coverage to $250,000 per depositor and deposit insurance assessments paid by Northrimthe Bank are now based on Northrimthe Bank’s total assets. Other Dodd-Frank Act changes include: (i) tightened capital requirements for Northrimthe Bank and the Company; (ii) new requirements on parties engaged in residential mortgage origination, brokerage, lending and securitization; (iii) expanded restrictions on affiliate and insider transactions; (iv) enhanced restrictions on management compensation and related governance procedures; (v) creation of a federal Consumer Financial Protection Bureau (the "CFPB") with broad authority to regulate consumer financial products and services; and (vi) restrictions and prohibitions on the ability of banking entities to engage in proprietary trading and to invest in or have certain relationships with hedge funds and private equity funds.
The Trump administrationIn December 2013, the Federal Reserve, the Office of the Comptroller of the Currency, the FDIC, the Securities and various members of Congress from timeExchange Commission (“SEC”), and the Commodities Futures Trading Commission issued final rules to time have expressed a desire to modify or repeal partsimplement certain provisions of the Dodd-Frank Act. We cannot predict whether any modificationAct commonly known as the “Volcker Rule.” The Volcker Rule, as amended on August 20, 2019, generally prohibits U.S. banks from engaging in proprietary trading and restricts those banking entities from sponsoring, investing in, or repeal will be enacted or, if so, any effect they would have on our business, operation or financial condition orhaving certain relationships with hedge funds and private equity funds. The prohibitions under the Volcker Rule are subject to a number of statutory exemptions, restrictions, and definitions. The Volcker Rule has not had a material impact on the financial services industry in general. Company’s Consolidated Financial Statements, but we continue to evaluate its application to our current and future operations.
The Gramm-Leach-Bliley Act (the “GLB Act”), which was enacted in 1999, allows bank holding companies to elect to become financial holding companies, subject to certain regulatory requirements. In addition to the activities previously permitted bank holding companies, financial holding companies may engage in non-banking activities that are financial in nature, such as securities, insurance, and merchant banking activities, subject to certain limitations. The Company could utilize this structure to accommodate an expansion of its products and services in the future.
Bank holding companies, such as the Company, are subject to a variety of restrictions on the activities in which they can engage and the acquisitions they can make. The activities or acquisitions of bank holding companies, such as the Company, that are not financial holding companies, are limited to those which constitute banking, managing or controlling banks or which are closely related activities. A bank holding company is required to obtain the prior approval of the FRB for the acquisition of more than 5% of the outstanding shares of any class of voting securities or substantially all of the assets of any bank or bank holding company. Nonbank acquisitions and activities of a bank holding company are also generally limited to the acquisition of up to 5% of the outstanding shares of any class of voting securities of a company unless the FRB has previously determined that the nonbank activities are closely related to banking, or prior approval is obtained from the FRB.
The GLB Act also included extensive consumer privacy provisions. These provisions, among other things, limit the ability of banks and other financial institutions to disclose nonpublic consumer information to non-affiliated third parties. The regulations require full disclosure of the Company’s privacy policypolicies and allow consumers to consumers and mandate offering the consumer the ability to “opt out” of having non-publicprevent certain personal information disclosed tofrom being shared with non-affiliated third parties. PursuantThe Fair and Accurate Credit Transaction Act (“FACT Act”) requires financial institutions to these provisions,develop and implement an identity theft prevention program to detect, prevent and mitigate identity theft “red flags” to reduce the federal banking regulators adopted privacy regulations.risk that customer information will be misused to conduct fraudulent financial transactions. As a result of the Dodd-Frank Act, the rule-making authority for the privacy provisions of the GLB Act has been transferred to the CFPB. In addition, the states are permitted to adopt more extensive privacy protections through legislation or regulation.
There are various legal restrictions on the extent to which a bank holding company and certain of its nonbank subsidiaries can borrow or otherwise obtain credit from their banking subsidiaries or engage in certain other transactions with or involving those banking subsidiaries. With certain exceptions, federal law imposes limitations on, and requires collateral for, extensions of credit by insured depository institutions, such as Northrimthe Bank, to their non-bank affiliates, such as the Company. In addition, new capital rules may affect the Company's ability to pay dividends.
Subject to certain limitations and restrictions, a bank holding company, with prior approval of the FRB, may acquire an out-of-state bank. Banks in states that do not prohibit out-of-state mergers may merge with the approval of the appropriate federal banking agency. A state bank may establish a de novo branch out of state if such branching is permitted by the other state for state banks chartered by such other state.
Among other things, applicable federal and state statutes and regulations which govern a bank’s activities relate to minimum capital requirements, required reserves against deposits, investments, loans, legal lending limits, mergers and consolidations, borrowings, issuance of securities, payment of dividends, establishment of branches and other aspects of its operations. The Division and the FDIC also have authority to prohibit banks under their supervision from engaging in what they consider to be unsafe or unsound practices.
There also are certain limitations on the ability of the Company to pay dividends to its shareholders. It is the policy of the FRB that bank holding companies should pay cash dividends on common stock only out of net income available over the past year and only if the prospective rate of earnings retention is consistent with the organization’s current and expected future capital needs, asset quality and overall financial condition. The policy provides that bank holding companies should not maintain a level of cash dividends that undermines a bank holding company’s ability to serve as a source of strength to its banking subsidiaries. Additionally, the Alaska Corporations Code generally prohibits the Company from making any distributions to the Company's shareholders unless the amount of the retained earnings of the Company immediately before the distribution equals or exceeds the amount of the proposed distribution. The Alaska Corporations Code also prohibits the Company from making any distribution to the Company's shareholders if the Company or a subsidiary of the Company making the distribution is, or as a result of the distribution would be, likely to be unable to meet its liabilities as they mature. Under Alaska law, the Bank is not permitted to pay or declare a dividend in an amount greater than its undivided profits.
Various federal and state statutory provisions also limit the amount of dividends that subsidiary banks can pay to their holding companies without regulatory approval. The FDIC or the Division could take the position that paying a dividend would constitute an unsafe or unsound banking practice. In addition, new capital rules may affect the Bank's ability to pay dividends.
Under longstanding FRB policy and under the Dodd-Frank Act, a bank holding company is required to act as a source of financial strength for its subsidiary banks. The Company could be required to commit resources to its subsidiary banksbank in circumstances where it might not do so, absent such requirement.
Both the Company and the Bank are required to maintain minimum levels of regulatory capital. In July 2013, federal banking regulators (including the FDIC and the FRB) adopted new capital requirement rules (the “Rules”). The Rules apply to both depository institutions (such as the Bank) and their holding companies (such as the Company). The Rules reflect, in part, certain standards initially adopted by the Basel Committee on Banking Supervision in December 2010 (which standards are commonly referred to as “Basel III”) as well as requirements contemplated by the Dodd-Frank Act. The Rules have applied to both the Company and the Bank since the beginning of 2015.
The Rules recognize three types, or tiers, of capital: common equity Tier 1 capital, additional Tier 1 capital and Tier 2 capital. Common equity Tier 1 capital generally consists of retained earnings and common stock instruments (subject to certain adjustments), as well as accumulated other comprehensive income ("AOCI"), except to the extent that the Company and the Bank exercise a one-time irrevocable option to exclude certain components of AOCI. Additional Tier 1 capital generally includes noncumulative perpetual preferred stock and related surplus subject to certain adjustments and limitations. Tier 2 capital generally includes certain capital instruments (such as subordinated debt) and portions of the amounts of the allowance
for loan and lease losses, subject to certain requirements and deductions. The term "Tier 1 capital" means common equity Tier 1 capital plus additional Tier 1 capital, and the term "total capital" means Tier 1 capital plus Tier 2 capital.
The Rules generally measure an institution's capital using four capital measures or ratios. The common equity Tier 1 capital ratio is the ratio of the institution's common equity Tier 1 capital to its total risk-weighted assets. The Tier 1 capital ratio is the ratio of the institution's total Tier 1 capital to its total risk-weighted assets. The total capital ratio is the ratio of the institution's total capital to its total risk-weighted assets. The leverage ratio is the ratio of the institution's Tier 1 capital to its average total consolidated assets. To determine risk-weighted assets, assets of an institution are generally placed into a risk category and given a percentage weight based on the relative risk of that category. The percentage weights range from 0% to 1,250%. An asset's risk-
weightedrisk-weighted value will generally be its percentage weight multiplied by the asset's value as determined under generally accepted accounting principles. In addition, certain off-balance-sheet items are converted to balance-sheet credit equivalent amounts, and each amount is then assigned to one of the risk categories. An institution's federal regulator may require the institution to hold more capital than would otherwise be required under the Rules if the regulator determines that the institution's capital requirements under the Rules are not commensurate with the institution's credit, market, operational or other risks.
Both the Company and the Bank are required to have a common equity Tier 1 capital ratio of 4.5% as well as a Tier 1 leverage ratio of 4.0%, a Tier 1 risk-based ratio of 6.0% and a total risk-based ratio of 8.0%. In addition to the preceding requirements, both the Company and the Bank are required to have a “conservation buffer,” consisting of common equity Tier 1 capital, which is at least 2.5% above each of the preceding common equity Tier 1 capital ratio, the Tier 1 risk-based ratio and the total risk-based ratio. An institution that does not meet the conservation buffer will be subject to restrictions on certain activities including payment of dividends, stock repurchases and discretionary bonuses to executive officers.
The Rules set forth the manner in which certain capital elements are determined, including but not limited to, requiring certain deductions related to mortgage servicing rights and deferred tax assets. When the federal banking regulators initially proposed new capital rules in 2012, the rules would have phased out trust preferred securities as a component of Tier 1 capital. As finally adopted, however, the Rules permit holding companies with less than $15 billion in total assets as of December 31, 2009 (which includes the Company) to continue to include trust preferred securities issued prior to May 19, 2010 in Tier 1 capital, generally up to 25% of other Tier 1 capital.
The Rules made changes in the methods of calculating certain risk-based assets, which in turn affects the calculation of risk- based ratios. Higher or more sensitive risk weights are assigned to various categories of assets, among which are commercial real estate, credit facilities that finance the acquisition, development or construction of real property, certain exposures or credits that are 90 days past due or are nonaccrual, foreign exposures, certain corporate exposures, securitization exposures, equity exposures and in certain cases mortgage servicing rights and deferred tax assets.
Both the Company and the Bank were required to begin compliance with the Rules on January 1, 2015. The conservation buffer started to be phased in beginning in 2016 took full effect on January 1, 2019. Certain calculations under the Rules will also have phase-in periods. We believe that the current capital levels of the Company and the Bank are in compliance with the standards under the Rules including the conservation buffer.
Following the enactment of certain federal legislation in 2018, the federal banking regulators (including the FDIC and FRB) have proposed a rule intended to simplify capital rules for certain community banks and their holding companies.companies, the Community Bank Leverage Ratio ("CBLR"). Qualifying community banking organizations couldcan elect to opt-into the CBLR and be under a new capital requirement rather than the current capital framework. To be eligible to make this election, the community banking organization would have to have less than $10 billion in assets, have a community bank leverage ratio of at least 9.00% and meet certain other criteria (including limits on off-balance sheet exposures and trading assets and liabilities, mortgage servicing assets, and deferred tax assets)liabilities). The community bank leverage ratioCBLR would generally be the ratio of the organization's total bank equity capital to average assets, subject to certain adjustments. The intent of the proposalCBLR is to simplify but not weaken capital requirements for qualifying community banks. Management has not elected to opt in to these new capital rules. However, the guidelines allow the Company to opt in to the simplification in the future should our assessment change.
In addition to the minimum capital standards, the federal banking agencies have issued regulations to implement a system of "prompt corrective action." These regulations apply to the Bank but not the Company. The regulations establish five capital categories; under the Rules, a bank generally is:
“well capitalized” if it has a total risk-based capital ratio of 10.0% or more, a Tier 1 risk-based capital ratio of 8.0% or more, a common equity Tier 1 risk-based ratio of 6.5% or more, and a leverage capital
ratio of 5.0% or more, and is not subject to any written agreement, order or capital directive to meet and maintain a specific capital level for any capital measure;
“adequately capitalized” if it has a total risk-based capital ratio of 8.0% or more, a Tier 1 risk-based capital ratio of 6.0% or more, a common equity Tier 1 risk-based ratio of 4.5% or more, and a leverage capital ratio of 4.0% or more;
“undercapitalized” if it has a total risk-based capital ratio less than 8.0%, a Tier 1 risk-based capital ratio less than 6.0%, a common equity risk-based ratio less than 4.5% or a leverage capital ratio less than 4.0%;
“significantly undercapitalized” if it has a total risk-based capital ratio less than 6.0%, a Tier 1 risk-based capital ratio less than 4.0%, a common equity risk-based ratio less than 3.0% or a leverage capital ratio less than 3.0%; and
“critically undercapitalized” if it has a ratio of tangible equity to total assets that is equal to or less than 2.0%.
A bank that, based upon its capital levels, is classified as “well capitalized,” “adequately capitalized” or “undercapitalized” may be treated as though it were in the next lower capital category if the appropriate federal banking agency, after notice and opportunity for a hearing, determines that an unsafe or unsound condition, or an unsafe or unsound practice, warrants such treatment.
At each successive lower capital category, a bank is subject to increasing supervisory restrictions. For example, being “adequately capitalized” rather than “well-capitalized” affects a bank’s ability to accept brokered deposits without the prior approval of the FDIC, and may cause greater difficulty obtaining retail deposits. Banks in the “adequately capitalized” classification may have to pay higher interest rates to continue to attract those deposits, and higher deposit insurance rates for those deposits. This status also affects a bank’s eligibility for a streamlined review process for acquisition proposals.
Management intends to maintain capital ratios for the Bank in 20192022 that exceed the FDIC’s requirements for the “well-capitalized” capital requirement classification. The dividends that the Bank pays to the Company will be limited to the extent necessary for the Bank to meet the regulatory requirements of a “well-capitalized” bank.
The capital ratios for the Company exceed those for the Bank primarily because the trust preferred securities offeringsoffering that the Company completed in the second quarter of 2003 and in the fourth quarter of 2005 areis included in the Company’s capital for regulatory purposes, although they areit is accounted for as a liability in itsthe Company's consolidated financial statements. The trust preferred securities are not accounted for on the Bank’s financial statements nor are they included in its capital (although the Company did contribute to the Bank a portion of the cash proceeds from the sale of those securities). The Company redeemed $8 million trust preferred securities in August 2017. As a result, the Company has $10 million more in regulatory capital than the Bank at December 31, 20182021 and 2017,2020, respectively, which explains most of the difference in the capital ratios for the two entities.
The Bank is required to file periodic reports with the FDIC and the Division and is subject to periodic examinations and evaluations by those regulatory authorities. These examinations must be conducted every 12 months, except that certain “well-capitalized” banks may be examined every 18 months. The FDIC and the Division may each accept the results of an examination by the other in lieu of conducting an independent examination.
In the liquidation or other resolution of a failed insured depository institution, claims for administrative expenses (including certain employee compensation claims) and deposits are afforded a priority over other general unsecured claims, including non-deposit claims, and claims of a parent company such as the Company. Such priority creditors would include the FDIC, which succeeds to the position of insured depositors to the extent it has made payments to such depositors.
The Company is also subject to the information, proxy solicitation, insider trading restrictions and other requirements of the Securities Exchange Act of 1934, as amended (the “Securities Exchange Act of 1934”), including certain requirements under the Sarbanes-Oxley Act of 2002.
Northrim The Bank is subject to the Community Reinvestment Act of 1977 (“CRA”). The CRA requires that Northrimthe Bank help meet the credit needs of the communities it serves, including low and moderate income neighborhoods, consistent with the safe and sound operation of the institution. The FDIC assigns one of four possible ratings to Northrimthe Bank’s CRA performance and makes the rating and the examination reports publicly available. The four possible ratings are outstanding, satisfactory, needs
to improve and substantial noncompliance. A financial institution’s CRA rating can affect an institution’s future business. For example, a federal banking agency will take CRA performance into consideration when acting on an institution’s application to establish or move a branch, to merge or to acquire assets or assume liabilities of another institution. In its most recent CRA examination, Northrimthe Bank received a “Satisfactory” rating from the FDIC.
In December 2019, the FDIC and the Office of the Comptroller of the Currency (“OCC”) jointly proposed rules that would significantly change existing CRA regulations. The proposed rules are intended to increase bank activity in low- and moderate-income communities where there is significant need for credit, more responsible lending, greater access to banking services, and improvements to critical infrastructure. The proposals change four key areas: (i) clarifying what activities qualify for CRA credit; (ii) updating where activities count for CRA credit; (iii) providing a more transparent and objective method for measuring CRA performance; and (iv) revising CRA-related data collection, record keeping, and reporting. However, the FRB did not join in that proposed rulemaking. In June 2020, the OCC issued its final CRA rule, effective October 1, 2020, while the FDIC did not finalize any revisions to its CRA rule. In September 2020, the FRB issued an Advance Notice of Proposed Rulemaking (“ANPR”) that invited public comment on an approach to modernize the regulations that implement the CRA by strengthening, clarifying, and tailoring them to reflect the current banking landscape and better meet the core purpose of the CRA.
The ANPR sought feedback on ways to evaluate how banks meet the needs of low- and moderate-income communities and address inequities in credit access. In December 2021, the OCC issued a final rule to rescind its June 2020 final rule in favor of working with other agencies to put forward a joint rule. We will continue to evaluate the impact of any changes to the regulations implementing the CRA and their impact to our financial condition, results of operations, and/or liquidity, which cannot be predicted at this time.
The Company is also subject to the Uniting and Strengthening America by Providing Appropriate Tools Required to Intercept and Obstruct Terrorism Act of 2001 (the “USA PATRIOT Act”) and the Anti-Money Laundering Act of 2020 (the “AMLA”). Among other things, the USA PATRIOT Act requiresand AMLA require the Company and the Bank to adopt and implement specific policies and procedures designed to prevent and defeat money laundering. Management believes the Company is in compliance with the USA PATRIOT Act as in effect on December 31, 2018.2020. The AMLA was passed on January 1, 2021 and regulatory agencies are in the process of finalizing rules and regulations required by the passage of the AMLA.
On March 27, 2020, President Trump signed the CARES Act into law. The CARES Act established several new temporary SBA loan programs to assist U.S. small businesses through the COVID-19 pandemic. One of the new loan programs is the PPP, an expansion of the SBA’s 7(a) loan program and the Economic Injury Disaster Loan Program.
The PPP provides loans to small businesses who were affected by economic conditions as a result of COVID-19 to provide cash-flow assistance to employers who maintain their payroll (including healthcare and certain related expenses), mortgage interest, rent, leases, utilities and interest on existing debt during this emergency. Eligible borrowers need to make a good faith certification that the uncertainty of current economic conditions make requesting assistance necessary to support ongoing operations. Pursuant to the provisions of Section 1106 of the CARES Act, borrowers may apply to the Bank for loan forgiveness of all or a portion of the loan, subject to certain eligibility requirements and conditions. On March 11, 2021, the ARP Act was enacted and, among others, provided additional funding for the PPP and an expansion of the program for the benefit of certain nonprofits.
The Bank is an SBA lender and began accepting applications under the PPP via its online application process on April 3, 2020. As of December 31, 2021, the Bank had 1,320 PPP loans totaling $122.7 million outstanding.
In February 2018, the SEC published interpretive guidance to assist public companies in preparing disclosures about cybersecurity risks and incidents. These SEC guidelines, and any other regulatory guidance, are in addition the Companyto notification and its affiliatesdisclosure requirements under state and federal banking law and regulations.
The federal banking regulators regularly issue new guidance and standards, and update existing guidance and standards, regarding cybersecurity intended to enhance cyber risk management among financial institutions. Financial institutions are expected to comply with such guidance and standards and to accordingly develop appropriate security controls and risk management processes. If we fail to observe such regulatory guidance or standards, we could be subject to various regulatory sanctions, including financial penalties.
Recently, in November 2021, the federal banking agencies adopted a broad arrayFinal Rule, with compliance required by May 1, 2022, that requires banking organizations to notify their primary banking regulator within 36 hours of financialdetermining that a “computer-security incident” has materially disrupted or degraded, or is reasonably likely to materially disrupt or degrade, the banking organization’s ability to carry out banking operations or deliver banking products and services to a material portion of
its customer base, its businesses and operations that would result in material loss, or that would impact the stability of the United States.State regulators have also been increasingly active in implementing privacy and cybersecurity standards and regulations.
Risks and exposures related to cybersecurity attacks, including litigation and enforcement risks, are expected to be elevated for the foreseeable future due to the rapidly evolving nature and sophistication of these threats, as well as due to the expanding use of Internet banking, mobile banking and other technology-based products and services by us and our customers.
A number of other federal and state consumer protection laws extensively govern the Bank’s relationship with its customers. These laws include the Equal Credit Opportunity Act, the Fair Credit Reporting Act, the Truth in Lending Act, the Truth in Savings Act, the Electronic Fund Transfer Act, the Expedited Funds Availability Act, the Home Mortgage Disclosure Act, the Fair Housing Act, the Real Estate Settlement Procedures Act, the Fair Debt Collection Practices Act, Telephone Consumer Protection Act, the Service Members Civil Relief Act and regulations. Amongthese laws’ respective state-law counterparts, as well as state and territorial usury laws and laws regarding unfair and deceptive acts and practices. These and other laws subject the Bank to substantial regulatory oversight and, among other things, these lawsrequire disclosures of the cost of credit and regulations mandate certain disclosure requirements andterms of deposit accounts, provide substantive consumer rights, prohibit discrimination in credit transactions, regulate the manner in whichuse of credit report information, provide financial institutions deal with their customers.privacy protections, prohibit unfair, deceptive and abusive practices, and restrict the Bank’s ability to raise interest rates.
Available Information
The Company’s annual report on Form 10-K and quarterly reports on Form 10-Q, as well as its current reports on Form 8-K and proxy statement filings (and all amendments thereto), which are filed with the Securities and Exchange Commission (“SEC”),SEC, are accessible free of charge at our website at http://www.northrim.com as soon as reasonably practicable after filing with the SEC. By making this reference to our website, the Company does not intend to incorporate into this report any information contained in the website. The website should not be considered part of this report.
The public may read and copy any materials we file with the SEC at the SEC’s Public Reference Room at 100 F Street, NE, Washington, DC 20549. The public may also obtain information on the operation of the Public Reference Room by calling the SEC at 1-800-SEC-0330. The SEC maintains a website at http://www.sec.gov that contains reports, proxy and information statements, and other information regarding issuers, including the Company, that file electronically with the SEC.
ITEM 1A. RISK FACTORS
An investment in the Company’s common stock is subject to risks inherent to the Company’s business. The material risks and uncertainties that management believes affect the Company are described below. Before making an investment decision, you should carefully consider the risks and uncertainties described below together with all of the other information included or incorporated by reference in this report. The risks and uncertainties described below are not the only ones facing the Company. Additional risks and uncertainties that management is not aware of or focused on or that management currently deems immaterial may also impair the Company’s business operations. This report is qualified in its entirety by these risk factors.
If any of the following risks actually occur, the Company’s financial condition and results of operations could be materially and adversely affected. If this were to happen, the value of the Company’s common stock could decline significantly, and you could lose all or part of your investment.
Risk Factors Summary
An investment in the Company's common stock is subject to risks inherent to the Company's business. Such risks, including those set forth in the summary of material risks in this Part I. Item 1A. should be carefully considered before purchasing our securities.
COVID-19 Pandemic Risk Factors
•The COVID-19 pandemic has materially impacted our business and financial results, and our business and financial results will likely continue to be adversely affected by the pandemic.
Interest Rate Risk Factor
•Changes in market interest rates could adversely impact the Company.
Operational, Strategic and Business Risk Factors
•Current economic conditions in the State of Alaska pose challenges for us and could adversely affect our financial condition and results of operations.
•Our concentration of operations in the Anchorage, Matanuska-Susitna Valley, Fairbanks and Southeast areas of Alaska makes us more sensitive to downturns in those areas.
•Residential mortgage lending is a market sector that experiences significant volatility and is influenced by many factors beyond our control.
•Our information systems or those of our third-party vendors may be subject to an interruption or breach in security, including as a result of cyber-attacks.
•A failure in or breach of the Company's operational systems, information systems, or infrastructure, or those of the Company's third-party vendors and other service providers, may result in financial losses, or loss of customers.
•Our business is highly reliant on third party vendors.
•We continually encounter technological change, and we may have fewer resources than many of our competitors to continue to invest in technological improvements.
•Our business, financial condition and results of operations are subject to risk from changes in customer behavior.
•If we do not comply with the agreements governing servicing of loans, if these agreements change materially, or if others allege non-compliance, our business and results of operations may be harmed.
•Certain hedging strategies that we use to manage interest rate risk may be ineffective to offset any adverse changes in the fair value of these assets due to changes in interest rates and market liquidity.
•Our allowance for credit losses may be insufficient.
•We have a significant concentration in real estate lending. A downturn in real estate within our markets would have a negative impact on our results of operations.
•Real estate values may decrease leading to additional and greater than anticipated loan charge-offs and valuation writedowns on our other real estate owned (“OREO”) properties.
•We conduct substantially all of our operations through Northrim Bank, our banking subsidiary; our ability to pay dividends, repurchase our shares, or to repay our indebtedness depends upon liquid assets held by the holding company and the results of operations of our subsidiaries and their ability to pay dividends.
•There can be no assurance that the Company will continue to declare cash dividends or repurchase stock.
•We may be unable to attract and retain key employees and personnel.
•Liquidity risk could impair our ability to fund operations and jeopardize our financial conditions.
•A failure of a significant number of our borrowers, guarantors and related parties to perform in accordance with the terms of their loans would have an adverse impact on our results of operations.
Regulatory, Legislative and Legal Risk Factors
•We operate in a highly regulated environment and changes of or increases in banking or other laws and regulations or governmental fiscal or monetary policies could adversely affect us.
•Changes in the FRB’s monetary or fiscal policies could adversely affect our results of operations and financial condition.
•Non-compliance with the USA PATRIOT Act, Bank Secrecy Act, Anti-Money Laundering Act of 2020, Real Estate Settlement Procedures Act, Truth-in-Lending Act or other laws and regulations could result in fines, sanctions or other adverse consequences.
Accounting, Tax and Financial Risk Factors
•Changes in income tax laws and interpretations, or in accounting standards, could materially affect our financial condition or results of operations.
•Uncertainty about the continuing availability of the London Inter-Bank Offered Rate ("LIBOR") may adversely affect our business.
General Economic and Market Risk Factors
•Natural disasters and adverse weather could negatively affect real estate property values and Bank operations.
•The soundness of other financial institutions could adversely affect us.
•The financial services business is intensely competitive and our success will depend on our ability to compete effectively.
•We are a community bank and our ability to maintain our reputation is critical to the success of our business and the failure to do so could materially adversely affect our performance.
•Social, political, and economic instability, unrest, and other circumstances beyond our control could adversely affect our business operations.
•Climate change, severe weather, natural disasters, and other external events could significantly impact our business.
We attempt to mitigate the foregoing risks. However, if we are unable to effectively manage the impact of these and other risks, our financial condition, results of operations, our ability to make distributions to our shareholders, or the market price of our common stock could be materially impacted.
COVID-19 Pandemic Risks
The COVID-19 pandemic has materially impacted our business and financial results, and our business and financial results will likely continue to be adversely affected by the pandemic.
The COVID-19 pandemic has created economic and financial disruptions that have adversely affected, and are likely to continue to adversely affect, our business, financial condition, liquidity and results of operations. The extent to which the COVID-19 pandemic will continue to negatively affect our business, financial condition, liquidity and results of operations will depend on future developments, which are highly uncertain and cannot be predicted and many of which are outside of our control, including the scope and duration of the pandemic, the emergence of new variants, the effectiveness of our pandemic response plans, the direct and indirect impact of the pandemic on our employees, customers, clients, counterparties and service providers, as well as other market participants, and actions taken, or that may yet be taken, or inaction, by governmental authorities and other third parties in response to the pandemic. Should the pandemic continue for a more extended period or worsen, we may face additional circumstances such as significant draws on credit lines should customers seek to increase liquidity. Furthermore, should the pandemic continue, we may experience increased rates of employee illness or unavailability, and may experience challenges recruiting new employees.
Any disruption to our ability to deliver financial products or services to, or interact with, our clients and customers could result in losses or increased operational costs, regulatory fines, penalties and other sanctions, or harm our reputation. We are also subject to litigation and reputational risk arising from our response to the COVID-19 pandemic. The length of the pandemic and the efficacy of the measures being put in place to address it are unknown as efforts to combat the virus have been complicated by viral variants and uneven access to, and acceptance and effectiveness of, vaccines globally. To the extent the pandemic adversely affects our business, financial condition, liquidity or results of operations, it may also have the effect of heightening many of the other risks described in this report. See the section captioned “COVID-19 Issues” in Part II. Item 7 of this report for further discussion. In addition, the effects could have a material impact on our results of operations and heighten many of our known risks described in this Part I, Section 1A “Risk Factors”.
Interest Rate Risk
Changes in market interest rates could adversely impact the Company.
Our earnings and cash flows are largely dependent upon our net interest income. Net interest income is the difference between interest income earned on interest-earning assets such as loans and securities and interest expense paid on interest-bearing liabilities such as deposits and borrowed funds. Interest rates are highly sensitive to many factors that are beyond our control, including general economic conditions, inflationary trends, changes in government spending and debt issuances and policies of various governmental and regulatory agencies and, in particular, the Federal Open Market Committee (“FOMC”). Changes in interest rates affect the demand for new loans, the credit profile of existing loans, the rates received on loans and securities, and rates paid on deposits and borrowings.If the interest rates paid on deposits and other borrowings increase at a faster rate than the interest rates received on loans and other investments, our net interest income, and therefore earnings, could be adversely affected. Earnings could also be adversely affected if the interest rates received on loans and other investments fall more quickly than the interest rates paid on deposits and other borrowings. These impacts may negatively impact our ability to
attract deposits, make loans, and achieve satisfactory interest rate spreads, which could adversely affect our financial condition or results of operations. In particular, increases in interest rates will likely reduce RML’s revenues by reducing the market for refinancings, as well as the demand for RML’s other residential loan products.Additionally, increases in interest rates may impact our borrowers' ability to make loan payments, particularly in our commercialloan portfolio.
Interest rates may be affected by many factors beyond our control, including general and economic conditions and the monetary and fiscal policies of various governmental and regulatory authorities. The FOMC announced its target to keep the federal funds rate near zero percent in January 2022. However, the FOMC also indicated that due to rising inflation it expects to raise interest rates in the near term. Market volatility in interest rates can be difficult to predict, as unexpected interest rate changes may result in a sudden impact while anticipated changes in interest rates generally impact the mortgage rate market prior to the actual rate change. Exposure to interest rate risk is managed by monitoring the repricing frequency of our rate-sensitive assets and rate-sensitive liabilities over any given period. Although we believe the current level of interest rate sensitivity is reasonable, significant fluctuations in interest rates could potentially have an adverse effect on our business, financial condition and results of operations.
Operational, Strategic and Business Risks
Current economic conditions in the State of Alaska pose challenges for us and could adversely affect our financial condition and results of operations.
We are operating in an uncertain economic environment. The decrease in the price of oil which began in 2014 has led to a significant deficit in the budget for the State of Alaska, andwhich was partially mitigated in 2018 by the implementation of a percent of market value approach allocating a portion of the Alaska Permanent Fund's investment earnings to help fund the state budget. However, we believe that absent action by the Alaska state legislature, these deficits are expectedthis has addressed only part of Alaska's structural finance problem and this approach also increased Alaska's exposure to exhaust cash savings of the statevolatility in the near term.financial markets. In the longer term, relatively low oil prices are expected to negatively impact the overall economy in Alaska on a larger scale as we estimate that one third of the Alaskan economy is related to oil. Financial institutions continue to be affected by changing conditions in the real estate and financial markets, along with an arduous regulatory climate. Dramatic declines in the United States housing market from 2008 through 2012, with falling home prices and increasing foreclosures and unemployment, resulted in significant writedowns of asset values by financial institutions. While conditions have improved nationally, a return to a recessionary economy could result in financial stress on our borrowers that would adversely affect our financial condition and results of operations. Deteriorating conditions in the regional economies of Anchorage, Matanuska-Susitna Valley, Fairbanks, and the Southeast areas of Alaska served by the Company could drive losses beyond that which is provided for in our allowance for loan losses. We may also face the following risks in connection with events:
|
| | | | |
| ▪ | Ineffective monetary policy could cause rapid changes in interest rates and asset values that would have a materially adverse impact on our profitability and overall financial condition. |
| ▪ | Market developments may affect consumer confidence levels and may cause adverse changes in payment patterns, resulting in increased delinquencies and default rates on loans and other credit facilities. |
| ▪ | Regulatory scrutiny of the industry could increase, leading to harsh regulation of our industry that could lead to a higher cost of compliance, limit our ability to pursue business opportunities and increase our exposure to the judicial system and the plaintiff’s bar. |
| ▪ | Erosion in the fiscal condition of the U.S. Treasury could lead to new taxes that would limit the ability of the Company to pursue growth and return profits to shareholders. |
If these conditions or similar ones develop, we could experience adverse effects on our financial condition and results of operations.
Our concentration of operations in the Anchorage, Matanuska-Susitna Valley, Fairbanks and Southeast areas of Alaska makes us more sensitive to downturns in those areas.
Substantially all of our business is derived from the Anchorage, Matanuska-Susitna Valley, Fairbanks, and Southeast areas of Alaska. The majority of our lending has been with Alaska businesses and individuals. At December 31, 2018,2021, approximately 73%9% of the Bank’sBank's loans are PPP loans which are 100% guaranteed by the SBA. Of the remaining loan portfolio, excluding PPP loans, approximately 75% of loans are secured by real estate and 2%1% are unsecured. Approximately 25%24% are for general commercial uses, including professional, retail, and small businesses, and are secured by non-real estate assets. Repayment is expected from the borrowers’ cash flow or, secondarily, the collateral. Our exposure to credit loss, if any, is the outstanding amount of the loan if the collateral is proved to be of no value. These areas rely primarily upon the natural resources industries, particularly oil production, as well as tourism and government and U.S. military spending for their
economic success. In particular, the oil industry plays a significant role in the Alaskan economy. We estimate that one third of Alaska's gross state product is currently derived from the oil industry.
Our business is and will remain sensitive to economic factors that relate to these industries and local and regional business conditions. As a result, local or regional economic downturns, or downturns that disproportionately affect one or more of the key industries in regions served by the Company, may have a more pronounced effect upon our business than they might on an institution that is less geographically concentrated. The extent of the future impact of these events on economic and business conditions cannot be predicted; however, prolonged or acute fluctuations could have a material and adverse impact upon our financial condition and results of operation.
Changes in Residential mortgage lending is a market interest rates could adversely impact the Company.
Our earnings are impacted by changing interest rates. Changes in interest rates affect the demand for new loans, the credit profile of existing loans, the rates received on loanssector that experiences significant volatility and securities, and rates paid on deposits and borrowings. These impacts may negatively impact our ability to attract deposits, make loans, and achieve satisfactory interest rate spreads, which could adversely affect our financial condition or results of operations. In particular, increases in interest rates will likely reduce RML’s revenues by further reducing the market for refinancings, as well as the demand for RML’s other residential loan products. Additionally, increases in interest rates may impact our borrowers' ability to make loan payments, particularly in our commercial loan portfolio.
Interest rates may be affectedis influenced by many factors beyond our control, includingcontrol.
The Company earns revenue from the residential mortgage lending activities primarily in the form of gains on the sale of mortgage loans that we originate and sell to the secondary market. Residential mortgage lending in general and economic conditions and the monetary and fiscal policies of various governmental and regulatory authorities. Since December 2015, the RB has increased short-term interest rates eight times and may consider additional rate increases in 2019. Marketexperienced substantial volatility in interest rates can be difficultrecent periods primarily due to predict, as unexpected interest rate changes may result in a sudden impact while anticipated changes in interest rates generallyand other market forces beyond our control. Interest rate changes, such as rate increases implemented by the FRB, may result in lower rate locks and closed loan volume, which may adversely impact the mortgage rate market prior to the actual rate change. Exposure to interest rate riskearnings and results of operations of RML. In addition, an increase, as is managed by monitoring the repricing frequency of our rate-sensitive assets and rate-sensitive liabilities over any given period. Although we believe the current level of interest rate sensitivity is reasonable, significant fluctuationscurrently expected, in interest rates could potentially have an adverse effect on our business, financial condition and results of operations.
We operate in a highly regulated environment and changes of or increases in banking or other laws and regulations or governmental fiscal or monetary policies could adversely affect us.
We are subject to extensive regulation, supervision and examination by federal and state banking authorities. In addition, as a publicly-traded company, we are subject to regulation by the SEC and NASDAQ. Any change in applicable regulations or federal or state legislation or in policies or interpretations or regulatory approaches to compliance and enforcement, income tax laws and accounting principles could have a substantial impact on us and our operations. Changes in laws and regulations may also increase our expenses by imposing additional fees or taxes or restrictions on our operations. Additional legislation and regulations that could significantly affect our authority and operations may be enacted or adopted in the future, which could have a material adverse effect on our financial condition and results of operations. Failure to appropriately comply with any such laws, regulations or principles could result in sanctions by regulatory agencies or damage to our reputation, all of which could adversely affect our business, financial condition or results of operations.
In that regard, the Dodd-Frank Act was enacted in July 2010. Among other provisions, the Dodd-Frank Act created a new Consumer Financial Protection Bureau with broad powers to regulate consumer financial products such as credit cards and mortgages, created a Financial Stability Oversight Council comprised of the heads of other regulatory agencies, has resulted in new capital requirements from federal banking agencies, placed new limits on electronic debt card interchange fees, and requires banking regulators, the SEC and national stock exchanges to adopt significant new corporate governance and executive compensation reforms.
Certain provisions of these new rules have phase-in periods, including a 2.5% conservation buffer, which began to be phased-in in 2016 and took full effect on January 1, 2019. Further, regulators have significant discretion and authority to prevent or remedy practices that they deem to be unsafe or unsound, or violations of laws or regulations by financial institutions and holding companies in the performance of their supervisory and enforcement duties. These powers have been utilized more frequently in recent years due to the serious national economic conditions that faced the financial system in late 2008 and early 2009. The exercise of regulatory authority may have a negative impact on our financial condition and results of operations. Additionally, our business is affected significantly by the fiscal and monetary policies of the U.S. federal government and its agencies, including the FRB.
We cannot accurately predict the full effects of recent or future legislation or the various other governmental, regulatory, monetary and fiscal initiatives which have been and may be enacted on the financial markets and on the Company. The terms and costs of these activities could materially and adversely affect our business, financial condition, results of operationsfuture loan origination volume and the trading price of our common stock.
We are subject to more stringent capital and liquidity requirements which may adversely affect our net income and future growth.
In July 2013, the FRB and the FDIC announced the new capital rules, which apply to both depository institutions and (subject to certain exceptions not applicable to the Company) their holding companies. As described in further detail above in “Item 1 Business - Supervision and Regulation” these rules created increased capital requirements for United States depository institutions and their holding companies. These rules include risk-based and leverage capital ratio requirements, which became effective on January 1, 2015. These rules also revise the prompt corrective action framework, which is designed to place restrictions on insured depository institutions, including the Bank, if their capital levels do not meet certain thresholds. These revisions also became effective January 1, 2015.
Our failure to comply with the minimum capital requirements could result in our regulators taking formal or informal actions against us which could restrict our future growth or operations. margins.
Our information systems or those of our third partythird-party vendors may be subject to an interruption or breach in security, including as a result of cyber attacks.
The Company’s technologies, systems, networks and software, and those of other financial institutions have been, and are likely to continue to be, the target of cybersecurity threats and attacks, which may range from uncoordinated individual attempts to sophisticated and targeted measures directed at us. These cybersecurity threats and attacks may include, but are not limited to, breaches, unauthorized access, misuse, malicious code, computer viruses and denial of service attacks that could result in unauthorized access, misuse, loss or destruction of data (including confidential customer information), account takeovers, unavailability of service or other events. These types of threats may result from human error, fraud or malice on the part of external or internal parties, or from accidental technological failure. Further, to access our products and services our customers may use computers and mobile devices that are beyond our security control systems. The risk of a security breach or disruption, particularly through cyber-attack or cyber intrusion, including by computer hackers, has increased as the number, intensity and sophistication of attempted attacks and intrusions from around the world have increased.
Our business requires the collection and retention of large volumes of customer data, including payment card numbers and other personally identifiable information in various information systems that we maintain and in those maintained by third parties with whom we contract to provide data services. We also maintain important internal company data such as personally identifiable information about our employees and information relating to our operations. The integrity and protection of that customer and company data is important to us. As customer, public, legislative and regulatory expectations and requirements regarding operational and information security have increased, our operations systems and infrastructure must continue to be safeguarded and monitored for potential failures, disruptions and breakdowns.
Our customers and employees have been, and will continue to be, targeted by parties using fraudulent e-mails and other communications in attempts to misappropriate passwords, payment card numbers, bank account information or other personal information or to introduce viruses or other malware through “trojan horse” programs to our customers’ computers. These communications may appear to be legitimate messages sent by the Bank or other businesses, but direct recipients to fake websites operated by the sender of the e-mail or request that the recipient send a password or other confidential information via e-mail or download a program. Despite our efforts to mitigate these threats through product improvements, use of encryption and authentication technology to secure online transmission of confidential consumer information, and customer and employee education, such attempted frauds against us or our merchants and our third partythird-party service providers remain a serious issue. The pervasiveness of cyber security incidents in general and the risks of cyber-crime are complex and continue to evolve. In addition, due to COVID-19, we have modified our business practices with a portion of our employees working remotely from their homes. The continuation of these work-from-home measures also introduces additional operational risk, including increased cybersecurity risk. In light of
several recent high-profile data breaches at other companies involving customer personal and financial information, we believe the potential impact of a cyber security incident involving the Company, any exposure to consumer losses and the cost of technology investments to improve security could cause customer and/or Bank losses, damage to our brand, and increase our costs.
Although we make significant efforts to maintain the security and integrity of our information systems and have implemented various measures to manage the risk of a security breach or disruption, there can be no assurance that our security efforts and measures will be effective or that attempted security breaches or disruptions would not be successful or damaging. Even the most well-protected information, networks, systems and facilities remain potentially vulnerable because attempted security breaches, particularly cyber-attacks and intrusions, or disruptions will occur in the future, and because the techniques used in such attempts are constantly evolving and generally are not recognized until launched against a target, and in some cases are designed not to be detected and, in fact, may not be detected. Accordingly, we may be unable to anticipate these techniques or to implement adequate security barriers or other preventative measures, and thus it is virtually impossible for us to entirely mitigate this risk. A security breach or other significant disruption could: disrupt the proper functioning of our networks and systems and therefore our operations and/or those of certain of our customers; result in the unauthorized access to, and destruction, loss, theft, misappropriation or release of confidential, sensitive or otherwise valuable information of ours or our customers, including account numbers and other financial information; result in a violation of applicable privacy, data breach and other laws, subjecting the Bank to additional regulatory scrutiny and exposing the Bank to civil litigation, governmental fines and possible financial liability; require significant management attention and resources to remedy the damages that result; or harm our reputation or cause a decrease in the number of customers that choose to do business with us or reduce the level of business that our customers do with us. The occurrence of any such failures, disruptions or security breaches could have a negative impact on our financial condition and results of operations.
A failure in or breach of the Company's operational systems, information systems, or infrastructure, or those of the Company's third party vendors and other service providers,may result in financial losses, or loss of customers.
The Company relies heavily on communications and information systems to conduct our business. In addition, we rely on third parties to provide key components of our infrastructure, including the processing of sensitive consumer and business customer data, internet connections, and network access. These types of information and related systems are critical to the operation of our business and essential to our ability to perform day-to-day operations, and, in some cases, are critical to the operations of many of our customers. These third parties with which the Company does business or that facilitate our business activities, including exchanges, financial intermediaries or vendors that provide services or security solutions for our operations, could also be sources of operational and information security risk to us, including breakdowns or failures of their own systems or capacity constraints. Although the Company has implemented safeguards and business continuity plans, our business operations may be adversely affected by significant and widespread disruption to our physical infrastructure or operating systems that support our business and our customers, resulting in financial losses or loss of customers.
Our business is highly reliant on third party vendor.vendors.
We rely on third parties to provide services that are integral to our operations. These vendors provide services that support our operations, including the storage and processing of sensitive consumer and business customer data. The loss of these vendor relationships, or a failure of these vendors' systems, could disrupt the services we provide to our customers and cause us to incur significant expense in connection with replacing these services.
We continually encounter technological change, and we may have fewer resources than many of our competitors to continue to invest in technological improvements.
The financial services industry is undergoing rapid technological changes with frequent introductions of new technology-driven products and services. The effective use of technology increases efficiency and enables financial institutions to better serve customers and to reduce costs. Our future success will depend, in part, upon our ability to address the needs of our clients by using technology to provide products and services that will satisfy client demands for convenience, as well as to create additional efficiencies in our operations. Many national vendors provide turn-key services to community banks, such as Internet banking and remote deposit capture that allow smaller banks to compete with institutions that have substantially greater resources to invest in technological improvements. We may not be able, however, to effectively implement new technology-driven products and services or be successful in marketing these products and services to our customers.
Residential mortgage lending is a market sector that experiences significant volatility and is influenced by many factors beyond our control.
The Company earns revenue from the residential mortgage lending activities primarily in the form of gains on the sale of mortgage loans that we originate and sell to the secondary market. Residential mortgage lending in general has experienced substantial volatility in recent periods primarily due to changes in interest rates and other market forces beyond our control. Interest rate changes, such as rate increases implemented by the FRB, may result in lower rate locks and closed loan volume, which may adversely impact the earningsOur business, financial condition and results of operations are subject to risk from changes in customer behavior.
Individual, economic, political, industry-specific conditions and other factors outside of RML. In addition, an increaseour control, such as fuel prices, energy costs, real estate values, inflation, taxes or other factors that affect customer income levels, could alter anticipated customer behavior, including borrowing, repayment, investment and deposit practices. Such a change in interest ratesthese practices could materially adversely affect our ability to anticipate business needs and meet regulatory requirements. Further, difficult economic conditions may materiallynegatively affect consumer confidence levels. A decrease in consumer confidence levels would likely
aggravate the adverse effects of these difficult market conditions on us, our customers and adversely affect our future loan origination volume and margins.
If we do not comply with the agreements governing servicing of loans, if these agreements change materially, or if others allege non-compliance, our business and results of operations may be harmed.
We have contractual obligations under the servicing agreements pursuant to which we service mortgage loans. Many of our servicing agreements require adherence to general servicing standards, and certain contractual provisions delegate judgment over various servicing matters to us. If the terms of these servicing agreements change, we may sustain higher costs. Our servicing practices, and the judgments that we make in our servicing of loans, could also be questioned by parties to these agreements. We could also become subject to litigation claims seeking damages or other remedies arising from alleged breaches of our servicing agreements.
Additionally, under our loan servicing program we retain servicing rights on mortgage loans originated by RML and sold to the Alaska Housing Finance Corporation. If we breach any of the representations and warranties in our servicing agreements with the Alaska Housing Finance Corporation, we may be required to repurchase any loan sold under this program and record a loss upon repurchase and/or bear any subsequent loss on the loan. We may not have any remedies available to us against third parties for such losses, or the remedies might not be as broad as the remedies available to the Alaska Housing Finance Corporation against us.
Certain hedging strategies that we use to mangemanage interest rate risk may be ineffective to offset any adverse changes in the fair value of these assets due to changes in interest rates and market liquidity.
We use derivative instruments to economically hedge the interest rate risk in our residential mortgage loan commitments. Our hedging strategies are susceptible to prepayment risk, basis risk, market volatility and changes in the shape of the yield curve, among other factors. In addition, hedging strategies rely on assumptions and projections regarding assets and general market factors. If these assumptions and projections prove to be incorrect or our hedging strategies do not adequately mitigate the impact of changes in interest rates, we may incur losses that would adversely impact our financial condition and results of operations.
Our loan loss allowance for credit losses may not be adequate to cover future loaninsufficient.
We maintain allowances for credit losses which may adversely affect our earnings.
We have established a reserve for probable losses we expect to incur in connection withon loans, in oursecurities and off-balance sheet credit portfolio. Thisexposures. The amount of each allowance reflects ouraccount represents management's best estimate of current expected credit losses on these financial instruments considering available information, from internal and external sources, relevant to assessing exposure to credit loss over the collectabilitycontractual term of certain identified loans, as well as an overall risk assessment of total loans outstanding. Ourthe instrument. Relevant available information includes historical credit loss experience, current conditions and reasonable and supportable forecasts. As a result, the determination of the amountappropriate level of loan loss allowance is highly subjective; although management personnel apply criteria such as risk ratings and historical loss rates; these factors may not be adequate predictors of future loan performance. Accordingly, we cannot offer assurances that these estimates ultimately will prove correct or that the loan loss allowance will be sufficient to protect against losses that ultimately may occur. If our loan loss allowance proves to be inadequate, we may suffer unexpected charges to income, which would adversely impact our results of operations and financial condition. Moreover, bank regulators frequently monitor banks' loan loss allowances, and if regulators were to determine that the allowance is inadequate, theyfor credit losses inherently involves a high degree of subjectivity and requires us to make significant estimates related to current and expected future credit risks and trends, all of which may undergo material changes. Continuing deterioration in economic conditions affecting borrowers and securities issuers; new information regarding existing loans, credit commitments and securities holdings; the continuation of the COVID-19 pandemic or other global pandemics; natural disasters and risks related to climate change; and identification of additional problem loans, ratings down-grades and other factors, both within and outside of our control, may require usan increase in the allowances for credit losses on loans, securities and off-balance sheet credit exposures. In addition, bank regulatory agencies periodically review our allowance for credit losses and may require an increase in credit loss expense or the recognition of further loan charge-offs, based on judgments different than those of management. Furthermore, if any charge-offs related to loans, securities or off-balance sheet credit exposures in future periods exceed our allowances for credit losses on loans, securities or off-balance sheet credit exposures, we will need to recognize additional credit loss expense to increase the applicable allowance. Any increase in the allowance which also would adversely impactfor credit losses on loans, securities and/or off-balance sheet credit exposures will result in a decrease in net income and, possibly, capital, and may have a material adverse effect on our business, financial condition and results of operations.
We have a significant concentration in real estate lending.Adownturn in real estate within our markets would have a negative impact on our results of operations.
Approximately 73%75% of the Bank’s loan portfolio, excluding PPP loans, at December 31, 20182021 consisted of loans secured by commercial and residential real estate located in Alaska. Additionally, all of the Company's loans held for sale are secured by residential real estate. A slowdown in the residential sales cycle in our major markets and a constriction in the availability of mortgage financing, such as what occurred during the financial crisis in the United States housing market from 2008 through 2012, would negatively impactedimpact residential real estate sales, which would result in customers’ inability to repay loans. This would result in an increase in our non-performing assets if more borrowers fail to perform according to loan terms and if we take possession of real estate properties. Additionally, if real estate values decline, the value of real estate collateral
securing our loans could be significantly reduced. If
any of these effects continue or become more pronounced, loan losses will increase more than we expect and our financial condition and results of operations would be adversely impacted.
Further, approximately 50%52% of the Bank’s loan portfolio at December 31, 20182021 consisted of commercial real estate loans. While our investments in these types of loans have not been as adversely impacted as residential construction and land development loans, there can be no assurance that the credit quality in these portfolios will remain stable. Commercial construction and commercial real estate loans typically involve larger loan balances to single borrowers or groups of related borrowers. Consequently, an adverse development with respect to one commercial loan or one credit relationship exposes us to significantly greater risk of loss compared to an adverse development with respect to a consumer loan. The credit quality of these loans may deteriorate more than expected which may result in losses that exceed the estimates that are currently included in our loan loss allowance, which could adversely affect our financial conditionscondition and results of operations.
Real estate values may decrease leading to additional and greater than anticipated loan charge-offs and valuation writedowns on our other real estate owned (“OREO”) properties.
Real estate owned by the Bank and not used in the ordinary course of its operations is referred to as “other real estate owned” or “OREO” property. We foreclose on and take title to the real estate serving as collateral for defaulted loans as part of our business. At December 31, 2018,2021, the Bank held $8.0$5.6 million of OREO properties, most of which relate to a commercial real estate loan. Increased OREO balances lead to greater expenses as we incur costs to manage and dispose of the properties. Our ability to sell OREO properties is affected by public perception that banks are inclined to accept large discounts from market value in order to quickly liquidate properties. Any decrease in market prices may lead to OREO writedowns, with a corresponding expense in our income statement. We evaluate OREO property values periodically and writedown the carrying value of the properties if the results of our evaluations require it. Further writedowns on OREO or an inability to sell OREO properties could have a material adverse effect on our results of operations and financial condition.
Natural disasters and adverse weather could negatively affect real estate property values and Bank operations.
Real estate and real estate property values play an important role for the Bank in several ways. The Bank owns or leases many real estate properties in connection with its operations, located in Anchorage, Juneau, Fairbanks, the Matanuska-Susitna Valley, Ketchikan, Sitka, and to a lessor extent, the Kenai Peninsula. Real estate is also utilized as collateral for many of our loans. A natural disaster could cause property values to fall, which could require the Bank to record an impairment on its financial statements. A natural disaster could also impact collateral values, which would increase our exposure to loan defaults. Our business operations could also suffer to the extent the Bank cannot utilize its branch network due to a natural disaster or other weather-related damage.
Changes in the FRB’s monetary or fiscal policies could adversely affect our results of operations and financial condition.
Our earnings will be affected by domestic economic conditions and the monetary and fiscal policies of the United States government and its agencies. The FRB has, and is likely to continue to have, an important impact on the operating results of depository institutions through its power to implement national monetary policy, among other things, in order to curb inflation or combat a recession. The FRB affects the levels of bank loans, investments and deposits through its control over the issuance of United States government securities, its regulation of the discount rate applicable to member banks and its influence over reserve requirements to which member banks are subject. Since December 2015, the FRB has increased short-term interest rates eight times and may consider additional increases in 2019. We cannot predict the nature or impact of future changes in monetary and fiscal policies.
We conduct substantially all of our operations through Northrim Bank, our banking subsidiary; our ability to pay dividends, repurchase our shares, or to repay our indebtedness depends upon liquid assets held by the holding company and the results of operations of our subsidiaries and their ability to pay dividends.
The Company is a separate legal entity from our subsidiaries. It receives substantially all of its revenue from dividends paid from the Bank. There are legal limitations on the extent to which the Bank may extend credit, pay dividends or otherwise supply funds to, or engage in transactions with us. Our inability to receive dividends from the Bank could adversely affect our business, financial condition, results of operations and prospects.
Our net income depends primarily upon the Bank’s net interest income, which is the income that remains after deducting from total income generated by earning assets the expense attributable to the acquisition of the funds required to support earning assets (primarily interest paid on deposits and borrowings). The amount of interest income is dependent on many factors including
the volume of earning assets, the general level of interest rates, the dynamics of changes in interest rates and the levels of nonperforming loans. All of those factors affect the Bank’s ability to pay dividends to the Company. In 2016,On January 1, 2019, a requirement to have a capital conservation buffer started to be phased in and this requirement, which went into full effect on January 1, 2019and could adversely affect the Bank's ability to pay dividends.
Various statutory provisions restrict the amount of dividends the Bank can pay to us without regulatory approval. Under Alaska law, a bank may not declare or pay a dividend in an amount greater than its net undivided profits then on hand. In addition, the Bank may not pay cash dividends if that payment could reduce the amount of its capital below that necessary to meet the “adequately capitalized” level in accordance with regulatory capital requirements. It is also possible that, depending upon the financial condition of the Bank and other factors, regulatory authorities could conclude that payment of dividends or other payments, including payments to us, is an unsafe or unsound practice and impose restrictions or prohibit such payments. It is the policy of the FRB that bank holding companies should pay cash dividends on common stock only out of net income available over the past year and only if the prospective rate of earnings retention is consistent with the organization’s current and expected future capital needs, asset quality and overall financial condition. The policy provides that bank holding companies should not maintain a level of cash dividends that undermines a bank holding company’s ability to serve as a source of strength to its banking subsidiaries.
There can be no assurance that the Company will continue to declare cash dividends or repurchase stock.
During 2018,2021, the Company repurchased 15,468279,276 shares of common stock at an average price of $31.90$41.30 per share under its previously announced share repurchase program. On January 28, 2022, the Company announced that its Board of Directors had authorized the repurchase of up to an additional 300,000 shares of common stock. The Company also paid cash dividends of $1.02$1.50 per diluted share in 2018.2021. On February 28, 2019,24, 2022, the Board of Directors approved payment of a $0.30$0.41 per share dividend on the Company’s outstanding shares.
Whether we continue, and the amount and timing of, such dividends and/or stock repurchases is subject to capital availability and periodic determinations by our Board. The Company continues to evaluate the potential impact that regulatory proposals may have on our liquidity and capital management strategies, including Basel III and those required under the Dodd-Frank Act. The actual amount and timing of future dividends and share repurchases, if any, will depend on market and economic conditions, applicable SEC rules, federal and state regulatory restrictions, and various other factors. In addition, the amount we spend and the number of shares we are able to repurchase under our stock repurchase program may further be affected by a number of other factors, including the stock price and blackout periods in which we are restricted from repurchasing shares. Our dividend payments and/or stock repurchases may change from time to time, and we cannot provide assurance that we will continue to declare dividends and/or repurchase stock in any particular amounts or at all. A reduction in or elimination of our dividend payments and/or stock repurchases could have a negative effect on our stock price.
The soundness of other financial institutions could adversely affect us.
Our ability to engage in routine funding transactions could be adversely affected by the actions and commercial soundness of other financial institutions. Financial services institutions are interrelated as a result of trading, clearing, counterparty or other relationships. As a result, defaults by, or even rumors or questions about, one or more financial services institutions, or the financial services industry generally, have led to market-wide liquidity problems and could lead to losses or defaults by us or by other institutions. Many of these transactions expose us to credit risk in the event of default of our counterparty or client. In addition, our credit risk may be exacerbated when the collateral held by us cannot be realized upon or is liquidated at prices not sufficient to recover the full amount of the financial instrument exposure. There can be no assurance that any such losses would not materially and adversely affect our results of operations.
The financial services business is intensely competitive and our success will depend on our ability to compete effectively.
The financial services business in our market areas is highly competitive. It is becoming increasingly competitive due to changes in regulation, technological advances, and the accelerating pace of consolidation among financial services providers. We face competition both in attracting deposits and in originating loans. We compete for loans principally through the pricing of interest rates and loan fees and the efficiency and quality of services. Increasing levels of competition in the banking and financial services industries may reduce our market share or cause the prices charged for our services to fall. Improvements in technology, communications, and the internet have intensified competition. As a result, our competitive position could be weakened, which could adversely affect our financial condition and results of operations.
We are a community bank and our ability to maintain our reputation is critical to the success of our business and the failure to do so could materially adversely affect our performance.
We are a community bank, and our reputation is one of the most valuable components of our business. As such, we strive to conduct our business in a manner that enhances our reputation. This is done, in part, by recruiting, hiring and retaining employees who share our core values of being an integral part of the communities we serve, delivering superior service to our customers and caring about our customers and associates. If our reputation is negatively affected, by the actions of our employees or otherwise, our business and, therefore, our operating results could be materially adversely affected.
We may be unable to attract and retain key employees and personnel.
We will be dependent for the foreseeable future on the services of Joseph M. Schierhorn, our Chairman of the Board, President, Chief Executive Officer, and Chief Operating Officer of the Company; Michael Martin, our Executive Vice President, General Counsel and Corporate Secretary; and Jed W. Ballard, our Executive Vice President and Chief Financial Officer. While we maintain keyman life insurance on the lives of Messrs. Schierhorn Martin, and Ballard in the amounts of $2.4 million and $2 million, each,respectively, we may not be able to timely replace Mr. Schierhorn Mr. Martin, or Mr. Ballard with a person of comparable ability and experience should the need to do so arise, causing losses in excess of the insurance proceeds. The unexpected loss of key employees could have a material adverse effect on our business and possibly result in reduced revenues and earnings.
Liquidity risk could impair our ability to fund operations and jeopardize our financial conditions.
Liquidity is essential to our business. An inability to raise funds through deposits, borrowings and other sources could have a substantial negative effect on our liquidity and severely constrain our financial flexibility. Our primary source of funding is deposits gathered through our network of branch offices. Our access to funding sources in amounts adequate to finance our activities on terms that are acceptable to us could be impaired by factors that affect us specifically or the financial services industry or the economy in general. Factors that could negatively impact our access to liquidity sources include:
•a decrease in the level of our business activity as a result of an economic downturn in the markets in which our loans are concentrated;
•adverse regulatory actions against us; or
•our inability to attract and retain deposits.
Our ability to borrow could be impaired by factors that are not specific to us or our region, such as a disruption in the financial markets or negative views and expectations about the prospects for the financial services industry and unstable credit markets. Our access to deposits may also be negatively impacted by, among other factors, continued periods of low interest rates and increased competition for deposits, including from new financial technology competitors.
A failure of a significant number of our borrowers, guarantors and related parties to perform in accordance with the terms of their loans would have an adverse impact on our results of operations.
A source of risk arises from the possibility that losses will be sustained if a significant number of our borrowers, guarantors and related parties fail to perform in accordance with the terms of their loans. We have adopted underwriting and credit monitoring procedures and credit policies, including the establishment and review of our allowance for loan losses, which we believe are appropriate to minimize this risk by assessing the likelihood of nonperformance, tracking loan performance, and diversifying our credit portfolio. These policies and procedures, however, may not prevent unexpected losses that could materially affect our financial condition and results of operations.
Regulatory, Legislative and Legal Risks
We operate in a highly regulated environment and changes of or increases in banking or other laws and regulations or governmental fiscal or monetary policies could adversely affect us.
We are subject to extensive regulation, supervision and examination by federal and state banking authorities. In addition, as a publicly-traded company, we are subject to regulation by the SEC and NASDAQ. Any change in applicable regulations or federal or state legislation or in policies or interpretations or regulatory approaches to compliance and enforcement, income tax laws and accounting principles could have a substantial impact on us and our operations. Changes in laws and regulations may also increase our expenses by imposing additional fees or taxes or restrictions on our operations. Additional legislation and regulations that could significantly affect our authority and operations may be enacted or adopted in the future, which could have a material adverse effect on our financial condition and results of operations. Failure to appropriately comply with any such laws, regulations or principles could result in sanctions by regulatory agencies or damage to our reputation, all of which could adversely affect our business, financial condition or results of operations.
In that regard, the Dodd-Frank Act was enacted in July 2010. Among other provisions, the Dodd-Frank Act created the CFPB with broad powers to regulate consumer financial products such as credit cards and mortgages, created a Financial Stability Oversight Council comprised of the heads of other regulatory agencies, has resulted in new capital requirements from federal banking agencies, placed new limits on electronic debit card interchange fees, and requires banking regulators, the SEC and national stock exchanges to adopt significant new corporate governance and executive compensation reforms.
Certain provisions of these new rules have phase-in periods, including a 2.5% conservation buffer, which began to be phased-in in 2016 and took full effect on January 1, 2019. Further, regulators have significant discretion and authority to prevent or remedy practices that they deem to be unsafe or unsound, or violations of laws or regulations by financial institutions and holding companies in the performance of their supervisory and enforcement duties. These powers have been utilized more frequently in recent years due to the serious national economic conditions that faced the financial system in late 2008 and early 2009. The exercise of regulatory authority may have a negative impact on our financial condition and results of operations. Additionally, our business is affected significantly by the fiscal and monetary policies of the U.S. federal government and its agencies, including the FRB.
We cannot accurately predict the full effects of recent or future legislation or the various other governmental, regulatory, monetary and fiscal initiatives which have been and may be enacted on the financial markets and on the Company. The terms and costs of these activities could materially and adversely affect our business, financial condition, results of operations and the trading price of our common stock.
Changes in the FRB’s monetary or fiscal policies could adversely affect our results of operations and financial condition.
Our earnings will be affected by domestic economic conditions and the monetary and fiscal policies of the United States government and its agencies. The FRB has, and is likely to continue to have, an important impact on the operating results of depository institutions through its power to implement national monetary policy, among other things, in order to curb inflation or combat a recession. The FRB affects the levels of bank loans, investments and deposits through its control over the issuance of United States government securities, its regulation of the discount rate applicable to member banks and its influence over reserve requirements to which member banks are subject. The FOMC announced its target to keep the federal funds rate near zero percent in January 2022. However, the FOMC also indicated that due to rising inflation it expects to raise interest rates in the near term. While we expect the FRB to raise short-term interest rates in 2022, we cannot predict the nature or impact of future changes in monetary and fiscal policies.
Non-compliance with the USA PATRIOT Act, Bank Secrecy Act, Anti-Money Laundering Act of 2020, Real Estate Settlement Procedures Act, Truth-in-Lending Act or other laws and regulations could result in fines, sanctions or other adverse consequences.
Financial institutions are required under the USA PATRIOT Act and Bank Secrecy Act to develop programs to prevent financial institutions from being used for money-laundering and terrorist activities. Financial institutions are also obligated to file suspicious activity reports with the United States Treasury Department’s Office of Financial Crimes Enforcement Network if such activities are detected. These rules also require financial institutions to establish procedures for identifying and verifying the identity of customers seeking to open new financial accounts. Failure or the inability to comply with these regulations could result in fines or penalties, intervention or sanctions by regulators, and costly litigation or expensive additional controls and systems. In recent years, several banking institutions have received large fines for non-compliance with these laws and regulations. In addition, the federal government has in place laws and regulations relating to residential and consumer lending, as well as other activities with customers, that create significant compliance burdens and financial risks. We have developed policies and continue to augment procedures and systems designed to assist in compliance with these laws and regulations; however, it is possible for such safeguards to fail or prove deficient during the implementation phase to avoid non-compliance with such laws.
Accounting, Tax and Financial Risks
Changes in income tax laws and interpretations, or in accounting standards, could materially affect our financial condition or results of operations.
Further changes in income tax laws could be enacted, or interpretations of existing income tax laws could change, causing an adverse effect on our financial condition or results of operations. Similarly, our accounting policies and methods are fundamental to how we report our financial condition and results of operations. Some of these policies require the use of estimates and assumptions that may affect the value of our assets, liabilities, and financial results. Periodically, new accounting standards are issued or existing standards are revised, changing the methods for preparing our financial statements. These changes are not within our control and may significantly impact our financial condition and results of operations.
Uncertainty about the continuing availability of the London Inter-Bank Offered Rate ("LIBOR") may adversely affect our business.
On July 27, 2017, the United Kingdom’s Financial Conduct Authority, which regulates the LIBOR announced that after December 31, 2021 it would no longer compel banks to submit the rates required to calculate LIBOR. With this announcement there is uncertainty about the continued availability of LIBOR after 2021. If LIBOR ceases to be available or the methods of calculating LIBOR change from the current methods, financial products with interest rates tied to LIBOR may be adversely affected. Even if LIBOR remains available it is uncertain whether it will continue to be viewed as an acceptable market benchmark, what rate or rates may become accepted alternatives to LIBOR or what the effect of any such changes in views or alternatives may be on the markets for LIBOR-indexed financial instruments. We have loans, derivative contracts, and other financial instruments, including debentures related to our trust preferred securities, with rates that are either directly or indirectly tied to LIBOR. If any of the foregoing were to occur, the interest rates on these instruments, as well as the revenue and expenses associated with the same, may be adversely affected. Furthermore, failure to adequately manage this transition process with our customers could adversely impact our reputation.
General Economic and Market Risks
Natural disasters and adverse weather could negatively affect real estate property values and Bank operations.
Real estate and real estate property values play an important role for the Bank in several ways. The Bank owns or leases many real estate properties in connection with its operations, located in Anchorage, Juneau, Fairbanks, the Matanuska-Susitna Valley, Kodiak, Ketchikan, Sitka, and the Kenai Peninsula. Real estate is also utilized as collateral for many of our loans. A natural disaster could cause property values to fall, which could require the Bank to record an impairment on its financial statements. A natural disaster could also impact collateral values, which would increase our exposure to loan defaults. Our business operations could also suffer to the extent the Bank cannot utilize its branch network due to a natural disaster or other weather-related damage.
The soundness of other financial institutions could adversely affect us.
Our ability to engage in routine funding transactions could be adversely affected by the actions and commercial soundness of other financial institutions. Financial services institutions are interrelated as a result of trading, clearing, counterparty or other relationships. As a result, defaults by, or even rumors or questions about, one or more financial services institutions, or the financial services industry generally, have led to market-wide liquidity problems and could lead to losses or defaults by us or by other institutions. Many of these transactions expose us to credit risk in the event of default of our counterparty or client. In addition, our credit risk may be exacerbated when the collateral held by us cannot be realized upon or is liquidated at prices not sufficient to recover the full amount of the financial instrument exposure. There can be no assurance that any such losses would not materially and adversely affect our results of operations.
The financial services business is intensely competitive and our success will depend on our ability to compete effectively.
The financial services business in our market areas is highly competitive. It is becoming increasingly competitive due to changes in regulation, technological advances, and the accelerating pace of consolidation among financial services providers. We face competition both in attracting deposits and in originating loans. We compete for loans principally through the pricing of interest rates and loan fees and the efficiency and quality of services. Increasing levels of competition in the banking and financial services industries may reduce our market share or cause the prices charged for our services to fall. Improvements in technology, communications, and the internet have intensified competition. As a result, our competitive position could be weakened, which could adversely affect our financial condition and results of operations.
We are a community bank and our ability to maintain our reputation is critical to the success of our business and the failure to do so could materially adversely affect our performance.
We are a community bank, and our reputation is one of the most valuable components of our business. As such, we strive to conduct our business in a manner that enhances our reputation. This is done, in part, by recruiting, hiring and retaining employees who share our core values of being an integral part of the communities we serve, delivering superior service to our customers and caring about our customers and associates. If our reputation is negatively affected, by the actions of our employees or otherwise, our business and, therefore, our operating results could be materially adversely affected.
Social, political, and economic instability, unrest, and other circumstances beyond our control could adversely affect our business operations.
Our business may be adversely affected by social, political, and economic instability, unrest, or disruption in a geographic region in which we operate, regardless of cause, including legal, regulatory, and policy changes by a new presidential administration in the U.S., protests, demonstrations, strikes, riots, civil disturbance, disobedience, insurrection, or social and other political unrest.
Such events may result in restrictions, curfews, or other actions and give rise to significant changes in regional and global economic conditions and cycles, which may adversely affect our financial condition and operations. In 2020, there were protests in cities throughout the U.S. as well as globally, including in Hong Kong, in connection with civil rights, liberties, and social and governmental reform. Looting, vandalism, and fires have occurred in cities such as Seattle, Portland, Los Angeles, Washington, D.C., New York City, and Minneapolis that have led to the imposition of mandatory curfews and, in some locations, deployment of the U.S. National Guard. Government actions in an effort to protect people and property, including curfews and restrictions on business operations, may disrupt operations, harm perceptions of personal well-being, and increase the need for additional expenditures on security resources. In addition, action resulting from such social or political unrest may pose significant risks to our personnel, facilities, and operations. The effect and duration of demonstrations, protests, or other factors is uncertain, and we cannot ensure there will not be further political or social unrest in the future or that there will not be other events that could lead to social, political, and economic disruptions. If such events or disruptions persist for a prolonged period of time, our overall business and results of operations may be adversely affected.
In addition, a new U.S. President, Joseph R. Biden, was elected in November 2020. The aftermath of the November 2020 presidential election, including the January 6, 2021, violent disruption at the Capitol, has left the U.S. in what many consider to be an extremely heightened state of political and social tension, and it is unclear whether this tension will dissipate or intensify in coming months and what resulting impacts may occur to adversely affect our business operations or the safety of our employees, our customers, and the communities in which we operate.
Changes in federal policy, including tax policies, and at regulatory agencies occur over time through policy and personnel changes following elections, which lead to changes involving the level of oversight and focus on certain industries and corporate entities. The nature, timing, and economic and political effects of potential changes to the current legal and regulatory frameworks affecting the financial services industry remain highly uncertain.
Climate change, severe weather, natural disasters, and other external events could significantly impact our business.
Severe weather events of increasing strength and frequency due to climate change cannot be predicted and may be exacerbated by global climate change, natural disasters, including volcanic eruptions and earthquakes, and other adverse external events could have a significant impact on our ability to conduct business or upon third parties who perform operational services for us. In addition, there is continuing uncertainty over demand for oil and gas in part due to regulatory changes from climate change related policies.Such events could affect the stability of our deposit base, impair the ability of borrowers to repay outstanding loans, impair the value of collateral securing loans, cause significant property damage, result in lost revenue, or cause us to incur additional expenses.Although management has established disaster recovery policies and procedures, there can be no assurance of the effectiveness of such policies and procedures, and the occurrence of any such event could have a material adverse effect on our business, financial condition and results of operations.
ITEM 1B.UNRESOLVED STAFF COMMENTS
None.
ITEM 2.PROPERTIES
The following sets forth information about our Community Banking branch locations:
|
| | | | | | | |
| Locations | Type | Leased/Owned |
Midtown Financial Center: Northrim Headquarters 3111 C Street, Anchorage, AK | Traditional | Land partially leased, partially owned, building owned |
SouthSide Financial Center
8730 Old Seward Highway, Anchorage, AK
| Traditional | Land leased, building owned |
Lake Otis Community Branch
2270 East 37th Avenue, Anchorage, AK
| Traditional | Land leased, building owned |
Huffman Branch
1501 East Huffman Road, Anchorage, AK
| In-store | Leased |
Jewel Lake Branch 9170 Jewel Lake Road
4000 W. Dimond Boulevard, Suite 101,No. 02, Anchorage, AK
| Traditional | Leased |
Seventh Avenue Branch
517 West Seventh Avenue, Suite 300, Anchorage, AK
| Traditional | Leased |
Eastside Community Branch
7905 Creekside Center Drive, Suite 100, Anchorage, AK | Traditional | Leased |
West Anchorage Branch
2709 Spenard Road, Anchorage, AK
| Traditional | Owned |
Eagle River Branch
12812 Old Glenn Highway, Suite C03, Eagle River, AK
| Traditional | Leased |
Fairbanks Financial Center
360 Merhar Avenue, Fairbanks, AK
| Traditional | Owned |
Wasilla Financial Center
850 E. USA Circle, Suite A, Wasilla, AK
| Traditional | Owned |
Soldotna Loan Production Office
44296Financial Center
44384 Sterling Highway, Suite 1,101, Soldotna, AK | Loan productionTraditional | Leased |
Juneau Financial Center
2094 Jordan Avenue, Juneau, AK | Traditional | Leased |
Juneau Downtown Branch
301 North Franklin Street, Juneau, AK | Traditional | Leased |
Sitka Financial Center
315 Lincoln Street, Suite 206, Sitka, AK | Traditional | Leased |
Ketchikan Financial Center
2491 Tongass Avenue, Ketchikan, AK | Traditional | Owned |
Kodiak Loan Production Office
2011 Mill Bay Road, #1, Kodiak, AK | Loan Production | Leased |
Fairbanks West Community Branch
3637 Airport Way, Suite 110, Fairbanks, AK | Traditional | Leased |
The following sets forth information about our Home Mortgage Lending branch locations, operated by RML:
|
| | | | |
| Locations | Leased/Owned |
Main Office at Calais
100 Calais Drive, Anchorage, AK
| Leased |
ReMax/Dynamic Office
3350 Midtown Place, Suite 101, Anchorage, AK | Leased |
Midtown Office
101 W. Benson Boulevard, #201, Anchorage, AK | Leased |
Eagle River Office
11901 Business Boulevard, #203,
12812 Old Glenn Highway, Suite C-4, Eagle River, AK | Leased |
Fairbanks Office
308
324 Old Steese Highway, Suite 7, Fairbanks, AK | Leased |
Fairbanks Northrim Office
360 Merhar Avenue, Fairbanks, AK | Leased |
Fairbanks Office
711 Gaffney Road, Suite 202,201, Fairbanks, AK | Leased |
Juneau Office
8800 Glacier Highway, #232, Juneau, AK | Leased |
Kodiak Office
2011 Mill Bay Road, #101,#1, Kodiak, AK | Leased |
Soldotna Office
44296
44384 Sterling Highway, #1,Suite 102, Soldotna, AK | Leased |
Wasilla Remax Dynamic Branch
892 E USA Circle, Suite 105, Wasilla, AK | Leased |
Wasilla Northrim Branch
850 E USA Circle, Suite B, Wasilla, AK | Leased |
ITEM 3.LEGAL PROCEEDINGS
The Company from time to time may be involved with disputes, claims and litigation related to the conduct of its banking business. Management does not expect that the resolution of these matters will have a material effect on the Company’s business, financial position, results of operations or cash flows.
ITEM 4.MINE SAFETY DISCLOSURES
Not applicable.
PART II
ITEM 5.MARKET FOR REGISTRANT’S COMMON EQUITY, RELATED STOCKHOLDER MATTERS, AND ISSUER PURCHASES OF EQUITY SECURITIES
Our common stock trades on the NASDAQ Global Select Stock Market under the symbol, “NRIM.” At March 12, 2019,4, 2022, the number of shareholders of record of our common stock was 246.218. As many of our shares of common stock are held of record in "street name" by brokers and other institutions on behalf of shareholders, we are unable to estimate the total number of beneficial holders of our common stock represented by these record holders.
The following are high and low closing prices as reported by NASDAQ. Prices do not include retail markups, markdowns or commissions.
|
| | | | | |
| | | First | Second | Third | Fourth |
| | | Quarter | Quarter | Quarter | Quarter |
| 2018 | | | | | |
| | High | $36.05 | $40.45 | $45.35 | $43.00 |
| | Low | $32.80 | $34.05 | $38.80 | $30.70 |
| 2017 | | | | | |
| | High | $32.40 | $32.55 | $35.35 | $37.90 |
| | Low | $27.50 | $29.25 | $26.45 | $32.50 |
In 2018, we paid cash dividends of $0.24 per share in the first and second quarters and $0.27 per share in the third and fourth quarters. In 2017, we paid cash dividends of $0.21 per share in the first and second quarters and $0.22 per share in the third and fourth quarters. Cash dividends totaled $7.1 million, $6.0 million, and $5.4 million in 2018, 2017, and 2016, respectively. On February 28, 2019, the Board of Directors approved payment of a $0.30 per share cash dividend on March 22, 2019, to shareholders of record on March 14, 2019. The Company and the Bank are subject to restrictions on the payment of dividends pursuant to applicable federal and state banking regulations and Alaska corporate law. The dividends that the Bank pays to the Company are limited to the extent necessary for the Bank to meet the regulatory requirements of a “well-capitalized” bank. Given the fact that the Bank believes it will remain “well-capitalized”; the Company expects to receive dividends from the Bank in 2019. Beginning in 2016, a requirement to have a capital conservation buffer began to be phased in and is now in full effect, and this requirement could adversely affect the Bank's ability to pay dividends. See "Item 1 Business - Supervision and Regulation" in this report.
Repurchase of Securities
At December 31, 2018,2021, there are 153,433were 33,724 shares available under the previously announced stock repurchase program. The Company repurchased 15,468279,276 shares in 20182021 and 58,341327,000 shares in 2017.2020. On January 28, 2022, the Company announced that its Board of Directors had authorized the repurchase of up to an additional 300,000 shares of common stock. The Company intends to continue to repurchase its stock from time to time depending upon market conditions, but we can make no assurances that we will continue this program or that we will repurchase allprogram.
The Company repurchased 188,264 shares of its common stock during the authorized shares.three-month period ending December 31, 2021.
| | | | | | | | | | | | | | |
| Total Number of Shares (or Units) Purchased | Average Price Paid per Shares (or Unit) | Total Number of Shares (or Units) Purchased as Part of the Publicly Announced Plans or Programs | Maximum Number (1) (or Approximate Dollar Value) of Shares (or Units) that May Yet Be Purchased Under the Plans or Programs |
| Period | (a) | (b) | (c) | (d) |
| Month No. 1 | | | | |
| October 1, 2021 - October 31, 2021 | 35,810 | | $44.24 | | 35,810 | | 186,178 | |
| Month No. 2 | | | | |
| November 1, 2021 - November 30, 2021 | 20,189 | | $44.58 | | 20,189 | | 165,989 | |
| Month No. 3 | | | | |
| December 1, 2021 - December 31, 2021 | 132,265 | | $42.60 | | 132,265 | 33,724 |
| Total | 188,264 | $43.12 | | 188,264 | 33,724 |
Equity Compensation Plan Information
The following table sets forth information regarding securities authorized for issuance under the Company’s equity plans as of December 31, 2018.2021. Additional information regarding the Company’s equity plans is presented in Note 2122 of the Notes to Consolidated Financial Statements included in Part II. Item 8 of this report.
| | | Plan Category | Number of Securities to be Issued Upon Exercise of Outstanding Options, Warrants and Rights (a) (2) | Weighted-Average Exercise Price of Outstanding Options,
Warrants and Rights | Number of Securities Remaining Available for Future Issuance Under Equity Compensation Plans (Excluding Securities Reflected in Column (a)) | Plan Category | Number of Securities to be Issued Upon Exercise of Outstanding Options, Warrants and Rights (a) | Weighted-Average Exercise Price of Outstanding Options,
Warrants and Rights | Number of Securities Remaining Available for Future Issuance Under Equity Compensation Plans (Excluding Securities Reflected in Column (a)) |
Equity compensation plans approved by security holders1 | 222,447 | $19.26 | 176,199 | Equity compensation plans approved by security holders1 | 193,034 | $23.77 | 170,905 |
| Total | 222,447 | $19.26 | 176,199 | Total | 193,034 | $23.77 | 170,905 |
1Consists of the Company's 2017 Stock Incentive Plan, which replaced the 2014 Stock Incentive Plan (the "2014 Plan") | |
2 Includes 129,933 options awarded under the 2014 Plan and other previous stock option plans. | |
1Consists of the Company's 2020 Stock Incentive Plan, which replaced the 2017 Stock Incentive Plan (the "2017 Plan") | | 1Consists of the Company's 2020 Stock Incentive Plan, which replaced the 2017 Stock Incentive Plan (the "2017 Plan") |
We do not have any equity compensation plans that have not been approved by our shareholders.
Stock Performance Graph
The graph shown below depicts the total return to shareholders during the period beginning after December 31, 2013,2016, and ending December 31, 2018.2021. The definition of total return includes appreciation in market value of the stock, as well as the actual cash and stock dividends paid to shareholders. The comparable indices utilized are the Russell 3000 Index, representing approximately 98% of the U.S. equity market, and the SNL Financial Bank StockS&P U.S. Small Cap Banks Index, comprised of publicly traded banks with assets of $1 billiona market capitalization between $750 million to $5$3.3 billion, which are located in the United States. The graph assumes that the value of the investment in the Company’s common stock and each of the two indices was $100 on December 31, 2013,2016, and that all dividends were reinvested.
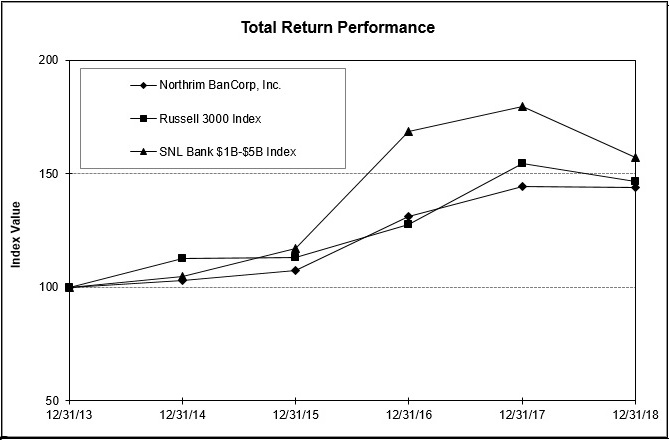
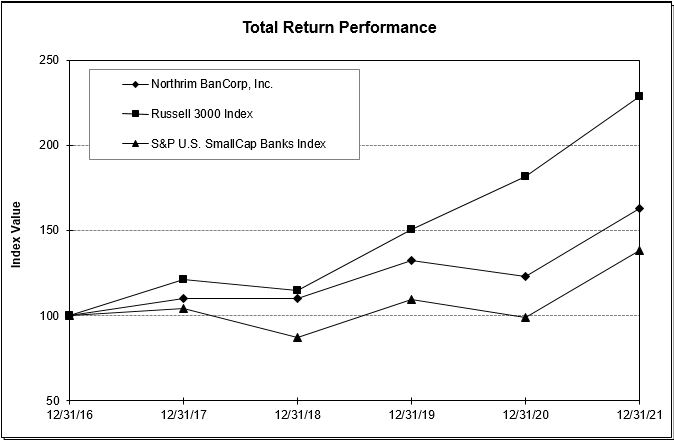
| | | | | | | | | | | | | | | | | | | | |
| Period Ending |
| Index | 12/31/16 | 12/31/17 | 12/31/18 | 12/31/19 | 12/31/20 | 12/31/21 |
| Northrim BanCorp, Inc. | 100.00 | | 110.12 | | 109.83 | | 132.45 | | 122.95 | | 162.87 | |
| Russell 3000 | 100.00 | | 121.13 | | 114.78 | | 150.39 | | 181.8 | | 228.45 | |
| S&P U.S. SmallCap Banks | 100.00 | | 104.33 | | 87.06 | | 109.22 | | 99.19 | | 138.09 | |
|
| | | | | | | | | | | | |
| | Period Ending |
| Index | 12/31/13 | 12/31/14 | 12/31/15 | 12/13/16 | 12/31/17 | 12/31/18 |
| Northrim BanCorp, Inc. | 100.00 |
| 102.77 |
| 107.11 |
| 131.15 |
| 144.42 |
| 144.01 |
|
| Russell 3000 | 100.00 |
| 112.56 |
| 113.1 |
| 127.50 |
| 154.44 |
| 146.34 |
|
| SNL Bank $1B-$5B | 100.00 |
| 104.56 |
| 117.04 |
| 168.38 |
| 179.51 |
| 157.27 |
|
ITEM 6.SELECTED FINANCIAL DATA(1) [RESERVED]
|
| | | | | | | | | | | | | | | | | | | | |
| | Years Ended December 31, | |
| | (In thousands, except per share data and shares outstanding amounts) | |
| 2018 | 2017 | 2016 | 2015 | 2014 | 2013 | Five Year Compound Growth Rate |
| | (Unaudited) |
| Net interest income |
| $61,208 |
|
| $57,678 |
|
| $56,357 |
|
| $56,909 |
|
| $52,293 |
|
| $44,034 |
| 7 | % |
| Provision (benefit) for loan losses | (500 | ) | 3,200 |
| 2,298 |
| 1,754 |
| (636 | ) | (635 | ) | NM |
|
| Other operating income | 32,167 |
| 40,474 |
| 43,263 |
| 44,608 |
| 20,034 |
| 12,886 |
| 20 | % |
| Compensation expense, RML acquisition payments | — |
| 130 |
| 4,775 |
| 4,094 |
| — |
| — |
| NM |
|
| Other operating expense | 69,800 |
| 71,023 |
| 71,505 |
| 68,551 |
| 46,923 |
| 38,897 |
| 12 | % |
| Income before provision for income taxes |
| $24,075 |
|
| $23,799 |
|
| $21,042 |
|
| $27,118 |
|
| $26,040 |
|
| $18,658 |
| 5 | % |
| Provision for income taxes | 4,071 |
| 10,321 |
| 6,052 |
| 8,784 |
| 8,173 |
| 6,246 |
| (8 | )% |
| Net Income | 20,004 |
| 13,478 |
| 14,990 |
| 18,334 |
| 17,867 |
| 12,412 |
| 10 | % |
| Less: Net income attributable to | | | | | | |
|
| noncontrolling interest | — |
| 327 |
| 579 |
| 551 |
| 459 |
| 87 |
| NM |
|
| Net income attributable to Northrim Bancorp, Inc. |
| $20,004 |
|
| $13,151 |
|
| $14,411 |
|
| $17,783 |
|
| $17,408 |
|
| $12,325 |
| 10 | % |
| | | | | | | | |
| Year End Balance Sheet | | | | | | | |
| Assets |
| $1,502,988 |
|
| $1,518,596 |
|
| $1,525,851 |
|
| $1,498,691 |
|
| $1,448,327 |
|
| $1,213,740 |
| 4 | % |
| Portfolio loans | 984,346 |
| 954,953 |
| 974,074 |
| 979,682 |
| 923,122 |
| 768,750 |
| 5 | % |
| Deposits | 1,228,088 |
| 1,258,283 |
| 1,267,653 |
| 1,240,792 |
| 1,179,747 |
| 1,003,723 |
| 4 | % |
| Securities sold under repurchase agreements | 34,278 |
| 27,746 |
| 27,607 |
| 31,420 |
| 19,843 |
| 21,143 |
| 10 | % |
| Borrowings | 7,241 |
| 7,362 |
| 4,338 |
| 2,120 |
| 26,304 |
| 6,527 |
| 2 | % |
| Junior subordinated debentures | 10,310 |
| 10,310 |
| 18,558 |
| 18,558 |
| 18,558 |
| 18,558 |
| (11 | )% |
| Shareholders' equity | 205,947 |
| 192,802 |
| 186,712 |
| 177,214 |
| 164,441 |
| 144,318 |
| 7 | % |
| Common shares outstanding | 6,883,216 |
| 6,871,963 |
| 6,897,890 |
| 6,877,140 |
| 6,854,189 |
| 6,537,652 |
| 1 | % |
| | | | | | | | |
| Average Balance Sheet | | | | | | | |
| Assets |
| $1,493,385 |
|
| $1,511,052 |
|
| $1,506,522 |
|
| $1,480,913 |
|
| $1,335,929 |
|
| $1,156,500 |
| 5 | % |
| Earning assets | 1,346,449 |
| 1,367,203 |
| 1,361,913 |
| 1,334,102 |
| 1,212,291 |
| 1,041,268 |
| 5 | % |
| Portfolio loans | 971,548 |
| 981,001 |
| 976,613 |
| 968,752 |
| 893,031 |
| 734,427 |
| 6 | % |
| Deposits | 1,227,272 |
| 1,248,333 |
| 1,250,243 |
| 1,219,445 |
| 1,111,594 |
| 953,925 |
| 5 | % |
| Securities sold under repurchase agreements | 29,940 |
| 29,690 |
| 27,322 |
| 24,447 |
| 20,909 |
| 19,454 |
| 9 | % |
| Borrowings | 7,309 |
| 5,767 |
| 4,215 |
| 14,552 |
| 4,697 |
| 6,130 |
| 4 | % |
| Junior subordinated debentures | 10,310 |
| 15,066 |
| 18,558 |
| 18,558 |
| 18,558 |
| 18,558 |
| (11 | )% |
| Shareholders' equity | 201,022 |
| 193,129 |
| 181,628 |
| 169,802 |
| 155,591 |
| 140,924 |
| 7 | % |
| Basic common shares outstanding | 6,877,573 |
| 6,889,621 |
| 6,883,663 |
| 6,859,209 |
| 6,761,328 |
| 6,518,772 |
| 1 | % |
| Diluted common shares outstanding | 6,981,557 |
| 6,977,910 |
| 6,974,864 |
| 6,948,474 |
| 6,852,267 |
| 6,609,950 |
| 1 | % |
| | | | | | | | |
| Per Common Share Data | | | | | | | |
| Basic earnings |
| $2.91 |
|
| $1.91 |
|
| $2.09 |
|
| $2.59 |
|
| $2.57 |
|
| $1.89 |
| 9 | % |
| Diluted earnings |
| $2.86 |
|
| $1.88 |
|
| $2.06 |
|
| $2.56 |
|
| $2.54 |
|
| $1.87 |
| 9 | % |
| Book value per share |
| $29.92 |
|
| $28.06 |
|
| $27.07 |
|
| $25.77 |
|
| $23.99 |
|
| $22.07 |
| 6 | % |
Tangible book value per share(2) |
| $27.57 |
|
| $25.70 |
|
| $24.70 |
|
| $22.31 |
|
| $20.48 |
|
| $20.86 |
| 6 | % |
| Cash dividends per share |
| $1.02 |
|
| $0.86 |
|
| $0.78 |
|
| $0.74 |
|
| $0.70 |
|
| $0.64 |
| 10 | % |
|
| | | | | | | | | | | | | | | | | | | | |
| | Years Ended December 31, | |
| | 2018 | 2017 | 2016 | 2015 | 2014 | 2013 | Five Year Compound Growth Rate |
| | (Unaudited) | |
| Performance Ratios | | | | | | | |
| Return on average assets | 1.34 | % | 0.87 | % | 0.96 | % | 1.20 | % | 1.30 | % | 1.07 | % | 5 | % |
| Return on average equity | 9.95 | % | 6.81 | % | 7.93 | % | 10.47 | % | 11.19 | % | 8.75 | % | 3 | % |
| Equity/assets | 13.70 | % | 12.70 | % | 12.24 | % | 11.82 | % | 11.35 | % | 11.89 | % | 3 | % |
Tangible common equity/tangible assets(3) | 12.76 | % | 11.75 | % | 11.29 | % | 10.40 | % | 9.86 | % | 11.31 | % | 2 | % |
| Net interest margin | 4.55 | % | 4.22 | % | 4.14 | % | 4.27 | % | 4.31 | % | 4.23 | % | 1 | % |
Net interest margin (tax equivalent)(4) | 4.60 | % | 4.28 | % | 4.20 | % | 4.32 | % | 4.36 | % | 4.29 | % | 1 | % |
| Non-interest income/total revenue | 34.45 | % | 41.24 | % | 43.43 | % | 43.94 | % | 27.70 | % | 22.64 | % | 9 | % |
Efficiency ratio (5) | 74.68 | % | 72.39 | % | 76.44 | % | 71.31 | % | 64.48 | % | 67.94 | % | 2 | % |
| Dividend payout ratio | 35.08 | % | 45.44 | % | 37.59 | % | 28.81 | % | 27.40 | % | 34.18 | % | 1 | % |
| | | | | | | | |
| Asset Quality | | | | | | | |
| Nonperforming loans, net of government guarantees |
| $14,694 |
|
| $21,411 |
|
| $12,936 |
|
| $2,125 |
|
| $3,496 |
|
| $1,814 |
| 52 | % |
| Nonperforming assets, net of government guarantees | 22,619 |
| 28,729 |
| 19,315 |
| 5,178 |
| 7,231 |
| 4,216 |
| 40 | % |
| Nonperforming loans/portfolio loans, net of government guarantees | 1.49 | % | 2.24 | % | 1.33 | % | 0.22 | % | 0.38 | % | 0.24 | % | 44 | % |
| Net charge-offs (recoveries)/average loans | 0.15 | % | 0.15 | % | 0.08 | % | 0.03 | % | (0.12 | )% | (0.07 | )% | NM |
|
| Allowance for loan losses/portfolio loans | 1.98 | % | 2.25 | % | 2.02 | % | 1.85 | % | 1.81 | % | 2.11 | % | (1 | )% |
| Nonperforming assets/assets, net of government guarantees | 1.50 | % | 1.89 | % | 1.27 | % | 0.35 | % | 0.50 | % | 0.35 | % | 34 | % |
| | | | | | | | |
| Other Data | | | | | | | |
Effective tax rate (6) | 17 | % | 43 | % | 29 | % | 32 | % | 31 | % | 33 | % | (12 | )% |
Number of banking offices(7) | 16 |
| 14 |
| 14 |
| 14 |
| 14 |
| 10 |
| 10 | % |
Number of employees (FTE) (8) | 430 |
| 429 |
| 451 |
| 441 |
| 426 |
| 269 |
| 10 | % |
1 These unaudited schedules provide selected financial information concerning the Company that should be read in conjunction with Item 7 "Management's Discussion and Analysis of Financial Condition and Results of Operations" of this report.
2Tangible book value per share is a non-GAAP ratio defined as shareholders’ equity, less intangible assets, divided by common shares outstanding. Management believes that tangible book value is a useful measurement of the value of the Company’s equity because it excludes the effect of intangible assets on the Company’s equity. See reconciliation to book value per share, the most comparable GAAP measurement below.
3Tangible common equity to tangible assets is a non-GAAP ratio that represents total equity less goodwill and intangible assets divided by total assets less goodwill and intangible assets. Management believes this ratio is important as it has received more attention over the past several years from stock analysts and regulators. The most comparable GAAP measure of shareholders' equity to total assets is calculated by dividing total shareholders' equity by total assets. See reconciliation to shareholders' equity to total assets below.
4Tax-equivalent net interest margin is a non-GAAP performance measurement in which interest income on non-taxable investments and loans is presented on a tax-equivalent basis using a combined federal and state statutory rate of 28.43% in 2018 and 41.11% in all other years presented. Management believes that tax-equivalent net interest margin is a useful financial measure because it enables investors to evaluate net interest margin excluding tax expense in order to monitor our effectiveness in growing higher interest yielding assets and managing our costs of interest bearing liabilities over time on a fully tax equivalent basis. See reconciliation to net interest margin, the comparable GAAP measurement below.
5In managing our business, we review the efficiency ratio exclusive of intangible asset amortization, which is a non-GAAP performance measurement. Management believes that this is a useful financial measurement because we believe this presentation provides investors with a more accurate picture of our operating efficiency. The efficiency ratio is calculated by dividing other operating expense, exclusive of intangible asset amortization, by the sum of net interest income and other operating income. Other companies may define or calculate this data differently. For additional information see the "Other Operating Expense" section in Item 7 "Management's Discussion and Analysis of Financial Condition and Results of Operations" of this report. See reconciliation to comparable GAAP measurement below.
6The Company’s 2017 results included the impact of the enactment of the Tax Cuts and Jobs Act, which was signed into law on December 22, 2017. The law includes significant changes to the U.S. corporate tax system, including a Federal corporate rate reduction from 35% to 21%. In 2017, the Company applied the newly enacted corporate federal income tax rate of 21%, reducing the value of the Company's net deferred tax asset, resulting in approximately a $2.7 million increase in tax expense. In 2018, the Company finalized changes related to the reduction in the federal tax rate which resulted in a $470,000 reduction in tax expense.
7Number of banking offices includes 15 full service branches and 1 loan production office. Does not include RML locations.
8FTE includes 320 employees of the Bank and 110 employees of RML in 2018, 314 employees of the Bank and 115 employees of RML in 2017, 304 employees of the Bank, 130 employees of RML, and 17 employees of NBG in 2016, 303 employees of the Bank, 124 employees of RML, and 14 employees of NBG in 2015, 294 employees of the Bank, 117 employees of RML, and 15 employees of NBG in 2014, and 256 employees of the Bank and 13 employees of NBG in 2013.
Reconciliation of Selected Financial Data to GAAP Financial Measures
These unaudited schedules provide selected financial information concerning the Company that should be read in conjunction with "Item 7. Management's Discussion and Analysis of Financial Condition and Results of Operations" of this report.
Reconciliationoftotal shareholders' equity to tangiblecommonshareholders’equity (Non-GAAP)and total assets totangible assets:
|
| | | | | | | | | | | | | | | | | | |
| (In Thousands) | 2018 | 2017 | 2016 | 2015 | 2014 | 2013 |
| Total shareholders' equity |
| $205,947 |
|
| $192,802 |
|
| $186,712 |
|
| $177,214 |
|
| $164,441 |
|
| $144,318 |
|
| Total assets | 1,502,988 |
| 1,518,596 |
| 1,525,851 |
| 1,498,691 |
| 1,448,327 |
| 1,213,740 |
|
| Total shareholders' equity to total assets ratio | 13.70 | % | 12.70 | % | 12.24 | % | 11.82 | % | 11.35 | % | 11.89 | % |
|
| | | | | | | | | | | | | | | | | | |
| (In Thousands) | 2018 | 2017 | 2016 | 2015 | 2014 | 2013 |
| Total shareholders' equity |
| $205,947 |
|
| $192,802 |
|
| $186,712 |
|
| $177,214 |
|
| $164,441 |
|
| $144,318 |
|
| Less: goodwill and other intangible assets, net | 16,154 |
| 16,224 |
| 16,324 |
| 23,776 |
| 24,035 |
| 7,942 |
|
| Tangible common shareholders' equity |
| $189,793 |
|
| $176,578 |
|
| $170,388 |
|
| $153,438 |
|
| $140,406 |
|
| $136,376 |
|
| Total assets |
| $1,502,988 |
|
| $1,518,596 |
|
| $1,525,851 |
|
| $1,498,691 |
|
| $1,448,327 |
|
| $1,213,740 |
|
| Less: goodwill and other intangible assets, net | 16,154 |
| 16,224 |
| 16,324 |
| 23,776 |
| 24,035 |
| 7,942 |
|
| Tangible assets |
| $1,486,834 |
|
| $1,502,372 |
|
| $1,509,527 |
|
| $1,474,915 |
|
| $1,424,292 |
|
| $1,205,798 |
|
| Tangible common equity to tangible assets ratio | 12.76 | % | 11.75 | % | 11.29 | % | 10.40 | % | 9.86 | % | 11.31 | % |
Reconciliation of tangible book value per share to book value per share
|
| | | | | | | | | | | | | | | | | | |
| (In thousands, except per share data) | 2018 | 2017 | 2016 | 2015 | 2014 | 2013 |
| Total shareholders' equity |
| $205,947 |
|
| $192,802 |
|
| $186,712 |
|
| $177,214 |
|
| $164,441 |
|
| $144,318 |
|
| Divided by common shares outstanding | 6,883,216 |
| 6,871,963 |
| 6,897,890 |
| 6,877,140 |
| 6,854,189 |
| 6,537,652 |
|
| Book value per share |
| $29.92 |
|
| $28.06 |
|
| $27.07 |
|
| $25.77 |
|
| $23.99 |
|
| $22.07 |
|
|
| | | | | | | | | | | | | | | | | | |
| (In thousands, except per share data) | 2018 | 2017 | 2016 | 2015 | 2014 | 2013 |
| Total shareholders' equity |
| $205,947 |
|
| $192,802 |
|
| $186,712 |
|
| $177,214 |
|
| $164,441 |
|
| $144,318 |
|
| Less: goodwill and intangible assets, net | 16,154 |
| 16,224 |
| 16,324 |
| 23,776 |
| 24,035 |
| 7,942 |
|
| |
| $189,793 |
|
| $176,578 |
|
| $170,388 |
|
| $153,438 |
|
| $140,406 |
|
| $136,376 |
|
| Divided by common shares outstanding | 6,883,216 |
| 6,871,963 |
| 6,897,890 |
| 6,877,140 |
| 6,854,189 |
| 6,537,652 |
|
| Tangible book value per share |
| $27.57 |
|
| $25.70 |
|
| $24.70 |
|
| $22.31 |
|
| $20.48 |
|
| $20.86 |
|
Reconciliation of tax-equivalent net interest margin to net interest margin
|
| | | | | | | | | | | | | | | | | | |
| (In Thousands) | 2018 | 2017 | 2016 | 2015 | 2014 | 2013 |
Net interest income(9) |
| $61,208 |
|
| $57,678 |
|
| $56,357 |
|
| $56,909 |
|
| $52,293 |
|
| $44,034 |
|
| Divided by average interest-bearing assets | 1,346,449 |
| 1,367,203 |
| 1,361,913 |
| 1,334,102 |
| 1,212,291 |
| 1,041,268 |
|
| Net interest margin | 4.55 | % | 4.22 | % | 4.14 | % | 4.27 | % | 4.31 | % | 4.23 | % |
|
| | | | | | | | | | | | | | | | | | |
| (In Thousands) | 2018 | 2017 | 2016 | 2015 | 2014 | 2013 |
Net interest income(9) |
| $61,208 |
|
| $57,678 |
|
| $56,357 |
|
| $56,909 |
|
| $52,293 |
|
| $44,034 |
|
| Plus: reduction in tax expense related to | | | | | | |
| tax-exempt interest income | 726 |
| 872 |
| 808 |
| 722 |
| 583 |
| 585 |
|
| |
| $61,934 |
|
| $58,550 |
|
| $57,165 |
|
| $57,631 |
|
| $52,876 |
|
| $44,619 |
|
| Divided by average interest-bearing assets | 1,346,449 |
| 1,367,203 |
| 1,361,913 |
| 1,334,102 |
| 1,212,291 |
| 1,041,268 |
|
| Tax-equivalent net interest margin | 4.60 | % | 4.28 | % | 4.20 | % | 4.32 | % | 4.36 | % | 4.29 | % |
Calculation of efficiency ratio
|
| | | | | | | | | | | | | | | | | | |
| (In Thousands) | 2018 | 2017 | 2016 | 2015 | 2014 | 2013 |
Net interest income(9) |
| $61,208 |
|
| $57,678 |
|
| $56,357 |
|
| $56,909 |
|
| $52,293 |
|
| $44,034 |
|
| Other operating income | 32,167 |
| 40,474 |
| 43,263 |
| 44,608 |
| 20,034 |
| 12,886 |
|
| Total revenue | 93,375 |
| 98,152 |
| 99,620 |
| 101,517 |
| 72,327 |
| 56,920 |
|
| Other operating expense | 69,800 |
| 71,153 |
| 76,280 |
| 72,645 |
| 46,923 |
| 38,897 |
|
| Less intangible asset amortization | 70 |
| 100 |
| 135 |
| 258 |
| 289 |
| 228 |
|
| Adjusted other operating expense |
| $69,730 |
|
| $71,053 |
|
| $76,145 |
|
| $72,387 |
|
| $46,634 |
|
| $38,669 |
|
| Efficiency ratio | 74.68 | % | 72.39 | % | 76.44 | % | 71.31 | % | 64.48 | % | 67.94 | % |
9Amount represents net interest income before provision for loan losses.
Non-GAAP financial measures have inherent limitations, are not required to be uniformly applied, and are not audited. Although we believe these non-GAAP financial measures are frequently used by stakeholders in the evaluation of the Company, they have limitations as analytical tools and should not be considered in isolation or as a substitute for analysis of results as reported under GAAP.
ITEM 7.MANAGEMENT’S DISCUSSION AND ANALYSIS OF FINANCIAL CONDITION AND RESULTS OF OPERATIONS
This discussionWe have prepared this Management's Discussion and Analysis as an aid to understanding our financial results. It highlights key information as determined by management but may not contain all of the information that is important to you. For a more complete understanding, the followingIt should be read in conjunction with the Company’s audited consolidated financial statements and the notes thereto as of December 31, 2018, 2017 and 2016 included in Part II. Item 8 of this report. Discussions of 2019 items and year-to-year comparisons between 2020 and 2019 that are not included in this Form 10-K can be found in "Management's Discussion and Analysis of Financial Condition and Results of Operations" in Part II. Item 7 of our Annual Report on Form 10-K for fiscal year ended December 31, 2020.
This annual report contains forward-looking statements that involve risks and uncertainties. Our actual results may differ materially from those indicated in forward-looking statements. See “Cautionary Note Regarding Forward-Looking Statements.”
Executive Overview
Net income attributable to the Company increased 52%14% to $20.0$37.5 million or $2.86$6.00 per diluted share for the year ended December 31, 2018,2021, from $13.2$32.9 million, or $1.88$5.11 per diluted share, for the year ended December 31, 2017. Significant items contributing to the increase in 2018 compared to 2017 were:
an2020. The increase in net interest income due to increasesis the result of an $11.6 million increase in interest rates
net income in the Community Banking segment, which was only partially offset by a $7.0 million decrease in the provision fornet income taxes due to a lower federal corporate income tax rate in 2018 arising from the Tax Cuts Jobs Act, and
a decrease in the provision for loan losses primarily resulting from improvements in credit quality.Home Mortgage Lending segment.
The following are other significant itemsHighlights for the year ended December 31, 2018:2021 are as follows:
Total revenues, which include net interest•Net income plus other operating income, decreased 5%in the Community Banking segment increased 74% or $11.6 million, to $93.4$27.2 million in 2018 from $98.22021 as compared to 2020. This increase was primarily the result of the following:
◦Interest and fee income on PPP loans increased $7.3 million to $15.4 million in 2017 and decreased 6%2021 from $99.6$8.1 million in 2016. This decrease mainly reflects decreased mortgage banking2020. Interest income on PPP loans was $2.9 million and employee benefit plan income, as well as the fact that the company recognized a gain on the sale of NBG in 2017. These declines were partially offset by an increase in net interest income, a one-time immaterial gain on commercial servicing rights, and increases in purchased receivable income and bankcard fees.
The net interest margin increased to 4.55% in 2018 from 4.22% in 2017 and 4.14% in 2016 despite a decline in average loans to $971.5$2.5 million in 20182021 and 2020, respectively. Loan fee income on PPP loans was $12.5 million and $5.6 million in 2021 and 2020, respectively. Loan fee income on PPP loans is largely made up of fees fully recognized upon loan forgiveness from the SBA. In 2021, $426.3 million PPP loans were forgiven compared to $981.0$65.1 million in 2017 and $976.62020. As of December 31, 2021, there is $4.5 million in 2016. This increasedeferred PPP loan fees, net of deferred costs, remaining to be recognized. Management expects the majority of the remaining deferred fees to be recognized in 2022.
◦The provision for credit losses decreased in 2021 to a benefit of $4.1 million from a provision of $2.4 million in 2020. As of January 1, 2021, the Company implemented ASU 2016-13, Financial Instruments - Credit Losses ("ASU 2016-13" or "CECL"). The provision for 2021 was recorded using the CECL methodology and reflects expected lifetime credit losses on loans and off-balance sheet unfunded loan commitments. The decrease in the provision for credit losses in 2021 compared to 2020 is primarily the result of increasesimprovement in interest rates as the Company's interest-earning assetseconomic assumptions used to estimate lifetime credit losses, which have repriced faster than interest-bearing liabilities.
The provision for loan losses decreased in 2018 to a benefit of $500,000 from provisions of $3.2 million in 2017 and $2.3 million in 2016.improved but are not yet at pre-pandemic levels. Our nonperforming loans, net of government guarantees, decreasedincreased to $14.7$10.7 million at the end of 20182021 compared to $21.4$10.0 million at the end of 2017 and increased from $12.9 million at the end of 2016,2020, while total adversely classified loans, net of government guarantees at December 31, 2018 decreased2021 increased to $27.2$13.7 million from $33.8$12.8 million at December 31, 2017 and $35.6 million at December 31, 2016.2020. The allowanceAllowance for loan losses (“Allowance”Credit Losses ("ACL") totaled 1.98%0.83% of total portfolio loans at December 31, 2018,2021, compared to 2.25%1.46% at December 31, 2017 and 2.02% at December 31, 2016.2020. The AllowanceACL compared to nonperforming loans, net of government guarantees, was 133%110% at December 31, 20182021 compared to 100%210% at the end of 2017 and 152%2020.
◦Interest expense decreased $2.3 million to $3.8 million in 2021 from $6.1 million in 2020 due to lower interest rates.
◦The changes above where partially offset by a $3.8 million increase in tax expense in the end of 2016.
Return on average assets was 1.34%Community Banking segment in 20182021 primarily due to higher taxable income in 2021 compared to 0.87%2020.
•Net income in 2017 and 0.96%the Home Mortgage Lending segment decreased 40%, or $7.0 million, to $10.3 million in 2016.2021 from $17.3 million in 2020 primarily due to a decrease in production volume to $1.118 billion in 2021 from $1.295 billion in 2020, as well as a $3.7 million decrease in the change in fair value of the interest rate lock commitments as the loan pipeline decreased at December 31, 2021 compared to December 31, 2020.
•The net interest margin decreased to 3.58% in 2021 from 4.02% in 2020 mostly due to a decrease in average yields on interest earning assets to 3.74% in 2021 compared to 4.36% in 2020 as a result of lower interest rates. Additionally, the mix of earning assets, specifically an increase in interest-bearing cash, also contributed to the decrease in the net interest margin in 2021 as compared to the prior year.
•The Company continued to maintain strong capital ratios with Tier 1 Capital to Risk Adjusted Assets of 15.47%14.08% at December 31, 20182021 as compared to 14.65%14.20% at December 31, 2017. 2020.
•The aggregate cash dividends paid by the Company in 20182021 rose 19%6% to $1.02 per diluted share$9.4 million from $0.86 per diluted share$8.8 million paid in 2017.2020.
•The Company repurchased 15,468279,276 shares of its common stock in 20182021 at an average price of $31.90$41.30 per share.
COVID-19 Issues:
•Industry Exposure: Northrim has identified various industries that may be adversely impacted by the COVID-19 pandemic and the volatility in oil prices that has occurred over the last year and a half, though oil prices have rebounded recently. Though the industries affected may change through the progression of the pandemic, the following sectors for which the Company has exposure, as a percent of the total loan portfolio as of December 31, 2021 are being impacted: Healthcare (8%), Tourism (7%), Oil and Gas (4%), Aviation (non-tourism) (4%), Accommodations (4%), Fishing (4%), Restaurants and Breweries (3%) and Retail (2%). The portion of the Company's Allowance that related to the loans with exposure to these industries is estimated at the following amounts as of December 31, 2021:
| | | | | | | | | | | | | | | | | | | | | | | | | | |
| (In Thousands) | Tourism | Aviation (non-tourism) | Healthcare | Retail | Restaurants and Breweries | Fishing | Accommodations | Total |
| Allowance | $896 | | $565 | | $1,257 | | $332 | | $486 | | $432 | | $507 | | $4,475 | |
•Customer Accommodations: The Company has implemented assistance to help customers experiencing financial challenges as a result of COVID-19 in addition to our participation in PPP lending. The provisions of the CARES Act included an election to not apply the guidance on accounting for certain troubled debt restructurings ("TDR") related to COVID-19 and allow certain accommodations to borrowers. These accommodations include interest only and deferral options on loan payments, as well as the waiver of various fees related to loans, deposits and other services. The Company has elected to adopt these provisions of the CARES Act. The outstanding principal balance of loan modifications due to the economic impacts of COVID-19 for the periods below were as follows:
| | | | | | | | | | | |
| Loan Modifications due to COVID-19 as of December 31, 2021 |
| (Dollars in thousands) | Interest Only | Full Payment Deferral | Total |
| Portfolio loans | $49,219 | | $31 | | $49,250 | |
| Number of modifications | 16 | | 1 | | 17 | |
| | | | | | | | | | | |
| Loan Modifications due to COVID-19 as of December 31, 2020 |
| (Dollars in thousands) | Interest Only | Full Payment Deferral | Total |
| Portfolio loans | $43,379 | | $22,165 | | $65,544 | |
| Number of modifications | 23 | | 11 | | 34 | |
All 17 loan modifications as of December 31, 2021, have entered into more than one modification.
•Branch Operations: All branches have returned to pre-pandemic levels, while a number of customer and employee safety measure continue to be implemented.
•Growth and Paycheck Protection Program:
•Over the last two years, Northrim funded a total of nearly 5,800 PPP loans totaling $612.6 million to both existing and new customers.
•Management estimates that Northrim funded approximately 24% of the number and 32% of the value of all Alaska PPP second round loans.
•As of December 31, 2021, Northrim customers had received forgiveness through the SBA on 4,451 PPP loans totaling $491.4 million.
•The Company initially utilized the Federal Reserve Bank's Paycheck Protection Program Liquidity Facility (the "PPPLF") to fund PPP loans, but paid those funds back in full during the second quarter of 2020 and has since funded the PPP loans through core deposits and maturity of long-term investments.
Trends in Miscellaneous Financial Data(1)
| | | | | | | | | | | | | | | | | | | | | | | |
| Years Ended December 31, | |
| (In thousands, except per share data and shares outstanding amounts) | |
| 2021 | 2020 | 2019 | 2018 | 2017 | 2016 | Five Year Compound Growth Rate |
| | (Unaudited) |
| Net interest income | $80,827 | | $70,665 | | $64,442 | | $61,208 | | $57,678 | | $56,357 | | 7 | % |
| Provision (benefit) for credit losses | (4,099) | | 2,432 | | (1,175) | | (500) | | 3,200 | | 2,298 | | NM |
| Other operating income | 52,263 | | 63,328 | | 37,346 | | 32,167 | | 40,474 | | 43,263 | | 4 | % |
| Compensation expense, RML acquisition payments | — | | — | | 468 | | — | | 130 | | 4,775 | | (100) | |
| Other operating expense | 89,196 | | 89,114 | | 76,370 | | 69,800 | | 71,023 | | 71,505 | | 5 | % |
| Income before provision for income taxes | $47,993 | | $42,447 | | $26,125 | | $24,075 | | $23,799 | | $21,042 | | 18 | % |
| Provision for income taxes | 10,476 | | 9,559 | | 5,434 | | 4,071 | | 10,321 | | 6,052 | | 12 | % |
| Net Income | 37,517 | | 32,888 | | 20,691 | | 20,004 | | 13,478 | | 14,990 | | 20 | % |
| Less: Net income attributable to | | | | | | | |
| noncontrolling interest | — | | — | | — | | — | | 327 | | 579 | | (100) | |
| Net income attributable to Northrim Bancorp, Inc. | $37,517 | | $32,888 | | $20,691 | | $20,004 | | $13,151 | | $14,411 | | 21 | % |
| | | | | | | |
| Year End Balance Sheet | | | | | | | |
| Assets | $2,724,719 | | $2,121,798 | | $1,643,996 | | $1,502,988 | | $1,518,596 | | $1,525,851 | | 12 | % |
| Loans | 1,413,886 | | 1,444,050 | | 1,043,371 | | 984,346 | | 954,953 | | 974,074 | | 8 | % |
| Deposits | 2,421,631 | | 1,824,981 | | 1,372,351 | | 1,228,088 | | 1,258,283 | | 1,267,653 | | 14 | % |
| Shareholders' equity | 237,817 | | 221,575 | | 207,117 | | 205,947 | | 192,802 | | 186,712 | | 5 | % |
| Common shares outstanding | 6,014,813 | | 6,251,004 | | 6,558,809 | | 6,883,216 | | 6,871,963 | | 6,897,890 | | (3) | % |
| | | | | | | |
| Average Balance Sheet | | | | | | | |
| Assets | $2,432,599 | | $1,936,047 | | $1,555,707 | | $1,493,385 | | $1,511,052 | | $1,506,522 | | 10 | % |
| Earning assets | 2,260,778 | | 1,758,839 | | 1,386,557 | | 1,346,449 | | 1,367,203 | | 1,361,913 | | 11 | % |
| Loans | 1,478,318 | | 1,339,908 | | 1,010,098 | | 971,548 | | 981,001 | | 976,613 | | 9 | % |
| Deposits | 2,125,080 | | 1,638,216 | | 1,276,407 | | 1,227,272 | | 1,248,333 | | 1,250,243 | | 11 | % |
| Shareholders' equity | 239,214 | | 211,721 | | 208,602 | | 201,022 | | 193,129 | | 181,628 | | 6 | % |
| Basic common shares outstanding | 6,180,801 | | 6,354,687 | | 6,708,622 | | 6,877,573 | | 6,889,621 | | 6,883,663 | | (2) | % |
| Diluted common shares outstanding | 6,249,313 | | 6,431,367 | | 6,808,209 | | 6,981,557 | | 6,977,910 | | 6,974,864 | | (2) | % |
| | | | | | | |
| Per Common Share Data | | | | | | | |
| Basic earnings | $6.07 | | $5.18 | | $3.08 | | $2.91 | | $1.91 | | $2.09 | | 24 | % |
| Diluted earnings | $6.00 | | $5.11 | | $3.04 | | $2.86 | | $1.88 | | $2.06 | | 24 | % |
| Book value per share | $39.54 | | $35.45 | | $31.58 | | $29.92 | | $28.06 | | $27.07 | | 8 | % |
Tangible book value per share(2) | $36.88 | | $32.88 | | $29.12 | | $27.57 | | $25.70 | | $24.70 | | 8 | % |
| Cash dividends per share | $1.50 | | $1.38 | | $1.26 | | $1.02 | | $0.86 | | $0.78 | | 14 | % |
| | | | | | | | | | | | | | | | | | | | | | | |
| Years Ended December 31, | |
| 2021 | 2020 | 2019 | 2018 | 2017 | 2016 | Five Year Compound Growth Rate |
| | (Unaudited) | |
| Performance Ratios | | | | | | | |
| Return on average assets | 1.54 | % | 1.70 | % | 1.33 | % | 1.34 | % | 0.87 | % | 0.96 | % | 10 | % |
| Return on average equity | 15.68 | % | 15.53 | % | 9.92 | % | 9.95 | % | 6.81 | % | 7.93 | % | 15 | % |
| Equity/assets | 8.73 | % | 10.44 | % | 12.60 | % | 13.70 | % | 12.70 | % | 12.24 | % | (7) | % |
Tangible common equity/tangible assets(3) | 8.19 | % | 9.76 | % | 11.73 | % | 12.76 | % | 11.75 | % | 11.29 | % | (6) | % |
| Net interest margin | 3.58 | % | 4.02 | % | 4.65 | % | 4.55 | % | 4.22 | % | 4.14 | % | (3) | % |
Net interest margin (tax equivalent)(4) | 3.60 | % | 4.05 | % | 4.70 | % | 4.60 | % | 4.28 | % | 4.20 | % | (3) | % |
| Non-interest income/total revenue | 39.27 | % | 47.26 | % | 36.69 | % | 34.45 | % | 41.24 | % | 43.43 | % | (2) | % |
Efficiency ratio (5) | 66.99 | % | 66.47 | % | 75.43 | % | 74.68 | % | 72.39 | % | 76.44 | % | (3) | % |
| Dividend payout ratio | 25.02 | % | 26.66 | % | 40.79 | % | 35.08 | % | 45.44 | % | 37.59 | % | (8) | % |
| | | | | | | |
| Asset Quality | | | | | | | |
| Nonperforming loans, net of government guarantees | $10,672 | | $10,048 | | $13,951 | | $14,694 | | $21,411 | | $12,936 | | (4) | % |
| Nonperforming assets, net of government guarantees | 15,031 | | 16,289 | | 19,946 | | 22,619 | | 28,729 | | 19,315 | | (5) | % |
| Nonperforming loans, net of government guarantees/portfolio loans | 0.75 | % | 0.70 | % | 1.34 | % | 1.49 | % | 2.24 | % | 1.33 | % | (11) | % |
| Net charge-offs (recoveries)/average loans | 0.07 | % | 0.03 | % | (0.07) | % | 0.15 | % | 0.15 | % | 0.08 | % | (3) | % |
| Allowance for credit losses/portfolio loans | 0.83 | % | 1.46 | % | 1.83 | % | 1.98 | % | 2.25 | % | 2.02 | % | (16) | % |
| Nonperforming assets, net of government guarantees/assets | 0.55 | % | 0.77 | % | 1.21 | % | 1.50 | % | 1.89 | % | 1.27 | % | (15) | % |
| | | | | | | |
| Other Data | | | | | | | |
Effective tax rate (6) | 22 | % | 23 | % | 21 | % | 17 | % | 43 | % | 29 | % | (5) | % |
Number of banking offices(7) | 18 | | 17 | | 16 | | 16 | | 14 | | 14 | | 5 | % |
Number of employees (FTE) (8) | 451 | | 438 | | 431 | | 430 | | 429 | | 451 | | — | % |
1 These unaudited schedules provide selected financial information concerning the Company that should be read in conjunction with Item 7 "Management's Discussion and Analysis of Financial Condition and Results of Operations" of this report.
2Tangible book value per share is a non-GAAP ratio defined as shareholders’ equity, less intangible assets, divided by common shares outstanding. Management believes that tangible book value is a useful measurement of the value of the Company’s equity because it excludes the effect of intangible assets on the Company’s equity. See reconciliation to book value per share, the most comparable GAAP measurement below.
3Tangible common equity to tangible assets is a non-GAAP ratio that represents total equity less goodwill and intangible assets divided by total assets less goodwill and intangible assets. Management believes this ratio is important as it has received more attention over the past several years from stock analysts and regulators. The most comparable GAAP measure of shareholders' equity to total assets is calculated by dividing total shareholders' equity by total assets. See reconciliation to shareholders' equity to total assets below.
4Tax-equivalent net interest margin is a non-GAAP performance measurement in which interest income on non-taxable investments and loans is presented on a tax-equivalent basis using a combined federal and state statutory rate of 28.43% in 2018 through 2021 and 41.11% in all other years presented. Management believes that tax-equivalent net interest margin is a useful financial measure because it enables investors to evaluate net interest margin excluding tax expense in order to monitor our effectiveness in growing higher interest yielding assets and
managing our costs of interest bearing liabilities over time on a fully tax equivalent basis. See reconciliation to net interest margin, the comparable GAAP measurement below.
5In managing our business, we review the efficiency ratio exclusive of intangible asset amortization, which is a non-GAAP performance measurement. Management believes that this is a useful financial measurement because we believe this presentation provides investors with a more accurate picture of our operating efficiency. The efficiency ratio is calculated by dividing other operating expense, exclusive of intangible asset amortization, by the sum of net interest income and other operating income. Other companies may define or calculate this data differently. For additional information see the "Other Operating Expense" section in Part II. Item 7 "Management's Discussion and Analysis of Financial Condition and Results of Operations" of this report. See reconciliation to comparable GAAP measurement below.
6The Company’s 2017 results included the impact of the enactment of the Tax Cuts and Jobs Act, which was signed into law on December 22, 2017. The law includes significant changes to the U.S. corporate tax system, including a Federal corporate rate reduction from 35% to 21%. In 2017, the Company applied the newly enacted corporate federal income tax rate of 21%, reducing the value of the Company's net deferred tax asset, resulting in approximately a $2.7 million increase in tax expense. In 2018, the Company finalized changes related to the reduction in the federal tax rate which resulted in a $470,000 reduction in tax expense.
7Number of banking offices does not include RML locations. 2021 number of banking offices includes 17 full service branches and 1 loan production office. 2020 number of banking offices includes 16 full service branches and 1 loan production office. 2018 number of banking offices includes 15 full service branches and 1 loan production office.
8FTE includes 321, 312, 311, 320, 314, and 321 Community Banking employees in 2021, 2020, 2019, 2018, 2017 and 2016, respectively. FTE includes 130, 126, 120, 110, 115, and 130 Home Mortgage Lending employees in 2021, 2020, 2019, 2018, 2017 and 2016, respectively.
Reconciliation of Selected Non-GAAP Financial Data to GAAP Financial Measures
These unaudited schedules provide selected financial information concerning the Company that should be read in conjunction with "Part II. Item 7. Management's Discussion and Analysis of Financial Condition and Results of Operations" of this report.
Reconciliationoftotal shareholders' equity to tangiblecommonshareholders’equity (Non-GAAP)and total assets totangible assets:
| | | | | | | | | | | | | | | | | | | | |
| (In Thousands) | 2021 | 2020 | 2019 | 2018 | 2017 | 2016 |
| Total shareholders' equity | $237,817 | | $221,575 | | $207,117 | | $205,947 | | $192,802 | | $186,712 | |
| Total assets | 2,724,719 | | 2,121,798 | | 1,643,996 | | 1,502,988 | | 1,518,596 | | 1,525,851 | |
| Total shareholders' equity to total assets ratio | 8.73 | % | 10.44 | % | 12.60 | % | 13.70 | % | 12.70 | % | 12.24 | % |
| | | | | | | | | | | | | | | | | | | | |
| (In Thousands) | 2021 | 2020 | 2019 | 2018 | 2017 | 2016 |
| Total shareholders' equity | $237,817 | | $221,575 | | $207,117 | | $205,947 | | $192,802 | | $186,712 | |
| Less: goodwill and other intangible assets, net | 16,009 | | 16,046 | | 16,094 | | 16,154 | | 16,224 | | 16,324 | |
| Tangible common shareholders' equity | $221,808 | | $205,529 | | $191,023 | | $189,793 | | $176,578 | | $170,388 | |
| Total assets | $2,724,719 | | $2,121,798 | | $1,643,996 | | $1,502,988 | | $1,518,596 | | $1,525,851 | |
| Less: goodwill and other intangible assets, net | 16,009 | | 16,046 | | 16,094 | | 16,154 | | 16,224 | | 16,324 | |
| Tangible assets | $2,708,710 | | $2,105,752 | | $1,627,902 | | $1,486,834 | | $1,502,372 | | $1,509,527 | |
| Tangible common equity to tangible assets ratio | 8.19 | % | 9.76 | % | 11.73 | % | 12.76 | % | 11.75 | % | 11.29 | % |
Reconciliation of tangible book value per share (Non-GAAP) to book value per share
| | | | | | | | | | | | | | | | | | | | |
| (In thousands, except per share data) | 2021 | 2020 | 2019 | 2018 | 2017 | 2016 |
| Total shareholders' equity | $237,817 | | $221,575 | | $207,117 | | $205,947 | | $192,802 | | $186,712 | |
| Divided by common shares outstanding | 6,014,813 | | 6,251,004 | | 6,558,809 | | 6,883,216 | | 6,871,963 | | 6,897,890 | |
| Book value per share | $39.54 | | $35.45 | | $31.58 | | $29.92 | | $28.06 | | $27.07 | |
| | | | | | | | | | | | | | | | | | | | |
| (In thousands, except per share data) | 2021 | 2020 | 2019 | 2018 | 2017 | 2016 |
| Total shareholders' equity | $237,817 | | $221,575 | | $207,117 | | $205,947 | | $192,802 | | $186,712 | |
| Less: goodwill and intangible assets, net | 16,009 | | 16,046 | | 16,094 | | 16,154 | | 16,224 | | 16,324 | |
| Tangible book value | $221,808 | | $205,529 | | $191,023 | | $189,793 | | $176,578 | | $170,388 | |
| Divided by common shares outstanding | 6,014,813 | | 6,251,004 | | 6,558,809 | | 6,883,216 | | 6,871,963 | | 6,897,890 | |
| Tangible book value per share | $36.88 | | $32.88 | | $29.12 | | $27.57 | | $25.70 | | $24.70 | |
Reconciliation of tax-equivalent net interest margin (Non-GAAP) to net interest margin
| | | | | | | | | | | | | | | | | | | | |
| (In Thousands) | 2021 | 2020 | 2019 | 2018 | 2017 | 2016 |
Net interest income(9) | $80,827 | | $70,665 | | $64,442 | | $61,208 | | $57,678 | | $56,357 | |
| Divided by average interest-bearing assets | 2,260,778 | | 1,758,839 | | 1,386,557 | | 1,346,449 | | 1,367,203 | | 1,361,913 | |
| Net interest margin | 3.58 | % | 4.02 | % | 4.65 | % | 4.55 | % | 4.22 | % | 4.14 | % |
| | | | | | | | | | | | | | | | | | | | |
| (In Thousands) | 2021 | 2020 | 2019 | 2018 | 2017 | 2016 |
Net interest income(9) | $80,827 | | $70,665 | | $64,442 | | $61,208 | | $57,678 | | $56,357 | |
| Plus: reduction in tax expense related to | | | | | | |
| tax-exempt interest income | 489 | | 613 | | 722 | | 726 | | 872 | | 808 | |
| | $81,316 | | $71,278 | | $65,164 | | $61,934 | | $58,550 | | $57,165 | |
| Divided by average interest-bearing assets | 2,260,778 | | 1,758,839 | | 1,386,557 | | 1,346,449 | | 1,367,203 | | 1,361,913 | |
| Tax-equivalent net interest margin | 3.60 | % | 4.05 | % | 4.70 | % | 4.60 | % | 4.28 | % | 4.20 | % |
Calculation of efficiency ratio
| | | | | | | | | | | | | | | | | | | | |
| (In Thousands) | 2021 | 2020 | 2019 | 2018 | 2017 | 2016 |
Net interest income(9) | $80,827 | | $70,665 | | $64,442 | | $61,208 | | $57,678 | | $56,357 | |
| Other operating income | 52,263 | | 63,328 | | 37,346 | | 32,167 | | 40,474 | | 43,263 | |
| Total revenue | 133,090 | | 133,993 | | 101,788 | | 93,375 | | 98,152 | | 99,620 | |
| Other operating expense | 89,196 | | 89,114 | | 76,838 | | 69,800 | | 71,153 | | 76,280 | |
| Less intangible asset amortization | 37 | | 48 | | 60 | | 70 | | 100 | | 135 | |
| Adjusted other operating expense | $89,159 | | $89,066 | | $76,778 | | $69,730 | | $71,053 | | $76,145 | |
| Efficiency ratio | 66.99 | % | 66.47 | % | 75.43 | % | 74.68 | % | 72.39 | % | 76.44 | % |
9Amount represents net interest income before provision for loan losses.
Non-GAAP financial measures have inherent limitations, are not required to be uniformly applied, and are not audited. Although we believe these non-GAAP financial measures are frequently used by stakeholders in the evaluation of the Company, they have limitations as analytical tools and should not be considered in isolation or as a substitute for analysis of results as reported under GAAP.
RESULTS OF OPERATIONS
Income Statement
Net Income
Our results of operations are dependent to a large degree on our net interest income. We also generate other income primarily through mortgage banking income, purchased receivables products, service charges and fees, and bankcard fees. Our operating expenses consist in large part of salaries and other personnel costs, data processing, occupancy, marketing, and professional services expenses. Interest income and cost of funds, or interest expense, and mortgage banking income are affected significantly by general economic conditions, particularly changes in market interest rates, by government policies and the actions of regulatory authorities, and by competition in our markets.
We earned net income of $37.5 million in 2021, compared to net income of $32.9 million in 2020. During these periods, net income per diluted share was $6.00 and $5.11, respectively. The following sections present discussion of the components that make up net income.
Net Interest Income / Net Interest Margin
Net interest income is the difference between interest income from loan and investment securities portfolios and interest expense on customer deposits and borrowings. Changes in net interest income result from changes in volume and spread, which in turn affect our margin. For this purpose, volume refers to the average dollar level of interest-earning assets and interest-bearing liabilities, spread refers to the difference between the average yield on interest-earning assets and the average cost of interest-bearing liabilities, and margin refers to net interest income divided by average interest-earning assets. Changes in net interest income are influenced by yields and the level and relative mix of interest-earning assets and interest-bearing liabilities.
Net interest income in 2021 was $80.8 million, compared to $70.7 million in 2020. The increase in 2021 as compared to 2020 was primarily the result of a $7.3 million increase in interest and fee income on PPP loans in 2021 compared to 2020. Interest income on PPP loans was $2.9 million and $2.5 million in 2021 and 2020, respectively. Loan fee income on PPP loans was $12.5 million and $5.6 million in 2021 and 2020, respectively. Loan fee income on PPP loans is largely made up of fees fully recognized upon loan forgiveness from the SBA. Interest income not related to PPP loans also increased $934,000 in 2021 as compared to 2020 due to higher net average interest-earning asset balances that was only partially offset by a decrease in interest rates. Interest expense decreased $2.1 million as a result of lower interest rates. During 2021 and 2020, net interest margins were 3.58% and 4.02%, respectively. The decrease in net interest margin in 2021 as compared to 2020 is the result of decreases in the spread between the average yield on interest-earning assets and the average cost of interest-bearing liabilities which was impacted by a decrease in interest rates, as well as a change in the mix of interest earning-assets. Average loans, the Company's highest yielding interest-earning asset, decreased to 65% of total average interest-earning assets in 2021 from 76% in the 2020. Short-term investments, the Company's lowest yielding interest-earning asset, increased to 14% of total average interest-earning assets in 2021 from 4% in the 2020.
The following table sets forth for the periods indicated information with regard to average balances of assets and liabilities, as well as the total dollar amounts of interest income from interest-earning assets and interest expense on interest-bearing liabilities. Average yields or costs, net interest income, and net interest margin are also presented. Average yields or costs are not calculated on a tax-equivalent basis:
| | | | | | | | | | | | | | | | | | | | | | | | | | | | | | | | | | | |
| Years ended December 31, | 2021 | | 2020 | | 2019 |
| | Average outstanding balance | Interest income / expense | Average Yield / Cost | | Average outstanding balance | Interest income / expense | Average Yield / Cost | | Average outstanding balance | Interest income / expense | Average Yield / Cost |
| |
| (In Thousands) |
Loans (1),(2) | $1,478,318 | | $76,392 | | 5.17 | % | | $1,339,908 | | $67,876 | | 5.07 | % | | $1,010,098 | | $59,919 | | 5.93 | % |
| Loans held for sale | 101,752 | | 2,849 | | 2.80 | % | | 105,287 | | 3,215 | | 3.05 | % | | 56,344 | | 2,231 | | 3.96 | % |
Taxable long-term investments(3) | 368,319 | | 4,900 | | 1.33 | % | | 245,148 | | 5,234 | | 2.14 | % | | 269,228 | | 6,891 | | 2.56 | % |
Non-taxable long-term investments(3) | 853 | | 18 | | 2.11 | % | | 2,236 | | 82 | | 3.67 | % | | 4,483 | | 120 | | 2.68 | % |
Interest-bearing deposits in other banks(4) | 311,536 | | 447 | | 0.14 | % | | 66,260 | | 309 | | 0.47 | % | | 46,404 | | 922 | | 1.99 | % |
Total interest-earning assets(5) | 2,260,778 | | 84,606 | | 3.74 | % | | 1,758,839 | | 76,716 | | 4.36 | % | | 1,386,557 | | 70,083 | | 5.05 | % |
| Noninterest-earning assets | 171,821 | | | | | 177,208 | | | | | 169,150 | | | |
| Total | $2,432,599 | | | | | $1,936,047 | | | | | $1,555,707 | | | |
| | | | | | | | | | | |
| Interest-bearing demand | $575,298 | | $484 | | 0.08 | % | | $387,417 | | $622 | | 0.16 | % | | $272,894 | | $475 | | 0.17 | % |
| Savings deposits | 323,131 | | 499 | | 0.15 | % | | 257,292 | | 717 | | 0.28 | % | | 233,057 | | 1,082 | | 0.46 | % |
| Money market deposits | 264,344 | | 418 | | 0.16 | % | | 219,024 | | 708 | | 0.32 | % | | 209,246 | | 1,142 | | 0.55 | % |
| Time deposits | 178,215 | | 1,676 | | 0.94 | % | | 176,873 | | 3,232 | | 1.83 | % | | 135,005 | | 2,262 | | 1.68 | % |
| Total interest-bearing deposits | 1,340,988 | | 3,077 | | 0.23 | % | | 1,040,606 | | 5,279 | | 0.51 | % | | 850,202 | | 4,961 | | 0.58 | % |
| Borrowings | 24,993 | | 702 | | 2.81 | % | | 35,918 | | 772 | | 1.37 | % | | 33,730 | | 680 | | 2.02 | % |
| Total interest-bearing liabilities | 1,365,981 | | 3,779 | | 0.28 | % | | 1,076,524 | | 6,051 | | 0.56 | % | | 883,932 | | 5,641 | | 0.64 | % |
| Noninterest-bearing demand deposits | 784,092 | | | | | 597,610 | | | | | 426,205 | | | |
| Other liabilities | 43,312 | | | | | 50,192 | | | | | 36,968 | | | |
| Equity | 239,214 | | | | | 211,721 | | | | | 208,602 | | | |
| Total | $2,432,599 | | | | | $1,936,047 | | | | | $1,555,707 | | | |
| Net interest income | | $80,827 | | | | | $70,665 | | | | | $64,442 | | |
| Net interest margin | | | 3.58 | % | | | | 4.02 | % | | | | 4.65 | % |
| Average portfolio loans to average-earnings assets | 65.39 | % | | | | 76.18 | % | | | | 72.85 | % | | |
| Average portfolio loans to average total deposits | 69.57 | % | | | | 81.79 | % | | | | 79.14 | % | | |
| Average non-interest deposits to average total deposits | 36.90 | % | | | | 36.48 | % | | | | 33.39 | % | | |
| Average interest-earning assets to average interest-bearing liabilities | 165.51 | % | | | | 163.38 | % | | | | 156.86 | % | | |
1Interest income includes loan fees. Loan fees recognized during the period and included in the yield calculation totaled $16.2 million, $8.9 million and $3.3 million for 2021, 2020 and 2019, respectively.
2Nonaccrual loans are included with a zero effective yield. Average nonaccrual loans included in the computation of the average loans were $12.3 million, $13.8 million, and $16.9 million in 2021, 2020 and 2019, respectively.
3Consists of investment securities available for sale, investment securities held to maturity, marketable equity securities, and investment in Federal Home Loan Bank stock. Taxable long-term investments consist of U.S. treasury and government sponsored entities, corporate bonds, collateral loan obligations, marketable equity securities, and Federal Home Loan Bank stock. Non-taxable long-term investments consist of municipal securities.
4Consists of interest bearing deposits in other banks and domestic CDs.
5The Company does not have any fed funds sold or securities purchased with agreements to resell to disclose as part of its total interest-earning assets in the periods presented.
The following table sets forth the changes in consolidated net interest income attributable to changes in volume and to changes in interest rates. Changes attributable to the combined effect of volume and interest rate have been allocated proportionately to the changes due to volume and the changes due to interest rate:
| | | | | | | | | | | | | | | | | | | | |
| | 2021 compared to 2020 | 2020 compared to 2019 |
| | Increase (decrease) due to | Increase (decrease) due to |
| (In Thousands) | Volume | Rate | Total | Volume | Rate | Total |
| Interest Income: | | | | | | |
| Loans | $7,186 | | $1,330 | | $8,516 | | $17,590 | | ($9,633) | | $7,957 | |
| Loans held for sale | (105) | | (261) | | (366) | | 1,336 | | (352) | | 984 | |
| Taxable long-term investments | 2,064 | | (2,398) | | (334) | | (580) | | (1,077) | | (1,657) | |
| Non-taxable long-term investments | (38) | | (26) | | (64) | | (143) | | 105 | | (38) | |
| Interest-bearing deposits in other banks | 170 | | (32) | | 138 | | 779 | | (1,392) | | (613) | |
| Total interest income | $9,277 | | ($1,387) | | $7,890 | | $18,982 | | ($12,349) | | $6,633 | |
| Interest Expense: | | | | | | |
| Interest-bearing demand | $229 | | ($367) | | ($138) | | $186 | | ($39) | | $147 | |
| Savings deposits | 154 | | (372) | | (218) | | 104 | | (469) | | (365) | |
| Money market deposits | 125 | | (415) | | (290) | | 51 | | (485) | | (434) | |
| Time deposits | 25 | | (1,581) | | (1,556) | | 751 | | 219 | | 970 | |
| Interest-bearing deposits | 1,236 | | (3,438) | | (2,202) | | 763 | | (445) | | 318 | |
| Borrowings | 29 | | (99) | | (70) | | 9 | | 83 | | 92 | |
| Total interest expense | $1,265 | | ($3,537) | | ($2,272) | | $772 | | ($362) | | $410 | |
Provision for Credit Losses
The Company adopted ASU 2016-13 effective January 1, 2021. The provision for credit loss expense is the amount of expense that, based on our judgment, is required to maintain the ACL at an appropriate level under CECL. The determination of the amount of the ACL is complex and involves a high degree of judgment and subjectivity. Refer to Note 1 of the notes to Consolidated Financial Statements included in Part II. Item 8 of this report for detailed discussion regarding ACL methodologies for loans, available for sale debt securities, held to maturity securities, loans held for investment, unfunded commitments, and purchased receivables.
The following table presents the major categories of credit loss expense:
| | | | | | | | |
| (In Thousands) | 2021 | 2020 |
| Credit loss expense on loans held for investment | ($3,779) | | $2,432 | |
| Credit loss expense on unfunded commitments | (320) | | — | |
| Credit loss expense on available for sale debt securities | — | | — | |
| Credit loss expense on held to maturity securities | — | | — | |
| Credit loss expense on purchased receivables | — | | — | |
| Total credit loss expense | ($4,099) | | $2,432 | |
As noted above, the provision for credit losses was recorded in accordance with CECL in 2021. The provision for credit losses in 2020, prior to adoption of CECL, was recorded under the incurred loss model. Despite the fact that a different methodology was used in the calculation of the provision for credit losses in 2021 versus 2020, in general the decrease in the provision for credit losses on loans in 2021 as compared to 2020 is primarily the result of improvement in economic assumptions used to estimate credit losses. The ongoing impacts of the CECL methodology will be dependent upon changes in economic conditions and forecasts, as well as loan portfolio composition, quality, and duration.
See the “Loans and Lending Activity” section under “Financial Condition” and Note 5 of the Notes to Consolidated Financial Statements included in Part II. Item 8 of this report for further discussion of these decreases and changes in the Company’s ACL.
Other Operating Income
The following table details the major components of other operating income for the years ended December 31:
| | | | | | | | | | | | | | | | | | | | | | | |
| (In Thousands) | 2021 | $ Change | % Change | 2020 | $ Change | % Change | 2019 |
| Other Operating Income | | | | | | | |
| Mortgage banking income | $42,144 | | ($10,491) | | (20) | % | $52,635 | | $28,434 | | 117 | % | $24,201 | |
| Bankcard fees | 3,389 | | 552 | | 19 | % | 2,837 | | (139) | | (5) | % | 2,976 | |
| Purchased receivable income | 2,259 | | (391) | | (15) | % | 2,650 | | (621) | | (19) | % | 3,271 | |
| Service charges on deposit accounts | 1,297 | | 195 | | 18 | % | 1,102 | | (455) | | (29) | % | 1,557 | |
| Merchant fees | 561 | | 146 | | 35 | % | 415 | | (52) | | (11) | % | 467 | |
| Interest rate swap income | 452 | | (497) | | (52) | % | 949 | | (15) | | (2) | % | 964 | |
| Commercial servicing revenue | 306 | | (221) | | (42) | % | 527 | | (97) | | (16) | % | 624 | |
| Rental income | 188 | | (90) | | (32) | % | 278 | | (219) | | (44) | % | 497 | |
| Gain (loss) on sale of securities | 67 | | (31) | | (32) | % | 98 | | 75 | | 100 | % | 23 | |
| Gain (loss) on marketable equity securities | (101) | | (162) | | (266) | % | 61 | | (850) | | 93 | % | 911 | |
| | | | | | | |
| | | | | | | |
| | | | | | | |
| | | | | | | |
| Other income | 1,701 | | (75) | | (4) | % | 1,776 | | (79) | | (4) | % | 1,855 | |
| Total other operating income | $52,263 | | ($11,065) | | (17) | % | $63,328 | | $25,982 | | 70 | % | $37,346 | |
2021 Compared to 2020
The most significant change in other operating income in 2021 was a decrease in mortgage banking income, followed by an increase in bankcard fees and decreases in interest rate swap income and purchased receivable income.
Mortgage banking income consists of gross income from the origination and sale of mortgages as well as mortgage loan servicing fees and is the largest component of other operating income at 81% of total other operating income in 2021 and 83% in 2020. Mortgage banking income decreased in 2021 compared to 2020 mainly due to a decrease in mortgage loans originated and sold as this volume decreased to $1.1 billion in 2021 from $1.3 billion in 2020. The overall decrease in mortgage originations in 2021 as compared to the prior year is primarily the result of the changes in interest rates during the year that led to decreased refinance activity. Additionally, there was a $3.7 million decrease in the fair value of the interest rate lock commitments, which is also included in mortgage banking income, due to a decrease in the loan origination pipeline at December 31, 2021 compared to December 31, 2020.
Interest rate swap income decreased in 2021 as compared to 2020 due to a decrease in the origination of new swap contracts with commercial loan customers. The Company executed new customer swap contracts with a notional value of $15.7 million in 2021 as compared to new customer swap contracts with a notional value of $49.3 million in 2020.
Purchased receivable income decreased in 2021 as compared to 2020 due to customers reportedly using PPP funds instead of selling receivables to fund their operating cash needs.
Bankcard fees and service charges on deposit accounts increased in 2021 due to the cessation of COVID-19 quarantine restrictions, which led to higher transaction volume as compared to 2020, as well as the increase in customers.
Other Operating Expense
The following table details the major components of other operating expense for the years ended December 31:
| | | | | | | | | | | | | | | | | | | | | | | |
| (In Thousands) | 2021 | $ Change | % Change | 2020 | $ Change | % Change | 2019 |
| Other Operating Expense | | | | | | | |
| Salaries and other personnel expense | $60,412 | | ($725) | | (1) | % | $61,137 | | $9,820 | | 19 | % | $51,317 | |
| Data processing expense | 8,567 | | 899 | | 12 | % | 7,668 | | 540 | | 8 | % | 7,128 | |
| Occupancy expense | 7,078 | | 454 | | 7 | % | 6,624 | | 17 | | — | % | 6,607 | |
| Professional and outside services | 2,801 | | (356) | | (11) | % | 3,157 | | 626 | | 25 | % | 2,531 | |
| Marketing expense | 2,741 | | 421 | | 18 | % | 2,320 | | (53) | | (2) | % | 2,373 | |
| Insurance expense | 1,593 | | 365 | | 30 | % | 1,228 | | 671 | | 120 | % | 557 | |
| Compensation expense - RML acquisition payments | — | | — | | NM | — | | (468) | | (100) | % | 468 | |
| Intangible asset amortization | 37 | | (11) | | (23) | % | 48 | | (12) | | (20) | % | 60 | |
| | | | | | | |
| | | | | | | |
| OREO (income) expense, net rental income and gains on sale: | |
| OREO operating expense | 777 | | 119 | | 18 | % | 658 | | (35) | | (5) | % | 693 | |
| | | | | | | |
| Rental income on OREO | (524) | | (15) | | (3) | % | (509) | | (3) | | (1) | % | (506) | |
| Gains on sale of OREO | (685) | | (294) | | (75) | % | (391) | | (11) | | NM | (380) | |
| Subtotal | (432) | | (190) | | (79) | % | (242) | | (49) | | 25 | % | (193) | |
| Other expenses | 6,399 | | (775) | | (11) | % | 7,174 | | 1,184 | | 20 | % | 5,990 | |
| Total other operating expense | $89,196 | | $82 | | — | % | $89,114 | | $12,276 | | 16 | % | $76,838 | |
2021 Compared to 2020
Other operating expense increased by less than 1% in 2021 as compared to 2020. The largest increases where in data processing expense, occupancy expense, insurance expense, and marketing expense. These increases were only mostly offset by decreases in salary and other personnel expense, professional and outside services, and OREO expense. Data processing expense increased in 2021 compared to 2020 mostly due to increased customer and transaction volume. Occupancy expense, insurance expense, and marketing expense increased in 2021 as compared to 2020 due to miscellaneous repairs and maintenance and tenant improvements at several of the Company's locations, increased FDIC insurance costs associated with asset growth, and increased marketing expense due to higher giving in the form of increased sponsorship and charitable contributions. Decreases in salaries and other personnel expense and professional and outside services in 2021 as compared to 2020 are primarily related to mortgage banking operations, which fluctuate with production volumes. OREO expense decreased in 2021 primarily due to increased gains on sale of OREO properties as compared to 2020.
Income Taxes
The provision for income taxes increased $917,000 or 10%, to $10.5 million in 2021 as compared to 2020. The increase in 2021 is primarily due to higher pretax income. The Company's effective tax rates were relatively consistent at 21.8% and 22.5% in 2021 and 2020, respectively.
FINANCIAL CONDITION
Investment Securities
The composition of our investment securities portfolio, which includes securities available for sale and marketable equity securities, reflects management’s investment strategy of maintaining an appropriate level of liquidity while providing a relatively stable source of interest income. The investment securities portfolio also mitigates interest rate and credit risk inherent in the loan portfolio, while providing a vehicle for the investment of available funds, a source of liquidity (by pledging as collateral or through repurchase agreements), and collateral for certain public funds deposits. Investment securities designated as available for sale comprised 94% of the portfolio as of December 31, 2021 and are available to meet liquidity requirements.
Our investment portfolio consists primarily of government sponsored entity securities, corporate securities, collateralized loan obligations, and municipal securities. Investment securities at December 31, 2021 increased $188.4 million, or 71%, to $455.1 million from $266.7 million at December 31, 2020. The increase at December 31, 2021 as compared to December 31, 2020 came from an increase in deposits that were not lent out were invested. The average maturity of the investment portfolio was approximately four years at December 31, 2021.
Investment securities may be pledged as collateral to secure public deposits or borrowings. At December 31, 2021 and 2020, $59.5 million and $77.9 million in securities were pledged for deposits and borrowings, respectively. Pledged securities decreased at December 31, 2021 as compared to December 31, 2020 primarily due to decreased pledges to the FHLB to support the Company's immediate borrowing capacity at December 31, 2021.
The following tables set forth the composition of our investment portfolio at December 31 for the years indicated:
| | | | | | | | | | | |
| (In Thousands) | Amortized Cost | | Fair Value |
| Securities Available for Sale: | | | |
| 2021: | | | |
| U.S. Treasury and government sponsored entities | $345,514 | | | $341,480 | |
| Municipal Securities | 820 | | | 840 | |
| | | |
| Corporate Bonds | 32,721 | | | 32,946 | |
| Collateralized Loan Obligations | 51,431 | | | 51,418 | |
| | | |
| Total | $430,486 | | | $426,684 | |
| 2020: | | | |
| U.S. Treasury and government sponsored entities | $173,318 | | | $174,601 | |
| Municipal Securities | 820 | | | 856 | |
| | | |
| Corporate Bonds | 29,951 | | | 30,492 | |
| Collateralized Loan Obligations | 41,782 | | | 41,684 | |
| | | |
| Total | $245,871 | | | $247,633 | |
| 2019: | | | |
| U.S. Treasury and government sponsored entities | $210,756 | | | $211,852 | |
| Municipal Securities | 3,288 | | | 3,297 | |
| Corporate Bonds | 34,764 | | | 35,066 | |
| Collateralized Loan Obligations | 25,980 | | | 25,923 | |
| | | |
| Total | $274,788 | | | $276,138 | |
| Marketable Equity Securities: | | | |
| 2021: | | | |
| Preferred Stock | $7,865 | | | $8,420 | |
| Total | $7,865 | | | $8,420 | |
| 2020: | | | |
| Preferred Stock | $8,395 | | | $9,052 | |
| Total | $8,395 | | | $9,052 | |
| 2019: | | | |
| Preferred Stock | $7,349 | | | $7,945 | |
| Total | $7,349 | | | $7,945 | |
| Securities Held to Maturity: | | | |
| 2021: | | | |
| Corporate Bonds | $20,000 | | | $19,164 | |
| Total | $20,000 | | | $19,164 | |
| 2020: | | | |
| Corporate Bonds | $10,000 | | | $10,000 | |
| Total | $10,000 | | | $10,000 | |
| 2019: | | | |
| Corporate Bonds | $— | | | $— | |
| Total | $— | | | $— | |
The following table sets forth the market value, maturities, and weighted average pretax yields of our investment portfolio as of December 31, 2021:
| | | | | | | | | | | | | | | | | |
| | Maturity |
| | Within | | | Over | |
| (In Thousands) | 1 Year | 1-5 Years | 5-10 Years | 10 Years | Total |
| Securities Available for Sale: | | | | | |
| U.S. Treasury and government sponsored entities | | | | | |
| Balance | $5,041 | | $336,439 | | $— | | $— | | $341,480 | |
Weighted average yield(1) | 2.80 | % | 0.79 | % | — | % | — | % | 0.82 | % |
| Municipal securities | | | | | |
| Balance | $— | | $840 | | $— | | $— | | $840 | |
Weighted average yield(1) | — | % | 2.14 | % | — | % | — | % | 2.14 | % |
| | | | | |
| | | | | |
| | | | | |
| Corporate bonds | | | | | |
| Balance | $— | | $27,993 | | $4,953 | | $— | | $32,946 | |
Weighted average yield(1) | — | % | 1.29 | % | 1.50 | % | — | % | 1.33 | % |
| Collateralized loan obligations | | | | | |
| Balance | $— | | $5,000 | | $46,418 | | $— | | $51,418 | |
Weighted average yield(1) | — | % | 1.65 | % | 1.39 | % | — | % | 1.42 | % |
| | | | | |
| | | | | |
| | | | | |
| Total | | | | | |
| Balance | $5,041 | | $370,272 | | $51,371 | | $— | | $426,684 | |
Weighted average yield(1) | 2.80 | % | 0.84 | % | 1.40 | % | — | % | 0.93 | % |
| Securities Held to Maturity | | | | | |
| Corporate bonds | | | | | |
| Balance | $— | | $9,919 | | $9,245 | | $— | | $19,164 | |
Weighted average yield(1) | — | % | 5.50 | % | 5.00 | % | — | % | 5.25 | % |
| Marketable Equity Securities | | | | | |
| Preferred Stock | | | | | |
| Balance | $— | | $— | | $— | | $8,420 | | $8,420 | |
Weighted average yield(1) | — | % | — | % | — | % | 5.57 | % | 5.57 | % |
(1) Weighted average yields have been calculated on an amortized cost basis and not on a tax-equivalent basis.
The Company’s investment in marketable equity securities does not have a maturity date but it has been included in the over 10 years column above.
Loans and Lending Activities
All of our loans and credit lines are subject to approval procedures and amount limitations. These limitations apply to the borrower’s total outstanding indebtedness and commitments to us, including the indebtedness of any guarantor. Generally, we are permitted to make loans to one borrower of up to 15% of the unimpaired capital and surplus of the Bank. The legal lending limit for the Bank was $30.2 million at December 31, 2021. At December 31, 2021, the Company had two relationships whose total direct and indirect commitments exceeded $30.2 million; however, no individual direct relationship exceeded the loans-to-one borrower limitation.
The Company's loans have grown significantly in recent history, in part due to PPP loans, but over the last 3 years, non-PPP loans have also increased significantly. Management attributes higher growth in loans, excluding PPP loans, in 2021 and 2020 to our ability to attract new customers through our outreach to the community. The Company's "Land and Expand" program was designed to increase both loans and deposits as we attract a broader customer base and convert new PPP customers into full banking relationships.
The following table presents growth information for loans and loans excluding PPP loans:
| | | | | | | | | | | | | | | | | | | | | | | |
| Years Ended December 31, | |
| (In Thousands) | 2021 | 2020 | 2019 | 2018 | 2017 | 2016 | Five Year Compound Growth Rate |
| | | | | | | |
| Loans | $1,413,886 | $1,444,050 | $1,043,371 | $984,346 | $954,953 | $974,074 | | 8 | % |
| Less: PPP loans | 118,229 | 304,587 | — | — | — | — | | NM |
| Loans, excluding PPP loans | $1,295,657 | $1,139,463 | $1,043,371 | $984,346 | $954,953 | $974,074 | | 6 | % |
| Percent change, Loans excluding PPP loans | 14 | % | 9 | % | 6 | % | 3 | % | (2) | % | | |
The following table sets forth the composition of our loan portfolio by loan segment as of the dates indicated:
| | | | | | | | | | | | | | |
| December 31, 2021 | December 31, 2020 |
| Dollar Amount | Percent of Total | Dollar Amount | Percent of Total |
| (In Thousands) |
| Commercial & industrial loans | $448,338 | | 31.7 | % | $612,254 | | 42.2 | % |
| Commercial real estate: | | | | |
| Owner occupied properties | 300,200 | | 21.2 | % | 233,320 | | 16.2 | % |
| Non-owner occupied and multifamily properties | 435,311 | | 30.8 | % | 392,452 | | 27.2 | % |
| Residential real estate: | | | | |
| 1-4 family residential properties secured by first liens | 32,542 | | 2.3 | % | 33,415 | | 2.3 | % |
| 1-4 family residential properties secured by junior liens and revolving secured by 1-4 family first liens | 19,610 | | 1.4 | % | 18,236 | | 1.3 | % |
| 1-4 family residential construction loans | 36,222 | | 2.6 | % | 32,500 | | 2.3 | % |
| Other construction, land development and raw land loans | 88,094 | | 6.2 | % | 83,463 | | 5.8 | % |
| Obligations of states and political subdivisions in the US | 16,403 | | 1.2 | % | 15,318 | | 1.1 | % |
| Agricultural production, including commercial fishing | 27,959 | | 2.0 | % | 12,968 | | 0.9 | % |
| Consumer loans | 4,801 | | 0.3 | % | 5,734 | | 0.4 | % |
| Other loans | 4,406 | | 0.3 | % | 4,390 | | 0.3 | % |
| Total portfolio loans | $1,413,886 | | | $1,444,050 | | |
The following table presents the maturity distribution of our loan portfolio and the rate sensitivity of these loans to changes in interest rates as of December 31, 2021:
| | | | | | | | | | | | | | | | | | | | | | | | | | |
| | By Maturity | | | Loans Over One Year By Rate Sensitivity |
| (In Thousands) | Within 1 Year | 1-5 Years | 5-15 Years | Over 15 Years | Total | | Fixed Interest Rate | Floating Interest Rate |
| Commercial & industrial loans | $92,622 | | $242,076 | | $113,054 | | $— | | $447,752 | | | $219,834 | | $135,296 | |
| Commercial real estate | 43,627 | | 125,032 | | 491,692 | | 79,952 | | 740,303 | | | 180,555 | | 516,121 | |
| Residential real estate | 41,142 | | 5,228 | | 18,803 | | 21,103 | | 86,276 | | | 19,862 | | 25,272 | |
| Other construction | 44,549 | | 19,692 | | 17,534 | | 2,076 | | 83,851 | | | 13,980 | | 25,322 | |
| Consumer and other | 7,631 | | 9,320 | | 38,743 | | 10 | | 55,704 | | | 12,726 | | 35,347 | |
| Total | $229,571 | | $401,348 | | $679,826 | | $103,141 | | $1,413,886 | | | $446,957 | | $737,358 | |
Loans Directly Exposed to the Oil and Gas Industry: The Company defines "direct exposure" to the oil and gas industry as companies that it has identified as significantly reliant upon activity related to the oil and gas industry, such as oil producers or drilling and exploration companies, and companies who provide oilfield services, lodging, equipment rental, transportation, and other logistic services specific to the industry. The Company estimates that $63.6 million, or approximately 4% of loans as of December 31, 2021 have direct exposure to the oil and gas industry as compared to $65.1 million, or approximately 4% of loans as of December 31, 2020. The Company's exposure as a percent of the total loan portfolio excluding PPP loans as of December 31, 2021 was 5%. The Company has no loans to oil producers or drilling and exploration companies as of the end of 2021 or 2020, but the $63.6 million outstanding as of December 31, 2021 noted above does include $1.8 million related to the construction of an oil drilling rig. The Company's unfunded commitments to borrowers that have direct exposure to the oil and gas industry were $66.4 million and $63.5 million at December 31, 2021 and 2020, respectively. The portion of the Company's allowance for loan losses that related to the loans with direct exposure to the oil and gas industry was estimated at $684,000 and $1.2 million as of December 31, 2021 and 2020, respectively.
The following table details loan balances by loan segment and class of financing receivable for loans with direct oil and gas exposure as of the dates indicated:
| | | | | | | | | | | |
| (In Thousands) | December 31, 2021 | | December 31, 2020 |
| | | |
| Commercial & industrial loans | $45,338 | | | $41,016 | |
| Commercial real estate: | | | |
| Owner occupied properties | 10,244 | | | 11,296 | |
| Non-owner occupied and multifamily properties | 6,564 | | | 6,606 | |
| | | |
| | | |
| | | |
| | | |
| | | |
| | | |
| | | |
| Consumer loans | — | | | 2,256 | |
| Other loans | 1,495 | | | 3,948 | |
| Total loans | $63,641 | | | $65,122 | |
Credit Quality and Nonperforming Assets
The following table sets forth information regarding our nonperforming loans and total nonperforming assets:
| | | | | | | | |
| December 31, | December 31, |
| (In Thousands) | 2021 | 2020 |
| Nonaccrual loans | $11,650 | | $11,120 | |
| Loans 90 days past due and accruing | — | | 449 | |
| Total nonperforming loans | 11,650 | | 11,569 | |
| Nonperforming loans guaranteed by government | (978) | | (1,521) | |
| Net nonperforming loans | 10,672 | | 10,048 | |
| Other real estate owned | 5,638 | | 7,289 | |
| Repossessed assets | — | | 231 | |
| | |
| Other real estate owned guaranteed by government | (1,279) | | (1,279) | |
| Net nonperforming assets | $15,031 | | $16,289 | |
| Nonperforming loans, net of government guarantees / portfolio loans | 0.75 | % | 0.70 | % |
| Nonperforming loans, net of government guarantees / portfolio loans, net of government guarantees | 0.88 | % | 0.92 | % |
| Nonperforming assets, net of government guarantees / total assets | 0.55 | % | 0.77 | % |
| Nonperforming assets, net of government guarantees / total assets net of government guarantees | 0.60 | % | 0.92 | % |
| | |
| Performing restructured loans | $3,291 | | $2,355 | |
| Performing restructured loans guaranteed by government | (2,518) | | (1,523) | |
| Net performing restructured loans | $773 | | $832 | |
| | |
| Nonperforming loans plus performing restructured loans, net of government guarantees | $11,445 | | $10,880 | |
| Nonperforming loans plus performing restructured loans, net of government | | |
| guarantees / portfolio loans | 0.81 | % | 0.75 | % |
| Nonperforming loans plus performing restructured loans, net of government | | |
| guarantees / portfolio loans, net of government guarantees | 0.94 | % | 0.99 | % |
| Nonperforming assets plus performing restructured loans, net of government | | |
| guarantees / total assets | 0.58 | % | 0.81 | % |
| Nonperforming assets plus performing restructured loans, net of government | | |
| guarantees / total assets, net of government guarantees | 0.63 | % | 0.97 | % |
| | |
| Adversely classified loans, net of government guarantees | $13,739 | | $12,768 | |
| Special mention loans, net of government guarantees | $22,110 | | $19,063 | |
| Loans 30-89 days past due and accruing, net of government guarantees /portfolio loans | — | | 0.05 | % |
| Loans 30-89 days past due and accruing, net of government guarantees / | | |
| portfolio loans, net of government guarantees | — | | 0.07 | % |
| | |
| Allowance for credit losses / portfolio loans | 0.83 | % | 1.46 | % |
| Allowance for credit losses / portfolio loans, net of government guarantees | 0.97 | % | 1.93 | % |
| Allowance for credit losses / nonperforming loans, net of government | | |
| guarantees | 110 | % | 210 | % |
| | |
| Gross loan charge-offs for the quarter | $1,179 | | $11 | |
| Gross loan recoveries for the quarter | ($53) | | $64 | |
| Net loan (recoveries) charge-offs for the quarter | $1,126 | | ($53) | |
| Net loan (recoveries) charge-offs year-to-date | $1,107 | | $384 | |
| Net loan (recoveries) charge-offs for the quarter / average loans, for the quarter | 0.08 | % | — | % |
| Net loan (recoveries) charge-offs year-to-date / average loans, | | |
| year-to-date annualized | 0.07 | % | 0.03 | % |
The Company’s nonperforming loans, net of government guarantees increased in 2021 to $10.7 million as compared to $10.0 million in 2020. This increase was mostly due to several additions to nonaccrual loans which were only partially offset by principal paydowns and charge-offs on nonaccrual loans in 2021. There was interest income of $1.6 million and $924,000 recognized in net income for 2021 and 2020, respectively, related to interest collected on nonaccrual loans whose principal has been paid down to zero. The Company had three relationships that each represented more than 10% of nonaccrual loans as of December 31, 2021.
The Company had $773,000 and $832,000 in loans classified as TDRs, net of government guarantees that were performing as of December 31, 2021 and 2020, respectively. Additionally, there were $6.5 million and $5.5 million in TDRs included in nonaccrual loans at December 31, 2021 and 2020 for total TDRs, net of government guarantees of $7.3 million and $5.3 million at December 31, 2021 and 2020, respectively. The increase in TDRs at December 31, 2021 as compared to 2020 was primarily due additions to TDRs that were only partially offset by payoffs and paydowns on loans classified as TDRs in 2021. See Note 5 of the Notes to Consolidated Financial Statements included in Part II. Item 8 of this report for further discussion of TDRs.
At December 31, 2021, management had identified potential problem loans of $2.1 million as compared to potential problem loans of $6.1 million at December 31, 2020. Potential problem loans are loans which are currently performing that have developed negative indications that the borrower may not be able to comply with present payment terms and which may later be included in nonaccrual, past due, or impaired loans. The $4.0 million decrease in potential problem loans at December 31, 2021 from December 31, 2020 was primarily the result of one $3.9 million relationship moving to nonaccrual as well as paydowns and credit risk upgrades to existing potential problem loans that were partially offset by the addition of new potential problem loans in 2021.
The Company acquired a vessel totaling $231,000 in the third quarter of 2019 through foreclosure proceedings related to one lending relationship that was sold in the second quarter of 2021.
The following summarizes OREO activity for the periods indicated:
| | | | | | | | | | | |
| (In Thousands) | 2021 | 2020 | 2019 |
| Balance, beginning of the year | $7,289 | | $7,043 | | $7,962 | |
| Transfers from loans | 274 | | 652 | | — | |
| | | |
| | | |
| | | |
| | | |
| Proceeds from the sale of other real estate owned | (2,610) | | (797) | | (1,299) | |
| Gain on sale of other real estate owned, net | 685 | | 391 | | 380 | |
| | | |
| | | |
| Balance, end of year | 5,638 | | 7,289 | | 7,043 | |
| Government guarantees | (1,279) | | (1,279) | | (1,279) | |
| Balance, end of year, net of government guarantees | $4,359 | | $6,010 | | $5,764 | |
The Company made a $1.0 million loan in 2021 to facilitate the sale of OREO in 2021, but did not make any loans to facilitate the sale of OREO in 2020. Our underwriting policies and procedures for loans to facilitate the sale of OREO are no different than our standard loan policies and procedures.
Allowance for Credit Losses
The Company adopted ASU 2016-13 effective January 1, 2021. The determination of the amount of the ACL is complex and involves a high degree of judgment and subjectivity. Refer to Note 1 of the notes to Consolidated Financial
Statements included in Part II. Item 8 of this report for detailed discussion regarding the ACL methodology for loans and unfunded commitments.
The following tables show the allocation of the ACL and the percent of loans in each category to total loans and the ratio of net loan charge-offs to average loans outstanding by loan segment for the years indicated:
| | | | | | | | | | | |
| | 2021 |
| | | % of Loans(1) | Net loan charge-offs (recoveries) to average loans |
| (In Thousands) | Amount |
| Commercial & industrial loans | $3,027 | | 33 | % | 0.21 | % |
| Commercial real estate: | | | |
| Owner occupied properties | 3,176 | | 21 | % | — | % |
| Non-owner occupied and multifamily properties | 2,930 | | 31 | % | — | % |
| Residential real estate: | | | |
| 1-4 family residential properties secured by first liens | 439 | | 2 | % | — | % |
| 1-4 family residential properties secured by junior liens and revolving secured by 1-4 family first liens | 215 | | 1 | % | (0.21) | % |
| 1-4 family residential construction loans | 120 | | 3 | % | — | % |
| Other construction, land development and raw land loans | 1,635 | | 6 | % | — | % |
| Obligations of states and political subdivisions in the US | 32 | | 1 | % | — | % |
| Agricultural production, including commercial fishing | 91 | | 2 | % | (0.15) | % |
| Consumer loans | 67 | | — | % | (0.27) | % |
| Other loans | 7 | | — | % | — | % |
| Total | $11,739 | | 100 | % | 0.07 | % |
1Represents percentage of this category of loans to total portfolio loans.
| | | | | | | | | | | |
| | 2020 |
| | | % of Loans(1) | Net loan charge-offs (recoveries) to average loans |
| (In Thousands) | Amount |
| Commercial | $7,973 | | 39 | % | 0.04 | % |
| Real estate construction one-to-four family | 679 | | 3 | % | — | % |
| Real estate construction other | 1,179 | | 6 | % | — | % |
| Real estate term owner occupied | 2,625 | | 11 | % | 0.06 | % |
| Real estate term non-owner occupied | 5,133 | | 21 | % | — | % |
| Real estate term other | 779 | | 3 | % | — | % |
| Consumer secured by 1st deed of trust | 261 | | 1 | % | — | % |
| Consumer other | 400 | | 2 | % | (0.04) | % |
| Unallocated | 2,107 | | — | % | — | % |
| Total | $21,136 | | 86 | % | 0.03 | % |
1Represents percentage of this category of loans to total portfolio loans.
As of December 31, 2021, and 2020, loans acquired in connection with our acquisition of Alaska Pacific on April 1, 2014 are included in the Company's ACL using the same methodology as all other loans as described in Note 1 of the notes to Consolidated Financial Statements included in Part II. Item 8 of this report due to the amount of time that has passed since the loans were purchased. The purchase discount related to acquired credit impaired loans was zero and $328,000 as of December 31, 2021 and 2020, respectively.
The provision for credit losses in 2021 as compared to 2020 decreased $6.5 million to a benefit for credit losses of $4.1 million compared to a provision of $2.4 million in 2020. This decrease is primarily due to improvement in economic assumptions. The Company determined that an ACL of $11.7 million, or 0.83% of portfolio loans, is appropriate as of December 31, 2021 based on our analysis of the current credit quality of the portfolio and current economic conditions. The provision for credit losses in 2020 as compared to 2019 increased $3.6 million to a provision for credit losses of $2.4 million compared to a benefit of $1.2 million in 2019. This increase is primarily due to management's assessment of risk associated with the economic impacts of the COVID-19 pandemic, the reduction in oil prices and a slowing Alaska economy, as well as growth in the unguaranteed portion of the loan portfolio.
As noted above, the ACL was recorded in accordance with CECL in 2021. The allowance for loan losses in 2020, prior to adoption of CECL, was recorded under the incurred loss model. Despite the fact that a different methodology was used in the calculation of the provision for credit losses in 2021 versus 2020, in general the decrease in the ACL on loans as of December 31, 2021 compared to December 31, 2020 is primarily the result of improvement in economic assumptions used to estimate credit losses following the economy's recovery from the COVID-19 pandemic. The ongoing impacts of the CECL methodology will be dependent upon changes in economic conditions and forecasts, as well as loan portfolio composition, quality, and duration.
The following table sets forth information regarding changes in the ACL for unfunded commitments for the years indicated:
| | | | | | | | |
| (In Thousands) | 2021 | 2020 |
| Balance at beginning of period | $187 | | $152 | |
| Impact of adopting ASC 326 | 1,229 | | — | |
| Adjusted balance, beginning of period | 1,416 | | 152 | |
| (Benefit) provision for credit losses | (320) | | 35 | |
| Balance at end of period | $1,096 | | $187 | |
While management believes that it uses the best information available to determine the ACL, unforeseen market conditions and other events could result in an adjustment to the ACL, and net income could be significantly affected if circumstances differed substantially from the assumptions used in making the final determination of the ACL.
Purchased Receivables
Purchased receivable balances decreased at December 31, 2021 to $7.0 million from $13.9 million at December 31, 2020, and year-to-date average purchased receivable balances were $12.4 million and $14.5 million in 2021 and 2020, respectively. Purchased receivable income was $2.3 million and $2.7 million in 2021 and 2020, respectively. Purchased receivable income in 2021 decreased from 2020 due to customers reportedly using PPP loans to fund liquidity needs instead of selling receivables.
The following table sets forth information regarding changes in the purchased receivable ACL for the years indicated:
| | | | | | | | | | | |
| (In Thousands) | 2021 | 2020 | 2019 |
| Balance at beginning of year | $73 | | $94 | | $190 | |
| Charge-offs | — | | — | | — | |
| Recoveries | — | | — | | — | |
| Charge-offs net of recoveries | — | | — | | — | |
| Reserve for (recovery from) purchased receivables | — | | (21) | | (96) | |
| Balance at end of year | $— | | $73 | | $94 | |
| Ratio of net charge-offs (recoveries) to average purchased receivables during the period | — | % | — | % | — | % |
Deposits
Deposits are our primary source of funds. Total deposits increased 33% to $2.4 billion at December 31, 2021 from $1.8 billion at December 31, 2020. This increase is primarily due to funding PPP loans, but is also due to new client relationships as a result of the Company's significant PPP efforts during 2021 and 2020. Our deposits generally are expected to fluctuate according to the level of our market share, economic conditions, and normal seasonal trends.
The following table sets forth the average balances outstanding and average interest rates for each major category of our deposits, for the periods indicated:
| | | | | | | | | | | | | | | | | | | | | | | | | | |
| | 2021 | | 2020 | | 2019 |
| | Average balance | Average rate paid | | Average balance | Average rate paid | | Average balance | Average rate paid |
| (In Thousands) | | |
| Interest-bearing demand accounts | $575,298 | | 0.08 | % | | $387,416 | | 0.16 | % | | $272,895 | | 0.17 | % |
| Money market accounts | 264,344 | | 0.16 | % | | 219,025 | | 0.32 | % | | 209,245 | | 0.55 | % |
| Savings accounts | 323,131 | | 0.15 | % | | 257,292 | | 0.28 | % | | 233,057 | | 0.46 | % |
| Certificates of deposit | 178,215 | | 0.94 | % | | 176,873 | | 1.83 | % | | 135,005 | | 1.67 | % |
| Total interest-bearing accounts | 1,340,988 | | 0.23 | % | | 1,040,606 | | 0.51 | % | | 850,202 | | 0.58 | % |
| Noninterest-bearing demand accounts | 784,092 | | | | 597,610 | | | | 426,205 | | |
| Total average deposits | $2,125,080 | | | | $1,638,216 | | | | $1,276,407 | | |
The Company's mix of deposits continues to contribute to a low cost of funds with balances in transaction accounts representing 93% of total deposits at December 31, 2021 and 90% at December 31, 2020.
The only deposit category with stated maturity dates is certificates of deposit. At December 31, 2021, we had $178.0 million in certificates of deposit, of which $118.5 million, or 67%, are scheduled to mature in 2022. The Company’s certificates of deposit increased to $178.0 million during 2021 as compared to $175.6 million at December 31, 2020. The aggregate amount of certificates of deposit in amounts of $250,000 or more at December 31, 2021 and 2020, was $77.1 million and $83.6 million, respectively. The following table sets forth the amount outstanding of certificates of deposits in amounts of $250,000 or more by time remaining until maturity and percentage of total deposits as of December 31, 2021:
| | | | | | | | | | | |
| | Time Certificates of Deposits |
| | of $250,000 or More |
| | | | Percent of Total Deposits |
| | | |
| (In Thousands) | Amount | |
| Amounts maturing in: | | | |
| Three months or less | $9,787 | | | 13 | % |
| Over 3 through 6 months | 9,814 | | | 13 | % |
| Over 6 through 12 months | 25,523 | | | 33 | % |
| Over 12 months | 31,989 | | | 41 | % |
| Total | $77,113 | | | 100 | % |
The Company offers the Certificate of Deposit Account Registry Service® (CDARS®) as a member of Promontory Interfinancial Network, LLCSM (Network). When a Network member places a deposit using CDARS, that certificate of deposit is divided into amounts under the standard FDIC insurance maximum ($250,000) and is allocated among member banks, making the large deposit eligible for FDIC insurance. The Company had $24.0 million CDARS certificates of deposits at December 31, 2021 and $9.4 million CDARS certificates of deposits at December 31, 2020.
Borrowings
FHLB: The Bank is a member of the Federal Home Loan Bank of Des Moines (the "FHLB"). As a member, the Bank is eligible to obtain advances from the FHLB. FHLB advances are dependent on the availability of acceptable collateral such as marketable securities or real estate loans, although all FHLB advances are secured by a blanket pledge of the Company’s assets. At December 31, 2021, our maximum borrowing line from the FHLB was $1.219 billion, approximately 45% of the Bank’s assets, subject to the FHLB’s collateral requirements. The Company has outstanding advances of $14.5 million as of December 31, 2021 which were originated to match fund low income housing projects that qualify for long term fixed interest
rates. These advances have original terms of either 18 or 20 years with 30 year amortization periods and fixed interest rates ranging from 1.23% to 3.25%.
Federal Reserve Bank: The Federal Reserve Bank of San Francisco (the "Federal Reserve Bank") is holding $50.7 million of loans as collateral to secure advances made through the discount window as of December 31, 2021. There were no discount window advances outstanding at December 31, 2021 or 2020. The Company paid less than $1,000 in interest in 2021 and 2020 on this agreement. The Company utilized the Federal Reserve Bank's PPPLF to fund SBA PPP loans during the second quarter of 2020, but has repaid those funds in full as of June 30, 2020. This advance had an interest rate of 0.35%.
Other Short and Long-term Borrowings: The Company had no short or long-term borrowings outstanding other than the FHLB advances noted above as of December 31, 2021 or 2020.
The Company is subject to provisions under Alaska state law which generally limit the amount of outstanding debt to 35% of total assets or $948.0 million at December 31, 2021 and 35% of total assets or $736.0 million at December 31, 2020.
Junior Subordinated Debentures
On December 16, 2005, the Company’s subsidiary, NST2, issued trust preferred securities in the principal amount of $10 million. These securities carry an interest rate of 90-day LIBOR plus 1.37% per annum that was initially set at 5.86% adjusted quarterly. The securities have a maturity date of March 15, 2036, and are callable by the Company on or after March 15, 2011. These securities are treated as Tier 1 capital by the Company’s regulators for capital adequacy calculations. The interest cost to the Company of these securities was $160,000 in 2021. At December 31, 2021, the securities had an interest rate of 1.57%. The Company entered into an interest rate swap in the third quarter of 2017 to hedge the variability in cash flows arising out of its junior subordinated debentures, by swapping the cash flows with an interest rate swap which receives floating and pays fixed. The Company has designated this interest rate swap as a hedging instrument. The interest rate swap effectively fixes the Company's interest payments on the $10 million of junior subordinated debentures held under NST2 at 3.72% through its maturity date. Net of the impact of the interest rate swap, interest expense on these securities was $382,000 in 2021 and $385,000 in 2020.
Liquidity and Capital Resources
The Company is a single bank holding company and its primary ongoing source of liquidity is from dividends received from the Bank. Such dividends arise from the cash flow and earnings of the Bank. Banking regulations and regulatory authorities may limit the amount of, or require the Bank to obtain certain approvals before paying, dividends to the Company. Given that the Bank currently meets and the Bank anticipates that it will continue to meet, all applicable capital adequacy requirements for a “well-capitalized” institution by regulatory standards, the Company expects to continue to receive dividends from the Bank during 2022. Other available sources of liquidity for the bank holding company include the issuance of debt and the issuance of common or preferred stock. As of December 31, 2021, the Company has 10.0 million authorized shares of common stock, of which 6.0 million are issued and outstanding, leaving 153,4334.0 million shares available for issuance. Additionally, the Company has 2.5 million authorized shares of preferred stock available for issuance.
The Bank manages its liquidity through its Asset and Liability Committee. The Bank's primary source of funds are customer deposits. These funds, together with loan repayments, loan sales, maturity of investment securities, borrowed funds, and retained earnings are used to make loans, to acquire securities and other assets, and to fund deposit flows and continuing operations. The primary sources of demands on our liquidity are customer demands for withdrawal of deposits and borrowers’ demands that we advance funds against unfunded lending commitments.
The Company had cash and cash equivalents of $645.8 million, or 24% of total assets at December 31, 2021 compared to $116.0 million, or 6% of total assets as of December 31, 2020. The increase in cash and cash equivalents is primarily due to a significant increase in deposits. Management expects this elevated level of liquidity to continue through 2022 and potentially into subsequent years. Accordingly, management has invested in slightly longer term investment securities as compared to the last several years. As of December 31, 2021, the weighted average maturity of available for sale securities is 4.1 years compared to 2.6 years at December 31, 2020. At December 31, 2021, $5.0 million in available for sale securities mature in 2022, $15 million mature in 2023, and $116.2 million mature in 2024. Our total unfunded commitments to fund loans, loans held for sale, and letters of credit at December 31, 2021, were $445.9 million. We do not expect that all of these loans are likely to be fully drawn upon at any one time. At December 31, 2021, certificates of deposit totaling $118.6 million and $52.6 million, respectively, contractually mature in 2022 and 2023, and may be withdrawn from the Bank. Similar to loans, we do not
expect that these maturing certificates of deposit, or other non-maturity deposits, to be withdrawn from the Bank in a manner that will strain liquidity; however, unforeseen future circumstances or events may cause higher than anticipated withdrawal of deposits or draws of unfunded commitments to fund new loans. Management believes that cash requirements to fund future non-deposit liabilities, including operating lease liabilities, other liabilities, or borrowings as of December 31, 2021, are not material to the Company's liquidity position as of December 31, 2021.
The Company has other available sources of liquidity to fund unforeseen liquidity needs. These include borrowings available through our correspondent banking relationships and our credit lines with the Federal Reserve Bank and the FHLB. At December 31, 2021, our liquid assets were $907.9 million and our funds available for borrowing under our existing lines of credit were $1.27 billion. Given these sources of liquidity and our expectations for customer demands for cash and for our operating cash needs, we believe our sources of liquidity to be sufficient in the foreseeable future.
As shown in the Consolidated Statements of Cash Flows included in Part II. Item 8 of this report, net cash provided by operating activities was $112.0 million in 2021 and net cash used by operating activities was $36.5 million in 2020. The primary source of cash provided by, and used by operating activities for all periods presented was positive net income. In 2021 proceeds from the sale of loans held for sale exceeded proceeds used in originations as refinance activity slowed, and in 2020 the opposite was true. In 2020 the origination of loans held for sale exceeded proceeds from the sale of loans held for sale which is the primary reason that operating cash flow is negative in 2020. Net cash used by investing activities was $159.1 million in 2021 primarily due to purchases of available for sale and held to maturity securities. Net cash used by investing activities was $382.8 million in 2020 primarily due to increases in loans, in particular PPP loans. Financing activities provided cash of $577.0 million in 2021 and $439.8 million in 2020. Financing activities provided cash in both 2021 and 2020 due to increases in deposits that were only partially offset by the payment of cash dividends to shareholders and the repurchase of shares of the Company's common stock.
Throughout our history, the Company has periodically repurchased for cash a portion of its shares of common stock in the open market. The following table presents the amount of common shares repurchased and the weighted average price paid per share for the periods indicated:
| | | | | | | | | | | |
| Years Ending: | Common Shares Repurchased | | Weighted Average Price |
| 2021 | 279,276 | | $41.30 |
| 2020 | 327,000 | | $30.51 |
| 2019 | 347,676 | | $36.15 |
| 2018 | 15,468 | | $31.90 |
| 2017 | 58,341 | | $27.56 |
At December, 31, 2021, there were 33,724 shares available under the previously announced stock repurchase authorization.program. However, on January 28, 2022 the Company announced that its Board of Directors authorized the repurchase of up to an additional 300,000 shares of common stock. The Company intends to continue to repurchase our stock from time-to-time depending upon market conditions, but we can make no assurances that we will continue this program or that we will authorize additional shares for repurchase.
The table below shows the cumulative effect the repurchase of common shares since the inception of the Company on diluted earnings per share:
| | | | | | | | | | | |
| Years Ending: | Diluted
EPS as
Reported | | Diluted EPS without Stock Repurchase |
| 2021 | $6.00 | | $4.79 |
| 2020 | $5.11 | | $4.22 |
| 2019 | $3.04 | | $2.59 |
| 2018 | $2.86 | | $2.56 |
| 2017 | $1.88 | | $1.69 |
Regulatory Capital Requirements: We are subject to minimum capital requirements. Federal banking agencies have adopted regulations establishing minimum requirements for the capital adequacy of banks and bank holding companies. The requirements address both risk-based capital and leverage capital. We believe as of December 31, 2021, that the Company and the Bank met all applicable capital adequacy requirements for a “well-capitalized” institution by regulatory standards.
The table below illustrates the capital requirements in effect in 2021 for the Company and the Bank and the actual capital ratios for each entity that exceed these requirements. Management intends to maintain capital ratios for the Bank in 2022 exceeding the FDIC’s new requirements for the “well-capitalized” classification. The capital ratios for the Company exceed those for the Bank primarily because the $10 million trust preferred securities offering is included in the Company’s capital for regulatory purposes, although they are accounted for as a long-term debt in our consolidated financial statements. The trust preferred securities are not accounted for on the Bank’s financial statements nor are they included in its capital. As a result, the Company has $10 million more in regulatory capital than the Bank at December 31, 2021 and 2020, respectively, which explains most of the difference in the capital ratios for the two entities.
| | | | | | | | | | | | | | | | | | | | | | | |
| | Minimum Required Capital | | Well-Capitalized | | Actual Ratio Company | | Actual Ratio Bank |
| | | | |
| December 31, 2021 | | | |
| Total risk-based capital | 8.00% | | 10.00% | | 14.79% | | 12.13% |
| Tier 1 risk-based capital | 6.00% | | 8.00% | | 14.08% | | 11.42% |
| Common equity tier 1 capital | 4.50% | | 6.50% | | 13.50% | | 11.43% |
| Leverage ratio | 4.00% | | 5.00% | | 9.03% | | 7.31% |
See Note 23 of the Consolidated Financial Statements included in Part II. Item 8 of this report for a detailed discussion of the capital ratios. The requirements for "well-capitalized" come from the Prompt Correction Action rules. See Part I. Item 1 Supervision and Regulation. These rules apply to the Bank but not to the Company. Under the rules of the Federal Reserve Bank, a bank holding company such as the Company is generally defined to be "well capitalized" if its Tier 1 risk-based capital ratio is 8.0% or more and its total risk-based capital ratio is 10.0% or more.
Critical Accounting Policies
The SEC defines "critical accounting policies" as those that require application of management's most difficult, subjective or complex judgments often as a result of the need to make "critical accounting estimates", which are estimates aboutthat involve estimation uncertainty that has had or is reasonably likely to have a material impact on the effectCompany's financial condition or results of matters that are inherently uncertain and may change in future periods.operations. Our significant accounting policies are described in Note 1 in the Notes to Consolidated Financial Statements in Part II. Item 8 of this report. Not all of these significant accounting policies require management to make difficult, subjective or complex judgments orcritical accounting estimates. Management believes that the following accounting policies would be considered critical under the SEC's definition. The following discussion is intended to supplement, but not duplicate, information provided in Note 1 in the Notes to Consolidated Financial Statements in Part II. Item 8 of this report for these policies.
Allowance for loan losses:Credit Losses Policy: The Company maintains an Allowance to reflect inherent lossesadopted CECL on January 1, 2021. The Company's Executive Loan Management Committee and Asset Liability Committee are both involved in its loan portfolio asmonitoring various aspects of the balance sheet date.Company's ACL methodology. The Company performs regular credit reviewsCompany's Audit Committee provides board oversight of the loan portfolioACL process and reviews and approves the ACL methodology on a quarterly basis.
CECL is not prescriptive in the methodology used to determine the expected credit qualityloss estimate. Therefore, management has flexibility in selecting the methodology. However, the expected credit losses must be estimated over a financial asset's contractual term, adjusted for prepayments, utilizing quantitative and adherencequalitative factors. The estimate of current expected credit losses is based on relevant information about past events, current conditions, and reasonable and supportable forecasts that affect the collectability of the reported amounts. Historical loss experience is the starting point for estimating expected credit losses. Adjustments are made to historical loss experience to reflect differences in asset-specific risk characteristics, such as underwriting standards.standards, portfolio mix or asset terms, and differences in economic conditions – both current conditions and reasonable and supportable forecasts. When the Company is not able to make or obtain reasonable and supportable forecasts for the entire life of the financial asset it has estimated expected credit losses for the remaining life after the forecasted period using an approach that reverts to historical credit loss information.
Depending on the nature and size of the pool of financial assets with similar risk characteristics, the Company uses a discounted cash flow (“DCF”) method or a weighted average remaining life method to estimate expected credit losses quantitatively. The Company uses a DCF method for 8 of its 11 loan pools, which represent 97% of the amortized cost basis of total loan pools at December 31, 2021. The weighted average remaining life method is used for the remaining 3 loan pools primarily because loan level data constraints preclude the use of the DCF model.
Under the DCF method, the Company utilizes complex models to obtain reasonable and supportable forecasts to calculate two predictive metrics, the probability of default ("PD") and loss given default ("LGD"). The PD measures the probability that a loan will default within a given time horizon and is an assumption derived from regression models which determine the relationship between historical defaults and certain economic variables. The Company's regression models for PD utilize the Company's actual historical loan level default data. The Company determines a reasonable and supportable forecast and applies that forecast to the regression model to estimate defaults over the forecast period. Management leverages economic projections from a reputable and independent third-party to inform its loss driver forecasts over the Company's four quarter forecast period. Management utilizes and forecasts Alaska unemployment as a loss driver for all of the loans pools that utilize the DCF method. Management also utilizes and forecasts either one-year percentage change in the Alaska home price index or the one-year percentage change in the national commercial real estate price index as a second loss driver depending on the nature of the underlying loan pool and how well that loss driver correlates to expected future losses. Other internal and external indicators of economic forecasts are originated, they are assignedalso considered by management when developing the forecast metrics. Following the forecast period, the economic variables used to calculate PD revert to a risk rating thathistorical average at a constant rate over an eight quarter reversion period. Other assumptions relevant to the discounted cash flow model to derive the quantitative allowance include the LGD, which is reassessed periodically
during the estimate of loss for a defaulted loan, prepayment speeds, and the discount rate applied to future cash flows. The DCF method utilizes the effective interest rate of individual assets to discount the expected credit losses over the contractual term of the loan, through the credit review process. The Company's risk rating methodology assigns risk ratings ranging from 1 to 10, where a higher rating represents higher risk. These risk ratings are then consolidated into five classes, which include pass, special mention, substandard, doubtful and loss. These classes are a primary factor in determining an appropriate amount for the allowance for loan losses. Each class is assessed an inherent credit loss factor that determines an amount of allowance for loan losses provided for that group of loans. This allowance is then adjusted for qualitative factors, by segment and class. Qualitative factors are based on management’s assessment of current trends that may cause losses inherent in the current loan portfolio to differ significantly from historical losses. Some factors that management considers in determining the qualitative adjustment to the general reserve include loan quality trends in our own portfolio, the degree of concentrations of large borrowers in our loan portfolio, national and local economic trends, business conditions, underwriting policies and standards, trends in local real estate markets, effects of various political activities, peer group data, and internal factors such as underwriting policies and expertise of the Company’s employees.
Regular credit reviews of the portfolio also identify loans that are considered potentially impaired. A loan is considered impaired when based on current information and events, we determine that we will probably not be able to collect all amounts due according to the loan contract, including scheduled interest payments. When we identify a loan as impaired, we measure the impairment using discounted cash flows, except when the sole remaining source of the repayment for the loanprepayments. The LGD is the liquidation ofexpected loss which would be realized presuming a default has occurred and primarily measures the collateral. In these cases, we use the current fair value of the collateral less selling costs, insteador other secondary source of discounted cash flows. repayment related to the collateral.
The analysisCompany has identified the following pools of collateral dependentfinancial assets with similar risk characteristics for measuring expected credit losses under CECL as adopted by the Company on January 1, 2021:
Commercial & industrial - Commercial loans are loans for commercial, corporate and business purposes. The Company’s commercial business loan portfolio is comprised of loans for a variety of purposes and across a variety of industries. These loans include general commercial and industrial loans, loans to purchase capital equipment, and other business loans for working capital and operational purposes. Commercial loans are generally secured by accounts receivable, inventory and other business assets. Also included in commercial loans are our PPP loans originated during 2020 and 2021. The Company utilizes the DCF method to quantitatively estimate credit losses for this pool.
Commercial real estate - This category of loans consists of the following loan types:
Owner occupied - This category includes non-farm, non-residential real estate loans for a variety of commercial property types and purposes, including owner occupied commercial real estate loans primarily secured by commercial office or industrial buildings, warehouses or retail buildings where the owner of the building occupies the property. Repayment terms vary considerably, interest rates are fixed or variable, and are structured for full, partial, or no amortization of principal. The Company utilizes the DCF method to quantitatively estimate credit losses for this pool.
Non-owner occupied and multifamily - This category includes non-farm, non-residential real estate loans for a variety of commercial property types and purposes, including investment real estate loans that are primarily secured by office and industrial buildings, warehouses or retail buildings where the owner of the building does not occupy the property, non-owner occupied apartment or multifamily residential buildings, and various special purpose properties. Repayment terms vary considerably, interest rates are fixed or variable, and are structured for full, partial, or no amortization of principal. Generally, these types of loans are thought to involve a greater degree of credit risk than owner occupied commercial real estate as they are more sensitive to adverse economic conditions. The Company utilizes the DCF method to quantitatively estimate credit losses for this pool.
Residential real estate - This category of loans consists of the following loan types:
1-4 family residential properties secured by first liens - This category of loans includes appraisals onterm loans secured by first liens on residential real property, management’s assessmentestate. The Company utilizes the DCF method to quantitatively estimate credit losses for this pool.
1-4 family residential properties secured by junior liens and revolving credit lines secured by 1-4 family first liens - This category of loans includes term loans primarily secured by junior liens on residential real estate and revolving credit lines that are secured by first liens on residential real estate. Home equity revolving lines of credit and home equity term loans are included in this group of loans. The Company utilizes the DCF method to quantitatively estimate credit losses for this pool.
1-4 family residential construction - This category of loans consists of loans to finance the ground up construction, improvement and/or carrying for sale after the completion of construction of 1-4 family residential properties which will secure the loan. These loans may also be secured by tracts or individual parcels of land on which 1-4 family residential properties are being constructed. The repayment of construction loans is generally dependent upon the successful completion of the current market, recent payment history and an evaluationimprovements by the builder for the end user, or sale of other sources of repayment.the property to a third-party. The Company obtains appraisals on realutilizes the DCF method to quantitatively estimate credit losses for this pool.
Other construction, land development, and personal property that secure itsraw land - This category of loans duringconsists of loans to finance the loan origination process in accordance with regulatory guidanceground up construction, improvement and/or carrying for sale after the completion of construction of owner occupied and its loan policy. The Company obtains updated appraisals onnon-owner occupied commercial properties, and loans secured by raw or improved land. The repayment of construction loans is generally dependent upon the successful completion of the improvements by the builder for the end user, or sale of the property to a third-party. Repayment of land secured loans are dependent upon the successful development and sale of the property, the sale of the land as is, or the outside cash flow of the owners to support the retirement of the debt. The Company utilizes the DCF method to quantitatively estimate credit losses for this pool.
Agricultural production, including commercial fishing - These loans are for the purpose of financing agricultural production, including growing and storing of crops, and for the purpose of financing fisheries and forestries, including loans to commercial fishermen. These loans may be secured or unsecured, but any loans for these purposes that are secured by real estate are included in a real estate category. The Company utilizes the weighted average remaining life method to quantitatively estimate credit losses for this pool.
Consumer - Loans used for personal use, which may be secured or personal property based upon its assessmentunsecured, and customer overdrafts. The Company utilizes the DCF method to quantitatively estimate credit losses for this pool.
Obligations of changesstates and political subdivisions in the current market or particular projects or properties, information from other current appraisalsUS - This category of loans includes all loans made to states, counties municipalities, school districts, drainage and other sourcessewer districts, and Indian tribes in the U.S. These loans maybe be secured by any type of information.collateral, including real estate. The Company usesutilizes the information provided in these updated appraisals along with its evaluationweighted average remaining life method to quantitatively estimate credit losses for this pool.
Other - This category of loans includes all other information available on a particular property as it assesses the collateral coverage on its performing and nonperforming loans and the impact that may have on the adequacy of its Allowance.
If we determine that the valuecannot properly be reported in one of the impaired loan is less thanpreceding categories. The Company utilizes the recorded investmentweighted average remaining life method to quantitatively estimate credit losses for this pool.
In addition to the quantitative portion of the ACL derived using either the DCF or weighted average remaining life method, the Company also considers the effects of the following qualitative factors in its calculation of expected losses in the loan we either recognize an impairment reserve as a specific component to be provided forportfolio:
•Lending strategy, policies, and procedures;
•Quality of internal loan review;
•Lending management and staff;
•Trends in underlying collateral values;
•Competition, legal, and regulatory changes;
•Economic and business conditions including fluctuations in the Allowance or charge-off the impaired balance on collateral dependentprice of Alaska North slope crude oil;
•Changes in trends, volume and severity of adversely classified loans, if it is determined that such amount represents a confirmed loss. The combination of the risk rating-based allowance component and the impairment reserve allowance component lead to an allocated allowance for loan losses.
Finally, the Company assesses the overall adequacy of the Allowance based on several factors including the level of the Allowance as compared to totalnonaccrual loans, and nonperforming loansdelinquencies;
•Concentration of credit; and
•Changes in light of current economic conditions. This portion of the Allowance is deemed “unallocated” because it is not allocated to any segment or classnature and volume of the loan portfolio. This portion of the Allowance provides for coverage of credit losses inherent in the loan portfolio but not captured in the credit loss factors that are utilized in the risk rating-based component or in the specific impairment component of the Allowance and acknowledges the inherent imprecision of all loss prediction models.
The unallocated portion of the Allowance is based upon management’s evaluation of various factors that are not directly measured in the determination of the allocated portions of the Allowance. Such factors include uncertainties in identifying triggering events that directly correlate to subsequent loss rates, uncertainties in economic conditions, risk factors that have not yet manifested themselves in loss allocation factors, and historical loss experience data that may not precisely correspond to the current portfolio. In addition, the unallocated reserve may fluctuate based upon the direction of various risk indicators. Examples of such factors include the risk as to current and prospective economic conditions, the level and trend of charge offs or recoveries, and the risk of heightened imprecision or inconsistency of appraisals used in estimating real estate values. Although this allocation process may not accurately predict credit losses by loan type or in aggregate, the total allowance for credit losses is available to absorb losses that may arise from any loan type or category. Due to the subjectivity involved in the determination of the unallocated portion of the Allowance, the relationship of the unallocated component to the total Allowance may fluctuate from period to period.
Based on our methodology and its components, management believes the resulting Allowance is adequate and appropriate for the risk identified in the Company's loan portfolio. Given current processes employed by the Company, management believes the segments, classes, and estimated loss rates currently assigned are appropriate. It is possible that others, given the same information, may at any point in time reach different reasonable conclusions that could be material to the Company's financial statements. In addition, current loan classes and fair value estimates of collateral are subject to change as we continue to review loans within our portfolio and as our borrowers are impacted by economic trends within their market areas. Although we have established an Allowance that we consider adequate, there can be no assurance that the established Allowance will be sufficient to offset losses on loans in the future. In addition, a substantial percentage of our loan portfolio is secured by real estate; as a result, a significant decline in real estate market values may require an increase in the Allowance.
Valuation of goodwill and other intangibles: Goodwill and other intangible assets with indefinite lives are not amortized but instead are periodically tested for impairment. Management performs an impairment analysis for the intangible assets with indefinite lives on an annual basis as of December 31. Additionally, goodwill and other intangible assets with indefinite lives are evaluated on an interim basis when events or circumstances indicate impairment potentially exists. The impairment analysis requires management to make subjective judgments. Events and factors that may significantly affect the estimates include, among others, competitive forces, customer behaviors and attrition, changes in revenue growth trends, cost structures, technology, changes in discount rates and specific industry and market conditions. There can be no assurance that changes in circumstances, estimates or assumptions may result in additional impairment of all, or some portion of, goodwill or other intangible assets. The Company performed its annual goodwill impairment testing at December 31, 20182021 and 20172020 in
accordance with the policy described in Note 1 to the financial statements included within Part II. Item 8 of this report. At December 31, 2018,2021, the Company performed its annual impairment test by performing a qualitative assessment. Significant positive inputs to the qualitative assessment included the Company’s increasing net income as compared to historical trends,trends; the Company's stable budget-to-actual results of operations;increasing market share for deposits in our markets; results of regulatory examinations; peer comparisons of the Company's net interest margin; trends in the Company’s cash flows; and improvements in the Alaskan economy in 2018.2021; increases in the volume of mortgage originations in Alaska; increases in the Company's market share of mortgage originations; and increases in the Company's stock price. Significant negative inputs to the qualitative assessment included the recent decline in oil prices andmuted pace of growth in the company's stock price, as well as the decline in the volume of mortgage originations in Alaska and the decrease in net income in the Company's Home Mortgage Lending segment. For the Community Banking segment, weeconomy. We believe that the positive inputs to the qualitative assessment noted above outweigh the negative inputs for both of the Company's operating segments, and we therefore concluded that it is more likely than not that the fair value of the Company exceeds its carrying value at December 31, 20182021 and that no potential impairment existed at that time. After review of these qualitative inputs, the Company determined that performing a quantitative goodwill impairment test for the Home Mortgage Lending segment as of December 31, 2018 was appropriate. The Company estimated the fair value of the Home Mortgage Lending segment using a discounted cash flow approach. We then compared the estimated fair value of the Home Mortgage Lending segment to the carrying value as of December 31, 2018 and concluded that no potential impairment existed at that time.
Valuation of OREO: OREO Other Real Estate Owned ("OREO") represents properties acquired through foreclosure or its equivalent. Prior to foreclosure, the carrying value is adjusted to the fair value, less cost to sell, of the real estate to be acquired by an adjustment to the allowance for loan loss. The amount by which the fair value less cost to sell is greater than the carrying amount of the loan plus amounts previously charged off is recognized in earnings. Any subsequent reduction in the carrying value is charged against earnings. Management's evaluation of fair value is based on appraisals or discounted cash flows of anticipated sales. The amounts ultimately recovered from the sale of OREO may differ from the carrying value of the assets because of market factors beyond the Company's control or due to changes in the Company's strategies for recovering the investment.
Servicing rights: The Company measures mortgage servicing rights ("MSRs") and commercial servicing rights ("CSRs") at fair value on a recurring basis with changes in fair value going through earnings in the period in which the change occurs. Changes in the fair value of MSRs are recorded in mortgage banking income, and changes in the fair value of CSRs are recorded in commercial servicing revenue. Fair value adjustments encompass market-driven valuation changes and the decrease in value that occurs from the passage of time, which are separately reported. Retained servicing rights are measured at fair value as of the date of sale. Initial and subsequent fair value measurements are determined using a discounted cash flow model. In order to determine the fair value of servicing rights, the present value of expected net future cash flows is estimated. Assumptions used include market discount rates, anticipated prepayment speeds, escrow calculations, delinquency rates and ancillary fee income net of servicing costs. The model assumptions for MSRs are also compared to publicly filed information from several large MSR holders, as available.
Fair Value: A hierarchical disclosure framework associated with the level of pricing observability is utilized in measuring financial instruments at fair value. The degree of judgment utilized in measuring the fair value of financial instruments generally correlates to the level of pricing observability. Financial instruments with readily available active quoted prices or for which fair value can be measured from actively quoted prices generally will have a higher degree of pricing observability and a lesser degree of judgment utilized in measuring fair value. Conversely, financial instruments rarely traded or not quoted will generally have little or no pricing observability and a higher degree of judgment utilized in measuring fair value. Pricing observability is impacted by a number of factors, including the type of financial instrument, whether the financial instrument is new to the market and not yet established and the characteristics specific to the transaction.
RESULTS OF OPERATIONS
Income Statement
Net Income
Our results of operations are dependent to a large degree on our net interest income. We also generate other income primarily through mortgage banking income, purchased receivables products, sales of employee benefit plans (through August of 2017, when we sold our interest in the assets of NBG), service charges and fees, and bankcard fees. Our operating expenses consist in large part of salaries and other personnel costs, occupancy, data processing, marketing, and professional services expenses and compensation expense for RML acquisition payments. Interest income and cost of funds, or interest expense, are affected significantly by general economic conditions, particularly changes in market interest rates, by government policies and the actions of regulatory authorities, and by competition in our markets.
We earned net income attributable to the Company of $20.0 million in 2018, compared to net income of $13.2 million in 2017, and $14.4 million in 2016. During these periods, net income per diluted share was $2.86, $1.88, and $2.06, respectively. The increase in net income in 2018 compared to 2017 was primarily due to a decrease of $6.3 million in provision for income taxes, a decrease of $3.7 in the provision for loan losses, and a $3.5 million increase in net interest income. These changes were only partially offset by a decrease of $8.3 million in other operating income, which was primarily due to the sale of our interest in the assets of NBG in August 2017 and a decrease in mortgage banking income. The decrease in net income in 2017 compared to 2016 was primarily due to an increase of $4.3 million in provision for income taxes and an increase of $902,000 in the provision for loan losses, as well as a decrease of $2.8 million in other operating income, which was primarily driven by a reduction in mortgage banking income. These changes were only partially offset by a $1.3 million increase in net interest income and a $4.6 million decrease in compensation expense - RML acquisition payments in 2017 compared to 2016.
Net Interest Income / Net Interest Margin
Net interest income is the difference between interest income from loan and investment securities portfolios and interest expense on customer deposits and borrowings. Changes in net interest income result from changes in volume and spread, which in turn affect our margin. For this purpose, volume refers to the average dollar level of interest-earning assets and interest-bearing liabilities, spread refers to the difference between the average yield on interest-earning assets and the average cost of interest-bearing liabilities, and margin refers to net interest income divided by average interest-earning assets. Changes in net interest income are influenced by yields and the level and relative mix of interest-earning assets and interest-bearing liabilities.
Net interest income in 2018 was $61.2 million, compared to $57.7 million in 2017, and $56.4 million in 2016. The increase in 2018 as compared to 2017 and 2017 as compared to 2016 was mainly due to increased interest income earned on long- and short-term investments and loans primarily due to higher yields resulting from increases in interest rates in both 2018 and 2017 compared to the prior year. During 2018, 2017, and 2016, net interest margins were 4.55%, 4.22%, and 4.14%, respectively. The increase in net interest margin in both 2017 and 2018 compared to the prior year is the result of increases in the spread between the average yield on interest-earning assets and the average cost of interest-bearing liabilities.
The following table sets forth for the periods indicated information with regard to average balances of assets and liabilities, as well as the total dollar amounts of interest income from interest-earning assets and interest expense on interest-bearing liabilities. Average yields or costs, net interest income, and net interest margin are also presented:
|
| | | | | | | | | | | | | | | | | | | | | | | | | | |
| Years ended December 31, | 2018 |
| 2017 |
| 2016 |
| | Average outstanding balance | Interest income / expense | Average Yield / Cost |
| Average outstanding balance | Interest income / expense | Average Yield / Cost |
| Average outstanding balance | Interest income / expense | Average Yield / Cost |
| |
| (In Thousands) |
Loans (1),(2) |
| $971,548 |
|
| $55,526 |
| 5.72 | % |
|
| $981,001 |
|
| $53,301 |
| 5.43 | % |
|
| $976,613 |
|
| $52,905 |
| 5.42 | % |
| Loans held for sale | 46,089 |
| 2,016 |
| 4.37 | % | | 44,047 |
| 1,740 |
| 3.95 | % | | 52,012 |
| 1,872 |
| 3.60 | % |
Long-term Investments(3) | 286,426 |
| 5,829 |
| 2.04 | % |
| 305,211 |
| 4,634 |
| 1.52 | % |
| 296,214 |
| 3,936 |
| 1.33 | % |
Short-term investments(4) | 42,386 |
| 806 |
| 1.90 | % |
| 36,944 |
| 433 |
| 1.17 | % |
| 37,074 |
| 205 |
| 0.55 | % |
| Total interest-earning assets |
| $1,346,449 |
|
| $64,177 |
| 4.77 | % |
|
| $1,367,203 |
|
| $60,108 |
| 4.40 | % |
|
| $1,361,913 |
|
| $58,918 |
| 4.33 | % |
| Noninterest-earning assets | 146,936 |
| | |
| 143,849 |
| | |
| 144,609 |
| | |
| Total |
| $1,493,385 |
| |
| |
|
|
| $1,511,052 |
| |
| |
|
|
| $1,506,522 |
| |
| |
|
| Interest-bearing deposits |
| $809,808 |
|
| $2,307 |
| 0.28 | % |
|
| $829,918 |
|
| $1,707 |
| 0.21 | % |
|
| $803,877 |
|
| $1,870 |
| 0.23 | % |
| Borrowings | 47,570 |
| 662 |
| 1.37 | % |
| 50,523 |
| 723 |
| 1.43 | % |
| 50,095 |
| 691 |
| 1.38 | % |
| Total interest-bearing liabilities |
| $857,378 |
|
| $2,969 |
| 0.35 | % |
|
| $880,441 |
|
| $2,430 |
| 0.28 | % |
|
| $853,972 |
|
| $2,561 |
| 0.30 | % |
| Noninterest-bearing demand deposits | 417,464 |
| | |
| 418,415 |
| | |
| 446,366 |
| | |
| Other liabilities | 17,521 |
| | |
| 19,067 |
| | |
| 24,556 |
| | |
| Equity | 201,022 |
| | |
| 193,129 |
| | |
| 181,628 |
| | |
| Total |
| $1,493,385 |
| | |
|
| $1,511,052 |
| | |
|
| $1,506,522 |
| | |
| Net interest income | |
| $61,208 |
| |
| |
| $57,678 |
| |
| |
| $56,357 |
| |
| Net interest margin | | | 4.55 | % |
| | | 4.22 | % |
| | | 4.14 | % |
| Average portfolio loans to average-earnings assets | 72.16 | % | | | | 71.75 | % | | | | 71.71 | % | | |
| Average portfolio loans to average total deposits | 79.16 | % | | | | 78.58 | % | | | | 78.11 | % | | |
| Average non-interest deposits to average total deposits | 34.02 | % | | | | 33.52 | % | | | | 35.70 | % | | |
| Average interest-earning assets to average interest-bearing liabilities | 157.04 | % | | | | 155.29 | % | | | | 159.48 | % | | |
1Interest income includes loan fees. Loan fees recognized during the period and included in the yield calculation totaled $3.0 million, $3.2 million and $3.1 million for 2018, 2017 and 2016, respectively.
2Nonaccrual loans are included with a zero effective yield. Average nonaccrual loans included in the computation of the average loans were $17.5 million, $18.1 million, and $7.2 million in 2018, 2017 and 2016, respectively.
3Consists of investment securities available for sale, investment securities held to maturity, marketable equity securities, and investment in Federal Home Loan Bank stock.
4Consists of interest bearing deposits in other banks and domestic CDs.
The following table sets forth the changes in consolidated net interest income attributable to changes in volume and to changes in interest rates. Changes attributable to the combined effect of volume and interest rate have been allocated proportionately to the changes due to volume and the changes due to interest rate:
|
| | | | | | | | | | | | | | | | | | |
| | 2018 compared to 2017 | 2017 compared to 2016 |
| | Increase (decrease) due to | Increase (decrease) due to |
| (In Thousands) | Volume | Rate | Total | Volume | Rate | Total |
| Interest Income: | | | | | | |
| Loans |
| ($508 | ) |
| $2,733 |
|
| $2,225 |
|
| $238 |
|
| $158 |
|
| $396 |
|
| Loans held for sale | 83 |
| 193 |
| 276 |
| (364 | ) | 232 |
| (132 | ) |
| Long-term investments | (264 | ) | 1,459 |
| 1,195 |
| 123 |
| 575 |
| 698 |
|
| Short term investments | 71 |
| 302 |
| 373 |
| (1 | ) | 229 |
| 228 |
|
| Total interest income |
| ($618 | ) |
| $4,687 |
|
| $4,069 |
|
| ($4 | ) |
| $1,194 |
|
| $1,190 |
|
| Interest Expense: | | | | | | |
| Interest-bearing deposits |
| ($40 | ) |
| $640 |
|
| $600 |
|
| $64 |
|
| ($227 | ) |
| ($163 | ) |
| Borrowings | (35 | ) | (26 | ) | (61 | ) | 6 |
| 26 |
| 32 |
|
| Total interest expense |
| ($75 | ) |
| $614 |
|
| $539 |
|
| $70 |
|
| ($201 | ) |
| ($131 | ) |
Provision for Loan Losses
We recorded a benefit for loan losses in 2018 of $500,000, compared to a provision for loan losses of $3.2 million and $2.3 million in 2017 and 2016, respectively. The loan loss provision decreased in 2018 compared to 2017 primarily due to an improvement in credit quality as nonperforming loans, adversely classified loans, and specific impairment on loans decreased in 2018. The loan loss provision increased in 2017 compared to 2016 primarily due to an increase in nonperforming loans as well as an increase in specific impairment on loans. See the “Allowance for Loan Losses” section under “Financial Condition” and Note 7 of the Notes to Consolidated Financial Statements included in Item 8 of this report for further discussion of these decreases and changes in the Company’s Allowance.
Other Operating Income
The following table details the major components of other operating income for the years ended December 31:
|
| | | | | | | | | | | | | | | | | | | |
| (In Thousands) | 2018 | $ Change | % Change | 2017 | $ Change | % Change | 2016 |
| Other Operating Income | | | | | | | |
| Mortgage banking income |
| $20,844 |
|
| ($2,443 | ) | (10 | )% |
| $23,287 |
|
| ($6,220 | ) | (21 | )% |
| $29,507 |
|
| Employee benefit plan income | — |
| (2,506 | ) | (100 | )% | 2,506 |
| (1,264 | ) | (34 | )% | 3,770 |
|
| Bankcard fees | 2,811 |
| 214 |
| 8 | % | 2,597 |
| (73 | ) | (3 | )% | 2,670 |
|
| Purchased receivable income | 3,255 |
| 280 |
| 9 | % | 2,975 |
| 628 |
| 27 | % | 2,347 |
|
| Service charges on deposit accounts | 1,508 |
| (106 | ) | (7 | )% | 1,614 |
| (384 | ) | (19 | )% | 1,998 |
|
| Commercial servicing revenue | 1,422 |
| 1,050 |
| 282 | % | 372 |
| 50 |
| 16 | % | 322 |
|
| Other loan fees | 584 |
| 18 |
| 3 | % | 566 |
| 38 |
| 7 | % | 528 |
|
| Rental income | 692 |
| 160 |
| 30 | % | 532 |
| 108 |
| 25 | % | 424 |
|
| Gain on loans acquired - APB | 257 |
| 68 |
| 36 | % | 189 |
| 18 |
| 11 | % | 171 |
|
| Gain (loss) on sale of securities | — |
| (11 | ) | (100 | )% | 11 |
| 22 |
| (200 | )% | (11 | ) |
| Gain on sale of Northrim Benefits Group | — |
| (4,445 | ) | NM |
| 4,445 |
| 4,445 |
| NM |
| — |
|
| Loss on marketable equity securities | (625 | ) | (625 | ) | NM |
| — |
| — |
| NM |
| — |
|
| Other income | 1,419 |
| 39 |
| 3 | % | 1,380 |
| (157 | ) | (10 | )% | 1,537 |
|
| Total other operating income |
| $32,167 |
|
| ($8,307 | ) | (21 | )% |
| $40,474 |
|
| ($2,789 | ) | (6 | )% |
| $43,263 |
|
2018 Compared to 2017
The most significant changes in other operating income in 2018 were decreases in mortgage banking income and employee benefit plan income, as well as a $4.4 million decrease in gain on the sale of our interest in the assets of NBG. Mortgage banking income consists of gross income from the origination and sale of mortgages as well as mortgage loan servicing fees and is the largest component of other operating income at 65% of total other operating income in 2018. Mortgage banking income decreased in 2018 compared to 2017 mainly due to a decrease in the yield and amount of mortgage loans originated and sold as this volume decreased to $528 million in 2018 from $554 million in 2017. The overall decline in mortgage originations is primarily the result of the slowing of the Alaskan economy and rising interest rates while yields have decreased due to market competition. Employee benefit plan income decreased in 2018 compared to 2017 due to the sale of the assets of NBG in August 2017. Lastly, the Company recorded for the first time in other operating income the fair value of its commercial loan servicing portfolio of $1.0 million. Going forward, only changes in the fair value of the Company's commercial loan servicing portfolio will be reflected in other operating income and are not expected to be material to the Company's net income.
2017 Compared to 2016
The most significant changes in other operating income in 2017 were decreases in mortgage banking income and employee benefit plan income, which were partially offset by a $4.4 million gain on the sale of our interest in the assets of NBG. Mortgage banking income decreased in 2017 compared to 2016 mainly due to a decrease in mortgage loans originated and sold to $554 million in 2017 from $736 million in 2016.The overall decline in mortgage originations in 2017 was primarily the result of the slowing of the Alaskan economy. Employee benefit plan income decreased in 2017 compared to 2016 primarily due to the sale of our interest in the assets of NBG in August 2017. Lastly, purchased receivable income increased mostly due to higher yields and balances in 2017 compared to 2016 and service charges on deposit accounts decreased primarily due to lower non-sufficient funds fees.
Other Operating Expense
The following table details the major components of other operating expense for the years ended December 31:
|
| | | | | | | | | | | | | | | | | | | |
| (In Thousands) | 2018 | $ Change | % Change | 2017 | $ Change | % Change | 2016 |
| Other Operating Expense | | | | | | | |
| Salaries and other personnel expense |
| $44,650 |
|
| ($71 | ) | — | % |
| $44,721 |
|
| ($2,031 | ) | (4 | )% |
| $46,752 |
|
| Occupancy expense | 6,136 |
| (616 | ) | (9 | )% | 6,752 |
| 290 |
| 4 | % | 6,462 |
|
| Data processing expense | 6,035 |
| 486 |
| 9 | % | 5,549 |
| 670 |
| 14 | % | 4,879 |
|
| Marketing expense | 2,318 |
| (248 | ) | (10 | )% | 2,566 |
| 117 |
| 5 | % | 2,449 |
|
| Professional and outside services | 2,453 |
| 88 |
| 4 | % | 2,365 |
| (432 | ) | (15 | )% | 2,797 |
|
| Insurance expense | 862 |
| (299 | ) | (26 | )% | 1,161 |
| 138 |
| 13 | % | 1,023 |
|
| Intangible asset amortization | 70 |
| (30 | ) | (30 | )% | 100 |
| (35 | ) | (26 | )% | 135 |
|
| Loss on sale of premise and equipment | 2 |
| (1 | ) | NM |
| 3 |
| (349 | ) | (99 | )% | 352 |
|
| Compensation expense - RML acquisition payments | — |
| (130 | ) | (100 | )% | 130 |
| (4,645 | ) | (97 | )% | 4,775 |
|
| OREO (income) expense, net rental income and gains on sale: | |
| OREO operating expense | 802 |
| 382 |
| 91 | % | 420 |
| 116 |
| 38 | % | 304 |
|
| Impairment on OREO | — |
| (904 | ) | (100 | )% | 904 |
| 717 |
| 383 | % | 187 |
|
| Rental income on OREO | (541 | ) | (425 | ) | (366 | )% | (116 | ) | (18 | ) | (18 | )% | (98 | ) |
| Gains on sale of OREO | (3 | ) | 368 |
| 99 | % | (371 | ) | (76 | ) | (26 | )% | (295 | ) |
| Subtotal | 258 |
| (579 | ) | 69 | % | 837 |
| 739 |
| 754 | % | 98 |
|
| Other expenses | 7,016 |
| 47 |
| 1 | % | 6,969 |
| 411 |
| 6 | % | 6,558 |
|
| Total other operating expense |
| $69,800 |
|
| ($1,353 | ) | (2 | )% |
| $71,153 |
|
| ($5,127 | ) | (7 | )% |
| $76,280 |
|
2018 Compared to 2017
Other operating expense decreased in 2018 as compared to the prior year primarily due to decreases in occupancy expense and OREO expense, net of OREO gains on sale and rental income. In 2018, occupancy expense included a one-time technical correction that decreased depreciation expense by $670,000. OREO expenses net of gains and rental income decreased due to no impairment charges on OREO properties in 2018 and an increase in rental income on OREO properties associated with one commercial property. These decreases were partially offset by increases in OREO operating costs associated with the commercial property, and lower gains on the sale of OREO properties in 2018. Lastly, salaries and other personnel expense in the Home Mortgage Lending segment decreased $935,000 in 2018 as compared to 2017, primarily due to a reduction in full-time equivalent employees as mortgage origination volume has declined. This decrease was offset by an $864,000 increase in salaries and other personnel expense in the Community Banking segment in 2018 compared to 2017, primarily due to an increase in full time equivalent employees and an increase in benefits costs associated with the Company's self-insured group health plan due to higher medical claims.
2017 Compared to 2016
Other operating expense decreased in 2017 as compared to the prior year primarily due to decreased costs in compensation expense - RML acquisition payments and salaries and other personnel expense, and, to a lesser extent, professional and outside services expense and loss on sale of premises and equipment. Compensation expense - RML acquisition payments decreased $4.6 million in 2017 as compared to 2016 due in part to the fact that 2016 included a $2.3 million non-cash error correction that covered the period from December 1, 2014, through June 30, 2016. The remainder of the decrease in compensation expense - RML acquisition payments resulted from a decrease in net income from RML. Salaries and other personnel expense decreased primarily due to lower originator commission expense in the Home Mortgage Lending segment due to lower home mortgage loan originations. These decreases were partially offset by increases in impairment on OREO expense and data processing expense in 2017 compared to 2016. Impairment on OREO increased in 2017 as compared to 2016 due to writedowns on two OREO properties resulting from a decrease in sales price assumptions. Data processing expense increased in 2017 as compared to 2016 mostly due to higher software amortization and maintenance expense.
Income Taxes
The provision for income taxes decreased $6.3 million or 61%, to $4.1 million in 2018 as compared to 2017 and increased $4.3 million or 71%, to $10.3 million in 2017 as compared to 2016. The decrease in 2018 is primarily due to a decrease in the corporate tax rate included in federal tax legislation enacted in December 2017. In addition to reducing the Company's federal tax rate from 35% in 2017 to 21% in 2018, this change also resulted in $2.7 million in expense in 2017 for the revaluation of the Company's net deferred tax asset. In 2018, the Company finalized its valuation of net deferred tax assets related to the decrease in the federal tax rate after completing a fixed asset cost segregation study for tax planning purposes which resulted in a $470,000 decrease in tax expense. The Company's effective tax rates were 17%, 43%, and 29% in 2018, 2017, and 2016, respectively. The changes in the Company's effective tax rates for 2018 and 2017 are primarily due to the items discussed regarding the changes in tax expense for these periods.
FINANCIAL CONDITION
Investment Securities
The composition of our investment securities portfolio, which includes securities available for sale, securities held to maturity, and marketable equity securities, reflects management’s investment strategy of maintaining an appropriate level of liquidity while providing a relatively stable source of interest income. The investment securities portfolio also mitigates interest rate and credit risk inherent in the loan portfolio, while providing a vehicle for the investment of available funds, a source of liquidity (by pledging as collateral or through repurchase agreements), and collateral for certain public funds deposits. Investment securities designated as available for sale comprised 97% of the portfolio as of December 31, 2018 and are available to meet liquidity requirements.
Our investment portfolio consists primarily of government sponsored entity securities, corporate securities, and municipal securities. Investment securities at December 31, 2018 decreased $33.9 million, or 11%, to $278.9 million from $312.8 million at December 31, 2017. The decrease at December 31, 2018 as compared to December 31, 2017 is primarily due to a portion of the proceeds from sales, maturities, and security calls being reinvested in loans as of December 31, 2018. The average maturity of the investment portfolio was approximately two and a half years at December 31, 2018.
Investment securities may be pledged as collateral to secure public deposits or borrowings. At December 31, 2018 and 2017, $58.4 million and $51.6 million in securities were pledged for deposits and borrowings, respectively. Pledged securities increased at December 31, 2018 as compared to December 31, 2017 because the Company had increased balances in tri-party accounts at December 31, 2018.
The following tables set forth the composition of our investment portfolio at December 31 for the years indicated:
|
| | | | | | | |
| (In Thousands) | Amortized Cost |
| Fair Value |
| Securities Available for Sale: | |
|
| |
|
| 2018: | |
|
| |
|
| U.S. Treasury and government sponsored entities |
| $209,908 |
|
|
| $208,860 |
|
| Municipal Securities | 9,089 |
|
| 9,084 |
|
| Corporate Bonds | 40,139 |
|
| 39,780 |
|
| Collateralized Loan Obligations | 13,990 |
| | 13,886 |
|
| Total |
| $273,126 |
|
|
| $271,610 |
|
| 2017: | |
|
| |
|
| U.S. Treasury and government sponsored entities |
| $250,794 |
|
|
| $249,461 |
|
| Municipal Securities | 14,395 |
|
| 14,421 |
|
| Corporate Bonds | 36,654 |
|
| 37,132 |
|
| Collateralized Loan Obligations | 6,000 |
| | 6,005 |
|
| Preferred Stock | 5,422 |
|
| 5,731 |
|
| Total |
| $313,265 |
|
|
| $312,750 |
|
| 2016: | |
|
| |
|
| U.S. Treasury and government sponsored entities |
| $264,267 |
|
|
| $263,361 |
|
| Municipal Securities | 18,184 |
|
| 18,157 |
|
| U.S. Agency Mortgage-backed Securities | 2 |
|
| 2 |
|
| Corporate Bonds | 44,437 |
|
| 44,732 |
|
| Preferred Stock | 4,922 |
|
| 4,967 |
|
| Total |
| $331,812 |
|
|
| $331,219 |
|
| Marketable Equity Securities: | | | |
| 2018: | | | |
| Preferred Stock |
| $7,580 |
| |
| $7,265 |
|
| Total |
| $7,580 |
| |
| $7,265 |
|
| 2017: | | | |
| Preferred Stock |
| $— |
| |
| $— |
|
| Total |
| $— |
| |
| $— |
|
| 2016: | | | |
| Preferred Stock |
| $— |
| |
| $— |
|
| Total |
| $— |
| |
| $— |
|
| Securities Held to Maturity: | |
|
| |
|
| 2018: | |
|
| |
|
| Municipal Securities |
| $— |
|
|
| $— |
|
| Total |
| $— |
|
|
| $— |
|
| 2017: | |
|
| |
|
| Municipal Securities |
| $— |
|
|
| $— |
|
| Total |
| $— |
|
|
| $— |
|
| 2016: | |
|
| |
|
| Municipal Securities |
| $899 |
|
|
| $922 |
|
| Total |
| $899 |
|
|
| $922 |
|
The following table sets forth the market value, maturities, and weighted average pretax yields of our investment portfolio as of December 31, 2018:
|
| | | | | | | | | | | | | | | |
| | Maturity |
| | Within | | | Over | |
| (In Thousands) | 1 Year | 1-5 Years | 5-10 Years | 10 Years | Total |
| Securities Available for Sale: | | | | | |
| U.S. Treasury and government sponsored entities | |
| |
| |
| |
| |
|
| Balance |
| $67,798 |
|
| $141,062 |
|
| $— |
|
| $— |
|
| $208,860 |
|
| Weighted average yield | 1.41 | % | 2.36 | % | — | % | — | % | 2.05 | % |
| Municipal securities | |
| |
| |
| |
| |
|
| Balance |
| $1,861 |
|
| $7,223 |
|
| $— |
|
| $— |
|
| $9,084 |
|
| Weighted average yield | 1.64 | % | 2.64 | % | — | % | — | % | 2.43 | % |
| Corporate bonds | |
| |
| |
| |
| |
|
| Balance |
| $— |
|
| $30,103 |
|
| $9,677 |
|
| $— |
|
| $39,780 |
|
| Weighted average yield | — | % | 3.45 | % | 3.51 | % | — | % | 3.46 | % |
| Collateralized loan obligations | | | | | |
| Balance |
| $— |
|
| $— |
|
| $2,990 |
|
| $10,896 |
|
| $13,886 |
|
| Weighted average yield | — | % | — | % | 3.86 | % | 3.78 | % | 3.80 | % |
| Total | |
| |
| |
| |
| |
|
| Balance |
| $69,659 |
|
| $178,388 |
|
| $12,667 |
|
| $10,896 |
|
| $271,610 |
|
| Weighted average yield | 1.41 | % | 2.55 | % | 3.59 | % | 3.78 | % | 2.36 | % |
| Marketable Equity Securities | |
| |
| |
| |
| |
|
| Preferred Stock |
|
|
|
|
|
|
|
|
|
|
| Balance |
| $— |
|
| $— |
|
| $— |
|
| $7,265 |
|
| $7,265 |
|
| Weighted average yield | — | % | — | % | — | % | 4.75 | % | 4.75 | % |
The Company’s investment in marketable equity securities does not have a maturity date but it has been included in the over 10 years column above. At December 31, 2018, we held no securities of any single issuer (other than government sponsored entities) that exceeded 10% of our shareholders’ equity.
Loans
Our loan products include short and medium-term commercial loans, commercial credit lines, construction and real estate loans, and consumer loans. To a lesser extent, through our wholly-owned subsidiary RML, we also originate mortgage loans which we sell to the secondary market. We also retain servicing rights on mortgage loans originated by RML and sold to the Alaska Housing Finance Corporation ("AHFC"). We emphasize providing financial services to small and medium-sized businesses and to individuals. From our inception, we have emphasized commercial, land development and home construction, and commercial real estate lending. These types of lending have provided us with needed market opportunities and generally provide higher net interest margins compared to other types of lending such as consumer lending. However, they also involve greater risks, including greater exposure to changes in local economic conditions.
All of our loans and credit lines are subject to approval procedures and amount limitations. These limitations apply to the borrower’s total outstanding indebtedness and commitments to us, including the indebtedness of any guarantor. Generally, we are permitted to make loans to one borrower of up to 15% of the unimpaired capital and surplus of the Bank. The loan-to-one-borrower limitation for the Bank was $27.9 million at December 31, 2018. At December 31, 2018, the Company had two relationships whose total direct and indirect commitments exceeded $27.9 million; however, no individual direct relationship exceeded the loans-to-one borrower limitation. See “Management’s Discussion and Analysis of Financial Condition and Results of Operations – Provision for Loan Losses” for further discussion of the Company's concentration of loans to large borrowers.
Our lending operations are guided by loan policies, which outline the basic policies and procedures by which lending operations are conducted. Generally, the policies address our desired loan types, target markets, underwriting and collateral
requirements, terms, interest rate and yield considerations, and compliance with laws and regulations. The policies are reviewed and approved annually by the board of directors of the Bank. Our Quality Assurance Department provides a detailed financial analysis of our largest, most complex loans. In addition, the Quality Assurance Department, along with the Senior Credit Officer of the Bank, have developed processes to analyze and manage various concentrations of credit within the overall loan portfolio. The Credit Administration Department monitors the procedures and processes for both the analysis and reporting of problem loans, and also develops strategies to resolve problem loans based on the facts and circumstances for each loan. Finally, our Internal Audit Department also performs an independent review of each loan portfolio for compliance with loan policy as well as a review of credit quality. The Internal Audit review follows the FDIC sampling guidelines, and a review of each portfolio is performed on an annual basis.
The following table sets forth the composition of our loan portfolio by loan segment:
|
| | | | | | | | | | | | | | | | | | | | | | | | | |
| | December 31, 2018 | December 31, 2017 | December 31, 2016 | December 31, 2015 | December 31, 2014 |
| | Dollar Amount | Percent of Total | Dollar Amount | Percent of Total | Dollar Amount | Percent of Total | Dollar Amount | Percent of Total | Dollar Amount | Percent of Total |
| (In Thousands) |
| Commercial |
| $342,420 |
| 34.8 | % |
| $313,514 |
| 32.8 | % |
| $277,802 |
| 28.5 | % |
| $271,946 |
| 27.8 | % |
| $271,986 |
| 29.5 | % |
| Real estate construction one-to-four family | 37,111 |
| 3.8 | % | 31,201 |
| 3.3 | % | 26,061 |
| 2.7 | % | 44,488 |
| 4.5 | % | 34,842 |
| 3.8 | % |
| Real estate construction other | 72,256 |
| 7.3 | % | 80,093 |
| 8.4 | % | 72,159 |
| 7.4 | % | 74,956 |
| 7.7 | % | 91,162 |
| 9.9 | % |
| Real estate term owner occupied | 126,414 |
| 12.8 | % | 132,042 |
| 13.8 | % | 152,112 |
| 15.6 | % | 143,667 |
| 14.7 | % | 120,621 |
| 13.1 | % |
| Real estate term non-owner occupied | 325,720 |
| 33.1 | % | 319,313 |
| 33.4 | % | 356,411 |
| 36.6 | % | 347,284 |
| 35.4 | % | 301,544 |
| 32.7 | % |
| Real estate term other | 42,039 |
| 4.3 | % | 40,411 |
| 4.2 | % | 45,402 |
| 4.7 | % | 46,672 |
| 4.8 | % | 44,385 |
| 4.8 | % |
| Consumer secured by 1st deeds of trust | 19,228 |
| 2.0 | % | 22,616 |
| 2.4 | % | 23,280 |
| 2.4 | % | 26,369 |
| 2.7 | % | 31,640 |
| 3.4 | % |
| Consumer other | 23,645 |
| 2.4 | % | 19,919 |
| 2.1 | % | 25,281 |
| 2.6 | % | 28,912 |
| 3.0 | % | 31,493 |
| 3.4 | % |
| Subtotal |
| $988,833 |
| |
| $959,109 |
| |
| $978,508 |
| |
| $984,294 |
| |
| $927,673 |
| |
| Less: Unearned origination fee, | | | | | | | | | | |
| net of origination costs | (4,487 | ) | (0.5 | )% | (4,156 | ) | (0.4 | )% | (4,434 | ) | (0.5 | )% | (4,612 | ) | (0.5 | )% | (4,551 | ) | (0.5 | )% |
| Total portfolio loans |
| $984,346 |
| |
| $954,953 |
| |
| $974,074 |
| |
| $979,682 |
| |
| $923,122 |
| |
Commercial Loans: Our commercial loan portfolio includes both secured and unsecured loans for working capital and expansion. Short-term working capital loans generally are secured by accounts receivable, inventory, or equipment. We also make longer-term commercial loans secured by equipment and real estate. We also make commercial loans that are guaranteed in large part by the Small Business Administration or the Bureau of Indian Affairs and to a lesser extent guaranteed by the United States Department of Agriculture, as well as commercial real estate loans that are purchased by the Alaska Industrial Development and Export Authority (“AIDEA”). Commercial loans increased to $342.4 million at December 31, 2018 from $313.5 million at December 31, 2017 and represented approximately 35% and 33% of our total loans outstanding as of December 31, 2018 and December 31, 2017, respectively. Commercial loans reprice more frequently than other types of loans, such as real estate loans. More frequent repricing means that interest cash flows from commercial loans are more sensitive to changes in interest rates. In a rising interest rate environment, our philosophy is to emphasize the pricing of loans on a floating rate basis, which allows these loans to reprice more frequently and to contribute positively to our net interest margin.
Commercial Real Estate:We are an active lender in the commercial real estate market. At December 31, 2018, commercial real estate loans increased to $494.2 million from $491.8 million at December 31, 2017, and represented approximately 50% and 52% of our loan portfolio as of December 31, 2018 and December 31, 2017, respectively. These loans are typically secured by office buildings, apartment complexes or warehouses. Loan amortization periods range from 10 to 25 years and generally have a maximum maturity of 10 years.
We may sell all or a portion of a commercial real estate loan to two State of Alaska entities, AIDEA and AHFC, which were both established to provide long-term financing in the State of Alaska. The loans that AIDEA purchases typically feature a maturity twice that of the loans retained by us and bear a lower interest rate. The blend of our and AIDEA’s loan terms allows us to provide competitive long-term financing to our customers, while reducing the risk inherent in this type of lending. We also originate and sell to AHFC loans secured by multifamily residential units. Typically, 100% of these loans are sold to AHFC and we provide ongoing servicing of the loans for a fee. AIDEA and AHFC make it possible for us to originate these commercial real estate loans and enhance fee income while reducing our exposure to interest rate risk.
Construction Loans:We provide construction lending for commercial real estate projects. Such loans generally are made only when the Company has also committed to finance the completed project with a commercial real estate loan, or if there is a firm
take-out commitment upon completion of the project by a third party lender. Additionally, we provide land development and residential subdivision construction loans. We also originate one-to-four-family residential and condominium construction loans to builders for construction of homes. The Company’s construction loans decreased in 2018 to $109.4 million, down from $111.3 million in 2017, and represented approximately 11% and 12% of our loan portfolio in December 31, 2018 and December 31, 2017, respectively. As of December 31, 2018, approximately $43.1 million or 39%, of the Company's construction loans were for low income housing tax credit projects as compared to $30.5 million or 27% as of December 31, 2017.
Consumer Loans:We provide personal loans for automobiles, recreational vehicles, boats, and other larger consumer purchases. We provide both secured and unsecured consumer credit lines to accommodate the needs of our individual customers, with home equity lines of credit serving as the major product in this area.
Loans Directly Exposed to the Oil and Gas Industry: The Company defines "direct exposure" to the oil and gas industry as companies that it has identified as significantly reliant upon activity related to the oil and gas industry, such as oil producers or drilling and exploration companies, and companies who provide oilfield services, lodging, equipment rental, transportation, and other logistic services specific to the industry. The Company estimates that $62.3 million, or approximately 6% of loans as of December 31, 2018 have direct exposure to the oil and gas industry as compared to $70.8 million, or approximately 7% of loans as of December 31, 2017. The Company has no loans to oil producers or drilling and exploration companies as of the end of 2018 or 2017, but the $62.3 million outstanding as of December 31, 2018 noted above does include $9.6 million related to the construction of an oil rig. The Company's unfunded commitments to borrowers that have direct exposure to the oil and gas industry were $32.5 million and $53.5 million at December 31, 2018 and 2017, respectively. The portion of the Company's allowance for loan losses that related to the loans with direct exposure to the oil and gas industry was estimated at $1.4 million and $1.8 million as of December 31, 2018 and 2017, respectively.
The following table details loan balances by loan segment asset quality rating ("AQR") and class of financing receivable for loans with direct oil and gas exposure as of the dates indicated:
|
| | | | | | | | | | | | | | | | | | | | | | | | | | | | | | | | | | | |
| (In Thousands) | Commercial | | Real estate construction one-to-four family | | Real estate construction other | | Real estate term owner occupied | | Real estate term non-owner occupied | | Real estate term other | | Consumer secured by 1st deeds of trust | | Consumer other | | Total |
| December 31, 2018 | | | | | | | | | | | | | | | | | |
| AQR Pass |
| $44,512 |
| |
| $— |
| |
| $— |
| |
| $5,216 |
| |
| $— |
| |
| $— |
| |
| $— |
| |
| $399 |
| |
| $50,127 |
|
| AQR Special Mention | 857 |
| | — |
| | — |
| | 2,242 |
| | 7,364 |
| | — |
| | — |
| | — |
| | 10,463 |
|
| AQR Substandard | 1,723 |
| | — |
| | — |
| | — |
| | — |
| | — |
| | — |
| | — |
| | 1,723 |
|
| Total loans |
| $47,092 |
| |
| $— |
| |
| $— |
| |
| $7,458 |
| |
| $7,364 |
| |
| $— |
| |
| $— |
| |
| $399 |
| |
| $62,313 |
|
| December 31, 2017 | | | | | | | | | | | | | | | | | |
| AQR Pass |
| $48,601 |
| |
| $— |
| |
| $— |
| |
| $9,731 |
| |
| $7,778 |
| |
| $— |
| |
| $— |
| |
| $435 |
| |
| $66,545 |
|
| AQR Substandard |
| $4,234 |
| |
| $— |
| |
| $— |
| |
| $— |
| |
| $— |
| |
| $— |
| |
| $— |
| |
| $— |
| |
| $4,234 |
|
| Total loans |
| $52,835 |
| |
| $— |
| |
| $— |
| |
| $9,731 |
| |
| $7,778 |
| |
| $— |
| |
| $— |
| |
| $435 |
| |
| $70,779 |
|
Maturities and Sensitivities of Loans to Change in Interest Rates: The following table presents the aggregate maturity data of our loan portfolio, excluding loans held for sale, at December 31, 2018:
|
| | | | | | | | | | | | |
| | Maturity | |
| (In Thousands) | Within 1 Year | 1-5 Years | Over 5 Years | Total |
| Commercial |
| $146,127 |
|
| $81,009 |
|
| $115,284 |
|
| $342,420 |
|
| Real estate construction one-to-four family | 36,367 |
| 744 |
| — |
| 37,111 |
|
| Real estate construction other | 43,005 |
| 19,092 |
| 10,159 |
| 72,256 |
|
| Real estate term owner occupied | 8,966 |
| 22,979 |
| 94,469 |
| 126,414 |
|
| Real estate term non-owner occupied | 27,801 |
| 119,627 |
| 178,292 |
| 325,720 |
|
| Real estate term other | 9,442 |
| 11,392 |
| 21,205 |
| 42,039 |
|
| Consumer secured by 1st deeds of trust | 55 |
| 1,766 |
| 17,407 |
| 19,228 |
|
| Consumer other | 1,477 |
| 5,576 |
| 16,592 |
| 23,645 |
|
| Total |
| $273,240 |
|
| $262,185 |
|
| $453,408 |
|
| $988,833 |
|
| Fixed interest rate |
| $113,168 |
|
| $82,084 |
|
| $57,591 |
|
| $252,843 |
|
| Floating interest rate | 160,072 |
| 180,101 |
| 395,817 |
| 735,990 |
|
| Total |
| $273,240 |
|
| $262,185 |
|
| $453,408 |
|
| $988,833 |
|
At December 31, 2018, 61% of the portfolio was scheduled to mature or reprice in 2019 with 36% scheduled to mature or reprice between 2020 and 2023.
As of December 31, 2018, approximately 70% of commercial loans are variable rate loans, of which 69% reprice within one year. The majority of these loans reprice to an index based upon the prime rate of interest or the respective Federal Home Loan Bank of Boston (the "Boston FHLB") rate. The Company also uses floors in its commercial loan pricing as loans are originated or renewed during the year.
At December 31, 2018, the interest rates for approximately 85% of commercial real estate loans are variable, of which 52% reset within one year. Approximately 42% of commercial real estate variable rate loans reprice in greater than one year but within three years. The indices for these loans include the prime rate of interest or the respective Treasury or Boston FHLB rate. The Company also uses floors in its commercial real estate loan pricing as loans are originated or renewed during the year.
Loans Held for Sale and Mortgage Servicing Rights: The Company originates residential mortgage loans and sells them in the secondary market through our wholly-owned subsidiary, RML. All residential mortgage loans originated and sold in 2018 and 2017 were newly originated loans that did not affect nonperforming loans. The Company also has a mortgage servicing portfolio which is comprised of 1-4 family loans serviced for Freddie Mac Home Loan Corporation ("FHLMC") and AHFC. The Company retains servicing rights on all mortgage loans originated by RML and sold to AHFC. Mortgages originated by RML and sold to AHFC represent approximately 32% and 26% of the mortgages originated by RML in 2018 and 2017, respectively. Mortgage servicing rights are adjusted to fair value quarterly with the change recorded in mortgage banking income. The value of mortgage servicing rights is impacted by market rates for mortgage loans primarily due to how changes in interest rates affect prepayments of mortgage loans. To the extent loans are prepaid sooner than estimated at the time servicing assets are originally recorded, it is possible that certain residential mortgage servicing rights assets may decrease in value. Generally, the fair value of our residential mortgage servicing rights are expected to increase as market rates for mortgage loans rise and decrease if market rates fall.
Credit Quality and Nonperforming Assets
Nonperforming assets consist of nonaccrual loans, accruing loans that are 90 days or more past due, repossessed assets and OREO. The following table sets forth information regarding our nonperforming loans and total nonperforming assets:
|
| | | | | | | | | | | | | | | |
| (In Thousands) | 2018 | 2017 | 2016 | 2015 | 2014 |
| Nonperforming loans | | | | | |
| Nonaccrual loans |
| $15,210 |
|
| $21,626 |
|
| $13,893 |
|
| $3,686 |
|
| $4,674 |
|
| Loans 90 days past due and accruing | — |
| 252 |
| 456 |
| — |
| — |
|
| Government guarantees on nonperforming loans | (516 | ) | (467 | ) | (1,413 | ) | (1,561 | ) | (1,178 | ) |
| Net nonperforming loans |
| $14,694 |
|
| $21,411 |
|
| $12,936 |
|
| $2,125 |
|
| $3,496 |
|
| Other real estate owned | 7,962 |
| 8,651 |
| 6,574 |
| 3,053 |
| 4,607 |
|
| Repossessed assets | 1,242 |
| — |
| — |
| — |
| 19 |
|
| Other real estate owned guaranteed by government | (1,279 | ) | (1,333 | ) | (195 | ) | — |
| (891 | ) |
| Net nonperforming assets |
| $22,619 |
|
| $28,729 |
|
| $19,315 |
|
| $5,178 |
|
| $7,231 |
|
| | | | | | |
Nonperforming loans, net of government guarantees
to portfolio loans | 1.49 | % | 2.24 | % | 1.33 | % | 0.22 | % | 0.38 | % |
| Nonperforming assets, net of government guarantees to total assets | 1.50 | % | 1.89 | % | 1.27 | % | 0.35 | % | 0.50 | % |
| | | | | | |
| Performing restructured loans |
| $3,413 |
|
| $7,668 |
|
| $6,131 |
|
| $11,804 |
|
| $5,353 |
|
| | | | | | |
| Nonperforming loans plus performing restructured loans, net of government guarantees |
| $18,107 |
|
| $29,079 |
|
| $19,067 |
|
| $13,929 |
|
| $8,849 |
|
| Nonperforming loans plus performing restructured loans to portfolio loans, net of government guarantees | 1.84 | % | 3.05 | % | 1.96 | % | 1.42 | % | 0.96 | % |
| Nonperforming assets plus performing restructured loans to total assets, net of government guarantees | 1.73 | % | 2.40 | % | 1.67 | % | 1.13 | % | 0.87 | % |
| | | | | | |
| Adversely classified loans, net of government guarantees |
| $27,217 |
|
| $33,845 |
|
| $35,634 |
|
| $30,825 |
|
| $5,878 |
|
| Loans 30-89 days past due and accruing, net of government guarantees to portfolio loans | 0.36 | % | 0.22 | % | 0.22 | % | 0.12 | % | — | % |
| | | | | | |
| Allowance for loan losses to portfolio loans | 1.98 | % | 2.25 | % | 2.02 | % | 1.85 | % | 1.81 | % |
| Allowance for loan losses to nonperforming loans, net of government guarantees | 133 | % | 100 | % | 152 | % | 854 | % | 478 | % |
The Company’s nonperforming loans, net of government guarantees decreased in 2018 to $14.7 million as compared to $21.4 million in 2017. This decrease was due to the transfer of one borrowing relationship to repossessed assets, principal paydowns including one large nonaccrual loan payoff, and charge-offs on nonaccrual loans in 2018. There was interest income of $213,000, $142,000, and $181,000 recognized in net income for 2018, 2017, and 2016, respectively, related to interest collected on nonaccrual loans whose principal has been paid down to zero. The Company had five relationships that represented more than 10% of nonaccrual loans as of December 31, 2018.
The Company had $3.4 million and $7.7 million in loans classified as troubled debt restructuring loans ("TDRs") that were performing as of December 31, 2018 and 2017, respectively. Additionally, there were $11.4 million and $16.2 million in TDRs included in nonaccrual loans at December 31, 2018 and 2017 for total TDRs of $14.8 million and $23.8 million at December 31, 2018 and 2017, respectively. The decrease in TDRs at December 31, 2018 as compared to 2017 was primarily due to several payoffs and paydowns on loans classified as TDRs that were only partially offset by additions to TDRs in 2018. See Note 6 of the Notes to Consolidated Financial Statements included in Item 8 of this report for further discussion of TDRs.
At December 31, 2018, management had identified potential problem loans of $17.1 million as compared to potential problem loans of $9.5 million at December 31, 2017. Potential problem loans are loans which are currently performing that have developed negative indications that the borrower may not be able to comply with present payment terms and which may later be
included in nonaccrual, past due, or impaired loans. The $7.6 million increase in potential problem loans at December 31, 2018 from December 31, 2017 was primarily due to the addition of three relationships totaling $9.1 million. These increases were partially offset by the payoff of one loan totaling $883,000 and other loan paydowns in 2018.
The Company acquired other assets consisting of aircraft totaling $1.2 million in the fourth quarter of 2018 through foreclosure proceedings related to one lending relationship.
The following summarizes OREO activity for the periods indicated:
|
| | | | | | | | | |
| (In Thousands) | 2018 | 2017 | 2016 |
| Balance, beginning of the year |
| $8,651 |
|
| $6,574 |
|
| $3,053 |
|
| Transfers from loans | 686 |
| 5,912 |
| 4,036 |
|
| Investment in other real estate owned | 144 |
| — |
| 311 |
|
| Proceeds from the sale of other real estate owned | (1,522 | ) | (3,302 | ) | (934 | ) |
| Gain on sale of other real estate owned, net | 3 |
| 371 |
| 295 |
|
| Impairment on other real estate owned | — |
| (904 | ) | (187 | ) |
| Balance, end of year | 7,962 |
| 8,651 |
| 6,574 |
|
| Government guarantees | (1,279 | ) | (1,333 | ) | (195 | ) |
| Balance, end of year, net of government guarantees |
| $6,683 |
|
| $7,318 |
|
| $6,379 |
|
At December 31, 2018 and 2017 the Company held $6.7 million and $7.3 million, respectively, of OREO assets, net of government guarantees. At December 31, 2018, OREO consists of $2.2 million in residential lots in various stages of development, a $151,000 single-family residence, and a $5.6 million commercial building. All OREO property is located in Alaska. The Bank initiates foreclosure proceedings to recover and sell collateral pledged by a debtor to secure a loan based on various events of default and circumstances related to loans that are secured by either commercial or residential real property. These events and circumstances include delinquencies, the Company’s relationship with the borrower, and the borrower’s ability to repay the loan via a source other than the collateral. If the loan has not yet matured, the debtors may cure the events of default up to the time of sale to retain their interest in the collateral. Failure to cure the defaults will result in the debtor losing ownership interest in the property, which is taken by the creditor, or high bidder at a foreclosure sale.
During 2018, additions to OREO totaled $686,000 which included four single-family residences. During 2018, the Company received approximately $1.5 million in proceeds from the sale of OREO which included $806,000 from the sale of lots and land, $645,000 from the sale of single-family residences, and $71,000 from the sale of a commercial building. The Company recognized $144,000, $391,000, and $295,000 in gains and $141,000, $19,000, and $0 in losses on the sale of OREO properties in 2018, 2017, and 2016, respectively, for net gains of $3,000, $371,000, and $295,000 in 2018, 2017, and 2016, respectively. The Company had remaining accumulated deferred gains on the sale of OREO properties of $262,000 at both December 31, 2018 and 2017.
The Company did not make any loans to facilitate the sale of OREO in 2018, 2017, or 2016. Our underwriting policies and procedures for loans to facilitate the sale of OREO are no different than our standard loan policies and procedures.
The Company recognized impairments of zero, $904,000 and $187,000 in 2018, 2017, and 2016, respectively, due to adjustments to the Company’s estimate of the fair value of certain properties based on changes in estimated costs to complete the projects, decrease in expected sales prices, and changes in the Anchorage, Fairbanks, and the Southeastern Alaska real estate markets.
Allowance for Loan Losses
The Company maintains an Allowance to reflect management's assessment of probable, estimable losses inherent in the loan portfolio. The Allowance is increased by provisions for loan losses and loan recoveries and decreased by loan charge-offs. The size of the Allowance is determined through quarterly assessments of probable estimated losses in the loan portfolio. Our methodology for making such assessments and determining the adequacy of the Allowance includes the following key elements:
A specific allocation for impaired loans. Management determines the fair value of the majority of these loans based on the underlying collateral values. This analysis is based upon a specific analysis for each impaired loan, including external appraisals on loans secured by real property, management’s assessment of the current market, recent payment history, and an evaluation of other sources of repayment. In-house evaluations of fair value are used in the impairment analysis in some situations. Inputs to the in-house evaluation process include information about sales of comparable properties in the appropriate markets and changes in tax assessed values. The Company obtains appraisals on real and personal property that secure its loans during the loan origination process in accordance with regulatory guidance and its loan policy. The Company obtains updated appraisals on loans secured by real or personal property based upon its assessment of changes in the current market or particular projects or properties, information from other current appraisals, and other sources of information. Appraisals may be adjusted downward by the Company based on its evaluation of the facts and circumstances on a case by case basis. External appraisals may be discounted when management believes that the absorption period used in the appraisal is unrealistic, when expected liquidation costs exceed those included in the appraisal, or when management’s evaluation of deteriorating market conditions warrants an adjustment. Additionally, the Company may also adjust appraisals in the above circumstances between appraisal dates. The Company uses the information provided in these updated appraisals along with its evaluation of all other information available on a particular property as it assesses the collateral coverage on its performing and nonperforming loans and the impact that may have on the adequacy of its Allowance. The specific allowance for impaired loans, as well as the overall Allowance, may increase based on the Company’s assessment of updated appraisals. See Note 24 of the Notes to Consolidated Financial Statements included in Item 8 of this report for further discussion of the Company’s estimation of impaired loans measured at fair value.
When the Company determines that a loss has occurred on an impaired loan, a charge-off equal to the difference between carrying value and fair value is recorded. If a specific allowance is deemed necessary for a loan, and then that loan is partially charged off, the loan remains classified as a nonperforming loan after the charge-off is recognized.
A general allocation - The Company has identified segments and classes of loans not considered impaired for purposes of establishing the general allocation allowance. The Company disaggregates the loan portfolio into segments and classes based on its assessment of how different pools of loans with like characteristics in the portfolio behave over time. This determination is based on historical experience and management’s assessment of how current facts and circumstances are expected to affect the loan portfolio.
The Company first disaggregates the loan portfolio into the following eight segments: commercial, real estate construction one-to-four family, real estate construction other, real estate term owner occupied, real estate term non-owner occupied, real estate term other, consumer secured by 1st deeds of trust, and other consumer loans.
After division of the loan portfolio into segments, the Company then further disaggregates each of the segments into classes. The Company has a total of five classes, which are based off of the Company's loan risk grading system known as the Asset Quality Rating (“AQR”) system. The risk ratings are discussed in Note 6 to the Consolidated Financial Statements included in Item 8 of this report. There are five loan classes: pass (pass AQR grades, which are grades 1 – 6), special mention, substandard, doubtful, and loss. There have been no changes to these loan classes in 2018.
After the portfolio has been disaggregated into segments and classes, the Company calculates a general reserve for each segment and class based on the average loss history for each segment and class. The Company utilizes a look-back period of five years in the calculation of average historical loss rates.
After the Company calculates a general allocation using our loss history, the general reserve is then adjusted for qualitative factors by segment and class. Qualitative factors are based on management’s assessment of current trends that may cause losses inherent in the current loan portfolio to differ significantly from historical losses. Some factors that management considers in determining the qualitative adjustment to the general reserve include our concentration of large borrowers; national and local economic trends; general business conditions; trends in local real estate markets; economic, political, and industry specific factors that affect resource development in Alaska; effects of various political activities; peer group data; and internal factors such as underwriting policies and expertise of the Company’s employees.
An unallocated reserve - The unallocated portion of the Allowance provides for other credit losses inherent in our loan portfolio that may not have been contemplated in the specific and general components of the Allowance, and it acknowledges the inherent imprecision of all loss prediction models. The unallocated component is reviewed
periodically based on trends in credit losses and overall economic conditions. At December 31, 2018 and 2017, the unallocated allowance as a percentage of the total Allowance was 13% and 16%, respectively.
The following table shows the allocation of the Allowance for the years indicated:
|
| | | | | | | | | | | | | | | | | | | | | | | | | |
| | 2018 | 2017 | 2016 | 2015 | 2014 |
| | | % of Loans(1) | | % of Loans(1) | | % of Loans(1) | | % of Loans(1) | | % of Loans(1) |
| (In Thousands) | Amount | Amount | Amount | Amount | Amount |
| Commercial |
| $5,660 |
| 35 | % |
| $6,172 |
| 34 | % |
| $5,535 |
| 28 | % |
| $5,906 |
| 28 | % |
| $5,643 |
| 33 | % |
| Real estate construction one-to-four family | 675 |
| 4 | % | 629 |
| 3 | % | 550 |
| 3 | % | 854 |
| 4 | % | 644 |
| 4 | % |
| Real estate construction other | 1,275 |
| 7 | % | 1,566 |
| 8 | % | 1,465 |
| 7 | % | 1,439 |
| 8 | % | 1,653 |
| 10 | % |
| Real estate term owner occupied | 2,027 |
| 13 | % | 2,194 |
| 14 | % | 2,358 |
| 16 | % | 1,657 |
| 15 | % | 1,580 |
| 12 | % |
| Real estate term non-owner occupied | 5,799 |
| 33 | % | 6,043 |
| 33 | % | 6,853 |
| 37 | % | 5,515 |
| 35 | % | 4,704 |
| 31 | % |
| Real estate term other | 716 |
| 4 | % | 725 |
| 4 | % | 819 |
| 5 | % | 628 |
| 4 | % | 656 |
| 4 | % |
| Consumer secured by 1st deeds of trust | 306 |
| 2 | % | 315 |
| 2 | % | 313 |
| 2 | % | 264 |
| 3 | % | 285 |
| 3 | % |
| Consumer other | 426 |
| 2 | % | 307 |
| 2 | % | 408 |
| 2 | % | 397 |
| 3 | % | 410 |
| 3 | % |
| Unallocated | 2,635 |
| — | % | 3,510 |
| — | % | 1,396 |
| — | % | 1,493 |
| — | % | 1,148 |
| — | % |
| Total |
| $19,519 |
| 100 | % |
| $21,461 |
| 100 | % |
| $19,697 |
| 100 | % |
| $18,153 |
| 100 | % |
| $16,723 |
| 100 | % |
1Represents percentage of this category of loans to total portfolio loans.
The following table sets forth information regarding changes in our Allowance for the years indicated:
|
| | | | | | | | | | | | | | | | | | | |
| (In Thousands) | 2018 |
| 2017 |
| 2016 |
| 2015 |
| 2014 |
| Balance at beginning of year |
| $21,461 |
|
|
| $19,697 |
|
|
| $18,153 |
|
|
| $16,723 |
|
|
| $16,282 |
|
| Charge-offs: | |
| |
| |
| |
| |
| Commercial | (1,716 | ) |
| (1,611 | ) |
| (903 | ) |
| (616 | ) |
| (319 | ) |
| Real estate construction one-to-four family | — |
|
| — |
|
| (535 | ) |
| — |
|
| — |
|
| Real estate term non-owner occupied | — |
|
| — |
|
| — |
|
| — |
|
| (160 | ) |
| Real estate term other | (28 | ) |
| (5 | ) |
| — |
|
| (81 | ) |
| — |
|
| Consumer secured by 1st deeds of trust | (143 | ) |
| (85 | ) |
| (36 | ) |
| (28 | ) |
| (59 | ) |
| Consumer other | (39 | ) |
| (43 | ) |
| (8 | ) |
| (101 | ) |
| (87 | ) |
| Total charge-offs | (1,926 | ) |
| (1,744 | ) |
| (1,482 | ) |
| (826 | ) |
| (625 | ) |
| Recoveries: | |
| |
| |
| |
| |
| Commercial | 442 |
|
| 293 |
|
| 699 |
|
| 379 |
|
| 1,041 |
|
| Real estate construction one-to-four family | — |
|
| — |
|
| — |
|
| — |
|
| 625 |
|
| Real estate term other | 3 |
|
| 2 |
|
| — |
|
| 107 |
|
| — |
|
| Consumer secured by 1st deeds of trust | 12 |
|
| 2 |
|
| — |
|
| 3 |
|
| 4 |
|
| Consumer other | 27 |
|
| 11 |
|
| 29 |
|
| 13 |
|
| 32 |
|
| Total recoveries | 484 |
|
| 308 |
|
| 728 |
|
| 502 |
|
| 1,702 |
|
| Net, recoveries (charge-offs) | (1,442 | ) |
| (1,436 | ) |
| (754 | ) |
| (324 | ) |
| 1,077 |
|
| Provision (benefit) for loan losses | (500 | ) |
| 3,200 |
|
| 2,298 |
|
| 1,754 |
|
| (636 | ) |
| Balance at end of year |
| $19,519 |
|
|
| $21,461 |
|
|
| $19,697 |
|
|
| $18,153 |
|
|
| $16,723 |
|
| Ratio of net charge-offs to average loans | |
| |
| |
| |
| |
| outstanding during the period | 0.15 | % |
| 0.15 | % |
| 0.08 | % |
| (0.03 | )% |
| (0.12 | )% |
In accordance with GAAP, loans acquired in connection with our acquisition of Alaska Pacific on April 1, 2014 were recorded at their fair value at the acquisition date. Credit discounts were included in the determination of fair value; therefore, an allowance for loan losses was not recorded at the acquisition date. Purchased credit impaired loans were evaluated on a loan by loan basis and the valuation allowance for these loans was netted against the carrying value. Deterioration in credit quality of the acquired loans subsequent to acquisition date results in the establishment of an allowance. Management assesses the credit
impairment for the loans that were acquired in connection with the acquisition of Alaska Pacific as part of the on-going monitoring of the credit quality of the Company's entire loan portfolio. Management tracks certain credit quality indicators including trends in past due and nonaccrual loans, gross and net charge-offs, and movement in loan balances within the risk classifications. As of December 31, 2018, $220,000 of the original $141.5 million of purchased loans, or 0.16%, had migrated from pass grade loans to substandard loans. These loans are included in impaired loans as of December 31, 2018, and have been evaluated for specific impairment as part of the calculation of the Allowance. There was no specific impairment on these loans at December 31, 2018 or 2017. There was no Allowance related to acquired loans at December 31, 2017, however, the Company included these loans in the Allowance at December 31, 2018 due to the the amount of time that has passed since the loans were purchased. The purchase discount related to these acquired credit impaired loans was $375,000 and $803,000 as of December 31, 2018 and 2017, respectively.
The provision for loan losses in 2018 as compared to 2017 decreased $3.7 million to a benefit of $500,000 compared to a provision of $3.2 million in 2017. This decrease is primarily due to a decrease in nonperforming loans and the portion of the Allowance specific to impaired loans. The Company determined that an Allowance of $19.5 million, or 1.98% of portfolio loans, is appropriate as of December 31, 2018 based on our analysis of the current credit quality of the portfolio and current economic conditions. The provision for loan losses in 2017 as compared to 2016 increased $902,000 to $3.2 million compared to $2.3 million in 2016. This increase is primarily due to an increase in nonperforming loans and the portion of the Allowance specific to impaired loans. The provision for loan losses in 2016 as compared to 2015 increased $544,000 to $2.3 million compared to $1.8 million in 2015. This increase was primarily due to an increase in nonperforming loans in 2016 compared to the prior year as well as an increase in qualitative factors mostly due to softening in the Alaska economy in 2016. The provision for loan losses in 2015 as compared to 2014 increased $2.4 million to $1.8 million compared to a benefit, or negative expense, of $636,000 in 2014. This increase was primarily due to net recoveries on loans in 2014 that led to a negative loan loss provision in that year.
While management believes that it uses the best information available to determine the Allowance, unforeseen market conditions and other events could result in an adjustment to the Allowance, and net income could be significantly affected if circumstances differed substantially from the assumptions used in making the final determination of the Allowance.
Purchased Receivables
We purchase accounts receivable from our business customers and provide them with short-term working capital. We provide this service to our customers in Alaska, Washington, Oregon, and some other states through NFS.
Our purchased receivable activity is guided by policies that outline risk management, documentation, and approval limits. The policies are reviewed and approved annually by the Company's Board of Directors. Purchased receivables are recorded on the balance sheet net of a reserve for purchased receivable losses.
Purchased receivable balances decreased at December 31, 2018 to $14.4 million from $22.2 million at December 31, 2017, and year-to-date average purchased receivable balances were $17.4 million, $15.9 million, and $13.3 million in 2018, 2017, and 2016, respectively. Purchased receivable income was $3.3 million, $3.0 million, and $2.3 million in 2018, 2017, and 2016, respectively. The increase in purchased receivable income in 2018 is attributable to increased average balances, as well as higher yields.
The following table sets forth information regarding changes in the purchased receivable reserve for the years indicated:
|
| | | | | | | | | |
| (In Thousands) | 2018 | 2017 | 2016 |
| Balance at beginning of year |
| $200 |
|
| $171 |
|
| $181 |
|
| Charge-offs | — |
| — |
| — |
|
| Recoveries | — |
| — |
| — |
|
| Net recoveries (charge-offs) | — |
| — |
| — |
|
| Reserve for (recovery from) purchased receivables | (10 | ) | 29 |
| (10 | ) |
| Balance at end of year |
| $190 |
|
| $200 |
|
| $171 |
|
| Ratio of net charge-offs (recoveries) to average purchased receivables during the period | — | % | — | % | — | % |
Deposits
Deposits are our primary source of funds. Total deposits decreased 2% to $1.228 billion at December 31, 2018 from $1.258 billion at December 31, 2017. Our deposits generally are expected to fluctuate according to the level of our market share, economic conditions, and normal seasonal trends.
The following table sets forth the average balances outstanding and average interest rates for each major category of our deposits, for the periods indicated:
|
| | | | | | | | | | | | | | | | | |
| | 2018 |
| 2017 |
| 2016 |
| | Average balance | Average rate paid |
| Average balance | Average rate paid |
| Average balance | Average rate paid |
| (In Thousands) |
|
|
| Interest-bearing demand accounts |
| $243,000 |
| 0.07 | % |
|
| $220,449 |
| 0.03 | % |
|
| $192,512 |
| 0.04 | % |
| Money market accounts | 225,014 |
| 0.31 | % |
| 238,830 |
| 0.17 | % |
| 242,025 |
| 0.17 | % |
| Savings accounts | 241,807 |
| 0.31 | % |
| 249,641 |
| 0.21 | % |
| 234,347 |
| 0.21 | % |
| Certificates of deposit | 99,987 |
| 0.70 | % |
| 120,998 |
| 0.57 | % |
| 134,993 |
| 0.66 | % |
| Total interest-bearing accounts | 809,808 |
| 0.28 | % |
| 829,918 |
| 0.21 | % |
| 803,877 |
| 0.23 | % |
| Noninterest-bearing demand accounts | 417,464 |
| | | 418,415 |
| | | 446,366 |
| |
| Total average deposits |
| $1,227,272 |
| |
|
| $1,248,333 |
| |
|
| $1,250,243 |
| |
Certificates of Deposit: The only deposit category with stated maturity dates is certificates of deposit. At December 31, 2018, we had $113.3 million in certificates of deposit, of which $57.4 million, or 51%, are scheduled to mature in 2019. The Company’s certificates of deposit increased to $113.3 million during 2018 as compared to $100.5 million at December 31, 2017. The aggregate amount of certificates of deposit in amounts of $100,000 or more at December 31, 2018 and 2017, was $70.7 million and $61.4 million, respectively. The following table sets forth the amount outstanding of certificates of deposits in amounts of $100,000 or more by time remaining until maturity and percentage of total deposits as of December 31, 2018:
|
| | | | | | |
| | Time Certificates of Deposits |
| | of $100,000 or More |
| | |
| Percent of Total Deposits |
| | |
|
| (In Thousands) | Amount |
|
| Amounts maturing in: | |
| |
| Three months or less |
| $8,237 |
|
| 12 | % |
| Over 3 through 6 months | 5,724 |
|
| 8 | % |
| Over 6 through 12 months | 20,850 |
|
| 29 | % |
| Over 12 months | 35,906 |
|
| 51 | % |
| Total |
| $70,717 |
|
| 100 | % |
The Company is also a member of the Certificate of Deposit Account Registry System (“CDARS”) which is a network of over 3,000 banks throughout the United States. The CDARS system was founded in 2003 and allows participating banks to exchange FDIC insurance coverage so that 100% of the balance of their customers’ certificates of deposit is fully subject to FDIC insurance. At December 31, 2018 and 2017, the Company had no CDARS certificates of deposit.
Borrowings
FHLB: The Bank is a member of the Federal Home Loan Bank of Des Moines (the "FHLB"). As a member, the Bank is eligible to obtain advances from the FHLB. FHLB advances are dependent on the availability of acceptable collateral such as marketable securities or real estate loans, although all FHLB advances are secured by a blanket pledge of the Company’s assets. At December 31, 2018, our maximum borrowing line from the FHLB was $667.8 million, approximately 45% of the Bank’s assets, subject to the FHLB’s collateral requirements. The Company has outstanding advances of $7.2 million as of December 31, 2018 which were originated to match fund low income housing projects that qualify for long term fixed interest rates. The first advance is a $2.2 million FHLB Community Investment Program advance which was originated on March 22, 2013. It has an eighteen year term
with a 30 year amortization period, which mirrors the term of the term real estate loan made to the borrower, and a fixed rate of 3.12%. The second advance is a $2.3 million FHLB Community Investment Cash Advance Program advance that was originated in the second quarter of 2016. This advance has a 20 year term with a 30 year amortization period, which mirrors the term of the term real estate loan made to the borrower, and a fixed interest rate of 2.61%. The last advance is a $3.1 million FHLB Community Investment Cash Advance Program advance that was originated in the third quarter of 2017. This advance has a 20 year term with a 30 year amortization period and a fixed interest rate of 3.25%, which mirrors the term of the loan made to the borrower. All of these FHLB advances are included in borrowings.
Federal Reserve Bank: The Federal Reserve Bank of San Francisco (the "Federal Reserve Bank") is holding $78.6 million of loans as collateral to secure advances made through the discount window as of December 31, 2018. There were no discount window advances outstanding at December 31, 2018 or 2017.
Other Short-term Borrowings: Securities sold under agreements to repurchase were $34.3 million and $27.7 million, as of December 31, 2018 and 2017, respectively. The average balance outstanding of securities sold under agreements to repurchase during 2018 and 2017 was $29.9 million and $29.0 million, respectively, and the maximum outstanding at any month-end was $36.5 million and $32.6 million, respectively, during the same time periods. The securities sold under agreements to repurchase are held by the FHLB under the Company’s control.
The Company is subject to provisions under Alaska state law which generally limit the amount of outstanding debt to 15% of total assets or $222.6 million and $225.8 million at December 31, 2018 and 2017, respectively.
Long-term Borrowings: The Company had no long-term borrowings outstanding other than the FHLB advances noted above as of December 31, 2018 or 2017.
Contractual Obligations
The following table references contractual obligations of the Company for the periods indicated. This table does not include interest payments:
|
| | | | | | | | | | | | | | | | | | | |
| | Payments Due by Period |
| | Within 1 Year |
| |
| |
| Over 5 Years |
| |
| (In Thousands) |
| 1-3 Years |
| 3-5 Years |
|
| Total |
| December 31, 2018: | |
| |
| |
| |
| |
| Certificates of deposit |
| $57,451 |
|
|
| $52,529 |
|
|
| $1,494 |
|
|
| $1,799 |
|
|
| $113,273 |
|
| Short-term borrowings | 34,278 |
|
| — |
|
| — |
|
| — |
|
| 34,278 |
|
| Long-term borrowings | 167 |
|
| 351 |
|
| 373 |
|
| 6,350 |
|
| 7,241 |
|
| Junior subordinated debentures | — |
|
| — |
|
| — |
|
| 10,310 |
|
| 10,310 |
|
| Operating lease obligations | 2,668 |
|
| 4,908 |
|
| 3,750 |
|
| 8,121 |
|
| 19,447 |
|
Other long-term liabilities(1) | 1,010 |
|
| 1,703 |
|
| 1,453 |
|
| 3,196 |
|
| 7,362 |
|
| Capital commitments | 57 |
|
| — |
|
| — |
|
| — |
|
| 57 |
|
| Total |
| $95,631 |
|
|
| $59,491 |
|
|
| $7,070 |
|
|
| $29,776 |
|
|
| $191,968 |
|
| December 31, 2017: | |
| |
| |
| |
| |
| Certificates of deposit |
| $66,013 |
|
|
| $31,470 |
|
|
| $1,159 |
|
|
| $1,885 |
|
|
| $100,527 |
|
| Short-term borrowings | 27,746 |
|
| — |
|
| — |
|
| — |
|
| 27,746 |
|
| Long-term borrowings | 121 |
|
| 340 |
|
| 362 |
|
| 6,539 |
|
| 7,362 |
|
| Junior subordinated debentures | — |
|
| — |
|
| — |
|
| 10,310 |
|
| 10,310 |
|
| Operating lease obligations | 2,737 |
|
| 4,334 |
|
| 3,762 |
|
| 9,354 |
|
| 20,187 |
|
| Other long-term liabilities | 6,230 |
|
| 1,556 |
|
| 718 |
|
| 3,482 |
|
| 11,986 |
|
Capital commitments
| 47 |
|
| — |
|
| — |
|
| — |
|
| 47 |
|
| Total |
| $102,894 |
|
|
| $37,700 |
|
|
| $6,001 |
|
|
| $31,570 |
|
|
| $178,165 |
|
(1) Includes principal payments related to employee benefit plans. If a benefit payment schedule is established, payments are recorded in the corresponding dates listed in the table above. Unscheduled payments for all remaining benefits are recorded "Over 5 Years". Additional information about employee benefit plans is provided in Note 17 of the Notes to the Consolidated Financial Statements in Item 8 below.
Short and long-term borrowings included in the table above are described in the "Borrowings" section above. Junior subordinated debentures include $10.3 million that was originated on December 16, 2005, matures on March 15, 2036, and bears interest at a rate of 90-day LIBOR plus 1.37%, adjusted quarterly. The Company entered into an interest rate swap in the third quarter of 2017 to hedge the variability in cash flows arising out of its junior subordinated debentures, by swapping the cash flows with an interest rate swap which receives floating and pays fixed. The Company has designated this interest rate swap as a hedging instrument. The interest rate swap effectively fixes the Company's interest payments on the $10 million of junior subordinated debentures held under Northrim Statutory Trust 2 ("NST2") at 3.72% through its maturity date. Operating lease obligations are more fully described in Note 18 of the Company’s Consolidated Financial Statements included in Item 8 of this report. Other long-term liabilities consist of amounts that the Company owes for its investments in Delaware limited partnerships that develop low-income housing projects throughout the United States. The Company purchased a $10.7 million interest in R4 Frontier Housing Partners L.P., Coronado Park Senior Village L.P. ("R4-Coronado") in March 2013. The investment in R4-Coronado was 95% funded at the end of 2018 and is expected to be fully funded in 2029. The Company also purchased an $8.5 million interest in R4 Frontier Housing Partners L.P., Mountain View Village V L.P. ("R4-MVV") in May 2014. The investment in R4-MVV was 97% funded at the end of 2017 and is expected to be fully funded in 2030. The Company also purchased a $6.8 million interest in R4 Frontier Housing Partners L.P., PJ33 L.P. ("R4-PJ33") in June 2016. The investment in R4-PJ33 was 94% funded at the end of 2018 and is expected to be fully funded in 2032.
Off-Balance Sheet Arrangements
The Company is a party to financial instruments with off-balance sheet risk. Among the off-balance sheet items entered into in the ordinary course of business are commitments to extend credit, commitments to originate loans held for sale and the issuance of letters of credit. These instruments involve, to varying degrees, elements of credit and interest rate risk in excess of the amounts recognized on the balance sheet. Certain commitments are collateralized. We apply the same credit standards to these commitments as in all of our lending activities and include these commitments in our lending risk evaluations.
As of December 31, 2018, we had commitments to extend credit of $260.6 million, which were not reflected on our balance sheet, compared to $283.9 million as of December 31, 2017. Commitments to extend credit are agreements to lend to customers. These commitments have specified interest rates and generally have fixed expiration dates but may be terminated by the Company if certain conditions of the contract are violated. Collateral held relating to these commitments varies, but generally includes real estate, inventory, accounts receivable, and equipment. Our exposure to credit loss under commitments to extend credit is represented by the amount of these commitments. Since many of the commitments are expected to expire without being drawn upon, these total commitment amounts do not necessarily represent future cash requirements.
As of December 31, 2018, we had commitments to originate loans held for sale of $45.0 million, which were not reflected in the balance sheet compared to $43.6 million as of December 31, 2017. Mortgage loans sold to investors may be sold with servicing rights released, for which the Company makes only standard legal representations and warranties as to meeting certain underwriting and collateral documentation standards. In the past two years, the Company has had to repurchase one loan due to deficiencies in underwriting or loan documentation and has not realized significant losses related to this repurchase. Management currently believes that any liabilities that may result from such recourse provisions are not significant.
As of December 31, 2018, we had standby letters of credit of $3.2 million, which were not reflected on our balance sheet compared to $7.6 million as of December 31, 2017. Standby letters of credit are conditional commitments issued by the Company to guarantee the performance of a customer to a third party. Credit risk arises in these transactions from the possibility that a customer may not be able to repay the Company upon default of performance. Collateral held for standby letters of credit is based on an individual evaluation of each customer’s creditworthiness.
Our total unfunded lending commitments at December 31, 2018, which includes commitments to extend credit, commitments to originate loans held for sale and standby letters of credit, were $308.8 million, compared to $335.1 million as of December 31, 2017. We do not expect that all of these commitments are likely to be fully drawn upon at any one time. The Company has established reserves of $130,000 and $152,000 at December 31, 2018 and 2017, respectively, for losses related to these commitments that are recorded in other liabilities on the consolidated balance sheet.
Additional information regarding Off-Balance Sheet Arrangements is included in Notes 18 and 19 of the Notes to Consolidated Financial Statements included in Item 8 of this report.
Liquidity and Capital Resources
The Company is a single bank holding company and its primary ongoing source of liquidity is from dividends received from the Bank. Such dividends arise from the cash flow and earnings of the Bank. Banking regulations and regulatory authorities may limit the amount of, or require the Bank to obtain certain approvals before paying, dividends to the Company. Given that the Bank currently meets and the Bank anticipates that it will continue to meet, all applicable capital adequacy requirements for a “well-capitalized” institution by regulatory standards, the Company expects to continue to receive dividends from the Bank during 2019. A requirement to have a conservation buffer began being phased-in in 2016 and is now in full effect, and this requirement could adversely affect the Bank's ability to pay dividends.
The Bank manages its liquidity through its Asset and Liability Committee. Our primary sources of funds are customer deposits and advances from the FHLB. These funds, together with loan repayments, loan sales, other borrowed funds, retained earnings, and equity are used to make loans, to acquire securities and other assets, and to fund deposit flows and continuing operations. The primary sources of demands on our liquidity are customer demands for withdrawal of deposits and borrowers’ demands that we advance funds against unfunded lending commitments. Our total unfunded commitments to fund loans, loans held for sale, and letters of credit at December 31, 2018, were $308.8 million. We do not expect that all of these loans are likely to be fully drawn upon at any one time. Additionally, as noted above, our total deposits at December 31, 2018, were $1.2 billion.
As shown in the Consolidated Statements of Cash Flows, net cash provided by operating activities was $25.2 million, $19.3 million, and $20.1 million in 2018, 2017, and 2016 respectively. The primary source of cash provided by operating activities for all periods presented was positive net income in each of these periods. The primary reason that net cash provided by operating activities increased in 2018 as compared to 2017 was that the Company had net proceeds of $24.1 million in 2018 compared to $17.8 million in 2017 from sales of loans held for sale. Net cash of $5.6 million and $30.4 million was provided by investing activities in 2018 and 2017, respectively, as the Company's proceeds from security sales, maturities, and calls were greater than funds used to purchase additional investment securities in those years. $47.5 million of cash was used in investing activities in 2016 as the Company invested available cash primarily in available for sale securities and portfolio loans. Financing activities used cash of $31.1 million and $22.4 million in 2018 and 2017, respectively, and provided cash of $19.3 million in 2016. Financing activities used net cash in 2018 primarily as a result of a decrease in deposit balances in 2018 compared to 2017. Financing activities used net cash in 2017 primarily due to a decrease in deposit balances and the redemption of $8.3 million in junior subordinated debentures.
The sources by which we meet the liquidity needs of our customers are current assets and borrowings available through our correspondent banking relationships and our credit lines with the Federal Reserve Bank and the FHLB. At December 31, 2018, our current assets were $439.7 million and our funds available for borrowing under our existing lines of credit were $739.5 million. Given these sources of liquidity and our expectations for customer demands for cash and for our operating cash needs, we believe our sources of liquidity to be sufficient in the foreseeable future.
During 2018, the Company's Board of Directors approved a quarterly cash dividend of $0.24 per common share for the first and second quarters and $0.27 per common share for the third and fourth quarters. These dividends were made pursuant to our existing dividend policy and in consideration of, among other things, earnings, regulatory capital levels, liquidity, asset quality, and the overall payout ratio. We expect that dividend payments will be reassessed on a quarterly basis by the Board of Directors in accordance with the dividend policy. The payment of cash dividends is subject to regulatory limitations as described under the Supervision and Regulation section of Part I of this report. There is no assurance that future cash dividends on common shares will be declared or increased.
On February 28, 2019, the Board of Directors approved payment of a $0.30 per share dividend on March 22, 2019, to shareholders of record on March 14, 2019. This dividend is $0.03, or 11%, higher than the Company’s dividend of $0.27 that was paid in the fourth quarter of 2018.
In September 2002, our Board of Directors approved a plan whereby we would periodically repurchase for cash up to approximately 5% of our shares of common stock in the open market. We purchased an aggregate of 688,442 shares of our stock under this program through December 31, 2009 at a total cost of $14.2 million at an average price of $20.65, which left a balance of 227,242 shares available under the stock repurchase program. The Company did not repurchase any of its shares in 2010 through 2016. In 2017, we purchased an aggregate of 58,341 shares at an average price of $27.56. In 2018, we purchased an aggregate of 15,468 shares at an average price of $31.90, which leaves a balance of 153,433 shares available under the stock repurchase plan as of December 31, 2018. We intend to continue to repurchase our stock from time-to-time depending upon market conditions, but we can make no assurances that we will continue this program or that we will repurchase all of the authorized shares. The table below shows this effect on diluted earnings per share.
|
| | | |
| Years Ending: | Diluted
EPS as
Reported | | Diluted EPS without Stock Repurchase |
| 2018 | $2.86 | | $2.56 |
| 2017 | $1.88 | | $1.69 |
| 2016 | $2.06 | | $1.87 |
| 2015 | $2.56 | | $2.31 |
| 2014 | $2.54 | | $2.29 |
On May 8, 2003, the Company’s subsidiary, NCT1, issued trust preferred securities in the principal amount of $8 million. These securities carried an interest rate of 90-day LIBOR plus 3.15% per annum that was initially set at 4.45% adjusted quarterly. The securities had a maturity date of May 15, 2033, and were callable by the Company on or after May 15, 2008. These securities were treated as Tier 1 capital by the Company’s regulators for capital adequacy calculations. The Company redeemed these trust preferred securities on August 15, 2017.
On December 16, 2005, the Company’s subsidiary, NST2, issued trust preferred securities in the principal amount of $10 million. These securities carry an interest rate of 90-day LIBOR plus 1.37% per annum that was initially set at 5.86% adjusted quarterly. The securities have a maturity date of March 15, 2036, and are callable by the Company on or after March 15, 2011. These securities are treated as Tier 1 capital by the Company’s regulators for capital adequacy calculations. The interest cost to the Company of these securities was $368,000 in 2018. At December 31, 2018, the securities had an interest rate of 4.16%. The Company entered into an interest rate swap in the third quarter of 2017 to hedge the variability in cash flows arising out of its junior subordinated debentures, by swapping the cash flows with an interest rate swap which receives floating and pays fixed. The Company has designated this interest rate swap as a hedging instrument. The interest rate swap effectively fixes the Company's interest payments on the $10 million of junior subordinated debentures held under NST2 at 3.72% through its maturity date.
Our shareholders’ equity at December 31, 2018, was $205.9 million, as compared to $192.8 million at December 31, 2017. The Company earned net income of $20.0 million during 2018 and issued 26,721 shares through the exercise of stock options. At December 31, 2018, the Company had approximately 6.9 million shares of its common stock outstanding.
We are subject to minimum capital requirements. Federal banking agencies have adopted regulations establishing minimum requirements for the capital adequacy of banks and bank holding companies. The requirements address both risk-based capital and leverage capital. We believe as of December 31, 2018, that the Company and the Bank met all applicable capital adequacy requirements for a “well-capitalized” institution by regulatory standards.
The table below illustrates the capital requirements in effect in 2018 for the Company and the Bank and the actual capital ratios for each entity that exceed these requirements. Management intends to maintain capital ratios for the Bank in 2019, exceeding the FDIC’s new requirements for the “well-capitalized” classification. The capital ratios for the Company exceed those for the Bank primarily because the $10 million trust preferred securities offering that the Company completed in the fourth quarter of 2005 is included in the Company’s capital for regulatory purposes, although they are accounted for as a long-term debt in our financial statements. The trust preferred securities are not accounted for on the Bank’s financial statements nor are they included in its capital. As a result, the Company has $10 million more in regulatory capital than the Bank at December 31, 2018 and 2017, respectively, which explains most of the difference in the capital ratios for the two entities.
|
| | | | | | | |
| | Minimum Required Capital |
| Well-Capitalized |
| Actual Ratio Company |
| Actual Ratio Bank |
| |
|
|
|
| December 31, 2018 |
|
|
|
| Total risk-based capital | 8.00% |
| 10.00% |
| 16.73% |
| 14.30% |
| Tier 1 risk-based capital | 6.00% |
| 8.00% |
| 15.47% |
| 13.05% |
| Common equity tier 1 capital | 4.50% | | 6.50% | | 14.73% | | 13.05% |
| Leverage ratio | 4.00% |
| 5.00% |
| 13.40% |
| 11.28% |
See Note 22 of the Consolidated Financial Statements for a detailed discussion of the capital ratios. The requirements for "well-capitalized" come from the Prompt Correction Action rules. See Item 1 Supervision and Regulation. These rules apply to the Bank but not to the Company. Under the rules of the Federal Reserve Bank, a bank holding company such as the Company is generally defined to be "well capitalized" if its Tier 1 risk-based capital ratio is 8.0% or more and its total risk-based capital ratio is 10.0% or more.
Effects of Inflation and Changing Prices: The primary impact of inflation on our operations is increased operating costs. Unlike most industrial companies, virtually all of the assets and liabilities of a financial institution are monetary in nature. As a result, interest rates generally have a more significant impact on a financial institution’s performance than the effects of general levels of inflation. Although interest rates do not necessarily move in the same direction or to the same extent as the prices of goods and services, increases in inflation generally have resulted in increased interest rates, which could affect the degree and timing of the repricing of our assets and liabilities. In addition, inflation has an impact on our customers’ ability to repay their loans.
ITEM 7A.QUANTITATIVE AND QUALITATIVE DISCLOSURES ABOUT MARKET RISK
Market risk is defined as the sensitivity of income, expense, fair value measurements, and capital to changes in interest rates, foreign currency rates, commodity prices, and other relevant market rates or prices. The primary market risks that we are exposed to are interest rate and price risks, in addition to risk in the Alaska economy due to our community banking focus. Price risk is the risk to current or future earnings or capital arising from changes in the value of either assets or liabilities that are entered into as part of distributing or managing risk. Interest rate risk is the risk to current or future earnings or capital arising from changes in interest rates. Generally, there are four sources of interest rate risk as described below:
•Re-pricing Risk:Risk:Generally, re-pricing risk is the risk of adverse consequences from a change in interest rates that arises because of differences in the timing of when those interest rate changes affect an institution’s assets and liabilities.
•Basis Risk:Risk: Basis risk is the risk of adverse consequences resulting from unequal changes in the spread between two or more rates for different instruments with the same maturity.
•Yield Curve Risk:Risk: Also called yield curve twist risk, yield curve risk is the risk of adverse consequences resulting from unequal changes in the spread between two or more rates for different maturities for the same instrument.
•Option Risk:Risk: In banking, option risks are known as borrower options to prepay loans and depositor options to make deposits, withdrawals, and early redemptions. Option risk arises whenever bank products give customers the right, but not the obligation, to alter the quantity of the timing of cash flows.
The Company is exposed to price and interest rate risks in the financial instruments and positions we hold. This includes investment securities, loans, loans held for sale, mortgage servicing rights, deposits, borrowings, and derivative financial instruments. Market risks such as foreign currency exchange risk and commodity price risk do not arise in the normal course of the Company's business.
The Company's price and interest rate riskrisks are managed by the Asset and Liability Committee, a management committee that identifies and manages the sensitivity of earnings and capital to changing interest rates to achieve our overall financial objectives. Based on economic conditions, asset quality and various other considerations, the Asset and Liability Committee establishes overall balance sheet management policies as well as tolerance ranges for interest rate sensitivity and manages within these ranges.
A number of measures are used to monitor and manage interest rate risk, including interest sensitivity (gap) analysis and income simulations. An income simulation model is the primary tool used to assess the direction and magnitude of changes in net interest income resulting from changes in interest rates. Key assumptions in the model include loan and deposit volumes and pricing, prepayment speeds on fixed rate assets, and cash flows and maturities of investment securities. These assumptions are inherently uncertain and, as a result, the model cannot precisely estimate net interest income or precisely predict the impact of higher or lower interest rates on net interest income. Actual results will differ from simulated results due to timing, magnitude and frequency of interest rate changes, changes in market conditions and management strategies, among other factors.
Although analysis of interest rate gap (the difference between the repricing of interest-earning assets and interest-bearing liabilities during a given period of time) is one standard tool for the measurement of exposure to interest rate risk, we believe that because interest rate gap analysis does not address all factors that can affect earnings performance it should not be used as the primary indicator of exposure to interest rate risk and the related volatility of net interest income in a changing interest rate environment. Interest rate gap analysis is primarily a measure of liquidity based upon the amount of change in principal amounts of assets and liabilities outstanding, as opposed to a measure of changes in the overall net interest margin.
The Company uses derivatives in the Home Mortgage Lending segment, including commitments to originate residential mortgage loans at fixed prices, and it enters into forward delivery contracts to sell mortgage-backed securities to broker/dealers at specific prices and dates in order to hedge the interest rate risk in its residential mortgage loan commitments. The Company does not use derivatives outside of these activities in the Home Mortgage Lending segment to manage our interest rate risk exposures. However, the Company does enter into commercial loan interest rate swap agreements in its Community Banking
segment in order to provide commercial loan customers the ability to convert from variable to fixed interest rates. Commercial loan interest rate swap agreements are offset with corresponding swap agreements with a third party swap dealer in order to offset the Company's exposure on the fixed component of the customer’s interest rate swap. Additional information regarding the Company’s customer interest rate swap program is presented in Note 1920 of the Notes to Consolidated Financial Statements included in Part II. Item 8 of this report.
The following table sets forth the estimated maturity or repricing, and the resulting interest rate gap, of our interest-earning assets (which exclude nonaccrual loans) and interest-bearing liabilities at December 31, 2018.2021. The amounts shown below could be significantly affected by external factors such as changes in prepayment assumptions, early withdrawals of deposits, and competition.
| | | | Estimated maturity or repricing at December 31, 2018 | | Estimated maturity or repricing at December 31, 2021 |
| (In Thousands) | Within 1 year | | 1-5 years | | >5 years | | Total | (In Thousands) | Within 1 year | | 1-5 years | | >5 years | | Total |
| Interest -Earning Assets: | | | | | | | | Interest -Earning Assets: | | | | | | | |
| Interest bearing deposits in other banks |
| $50,767 |
| |
| $— |
| |
| $— |
| |
| $50,767 |
| Interest bearing deposits in other banks | $625,022 | | | $— | | | $— | | | $625,022 | |
| Portfolio investments and FHLB Stock | 146,445 |
| | 134,531 |
| | — |
| | 280,976 |
| |
| Portfolio loans | 590,753 |
| | 354,519 |
| | 28,351 |
| | 973,623 |
| |
| Investments securities and FHLB Stock | | Investments securities and FHLB Stock | 144,270 | | | 313,941 | | | — | | | 458,211 | |
| Loans | | Loans | 650,478 | | | 675,118 | | | 88,183 | | | 1,413,779 | |
| Loans held for sale | 34,710 |
| | — |
| | — |
| | 34,710 |
| Loans held for sale | 73,650 | | | — | | | — | | | 73,650 | |
| Total interest-earning assets |
| $822,675 |
| |
| $489,050 |
| |
| $28,351 |
| |
| $1,340,076 |
| Total interest-earning assets | $1,493,420 | | | $989,059 | | | $88,183 | | | $2,570,662 | |
| Percent of total interest-earning assets | 61.4 | % | | 36.5 | % | | 2.1 | % | | 100.0 | % | Percent of total interest-earning assets | 58.09 | % | | 38.47 | % | | 3.43 | % | | 99.99 | % |
| Interest-Bearing Liabilities: | | | | | | | | Interest-Bearing Liabilities: | | | | | | | |
| Interest-bearing demand accounts |
| $248,056 |
| |
| $— |
| |
| $— |
| |
| $248,056 |
| Interest-bearing demand accounts | $692,683 | | | $— | | | $— | | | $692,683 | |
| Money market accounts | 206,717 |
| | — |
| | — |
| | 206,717 |
| Money market accounts | 314,996 | | | — | | | — | | | 314,996 | |
| Savings accounts | 239,054 |
| | — |
| | — |
| | 239,054 |
| Savings accounts | 348,164 | | | — | | | — | | | 348,164 | |
| Certificates of deposit | 57,541 |
| | 54,377 |
| | 1,355 |
| | 113,273 |
| Certificates of deposit | 121,515 | | | 55,131 | | | 1,318 | | | 177,964 | |
| Securities sold under repurchase agreements | 34,278 |
| | — |
| | — |
| | 34,278 |
| Securities sold under repurchase agreements | — | | | — | | | — | | | — | |
| Borrowings | 355 |
| | 1,534 |
| | 5,352 |
| | 7,241 |
| Borrowings | 812 | | | 3,540 | | | 10,156 | | | 14,508 | |
| Junior subordinated debentures | — |
| | — |
| | 10,310 |
| | 10,310 |
| Junior subordinated debentures | — | | | — | | | 10,310 | | | 10,310 | |
| Total interest-bearing liabilities |
| $786,001 |
| |
| $55,911 |
| |
| $17,017 |
| |
| $858,929 |
| Total interest-bearing liabilities | $1,478,170 | | | $58,671 | | | $21,784 | | | $1,558,625 | |
| Percent of total interest-bearing liabilities | 91.5 | % | | 6.5 | % | | 2.0 | % | | 100.0 | % | Percent of total interest-bearing liabilities | 94.84 | % | | 3.76 | % | | 1.40 | % | | 100.00 | % |
| Interest sensitivity gap |
| $36,674 |
| |
| $433,139 |
| |
| $11,334 |
| |
| $481,147 |
| Interest sensitivity gap | $15,250 | | | $930,388 | | | $66,399 | | | $1,012,037 | |
| Cumulative interest sensitivity gap |
| $36,674 |
| |
| $469,813 |
| |
| $481,147 |
| | | Cumulative interest sensitivity gap | $15,250 | | | $945,638 | | | $1,012,037 | | | |
| Cumulative interest sensitivity gap as a percentage | | | | | | | | Cumulative interest sensitivity gap as a percentage | | | | | | | |
| of total interest-earning assets | 2.7 | % | | 35.1 | % | | 35.9 | % | | | of total interest-earning assets | 0.6 | % | | 36.8 | % | | 39.4 | % | | |
As stated previously, certain shortcomings, including those described below, are inherent in the method of analysis presented in the foregoing table. For example, although certain assets and liabilities may have similar maturities or periods of repricing, they may react in different degrees to changes in market interest rates. Also, the interest rates on certain types of assets and liabilities may fluctuate in advance of changes in market interest rates, while interest rates on other types may lag behind changes in market interest rates. Additionally, certain assets have features that restrict changes in their interest rates, both on a short-term basis and over the lives of the assets. Further, in the event of a change in market interest rates, prepayment and early withdrawal levels could deviate significantly from those assumed in calculating the tables as can the relationship of rates between different loan and deposit categories. Moreover, the ability of many borrowers to service their adjustable-rate debt may decrease in the event of an increase in market interest rates.
While the analysis above sets forth the estimated maturity or repricing and the resulting interest rate gap of our interest-earning assets and interest-bearing liabilities, the following tables show the estimated impact on net interest income and net income at one and two year time horizons with instantaneous parallel rate shocks of up 400 basis points, up 300 basis points, up 200 basis points, up 100 basis points, and up 50 basis points, down 50 basis points, down 100 basis points, and down 200 basis points. The Company did not perform analyses for rate shock scenarios where interest rates instantaneously drop as of December 31, 2021 because those scenarios do not produce meaningful results in the current low interest rate environment. Due to the various assumptions used for this modeling and potential balance sheet strategies management may implement to mitigate interest rate risk, no assurance can be given that projections will reflect actual results.
The following table shows the estimated impact on net interest income under for the stated interest rate scenarios:
| | | | | | | | | | | | | | | | | | | | |
| | 1st Year Change in net interest income from base scenario | | Percentage change | 2nd Year Change in net interest income from base scenario | | Percentage change |
| | | |
| (In Thousands) | | |
| Scenario: | | | | | | |
| Up 400 basis points | $22,226 | | | 31.06 | % | $30,206 | | | 43.61 | % |
| Up 300 basis points | $16,926 | | | 23.65 | % | $22,966 | | | 33.16 | % |
| Up 200 basis points | $11,235 | | | 15.70 | % | $15,302 | | | 22.09 | % |
| Up 100 basis points | $5,590 | | | 7.81 | % | $7,653 | | | 11.05 | % |
| Up 50 basis points | $4,552 | | | 6.36 | % | $5,730 | | | 8.27 | % |
| Up 25 basis points | $2,321 | | | 3.24 | % | $2,892 | | | 4.18 | % |
| Down 50 basis points | NM | | NM | NM | | NM |
| Down 100 basis points | NM | | NM | NM | | NM |
| | | | | | |
|
| | | | | | | | | | | | |
| | 1st Year Change in net interest income from base scenario |
| Percentage change | 2nd Year Change in net interest income from base scenario | | Percentage change |
| |
| |
| (In Thousands) |
| |
| Scenario: | |
| | | | |
| Up 400 basis points |
| $9,228 |
| | 13.74 | % |
| $21,247 |
| | 30.40 | % |
| Up 300 basis points |
| $6,999 |
| | 10.42 | % |
| $16,082 |
| | 23.01 | % |
| Up 200 basis points |
| $4,769 |
|
| 7.10 | % |
| $10,941 |
| | 15.66 | % |
| Up 100 basis points |
| $2,440 |
|
| 3.63 | % |
| $5,605 |
| | 8.02 | % |
| Up 50 basis points |
| $1,199 |
| | 1.78 | % |
| $2,765 |
| | 3.96 | % |
| Down 50 basis points |
| ($2,350 | ) | | (3.50 | )% |
| ($3,837 | ) | | (5.49 | )% |
| Down 100 basis points |
| ($4,594 | ) |
| (6.84 | )% |
| ($7,725 | ) | | (11.05 | )% |
| Down 200 basis points |
| ($10,306 | ) | | (15.34 | )% |
| ($16,778 | ) | | (24.01 | )% |
The following table shows the estimated impact on net income under the stated interest rate scenarios:
|
| | | | | | | | | | | | |
| | 1st Year Change in net income from base scenario |
| Percentage change | 2nd Year Change in net income from base scenario | | Percentage change |
| |
| |
| (In Thousands) |
| |
| Scenario: | |
| | | | |
| Up 400 basis points |
| $6,468 |
| | 37.13 | % |
| $15,838 |
| | 81.11 | % |
| Up 300 basis points |
| $4,963 |
| | 28.49 | % |
| $12,044 |
| | 61.68 | % |
| Up 200 basis points |
| $3,322 |
| | 19.07 | % |
| $8,134 |
| | 41.66 | % |
| Up 100 basis points |
| $1,739 |
| | 9.98 | % |
| $4,206 |
| | 21.54 | % |
| Up 50 basis points |
| $821 |
| | 4.71 | % |
| $2,041 |
| | 10.45 | % |
| Down 50 basis points |
| ($1,728 | ) | | (9.92 | )% |
| ($2,881 | ) | | (14.75 | )% |
| Down 100 basis points |
| ($3,437 | ) | | (19.73 | )% |
| ($5,866 | ) | | (30.04 | )% |
| Down 200 basis points |
| ($7,686 | ) | | (44.12 | )% |
| ($12,705 | ) | | (65.07 | )% |
Impactscenarios. The trends in the estimated impact on net income under the stated interest rate scenarios differ from the table above primarily due to the inclusion ofInflation and Changing Prices: The primary the estimated impact of inflation on the Company’s operations is increasedchanges in other operating costs. Unlike most industrial companies, virtually all of the assetsincome and liabilities of a financial institution are monetary in nature and as a result, interest rates generally have a more significant impact on a financial institution’s performance than the effects of general levels of inflation. Although interest rates do not necessarily move in the same direction orexpense related to the same extent as the prices of goods and services, increases in inflation generally have resulted in increased interest rates.
mortgage banking activities:
| | | | | | | | | | | | | | | | | | | | |
| | 1st Year Change in net income from base scenario | | Percentage change | 2nd Year Change in net income from base scenario | | Percentage change |
| | | |
| (In Thousands) | | |
| Scenario: | | | | | | |
| Up 400 basis points | $11,151 | | | 59.21 | % | $17,223 | | | 147.02 | % |
| Up 300 basis points | $10,187 | | | 54.09 | % | $14,757 | | | 125.97 | % |
| Up 200 basis points | $6,968 | | | 37.00 | % | $10,044 | | | 85.74 | % |
| Up 100 basis points | $3,786 | | | 20.10 | % | $5,342 | | | 45.61 | % |
| Up 50 basis points | $3,222 | | | 17.11 | % | $4,095 | | | 34.96 | % |
| Up 25 basis points | $1,841 | | | 9.77 | % | $2,260 | | | 19.29 | % |
| Down 50 basis points | NM | | NM | NM | | NM |
| Down 100 basis points | NM | | NM | NM | | NM |
| | | | | | |
ITEM 8.FINANCIAL STATEMENTS AND SUPPLEMENTARY DATA
The following report, audited consolidated financial statements and the notes thereto are set forth in this Annual Report on Form 10-K on the pages indicated:
|
| | | | |
| |
| |
For the Years Ended December 2018, 20172021, 2020 and 2016:2019: | |
| |
| |
| |
| |
| |
Report of Independent Registered Public Accounting Firm
To the Shareholders and the Board of Directors of
Northrim BanCorp, Inc. and Subsidiaries
Opinions on the Financial Statements and Internal Control over Financial Reporting
We have audited the accompanying consolidated balance sheets of Northrim BanCorp, Inc. and Subsidiariessubsidiaries (the “Company”) as of December 31, 20182021 and 2017,2020, the related consolidated statements of income, comprehensive income, changes in shareholders’ equity and cash flows for each of the three years in the period ended December 31, 2018,2021, and the related notes (collectively referred to as the “consolidatedfinancial statements”). We also have audited the Company’s internal control over financial reporting as of December 31, 2018,2021, based on criteria established in Internal Control - Integrated Framework (2013) issued by the Committee of Sponsoring Organizations of the Treadway Commission (COSO).
In our opinion, the consolidated financial statements referred to above present fairly, in all material respects, the consolidated financial position of the Company as of December 31, 20182021 and 2017,2020, and the consolidated results of its operations and its cash flows for each of the three years in the period ended December 31, 2018,2021, in conformity with accounting principles generally accepted in the United States of America. Also in our opinion, the Company maintained, in all material respects, effective internal control over financial reporting as of December 31, 2018,2021, based on criteria established in Internal Control - Integrated Framework (2013) issued by COSO.
Change in Accounting Principle
As discussed in Note 1 to the consolidated financial statements, the Company changed its method of accounting for credit losses effective January 1, 2021, due to the adoption of Accounting Standards Codification Topic 326: Financial Instruments – Credit Losses (“Topic 326”). The Company adopted the new credit loss standard using the modified retrospective approach such that prior period amounts are not adjusted and continue to be reported in accordance with previously applicable generally accepted accounting principles. The adoption of the new credit loss standard and its subsequent application is also communicated as a critical audit matter below.
Basis for Opinions
The Company’s management is responsible for these consolidated financial statements, for maintaining effective internal control over financial reporting, and for its assessment of the effectiveness of internal control over financial reporting, included in the accompanying Management’s Report on Internal Control over Financial Reporting. Our responsibility is to express an opinion on the Company’s consolidated financial statements and an opinion on the Company’s internal control over financial reporting based on our audits. We are a public accounting firm registered with the Public Company Accounting Oversight Board (United States) (“PCAOB”) and are required to be independent with respect to the Company in accordance with the U.S. federal securities laws and the applicable rules and regulations of the Securities and Exchange Commission and the PCAOB.
We conducted our audits in accordance with the standards of the PCAOB. Those standards require that we plan and perform the audits to obtain reasonable assurance about whether the consolidated financial statements are free of material misstatement, whether due to error or fraud, and whether effective internal control over financial reporting was maintained in all material respects.
Our audits of the consolidated financial statements included performing procedures to assess the risks of material misstatement of the consolidated financial statements, whether due to error or fraud, and performing procedures to respond to those risks. Such procedures included examining, on a test basis, evidence regarding the amounts and disclosures in the consolidated financial statements. Our audits also included evaluating the accounting principles used and significant estimates made by management, as well as evaluating the overall presentation of the consolidated financial statements. Our audit of internal control over financial reporting included obtaining an understanding of internal control over financial reporting, assessing the risk that a material weakness exists, and testing and evaluating the design and operating effectiveness of internal control based on the assessed risk. Our audits also included performing such other procedures as we considered necessary in the circumstances. We believe that our audits provide a reasonable basis for our opinions.
Definition and Limitations of Internal Control Over Financial Reporting
A company’s internal control over financial reporting is a process designed to provide reasonable assurance regarding the reliability of financial reporting and the preparation of financial statements for external purposes in accordance with generally
accepted accounting principles. A company’s internal control over financial reporting includes those policies and procedures that (1) pertain to the maintenance of records that, in reasonable detail, accurately and fairly reflect the transactions and dispositions of the assets of the company; (2) provide reasonable assurance that transactions are recorded as necessary to permit preparation of financial statements in accordance with generally accepted accounting principles, and that receipts and expenditures of the company are being made only in accordance with authorizations of management and directors of the company; and (3) provide reasonable assurance regarding prevention or timely detection of unauthorized acquisition, use, or disposition of the company’s assets that
could have a material effect on the financial statements.
Because of its inherent limitations, internal control over financial reporting may not prevent or detect misstatements. Also, projections of any evaluation of effectiveness to future periods are subject to the risk that controls may become inadequate because of changes in conditions, or that the degree of compliance with the policies or procedures may deteriorate.
Critical Audit Matter
The critical audit matter communicated below is a matter arising from the current period audit of the consolidated financial statements that was communicated or required to be communicated to the audit committee and that (1) relates to accounts or disclosures that are material to the consolidated financial statements and (2) involved our especially challenging, subjective, or complex judgments. The communication of critical audit matters does not alter in any way our opinion on the consolidated financial statements, taken as a whole, and we are not, by communicating the critical audit matter below, providing a separate opinion on the critical audit matter or on the accounts or disclosures to which it relates.
Allowance for Credit Losses - Loans
As described in Notes 1 and 5 to the consolidated financial statements, the Company’s allowance for credit losses - loans balance was $11.7 million at December 31, 2021. The allowance for credit losses – loans is management’s best estimate of current expected credit losses in its loan portfolio and is estimated using either a discounted cash flow method or a weighted average remaining life method, depending on the nature and size of the loan pool. The estimate of current expected credit losses is based on relevant information about past events, current conditions, and reasonable and supportable forecasts that affect the collectability of loans. Historical loss experience is the starting point for estimating expected credit losses. Adjustments are made to historical loss experience to reflect differences in asset-specific risk characteristics using qualitative factors.
We identified management’s estimation and application of management’s forecast of economic conditions used in the calculation of probabilities of default in the allowance for credit losses – loans as a critical audit matter. The forecast of economic conditions component of the allowance for credit losses - loans is used to compare the conditions that existed during the historical period to current conditions and future expectations, and to make adjustments to the historical data accordingly. Auditing management’s judgments regarding the estimation and application of forecasted economic conditions portion of the allowance for credit losses - loans involved a high degree of subjectivity.
The primary procedures we performed to address the critical audit matters included:
•Testing the design, implementation, and operating effectiveness of controls relating to management’s calculation of the allowance for credit losses – loans, including controls over the estimation and application of forecast of economic conditions.
•Obtaining management’s analysis and supporting documentation related to the forecast of economic conditions used to determine the probabilities of default, and testing whether the forecasts of economic conditions used in the calculation of the allowance for credit losses on loans are reasonable and supportable.
•Testing the appropriateness of the methodology and assumptions used in the calculation of the allowance for credit losses – loans, and testing the calculation itself, including completeness and accuracy of the data used in the calculation, application of forecasted economic conditions used in the calculation of determining probabilities of default, and recalculation of the impact of the forecast on the allowance for credit losses – loans balance.
/s/ Moss Adams LLP
Portland, OregonEverett, Washington
March 12, 20194, 2022
We have served as the Company’s auditor since 2010.
CONSOLIDATED FINANCIAL STATEMENTS
NORTHRIM BANCORP, INC.
Consolidated Balance Sheets
December 31, 20182021 and 20172020
| | | | December 31,
2018 | | December 31,
2017 | | December 31,
2021 | | December 31,
2020 |
| (In Thousands, Except Share Data) | | (In Thousands, Except Share Data) | |
| ASSETS | | | | ASSETS | | | |
| Cash and due from banks |
| $26,771 |
| |
| $25,016 |
| Cash and due from banks | $20,805 | | | $23,304 | |
| Interest bearing deposits in other banks | 50,767 |
| | 52,825 |
| Interest bearing deposits in other banks | 625,022 | | | 92,661 | |
| Investment securities available for sale | 271,610 |
| | 307,019 |
| |
| Investment securities available for sale, at fair value | | Investment securities available for sale, at fair value | 426,684 | | | 247,633 | |
| Marketable equity securities | 7,265 |
| | 5,731 |
| Marketable equity securities | 8,420 | | | 9,052 | |
| Total portfolio investments | 278,875 |
| | 312,750 |
| |
| Investment securities held to maturity, at amortized cost | | Investment securities held to maturity, at amortized cost | 20,000 | | | 10,000 | |
| Investment in Federal Home Loan Bank stock | 2,101 |
| | 2,115 |
| Investment in Federal Home Loan Bank stock | 3,107 | | | 2,551 | |
| Loans held for sale | 34,710 |
| | 43,979 |
| Loans held for sale | 73,650 | | | 146,178 | |
| Loans | 984,346 |
| | 954,953 |
| Loans | 1,413,886 | | | 1,444,050 | |
| Allowance for loan losses | (19,519 | ) | | (21,461 | ) | |
| Allowance for credit losses, loans | | Allowance for credit losses, loans | (11,739) | | | (21,136) | |
| Net loans | 964,827 |
| | 933,492 |
| Net loans | 1,402,147 | | | 1,422,914 | |
| Purchased receivables, net | 14,406 |
| | 22,231 |
| Purchased receivables, net | 6,987 | | | 13,922 | |
| Mortgage servicing rights, at fair value | 10,821 |
| | 7,305 |
| Mortgage servicing rights, at fair value | 13,724 | | | 11,218 | |
| OREO, net | 7,962 |
| | 8,651 |
| |
| Other real estate owned, net | | Other real estate owned, net | 5,638 | | | 7,289 | |
| Premises and equipment, net | 39,090 |
| | 37,867 |
| Premises and equipment, net | 37,164 | | | 38,102 | |
| Operating lease right-of-use assets | | Operating lease right-of-use assets | 11,001 | | | 12,440 | |
| Goodwill | 15,017 |
| | 15,017 |
| Goodwill | 15,017 | | | 15,017 | |
| Other intangible assets, net | 1,137 |
| | 1,207 |
| Other intangible assets, net | 992 | | | 1,029 | |
| Other assets | 56,504 |
| | 56,141 |
| Other assets | 54,361 | | | 68,488 | |
| Total assets |
| $1,502,988 |
| |
| $1,518,596 |
| Total assets | $2,724,719 | | | $2,121,798 | |
| LIABILITIES | | | | LIABILITIES | | | |
| Deposits: | | | | Deposits: | | | |
| Demand |
| $420,988 |
| |
| $414,686 |
| Demand | $887,824 | | | $643,825 | |
| Interest-bearing demand | 248,056 |
| | 252,009 |
| Interest-bearing demand | 692,683 | | | 459,095 | |
| Savings | 239,054 |
| | 247,458 |
| Savings | 348,164 | | | 308,725 | |
| Money market | 206,717 |
| | 243,603 |
| Money market | 314,996 | | | 237,705 | |
| Certificates of deposit less than $250,000 | 75,318 |
| | 69,283 |
| Certificates of deposit less than $250,000 | 100,851 | | | 92,047 | |
| Certificates of deposit $250,000 and greater | 37,955 |
| | 31,244 |
| Certificates of deposit $250,000 and greater | 77,113 | | | 83,584 | |
| Total deposits | 1,228,088 |
| | 1,258,283 |
| Total deposits | 2,421,631 | | | 1,824,981 | |
| Securities sold under repurchase agreements | 34,278 |
| | 27,746 |
| |
| | Borrowings | 7,241 |
| | 7,362 |
| Borrowings | 14,508 | | | 14,817 | |
| Junior subordinated debentures | 10,310 |
| | 10,310 |
| Junior subordinated debentures | 10,310 | | | 10,310 | |
| Operating lease liabilities | | Operating lease liabilities | 10,965 | | | 12,378 | |
| Other liabilities | 17,124 |
| | 22,093 |
| Other liabilities | 29,488 | | | 37,737 | |
| Total liabilities | 1,297,041 |
| | 1,325,794 |
| Total liabilities | 2,486,902 | | | 1,900,223 | |
| COMMITMENTS AND CONTINGENTCIES (NOTE 18) |
| |
| |
| COMMITMENTS AND CONTINGENCIES (NOTE 19) | | COMMITMENTS AND CONTINGENCIES (NOTE 19) | 0 | | 0 |
| SHAREHOLDERS' EQUITY | | | | SHAREHOLDERS' EQUITY | | | |
| Preferred stock, $1 par value, 2,500,000 shares authorized, none issued or outstanding | — |
| | — |
| Preferred stock, $1 par value, 2,500,000 shares authorized, none issued or outstanding | — | | | — | |
Common stock, $1 par value, 10,000,000 shares authorized, 6,883,216 and 6,871,963 shares
issued and outstanding at December 31, 2018 and December 31, 2017, respectively | 6,883 |
| | 6,872 |
| |
Common stock, $1 par value, 10,000,000 shares authorized, 6,014,813 and 6,251,004 shares issued and outstanding at December 31, 2021 and December 31, 2020, respectively | | Common stock, $1 par value, 10,000,000 shares authorized, 6,014,813 and 6,251,004 shares issued and outstanding at December 31, 2021 and December 31, 2020, respectively | 6,015 | | | 6,251 | |
| Additional paid-in capital | 62,132 |
| | 61,793 |
| Additional paid-in capital | 31,162 | | | 41,808 | |
| Retained earnings | 137,452 |
| | 124,407 |
| Retained earnings | 204,046 | | | 173,498 | |
| Accumulated other comprehensive loss, net of tax | (520 | ) | | (270 | ) | |
| Accumulated other comprehensive (loss) income, net of tax | | Accumulated other comprehensive (loss) income, net of tax | (3,406) | | | 18 | |
| | Total shareholders' equity | 205,947 |
| | 192,802 |
| Total shareholders' equity | 237,817 | | | 221,575 | |
| Total liabilities and shareholders' equity |
| $1,502,988 |
| |
| $1,518,596 |
| Total liabilities and shareholders' equity | $2,724,719 | | | $2,121,798 | |
See notes to consolidated financial statements
NORTHRIM BANCORP, INC.
Consolidated Statements of Income
Years Ended December 31, 2018, 2017,2021, 2020, and 20162019
| | | (In Thousands, Except Share and Per Share Data) | 2018 | | 2017 | | 2016 | (In Thousands, Except Share and Per Share Data) | 2021 | | 2020 | | 2019 |
| Interest Income | | | | | | |
| Interest and Dividend Income | | Interest and Dividend Income | | | | | |
| Interest and fees on loans and loans held for sale |
| $57,542 |
| |
| $55,041 |
| |
| $54,777 |
| Interest and fees on loans and loans held for sale | $79,241 | | | $71,091 | | | $62,150 | |
| Interest on investment securities available for sale | 5,481 |
| | 4,230 |
| | 3,580 |
| Interest on investment securities available for sale | 3,339 | | | 4,832 | | | 6,572 | |
| Dividends on marketable equity securities | 348 |
| | 345 |
| | 315 |
| Dividends on marketable equity securities | 440 | | | 466 | | | 439 | |
| Interest on investment securities held to maturity | — |
| | 59 |
| | 41 |
| Interest on investment securities held to maturity | 1,037 | | | 18 | | | — | |
| Dividends on Federal Home Loan Bank stock | | Dividends on Federal Home Loan Bank stock | 102 | | | 84 | | | 76 | |
| Interest on deposits in other banks | 806 |
| | 433 |
| | 205 |
| Interest on deposits in other banks | 447 | | | 225 | | | 846 | |
| Total Interest Income | 64,177 |
| | 60,108 |
| | 58,918 |
| Total Interest Income | 84,606 | | | 76,716 | | | 70,083 | |
| Interest Expense | | | | | | Interest Expense | | | | | |
| Interest expense on deposits | 2,307 |
| | 1,707 |
| | 1,870 |
| Interest expense on deposits | 3,077 | | | 5,279 | | | 4,961 | |
| Interest expense on securities sold under agreements to repurchase | 50 |
| | 34 |
| | 30 |
| Interest expense on securities sold under agreements to repurchase | — | | | — | | | 40 | |
| Interest expense on borrowings | 223 |
| | 173 |
| | 127 |
| Interest expense on borrowings | 320 | | | 387 | | | 251 | |
| Interest expense on junior subordinated debentures | 389 |
| | 516 |
| | 534 |
| Interest expense on junior subordinated debentures | 382 | | | 385 | | | 389 | |
| Total Interest Expense | 2,969 |
| | 2,430 |
| | 2,561 |
| Total Interest Expense | 3,779 | | | 6,051 | | | 5,641 | |
| Net Interest Income | 61,208 |
| | 57,678 |
| | 56,357 |
| Net Interest Income | 80,827 | | | 70,665 | | | 64,442 | |
| (Benefit) provision for loan losses | (500 | ) | | 3,200 |
| | 2,298 |
| |
| Net Interest Income After Provision for Loan Losses | 61,708 |
| | 54,478 |
| | 54,059 |
| |
| (Benefit) provision for credit losses | | (Benefit) provision for credit losses | (4,099) | | | 2,432 | | | (1,175) | |
| Net Interest Income After (Benefit) Provision for Credit Losses | | Net Interest Income After (Benefit) Provision for Credit Losses | 84,926 | | | 68,233 | | | 65,617 | |
| Other Operating Income | | | | | | Other Operating Income | | | | | |
| Mortgage banking income | 20,844 |
| | 23,287 |
| | 29,507 |
| Mortgage banking income | 42,144 | | | 52,635 | | | 24,201 | |
| Bankcard fees | | Bankcard fees | 3,389 | | | 2,837 | | | 2,976 | |
| Purchased receivable income | 3,255 |
| | 2,975 |
| | 2,347 |
| Purchased receivable income | 2,259 | | | 2,650 | | | 3,271 | |
| Bankcard fees | 2,811 |
| | 2,597 |
| | 2,670 |
| |
| Service charges on deposit accounts | 1,508 |
| | 1,614 |
| | 1,998 |
| Service charges on deposit accounts | 1,297 | | | 1,102 | | | 1,557 | |
| Interest rate swap income | | Interest rate swap income | 452 | | | 949 | | | 964 | |
| Commercial servicing revenue | 1,422 |
| | 372 |
| | 322 |
| Commercial servicing revenue | 306 | | | 527 | | | 624 | |
| Gain on sale of Northrim Benefits Group | — |
| | 4,445 |
| | — |
| |
| Employee benefit plan income | — |
| | 2,506 |
| | 3,770 |
| |
| Gain (loss) on sale of securities | — |
|
| 11 |
|
| (11 | ) | |
| Loss on marketable equity securities | (625 | ) | | — |
| | — |
| |
| Gain on sale of marketable equity securities, net | | Gain on sale of marketable equity securities, net | 67 | | | 98 | | | — | |
| Unrealized (loss) gain on marketable equity securities | | Unrealized (loss) gain on marketable equity securities | (101) | | | 61 | | | 911 | |
| Gain on sale of investment securities available for sale, net | | Gain on sale of investment securities available for sale, net | — | | | — | | | 23 | |
| | Other income | 2,952 |
| | 2,667 |
| | 2,660 |
| Other income | 2,450 | | | 2,469 | | | 2,819 | |
| Total Other Operating Income | 32,167 |
| | 40,474 |
| | 43,263 |
| Total Other Operating Income | 52,263 | | | 63,328 | | | 37,346 | |
| Other Operating Expense | | | | | | Other Operating Expense | | | | | |
| Salaries and other personnel expense | 44,650 |
| | 44,721 |
| | 46,752 |
| Salaries and other personnel expense | 60,412 | | | 61,137 | | | 51,317 | |
| Data processing expense | | Data processing expense | 8,567 | | | 7,668 | | | 7,128 | |
| Occupancy expense | 6,136 |
| | 6,752 |
| | 6,462 |
| Occupancy expense | 7,078 | | | 6,624 | | | 6,607 | |
| Data processing expense | 6,035 |
| | 5,549 |
| | 4,879 |
| |
| Professional and outside services | 2,453 |
| | 2,365 |
| | 2,797 |
| Professional and outside services | 2,801 | | | 3,157 | | | 2,531 | |
| Marketing expense | 2,318 |
| | 2,566 |
| | 2,449 |
| Marketing expense | 2,741 | | | 2,320 | | | 2,373 | |
| Insurance expense | 862 |
| | 1,161 |
| | 1,023 |
| Insurance expense | 1,593 | | | 1,228 | | | 557 | |
| Impairment of equity method investment | 804 |
| | 686 |
| | — |
| |
| OREO expense, net of rental income and gains on sale | 258 |
|
| 837 |
|
| 98 |
| |
| Intangible asset amortization expense | 70 |
|
| 100 |
|
| 135 |
| Intangible asset amortization expense | 37 | | | 48 | | | 60 | |
| Loss on sale of premises and equipment | 2 |
| | 3 |
| | 352 |
| |
| Compensation expense - RML acquisition payments | — |
| | 130 |
| | 4,775 |
| Compensation expense - RML acquisition payments | — | | | — | | | 468 | |
| | OREO (income) expense, net of rental income and gains on sale | | OREO (income) expense, net of rental income and gains on sale | (432) | | | (242) | | | (193) | |
| | Other operating expense | 6,212 |
| | 6,283 |
| | 6,558 |
| Other operating expense | 6,399 | | | 7,174 | | | 5,990 | |
| Total Other Operating Expense | 69,800 |
| | 71,153 |
| | 76,280 |
| Total Other Operating Expense | 89,196 | | | 89,114 | | | 76,838 | |
| Income Before Provision for Income Taxes | 24,075 |
| | 23,799 |
| | 21,042 |
| Income Before Provision for Income Taxes | 47,993 | | | 42,447 | | | 26,125 | |
| Provision for income taxes | 4,071 |
| | 10,321 |
| | 6,052 |
| Provision for income taxes | 10,476 | | | 9,559 | | | 5,434 | |
| Net Income | 20,004 |
| | 13,478 |
| | 14,990 |
| Net Income | $37,517 | | | $32,888 | | | $20,691 | |
| Less: Net income attributable to the noncontrolling interest | — |
| | 327 |
| | 579 |
| |
| Net Income Attributable to Northrim BanCorp, Inc. |
| $20,004 |
| |
| $13,151 |
| |
| $14,411 |
| |
| | Earnings Per Share, Basic |
| $2.91 |
| |
| $1.91 |
| |
| $2.09 |
| Earnings Per Share, Basic | $6.07 | | | $5.18 | | | $3.08 | |
| Earnings Per Share, Diluted |
| $2.86 |
| |
| $1.88 |
| |
| $2.06 |
| Earnings Per Share, Diluted | $6.00 | | | $5.11 | | | $3.04 | |
| Weighted Average Shares Outstanding, Basic | 6,877,573 |
| | 6,889,621 |
| | 6,883,663 |
| Weighted Average Shares Outstanding, Basic | 6,180,801 | | | 6,354,687 | | | 6,708,622 | |
| Weighted Average Shares Outstanding, Diluted | 6,981,557 |
| | 6,977,910 |
| | 6,974,864 |
| Weighted Average Shares Outstanding, Diluted | 6,249,313 | | | 6,431,367 | | | 6,808,209 | |
See notes to consolidated financial statements
NORTHRIM BANCORP, INC.
Consolidated Statements of Comprehensive Income
Years Ended December 31, 2018, 2017,2021, 2020, and 20162019
2010
|
| | | | | | | | | | | |
| (In Thousands) | 2018 | | 2017 | | 2016 |
| Net income |
| $20,004 |
| |
| $13,478 |
| |
| $14,990 |
|
| Other comprehensive income (loss), net of tax: | | | | | |
| Securities available for sale: | | | | | |
| Unrealized holding gains (losses) arising during the period |
| ($692 | ) | |
| $175 |
| |
| $42 |
|
| Reclassification of net (gains) losses included in net income (net of tax | | | | | |
| benefit (expense) of $0, $5, and ($5) in 2018, 2017, and 2016, | | | | | |
respectively)
| — |
| | (6 | ) | | 6 |
|
| Derivatives and hedging activities: | | | | | |
| Unrealized holding gains arising during the period | 423 |
| | 184 |
| | — |
|
| Income tax (expense) benefit related to unrealized gains and losses | 210 |
| | (141 | ) | | (33 | ) |
| Other comprehensive income (loss), net of tax | (59 | ) | | 212 |
| | 15 |
|
| Comprehensive income | 19,945 |
| | 13,690 |
| | 15,005 |
|
| Less: comprehensive income attributable to the noncontrolling interest | — |
| | 327 |
| | 579 |
|
| Comprehensive income attributable to Northrim BanCorp, Inc. |
| $19,945 |
| |
| $13,363 |
| |
| $14,426 |
|
| | | | | | | | | | | | | | | | | |
| (In Thousands) | 2021 | | 2020 | | 2019 |
| Net income | $37,517 | | | $32,888 | | | $20,691 | |
| Other comprehensive income (loss), net of tax: | | | | | |
| Securities available for sale: | | | | | |
| Unrealized holding (losses) gains arising during the period | ($5,564) | | | $411 | | | $2,866 | |
| Reclassification of net gains included in net income (net of tax | | | | | |
| expense of $—, $—, and $7 in 2021, 2020, and 2019, | | | | | |
| respectively) | — | | | — | | | (16) | |
| Derivatives and hedging activities: | | | | | |
| Unrealized holding gains (losses) during the period | 780 | | | (1,201) | | | (1,142) | |
| Income tax benefit (expense) related to unrealized gains and losses | 1,360 | | | 377 | | | (757) | |
| Other comprehensive (loss) income, net of tax | (3,424) | | | (413) | | | 951 | |
| | | | | |
| | | | | |
| Comprehensive income | $34,093 | | | $32,475 | | | $21,642 | |
See notes to consolidated financial statements
NORTHRIM BANCORP, INC.
Consolidated Statements of Changes in Shareholders’ Equity
Years Ended December 31, 2018, 2017,2021, 2020, and 20162019
|
| | | | | | | | | | | | | | | | | | | | | | | | | | |
| | Common Stock | | Additional Paid-in Capital | | Retained Earnings | | Accumulated Other Comprehensive Income (Loss) | | Non-controlling Interest | | Total |
| | Number of Shares | | Par Value | | | | | |
| (In Thousands) | | | | | | |
| Balance at January 1, 2016 | 6,877 |
| |
| $6,877 |
| |
| $62,420 |
| |
| $108,150 |
| |
| ($412 | ) | |
| $179 |
| |
| $177,214 |
|
| Cash dividend declared | — |
| | — |
| | — |
| | (5,420 | ) | | — |
| | — |
| | (5,420 | ) |
| Stock-based compensation expense | — |
| | — |
| | 778 |
| | — |
| | — |
| | — |
| | 778 |
|
| Exercise of stock options and vesting of restricted stock units, net | 21 |
| | 21 |
| | (183 | ) | | — |
| | — |
| | — |
| | (162 | ) |
| Excess tax benefits from share-based payment arrangements | — |
| | — |
| | (63 | ) | | — |
| | — |
| | — |
| | (63 | ) |
| Distributions to noncontrolling interest | — |
| | — |
| | — |
| | — |
| | — |
| | (640 | ) | | (640 | ) |
| Other comprehensive income, net of tax | — |
| | — |
| | — |
| | — |
| | 15 |
| | — |
| | 15 |
|
| Net income attributable to the noncontrolling interest | — |
| | — |
| | — |
| | — |
| | — |
| | 579 |
| | 579 |
|
| Net income attributable to Northrim BanCorp, Inc. | — |
| | — |
| | — |
| | 14,411 |
| | — |
| | — |
| | 14,411 |
|
| Balance at December 31, 2016 | 6,898 |
| |
| $6,898 |
| |
| $62,952 |
| |
| $117,141 |
| |
| ($397 | ) | |
| $118 |
| |
| $186,712 |
|
| Cash dividend declared | — |
| | — |
| | — |
| | (5,970 | ) | | — |
| | — |
| | (5,970 | ) |
| Stock-based compensation expense | — |
| | — |
| | 665 |
| | — |
| | — |
| | — |
| | 665 |
|
| Exercise of stock options and vesting of restricted stock units, net | 32 |
| | 32 |
| | (275 | ) | | — |
| | — |
| | — |
| | (243 | ) |
| Repurchase of common stock | (58 | ) | | (58 | ) | | (1,549 | ) | | — |
| | — |
| | — |
| | (1,607 | ) |
| Distributions to noncontrolling interest | — |
| | — |
| | — |
| | — |
| | — |
| | (445 | ) | | (445 | ) |
| Other comprehensive income, net of tax | — |
| | — |
| | — |
| | — |
| | 212 |
| | — |
| | 212 |
|
| Reclassification for remeasuring of deferred tax asset related to investment securities | — |
| | — |
| | — |
| | 85 |
| | (85 | ) | | — |
| | — |
|
| Net income attributable to the noncontrolling interest | — |
| | — |
| | — |
| | — |
| | — |
| | 327 |
| | 327 |
|
| Net income attributable to Northrim BanCorp, Inc. | — |
| | — |
| | — |
| | 13,151 |
| | — |
| | — |
| | 13,151 |
|
| Balance at December 31, 2017 | 6,872 |
| |
| $6,872 |
| |
| $61,793 |
| |
| $124,407 |
| |
| ($270 | ) | |
| $— |
| |
| $192,802 |
|
| Cash dividend declared | — |
| | — |
| | — |
| | (7,088 | ) | | — |
| | — |
| | (7,088 | ) |
| Stock-based compensation expense | — |
| | — |
| | 816 |
| | — |
| | — |
| | — |
| | 816 |
|
| Exercise of stock options and vesting of restricted stock units, net | 27 |
| | 27 |
| | 1 |
| | — |
| | — |
| | — |
| | 28 |
|
| Repurchase of common stock | (16 | ) | | (16 | ) | | (478 | ) | | — |
| | — |
| | — |
| | (494 | ) |
| Other comprehensive loss, net of tax | — |
| | — |
| | — |
| | — |
| | (59 | ) | | — |
| | (59 | ) |
| Cumulative effect of adoption of accounting principles related to premium amortization of investment securities | — |
| | — |
| | — |
| | (62 | ) | | — |
| | — |
| | (62 | ) |
| Reclassification for cumulative effect of adoption of accounting principles related to fair value measurement of equity securities | | | | | | | 191 |
| | (191 | ) | | | | — |
|
| Net income attributable to Northrim BanCorp, Inc. | — |
| | — |
| | — |
| | 20,004 |
| | — |
| | — |
| | 20,004 |
|
| Balance at December 31, 2018 | 6,883 |
| |
| $6,883 |
| |
| $62,132 |
| |
| $137,452 |
| |
| ($520 | ) | |
| $— |
| |
| $205,947 |
|
| | | | | | | | | | | | | | | | | | | | | | | | | | | | | | | | | | | | |
| | Common Stock | | Additional Paid-in Capital | | Retained Earnings | | Accumulated Other Comprehensive Income (Loss) | | | Total |
| | Number of Shares | | Par Value | | | | |
| (In Thousands) | | | | | |
| Balance at January 1, 2019 | 6,883 | | | $6,883 | | | $62,132 | | | $137,452 | | | ($520) | | | | $205,947 | |
| | | | | | | | | | | | |
| Cash dividend declared | — | | | — | | | — | | | (8,528) | | | — | | | | (8,528) | |
| Stock-based compensation expense | — | | | — | | | 832 | | | — | | | — | | | | 832 | |
| Exercise of stock options and vesting of restricted stock units, net | 24 | | | 24 | | | (231) | | | — | | | — | | | | (207) | |
| Repurchase of common stock | (348) | | | (348) | | | (12,221) | | | — | | | — | | | | (12,569) | |
| | | | | | | | | | | | |
| Other comprehensive income, net of tax | — | | | — | | | — | | | — | | | 951 | | | | 951 | |
| | | | | | | | | | | | |
| | | | | | | | | | | | |
| Net income | — | | | — | | | — | | | 20,691 | | | — | | | | 20,691 | |
| Balance at December 31, 2019 | 6,559 | | | $6,559 | | | $50,512 | | | $149,615 | | | $431 | | | | $207,117 | |
| Cash dividend declared | — | | | — | | | — | | | (8,866) | | | — | | | | (8,866) | |
| Stock-based compensation expense | — | | | — | | | 943 | | | — | | | — | | | | 943 | |
| Exercise of stock options and vesting of restricted stock units, net | 19 | | | 19 | | | (137) | | | — | | | — | | | | (118) | |
| Repurchase of common stock | (327) | | | (327) | | | (9,649) | | | — | | | — | | | | (9,976) | |
| | | | | | | | | | | | |
| Other comprehensive (loss), net of tax | — | | | — | | | — | | | — | | | (413) | | | | (413) | |
| | | | | | | | | | | | |
| Cumulative effect of adoption of accounting principles related to equity compensation expense | — | | | — | | | 139 | | | (139) | | | — | | | | — | |
| Net income | — | | | — | | | — | | | 32,888 | | | — | | | | 32,888 | |
| Balance at December 31, 2020 | 6,251 | | | $6,251 | | | $41,808 | | | $173,498 | | | $18 | | | | $221,575 | |
| Cash dividend declared | — | | | — | | | — | | | (9,369) | | | — | | | | (9,369) | |
| Stock-based compensation expense | — | | | — | | | 1,073 | | | — | | | — | | | | 1,073 | |
| Exercise of stock options and vesting of restricted stock units, net | 43 | | | 43 | | | (464) | | | — | | | — | | | | (421) | |
| Repurchase of common stock | (279) | | | (279) | | | (11,255) | | | — | | | — | | | | (11,534) | |
| | | | | | | | | | | | |
| Other comprehensive (loss), net of tax | — | | | — | | | — | | | — | | | (3,424) | | | | (3,424) | |
| | | | | | | | | | | | |
| | | | | | | | | | | | |
| Cumulative effect of adoption of ASU 2016-13 | — | | | — | | | — | | | 2,400 | | | — | | | | 2,400 | |
| Net income | — | | | — | | | — | | | 37,517 | | | — | | | | 37,517 | |
| Balance at December 31, 2021 | 6,015 | | | $6,015 | | | $31,162 | | | $204,046 | | | ($3,406) | | | | $237,817 | |
See notes to consolidated financial statements
NORTHRIM BANCORP, INC.
Consolidated Statements of Cash Flows
Years Ended December 31, 2018, 2017,2021, 2020, and 20162019
| | | | | | | | | | | | | | | | | |
| (In Thousands) | 2021 | | 2020 | | 2019 |
| Operating Activities: | | | | | |
| Net income | $37,517 | | | $32,888 | | | $20,691 | |
| Adjustments to Reconcile Net Income to Net Cash Provided by Operating Activities: | | | | | |
| Gain on sale of securities, net | (67) | | | (98) | | | (23) | |
| Loss on sale of premises and equipment | — | | | 22 | | | — | |
| Depreciation and amortization of premises | 3,276 | | | 3,147 | | | 2,986 | |
| Amortization of software | 1,161 | | | 1,104 | | | 1,019 | |
| Intangible asset amortization | 37 | | | 48 | | | 60 | |
| Amortization of investment security premium, net of discount accretion | 529 | | | 19 | | | (15) | |
| Unrealized loss (gain) on marketable equity securities | 101 | | | (61) | | | (911) | |
| Deferred tax (income) expense | (1,298) | | | 555 | | | 711 | |
| Stock-based compensation | 1,073 | | | 943 | | | 832 | |
| | | | | |
| Deferral of loan fees and amortization, net of costs | (192) | | | 6,650 | | | 598 | |
| Provision (benefit) for credit losses | (4,099) | | | 2,432 | | | (1,175) | |
| Benefit for purchased receivables | — | | | (21) | | | (96) | |
| | | | | |
| Additions to home mortgage servicing rights carried at fair value | (6,088) | | | (4,824) | | | (3,707) | |
| Change in fair value of home mortgage servicing rights carried at fair value | 3,582 | | | 5,526 | | | 2,608 | |
| Change in fair value of commercial servicing rights carried at fair value | 437 | | | 99 | | | (6) | |
| Gain on sale of loans | (36,436) | | | (46,258) | | | (19,813) | |
| Proceeds from the sale of loans held for sale | 1,227,150 | | | 1,263,325 | | | 670,986 | |
| Origination of loans held for sale | (1,118,186) | | | (1,295,411) | | | (684,297) | |
| Gain on sale of other real estate owned | (685) | | | (391) | | | (380) | |
| | | | | |
| Net changes in assets and liabilities: | | | | | |
| Decrease (increase) in accrued interest receivable | 1,133 | | | (3,467) | | | 305 | |
| Decrease (increase) in other assets | 12,739 | | | (15,096) | | | 6,395 | |
| (Decrease) increase in other liabilities | (9,695) | | | 12,415 | | | 2,411 | |
| Net Cash Provided (Used) by Operating Activities | 111,989 | | | (36,454) | | | (821) | |
| Investing Activities: | | | | | |
| Investment in securities: | | | | | |
| Purchases of investment securities available for sale | (320,501) | | | (160,423) | | | (132,104) | |
| Purchases of marketable equity securities | (493) | | | (1,552) | | | — | |
| Purchases of FHLB stock | (573) | | | (5,931) | | | (880) | |
| Purchases of investment securities held to maturity | (10,000) | | | (10,000) | | | — | |
| Proceeds from sales/calls/maturities of securities available for sale | 135,365 | | | 189,323 | | | 130,482 | |
| Proceeds from sales of marketable equity securities | 1,084 | | | 601 | | | 229 | |
| | | | | |
| | | | | |
| | | | | |
| Proceeds from redemption of FHLB stock | 17 | | | 5,518 | | | 843 | |
| Decrease (increase) in purchased receivables, net | 6,935 | | | 10,472 | | | (9,871) | |
| Decrease (increase) in loans, net | 28,975 | | | (408,365) | | | (58,879) | |
| Proceeds from sale of other real estate owned | 2,610 | | | 797 | | | 1,299 | |
| | | | | |
| Purchases of software | (170) | | | (416) | | | (721) | |
| | | | | |
| Purchases of premises and equipment | (2,338) | | | (2,849) | | | (2,318) | |
| Net Cash (Used) Provided by Investing Activities | (159,089) | | | (382,825) | | | (71,920) | |
| Financing Activities: | | | | | |
| Increase in deposits | 596,650 | | | 452,630 | | | 144,263 | |
| (Decrease) increase in securities sold under repurchase agreements | — | | | — | | | (34,278) | |
| Proceeds from borrowings | — | | | 110,610 | | | 1,817 | |
| Repayments of borrowings | (309) | | | (104,684) | | | (167) | |
| | | | | |
| | | | | |
| Proceeds from the issuance of common stock | 1,543 | | | 84 | | | 73 | |
| Repurchase of common stock | (11,534) | | | (9,976) | | | (12,569) | |
| | | | | |
| Cash dividends paid | (9,388) | | | (8,844) | | | (8,512) | |
| Net Cash Provided by Financing Activities | 576,962 | | | 439,820 | | | 90,627 | |
| Net Change in Cash and Cash Equivalents | 529,862 | | | 20,541 | | | 17,886 | |
| Cash and Cash Equivalents at Beginning of Year | 115,965 | | | 95,424 | | | 77,538 | |
| Cash and Cash Equivalents at End of Year | $645,827 | | | $115,965 | | | $95,424 | |
| | | | | |
| | | | | |
|
| | | | | | | | | | | |
| (In Thousands) | 2018 | | 2017 | | 2016 |
| Operating Activities: | | | | | |
| Net income |
| $20,004 |
| |
| $13,478 |
| |
| $14,990 |
|
| Adjustments to Reconcile Net Income to Net Cash Provided by Operating Activities: | |
| | |
| | |
|
| Loss (gain) on sale of securities, net | — |
| | (11 | ) | | 11 |
|
| Loss on sale of premises and equipment | 2 |
| | 3 |
| | 352 |
|
| Gain on sale of Northrim Benefits Group | — |
| | (4,445 | ) | | — |
|
| Depreciation and amortization of premises and equipment | 2,283 |
| | 2,867 |
| | 2,439 |
|
| Amortization of software | 911 |
| | 675 |
| | 157 |
|
| Intangible asset amortization | 70 |
| | 100 |
| | 135 |
|
| Amortization of investment security premium, net of discount accretion | 199 |
| | 332 |
| | 27 |
|
| Change in fair value of marketable equity securities | 625 |
| | — |
| | — |
|
| Deferred tax expense (benefit) | 3,014 |
| | 4,004 |
| | (325 | ) |
| Stock-based compensation | 816 |
| | 665 |
| | 778 |
|
| Excess tax expense from share-based payment arrangements | — |
| | — |
| | 63 |
|
| Deferral of loan fees and costs, net | 331 |
| | (278 | ) | | (178 | ) |
| (Benefit) provision for loan losses | (500 | ) | | 3,200 |
| | 2,298 |
|
| (Benefit) reserve for purchased receivables | (10 | ) | | 29 |
| | (10 | ) |
| Originations of home mortgage servicing rights carried at fair value | (3,641 | ) | | (3,146 | ) | | (3,029 | ) |
| Change in fair value of home mortgage servicing rights carried at fair value | 125 |
| | (2 | ) | | 526 |
|
| Change in fair value of commercial servicing rights carried at fair value | (972 | ) | | — |
| | — |
|
| Gain on sale of loans | (14,822 | ) | | (18,013 | ) | | (25,413 | ) |
| Proceeds from the sale of loans held for sale | 551,607 |
| | 571,909 |
| | 768,169 |
|
| Origination of loans held for sale | (527,516 | ) | | (554,078 | ) | | (735,799 | ) |
| Gain on sale of other real estate owned | (3 | ) | | (371 | ) | | (295 | ) |
| Impairment on other real estate owned | — |
| | 904 |
| | 187 |
|
| Impairment on equity method investment | 804 |
| | 686 |
| | — |
|
| Net changes in assets and liabilities: | |
| | | | |
| Increase in accrued interest receivable | (432 | ) | | (651 | ) | | (114 | ) |
| (Increase) decrease in other assets | (2,512 | ) | | 841 |
| | 10,015 |
|
| Increase (decrease) in other liabilities | (5,233 | ) | | 586 |
| | (14,861 | ) |
| Net Cash Provided by Operating Activities | 25,150 |
| | 19,284 |
| | 20,123 |
|
| Investing Activities: | |
| | |
| | |
|
| Investment in securities: | |
| | | | |
| Purchases of investment securities available for sale | (88,139 | ) | | (84,339 | ) | | (145,707 | ) |
| Purchases of marketable equity securities | (2,992 | ) | | — |
| | — |
|
| Purchases of FHLB stock | — |
| | (3,665 | ) | | (751 | ) |
| Proceeds from sales/calls/maturities of securities available for sale | 122,644 |
| | 102,660 |
| | 105,621 |
|
| Proceeds from calls/maturities of marketable equity securities | 783 |
| | — |
| | — |
|
| Proceeds from calls/maturities of securities held to maturity | — |
| | 890 |
| | — |
|
| Proceeds from redemption of FHLB stock | 14 |
| | 3,515 |
| | 602 |
|
| (Increase) decrease in purchased receivables, net | 7,835 |
| | (1,769 | ) | | (7,155 | ) |
| (Increase) decrease in loans, net | (31,852 | ) | | 12,278 |
| | 1,160 |
|
| Proceeds from sale of other real estate owned | 1,522 |
| | 3,302 |
| | 934 |
|
| Proceeds from the sale of Northrim Benefits Group | — |
| | 4,625 |
| | — |
|
| Investment in other real estate owned | (144 | ) | | — |
| | (311 | ) |
| Purchases of software | (517 | ) | | (5,680 | ) | | — |
|
| Proceeds from sales of premises and equipment | 3 |
| | 116 |
| | 1,401 |
|
| Purchases of premises and equipment | (3,511 | ) | | (1,555 | ) | | (3,293 | ) |
| Net Cash Provided (Used) by Investing Activities | 5,646 |
| | 30,378 |
| | (47,499 | ) |
| Financing Activities: | |
| | | | |
| (Decrease) increase in deposits | (30,195 | ) | | (9,370 | ) | | 26,861 |
|
| Increase (decrease) in securities sold under repurchase agreements | 6,532 |
| | 139 |
| | (3,813 | ) |
| Proceeds from borrowings | — |
| | 3,097 |
| | 2,265 |
|
| Repayments of borrowings | (121 | ) | | (73 | ) | | (47 | ) |
| Distributions to noncontrolling interest | — |
| | (445 | ) | | (640 | ) |
| Repayment of junior subordinated debentures | — |
| | (8,248 | ) | | — |
|
| Proceeds from the issuance of common stock | 243 |
| | 100 |
| | — |
|
| Repurchase of common stock | (494 | ) | | (1,607 | ) | | — |
|
| Cash dividends paid | (7,064 | ) | | (5,965 | ) | | (5,372 | ) |
| | | | | | | | | | | | | | | | | |
| Supplemental Information: | | | | | |
| Income taxes paid | $6,380 | | | $7,790 | | | $1,658 | |
| Interest paid | $3,813 | | | $6,009 | | | $5,640 | |
| Noncash commitments to invest in Low Income Housing Tax Credit Partnerships | $— | | | $— | | | $11,267 | |
| Transfer of loans to other real estate owned | $274 | | | $652 | | | $— | |
| Loans made to facilitate sales of other real estate owned | $1,012 | | | $— | | | $— | |
| Non-cash lease liability arising from obtaining right of use assets | $79 | | | $370 | | | $1,234 | |
| Cash dividends declared but not paid | $92 | | | $98 | | | $89 | |
| Cumulative effect adjustment to retained earnings | $2,400 | | | ($139) | | | $— | |
| | | | | |
| | | | | |
| | | | | |
|
| | | | | | | | | | | |
| Net Cash (Used) Provided by Financing Activities | (31,099 | ) | | (22,372 | ) | | 19,254 |
|
| Net Change in Cash and Cash Equivalents | (303 | ) | | 27,290 |
| | (8,122 | ) |
| Cash and Cash Equivalents at Beginning of Year | 77,841 |
| | 50,551 |
| | 58,673 |
|
| Cash and Cash Equivalents at End of Year |
| $77,538 |
| |
| $77,841 |
| |
| $50,551 |
|
| | | | | | |
| Supplemental Information: | |
| | | | |
| Income taxes paid |
| $1,766 |
| |
| $7,764 |
| |
| $4,414 |
|
| Interest paid |
| $2,971 |
| |
| $2,470 |
| |
| $2,553 |
|
| Noncash commitments to invest in Low Income Housing Tax Credit Partnerships |
| $— |
| |
| $— |
| |
| $6,809 |
|
| Transfer of loans to other real estate owned |
| $686 |
| |
| $5,912 |
| |
| $4,036 |
|
| Cash dividends declared but not paid |
| $72 |
| |
| $53 |
| |
| $48 |
|
See notes to consolidated financial statements
NOTES TO THE CONSOLIDATED FINANCIAL STATEMENTS
NOTE 1 - Summary of Significant Accounting Policies
Nature of Operations: Northrim BanCorp, Inc. (the “Company”), is a publicly traded bank holding company headquartered in Anchorage, Alaska that is primarily engaged in the delivery of business and personal banking services through its wholly-owned banking subsidiary, Northrim Bank ("the Bank"). The Bank also engages in retail mortgage origination services through its wholly-owned subsidiary, Residential Mortgage Holding Company, LLC, (“RML”the parent company of Residential Mortgage, LLC (collectively “RML”). Additionally, the Bank through its wholly-owned subsidiary, Northrim Funding Services ("NFS"), operates a factoring division in Bellevue, Washington. Related companies include Pacific Wealth Advisors, LLC (“PWA”) and Homestate Mortgage Company, LLC ("Homestate"). The Company has aan equity investment in PWA through its wholly owned subsidiary, Northrim Investment Services Company ("NISC"), and the Company has aan equity investment in Homestate through RML. The Company also owned a 50.1% ownership interest in Northrim Benefits Group, LLC ("NBG") from 2005 until the Company sold all
Use of its interest in the assets of NBG in August of 2017.
Method of Accounting:Estimates: The Company prepares its consolidated financial statements in conformity with accounting principles generally accepted in the United States and prevailing practices within the banking industry. The preparation of consolidated financial statements in conformity with accounting principles generally accepted in the United States (“GAAP”) requires management to make estimates and assumptions that affect the reported amounts of assets and liabilities, the disclosure of contingent assets and liabilities at the date of the consolidated financial statements, and the reported amounts of income, gains, expenses, and losses during the reporting periods. Actual results could differ from those estimates. Significant estimates include the allowance for loan losses (“Allowance”), valuation of goodwill and other intangibles, valuation of other real estate owned (“OREO”), valuation of mortgage servicing rights, and fair value disclosures.
Consolidation: The Company consolidates affiliates in which we have a controlling interest. The accompanying consolidated financial statements include the accounts of the Company, the Bank, RML, NBG, and Northrim Investment Services Company (“NISC”).NISC. Significant intercompany balances have been eliminated in consolidation. As of December 31, 2018,2021, the Company had one1 wholly-owned business trust subsidiary, Northrim Statutory Trust 2 ("Trust"Trust 2") that was formed to issue trust preferred securities and related common securities of the Trust.Trust 2. The Company has not consolidated the accounts of the Trust 2 in its consolidated financial statements in accordance with Financial Accounting Standards Board (“FASB”) Accounting Standards Codification (“FASB”ASC”) ASC 810, Consolidation (“ASC 810”). As a result, the junior subordinated debentures issued by the Company to the Trust 2 are reflected on the Company’s consolidated balance sheet as junior subordinated debentures. The Company has determined that PWA and Homestate are not variable interest entities and therefore, the Company does not consolidate the balance sheets and income statements of PWA or Homestate into its financial statements. The Company's investmentsCompany owns a 24% interest in PWA and a 30% interest in Homestate Mortgage Company, LLC, and these investments are accounted for as equity method investments. Results of PWA and Homestate are included in "Other income" in our Consolidated Statements of Income. Investments in associatedother companies are presented on a one-line basis in the caption “Other assets” in our Consolidated Balance Sheets.
Operating Segments:Public enterprises are required to report certain information about theirIn accordance with ASC 280, Segment Reporting, operating segments are defined as components of an enterprise about which separate financial information is available that is evaluated regularly by the chief operating decision maker ("CODM"), or decision making group, in a complete set of financial statementsdeciding how to shareholders.allocate resources and in assessing performance. The basisCompany uses the "management approach" in determining reportable operating segments. The management approach considers the internal organization and reporting used the by the Company's CODM for making operating decisions and assessing performance as the source for determining the Company's reportable segments. Management, including the CODM, review operating results by the revenue of different services. For the year ended December 31, 2021 and 2020, the Company has 2 operating business lines; Community Banking and Home Mortgage Lending. Information about the Company's operating segments is included in Note 26 of the mannerNotes to the Company's Consolidated Financial Statements included in which management operates the business. Management has identified two primary business segments; Community Banking and Home Mortgage Lending.Part II. Item 8 of this report.
Reclassifications: Certain reclassifications have been made to prior year amounts to maintain consistency with the current year with no impact on net income or total shareholders’ equity.
Subsequent Events: The Company has evaluated events and transactions subsequent to December 31, 20182021 for potential recognition or disclosure.
Cash and Cash Equivalents: For purposes of reporting cash flows, cash and cash equivalents include cash on hand, amounts due from banks, interest-bearing deposits with other banks, federal funds sold, and securities with original maturities of less than 90 days at acquisition.
Equity Securities:Marketable Securities: Marketable securities are equity investments excluding those accounted for under the equity method of accounting or those that result in consolidation of the investee. Marketable securities are stated at fair value. Changes in fair value are included in "Gain"Unrealized gain (loss) on marketable equity securities" in our Consolidated Statements of Net Income.
Non-marketable equity securities are accounted for under the equity method of accounting and are included in other assets in our Consolidated Balance Sheets. The Company performs an impairment analysis on it's non-marketable equity securities when events or circumstances indicate impairment potentially exists.
Investment Securities: Debt securities are classified as available for sale if the Company intends and has the ability to hold those securities for an indefinite period of time, but not necessarily to maturity. Any decision to sell a debt security classified as available for sale would be based on various factors, including significant movements in interest rates, changes in the maturity mix of assets and liabilities, liquidity needs, regulatory capital considerations, and other similar factors. Premiums and discounts are amortized over the life of the related investment security as an adjustment to yield using the effective interest method. Dividend and interest income are recognized when earned.
Securities available for sale are stated at fair value with unrealizedvalue. Realized gains or losses, determined on the basis of the cost of specific securities sold, are included in earnings. Unrealized holding gains andor losses net of tax, excluded from earnings and reportedare included in other comprehensive income as a separate component of other comprehensive income, unless an unrealized loss is deemed other than temporary. Gains and losses on available for sale securities sold are determined on a specific identification basis.shareholders' equity, net of tax.
Held to maturity securities are stated at cost, adjusted for amortization of premium and accretion of discount on a level-yield basis. The Company has the ability and intent to hold these securities to maturity.
The Company amortizes purchase premiums for callable debt securities to the earliest call date.date and discounts are accreted over the contractual life.
A decline in the market value of anyAllowance for Credit Losses - Investment Securities: For available for sale or held to maturity security below cost that is deemed other than temporary resultsdebt securities in a charge to earnings andan unrealized loss position, the establishment of a new cost basis forCompany evaluates the security. Unrealized investment securities losses are evaluated at least quarterly on a specific identification basis to determine whether such declines in value should be considered "other than temporary" and therefore be subject to immediate loss recognition in income. Although these evaluations involve significant judgment, an unrealized lossthe decline in the fair value below the amortized cost basis (impairment) is due to credit-related factors or noncredit-related factors. Any impairment that is not credit related is recognized in other comprehensive income, net of a debt securityapplicable taxes. Credit-related impairment is generally deemedrecognized as an allowance for credit losses (“ACL”) on the balance sheet, limited to be temporary whenthe amount by which the amortized cost basis exceeds the fair value, ofwith a corresponding adjustment to earnings. The ACL may be reversed if conditions change. However, if the security is below the carrying value primarily due to changes in interest rates and there has not been significant deterioration in the financial condition of the issuer. The Company does not intendintends to sell nor is itan impaired available for sale debt security or more likely than not that it will be required to sell such a security before recovering its amortized cost basis, the entire impairment amount must be recognized in earnings with a corresponding adjustment to the security’s amortized cost basis. Because the security’s amortized cost basis is adjusted to fair value, there is no ACL in such a situation.
In evaluating available for sale debt securities whose marketin unrealized loss positions for impairment and the criteria regarding its intent or requirement to sell such securities, the Company considers the extent to which fair value is less than carrying value. Because it is more likely than not thatamortized cost, whether the Company will hold these investments until a market price recoverysecurities are issued by the federal government or maturity, these investments are not consideredits agencies, whether downgrades by bond rating agencies have occurred, and the results of reviews of the issuers’ financial condition, among other than temporarily impaired. Other factors that may be considered in determining whether a declinefactors.
Changes in the valueACL are recorded as provision for (or reversal of) credit loss expense. Losses are charged against the ACL when management believes the uncollectability of an available for sale debt security is "other than temporary" include the financial condition, capital strength, and near-term prospectsconfirmed or when either of the issuer; actionscriteria regarding intent or requirement to sell is met.
The ACL on held to maturity securities is estimated on a collective basis by major security type. At December 31, 2021, the Company’s held to maturity securities consisted of commercial banks or other lenders relative toinvestments in corporate bonds. Expected credit losses for these securities are estimated using a discounted cash flow ("DCF") methodology which considers historical credit loss information that is adjusted for current conditions and reasonable and supportable forecasts.
Accrued interest receivable is excluded from the continued extensionestimate of credit facilities to the issuer of the security; recommendations of investment advisors or market analysts; and ratings by recognized rating agencies.losses.
Federal Home Loan Bank Stock: The Company’s investment in Federal Home Loan Bank of Des Moines (“FHLB”) stock is carried at par value because the shares can only be redeemed with the FHLB at par. The Company is required to maintain a minimum level of investment in FHLB stock based on the Company’s total Bank assets and outstanding advances. FHLB stock is carried at cost and is subject to recoverability testing at least annually.
Loans held for sale: The Company designates loans held for sale as either carried at fair value or the lower of cost or fair value at loan level at origination. Loans held for sale include residential mortgage loans that have been originated for sale in the secondary market. Related gains or losses on the sale of these loans are recognized in mortgage banking income.
Loans: Loans are carried at their principal amount outstanding, net of charge-offs, unamortized fees, and direct loan origination costs. Loan origination fees received in excess of direct origination costs are deferred and accreted to interest income using the interest method in accordance with ASC 310 over the life of the loan. Loan balances are charged-off to the AllowanceACL when management believes that collection of principal is unlikely. Interest income on loans is accrued and recognized on the principal amount outstanding except for loans in a nonaccrual status. All classes of loans are placed on nonaccrual when management believes doubt exists as to the collectability of the interest or principal. Cash payments received on nonaccrual loans are directly applied to the principal balance. Generally, a loan may be returned to accrual status when the delinquent principal and interest is brought current in accordance with the terms of the loan agreement and certain ongoing performance criteria have been met. Loans are reported as past due when installment payments, interest payments, or maturity payments are past due based on contractual terms.
The Company considers a loan to be impaired when it is probable that it will be unable to collect all amounts due according to the contractual terms of the loan agreement. Once a loan is determined to be impaired, the impairment is measured based on the present value of the expected future cash flows discounted at the loan’s effective interest rate, unless the loan is collateral dependent, in which case the impairment is measured by using the fair value of the loan’s collateral. Nonperforming loans greater than $50,000 are individually evaluated for impairment based upon the borrower’s overall financial condition, resources, and payment record, and the prospects for support from any financially responsible guarantors.
The Company uses either in-house evaluations or external appraisals to estimate the fair value of collateral-dependent impaired loans as of each reporting date. The Company’s determination of which method to use is based upon several factors. The Company takes into account compliance with legal and regulatory guidelines, the amount of the loan, the estimated value of the collateral, the location and type of collateral to be valued, and how critical the timing of completion of the analysis is to the assessment of value. Those factors are balanced with the level of internal expertise, internal experience, and market information available, versus external expertise available such as qualified appraisers, brokers, auctioneers, and equipment specialists.
The Company uses external appraisals to estimate fair value for projects that are not fully constructed as of the date of valuation. These projects are generally valued as if complete, with an appropriate allowance for cost of completion, including contingencies developed from external sources such as vendors, engineers, and contractors.
The Company classifies fair value measurements using observable inputs, such as external appraisals, as level 2 valuations in the fair value hierarchy, and fair value measurements with unobservable inputs, such as in-house evaluations, as level 3 valuations in the fair value hierarchy.
When the fair value measurement of the impaired loan is less than the recorded amount of the loan, an impairment is recognized by recording a charge-off to the Allowance or by designating a specific reserve in accordance with GAAP. The Company’s policy is to record cash payments received on impaired loans that are not also nonaccrual loans in the same manner that cash payments are applied to performing loans.
A loan is classified as a troubled debt restructuring ("TDR") when a borrower is experiencing financial difficulties that lead to a restructuring of the loan, and the Company grants concessions to the borrower in the restructuring that it would not otherwise consider. These concessions may include interest rate reductions, principal forgiveness, extension of maturity date and other actions intended to minimize potential losses. Generally, a nonaccrual loan that is restructured remains on nonaccrual status for a period of at least six months to demonstrate that the borrower can meet the restructured terms. If the borrower's performance under the new terms is not reasonably assured, the loan remains classified as a nonaccrual loan. Interest on TDRs will be accrued at the restructured rates when it is anticipated that no loss of original principal will occur, and the interest can be collected, which is generally after a period of six months.
Loan origination fees receivedThe Company classifies fair value measurements on loans as level 3 valuations in excessthe fair value hierarchy because of direct origination costs are deferred and accreted to interest income using a method approximating the level-yield method over the lifetheir use of the loan.unobservable inputs.
Acquired Loans: Loans purchased without more-than-insignificant credit deterioration are recorded at their fair value at the acquisition date. Loans purchased with more-than-insignificant credit deterioration will be recorded with their applicable allowance for credit loss to determine amortized cost basis.
Allowance for Credit discountsLosses - Loans: Under the current expected credit loss model adopted by the Company on January 1, 2021, the ACL on loans is a valuation allowance estimated at each balance sheet date that is deducted from the loans’ amortized cost basis to present the net amount expected to be collected on the loans.
The Company estimates the ACL on loans based on the underlying assets’ amortized cost basis, which is the amount at which the loan is originated or acquired, adjusted for applicable accretion or amortization of premium, discount, and net deferred fees or costs, collection of cash, and charge-offs. In the event that collection of principal becomes uncertain, the Company has policies in place to reverse accrued interest in a timely manner. Therefore, the Company has made a policy election to exclude accrued interest from the measurement of ACL.
Expected credit losses are reflected in the ACL through a provision for or (reversal) of credit loss expense. When the Company deems all or a portion of a financial asset to be uncollectible the appropriate amount is written off and the ACL is reduced by the same amount. The Company applies judgment to determine when a financial asset is deemed uncollectible; however, generally speaking, an asset will be considered uncollectible when management believes that collection of principal is unlikely. Subsequent recoveries, if any, are credited to the ACL when received.
The Company measures expected credit losses of financial assets on a collective (pool) basis, when the financial assets share similar risk characteristics. Depending on the nature and size of the pool of financial assets with similar risk characteristics, the Company uses either a DCF method or a weighted average remaining life method to estimate expected credit losses quantitatively. The weighted average remaining life method uses exposure at default, along with the expected credit losses adjusted for prepayments to calculate the required allowance. The Company utilizes peer historical loss data to estimate credit losses under the weighted average remaining life method. Under the DCF method, the Company utilizes complex models to obtain reasonable and supportable forecasts to calculate two predictive metrics, the probability of default ("PD") and loss given default ("LGD"). Under the DCF method the combination of adjustments for the credit expectations PD and LGD, and timing expectations (prepayment, curtailment, and time to recovery), produces an expected cash flow stream at the instrument level. Instrument effective yield is calculated, net of the impacts of prepayment assumptions, and the instrument expected cash flows are then discounted at that effective yield to produce an instrument-level net present value of expected cash flows (“NPV”). An ACL is established for the difference between the instrument’s NPV and amortized cost basis.
In addition to the quantitative portion of the ACL derived using either the DCF or weighted average remaining life method, the Company also considers the effects of the qualitative factors in its calculation of expected losses in the loan
portfolio. The qualitative factor methodology is based on quantitative metrics, but also includes a high degree of subjectivity and changes in any of the metrics could have a significant impact on our calculation of the allowance.
Loans that do not share risk characteristics with other loans in the portfolio are individually evaluated for expected credit losses and are not included in the determinationcollective evaluation. Loans are identified for individual evaluation during regular credit reviews of fair value; therefore, an allowancethe portfolio. A loan is generally identified for loan losses isindividual evaluation when management determines that we will probably not recorded at the acquisition date. Purchased loans are evaluated upon acquisition and classified as either purchased credit impaired or purchased non-credit-impaired. Purchased credit impaired loans reflect credit deterioration since origination such that it is probable at acquisition that the Company will be unableable to collect all contractually requiredamounts due according to the loan contract, including scheduled interest payments.
Purchased When we identify a loan for individual evaluation, we measure expected credit impaired loans were individually evaluatedlosses using DCF, except when the sole remaining source of the repayment for credit impairment at acquisition using expected future cash flows or the estimated value of underlying collateral. A purchased credit impaired loan will be removed from impaired loans only if the loan is sold, foreclosed, or assets are received in full satisfactionthe liquidation of the loan, and it will be removed from impaired loans at its carrying value. If an individual loan is removed,collateral. In these cases, we use the difference between its relative carrying amount and its cash,current fair value of the collateral, or other assets received will be recognized in other income immediately as a gain and would not affect the effective yield used to recognize the accretable yield on purchased credit impaired loans.
less selling costs, instead of DCF. The excessanalysis of the undiscounted contractual balances due over the cash flows expected to be collected is considered to be the nonaccretable difference. The nonaccretable difference represents our estimate of the credit losses expected to occur and was considered in determining the fair value of the purchased credit impaired loans as of the acquisition date. Subsequent to the acquisition date, any increases in expected cash flows over those expected at purchase date in excess of fair value are adjusted through an increase to the accretable yield on a prospective basis. The purchased credit impaired loans are and will continue to be subject to the Company’s internal and external credit review and monitoring. If credit deterioration is experienced subsequent to the initial acquisition fair value amount, such deterioration will be measured, and a charge-off will be recorded.
For purchased non-credit-impaired loans, the difference between the fair value and unpaid principal balance of the loan at the acquisition date is amortized or accreted to interest income over the estimated life of the loans.
For the purpose of estimating the Allowance, the Company has evaluated the credit quality of purchased non-credit-impaired loans separately from loans that were originated by the Company and has applied different qualitative factors to these loans. Purchased non-credit-impaired loans that have been identified as impaired subsequent to the merger are included in the Company's normal process for reporting impaired loans and calculation of a specific valuation allowance.
Allowance for Loan Losses: The Allowance for Loan Losses is management’s best estimate of probable losses inherent in its loan portfolio. Accordingly, the methodology is based on historical loss experience by loan segment and class with adjustments for current events and conditions. The Company’s process for determining the appropriate level of the Allowance for probable loan losses is designed to account for credit deterioration as it occurs. The provision for loan losses reflects loan quality trends, including levels of and trends related to past due and nonaccrual loans, net charge-offs or recoveries, and other factors. The Company has identified the following segments: commercial, real estate construction one-to-four family, real estate construction other, real estate term owner occupied, real estate term non-owner occupied, real estate term other, consumer loans secured by 1st deeds of trust, and other consumer loans. Then the Company further disaggregates each segment into the following classes, which are also known as asset quality ratings: pass (grades 1-6), special mention (grade 7), substandard (grade 8), doubtful (grade 9), and loss (grade 10).
The level of the Allowance reflects management’s continuing evaluation of industry concentrations, specific credit risks, loan loss experience, current loan portfolio quality, present economic, political and regulatory conditions and unidentified losses
inherent in the current loan portfolio. Portions of the allowance may be allocated for specific credits; however, the entire allowance is available for any credit that, in management’s judgment, should be charged off. While management utilizes its best judgment and information available, the ultimate adequacy of the Allowance is dependent upon a variety of factors beyond the Company’s control including, among other things, the performance of the Company’s loan portfolio, the economy, changes in interest rates, and the view of the regulatory authorities toward loan classification.
The Company’s Allowance consists of three elements: (1) specific valuation allowances based on probable losses on specific loans, (2) general valuation allowances based on historical loan loss experience for similar loans with similar characteristics and trends, adjusted as necessary to reflect the impact of current conditions, and (3) unallocated general valuation allowances based on general economic conditions and other qualitative risk factors both internal and external to the Company.
The specific valuation allowance is an allocated allowance for impaired loans. This analysis is based upon a specific analysis for each impaired loan that is collateral dependent includingloans includes external appraisals andor in-house evaluations on loans secured by real property, management’s assessment of the current market, recent payment history and an evaluation of other sources of repayment. The Company’s determination of which method to use is based upon several factors. The Company obtains appraisals on realtakes into account compliance with legal and personal property that secure its loans duringregulatory guidelines, the amount of the loan, origination processthe estimated value of the collateral, the location and type of collateral to be valued, and how critical the timing of completion of the analysis is to the assessment of value. Those factors are balanced with the level of internal expertise, internal experience, and market information available, versus external expertise available such as qualified appraisers, brokers, auctioneers, and equipment specialists. The Company uses external appraisals to estimate fair value for projects that are not fully constructed as of the date of valuation. These projects are generally valued as if complete, with an appropriate allowance for cost of completion, including contingencies developed from external sources such as vendors, engineers, and contractors.
The Company’s estimate of the ACL reflects losses expected over the remaining contractual life of the assets. The contractual term does not consider extensions, renewals or modifications unless the Company has identified an expected troubled debt restructuring.
The Company’s ACL reflects all effects of a TDR when an individual asset is specifically identified as a reasonably expected TDR. The Company has determined that a TDR is reasonably expected no later than the point when the lender concludes that modification is the best course of action and it is at least reasonably possible that the troubled borrower will accept some form of concession from the lender to avoid a default. Reasonably expected TDRs and executed non-performing TDRs are evaluated individually to determine the required ACL. TDRs performing in accordance with regulatory guidance and its loan policy.
The Company then estimatestheir modified contractual terms for a general allocated allowance for all other loans that were not impaired asreasonable period of the balance sheet date using a formula-based approach that includes average historical loss factors that are adjusted for quantitative and qualitative factors. Qualitative factors are based on management’s assessment of current trends thattime may cause losses inherentbe included in the current loan portfolio to differ significantly from historical losses. The Company uses a formula-based approach that includes average historical loss factors that are adjusted for qualitative factors to establish this portion of the Allowance. After the portfolio has been disaggregated into segments and classes, the Company calculates a general reserve for each segment and classCompany’s existing pools based on the average five year loss history for each segment and class. This general reserve is then adjusted for qualitative factors, by segment and class. Qualitative factors are based on management’s assessment of current trends that may cause losses inherent in the current loan portfolio to differ significantly from historical losses. Some factors that management considers in determining the qualitative adjustment to the general reserve include our concentration of large borrowers; national and local economic trends; general business conditions; economic, political, and industry specific factors that affect resource development in Alaska; underwriting policies and standards; trends in local real estate markets; effects of various political activities; peer group data; and internal factors such as underwriting policies and expertise of the Company’s employees.
The unallocated general valuation portion of the Allowance is based on several factors, including the level of the Allowance as compared to total loans and nonperforming loans in light of current economic conditions. This portion of the Allowance is deemed “unallocated” because it is not allocated to any segment or classunderlying risk characteristics of the loan portfolio. This portionto measure the ACL.
If we determine that the value of an individually evaluated loan is less than the Allowance provides for coverage of credit losses inherentrecorded investment in the loan, portfolio but not captured in the credit loss factors that are utilized in the risk rating-based component or in the specific impairment component of the Allowance and acknowledges the inherent imprecision of all loss prediction models. This portion of the Allowance is based upon management’s evaluation of various factors that are not directly measured in the determination of the allocated portions of the Allowance. Such factors include uncertainties in identifying triggering events that directly correlate to subsequent loss rates, uncertainties in economic conditions, risk factors that have not yet manifested themselves in loss allocation factors, and historical loss experience data that may not precisely correspond to the current portfolio. In addition, the unallocated reserve may fluctuate based upon the direction of various risk indicators. Examples of such factors include the risk as to current and prospective economic conditions, the level and trend of charge offs or recoveries, and the risk of heightened imprecision or inconsistency of appraisals used in estimating real estate values. Although this allocation process may not accurately predict credit losses by loan type or in aggregate, the totalwe either recognize an allowance for credit losses specific to that loan, or charge-off the deficit balance on collateral dependent loans if it is available to absorb lossesdetermined that may arise from any loan type or category.
Based on our methodology and its components, management believes the resulting Allowance is adequate and appropriate for the risk identifiedsuch amount represents a confirmed loss. Subsequent changes in the Company's loan portfolio. While management believesexpected credit losses for loans evaluated individually are included within the provision for credit losses in the same manner in which the expected credit loss initially was recognized or as a reduction in the provision that it uses the best information available to determine the Allowance, unforeseen market conditionswould otherwise be reported.
Paycheck Protection Program ("PPP") and other events could resultloans guaranteed by the U.S. government: With the passage of the PPP, the Company has actively participated in adjustmentassisting its customers with applications for loans through the program. Loans funded through the PPP program are fully guaranteed by the U.S. government subject to certain representations and warranties. This guarantee exists at the Allowance,inception of the loans and net income could be significantly affected if circumstances differed substantiallythroughout the lives of the loans and was not entered into separately and apart from the assumptions usedloans. ASC 326 requires credit enhancements that mitigate credit losses, such as the U.S. government guarantee on PPP loans, to be considered in makingestimating credit losses. The guarantee is considered “embedded” and, therefore, is considered when estimating credit loss on the final determination. Our banking regulators, as an integral partPPP loans and other loans guaranteed by the U.S. government. Given that the loans are fully guaranteed by the U.S. government and absent any specific loss information on any of their examination process, periodically review the Company's Allowance. Our regulators may requireour guaranteed loans, the Company to recognize additions todoes not carry an ACL on its PPP and other loans guaranteed by the Allowance based on their judgments related to information available to them at the time of their examinations.U.S. government.
Reserve for Unfunded
Loan Commitments and Letters of Credit:Allowance for Credit Losses on Off-Balance Sheet Credit Exposures: The Company maintains a separate reserve for losses relatedenters into various types of transactions that involve financial instruments with off-balance sheet risk, including commitments to unfunded loan commitmentsextend credit and letters of credit. The determination of the adequacy of the reserve is based on periodic evaluations of the unfunded credit facilities including assessment of historical losses and current economic conditions. The allowance for unfunded loan commitments andstandby letters of credit issued to meet customer financing needs. We apply the same credit standards to these commitments as in all of our lending activities and include these commitments in our lending risk evaluations. The Company’s exposure to credit loss in the event of nonperformance by the other party to commitments to extend credit and standby letters of credit is represented by the contractual amount of those instruments. Such financial instruments are recorded when they are funded.
The Company records an ACL on off-balance sheet credit exposures, unless the commitments to extend credit are unconditionally cancellable, through a charge to provision for credit loss expense in the Company’s consolidated statements of income. The ACL on off-balance sheet credit exposures is estimated by loan segment at each balance sheet date under the
current expected credit loss model using the same methodologies as portfolio loans, taking into consideration the likelihood that funding will occur, and is included in other liabilities on the Consolidated Balance Sheets, with changes to theCompany’s consolidated balance charged against other operating expense.sheets.
Purchased Receivables:Receivables and related Allowance for Credit Losses: The Bank, through NFS,Company purchases accounts receivable from its customers. The purchased receivables are carried at their principal amount outstanding,amortized cost, net of a reservean ACL. Management measures expected credit losses on purchased receivables by evaluating each receivable individually. Each quarter, management reviews purchased receivable asset balances compared to assets eligible for anticipated lossesadvancement of funds in order to determine the exposure to loss for the Company. Exposure is zero when outstanding balances exceed assets eligible for advancement. Management may determine that have not yet been identified.an ACL is appropriate for individual purchased receivables based on asset specific facts and circumstances. Fees charged to the customer are earned while the balances of the purchases are outstanding, which is typically less than one year. The Company maintains a separate reserve for losses related to purchased receivable assets. The determination of the adequacy of the reserve is based on periodic evaluations of purchased receivable assets including an assessment of historical losses and current economic conditions. The reserve for purchased receivable assets is includedChanges in the balance of these accounts on a net basis on the consolidated balance sheets, with changes to the balance charged against other operatingACL are recorded as provision for (or reversal of) credit loss expense.
Other Real Estate Owned: Other real estate owned OREO represents properties acquired through foreclosure or its equivalent. Prior to foreclosure, the carrying value is adjusted to the fair value, less cost to sell, of the real estate to be acquired by an adjustment to the Allowance. Management’s evaluation of fair value is based on appraisals or discounted cash flows of anticipated sales. After foreclosure, any subsequent reduction in the carrying value is charged against earnings. Operating expenses associated with other real estate ownedOREO are charged to earnings in the period they are incurred. Operating expenses associated with OREO are recorded net of rental income and gain on sales associated with OREO.
Premises and Equipment: Premises and equipment, including leasehold improvements, are stated at cost, less accumulated depreciation and amortization. Depreciation and amortization expense for financial reporting purposes is computed using the straight-line method based upon the shorter of the lease term or the estimated useful lives of the assets that vary according to the asset type and include; furniture and equipment ranging between 3 and 7 years, leasehold improvements ranging between 2 and 15 years, and buildings at 39 years. Maintenance and repairs are charged to current operations, while renewals and betterments are capitalized. Long-lived assets such as premises and equipment are reviewed for impairment at least annually or whenever events or changes in business circumstances indicate that the remaining useful life may warrant revision, or that the carrying amount of the long-lived asset may not be fully recoverable. If impairment is determined to exist, any related impairment loss is calculated based on fair value. Impairment losses on assets to be disposed of, if any, are based on the estimated proceeds to be received, less costs of disposal.
Goodwill and Other Intangible Assets: Intangible assets are comprised of goodwill and other intangibles acquired in business combinations. Goodwill and intangible assets with indefinite useful lives are not amortized. Intangible assets with definite useful lives are amortized to their estimated residual values over their respective useful lives, and are also reviewed for impairment. Amortization of intangible assets is included in other operating expense in the Consolidated Statements of Income. The Company performs a goodwill impairment analysis at the segment leveleach reporting unit on an annual basis. Additionally, the Company performs a goodwill impairment evaluation on an interim basis when events or circumstances indicate impairment potentially exists.
Low Income Housing Tax Credit Partnerships: The Company earns a return on its investments in these partnerships in the form of tax credits and deductions that flow through to it as a limited partner. The Company amortizes these investments in tax expense over the period during which tax creditsbenefits are used.received.
Servicing Rights: Mortgage and commercial servicing rights associated with loans originated and sold, where servicing is retained, are measured at fair value and changes in fair value are reported through earnings. Changes in the fair value of servicing rights occur primarily due to the collection/realization of expected cash flows, as well as changes in valuation inputs and assumptions. Under the fair value method, servicing rights are carried on the balance sheet at fair value and the changes in fair value are reported in earnings in other operating income in the period in which the change occurs. Fair value measurements are determined using a discounted cash flow model. In order to determine the fair value of servicing rights, the present value of net expected future cash flows is estimated. Assumptions used include market discount rates, anticipated prepayment speeds, escrow calculations, delinquency rates, and ancillary fee income net of servicing costs. For mortgage servicing rights ("MSRs"), the model assumptions are also compared to publicly filed information from several large MSR holders, as available.
Other Assets: Other assets include purchased software and prepaid expenses. Purchased software is carried at amortized cost and is amortized using the straight-line method over its estimated useful life or the term of the agreement. Also included in other assets is the net deferred tax asset, bank owned life insurance carried at cash surrender value, net of premium charges, accrued interest receivable, taxes receivable, and rate lock derivatives, and the Company’s equity method investments. The Company performs an impairment analysis on it's equity method investments when events or circumstances indicate impairment potentially exists.derivatives.
Derivatives: The Company records all derivatives on the Consolidated Balance Sheets at fair value. The accounting for change in the fair value of derivatives depends on the intended use of the derivative, whether the Company has elected to designate the
derivative in a hedging relationship and apply hedge accounting, and whether the hedging relationship has satisfied the criteria necessary to apply hedge accounting. Interest rate swaps that are designated as a cash flow hedge and satisfy the hedge accounting requirements involve the receipt of variable amounts from a counter-party in exchange for the Company making fixed-rate payments over the life of the agreements without exchange of the underlying notional amount. For derivatives which are designed as cash flow hedges and satisfy hedge accounting requirements, the effective portion of changes in the fair value of the derivative is
recorded in accumulated other comprehensive income (loss). The fair value of the Company's derivatives is determined using discounted cash flowDCF analysis using observable market based inputs. The Company considers all free-standing derivatives not designated in a hedging relationship as economic hedges and recognizes these derivatives as either assets or liabilities in the balance sheet. These assets and liabilities are measured at fair value, and changes in fair value are recorded in earnings. By using derivatives, the Company is exposed to counterparty credit risk, which is the risk that counterparties to the derivative contracts do not perform as expected. If a counterparty fails to perform, our counterparty credit risk is equal to the amount reported as a derivative asset on our balance sheet, net of cash collateral received. We minimize counterparty credit risk through credit approvals, limits, monitoring procedures, and obtaining collateral, where appropriate. For derivative instruments executed with the same counterparty under a master netting arrangement, we do not offset fair value amounts of interest rate swaps in liability positions with the onesinterest rate swaps in asset positions. For further detail, see Note 19.20 of the notes to the Company's Consolidated Financial Statements included in Part II. Item 8 of this report.
Transfers or sales of financial assets: For transfers of entire financial assets or a participating interest in an entire financial asset recorded as sales, we recognize and initially measure at fair value all assets obtained and liabilities incurred. We record a gain or loss in other operating income for the difference between the carrying amount and the fair value of the assets sold. Fair values are based on quoted market prices, quoted market prices for similar assets, or if market prices are not available, then the fair value is estimated using discounted cash flow analysis with assumptions for credit losses, prepayments and discount rates that are corroborated by and verified against market observable data, where possible.
Revenue Recognition: The majority of the Company's revenues come from interest income on loans and investment securities, as well as other non-interest income including mortgage banking income, bankcard fees, purchased receivable income, and service charges on deposits. The Company recognizes income in accordance with the applicable accounting guidance for these revenue sources. The Company's revenues that are within the scope of ASC Topic 606 are presented within other operating income and include bankcard fees, service charges on deposits, and other non-interest income including merchant services fees, commissions from sales of mutual funds and other investments, safety deposit box rental fees, bank check and other check fees, and other miscellaneous revenue streams.
Revenue within the contracts with customers guidance is recognized when obligations under the terms of a contract with customers are satisfied. Revenue is measured as the amount of consideration the Company expects to receive in exchange for transferring goods or providing services. When the amount of consideration is variable, the Company will only recognize revenue to the extent that it is probable that the cumulative amount recognized will not be subject to a significant reversal in the future. Substantially all of the Company's contracts with customers have expected durations of one year or less and payments are typically due when or as the services are rendered or shortly thereafter. When third parties are involved in providing services to customers, the Company recognizes revenue on a gross basis when it has control over those services being provided to the customer; otherwise, revenue is recognized for the net amount of any fee or commission.
Advertising: Advertising, promotion, and marketing costs are expensed as incurred. The Company reported total expenses in these areas of $2.3$2.7 million, $2.6$2.3 million, and $2.4 million for each of the periodsyears ending December 31, 2018, 2017,2021, 2020, and 2016,2019, respectively.
Stock Incentive Plans: The Company accounts for its stock incentive plans using a fair-value-based method of accounting forhas stock-based employee compensation plans. The Company has electedplans as more fully discussed in Note 22, Stock-Based Compensation to the modified prospective methodCompany's Consolidated Financial Statements included in Part II. Item 8 of this report. Compensation cost is recognized for recognitionstock options and restricted stock units issued to employees based on the fair value of compensation cost associated with stock-based employee compensationthese awards at the date of grant. A Black Scholes model is utilized to estimate the fair value of stock options, while the market price for the Company's common stock at the date of grant issued is utilized for restricted stock awards. The Company amortizes stock-basedrecognizes compensation expense over the vesting period of each award. The Company's accounting policy changed during the year ended December 31, 2020 and now recognizes forfeitures as they occur.
Income Taxes: The Company uses the asset and liability method of accounting for income taxes. Under the asset and liability method, deferred income taxes are recognized for the future consequences attributable to differences between the financial statement carrying amounts of existing assets and liabilities and their respective tax bases. Deferred tax assets and liabilities are measured using enacted tax rates expected to apply to taxable income in the years in which those temporary differences are expected to be recovered or settled. The effect on deferred taxes of a change in tax rates is recognized in income in the period
that includes the enactment date. Our policy is to recognize interest and penalties on unrecognized tax benefits in “Provision for income taxes”“Other operating expense" in the Consolidated Statements of Income.
Earnings Per Share: Earnings per share is calculated using the weighted average number of shares and dilutive common stock equivalents outstanding during the period. Stock options and restricted stock units, as described in Note 21,22 of the notes to the Company's Consolidated Financial Statements included in Part II. Item 8 of this report, are considered to be common stock equivalents. Potentially dilutive shares are excluded from the computation of earnings per share if their effect is anti-dilutive. There were no anti-dilutive shares outstanding related to options to acquire common stock in 2017 or 2016. Anti-dilutive shares outstanding related to options to acquire common stock for the year ended December 31, 20182020 totaled 44,721.45,062. There were no anti-dilutive shares outstanding related to options to acquire common stock in 2021 or 2019.
Information used to calculate earnings per share was as follows:
| | | | | | | | | | | |
| (In Thousands) | 2021 | 2020 | 2019 |
| Net income | $37,517 | | $32,888 | | $20,691 | |
| Basic weighted average common shares outstanding | 6,181 | | 6,355 | | 6,709 | |
| Dilutive effect of potential common shares from awards granted under equity incentive program | 68 | | 76 | | 99 | |
| Total | 6,249 | | 6,431 | | 6,808 | |
| Earnings per common share | | | |
| Basic | $6.07 | | $5.18 | | $3.08 | |
| Diluted | $6.00 | | $5.11 | | $3.04 | |
|
| | | | | | | | | |
| (In Thousands) | 2018 | 2017 | 2016 |
| Net income attributable to Northrim BanCorp, Inc. |
| $20,004 |
|
| $13,151 |
|
| $14,411 |
|
| Basic weighted average common shares outstanding | 6,878 |
| 6,890 |
| 6,884 |
|
| Dilutive effect of potential common shares from awards granted under equity incentive program | 104 |
| 88 |
| 91 |
|
| Total | 6,982 |
| 6,978 |
| 6,975 |
|
| Earnings per common share | | | |
| Basic |
| $2.91 |
|
| $1.91 |
|
| $2.09 |
|
| Diluted |
| $2.86 |
|
| $1.88 |
|
| $2.06 |
|
Comprehensive Income: Comprehensive income consists of net income, net unrealized gains (losses) on securities available for sale after the tax effect, and net unrealized gains (losses) on derivative and hedging activities.
Concentrations: Substantially all of the Company’s business is derived from the Anchorage, Matanuska-Susitna Valley, Fairbanks, Kenai Peninsula, and Southeast areas of Alaska. As such, the Company’s growth and operations depend upon the economic conditions of Alaska and these specific markets. These areas rely primarily upon the natural resources industries, particularly oil production, as well as tourism, government and U.S. military spending for their economic success. A significant majority of the unrestricted revenues of the Alaska state government are currently funded through various taxes and royalties on the oil industry. The Company’s business is and will remain sensitive to economic factors that relate to these industries and local and regional business conditions. As a result, local or regional economic downturns, or downturns that disproportionately affect one or more of the key industries in regions served by the Company, may have a more pronounced effect upon its business than they might on an institution that is less geographically concentrated. The extent of the future impact of these events on economic and business conditions cannot be predicted; however, prolonged or acute fluctuations could have a material and adverse impact upon the Company’s results of operation and financial condition.
At December 31, 20182021 and 2017,2020, the Company had $451.8$572.7 million and $424.8$728.2 million, respectively, in commercial and construction loans. At December 31, 2021, commercial loans included $118.2 million in Alaska.PPP loans administered by the U.S. Small Business Administration ("SBA"). Additionally, the Company continues to have a concentration in large borrowing relationships. At December 31, 2018, 40%2021, 33% of the Company’s loan portfolio is attributable to 2732 large borrowing relationships. The Company has additional unfunded commitments to these borrowers of $97.7$153.3 million at December 31, 2018.2021.
Fair Value Measurements: Fair value is defined as the price that would be received to sell an asset or paid to transfer a liability in the principal or most advantageous market for an asset or liability in an orderly transaction between market participants at the measurement date. GAAP established a fair value hierarchy that prioritizes the use of inputs used in valuation methodologies. In accordance with GAAP, the Company groups its assets and liabilities measured at fair value into the following three levels: :
•Level 1: Valuation is based upon quoted prices for identical instruments traded in active markets. A quoted market price in an active market provides the most reliable evidence of fair value and is used to measure fair value whenever available. A contractually binding sales price also provides reliable evidence of fair value.
•Level 2: Valuation is based upon quoted market prices for similar instruments in active markets, quoted prices for identical or similar instruments in markets that are not active, and model-based valuation techniques for which all significant assumptions are observable in the market.
•Level 3: Valuation is generated from model-based techniques that use significant assumptions not observable in the market, or inputs that require significant management judgment or estimation, some of which may be internally developed.
Error Corrections:
Acquisition of RML
In 2016, the Company identified and has corrected an error regarding the accounting for payments to be made by the Company to the four former equity owners of RML that were negotiated as part of the Company’s acquisition of 76.5% of the equity interest in RML on December 1, 2014. Three of the four former equity owners of RML had continuing employment contracts with the Company as of December 1, 2014, and under the terms of the acquisition agreement, the payments are terminated for future periods if any two of these three continuing employees terminate employment before November 30, 2019. The fair value of the estimated payments was recorded as acquisition consideration on December 1, 2014, and accrued as a contingent liability. The Company has determined that these payments are more appropriately accounted for as compensation expense in the period they are incurred. Changes in the value of the contingent liability that was initially recorded when the Company acquired RML have previously been reflected on the Company’s Consolidated Statements of Income in the “Change in fair value, RML earn-out liability” line item in prior periods. As of September 30, 2016, this line item has been renamed to “Compensation expense - RML acquisition payments”, and the payments to the sellers of RML are expensed and recorded in the Consolidated Statements of Income in that same line item. Management evaluated the materiality of the error from qualitative and quantitative perspectives and concluded that the error was immaterial to the prior period financial statements taken as a whole. Consequently, the financial statements for the period ended December 31, 2016, include the cumulative impact of the correction of the error, and prior period financial statements have not been restated. The error correction reduced the total purchase price of RML from $29.5 million to $22.2 million and reduced the amount of goodwill recorded in the RML acquisition from $14.8 million to $7.5 million. The error correction eliminated the contingent liability originally recorded as part of the purchase consideration and resulted in the accrual of compensation expense, which is included in "Other liabilities" on the Consolidated Balance Sheets. The error correction increased Compensation expense - RML acquisition payments by $2.3 million and reduced net income by $1.4 million and covered the period from December 1, 2014, through June 30, 2016. Additionally, the change in the prospective accounting treatment of these payments also increased Compensation expense - RML acquisition payments by $765,000 and reduced net income for the third and fourth quarters of 2016 by $438,000 for a total decrease in net income of $1.8 million in 2016. The change did not affect the
total cash flows from operating, investing, or financing activities in the Consolidated Statement of Cash Flows. Accrued compensation expense related to these payments was $0 as of December 31, 2018 and represents compensation accrued for the period from December 1, 2018 through December 31, 2018.
Recognition of commercial servicing rights
In 2018, the Company recorded for the first time in other operating income the fair value of its commercial loan servicing portfolio of $1.0 million. This revenue is included in the "Commercial servicing revenue" line item in the Company's Consolidated Statement of Income. In previous years, the Company accounted for revenue from commercial servicing activities on a cash basis. Management evaluated the materiality of this error from qualitative and quantitative perspectives and concluded that the error was immaterial to the prior period financial statements taken as a whole. Consequently, the financial statements for the period ended December 31, 2018, include the cumulative impact of the correction of the error, and prior period financial statements have not been restated. The error correction increased total assets and net income by $737,000 after the impact of accounting for a provision for income taxes and covered the period from March 31, 2001 to December 31, 2018. The change did not affect cash flows from operating, investing, or financing activities in the Consolidated Statement of Cash Flows.
Occupancy expense
In 2018, the Company performed a review of it's premises and equipment assets as part of it's tax planning process related to the Tax Cuts and Jobs Act of 2017 that was enacted in December of 2017. During this review, the Company identified that $2.6 million of land was misclassified as buildings in 2008. This misclassification resulted in the recognition of $670,000 in depreciation expense between September 30, 2008 and June 30, 2018. Management evaluated the materiality of this error from qualitative and quantitative perspectives and concluded that the error was immaterial to the prior period financial statements taken as a whole. Consequently, the financial statements for the period ended December 31, 2018, include the cumulative impact of the correction of the error, and prior period financial statements have not been restated. The error correction increased total assets and net income by $480,000 after the impact of accounting for a provision for income taxes and covered the period from September 30, 2008 to December 31, 2018. The change did not affect cash flows from operating, investing, or financing activities in the Consolidated Statement of Cash Flows.
Recent Accounting Pronouncements
Accounting pronouncements implemented in 20182021
In May 2014, the FASB issued ASU 2014-09, Revenue from Contracts with Customers (“ASU 2014-09”). The core principle of the guidance is that an entity should recognize revenue to depict the transfer of promised goods or services to customers in an amount that reflects the consideration to which the entity expects to be entitled in exchange for those goods or services. In general, this new guidance requires companies to use more judgment and make more estimates than under current guidance, including identifying performance obligations in the contract, estimating the amount of variable consideration to include in the transaction price and allocating the transaction price to each separate performance obligation. ASU 2014-09 is effective for the Company’s financial statements for annual and interim periods beginning on or after December 15, 2017; early adoption is permitted for annual reporting periods. For financial reporting purposes, the standard allows for either full retrospective adoption, meaning the standard is applied to all of the periods presented, or modified retrospective adoption, meaning the standard is applied only to the most current period presented in the financial statements with the cumulative effect of initially applying the standard recognized at the date of initial application. The Company has reviewed all revenue sources to determine the sources that are in scope for this guidance. As a bank, key revenue sources, including interest income and mortgage banking income have been identified as out of scope of this new guidance. The Company's overall assessment of material in-scope revenue sources include service charges on deposits and credit card payment processing fees. The Company adopted the guidance on January 1, 2018, utilizing the modified retrospective approach, which did not have a material impact on how the Company recognizes revenue or on our consolidated financial statements and disclosures. See Note 2 of the Notes to Consolidated Financial Statements for disclosures related to revenue generated from contracts with customers.
In January 2016, the FASB issued ASU 2016-01, Recognition and Measurement of Financial Assets and Financial Liabilities (“ASU 2016-01”). The new guidance is intended to improve the recognition and measurement of financial instruments. ASU 2016-01 requires that equity investments (except those accounted for under the equity method of accounting or those that result in consolidation of the investee) to be measured at fair value with changes in fair value recognized in net income. In addition, the amendment requires public business entities to use the exit price notion when measuring the fair value of financial instruments for disclosure purposes and requires separate presentation of financial assets and financial liabilities by measurement category and form of financial asset (i.e., securities or loans and receivables) on the balance sheet or the accompanying notes to the financial statements. This ASU also eliminates the requirement for public business entities to disclose the method(s) and significant
assumptions used to estimate the fair value that is required to be disclosed for financial instruments measured at amortized cost on the balance sheet. The amendment also requires a reporting organization to present separately in other comprehensive income the portion of the total change in the fair value of a liability resulting from a change in the instrument specific credit risk (also referred to as "own credit") when the organization has elected to measure the liability at fair value in accordance with the fair value option for financial instruments. The Company adopted the guidance on January 1, 2018 and reclassified $191,000 in unrealized gains on its investments in preferred stock from other accumulated comprehensive income to retained earnings. The Company also used an exit price notion to measure the fair value of financial instruments for it's disclosures as of December 31, 2018. Adoption of the guidance does not have a material or significant impact on the Company's consolidated financial statements. As of January 1, 2018, unrealized gains and losses on marketable equity securities are included in other operating income in the Consolidated Statement of Income.
In August 2016, the FASB issued ASU 2016-15, Classification of Certain Cash Receipts and Cash Payments (“ASU 2016-15”). ASU 2016-15 provides guidance on eight specific cash flow issues: debt prepayment or debt extinguishment costs; settlement of zero-coupon debt instruments or other debt instruments with coupon interest rates that are insignificant in relation to the effective interest rate of the borrowing; contingent consideration payments made after a business combination; proceeds from the settlement of insurance claims; proceeds from the settlement of corporate-owned life insurance policies, including bank-owned life insurance policies; distributions received from equity method investees; beneficial interests in securitization transactions; and separately identifiable cash flows and application of the predominance principle. The Company adopted the guidance on January 1, 2018 and made an accounting policy election to classify distributions from equity method investees using the cumulative earnings approach. Accordingly, these distributions are recorded as cash inflows in the operating activity section of the Statement of Cash Flows. Adoption of the guidance does not have a material or significant impact on the Company's consolidated financial statements.
In May 2017, the FASB issued ASU 2017-09, Compensation-Stock Compensation (“ASU 2017-09”). ASU 2017-09 provides guidance about which changes to the terms or conditions of a share-based payment award require an entity to apply modification accounting in Topic 718. The Company adopted the guidance on January 1, 2018, and it did not have a material impact on the Company’s consolidated financial position or results of operations.
In March 2017, the FASB issued ASU 2017-08, Receivables-Nonrefundable Fees and Other Costs (“ASU 2017-08”). ASU 2017-08 amends the amortization period for certain purchased callable debt securities held at a premium by shortening the amortization period for the premium to the earliest call date. Under the current guidance, entities generally amortize the premium as an adjustment of yield over the contractual life of the instrument. ASU 2017-08 is effective for the Company’s financial statements for annual and interim periods beginning on or after December 15, 2018, and should be applied on a modified retrospective basis through a cumulative-effect adjustment directly to retained earnings. The Company early adopted this standard in the first quarter of 2018, which resulted in a $62,000 decrease in beginning retained earnings through a cumulative-effect adjustment.
In August 2017, the FASB issued ASU 2017-12, Derivatives and Hedging (“ASU 2017-12”). ASU 2017-12 improves the financial reporting of hedging relationships to better portray the economic results of an entity’s risk management activities in its financial statements. In addition to that main objective, the amendments in this ASU make certain targeted improvements to simplify the application of the hedge accounting guidance in current GAAP based on the feedback received from preparers, auditors, users, and other stakeholders. ASU 2017-12 is effective for the Company’s financial statements for annual and interim periods beginning on or after December 15, 2018, and all transition requirements and elections must be applied to hedging relationships existing (that is, hedging relationships in which the hedging instrument has not expired, been sold, terminated, or exercised or the entity has not removed the designation of the hedging relationship) on the date of adoption. The Company early-adopted this standard in the first quarter of 2018, and it did not have a significant impact on the Company’s consolidated financial position or results of operations.
In January 2017, the FASB issued ASU 2017-04, Intangibles-Goodwill and Other (“ASU 2017-04”). ASU 2017-04 simplifies how an entity is required to test goodwill for impairment by eliminating Step 2 from the goodwill impairment test. ASU 2017-04 is effective for the Company’s financial statements for annual and interim periods beginning on or after December 15, 2019, and must be applied on a prospective basis. The Company early adopted this standard in the fourth quarter of 2018, and it did not have a significant impact on the Company’s consolidated financial position or results of operations.
Accounting pronouncements to be implemented in future periods
In June 2016, the FASB issued ASU 2016-13, Financial Instruments - Credit Losses (“(“ASU 2016-13” or “CECL”). ASU 2016-13 is intended to improve financial reporting by requiring timelier recording of credit losses on loans and other financial instruments held by financial institutions and other organizations. The standard requires the measurement of all expected credit losses for certainUnder ASU 2016-13 financial assets held at the reporting date based on historical experience, current conditions, and reasonable and supportable
forecasts. Financial institutions and other organizations will now use forward-looking information to better inform their credit loss estimates but will continue to use judgment to determine which loss estimation method is appropriate for their circumstances. ASU 2016-13 requires enhanced disclosures to help investors and other financial statement users better understand significant estimates and judgments used in estimating credit losses, as well as the credit quality and underwriting standards of an organization's portfolio. These disclosures include qualitative and quantitative requirements that provide additional information about the amounts recorded in the financial statements. In addition, the ASU 2016-13 amends the accounting for credit losses on available-for-sale debt securities and purchased financial assets with credit deterioration. The
ASU 2016-13 is effective for the Company for fiscal years, and interim periods within those fiscal years, beginning on or after December 15, 2019.2019, and must be applied prospectively. However, on October 16, 2019 the FASB voted to delay ASU 2016-13 for Smaller Reporting Companies. The Company had elected Small Reporting Company status, which changes the effective date for ASU 2016-13 for the Company to fiscal years, and interim periods within those fiscal years, beginning on or after December 15, 2022. Early application will bewas permitted for specified periods. The Company has formedelected to early adopt ASU 2016-13 on January 1, 2021 after finalizing data and model validation and our internal governance framework. The guidance was applied on a cross-functional team to begin implementation effortsmodified retrospective basis with the cumulative effect of this new guidance. The team is evaluatinginitially applying the data elements and modeling options thatamendments recognized in retained earnings at January 1, 2021. However, certain provisions of the guidance are expectedonly required to be criticalapplied on a prospective basis.
Results for periods beginning after January 1, 2021 and presented under ASC 326 while prior period amounts continue to be reported in accordance with previously applicable US GAAP. The Company recorded a net increase in retained earnings of $2.4 million upon adoption of ASU 2016-13. The transition adjustment includes a decrease in the new process. Additionally,ACL on loans of $4.5 million, a decrease in the Company has engaged external consulting services related to this effort. An estimateACL on purchased receivables of $73,000, and an increase in the ACL on unfunded commitments of $1.2 million, net of the impactcorresponding net decrease in deferred tax assets of this standard on the Company's consolidated financial position and results of operations has not yet been determined, however, the impact is expected$954,000.
Accounting pronouncements to be significant and the impact on the Company's process for calculating the Allowance is also expected to be significant.implemented in future periods
In February 2016,March 2020, the FASB issued ASU 2016-02, Leases2020-04, Reference Rate Reform (Topic 842) (“848): Facilitation of the Effects of Reference Rate Report of Financial Reporting ("ASU 2016-02”2020-04"). ASU 2016-02 requires lessees, among other things,2020-04 was issued to recognize lease assetsprovide temporary optional guidance to ease the potential burden in accounting for reference rate reform. The guidance provides optional expedients and lease liabilities on the balance sheetexceptions for those leasesapplying generally accepted accounting principles to contract modifications and hedging relationships, subject to meeting certain criteria, that reference London Inter-Bank Offered Rate ("LIBOR") or another reference rate expected to be discontinued. The last expedient is a one-time election to sell or transfer debt securities classified as operating leases under previous authoritative guidance. This update also introduces new disclosure requirements for leasing arrangements. ASU 2016-02 is effective for the Company’s financial statements for annual and interim periods beginning on or afterheld to maturity. The expedients are in effect from March 12, 2020, through December 15, 2018, and must be applied prospectively. All entities are required to use a modified retrospective approach for leases that exist or are entered into after the beginning of the earliest comparative period in the financial statements. As the Company expects to elect the transition option provided in ASU No. 2018-11 (see below), the modified retrospective approach will be applied on January 1, 2019 (as opposed to January 1, 2017). The Company also expects to elect certain relief options offered in ASU 2016-02 including the package of practical expedients, the option not to separate lease and non-lease components and instead to account for them as a single lease component, and the option not to recognize right-of-use assets and lease liabilities that arise from short-term leases (i.e., leases with terms of twelve months or less).31, 2022. The Company will likely not elect the hindsight practical expedient, which allows entitiesbe able to use hindsight when determining lease termthe expedients in this guidance to manage through the transition away from LIBOR, specifically for our loan portfolio, derivative contracts, and impairment of right-of-use assets. The Company has several lease agreements, such as branch locations, which are currently considered operating leases, and therefore, not recognized on the Company’s consolidated statements of condition. When the Company adopts these amendments onbond portfolio.
In January 1, 2019, the Company expects to recognize a right-of-use asset and related lease liability on the Company’s statement of financial condition of $15.9 and $15.9, respectively. The Company has finalized its review of the amendments and has updated its accounting policies and procedures.
In July 2018,2021, the FASB issued ASU 2018-11, Leases - Targeted ImprovementsNo. 2021-01, Reference Rate Reform (Topic 848): Scope, ("ASU 2018-11"2021-01") to provide entities with relief from the costs of implementing certain aspects of the new leasing standard, ASU 2016-02. Specifically, under the. The amendments in ASU 2018-11: (1)2021-01 are elective and apply to all entities may elect notthat have derivative instruments that use an interest rate for margining, discounting, or contract price alignment that is modified as a result of reference rate reform. The amendments clarify certain optional expedients and exceptions in Topic 848 for contract modifications apply to recastderivatives that are affected by the comparativediscounting transition.
LIBOR is a widely-referenced benchmark rate, which is published in five currencies and a range of tenors, and seeks to estimate the cost at which banks can borrow on an unsecured basis from other banks. The administrator of LIBOR, ICE Benchmark Administration, published a consultation in December 2020 regarding its intention to cease the publication of LIBOR after December 31, 2021, with the exception of certain tenors of U.S. dollar (USD) LIBOR that it proposed would remain available for use in legacy contracts or as otherwise enumerated by financial regulators until June 30, 2023. The Company has some assets and liabilities referenced to LIBOR, such as commercial loans, derivatives, debt securities, and junior subordinated debentures. As of December 31, 2021, we had approximately $180.5 million of assets, including $102.2 million in commercial loans and $78.1 million in debt securities, and $10.0 million of liabilities in the form of our junior subordinated debentures linked to USD LIBOR. These amounts exclude derivative assets and liabilities on our consolidated balance sheet. As of December 31, 2021, the notional amount of our USD LIBOR-linked interest rate derivative contracts was $143.2 million. Of this amount, $71.6 million in notional value represent commercial loan interest rate swap agreements with commercial banking customers. An additional $71.6 million in notional value represent corresponding swap agreements with third party financial institutions that offset the commercial loan swaps. Swap agreements with third party institutions are $81.6 million, including an interest rate swap agreement for $10.0 million in notional value related to our junior subordinated debentures. Each of the USD LIBOR-linked amounts referenced above are expected to vary in future periods presented when transitioningas current contracts expire with potential replacement contracts using an alternative reference rate.
In an effort to mitigate the risks associated with a transition away from LIBOR, our Asset Liability Committee has undertaken initiatives to: (i) develop more robust fallback language and disclosures related to the new leasing standard,LIBOR transition, (ii) develop a plan to seek to amend legacy contracts to reference such fallback language or alternative reference rates, (iii) enhance systems to support commercial loans, securities, and (2) lessors may elect notderivatives linked to separate leasethe Secured Overnight Financing Rate and non-lease components when certain conditions are met. The amendments haveother alternative reference rates, (iv) develop and evaluate internal guidance, policies and procedures focused on the same effective date as transition away from LIBOR to alternative reference rate products, and (v) prepare and disseminate internal and external communications regarding the LIBOR transition.
ASU 2016-02 (January 1, 2019 for the Company). The Company expects to elect both transition options. ASU 2018-112021-01 is not expected to have a material impact on the Company’s Consolidated Financial Statements.
In August 2018, the FASB issued ASU 2018-13, Fair Value Measurement (Topic 820) (“ASU 2018-13”). ASU 2018-13 modifies the disclosure requirements on fair value measurements in Topic 820, Fair Value Measurement, based on the concepts in the Concepts Statement, including the consideration of costs and benefits. ASU 2018-13 is effective for the Company’s financial statements for annual and interim periods beginning on or after December 15, 2019. The Company does not believe that the adoption of this standard will have a material impact on the Company’sCompany's consolidated financial position or results of operations.statements.
NOTE2 – Revenue
The Company's revenue is included in net interest income and other operating income on its Consolidated Statements of Income. ASU 2014-09, which amends Topic 606 in the Accounting Standards Codification ("ASC"), establishes principles for reporting information about the nature, amount, timing and uncertainty of revenue and cash flows arising from the entity's contracts to provide goods or services to customers. The core principle requires an entity to recognize revenue to depict the transfer of goods or services to customers in an amount that reflects the consideration that it expects to be entitled to receive in exchange for those goods or services recognized as performance obligations are satisfied.
The majority of our ongoing revenue-generating transactions are not subject to Topic 606, including revenue associated with financial instruments, including revenue from loans and securities. In addition, certain noninterest income streams such as fees associated with mortgage servicing rights, purchased receivable income, financial guarantees, and derivatives are also not in scope of the new guidance. Topic 606 is applicable to noninterest revenue streams such as deposit related fees, interchange fees, merchant services income, and commissions from the sales of mutual funds and other investments. However, the recognition of
these revenue streams did not change significantly upon adoption of Topic 606. Substantially all of the Company’s non-interest revenue is generated from contracts with customers. Non-interest revenue streams in-scope of Topic 606 are discussed below.
Bankcard fees
Bankcard fees are primarily comprised of debit card income and ATM fees. Debit card income is primarily comprised of interchange fees earned whenever the Company’s debit cards are processed through card payment networks such as Visa or MasterCard. ATM fees are primarily generated when a Company cardholder uses a non-Company ATM or a non-Company cardholder uses a Company ATM. The Company’s performance obligation for bankcard fees are largely satisfied, and related revenue recognized, when the services are rendered or upon completion. Payments are typically received immediately or in the following month.
Service charges on deposit accounts
Service charges on deposit accounts consist of general service fees for monthly account maintenance, activity- or transaction-based fees, and account analysis fees (i.e., net fees earned on analyzed business and public checking accounts), and other deposit account related fees and consist of transaction-based revenue, time-based revenue (service period), item-based revenue or some other individual attribute-based revenue. Revenue is recognized when our performance obligation is completed which is generally monthly for account maintenance services or when a transaction has been completed. Payments for service charges on deposit accounts are primarily received immediately or in the following month through a direct charge to customers’ accounts.
Other
Other operating income consists of other recurring revenue streams such as merchant services income, commissions from sales of mutual funds and other investments, safety deposit box rental fees, bank check and other check fees, unrealized gains and losses on marketable securities, and other miscellaneous revenue streams. Merchant services income mainly represents fees charged to merchants to process their debit and credit card transactions, in addition to account management fees. The Company’s performance obligation for merchant services income is largely satisfied, and related revenue recognized, when the transactions have been completed. Payment is typically received immediately or in the following month. The Company earns commissions from the sale of mutual funds as periodic service fees (i.e., trailers) from Elliott Cove Capital Management typically based on a percentage of net asset value. Trailer revenue is recorded over time, quarterly, as net asset value is determined. The Company also earns commission income from the sale of annuity products. The Company acts as an intermediary between the Company's customer and Elliott Cove Investment Advisors for these transactions, and Commissions from annuity product sales are recorded when the Company’s performance obligation is satisfied, which is generally upon the issuance of the annuity policy. The Company does not earn trailer fees on annuity sales. Payment for commissions from sales of mutual funds and other investments and annuity sales is typically received in the following quarter. Other service charges include revenue from safety deposit box rental fees, processing wire transfers, bank check and other check fees, and other services. The Company’s performance obligations for these other revenue streams are largely satisfied, and related revenue recognized, when the services are rendered or upon completion. Payments are typically received immediately or in the following month.
The following presents other operating income, segregated by revenue streams in-scope and out-of-scope of Topic 606, for the years ended December 31, 2018, 2017 and 2016:
|
| | | | | | | | | | | |
| (In Thousands) | December 31, |
| Other operating income | 2018 | 2017 | 2016 |
| | In-scope of Topic 606:
| | | |
| | | Bankcard fees |
| $2,811 |
|
| $2,597 |
|
| $2,670 |
|
| | | Service charges on deposit accounts | 1,508 |
| 1,614 |
| 1,998 |
|
| | | Other | 1,592 |
| 1,615 |
| 1,612 |
|
| | Other operating income (in-scope of Topic 606) |
| $5,911 |
|
| $5,826 |
|
| $6,280 |
|
| | Other operating income (out-of-scope of Topic 606) | 26,256 |
| 34,648 |
| 36,983 |
|
| Total other operating income |
| $32,167 |
|
| $40,474 |
|
| $43,263 |
|
Contract Balances
A contract asset balance occurs when an entity performs a service for a customer before the customer pays consideration (resulting in a contract receivable) or before payment is due (resulting in a contract asset). A contract liability balance is an entity’s obligation to transfer a service to a customer for which the entity has already received payment (or payment is due) from the customer. The Company’s other operating revenue streams are largely based on transactional activity, or standard month-end revenue accruals. Consideration is often received immediately or shortly after the Company satisfies its performance obligation
and revenue is recognized. The Company does not typically enter into long-term revenue contracts with customers, and therefore, does not experience significant contract balances. As of December 31, 2018, 2017 and 2016, the Company did not have any significant contract balances.
Contract Acquisition Costs
An entity is required to capitalize, and subsequently amortize into expense, certain incremental costs of obtaining a contract with a customer if these costs are expected to be recovered. The incremental costs of obtaining a contract are those costs that an entity incurs to obtain a contract with a customer that it would not have incurred if the contract had not been obtained (for example, sales commission). The Company utilizes the practical expedient which allows entities to immediately expense contract acquisition costs when the asset that would have resulted from capitalizing these costs would have been amortized in one year or less. Upon adoption of ASU 2014-09, the Company did not capitalize any contract acquisition costs.
NOTE 32 – Cash and Due from Banks
The Company is no longer required to maintain a $983,000 minimum average daily balancecash balances or deposits with the Federal Reserve Bank of San Francisco ("Federal Reserve Bank") for purposes of settling financial transactions and charges for Federal Reserve Bank services. The Company is also required to maintain cash balances or deposits with the Federal Reserve Bank sufficient to meet its statutory reserve requirements. The average reserve requirement for the maintenance period, which included December 31, 2018, was $0..
The Company is required to maintain a $500,000$300,000 balance with a correspondent bank for outsourced servicing of ATMs.
The Company is required to maintain a $100,000 and $300,000$2.8 million balance with a correspondent bank to collateralize the initial margin and the fair value exposure of one of its interest rate swaps, respectively.
NOTE 43 - Interest Bearing Deposits in Other Banks
All interest bearing deposits in other banks have a maturity of one year or less. Balances at December 31 for the respective years are as follows:
| | | | | | | | | | | |
| (In Thousands) | 2021 | | 2020 |
| Interest bearing deposits at Federal Reserve Bank | $622,034 | | | $54,488 | |
| Interest bearing deposits at FHLB | 138 | | | 133 | |
| | | |
| Other interest bearing deposits at other institutions | 2,850 | | | 38,040 | |
| Total | $625,022 | | | $92,661 | |
|
| | | | | | | |
| (In Thousands) | 2018 |
| 2017 |
| Interest bearing deposits at Federal Reserve Bank |
| $49,924 |
|
|
| $52,083 |
|
| Interest bearing deposits at FHLB | 142 |
|
| 41 |
|
| Other interest bearing deposits at other institutions | 701 |
|
| 701 |
|
| Total |
| $50,767 |
|
|
| $52,825 |
|
NOTE 54 - Investment Securities
Marketable Equity Securities
The carrying values and approximateCompany held marketable equity securities with fair values of investment$8.4 million and $9.1 million at December 31, 2021 and 2020, respectively. The gross realized and unrealized gains (losses) recognized on marketable equity securities in other operating income in the Company's Consolidated Statements of Income for the periods indicated were as follows:
| | | | | | | | | | | | | | | | | |
| (In Thousands) | 2021 | | 2020 | | 2019 |
| Unrealized (loss) gain on marketable equity securities | ($101) | | | $61 | | | $911 | |
| Gain on sale of marketable equity securities, net | 67 | | | 98 | | | — | |
| Total | ($34) | | | $159 | | | $911 | |
Debt securities
Debt securities have been classified in the financial statements as available for sale or held to maturity. The following table summarizes the amortized cost, estimated fair value, and ACL of debt securities and the corresponding amounts of gross unrealized gains and losses of available for sale securities recognized in accumulated other comprehensive income (loss) and unrecognized gains and losses of held to maturity securities at the periods indicated are presented below:indicated:
| | | | | | | | | | | | | | | | | | | | | | | | | | | | | |
| (In Thousands) | Amortized Cost | | Gross Unrealized Gains | | Gross Unrealized Losses | | Allowance for Credit Losses | | Fair Value |
| December 31, 2021 | | | | | | | | | |
| Securities available for sale | | | | | | | | | |
| U.S. Treasury and government sponsored entities | $345,514 | | | $333 | | | ($4,367) | | | $— | | | $341,480 | |
| Municipal securities | 820 | | | 20 | | | — | | | — | | | 840 | |
| Corporate bonds | 32,721 | | | 302 | | | (77) | | | — | | | 32,946 | |
| Collateralized loan obligations | 51,431 | | | 9 | | | (22) | | | — | | | 51,418 | |
| | | | | | | | | |
| Total securities available for sale | $430,486 | | | $664 | | | ($4,466) | | | $— | | | $426,684 | |
| | | | | | | | | | | | | | | | | | | | | | | |
| (In Thousands) | Amortized Cost | | Gross Unrealized Gains | | Gross Unrealized Losses | | Fair Value |
| December 31, 2021 | | | | | | | |
| Securities held to maturity | | | | | | | |
| Corporate bonds | $20,000 | | | $— | | | ($836) | | | $19,164 | |
| Allowance for credit losses | — | | | — | | | — | | | — | |
| Total securities held to maturity, net of ACL | $20,000 | | | $— | | | ($836) | | | $19,164 | |
| | | | | | | | | | | | | | | | | | | | | | | |
| (In Thousands) | Amortized Cost | | Gross Unrealized Gains | | Gross Unrealized Losses | | Fair Value |
| December 31, 2020 | | | | | | | |
| Securities available for sale | | | | | | | |
| U.S. Treasury and government sponsored entities | $173,318 | | | $1,330 | | | ($47) | | | $174,601 | |
| Municipal securities | 820 | | | 36 | | | — | | | 856 | |
| Corporate bonds | 29,951 | | | 546 | | | (5) | | | 30,492 | |
| Collateralized loan obligations | 41,782 | | | 44 | | | (142) | | | 41,684 | |
| | | | | | | |
| Total securities available for sale | $245,871 | | | $1,956 | | | ($194) | | | $247,633 | |
| Securities held to maturity | | | | | | | |
| Corporate bonds | $10,000 | | | $— | | | $— | | | $10,000 | |
| Total securities held to maturity | $10,000 | | | $— | | | $— | | | $10,000 | |
|
| | | | | | | | | | | | | | | |
| (In Thousands) | Amortized Cost |
| Gross Unrealized Gains |
| Gross Unrealized Losses |
| Fair Value |
| December 31, 2018 | |
|
| |
|
| |
|
| |
|
| Securities available for sale | |
|
| |
|
| |
|
| |
|
| U.S. Treasury and government sponsored entities |
| $209,908 |
|
|
| $391 |
|
|
| $1,439 |
|
|
| $208,860 |
|
| Municipal securities | 9,089 |
|
| 17 |
|
| 22 |
|
| 9,084 |
|
| Corporate bonds | 40,139 |
|
| 38 |
|
| 397 |
|
| 39,780 |
|
| Collateralized loan obligations | 13,990 |
| | — |
| | 104 |
| | 13,886 |
|
| Total securities available for sale |
| $273,126 |
|
|
| $446 |
|
|
| $1,962 |
|
|
| $271,610 |
|
| December 31, 2017 | |
|
| |
|
| |
|
| |
|
| Securities available for sale | |
|
| |
|
| |
|
| |
|
| U.S. Treasury and government sponsored entities |
| $250,794 |
|
|
| $3 |
|
|
| $1,336 |
|
|
| $249,461 |
|
| Municipal securities | 14,395 |
|
| 72 |
|
| 46 |
|
| 14,421 |
|
| Corporate bonds | 36,654 |
|
| 478 |
|
| — |
|
| 37,132 |
|
| Collateralized loan obligations | 6,000 |
| | 5 |
| | — |
| | 6,005 |
|
| Total securities available for sale |
| $307,843 |
|
|
| $558 |
|
|
| $1,382 |
|
|
| $307,019 |
|
Gross unrealized losses on investment securities and the fair value of the related securities, aggregated by investment category and length of time that individual securities have been in a continuous unrealized loss position, at December 31, 20182021 and 2017,2020, were as follows:
| | | | Less Than 12 Months | More Than 12 Months | Total | | Less Than 12 Months | More Than 12 Months | Total |
| (In Thousands) | Fair
Value | Unrealized Losses | Fair
Value | Unrealized Losses | Fair
Value | Unrealized Losses | (In Thousands) | Fair
Value | Unrealized Losses | Fair
Value | Unrealized Losses | Fair
Value | Unrealized Losses |
| 2018 | | |
| 2021 | | 2021 | |
| Securities Available for Sale | | Securities Available for Sale | |
| U.S. Treasury and government sponsored entities |
| $5,030 |
|
| $6 |
|
| $135,807 |
|
| $1,433 |
|
| $140,837 |
|
| $1,439 |
| U.S. Treasury and government sponsored entities | $292,845 | | ($4,012) | | $21,743 | | ($355) | | $314,588 | | ($4,367) | |
| Corporate bonds | 22,285 |
| 397 |
| — |
| — |
| 22,285 |
| 397 |
| Corporate bonds | 4,953 | | (77) | | — | | — | | 4,953 | | (77) | |
| | Collateralized loan obligations | 13,886 |
| 104 |
| — |
| — |
| 13,886 |
| 104 |
| Collateralized loan obligations | 29,470 | | (22) | | — | | — | | 29,470 | | (22) | |
| Municipal securities | — |
| — |
| 1,673 |
| 22 |
| 1,673 |
| 22 |
| |
| | Total |
| $41,201 |
|
| $507 |
|
| $137,480 |
|
| $1,455 |
|
| $178,681 |
|
| $1,962 |
| Total | $327,268 | | ($4,111) | | $21,743 | | ($355) | | $349,011 | | ($4,466) | |
| 2017 | | |
| 2020 | | 2020 | |
| Securities Available for Sale | | Securities Available for Sale | |
| U.S. Treasury and government sponsored entities |
| $116,331 |
|
| $496 |
|
| $122,605 |
|
| $840 |
|
| $238,936 |
|
| $1,336 |
| U.S. Treasury and government sponsored entities | $31,270 | | ($47) | | $— | | $— | | $31,270 | | ($47) | |
| Municipal securities | 3,994 |
| 17 |
| 2,298 |
| 29 |
| 6,292 |
| 46 |
| |
| | Corporate bonds | | Corporate bonds | 3,198 | | (5) | | — | | — | | 3,198 | | (5) | |
| Collateralized loan obligations | | Collateralized loan obligations | 23,670 | | (118) | | 2,967 | | (24) | | 26,637 | | (142) | |
| Total |
| $120,325 |
|
| $513 |
|
| $124,903 |
|
| $869 |
|
| $245,228 |
|
| $1,382 |
| Total | $58,138 | | ($170) | | $2,967 | | ($24) | | $61,105 | | ($194) | |
TheManagement evaluates available for sale debt securities in unrealized losses on investmentsloss positions to determine whether the impairment is due to credit-related factors or noncredit-related factors. Consideration is given to the extent to which the fair value is less than cost, the financial condition and near-term prospects of the issuer, and the intent and ability of the Company to retain its investment in government sponsored entities, corporate bonds, municipal securities, and collateralized loan obligationsthe security for a period of time sufficient to allow for any anticipated recovery in both periods were caused by changes in interest rates. fair value.
At December 31, 20182021 and 2017,2020, there were 1441 and 2312 available for sale securities in an unrealized loss position without an ACL, respectively, that have been in a loss position for less than twelve months. There were 233 and 171 available for sale securities without an ACL with unrealized losses at December 31, 20182021 and 2017,2020, respectively, that have been at a loss position for more than twelve months. The contractual termsAt December 31, 2021 and 2020, there were 2 and no held to maturity securities in an unrealized loss position without an ACL, respectively, that have been in a loss position for less than twelve months. Management does not have the intent to sell any of these investments do not permit the issuer to settle the securities at a price less than the amortized cost of the investment. Becauseand believes that it is more likely than not that the Company will hold thesenot have to sell any such securities before a recovery of cost. The fair value is expected to recover as the securities approach their maturity date or repricing date or if market yields for such investments until adecline. Accordingly, as of December 31, 2021, management believes that the unrealized losses detailed in the previous table are due to noncredit-related factors, including changes in interest rates and other market price recovery or maturity, these investments are not considered other-than-temporarily impaired.conditions, and therefore no losses have been recognized in the Company's Consolidated Statements of Income.
At December 31, 20182021 and 2017, $58.42020, $59.5 million and $51.6$77.9 million in securities were pledged for deposits and borrowings, respectively.
The amortized cost and fair values of available for sale and held to maturity debt securities at December 31, 2018,2021, are distributed by contractual maturity as shown below. Expected maturities may differ from contractual maturities because issuers may have the right to call or prepay obligations with or without call or prepayment penalties.
| | | | | | | | | | | | | | | | | |
| (In Thousands) | Amortized Cost | | Fair Value | | Weighted Average Yield |
| U.S. Treasury and government sponsored entities | | | | | |
| Within 1 year | $4,999 | | | $5,041 | | | 2.80 | % |
| 1-5 years | 340,515 | | | 336,439 | | | 0.79 | % |
| | | | | |
| Total | $345,514 | | | $341,480 | | | 0.82 | % |
| | | | | |
| | | | | |
| | | | | |
| | | | | |
| | | | | |
| | | | | |
| Corporate bonds | | | | | |
| | | | | |
| 1-5 years | $37,691 | | | $37,912 | | | 2.41 | % |
| 5-10 years | 15,030 | | | 14,953 | | | 6.50 | % |
| Total | $52,721 | | | $52,865 | | | 2.81 | % |
| Collateralized loan obligations | | | | | |
| 1-5 years | $5,000 | | | $5,000 | | | 1.65 | % |
| 5-10 years | 46,431 | | | 46,418 | | | 1.39 | % |
| | | | | |
| Total | $51,431 | | | $51,418 | | | 1.42 | % |
| Municipal securities | | | | | |
| | | | | |
| 1-5 years | 820 | | | 840 | | | 2.14 | % |
| | | | | |
| Total | $820 | | | $840 | | | 2.14 | % |
|
| | | | | | | | | | |
| (In Thousands) | Amortized Cost |
| Fair Value |
| Weighted Average Yield |
| U.S. Treasury and government sponsored entities | |
| |
| |
| Within 1 year |
| $68,285 |
|
|
| $67,798 |
|
| 1.41 | % |
| 1-5 years | 141,623 |
|
| 141,062 |
|
| 2.36 | % |
| Total |
| $209,908 |
|
|
| $208,860 |
|
| 2.05 | % |
| Corporate bonds | |
| |
| |
| 1-5 years |
| $30,130 |
|
|
| $30,103 |
|
| 3.45 | % |
| 5-10 years | 10,009 |
|
| 9,677 |
|
| 3.51 | % |
| Total |
| $40,139 |
|
|
| $39,780 |
|
| 3.46 | % |
| Collateralized loan obligations | | | | | |
| 5-10 years |
| $3,000 |
| |
| $2,990 |
| | 3.86 | % |
| Over 10 years | 10,990 |
| | 10,896 |
| | 3.78 | % |
| Total |
| $13,990 |
| |
| $13,886 |
| | 3.80 | % |
| Municipal securities | |
| |
| |
| Within 1 year |
| $1,867 |
|
|
| $1,861 |
|
| 1.64 | % |
| 1-5 years | 7,222 |
|
| 7,223 |
|
| 2.64 | % |
| Total |
| $9,089 |
|
|
| $9,084 |
|
| 2.43 | % |
The proceeds and resulting gains and losses, computed using specific identification, from sales of investment securities for the years ending December 31, 2018, 2017,2021, 2020, and 2016,2019, respectively, are as follows:
| | | | | | | | | | | | | | | | | |
| (In Thousands) | Proceeds | | Gross Gains | | Gross Losses |
| 2021 | | | | | |
| Available for sale securities | $— | | | $— | | | $— | |
| 2020 | | | | | |
| Available for sale securities | $— | | | $— | | | $— | |
| 2019 | | | | | |
| Available for sale securities | $4,219 | | | $23 | | | $— | |
|
| | | | | | | | | | | |
| (In Thousands) | Proceeds |
| Gross Gains |
| Gross Losses |
| 2018 | |
| |
| |
| Available for sale securities |
| $— |
|
|
| $— |
|
|
| $— |
|
| 2017 | |
| |
| |
| Available for sale securities |
| $25,006 |
|
|
| $14 |
|
|
| $3 |
|
| 2016 | |
| |
| |
| Available for sale securities |
| $5,785 |
|
|
| $12 |
|
|
| $23 |
|
A summary of interest income for the years ending December 31, 2018, 2017,2021, 2020, and 20162019 on available for sale investment securities is as follows:
| | | | | | | | | | | | | | | | | |
| (In Thousands) | 2021 | | 2020 | | 2019 |
| U.S. Treasury and government sponsored entities | $2,203 | | | $3,396 | | | $4,170 | |
| | | | | |
| Other | 1,118 | | | 1,354 | | | 2,282 | |
| Total taxable interest income | $3,321 | | | $4,750 | | | $6,452 | |
| Municipal securities | $18 | | | $82 | | | $120 | |
| Total tax-exempt interest income | $18 | | | $82 | | | $120 | |
| Total | $3,339 | | | $4,832 | | | $6,572 | |
|
| | | | | | | | | | | |
| (In Thousands) | 2018 |
| 2017 | | 2016 |
| U.S. Treasury and government sponsored entities |
| $3,682 |
|
|
| $2,983 |
| |
| $2,661 |
|
| U.S. Agency mortgage-backed securities | — |
|
| — |
| | 4 |
|
| Other | 1,532 |
|
| 880 |
| | 633 |
|
| Total taxable interest income |
| $5,214 |
|
|
| $3,863 |
| |
| $3,298 |
|
| Municipal securities |
| $267 |
|
|
| $367 |
| |
| $282 |
|
| Total tax-exempt interest income |
| $267 |
|
|
| $367 |
| |
| $282 |
|
| Total |
| $5,481 |
|
|
| $4,230 |
| |
| $3,580 |
|
NOTE 65 - Loans and Allowance for Credit Losses
Loans Held for Sale
Loans held for sale are comprised entirely of 1-4 family residential mortgage loans as of December 31, 2021 and 2020.
Loans Held for Investment
The Company adopted ASU 2016-13 effective January 1, 2021. Upon adoption, the Company changed its loan segments for purposes of the calculation of the ACL. Prior to January 1, 2021, the Company's loan segments were based on a combination of loan purpose and loan collateral. Effective January 1, 2021 and thereafter, the Company's loan segments are primarily based on loan collateral. The following table presents the Company's loan segments as of December 31, 2020 under the legacy segmentation and the new segmentation under ASU 2016-13:
| | | | | |
| (In Thousands) | Pre-ASU 2016-13 |
| Commercial loans | $780,058 | |
| Real estate construction one-to-four family | 38,467 | |
| Real estate construction other | 80,315 | |
| Real estate term owner occupied | 163,597 | |
| Real estate term non-owner occupied | 309,074 | |
| Real estate term other | 46,620 | |
| Consumer secured by 1st deeds of trust | 15,585 | |
| Consumer other | 22,069 | |
| Subtotal | 1,455,785 | |
| Unearned loan fees, net | (11,735) | |
| Total portfolio loans | $1,444,050 | |
| |
| Post-ASU 2016-13 |
| Commercial & industrial loans | $619,304 | |
| Commercial real estate: | |
| Owner occupied properties | 234,364 | |
| Non-owner occupied and multifamily properties | 394,860 | |
| Residential real estate: | |
| 1-4 family residential properties secured by first liens | 33,463 | |
| 1-4 family residential properties secured by junior liens and revolving secured by 1-4 family first liens | 18,114 | |
| 1-4 family residential construction loans | 32,760 | |
| Other construction, land development and raw land loans | 84,352 | |
| Obligations of states and political subdivisions in the US | 15,274 | |
| Agricultural production, including commercial fishing | 13,093 | |
| Consumer loans | 5,794 | |
| Other loans | 4,407 | |
| Subtotal | $1,455,785 | |
| Unearned loan fees, net | ($11,735) | |
| Total portfolio loans | $1,444,050 | |
The following table presents amortized cost and unpaid principal balance of loans for the periods indicated:
| | | | | | | | | | | | | | | | | | | | |
| December 31, 2021 | December 31, 2020 |
| (In Thousands) | Amortized Cost | Unpaid Principal | Difference | Amortized Cost | Unpaid Principal | Difference |
| Commercial & industrial loans | $448,338 | | $454,106 | | ($5,768) | | $612,254 | | $619,304 | | ($7,050) | |
| Commercial real estate: | | | | | | |
| Owner occupied properties | 300,200 | | 301,623 | | (1,423) | | 233,320 | | 234,363 | | (1,043) | |
| Non-owner occupied and multifamily properties | 435,311 | | 438,631 | | (3,320) | | 392,452 | | 394,860 | | (2,408) | |
| Residential real estate: | | | | | | |
| 1-4 family residential properties secured by first liens | 32,542 | | 32,602 | | (60) | | 33,415 | | 33,510 | | (95) | |
| 1-4 family residential properties secured by junior liens and revolving secured by 1-4 family first liens | 19,610 | | 19,489 | | 121 | | 18,236 | | 18,114 | | 122 | |
| 1-4 family residential construction loans | 36,222 | | 36,542 | | (320) | | 32,500 | | 32,760 | | (260) | |
| Other construction, land development and raw land loans | 88,094 | | 88,604 | | (510) | | 83,463 | | 84,351 | | (888) | |
| Obligations of states and political subdivisions in the US | 16,403 | | 16,565 | | (162) | | 15,318 | | 15,274 | | 44 | |
| Agricultural production, including commercial fishing | 27,959 | | 28,082 | | (123) | | 12,968 | | 13,093 | | (125) | |
| Consumer loans | 4,801 | | 4,763 | | 38 | | 5,734 | | 5,794 | | (60) | |
| Other loans | 4,406 | | 4,422 | | (16) | | 4,390 | | 4,407 | | (17) | |
| Total | 1,413,886 | | 1,425,429 | | (11,543) | | 1,444,050 | | 1,455,830 | | (11,780) | |
| Allowance for credit losses | (11,739) | | | | (21,136) | | | |
| $1,402,147 | | $1,425,429 | | ($11,543) | | $1,422,914 | | $1,455,830 | | ($11,780) | |
The difference between the amortized cost and unpaid principal balance is primarily net deferred origination fees totaling $11.5 million and $11.7 million at December 31, 2021 and 2020, respectively, and premiums and discounts associated with acquired loans totaling $0 and $47,000 at December 31, 2021 and 2020, respectively.
Accrued interest on loans, which is excluded from the amortized cost of loans held for investment, totaled $5.5 million and $7.1 million at December 31, 2021 and 2020, respectively, and was included in other assets in the Consolidated Balance Sheets.
Amortized cost in the above table includes $118.2 million and $304.6 million as of December 31, 2021 and 2020, respectively, in PPP loans administered by the SBA within the Commercial & industrial loan segment.
At December 31, 2021, approximately 75% of the Company’s loans, excluding PPP loans, are secured by real estate and 1% are unsecured. Approximately 24% are for general commercial uses, including professional, retail, and small businesses. Repayment is expected from the borrowers’ cash flow or, secondarily, the collateral. The Company’s exposure to credit loss, if any, is the outstanding amount of the loan if the collateral is determined to be of no value.
Allowance for Credit Losses
The activity in the ACL related to loans held for investment is as follows:
| | | | | | | | | | | | | | | | | | | | |
| Beginning Balance | Impact of adopting ASC 326 | Credit Loss Expense (Benefit) | Charge-offs | Recoveries | Ending Balance |
| (In Thousands) |
| 2021 | | | | | | |
| Commercial | $7,973 | | ($7,973) | | $— | | $— | | $— | | — | |
| Real estate construction 1-4 family | 679 | | (679) | | — | | — | | — | | — | |
| Real estate construction other | 1,179 | | (1,179) | | — | | — | | — | | — | |
| Real estate term owner occupied | 2,625 | | (2,625) | | — | | — | | — | | — | |
| Real estate term non-owner occupied | 5,133 | | (5,133) | | — | | — | | — | | — | |
| Real estate term other | 779 | | (779) | | — | | — | | — | | — | |
| Consumer secured by 1st deed of trust | 261 | | (261) | | — | | — | | — | | — | |
| Consumer other | 400 | | (400) | | — | | — | | — | | — | |
| Unallocated | 2,107 | | (2,107) | | — | | — | | — | | — | |
| Commercial & industrial loans | — | | 4,348 | | (122) | | (1,452) | | 253 | | 3,027 | |
| Commercial real estate: | | | | | | |
| Owner occupied properties | — | | 3,579 | | (412) | | — | | 9 | | 3,176 | |
| Non-owner occupied and multifamily properties | — | | 4,944 | | (2,014) | | — | | — | | 2,930 | |
| Residential real estate: | | | | | | |
| 1-4 family residential properties secured by first liens | — | | 673 | | (234) | | — | | — | | 439 | |
| 1-4 family residential properties secured by junior liens and revolving secured by 1-4 family first liens | — | | 419 | | (242) | | — | | 38 | | 215 | |
| 1-4 family residential construction loans | — | | 454 | | (334) | | — | | — | | 120 | |
| Other construction, land development and raw land loans | — | | 1,994 | | (359) | | — | | — | | 1,635 | |
| Obligations of states and political subdivisions in the US | — | | 44 | | (12) | | — | | — | | 32 | |
| Agricultural production, including commercial fishing | — | | 49 | | 11 | | — | | 31 | | 91 | |
| Consumer loans | — | | 118 | | (65) | | — | | 14 | | 67 | |
| Other loans | — | | 3 | | 4 | | — | | — | | 7 | |
| Total | $21,136 | | ($4,511) | | ($3,779) | | ($1,452) | | $345 | | $11,739 | |
| | | | | | | | | | | | | | | | | |
| Beginning Balance | Provision (benefit) | Charge-offs | Recoveries | Ending Balance |
| (In Thousands) |
| 2020 | | | | | |
| Commercial | $6,604 | | $1,680 | | ($1,021) | | $710 | | $7,973 | |
| Real estate construction 1-4 family | 643 | | 36 | | — | | — | | 679 | |
| Real estate construction other | 1,017 | | 162 | | — | | — | | 1,179 | |
| Real estate term owner occupied | 2,188 | | 522 | | (85) | | — | | 2,625 | |
| Real estate term non-owner occupied | 5,180 | | (47) | | — | | — | | 5,133 | |
| Real estate term other | 671 | | 106 | | — | | 2 | | 779 | |
| Consumer secured by 1st deed of trust | 270 | | (9) | | — | | — | | 261 | |
| Consumer other | 436 | | (46) | | (15) | | 25 | | 400 | |
| Unallocated | 2,079 | | 28 | | — | | — | | 2,107 | |
| Total | $19,088 | | $2,432 | | ($1,121) | | $737 | | $21,136 | |
As of December 31, 2021 the ACL decreased to $11.7 million. The Company primarily uses a DCF method to estimate ACL for loans. The Company utilizes and forecasts unemployment in Alaska as the primary loss driver in the DCF model. The Company also utilizes and forecasts either the one-year percentage change in the Alaska home price index or the one-year percentage change in the national commercial real estate price index as a second loss driver depending on the nature of the underlying loan pool and how well that loss driver correlates to expected future losses. Consistent forecasts of the loss drivers are used across the loan segments.
At December 31, 2021, as compared to January 1, 2021, the Company forecasted a significantly lower unemployment rate in Alaska, a slightly higher one-year percentage change in the national commercial real estate price index, and a higher one-year percentage change in the Alaska home price index over the reasonable and supportable forecast period. Specifically regarding the forecasts used to calculate the December 31, 2021 ACL, management expects unemployment to decline each quarter in 2022 as compare to actual levels observed in Alaska as of December 2021. This rate is still above pre-pandemic levels over the forecast period, but is lower than rates previously projected by management.
The Company also applies qualitative factors in our CECL model, and these factors also improved as of December 31, 2021 as compared to January 1, 2021 due to increases in oil prices. Additionally, the ACL for individually impaired loans decreased during the 2021 due to pay downs. These factors, which decreased the ACL during 2021, were only partially offset by an increase in loan balances.
The following table presents loans individually and collectively evaluated for impairment and their respective allowance for credit loss allocations as of December 31, 2020, as determined in accordance with ASC 310 prior to the adoption of ASU 2016-13:
| | | | | | | | | | | | | | | | | | | | | | | |
| (In Thousands) | Loan Evaluation | | ALLL Allocations |
| Individually | Collectively | Total | | Individually | Collectively | Total |
| | | | | | | |
| Commercial | $7,786 | | $764,682 | | $772,468 | | | $13 | | $7,960 | | $7,973 | |
| Real estate construction 1-4 family | 702 | | $37,478 | | 38,180 | | | — | | 679 | | 679 | |
| Real estate construction other | — | | $79,403 | | 79,403 | | | — | | 1,179 | | 1,179 | |
| Real estate term owner occupied | 6,962 | | $155,762 | | 162,724 | | | — | | 2,625 | | 2,625 | |
| Real estate term non-owner occupied | 770 | | $306,477 | | 307,247 | | | — | | 5,133 | | 5,133 | |
| Real estate term other | 1,467 | | $44,763 | | 46,230 | | | — | | 779 | | 779 | |
| Consumer secured by 1st deed of trust | 259 | | $15,289 | | 15,548 | | | — | | 261 | | 261 | |
| Consumer other | 82 | | $22,168 | | 22,250 | | | — | | 400 | | 400 | |
| Unallocated | — | | — | | — | | | — | | 2,107 | | 2,107 | |
| Total | $18,028 | | $1,426,022 | | $1,444,050 | | | $13 | | $21,123 | | $21,136 | |
The following table presents information pertaining to impaired loans as of December 31, 2020, as determined in accordance with ASC 310 prior to the adoption of ASU 2016-13:
| | | | | | | | | | | | | | | | | | | | |
| Impaired Loans With a Valuation Allowance | | Impaired Loans Without a Valuation Allowance |
| (In Thousands) | Recorded Investment | Unpaid Principal | Related Allowance | | Recorded Investment | Unpaid Principal |
| | | | | | |
| Commercial | $308 | | $308 | | $13 | | | $7,478 | | $8,287 | |
| Real estate construction 1-4 family | — | | — | | — | | | 702 | | 702 | |
| Real estate construction other | — | | — | | — | | | — | | — | |
| Real estate term owner occupied | — | | — | | — | | | 6,962 | | 7,047 | |
| Real estate term non-owner occupied | — | | — | | — | | | 771 | | 771 | |
| Real estate term other | — | | — | | — | | | 1,467 | | 1,467 | |
| Consumer secured by 1st deed of trust | — | | — | | — | | | 258 | | 258 | |
| Consumer other | — | | — | | — | | | 82 | | 87 | |
| Total | $308 | | $308 | | $13 | | | $17,720 | | $18,619 | |
The following table presents average impaired loans information, as determined in accordance with ASC 310 prior to the adoption of ASU 2016-13, and interest recognized on such loans, for the year ended December 31, 2020:
| | | | | | | | |
| (In Thousands) | Average Impaired Loans | Interest Recognized |
| Commercial | $10,964 | | $147 | |
| Real estate construction 1-4 family | 781 | | — | |
| Real estate construction other | — | | — | |
| Real estate term owner occupied | 6,739 | | 125 | |
| Real estate term non-owner occupied | 562 | | 29 | |
| Real estate term other | 1,551 | | 20 | |
| Consumer secured by 1st deed of trust | 299 | | 12 | |
| Consumer other | 86 | | — | |
| Total | $20,982 | | $333 | |
Credit Quality Information
As part of the on-going monitoring of the credit quality of the Company’s loan portfolio, management tracks certain credit quality indicators including trends in past due and nonaccrual loans, gross and net charge-offs, and movement in loan balances within the risk classifications. The Company utilizes a loan risk grading system called the Asset Quality Rating (“AQR”) system to assign a risk classification to each of its loans. The risk classification is a dual rating system that contemplates both probability of default and risk of loss given default. Loans are graded on a scale of 1 to 10 and, loans graded 1 – 6 are considered “pass” grade loans. Loans graded 7 or higher are considered "classified" loans. A description of the general characteristics of the AQR risk classifications are as follows:
Pass grade loans – 1 through 6:The borrower demonstrates sufficient cash flow to fund debt service, including acceptable profit margins, cash flows, liquidity andother balance sheet ratios. Historic and projected performance indicates that the borrower is able to meet obligations under most economic circumstances. The companyCompany has competent management with an acceptable track record. The category does not include loans with undue or unwarranted credit risks that constitute identifiable weaknesses.
Classified loans:
Special Mention – 7: A "special mention" credit has weaknesses that deserve management's close attention. If left uncorrected, these potential weaknesses may result in deterioration of either the repayment prospects for the asset or the Bank's credit position at some future date. Special mention assets are not adversely classified and do not expose the Bank to sufficient risk to warrant adverse classification. Loans are currently protected, but are weak due to negative trends in the balance sheet and income statement. Current cash flow may be insufficient to meet debt service, with prospects that the condition may not be temporary. Profitability and key balance sheet ratios are below peers. There is a lack of effective control over collateral or there are documentation deficiencies as well as a potential risk of payment default. Collateral coverage is minimal in gross dollars or due to quality issues. Financial information may be inadequate to show the recent condition of borrower. The loan would not be approved as a new credit, and new loans would not be granted. Management may not be adequately qualified or may have very limited prior experience with similar activities or markets. The ability of management to cope with current conditions is questionable. Internal conflict and turnover in key positions may be present. Succession is unclear. The borrower's asset quality is below average. The capital base may be insufficient to cover capital losses. Leverage is above average or increasing. The industry outlook is generally negative but there are reasonable expectations of a turnaround within 12-18 months. The firm may be new, resulting in competitive deficiencies in comparison to the older, more established firms in the industry. Over-capacity may be evident in the industry. Collateral and guarantor strength are comparable to Management Attention-6, but agings and certifications of accounts receivable and inventory are required and are not being provided on a regular basis.
Substandard – 8: A "substandard" credit is inadequately protected by the current sound worth and paying capacity of the obligor or by the collateral pledged, if any. Assets so classified must have a well-defined weakness, or weaknesses that jeopardize the liquidation of the debt. They are characterized by the distinct possibility that the Bank will sustain some loss if the deficiencies are not corrected. Loans have well-defined weaknesses where a payment default and/or a loss are possible, but not yet probable. Cash flow is insufficient to service debt, with prospects that the condition is permanent. Assets classified as substandard are inadequately protected by the current net worth and paying capacity of the borrower, and there is a likelihood that collateral will have to be liquidated and/or the guarantor called upon to repay the debt. Generally, the loan is considered collectible as to both principal and interest, primarily because of collateral coverage. Loan(s) may have been restructured at less than market terms or have been partially charged off. If deficiencies are not corrected quickly, there is a probability of loss and the borrower’s ability to operate as a going concern may be deemed questionable/is questionable. Management has no prior experience with similar activities, demonstrating inability to realistically address problems and meet commitments. The borrower’s asset quality is poor. The capital base is weak and insufficient to absorb continuing losses, and leverage is significantly above peers. Liquidity is poor with significant reliance on short-term borrowing to support trade debt. Key balance sheet ratios are substantially inferior to industry norms. The industry is currently trending downward or demonstrating recovery from an adverse cycle. The outlook is generally negative at this time. Timing of recovery is unclear, but expectations are that market conditions will improve within 18-24 months. The borrower has substantial competitive deficiencies when compared to other firms, such as excess capacity and over-supply, resulting in frequent and significant concessions and discounting. Business failures are prevalent. Collateral coverage is marginal or non-existent. Collateral may be located outside the borrower’s market area. There are no agings or certifications of accounts receivable and inventory being received from the borrower, and collateral has doubtful marketability/convertibility. If guaranteed, the guarantor has limited outside worth and is highly leveraged with a poor credit report, which may reflect liens, collection problems, or lawsuits.
Doubtful – 9: An asset classified "doubtful" has all the weaknesses inherent in one that is classified "substandard-8" with the added characteristic that the weaknesses make collection or liquidation in full, on the basis of currently known facts, conditions, and values, highly questionable and improbable. The loan has substandard characteristics, and available information suggests that it is unlikely that the loan will be repaid in its entirety. Cash flow is insufficient to service debt. The company has had a series of substantial losses. If the current material adverse trends continue, it is unlikely the borrower will have the ability to meet the terms of the loan agreement. It may be difficult to predict the exact amount of loss, but the probability of some loss is greater
than 50%. Loans are to be placed on non-accrual status when any portion is classified as doubtful. Non-accrual loans would not be classified "doubtful" as long as the collateral appears adequate to retire the outstanding balance. Management is clearly unable to address problems and meet commitments, and there is little expectation either of improvement or for sustaining the relationship with current management. The company is highly illiquid with excessive leverage. Key balance sheet ratios are at unacceptable levels, and downturn is severe. Timing of recovery is undeterminable. The company is unable to compete; collateral and guarantees provide limited support.
Loss – 10: An asset classified "loss" is considered uncollectableuncollectible and of such little value that its continuance on the books is not warranted. This classification does not mean that the asset has absolutely no recovery or salvage value, but rather that it is not practical or desirable to defer writing off this basically worthless asset, even though partial recovery may be affected in the future.
The following tables present the Company's portfolio of risk-rated loans by grade and by year of origination. Management considers the guidance in ASC 310-20 when determining whether a modification, extension, or renewal of loan has doubtful characteristics, butconstitutes a current period origination. Generally, current period renewals of credit are re-underwritten at the loan will definitely not be repaid in full. Debt service coverage clearly reflects the company's inability to service debt. The borrower cannot generate sufficient cash flow to cover fixed charges. All near-termpoint of renewal and long-term trends concerning cash flow and earnings are negative. The damage to the financial conditionconsidered current period originations for purposes of the Company cannot be reversed at this point in time. Collateral and guarantees provide no support.table below.
| | | | | | | | | | | | | | | | | | | | | | | |
| December 31, 2021 | 2021 | 2020 | 2019 | 2018 | 2017 | Prior | Total |
| (In Thousands) |
| Commercial & industrial loans | | | | | | | |
| Pass | $227,376 | | $54,478 | | $29,846 | | $37,339 | | $23,205 | | $44,554 | | $416,798 | |
| Classified | 18,853 | | 714 | | 3,564 | | 3,118 | | 517 | | 4,774 | | 31,540 | |
| Total commercial & industrial loans | $246,229 | | $55,192 | | $33,410 | | $40,457 | | $23,722 | | $49,328 | | $448,338 | |
| | | | | | | |
| Commercial real estate: | | | | | | | |
| Owner occupied properties | | | | | | | |
| Pass | $81,533 | | $83,975 | | $39,254 | | $14,841 | | $14,452 | | $57,717 | | $291,772 | |
| Classified | — | | 1,399 | | — | | 522 | | — | | 6,507 | | 8,428 | |
| Total commercial real estate owner occupied properties | $81,533 | | $85,374 | | $39,254 | | $15,363 | | $14,452 | | $64,224 | | $300,200 | |
| | | | | | | |
| Non-owner occupied and multifamily properties | | | | | |
| Pass | $77,205 | | $77,961 | | $61,147 | | $34,307 | | $19,833 | | $154,561 | | $425,014 | |
| Classified | — | | — | | — | | 10 | | 10,286 | | 1 | | 10,297 | |
| Total commercial real estate non-owner occupied and multifamily properties | $77,205 | | $77,961 | | $61,147 | | $34,317 | | $30,119 | | $154,562 | | $435,311 | |
| | | | | | | |
| Residential real estate: | | | | | | | |
| 1-4 family residential properties secured by first liens | | | | | |
| Pass | $7,756 | | $8,023 | | $3,689 | | $531 | | $1,466 | | $8,812 | | $30,277 | |
| Classified | 417 | | 1,077 | | 472 | | 90 | | — | | 209 | | 2,265 | |
| Total residential real estate 1-4 family residential properties secured by first liens | $8,173 | | $9,100 | | $4,161 | | $621 | | $1,466 | | $9,021 | | $32,542 | |
| | | | | | | |
| 1-4 family residential properties secured by junior liens and revolving secured by 1-4 family first liens | | |
| Pass | $5,806 | | $2,535 | | $3,229 | | $3,464 | | $259 | | $4,046 | | $19,339 | |
| Classified | — | | — | | — | | 259 | | — | | 12 | | 271 | |
| Total residential real estate 1-4 family residential properties secured by junior liens and revolving secured by 1-4 family first liens | $5,806 | | $2,535 | | $3,229 | | $3,723 | | $259 | | $4,058 | | $19,610 | |
| | | | | | | |
| 1-4 family residential construction loans | | | | | | | |
| Pass | $21,409 | | $1,056 | | $1,707 | | $62 | | $— | | $11,879 | | $36,113 | |
| Classified | — | | — | | — | | — | | 109 | | — | | 109 | |
| Total residential real estate 1-4 family residential construction loans | $21,409 | | $1,056 | | $1,707 | | $62 | | $109 | | $11,879 | | $36,222 | |
| | | | | | | |
| Other construction, land development and raw land loans | | | | |
| Pass | $39,624 | | $26,458 | | $11,044 | | $3,315 | | $139 | | $5,544 | | $86,124 | |
| Classified | — | | — | | — | | 460 | | — | | 1,510 | | 1,970 | |
| Total other construction, land development and raw land loans | $39,624 | | $26,458 | | $11,044 | | $3,775 | | $139 | | $7,054 | | $88,094 | |
| | | | | | | |
| Obligations of states and political subdivisions in the US | | | | |
| Pass | $4,120 | | $812 | | $1,875 | | $343 | | $2,733 | | $6,520 | | $16,403 | |
| Classified | — | | — | | — | | — | | — | | — | | — | |
| | | | | | | | | | | | | | | | | | | | | | | |
| Total obligations of states and political subdivisions in the US | $4,120 | | $812 | | $1,875 | | $343 | | $2,733 | | $6,520 | | $16,403 | |
| | | | | | | |
| Agricultural production, including commercial fishing | | | | |
| Pass | $19,970 | | $3,929 | | $810 | | $1,118 | | $741 | | $1,391 | | $27,959 | |
| Classified | — | | — | | — | | — | | — | | — | | — | |
| Total agricultural production, including commercial fishing | $19,970 | | $3,929 | | $810 | | $1,118 | | $741 | | $1,391 | | $27,959 | |
| | | | | | | |
| Consumer loans | | | | | | | |
| Pass | $873 | | $815 | | $653 | | $403 | | $291 | | $1,766 | | $4,801 | |
| Classified | — | | — | | — | | — | | — | | — | | — | |
| Total consumer loans | $873 | | $815 | | $653 | | $403 | | $291 | | $1,766 | | $4,801 | |
| | | | | | | |
| Other loans | | | | | | | |
| Pass | $2,028 | | $1,645 | | $430 | | $95 | | $— | | $208 | | $4,406 | |
| Classified | — | | — | | — | | — | | — | | — | | — | |
| Total other loans | $2,028 | | $1,645 | | $430 | | $95 | | $— | | $208 | | $4,406 | |
| | | | | | | |
| Total loans | | | | | | | |
| Pass | $487,700 | | $261,687 | | $153,684 | | $95,818 | | $63,119 | | $296,998 | | $1,359,006 | |
| Classified | 19,270 | | 3,190 | | 4,036 | | 4,459 | | 10,912 | | 13,013 | | 54,880 | |
| Total loans | $506,970 | | $264,877 | | $157,720 | | $100,277 | | $74,031 | | $310,011 | | $1,413,886 | |
| | | | | | | |
| Total pass loans | $487,700 | | $261,687 | | $153,684 | | $95,818 | | $63,119 | | $296,998 | | $1,359,006 | |
| Government guarantees | (145,713) | | (12,725) | | (14,429) | | (3,299) | | (306) | | (6,562) | | (183,034) | |
| Total pass loans, net of government guarantees | $341,987 | | $248,962 | | $139,255 | | $92,519 | | $62,813 | | $290,436 | | $1,175,972 | |
| | | | | | | |
| Total classified loans | $19,270 | | $3,190 | | $4,036 | | $4,459 | | $10,912 | | $13,013 | | $54,880 | |
| Government guarantees | (7,201) | | (1,259) | | — | | — | | — | | (10,571) | | (19,031) | |
| Total classified loans, net government guarantees | $12,069 | | $1,931 | | $4,036 | | $4,459 | | $10,912 | | $2,442 | | $35,849 | |
The compositionfollowing table presents the Company's portfolio of the loan portfoliorisk-rated loans by grade as of December 31, 2020:
| | | | | | | | | | | |
| Pass | Classified | Total |
| (In Thousands) |
| December 31, 2020 | | | |
| Commercial | $758,362 | | $14,106 | | $772,468 | |
| Real estate construction 1-4 family | 37,093 | | 1,087 | | 38,180 | |
| Real estate construction other | 79,403 | | — | | 79,403 | |
| Real estate term owner occupied | 152,734 | | 9,990 | | 162,724 | |
| Real estate term non-owner occupied | 289,555 | | 17,692 | | 307,247 | |
| Real estate term other | 42,900 | | 3,330 | | 46,230 | |
| Consumer secured by 1st deed of trust | 15,404 | | 144 | | 15,548 | |
| Consumer other | 22,144 | | 106 | | 22,250 | |
| Portfolio loans | 1,397,595 | | 46,455 | | 1,444,050 | |
| Government guarantees | (334,639) | | (14,587) | | (349,226) | |
| Portfolio loans, net of government guarantees | $1,062,956 | | $31,868 | | $1,094,824 | |
Past Due Loans
The following tables present an aging of contractually past due loans as of the periods indicated is as follows:indicated:
| | | | | | | | | | | | | | | | | | | | | | | | | | | | | | | | | | | | | | | | | |
| (In Thousands) | 30-59 Days
Past Due | | 60-89 Days
Past Due | | Greater Than
90 Days Past Due | | Total Past
Due | | Current | | Total | | Greater Than 90 Days Past Due Still Accruing |
| December 31, 2021 | | | | | | | | | | | | | |
| Commercial & industrial loans | $206 | | | $51 | | | $469 | | | $726 | | | $447,612 | | | $448,338 | | | $— | |
| Commercial real estate: | | | | | | | | | | | | | |
| Owner occupied properties | 12 | | | — | | | 1,176 | | | 1,188 | | | 299,012 | | | 300,200 | | | — | |
| Non-owner occupied and multifamily properties | — | | | — | | | — | | | — | | | 435,311 | | | 435,311 | | | — | |
| Residential real estate: | | | | | | | | | | | | | |
| 1-4 family residential properties secured by first liens | — | | | — | | | 90 | | | 90 | | | 32,452 | | | 32,542 | | | — | |
| 1-4 family residential properties secured by junior liens and revolving secured by 1-4 family first liens | — | | | — | | | 139 | | | 139 | | | 19,471 | | | 19,610 | | | — | |
| 1-4 family residential construction loans | — | | | — | | | 109 | | | 109 | | | 36,113 | | | 36,222 | | | — | |
| Other construction, land development and raw land loans | — | | | — | | | 1,636 | | | 1,636 | | | 86,458 | | | 88,094 | | | — | |
| Obligations of states and political subdivisions in the US | — | | | — | | | — | | | — | | | 16,403 | | | 16,403 | | | — | |
| Agricultural production, including commercial fishing | — | | | — | | | — | | | — | | | 27,959 | | | 27,959 | | | — | |
| Consumer loans | — | | | — | | | — | | | — | | | 4,801 | | | 4,801 | | | — | |
| Other loans | — | | | — | | | — | | | — | | | 4,406 | | | 4,406 | | | — | |
| Total | $218 | | | $51 | | | $3,619 | | | $3,888 | | | $1,409,998 | | | $1,413,886 | | | $— | |
| December 31, 2020 | | | | | | | | | | | | | |
| Commercial & industrial loans | $242 | | | $229 | | | $2,675 | | | $3,146 | | | $609,108 | | | $612,254 | | | $— | |
| Commercial real estate: | | | | | | | | | | | | | |
| Owner occupied properties | 2,203 | | | — | | | 2,459 | | | 4,662 | | | 228,658 | | | 233,320 | | | 449 | |
| Non-owner occupied and multifamily properties | — | | | — | | | — | | | — | | | 392,452 | | | 392,452 | | | — | |
| Residential real estate: | | | | | | | | | | | | | |
| 1-4 family residential properties secured by first liens | 446 | | | — | | | — | | | 446 | | | 32,969 | | | 33,415 | | | — | |
| 1-4 family residential properties secured by junior liens and revolving secured by 1-4 family first liens | 38 | | | — | | | 139 | | | 177 | | | 18,059 | | | 18,236 | | | — | |
| 1-4 family residential construction loans | — | | | — | | | 702 | | | 702 | | | 31,798 | | | 32,500 | | | — | |
| Other construction, land development and raw land loans | — | | | — | | | 1,545 | | | 1,545 | | | 81,918 | | | 83,463 | | | — | |
| Obligations of states and political subdivisions in the US | — | | | — | | | — | | | — | | | 15,318 | | | 15,318 | | | — | |
| Agricultural production, including commercial fishing | — | | | — | | | — | | | — | | | 12,968 | | | 12,968 | | | — | |
| Consumer loans | — | | | — | | | 272 | | | 272 | | | 5,462 | | | 5,734 | | | — | |
| Other loans | — | | | — | | | — | | | — | | | 4,390 | | | 4,390 | | | — | |
| Total | $2,929 | | | $229 | | | $7,792 | | | $10,950 | | | $1,433,100 | | | $1,444,050 | | | $449 | |
|
| | | | | | | | | | | | | | | | | | | | | | | | | | | | | | | | | | | |
| (In Thousands) | Commercial | | Real estate construction one-to-four family | | Real estate construction other | | Real estate term owner occupied | | Real estate term non-owner occupied | | Real estate term other | | Consumer secured by 1st deeds of trust | | Consumer other | | Total |
| December 31, 2018 | | | | | | | | | | | | | | | | | |
| AQR Pass |
| $315,112 |
|
|
| $33,729 |
|
|
| $72,256 |
|
|
| $117,174 |
|
|
| $307,126 |
|
|
| $40,792 |
|
|
| $18,768 |
|
|
| $23,595 |
|
|
| $928,552 |
|
| AQR Special Mention | 5,116 |
|
| 3,382 |
|
| — |
|
| 3,987 |
|
| 18,129 |
|
| 670 |
|
| 140 |
|
| 2 |
|
| 31,426 |
|
| AQR Substandard | 22,192 |
|
| — |
|
| — |
|
| 5,253 |
|
| 465 |
|
| 577 |
|
| 320 |
|
| 47 |
|
| 28,854 |
|
| Subtotal |
| $342,420 |
|
|
| $37,111 |
|
|
| $72,256 |
|
|
| $126,414 |
|
|
| $325,720 |
|
|
| $42,039 |
|
|
| $19,228 |
|
|
| $23,645 |
|
|
| $988,833 |
|
| Less: Unearned origination fees, net of origination costs | | | | | | (4,487 | ) |
| Total loans | | | | | | | | | | | | | | | | |
| $984,346 |
|
| December 31, 2017 | | | | | | | | | | | | | | | | | |
| AQR Pass |
| $277,371 |
|
|
| $31,201 |
|
|
| $80,093 |
|
|
| $127,059 |
|
|
| $307,780 |
|
|
| $39,777 |
|
|
| $21,846 |
|
|
| $19,895 |
|
|
| $905,022 |
|
| AQR Special Mention | 4,921 |
|
| — |
|
| — |
|
| 2,095 |
|
| 11,051 |
|
| 634 |
|
| 3 |
|
| 22 |
|
| 18,726 |
|
| AQR Substandard | 31,222 |
|
| — |
|
| — |
|
| 2,888 |
|
| 482 |
|
| — |
|
| 767 |
|
| 2 |
|
| 35,361 |
|
| Subtotal |
| $313,514 |
|
|
| $31,201 |
|
|
| $80,093 |
|
|
| $132,042 |
|
|
| $319,313 |
|
|
| $40,411 |
|
|
| $22,616 |
|
|
| $19,919 |
|
|
| $959,109 |
|
| Less: Unearned origination fees, net of origination costs | | | | | | (4,156 | ) |
| Total loans | | | | | | | | | | | | | | | | |
| $954,953 |
|
93
At December 31, 2018, approximately 73% of the Company’s loans are secured by real estate and 2% are unsecured. Approximately 25% are for general commercial uses, including professional, retail, and small businesses. Repayment is expected from the borrowers’ cash flow or, secondarily, the collateral. The Company’s exposure to credit loss, if any, is the outstanding amount of the loan if the collateral is determined to be of no value.
Nonaccrual0Nonaccrual Loans
Nonaccrual loans net of government guarantees totaled $14.7$10.7 million and $21.2$9.6 million at December 31, 20182021 and December 31, 2017,2020, respectively. The following table presents loans on nonaccrual status and loans on nonaccrual status for which there was no related allowance for credit losses:
| | | | | | | | | | | | | | |
| December 31, 2021 | December 31, 2020 |
| (In Thousands) | Nonaccrual | Nonaccrual With No ACL | Nonaccrual | Nonaccrual With No ACL |
| | | | |
| Commercial & industrial loans | $4,350 | | $4,298 | | $3,848 | | $3,513 | |
| Commercial real estate: | | | | |
| Owner occupied properties | 3,506 | | 3,506 | | 4,620 | | 4,582 | |
| | | | |
| Residential real estate: | | | | |
| 1-4 family residential properties secured by first liens | 1,778 | | 1,778 | | 160 | | 160 | |
1-4 family residential properties secured by junior liens
and revolving secured by 1-4 family first liens | 271 | | 215 | | 242 | | 221 | |
| 1-4 family residential construction loans | 109 | | 109 | | 702 | | 702 | |
| Other construction, land development and raw land loans | 1,636 | | 1,636 | | 1,545 | | 1,545 | |
| | | | |
| | | | |
| Consumer loans | — | | — | | 3 | | — | |
| | | | |
| Total nonaccrual loans | 11,650 | | 11,542 | | 11,120 | | 10,723 | |
| Government guarantees on nonaccrual loans | (978) | | (978) | | (1,483) | | (1,483) | |
| Net nonaccrual loans | $10,672 | | $10,564 | | $9,637 | | $9,240 | |
Interest income which would have been earned on nonaccrual loans for 2018, 2017,2021, 2020, and 20162019 amounted to $744,000, $856,000, and $1.3 million, $1.4 million,respectively.
There was $10,000 interest on nonaccrual loans reversed through interest income in 2021, and $676,000, respectively. Additionally,there was $12,000 in interest on nonaccrual loans reversed through interest income in 2020. There was no interest earned on nonaccrual loans with a principal balance during 2021 or 2020. However, the Company recognized interest income of $159,000, $120,000,$1.6 million, $924,000, and $181,000$301,000 in 2018, 2017,2021, 2020, and 2016,2019, respectively, related to interest collected on nonaccrual loans whose principal has been paid down to zero. Nonaccrual loans at the periods indicated, by segment are presented below:
|
| | | | | | | | | | | | | | | | | | | |
| (In Thousands) | 30-59 Days
Past Due | | 60-89 Days
Past Due | | Greater Than
90 Days Past Due | | Current | | Total |
| December 31, 2018 | | | | | | | | | |
| Commercial |
| $1,329 |
| |
| $324 |
| |
| $1,287 |
| |
| $9,731 |
| |
| $12,671 |
|
| Real estate term owner occupied | — |
| | — |
| | 1,694 |
| | — |
| | 1,694 |
|
| Real estate term other | — |
| | — |
| | 577 |
| | — |
| | 577 |
|
| Consumer secured by 1st deeds of trust | — |
| | — |
| | — |
| | 220 |
| | 220 |
|
| Consumer other | — |
| | — |
| | 39 |
| | 9 |
| | 48 |
|
| Total nonaccrual loans | 1,329 |
| | 324 |
| | 3,597 |
| | 9,960 |
| | 15,210 |
|
| Government guarantees on nonaccrual loans | (269 | ) | | — |
| | — |
| | (247 | ) | | (516 | ) |
| Net nonaccrual loans |
| $1,060 |
| |
| $324 |
| |
| $3,597 |
| |
| $9,713 |
| |
| $14,694 |
|
| December 31, 2017 | | | | | | | | | |
| Commercial |
| $810 |
| |
| $— |
| |
| $2,652 |
| |
| $16,455 |
| |
| $19,917 |
|
| Real estate term owner occupied | — |
| | — |
| | — |
| | 1,331 |
| | 1,331 |
|
| Consumer secured by 1st deeds of trust | — |
| | — |
| | 378 |
| | — |
| | 378 |
|
| Total nonaccrual loans | 810 |
| | — |
| | 3,030 |
| | 17,786 |
| | 21,626 |
|
| Government guarantees on nonaccrual loans | — |
| | — |
| | (94 | ) | | (373 | ) | | (467 | ) |
| Net nonaccrual loans |
| $810 |
| |
| $— |
| |
| $2,936 |
| |
| $17,413 |
| |
| $21,159 |
|
Past Due Loans
There were zero and $252,000 past due loans greater than 90 days and still accruing interest at December 31, 2018 and 2017, respectively. Past due loans and nonaccrual loans at the periods indicated are presented below by loan class:
|
| | | | | | | | | | | | | | | | | | | | | | | | | | | |
| (In Thousands) | 30-59 Days Past Due Still Accruing |
| 60-89 Days Past Due Still Accruing |
| Greater Than 90 Days Still Accruing |
| Total Past
Due |
| Nonaccrual |
| Current |
| Total |
| December 31, 2018 | |
| |
| |
| |
| |
| |
| |
| Commercial |
| $872 |
|
|
| $857 |
|
|
| $— |
|
|
| $1,729 |
|
|
| $12,671 |
|
|
| $328,020 |
|
|
| $342,420 |
|
| Real estate construction one-to-four family | — |
|
| — |
|
| — |
|
| — |
|
| — |
|
| 37,111 |
|
| 37,111 |
|
| Real estate construction other | — |
|
| — |
|
| — |
|
| — |
|
| — |
|
| 72,256 |
|
| 72,256 |
|
| Real estate term owner occupied | 1,197 |
|
| — |
|
| — |
|
| 1,197 |
|
| 1,694 |
|
| 123,523 |
|
| 126,414 |
|
| Real estate term non-owner occupied | — |
|
| — |
|
| — |
|
| — |
|
| — |
|
| 325,720 |
|
| 325,720 |
|
| Real estate term other | — |
|
| — |
|
| — |
|
| — |
|
| 577 |
|
| 41,462 |
|
| 42,039 |
|
| Consumer secured by 1st deed of trust | 224 |
|
| 100 |
|
| — |
|
| 324 |
|
| 220 |
|
| 18,684 |
|
| 19,228 |
|
| Consumer other | 190 |
|
| — |
|
| — |
|
| 190 |
|
| 48 |
|
| 23,407 |
|
| 23,645 |
|
| Subtotal |
| $2,483 |
|
|
| $957 |
|
|
| $— |
|
|
| $3,440 |
|
|
| $15,210 |
|
|
| $970,183 |
|
|
| $988,833 |
|
| Less: Unearned origination fees, net of origination costs |
| |
|
| |
|
| (4,487 | ) |
| Total | |
|
| |
|
| |
|
| |
|
| |
|
| |
|
|
| $984,346 |
|
| December 31, 2017 | |
| |
| |
| |
| |
| |
| |
| Commercial |
| $503 |
|
|
| $— |
|
|
| $240 |
|
|
| $743 |
|
|
| $19,917 |
|
|
| $292,854 |
|
|
| $313,514 |
|
| Real estate construction one-to-four family | — |
|
| — |
|
| — |
|
| — |
|
| — |
|
| 31,201 |
|
| 31,201 |
|
| Real estate construction other | 90 |
|
| — |
|
| — |
|
| 90 |
|
| — |
|
| 80,003 |
|
| 80,093 |
|
| Real estate term owner occupied | 966 |
|
| — |
|
| — |
|
| 966 |
|
| 1,331 |
|
| 129,745 |
|
| 132,042 |
|
| Real estate term non-owner occupied | — |
|
| — |
|
| — |
|
| — |
|
| — |
|
| 319,313 |
|
| 319,313 |
|
| Real estate term other | — |
|
| — |
|
| — |
|
| — |
|
| — |
|
| 40,411 |
|
| 40,411 |
|
| Consumer secured by 1st deed of trust | 363 |
|
| — |
|
| — |
|
| 363 |
|
| 378 |
|
| 21,875 |
|
| 22,616 |
|
| Consumer other | 161 |
|
| 53 |
|
| 12 |
|
| 226 |
|
| — |
|
| 19,693 |
|
| 19,919 |
|
| Subtotal |
| $2,083 |
|
|
| $53 |
|
|
| $252 |
|
|
| $2,388 |
|
|
| $21,626 |
|
|
| $935,095 |
|
|
| $959,109 |
|
| Less: Unearned origination fees, net of origination costs |
| |
|
| |
|
| (4,156 | ) |
| Total | |
|
| |
|
| |
|
| |
|
| |
|
| |
|
|
| $954,953 |
|
Impaired Loans
At December 31, 2018 and 2017, the recorded investment in loans that are considered to be impaired was $31.7 million and $32.0 million, respectively. The following table presents information about impaired loans by class for the years ended December 31, 2018 and 2017:
|
| | | | | | | | | | | |
| (In Thousands) | Recorded Investment |
| Unpaid Principal Balance |
| Related Allowance |
| December 31, 2018 | |
| |
| |
| With no related allowance recorded | |
| |
| |
| Commercial - AQR pass |
| $80 |
|
|
| $80 |
|
|
| $— |
|
| Commercial - AQR special mention | 2,009 |
| | 2,009 |
| | — |
|
| Commercial - AQR substandard | 21,252 |
|
| 22,303 |
|
| — |
|
| Real estate term owner occupied - AQR substandard | 5,253 |
|
| 5,253 |
|
| — |
|
| Real estate term non-owner occupied - AQR pass | 295 |
|
| 295 |
|
| — |
|
| Real estate term non-owner occupied - AQR substandard | 465 |
|
| 465 |
|
| — |
|
Real estate term other - AQR pass
| 486 |
|
| 486 |
|
| — |
|
| Real estate term other - AQR substandard | 577 |
|
| 577 |
|
| — |
|
Consumer secured by 1st deeds of trust - AQR pass
| 129 |
|
| 129 |
|
| — |
|
Consumer secured by 1st deeds of trust - AQR substandard
| 320 |
|
| 320 |
|
| — |
|
| Subtotal |
| $30,866 |
|
|
| $31,917 |
|
|
| $— |
|
|
| | | | | | | | | | | |
| With an allowance recorded | |
| |
| |
| Commercial - AQR substandard |
| $848 |
|
|
| $1,352 |
|
|
| $14 |
|
| Subtotal |
| $848 |
|
|
| $1,352 |
|
|
| $14 |
|
|
| | | | | | | | | | | |
| Commercial - AQR pass |
| $80 |
|
|
| $80 |
|
|
| $— |
|
| Commercial - AQR special mention | 2,009 |
| | 2,009 |
| | — |
|
| Commercial - AQR substandard | 22,100 |
|
| 23,655 |
|
| 14 |
|
| Real estate term owner-occupied - AQR substandard | 5,253 |
|
| 5,253 |
|
| — |
|
| Real estate term non-owner occupied - AQR pass | 295 |
|
| 295 |
|
| — |
|
| Real estate term non-owner occupied - AQR substandard | 465 |
|
| 465 |
|
| — |
|
Real estate term other - AQR pass
| 486 |
|
| 486 |
|
| — |
|
| Real estate term other - AQR substandard | 577 |
|
| 577 |
|
| — |
|
Consumer secured by 1st deeds of trust - AQR pass
| 129 |
|
| 129 |
|
| — |
|
Consumer secured by 1st deeds of trust - AQR substandard
| 320 |
|
| 320 |
|
| — |
|
| Total |
| $31,714 |
|
|
| $33,269 |
|
|
| $14 |
|
|
| | | | | | | | | | | |
| (In Thousands) | Recorded Investment | | Unpaid Principal Balance | | Related Allowance |
| December 31, 2017 | |
| |
| |
| With no related allowance recorded | |
| |
| |
| Commercial - AQR special mention |
| $2,153 |
|
|
| $2,153 |
|
|
| $— |
|
| Commercial - AQR substandard | 16,671 |
|
| 17,742 |
|
| — |
|
| Real estate term owner occupied - AQR substandard | 2,862 |
|
| 2,862 |
|
| — |
|
| Real estate term non-owner occupied - AQR pass | 303 |
|
| 303 |
|
| — |
|
| Real estate term non-owner occupied - AQR special mention | 89 |
|
| 89 |
|
| — |
|
| Real estate term non-owner occupied - AQR substandard | 482 |
|
| 482 |
|
| — |
|
| Real estate term other - AQR pass | 559 |
|
| 559 |
|
| — |
|
| Consumer secured by 1st deeds of trust - AQR pass | 136 |
|
| 136 |
|
| — |
|
| Consumer secured by 1st deeds of trust - AQR substandard | 724 |
|
| 809 |
|
| — |
|
| Subtotal |
| $23,979 |
|
|
| $25,135 |
|
|
| $— |
|
|
| | | | | | | | | | | |
| With an allowance recorded | |
| |
| |
| Commercial - AQR substandard |
| $7,988 |
|
|
| $7,988 |
|
|
| $966 |
|
| Subtotal |
| $7,988 |
|
|
| $7,988 |
|
|
| $966 |
|
|
| | | | | | | | | | | |
| Commercial - AQR special mention |
| $2,153 |
|
|
| $2,153 |
|
|
| $— |
|
| Commercial - AQR substandard | 24,659 |
|
| 25,730 |
|
| 966 |
|
| Real estate term owner-occupied - AQR substandard | 2,862 |
|
| 2,862 |
|
| — |
|
| Real estate term non-owner occupied - AQR pass | 303 |
|
| 303 |
|
| — |
|
| Real estate term non-owner occupied - AQR special mention | 89 |
|
| 89 |
|
| — |
|
| Real estate term non-owner occupied - AQR substandard | 482 |
|
| 482 |
|
| — |
|
| Real estate term other - AQR pass | 559 |
|
| 559 |
|
| — |
|
| Consumer secured by 1st deeds of trust - AQR pass | 136 |
|
| 136 |
|
| — |
|
| Consumer secured by 1st deeds of trust - AQR substandard | 724 |
|
| 809 |
|
| — |
|
| Total |
| $31,967 |
|
|
| $33,123 |
|
|
| $966 |
|
The unpaid principal balance included in the table above represents the recorded investment at the dates indicated, plus amounts charged-off for book purposes.
The following table summarizes our average recorded investment and interest income recognized on impaired loans for years ended December 31, 2018 and 2017, respectively:
|
| | | | | | | | | | | | | | | |
| Year Ended December 31, | 2018 | | 2017 |
| (In Thousands) | Average Recorded Investment | Interest Income Recognized | Average Recorded Investment | Interest Income Recognized |
| With no related allowance recorded |
| |
| |
| |
|
| Commercial - AQR pass |
| $21 |
| |
| $2 |
| |
| $— |
| |
| $— |
|
| Commercial - AQR special mention | 2,146 |
| | 128 |
| | 582 |
| | 1 |
|
| Commercial - AQR substandard | 24,548 |
| | 381 |
| | 19,521 |
| | 487 |
|
| Real estate term owner occupied - AQR pass | — |
| | — |
| �� | 62 |
| | 5 |
|
| Real estate term owner occupied - AQR special mention | 155 |
| | — |
| | — |
| | — |
|
| Real estate term owner occupied - AQR substandard | 3,813 |
| | 201 |
| | 5,402 |
| | 286 |
|
| Real estate term non-owner occupied - AQR pass | 265 |
| | 24 |
| | 354 |
| | 43 |
|
| Real estate term non-owner occupied - AQR special mention | 22 |
| | 2 |
| | 23 |
| | 2 |
|
| Real estate term non-owner occupied - AQR substandard | 381 |
| | 30 |
| | 611 |
| | 45 |
|
| Real estate term other - AQR pass | 421 |
|
| 36 |
|
| 595 |
|
| 42 |
|
| Real estate term other - AQR substandard | 176 |
| | — |
| | 487 |
| | 34 |
|
| Consumer secured by 1st deeds of trust - AQR pass | 135 |
| | 13 |
| | 35 |
| | 3 |
|
| Consumer secured by 1st deeds of trust - AQR special mention | — |
| | — |
| | 105 |
| | 10 |
|
| Consumer secured by 1st deeds of trust - AQR substandard | 175 |
| | 10 |
| | 561 |
| | 17 |
|
| Consumer other - AQR substandard | — |
| | — |
| | 13 |
| | 1 |
|
| Subtotal |
| $32,258 |
| |
| $827 |
| |
| $28,351 |
| |
| $976 |
|
|
| | | | | | | | | | | | | | | |
| With an allowance recorded |
| |
| |
| |
|
| Commercial - AQR special mention |
| $— |
| |
| $— |
| |
| $525 |
| |
| $3 |
|
| Commercial - AQR substandard | 2,323 |
| | 20 |
| | 8,019 |
| | 4 |
|
| Commercial - AQR doubtful | 14 |
| | — |
| | — |
| | — |
|
| Consumer secured by 1st deeds of trust - AQR substandard | 94 |
| | — |
| | — |
| | — |
|
| Subtotal |
| $2,431 |
| |
| $20 |
| |
| $8,544 |
| |
| $7 |
|
|
| | | | | | | | | | | | | | |
| Total | | | | | |
|
| Commercial - AQR pass |
| $21 |
| |
| $2 |
| |
| $— |
|
| $— |
|
| Commercial - AQR special mention | 2,146 |
| | 128 |
| | 1,107 |
| 4 |
|
| Commercial - AQR substandard | 26,871 |
| | 401 |
| | 27,540 |
| 491 |
|
| Commercial - AQR doubtful | 14 |
| | — |
| | — |
| — |
|
| Real estate term owner-occupied - AQR pass | — |
| | — |
| | 62 |
| 5 |
|
| Real estate term owner-occupied - AQR special mention | 155 |
| | — |
| | — |
| — |
|
| Real estate term owner-occupied - AQR substandard | 3,813 |
| | 201 |
| | 5,402 |
| 286 |
|
| Real estate term non-owner occupied - AQR pass | 265 |
| | 24 |
| | 354 |
| 43 |
|
| Real estate term non-owner occupied - AQR special mention | 22 |
| | 2 |
| | 23 |
| 2 |
|
| Real estate term non-owner occupied - AQR substandard | 381 |
| | 30 |
| | 611 |
| 45 |
|
| Real estate term other - AQR pass | 421 |
|
| 36 |
|
| 595 |
| 42 |
|
| Real estate term other - AQR substandard | 176 |
| | — |
| | 487 |
| 34 |
|
| Consumer secured by 1st deeds of trust - AQR pass | 135 |
| | 13 |
| | 35 |
| 3 |
|
| Consumer secured by 1st deeds of trust - AQR special mention | — |
| | — |
| | 105 |
| 10 |
|
| Consumer secured by 1st deeds of trust - AQR substandard | 269 |
| | 10 |
| | 561 |
| 17 |
|
| Consumer other - AQR substandard | — |
| | — |
| | 13 |
| 1 |
|
| Total Impaired Loans |
| $34,689 |
| |
| $847 |
| |
| $36,895 |
|
| $983 |
|
The average recorded investment was $42.6 million, and interest income recognized on impaired loans was $2.4 million for the year ended December 31, 2016.
Purchased Credit Impaired Loans
The Company acquired eighteen purchased credit impaired loans from Alaska Pacific on April 1, 2014 subject to the requirements of FASB ASC 310-30 Loans and Debt Securities Acquired with Deteriorated Credit Quality. This group of loans consists primarily of commercial and commercial real estate loans, and unlike a pool of consumer mortgages, it is not practicable for the Company to analyze the accretable yield of these loans. As such, the Company has elected the cost recovery method of income recognition for these loans, and thus no accretable difference has been identified for these loans. At the acquisition date, April 1, 2014, the fair value of this group of loans was $3.9 million. The carrying value of these loans as of December 31, 2018 and 2017 were $235,000 and $923,000, respectively.
Troubled Debt Restructurings
Loans classified as troubled debt restructurings (“TDR”)TDRs totaled $14.8$10.6 million and $23.8$7.9 million at December 31, 20182021 and December 31, 2017,2020, respectively. A troubled debt restructuringTDR is a loan to a borrower that is experiencing financial difficulty that has been modified from its original terms and conditions in such a way that the Company is granting the borrower a concession that it would not grant otherwise.
The provisions of some kind. the Coronavirus Aid, Relief, and Economic Security ("CARES") Act included an election to not apply the guidance on accounting for TDRs to loan modifications, such as extensions or deferrals, related to COVID-19 made between March 1, 2020 and the earlier of (i) January 1, 2022 or (ii) 60 days after the end of the COVID-19 national emergency. The relief can only be applied to modifications for borrowers that were not more than 30 days past due as of December 31, 2019. The Company has elected to adopt these provisions of the CARES Act. As of December 31, 2021 and 2020, the Company has made the following types of loan modifications related to COVID-19, which are not classified as TDRs with principal balance outstanding of:
| | | | | | | | | | | |
| Loan Modifications due to COVID-19 as of December 31, 2021 |
| (Dollars in thousands) | Interest Only | Full Payment Deferral | Total |
| Portfolio loans | $49,219 | | $31 | | $49,250 | |
| Number of modifications | 16 | | 1 | | 17 | |
| | | | | | | | | | | |
| Loan Modifications due to COVID-19 as of December 31, 2020 |
| (Dollars in thousands) | Interest Only | Full Payment Deferral | Total |
| Portfolio loans | $43,379 | | $22,165 | | $65,544 | |
| Number of modifications | 23 | | 11 | | 34 | |
The Company has granted a variety of concessions to borrowers in the form of loan modifications. The modifications granted can generally be described in the following categories:
Rate Modification: A modification in which the interest rate is changed.
Term Modification: A modification in which the maturity date, timing of payments, or frequency of payments is changed.
Payment Modification: A modification in which the dollar amount of the payment is changed, or in which a loan is converted to interest only payments for a period of time is included in this category.
Combination Modification: Any other type of modification, including the use of multiple categories above.
AQR pass graded loans included above in the impaired loan data are loans classified as TDRs. By definition, TDRs are considered impaired loans. All of the Company’s TDRs are included in impaired loans.
The following table identifiespresents the portion of TDR balancesbreakout between newly restructured loans that occurred during 2021 and restructured loans that occurred prior to 2021 that are still included in portfolio loans. As discussed above, the CARES Act provided banks an option to elect to not account for certain loan modifications related to COVID-19 as TDRs as long as the borrowers were not more than 30 days past due as of December 31, 2018 that2019. The below disclosed restructurings were restructured during 2018:not related to COVID-19 modifications:
| | | | | | | | | | | | | | | | | |
| | Accrual Status | | Nonaccrual Status | | Total Modifications |
| (In Thousands) | | |
| New Troubled Debt Restructurings | | | | | |
| Commercial & industrial loans | $— | | | $3,118 | | | $3,118 | |
| Commercial real estate: | | | | | |
| Owner occupied properties | — | | | 350 | | | 350 | |
| | | | | |
| Residential real estate: | | | | | |
| | | | | |
| 1-4 family residential properties secured by junior liens and revolving secured by 1-4 family first liens | — | | | 139 | | | 139 | |
| | | | | |
| Other construction, land development and raw land loans | — | | | 577 | | | 577 | |
| | | | | |
| | | | | |
| | | | | |
| | | | | |
| Subtotal | — | | | 4,184 | | | 4,184 | |
| Existing Troubled Debt Restructurings | 3,291 | | | 3,163 | | | 6,454 | |
| Total | $3,291 | | | $7,347 | | | $10,638 | |
|
| | | | | | | | | | | |
| | Accrual Status |
| Nonaccrual Status |
| Total Modifications |
| (In Thousands) |
|
|
| New Troubled Debt Restructurings | |
| |
| |
| Commercial - AQR substandard |
| $— |
|
|
| $1,166 |
|
|
| $1,166 |
|
| Real estate owner occupied - AQR substandard | 227 |
|
| 1,694 |
|
| 1,921 |
|
| Subtotal |
| $227 |
|
|
| $2,860 |
|
|
| $3,087 |
|
| Existing Troubled Debt Restructurings | 3,186 |
|
| 8,558 |
|
| 11,744 |
|
| Total |
| $3,413 |
|
|
| $11,418 |
|
|
| $14,831 |
|
The following table provides additional information abouttables present newly restructured loans that were restructured in 2018occurred during 2021 and 2017:2020, by concession (terms modified):
| | | | | | | | | | | | | | | | | | | | | | | | | | | | | | | | | | | |
| December 31, 2021 |
| (In Thousands) | Number of Contracts | | Rate Modification | | Term Modification | | Payment Modification | | Combination Modification | | Total Modifications |
| Pre-Modification Outstanding Recorded Investment: | | |
| Commercial & industrial loans | 2 | | $— | | | $3,792 | | | $— | | | $— | | | $3,792 | |
| Commercial real estate: | | | | | | | | | | | |
| Owner occupied properties | 1 | | — | | | 360 | | | — | | | — | | | 360 | |
| Residential real estate: | | | | | | | | | | | |
| 1-4 family residential properties secured by junior liens and revolving secured by 1-4 family first liens | 1 | | — | | | — | | | 139 | | | — | | | 139 | |
| Other construction, land development and raw land loans | 1 | | — | | | 577 | | | — | | | — | | | 577 | |
| Total | 5 | | $— | | | $4,729 | | | $139 | | | $— | | | $4,868 | |
| Post-Modification Outstanding Recorded Investment: | | |
| Commercial & industrial loans | 1 | | $— | | | $3,118 | | | $— | | | $— | | | $3,118 | |
| Commercial real estate: | | | | | | | | | | | |
| Owner occupied properties | 1 | | — | | | 350 | | | — | | | — | | | 350 | |
| Residential real estate: | | | | | | | | | | | |
| 1-4 family residential properties secured by junior liens and revolving secured by 1-4 family first liens | 1 | | — | | | — | | | 139 | | | — | | | 139 | |
| Other construction, land development and raw land loans | 1 | | — | | | 577 | | | — | | | — | | | 577 | |
| Total | 4 | | $— | | | $4,045 | | | $139 | | | $— | | | $4,184 | |
| | | | December 31, 2018 | | December 31, 2020 |
| (In Thousands) | Number of Contracts |
| Rate Modification |
| Term Modification |
| Payment Modification |
| Combination Modification |
| Total Modifications | (In Thousands) | Number of Contracts | | Rate Modification | | Term Modification | | Payment Modification | | Combination Modification | | Total Modifications |
| Pre-Modification Outstanding Recorded Investment: | Pre-Modification Outstanding Recorded Investment: |
| | Pre-Modification Outstanding Recorded Investment: | | |
| Commercial - AQR substandard | 4 |
|
| $— |
|
|
| $— |
|
|
| $2,704 |
|
|
| $— |
|
|
| $2,704 |
| |
| Real estate term owner occupied - AQR substandard | 3 |
| — |
|
| — |
|
| 1,921 |
|
| — |
|
| 1,921 |
| |
| Commercial & industrial loans | | Commercial & industrial loans | 2 | | $— | | | $3,249 | | | $164 | | | $— | | | $3,413 | |
| Total | 7 |
|
| $— |
|
|
| $— |
|
|
| $4,625 |
|
|
| $— |
|
|
| $4,625 |
| Total | 2 | | $— | | | $3,249 | | | $164 | | | $— | | | $3,413 | |
| Post-Modification Outstanding Recorded Investment: | Post-Modification Outstanding Recorded Investment: | | | Post-Modification Outstanding Recorded Investment: | | |
| Commercial - AQR substandard | 4 |
|
| $— |
|
|
| $— |
|
|
| $1,166 |
|
|
| $— |
|
|
| $1,166 |
| |
| Real estate term owner occupied - AQR substandard | 3 |
| — |
|
| — |
|
| 1,921 |
|
| — |
|
| 1,921 |
| |
| Commercial & industrial loans | | Commercial & industrial loans | 2 | | $— | | | $1,590 | | | $161 | | | $— | | | $1,751 | |
| Total | 7 |
|
| $— |
|
|
| $— |
|
|
| $3,087 |
|
|
| $— |
|
|
| $3,087 |
| Total | 2 | | $— | | | $1,590 | | | $161 | | | $— | | | $1,751 | |
|
| | | | | | | | | | | | | | | | | | | | | |
| | December 31, 2017 |
| (In Thousands) | Number of Contracts |
| Rate Modification |
| Term Modification |
| Payment Modification |
| Combination Modification |
| Total Modifications |
| Pre-Modification Outstanding Recorded Investment: |
| |
| Commercial - AQR special mention | 1 |
|
| $— |
|
|
| $2,078 |
|
|
| $— |
|
|
| $— |
|
|
| $2,078 |
|
| Commercial - AQR substandard | 2 |
| — |
|
| 10,665 |
|
| 210 |
|
| — |
|
| 10,875 |
|
| Total | 3 |
|
| $— |
|
|
| $12,743 |
|
|
| $210 |
|
|
| $— |
|
|
| $12,953 |
|
| Post-Modification Outstanding Recorded Investment: | | |
| Commercial - AQR special mention | 1 |
|
| $— |
|
|
| $2,059 |
|
|
| $— |
|
|
| $— |
|
|
| $2,059 |
|
| Commercial - AQR substandard | 2 |
| — |
|
| 8,349 |
|
| 202 |
|
| — |
|
| 8,551 |
|
| Total | 3 |
|
| $— |
|
|
| $10,408 |
|
|
| $202 |
|
|
| $— |
|
|
| $10,610 |
|
The Company had no commitments to extend additional credit to borrowers owing receivables whose terms have been modified in troubled debt restructuringsTDRs at December 31, 2018.2021. There were $1.3 million ofzero charge-offs in 20182021 and 2020 on loans that were later classified as a TDR, and there were $731,000 of charge-offs in 2017 on loans that were later classified as a TDR in 2017.TDR.
All TDRs are also classified as impaired loans and are included in the loans individually evaluated for impairment in the calculation of the Allowance. There was one TDR with specific impairment at December 31, 2018 and two at December 31, 2017, respectively.
There were no loans that were restructured during 2017, and 2016, respectively,2021, 2020, or 2019 that also subsequently defaulted within the first twelve months of restructure in those same periods. The following table presents TDRs that occurred during 2018 that subsequently defaulted during the twelve-months ended December 31, 2018:
|
| | | | |
| | | | December 31, 2018 |
| | Number of Contracts | | Recorded Investment |
| (In Thousands) | |
| Troubled Debt Restructurings that Subsequently Defaulted: | | | |
| Commercial - AQR substandard | 4 | | $1,166 |
| Real estate term owner occupied - AQR substandard | 2 | | 1,694 |
|
| Total | 6 | | $2,860 |
Loans to Related Parties
Certain directors, and companies of which directors are principal owners, have loans and other transactions such as architectural fees with the Company. Such transactions are made on substantially the same terms, including interest rates and collateral required, as those prevailing for similar transactions of unrelated parties. An analysis of the loan transactions for the years indicated follows:
| | | (In Thousands) | 2018 |
| 2017 | | 2016 | (In Thousands) | 2021 | | 2020 | | 2019 |
| Balance, beginning of the year |
| $— |
|
|
| $90 |
| |
| $117 |
| Balance, beginning of the year | $217 | | | $309 | | | $— | |
| Loans made | — |
|
| — |
| | — |
| Loans made | — | | | — | | | 309 | |
| Repayments | — |
|
| 90 |
| | 27 |
| Repayments | 26 | | | 92 | | | — | |
| Balance, end of year |
| $— |
|
|
| $— |
| |
| $90 |
| Balance, end of year | $191 | | | $217 | | | $309 | |
The Company had $15,000$115,000 of unfunded loan commitments to these directors or their related interests on December 31, 20182021 and 2017.$15,000 of unfunded loan commitments on December 31, 2020.
Pledged Loans
At December 31, 20182021 and 2017,2020, there were no loans pledged as collateral to secure public deposits.
NOTE7 - Allowance for Loan Losses
The following table details activity in the Allowance for the periods indicated:
|
| | | | | | | | | | | | | | | | | | | | | | | | | | | | | | |
| (In Thousands) | Commercial | Real estate construction one-to-four family | Real estate construction other | Real estate term owner occupied | Real estate term non-owner occupied | Real estate term other | Consumer secured by 1st deed of trust | Consumer other | Unallocated | Total |
| 2018 | | | | | | | | |
| | |
|
| Balance, beginning of period |
| $6,172 |
|
| $629 |
|
| $1,566 |
|
| $2,194 |
|
| $6,043 |
|
| $725 |
|
| $315 |
|
| $307 |
|
| $3,510 |
|
| $21,461 |
|
| Charge-Offs | (1,716 | ) | — |
| — |
| — |
| — |
| (28 | ) | (143 | ) | (39 | ) | — |
| (1,926 | ) |
| Recoveries | 442 |
| — |
| — |
| — |
| — |
| 3 |
| 12 |
| 27 |
| — |
| 484 |
|
| Provision (benefit) | 762 |
| 46 |
| (291 | ) | (167 | ) | (244 | ) | 16 |
| 122 |
| 131 |
| (875 | ) | (500 | ) |
| Balance, end of period |
| $5,660 |
|
| $675 |
|
| $1,275 |
|
| $2,027 |
|
| $5,799 |
|
| $716 |
|
| $306 |
|
| $426 |
|
| $2,635 |
|
| $19,519 |
|
| Balance, end of period: | |
| |
| |
| |
| |
| |
| |
| |
| |
|
| Individually evaluated | |
| |
| |
| |
| |
| |
| |
| |
| |
|
| for impairment |
| $14 |
|
| $— |
|
| $— |
|
| $— |
|
| $— |
|
| $— |
|
| $— |
|
| $— |
|
| $— |
|
| $14 |
|
| Balance, end of period: | |
| |
| |
| |
| |
| |
| |
| |
| |
|
| Collectively evaluated | |
| |
| |
| |
| |
| |
| |
| |
| |
|
| for impairment |
| $5,646 |
|
| $675 |
|
| $1,275 |
|
| $2,027 |
|
| $5,799 |
|
| $716 |
|
| $306 |
|
| $426 |
|
| $2,635 |
|
| $19,505 |
|
| 2017 | |
| |
| |
| |
| |
| |
| |
| |
| |
| |
|
| Balance, beginning of period |
| $5,535 |
|
| $550 |
|
| $1,465 |
|
| $2,358 |
|
| $6,853 |
|
| $819 |
|
| $313 |
|
| $408 |
|
| $1,396 |
|
| $19,697 |
|
| Charge-Offs | (1,611 | ) | — |
| — |
| — |
| — |
| (5 | ) | (85 | ) | (43 | ) | — |
| (1,744 | ) |
| Recoveries | 293 |
| — |
|
|
| — |
| — |
| 2 |
| 2 |
| 11 |
| — |
| 308 |
|
| Provision (benefit) | 1,955 |
| 79 |
| 101 |
| (164 | ) | (810 | ) | (91 | ) | 85 |
| (69 | ) | 2,114 |
| 3,200 |
|
| Balance, end of period |
| $6,172 |
|
| $629 |
|
| $1,566 |
|
| $2,194 |
|
| $6,043 |
|
| $725 |
|
| $315 |
|
| $307 |
|
| $3,510 |
|
| $21,461 |
|
| Balance, end of period: | |
| |
| |
| |
| |
| |
| |
| |
| |
|
| Individually evaluated | |
| |
| |
| |
| |
| |
| |
| |
| |
|
| for impairment |
| $966 |
|
| $— |
|
| $— |
|
| $— |
|
| $— |
|
| $— |
|
| $— |
|
| $— |
|
| $— |
|
| $966 |
|
| Balance, end of period: | |
| |
| |
| |
| |
| |
| |
| |
| |
|
| Collectively evaluated | |
| |
| |
| |
| |
| |
| |
| |
| |
|
| for impairment |
| $5,206 |
|
| $629 |
|
| $1,566 |
|
| $2,194 |
|
| $6,043 |
|
| $725 |
|
| $315 |
|
| $307 |
|
| $3,510 |
|
| $20,495 |
|
| 2016 | |
| | | | | | | | | |
| Balance, beginning of period |
| $5,906 |
|
| $854 |
|
| $1,439 |
|
| $1,657 |
|
| $5,515 |
|
| $628 |
|
| $264 |
|
| $397 |
|
| $1,493 |
|
| $18,153 |
|
| Charge-Offs | (903 | ) | (535 | ) | — |
| — |
| — |
| — |
| (36 | ) | (8 | ) | — |
| (1,482 | ) |
| Recoveries | 699 |
| — |
| — |
| — |
| — |
| — |
| — |
| 29 |
| — |
| 728 |
|
| Provision (benefit) | (167 | ) | 231 |
| 26 |
| 701 |
| 1,338 |
| 191 |
| 85 |
| (10 | ) | (97 | ) | 2,298 |
|
| Balance, end of period |
| $5,535 |
|
| $550 |
|
| $1,465 |
|
| $2,358 |
|
| $6,853 |
|
| $819 |
|
| $313 |
|
| $408 |
|
| $1,396 |
|
| $19,697 |
|
| Balance, end of period: | |
| |
| |
| |
| |
| |
| |
| |
| |
|
| Individually evaluated | |
| |
| |
| |
| |
| |
| |
| |
| |
|
| for impairment |
| $614 |
|
| $— |
|
| $— |
|
| $— |
|
| $— |
|
| $— |
|
| $— |
|
| $— |
|
| $— |
|
| $614 |
|
| Balance, end of period: | |
| |
| |
| |
| |
| |
| |
| |
| |
|
| Collectively evaluated | |
| |
| |
| |
| |
| |
| |
| |
| |
|
| for impairment |
| $4,921 |
|
| $550 |
|
| $1,465 |
|
| $2,358 |
|
| $6,853 |
|
| $819 |
|
| $313 |
|
| $408 |
|
| $1,396 |
|
| $19,083 |
|
The following is a detail of the recorded investment, including unearned origination fees, net of origination costs, in the loan portfolio, segregated by amounts evaluated individually or collectively in the Allowance at the periods indicated:
|
| | | | | | | | | | | | | | | | | | | | | | | | | | | | | | | | | | | |
| (In Thousands) | Commercial |
| Real estate construction one-to-four family |
| Real estate construction other |
| Real estate term owner occupied |
| Real estate term non-owner occupied |
| Real estate term other |
| Consumer secured by 1st deed of trust |
| Consumer other |
| Total |
| December 31, 2018 | |
| |
| |
| |
| |
| |
| |
| |
| |
| Balance, end of period |
| $341,091 |
| |
| $36,828 |
| |
| $71,658 |
| |
| $125,795 |
| |
| $324,198 |
| |
| $41,746 |
| |
| $19,234 |
| |
| $23,796 |
|
|
| $984,346 |
|
| Balance, end of period: | |
| |
| |
| |
| |
| |
| |
| |
| |
| Individually evaluated | |
| |
| |
| |
| |
| |
| |
| |
| |
| for impairment |
| $24,189 |
|
|
| $— |
|
|
| $— |
|
|
| $5,253 |
|
|
| $760 |
|
|
| $1,063 |
|
|
| $449 |
|
|
| $— |
|
|
| $31,714 |
|
| Balance, end of period: | |
| |
| |
| |
| |
| |
| |
| |
| |
| Collectively evaluated | |
| |
| |
| |
| |
| |
| |
| |
| |
| for impairment |
| $316,902 |
|
|
| $36,828 |
|
|
| $71,658 |
|
|
| $120,542 |
|
|
| $323,438 |
|
|
| $40,683 |
|
|
| $18,785 |
|
|
| $23,796 |
|
|
| $952,632 |
|
| December 31, 2017 | |
| |
| |
| |
| |
| |
| |
| |
| |
| Balance, end of period |
| $312,254 |
| |
| $30,955 |
| |
| $79,784 |
| |
| $131,389 |
| |
| $317,808 |
| |
| $40,101 |
| |
| $22,625 |
| |
| $20,037 |
|
|
| $954,953 |
|
| Balance, end of period: | |
| |
| |
| |
| |
| |
| |
| |
| |
| Individually evaluated | |
| |
| |
| |
| |
| |
| |
| |
| |
| for impairment |
| $26,812 |
|
|
| $— |
|
|
| $— |
|
|
| $2,862 |
|
|
| $874 |
|
|
| $559 |
|
|
| $860 |
|
|
| $— |
|
|
| $31,967 |
|
| Balance, end of period: | |
| |
| |
| |
| |
| |
| |
| |
| |
| Collectively evaluated | |
| |
| |
| |
| |
| |
| |
| |
| |
| for impairment |
| $285,442 |
|
|
| $30,955 |
|
|
| $79,784 |
|
|
| $128,527 |
|
|
| $316,934 |
|
|
| $39,542 |
|
|
| $21,765 |
|
|
| $20,037 |
|
|
| $922,986 |
|
The following represents the balance of the Allowance for the periods indicated segregated by segment and class:
|
| | | | | | | | | | | | | | | | | | | | | | | | | | | | | | |
| (In Thousands) | Total | Commercial | Real estate construction 1-4 family | Real estate construction other | Real estate term owner occupied | Real estate term non-owner occupied | Real estate term other | Consumer secured by 1st deeds of trust | Consumer other | Unallocated |
| December 31, 2018 | | | | | | | | | | |
| Individually evaluated for impairment | | | | | | | | | |
| AQR Substandard |
| $14 |
|
| $14 |
|
| $— |
|
| $— |
|
| $— |
|
| $— |
|
| $— |
|
| $— |
|
| $— |
|
| $— |
|
| Collectively evaluated for impairment: | |
| |
| |
| |
| |
| |
| |
| |
| |
|
| AQR Pass | 16,005 |
| 5,522 |
| 615 |
| 1,275 |
| 1,958 |
| 5,236 |
| 683 |
| 303 |
| 413 |
| — |
|
| AQR Special Mention | 828 |
| 121 |
| 60 |
| — |
| 69 |
| 563 |
| 12 |
| 3 |
| — |
| — |
|
| AQR Substandard | 37 |
| 3 |
| — |
| — |
| — |
| — |
| 21 |
| — |
| 13 |
| — |
|
| Unallocated | 2,635 |
| — |
| — |
| — |
| — |
| — |
| — |
| — |
| — |
| 2,635 |
|
| |
| $19,519 |
|
| $5,660 |
|
| $675 |
|
| $1,275 |
|
| $2,027 |
|
| $5,799 |
|
| $716 |
|
| $306 |
|
| $426 |
|
| $2,635 |
|
| December 31, 2017 | |
| |
| |
| |
| |
| |
| |
| |
| |
| |
|
| Individually evaluated for impairment: | |
| |
| |
| |
| |
| |
| |
| |
| |
|
| AQR Substandard |
| $966 |
|
| $966 |
|
| $— |
|
| $— |
|
| $— |
|
| $— |
|
| $— |
|
| $— |
|
| $— |
|
| $— |
|
| Collectively evaluated for impairment: | |
| |
| |
| |
| |
| |
| |
| |
| |
|
| AQR Pass | 16,453 |
| 5,079 |
| 629 |
| 1,566 |
| 2,154 |
| 5,680 |
| 725 |
| 315 |
| 305 |
| — |
|
| AQR Special Mention | 524 |
| 120 |
| — |
| — |
| 40 |
| 363 |
| — |
| — |
| 1 |
| — |
|
| AQR Substandard | 8 |
| 7 |
| — |
| — |
| — |
| — |
| — |
| — |
| 1 |
| — |
|
| Unallocated | 3,510 |
| — |
| — |
| — |
| — |
| — |
| — |
| — |
| — |
| 3,510 |
|
| |
| $21,461 |
|
| $6,172 |
|
| $629 |
|
| $1,566 |
|
| $2,194 |
|
| $6,043 |
|
| $725 |
|
| $315 |
|
| $307 |
|
| $3,510 |
|
NOTE 86 - Purchased Receivables
We purchase accounts receivable from our business customers and provide them with short-term working capital. We provide this service to our customers in Alaska and in Washington and the greater west coast through NFS. Our purchased receivable activity is guided by policies that outline risk management, documentation, and approval limits. The policies are reviewed and approved annually by the Board of Directors.
Purchased receivables are carried at their principal amount outstanding, net of a reserve for anticipated losses that have not yet been identified,an ACL, and have a maturity of less than one year. Purchased receivable balances are charged against this reserve when management believes that collection of principal is unlikely. Management evaluates the adequacy of the reserve for purchased receivable losses based on historical loss experience by segment and class of receivable and its assessment of current economic conditions. As of December 31, 2018, the Company has one segment and class of purchased receivables. There are no purchased receivables past due at December 31, 20182021 or 2017,2020, and there were no restructured purchased receivables in 2018, 2017,2021, 2020, or 2016.2019.
Income on purchased receivables is accrued and recognized on the balance outstanding using an effective interest method except when management believes doubt exists as to the collectability of the income or principal. AsThere were no nonperforming purchased receivables as of December 31, 2018, the Company is accruing income on all purchased receivable balances outstanding.2021 or 2020.
The following table summarizes the components of net purchased receivables at December 31, for the years indicated:
| | | (In Thousands) | 2018 |
| 2017 | (In Thousands) | 2021 | | 2020 |
| Purchased receivables |
| $14,596 |
|
|
| $22,431 |
| Purchased receivables | $6,987 | | | $13,995 | |
| Reserve for purchased receivable losses | (190 | ) |
| (200 | ) | |
| Allowance for credit losses - purchased receivables | | Allowance for credit losses - purchased receivables | — | | | (73) | |
| Total |
| $14,406 |
|
|
| $22,231 |
| Total | $6,987 | | | $13,922 | |
The following table sets forth information regarding changes in the ACL on purchased receivable reservereceivables for the periods indicated:
| | | | | | | | | | | |
| (In Thousands) | 2021 | 2020 | 2019 |
| Balance at beginning of year | $73 | | $94 | | $190 | |
| Impact of adopting ASC 326 | (73) | | — | | — | |
| Charge-offs | — | | — | | — | |
| Recoveries | — | | — | | — | |
| Charge-offs net of recoveries | — | | — | | — | |
| Benefit for purchased receivables | — | | (21) | | (96) | |
| Balance at end of year | $— | | $73 | | $94 | |
|
| | | | | | | | | |
| (In Thousands) | 2018 | 2017 | 2016 |
| Balance at beginning of year |
| $200 |
|
| $171 |
|
| $181 |
|
| Reserve for (recovery from) purchased receivables | (10 | ) | 29 |
| (10 | ) |
| Balance at end of year |
| $190 |
|
| $200 |
|
| $171 |
|
The Company recorded no charge-offs of purchased receivables in 2018, 2017, or 2016.
NOTE9 - Other Real Estate Owned
At December 31, 2018 and 2017, the Company held $8.0 million and $8.7 million, respectively, as OREO. The following table details net operating expense related to OREO for the years indicated:
|
| | | | | | | | | |
| | Years Ended December 31, |
| (In Thousands) | 2018 | 2017 | 2016 |
| OREO (income) expense, net rental income and gains on sale: | | | |
| OREO operating expense |
| $802 |
|
| $420 |
|
| $304 |
|
| Impairment on OREO | — |
| 904 |
| 187 |
|
| Rental income on OREO | (541 | ) | (116 | ) | (98 | ) |
| Gains on sale of OREO | (3 | ) | (371 | ) | (295 | ) |
| Total |
| $258 |
|
| $837 |
|
| $98 |
|
NOTE10 - Premises and Equipment
The following summarizes the components of premises and equipment at December 31 for the years indicated:
|
| | | | | | | | | |
| (In Thousands) | Useful Life |
| 2018 |
| 2017 |
| Land | |
|
| $5,137 |
|
|
| $2,562 |
|
| Furniture and equipment | 3-7 years |
| 10,917 |
|
| 8,323 |
|
| Tenant improvements | 2-15 years |
| 8,268 |
|
| 8,323 |
|
| Buildings | 39 years |
| 35,626 |
|
| 38,114 |
|
| Total Premises and Equipment | |
| 59,948 |
|
| 57,322 |
|
| Accumulated depreciation and amortization | |
| (20,858 | ) |
| (19,455 | ) |
| Total Premises and Equipment, Net | |
|
| $39,090 |
|
|
| $37,867 |
|
Depreciation expense and amortization of leasehold improvements was $2.3 million, $2.9 million, and $2.4 million for the years ended December 31, 2018, 2017, and 2016, respectively.
Related Party Transactions: The Company made $49,000 in payments to related parties for design consultation for Bank branches for the year ended December 31, 2018 and no payments to related parties in 2017 or 2016.
NOTE11 7 - Servicing Rights
Mortgage servicing rights
The following table details the activity in the Company's mortgage servicing rights ("MSR")MSR for the year indicated:
| | | | | | | | | | | |
| (In Thousands) | 2021 | 2020 | 2019 |
| | | |
| Balance, beginning of period | $11,218 | | $11,920 | | $10,821 | |
| | | |
| Additions for new MSR capitalized | 6,088 | | 4,824 | | 3,707 | |
| Changes in fair value: | | | |
Due to changes in model inputs of assumptions (1) | (1,181) | | (2,701) | | (1,313) | |
Other (2) | (2,401) | | (2,825) | | (1,295) | |
| Carrying value, December 31 | $13,724 | | $11,218 | | $11,920 | |
|
| | | | | | | | | |
| (In Thousands) | 2018 | 2017 | 2016 |
| | | | |
| Balance, beginning of period |
| $7,305 |
|
| $4,157 |
|
| $1,654 |
|
| Additions for new MSR capitalized | 3,641 |
| 3,146 |
| 3,029 |
|
| Changes in fair value: | | | |
Due to changes in model inputs of assumptions (1) | 591 |
| 551 |
| (214 | ) |
Other (2) | (716 | ) | (549 | ) | (312 | ) |
| Carrying value, December 31 |
| $10,821 |
|
| $7,305 |
|
| $4,157 |
|
(1) Principally reflects changes in discount rates and prepayment speed assumptions, which are primarily affected by changes in interest rates.
(2) Represents changes due to collection/realization of expected cash flows over time.
The following table details information related to our serviced mortgage loan portfolio as of December 31, 2018 and 2017:the dates indicated:
| | | | | | | | |
| (In Thousands) | December 31, 2021 | December 31, 2020 |
| | |
| Balance of mortgage loans serviced for others | $772,764 | | $683,117 | |
| MSR as a percentage of serviced loans | 1.78 | % | 1.64 | % |
|
| | | | | | |
| (In Thousands) | December 31, 2018 | December 31, 2017 |
| | | |
| Balance of mortgage loans serviced for others |
| $557,583 |
|
| $406,291 |
|
| MSR as a percentage of serviced loans | 1.94 | % | 1.80 | % |
The Company recognized servicing fees of $1.9$2.9 million, $1.3$2.7 million, and $675,000$2.4 million during 2018, 2017,2021, 2020, and 2016,2019, respectively, which includes revenues recognized at capitalization of new mortgagecontractually specified servicing rights, late fees and ancillary fees which are included in "Mortgage banking income" as a component of other noninterest income in the Company's Consolidated Statements of Income.
The following table outlines the key assumptions used in measuring the fair value of mortgage servicing rights as of December 31, 20182021 and 2017:2020:
| | | | | | | | |
| 2021 | 2020 |
| | |
| Average constant prepayment rate | 11.80 | % | 13.05 | % |
| Average discount rate | 8.00 | % | 7.75 | % |
|
| | | | |
| | 2018 |
| 2017 |
|
| | | |
| Average constant prepayment rate | 7.70 | % | 9.00 | % |
| Average discount rate | 9.94 | % | 9.45 | % |
Key economic assumptions and the sensitivity of the current fair value for MSRmortgage servicing rights to immediate adverse changes in those assumptions at December 31, 20182021 and 20172020 were as follows:
| | | | | | | | | | | |
| (In Thousands) | | December 31, 2021 | December 31, 2020 |
| Aggregate portfolio principal balance | | $772,764 | | $683,117 | |
| Weighted average rate of note | | 3.31 | % | 3.62 | % |
| | | |
| December 31, 2021 | Base | 1.0% Adverse Rate Change | 2.0% Adverse Rate Change |
| Conditional prepayment rate | 11.80 | % | 23.59 | % | 34.57 | % |
| Discount rate | 8.00 | % | 7.00 | % | 6.00 | % |
| Fair value MSR | $13,724 | | $9,612 | | $7,256 | |
| Percentage of MSR | 1.78 | % | 1.24 | % | 0.94 | % |
| | | |
| December 31, 2020 | | | |
| Conditional prepayment rate | 13.05 | % | 26.11 | % | 38.97 | % |
| Discount rate | 7.75 | % | 6.75 | % | 5.75 | % |
| Fair value MSR | $11,218 | | $7,455 | | $5,404 | |
| Percentage of MSR | 1.64 | % | 1.09 | % | 0.79 | % |
|
| | | | | | | | | |
| (In Thousands) | | December 31, 2018 | December 31, 2017 |
| Aggregate portfolio principal balance | |
| $557,583 |
|
| $406,291 |
|
| Weighted average rate of note | | 3.91 | % | 3.77 | % |
| | | | |
| December 31, 2018 | Base | 1.0% Adverse Rate Change | 2.0% Adverse Rate Change |
| Conditional prepayment rate | 7.70 | % | 19.35 | % | 20.95 | % |
| Discount rate | 9.94 | % | 8.94 | % | 7.94 | % |
| Fair value MSR |
| $10,821 |
|
| $7,115 |
|
| $6,829 |
|
| Percentage of MSR | 1.94 | % | 1.28 | % | 1.22 | % |
| | | | |
| December 31, 2017 | | | |
| Conditional prepayment rate | 9.00 | % | 23.33 | % | 25.25 | % |
| Discount rate | 9.45 | % | 8.45 | % | 7.45 | % |
| Fair value MSR |
| $7,305 |
|
| $4,343 |
|
| $4,109 |
|
| Percentage of MSR | 1.80 | % | 1.07 | % | 1.01 | % |
The above tables show the sensitivity to market rate changes for the par rate coupon for a conventional one-to-four family Alaska Housing Finance Corporation/FNMA/FHLMC serviced home loan. The above tables reference a 100 basis point and 200 basis point decrease in notediscount rates.
These sensitivities are hypothetical and should be used with caution as the tables above demonstrate the Company’s methodology for estimating the fair value of MSR is highly sensitive to changes in key assumptions. For example, actual prepayment experience may differ and any difference may have a material effect on MSR fair value. Changes in fair value resulting from changes in assumptions generally cannot be extrapolated because the relationship of the change in the assumption to the change in fair value may not be linear. Also, in these tables, the effects of a variation in a particular assumption on the fair value of the MSR is calculated without changing any other assumption; in reality, changes in one factor may be associated with changes in another (for example, decreases in market interest rates may provide an incentive to refinance; however, this may also indicate a slowing economy and an increase in the unemployment rate, which reduces the number of borrowers who qualify for refinancing), which may magnify or counteract the sensitivities. Thus, any measurement of MSR fair value is limited by the conditions existing and assumptions made at a particular point in time. Those assumptions may not be appropriate if they are applied to a different point in time.
Commercial servicing rights
The Company recorded a commercial Commercial servicing right assetassets ("CSR"CSRs") for the first time in 2018. Refer to the "Error Corrections" section in footnote 1 of the Notes to the Consolidated Financial Statements for additional information regarding this adjustment. The CSR hashave a carrying value of $1.0$1.1 million and $1.3 million at December 31, 2018,2021 and 2020, respectively, and total commercial loans serviced for others were $239.5$259.8 million and $274.6 million at December 31, 2018.2021 and 2020, respectively. Key assumptions used in measuring the fair value of CSRs as of December 31, 20182021 and 2020 include a conditional prepayment rate of 12.72%16.08% and 9.66% and a discount rate of 11.49%.
9.94% and 9.46%, respectively.
NOTE12 8 - Other Real Estate Owned
At December 31, 2021 and 2020, the Company held $5.6 million and $7.3 million, respectively, as OREO. The following table details net operating (income) expense related to OREO for the years indicated:
| | | | | | | | | | | |
| Years Ended December 31, |
| (In Thousands) | 2021 | 2020 | 2019 |
| OREO (income) expense, net rental income and gains on sale: | | | |
| OREO operating expense | $777 | | $658 | | $693 | |
| | | |
| Rental income on OREO | (524) | | (509) | | (506) | |
| Gains on sale of OREO | (685) | | (391) | | (380) | |
| Total | ($432) | | ($242) | | ($193) | |
NOTE 9 - Premises and Equipment
The following summarizes the components of premises and equipment at December 31 for the years indicated:
| | | | | | | | | | | | | | | | | |
| (In Thousands) | Useful Life | | 2021 | | 2020 |
| Land | | | $5,137 | | | $5,137 | |
| Furniture and equipment | 3-7 years | | 14,287 | | | 13,157 | |
| Tenant improvements | 2-15 years | | 10,394 | | | 9,182 | |
| Buildings | 39 years | | 37,283 | | | 37,618 | |
| Total Premises and Equipment | | | 67,101 | | | 65,094 | |
| Accumulated depreciation and amortization | | | (29,937) | | | (26,992) | |
| Total Premises and Equipment, Net | | | $37,164 | | | $38,102 | |
Depreciation expense and amortization of leasehold improvements was $3.3 million, $3.1 million, and $3.0 million for the years ended December 31, 2021, 2020, and 2019, respectively.
NOTE 10 – Leases
The company's lease commitments consist primarily of agreements to lease land and office facilities that it occupies to operate several of its retail branch locations that are classified as operating leases and are recognized on the balance sheet as right-of-use ("ROU") asset and lease liabilities. As of December 31, 2021, the Company has operating lease ROU assets of $11.0 million and operating lease liabilities of $11.0 million. As of December 31, 2020, the Company has operating lease ROU assets of $12.4 million and operating lease liabilities of $12.4 million. The Company does not have any agreements that are classified as finance leases.
The following table presents additional information about the Company's operating leases:
| | | | | | | | |
| (In Thousands) | 2021 | 2020 |
| Lease Cost | | |
Operating lease cost(1) | $2,773 | | $2,819 | |
Short term lease cost(1) | 27 | | 35 | |
| Total lease cost | $2,800 | | $2,854 | |
| | |
| Other information | | |
| Operating leases - operating cash flows | $2,614 | | $2,681 | |
| Weighted average lease term - operating leases, in years | 10.55 | 10.72 |
| Weighted average discount rate - operating leases | 3.21 | % | 3.29 | % |
(1)Expenses are classified within occupancy expense on the Consolidated Statements of Income. | | |
The table below reconciles the remaining undiscounted cash flows for the next five years for each twelve-month period presented and the total of the subsequent remaining years to the operating lease liabilities recorded on the balance sheet:
| | | | | |
| (In Thousands) | Operating Leases |
| 2022 | $2,502 | |
| 2023 | 2,109 | |
| 2024 | 1,961 | |
| 2025 | 1,858 | |
| 2026 | 721 | |
| Thereafter | 4,265 | |
| Total minimum lease payments | $13,416 | |
| Less: amount of lease payment representing interest | (2,451) | |
| Present value of future minimum lease payments | $10,965 | |
NOTE 11 - Goodwill and Intangible Assets
A summary of goodwill and intangible assets at December 31, 20182021 and 2017,2020, is as follows:
| | | | | | | | | | | |
| (In Thousands) | 2021 | | 2020 |
| Intangible assets: | | | |
| Goodwill | $15,017 | | | $15,017 | |
| Core deposit intangible | 42 | | | 79 | |
| Trade name intangible | 950 | | | 950 | |
| | | |
| Total | $16,009 | | | $16,046 | |
|
| | | | | | | |
| (In Thousands) | 2018 |
| 2017 |
| Intangible assets: | |
|
| |
|
| Goodwill |
| $15,017 |
|
|
| $15,017 |
|
| Core deposit intangible | 187 |
|
| 257 |
|
| Trade name intangible | 950 |
| | 950 |
|
| Total |
| $16,154 |
|
|
| $16,224 |
|
Goodwill and Other Intangible Assets: Goodwill as of December 31, 2018 and 2017 includes $6.9 million related to the Company's acquisition of branch locations from Bank of America in 1998. In 2007, the Company recorded $1.8 million of goodwill and $1.3 million of core deposit intangible ("CDI") as part of the acquisition of Alaska First Bank & Trust, N.A. (“Alaska First”) stock. The Company amortized the CDI related to the Alaska First acquisition over its estimated useful life. On April 1, 2014, the Company recorded $623,000 of CDI as part of the acquisition of Alaska Pacific. The Company is amortizing the CDI related to the Alaska Pacific acquisition over its estimated useful life of ten years using an accelerated method. Accumulated amortization related to the Alaska Pacific CDI was $435,000, $365,000 and $283,000 at December 31, 2018, 2017, and 2016, respectively. Lastly, on December 1, 2014 the Company recorded goodwill and a trade name intangible as part of the acquisition of RML. As of December 31, 2018 and 2017, the Company has $7.5 million of goodwill and $950,000 of trade name intangible recorded related to this transaction. Refer to Note 1 for discussion of the change in the balance of goodwill in 2016 related to this acquisition. These assets have indefinite useful lives and are not amortized.
The Company performed its annual goodwill impairment testing at December 31, 20182021 and 2017December 31, 2020 in accordance with the policy described in Note 1 to the financial statements. Company's Consolidated Financial Statements included in Part II. Item 8 of this report.
At December 31, 2018,2021, the Company performed its annual impairment test using a qualitative assessment. Significant positive inputs to the qualitative assessment included the Company’s increasing net income as compared to historical trends,trends; the Company's stable budget-to-actual results of operations;increasing market share for deposits in our markets; results of regulatory examinations; peer comparisons of the Company's net interest margin; trends in the Company’s cash flows; and improvements in the Alaskan economy in 2018.2021; increases in the volume of mortgage originations in Alaska; increases in the Company's market share of mortgage originations; and increases in the Company's stock price. Significant negative inputs to the qualitative assessment included the recent decline in oil prices andthe muted pace of growth in the company's stock price, as well as the decline in the volume of mortgage originations in Alaska and the decrease in net income in the Company's Home Mortgage Lending segment. For the Community Banking segment, weAlaskan economy. We believe that the positive inputs to the qualitative assessment noted above outweigh the negative inputs, and we therefore concluded that it is more likely than not that the fair value of the Company exceeds its carrying value at December 31, 2018 and that no potential impairment existed at that time. After review of these qualitative inputs, the Company determined that performing a quantitative goodwill impairment test for the Home Mortgage Lending segment as of December 31, 2018 was appropriate. The Company estimated the fair value of the Home Mortgage Lending segment using a discounted cash flow approach. We then compared the estimated fair value of the Home Mortgage Lending segment to the carrying value as of December 31, 2018 and concluded that no potential impairment existed at that time.
The Company recorded amortization expense of its intangible assets of $70,000, $100,000,$37,000, $48,000, and $135,000$60,000 for the years ended December 31, 2018, 2017,2021, 2020, and 2016,2019, respectively. Accumulated amortization for intangible assets was $7.0 million and $6.9$6.0 million at both December 31, 20182021 and 2017, respectively.2020.
The future amortization expense required on these assets is as follows:
| | | (In Thousands) | | (In Thousands) | |
| 2019 |
| $60 |
| |
| 2020 | 48 |
| |
| 2021 | 37 |
| |
| 2022 | 25 |
| 2022 | $25 | |
| 2023 | 14 |
| 2023 | 14 | |
| 2024 | | 2024 | 3 | |
| 2025 | | 2025 | — | |
| 2026 | | 2026 | — | |
| Thereafter | 3 |
| Thereafter | — | |
| Total |
| $187 |
| Total | $42 | |
NOTE1312 - Other Assets
A summary of other assets as of December 31, 20182021 and 2017,2020, is as follows:
| | | | | | | | | | | |
| (In Thousands) | 2021 | | 2020 |
| Other assets: | | | |
| Investment in Low Income Housing Partnerships | $20,640 | | | $24,142 | |
| Accrued interest receivable | 6,846 | | | 7,979 | |
| Interest rate swaps not designated as hedging instruments, at fair value | 6,030 | | | 7,387 | |
| Bank owned life insurance, net | 4,293 | | | 6,520 | |
| Taxes receivable | 1,994 | | | 4,083 | |
| Interest rate lock commitments | 1,387 | | | 4,034 | |
| Software | 2,855 | | | 3,905 | |
| Equity method investments | 2,219 | | | 2,462 | |
| Prepaid expenses | 2,210 | | | 2,404 | |
| Deferred taxes, net | 3,278 | | | 1,980 | |
| Commercial servicing rights, at fair value | 1,084 | | | 1,310 | |
| Repossessed assets | — | | | 231 | |
| | | |
| Other assets | 1,525 | | | 2,051 | |
| Total | $54,361 | | | $68,488 | |
|
| | | | | | | |
| (In Thousands) | 2018 | | 2017 |
| Other assets: | |
| | |
|
| Investment in Low Income Housing Partnerships |
| $19,243 |
| |
| $21,908 |
|
| Deferred taxes, net | 3,246 |
| | 6,260 |
|
| Taxes receivable | 8,188 |
| | 5,331 |
|
| Bank owned life insurance | 6,272 |
| | 5,313 |
|
| Software | 4,888 |
| | 5,270 |
|
| Accrued interest receivable | 4,817 |
| | 4,385 |
|
| Investment in equity method investments | 2,259 |
| | 3,878 |
|
| Prepaid expenses | 1,902 |
| | 1,269 |
|
| Repossessed assets | 1,242 |
| | — |
|
| Commercial servicing rights | 1,030 |
| | — |
|
| Interest rate lock commitments | 978 |
| | 873 |
|
| Interest rate swaps designated as hedging instruments | 607 |
| | 184 |
|
| Other assets | 1,832 |
| | 1,470 |
|
| Total |
| $56,504 |
| |
| $56,141 |
|
Equity Method Investments: The Company applies the equity method of accounting for the following related entities:
The Company owns a 24% interest in PWA, an investment advisory, trust, and wealth management business located in Seattle, Washington.
The Company owns a 30% interest in Homestate Mortgage Company, LLC, a mortgage origination business located in Anchorage, Alaska.
Low Income Housing Partnerships: The following table shows the Company's commitments to invest in various low income housing tax credit partnerships. The Company earns a return on its investments in the form of tax credits and deductions that flow through to it as a limited partner in these partnerships. The Company recognized amortization expense of $3.5 million, $3.5 million, and $2.7 million $2.3 million,in 2021, 2020, and $2.9 million in 2018, 2017, and 2016,2019, respectively. The Company expects to fund its remaining $1.2$4.4 million in commitments on these investments through 2030.
| | | | | | | | | | | | | | | | | |
| (In Thousands) | Date of original commitment | Years over which tax benefits are earned | Original commitment amount | Less: life to date contributions | Remaining commitment amount |
| | | | | |
| | | | | |
| USA 57 | December 2006 | 15 | 3,000 | | (3,000) | | — | |
| WNC | December 2012 | 16 | 2,500 | | (2,500) | | — | |
| R4 - Coronado | March 2013 | 17 | 10,729 | | (10,629) | | 100 | |
| R4 - MVV | May 2014 | 17 | 8,528 | | (8,348) | | 180 | |
| R4 - PJ33 | June 2016 | 17 | 6,835 | | (6,529) | | 306 | |
| R4 - Coronado II | July 2019 | 17 | 7,282 | | (7,022) | | 260 | |
| R4 - Duke Apartments | November 2019 | 17 | 3,985 | | (384) | | 3,601 | |
| Total | | | $42,859 | | ($38,412) | | $4,447 | |
|
| | | | | | | | | | | |
| (In Thousands) | Date of original commitment | Years over which tax credits are earned | Original commitment amount | Less: life to date contributions | Remaining commitment amount |
| R4 - MVV | May 2014 | 17 |
| $8,528 |
|
| ($8,248 | ) |
| $280 |
|
| R4 - Coronado | March 2013 | 17 | 10,729 |
| (10,188 | ) | 541 |
|
| R4 - PJ33 | June 2016 | 17 | 6,835 |
| (6,442 | ) | 393 |
|
| WNC | December 2012 | 16 | 2,500 |
| (2,500 | ) | — |
|
| USA 57 | December 2006 | 15 | 3,000 |
| (3,000 | ) | — |
|
| Centerline XXXIII | September 2006 | 18 | 3,000 |
| (3,000 | ) | — |
|
| Centerline XXII | January 2003 | 18 | 3,000 |
| (3,000 | ) | — |
|
| Total |
|
|
| $37,592 |
|
| ($36,378 | ) |
| $1,214 |
|
NOTE 1413 - Deposits
Deposits: At December 31, 2018,2021, the scheduled maturities of certificates of deposit are as follows:
| | | (In Thousands) | (In Thousands) | (In Thousands) |
| 2019 |
| $57,451 |
| |
| 2020 | 47,071 |
| |
| 2021 | 5,458 |
| |
| 2022 | 710 |
| 2022 | $118,569 | |
| 2023 | 784 |
| 2023 | 52,643 | |
| 2024 | | 2024 | 4,572 | |
| 2025 | | 2025 | 143 | |
| 2026 | | 2026 | 280 | |
| Thereafter | 1,799 |
| Thereafter | 1,757 | |
| Total |
| $113,273 |
| Total | $177,964 | |
The Company isoffers IntraFi® Network DepositsSM as a member of IntraFi® NetworkSM (Network). When a Network member places a deposit using IntraFi Network Deposits, that certificate of deposit or deposit account is divided into amounts under the Certificate of Deposit Account Registry System (“CDARS”) which is a network of over 3,000 banks throughout the United States. The CDARS system was founded in 2003 and allows participating banks to exchangestandard FDIC insurance coverage so that 100%maximum ($250,000) and is allocated among member banks, making the large deposit eligible for FDIC insurance. In addition to customer deposit placement, the IntraFi Network Deposits also allows placement of the balance of their customers’ certificates of deposit are fully subject to FDIC insurance. The system also allows for investment of banks’Bank's own investment dollars in the form of domestic certificates of deposit.dollars. The Company had no CDARS$24.0 million in IntraFi Network Deposits certificates of deposits and $223.7 million in IntraFi Network Deposits in deposit accounts at December 31, 2018 or 2017.2021 and $9.4 million in IntraFi Network Deposits certificates of deposits and $86.5 million in IntraFi Network Deposits in deposit accounts at December 31, 2020.
At December 31, 20182021 and 2017, the Company did not hold any certificates of deposit from a public entity collateralized by letters of credit issued by the FHLB. At December 31, 2018 and 2017, the Company did not have any securities pledged to collateralize certificates of deposit from a public entity.
At December 31, 2018 and 2017,2020, the Company held $2.7$3.6 million and $2.5$4.6 million, respectively, in deposits for related parties, including directors, executive officers, and their affiliates.
Interest expense: Interest expense on deposits is presented below:
|
| | | | | | | | | | | |
| (In Thousands) | 2018 | | 2017 | | 2016 |
| Interest-bearing demand accounts |
| $8 |
| |
| $21 |
| |
| $67 |
|
| Money market accounts | 855 |
| | 472 |
| | 418 |
|
| Savings accounts | 744 |
| | 520 |
| | 489 |
|
| Certificates of deposit $250,000 and greater | 472 |
| | 480 |
| | 614 |
|
| Certificates of deposit less than $250,000 | 228 |
| | 214 |
| | 282 |
|
| Total |
| $2,307 |
| |
| $1,707 |
| |
| $1,870 |
|
NOTE 1514 - Borrowings
The Company has a maximum line of credit with the FHLB approximating 45% of eligible assets. FHLB advances are subject to collateral criteria that require the Company to pledge assets under a blanket pledge arrangement as collateral for its borrowings from the FHLB. Based on assets currently pledged and advances currently outstanding at December 31, 2018,2021, the Company's available borrowing line is $139.3$271.8 million, representing approximately 10% of total assets. Additional advances of up to 45% of eligible assets, or $667.8 million,$1.22 billion, are dependent on the availability of acceptable collateral such as marketable securities or real estate loans, although all FHLB advances are secured by a blanket pledge of the Company’s assets. The Company has outstanding FHLB advances of $7.2$14.5 million and $7.4$14.8 million as of December 31, 20182021 and 2017,2020, respectively, which were originated to match fund low income housing projects that qualify for long-term fixed interest rates. The first advance was a $2.2 million FHLB Community Investment Program advance which was originated on March 22, 2013. It has anThese advances have original terms of either 18 year termor 20 years with a 30 year amortization period, which mirrors the term of the term real estate loan made to the borrower,periods and a fixed rate of 3.12%. The second advance was a $2.3 million FHLB Community Investment Cash Advance Program advance that was originated in the second quarter of 2016. This advance has a 20 year term with a 30 year amortization period, which mirrors the term of the loan made to the borrower, and a fixed interest rate of 2.61%. The last advance was a $3.1 million FHLB Community Investment Cash Advance Program advance that was originated in the third quarter of 2017. This advance has a 20 year term with a 30 year amortization period and a fixed interest rate of 3.25%, which mirrors the term of the loan maderates ranging from 1.23% to the borrower. All of these FHLB advances are included in borrowings.3.25%.
The Federal Reserve Bank is holding $78.6$50.7 million of loans as collateral to secure available borrowing lines through the discount window of $48.9$32.2 million at December 31, 2018.2021. There were no discount window advances outstanding at December 31, 20182021 and 2017.2020. The Company paid less than $1,000 in interest in 20182021 and 20172020 on this agreement. The Company utilized the Federal Reserve Bank's PPPLF to fund SBA PPP loans during the second quarter of 2020, but has repaid those funds in full as of June 30, 2020. This advance had an interest rate of 0.35%.
The Company is subject to provisions under the laws in the State of Alaska state law, which subject to certain exceptions,generally limit the amount of the Bank's outstanding debt to 15%35% of total assets or $222.6 million and $225.8$948.0 million at December 31, 20182021 and 2017, respectively.$736.0 million at December 31, 2020.
Securities sold under agreements to repurchase were $34.3 million and $27.7 million, respectively,zero for both December 31, 20182021 and 2017. The Company was paying an average rate of 0.17% and 0.14% on these agreements at December 31, 2018 and 2017, respectively. The average balance outstanding of securities sold under agreement to repurchase during 2018 and 2017 was $29.9 million and $29.0 million, respectively, and the maximum outstanding at any month-end was $36.5 million and $32.6 million, respectively, during the same time periods. The securities sold under agreement to repurchase are held by the FHLB under the Company’s control.2020.
The future principal payments that are required on the Company’s borrowings as of December 31, 2018,2021, are as follows:
| | | (In Thousands) | (In Thousands) | (In Thousands) |
| 2019 |
| $34,445 |
| |
| 2020 | 173 |
| |
| 2021 | 178 |
| 2021 | $412 | |
| 2022 | 184 |
| 2022 | 421 | |
| 2023 | 189 |
| 2023 | 431 | |
| 2024 | | 2024 | 441 | |
| 2025 | | 2025 | 453 | |
| Thereafter | 6,350 |
| Thereafter | 12,350 | |
| Total |
| $41,519 |
| Total | $14,508 | |
The Company recognized interest expense of $273,000, $207,000,$320,000, $387,000, and $157,000$291,000 on borrowings and securities sold under repurchase agreements in 2018, 2017,2021, 2020, and 2016,2019, respectively. The average interest rates paid on long-term debt in the same periods was 3.39%2.90%, 3.23%3.12%, and 2.82%3.39%, respectively.
NOTE 1615 - Junior Subordinated Debentures
In May of 2003, the Company formed a wholly-owned Delaware statutory business trust subsidiary, Northrim Capital Trust 1 (the “Trust”), which issued $8 million of guaranteed undivided beneficial interests in the Company’s Junior Subordinated Deferrable Interest Debentures (“Trust Preferred Securities”). These debentures qualified as Tier 1 capital under Federal Reserve Board guidelines. All of the common securities of the Trust were owned by the Company. The proceeds from the issuance of the common securities and the Trust Preferred Securities were used by the Trust to purchase $8.2 million of junior subordinated debentures of the Company. The Trust was not consolidated in the Company’s financial statements in accordance with GAAP; therefore, the Company recorded its investment in the Trust as another asset and the subordinated debentures as a liability. The debentures, which represent the sole asset of the Trust, accrued and paid distributions quarterly at a variable rate of 90-day LIBOR plus 3.15% per annum, adjusted quarterly, of the stated liquidation value of $1,000 per capital security. The interest cost to the Company on these debentures was zero, $219,000, and $319,000 in 2018, 2017, and 2016, respectively. The Company entered into contractual arrangements which, taken collectively, fully and unconditionally guaranteed payment of: (i) accrued and unpaid distributions required to be paid on the Trust Preferred Securities; (ii) the redemption price with respect to any Trust Preferred Securities called for redemption by the Trust; and (iii) payments due upon a voluntary or involuntary dissolution, winding up or liquidation of the Trust. The Trust Preferred Securities were mandatorily redeemable upon maturity of the debentures on May 15, 2033, or upon earlier redemption as provided in the indenture. The Company redeemed the debentures purchased by the Trust in whole, on August 15, 2017. As specified in the indenture, the redemption price was the principal amount and all accrued but unpaid interest.
In December of 2005, the Company formed a wholly-owned Connecticut statutory business trust subsidiary, Northrim Statutory Trust 2 (the “Trust 2”), which issued $10$10 million of guaranteed undivided beneficial interests in the Company’s Junior Subordinated Deferrable Interest Debentures (“Trust Preferred Securities 2”). These debentures qualify as Tier 1 capital under Federal Reserve Board guidelines. All of the common securities of Trust 2 are owned by the Company. The proceeds from the issuance of the common securities and the Trust Preferred Securities 2 were used by Trust 2 to purchase $10.3$10.3 million of junior subordinated debentures of the Company. Trust 2 is not consolidated in the Company’s financial statements in accordance with GAAP; therefore, the Company has recorded its investment in Trust 2 as an other asset and the subordinated debentures as a liability. The debentures, which represent the sole asset of Trust 2, accrue and pay distributions quarterly at a variable rate of 90-day90-day LIBOR plus 1.37% per annum, adjusted quarterly, of the stated liquidation value of $1,000$1,000 per capital security. The interest rate on these debentures was 4.16%1.57% at December 31, 2018.2021. The interest cost to the Company on these debentures was $368,000, $268,000,$160,000, $219,000, and $215,000$398,000 in 2018, 2017,2021, 2020, and 2016,2019, respectively. The Company has entered into contractual arrangements which, taken collectively, fully and unconditionally guarantee payment of: (i) accrued and unpaid distributions required to be paid on the Trust Preferred Securities 2; (ii) the redemption price with respect to any Trust Preferred Securities 2 called for redemption by Trust 2; and (iii) payments due upon a voluntary or involuntary dissolution, winding up or liquidation of Trust 2. The Trust Preferred Securities 2 are mandatorily redeemable upon maturity of the debentures on March 15, 2036,, or upon earlier redemption as provided in the indenture. The Company has the right to redeem the debentures purchased by Trust 2 in whole or in part, on or after March 15, 2011.2011. As specified in the indenture, if the debentures are redeemed prior to maturity, the redemption price will be the principal amount and any accrued but unpaid interest.
NOTE 16 – Accumulated Other Comprehensive Income (Loss)
The following table shows changes in accumulated other comprehensive income (loss) by component for the years ended December 31, 2021, 2020, and 2019:
| | | | | | | | | | | | | | | | | |
| (In Thousands) | Unrealized gains (losses) on securities available for sale | | Unrealized gains (losses) on derivatives and hedging | | Total |
| | | | | |
| Balance at December 31, 2018 | ($1,127) | | | $607 | | | ($520) | |
| Other comprehensive income (loss), net of tax expense of $(757) | 2,092 | | | (1,141) | | | 951 | |
| | | | | |
| Balance at December 31, 2019 | $965 | | | ($534) | | | $431 | |
| Other comprehensive income (loss), net of tax benefit of $1,600 | 294 | | | (707) | | | (413) | |
| | | | | |
| Balance at December 31, 2020 | $1,259 | | | ($1,241) | | | $18 | |
| Other comprehensive income (loss), net of tax expense of $1,360 | (3,982) | | | 558 | | | (3,424) | |
| Balance at December 31, 2021 | ($2,723) | | | ($683) | | | ($3,406) | |
NOTE17 – Revenue
The Company records revenue when control of the promised products or services is transferred to the customer, in an amount that reflects the consideration the Company expects to be entitled to receive in exchange for those products or services. All of the Company's revenue from contracts with customers in the scope of Topic 606 is recognized in non-interest income.
The following table presents the Company's sources other operating income, segregated by revenue streams in-scope and out-of-scope of Topic 606, for the years ended December 31, 2021, 2020 and 2019:
| | | | | | | | | | | | | | | | | |
| (In Thousands) | December 31, |
| Other operating income | 2021 | 2020 | 2019 |
| In-scope of Topic 606: | | | |
| | Bankcard fees | $3,389 | | $2,837 | | $2,976 | |
| | Service charges on deposit accounts | 1,297 | | 1,102 | | 1,557 | |
| | Merchant fees | 560 | | 416 | | 467 | |
| | Commission income on the sale of mutual funds and annuity products | 417 | | 369 | | 385 | |
| | Other | 826 | | 743 | | 812 | |
| Other operating income (in-scope of Topic 606) | $6,489 | | $5,467 | | $6,197 | |
| Other operating income (out-of-scope of Topic 606) | 45,774 | | 57,861 | | 31,149 | |
| Total other operating income | $52,263 | | $63,328 | | $37,346 | |
Bankcard fees
Bankcard fees are primarily comprised of debit card income and ATM fees. Debit card income is primarily comprised of interchange fees earned whenever the Company’s debit cards are processed through card payment networks such as Visa or MasterCard. ATM fees are primarily generated when a Company cardholder uses a non-Company ATM or a non-Company cardholder uses a Company ATM. The Company’s performance obligation for bankcard fees are largely satisfied, and related revenue recognized, when the services are rendered or upon completion. Payments are typically received immediately or in the following month.
Service charges on deposit accounts
Service charges on deposit accounts consist of general service fees for monthly account maintenance, activity- or transaction-based fees, and account analysis fees (i.e., net fees earned on analyzed business and public checking accounts), and other deposit account related fees and consist of transaction-based revenue, time-based revenue (service period), item-based revenue or some other individual attribute-based revenue. Revenue is recognized when our performance obligation is completed which is generally monthly for account maintenance services or when a transaction has been completed. Payments for service charges on deposit accounts are primarily received immediately or in the following month through a direct charge to customers’ accounts.
Other
Other operating income consists of other recurring revenue streams such as merchant services income, commissions from sales of mutual funds and other investments, safety deposit box rental fees, bank check and other check fees, unrealized gains and losses on marketable securities, and other miscellaneous revenue streams. Merchant services income mainly represents fees charged to merchants to process their debit and credit card transactions, in addition to account management fees. The Company’s performance obligation for merchant services income is largely satisfied, and related revenue recognized, when the transactions have been completed. Payment is typically received immediately or in the following month. The Company earns commissions from the sale of mutual funds as periodic service fees (i.e., trailers) from Elliott Cove Capital Management typically based on a percentage of net asset value. Trailer revenue is recorded over time, quarterly, as net asset value is determined. The Company also earns commission income from the sale of annuity products. The Company acts as an intermediary between the Company's customer and Elliott Cove Investment Advisors for these transactions, and commissions from annuity product sales are recorded when the Company’s performance obligation is satisfied, which is generally upon the issuance of the annuity policy. The Company does not earn trailer fees on annuity sales. Payment for commissions from sales of mutual funds and other investments and annuity sales is typically received in the following quarter. Other service charges include revenue from safety deposit box rental fees, processing wire transfers, bank check and other check fees, and other services. The Company’s performance obligations for these other revenue streams are largely satisfied, and related revenue recognized, when the services are rendered or upon completion. Payments are typically received immediately or in the following month.
Gains on the sale of OREO are also within the scope of Topic 606 and are recorded within other operating expense on the Company's Consolidated Statements of Income. Gains on the sale of OREO properties were $685,000, $391,000, and $380,000 for the years ended December 31, 2021, 2020, and 2019, respectively.
NOTE 1718 - Employee Benefit Plans
Employees of Northrim Bankthe Company are eligible to participate in the Bank'sCompany's 401(k) plan. Bank employeesplan immediately upon date of hire. Employees may elect to have a portion of their salary contributed to the 401(k) plan in accordance with Section 401(k) of the Internal Revenue Code of 1986. Bank employees may participate in the plan upon date of hire. Under the plan, each eligible participant may contribute a percentage of their eligible salary to a maximum established by the IRS, and Northrim BankThe Company provides for a mandatory $1.00 match for each $1.00 contributed by an employeeemployees of the Bank up to 5.5% of the employee’s eligible salary. NorthrimThe Company provides for a mandatory $1.00 match for each $1.00 contributed by employees of RML up to 2% of the employee’s eligible salary. The Bank or RML may increase the matching contribution at the discretion of the Board of Directors.
Northrim BankThe Company expensed $1.2$1.8 million, $904,000,$1.7 million, and $841,000,$1.4 million, in 2018, 2017,2021, 2020, and 2016, respectively, for 401(k) contributions and included these expenses in "Salaries and other personal expense" in the Consolidated Statements of Income.
Employees of RML may participate in RML's 401(k) plan. Participation in the plan is available to RML employees who have completed three months of service with the Company and have attained the age of 20 1/2. RML expensed $160,000, $164,000, and $190,000 in 2018, 2017, and 2016,2019, respectively, for 401(k) contributions and included this expense in "Salaries and other personal expense" in the Consolidated Statements of Income.
On July 1, 1994, Northrimthe Bank implemented a Supplemental Executive Retirement Plan for executive officers of Northrimthe Bank whose retirement benefits under the 401(k) plan have been limited under provisions of the Internal Revenue Code. Contributions to this plan totaled $247,000, $264,000,$281,000, $290,000, and $299,000,$262,000, in 2018, 2017,2021, 2020, and 2016,2019, respectively. These expenses are included in "Salaries and other personnel expense" in the Consolidated Statements of Income. At December 31, 20182021 and 2017,2020, the balance of the accrued liability for this plan was included in "Other liabilities" and totaled $2.2 million and $2.3$2.1 million, respectively.
RML has established a Supplemental Executive Retirement Plan ("SERP"), under which RML has agreed to make payment to certain key executives, based on contributions made by RML to the plan and a variable rate of return. The SERP's assets primarily consist of the cash surrender value of life insurance policies.plan. Contributions and earnings made to the participant accounts to the SERP are vested over ten years. The Company recorded expenses of $489,000, $600,000,$959,000, $997,000, and $673,000$580,000 in 2018, 2017,2021, 2020, and 2016,2019, respectively. RML's recorded obligation under the SERP amounted to $2.3$3.0 million and $3.3$2.6 million at December 31, 20182021 and 2017,2020, respectively, and was included in "Other liabilities".
In February of 2002, Northrim Bank implemented a non-qualified deferred compensation plan in which certain of the executive officers participate. Northrim Bank's net liability under this plan is dependent upon market gains and losses on assets held in the plan. Northrim Bank recognized an increase in its liability of $52,000$173,000 in 2018, a decrease2021, an increase in its liability of $140,000$78,000 in 2017,2020, and an increase in its liability of $199,000$36,000 in 2016.2019. These changes are included in "Salaries and other personnel expense" in the Consolidated Statements of Income. At December 31, 20182021 and 2017,2020, the balance of the accrued liability for this plan was included in "Other liabilities" and totaled $1.5$1.8 million for both years.and $1.6 million, respectively.
In November of 2011, Northrim Bank implemented a Profit Sharing Plan. Executive officers, in addition to allAll employees of Northrimthe Bank who commenced employment prior toemployed on the January 1 that precedes or coincides with a performance period,last day of the calendar year are eligible toand will participate in payments made from a profit sharing pool calculated in accordance with the provisions of the Profit Sharing Plan. The aggregate amount to be paid to employees under the Profit Sharing Plan is determined using Company-wide performance goals that are established by the Compensation Committee of the Board.Board of Directors. If the performance goals are met for the year, the profit sharing pool for the period is calculated based on a formula that is also approved by the Compensation Committee each year. The Compensation Committee has complete discretion to designate an employee as ineligible for profit sharing, or to adjust the amount of profit share payments by individual employee or in aggregate. The Compensation Committee approved management’s recommendation based upon the calculated payout under the Profit Sharing Plan’s methodology resulting in aggregate payouts of $1.3$4.2 million, $1.2$3.7 million, and $1.1$2.9 million for 2018, 2017,2021, 2020, and 2016,2019, respectively. Information concerning the calculation of employee payments under the Profit Sharing Plan is set forth under the heading “Performance Based Annual Payment” in the Company’s definitive proxy statement for the 2019 Annual Shareholders’ Meeting and is incorporated into this report by reference.
NOTE 1819 - Commitments and Contingencies
Leases: Rental expense under leases for equipment and premises was $2.9 million, $2.9 million, and $2.8 million in 2018, 2017, and 2016, respectively. The Company's required minimum rental payments on non-cancelable leases as of December 31, 2018, are as follows:
|
| | | |
| (In Thousands) | |
| 2019 |
| $2,668 |
|
| 2020 | 2,495 |
|
| 2021 | 2,413 |
|
| 2022 | 1,983 |
|
| 2023 | 1,767 |
|
| Thereafter | 8,121 |
|
| Total |
| $19,447 |
|
Rental income under leases was $692,000, $532,000 and $424,000 in 2018, 2017, and 2016, respectively. The Company's future required minimum rental receipts on non-cancelable leases as of December 31, 2018, are as follows:
|
| | | |
| (In Thousands) | |
| 2019 |
| $537 |
|
| 2020 | 293 |
|
| 2021 | 295 |
|
| 2022 | 178 |
|
| Total |
| $1,303 |
|
Employee benefit plans: The Company is self-insured for medical, dental, and vision plan benefits provided to employees. The Company has obtained stop-loss insurance to limit total medical claims in any one year to $175,000 per covered individual. The Company has established a liability for outstanding incurred but unreported claims. While management uses what it believes are pertinent factors in estimating the liability, it is subject to change due to claim experience, type of claims, and rising medical costs.
Legal proceeding: proceedings: The Company from time to time may be involved with disputes, claims, and litigation related to the conduct of its banking business. In the opinion of management, the resolution of these matters will not have a material effect on the Company’s financial position, results of operations, or cash flows.
Financial Instruments with Off-Balance Sheet Risk:In the ordinary course of business, the Company enters into various types of transactions that involve financial instruments with off-balance sheet risk. These instruments include commitments to extend credit and standby letters of credit and are not reflected in the accompanying balance sheets. These transactions may involve to varying degrees credit and interest rate risk in excess of the amount, if any, recognized in the balance sheets. Certain commitments are collateralized. We apply the same credit standards to these commitments as in all of our lending activities and include these commitments in our lending risk evaluations. Management does not anticipate any loss as a result of these commitments.
The Company’s off-balance sheet credit risk exposure is the contractual amount of commitments to extend credit and standby letters of credit. The Company applies the same credit standards to these contracts as it uses in its lending process.
| | | (In Thousands) | 2018 |
| 2017 | (In Thousands) | 2021 | | 2020 |
| Off-balance sheet commitments: | |
| | Off-balance sheet commitments: | | | |
| Commitments to extend credit |
| $260,602 |
|
|
| $283,937 |
| Commitments to extend credit | $361,915 | | | $375,065 | |
| Commitments to originate loans held for sale |
| $44,999 |
| |
| $43,602 |
| Commitments to originate loans held for sale | $81,617 | | | $150,276 | |
| Standby letters of credit |
| $3,157 |
|
|
| $7,606 |
| Standby letters of credit | $2,364 | | | $2,333 | |
Commitments to extend credit are agreements to lend to customers. These commitments have specified interest rates and generally have fixed expiration dates but may be terminated by the Company if certain conditions of the contract are violated. Our exposure to credit loss under commitments to extend credit is represented by the amount of these commitments. Although currently subject to draw down, many of the commitments do not necessarily represent future cash requirements. Collateral held relating to these commitments varies, but generally includes real estate, inventory, accounts receivable, and equipment.
Mortgage loans sold to investors may be sold with servicing rights released, for which the Company makes only standard legal representations and warranties as to meeting certain underwriting and collateral documentation standards. In the past two years, the Company has had to repurchase one loan4 loans due to deficiencies in underwriting or loan documentation and
has not realized significant losses related to these loans. Management believes that any liabilities that may result from such recourse provisions are not significant.
Standby letters of credit are conditional commitments issued by the Company to guarantee the performance of a customer to a third party. Credit risk arises in these transactions from the possibility that a customer may not be able to repay the Company upon default of performance. Collateral held for standby letters of credit is based on an individual evaluation of each customer’s creditworthiness.
Total unfunded commitments were $308.8$445.9 million and $335.1$527.7 million at December 31, 20182021 and 2017,2020, respectively. The Company does not expect that all of these commitments are likely to be fully drawn upon at any one time. The Company has a reserve for lossesan ACL related to these commitments and letters of credit that is recorded in "Other liabilities" on the Consolidated Balance Sheets. The reserveACL for unfunded commitments was $130,000$1.1 million and $152,000$187,000 as of December 31, 20182021 and 2017,2020, respectively.
Capital Expenditures and Commitments: At December 31, 2018,2021, the Company has no capital commitments related to the planned improvements to the Company’s corporate office building. At December 31, 2018 the Company considers these commitments to be immaterial.commitments. There were no other material changes outside of the ordinary course of business to any of our material contractual obligations during 2018.2021.
NOTE 1920 - Derivatives
Interest rate swaps related to community banking activities
The Company enters into commercial loans interest rate swaps with commercial banking customers which are offset with a corresponding swap agreement with a third party financial institution (“counterparty”). The Company has agreements with its counterparties that contain provisions that provide that if the Company fails to maintain its status as a well-capitalized"well-capitalized" institution, then the counterparty could terminate the derivative positions and the Company would be required to settle its obligations under the agreements. These agreements also require that the Company and the counterparty collateralize any fair value shortfalls that exceed $250,000 with eligible collateral, which includes cash and securities backed with the full faith and credit of the federal government. Similarly, the Company could be required to settle its obligations under the agreement if specific regulatory events occur, such as if the Company were issued a prompt corrective action directive or a cease and desist order, or if certain regulatory ratios fall below specified levels. The Company pledged $296,000$8.2 million and $300,000$10.7 million in available for sale securities to collateralize fair value shortfalls on interest rate swap agreements as of December 31, 20182021 and 2017,2020, respectively.
The Company had interest rate swaps related to commercial loans with an aggregate notional amount of $16.0$212.6 million and $12.5$196.0 million at December 31, 20182021 and December 31, 2017,2020, respectively. At December 31, 2018,2021, the notional amount of interest rate swaps is made up of three19 variable to fixed rate swaps to commercial loan customers totaling $8.0$106.3 million, and three19 fixed to variable rate swap with a counterparty totaling $8.0$106.3 million. Changes in fair value from these six38 interest rate swaps offset each other in 20182021 and 2017.2020. The Company recognized $84,000$452,000, $949,000, and $26,000$964,000 in fee income related to interest rate swaps in 20182021 and 2017, respectively,2020, and did not recognize any fee income in 2016.2019, respectively. Interest rate swap income is recorded in "Other income"other operating income on the Consolidated Statements of Income. None of these interest rate swaps are designated as hedging instruments.
The Company entered intohas an interest rate swap in the third quarter of 2017 to hedge the variability in cash flows arising out of its junior subordinated debentures, which is floating rate debt, by swapping the cash flows with an interest rate swap which receives floating and pays fixed. The Company has designated this interest rate swap as a hedging instrument. The interest rate swap effectively fixes the Company's interest payments on the $10.0 million of junior subordinated debentures held under Northrim Statutory Trust 2 at 3.72% through its maturity date. The floating rate that the dealer pays is equal to the three month LIBOR plus 1.37%, which reprices quarterly on the payment date. This rate was 4.16%1.57% as of December 31, 2018.2021. The Company pledged $400,000$2.9 million and $2.9 million in cash to collateralize initial margin and fair value exposure of our counterparty on this interest rate swap as of December 31, 20182021 and 2017.2020, respectively. Changes in the fair value of this interest rate swap are reported in other comprehensive income. The unrealized gainloss on this interest rate swap was $607,000$1.0 million and $184,000$1.7 million as of December 31, 20182021 and 2017,2020, respectively.
Interest rate swaps related to home mortgage lending activities
The Company also uses derivatives to hedge the risk of changes in the fair values of interest rate lock commitments. The Company enters into commitments to originate residential mortgage loans at specific rates; the value of these commitments are detailed in the table below as "interest rate lock commitments". The Company also hedges the interest rate risk associated with its residential mortgage loan commitments, using interest rate swaps, which are referred to as "retail interest rate contracts" in the table below. Market risk with respect to commitments to originate loans arises from changes in the value of contractual positions due to
changes in interest rates. At December 31, 20182021 and 2017,2020, RML had commitments to originate mortgage loans held for sale totaling $45.0$81.6 million and $43.6$150.3 million, respectively. Changes in the value of RML's interest rate derivatives are recorded in "Mortgagemortgage banking income"income on the Consolidated Statements of Income. None of these home mortgage lending derivatives are designated as hedging instruments.
The following table presents the fair value of derivatives not designated as hedging instruments at December 31, 2018 and December 31, 2017:as of the dates noted:
| | | | | | | | | | | | | | | | | | | | |
| (In Thousands) | Asset Derivatives |
| | | December 31, 2021 | | | December 31, 2020 |
| Balance Sheet Location | | Fair Value | | | Fair Value |
| | | | | | |
| Interest rate swaps | Other assets | | $6,030 | | | | $7,387 | |
| Interest rate lock commitments | Other assets | | 1,387 | | | | 4,034 | |
| Retail interest rate contracts | Other assets | | 166 | | | | — | |
| Total | | | $7,583 | | | | $11,421 | |
| | | (In Thousands) | Asset Derivatives | (In Thousands) | Liability Derivatives |
|
| | December 31, 2018 |
| | December 31, 2017 | | December 31, 2021 | | December 31, 2020 |
| Balance Sheet Location |
| Fair Value |
| Fair Value | | Balance Sheet Location | | Fair Value | | Fair Value |
|
| |
|
| |
| |
| Interest rate swaps | Other assets | |
| $246 |
|
| |
| $77 |
| Interest rate swaps | Other liabilities | | $6,030 | | | $7,387 | |
| Interest rate lock commitments | Other assets | | 978 |
| | 873 |
| |
| Retail interest rate contracts | | Retail interest rate contracts | Other liabilities | | — | | | 880 | |
| Total | |
| $1,224 |
| |
| $950 |
| Total | | $6,030 | | | $8,267 | |
|
| | | | | | | | | | |
| (In Thousands) | Liability Derivatives |
|
| | December 31, 2018 |
| | December 31, 2017 |
| Balance Sheet Location |
| Fair Value |
|
| Fair Value |
|
| |
|
| |
|
| Interest rate swaps | Other liabilities | |
| $246 |
|
| |
| $77 |
|
| Retail interest rate contracts | Other liabilities | | 262 |
| | | — |
|
| Total | | |
| $508 |
| | |
| $77 |
|
The following table presents the incomenet gains (losses) of derivatives not designated as hedging instruments at December 31, 2018 and December 31, 2017:as of the dates noted:
| | | | | | | | | | | | | | | | | | | | |
| (In Thousands) | Income Statement Location | December 31, 2021 | | December 31, 2020 |
| | | | | | |
| Retail interest rate contracts | Mortgage banking income | | $1,930 | | | | ($7,980) | |
| Interest rate lock commitments | Mortgage banking income | | (2,529) | | | | 3,062 | |
| Total | | | ($599) | | | | ($4,918) | |
|
| | | | | | | | | | |
| (In Thousands) | Income Statement Location | December 31, 2018 | | December 31, 2017 |
| | | | | | | |
| Interest rate contracts | Mortgage banking income | |
| $257 |
| | |
| ($420 | ) |
| Interest rate lock commitments | Mortgage banking income | | 105 |
| | | (229 | ) |
| Total | | |
| $362 |
| | |
| ($649 | ) |
Our derivative transactions with counterparties under International Swaps and Derivative Association master agreements that include “right of set-off” provisions. “Right of set-off” provisions are legally enforceable rights to offset recognized amounts and there may be an intention to settle such amounts on a net basis. We do not offset such financial instruments for financial reporting purposes.
The following table summarizes the derivatives that have a right of offset as of December 31, 20182021 and 2017:2020:
| | | | | | | | | | | | | | | | | | | | |
| December 31, 2021 | | | | Gross amounts not offset in the Statement of Financial Position | |
| (In Thousands) | Gross amounts of recognized assets and liabilities | Gross amounts offset in the Statement of Financial Position | Net amounts of assets and liabilities presented in the Statement of Financial Position | Financial Instruments | Collateral Posted | Net Amount |
| Asset Derivatives | | | | | | |
| Interest rate swaps | $6,030 | $— | | $6,030 | $— | | $— | | $6,030 |
| Retail interest rate contracts | 166 | — | | 166 | — | | — | | 166 |
| | | | | | |
| Liability Derivatives | | | | | | |
| Interest rate swaps | $6,030 | $— | | $6,030 | $— | | $6,030 | $— | |
| | | | | | |
| | | | | | |
| December 31, 2020 | | | | Gross amounts not offset in the Statement of Financial Position | |
| (In Thousands) | Gross amounts of recognized assets and liabilities | Gross amounts offset in the Statement of Financial Position | Net amounts of assets and liabilities presented in the Statement of Financial Position | Financial Instruments | Collateral Posted | Net Amount |
| Asset Derivatives | | | | | | |
| Interest rate swaps | $7,387 | $— | | $7,387 | $— | | $— | | $7,387 |
| | | | | | |
| Liability Derivatives | | | | | | |
| Interest rate swaps | $7,387 | $— | | $7,387 | $— | | $7,387 | $— | |
| Retail interest rate contracts | 880 | | — | | 880 | | — | | — | | 880 | |
|
| | | | | | | | | | | | | | |
| December 31, 2018 | | | | Gross amounts not offset in the Statement of Financial Position | |
| (In Thousands) | Gross amounts of recognized assets and liabilities | Gross amounts offset in the Statement of Financial Position | Net amounts of assets and liabilities presented in the Statement of Financial Position | Financial Instruments | Collateral Posted | Net Amount |
| Asset Derivatives | | | | | | |
| Interest rate swaps | $246 |
| $— |
| $246 |
| $— |
|
| $— |
| $246 |
| | | | | | | |
| Liability Derivatives | | | | | | |
| Interest rate swaps | $246 |
| $— |
| $246 |
| $— |
| $246 |
| $— |
|
| | | | | | | |
| December 31, 2017 | | | | Gross amounts not offset in the Statement of Financial Position | |
| (In Thousands) | Gross amounts of recognized assets and liabilities | Gross amounts offset in the Statement of Financial Position | Net amounts of assets and liabilities presented in the Statement of Financial Position | Financial Instruments | Collateral Posted | Net Amount |
| Asset Derivatives | | | | | | |
| Interest rate swaps | $77 |
| $— |
| $77 |
| $— |
|
| $— |
| $77 |
| | | | | | | |
| Liability Derivatives | | | | | | |
| Interest rate swaps | $77 |
| $— |
| $77 |
| $— |
|
| $77 |
|
| $— |
|
NOTE 2021 - Common Stock
Quarterly cash dividends were paid aggregating to $7.1$9.4 million, $6.0$8.8 million, and $5.4$8.5 million, or $1.02$1.50 per share, $0.86$1.38 per share, and $0.78$1.26 per share, in 2018, 2017,2021, 2020, and 2016,2019, respectively. On February 28, 2019,24, 2022, the Board of Directors declared a $0.30$0.41 per share cash dividend payable on March 22, 2019,18, 2022, to shareholders of record on March 14, 2019.10, 2022. Federal and State regulations place certain limitations on the payment of dividends by the Company.
In September 2002,January 2021, the Company’s Board of Directors approved a plan whereby it would periodically repurchase for cash up to approximately 5% of its shares of common stock in the open market. At December, 31, 2018,2021, there are 153,433were 33,724 shares available under the stock repurchase program. However, on January 28, 2022 the Company announced that its Board of Directors authorized the repurchase of up to an additional 300,000 shares of common stock. The Company intends to continue to repurchase its stock from time to time depending upon market conditions. The Company can make no assurances that it will continue this program or that it will repurchase allauthorize additional shares for repurchase. During 2021, 2020 and 2019, 279,276, 327,000 and 347,676 shares of the authorized shares. During 2018 and 2017, 15,468 and 58,341 sharescommon stock were repurchased, respectively. There were no repurchases in 2016.
NOTE 2122 - Stock-Based Compensation
The Company adopted the 20172020 Stock Option Plan (“20172020 Plan”) following shareholder approval of the 20172020 Plan at the 20172020 Annual Meeting. Subsequent to the adoption of the 20172020 Plan, no additional grants may be issued under the prior plans. The 20172020 Plan provides for grants of up to 350,000325,000 shares, which includes any shares subject to stock awards under the previous stock option plans.
Stock Options: Under the 20172020 Plan and previous plans, certain key employees have been granted the option to purchase set amounts of common stock at the market price on the day the option was granted. Optionees, at their own discretion, may pay cash to cover the cost of exercise, may cover the cost of exercise through the exchange at the then fair value of already owned shares of the Company’s stock.stock, or they may cover the cost of exercise through net settlement of a portion of the stock options exercised in satisfaction of the exercise price and applicable tax withholding requirements. The two latter options are referred to as cashless stock option exercises. Options are granted for a 10-year period and vest on a pro-rata basis over the initial three years from the grant date.
The Company measures the fair value of each stock option at the date of grant using the Black-Scholes option pricing model using assumptions noted in the following table. Expected volatility is based on the historical volatility of the price of the Company’s common stock. The Company uses historical data to estimate option exercise and stock option forfeiture rates within the valuation model. The expected term of options granted is determined based on historical experience with similar options and represents the period of time that options granted are expected to be outstanding. The expected dividend yield is based on dividend trends and the market value of the Company’s common stock at the time of grant. The risk-free rate for periods within the expected life of the option is based on the U.S. Treasury yield curve in effect at the time of grant.
The following assumptions were used to determine the fair value of stock options as of the grant date to determine compensation expense for the years ended December 31, 2018, 2017,2021, 2020, and 2016:2019:
| | | Stock Options: | 2018 |
| 2017 |
| 2016 | Stock Options: | 2021 | | 2020 | | 2019 |
| Grant date fair value |
| $7.69 |
|
|
| $6.70 |
|
|
| $6.31 |
| Grant date fair value | $10.27 | | | $6.55 | | | $5.34 | |
| Expected life of options | 8 years |
|
| 8 years |
|
| 8 years |
| Expected life of options | 8 years | | 8 years | | 8 years |
| Risk-free interest rate | 3.01 | % |
| 2.29 | % |
| 2.15 | % | Risk-free interest rate | 1.33 | % | | 0.79 | % | | 1.74 | % |
| Dividend yield rate | 2.91 | % |
| 2.64 | % |
| 2.85 | % | Dividend yield rate | 3.86 | % | | 4.55 | % | | 4.11 | % |
| Price volatility | 23.47 | % |
| 23.43 | % |
| 27.37 | % | Price volatility | 36.46 | % | | 35.44 | % | | 24.34 | % |
The following table summarizes stock option activity during 2018:2021:
| | | | | | | | Number of Shares | | Weighted Average Exercise Price | | Weighted Average Remaining Contractual Life, in Years |
| | Number of Shares |
| Weighted Average Exercise Price |
| Weighted Average Remaining Contractual Life, in Years | | |
| |
| | |
| |
| |
| Outstanding at January 1, 2018 | 143,445 |
|
|
| $26.79 |
|
| | |
| Outstanding at January 1, 2021 | | Outstanding at January 1, 2021 | 178,793 | | | $30.64 | | | |
| Granted | 22,384 |
|
| 37.06 |
|
| | Granted | 12,893 | | | 42.02 | | | |
| Forfeited | — |
|
| — |
|
| | Forfeited | — | | | — | | | |
| Exercised | (17,764 | ) |
| 21.82 |
|
| | Exercised | (54,867) | | | 26.10 | | | |
| Outstanding at December 31, 2018 | 148,065 |
|
|
| $28.94 |
|
| 6.09 | |
| Outstanding at December 31, 2021 | | Outstanding at December 31, 2021 | 136,819 | | | $33.53 | | | 6.61 |
At December 31, 2018, 2017,2021, 2020, and 2016,2019, there were 100,824, 89,561,107,553, 136,038, and 119,898112,319 options exercisable, with weighted average exercise prices of $26.50, $24.48,$32.63, $29.42, and $21.55,$28.17, respectively.
The aggregate intrinsic value of the stock options is the total pretax intrinsic value (i.e., the difference between the Company’s closing stock price on December 31, 20182021 and the exercise price, times the number of shares) that would have been received by the option holders had all the option holders exercised their options on December 31, 2018.2021. This amount changes based on the fair value of the Company’s stock. The total intrinsic value of options outstanding and exercisable as of December 31, 2018, 2017,2021, 2020, and 20162019 was $646,000, $670,000,$1.2 million, $682,000, and $1,170,000,$1.1 million, respectively. The total intrinsic value of options exercised for the years ended December 31, 2018, 2017,2021, 2020, and 20162019 was $383,000, $631,000,$969,000, zero, and $208,000,$203,000, respectively.
The As noted above, the Company allows stock options to be exercised through cash or cashless transactions. Cashless stock option exercises require a portion of the options exercised to be net settled in satisfaction of the exercise priceIn 2021, 2020, and applicable tax withholding requirements. In 2018, 2017, and 20162019 the Company received cash of $195,000, $69,000,zero, zero, and zero, respectively, for cash stock option exercises. In 2018, 2017,2021, 2020, and 20162019 the Company net settled $193,000, $954,000,$1.4 million, zero, and $847,000$282,000 respectively, for cashless stock option exercises. The Company withheld $227,000, $1.1$1.7 million, zero, and $1.1 million$317,000 to pay for stock option exercises or income taxes that resulted from the exercise of stock options in 2018, 2017,2021, 2020, and 2016,2019, respectively.
For the years ended December 31, 2018, 20172021, 2020 and 2016,2019, the Company recognized $183,000, $152,000,$173,000, $148,000, and $207,000,$143,000, respectively, in stock option compensation expense as a component of "Salaries and other personnel expense". As of
December 31, 2018,2021, there was approximately $298,000$218,000 of total unrecognized compensation expense related to non-vested options, which is expected to be recognized over the weighted-average vesting period of 2.42.3 years.
Restricted Stock Units: Under the 20172020 Plan and previous plans, the Company grants restricted stock units to certain key employees periodically. Recipients of restricted stock units do not pay any cash consideration to the Company for the shares and receive all dividends with respect to such shares when the shares vest. Restricted stock units cliff vest at the end of a three-year time period.
The following table summarizes restricted stock unit activity during 2018:2021:
| | | | | | | | Number of Shares | | Weighted Average Grant Date Fair Value | | Weighted Average Remaining Contractual Life, in Years |
| | Number of Shares |
| Weighted Average Grant Date Fair Value |
| Weighted Average Remaining Contractual Life, in Years | | |
| |
| | |
| |
| |
| Outstanding at January 1, 2018 | 65,883 |
|
|
| $30.10 |
|
| | |
| Outstanding at January 1, 2021 | | Outstanding at January 1, 2021 | 72,817 | | | $33.33 | | | |
| Granted | 26,163 |
|
| 37.06 |
|
| | Granted | 17,316 | | | 42.02 | | | |
| Dividend equivalents awarded | | Dividend equivalents awarded | 2,310 | | | 37.07 | | |
| Vested | (17,664 | ) |
| 28.76 |
|
| | Vested | (33,490) | | | 33.24 | | | |
| Forfeited | — |
|
| — |
|
| | Forfeited | (2,738) | | | 32.50 | | | |
| Outstanding at December 31, 2018 | 74,382 |
|
|
| $32.87 |
|
| 1.90 | |
| Outstanding at December 31, 2021 | | Outstanding at December 31, 2021 | 56,215 | | | $34.74 | | | 2.29 |
The total intrinsic value of restricted stock units vested for the years ended December 31, 2018, 2017,2021, 2020, and 20162019 was $654,000, $676,000,$1.3 million, $735,000, and $501,000,$906,000, respectively.
For the years ended December 31, 2018, 20172021, 2020 and 2016,2019, the Company recognized $633,000, $513,000,$900,000, $795,000, and $571,000,$689,000, respectively, in restricted stock unit compensation expense as a component of "Salaries and other personnel expense". As of December 31, 2018,2021, there was approximately $1.7$1.3 million of total unrecognized compensation expense related to non-vested options, which is expected to be recognized over the weighted-average vesting period of 2.3 years.
NOTE 2223 - Regulatory Matters
The Company and the Bank are subject to various regulatory capital requirements administered by the federal banking agencies. Failure to meet minimum requirements can initiate certain mandatory, and possibly discretionary, actions by regulators that, if undertaken, could have a direct material effect on a company's financial statements. Under capital adequacy guidelines and the regulatory framework for prompt corrective action, the Company and the Bank must meet specific capital guidelines that involve quantitative measures of the Company’s and the Bank’s assets, liabilities, and certain off-balance sheet items as calculated under regulatory practices. The Company’s and the Bank’s capital amounts and classification are also subject to qualitative judgment by the regulators about components, risk weightings, and other factors.
Quantitative measures established by regulation to ensure capital adequacy require the Company and Bank to maintain minimum amounts and ratios (set forth in the following table) of total capital, Tier 1 capital, and common equity Tier 1 to risk-weighted assets, and of Tier 1 capital to average assets (as defined in the regulations).
The tables below illustrate the capital requirements for the Company and the Bank and the actual capital ratios for each entity that exceed these requirements. The dividends that the Bank pays to the Company are limited to the extent necessary for the Bank to meet the regulatory requirements of a “well-capitalized” bank. The capital ratios for the Company exceed those for the Bank primarily because the $18$10 million trust preferred securities offerings that the Company completed in the second quarter of 2003 and in the fourth quarter of 2005 are included in the Company’s capital for regulatory purposes although they are accounted for as a liability in its financial statements. In the third quarter of 2017, the Company redeemed $8 million its trust preferred securities offerings. The trust preferred securities are not accounted for on the Bank’s financial statements nor are they included in its capital. As a result, the Company has $10 million more in regulatoryBank's capital than the Bank at December 31, 2018 and 2017, respectively, which explains most of the difference in the capital ratios for the two entities.ratios.
| | | | | | | | | | | | | | | | | | | | | | | | | | | | | | | | | | | |
| Northrim BanCorp, Inc. | Actual | | Adequately-Capitalized | | Well-Capitalized |
| (In Thousands) | Amount | | Ratio | | Amount | | Ratio | | Amount | | Ratio |
| As of December 31, 2021: | | | | | | | | | | | |
| Common equity tier 1 capital (to risk-weighted assets) | $225,412 | | | 13.50 | % | | $75,137 | | | ≥ 4.5 | % | | NA | | NA |
| Total Capital (to risk-weighted assets) | $246,836 | | | 14.79 | % | | $133,515 | | | ≥ 8 | % | | NA | | NA |
| Tier I Capital (to risk-weighted assets) | $235,097 | | | 14.08 | % | | $100,183 | | | ≥ 6 | % | | NA | | NA |
| Tier I Capital (to average assets) | $235,097 | | | 9.03 | % | | $104,140 | | | ≥ 4 | % | | NA | | NA |
| As of December 31, 2020: | | | | | | | | | | | |
| Common equity tier 1 capital (to risk-weighted assets) | $205,717 | | | 13.75 | % | | $67,326 | | | ≥ 4.5 | % | | NA | | NA |
| Total Capital (to risk-weighted assets) | $234,363 | | | 15.46 | % | | $121,275 | | | ≥ 8 | % | | NA | | NA |
| Tier I Capital (to risk-weighted assets) | $215,380 | | | 14.20 | % | | $91,006 | | | ≥ 6 | % | | NA | | NA |
| Tier I Capital (to average assets) | $215,380 | | | 10.25 | % | | $84,051 | | | ≥ 4 | % | | NA | | NA |
| Northrim Bank | Actual | | Adequately-Capitalized | | Well-Capitalized |
| (In Thousands) | Amount | | Ratio | | Amount | | Ratio | | Amount | | Ratio |
| As of December 31, 2021: | | | | | | | | | | | |
| Common equity tier 1 capital (to risk-weighted assets) | $189,447 | | | 11.43 | % | | $74,585 | | | ≥ 4.5 | % | | $107,735 | | | ≥ 6.5 | % |
| Total Capital (to risk-weighted assets) | $201,087 | | | 12.13 | % | | $132,621 | | | ≥ 8 | % | | $165,777 | | | ≥ 10 | % |
| Tier I Capital (to risk-weighted assets) | $189,348 | | | 11.42 | % | | $99,482 | | | ≥ 6 | % | | $132,643 | | | ≥ 8 | % |
| Tier I Capital (to average assets) | $189,348 | | | 7.31 | % | | $103,610 | | | ≥ 4 | % | | $129,513 | | | ≥ 5 | % |
| As of December 31, 2020: | | | | | | | | | | | |
| Common equity tier 1 capital (to risk-weighted assets) | $178,532 | | | 11.89 | % | | $67,569 | | | ≥ 4.5 | % | | $97,599 | | | ≥ 6.5 | % |
| Total Capital (to risk-weighted assets) | $197,233 | | | 13.13 | % | | $120,172 | | | ≥ 8 | % | | $150,216 | | | ≥ 10 | % |
| Tier I Capital (to risk-weighted assets) | $178,429 | | | 11.88 | % | | $90,116 | | | ≥ 6 | % | | $120,154 | | | ≥ 8 | % |
| Tier I Capital (to average assets) | $178,429 | | | 8.55 | % | | $83,476 | | | ≥ 4 | % | | $104,344 | | | ≥ 5 | % |
|
| | | | | | | | | | | | | | | | | | | | |
| Northrim BanCorp, Inc. | Actual |
| Adequately-Capitalized |
| Well-Capitalized |
| (In Thousands) | Amount |
| Ratio |
| Amount |
| Ratio |
| Amount | | Ratio |
| As of December 31, 2018: | |
| |
| |
| |
| | | |
| Common equity tier 1 capital (to risk-weighted assets) |
| $190,541 |
| | 14.73 | % | |
| $58,210 |
| | ≥ 4.5 | % | | NA |
| | NA |
|
| Total Capital (to risk-weighted assets) |
| $216,410 |
|
| 16.73 | % |
|
| $103,484 |
|
| ≥ 8 | % |
| NA |
| | NA |
|
| Tier I Capital (to risk-weighted assets) |
| $200,189 |
|
| 15.47 | % |
|
| $77,643 |
|
| ≥ 6 | % |
| NA |
| | NA |
|
| Tier I Capital (to average assets) |
| $200,189 |
|
| 13.40 | % |
|
| $59,758 |
|
| ≥ 4 | % |
| NA |
| | NA |
|
| As of December 31, 2017: | |
| |
| |
| |
|
| | | |
|
| Common equity tier 1 capital (to risk-weighted assets) |
| $177,005 |
| | 13.89 | % | |
| $57,345 |
| | ≥ 4.5 | % | | NA |
| | NA |
|
| Total Capital (to risk-weighted assets) |
| $202,638 |
|
| 15.90 | % |
|
| $101,956 |
|
| ≥ 8 | % |
| NA |
| | NA |
|
| Tier I Capital (to risk-weighted assets) |
| $186,637 |
|
| 14.65 | % |
|
| $76,438 |
|
| ≥ 6 | % |
| NA |
| | NA |
|
| Tier I Capital (to average assets) |
| $186,637 |
|
| 12.41 | % |
|
| $60,157 |
|
| ≥ 4 | % |
| NA |
| | NA |
|
| Northrim Bank | Actual | | Adequately-Capitalized | | Well-Capitalized |
| (In Thousands) | Amount | | Ratio | | Amount | | Ratio | | Amount | | Ratio |
| As of December 31, 2018: | | | | | | | | | | | |
| Common equity tier 1 capital (to risk-weighted assets) |
| $166,580 |
| | 13.05 | % | |
| $57,441 |
| | ≥ 4.5 | % | |
| $82,971 |
| | ≥ 6.5 | % |
| Total Capital (to risk-weighted assets) |
| $182,585 |
| | 14.30 | % | |
| $102,145 |
| | ≥ 8 | % | |
| $127,682 |
| | ≥ 10 | % |
| Tier I Capital (to risk-weighted assets) |
| $166,580 |
| | 13.05 | % | |
| $76,589 |
| | ≥ 6 | % | |
| $102,118 |
| | ≥ 8 | % |
| Tier I Capital (to average assets) |
| $166,580 |
| | 11.28 | % | |
| $59,071 |
| | ≥ 4 | % | |
| $73,839 |
| | ≥ 5 | % |
| As of December 31, 2017: | | | | | | | |
| | | | |
| Common equity tier 1 capital (to risk-weighted assets) |
| $161,996 |
| | 12.83 | % | |
| $56,819 |
| | ≥ 4.5 | % | |
| $82,071 |
| | ≥ 6.5 | % |
| Total Capital (to risk-weighted assets) |
| $177,857 |
| | 14.08 | % | |
| $101,055 |
| | ≥ 8 | % | |
| $126,319 |
| | ≥ 10 | % |
| Tier I Capital (to risk-weighted assets) |
| $161,996 |
| | 12.83 | % | |
| $75,758 |
| | ≥ 6 | % | |
| $101,011 |
| | ≥ 8 | % |
| Tier I Capital (to average assets) |
| $161,996 |
| | 10.87 | % | |
| $59,612 |
| | ≥ 4 | % | |
| $74,515 |
| | ≥ 5 | % |
As of the most recent notification from its regulatory agencies, the Bank was categorized as well-capitalized"well-capitalized" under the regulatory framework for prompt corrective action. There are no conditions or events since that notification that management believes have changed the Bank’s regulatory capital category. Management believes, as of December 31, 2018,2021, that the Company and Bank meets all capital adequacy requirements to which they are subject.
The Company and Bank are required to have a “conservation buffer,” consisting of a common equity Tier 1 capital amount equal to 2.5% of risk-weighted assets. An institution that does not meet the conservation buffer requirement will be subject to restrictions on certain activities including payment of dividends, stock repurchases, and discretionary bonuses to executive officers.
NOTE 2324 - Income Taxes
At December 31, 2018 and 2017, the Company had $8.2 million and $5.3 million in total taxes receivable, respectively, included in "Other assets" in the Consolidated Balance Sheets. The Company realized $2.8 million, $3.5 million, and $3.5 million in tax credits related to its investments in low income housing tax credit partnerships for 2018, 2017, and 2016 respectively.
Components of the provision for income taxes are as follows:
| | | | | | | | | | | | | | | | | |
| (In Thousands) | Current Tax Expense (Benefit) | | Deferred Expense (Benefit) | | Total Expense |
| 2021: | | | | | |
| Federal | $5,090 | | | ($869) | | | $4,221 | |
| State | 3,182 | | | (429) | | | 2,753 | |
| Amortization of investment in low income housing tax credit partnerships | 3,502 | | | — | | | 3,502 | |
| Total | $11,774 | | | ($1,298) | | | $10,476 | |
| 2020: | | | | | |
| Federal | $3,607 | | | $371 | | | $3,978 | |
| State | 1,891 | | | 184 | | | 2,075 | |
| Amortization of investment in low income housing tax credit partnerships | 3,506 | | | — | | | 3,506 | |
| Total | $9,004 | | | $555 | | | $9,559 | |
| 2019: | | | | | |
| Federal | $1,078 | | | $476 | | | $1,554 | |
| State | 977 | | | 235 | | | 1,212 | |
| Amortization of investment in low income housing tax credit partnerships | 2,668 | | | — | | | 2,668 | |
| Total | $4,723 | | | $711 | | | $5,434 | |
|
| | | | | | | | | | | |
| (In Thousands) | Current Tax Expense (Benefit) |
| Deferred Expense (Benefit) |
| Total Expense |
| 2018: | |
| |
| |
| Federal |
| ($1,549 | ) | |
| $2,017 |
|
|
| $468 |
|
| State | (85 | ) | | 997 |
|
| 912 |
|
| Amortization of investment in low income housing tax credit partnerships | 2,691 |
| | — |
| | 2,691 |
|
| Total |
| $1,057 |
|
|
| $3,014 |
|
|
| $4,071 |
|
| 2017: | |
| |
| |
| Federal |
| $2,618 |
|
|
| $3,658 |
|
|
| $6,276 |
|
| State | 1,423 |
|
| 346 |
|
| 1,769 |
|
| Amortization of investment in low income housing tax credit partnerships | 2,276 |
| | — |
| | 2,276 |
|
| Total |
| $6,317 |
|
|
| $4,004 |
|
|
| $10,321 |
|
| 2016: | |
| |
| |
| Federal |
| $2,844 |
|
|
| ($251 | ) |
|
| $2,593 |
|
| State | 665 |
|
| (74 | ) |
| 591 |
|
| Amortization of investment in low income housing tax credit partnerships | 2,868 |
| | — |
| | 2,868 |
|
| Total |
| $6,377 |
|
|
| ($325 | ) |
|
| $6,052 |
|
The actual expense for 2018, 2017,2021, 2020, and 2016,2019, differs from the “expected” tax expense (computed by applying the U.S. Federal Statutory Tax Rate of 21% for the year ended December 31, 2018 and 35% for the years ended December 31, 2017,2021, 2020 and 2016)2019) as follows:
| | | | | | | | | | | | | | | | | |
| (In Thousands) | 2021 | | 2020 | | 2019 |
| Computed “expected” income tax expense | $10,079 | | | $8,914 | | | $5,486 | |
| State income taxes, net | 2,175 | | | 1,639 | | | 957 | |
| Tax-exempt interest on investment securities and loans | (238) | | | (256) | | | (300) | |
| Amortization of investment in low income housing tax credit partnerships, net | 3,163 | | | 2,712 | | | 2,316 | |
| Low income housing credits | (3,694) | | | (3,168) | | | (2,721) | |
| | | | | |
| Other | (1,009) | | | (282) | | | (304) | |
| Total | $10,476 | | | $9,559 | | | $5,434 | |
|
| | | | | | | | | | | |
| (In Thousands) | 2018 |
| 2017 |
| 2016 |
| Computed “expected” income tax expense |
| $5,056 |
|
|
| $8,330 |
|
|
| $7,365 |
|
| State income taxes, net | 720 |
|
| 1,225 |
|
| 384 |
|
| Tax-exempt interest on investment securities | (307 | ) | | (597 | ) | | (566 | ) |
| Amortization of investment in low income housing tax credit partnerships | 2,691 |
| | 2,276 |
| | 2,868 |
|
| Low income housing credits | (2,821 | ) |
| (3,468 | ) |
| (3,540 | ) |
| Revaluation of deferred tax assets | (470 | ) | | 2,678 |
| | — |
|
| Other | (798 | ) |
| (123 | ) |
| (459 | ) |
| Total |
| $4,071 |
|
|
| $10,321 |
|
|
| $6,052 |
|
The components of the net deferred tax asset are as follows:
| | | | | | | | | | | | | | | | | |
| (In Thousands) | 2021 | | 2020 | | 2019 |
| Deferred Tax Asset: | | | | | |
| Allowance for loan losses | $3,126 | | | $5,772 | | | $5,190 | |
| Loan fees, net of costs | 1,956 | | | (635) | | | 741 | |
| Interest income, nonaccrual loans | 482 | | | 419 | | | 609 | |
| Deferred compensation | 1,344 | | | 1,130 | | | 1,224 | |
| Equity compensation | 406 | | | 481 | | | 429 | |
| Operating lease liabilities | 3,117 | | | 3,519 | | | 4,045 | |
| Accrued liabilities | 1,826 | | | 1,391 | | | 1,173 | |
| Unrealized gain on available for sale investment securities | 1,270 | | | 54 | | | 27 | |
| Other | 837 | | | 1,258 | | | 537 | |
| Total Deferred Tax Asset | $14,364 | | | $13,389 | | | $13,975 | |
| | | | | |
| Deferred Tax Liability: | | | | | |
| Intangible amortization | ($1,453) | | | ($1,022) | | | ($587) | |
| Mortgage servicing rights | (4,172) | | | (3,530) | | | (3,767) | |
| Depreciation and amortization | (1,515) | | | (2,066) | | | (1,848) | |
| Operating lease right-of-use assets | (3,128) | | | (3,537) | | | (4,067) | |
| Unrealized loss on available for sale investment securities | (189) | | | (554) | | | (411) | |
| Unrealized loss on marketable equity securities, net | (159) | | | (187) | | | (169) | |
| Other | (470) | | | (513) | | | (591) | |
| Total Deferred Tax Liability | ($11,086) | | | ($11,409) | | | ($11,440) | |
| Net Deferred Tax Asset | $3,278 | | | $1,980 | | | $2,535 | |
|
| | | | | | | | | | | |
| (In Thousands) | 2018 |
| 2017 |
| 2016 |
| Deferred Tax Asset: | |
| |
| |
| Allowance for loan losses |
| $5,313 |
|
|
| $5,922 |
|
|
| $7,717 |
|
| Loan fees, net of costs | 818 |
|
| 825 |
|
| 1,823 |
|
| Other real estate owned | 160 |
|
| 160 |
|
| 123 |
|
| Deferred compensation | 1,121 |
|
| 1,218 |
|
| 2,112 |
|
| Equity compensation | 435 |
| | 422 |
| | 544 |
|
| Loan discount | 79 |
| | 171 |
| | 326 |
|
| Fair market value adjustment on certificates of deposit | 123 |
| | 147 |
| | 247 |
|
| Unrealized loss on available for sale investment securities, net | 270 |
|
| 59 |
|
| 195 |
|
| Other | 1,069 |
|
| 693 |
|
| 1,455 |
|
| Total Deferred Tax Asset |
| $9,388 |
|
|
| $9,617 |
|
|
| $14,542 |
|
| | | | | | |
| Deferred Tax Liability: | |
| |
| |
| Intangible amortization |
| ($288 | ) |
|
| ($219 | ) |
|
| ($2,804 | ) |
| Mortgage servicing rights | (3,424 | ) | | (2,156 | ) | | (415 | ) |
| Depreciation and amortization | (1,873 | ) | | (404 | ) | | 31 |
|
| FHLB stock repurchase and dividends | (178 | ) | | (179 | ) | | (686 | ) |
| Other | (379 | ) |
| (399 | ) |
| (404 | ) |
| Total Deferred Tax Liability |
| ($6,142 | ) |
|
| ($3,357 | ) |
|
| ($4,278 | ) |
| Net Deferred Tax Asset |
| $3,246 |
|
|
| $6,260 |
|
|
| $10,264 |
|
A valuation allowance is provided when it is more likely than not that some portion of the deferred tax asset will not be realized. The primary source of recovery of the deferred tax asset will be future taxable income. Management believes it is more likely than not that the results of future operations will generate sufficient taxable income to realize the deferred tax asset. The deferred tax asset is included in "Other assets" in the Consolidated Balance Sheets.
As of December 31, 2018,2021, the Company had no unrecognized tax benefits. ThereIn 2020 the Company reversed an accrual of $454,000 for a potential increase in tax expense that was recorded in 2019 related to an audit that was performed in 2018 by the State of Alaska for tax years 2014-2016. The Company appealed the initial audit decision and the appeal was ruled in the Company's favor in the first quarter of 2021. In 2019 the Company reversed an accrual of $250,000 related to interest and penalties that was recognized for the year ended December 31, 2018 and none for the years ended , 2017 and 2016. in 2018.
The tax years subject to examination by federal and state taxing authorities are the years ending December 31, 2021, 2020, 2019, and 2018. The tax years subject to examination by the State of Alaska are the years ending December 31, 2021, 2020, 2019, 2018, 2017 2016, and 2015.2016.
NOTE 2425 - Fair Value Measurements
Assets and Liabilities Measured at Fair Value on a Recurring Basis
Investment securities available for sale and marketable securities: equity securities: Fair values are based on quoted market prices, where available. If quoted market prices are not available, fair values are based on quoted market prices of comparable instruments.
Loans held for sale: Due to the short term nature of these instruments, the carrying amounts reported in the consolidated balance sheets represent their fair values.
Servicing rights: MSRsMSR and CSRsCSR are measured at fair value on a recurring basis. These assets are classified as Level 3 as quoted prices are not available. In order to determine the fair value of MSRsMSR and CSRs,CSR, the present value of net expected future cash flows is estimated. Assumptions used include market discount rates, anticipated prepayment speeds, escrow calculations,
delinquency rates, and ancillary fee income net of servicing costs. The model assumptions are also compared to publicly filed information from several large MSR holders, as available.
Derivative instruments:The fair value of the interest rate lock commitments are estimated using quoted or published market prices for similar instruments, adjusted for factors such as pull-through rate assumptions based on historical information, where
appropriate. The pull-through rate assumptions are considered Level 3 valuation inputs and are significant to the interest rate lock commitment valuation; as such, the interest rate lock commitment derivatives are classified as Level 3. Interest rate contracts are valued in a model, which uses as its basis a discounted cash flow technique incorporating credit valuation adjustments to reflect nonperformance risk in the measurement of fair value. Although the Company has determined that the majority of inputs used to value its interest rate derivatives fall within Level 2 of the fair value hierarchy, the credit valuation adjustments associated with its derivatives utilize Level 3 inputs, such as estimates of current credit spreads to evaluate the likelihood of default by itself and its counterparties. However, as of September 30, 2018,December 31, 2021, the Company has assessed the significance of the impact of these adjustments on the overall valuation of its interest rate positions and has determined that they are not significant to the overall valuation of its interest rate derivatives. As a result, the Company has classified its interest rate derivative valuations in Level 2 of the fair value hierarchy.
Commitments to extend credit and standby letters of credit: The fair value of commitments is estimated using the fees currently charged to enter into similar agreements, taking into account the remaining terms of the agreements and the present creditworthiness of the counterparties. For fixed-rate loan commitments, fair value also considers the difference between current levels of interest rates and the committed rates. The fair value of letters of credit is based on fees currently charged for similar agreements or on the estimated cost to terminate them or otherwise settle the obligation with the counterparties at the reporting date.
Assets Subject to Nonrecurring Adjustment to Fair Value:
The Company is also required to measure certain assets such as equity method investments, goodwill, intangible assets, loans held for sale, impaired loans, and other real estate owned (“OREO”)OREO at fair value on a nonrecurring basis in accordance with GAAP. Any nonrecurring adjustments to fair value usually result from the writedown of individual assets.
The Company uses either in-house evaluations or external appraisals to estimate the fair value of OREO and impaired loansloan individually evaluated for credit losses as of each reporting date. In-house appraisals are considered Level 3 inputs and external appraisals are considered Level 2 inputs. The Company’s determination of which method to use is based upon several factors. The Company takes into account compliance with legal and regulatory guidelines, the amount of the loan, the size of the assets, the location and type of property to be valued and how critical the timing of completion of the analysis is to the assessment of value. Those factors are balanced with the level of internal expertise, internal experience and market information available, versus external expertise available such as qualified appraisers, brokers, auctioneers and equipment specialists.
The Company uses external sources to estimate fair value for projects that are not fully constructed as of the date of valuation. These projects are generally valued as if complete, with an appropriate allowance for cost of completion, including contingencies developed from external sources such as vendors, engineers and contractors. The Company believes that recording other real estate owned that is not fully constructed based on as if complete values is more appropriate than recording other real estate owned that is not fully constructed using as is values. We concluded that as-is-complete values are appropriate for these types of projects based on the accounting guidance for capitalization of project costs and subsequent measurement of the value of real estate. GAAP specifically states that estimates and cost allocations must be reviewed at the end of each reporting period and reallocated based on revised estimates. The Company adjusts the carrying value of other real estate owned in accordance with this guidance for increases in estimated cost to complete that exceed the fair value of the real estate at the end of each reporting period.
Limitations
Fair value estimates are made at a specific point in time, based on relevant market information and information about the financial instrument. These estimates do not reflect any premium or discount that could result from offering for sale at one time the Company’s entire holdings of a particular financial instrument. Because no market exists for a significant portion of the Company’s financial instruments, fair value estimates are based on judgments regarding future expected loss experience, current economic conditions, risk characteristics of various financial instruments, and other factors. These estimates are subjective in nature and involve uncertainties and matters of significant judgment and therefore cannot be determined with precision. Changes in assumptions could significantly affect the estimates.
Estimated fair values as of the periods indicated are as follows:
| | | | | | | | | | | | | | | | | | | | | | | |
| | December 31, 2021 | | December 31, 2020 |
| (In Thousands) | Carrying Amount | | Fair Value | | Carrying Amount | | Fair Value |
| Financial assets: | | | | | | | |
| Level 1 inputs: | | | | | | | |
| Cash, due from banks and deposits in other banks | $645,827 | | | $645,827 | | | $115,965 | | | $115,965 | |
| Investment securities available for sale | 141,531 | | | 141,531 | | | 58,865 | | | 58,865 | |
| Marketable equity securities | 8,420 | | | 8,420 | | | 9,052 | | | 9,052 | |
| | | | | | | |
| Level 2 inputs: | | | | | | | |
| Investment securities available for sale | 285,153 | | | 285,153 | | | 188,768 | | | 188,768 | |
| Investment in Federal Home Loan Bank Stock | 3,107 | | | 3,107 | | | 2,551 | | | 2,551 | |
| Loans held for sale | 73,650 | | | 73,650 | | | 146,178 | | | 146,178 | |
| Accrued interest receivable | 6,846 | | | 6,846 | | | 7,979 | | | 7,979 | |
| Interest rate swaps | 6,030 | | | 6,030 | | | 7,387 | | | 7,387 | |
| Retail interest rate contracts | 166 | | | 166 | | | — | | | — | |
| | | | | | | |
| Level 3 inputs: | | | | | | | |
| Investment securities held to maturity | 20,000 | | | 19,164 | | | 10,000 | | | 10,000 | |
| Loans | 1,413,886 | | | 1,396,486 | | | 1,444,051 | | | 1,414,179 | |
| Purchased receivables, net | 6,987 | | | 6,987 | | | 13,922 | | | 13,922 | |
| Interest rate lock commitments | 1,387 | | | 1,387 | | | 4,034 | | | 4,034 | |
| Mortgage servicing rights | 13,724 | | | 13,724 | | | 11,218 | | | 11,218 | |
| Commercial servicing rights | 1,084 | | | 1,084 | | | 1,310 | | | 1,310 | |
| | | | | | | |
| Financial liabilities: | | | | | | | |
| Level 2 inputs: | | | | | | | |
| Deposits | $2,421,631 | | | 2,422,215 | | | $1,824,981 | | | $1,826,990 | |
| | | | | | | |
| Borrowings | 14,508 | | | 14,727 | | | 14,817 | | | 15,538 | |
| Accrued interest payable | 31 | | | 31 | | | 65 | | | 65 | |
| Interest rate swaps | 6,985 | | | 6,985 | | | 9,122 | | | 9,122 | |
| Retail interest rate contracts | — | | | — | | | 880 | | | 880 | |
| Level 3 inputs: | | | | | | | |
| | | | | | | |
| Junior subordinated debentures | 10,310 | | | 9,727 | | | 10,310 | | | 10,475 | |
|
| | | | | | | | | | | | | | | |
| | December 31, 2018 | | December 31, 2017 |
| (In Thousands) | Carrying Amount | | Fair Value | | Carrying Amount | | Fair Value |
| Financial assets: |
|
| |
|
| |
|
| | |
|
| Level 1 inputs: |
|
| |
|
| |
|
| | |
|
| Cash, due from banks and deposits in other banks |
| $77,538 |
| |
| $77,538 |
| |
| $77,841 |
| |
| $77,841 |
|
| Investment securities available for sale | 74,549 |
| | 74,549 |
| | 53,386 |
| | 53,386 |
|
| Marketable equity securities | 7,265 |
| | 7,265 |
| | 5,731 |
| | 5,731 |
|
| | | | | | | | |
| Level 2 inputs: |
|
| |
|
| |
|
| | |
|
| Investment securities available for sale | 197,061 |
| | 197,061 |
| | 253,633 |
| | 253,633 |
|
| Investment in Federal Home Loan Bank Stock | 2,101 |
| | 2,101 |
| | 2,115 |
| | 2,115 |
|
| Accrued interest receivable | 4,817 |
| | 4,817 |
| | 4,385 |
| | 4,385 |
|
| Interest rate swaps | 853 |
| | 853 |
| | 261 |
| | 261 |
|
| | | | | | | | |
| Level 3 inputs: |
|
| |
|
| |
|
| | |
|
Loans and loans held for sale1 | 1,019,056 |
| | 995,115 |
| | 999,445 |
| | 1,001,346 |
|
| Purchased receivables, net | 14,406 |
| | 14,406 |
| | 22,231 |
| | 22,231 |
|
| Interest rate lock commitments | 978 |
| | 978 |
| | 873 |
| | 873 |
|
| Mortgage servicing rights | 10,821 |
| | 10,821 |
| | 7,305 |
| | 7,305 |
|
| Commercial servicing rights | 1,030 |
| | 1,030 |
| | — |
| | — |
|
| | | | | | | | |
| Financial liabilities: |
|
| |
|
| |
|
| | |
|
| Level 2 inputs: |
|
| |
|
| |
|
| | |
|
| Deposits |
| $1,228,088 |
| |
| $1,227,086 |
| |
| $1,258,283 |
| |
| $1,257,670 |
|
| Securities sold under repurchase agreements | 34,278 |
| | 34,278 |
| | 27,746 |
| | 27,746 |
|
| Borrowings | 7,241 |
| | 6,965 |
| | 7,362 |
| | 7,308 |
|
| Accrued interest payable | 22 |
| | 22 |
| | 24 |
| | 24 |
|
| Interest rate swaps | 246 |
| | 246 |
| | 77 |
| | 77 |
|
| Retail interest rate contracts | 262 |
| | 262 |
| | — |
| | — |
|
| Level 3 inputs: | | | | | | | |
| Junior subordinated debentures | 10,310 |
| | 10,809 |
| | 10,310 |
| | 9,856 |
|
1Carrying amount is net of unearned income. In accordance with the prospective adoption of ASU 2016-01, the fair value of loans and loans held for sale as of December 31, 2018 was measured using an exit price notion. The fair value of loans as of December 31, 2017 was measured using an entry price notion.
The following table sets forth the balances as of the periods indicated of assets measured at fair value on a recurring basis:
| | | (In Thousands) | Total |
| Quoted Prices in Active Markets for Identical Assets (Level 1) |
| Significant Other Observable Inputs (Level 2) |
| Significant Unobservable Inputs (Level 3) | (In Thousands) | Total | | Quoted Prices in Active Markets for Identical Assets (Level 1) | | Significant Other Observable Inputs (Level 2) | | Significant Unobservable Inputs (Level 3) |
| December 31, 2018 | |
| |
| |
| | |
| December 31, 2021 | | December 31, 2021 | | | | | | | |
| Assets: | | | | | | | | Assets: | |
| Available for sale securities | |
| |
| |
| | Available for sale securities | | | | | | | |
| U.S. Treasury and government sponsored entities |
| $208,860 |
|
|
| $54,863 |
|
|
| $153,997 |
|
|
| $— |
| U.S. Treasury and government sponsored entities | $341,480 | | | $115,686 | | | $225,794 | | | $— | |
| Municipal securities | 9,084 |
|
| — |
|
| 9,084 |
|
| — |
| Municipal securities | 840 | | | — | | | 840 | | | — | |
| | Corporate bonds | | Corporate bonds | 32,946 | | | 25,845 | | | 7,101 | | | — | |
| Collateralized loan obligations | | Collateralized loan obligations | 51,418 | | | — | | | 51,418 | | | — | |
| Total available for sale securities | | Total available for sale securities | $426,684 | | | $141,531 | | | $285,153 | | | $— | |
| Marketable equity securities | | Marketable equity securities | $8,420 | | | $8,420 | | | $— | | | $— | |
| Total marketable equity securities | | Total marketable equity securities | $8,420 | | | $8,420 | | | $— | | | $— | |
| Interest rate swaps | | Interest rate swaps | $6,030 | | | $— | | | $6,030 | | | $— | |
| Interest rate lock commitments | | Interest rate lock commitments | 1,387 | | | — | | | — | | | 1,387 | |
| Mortgage servicing rights | | Mortgage servicing rights | 13,724 | | | — | | | — | | | 13,724 | |
| Commercial servicing rights | | Commercial servicing rights | 1,084 | | | — | | | — | | | 1,084 | |
| Retail interest rate contracts | | Retail interest rate contracts | 166 | | | — | | | 166 | | | — | |
| Total other assets | | Total other assets | $22,225 | | | $— | | | $6,030 | | | $16,195 | |
| Liabilities: | | Liabilities: | |
| Interest rate swaps | | Interest rate swaps | $6,985 | | | $— | | | $6,985 | | | $— | |
| | Total other liabilities | | Total other liabilities | $6,985 | | | $— | | | $6,985 | | | $— | |
| December 31, 2020 | | December 31, 2020 | | | | | | | |
| Assets: | | Assets: | |
| Available for sale securities | | Available for sale securities | | | | | | | |
| U.S. Treasury and government sponsored entities | | U.S. Treasury and government sponsored entities | $174,601 | | | $37,548 | | | $137,053 | | | $— | |
| Municipal securities | | Municipal securities | 856 | | | — | | | 856 | | | — | |
| | Corporate bonds | 39,780 |
|
| 19,686 |
|
| 20,094 |
|
| — |
| Corporate bonds | 30,492 | | | 21,317 | | | 9,175 | | | — | |
| Collateralized loan obligations | 13,886 |
| | — |
| | 13,886 |
| | — |
| Collateralized loan obligations | 41,684 | | | — | | | 41,684 | | | — | |
| Total available for sale securities |
| $271,610 |
|
|
| $74,549 |
|
|
| $197,061 |
|
|
| $— |
| Total available for sale securities | $247,633 | | | $58,865 | | | $188,768 | | | $— | |
| Marketable equity securities |
| $7,265 |
|
|
| $7,265 |
|
|
| $— |
|
|
| $— |
| Marketable equity securities | $9,052 | | | $9,052 | | | $— | | | $— | |
| Total marketable equity securities |
| $7,265 |
| |
| $7,265 |
| |
| $— |
| |
| $— |
| Total marketable equity securities | $9,052 | | | $9,052 | | | $— | | | $— | |
| Interest rate swaps |
| $853 |
| |
| $— |
| |
| $853 |
| |
| $— |
| Interest rate swaps | $7,387 | | | $— | | | $7,387 | | | $— | |
| Interest rate lock commitments | 978 |
| | — |
| | — |
| | 978 |
| Interest rate lock commitments | 4,034 | | | — | | | — | | | 4,034 | |
| Mortgage servicing rights | 10,821 |
| | — |
| | — |
| | 10,821 |
| Mortgage servicing rights | 11,218 | | | — | | | — | | | 11,218 | |
| Commercial servicing rights | 1,030 |
| | — |
| | — |
| | 1,030 |
| Commercial servicing rights | 1,310 | | | — | | | — | | | 1,310 | |
| Total other assets |
| $13,682 |
| |
| $— |
| |
| $853 |
| |
| $12,829 |
| Total other assets | $23,949 | | | $— | | | $7,387 | | | $16,562 | |
| Liabilities: |
|
| | | | | | | Liabilities: | |
| Interest rate swaps |
| $246 |
| |
| $— |
| |
| $246 |
| |
| $— |
| Interest rate swaps | $9,122 | | | $— | | | $9,122 | | | $— | |
| Retail interest rate contracts | 262 |
| | — |
| | 262 |
| | — |
| Retail interest rate contracts | 880 | | | — | | | 880 | | | — | |
| Total other liabilities |
| $508 |
| |
| $— |
| |
| $508 |
| |
| $— |
| Total other liabilities | $10,002 | | | $— | | | $10,002 | | | $— | |
| December 31, 2017 | |
| |
| |
| | |
| Assets: | | | | | | | | |
| Available for sale securities | |
| |
| |
| | |
| U.S. Treasury and government sponsored entities |
| $249,461 |
|
|
| $49,878 |
|
|
| $199,583 |
|
|
| $— |
| |
| Municipal securities | 14,421 |
|
| — |
|
| 14,421 |
|
| — |
| |
| Corporate bonds | 37,132 |
|
| 3,508 |
|
| 33,624 |
|
| — |
| |
| Collateralized loan obligations | 6,005 |
| | — |
| | 6,005 |
| | — |
| |
| Total available for sale securities |
| $307,019 |
| |
| $53,386 |
| |
| $253,633 |
| |
| $— |
| |
| Marketable equity securities |
| $5,731 |
|
|
| $5,731 |
|
|
| $— |
|
|
| $— |
| |
| Total marketable equity securities |
| $5,731 |
| |
| $5,731 |
| |
| $— |
| |
| $— |
| |
| Interest rate swaps |
| $261 |
| |
| $— |
| |
| $261 |
| |
| $— |
| |
| Interest rate lock commitments | 873 |
| | — |
| | — |
| | 873 |
| |
| Mortgage servicing rights | 7,305 |
| | — |
| | — |
| | 7,305 |
| |
| Total other assets |
| $8,439 |
| |
| $— |
| |
| $261 |
| |
| $8,178 |
| |
| Liabilities: | | | | | | | | |
| Interest rate swaps |
| $77 |
| |
| $— |
| |
| $77 |
| |
| $— |
| |
| Total other liabilities |
| $77 |
| |
| $— |
| |
| $77 |
| |
| $— |
| |
The following table provides a reconciliation of the assets and liabilities measured at fair value using significant unobservable inputs (Level 3) on a recurring basis during the years ended December 31, 20182021 and 2017:2020:
| | | (In Thousands) | Beginning balance | Change included in earnings | Purchases and issuances | Sales and settlements | Ending balance | (In Thousands) | Beginning balance | Change included in earnings | Purchases and issuances | Sales and settlements | Ending balance |
| December 31, 2018 | | | |
| December 31, 2021 | | December 31, 2021 | | |
| Interest rate lock commitments |
| $873 |
|
| ($2,018 | ) |
| $18,585 |
|
| ($16,462 | ) |
| $978 |
| Interest rate lock commitments | $4,034 | | ($3,389) | | $28,229 | | ($27,487) | | $1,387 | |
| Mortgage servicing rights | 7,305 |
| (125 | ) | 3,641 |
| — |
| 10,821 |
| Mortgage servicing rights | 11,218 | | (3,582) | | 6,088 | | — | | 13,724 | |
| Commercial servicing rights | — |
| 972 |
| 58 |
| — |
| 1,030 |
| Commercial servicing rights | 1,310 | | (437) | | 211 | | — | | 1,084 | |
| Total |
| $8,178 |
|
| ($1,171 | ) |
| $22,284 |
|
| ($16,462 | ) |
| $12,829 |
| Total | $16,562 | | ($7,408) | | $34,528 | | ($27,487) | | $16,195 | |
| December 31, 2017 | | |
| December 31, 2020 | | December 31, 2020 | |
| Interest rate lock commitments |
| $1,137 |
|
| ($1,615 | ) |
| $15,084 |
|
| ($13,733 | ) |
| $873 |
| Interest rate lock commitments | $810 | | ($5,680) | | $49,186 | | ($40,282) | | $4,034 | |
| Mortgage servicing rights | 4,157 |
| 2 |
| 3,146 |
| — |
| 7,305 |
| Mortgage servicing rights | 11,920 | | (5,526) | | 4,824 | | — | | 11,218 | |
| Commercial servicing rights | | Commercial servicing rights | 1,214 | | (99) | | 195 | | — | | 1,310 | |
| Total |
| $5,294 |
|
| ($1,613 | ) |
| $18,230 |
|
| ($13,733 | ) |
| $8,178 |
| Total | $13,944 | | ($11,305) | | $54,205 | | ($40,282) | | $16,562 | |
During 2018 As of and 2017,for the years ending December 31, 2021 and 2020, except for certain assets as shown in the following table, no impairment or valuation adjustment was recognized for assets recognized at fair value on a nonrecurring basis, except for certain assets as shown in the following table.basis. For loans individually measured for impairment,credit losses, the Company classifies fair value measurements using observable inputs, such as external appraisals, as Level 2 valuations in the fair value hierarchy, and unobservable inputs, such as in-house evaluations, as Level 3 valuations in the fair value hierarchy.
| | | | | | | | | | | | | | | | | | | | | | | |
| (In Thousands) | Total | | Quoted Prices in Active Markets for Identical Assets (Level 1) | | Significant Other Observable Inputs (Level 2) | | Significant Unobservable Inputs (Level 3) |
| December 31, 2021 | | | | | | | |
| Loans individually measured for credit losses | $— | | | $— | | | $— | | | $— | |
| | | | | | | |
| | | | | | | |
| Total | $— | | | $— | | | $— | | | $— | |
| December 31, 2020 | | | | | | | |
| Loans individually measured for credit losses | $308 | | | $— | | | $— | | | $308 | |
| | | | | | | |
| | | | | | | |
| Total | $308 | | | $— | | | $— | | | $308 | |
|
| | | | | | | | | | | | | | | |
| (In Thousands) | Total |
| Quoted Prices in Active Markets for Identical Assets (Level 1) |
| Significant Other Observable Inputs (Level 2) |
| Significant Unobservable Inputs (Level 3) |
| December 31, 2018 | |
| |
| |
| |
| Loans measured for impairment |
| $848 |
|
|
| $— |
|
|
| $— |
|
|
| $848 |
|
| Other assets - equity method investment | 709 |
| | — |
| | — |
| | 709 |
|
| Total |
| $1,557 |
|
|
| $— |
|
|
| $— |
|
|
| $1,557 |
|
| December 31, 2017 | |
| |
| |
| |
| Loans measured for impairment |
| $7,988 |
|
|
| $— |
|
|
| $— |
|
|
| $7,988 |
|
| Other real estate owned | 3,927 |
|
| — |
|
| — |
|
| 3,927 |
|
| Other assets - equity method investment | 2,292 |
| | — |
| | — |
| | 2,292 |
|
| Total |
| $14,207 |
|
|
| $— |
|
|
| $— |
|
|
| $14,207 |
|
The following table presents the (income)(gains) losses resulting from nonrecurring fair value adjustments for the periods ended December 31, 2018, 20172021, 2020 and 2016,2019, respectively:
| | | | | | | | | | | | | | | | | |
| (In Thousands) | 2021 | | 2020 | | 2019 |
| Loans individually measured for credit losses | ($13) | | | ($4) | | | $3 | |
| | | | | |
| | | | | |
| Total (income) loss from nonrecurring measurements | ($13) | | | ($4) | | | $3 | |
|
| | | | | | | | | | | |
| (In Thousands) | 2018 | | 2017 | | 2016 |
| Loans measured for impairment |
| ($952 | ) | |
| $352 |
| |
| $270 |
|
| Other real estate owned | — |
| | 904 |
| | 187 |
|
| Other operating expense - impairment on equity method investment | 804 |
| | 686 |
| | — |
|
| Total (income) loss from nonrecurring measurements |
| ($148 | ) | |
| $1,942 |
| |
| $457 |
|
Assets and Liabilities Measured at Fair Value Using Significant Unobservable Inputs (Level 3)
The following table provides a description of the valuation technique, unobservable input, and qualitative information about the unobservable inputs for the Company’s assets and liabilities classified as Level 3 and measured at fair value on a recurring and nonrecurring basis at December 31, 20182021 and 2017:
|
| | | | | | | | | | |
| Financial Instrument | Valuation Technique | Unobservable Input | Weighted Average or Rate Range |
December 31, 20182021 | | | |
| | | |
| | | |
| | | |
| Interest rate lock commitment | External pricing model | Pull through rate | 93.27 | % |
| Mortgage servicing rights | Discounted cash flow | Constant prepayment rate | 9.25% - 14.21% |
| | Discount rate | 8.00% |
| Commercial servicing rights | Discounted cash flow | Constant prepayment rate | 12.30% - 16.57% |
| | Discount rate | 9.94 | % |
| December 31, 2020 | | | |
Loans individually measured for impairmentcredit losses | In-house valuation of collateral | Discount rate | 6530 | % |
| Discounted cash flow | Discount rate | 8.25% - 8.50% |
|
| | | |
| Interest rate lock commitment | External pricing model | Pull through rate | 91.6690.65 | % |
| Mortgage servicing rights | Discounted cash flow | Constant prepayment rate | 7.62%7.77% - 9.87% |
13.17% |
| | Discount rate | 9.93% - 10.47% |
7.75% |
| Commercial servicing rights | Discounted cash flow | Constant prepayment rate | 7.64%7.38% - 15.67% |
9.94% |
| | Discount rate | 11.499.46 | % |
December 31, 2017 | | | |
Loans measured for impairment | In-house valuation of collateral | Discount rate | 32% - 40% |
|
| Discounted cash flow | Discount rate | 14 | % |
Other real estate owned | Fair value of collateral | Estimated capital costs to complete improvements | 25% - 32% |
|
Interest rate lock commitment | External pricing model | Pull through rate | 93 | % |
Mortgage servicing rights | Discounted cash flow | Constant prepayment rate | 8.94% - 11.34% |
|
| | Discount rate | 9.42% - 10.05% |
|
NOTE 2526 - Segment Information
The Company's operations are managed along two2 operating segments: Community Banking and Home Mortgage Lending. The Community Banking segment's principal business focus is the offering of loan and deposit products to business and consumer customers in its primary market areas. As of December 31, 2018,2021, the Community Banking segment operated 1517 branches throughout Alaska. The Home Mortgage Lending segment's principal business focus is the origination and sale of mortgage loans for 1-4 family residential properties.
Summarized financial information for the Company's reportable segments and the reconciliation to the consolidated financial results is shown in the following tables:
| | | | | | | | | | | | | | | | | |
| December 31, 2021 | | | | | |
| (In Thousands) | Community Banking | | Home Mortgage Lending | | Consolidated |
| | | | | |
| Interest income | $81,703 | | | $2,903 | | | $84,606 | |
| Interest expense | 3,623 | | | 156 | | | 3,779 | |
| Net interest income | 78,080 | | | 2,747 | | | 80,827 | |
| Provision for credit losses | (4,099) | | | — | | | (4,099) | |
| Other operating income | 10,119 | | | 42,144 | | | 52,263 | |
| | | | | |
| Other operating expense | 58,647 | | | 30,549 | | | 89,196 | |
| Income before provision for income taxes | 33,651 | | | 14,342 | | | 47,993 | |
| Provision for income taxes | 6,468 | | | 4,008 | | | 10,476 | |
| Net income | $27,183 | | | $10,334 | | | $37,517 | |
| | | | | |
| | | | | |
| | | | | |
| Total assets | $2,615,433 | | | $109,286 | | | $2,724,719 | |
| Loans held for sale | $— | | | $73,650 | | | $73,650 | |
| | | | | | | | | | | | | | | | | |
| December 31, 2020 | | | | | |
| (In Thousands) | Community Banking | | Home Mortgage Lending | | Consolidated |
| | | | | |
| Interest income | $73,435 | | | $3,281 | | | $76,716 | |
| Interest expense | 5,788 | | | 263 | | | 6,051 | |
| Net interest income | 67,647 | | | 3,018 | | | 70,665 | |
| Provision for credit losses | 2,432 | | | — | | | 2,432 | |
| Other operating income | 10,693 | | | 52,635 | | | 63,328 | |
| Other operating expense | 57,614 | | | 31,500 | | | 89,114 | |
| Income before provision for income taxes | 18,294 | | | 24,153 | | | 42,447 | |
| Provision for income taxes | 2,694 | | | 6,865 | | | 9,559 | |
| Net income | $15,600 | | | $17,288 | | | $32,888 | |
| | | | | |
| | | | | |
| | | | | |
| Total assets | $1,935,871 | | | $185,927 | | | $2,121,798 | |
| Loans held for sale | $— | | | $146,178 | | | $146,178 | |
| | | December 31, 2018 | | | | | | |
| December 31, 2019 | | December 31, 2019 | |
| (In Thousands) | Community Banking | | Home Mortgage Lending | | Consolidated | (In Thousands) | Community Banking | | Home Mortgage Lending | | Consolidated |
| | | | | | | |
| Interest income |
| $62,097 |
| |
| $2,080 |
| |
| $64,177 |
| Interest income | $67,770 | | | $2,313 | | | $70,083 | |
| Interest expense | 2,370 |
| | 599 |
| | 2,969 |
| Interest expense | 4,569 | | | 1,072 | | | 5,641 | |
| Net interest income | 59,727 |
| | 1,481 |
| | 61,208 |
| Net interest income | 63,201 | | | 1,241 | | | 64,442 | |
| Benefit for loan losses | (500 | ) | | — |
| | (500 | ) | |
| Benefit for credit losses | | Benefit for credit losses | (1,175) | | | — | | | (1,175) | |
| Other operating income | 11,323 |
| | 20,844 |
| | 32,167 |
| Other operating income | 13,145 | | | 24,201 | | | 37,346 | |
| Compensation expense, RML acquisition payments | | Compensation expense, RML acquisition payments | 468 | | | — | | | 468 | |
| Other operating expense | 49,956 |
| | 19,844 |
| | 69,800 |
| Other operating expense | 54,520 | | | 21,850 | | | 76,370 | |
| Income before provision for income taxes | 21,594 |
| | 2,481 |
| | 24,075 |
| Income before provision for income taxes | 22,533 | | | 3,592 | | | 26,125 | |
| Provision for income taxes | 3,361 |
| | 710 |
| | 4,071 |
| Provision for income taxes | 4,408 | | | 1,026 | | | 5,434 | |
| Net income |
| $18,233 |
| |
| $1,771 |
| |
| $20,004 |
| Net income | $18,125 | | | $2,566 | | | $20,691 | |
| | | | | | | |
| Total assets |
| $1,443,745 |
| |
| $59,243 |
| |
| $1,502,988 |
| Total assets | $1,540,869 | | | $103,127 | | | $1,643,996 | |
| Loans held for sale |
| $— |
| |
| $34,710 |
| |
| $34,710 |
| Loans held for sale | $— | | | $67,834 | | | $67,834 | |
|
| | | | | | | | | | | |
| December 31, 2017 | | | | | |
| (In Thousands) | Community Banking | | Home Mortgage Lending | | Consolidated |
| | | | | | |
| Interest income |
| $58,308 |
| |
| $1,800 |
| |
| $60,108 |
|
| Interest expense | 1,860 |
| | 570 |
| | 2,430 |
|
| Net interest income | 56,448 |
| | 1,230 |
| | 57,678 |
|
| Provision for loan losses | 3,200 |
| | — |
| | 3,200 |
|
| Other operating income | 17,187 |
| | 23,287 |
| | 40,474 |
|
| Compensation expense, RML acquisition payments | 130 |
| | — |
| | 130 |
|
| Other operating expense | 50,271 |
| | 20,752 |
| | 71,023 |
|
| Income before provision for income taxes | 20,034 |
| | 3,765 |
| | 23,799 |
|
| Provision for income taxes | 9,499 |
| | 822 |
| | 10,321 |
|
| Net income | 10,535 |
| | 2,943 |
| | 13,478 |
|
| Less: net income attributable to the noncontrolling interest | 327 |
| | — |
| | 327 |
|
| Net income attributable to Northrim BanCorp, Inc. |
| $10,208 |
| |
| $2,943 |
| |
| $13,151 |
|
| | | | | | |
| Total assets |
| $1,452,602 |
| |
| $65,994 |
| |
| $1,518,596 |
|
| Loans held for sale |
| $— |
| |
| $43,979 |
| |
| $43,979 |
|
|
| | | | | | | | | | | |
| December 31, 2016 | | | | | |
| (In Thousands) | Community Banking | | Home Mortgage Lending | | Consolidated |
| | | | | | |
| Interest income |
| $56,986 |
| |
| $1,932 |
| |
| $58,918 |
|
| Interest expense | 1,739 |
| | 822 |
| | 2,561 |
|
| Net interest income | 55,247 |
| | 1,110 |
| | 56,357 |
|
| Provision (benefit) for loan losses | 2,298 |
| | — |
| | 2,298 |
|
| Other operating income | 13,756 |
| | 29,507 |
| | 43,263 |
|
| Compensation expense, RML acquisition payments | 4,775 |
| | — |
| | 4,775 |
|
| Other operating expense | 48,610 |
| | 22,895 |
| | 71,505 |
|
| Income before provision for income taxes | 13,320 |
| | 7,722 |
| | 21,042 |
|
| Provision for income taxes | 2,867 |
| | 3,185 |
| | 6,052 |
|
| Net income | 10,453 |
| | 4,537 |
| | 14,990 |
|
| Less: net income attributable to the noncontrolling interest | 579 |
| | — |
| | 579 |
|
| Net income attributable to Northrim BanCorp, Inc. |
| $9,874 |
| |
| $4,537 |
| |
| $14,411 |
|
| | | | | | |
| Total assets |
| $1,459,261 |
| |
| $66,590 |
| |
| $1,525,851 |
|
| Loans held for sale |
| $— |
| |
| $43,849 |
| |
| $43,849 |
|
NOTE 2627 - Parent Company Information
| | | | | | | | | | | |
| Balance Sheets at December 31, | 2021 | | 2020 |
| (In Thousands) | |
| Assets | | | |
| Cash and cash equivalents | $35,546 | | | $24,742 | |
| Marketable equity securities | 8,420 | | | 9,052 | |
| Investment in Northrim Bank | 202,819 | | | 196,002 | |
| Investment in NISC | 1,336 | | | 1,472 | |
| | | |
| Investment in NST2 | 310 | | | 310 | |
| | | |
| Taxes receivable, net | 603 | | | 1,973 | |
| Other assets | 358 | | | 497 | |
| Total Assets | $249,392 | | | $234,048 | |
| Liabilities | | | |
| Junior subordinated debentures | $10,310 | | | $10,310 | |
| Other liabilities | 1,265 | | | 2,163 | |
| Total Liabilities | 11,575 | | | 12,473 | |
| Shareholders' Equity | | | |
| Common stock | 6,015 | | | 6,251 | |
| Additional paid-in capital | 31,162 | | | 41,808 | |
| Retained earnings | 204,046 | | | 173,498 | |
| Accumulated other comprehensive (loss) income | (3,406) | | | 18 | |
| Total Shareholders' Equity | 237,817 | | | 221,575 | |
| Total Liabilities and Shareholders' Equity | $249,392 | | | $234,048 | |
|
| | | | | | | |
| Balance Sheets at December 31, | 2018 |
| 2017 |
| (In Thousands) |
|
| Assets | |
| |
| Cash and cash equivalents |
| $18,314 |
|
|
| $15,872 |
|
| Marketable equity securities | 7,265 |
|
| 5,731 |
|
| Investment in Northrim Bank | 181,781 |
|
| 177,824 |
|
| Investment in NISC | 1,501 |
|
| 1,469 |
|
| Investment in NST2 | 310 |
|
| 310 |
|
| Taxes receivable, net | 6,914 |
| | 992 |
|
| Other assets | 800 |
|
| 1,951 |
|
| Total Assets |
| $216,885 |
|
|
| $204,149 |
|
| Liabilities | |
| |
| Junior subordinated debentures |
| $10,310 |
|
|
| $10,310 |
|
| Other liabilities | 628 |
|
| 1,037 |
|
| Total Liabilities | 10,938 |
|
| 11,347 |
|
| Shareholders' Equity | |
| |
| Common stock | 6,883 |
|
| 6,872 |
|
| Additional paid-in capital | 62,132 |
|
| 61,793 |
|
| Retained earnings | 137,452 |
|
| 124,322 |
|
| Accumulated other comprehensive loss | (520 | ) |
| (185 | ) |
| Total Shareholders' Equity | 205,947 |
|
| 192,802 |
|
| Total Liabilities and Shareholders' Equity |
| $216,885 |
|
|
| $204,149 |
|
| | | | | | | | | | | | | | | | | |
| Statements of Income for Years Ended: | 2021 | | 2020 | | 2019 |
| (In Thousands) | |
| Income | | | | | |
| Interest income | $551 | | | $599 | | | $635 | |
| Equity in undistributed earnings from Northrim Bank | 38,625 | | | 33,570 | | | 20,680 | |
| Equity in undistributed earnings from NISC | 66 | | | 174 | | | 218 | |
| Gain on sale of marketable equity securities, net | 67 | | | 98 | | | — | |
| Unrealized gain (loss) on marketable equity securities | (101) | | | 61 | | | 911 | |
| Other income | 151 | | | 10 | | | 44 | |
| Total Income | $39,359 | | | $34,512 | | | $22,488 | |
| Expense | | | | | |
| Interest expense | 382 | | | 385 | | | 389 | |
| Administrative and other expenses | 2,754 | | | 2,748 | | | 2,168 | |
| Total Expense | 3,136 | | | 3,133 | | | 2,557 | |
| Income Before Benefit from Income Taxes | 36,223 | | | 31,379 | | | 19,931 | |
| Benefit from income taxes | (1,294) | | | (1,509) | | | (760) | |
| Net Income | $37,517 | | | $32,888 | | | $20,691 | |
| | | | | | | | | | | | | | | | | |
| Statements of Cash Flows for Years Ended: | 2021 | | 2020 | | 2019 |
| (In Thousands) | |
| Operating Activities: | | | | | |
| Net income | $37,517 | | | $32,888 | | | $20,691 | |
| Adjustments to Reconcile Net Income to Net Cash: | | | | | |
| Gain on sale of securities, net | (67) | | | (98) | | | — | |
| Equity in undistributed earnings from subsidiaries | (38,691) | | | (33,744) | | | (20,897) | |
| Change in fair value marketable equity securities | 101 | | | (61) | | | (911) | |
| Stock-based compensation | 1,073 | | | 943 | | | 832 | |
| Changes in other assets and liabilities | (2,167) | | | (2,118) | | | 8,556 | |
| Net Cash Used from Operating Activities | (2,234) | | | (2,190) | | | 8,271 | |
| Investing Activities: | | | | | |
| Purchases of marketable equity securities | (493) | | | (1,552) | | | — | |
| Proceeds from sales/calls/maturities of marketable equity securities | 1,016 | | | 503 | | | 229 | |
| Investment in Northrim Bank, NISC & NST2 | 31,894 | | | 21,423 | | | 19,488 | |
| Net Cash Provided by Investing Activities | 32,417 | | | 20,374 | | | 19,717 | |
| Financing Activities: | | | | | |
| Dividends paid to shareholders | (9,388) | | | (8,844) | | | (8,512) | |
| Proceeds from issuance of common stock | 1,543 | | | 84 | | | 73 | |
| Repurchase of common stock | (11,534) | | | (9,976) | | | (12,569) | |
| Net Cash Used from Financing Activities | (19,379) | | | (18,736) | | | (21,008) | |
| Net change in Cash and Cash Equivalents | 10,804 | | | (552) | | | 6,980 | |
| Cash and Cash Equivalents at beginning of year | 24,742 | | | 25,294 | | | 18,314 | |
| Cash and Cash Equivalents at end of year | $35,546 | | | $24,742 | | | $25,294 | |
|
| | | | | | | | | | | |
| Statements of Income for Years Ended: | 2018 |
| 2017 |
| 2016 |
| (In Thousands) |
|
| Income | |
| |
| |
| Interest income |
| $477 |
|
|
| $408 |
|
|
| $369 |
|
| Equity in undistributed earnings from Northrim Bank | 20,888 |
|
| 14,055 |
|
| 14,969 |
|
| Equity in undistributed earnings from NISC | 166 |
|
| 122 |
|
| 95 |
|
| Loss on marketable equity securities | (625 | ) | | — |
| | — |
|
| Other income | 5 |
|
| — |
|
| — |
|
| Total Income |
| $20,911 |
|
|
| $14,585 |
|
|
| $15,433 |
|
| Expense | |
| |
| |
| Interest expense | 389 |
|
| 516 |
|
| 534 |
|
| Administrative and other expenses | 2,524 |
|
| 2,242 |
|
| 2,050 |
|
| Total Expense | 2,913 |
|
| 2,758 |
|
| 2,584 |
|
| Income Before Benefit from Income Taxes | 17,998 |
|
| 11,827 |
|
| 12,849 |
|
| Benefit from income taxes | (2,006 | ) |
| (1,324 | ) |
| (1,562 | ) |
| Net Income |
| $20,004 |
|
|
| $13,151 |
|
|
| $14,411 |
|
|
| | | | | | | | | | | |
| Statements of Cash Flows for Years Ended: | 2018 |
| 2017 |
| 2016 |
| (In Thousands) |
|
| Operating Activities: | |
| |
| |
| Net income |
| $20,004 |
| |
| $13,151 |
| |
| $14,411 |
|
| Adjustments to Reconcile Net Income to Net Cash: | | | | | |
| Equity in undistributed earnings from subsidiaries | (20,920 | ) | | (14,132 | ) | | (15,201 | ) |
| Change in fair value marketable equity securities | 625 |
| | — |
| | — |
|
| Stock-based compensation | 816 |
| | 665 |
| | 778 |
|
| Changes in other assets and liabilities | (6,428 | ) | | 207 |
| | (1,653 | ) |
| Net Cash Used from Operating Activities | (5,903 | ) | | (109 | ) | | (1,665 | ) |
| Investing Activities: | | | | | |
| Purchases of marketable equity securities | (3,000 | ) | | (499 | ) | | (1,373 | ) |
| Proceeds from sales/calls/maturities of marketable equity securities | 783 |
| | — |
| | — |
|
| Investment in Northrim Bank, NISC, NCT1 & NST2 | 17,877 |
| | 11,989 |
| | 10,115 |
|
| Net Cash Provided by Investing Activities | 15,660 |
| | 11,490 |
| | 8,742 |
|
| Financing Activities: | | | | | |
| Dividends paid to shareholders | (7,064 | ) | | (5,965 | ) | | (5,372 | ) |
| Proceeds from issuance of common stock and excess tax benefits | 243 |
| | 100 |
| | — |
|
| Repurchase of common stock | (494 | ) | | (1,607 | ) | | — |
|
| Net Cash Used from Financing Activities | (7,315 | ) | | (7,472 | ) | | (5,372 | ) |
| Net change in Cash and Cash Equivalents | 2,442 |
| | 3,909 |
| | 1,705 |
|
| Cash and Cash Equivalents at beginning of year | 15,872 |
| | 11,963 |
| | 10,258 |
|
| Cash and Cash Equivalents at end of year |
| $18,314 |
| |
| $15,872 |
| |
| $11,963 |
|
NOTE 2728 - Quarterly ResultsSubsequent Events
The Company's Executive Vice President, General Counsel and Corporate Secretary, who also served as Northrim Bank's Executive Vice President, General Counsel, Chief Operating Officer and Corporate Secretary passed away on November 11, 2021. The Company received $2.0 million in keyman life insurance proceeds on February 15, 2022 in connection with the death of Operations (Unaudited)this employee that will be reflected in the Company's Consolidated Statements of Net Income for the quarter ended March 31, 2022.
|
| | | | | | | | | | | | | | | |
| 2018 Quarter Ended | Dec. 31 |
| Sept. 30 |
| June 30 |
| March 31 |
| (In Thousands Except Per Share Amounts) |
|
| Total interest income |
| $17,207 |
|
|
| $16,580 |
|
|
| $15,595 |
|
|
| $14,795 |
|
| Total interest expense | 1,070 |
|
| 761 |
|
| 606 |
|
| 532 |
|
| Net interest income | 16,137 |
|
| 15,819 |
|
| 14,989 |
|
| 14,263 |
|
| Benefit for loan losses | (200 | ) |
| — |
|
| (300 | ) |
| — |
|
| Other operating income | 7,718 |
|
| 8,673 |
|
| 8,314 |
|
| 7,462 |
|
| Other operating expense | 18,300 |
|
| 18,099 |
|
| 16,606 |
|
| 16,795 |
|
| Income before provision for income taxes | 5,755 |
|
| 6,393 |
|
| 6,997 |
|
| 4,930 |
|
| Provision for income taxes | 907 |
|
| 1,129 |
|
| 1,167 |
|
| 868 |
|
| Net income |
| $4,848 |
|
|
| $5,264 |
|
|
| $5,830 |
|
|
| $4,062 |
|
| Earnings per share, basic |
| $0.70 |
|
|
| $0.77 |
|
|
| $0.85 |
|
|
| $0.59 |
|
| Earnings per share, diluted |
| $0.69 |
|
|
| $0.75 |
|
|
| $0.84 |
|
|
| $0.58 |
|
| | | | | | | | |
| 2017 Quarter Ended | Dec. 31 |
| Sept. 30 |
| June 30 |
| March 31 |
| (In Thousands Except Per Share Amounts) |
|
| Total interest income |
| $15,232 |
|
|
| $15,519 |
|
|
| $14,892 |
|
|
| $14,465 |
|
| Total interest expense | 548 |
|
| 602 |
|
| 648 |
|
| 632 |
|
| Net interest income | 14,684 |
|
| 14,917 |
|
| 14,244 |
|
| 13,833 |
|
| Provision for loan losses | — |
|
| 2,500 |
|
| 300 |
|
| 400 |
|
| Other operating income | 7,952 |
|
| 13,855 |
|
| 9,762 |
|
| 8,905 |
|
| Compensation expense, RML acquisition payments | (193 | ) | | 149 |
| | — |
| | 174 |
|
| Other operating expense | 18,530 |
|
| 17,542 |
|
| 18,510 |
|
| 16,441 |
|
| Income before provision for income taxes | 4,299 |
|
| 8,581 |
|
| 5,196 |
|
| 5,723 |
|
| Provision for income taxes | 4,085 |
|
| 2,980 |
|
| 1,455 |
|
| 1,801 |
|
| Net Income | 214 |
|
| 5,601 |
|
| 3,741 |
|
| 3,922 |
|
| Less: Net income attributable to the noncontrolling interest | — |
|
| 78 |
|
| 152 |
|
| 97 |
|
| Net income attributable to Northrim Bancorp, Inc. |
| $214 |
|
|
| $5,523 |
|
|
| $3,589 |
|
|
| $3,825 |
|
| Earnings per share, basic |
| $0.03 |
|
|
| $0.80 |
|
|
| $0.52 |
|
|
| $0.55 |
|
| Earnings per share, diluted |
| $0.03 |
|
|
| $0.79 |
|
|
| $0.51 |
|
|
| $0.55 |
|
ITEM 9: CHANGES IN AND DISAGREEMENTS WITH ACCOUNTANTS OF ACCOUNTING AND FINANCIAL DISCLOSURE
None.
ITEM 9A. CONTROLS AND PROCEDURES
Conclusion Regarding the Effectiveness of Disclosure Controls and Procedures
As of the end of the period covered by this report, we evaluated the effectiveness of the design and operation of our disclosure controls and procedures (as such term is defined in Rules 13a-15(e) under the Securities Exchange Act of 1934). Our principal executive and financial officers supervised and participated in this evaluation. Based on this evaluation, our principal executive and financial officers each concluded that our disclosure controls and procedures were effective in timely alerting them to material information required to be included in our periodic reports to the SEC. The design of any system of controls is based in part upon various assumptions about the likelihood of future events, and there can be no assurance that any of our plans, products, services or procedures will succeed in achieving their intended goals under future conditions.
Changes in Internal Control
There were no changes in the Company’s internal controls over financial reporting (as defined in Rule 13a-15f and 15d-15(f) of the Securities Exchange Act of 1934) that occurred during the period covered by this report that have materially affected, or are likely to materially affect, the Company’s internal control over financial reporting.
Management’s Report on Internal Control Over Financial Reporting
Management of the Company is responsible for establishing and maintaining internal control over financial reporting as defined in Rules 13a-15(f) and 15(d)-15(f) of the Securities Exchange Act of 1934. The Company’s internal control over financial reporting is designed to provide reasonable assurance regarding the reliability of financial reporting and the preparation of financial statements for external purposes in accordance with generally accepted accounting principles. Internal control over financial reporting includes maintaining records that in reasonable detail accurately and fairly reflect our transactions; providing reasonable assurance that transactions are recorded as necessary for preparation of our financial statements; providing reasonable assurance that receipts and expenditures are made in accordance with management authorization; and providing reasonable assurance that unauthorized acquisition, use or disposition of Company assets that could have a material effect on our financial statements would be prevented or detected on a timely basis.
Because of its inherent limitations, internal control over financial reporting may not prevent or detect misstatements and can provide only reasonable assurance with respect to financial statement preparation and presentation. Also, projections of any evaluation of effectiveness to future periods are subject to the risk that controls may become inadequate because of changes in conditions, or that the degree of compliance with policies or procedures may deteriorate.
Management assessed the effectiveness of the Company’s internal control over financial reporting as of December 31, 2018.2021. In making this assessment management used the criteria set forth by the Committee of Sponsoring Organizations of the Treadway Commission in Internal Control – Integrated Framework.
Based on our assessment and the criteria discussed above, management believes that, as of December 31, 2018,2021, the Company maintained effective internal control over financial reporting.
The Company’s independent registered public accounting firm has issued an attestation report on the Company’s effectiveness of internal control over financial reporting. This report appears under Part II. Item 8.8 of this report.
ITEM 9B.OTHER INFORMATION
None.
ITEM 9C.DISCLOSURE REGARDING FOREIGN JURISDICTIONS THAT PREVENT INSPECTIONS.
None.
PART III
ITEM 10.DIRECTORS, EXECUTIVE OFFICERS AND CORPORATE GOVERNANCE
Information concerning the officers and directors of the Company required to be included in this item is incorporated by reference from the Company’s definitive proxy statement for its annual meeting of shareholders to be held in 20192022 which will be filed with the Securities and Exchange Commission (the "SEC") within 120 days of our most recently completed fiscal year.
ITEM 11.EXECUTIVE COMPENSATION
Information concerning executive compensation and director compensation and certain matters regarding participation in the Company’s compensation committee required by this item is incorporated by reference from the Company’s definitive proxy statement for its annual meeting of shareholders to be held in 20192022 which will be filed with the SEC within 120 days of our most recently completed fiscal year.
ITEM 12.SECURITY OWNERSHIP OF CERTAIN BENEFICIAL OWNERS AND MANAGEMENT AND RELATED STOCKHOLDER MATTERS
Information concerning the security ownership of certain beneficial owners and management required by this item is incorporated by reference from the Company’s definitive proxy statement for its annual meeting of shareholders to be held in 20192022 which will be filed with the SEC within 120 days of our most recently completed fiscal year.
ITEM 13.CERTAIN RELATIONSHIPS AND RELATED TRANSACTIONS, AND DIRECTOR INDEPENDENCE
Information concerning certain relationships and related transactions required by this item is incorporated by reference from the Company’s definitive proxy statement for its annual meeting of shareholders to be held in 20192022 which will be filed with the SEC within 120 days of our most recently completed fiscal year.
ITEM 14.PRINCIPAL ACCOUNTINGACCOUNTANT FEES AND SERVICES
Information concerning fees paid to our independent auditors required by this item is incorporated by reference from the Company’s definitive proxy statement for its annual meeting of shareholders to be held in 20192022 which will be filed with the SEC within 120 days of our most recently completed fiscal year.
PART IV
ITEM 15.EXHIBITS, AND FINANCIAL STATEMENT SCHEDULES
Financial Statements
(a) The following documents are filed as part of this Annual Report on Form 10-K:
Consolidated Balance Sheets as of December 31, 20182021 and 20172020
Consolidated Statements of Income for the years ended December 31, 2018, 2017,2021, 2020, and 20162019
Consolidated Statements of Comprehensive Income for the years ended December 31, 2018, 2017,2021, 2020, and 20162019
Consolidated Statements of Changes in Shareholders’ Equity for the years ended December 31, 2018, 2017,2021, 2020, and 20162019
Consolidated Statements of Cash Flows for the years ended December 31, 2018, 2017,2021, 2020, and 20162019
Notes to Consolidated Financial Statements
Exhibits
4.2 Pursuant to Item 601 (b)(4)(iii)(A) of Regulation S-K, copies of instruments defining rights of holders of long-term debt and preferred securities are not filed. The Company agrees to furnish a copy thereof to the SEC upon request.
|
| | | | |
| 101.INS | Inline XBRL Instance Document - the instance document does not appear in the Interactive Data File because its XBRL tags are embedded within the Inline XBRL document |
| 101.SCH | Inline XBRL Taxonomy Extension Schema Document |
| 101.CAL | Inline XBRL Taxonomy Extension Calculation Linkbase Document |
101.DEF101.LAB | Inline XBRL Taxonomy Extension Labels Linkbase Document |
| 101.PRE | Inline XBRL Taxonomy Extension Presentation Linkbase Document |
| 101.DEF | Inline XBRL Taxonomy Extension Definition Linkbase Document |
101.LAB104 | The cover page for the Company's Annual Report on 10-K for the year ended December 31, 2021 - formatted in Inline XBRL Labels Linkbase Document |
101.PRE | XBRL Presentation Linkbase Document(included in Exhibit 101) |
Notes to Exhibits List:
Attached as Exhibit 101 to this report are the following formatted in XBRL (Extensible Business Reporting Language): (i) Consolidated Balance Sheet at December 31, 2018 and 2017, (ii) Consolidated Statements of Income for the years ended December 31, 2018, 2017, and 2016, (iii) Consolidated Statements of Comprehensive Income for the years ended December 31, 2018, 2017, and 2016, (iv) Consolidated Statements of Shareholders’ Equity for the years ended December 31, 2018, 2017, and 2016, (v) Consolidated Statements of Cash Flows for the years ended December 31, 2018, 2017, and 2016, and (vi) Notes to the Consolidated Financial Statements. In accordance with Rule 406T of Regulation S-T, the XBRL related information in Exhibit 101 to this Quarterly Report on FormITEM 16.FORM 10-K shall not be deemed to be “filed” for purposes of Section 18 of the Exchange Act, or otherwise subject to the liability of that section, and shall not be part of any registration statement or other document filed under the Securities Act or the Exchange Act, except as shall be expressly set forth by specific reference in such filing.SUMMARY
Not applicable.
Annual Report on Form 10-K
Annual Report Under Section 13 of the Securities Exchange Act of 1934 for the fiscal year ended December 31, 2018.2021.
Commission File Number 0-33501
Northrim BanCorp, Inc.
State of Incorporation: Alaska
Employer ID Number: 92-0175752
3111 C Street
Anchorage, Alaska 99503
Telephone Number: (907) 562-0062
Securities Registered Pursuant to Section 12(b) of the Act: None
Securities Registered Pursuant to Section 12(g) of the Act: Common Stock, $1.00 Par Value
Northrim BanCorp, Inc. has filed all reports required to be filed by Section 13 of the Securities and Exchange Act of 1934 during the preceding 12 months and has been subject to such filing requirements for the past 90 days.
Northrim BanCorp, Inc. is an accelerated filer and a smaller reporting company within the meaning of Rule 12b-2 promulgated under the Securities Exchange Act.
Northrim BanCorp, Inc. is not a well-known seasoned issuer, as defined in Rule 405 of the Securities Act.
Northrim BanCorp, Inc. is required to file reports pursuant to Section 13 of the Securities Exchange Act.
Northrim BanCorp, Inc. is not a shell company (as defined in Rule 12b-2 of the Securities Exchange Act).
Disclosure of delinquent filers pursuant to Item 405 of Regulation S-K (17 C.F.R. 229.405) is in our definitive proxy statement, which is incorporated by reference in Part III of this Form 10-K.
The aggregate market value of common stock held by non-affiliates of Northrim BanCorp, Inc. at June 30, 2018,2021, was $267,274,985.$258,025,106.
The number of shares of Northrim BanCorp Inc.’s common stock outstanding at March 12, 2019,4, 2022, was 6,879,902.5,941,885.
This Annual Report on Form 10-K incorporates into a single document the requirements of the accounting profession and the SEC. Only those sections of the Annual Report required in the following cross reference index and the information under the caption “Forward Looking Statements” are incorporated into this Form 10-K.
Signatures
Pursuant to the requirements of Section 13 or 15(d) of the Securities Exchange Act of 1934, the registrant has duly caused this report to be signed on its behalf by the undersigned, thereunto duly authorized, on March 12, 2019.4, 2022.
Northrim BanCorp, Inc.
|
| | | | | | | |
| By | /s/ Joseph M. Schierhorn |
|
| Joseph M. Schierhorn |
|
| Chairman, President and Chief Executive Officer |
Pursuant to the requirements of the Securities Exchange Act of 1934, this report has been signed below by the following persons on behalf of the registrant and in the capacities indicated, on March 12, 2019.4, 2022.
Principal Executive Officer:
|
| | | | | | | |
| By | /s/ Joseph M. Schierhorn |
|
| Joseph M. Schierhorn |
|
| Chairman, President and Chief Executive Officer |
Principal Financial Officer and Principal Accounting Officer:
|
| | | | | | | |
| By | /s/ Jed W. Ballard |
| | Jed W. Ballard |
| | Executive Vice President, Chief Financial Officer |
Joseph M. Schierhorn,Jed W. Ballard, pursuant to the power of attorney filed with this Annual Report on Form 10-K as Exhibit 24.1, has signed this report on March 12, 2019,4, 2022, as attorney-in-fact for the following directors who constitute a majority of the Board of Directors.
|
| | | | |
| Joseph M. Schierhorn | David J. McCambridge |
| Larry S. Cash | Krystal M. Nelson |
| Anthony Drabek | John C. Swalling |
| Karl L. Hanneman | Linda C. Thomas |
| David W. Karp | David G. Wight |
| Aaron Schutt | Joseph Marushack |
|
| | | | | | | |
| By | /s/ Joseph M. SchierhornJed W. Ballard |
| | Joseph M. SchierhornJed W. Ballard |
| | as Attorney-in-fact |
| | March 12, 20194, 2022 |
Investor Information
Annual Meeting
|
| | | | |
| Date: | Thursday, May 23, 201926, 2022 |
| Time: | 9 a.m. |
| Location: | Hilton Anchorage HotelLive Webcast |
| 500 West Third Avenue |
| Anchorage, AK 99501 www.virtualshareholdermeeting.com/NRIM2022 |
Stock Symbol
Northrim BanCorp, Inc.’s stock is traded on the Nasdaq Global Select Stock Market under the symbol, NRIM.
Auditor
Moss Adams LLP
Transfer Agent and Registrar
American Stock Transfer & Trust Company: 1-800-937-5449 info@amstock.com
Legal Counsel
Accretive Legal, PLLC
Davis Wright Tremaine LLP
Information Requests
Below are options for obtaining Northrim’s investor information:
•Visit our home page, www.northrim.com, and click on the “About Northrim” and then "Investor Relations" for stock information and copies of earnings and dividend releases.
•If you would like to have investor information mailed to you, please call our Corporate Secretary at (907) 562-0062.
Written requests should be mailed to the following address:
Corporate Secretary
Northrim Bank
P.O. Box 241489
Anchorage, Alaska 99524-1489
Telephone: (907) 562-0062
Fax: (907) 562-1758
Web site: http://www.northrim.com