Customers. Film Products sells to many branded product producers throughout the world. Its largest customer is The Procter & Gamble Company (“P&G”). Net sales to P&G totaled $226 million in 2004, $207 million in 2003 and $243 million in 2002 (these amounts include film sold to third parties that converted the film into materials used in products manufactured by P&G).
P&G and Tredegar have had a successful long-term relationship based on cooperation, product innovation and continuous process improvement. The loss or significant reduction in sales associated with P&G would have a material adverse effect on our business.
Research and Development and Intellectual Property. Film Products has technical centers in Richmond, Virginia; Terre Haute, Indiana; Chieti, Italy; and Shanghai, China; and holds 189 issued patents (73 of which are issued in the U.S.) and 110 trademarks (10 of which are issued in the U.S.). Expenditures for research and development (“R&D”) have averaged $7.4 million annually over the past three years. Aluminum Extrusions
The William L. Bonnell Company, Inc. and its subsidiaries (together, "Aluminum Extrusions") produce soft-alloy aluminum extrusions primarily for building and construction, distribution, transportation, machinery and equipment, electrical and consumer durables markets.
Aluminum Extrusions manufactures mill (unfinished), anodized (coated) and painted aluminum extrusions for sale directly to fabricators and distributors that use our extrusions to produce window components, curtain walls and storefronts, tub and shower doors, industrial and agricultural machinery and equipment, ladders, bus bars, automotive parts, snowmobiles and tractor-trailer shapes, among other products. Sales are made primarily in the United States and Canada, principally east of the Rocky Mountains. Aluminum Extrusions competes primarily on the basis of product quality, service and price.
Aluminum Extrusions sales volume by market segment over the last three years is shown below:
| | | | | | by Market Segment | | | | | 2006 | | 2005 | | 2004 | | | Building and construction: | | | | | | | | | Commercial | | | 48 | | | 44 | | | 41 | | | Residential | | | 14 | | | 18 | | | 21 | | | Distribution | | | 19 | | | 16 | | | 13 | | | Transportation | | | 9 | | | 9 | | | 10 | | | Machinery and equipment | | | 5 | | | 6 | | | 7 | | | Electrical | | | 3 | | | 4 | | | 5 | | | Consumer durables | | | 2 | | | 3 | | | 3 | | | Total | | | 100 | | | 100 | | | 100 | |
Raw Materials. The primary raw materials used by Aluminum Extrusions consist of aluminum ingot, aluminum scrap and various alloys, which are purchased from domestic and foreign producers in open-market purchases and under short-term contracts. We believe there will be an adequate supply of aluminum and other required raw materials and supplies in the immediate future.
Intellectual Property. Aluminum Extrusions holds two U.S. patents and two U.S. trademarks.
General
Patents, Licenses and Trademarks. Tredegar considers patents, licenses and trademarks to be of significance for Film Products. We routinely apply for patents on significant developments in this business. Our patents have remaining terms ranging from 1 to 19 years. We also have licenses under patents owned by third parties.
Research and Development. Tredegar’s spending for R&D activities in 2006, 2005 and 2004 was related to Film Products and AFBS, Inc. (formerly known as Therics, Inc.). R&D spending at Film Products was approximately $8.1 million in 2006, $6.6 million in 2005 and $7.5 million in 2004.
On June 30, 2005, substantially all of the assets of AFBS, a wholly-owned subsidiary of Tredegar, were sold or assigned to a newly-created limited liability company, Therics, LLC, controlled and managed by an individual not affiliated with Tredegar. AFBS received a 17.5% equity interest in Therics, LLC, valued at $170,000 and a 3.5% interest in Theken Spine, LLC, valued at $800,000, along with potential future payments based on the sale of certain products by Therics, LLC. AFBS had operating losses of $3.5 million during the first six months of 2005 and $9.8 million in 2004. There was no R&D spending at AFBS in 2006. R&D spending at AFBS was approximately $2.4 million in 2005 and $7.8 million in 2004.
Backlog. Backlogs are not material to our operations.
Government Regulation. Laws concerning the environment that affect or could affect our domestic operations include, among others, the Clean Water Act, the Clean Air Act, the Resource Conservation Recovery Act, the Occupational Safety and Health Act, the National Environmental Policy Act, the Toxic Substances Control Act, the Comprehensive Environmental Response, Compensation and Liability Act ("CERCLA"), as amended, regulations promulgated under these acts, and any other federal, state or local laws or regulations governing environmental matters. We believe that we are in substantial compliance with all applicable laws, regulations and permits. In order to maintain substantial compliance with such standards, we may be required to incur expenditures, the amounts and timing of which are not presently determinable but which could be significant, in constructing new facilities or in modifying existing facilities.
Employees. Tredegar employed approximately 3,000 people at December 31, 2006.
Available Information and Corporate Governance Documents. Our Internet address is www.tredegar.com. We make available, free of charge through our website, our annual report on Form 10-K, quarterly reports on Form 10-Q, current reports on Form 8-K and amendments to those reports filed or furnished pursuant to Section 13(a) or 15(d) of the Securities Exchange Act of 1934, as amended, as soon as reasonably practicable after such documents are electronically filed with, or furnished to, the SEC. Information filed electronically with the SEC can be accessed on its website at www.sec.gov. In addition, our Corporate Governance Guidelines, Code of Conduct and the charters of our Audit, Executive Compensation and Nominating and Governance Committees are available on our website and are available in print, without charge, to any shareholder upon request by contacting Tredegar’s Corporate Secretary at 1100 Boulders Parkway, Richmond, Virginia 23225. The information on our website is not, and shall not be deemed to be, a part of this report or incorporated into other filings we make with the SEC.
There are a number of risks and uncertainties that can have a material effect on the operating results of our businesses and our financial condition. These risk factors include, but are not limited to, the following:
General
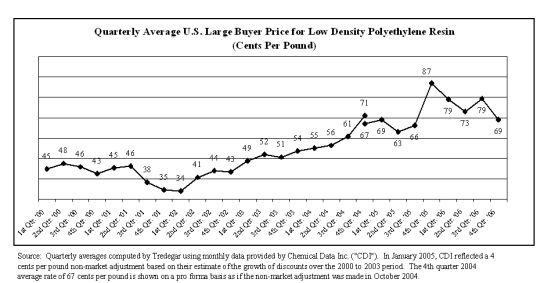
| · | Our future performance is influenced by costs incurred by our operating companies including, for example, the cost of energy and raw materials. These costs include, without limitation, the cost of resin (the raw material on which Film Products primarily depends), aluminum (the raw material on which Aluminum Extrusions primarily depends), natural gas (the principal fuel necessary for Aluminum Extrusions’ plants to operate), electricity and diesel fuel. Resin, aluminum and natural gas prices have risen significantly, and may continue to do so in the future. Tredegar attempts to mitigate the effects of increased costs through price increases and contractual pass-through provisions, but there are no assurances that higher prices can effectively be passed through to our customers or that we will be able to offset fully or on a timely basis the effects of higher raw material costs through price increases or pass-through arrangements. Further, there is no assurance that cost control efforts will be sufficient to offset any additional future declines in revenue or increases in energy, raw material or other costs. |
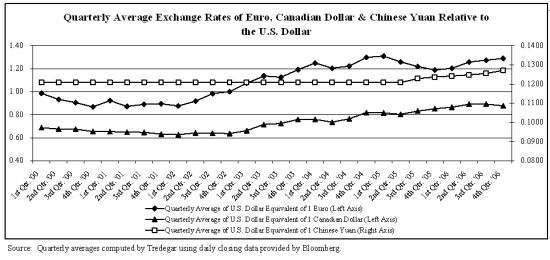
| · | Our substantial international operations subject us to risks of doing business in foreign countries, which could adversely affect our business, financial condition and results of operations. Risks inherent in international operations include the following, by way of example: changes in general economic conditions, potential difficulty enforcing agreements and intellectual property rights, staffing and managing widespread operations, restrictions on foreign trade or investment, restrictions on the repatriation of income, fluctuations in exchange rates, imposition of additional taxes on our foreign income, nationalization of private enterprises and unexpected adverse changes in foreign laws and regulatory requirements. |
| · | Non-compliance with any of the covenants in our $300 million credit facility could result in all outstanding debt under the agreement becoming due, which could have an adverse effect on our financial condition or liquidity. The credit agreement governing our credit facility contains restrictions and financial covenants that could restrict our financial flexibility. Our failure to comply with these covenants could result in an event of default, which if not cured or waived, could have an adverse effect on our financial condition and liquidity. |
Film Products
| · | Film Products is highly dependent on sales associated with one customer, P&G. P&G comprised approximately 23% of Tredegar Corporation’s net sales in 2006, 25% in 2005 and 27% in 2004. The loss or significant reduction of sales associated with P&G would have a material adverse effect on our business.Research Other P&G-related factors that could adversely affect our business include, by way of example, (i) failure by P&G to achieve success or maintain share in markets in which P&G sells products containing our materials, (ii) operational decisions by P&G that result in component substitution, inventory reductions and Developmentsimilar changes and Intellectual Property.(iii) delays in P&G rolling out products utilizing new technologies developed by Tredegar. While we have undertaken efforts to expand our customer base, there can be no assurance that such efforts will be successful, or that they will offset any delay or loss of sales and profits associated with P&G.
|
| · | Growth of Film Products has technical centers in Terre Haute, Indiana; Lake Zurich, Illinois; Chieti, Italy;depends on our ability to develop and Shanghai, China; and holds 220 issued patents (75 of which are issueddeliver new products at competitive prices, especially in the U.S.)personal care market. Personal care products are now being made with a variety of new materials and 103 trademarks (5the overall cycle for changing materials has accelerated. While we have substantial technical resources, there can be no assurance that our new products can be brought to market successfully, or if brought to market successfully, at the same level of which are issuedprofitability and market share of replaced films. A shift in customer preferences away from our technologies, our inability to develop and deliver new profitable products, or delayed acceptance of our new products in domestic or foreign markets, could have a material adverse effect on our business. In the long term, growth will depend on our ability to provide innovative materials at a cost that meets our customers’ needs. |
| · | Continued growth in Film Products' sale of high value protective film products is not assured.A shift in our customers' preference to new or different products could have a material adverse effect on our sale of protective films. Similarly, a decline in consumer demand for notebook computers or liquid crystal display (LCD) monitors or a decline in the U.S.). Expenditures for researchrate of growth in purchases of LCD televisions could have a significant negative impact on protective film sales. |
| · | Our inability to protect our intellectual property rights or our infringement of the intellectual property rights of others could have a significant adverse impact on Film Products. Film Products operates in a field where our significant customers and development (“R&D”)competitors have averaged $7.6 million per year oversubstantial intellectual property portfolios. The continued success of this business depends on our ability not only to protect our own technologies and trade secrets, but also to develop and sell new products that do not infringe upon existing patents or threaten existing customer relationships. An unfavorable outcome in any intellectual property litigation or similar proceeding could have a significant adverse impact on Film Products. |
| · | As Film Products expands its personal care business, we have greater credit risk that is inherent in broadening our customer base. |
Aluminum Extrusions
| · | Sales volume and profitability of Aluminum Extrusions is cyclical and highly dependent on economic conditions of end-use markets in the past three years.United States and Canada, particularly in the construction, distribution and transportation industries. Our market segments are also subject to seasonal slowdowns during the winter months. On September 13, 2004, we announced that Because of the high degree of operating leverage inherent in our technical centersoperations (generally constant fixed costs until full capacity utilization is achieved), the percentage drop in Terre Haute, Indiana and Lake Zurich, Illinois would be moved to Richmond, Virginia, whereoperating profits in a substantial portion of Film Products’ marketing, sales and senior management are located. We expectcyclical downturn will likely exceed the move to be completed by the end of 2005. The technical facilitypercentage drop in Terre Haute will continue to operate at reduced staffing levels. Technical operations at the plant in Lake Zurich will be discontinued. The centralized location of R&D, marketing, sales and senior management should help improve product development time and reduce expenses. Pretax cash expendituresvolume. Any benefits associated with cost reductions and productivity improvements may not be sufficient to offset the restructuringadverse effects on profitability from pricing and margin pressure and higher bad debts that usually accompany a downturn. In addition, higher energy costs and the appreciation of the U.S. Dollar equivalent value of the Canadian Dollar can further reduce profits unless offset by price increases or cost reductions and productivity improvements.
|
| · | The markets for our products are expected of approximately $8 million (consisting primarily of severance, relocationhighly competitive with product quality, service, delivery performance and hiring expenses, leasehold improvements and equipment costs). Once complete,price being the restructuring is expected to reduce annual operating expenses by approximately $2 million and resultprincipal competitive factors. Aluminum Extrusions has around 1,800 customers in a net reductionvariety of approximately 20 positions.Aluminum Extrusions
The William L. Bonnell Company, Inc. and its subsidiaries (together, “Aluminum Extrusions”) produce soft-alloy aluminum extrusions primarily forend-use markets within the broad categories of building and construction, distribution, transportation, machinery and equipment, electrical and consumer durablesdurables. No single customer exceeds 4% of Aluminum Extrusion’s net sales. Due to the diverse customer mix across many end-use markets, we believe the industry generally tracks the real growth of the overall economy (historical cross-cycle volume growth has been in the 3% range).
|
| During improving economic conditions, excess industry capacity is absorbed and pricing pressure becomes less of a factor in many of our end-use markets. Conversely, during an economic slowdown, excess industry capacity often drives increased pricing pressure in many end-use markets as competitors protect their position with key customers. Because the business is susceptible to these changing economic conditions, Aluminum Extrusions manufactures mill (unfinished), anodized (coated) and painted aluminum extrusions for sale directlytargets complex, customized, service-intensive business with more challenging requirements which is competitively more defensible compared to fabricators and distributors that use our extrusions to produce window components, curtain walls and storefronts, tub and shower doors, industrial and agricultural machinery and equipment, ladders, bus bars, automotive parts, snowmobiles and tractor-trailer shapes, among other products. Sales are madehigher volume, standard extrusion applications. |
| Foreign imports, primarily in the United States and Canada, principally eastfrom China, represent a growing portion of the Rocky Mountains. Aluminum Extrusions competesNorth American aluminum extrusion market. Foreign competition to date has been primarily on the basislarge volume, standard extrusion profiles that impact some of product quality, service and price. Aluminum Extrusions sales volume by market segment over the last two years is shown below:
our less strategic end-use markets. Market share erosion in other end-use markets remains possible. |
| |
| |
|---|
| | % of Aluminum Extrusions Sales Volume
by Market Segment | |
|---|
| |
| |
|---|
| | | 2004 | | 2003 | |
|---|
| | |
| |
| | | | Building and construction: | | | | | | | | | Commercial | | 41 | | | 39 | | | | Residential | | 21 | | | 23 | | | | Distribution | | 13 | | | 14 | | | | Transportation | | 10 | | | 10 | | | | Machinery and equipment | | 7 | | | 6 | | | | Electrical | | 5 | | | 5 | | | | Consumer durables | | 3 | | | 3 | | | |
| |
|---|
| | Total | | 100 | | | 100 | | | |
| |
|---|
Raw Materials. The primary raw materials used by Aluminum Extrusions consist of aluminum ingot, aluminum scrap and various alloys, which are purchased from domestic and foreign producers in open-market purchases and under short-term contracts. We believe thereThere can be no assurance that we will be an adequate supply of aluminum and other required raw materials and supplies in the immediate future.
Intellectual Property. Aluminum Extrusions holds two U.S. patents and three U.S. trademarks.
Therics
Located in Princeton, New Jersey, Therics currently employs 32 people. Therics began developing tissue-engineered products in 1996. Its primary focus is on commercializing products made from the TheriForm® process, a unique microfabrication technology used to create scaffolds in a variety of shapes and forms with precise internal architecture that permits tissue in-growth.
�� Therics’ initial synthetic bone graft implants, which have received clearance from the U.S. Food and Drug Administration (the “FDA”), are made from beta-tricalcium phosphate (“b -TCP”). b -TCP has proven effective as a reliable bone substitute in a variety of orthopaedic and neurosurgical applications. We believe there will be adequate supply of b -TCP in the immediate future.
Therics introduced its initial line of implants used in bone grafting procedures in 2004. The initial feedback from orthopaedic surgeons, neurosurgeons and others in the marketplace has generally been positive. Therics is working with selected surgeons and using patient-based case studies to improve existing products and develop more advanced product line extensions. Therics currently distributes through a network of independent distributors and is presently considering potential research and marketing collaborations with a variety of orthopaedic companies in an effort to broaden its scope and reach.
According to Knowledge Enterprises, Inc. (The Worldwide Orthopaedic Market, 2003-2004), global sales for the orthobiologics market, which includes bone graft substitutes, allograft distribution/processing, autogenous bone and soft tissue replacement products, growth factors and viscoelastics, were $1.37 billion in 2003 (a 29% increase over 2002) and one of the fastest growing segments in the orthopaedics industry.
Therics relies on a combination of patent, trademark, copyright and trade secret laws to protect the company’s proprietary technologies and products. Therics owns or holds exclusive rights to 36 issued patents (34 of which are issued in the U.S.) and has two U.S. trademarks. Therics has more than 34 U.S. and foreign patent applications pending and nine trademark applications pending. Therics spent approximately $7.8 million in 2004, $11.2 million in 2003 and $12.5 million in 2002 on R&D activities.
Therics had revenues of $380,000 and an operating loss of $9.8 million in 2004, no revenues and an operating loss of $11.7 million in 2003 and revenues of $208,000 and an operating loss of $13.1 million in 2002. Revenues in 2004 relate to the sale of Therics’ initial line of implants used in bone grafting procedures. Revenues recognized by Therics prior to 2004 relate entirely to payments received for R&D support. As of December 31, 2004, Tredegar had invested approximately $74 million in Therics compared with $65 million as of December 31, 2003. Therics’ identifiable assets included in Tredegar’s consolidated balance sheet were $8.6 million at December 31, 2004, including goodwill and intangible assets of $4.4 million. Therics also has future rental commitments under noncancelable operating leases through 2011 totaling $9.7 million at December 31, 2004, with partially offsetting sublease rental commitments relating to excess space totaling about $1 million.
|
General
Patents, Licenses and Trademarks. Tredegar considers patents, licenses and trademarks to be of significance for Film Products and Therics. We routinely apply for patents on significant developments in each of these businesses. Our patents have remaining terms ranging from 1 to 17 years. We also have licenses under patents owned by third parties.
Research and Development. Tredegar spent approximately $15.3 million in 2004, $18.8 million in 2003 and $20.3 million in 2002 on R&D activities related to continuing operations.
Backlog. Backlogs are not material to our operations.
Government Regulation. Laws concerning the environment that affect or could affect our domestic operations include, among others, the Clean Water Act, the Clean Air Act, the Resource Conservation Recovery Act, the Occupational Safety and Health Act, the National Environmental Policy Act, the Toxic Substances Control Act, the Comprehensive Environmental Response, Compensation and Liability Act (“CERCLA”), as amended, regulations promulgated under these acts, and any other federal, state or local laws or regulations governing environmental matters. We believe that we are in substantial compliance with all applicable laws, regulations and permits. In orderable to maintain substantial compliance with such standards, we may be required to incur expenditures, the amountscurrent margins and timing of which are not presently determinable but which could be significant, in constructing new facilities or in modifying existing facilities.
Employees. Tredegar employed approximately 3,100 people at December 31, 2004.
Available Informationprofitability. Our continued success and Corporate Governance Documents. Our Internet address is www.tredegar.com. We make available, free of charge through our web site, our annual report on Form 10-K, quarterly reports on Form 10-Q, current reports on Form 8-K and amendments to those reports filed or furnished pursuant to Section 13(a) or 15(d) of the Securities Exchange Act of 1934, as amended, as soon as reasonably practicable after such documents are electronically filed with, or furnished to, the SEC. In addition, our Corporate Governance Guidelines, Code of Conduct and the charters of our Audit, Executive Compensation and Nominating and Governance Committees are availableprospects depend on our web siteability to retain existing customers and are availableparticipate in print, without charge, to any shareholder upon request by contacting Tredegar’s Corporate Secretary at 1100 Boulders Parkway, Richmond, Virginia 23225. The information on our website is not, and shall not be deemed to be, a part of this report or incorporated into other filings we make with the SEC.overall industry cross-cycle growth.
|
| UNRESOLVED STAFF COMMENTS |
None.
| PROPERTIESGeneral
Most of the improved real property and the other assets used in our operations are owned, and none of the owned property is subject to an encumbrance that is material to our consolidated operations. We consider the plants, warehouses and other properties and assets owned or leased by us to be in generally good condition.
We believe that the capacity of our plants is adequate to meet our immediate needs. Our plants generally have operated at 50-95% of capacity. Our corporate headquarters, which is leased, is located at 1100 Boulders Parkway, Richmond, Virginia 23225.
|
General
Most of the improved real property and the other assets used in our operations are owned, and none of the owned property is subject to an encumbrance that is material to our consolidated operations. We consider the plants, warehouses and other properties and assets owned or leased by us to be in generally good condition.
We believe that the capacity of our plants is adequate to meet our immediate needs. Our plants generally have operated at 50-95% of capacity. Our corporate headquarters, which is leased, is located at 1100 Boulders Parkway, Richmond, Virginia 23225.
Our principal plants and facilities are listed below:
Our principal plants and facilities are listed below:
| |
Film Products |
| Principal Operations | | Locations in the United States Lake Zurich, Illinois Pottsville, Pennsylvania Red Springs, North Carolina (leased) Richmond, Virginia (technical center) (leased) Terre Haute, Indiana (technical center and production facility) | | Locations in Foreign Countries | | LaGrange, Georgia(1)
Lake Zurich, Illinois (technical
center & production
facility)(2)
Pottsville, Pennsylvania
Terre Haute, Indiana
(technical center &
production facility) (2) | Chieti, Italy (technical center)
Guangzhou, China
Kerkrade, The Netherlands
Rétság, Hungary
Roccamontepiano, Italy
São Paulo, Brazil
Shanghai, China | | Principal Operations Production of plastic films
nonwovens and laminate materials |
Aluminum Extrusions |
| Principal Operations | | Locations in the United States Carthage, Tennessee Kentland, Indiana Newnan, Georgia | | Locations in Canada | | Carthage, Tennessee
Kentland, Indiana
Newnan, Georgia | Aurora, Ontario(3)
Pickering, Ontario
Richmond Hill, Ontario
Ste Thérèse, Québec
Woodbridge, Ontario (leased) | | Principal Operations Production of aluminum extrusions, fabrication and finishing |
———————————————— | | On January 10, 2005, we announced that we are exploring the sale of the Film Products’ plant in LaGrange, Georgia. This plant produces blown films used for adult incontinent and baby diaper backsheet, feminine hygiene pad pouch packaging, and other packaging and industrial applications. Annual revenues for the products that would be included in a sale are about $25 million. The proposed transaction is not expected to have a material impact on our financial results. | | | (2)
| On September 13, 2004, we announced that our technical centers in Terre Haute, Indiana and Lake Zurich, Illinois would be moved to Richmond, Virginia, where a substantial portion of Film Products’ marketing, sales and senior management are located. More information on this restructuring is provided on page 2. | | | (3) | On April 13, 2004, we announced that the aluminum extrusions plant in Aurora, Ontario would be closed and that its business would be transferred to other extrusion facilities in Ontario. We expect the plant to close in the first quarter of 2005. The shutdown plan includes moving the Aurora plant’s largest press to the plant in Pickering, Ontario, and investing $8 million to upgrade the press and enlarge the facility. This consolidation is expected to reduce annual operating costs by approximately $2 million. |
| Therics
Therics leases space in Princeton, New Jersey.
Item 3. LEGAL PROCEEDINGS
A consent order was entered into by the Environmental Protection Division, Department of Natural Resources, State of Georgia and The William L. Bonnell Company relating to alleged violations of the conditions and limitations contained in the National Pollutant Discharge Elimination System Permit No. GA0000507 (the “Permit”) for our wastewater treatment facility in Newnan, Georgia. The consent order was in effect through December 31, 2003. We agreed to pay penalties until the Permit issues associated with our wastewater treatment facility were resolved. We believe that the issues have been resolved and have made aggregate payments of $160,000 under the consent order.
|
On June 23, 2005, the United States Environmental Protection Agency, Region 4 (“EPA”), issued an Administrative Order (Docket No. CAA-04-2005-1838, the “Order”) under the Clean Air Act (as amended from time to time, the “Act”) alleging certain violations by Aluminum Extrusions’ Carthage, Tennessee facility of the refrigerant management regulations promulgated pursuant to the Act. The Order alleged that the violations occurred primarily in 2002 and 2003.
The Order required Aluminum Extrusions to either replace the cooling system at issue or retrofit it with an EPA approved non-ozone depleting substance. The Order further required Aluminum Extrusions to comply with certain applicable provisions of the Act and to provide certified documentation verifying compliance with the Order. Aluminum Extrusions was required to comply with all terms of the Order within 180 days from issuance.
Aluminum Extrusions fulfilled all obligations imposed by the Order during 2005, and reported that fact in a letter to the EPA dated October 25, 2005. Although Aluminum Extrusions has not admitted any violations to the EPA pursuant to the Order, Aluminum Extrusions elected to replace the affected cooling system and incurred related replacement costs of approximately $110,000.
Pursuant to a Consent Agreement and Final Order (“CAFO”) that became effective May 9, 2006, Aluminum Extrusions (i) paid a civil penalty of $30,422 and (ii) undertook a supplemental environmental project ("SEP") in an amount of at least $208,170 ("Minimum SEP Expenditure"). The CAFO requires that the SEP be fully implemented within one year of the CAFO's effective date. On July 6, 2006, Aluminum Extrusions completed the SEP at a cost of $296,432. Management sent a report to the EPA in the fourth quarter of 2006 indicating that it believes that the SEP was completed in a satisfactory and timely manner. If, however, the EPA rules that the SEP was not completed satisfactorily or failed to spend at least the Minimum SEP Expenditure, Aluminum Extrusions could be responsible under the CAFO for additional penalties of up to $91,000.
| SUBMISSION OF MATTERS TO A VOTE OF SECURITY HOLDERS None.
|
None.
Item 5. | MARKET FOR TREDEGAR’S COMMON EQUITY, RELATED STOCKHOLDER MATTERS AND ISSUER PURCHASES OF EQUITY SECURITIES |
Market Prices of Common Stock and Shareholder Data
Our common stock is traded on the New York Stock Exchange (“NYSE”) under the ticker symbol TG. We have no preferred stock outstanding. There were 39,286,079 shares of common stock held by 3,482 shareholders of record on December 31, 2006. The following table shows the reported high and low closing prices of our common stock by quarter for the past two years.
| | | | | | | | | 2006 | | 2005 | | | | | High | | Low | | High | | Low | | | First quarter | | $ | 16.65 | | $ | 13.06 | | $ | 20.19 | | $ | 16.08 | | | Second quarter | | | 16.89 | | | 13.84 | | | 17.56 | | | 14.52 | | | Third quarter | | | 16.94 | | | 14.39 | | | 16.67 | | | 12.09 | | | Fourth quarter | | | 23.32 | | | 16.31 | | | 13.16 | | | 11.76 | |
The closing price of our common stock on February 20, 2007 was $23.86.
Dividend Information
We have paid a dividend every quarter since becoming a public company in July 1989. During 2006, 2005 and 2004, our quarterly dividend was 4 cents per share. All decisions with respect to the declaration and payment of dividends will be made by the Board of Directors in its sole discretion based upon earnings, financial condition, anticipated cash needs, restrictions in our credit agreement and such other considerations as the Board deems relevant. See Note 8 beginning on page 59 for the restrictions contained in our credit agreement related to minimum shareholders’ equity required and aggregate dividends permitted.
Issuer Purchases of Equity Securities
During 2006, 2005 and 2004, we did not purchase any shares of our common stock in the open market. Under a standing authorization from our board of directors announced on August 8, 2006, we may purchase up to 5 million shares in the open market or in privately negotiated transactions at prices management deems appropriate.
Annual Meeting
Our annual meeting of shareholders will be held on May 17, 2007, beginning at 9:00 a.m. EDT at Lewis Ginter Botanical Garden, 1800 Lakeside Avenue, Richmond, Virginia, 23229. We expect to mail formal notice of the annual meeting, proxies and proxy statements to shareholders on or about March 28, 2007.
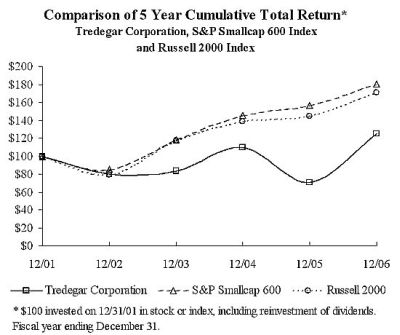
Comparative Tredegar Common Stock Performance
The following graph compares cumulative total shareholder returns for Tredegar, the S&P 600 Stock Index (an index comprised of companies with market capitalizations similar to Tredegar) and the Russell 2000 Index for the five years ended December 31, 2006. Tredegar is part of both the S&P SmallCap 600 Index and Russell 2000 Index. Inquiries
Inquiries concerning stock transfers, dividends, dividend reinvestment, consolidating accounts, changes of address, or lost or stolen stock certificates should be directed to:
National City Bank Dept. 5352 Corporate Trust Operations P.O. Box 92301 Cleveland, Ohio 44101-4301 Phone: 800-622-6757 E-mail: shareholder.inquiries@nationalcity.com All other inquiries should be directed to:
Tredegar Corporation Investor Relations Department 1100 Boulders Parkway Richmond, Virginia 23225 Phone: 800-411-7441 E-mail: invest@tredegar.com Web site: www.tredegar.com
Quarterly Information
We do not generate or distribute quarterly reports to shareholders. Information on quarterly results can be obtained from our website. In addition, we file quarterly, annual and other information electronically with the SEC, which can be accessed on its website at www.sec.gov.
| Market Prices of Common Stock and Shareholder Data Our common stock is traded on the New York Stock Exchange (“NYSE”) under the ticker symbol TG. We have no preferred stock outstanding. There were 38,597,522 shares of common stock held by 4,146 shareholders of record on December 31, 2004.
The following table shows the reported high and low closing prices of our common stock by quarter for the past two years.
|
| |
|---|
| | 2004 | | 2003 | |
|---|
| |
| |
| |
|---|
| High | | Low | | High | | Low | |
|---|
| |
| |
| |
| |
| | | First quarter | $ | 17.80 | | $ | 13.20 | | $ | 15.08 | | $ | 10.60 | | | | | | | | Second quarter | | 16.13 | | | 13.00 | | | 15.67 | | | 11.96 | | | | | | | | Third quarter | | 18.38 | | | 14.75 | | | 16.76 | | | 14.03 | | | | | | | | Fourth quarter | | 20.25 | | | 16.68 | | | 16.52 | | | 14.62 | |
| |
We have paid a dividend every quarter since becoming a public company in July 1989. During 2002, 2003 and 2004, our quarterly dividend was 4 cents per share. |
| All decisions with respect to payment of dividends will be made by the Board of Directors based upon earnings, financial condition, anticipated cash needs and such other considerations as the Board deems relevant. See Note 8 beginning on page 60 for minimum shareholders’ equity required and aggregate dividends permitted.
Issuer Purchases of Equity Securities
During 2004, we did not purchase any shares of our common stock in the open market. During 2003, we purchased 406,400 shares of our common stock in the open market for $5.2 million (an average price of $12.72 per share). During 2002, we purchased 110,700 shares of our common stock in the open market for $1.4 million (an average price of $12.91 per share). Under a standing authorization from our board of directors, we may purchase an additional 3.4 million shares in the open market or in privately negotiated transactions at prices management deems appropriate.
Annual Meeting
Our annual meeting of shareholders will be held on April 28, 2005, beginning at 9:30 a.m. EDT at the University of Richmond’s Jepson Alumni Center in Richmond, Virginia. We expect to mail formal notice of the annual meeting, proxies and proxy statements to shareholders on or about March 25, 2005.
|
Inquiries
Inquiries concerning stock transfers, dividends, dividend reinvestment, consolidating accounts, changes of address, or lost or stolen stock certificates should be directed to:
National City Bank
Dept. 5352
Corporate Trust Operations
P.O. Box 92301
Cleveland, Ohio 44193-0900
Phone: 800-622-6757
E-mail: shareholder.inquiries@nationalcity.com
All other inquiries should be directed to:
Tredegar Corporation
Investor Relations Department
1100 Boulders Parkway
Richmond, Virginia 23225
Phone: 800-411-7441
E-mail: invest@tredegar.com
Web site: www.tredegar.com
Quarterly Information
We do not generate or distribute quarterly reports to shareholders. Information on quarterly results can be obtained from our web site and from quarterly reports on Form 10-Q filed with the SEC.
| |
Legal Counsel
Hunton & Williams LLP
Richmond, Virginia | Independent Registered Public Accounting Firm
PricewaterhouseCoopers LLP
Richmond, Virginia |
| Hunton & Williams LLP Richmond, Virginia | PricewaterhouseCoopers LLP Richmond, Virginia |
| SELECTED FINANCIAL DATA The tables that follow on pages 8-14 present certain selected financial and segment information for the eight years ended December 31, 2004.
|
| EIGHT-YEAR SUMMARY |
| | Tredegar Corporation and Subsidiaries | | | | | | | | | | | | | | | | | | | | | | | | | | | | | | | | | | | | | | | | | | | | | | | | | | | | | | | | | | | | | | | | | | | | Years Ended December 31 | 2004 | | | 2003 | | | 2002 | | | 2001 | | | 2000 | | | 1999 | | | 1998 | | | 1997 | | |
| | (In thousands, except per-share data) | | | | | | | | | | | | | | | | | | | | | | | | | | | | | | | | | | | | | | | | | | | | | | | | | | | | | | | | | | | | | | | | | | | | Results of Operations (a): | | | | | | | | | | | | | | | | | | | | | | | | | | | | | | | | | | Sales | $ | 861,165 | | | $ | 738,651 | | | $ | 753,724 | | | $ | 779,157 | | | $ | 879,475 | | | $ | 828,015 | | | $ | 705,024 | | | $ | 586,466 | | | | Other income (expense), net | | 15,604 | | (b) | | 7,853 | | | | 546 | | | | 1,255 | | | | 1,914 | | | | 972 | | | | 1,749 | | | | 3,135 | | |
| | | | 876,769 | | | | 746,504 | | | | 754,270 | | | | 780,412 | | | | 881,389 | | | | 828,987 | | | | 706,773 | | | | 589,601 | | |
| | Cost of goods sold | | 717,120 | | (b) | | 606,242 | | | | 582,658 | | | | 618,323 | | | | 706,817 | | | | 648,254 | | | | 553,184 | | | | 457,896 | | | | Freight | | 22,398 | | | | 18,557 | | | | 16,319 | | | | 15,580 | | | | 17,125 | | | | 15,221 | | | | 10,946 | | | | 8,045 | | | Selling, general & administrative
expenses | | 60,030 | | (b) | | 53,341 | | | | 52,252 | | | | 47,954 | | | | 47,321 | | | | 44,675 | | | | 37,127 | | | | 36,659 | | | | Research and development expenses | | 15,265 | | | | 18,774 | | | | 20,346 | | | | 20,305 | | | | 15,305 | | | | 11,500 | | | | 5,995 | | | | 6,475 | | | | Amortization of intangibles | | 330 | | | | 268 | | | | 100 | | | | 4,914 | | | | 5,025 | | | | 3,430 | | | | 205 | | | | 50 | | | | Interest expense | | 3,171 | | | | 6,785 | | | | 9,352 | | | | 12,671 | | | | 17,319 | | | | 9,088 | | | | 1,318 | | | | 1,952 | | | Asset impairments and costs associated
with exit and disposal activities | | 22,973 | | (b) | | 11,426 | | (c) | | 3,884 | | (d) | | 16,935 | | (e) | | 23,791 | | (f) | | 4,628 | | (g) | | 664 | | (h) | | — | | | | Unusual items | | — | | | | 1,067 | | (c) | | (6,147 | ) | (d) | | (971 | ) | (e) | | (762 | ) | (f) | | — | | | | (765 | ) | (h) | | (2,250 | ) | (i) |
| | | | 841,287 | | | | 716,460 | | | | 678,764 | | | | 735,711 | | | | 831,941 | | | | 736,796 | | | | 608,674 | | | | 508,827 | | |
| Income from continuing operations
before income taxes | | 35,482 | | | | 30,044 | | | | 75,506 | | | | 44,701 | | | | 49,448 | | | | 92,191 | | | | 98,099 | | | | 80,774 | | | | Income taxes | | 9,222 | | (b) | | 10,717 | | | | 26,881 | | | | 13,950 | | (e) | | 18,135 | | | | 32,728 | | | | 32,094 | | (h) | | 28,339 | | |
| | Income from continuing operations (a) | | 26,260 | | | | 19,327 | | | | 48,625 | | | | 30,751 | | | | 31,313 | | | | 59,463 | | | | 66,005 | | | | 52,435 | | |
| | Discontinued operations (a): | | | | | | | | | | | | | | | | | | | | | | | | | | | | | | | | | Income (loss) from venture capital
investment activities | | 2,921 | | | | (46,569 | ) | | | (42,428 | ) | | | (16,627 | ) | | | 83,640 | | | | (4,626 | ) | | | 394 | | | | 8,883 | | | Income (loss) from operations
of Molecumetics | | — | | | | 891 | | | | (8,728 | ) | | | (5,768 | ) | | | (3,577 | ) | | | (2,189 | ) | | | (2,243 | ) | | | (2,872 | ) | | | Income from discontinued energy segment | | — | | | | — | | | | — | | | | 1,396 | | | | — | | | | — | | | | 4,713 | | | | — | | |
| | Income (loss) from discontinued operations (a) | | 2,921 | | | | (45,678 | ) | | | (51,156 | ) | | | (20,999 | ) | | | 80,063 | | | | (6,815 | ) | | | 2,864 | | | | 6,011 | | |
| | Net income (loss) | $ | 29,181 | | | $ | (26,351 | ) | | $ | (2,531 | ) | | $ | 9,752 | | | $ | 111,376 | | | $ | 52,648 | | | $ | 68,869 | | | $ | 58,446 | | |
| | | | | | | | | | | | | | | | | | | | | | | | | | | | | | | | | | | | Diluted earnings (loss) per share: | | | | | | �� | | | | | | | | | | | | | | | | | | | | | | | | | | | | Continuing operations (a) | $ | .68 | | | $ | .50 | | | $ | 1.25 | | | $ | .79 | | | $ | .80 | | | $ | 1.54 | | | $ | 1.71 | | | $ | 1.33 | | | | Discontinued operations (a) | | .08 | | | | (1.19 | ) | | | (1.32 | ) | | | (.54 | ) | | | 2.06 | | | | (.18 | ) | | | .07 | | | | .15 | | |
| | Net income (loss) | $ | .76 | | | $ | (.69 | ) | | $ | (.07 | ) | | $ | .25 | | | $ | 2.86 | | | $ | 1.36 | | | $ | 1.78 | | | $ | 1.48 | | |
|
The tables that follow on pages 10-16 present certain selected financial and segment information for the eight years ended December 31, 2006. EIGHT-YEAR SUMMARY | | | | | | | | | | | | | Tredegar Corporation and Subsidiaries | | | | | | | | | | | | | | | | | | | | | | | | | | | | | | | | Years Ended December 31 | | 2006 | | 2005 | | 2004 | | 2003 | | 2002 | | 2001 | | 2000 | | 1999 | | | (In Thousands, Except Per-Share Data) | | | | | | | | | | | | | | | | | | | | | | | | | | | | | Results of Operations (a): | | | | | | | | | | | | | | | Sales | | $ | 1,116,525 | | $ | 956,969 | | $ | 861,165 | | $ | 738,651 | | $ | 753,724 | | $ | 779,157 | | $ | 879,475 | | $ | 828,015 | | | Other income (expense), net | | | 1,444 | (b) | | (544 | ) (c) | | 15,604 | (d) | | 7,853 | | | 546 | | | 1,255 | | | 1,914 | | | 972 | | | | | | 1,117,969 | | | 956,425 | | | 876,769 | | | 746,504 | | | 754,270 | | | 780,412 | | | 881,389 | | | 828,987 | | | Cost of goods sold | | | 944,839 | (b) | | 810,621 | (c) | | 717,120 | (d) | | 606,242 | | | 582,658 | | | 618,323 | | | 706,817 | | | 648,254 | | | Freight | | | 28,096 | | | 24,691 | | | 22,398 | | | 18,557 | | | 16,319 | | | 15,580 | | | 17,125 | | | 15,221 | | | Selling, general & administrative expenses | | | 68,360 | (b) | | 64,723 | (c) | | 60,030 | (d) | | 53,341 | | | 52,252 | | | 47,954 | | | 47,321 | | | 44,675 | | | Research and development expenses | | | 8,088 | | | 8,982 | | | 15,265 | | | 18,774 | | | 20,346 | | | 20,305 | | | 15,305 | | | 11,500 | | | Amortization of intangibles | | | 149 | | | 299 | | | 330 | | | 268 | | | 100 | | | 4,914 | | | 5,025 | | | 3,430 | | | Interest expense | | | 5,520 | | | 4,573 | | | 3,171 | | | 6,785 | | | 9,352 | | | 12,671 | | | 17,319 | | | 9,088 | | | Asset impairments and costs associated with exit and disposal activities | | | 4,080 | (b) | | 16,334 | (c) | | 22,973 | (d) | | 11,426 | (e) | | 3,884 | (f) | | 16,935 | (g) | | 23,791 | (h) | | 4,628 | (i) | | Unusual items | | | - | | | - | | | - | | | 1,067 | (e) | | (6,147 | ) (f) | | (971 | ) (g) | | (762 | ) (h) | | - | | | | | | 1,059,132 | | | 930,223 | | | 841,287 | | | 716,460 | | | 678,764 | | | 735,711 | | | 831,941 | | | 736,796 | | | Income from continuing operations before income taxes | | | 58,837 | | | 26,202 | | | 35,482 | | | 30,044 | | | 75,506 | | | 44,701 | | | 49,448 | | | 92,191 | | | Income taxes | | | 20,636 | (b) | | 9,973 | | | 9,222 | (d) | | 10,717 | | | 26,881 | | | 13,950 | (g) | | 18,135 | | | 32,728 | | | Income from continuing operations (a) | | | 38,201 | | | 16,229 | | | 26,260 | | | 19,327 | | | 48,625 | | | 30,751 | | | 31,313 | | | 59,463 | | | Discontinued operations (a): | | | | | | | | | | | | | | | | | | | | | | | | | | | Income (loss) from venture capital investment activities | | | - | | | - | | | 2,921 | | | (46,569 | ) | | (42,428 | ) | | (16,627 | ) | | 83,640 | | | (4,626 | ) | | Income (loss) from operations of Molecumetics | | | - | | | - | | | - | | | 891 | | | (8,728 | ) | | (5,768 | ) | | (3,577 | ) | | (2,189 | ) | | Income from discontinued energy segment | | | - | | | - | | | - | | | - | | | - | | | 1,396 | | | - | | | - | | | Income (loss) from discontinued operations (a) | | | - | | | - | | | 2,921 | | | (45,678 | ) | | (51,156 | ) | | (20,999 | ) | | 80,063 | | | (6,815 | ) | | Net income (loss) | | $ | 38,201 | | $ | 16,229 | | $ | 29,181 | | $ | (26,351 | ) | $ | (2,531 | ) | $ | 9,752 | | $ | 111,376 | | $ | 52,648 | | | | | | | | | | | | | | | | | | | | | | | | | | | | | | Diluted earnings (loss) per share: | | | | | | | | | | | | | | | | | | | | | | | | | | | Continuing operations (a) | | $ | .98 | | $ | .42 | | $ | .68 | | $ | .50 | | $ | 1.25 | | $ | .79 | | $ | .80 | | $ | 1.54 | | | Discontinued operations (a) | | | - | | | - | | | .08 | | | (1.19 | ) | | (1.32 | ) | | (.54 | ) | | 2.06 | | | (.18 | ) | | Net income (loss) | | $ | .98 | | $ | .42 | | $ | .76 | | $ | (.69 | ) | $ | (.07 | ) | $ | .25 | | $ | 2.86 | | $ | 1.36 | | | | | | | | | | | | | | | | | | | | | | | | | | | | | Refer to notes to financial tables on page 16. | | | | | | | | | | |
Refer to notes to financial tables on page 14.
|
EIGHT-YEAR SUMMARY | | | | | | | | | | | Tredegar Corporation and Subsidiaries | | | | | | | | | | | | | | | | | | | | | | | | | | | | | | Years Ended December 31 | | 2006 | | 2005 | | 2004 | | 2003 | | 2002 | | 2001 | | 2000 | | 1999 | | | (In Thousands, Except Per-Share Data) | | | | | | | | | | | | | | | | | | | | | | | | | | | | | Share Data: | | | | | | | | | | | | | | | | | | | Equity per share | | $ | 13.15 | | $ | 12.53 | | $ | 12.45 | | $ | 11.72 | | $ | 12.08 | | $ | 12.53 | | $ | 13.07 | | $ | 9.88 | | | Cash dividends declared per share | | | .16 | | | .16 | | | .16 | | | .16 | | | .16 | | | .16 | | | .16 | | | .16 | | | Weighted average common shares outstanding during the period | | | 38,671 | | | 38,471 | | | 38,295 | | | 38,096 | | | 38,268 | | | 38,061 | | | 37,885 | | | 36,992 | | | Shares used to compute diluted earnings per share during the period | | | 38,931 | | | 38,597 | | | 38,507 | | | 38,441 | | | 38,869 | | | 38,824 | | | 38,908 | | | 38,739 | | | Shares outstanding at end of period | | | 39,286 | | | 38,737 | | | 38,598 | | | 38,177 | | | 38,323 | | | 38,142 | | | 38,084 | | | 37,661 | | | Closing market price per share: | | | | | | | | | | | | | | | | | | | | | | | | | | | High | | | 23.32 | | | 20.19 | | | 20.25 | | | 16.76 | | | 24.72 | | | 21.70 | | | 32.00 | | | 32.94 | | | Low | | | 13.06 | | | 11.76 | | | 13.00 | | | 10.60 | | | 12.25 | | | 15.30 | | | 15.00 | | | 16.06 | | | End of year | | | 22.61 | | | 12.89 | | | 20.21 | | | 15.53 | | | 15.00 | | | 19.00 | | | 17.44 | | | 20.69 | | | Total return to shareholders (j) | | | 76.6 | % | | (35.4 | )% | | 31.2 | % | | 4.6 | % | | (20.2 | )% | | 9.9 | % | | (14.9 | )% | | (7.3 | )% | | | | | | | | | | | | | | | | | | | | | | | | | | | | Financial Position: | | | | | | | | | | | | | | | | | | | | | | | | | | | Total assets | | | 781,787 | | | 781,758 | | | 769,474 | | | 753,025 | | | 837,962 | | | 865,031 | | | 903,768 | | | 792,487 | | | Cash and cash equivalents | | | 40,898 | | | 23,434 | | | 22,994 | | | 19,943 | | | 109,928 | | | 96,810 | | | 44,530 | | | 25,752 | | | | | | | | | | | | | | | | | | | | | | | | | | | | | | Income taxes recoverable from sale of venture capital portfolio | | | - | | | - | | | - | | | 55,000 | | | - | | | - | | | - | | | - | | | Debt | | | 62,520 | | | 113,050 | | | 103,452 | | | 139,629 | | | 259,280 | | | 264,498 | | | 268,102 | | | 270,000 | | | Shareholders' equity (net book value) | | | 516,595 | | | 485,362 | | | 480,442 | | | 447,399 | | | 462,932 | | | 477,899 | | | 497,728 | | | 372,228 | | | Equity market capitalization (k) | | | 888,256 | | | 499,320 | | | 780,066 | | | 592,889 | | | 574,845 | | | 724,706 | | | 664,090 | | | 779,112 | | | | | | | | | | | | | | | | | | | | | | | | | | | | | Refer to notes to financial tables on page 16. | | | | | | | | | | | | | | | |
| EIGHT-YEAR SUMMARY |
| | Tredegar Corporation and Subsidiaries | | | | Years Ended December 31 | 2004 | | 2003 | | 2002 | | 2001 | | 2000 | | 1999 | | 1998 | | 1997 | |
|---|
| | (In thousands, except per-share data) | | | | | | | | | | | | | | | | | | | | | | | | | | | | | | | | | | | | | | | | | | | | | | | | | | | | Share Data: | | | | | | | | | | | | | | | | | | | | | | | | | | Equity per share | $ | 12.45 | | $ | 11.72 | | $ | 12.08 | | $ | 12.53 | | $ | 13.07 | | $ | 9.88 | | $ | 8.46 | | $ | 7.34 | | | Cash dividends declared per share | | .16 | | | .16 | | | .16 | | | .16 | | | .16 | | | .16 | | | .15 | | | .11 | | Weighted average common shares
outstanding during the period | | 38,295 | | | 38,096 | | | 38,268 | | | 38,061 | | | 37,885 | | | 36,992 | | | 36,286 | | | 36,861 | | Shares used to compute diluted
earnings per share during
the period | | 38,507 | | | 38,441 | | | 38,869 | | | 38,824 | | | 38,908 | | | 38,739 | | | 38,670 | | | 39,534 | | | Shares outstanding at end of period | | 38,598 | | | 38,177 | | | 38,323 | | | 38,142 | | | 38,084 | | | 37,661 | | | 36,661 | | | 37,113 | | | Closing market price per share: | | | | | | | | | | | | | | | | | | | | | | | | | | High | | 20.25 | | | 16.76 | | | 24.72 | | | 21.70 | | | 32.00 | | | 32.94 | | | 30.67 | | | 24.65 | | | Low | | 13.00 | | | 10.60 | | | 12.25 | | | 15.30 | | | 15.00 | | | 16.06 | | | 16.13 | | | 12.54 | | | End of year | | 20.21 | | | 15.53 | | | 15.00 | | | 19.00 | | | 17.44 | | | 20.69 | | | 22.50 | | | 21.96 | | | Total return to shareholders (j) | | 31.2 | % | | 4.6 | % | | (20.2 | )% | | 9.9 | % | | (14.9 | )% | | (7.3 | )% | | 3.1 | % | | 65.0 | % | | | | | | | | | | | | Financial Position: | | | | | | | | | | | | | | | | | | | | | | | | | | Total assets | | 769,474 | | | 753,025 | | | 837,962 | | | 865,031 | | | 903,768 | | | 792,487 | | | 457,178 | | | 410,937 | | | Cash and cash equivalents | | 22,994 | | | 19,943 | | | 109,928 | | | 96,810 | | | 44,530 | | | 25,752 | | | 25,409 | | | 120,065 | | Income taxes recoverable from sale of
venture capital portfolio | | — | | | 55,000 | | | — | | | — | | | — | | | — | | | — | | | — | | | Debt | | 103,452 | | | 139,629 | | | 259,280 | | | 264,498 | | | 268,102 | | | 270,000 | | | 25,000 | | | 30,000 | | | Shareholders’ equity (net book value) | | 480,442 | | | 447,399 | | | 462,932 | | | 477,899 | | | 497,728 | | | 372,228 | | | 310,295 | | | 272,546 | | | Equity market capitalization (k) | | 780,066 | | | 592,889 | | | 574,845 | | | 724,706 | | | 664,090 | | | 779,112 | | | 824,873 | | | 814,940 | |
| | | | | | | | | |
SEGMENT TABLES Tredegar Corporation and Subsidiaries | Net Sales (1) | | | | | | | | | | | | | | | | | | | | | | | | | | | | | | | | | | | | | | Segment | | 2006 | | 2005 | | 2004 | | 2003 | | 2002 | | 2001 | | 2000 | | 1999 | | | (In Thousands) | | | | | | | | | | | | | | | | | | | | | | | | | | | | | | | | | | | | | | Film Products | | $ | 511,169 | | $ | 460,277 | | $ | 413,257 | | $ | 365,501 | | $ | 376,904 | | $ | 382,740 | | $ | 380,202 | | $ | 342,300 | | | Aluminum Extrusions | | | 577,260 | | | 471,749 | | | 425,130 | | | 354,593 | | | 360,293 | | | 380,387 | | | 479,889 | | | 461,241 | | | AFBS (formerly Therics) | | | - | | | 252 | | | 380 | | | - | | | 208 | | | 450 | | | 403 | | | 161 | | | Total ongoing operations (m) | | | 1,088,429 | | | 932,278 | | | 838,767 | | | 720,094 | | | 737,405 | | | 763,577 | | | 860,494 | | | 803,702 | | | Divested operations (a): | | | | | | | | | | | | | | | | | | | | | | | | | | | Fiberlux | | | - | | | - | | | - | | | - | | | - | | | - | | | 1,856 | | | 9,092 | | | Total net sales | | | 1,088,429 | | | 932,278 | | | 838,767 | | | 720,094 | | | 737,405 | | | 763,577 | | | 862,350 | | | 812,794 | | | Add back freight | | | 28,096 | | | 24,691 | | | 22,398 | | | 18,557 | | | 16,319 | | | 15,580 | | | 17,125 | | | 15,221 | | | | | | | | | | | | | | | | | | | | | | | | | | | | | | Sales as shown in Consolidated Statements of Income | | $ | 1,116,525 | | $ | 956,969 | | $ | 861,165 | | $ | 738,651 | | $ | 753,724 | | $ | 779,157 | | $ | 879,475 | | $ | 828,015 | | | | | | | | | | | | | | | | | | | | | | | | | | | | | Refer to notes to financial tables on page 16. | | | | | | | | | |
Refer to notes to financial tables on page 14.
|
SEGMENT TABLES Tredegar Corporation and Subsidiaries Operating Profit | | | | | | | | | | | | | | | | | | | | | | | | | | | | | | | | | | Segment | | 2006 | | 2005 | | 2004 | | 2003 | | 2002 | | 2001 | | 2000 | | 1999 | | | (In Thousands) | | | | | | | | | | | | | | | | | | | | | | | | | | | | | | | | | | | | | | Film Products: | | | | | | | | | | | | | | | | | | | | | | | | | | | Ongoing operations | | $ | 57,645 | | $ | 44,946 | | $ | 43,259 | | $ | 45,676 | | $ | 72,307 | | $ | 61,787 | | $ | 47,112 | | $ | 59,554 | | | Plant shutdowns, asset impairments and restructurings, net of gains on sale of assets and related income from LIFO inventory liquidations | | | 221 | (b) | | (3,955 | ) (c) | | (10,438 | ) (d) | | (5,746 | ) (e) | | (3,397 | ) (f) | | (9,136 | ) (g) | | (22,163 | ) (h) | | (1,170 | ) (i) | | Unusual items | | | - | | | - | | | - | | | - | | | 6,147 | (f) | | - | | | - | | | - | | | Aluminum Extrusions: | | | | | | | | | | | | | | | | | | | | | | | | | | | Ongoing operations | | | 22,031 | | | 19,302 | | | 22,637 | | | 15,117 | | | 27,304 | | | 25,407 | | | 52,953 | | | 56,501 | | | Plant shutdowns, asset impairments and restructurings, net of gains on sale of assets | | | (1,434 | ) (b) | | 122 | (c) | | (10,553 | ) (d) | | (644 | ) (e) | | (487 | ) (f) | | (7,799 | ) (g) | | (1,628 | ) (h) | | - | | | Gain on sale of land | | | | | | | | | - | | | 1,385 | | | - | | | - | | | - | | | - | | | Other | | | - | | | - | | | 7,316 | (d) | | - | | | - | | | - | | | - | | | - | | | AFBS (formerly Therics): | | | | | | | | | | | | | | | | | | | | | | | | | | | Ongoing operations | | | - | | | (3,467 | ) | | (9,763 | ) | | (11,651 | ) | | (13,116 | ) | | (12,861 | ) | | (8,024 | ) | | (5,235 | ) | | Loss on investment in Therics, LLC | | | (25 | ) | | (145 | ) | | - | | | - | | | - | | | - | | | - | | | - | | | Plant shutdowns, asset impairments and restructurings | | | (637 | ) (b) | | (10,318 | ) (c) | | (2,041 | ) (d) | | (3,855 | ) (e) | | - | | | - | | | - | | | (3,458 | ) (i) | | Unusual items | | | - | | | - | | | - | | | (1,067 | ) (e) | | - | | | - | | | - | | | - | | | Divested operations (a): | | | | | | | | | | | | | | | | | | | | | | | | | | | Fiberlux | | | - | | | - | | | - | | | - | | | - | | | - | | | (264 | ) | | 57 | | | Unusual items | | | - | | | - | | | - | | | - | | | - | | | - | | | 762 | (h) | | - | | | Total | | | 77,801 | | | 46,485 | | | 40,417 | | | 39,215 | | | 88,758 | | | 57,398 | | | 68,748 | | | 106,249 | | | Interest income | | | 1,240 | | | 586 | | | 350 | | | 1,183 | | | 1,934 | | | 2,720 | | | 2,578 | | | 1,419 | | | Interest expense | | | 5,520 | | | 4,573 | | | 3,171 | | | 6,785 | | | 9,352 | | | 12,671 | | | 17,319 | | | 9,088 | | | Gain on sale of corporate assets | | | 56 | | | 61 | | | 7,560 | | | 5,155 | | | - | | | - | | | - | | | 712 | | | Loss from write-down of investment in Novalux | | | - | (b) | | 5,000 | (c) | | - | | | - | | | - | | | - | | | - | | | - | | | Stock option-based compensation costs | | | 970 | | | - | | | - | | | - | | | - | | | - | | | - | | | - | | | Corporate expenses, net | | | 13,770 | | | 11,357 | | | 9,674 | | | 8,724 | (e) | | 5,834 | | | 2,746 | (g) | | 4,559 | | | 7,101 | | | Income from continuing operations before income taxes | | | 58,837 | | | 26,202 | | | 35,482 | | | 30,044 | | | 75,506 | | | 44,701 | | | 49,448 | | | 92,191 | | | Income taxes | | | 20,636 | (b) | | 9,973 | | | 9,222 | | | 10,717 | | | 26,881 | | | 13,950 | (g) | | 18,135 | | | 32,728 | | | Income from continuing operations | | | 38,201 | | | 16,229 | | | 26,260 | | | 19,327 | | | 48,625 | | | 30,751 | | | 31,313 | | | 59,463 | | | Income (loss) from discontinued operations (a) | | | - | | | - | | | 2,921 | | | (45,678 | ) | | (51,156 | ) | | (20,999 | ) | | 80,063 | | | (6,815 | ) | | | | | | | | | | | | | | | | | | | | | | | | | | | | | Net income (loss) | | $ | 38,201 | | $ | 16,229 | | $ | 29,181 | | $ | (26,351 | ) | $ | (2,531 | ) | $ | 9,752 | | $ | 111,376 | | $ | 52,648 | | | | | | | | | | | | | | | | | | | | | | | | | | | | | Refer to notes to financial tables on page 16. | | | | | | | | | |
SEGMENT TABLES | Tredegar Corporation and Subsidiaries |
SEGMENT TABLES Tredegar Corporation and Subsidiaries | Identifiable Assets | | | | | | | | | | | | | | | | | | | | | | | | | | | | | | | | | | | | | | Segment | | 2006 | | 2005 | | 2004 | | 2003 | | 2002 | | 2001 | | 2000 | | 1999 | | | (In Thousands) | | | | | | | | | | | | | | | | | | | | | | | | | | | | | | | | | | | | | | Film Products | | $ | 498,961 | | $ | 479,286 | | $ | 472,810 | | $ | 422,321 | | $ | 379,635 | | $ | 367,291 | | $ | 367,526 | | $ | 360,517 | | | Aluminum Extrusions | | | 209,395 | | | 214,374 | | | 210,894 | | | 185,336 | | | 176,631 | | | 185,927 | | | 210,434 | | | 216,258 | | | AFBS (formerly Therics) | | | 2,420 | | | 2,759 | | | 8,613 | | | 8,917 | | | 10,643 | | | 9,931 | | | 9,609 | | | 9,905 | | | Subtotal | | | 710,776 | | | 696,419 | | | 692,317 | | | 616,574 | | | 566,909 | | | 563,149 | | | 587,569 | | | 586,680 | | | General corporate | | | 30,113 | | | 61,905 | | | 54,163 | | | 61,508 | | | 52,412 | | | 40,577 | | | 30,214 | | | 22,419 | | | Income taxes recoverable from sale of venture capital investment portfolio | | | - | | | - | | | - | | | 55,000 | | | - | | | - | | | - | | | - | | | Cash and cash equivalents | | | 40,898 | | | 23,434 | | | 22,994 | | | 19,943 | | | 109,928 | | | 96,810 | | | 44,530 | | | 25,752 | | | Identifiable assets from ongoing operations | | | 781,787 | | | 781,758 | | | 769,474 | | | 753,025 | | | 729,249 | | | 700,536 | | | 662,313 | | | 634,851 | | | Divested operations (a): | | | | | | | | | | | | | | | | | | | | | | | | | | | Fiberlux | | | - | | | - | | | - | | | - | | | - | | | - | | | - | | | 7,859 | | | Discontinued operations (a): | | | | | | | | | | | | | | | | | | | | | | | | | | | Venture capital | | | - | | | - | | | - | | | - | | | 108,713 | | | 158,887 | | | 236,698 | | | 145,028 | | | Molecumetics | | | - | | | - | | | - | | | - | | | - | | | 5,608 | | | 4,757 | | | 4,749 | | | Total | | $ | 781,787 | | $ | 781,758 | | $ | 769,474 | | $ | 753,025 | | $ | 837,962 | | $ | 865,031 | | $ | 903,768 | | $ | 792,487 | | | | | | | | | | | | | | | | | | | | | | | | | | | | | Refer to notes to financial tables on page 16. | | | | | | | | | | | | | | | | | | | | | | | | | |
| Net Sales (l) | |
|---|
|
|---|
| Segment | 2004 | | 2003 | | 2002 | | 2001 | | 2000 | | 1999 | | 1998 | | 1997 | |
|---|
| | (In thousands) | | | | | | | | | | | | | | | | | | | | | | | | | | | | | | | | | | | | | | | | | | | | | | | | | | | | Film Products | $ | 413,257 | | $ | 365,501 | | $ | 376,904 | | $ | 382,740 | | $ | 380,202 | | $ | 342,300 | | $ | 286,965 | | $ | 298,862 | | | Aluminum Extrusions | | 425,130 | | | 354,593 | | | 360,293 | | | 380,387 | | | 479,889 | | | 461,241 | | | 395,455 | | | 266,585 | | | Therics | | 380 | | | — | | | 208 | | | 450 | | | 403 | | | 161 | | | — | | | — | |
| | Total ongoing operations (n) | | 838,767 | | | 720,094 | | | 737,405 | | | 763,577 | | | 860,494 | | | 803,702 | | | 682,420 | | | 565,447 | | | Divested operations (a): | | | | | | | | | | | | | | | | | | | | | | | | | | Fiberlux | | — | | | — | | | — | | | — | | | 1,856 | | | 9,092 | | | 11,629 | | | 10,596 | | | Other (m) | | — | | | — | | | — | | | — | | | — | | | — | | | 29 | | | 2,378 | |
| | Total net sales | | 838,767 | | | 720,094 | | | 737,405 | | | 763,577 | | | 862,350 | | | 812,794 | | | 694,078 | | | 578,421 | | | Add back freight | | 22,398 | | | 18,557 | | | 16,319 | | | 15,580 | | | 17,125 | | | 15,221 | | | 10,946 | | | 8,045 | |
| | Sales as shown in Consolidated | | | | | | | | | | | | | | | | | | | | | | | | | | Statements of Income | $ | 861,165 | | $ | 738,651 | | $ | 753,724 | | $ | 779,157 | | $ | 879,475 | | $ | 828,015 | | $ | 705,024 | | $ | 586,466 | |
|
SEGMENT TABLES Tredegar Corporation and Subsidiaries | Depreciation and Amortization | | | | | | | | | | | | | | | | | | | | | | | | | | | | | | Segment | | 2006 | | 2005 | | 2004 | | 2003 | | 2002 | | 2001 | | 2000 | | 1999 | | | (In Thousands) | | | | | | | | | | | | | | | | | | | | | | | | | | | | | | | | | | Film Products | | $ | 31,847 | | $ | 26,673 | | $ | 21,967 | | $ | 19,828 | | $ | 20,085 | | $ | 22,047 | | $ | 23,122 | | $ | 18,751 | | | Aluminum Extrusions | | | 12,323 | | | 11,484 | | | 10,914 | | | 10,883 | | | 10,506 | | | 11,216 | | | 9,862 | | | 9,484 | | | AFBS (formerly Therics) | | | - | | | 437 | | | 1,300 | | | 1,641 | | | 463 | | | 2,262 | | | 1,782 | | | 1,195 | | | Subtotal | | | 44,170 | | | 38,594 | | | 34,181 | | | 32,352 | | | 31,054 | | | 35,525 | | | 34,766 | | | 29,430 | | | General corporate | | | 111 | | | 195 | | | 241 | | | 270 | | | 353 | | | 329 | | | 315 | | | 253 | | | Total ongoing operations | | | 44,281 | | | 38,789 | | | 34,422 | | | 32,622 | | | 31,407 | | | 35,854 | | | 35,081 | | | 29,683 | | | Divested operations (a): | | | | | | | | | | | | | | | | | | | | | | | | | | | Fiberlux | | | - | | | - | | | - | | | - | | | - | | | - | | | 151 | | | 498 | | | Discontinued operations (a): | | | | | | | | | | | | | | | | | | | | | | | | | | | Venture capital | | | - | | | - | | | - | | | - | | | - | | | - | | | 18 | | | 22 | | | Molecumetics | | | - | | | - | | | - | | | - | | | 527 | | | 2,055 | | | 1,734 | | | 1,490 | | | Total | | $ | 44,281 | | $ | 38,789 | | $ | 34,422 | | $ | 32,622 | | $ | 31,934 | | $ | 37,909 | | $ | 36,984 | | $ | 31,693 | | | | | | | | | | | | | | | | | | | | | | | | | | | | | Capital Expenditures, Acquisitions and Investments | | | | | | | | | | | | | | | | | | | | | | | | Segment | | | 2006 | | | 2005 | | | 2004 | | | 2003 | | | 2002 | | | 2001 | | | 2000 | | | 1999 | | | (In Thousands) | | | | | | | | | | | | | | | | | | | | | | | | | | | | | | | | | | | | | | | | | | | | | | | | | | | | | | Film Products | | $ | 33,168 | | $ | 50,466 | | $ | 44,797 | | $ | 57,203 | | $ | 24,063 | | $ | 24,775 | | $ | 53,161 | | $ | 25,296 | | | Aluminum Extrusions | | | 7,381 | | | 11,968 | | | 10,007 | | | 8,293 | | | 4,799 | | | 8,506 | | | 21,911 | | | 16,388 | | | AFBS (formerly Therics) | | | - | | | 36 | | | 275 | | | 219 | | | 1,621 | | | 2,340 | | | 1,730 | | | 757 | | | Subtotal | | | 40,549 | | | 62,470 | | | 55,079 | | | 65,715 | | | 30,483 | | | 35,621 | | | 76,802 | | | 42,441 | | | General corporate | | | 24 | | | 73 | | | 572 | | | 93 | | | 60 | | | 519 | | | 384 | | | 606 | | | | | | | | | | | | | | | | | | | | | | | | | | | | | | Capital expenditures for ongoing operations | | | 40,573 | | | 62,543 | | | 55,651 | | | 65,808 | | | 30,543 | | | 36,140 | | | 77,186 | | | 43,047 | | | Divested operations (a): | | | | | | | | | | | | | | | | | | | | | | | | | | | Fiberlux | | | - | | | - | | | - | | | - | | | - | | | - | | | 425 | | | 812 | | | Discontinued operations (a): | | | | | | | | | | | | | | | | | | | | | | | | | | | Venture capital | | | - | | | - | | | - | | | - | | | - | | | - | | | 86 | | | - | | | Molecumetics | | | - | | | - | | | - | | | - | | | 793 | | | 2,850 | | | 2,133 | | | 1,362 | | | Total capital expenditures | | | 40,573 | | | 62,543 | | | 55,651 | | | 65,808 | | | 31,336 | | | 38,990 | | | 79,830 | | | 45,221 | | | Acquisitions and other | | | - | | | - | | | 1,420 | | | 1,579 | | | - | | | 1,918 | | | 6,316 | | | 215,227 | | | Novalux investment | | | 542 | | | 1,095 | | | 5,000 | | | - | | | - | | | - | | | - | | | - | | | Venture capital investments | | | - | | | - | | | - | | | 2,807 | | | 20,373 | | | 24,504 | | | 93,058 | | | 81,747 | | | Total | | $ | 41,115 | | $ | 63,638 | | $ | 62,071 | | $ | 70,194 | | $ | 51,709 | | $ | 65,412 | | $ | 179,204 | | $ | 342,195 | | | | | | | | | | | | | | | | | | | | | | | | | | | | | Refer to notes to financial tables on page 16. | | | | | | | | | | | | | |
Refer to notes to financial tables on page 14.
|
NOTES TO FINANCIAL TABLES
(In Thousands, Except Per-Share Data) | SEGMENT TABLES | | | | | | | | | | | | | | | | | | | | | | | | | | | | | | | | | | Tredegar Corporation and Subsidiaries | | | | | | | | | | | | | | | | | | | | | | | | | | | | | | | | | | | | | | | | | | | | | | | | | | | | | | | | | | | | | | | | | | | | Operating Profit | | | | | | | | | | | | | | | | | | | | | | | | | | | | | | | | |
| | Segment | | 2004 | | | | 2003 | | | | 2002 | | | | 2001 | | | | 2000 | | | | 1999 | | | | 1998 | | | | 1997 | | |
| | (In thousands) | | | | | | | | | | | | | | | | | | | | | | | | | | | | | | | | | | | | | | | | | | | | | | | | | | | | | | | | | | | | | | | | | | | | Film Products: | | | | | | | | | | | | | | | | | | | | | | | | | | | | | | | | | | Ongoing operations | $ | 43,259 | | | $ | 45,676 | | | $ | 72,307 | | | $ | 61,787 | | | $ | 47,112 | | | $ | 59,554 | | | $ | 53,786 | | | $ | 50,463 | | | Plant shutdowns, asset impairments
and restructurings | | (10,438) | | (b) | | (5,746 | ) | (c) | | (3,397 | ) | (d) | | (9,136 | ) | (e) | | (22,163 | ) | (f) | | (1,170 | ) | (g) | | — | | | | — | | | | Unusual items | | — | | | | — | | | | 6,147 | | (d) | | — | | | | — | | | | — | | | | — | | | | — | | |
| | Aluminum Extrusions: | | | | | | | | | | | | | | | | | | | | | | | | | | | | | | | | | | Ongoing operations | | 22,637 | | | | 15,117 | | | | 27,304 | | | | 25,407 | | | | 52,953 | | | | 56,501 | | | | 47,091 | | | | 32,057 | | | Plant shutdowns, asset impairments
and restructurings | | (10,553 | ) | (b) | | (644 | ) | (c) | | (487 | ) | (d) | | (7,799 | ) | (e) | | (1,628 | ) | (f) | | — | | | | (664 | ) | (h) | | — | | | | Gain on sale of land | | — | | | | 1,385 | | | | — | | | | — | | | | — | | | | — | | | | — | | | | — | | | | Other | | 7,316 | | (b) | | — | | | | — | | | | — | | | | — | | | | — | | | | — | | | | — | | |
| | Therics: | | | | | | | | | | | | | | | | | | | | | | | | | | | | | | | | | | Ongoing operations | | (9,763 | ) | | | (11,651 | ) | | | (13,116 | ) | | | (12,861 | ) | | | (8,024 | ) | | | (5,235 | ) | | | — | | | | — | | | Plant shutdowns, asset impairments
and restructurings | | (2,041 | ) | (b) | | (3,855 | ) | (c) | | — | | | | — | | | | — | | | | (3,458 | ) | (g) | | — | | | | — | | | | Unusual items | | — | | | | (1,067 | ) | (c) | | — | | | | — | | | | — | | | | — | | | | — | | | | — | | |
| | Divested operations (a): | | | | | | | | | | | | | | | | | | | | | | | | | | | | | | | | | | Fiberlux | | — | | | | — | | | | — | | | | — | | | | (264 | ) | | | 57 | | | | 1,433 | | | | 845 | | | | Other (m) | | — | | | | — | | | | — | | | | — | | | | — | | | | — | | | | (428 | ) | | | (267 | ) | | | Unusual items | | — | | | | — | | | | — | | | | — | | | | 762 | | (f) | | — | | | | 765 | | (h) | | 2,250 | | (i) |
| | Total | | 40,417 | | | | 39,215 | | | | 88,758 | | | | 57,398 | | | | 68,748 | | | | 106,249 | | | | 101,983 | | | | 85,348 | | | | Interest income | | 350 | | | | 1,183 | | | | 1,934 | | | | 2,720 | | | | 2,578 | | | | 1,419 | | | | 2,279 | | | | 4,959 | | | | Interest expense | | 3,171 | | | | 6,785 | | | | 9,352 | | | | 12,671 | | | | 17,319 | | | | 9,088 | | | | 1,318 | | | | 1,952 | | | | Gain on sale of corporate assets | | 7,560 | | | | 5,155 | | | | — | | | | — | | | | — | | | | 712 | | | | — | | | | — | | | | Corporate expenses, net | | 9,674 | | | | 8,724 | | (c) | | 5,834 | | | | 2,746 | | (e) | | 4,559 | | | | 7,101 | | | | 4,845 | | | | 7,581 | | |
| Income from continuing operations
before income taxes | | 35,482 | | | | 30,044 | | | | 75,506 | | | | 44,701 | | | | 49,448 | | | | 92,191 | | | | 98,099 | | | | 80,774 | | | | Income taxes | | 9,222 | | | | 10,717 | | | | 26,881 | | | | 13,950 | | (e) | | 18,135 | | | | 32,728 | | | | 32,094 | | (h) | | 28,339 | | |
| | Income from continuing operations | | 26,260 | | | | 19,327 | | | | 48,625 | | | | 30,751 | | | | 31,313 | | | | 59,463 | | | | 66,005 | | | | 52,435 | | | Income (loss) from discontinued
operations (a) | | 2,921 | | | | (45,678 | ) | | | (51,156 | ) | | | (20,999 | ) | | | 80,063 | | | | (6,815 | ) | | | 2,864 | | | | 6,011 | | |
| | | | | | | | | | | | | | | | | | | | | | | | | | | | | | | | | | | | Net income (loss) | $ | 29,181 | | | $ | (26,351 | ) | | $ | (2,531 | ) | | $ | 9,752 | | | $ | 111,376 | | | $ | 52,648 | | | $ | 68,869 | | | $ | 58,446 | | |
|
Refer to notes to financial tables on page 14.
|
SEGMENT TABLES | Tredegar Corporation and Subsidiaries |
| Identifiable Assets | |
|---|
|
|---|
| Segment | 2004 | | 2003 | | 2002 | | 2001 | | 2000 | | 1999 | | 1998 | | 1997 | |
|---|
| | (In thousands) | | | | | | | | | | | | | | | | | | | | | | | | | | | | | | | | | | | | | | | | | | | | | | | | | | | | Film Products | $ | 472,810 | | $ | 422,321 | | $ | 379,635 | | $ | 367,291 | | $ | 367,526 | | $ | 360,517 | | $ | 132,241 | | $ | 123,613 | | | Aluminum Extrusions | | 210,894 | | | 185,336 | | | 176,631 | | | 185,927 | | | 210,434 | | | 216,258 | | | 201,518 | | | 101,855 | | | Therics | | 8,613 | | | 8,917 | | | 10,643 | | | 9,931 | | | 9,609 | | | 9,905 | | | — | | | — | |
| | Subtotal | | 692,317 | | | 616,574 | | | 566,909 | | | 563,149 | | | 587,569 | | | 586,680 | | | 333,759 | | | 225,468 | | | General corporate | | 54,163 | | | 61,508 | | | 52,412 | | | 40,577 | | | 30,214 | | | 22,419 | | | 23,905 | | | 21,357 | | Income taxes recoverable from sale of
venture capital investment portfolio | | — | | | 55,000 | | | — | | | — | | | — | | | — | | | — | | | — | | | Cash and cash equivalents | | 22,994 | | | 19,943 | | | 109,928 | | | 96,810 | | | 44,530 | | | 25,752 | | | 25,409 | | | 120,065 | |
| | Identifiable assets from ongoing operations | | 769,474 | | | 753,025 | | | 729,249 | | | 700,536 | | | 662,313 | | | 634,851 | | | 383,073 | | | 366,890 | | | Divested operations (a): | | | | | | | | | | | | | | | | | | | | | | | | | | Fiberlux | | — | | | — | | | — | | | — | | | — | | | 7,859 | | | 7,811 | | | 6,886 | | | Other (m) | | — | | | — | | | — | | | — | | | — | | | — | | | — | | | 983 | | | Discontinued operations (a): | | Venture capital | | — | | | — | | | 108,713 | | | 158,887 | | | 236,698 | | | 145,028 | | | 61,098 | | | 33,628 | | | Molecumetics | | — | | | — | | | — | | | 5,608 | | | 4,757 | | | 4,749 | | | 5,196 | | | 2,550 | |
| | Total | $ | 769,474 | | $ | 753,025 | | $ | 837,962 | | $ | 865,031 | | $ | 903,768 | | $ | 792,487 | | $ | 457,178 | | $ | 410,937 | |
|
Refer to notes to financial tables on page 14.
|
SEGMENT TABLES | Tredegar Corporation and Subsidiaries |
| Depreciation and Amortization |
|---|
|
|---|
| Segment | | 2004 | | | 2003 | | | 2002 | | | 2001 | | | 2000 | | | 1999 | | | 1998 | | | 1997 | |
|---|
| | (In thousands) | | | | | | | | | | | | | | | | | | | | | | | | | | | | Film Products | $ | 21,967 | | $ | 19,828 | | $ | 20,085 | | $ | 22,047 | | $ | 23,122 | | $ | 18,751 | | $ | 11,993 | | $ | 10,947 | | | Aluminum Extrusions | | 10,914 | | | 10,883 | | | 10,506 | | | 11,216 | | | 9,862 | | | 9,484 | | | 8,393 | | | 5,508 | | | Therics | | 1,300 | | | 1,641 | | | 463 | | | 2,262 | | | 1,782 | | | 1,195 | | | — | | | — | |
| | Subtotal | | 34,181 | | | 32,352 | | | 31,054 | | | 35,525 | | | 34,766 | | | 29,430 | | | 20,386 | | | 16,455 | | | General corporate | | 241 | | | 270 | | | 353 | | | 329 | | | 315 | | | 253 | | | 254 | | | 313 | |
| | Total ongoing operations | | 34,422 | | | 32,622 | | | 31,407 | | | 35,854 | | | 35,081 | | | 29,683 | | | 20,640 | | | 16,768 | | | Divested operations (a): | | | | | | | | | | | | | | | | | | | | | | | | | | Fiberlux | | — | | | — | | | — | | | — | | | 151 | | | 498 | | | 544 | | | 515 | | | Other (m) | | — | | | — | | | — | | | — | | | — | | | — | | | — | | | 135 | | | Discontinued operations (a): | | | | | | | | | | Venture capital | | — | | | — | | | — | | | — | | | 18 | | | 22 | | | 21 | | | — | | | Molecumetics | | — | | | — | | | 527 | | | 2,055 | | | 1,734 | | | 1,490 | | | 1,260 | | | 996 | |
| | Total | $ | 34,422 | | $ | 32,622 | | $ | 31,934 | | $ | 37,909 | | $ | 36,984 | | $ | 31,693 | | $ | 22,465 | | $ | 18,414 | |
| | Capital Expenditures, Acquisitions and Investments |
| | Segment | | 2004 | | | 2003 | | | 2002 | | | 2001 | | | 2000 | | | 1999 | | | 1998 | | | 1997 | |
| | (In thousands) | | Film Products | $ | 44,797 | | $ | 57,203 | | $ | 24,063 | | $ | 24,775 | | $ | 53,161 | | $ | 25,296 | | $ | 18,456 | | $ | 15,354 | | | Aluminum Extrusions | | 10,007 | | | 8,293 | | | 4,799 | | | 8,506 | | | 21,911 | | | 16,388 | | | 10,407 | | | 6,372 | | | Therics | | 275 | | | 219 | | | 1,621 | | | 2,340 | | | 1,730 | | | 757 | | | — | | | — | |
| | Subtotal | | 55,079 | | | 65,715 | | | 30,483 | | | 35,621 | | | 76,802 | | | 42,441 | | | 28,863 | | | 21,726 | | | General corporate | | 572 | | | 93 | | | 60 | | | 519 | | | 384 | | | 606 | | | 115 | | | 28 | |
| Capital expenditures for
ongoing operations | | 55,651 | | | 65,808 | | | 30,543 | | | 36,140 | | | 77,186 | | | 43,047 | | | 28,978 | | | 21,754 | | | Divested operations (a): | | | | | | | | | | | | | | | | | | | | | | | | | | Fiberlux | | — | | | — | | | — | | | — | | | 425 | | | 812 | | | 1,477 | | | 530 | | | Other (m) | | — | | | — | | | — | | | — | | | — | | | — | | | — | | | 5 | | | Discontinued operations (a): | | | | | | | | | | Venture capital | | — | | | — | | | — | | | — | | | 86 | | | — | | | 54 | | | — | | | Molecumetics | | — | | | — | | | 793 | | | 2,850 | | | 2,133 | | | 1,362 | | | 3,561 | | | 366 | |
| | Total capital expenditures | | 55,651 | | | 65,808 | | | 31,336 | | | 38,990 | | | 79,830 | | | 45,221 | | | 34,070 | | | 22,655 | | | Acquisitions and other | | 1,420 | | | 1,579 | | | — | | | 1,918 | | | 6,316 | | | 215,227 | | | 72,102 | | | 13,469 | | | Novalux investment | | 5,000 | | | — | | | — | | | — | | | — | | | — | | | — | | | — | | | Venture capital investments | | — | | | 2,807 | | | 20,373 | | | 24,504 | | | 93,058 | | | 81,747 | | | 35,399 | | | 20,801 | |
| | Total | $ | 62,071 | | $ | 70,194 | | $ | 51,709 | | $ | 65,412 | | $ | 179,204 | | $ | 342,195 | | $ | 141,571 | | $ | 56,925 | |
|
Refer to notes to financial tables on page 14.
|
NOTES TO FINANCIAL TABLES |
| (In thousands, except per-share amounts) |
| (a) | In 2004, discontinued operations include a gain of $2,921 after-taxes primarily related to the reversal of a business and occupancy tax contingency accrual upon favorable resolution. The accrual was originally recorded in connection with our venture capital investment operation. In 2003, we sold substantially all of our venture capital investment portfolio. In 2002, we ceased operations at Molecumetics, one of our biotechnology units, and sold its tangible assets. The operating results associated with the venture capital investment portfolio and Molecumetics have been reported as discontinued operations. In 2003, discontinued operations also include a gain of $891 after-taxes on the sale of intellectual property of Molecumetics and a loss on the divestiture of the venture capital investment portfolio of $46,269 after-taxes. Discontinued operations in 2002 also include a loss on the disposal of Molecumetics of $4,875 after-taxes. In 2001, discontinued operations include a gain of $1,396 for the reversal of an income tax contingency accrual upon favorable conclusion of IRS examinations through 1997. The accrual was originally recorded in conjunction with the sale of The Elk Horn Coal Corporation. We divested our coal subsidiary, The Elk Horn Coal Corporation, and our remaining oil and gas properties in 1994. As a result of these events, we report the Energy segment as discontinued operations. In 1998, discontinued operations include gains for the reimbursement of payments made by us to the United Mine Workers of America Combined Benefit Fund (the “Fund”) and the reversal of a related accrued liability established to cover future payments to the Fund. On April 10, 2000, we sold Fiberlux. The operating results of Fiberlux were historically reported as part of the Plastics segment on a combined basis with Film Products. |
| (b) | Plant shutdowns, asset impairments and restructurings for 2006 include a net gain of $1,454 associated with the shutdown of the films manufacturing facility in LaGrange, Georgia, including a gain of $2,889 for related LIFO inventory liquidations (included in "Cost of goods sold" in the consolidated statements of income) and a gain of $261 on the sale of related property and equipment (included in "Other income (expense), net" in the consolidated statements of income), partially offset by severance and other costs of $1,566 and asset impairment charges of $130, charges of $1,020 for asset impairments in Film Products, a charge of $920 related to expected future environmental costs at the aluminum extrusions facility in Newnan, Georgia (included in "Cost of goods sold" in the consolidated statements of income), charges of $727 for severance and other employee-related costs in connection with restructurings in Film Products ($213) and Aluminum Extrusions ($514), and charges of $637 related to the estimated loss on the sub-lease of a portion of the AFBS (formerly Therics) facility in Princeton, New Jersey. Income taxes in 2006 include a reversal of a valuation allowance of $577 for deferred tax assets associated with capital loss carry-forwards recorded with the write-down of the investment in Novalux in 2005. Outside appraisal of the value of corporate assets, primarily real estate, performed in December 2006, indicates that realization of related deferred tax assets is more likely than not. |
| (c) | Plant shutdowns, asset impairments and restructurings for 2005 include charges of $10,318 related to the sale or assignment of substantially all of AFBS' assets, charges of $2,221 related to severance and other employee-related costs in connection with restructurings in Film Products ($1,118), Aluminum Extrusions ($648) and corporate headquarters ($455, included in "Corporate expenses, net" in the operating profit by segment table), a charge of $2,101 related to the planned shutdown of the films manufacturing facility in LaGrange, Georgia, a net gain of $1,667 related to the shutdown of the films manufacturing facility in New Bern, North Carolina, including a gain on the sale of the facility ($1,816, included in "Other income (expense), net" in the consolidated statements of income), partially offset by shutdown-related expenses ($225), a net gain of $1,265 related to the shutdown of the aluminum extrusions facility in Aurora, Ontario, including a gain on the sale of the facility ($1,667, included in "Other income (expense), net" in the consolidated statements of income), shutdown-related costs ($1,111), partially offset by the reversal to income of certain accruals associated with severance and other costs ($709), a charge of $1,019 for process reengineering costs associated with the implementation of a global information system in Film Products (included in "Costs of goods sold" in the consolidated statements of income), a net charge of $843 related to severance and other employee-related costs associated with the restructuring of the research and development operations in Film Products (of this amount, $1,363 in charges for employee relocation and recruitment is included in "Selling, general & administrative expenses" in the consolidated statements of income); a gain of $653 related to the shutdown of the films manufacturing facility in Carbondale, Pennsylvania, including a gain on the sale of the facility ($630, included in "Other income (expense), net" in the consolidated statements of income), and the reversal to income of certain shutdown-related accruals ($23), charges of $583 for asset impairments in Film Products, a gain of $508 for interest receivable on tax refund claims (included in "Corporate expenses, net" in the operating profit by segment table and "Other income (expense), net" in the consolidated statements of income), a charge of $495 in Aluminum Extrusions, including an asset impairment ($597), partially offset by the reversal to income of certain shutdown-related accruals ($102), charges of $353 for accelerated depreciation related to restructurings in Film Products, and a charge of $182 in Film Products related to the write-off of an investment. As of December 31, 2005, the investment in Novalux, Inc. of $6,095 was written down to estimated fair value of $1,095. The loss from the write-down, $5,000, is included in "Other income (expense), net" in the consolidated statements of income. |
| (d) | Plant shutdowns, asset impairments and restructurings for 2004 include a charge of $10,127 related to the planned shutdown of the aluminum extrusions plant in Aurora, Ontario, a charge of $3,022 related to the sale of the films business in Argentina, charges of $2,572 related to accelerated depreciation from plant shutdowns and restructurings in Film Products, charges of $2,459 related to severance and other costs associated with plant shutdowns in Film Products, charges of $1,547 for severance and other employee-related costs associated with restructurings in ThericsAFBS ($735), Film Products ($532) and Aluminum Extrusions ($280), a charge of $1,306 related to the estimated loss on the sub-lease of a portion of the ThericsAFBS facility in Princeton, New Jersey, a charge of $1,278 (of this amount, $59 for employee relocation is included in “Selling,"Selling, general & administrative expenses”expenses" in the consolidated statements of income) related to severance and other employee-related costs associated with the restructuring of the research and development operations in Film Products and charges of $575 in Film Products and $146 in Aluminum Extrusions related to asset impairments. Income taxes in 2004 include a tax benefit of $4,000 related to the reversal of income tax contingency accruals upon favorable conclusion of IRS and state examinations through 2000. The other pretax gain of $7,316 included in the Aluminum Extrusions section of the operating profit by segment table is comprised of the present value of an insurance settlement of $8,357 (future value of $8,455) associated with environmental costs related to prior years, partially offset by accruals for expected future environmental costs of $1,041. The company received $5,143 of the $8,455 insurance settlement in 2004 and recognized receivables at present value for future amounts due ($1,497 duereceived in February of 2005 and $1,717 duereceived in February 2006). The gain from the insurance settlement is included in “Other"Other income (expense), net”net" in the consolidated statements of income, while the accruals for expected future environmental costs are included in “Cost"Cost of goods sold.”" |
(c)(e) | Plant shutdowns, asset impairments and restructurings for 2003 include charges of $4,514 for severance costs in connection with restructurings in Film Products ($1,922), Aluminum Extrusions ($256), ThericsAFBS ($1,155) and corporate headquarters ($1,181, included in “Corporate"Corporate expenses, net”net" in the operating profit by segment table), charges of $2,776 for asset impairments in the films business, charges of $2,700 related to the estimated loss on the sub-lease of a portion of the ThericsAFBS facility in Princeton, New Jersey, a charge of $611 primarily related to severance costs associated with the shutdown of the films plant in New Bern, North Carolina, a charge of $388 related to an early retirement program in our aluminum business and charges of $437 for additional costs incurred related to plant shutdowns in our films business. Unusual items for 2003 include a charge of $1,067 related to an adjustment for depreciation and amortization at ThericsAFBS based on our decision to suspend divestiture efforts. |
(d)(f) | Plant shutdowns, asset impairments and restructurings for 2002 include a charge of $1,457 for asset impairments in the films business, a charge of $1,007 for additional costs related to the shutdown of the films plant in Carbondale, Pennsylvania, a charge of $541 for additional costs related to the shutdown of the films plant in Tacoma, Washington, a charge of $487 for additional costs related to the shutdown of the aluminum extrusions plant in El Campo, Texas, and a charge of $392 for additional costs related to the 2000 shutdown of the films plant in Manchester, Iowa. Unusual items for 2002 include a net gain of $5,618 for payments received from P&G related to terminations and revisions to contracts and related asset write-downs,writedowns, and a gain of $529 related to the sale of assets. |
(e)(g) | Plant shutdowns, asset impairments and restructurings for 2001 include a charge of $7,799 for the shutdown of the aluminum extrusions plant in El Campo, Texas, a charge of $3,386 for the shutdown of the films plant in Tacoma, Washington, a charge of $2,877 for the shutdown of the films plant in Carbondale, Pennsylvania, a charge of $1,505 for severance costs related to further rationalization in the films business, and a charge of $1,368 for impairment of our films business in Argentina. Unusual items in 2001 include a gain of $971 (included in “Corporate"Corporate expenses, net”net" in the operating profit by segment table) for interest received on tax overpayments. Income taxes in 2001 include a tax benefit of $1,904 related tofor the reversal of income tax contingency accruals upon favorable conclusion of IRS examinations through 1997. |
(f)(h) | Plant shutdowns, asset impairments and restructurings for 2000 include a charge of $17,870 related to excess capacity in the films business, a charge of $1,628 related to restructuring at our aluminum extrusions plant in El Campo, Texas, and a charge of $4,293 for the shutdown of the films plant in Manchester, Iowa. Unusual items in 2000 include a gain of $762 for the sale of Fiberlux. |
(g)(i) | Plant shutdowns, asset impairments and restructurings for 1999 include a charge of $3,458 related to a write-off of in-process research and development expenses associated with the ThericsAFBS acquisition and a charge of $1,170 for the write-off of excess packaging film capacity. |
(h) | Plant shutdowns, asset impairments and restructurings for 1998 include a charge of $664 related to the shutdown of the powder-coat paint line in our aluminum extrusions plant in Newnan, Georgia. Unusual items for 1998 include a gain of $765 on the sale of APPX Software. Income taxes in 1998 include a tax benefit of $2,001 related to the sale, including a tax benefit for the excess of APPX Software's income tax basis over its financial reporting basis.
|
(i) | Unusual items for 1997 include a gain of $2,250 related to the redemption of preferred stock received in connection with the 1996 divestiture of Molded Products. |
| (j) | Total return to shareholders is computeddefined as the sum of the change in stock price during the year plus dividends per share, divided by the stock price at the beginning of the year. |
| (k) | Equity market capitalization is the closing market price per share for the period timesmultiplied by the shares outstanding at the end of the period. |
| (l) | Net sales represent gross sales less freight. Net sales is the measure used by the chief operating decision maker of each segment for purposes of assessing performance. |
| (m) | Other includes primarily APPX Software (sold in 1998 - see (h)). |
(n) | Net sales include sales to P&G totaling $255,414 in 2006, $236,554 in 2005, and $226,122 in 2004, $207,049 in 2003, and $242,760 in 2002.2004. These amounts include plastic film sold to others who converted the film into materials used in products manufactured by P&G. |
| MANAGEMENT’S DISCUSSION AND ANALYSIS OF FINANCIAL CONDITION AND | | RESULTS OF OPERATIONS |
Forward-looking and Cautionary Statements
From time to time, we may make statements that may constitute “forward-looking statements” within the meaning of the “safe-harbor” provisions of the Private Securities Litigation Reform Act of 1995. These statements are based on our then current expectations and are subject to a number of risks and uncertainties that could cause actual results to differ materially from those addressed in the forward-looking statements. Some of the risk factors that may cause such a difference are summarized on pages 3-5 and are incorporated herein.
Executive Summary
General Tredegar is a manufacturer of plastic films and aluminum extrusions. Descriptions of our businesses are provided on pages 1-5. Income from continuing operations was $38.2 million (98 cents per diluted share) in 2006 compared with $16.2 million (42 cents per diluted share) in 2005. Gains on the sale of assets, investment write-downs and other items and losses related to plant shutdowns, assets impairments and restructurings are described in results of operations beginning on page 20. The business segment review begins on page 33.
Film Products
In Film Products, net sales were $511.2 million in 2006, up 11.1% versus $460.3 million in 2005. Operating profit from ongoing operations was $57.6 million in 2006, up 28.3% compared to $44.9 million in 2005. Operating profit from ongoing operations excluding the estimated effects of resin pass-through lag and year-end LIFO adjustments was $53.1 million in 2006, up 8.6% versus $48.9 million in 2005. Volume decreased to 253.5 million pounds in 2006 from 261.1 million pounds in 2005. We estimate that the growth in net sales excluding the effects of the pass-through of resin price changes and foreign exchange rate changes was approximately 6% in 2006. Sales and operating profit growth in 2006 were driven primarily by increased sales of high-value surface protection films, elastic materials and new apertured topsheets, partially offset by lower sales of certain commodity barrier films that were dropped in conjunction with the shutdown of the plant in LaGrange, Georgia. The plant was shut down in the first half of 2006 and had sales of commodity barrier films of approximately $20 million in 2005.
Film Products has index-based pass-through raw material cost agreements for the majority of its business. However, under certain agreements, changes in resin prices are not passed through for an average period of 90 days. Average quarterly prices of low-density polyethylene resin (“LDPE”) in the U.S. have been volatile over the last several years (see the chart on page 29). Resin prices in Europe, Asia and South America have exhibited similar trends. Capital expenditures declined to $33.2 million in 2006 compared with $50.5 million in 2005. Capital expenditures in 2007 are expected to be approximately $35 million. Approximately half of the capital expenditures in 2006 related to expanding the production capacity for surface protection films. These films are primarily used to protect flat panel display components during fabrication, shipping and handling. Sales of surface protection films used primarily in this application totaled approximately $56 million in 2006, $30 million in 2005 and $16 million in 2004. Other capital expenditures in 2006 included capacity additions for elastic materials and a new information system, which was rolled out in U.S. locations. Depreciation expense was $31.7 million in 2006 compared with $26.5 million 2005, and is projected to be $34 million in 2007.
Aluminum Extrusions
In Aluminum Extrusions, net sales were $577.3 million in 2006, up 22.4% versus $471.7 million in 2005. Operating profit from ongoing operations was $22.0 million in 2006, up 14.0% compared to $19.3 million in 2005. Volume increased to 259.9 million pounds in 2006, up 5.5% compared to 246.4 million pounds in 2005. Growth in shipments in 2006 was driven by demand for extrusions used in commercial construction and hurricane protection products, partially offset by a decline in extrusions used in residential construction. The increase in operating profit during 2006 was primarily due to higher volume and selling prices and lower energy costs (energy costs were down $1.1 million), partially offset by appreciation of the Canadian Dollar ($2.8 million) and higher charges for possible uncollectible accounts ($1.4 million).
Capital expenditures in 2006 were $7.4 million versus $12 million in 2005 and are expected to be approximately $14 million in 2007. Depreciation expense was $12.3 million in 2006 compared with $11.5 million in 2005, and is projected to be $12.8 million in 2007.
Other Developments
Consolidated net pension expense was $2.6 million in 2006, an increase of $5.3 million (9 cents per share after taxes) from the net pension income of $2.7 million recognized in 2005 (see Note 11 beginning on page 61 for more information). Most of this unfavorable change relates to a pension plan that is reflected in “Corporate expenses, net” in the segment operating profit table on page 13. We contributed $1.1 million to our pension plans in 2006 and expect required contributions of $1.1 million in 2007.
On October 26, 2006, we announced changes to our U.S. defined benefit (pension) and savings plans covering salaried and certain other employees. The changes had no impact on our net income or earnings per share in 2006. The changes relating to the pension plan reduced our projected benefit obligation by approximately $10 million as of December 31, 2006. In 2007, the changes to the pension plan are expected to reduce our service cost, interest cost and amortization of prior service cost components of pension expense by approximately $600,000, $600,000 and $1.5 million, respectively, and the savings plan changes are expected to increase charges for company matching contributions by approximately $700,000. Based on these changes and other factors, we expect pension income of $2.0 million in 2007, a favorable change of $4.6 million or 7 cents per share after taxes compared with 2006.
Effective December 31, 2006, we adopted Statement of Financial Accounting Standards (“SFAS”) No. 158, Employers' Accounting for Defined Benefit Pension and Other Postretirement Plans, an amendment of FASB Statements No 87, 88, 106 and 132(R). In accordance with this new standard we recognized the funded status of our pension and other postretirement plans in our balance sheet as of December 31, 2006, which included plan assets at fair value in excess of benefit obligations of $41.0 million. The adjustments in our balance sheet of our pension and other postretirement plans to recognize their funded status resulted in a decrease in prepaid pension cost of $27.7 million, an increase in related liabilities of $3.3 million, a decrease in non-current deferred income tax liabilities of $11.4 million and a decrease in shareholders’ equity of $19.6 million. Prepaid pension cost and related liabilities are included in “Other assets and deferred charges” and “Other noncurrent liabilities” in the consolidated balance sheets.
During the first quarter of 2006, we adopted Statement of Financial Accounting Standards No. 123(R), Share-Based Payment (“SFAS 123(R)”), which requires all stock-based compensation to be expensed and accounted for using a fair value-based method. The adoption of SFAS 123(R) and the granting of stock options in 2006 resulted in pretax charges for stock option-based compensation of $970,000 (2 cents per share after taxes) in 2006.
Strong cash flows from operations after investing activities and dividends of approximately $58 million and proceeds from the exercise of stock options of approximately $10 million resulted in a decline in net debt (total debt net of cash) of approximately $68 million in 2006. Consolidated net capitalization and other credit measures are provided in the financial condition section beginning on page 24.
Critical Accounting Policies
In the ordinary course of business, we make a number of estimates and assumptions relating to the reporting of results of operations and financial position in the preparation of financial statements in conformity with generally accepted accounting principles. Actual results could differ significantly from those estimates under different assumptions and conditions. We believe the following discussion addresses our critical accounting policies. These policies require management to exercise judgments that are often difficult, subjective and complex due to the necessity of estimating the effect of matters that are inherently uncertain.
Impairment and Useful Lives of Long-lived Identifiable Assets and Goodwill
We regularly assess our long-lived identifiable assets for impairment when events or circumstances indicate that their carrying value may not be recoverable from future cash flows. Any necessary impairment charges are recorded when we do not believe the carrying value of the long-lived asset will be recoverable. We also reassess the useful lives of our long-lived assets based on changes in our business and technologies.
We assess goodwill for impairment when events or circumstances indicate that the carrying value may not be recoverable, or, at a minimum, on an annual basis (December 1 of each year). We have made determinations as to what our reporting units are and what amounts of goodwill and intangible assets should be allocated to those reporting units.
In assessing the recoverability of long-lived identifiable assets and goodwill, we must make assumptions regarding estimated future cash flows, discount rates and other factors to determine if impairment tests are met or the fair value of the respective assets. If these estimates or their related assumptions change in the future, we may be required to record additional impairment charges. Based upon assessments performed, we recorded asset impairment losses for continuing operations related to long-lived identifiable assets of $1.2 million in 2006, $8.6 million in 2005 and $14.1 million in 2004.
Pension Benefits
We have noncontributory and contributory defined benefit (pension) plans that have significant net pension income developed from actuarial valuations. Inherent in these valuations are key assumptions including discount rates, expected return on plan assets and rate of future compensation increases. We are required to consider current market conditions, including changes in interest rates and plan asset investment returns, in determining these assumptions. Actuarial assumptions may differ materially from actual results due to changing market and economic conditions, higher or lower withdrawal rates or longer or shorter life spans of participants. These differences may result in a significant impact to the amount of net pension income recorded in future periods.
The discount rate is used to determine the present value of future payments. The discount rate is the single rate that, when applied to expected benefit payments, provides a present value equal to the present value of expected benefit payments determined by using the AA-rated bond yield curve. In general, our liability increases as the discount rate decreases and vice versa. Our weighted average discount rate was 5.70% at the end of 2006, 5.70% at the end of 2005 and 6.00% at the end of 2004, with changes between periods due to changes in market interest rates. The compensation increase assumption affects the estimate of future payments, and was 4% at the end of 2006, 2005 and 2004. A lower expected return on plan assets increases the amount of expense and vice versa. Decreases in the level of actual plan assets will also serve to increase the amount of pension expense. During 2006, 2005, 2004 and 2003, the value of our plan assets increased due to improved general market conditions after declining in 2002, 2001 and 2000. Our expected long-term return on plan assets has been 8.4% since 2004 based on market and economic conditions and asset mix (our expected return was 8.6% in 2003 and 9% in 2002 and prior years). See page 65 for more information on expected long-term return on plan assets and asset mix.
See the executive summary beginning on page 17 for further discussion regarding the financial impact of our pension plans.
Income Taxes
Many deductions for tax return purposes cannot be taken until the expenses are actually paid, rather than when the expenses are recorded for book purposes. In these circumstances, we accrue for the tax benefit expected to be received in future years if, in our judgment, it is more likely than not that we will receive such benefits. In addition, the amount and timing of certain current deductions (which reduce taxes currently payable or generate income tax refunds) require interpretation of tax laws. In these circumstances, we estimate and accrue income tax contingencies for differences in interpretation that may exist with tax authorities. On a quarterly basis, we review our judgments regarding income tax contingency accruals and the likelihood the benefits of a deferred tax asset will be realized. During the periodic reviews, we must consider a variety of factors, including the nature and amount of the tax income and expense items, the current tax statutes, the current status of audits performed by tax authorities and the projected future earnings. We believe the realization of our net deferred tax assets is reasonably assured and that our income tax contingency accruals are adequate as measured under existing accounting standards. As circumstances change, our valuation allowances for deferred tax assets, income tax contingency accruals and net earnings are adjusted accordingly in that period.
Recently Issued Accounting Standards In September 2006, the Financial Accounting Standards Board (“FASB”) issued FASB Staff Position ("FSP") No. AUG AIR-1, Accounting for Planned Major Maintenance Activities. The FSP is effective for the first fiscal year beginning after December 15, 2006. The FSP eliminates the accrual method of accounting for major maintenance activities, but continues to permit the use of the direct expensing, built-in overhaul and deferral methods. The FSP also continues to require accruals or deferrals for interim periods of annual costs that clearly benefit two or more interim periods. We are evaluating the FSP and have not determined whether or not it will have a material effect on our financial position or results of operations.
In July 2006, the FASB issued FASB Interpretation No. 48, Accounting for Uncertainty in Income Taxes, clarifying the accounting for uncertain tax positions. The interpretation prescribes a recognition threshold and measurement attribute for the financial statement recognition and measurement of a tax position taken or expected to be taken in a tax return. This interpretation is effective for fiscal years beginning after December 15, 2006 with earlier application encouraged. We are evaluating the interpretation and have not determined if it will have a material effect on our financial position or results of operations.
Results of Operations
2006 versus 2005
Revenues. Sales in 2006 increased by 16.7% compared with 2005. Net sales (sales less freight) increased 11.1% in Film Products primarily due to growth in higher value-added products, including surface protection, elastic and apertured materials, and higher selling prices, which were driven by higher raw material costs. Net sales increased 22.4% in Aluminum Extrusions due to higher volume (up 5.5%) and selling prices. For more information on net sales and volume, see the executive summary beginning on page 17.
Operating Costs and Expenses. Gross profit (sales minus cost of goods sold and freight) as a percentage of sales increased to 12.9% in 2006 from 12.7% in 2005. At Film Products, a higher gross profit margin was driven primarily by growth in higher value-added products, including surface protection, elastic and apertured materials, partially offset by the effects of higher average selling prices to cover higher average resin costs. Margins in Film Products also improved in 2006 versus 2005 from a favorable lag in the pass-through to customers of changes in resin costs and income from LIFO inventory liquidations of approximately $7.4 million in 2006 (including $2.9 million of income shown in “Cost of goods sold” in the consolidated statements of income from LIFO liquidations related to the shutdown of the facility in LaGrange, Georgia) compared with an unfavorable net lag and LIFO adjustment in 2005 of approximately $4.0 million. At Aluminum Extrusions, a lower gross profit margin was primarily due to the effects of higher selling prices to cover higher aluminum costs and appreciation of the Canadian Dollar, partially offset by higher volume and selling prices and lower energy costs. As a percentage of sales, selling, general and administrative (“SG&A”) expenses decreased to 6.1% in 2006 compared with 6.8% in 2005 due primarily to higher sales and the divestiture of substantially all of our interest in AFBS, Inc. (formerly known as Therics, Inc.) at the end of the second quarter of 2005. For more information on this divestiture, see the business segment review beginning on page 33.
R&D expenses declined to $8.1 million in 2006 from $9.0 million in 2005 primarily due to the divestiture of substantially all of our interest in AFBS.
Losses associated with plant shutdowns, asset impairments and restructurings, net of gains on sale of related assets and related income from LIFO inventory liquidations, in 2006 totaled $1.9 million ($1.4 million after taxes) and included:
| · | Executive Summary
Tredegar is a manufacturer of plastic films and aluminum extrusions. We also have developed and are marketing an initial line of bone graft substitutes through our Therics subsidiary. Descriptions of our businesses are provided on pages 1-4.
In Film Products, operating profit from ongoing operations was $43.3 million in 2004 compared with $45.7 million in 2003. The decline was primarily due to higher resin costs and the loss of certain domestic backsheet business at the end of the first quarter of 2003 (see the business segment review beginning on page 34 for more information), partially offset by the positive effects of sales growth for new value-added products. Average prices of low density polyethylene resin (a primary raw material for Film Products) in the U.S. increased by approximately 27% during the second half of 2004 (see the chart on page 28 for historical prices since 2000). Resin prices in Europe and Asia have exhibited similar trends. We estimate that resin price increases in theA fourth quarter resulted innet gain of $14,000 ($8,000 after taxes), a negative operating profit impactthird-quarter net gain of about $2 million compared with the third quarter of 2004. This is in addition to the $1 million adverse impact we estimate occurred between the second($615,000 after taxes), a second-quarter net gain of $822,000 ($494,000 after taxes) and third quarters.
To address fluctuating resin prices, we have pass-through or cost-sharing agreements covering about 65%a first-quarter pretax charge of our sales, but many have a 90-day lag. We are implementing price increases for many customers that are currently not subject to pass-through arrangements. Most new customer contracts contain resin pass-through arrangements. However, if resin prices continue to rise at a faster rate than selling prices, the delayed pass-through of costs will exert downward pressure on near-term profits.
We remain optimistic about the global growth prospects in Film Products, especially sales of new apertured, elastic, protective and other specialty films. The chart below shows the growth that we have achieved in these areas during the past year.
| |  |
We believe much of our sales growth is the result of investments made over the past two years. Aggregate capital expenditures in 2003 and 2004 totaled $102 million, and we expect to spend another $50 million in 2005,$404,000 ($243,000 after taxes) associated with about $10 million earmarked for a production line that will manufacture a new material that enhances the fit of personal care products. The new line is already contracted to SCA, a $12 billion global personal care market leader headquartered in Sweden. Approximately one-third of our capital expenditures during 2003 and 2004 and planned capital expenditures during 2005 relate to customer-specific opportunities that are covered by capital indemnification, take-or-pay or similar arrangements. Excluding these opportunities, we estimate that our ongoing capital expenditure requirement in Film Products is about $35 million annually.
On January 10, 2005, we announced that we are exploring the sale of the films plant in LaGrange, Georgia. This plant produces blown films used for adult incontinent and baby diaper backsheet, feminine hygiene pad pouch packaging, and other packaging and industrial applications. Annual revenues for the products that would be included in a sale are about $25 million. The proposed transaction is not expected to have a material impact on our financial results. On July 23, 2004, a subsidiary of Tredegar purchased the assets of Yaheng Perforated Film Material Co., Ltd. (“Yaheng”) for approximately $1.4 million. Yaheng, based in Shanghai, China, has 21 employees and manufactures apertured nonwovens used primarily in personal care markets.
In Aluminum Extrusions, operating profit from ongoing operations increased to $22.6 million in 2004 (volume of 243.4 million pounds) from $15.1 million in 2003 (volume of 228.2 million pounds). The $7.5 million or 50% increase in operating profit on 6.7% volume growth is primarily due to operating leverage and pricing improvements, partially offset by the adverse effects of appreciation of the Canadian Dollar (about $2.4 million). Based on existing operating levels, we expect future annual operating profits to change at 3 - 4 times the percentage change in volume. Volume in 2004 was up in most markets after declining by about 30% from the last cyclical peak around 1999. Volume in our largest market, commercial construction, improved by about 13% in 2004 compared with 2003. Our outlook for continued volume growth in 2005 remains favorable. Historically, cyclical upturns in the aluminum extrusions industry last several years with overall cross-cycle volume growth in the 3% range. We believe that our focus on end markets and products that require customization, customer service and quality make us less vulnerable to price competition from low-cost suppliers of stock-type products, including offshore manufacturers. Our most attractive end markets include residential and non-residential windows, curtain walls, louvers & vents, agricultural equipment, ladders, walkway covers, pre-engineered structures, pleasure boats, custom trailers, and displays.
We continue to focus on reducing costs and aligning our structure to meet the needs of our customers. Three areas that we believe will generate significant savings are the shutdown of the films plantmanufacturing facility in New Bern, North Carolina (the “New Bern Plant”) (which occurredLaGrange, Georgia, including a pretax gain of $2.9 million for related LIFO inventory liquidations (included in "Cost of goods sold" in the fourth quarterconsolidated statements of 2004)income), severance and other costs of $1.6 million, asset impairment charges of $130,000 and a gain on the restructuring overdisposal of equipment of $261,000 (included in “Other income (expense), net” in the next 12 monthsconsolidated statements of the R&D function in Film Products, and the shutdownincome);
|
| · | A third-quarter charge of $920,000 ($566,000 after taxes) related to expected future environmental costs at the aluminum extrusions plantfacility in Aurora, Ontario (the “Aurora Plant”) (expectedNewnan, Georgia (included in the first quarter"Cost of 2005). Annual cost savings from these moves are expected of about $4 million for the shutdown of the New Bern Plant, $2 million for the restructuring of the R&D function, and $2 million for the shutdown of Aurora Plant. Related incremental cash expenditures to achieve these savings are about $7 million, $8 million and $8 million, respectively. More information on Film Products and Aluminum Extrusions is provided in the business segment review beginning on page 34.
At Therics, sales and marketing efforts are evolving more slowly than expected, and we took steps in early January 2005 to reduce its expected loss rate from approximately $2.5 million to $2 million per quarter. We are exploring potential collaborations with other companies aimed at accelerating market penetration across a broader array of market segments.
We sold our venture capital investment portfolio in the first quarter of 2003 for cash proceeds of approximately $21.5 million, and its activities have been reported as discontinued operations. The sale generated income taxes recoverable of approximately $55 million, which we received in the first quarter of 2004. At December 31, 2004, we had $91 million of available borrowings under our credit facility. Key terms for the facility are summarized in the financial condition review on pages 23-27.
|
Critical Accounting Policies
In the ordinary course of business, we make a number of estimates and assumptions relating to the reporting of results of operations and financial position in the preparation of financial statements in conformity with generally accepted accounting principles. Actual results could differ significantly from those estimates under different assumptions and conditions. We believe the following discussion addresses our most critical accounting policies. These policies require management to exercise judgments that are often difficult, subjective and complex due to the necessity of estimating the effect of matters that are inherently uncertain.
Impairment and Useful Lives of Long-lived Identifiable Assets and Goodwill
We regularly assess our long-lived identifiable assets for impairment when events or circumstances indicate that their carrying value may not be recoverable from future cash flows. Any necessary impairment charges are recorded when we do not believe the carrying value of the long-lived asset will be recoverable. We also reassess the useful lives of our long-lived assets based on changes in our business and technologies.
We assess goodwill for impairment when events or circumstances indicate that the carrying value may not be recoverable, or, at a minimum, on an annual basis (December 1 of each year). We have made determinations as to what our reporting units are and what amounts of goodwill and intangible assets should be allocated to those reporting units.
In assessing the recoverability of long-lived identifiable assets and goodwill, we must make assumptions regarding estimated future cash flows, discount rates and other factors to determine if impairment tests are met or the fair value of the respective assets. If these estimates or their related assumptions change in the future, we may be required to record additional impairment charges. Based upon assessments performed, we recorded asset impairment losses for continuing operations related to long-lived identifiable assets of $14.1 million in 2004, $2.8 million in 2003 and $1.5 million in 2002.
Pension Benefits
We have noncontributory and contributory defined benefit (pension) plans that have significant net pension income developed from actuarial valuations. Inherent in these valuations are key assumptions including discount rates, expected return on plan assets and rate of future compensation increases. We are required to consider current market conditions, including changes in interest rates and plan asset investment returns, in determining these assumptions. Actuarial assumptions may differ materially from actual results due to changing market and economic conditions, higher or lower withdrawal rates or longer or shorter life spans of participants. These differences may result in a significant impact to the amount of net pension income recorded in future periods.
The discount rate is used to determine the present value of future payments. In general, our liability increases as the discount rate decreases and vice versa. We reduced our discount rate in each of the last three years (the rate was 6.00% at the end of 2004, 6.25% at the end of 2003 and 6.75% at the end of 2002) due to the decline in market interest rates. The compensation increase assumption affects the estimate of future payments, and was 4% at the end of 2004 and 2003 and 4.5% at the end of 2002. Compensation increases were lowered in 2003 as a result of expected lower inflation. A lower expected return on plan assets increases the amount of expense and vice versa. Decreases in the level of actual plan assets will also serve to increase the amount of pension expense. During 2004 and 2003, the value of our plan assets increased due to improved general market conditions after declining in 2002, 2001 and 2000. Last year we decreased our expected long-term return on plan assets to 8.4% and have maintained that rate based on current market and economic conditions and asset mix (our expected return was 8.6% in 2003 and 9% in 2002 and prior years).
We currently expect net pension income to decline in 2005 by approximately $2 million compared to 2004 after declining by $800,000 in 2004 compared to 2003. We expect our minimum cash-funding requirement to be about $600,000 in 2005.
|
Income Taxes
Many deductions for tax return purposes cannot be taken until the expenses are actually paid, rather than when the expenses are recorded for book purposes. In these circumstances, we accrue for the tax benefit expected to be received in future years if, in our judgment, it is more likely than not that we will receive such benefits. In addition, the amount and timing of certain current deductions (which reduce taxes currently payable or generate income tax refunds) require interpretation of tax laws. In these circumstances, we estimate and accrue income tax contingencies for differences in interpretation that may exist with tax authorities. On a quarterly basis, we review our judgments regarding income tax contingency accruals and the likelihood the benefits of a deferred tax asset will be realized. During the periodic reviews, we must consider a variety of factors, including the nature and amount of the tax income and expense items, the current tax statutes, the current status of audits performed by tax authorities and the projected future earnings. We believe the realization of our net deferred tax assets is reasonably assured and that our income tax contingency accruals are adequate. If circumstances change, our valuation allowances for deferred tax assets, income tax contingency accruals and net earnings are adjusted accordingly in that period.
Recently Issued Accounting Standards
In December 2004, the Financial Accounting Standards Board (“FASB”) revised Statement of Financial Accounting Standards (“SFAS”) No. 123, Share-Based Payment. This statement requires that the cost of employee services received in exchange for equity instruments be measured based on the fair value of the award on the grant date. The statement also requires that the cost be recognized over the employee service period required to receive the award. The statement applies to awards granted after the effective date and to awards modified, repurchased or cancelled after that date. The statement is effective as of the beginning of the first interim or annual reporting period that begins after June 15, 2005. Early adoption is permitted. The adoption of this standard will have no impact on cash flow. The primary impact of adoption on Tredegar will be the recognition of compensation expense for stock options granted. Currently, we disclose the pro forma effects of treating stock option grants as compensation expense under the fair value-based method (see pages 51-53). We expect to continue to use the Black-Scholes options-pricing model to determine the estimated fair value of option grants but are still evaluating our transition method. We believe that the pro forma effects that have been disclosed are not materially different from compensation expense that would have been recognized if this standard had been previously adopted.
In November 2004, the FASB issued SFAS No. 151,Inventory Costs – An Amendment of ARB No. 43, Chapter 4. This statement clarifies that abnormal amounts of idle facility expense, freight, handling costs and wasted material (spoilage) should be expensed as current-period charges. In addition, this statement requires that allocation of fixed production overheads to the costs of conversion be based on the normal capacity of the production facilities. The statement is effective for inventory costs incurred during the fiscal years beginning after June 15, 2005. Early adoption is permitted. The adoption of this standard will have no impact on cash flow, and we do not expect it to have a significant impact on amounts reportedgoods sold" in the consolidated statementstatements of income and balance sheet.
In October 2004, the American Jobs Creation Act of 2004 (“AJCA”) was signed into law. In December 2004, the FASB issued Staff Position No. 109-1 (“FSP 109-1”),Application of FASB Statement No. 109, Accounting for Income Taxes, to the Tax Deduction on Qualified Production Activities Provided by the American Jobs Creation Act of 2004 and Staff Position No. 109-2 (“FSP 109-2”),Accounting and Disclosure Guidance for the Foreign Earnings Repatriation Provision within the American Jobs Creation Act of 2004. FSP 109-1 clarifies that the manufacturer’s tax deduction provided for under the AJCA should be accounted for as a special deduction in accordance with SFAS No. 109 and not as a tax rate reduction. FSP 109-2 provides accounting and disclosure guidance for the repatriation of certain foreign earnings to a U.S. taxpayer as provided for in the AJCA. We do not expect that the tax benefits resulting from the AJCA will have a material impact on our financial statements.
Results of Operations
2004 versus 2003
Revenues. Overall, sales for 2004 increased 17% compared with 2003. Net sales (sales less freight) for Film Products and Aluminum Extrusions increased primarily due to higher sales volume and mix, including sales of new value-added products in Film Products, and higher selling prices driven by higher raw material costs. For more information on net sales, see the business segment review beginning on page 34.
income); |
Operating Costs and Expenses. Gross profit (sales less cost of goods sold and freight) as a percentage of sales decreased to 14.1% from 15.4% in 2003. At Film Products, the lower gross profit margin was driven primarily by higher resin costs and the loss of certain domestic backsheet business at the end of the first quarter of 2003 (see the business segment review beginning on page 34 for more information), partially offset by higher overall gross profit. For more information on resin costs, see the executive summary beginning on page 15. At Aluminum Extrusions, the gross profit margin increased primarily due to higher volume, operating leverage (generally constant fixed costs until full capacity utilization is achieved) and selling price increases above raw material cost increases, partially offset by appreciation of the Canadian dollar.
As a percentage of sales, selling, general and administrative (“SG&A”) expenses decreased to 7.0% compared with 7.2% in 2003 primarily due to higher sales. Overall SG&A expenses were up by $6.7 million partially due to the classification of certain costs at Therics as operating versus R&D (see below) consistent with the commercialization of the company’s initial line of bone graft substitutes. SG&A expenses also increased in equivalent U.S. Dollars as a result of the appreciation of the Euro, Hungarian Forint and Canadian Dollar.
R&D expenses declined to $15.3 million in 2004 from $18.8 million in 2003. R&D spending at Therics declined to $7.8 million in 2004 from $11.2 million in 2003 due to cost reduction efforts and the classification of certain costs as operating versus R&D consistent with the commercialization of the company’s initial line of bone graft substitutes. R&D spending at Film Products was $7.5 million in 2004 compared with $7.6 million in 2003.
Losses associated with plant shutdowns, asset impairments and restructurings in 2004 totaled $23 million ($15.2 million after taxes) and included:
| |
•· | A fourth quarter charge of $84,000$143,000 ($56,000 after taxes), a third-quarter charge of $828,000 ($537,000 after taxes), a second-quarter charge of $994,000 ($647,00093,000 after taxes) and a first-quarter charge of $666,000 ($432,000 after taxes) related to accelerated depreciation from plant shutdowns and restructurings in Film Products; | | | • | A fourth-quarter charge of $569,000 (of this amount, $59,000 for employee relocation is included in SG&A expenses in the consolidated statements of income) ($369,000 after taxes) and a third-quarter charge of $709,000 ($461,000 after taxes) related to severance for 30 people and other employee-related costs associated with the restructuring of the R&D operations in Film Products (we anticipate recognizing additional charges associated with this restructuring over the next 12 months of approximately $2.8 million ($1.8 million after taxes)), including costs associated with relocating R&D functions to Richmond, Virginia; | | | • | A fourth-quarter charge of $639,000 ($415,000 after taxes), a third-quarter charge of $617,000 ($401,000 after taxes), a second-quarter charge of $300,000 ($195,000 after taxes) and a first-quarter charge of $537,000 ($349,000 after taxes) primarily related to severance (63 people) and other employee-related costs associated with the shutdown of the New Bern Plant; | | | • | A third-quarter charge of $357,000 ($329,000 after taxes) and a second-quarter charge of $2.7 million ($1.9 million after taxes) for the loss on the sale of the films business in Argentina (proceeds net of transaction costs were $803,000 ($401,000 net of cash included in business sold)); | | | • | A fourth-quarter charge of $352,000 ($228,000 after taxes), a third-quarter charge of $195,000 ($127,000 after taxes) and a first-quarter charge of $9.6 million ($6.2 million after taxes) related to the planned shutdown of the Aurora Plant, including asset impairment charges of $7.1 million and severance and other employee-related costs of $2.5 million (these costs are contractually-related for about 100 people and have been immediately accrued and we anticipate recognizing additional shutdown-related costs of about $2 million in the first quarter of 2005); | | | • | A third-quarter charge of $170,000 ($111,000 after taxes) for additional costs incurred related to a plant shutdown in Film Products; | | | • | A second-quarter charge of $300,000 ($195,000 after taxes), partially offset by a fourth-quarter gain of $104,000 ($68,000 after taxes), related to the loss on the sale of the previously shutdown films manufacturing facility in Manchester, Iowa (the “Manchester Plant”); | | | • | A fourththird quarter charge of $427,000$494,000 ($277,000 after taxes) and a second-quarter charge of $879,000 ($571,000321,000 after taxes) related to the estimated loss on the sub-lease of a portion of the ThericsAFBS facility in Princeton, New Jersey; |
•· | Second-quarter charges of $575,000$459,000 ($374,000 after taxes) in Film Products and $146,000 ($95,000 after taxes) in Aluminum Extrusions related to asset impairments; and | | | • | Fourth quarter charges of $1.4 million ($912,000 after taxes) related to severance and other employee-related costs associated with restructurings in Therics ($590,000 before taxes), Film Products ($532,000 before taxes) and Aluminum Extrusions ($280,000 before taxes) and a second-quarter charge of $145,000 ($94,000 after taxes) related to severance at Therics (an aggregate of 24 people were affected by these restructurings). |
| Remaining liabilities for exit and disposal activities at December 31, 2004 ($8.5 million), primarily include the shutdown of the Aurora Plant, the relocation of R&D functions in Film Products to Richmond, Virginia, the recent staff reductions at Therics and the estimated loss on the sub-lease at Therics.
Gain on sale of corporate assets in 2004 includes a fourth-quarter gain on the sale of land of $1 million ($649,000 after taxes and proceeds of $1.3 million), a second-quarter gain on the sale of land of $413,000 ($268,000 after taxes and proceeds of $647,000) and a first-quarter gain on the sale of public equity securities of $6.1 million ($4 million after taxes and proceeds of $7.2 million). There were no public equity securities held at December 31, 2004. These gains are included in “Other income (expense), net” in the consolidated statements of income and separately shown in the operating profit by segment table on page 11.
Income taxes in 2004 include a third-quarter tax benefit of $4 million related to the reversal of income tax contingency accruals upon the favorable conclusion of IRS and state examinations through 2000.
The other gain of $7.3 million ($4.8 million after taxes) included in the Aluminum Extrusions section of the operating profit by segment table on page 11 is comprised of the present value of an insurance settlement of $8.4 million (future value of $8.5 million) associated with environmental matters related to prior years, partially offset by accruals for expected future environmental costs of $1 million. The company received $5.2 million of the $8.5 million insurance settlement in September of 2004 and recognized receivables at present value for future amounts due ($1.5 million due in February of 2005 and $1.8 million due in February 2006). The gain from the insurance settlement is included in “Other income (expense), net” in the consolidated statements of income, while the accruals for expected future environmental costs are included in “Cost of goods sold.”
For more information on costs and expenses, see the business segment review beginning on page 34.
Interest Income and Expense.Interest income, which is included in “Other income (expense), net” in the consolidated statements of income, was $350,000 in 2004 and $1.2 million in 2003. Interest income was down primarily due to lower average cash and cash equivalents balances (excess cash was used to repay debt in conjunction with our debt refinancing in October 2003). Our policy permits investment of excess cash in marketable securities that have the highest credit ratings and maturities of less than one year with the primary objectives being safety of principal and liquidity.
|
Interest expense declined to $3.2 million in 2004 compared with $6.8 million in 2003. Average debt outstanding and interest rates were as follows:
|
| | (In Millions) | 2004 | | 2003 | |
|---|
| Floating-rate debt with interest charged on a rollover
basis at one-month LIBOR plus a credit spread: | | | | | | | | | Average outstanding debt balance | | $ | 105.2 | | $ | 108.8 | | | Average interest rate | | | 2.7 | % | | 2.0 | % | Floating-rate debt fixed via interest rate swaps in the
second quarter of 2001 and maturing in the second | | | | | | | | | quarter of 2003: | | | | | | | | | Average outstanding debt balance | | $ | — | | $ | 28.9 | | | Average interest rate | | | — | | | 5.4 | % | | Fixed-rate and other debt: | | | | | | | | | Average outstanding debt balance | | $ | 5.6 | | $ | 7.2 | | | Average interest rate | | | 6.0 | % | | 6.4 | % |
| | Total debt: | | | | | | | | | Average outstanding debt balance | | $ | 110.8 | | $ | 216.9 | | | Average interest rate | | | 2.8 | % | | 2.6 | % |
|
Income Taxes. The effective tax rate from continuing operations was 26.0% in 2004, down from 35.7% in 2003. The decrease is primarily due to a tax benefit of $4 million related to the reversal of income tax contingency accruals upon favorable conclusion of IRS and state examinations through 2000, partially offset by tax benefits of about $600,000 not recognized on 2004 operating losses of certain foreign subsidiaries that may not be recoverable in the carryforward period.
Discontinued Operations.On March 7, 2003, Tredegar Investments, Inc. (“Tredegar Investments”) reached definitive agreements to sell substantially all of its venture capital investment portfolio. For more information on the sale (including a summary of venture capital investment activities from 2002 through disposal in 2003), see the business segment review beginning on page 37. The results for venture capital investment activities have been reported as discontinued operations and include an after-tax gain of $2.9 million in 2004 primarily related to the reversal of business and occupancy tax contingency accruals upon favorable resolution.
2003 versus 2002
Revenues. Overall, sales for 2003 decreased 2% compared with 2002. Net sales (sales less freight) for Film Products and Aluminum Extrusions declined primarily due to lower sales volume, partially offset by higher selling prices driven by higher raw material costs. For more information on net sales, see the business segment review beginning on page 34.
Operating Costs and Expenses. Gross profit (sales less cost of goods sold and freight) as a percentage of sales decreased to 15.4% in 2003 from 20.5% in 2002. In Film Products, an overall lower gross profit margin was driven primarily by the loss of certain domestic backsheet business (lower overall contribution to cover fixed costs), higher raw material prices and higher manufacturing costs on certain new products. In Aluminum Extrusions, the gross profit margin declined primarily due to the impact of the Canadian Dollar appreciating against the U.S. Dollar, higher energy costs, lower volume and higher insurance costs. For more information on the loss of certain domestic backsheet business, see the business segment review for Film Products beginning on page 34.
As a percentage of sales, SG&A expenses increased to 7.2% compared with 6.9% in 2002, primarily due to lower sales, the appreciation of the Canadian Dollar and Euro against the U.S. Dollar, higher employee-related costs, and expenses associated with commencing the implementation of a new information system in Film Products.
R&D expenses declined to $18.8 million in 2003 ($11.2 million for Therics and $7.6 million for Film Products) from $20.3 million in 2002 ($12.5 million for Therics and $7.8 million for Film Products). The decline was primarily due to cost reduction efforts at Therics.
|
Losses associated with plant shutdowns, asset impairments and restructurings in 2003 totaled $11.4 million ($7.4 million289,000 after taxes) and included:
| |
• | A fourth-quarter charge of $875,000 ($560,000 after taxes) for asset impairments in the films business, includingfirst-quarter charges of $466,000$268,000 ($298,000 after taxes) relating to accelerated depreciation of assets at the New Bern Plant; | | | • | A fourth-quarter charge of $611,000 ($391,000 after taxes) for approximately 50% of the total severance costs and other employee-related costs in connection with the shutdown of the New Bern Plant; | | | • | A third-quarter charge of $945,000 ($605,000 after taxes) relating to accelerated depreciation of assets at the New Bern Plant; | | | • | A third-quarter charge of $299,000, a second quarter charge of $53,000 and a first-quarter charge of $85,000 (collectively $280,000 after taxes) for additional costs incurred related to the shutdown of the films plants in Tacoma, Washington, Carbondale, Pennsylvania and the Manchester Plant; | | | • | A third-quarter charge of $322,000 ($206,000 after taxes) for severance and other employee-related costs in connection with restructurings in Film Products; | | | • | A third-quarter charge of $2.2 million ($1.4 million after taxes) and a second-quarter charge of $549,000 ($357,000 after taxes) related to the estimated loss on the sub-lease of a portion of the Therics facility in Princeton, New Jersey; | | | • | A third-quarter charge of $256,000 ($163,000170,000 after taxes) for severance and other employee-related costs in connection with restructurings in Aluminum Extrusions;Extrusions ($514,000) and Film Products ($213,000); and |
| · | First-quarter charges of $1 million ($876,000 after taxes) for asset impairments relating to machinery & equipment in Film Products. |
In 2006, a pretax gain on the sale of public equity securities of $56,000 (proceeds also of $56,000) is included in “Other income (expense), net” in the consolidated statements of income and “Gain on the sale of corporate assets” in the segment operating profit table on page 13. Income taxes in 2006 include a reversal of a valuation allowance of $577,000 for deferred tax assets associated with capital loss carry-forwards recorded with the write-down of the investment in Novalux. Outside appraisal of the value of corporate assets, primarily real estate, performed in December 2006, indicates that realization of related deferred tax assets is more likely than not.
For more information on costs and expenses, see the executive summary beginning on page 17.
Interest Income and Expense. Interest income, which is included in “Other income (expense), net” in the consolidated statements of income, was $1.2 million in 2006 and $586,000 in 2005. Interest income was up primarily due to a higher average yield earned on cash equivalents. Our policy permits investment of excess cash in marketable securities that have the highest credit ratings and maturities of less than one year with the primary objectives being safety of principal and liquidity. Interest expense increased to $5.5 million in 2006 compared with $4.6 million in 2005. Average debt outstanding and interest rates were as follows: | | | | | | | | (In Millions) | | 2006 | | 2005 | | | Floating-rate debt with interest charged on a rollover basis at one-month LIBOR plus a credit spread: | | | | | | | Average outstanding debt balance | | $ | 91.0 | | $ | 110.0 | | | Average interest rate | | | 5.9 | % | | 4.5 | % | | Fixed-rate and other debt: | | | | | | | | | Average outstanding debt balance | | $ | 4.4 | | $ | 5.9 | | | Average interest rate | | | 6.5 | % | | 5.5 | % | | Total debt: | | | | | | | | | Average outstanding debt balance | | $ | 95.4 | | $ | 115.9 | | | Average interest rate | | | 5.9 | % | | 4.6 | % |
Income Taxes. The effective tax rate declined to 35.1% in 2006 compared with 38.1% in 2005 due to the numerous variances between years that are shown in the effective tax rate reconciliation provided in Note 14 of the notes to financial statements.
2005 versus 2004
Revenues. Overall, sales for 2005 increased 11.1% compared with 2004. Net sales (sales less freight) for Film Products increased 11.4% primarily due to sales of higher value-added products (mainly apertured, elastic and surface protection materials) and higher selling prices driven by higher raw material costs. Net sales for Aluminum Extrusions increased 11% primarily due to higher selling prices driven by higher raw material and energy costs and higher sales volume (volume was up 1.2%). For more information on net sales, see the business segment review beginning on page 33.
Operating Costs and Expenses. Gross profit (sales less cost of goods sold and freight) as a percentage of sales decreased to 12.7% in 2005 from 14.1% in 2004. At Film Products, the lower gross profit margin was driven primarily by higher resin costs, partially offset by higher overall gross profit from sales of higher value-added products. For more information on resin costs, see the executive summary beginning on page 17. At Aluminum Extrusions, the gross profit margin decreased in 2005 compared with 2004 primarily due to higher energy costs and strength of the Canadian Dollar, partially offset by price increases, higher volume and an energy surcharge. As a percentage of sales, SG&A expenses decreased to 6.8% in 2005 compared with 7.0% in 2004 due to higher sales and the divestiture of substantially all of our interest in AFBS at the end of the second quarter of 2005, partially offset by the classification of certain costs at AFBS as operating versus R&D consistent with the commercialization of the company’s bone void filler products last year.
R&D expenses declined to $9.0 million in 2005 from $15.3 million in 2004. R&D spending at AFBS declined to $2.4 million in 2005 from $7.8 million in 2004 due to the divestiture of substantially all of our interest in AFBS at the end of the second quarter of 2005. Further contributing to lower R&D expenses at AFBS were cost reduction efforts and the classification of certain costs as operating versus R&D consistent with the commercialization of the company’s bone void filler products last year. R&D spending at Film Products dropped to $6.6 million in 2005 compared with $7.5 million in 2004 due to restructuring.
Losses associated with plant shutdowns, asset impairments and restructurings, net of gains on sale of related assets, in 2005 totaled $14.6 million ($9.4 million after taxes) and included:
•· | A fourth-quarter charge of $269,000 ($174,000 after taxes) and a second-quarter charge of $3.9$10 million ($2.56.5 million after taxes) related to the sale or assignment of substantially all of AFBS assets, including asset impairment charges of $5.6 million, lease-related losses of $3.3 million and severance (31 people) and other transaction-related costs of $1.4 million (see page 35 for additional information on the transaction); |
| · | Fourth-quarter charges of $397,000 ($256,000 after taxes), third-quarter charges of $906,000 ($570,000 after taxes), second-quarter charges of $500,000 ($317,000 after taxes) and first-quarter charges of $418,000 ($266,000 after taxes) related to severance and other employee-related costs in connectionassociated with restructurings in Film Products ($1.61.1 million before taxes), and Aluminum Extrusions ($648,000 before taxes) and at corporate headquarters ($1.2 million455,000 before taxes andtaxes; included in “Corporate expenses, net” in the segment operating profit by segment table on page 11)13) (an aggregate of 21 people were affected by these restructurings); |
| · | A fourth-quarter charge of $2.1 million ($1.3 million after taxes) related to the shutdown of the films manufacturing facility in LaGrange, Georgia, including asset impairment charges of $1.6 million and Thericsseverance (15 people) and other costs of $486,000; |
| · | A fourth-quarter gain of $1.9 million ($1.2 million beforeafter taxes);, a third-quarter charge of $198,000 ($127,000 after taxes), a second-quarter net gain of $71,000 ($46,000 after taxes) and a first-quarter charge of $470,000 ($301,000 after taxes) related to the shutdown of the aluminum extrusions facility in Aurora, Ontario, including a $1.7 million gain on the sale of the facility (included in "Other income (expense), net" in the consolidated statements of income) and $1.1 million of shutdown-related costs partially offset by the reversal to income of certain accruals associated with severance and other costs of $709,000; |
| | •· | A second-quarter charge of $956,000$27,000 ($612,00016,000 after taxes) for asset impairments in the films business, including chargesand a first-quarter gain of $312,000$1.6 million ($200,000973,000 after taxes) related to accelerated depreciationthe shutdown of assets at the films manufacturing facility in New Bern, Plant; andNorth Carolina, including a $1.8 million gain on the sale of the facility (included in "Other income (expense), net" in the consolidated statements of income), partially offset by shutdown-related expenses of $225,000; |
| | •· | A second-quarterfirst-quarter charge of $388,000$1 million ($248,000653,000 after taxes) for process reengineering costs associated with the implementation of a global information system in Film Products (included in "Costs of goods sold" in the consolidated statements of income); |
| · | Fourth-quarter charges of $118,000 ($72,000 after taxes), third-quarter charges of $595,000 ($359,000 after taxes), second-quarter charges of $250,000 ($150,000 after taxes) partially offset by a net first-quarter gain of $120,000 ($72,000 after taxes) related to an early retirement programseverance and other employee-related accruals associated with the restructuring of the research and development operations in Aluminum Extrusions.Film Products (of this amount, $1.4 million in pretax charges for employee relocation and recruitment is included in SG&A expenses in the consolidated statements of income); |
| · | The loss from unusual items in 2003A second-quarter gain of $1.1 million$653,000 ($694,000392,000 after taxes) relatesrelated to the shutdown of the films manufacturing facility in Carbondale, Pennsylvania, including a first-quarter charge to adjust depreciation and amortization at Therics based on Tredegar’s decision to suspend divestiture efforts. Results for 2003 also included a fourth-quarter$630,000 gain of $1.4 million ($886,000 after taxes) on the sale of land at the facility in Richmond Hill, Ontario (total proceeds of approximately $1.8 million), and gains totaling $5.2 million ($3.3 million after taxes) on the sale of corporate assets. The gains from the sale of corporate assets included:
| |
• | A fourth-quarter gain of $2.6 million ($1.6 million after taxes) from the sale of 547,500 shares of Illumina, Inc. common stock (NASDAQ: ILMN) for total proceeds of $3.8 million; | | | • | A fourth-quarter gain of $355,000 ($229,000 after taxes) from the sale of 64,150 shares of Vascular Solutions, Inc. common stock (NASDAQ: VASC) for total proceeds of $403,000; | | | • | A third-quarter gain of $942,000 ($608,000 after taxes) from the sale of 200,000 shares of VASC for total proceeds of $1.1 million; and | | | • | A third-quarter gain of $1.3 million and fourth-quarter gain of $15,000 (collectively $841,000 after taxes) from the sale of corporate real estate (total proceeds of approximately $1.8 million). |
| The gains from the sale of land and corporate assets are included(included in “Other income (expense), net” in the consolidated statements on income), and the reversal to income of certain shutdown-related accruals of $23,000;
|
| · | Fourth-quarter charges of $583,000 ($351,000 after taxes) for asset impairments in Film Products; |
| · | A net fourth-quarter charge of $495,000 ($310,000 after taxes) in Aluminum Extrusions, including an asset impairment of $597,000, partially offset by the reversal to income of certain shutdown-related accruals of $102,000; |
| · | Fourth-quarter charges of $31,000 ($19,000 after taxes), third-quarter charges of $117,000 ($70,000 after taxes), second-quarter charges of $105,000 ($63,000 after taxes) and first-quarter charges of $100,000 ($60,000 after taxes) for accelerated depreciation related to restructurings in Film Products; and |
| · | A fourth-quarter charge of $182,000 ($119,000 after taxes) in Film Products related to the write-off of an investment. |
Gain on sale of corporate assets in 2005 includes a pretax gain of $61,000 related to the sale of corporate real estate. This gain is included in “Other income (expense), net” in the consolidated statements of income and separately shown in the segment operating profit table on page 13.
During the first quarter of 2005, we recognized a pretax gain for interest receivable on tax refund claims of $508,000 ($327,000 after taxes) (included in "Other income (expense), net" in the consolidated statements of income and "Corporate expenses, net" in the segment operating profit table on page 13).
During the fourth quarter of 2005, we recognized a pretax loss of $5 million ($3.8 million after taxes) from the write-down of our investment in Novalux, Inc. to estimated fair value at that time of $1.1 million. Novalux is a developer of laser technology for potential use in a variety of applications. The reduction in estimated fair value was due to longer than anticipated delays both in bringing the company’s technology to market and in obtaining key development partnerships as well as liquidity issues. The loss from the write-down is included in “Other income (expense), net” in the consolidated statements of income and separately shown in the segment operating profit table on page 13. Subsequent to the first quarter of 2006, Novalux prospects improved and we invested an aggregate of $542,000 in May and September of 2006. As of December 31, 2006, our investment in Novalux was $6.6 million. Our carrying value in Novalux of $1.6 million and $1.1 million at December 31, 2006 and 2005, respectively, is included in “Other assets and deferred charges” in the consolidated balance sheet. Our voting ownership of Novalux as of December 31, 2006 is approximately 12% (11% on a fully diluted basis).
For more information on costs and expenses, see the business segment review beginning on page 33.
Interest Income and Expense. Interest income, which is included in “Other income (expense), net” in the consolidated statements of income, was $586,000 in 2005 and $350,000 in 2004. Interest income was up primarily due to a higher average yield earned on cash equivalents. Our policy permits investment of excess cash in marketable securities that have the highest credit ratings and maturities of less than one year with the primary objectives being safety of principal and liquidity.
Interest expense increased to $4.6 million in 2005 compared with $3.2 million in 2004. Average debt outstanding and interest rates were as follows: | | | | | | | | (In Millions) | | 2005 | | 2004 | | | Floating-rate debt with interest charged on a rollover basis at one-month LIBOR plus a credit spread: | | | | | | | Average outstanding debt balance | | $ | 110.0 | | $ | 105.2 | | | Average interest rate | | | 4.5 | % | | 2.7 | % | | Fixed-rate and other debt: | | | | | | | | | Average outstanding debt balance | | $ | 5.9 | | $ | 5.6 | | | Average interest rate | | | 5.5 | % | | 6.0 | % | | Total debt: | | | | | | | | | Average outstanding debt balance | | $ | 115.9 | | $ | 110.8 | | | Average interest rate | | | 4.6 | % | | 2.8 | % |
Income Taxes. The effective tax rate from continuing operations was 38.1% in 2005, up from 26.0% in 2004. The lower rate in 2004 reflects a tax benefit of $4 million related to the reversal of income tax contingency accruals upon favorable conclusion of IRS and state examinations through 2000.
Financial Condition
Assets and Liabilities
Changes in operating assets and liabilities from December 31, 2005 to December 31, 2006 are summarized below:
| · | Accounts receivable increased $2.5 million (2.1%). |
| - | Accounts receivable in Film Products increased by $6.5 million due mainly to higher sales. Days sales outstanding (“DSO”) was 46 at December 31, 2006 compared with 45 days at December 31, 2005. |
| - | Accounts receivable in Aluminum Extrusions decreased by $2.1 million. DSO was about 45, consistent with last year. |
| - | Accounts receivable at Corporate declined by $1.9 million due to funds received from an insurance settlement in February 2006. |
| · | Inventories increased by $6.5 million (10.4%). |
| - | Inventories in Film Products increased by $3.4 million. Inventory days climbed to 43, up from 38 at September 30, 2006 due to a build-up in inventory caused by lower sales than expected. We believe that the unfavorable sales variance in the fourth quarter of 2006 is due to customer inventory corrections. Inventory days are still about 5 days below last year, which is indicative of the success achieved by the inventory management program initiated at the beginning of the year. |
| - | Inventories in Aluminum Extrusions increased by $3.1 million. Inventory days were 35 in Aluminum Extrusions at December 31, 2006 compared with 32 days at December 31, 2005. |
| · | Net property, plant and equipment was up $2.9 million (0.9%) due primarily to appreciation of foreign currencies relative to the U.S. Dollar ($9.1 million), capital expenditures of $40.6 million compared with depreciation of $44.1 million and asset impairments in Film Products of $1.2 million. |
| · | Accounts payable increased by $7.7 million (12.5%). |
| - | Accounts payable days were 29 in Film Products at December 31, 2006 compared with 28 days at December 31, 2005. |
| - | Accounts payable days were 27 in Aluminum Extrusions compared with 26 days at December 31, 2005. |
| · | Accrued expenses increased by $5.9 million (16.3%) due primarily to incentive compensation accruals (there was no significant incentive compensation earned in 2005) and the timing of payments. |
| · | Other noncurrent assets decreased and other noncurrent liabilities increased due primarily to the adoption of SFAS No. 158. |
| · | Net deferred income tax liabilities in excess of assets increased by $3.2 million due to numerous changes between years in the balance of the components shown in the segment operating profit table on page 11. For more information on costsDecember 31, 2006 and expenses, see the business segment review beginning on page 34.
Interest Income and Expense.Interest income, which is included in “Other income (expense), net” in the consolidated statements of income, was $1.2 million in 2003 and $1.9 million in 2002. Despite a higher average cash and cash equivalents balance, interest income was down due to lower average tax equivalent yield earned on cash equivalents (1% in 2003 and 1.9% in 2002).
Interest expense was $6.8 million in 2003 (including a charge of $737,000 for the write-off2005 schedule of deferred financing costs associated with credit facilities replaced) compared with $9.4 millionincome tax assets and liabilities provided in 2002. Capitalized interest costs were $593,000Note 14 of the notes to financial statements.
|
Net capitalization and indebtedness as defined under our revolving credit agreement as of December 31, 2006 are as follows: | | | | Net Capitalization and Indebtedness as of Dec. 31, 2006 | | | (In Thousands) | | | Net capitalization: | | | | | Cash and cash equivalents | | $ | 40,898 | | | Debt: | | | | | $300 million revolving credit agreement maturing December 15, 2010 | | | 60,000 | | | Other debt | | | 2,520 | | | Total debt | | | 62,520 | | | Debt net of cash and cash equivalents | | | 21,622 | | | Shareholders' equity | | | 516,595 | | | Net capitalization | | $ | 538,217 | | | | | | | | | Indebtedness as defined in revolving credit agreement: | | | | | | Total debt | | $ | 62,520 | | | Face value of letters of credit | | | 5,907 | | | Liabilities relating to derivative financial instruments | | | 116 | | | Indebtedness | | $ | 68,543 | |
Under the revolving credit agreement, borrowings are permitted up to $300 million, and $239 million was available to borrow at December 31, 2006. The credit spread and commitment fees charged on the unused amount under the revolving credit agreement at various indebtedness-to-adjusted EBITDA levels are as follows: | | | Pricing Under Revolving Credit Agreement (Basis Points) | EBITDA Ratio | | Over LIBOR | | Fee | | > 2.50x but <= 3x | | 125 | | 25 | | > 1.75x but <= 2.50x | | 100 | | 20 | | > 1x but <=1.75x | | 87.5 | | 17.5 | | <= 1x | | 75 | | 15 |
At December 31, 2006, the interest rate on debt under the revolving credit agreement was priced at one-month LIBOR plus the applicable credit spread of 75 basis points.
The computations of adjusted EBITDA, adjusted EBIT, the leverage ratio and interest coverage ratio as defined in the credit agreement are presented below along with the related most restrictive covenants. Adjusted EBITDA and adjusted EBIT as defined in the credit agreement are not intended to represent cash flow from operations as defined by GAAP and should not be considered as either an alternative to net income or to cash flow. | | | | | | Computations of Adjusted EBITDA, Adjusted EBIT, Leverage Ratio and | | | Interest Coverage Ratio as Defined in Credit Agreement Along with Related Most | | | Restrictive Covenants | | | For the Year Ended December 31, 2006 (In Thousands) | | | Computations of adjusted EBITDA and adjusted EBIT as defined in | | | | | Credit Agreement: | | | Net income | | $ | 38,201 | | | Plus: | | | | | | After-tax losses related to discontinued operations | | | - | | | Total income tax expense for continuing operations | | | 20,636 | | | Interest expense | | | 5,520 | | | Charges related to stock option grants and awards accounted for under the fair value-based method | | | 970 | | | Losses related to the application of the equity method of accounting | | | 25 | | | Depreciation and amortization expense for continuing operations | | | 44,281 | | | All non-cash losses and expenses, plus cash losses and expenses not to exceed $10,000, for continuing operations that are classified as unusual, extraordinary or which are related to plant shutdowns, asset impairments and/or restructurings (cash-related of $3,850) | | | 5,000 | | | Minus: | | | | | | After-tax income related to discontinued operations | | | - | | | Total income tax benefits for continuing operations | | | - | | | Interest income | | | (1,240 | ) | | All non-cash gains and income, plus cash gains and income not to exceed $10,000, for continuing operations that are classified as unusual, extraordinary or which are related to plant shutdowns, asset impairments and/or restructurings (cash-related of $317) | | | (3,206 | ) | | Plus or minus, as applicable, pro forma EBITDA adjustments associated with acquisitions and asset dispositions | | | - | | | Adjusted EBITDA as defined in Credit Agreement | | | 110,187 | | | Less: Depreciation and amortization expense for continuing operations (including pro forma for acquisitions and asset dispositions) | | | (44,281 | ) | | Adjusted EBIT as defined in Credit Agreement | | $ | 65,906 | | | Indebtedness: | | | | | | Total debt | | $ | 62,520 | | | Face value of letters of credit | | | 5,907 | | | Indebtedness | | $ | 68,427 | | | Shareholders' equity at December 31, 2006 | | $ | 516,595 | | | Computations of leverage and interest coverage ratios as defined in | | | | | | Credit Agreement: | | | | | | Leverage ratio (indebtedness-to-adjusted EBITDA) | | | .62x | | | Interest coverage ratio (adjusted EBIT-to-interest expense) | | | 11.94x | | | Most restrictive covenants as defined in Credit Agreement: | | | | | | Maximum permitted aggregate amount of dividends that can be paid by Tredegar during the term of the Credit Agreement ($100,000 plus 50% of net income generated after October 1, 2005) | | $ | 119,546 | | | Minimum adjusted shareholders' equity permitted ($351,918 plus 50% of net income generated after October 1, 2005) | | $ | 371,464 | | | Maximum leverage ratio permitted: | | | | | | Ongoing | | | 3.00x | | | Pro forma for acquisitions | | | 2.50x | | | | | | | | | Minimum interest coverage ratio permitted | | | 2.50x | |
Noncompliance with any one or more of the debt covenants may have a material adverse effect on financial condition or liquidity in the event such noncompliance cannot be cured or should we be unable to obtain a waiver from the lenders. Renegotiation of the covenant(s) through an amendment to the credit agreement may effectively cure the noncompliance, but may have an effect on financial condition or liquidity depending upon how the covenant is renegotiated. We are obligated to make future payments under various contracts as set forth below: | | | | | | | | | | | | | | | | | | | | Payments Due by Period | | | (In Millions) | | 2007 | | 2008 | | 2009 | | 2010 | | 2011 | | Remainder | | Total | | | Debt | | $ | .7 | | $ | .5 | | $ | .5 | | $ | 60.4 | | $ | .2 | | $ | .2 | | $ | 62.5 | | | Operating leases: | | | | | | | | | | | | | | | | | | | | | | | | AFBS (formerly Therics) | | | 1.6 | | | 1.6 | | | 1.6 | | | 1.6 | | | .4 | | | - | | | 6.8 | | | Other | | | 2.1 | | | 1.6 | | | .5 | | | .5 | | | .3 | | | .8 | | | 5.8 | | | Capital expenditure commitments * | | | 6.0 | | | - | | | - | | | - | | | - | | | - | | | 6.0 | | | Total | | $ | 10.4 | | $ | 3.7 | | $ | 2.6 | | $ | 62.5 | | $ | .9 | | $ | 1.0 | | $ | 81.1 | | | *Represents contractual obligations for plant construction and purchases of real property and equipment. See Note 13 on page 66. |
We believe that existing borrowing availability, our current cash balances and our cash flow from operations will be sufficient to satisfy our working capital, capital expenditure and dividend requirements for the foreseeable future.
From time to time, we enter into transactions with third parties in connection with the sale of assets or businesses in which we agree to indemnify the buyers or third parties involved in the sale for certain liabilities or risks related to the assets or business. Also, in the ordinary course of our business, we may enter into agreements with third parties for the sale of goods or services that may contain indemnification provisions. In the event that an indemnification claim is asserted, liability for indemnification would be subject to an assessment of the underlying facts and circumstances under the terms of the applicable agreement. Further, any indemnification payments may be limited or barred by a monetary cap, a time limitation, or a deductible or basket. For these reasons, we are unable to estimate the maximum potential amount of the potential future liability under the indemnity provisions of these agreements. We do, however, accrue for losses for any known contingent liability, including those that may arise from indemnification provisions, when future payment is probable. We disclose contingent liabilities if the probability of loss is reasonably possible and significant.
Shareholders’ Equity
At December 31, 2006, we had 39,286,079 shares of common stock outstanding and a total market capitalization of $888.3 million, compared with 38,737,016 shares of common stock outstanding and a total market capitalization of $499.3 million at December 31, 2005. During 2006, 2005 and 2004, we did not purchase any shares of our common stock in the open market. Under a standing authorization from our board of directors, we may purchase up to 5 million shares in the open market or in privately negotiated transactions at prices management deems appropriate.
Cash Flows
The discussion in this section supplements the information presented in the consolidated statements of cash flows on page 44.
Cash provided by operating activities was $104.6 million in 2006 compared with $53.7 million in 2005. The increase is due primarily to improved operating results, higher deferred income taxes and lower incremental working capital investment (see assets and liabilities section on page 24 for discussion of working capital trends).
Cash used in investing activities was $40.6 million in 2006 compared with $55.0 million in 2005 due primarily to lower capital expenditures. Capital expenditures in 2006 in Film Products of $33.2 million (down from $50.5 million in 2005 and $1.5 million in excess of 2006 depreciation) primarily included the continued expansion of capacity for surface protection films and elastic materials, a new information system and normal replacement of machinery and equipment. Capital expenditures in Aluminum Extrusions were $7.4 million in 2006 compared to $12 million in 2005 and depreciation in 2006 of $12.3 million. See the executive summary beginning on page 17 and the business segment review beginning on page 33 for more information on capital expenditures.
Net cash flow used in financing activities was $47.0 million in 2006 and included the use of cash generated from operating activities in excess of investing activities to pay dividends and repay amounts outstanding under our revolving credit facility. In addition, financing activities in 2006 included proceeds from the exercise of stock options of $9.7 million, including $8.5 million in the fourth quarter of 2006 due to an increase in the company’s stock price and certain stock option expiration dates in early 2007.
Cash provided by operating activities was $53.7 million in 2005 compared with $93.8 million in 2004. The decrease is due primarily to the income tax refund received in 2004 related to the sale in 2003 of our venture capital portfolio, partially offset by lower working capital investment in 2005 compared with 2004.
Cash used in investing activities was $55.0 million in 2005 compared with $52.2 million in 2004. The change is primarily attributable to higher capital expenditures (up $6.9 million) and lower proceeds from the sale of assets and property disposals (down $2.2 million), partially offset by a small acquisition in Film Products in 2004 ($1.4 million) and higher investment in Novalux, Inc. in 2004 ($5.0 million invested in 2004 compared with $1.1 million invested in 2005).
Capital expenditures in 2005 included the normal replacement of machinery and equipment and primarily:
| · | Continued expansion of capacity for apertured and elastic materials and surface protection films and a new global information system in 2003 compared with $674,000Film Products; and |
| · | Moving and upgrading the largest aluminum extrusion press at the facility shut down in 2002. Average debt outstandingAurora, Ontario to the plant in Pickering, Ontario, and interest rates for 2003 and 2002 were as follows:enlargement of the Pickering facility. |
Net cash provided by financing activities was $3.6 million in 2005 and included the refinancing of our debt in December 2005 (see the assets and liabilities section beginning on page 24 for more information).
| | (In Millions) | 2003 | | 2002 | |
|---|
| Floating-rate debt with interest charged on a rollover
basis at one-month LIBOR plus a credit spread: | | | | | | | | | Average outstanding debt balance | | $ | 180.8 | | $ | 175.0 | | | Average interest rate | | | 2.0 | % | | 2.5 | % | Floating-rate debt fixed via interest rate swaps in the
second quarter of 2001 and maturing in the second
quarter of 2003: | | | | | | | | | Average outstanding debt balance | | $ | 28.9 | | $ | 75.0 | | | Average interest rate | | | 5.4 | % | | 5.4 | % | | Fixed-rate and other debt: | | | | | | | | | Average outstanding debt balance | | $ | 7.2 | | $ | 7.3 | | | Average interest rate | | | 6.4 | % | | 7.2 | % |
| | Total debt: | | | | | | | | | Average outstanding debt balance | | $ | 216.9 | | $ | 257.3 | | | Average interest rate | | | 2.6 | % | | 3.5 | % |
|
In 2004, cash provided by operating activities was $93.8 million compared with $76.4 million in 2003. The increase is due primarily to the income tax refund related to the sale of the venture capital portfolio (see the business segment review beginning on page 33) partially offset by higher primary working capital (accounts receivable, inventories and accounts payable) needed to support higher sales. Income Taxes. The effective tax rate from continuing operations was 35.7% in 2003 and 35.6% in 2002.
Discontinued Operations.Discontinued operations in 2002 include results for venture capital investment activities and Molecumetics. For more information, see the business segment review beginning on page 37.
Financial Condition
Assets
Tredegar’s total assets increased to $769.5
Cash used in investing activities was $52.2 million in 2004 compared with $38.5 million in 2003. The change is primarily attributable to proceeds from the sale of venture capital investments, net of investments made, of $18.7 million in 2003, and the $5 million investment in Novalux, Inc. made in the third quarter of 2004, partially offset by lower capital expenditures of $10.2 million.
Net cash used in financing activities was $40.5 million in 2004 compared with $129.9 million in 2003. In 2004, we used $50 million from tax refunds related to the sale of the venture capital portfolio to pay down debt. Additional net borrowings of $13.8 million related primarily to capital expenditures and higher primary working capital needed to support higher sales. Net cash used in financing activities in 2003 was driven by scheduled debt payments and debt payments made in conjunction with our refinancing in 2003.
Quantitative and Qualitative Disclosures about Market Risk
Tredegar has exposure to the volatility of interest rates, polyethylene and polypropylene resin prices, aluminum ingot and scrap prices, energy prices, foreign currencies and emerging markets. See the assets and liabilities section beginning on page 24 regarding credit agreements and interest rate exposures.
Changes in resin prices, and the timing of those changes, could have a significant impact on profit margins in Film Products. Profit margins in Aluminum Extrusions are sensitive to fluctuations in aluminum ingot and scrap prices as well as natural gas prices (natural gas is the principal energy source used to operate our casting furnaces). There is no assurance of our ability to pass through higher raw material and energy costs to our customers.
See the executive summary beginning on page 17 and the business segment review beginning on page 33 for discussion regarding the impact of the lag in the pass-through of resin price changes. The volatility of average quarterly prices of low density polyethylene resin in the U.S. (a primary raw material for Film Products) are shown in the chart below.
Resin prices in Europe, Asia and South America have exhibited similar trends. The price of resin is driven by several factors including supply and demand and the price of oil, ethylene and natural gas. To address fluctuating resin prices, Film Products has index-based pass-through raw material cost agreements for the majority of its business. However, under certain agreements, changes in resin prices are not passed through for an average period of 90 days. In the normal course of business, we enter into fixed-price forward sales contracts with certain customers for the sale of fixed quantities of aluminum extrusions at scheduled intervals. In order to hedge our exposure to aluminum price volatility (see the chart below) under these fixed-price arrangements, which generally have a duration of not more than 12 months, we enter into a combination of forward purchase commitments and futures contracts to acquire or hedge aluminum, based on the scheduled deliveries. See Note 6 on page 55 for more information. 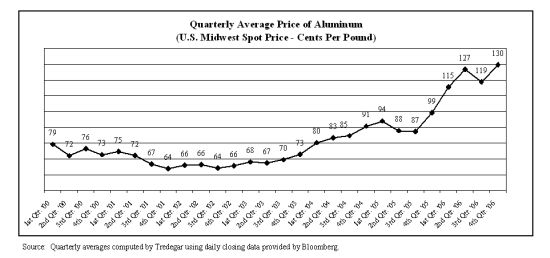
In Aluminum Extrusions, we hedge from time-to-time a portion of our exposure to natural gas price volatility by entering into fixed-price forward purchase contracts with our natural gas suppliers. We estimate that, in an unhedged situation, every $1 per mmBtu per month change in the market price of natural gas has a $150,000 impact on the monthly operating profit in Aluminum Extrusions. Substantially higher energy costs (primarily natural gas) in 2005 resulted in a reduction in operating profit in Aluminum Extrusions of approximately $7 million in 2005 compared with 2004. In September 2005, we announced an energy surcharge for our aluminum extrusions business in the U.S. to be applied when the previous quarter’s NYMEX natural gas average settlement price is in excess of $8.85 per mmBtu.
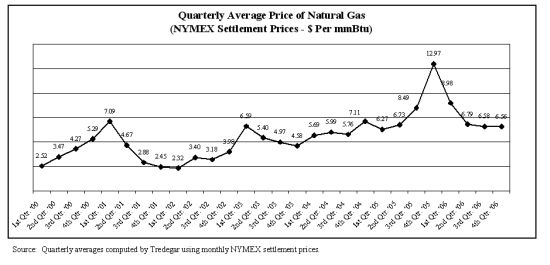
We sell to customers in foreign markets through our foreign operations and through exports from U.S. plants. The percentage of sales and total assets for manufacturing operations related to foreign markets for 2006 and 2005 are as follows: | | | Tredegar Corporation - Manufacturing Operations | | Percentage of Net Sales and Total Assets Related to Foreign Markets | | | | | 2006 | | 2005 | | | | | % of Total | | % Total | | % of Total | | % Total | | | | | Net Sales * | | Assets - | | Net Sales * | | Assets - | | | | | Exports | | Foreign | | Foreign | | Exports | | Foreign | | Foreign | | | | | From | | Oper- | | Oper- | | From | | Oper- | | Oper- | | | | | U.S. | | ations | | ations * | | U.S. | | ations | | ations * | | | Canada | | | 4 | | | 16 | | | 11 | | | 5 | | | 16 | | | 12 | | | Europe | | | 1 | | | 12 | | | 14 | | | 1 | | | 14 | | | 14 | | | Latin America | | | - | | | 2 | | | 2 | | | 1 | | | 2 | | | 2 | | | Asia | | | 5 | | | 4 | | | 7 | | | 4 | | | 4 | | | 5 | | | Total % exposure to foreign markets | | | 10 | | | 34 | | | 34 | | | 11 | | | 36 | | | 33 | | | | | *The percentages for foreign markets are relative to Tredegar's total net sales and total assets from manufacturing operations (consolidated net sales and total assets from continuing operations excluding cash and cash equivalents and AFBS (formerly Therics)). |
We attempt to match the pricing and cost of our products in the same currency (except in Canada where about 80% of our sales of aluminum extrusions are U.S. Dollar-based) and generally view the volatility of foreign currencies (see trends for the Euro, Canadian Dollar and Chinese Yuan in the chart below) and emerging markets, and the corresponding impact on earnings and cash flow, as part of the overall risk of operating in a global environment. Exports from the U.S. are generally denominated in U.S. Dollars. Our foreign currency exposure on income from foreign operations relates to the Canadian Dollar, the Euro, the Chinese Yuan, the Hungarian Forint and the Brazilian Real.
The relatively high percentage of U.S. Dollar-priced sales in Canada is partly due to the shifting of a large portion of the customers previously served by the aluminum extrusions plant in El Campo, Texas, in 2001. The resulting mismatch between the currency denomination of sales and costs causes lower U.S. Dollar translated profits when the Canadian Dollar appreciates since our costs are higher in U.S. Dollar equivalent terms while sales are mostly unaffected (the opposite effect occurs when the Canadian Dollar depreciates in value relative to the U.S. Dollar). We estimate that the appreciation of the Canadian Dollar relative to the U.S. Dollar had an adverse impact on operating profit of about $2.8 million in 2006 compared with 2005, and $3.5 million in 2005 compared with 2004. In Film Products, where we have been able to better match the currency of our sales and costs, we estimate that the change in value of foreign currencies (primarily the Euro and Hungarian Forint and to a lesser extent the Chinese Yuan and Brazilian Real) relative to the U.S. Dollar had a positive impact on operating profit of about $500,000 in 2006 compared with 2005, and $600,000 in 2005 compared with 2004.
We continue to review the loading of our aluminum extrusions plants in North America to optimize production mix and minimize cost in light of the increase in the U.S. Dollar equivalent cost structure of our plants in Canada. In addition, we have partially hedged our exposure to the Canadian Dollar and Euro as shown in the following tables (accounted for as cash flow hedges): | (In Thousands Except Exchange Rates) | | | | | | | | | Notional Amount as a % of Forecasted USD-Equiv. | | | | USD-Equivalent Strike Prices of Options Bought & | | Pretax Unrealized Gain (Loss) on Options at | | USD- Equiv. Average | | Cash (Paid to) Received from | | Gain (Loss) on Options Recognized in Income for Period | | | | | Notional | | CAD- | | Net Option | | Sold on CAD/USD | | 12/31/06 | | Reference | | Counter- | | Portion | | Portion | | | Description of Currency | | Amount | | Related | | Premium | | Call | | Put | | Included in | | Price of | | party at | | Deemed | | Deemed | | | Exposure, Options Hedging Strategy | | of Option | | Costs for | | (Paid) | | Options | | Options | | Shareholders' | | CAD for | | Expiration | | Effective | | Ineffective | | | Used & Periods Covered | | Contracts | | Period | | Received | | Bought | | Sold | | Equity | | Period | | of Options | | as Hedge | | as Hedge | | Exposure: About 80% of sales of extrusions manufactured in facilities in Canada are denominated or economically priced in U.S. Dollars ("USD") while conversion costs are denominated or economically priced in Canadian Dollars ("CAD"). | | | | | | | | | | | | | | | | | | | | Hedge Strategy: Bought average rate call options & sold average rate put options on CAD/USD. | | | | | | | | | | | | | | | | | | | | Periods Covered by Option Contracts: | | | | | | | | | | | | | | | | | | | | | | | 5/11/06 to end of second quarter 2006 | | $ | 2,500 | | | 38 | % | $ | - | | $ | 0.9500 | | $ | 0.8850 | | | n/a | | $ | 0.8995 | | $ | - | | $ | - | | $ | - | | | Third quarter 2006 | | | 5,000 | | | 40 | % | | - | | | 0.9500 | | | 0.8749 | | | n/a | | | 0.8919 | | | - | | | - | | | - | | | Fourth quarter 2006 | | | 6,500 | | | 53 | % | | - | | | 0.9324 | | | 0.8650 | | | n/a | | | 0.8793 | | | - | | | - | | | - | | | First quarter 2007 | | | 3,500 | | | 28 | % | | - | | | 0.9100 | | | 0.8380 | | $ | (3 | ) | | n/a | | | n/a | | | n/a | | | - | | | First quarter 2007 | | | 3,500 | | | 28 | % | | - | | | 0.9000 | | | 0.8345 | | | (2 | ) | | n/a | | | n/a | | | n/a | | | - | | | Second quarter 2007 | | | 3,500 | | | 28 | % | | - | | | 0.9100 | | | 0.8430 | | | (18 | ) | | n/a | | | n/a | | | n/a | | | - | | | Second quarter 2007 | | | 3,500 | | | 28 | % | | - | | | 0.9000 | | | 0.8364 | | | (8 | ) | | n/a | | | n/a | | | n/a | | | - | | | Third quarter 2007 | | | 3,500 | | | 28 | % | | - | | | 0.9100 | | | 0.8473 | | | (27 | ) | | n/a | | | n/a | | | n/a | | | - | | | Third quarter 2007 | | | 3,500 | | | 28 | % | | - | | | 0.9000 | | | 0.8403 | | | (11 | ) | | n/a | | | n/a | | | n/a | | | - | | | Fourth quarter 2007 | | | 3,500 | | | 28 | % | | - | | | 0.9100 | | | 0.8516 | | | (33 | ) | | n/a | | | n/a | | | n/a | | | - | | | Fourth quarter 2007 | | | 3,500 | | | 28 | % | | - | | | 0.9000 | | | 0.8446 | | | (14 | ) | | n/a | | | n/a | | | n/a | | | - | | | | | | | | | | | | | | | | | | | | $ | (116 | ) | | | | | | | | | | | | |
| (In Thousands Except Exchange Rates) | | | | | | | | | | | | | Sensitivity Analysis of Amount Tredegar (Pays to) Receives | | | Average | | Average | | from Counterparty in 2007 for Settlement of CAD/USD Options | | | CAD Per | | USD Equiv. | | First | | Second | | Third | | Fourth | | | | | USD | | of CAD | | Quarter | | Quarter | | Quarter | | Quarter | | Total | | | 1.21951 | | $ | 0.8200 | | $ | (136 | ) | $ | (164 | ) | $ | (197 | ) | $ | (232 | ) | $ | (729 | ) | | 1.20482 | | | 0.8300 | | | (52 | ) | | (81 | ) | | (115 | ) | | (149 | ) | | (397 | ) | | 1.19048 | | | 0.8400 | | | - | | | (12 | ) | | (32 | ) | | (67 | ) | | (111 | ) | | 1.17647 | | | 0.8500 | | | - | | | - | | | - | | | (7 | ) | | (7 | ) | | 1.16279 | | | 0.8600 | | | - | | | - | | | - | | | - | | | - | | | 1.14943 | | | 0.8700 | | | - | | | - | | | - | | | - | | | - | | | 1.13636 | | | 0.8800 | | | - | | | - | | | - | | | - | | | - | | | 1.12360 | | | 0.8900 | | | - | | | - | | | - | | | - | | | - | | | 1.11111 | | | 0.9000 | | | - | | | - | | | - | | | - | | | - | | | 1.09890 | | | 0.9100 | | | 39 | | | 39 | | | 39 | | | 39 | | | 155 | | | 1.08696 | | | 0.9200 | | | 116 | | | 116 | | | 116 | | | 116 | | | 465 | | | 1.07527 | | | 0.9300 | | | 194 | | | 194 | | | 194 | | | 194 | | | 774 | | | 1.06383 | | | 0.9400 | | | 271 | | | 271 | | | 271 | | | 271 | | | 1,084 | |
| (In Thousands Except Exchange Rates) | | | | | | | | | | | | | | | | | | | Notional | | | | | | | | | | | | | | | Amount as | | | | | | | | Pretax | | | | | | | a % of | | | | USD-Equivalent | | Unrealized | | | | | | | Forecasted | | | | Strike Prices of | | Gain (Loss) | | | | | | | USD-Equiv. | | | | Options Bought & | | on Options at | | | | | Notional | | Royalty | | Net Option | | Sold on EUR/USD | | 12/31/06 | | | Description of Currency | | Amount | | from | | Premium | | Call | | Put | | Included in | | | Exposure, Options Hedging Strategy | | of Option | | Nether- | | (Paid) | | Options | | Options | | Shareholders' | | | Used & Periods Covered | | Contracts | | lands Sub | | Received | | Sold | | Bought | | Equity* | | Exposure: Significant royalty on sales from film technology licensed to subsidiary in the Netherlands is earned in Euros ("EUR"). | | | | | | | | | | | | Hedge Strategy: Sold average rate call options & bought average rate put options on EUR/USD. | | | | | | | | | | | | Periods Covered by Option Contracts: | | | | | | | | | | | | | | | First quarter 2007 | | $ | 3,200 | | | 74 | % | $ | - | | $ | 1.3350 | | $ | 1.2800 | | | n/a | | | Second quarter 2007 | | | 3,200 | | | 82 | % | | - | | | 1.3480 | | | 1.2800 | | | n/a | | | Third quarter 2007 | | | 3,200 | | | 75 | % | | - | | | 1.3575 | | | 1.2800 | | | n/a | | | Fourth quarter 2007 | | | 3,200 | | | 76 | % | | - | | | 1.3640 | | | 1.2800 | | | n/a | | | * Hedge transactions occurred on 1/4/07 and therefore there was no unrealized gain or loss at 12/31/06. | | | |
| (In Thousands Except Exchange Rates) | | | | | | | | | | | | | Sensitivity Analysis of Amount Tredegar (Pays to) Receives | | | Average | | Average | | from Counterparty in 2007 for Settlement of EUR/USD Options | | | EUR Per | | USD Equiv. | | First | | Second | | Third | | Fourth | | | | | USD | | of EUR | | Quarter | | Quarter | | Quarter | | Quarter | | Total | | | 0.84034 | | $ | 1.1900 | | $ | 225 | | $ | 225 | | $ | 225 | | $ | 225 | | $ | 900 | | | 0.82645 | | | 1.2100 | | | 175 | | | 175 | | | 175 | | | 175 | | | 700 | | | 0.81301 | | | 1.2300 | | | 125 | | | 125 | | | 125 | | | 125 | | | 500 | | | 0.80000 | | | 1.2500 | | | 75 | | | 75 | | | 75 | | | 75 | | | 300 | | | 0.78740 | | | 1.2700 | | | 25 | | | 25 | | | 25 | | | 25 | | | 100 | | | 0.77519 | | | 1.2900 | | | - | | | - | | | - | | | - | | | - | | | 0.76336 | | | 1.3100 | | | - | | | - | | | - | | | - | | | - | | | 0.75188 | | | 1.3300 | | | - | | | - | | | - | | | - | | | - | | | 0.74074 | | | 1.3500 | | | (36 | ) | | (5 | ) | | - | | | - | | | (41 | ) | | 0.72993 | | | 1.3700 | | | (84 | ) | | (52 | ) | | (29 | ) | | (14 | ) | | (180 | ) | | 0.71942 | | | 1.3900 | | | (132 | ) | | (100 | ) | | (77 | ) | | (61 | ) | | (369 | ) | | 0.70922 | | | 1.4100 | | | (180 | ) | | (147 | ) | | (124 | ) | | (108 | ) | | (559 | ) | | 0.69930 | | | 1.4300 | | | (228 | ) | | (195 | ) | | (171 | ) | | (155 | ) | | (748 | ) |
Trends for the Euro, Canadian Dollar and Cheinese Yuan are shown in the chart below:
Business Segment Review
Net sales (sales less freight) and operating profit from ongoing operations are the measures of sales and operating profit used by the chief operating decision maker for purposes of assessing performance.
Film Products
Net Sales. Net sales in Film Products were $511.2 million in 2006, $460.3 million in 2005 and $413.3 million in 2004. The increases in net sales (sales less freight) in Film Products in the last two years is primarily due to growth in higher value-added products, including surface protection films, elastic materials and new apertured materials. Selling price and net sales are also affected by the pass-through of changes in raw material costs and changes in currency exchange rates (see the qualitative and quantitative disclosures about market risks section beginning on page 28). Total volume was 253.5 million pounds in 2006, 261.1 million pounds in 2005 and 278.7 million pounds in 2004. Total volume related to the business in Argentina sold in the third quarter of 2004 was 9.4 million pounds in 2004. We estimate that the growth in net sales excluding the effects of the pass-through of resin price changes, foreign exchange rate changes and the business in Argentina sold was about 6% in 2006, 7% in 2005 and 9% in 2004. Volume declines in 2006 compared with 2005 were mainly due to lower sales of certain commodity barrier films that were dropped in conjunction with the shutdown of the plant in LaGrange, Georgia. The plant was shut down in the first half of 2006 and had sales of commodity barrier films of approximately $20 million in 2005.
Operating Profit. Operating profit from ongoing operations in Film Products was $57.6 million in 2006, $44.9 million in 2005 and $43.3 million in 2004. Operating profit from ongoing operations excluding the estimated effects of resin pass-through lag and year-end LIFO adjustments was $53.1 million in 2006, $48.9 million in 2005 and $45.8 million in 2004. The increase in operating profit in since 2004 excluding the impact of resin pass-through lag and LIFO adjustments has been driven by growth in the sale of higher value surface protection films, elastic materials and new apertured topsheets.
Identifiable Assets. Identifiable assets in Film Products increased to $499.0 million at December 31, 2006, from $479.3 million at December 31, 2005, due primarily to the effects of foreign exchange rate changes of $9.0 million, higher accounts receivable (up $6.5 million) due to higher sales and higher inventories (up $3.4 million) and asset impairments during the year totaling $1.2 million. See page 24 for further discussion on changes in assets and liabilities.
Identifiable assets in Film Products increased to $479.3 million at December 31, 2005, from $472.8 million at December 31, 2004, from $753 million at December 31, 2003. In the first quarter of 2004, we received tax refunds of about $55 million related to the sale of the venture capital portfolio and used $50 million to repay revolver debt in April 2004. Other significant changes in balance sheet items since December 31, 2003, are summarized below: | |
• | Accounts receivable increased by $33.2 million (39%) due primarily to higher net sales for all businesses (net sales for the fourth quarter of 2004 were up $43.4 million compared to the fourth quarter of 2003) and foreign currency effects (about $3.5 million). | | |
| – | Days sales outstanding remains in the 50-day range in Film Products and 45-day range in Aluminum Extrusions. | | | |
• | Inventories increased by $15.8 million (32%) due primarily to higher raw material prices (low-density polyethylene resin prices are up around 18 cents per pound (about 30%) in the U.S. and Europe since the fourth quarter of 2003, and aluminum is also up about 18 cents per pound (about 25%) since that time), sales volume and foreign currency effects (about $2.5 million). | | |
| – | Inventory days are in the 45-day range in Film Products and 35-day range in Aluminum Extrusions consistent with the end of last year. | | | |
• | Income taxes recoverable declined by $61.5 million due primarily to the receipt in the first quarter of 2004 of income tax refunds related to the sale of the venture capital portfolio (about $55 million). | | | • | Other assets increased by $5.4 million primarily due to the $5 million investment in Novalux during the third quarter of 2004. Our ownership interest in Novalux is approximately 18% (15% on a fully diluted basis). Novalux, based in Sunnyvale, California, is developing and commercializing a laser technology for use in a variety of applications, including flat panel displays for home theaters. We are already participating in the growing flat panel display market with our surface protection films. The investment in Novalux, which is included in “Other assets and deferred charges” in the consolidated balance sheet, is being accounted for under the cost method, with an impairment loss recognized and a new cost basis established for any write-down to estimated fair value. |
Net property, plant and equipment was up $19.2 million due primarily to capital expenditures in excess of depreciation of $21.6$24.0 million (see the depreciation, amortization and foreign exchange translation of $9.1 million,capital expenditures section below for more information) partially offset by lower accounts receivable (down $4.9 million) due to lower days sales outstanding (down about 5 days since the $7.1end of 2004), the effects of foreign exchange rate changes of $9.8 million asset impairment recognized in the first quarter of 2004 on the planned shutdown of the Aurora Plant and other asset impairments and disposals during 2005 totaling $4.3 million.
Depreciation, Amortization and Capital Expenditures. Depreciation and amortization for Film Products was $31.7 million in 2006, $26.7 million in 2005 and $22.0 million in 2004. The increases in each year are due to the yearrelatively high level of capital expenditures from 2003-2005. We expect depreciation and amortization expense for Film Products to increase to about $34 million in 2007.
Capital expenditures declined to $33.2 million in 2006 compared with $50.5 million in 2005. Capital expenditures in 2007 are expected to be approximately $35 million. Approximately half of the capital expenditures in 2006 related to expanding the production capacity for surface protection films. These films are primarily used to protect flat panel display components during fabrication, shipping and handling. Sales of surface protection films used primarily in this application totaled approximately $56 million in 2006, $30 million in 2005 and $16 million in 2004. Other capital expenditures in 2006 included capacity additions for elastic materials and continued costs associated with a new information system, which was rolled out in U.S. locations.
Capital expenditures in Film Products totaling $3.3 million.in 2005 totaled $50.5 million and reflect the normal replacement of machinery and equipment and:
| Liabilities, Credit and Long-Term Obligations
Total liabilities were $289.0 million at December 31, 2004, down from $305.6 million at December 31, 2003, primarily due to debt reduction ($36.2 million), partially offset by an increase in accounts payable (up $17.2 million or 37%) due to higher inventories and the timing of payments.
Debt outstanding at December 31, 2004 of $103.5 million consisted of $97.4 million borrowed under our credit facility (comprised of a term loan of $64.4 million and revolving credit borrowings of $33 million) and other debt of $6.1 million. The credit agreement, dated October 17, 2003, consists of a $125 million three-year revolving credit facility and a $75 million three-year term loan (required term loan payments of $10.6 million have been made since origination). At December 31, 2004, available credit under the revolving credit facility was $91 million. Remaining term loan installments are due as follows:
|
| | Term Loan Quarterly Repayment Schedule (In Thousands) |
|---|
| | Installment due each quarter on March 31, June 30 and September 30, 2005 | | | $ | 3,125 | | Installment due each quarter on December 31, 2005, and March 31 and
June 30, 2006 | | | | 3,750 | | | Final payment due on September 30, 2006 | | | | 43,750 | |
|
The credit spread over LIBOR and commitment fees charged on the unused amount under the credit agreement at various indebtedness-to-adjusted EBITDA levels is as follows:
|
| | Pricing Under Credit Agreement (Basis Points) |
|---|
| | | Credit Spread Over LIBOR
| | | |
|---|
Indebtedness-to-
Adjusted EBITDA
Ratio | Revolver
($33 Million
Outstanding
at 12/31/04) | | Term Loan
($64 Million
Outstanding
at 12/31/04) | | Commitment
Fee | |
|---|
| | > 2x but <= 3x | | | 150 | | 150 | | 30 | | | > 1x but <= 2x | | | 125 | | 125 | | 25 | | | <= 1x | | | 100 | | 100 | | 20 | |
|
At December 31, 2004, we had no interest rate swaps outstanding and the interest cost on debt was priced at one-month LIBOR plus the applicable credit spread of 125 basis points.
|
The computations of adjusted EBITDA, adjusted EBIT, the leverage ratio and interest coverage ratio as defined in the credit agreement are presented below along with the related most restrictive covenants. Adjusted EBITDA and adjusted EBIT as defined in the credit agreement are not intended to represent cash flow from operations as defined by GAAP and should not be considered as either an alternative to net income or to cash flow.
|
| Computations of Adjusted EBITDA, Adjusted EBIT, Leverage Ratio and
| Interest Coverage Ratio as Defined in Credit Agreement Along with Related Most
| Restrictive Covenants
| For the Year Ended December 31, 2004 (In Thousands)
|
|
Computations of adjusted EBITDA and adjusted EBIT as defined in
Credit Agreement: | | | | | | | Net income | | | $ | 29,181 | | | Plus: | | | | | | | After-tax losses related to discontinued operations | | | | — | | | Total income tax expense for continuing operations | | | | 9,222 | | | Interest expense | | | | 3,171 | | | Depreciation and amortization expense for continuing operations | | | | 34,422 | | All non-cash losses and expenses, plus cash losses and expenses not
to exceed $10,000, for continuing operations that are classified as
unusual, extraordinary or which are related to plant shutdowns, asset
impairments and/or restructurings (cash-related of $10,262) | | | | 23,811 | | | Minus: | | | | After-tax income related to discontinued operations | | | | (2,921 | ) | | Total income tax benefits for continuing operations | | | | — | | | Interest income | | | | (350 | ) | All non-cash gains and income, plus cash gains and income not to
exceed $10,000, for continuing operations that are classified as unusual,
extraordinary or which are related to plant shutdowns, asset
impairments and/or restructurings (all cash-related of $15,917) | | | | (10,000 | ) | Plus or minus, as applicable, pro forma EBITDA adjustments associated
with acquisitions and asset dispositions | | | | (22 | ) | | |
| | | Adjusted EBITDA as defined in Credit Agreement | | | | 86,514 | | Less: Depreciation and amortization expense for continuing operations
(including pro forma for acquisitions and asset dispositions) | | | | (34,430 | ) | | |
| | | Adjusted EBIT as defined in Credit Agreement | | | $ | 52,084 | | | |
| | | Indebtedness: | | | | Total debt | | | $ | 103,452 | | | Face value of letters of credit | | | | 6,391 | | | |
| | | Indebtedness | | | $ | 109,843 | | | |
| | | Shareholders’ equity at December 31, 2004 | | | $ | 480,442 | | | | | | Computations of leverage and interest coverage ratios as defined in
Credit Agreement: | | | | Leverage ratio (pro forma indebtedness-to-adjusted EBITDA) | | | | 1.27 | x | | Interest coverage ratio (adjusted EBIT-to-interest expense) | | | | 16.43 | x | | Most restrictive covenants as defined in Credit Agreement: | | | Maximum permitted aggregate amount of dividends that can be paid
by Tredegar during the term of the Credit Agreement | | | $ | 100,000 | | Minimum adjusted shareholders’ equity permitted (increases by
50% of net income generated after September 30, 2003) | | | $ | 344,248 | | | Maximum leverage ratio permitted: | | | | Ongoing | | | | 3.00 | x | | Pro forma for acquisitions | | | | 2.50 | x | | Minimum interest coverage ratio permitted | | | | 2.50 | x |
|
Noncompliance with any one or more of the debt covenants may have an adverse effect on financial condition or liquidity in the event such noncompliance cannot be cured or should we be unable to obtain a waiver from the lenders. Renegotiation of the covenant through an amendment to the credit agreement may effectively cure the noncompliance, but may have an effect on financial condition or liquidity depending upon how the covenant is renegotiated.
We are obligated to make future payments under various contracts as set forth below:
|
| | | Payments Due by Period |
|---|
| | (In Millions) | 2005 | | 2006 | | 2007 | | 2008 | | 2009 | | Remainder | | Total | |
|---|
| | Debt | $ | 13.1 | | $ | 88.9 | | $ | .4 | | $ | .3 | | $ | .3 | | $ | .5 | | $ | 103.5 | | | Operating leases: | | Therics | | 1.4 | | | 1.5 | | | 1.6 | | | 1.6 | | | 1.6 | | | 2.0 | | | 9.7 | | | Other | | 1.5 | | | 1.4 | | | 1.1 | | | .9 | | | .2 | | | .6 | | | 5.7 | | | Capital expenditure commitments * | | 16.1 | | | — | | | — | | | — | | | — | | | — | | | 16.1 | |
| | Total | $ | 32.1 | | $ | 91.8 | | $ | 3.1 | | $ | 2.8 | | $ | 2.1 | | $ | 3.1 | | $ | 135.0 | |
|
*Represents contractual obligations for plant construction and purchases of real property and equipment. See Note 13 on page 66.
We believe that existing borrowing availability, our current cash balances and our cash flow from operations will be sufficient to satisfy our working capital, capital expenditure and dividend requirements for the foreseeable future.
From time to time, we enter into transactions with third parties in connection with the sale of assets or businesses in which we agree to indemnify the buyers or third parties involved in the sale for certain liabilities or risks related to the assets or business. Also, in the ordinary course of our business, we may enter into agreements with third parties for the sale of goods or services that may contain indemnification provisions. In the event that an indemnification claim is asserted, liability for indemnification would be subject to an assessment of the underlying facts and circumstances under the terms of the applicable agreement. Further, any indemnification payments may be limited or barred by a monetary cap, a time limitation, or a deductible or basket. For these reasons, we are unable to estimate the maximum potential amount of the potential future liability under the indemnity provisions of these agreements. We do, however, accrue for losses for any known contingent liability, including those that may arise from indemnification provisions, when future payment is probable. We disclose contingent liabilities if the probability of loss is reasonably possible and significant.
Shareholders’ Equity
At December 31, 2004, we had 38,597,522 shares of common stock outstanding and a total market capitalization of $780.1 million, compared with 38,176,821 shares of common stock outstanding and a total market capitalization of $592.9 million at December 31, 2003.
During 2004, we did not purchase any shares of our common stock in the open market. During 2003, we purchased 406,400 shares of our common stock in the open market for $5.2 million (an average price of $12.72 per share). During 2002, we purchased 110,700 shares of our common stock in the open market for $1.4 million (an average price of $12.91 per share). Since becoming an independent company in 1989, we have purchased a total of 20.8 million shares for $122.8 million (an average price of $5.90 per share). Under a standing authorization from our board of directors, we may purchase an additional 3.4 million shares in the open market or in privately negotiated transactions at prices management deems appropriate.
Cash Flows
The discussion below supplements the information presented in the consolidated statements of cash flows on page 47.
In 2004, cash provided by operating activities was $93.8 million compared with $76.4 million in 2003. The increase is due primarily to the income tax refund related to the sale of the venture capital portfolio (see the business segment review beginning on page 34) partially offset by higher primary working capital (accounts receivable, inventories and accounts payable) needed to support higher sales.
|
Cash used in investing activities was $50.3 million in 2004 compared with $36.5 million in 2003. The change is primarily attributable to proceeds from the sale of venture capital investments, net of investments made, of $18.7 million in 2003, and the $5 million investment in Novalux made in the third quarter of 2004, partially offset by lower capital expenditures of $10.2 million. See the business segment review beginning on page 34 regarding capital expenditures in 2004 and 2003.
Net cash used in financing activities was $40.5 million in 2004 compared to $129.9 million in 2003. In 2004, we used $50 million from tax refunds related to the sale of the venture capital portfolio to pay down debt. Additional net borrowings of $13.8 million related primarily to capital expenditures and higher primary working capital needed to support higher sales. Net cash used in financing activities in 2003 was driven by scheduled debt payments and debt payments made in conjunction with our refinancing in 2003.
In 2003, net cash provided by operating activities was $76.4 million compared with $65.3 million in 2002. The increase is due to a decrease in the level of primary working capital partially offset by lower income from ongoing operations. Accounts receivable declined mainly from volume shortfall payments and contract terminations and revisions in Film Products accrued at the end of 2002 and received in 2003 (about $15 million in accounts receivable at the end of 2002 versus none at the end of 2003). Accounts payable increased due to the timing of payments. Inventories increased primarily due to the appreciation of the Euro and the Canadian Dollar.
Net cash used in investing activities was $36.5 million in 2003 compared to $42.1 million in 2002. This decrease was due to positive cash flow from venture capital activities in 2003 versus negative cash flow in 2002 and higher proceeds from the sale of corporate assets and property disposals (see Note 15 on page 69 for more information), partially offset by higher capital expenditures and acquisitions (up $36.1 million).
Net cash used in financing activities was $129.9 million in 2003 compared to $10.1 million in 2002. This increase was driven by scheduled debt payments and debt payments made in conjunction with our refinancing in 2003 (see pages 24-26 for more information).
In 2002, net cash provided by operating activities was $65.3 million compared to $74.9 million in 2001. The decrease is due to an increase in working capital in 2002 versus a decrease in working capital in 2001, partially offset by higher income from manufacturing operations (up $8.3 million). The increase in working capital in 2002 was mainly due to higher receivables, primarily from volume shortfall payments and contract terminations and revisions in Film Products (up $14.7 million). The decrease in working capital in 2001 was mainly due to lower receivables (down $17.4 million), primarily from a 15% drop in volume in Aluminum Extrusions in the fourth quarter of 2001.
Net cash used in investing activities was $42.1 million in 2002 compared to $13.4 million in 2001. The increase was driven by negative cash flow from venture capital activities in 2002 versus positive cash flow in 2001, partially offset by lower capital expenditures and acquisitions (down $9.6 million).
Net cash used in financing activities was about the same in 2002 and 2001.
|
Quantitative and Qualitative Disclosures about Market Risk
Tredegar has exposure to the volatility of interest rates, polyethylene and polypropylene resin prices, aluminum ingot and scrap prices, energy prices, foreign currencies and emerging markets. See the section on liabilities, credit and long-term obligations beginning on page 24 regarding credit agreements and interest rate exposures.
Changes in resin prices, and the timing of those changes, could have a significant impact on profit margins in Film Products. Profit margins in Aluminum Extrusions are sensitive to fluctuations in aluminum ingot and scrap prices as well as natural gas prices. There is no assurance of our ability to pass through higher raw material and energy costs to our customers.
We estimate that resin price increases in the fourth quarter resulted in a negative operating profit impact of about $2 million compared with the third quarter of 2004. This is in addition to the $1 million adverse impact we estimate occurred between the second and third quarters of 2004. The significant increases in the U.S. since 2002 in prices of low density polyethylene resin (a primary raw material for Film Products) are shown in the chart below.
| |  | | Resin prices in Europe and Asia have exhibited similar trends. The price of resin is driven by several factors including supply and demand and the price of natural gas, oil and ethylene. To address fluctuating resin prices, we have pass-through or cost-sharing agreements covering about 65% of our sales, but many have a 90-day lag. We are implementing price increases for many customers that are currently not subject to pass-through arrangements. Most new customer contracts contain resin pass-through arrangements. However, if resin prices continue to rise at a faster rate than selling prices, the delayed pass-through of costs will exert downward pressure on near-term profits.
|
In the normal course of business, we enter into fixed-price forward sales contracts with certain customers for the sale of fixed quantities of aluminum extrusions at scheduled intervals. In order to hedge our exposure to aluminum price volatility (see the chart below) under these fixed-price arrangements, which generally have a duration of not more than 12 months, we enter into a combination of forward purchase commitments and futures contracts to acquire or hedge aluminum, based on the scheduled deliveries. See Note 6 on page 58 for more information. | |  | | In Aluminum Extrusions, we hedge from time-to-time a portion of our exposure to natural gas price volatility by entering into fixed-price forward purchase contracts with our natural gas suppliers. As of December 31, 2004, we had forward contracts with natural gas suppliers covering 18% of our estimated future needs through March 31, 2005, with an average fixed price of $5.97 per mmBtu. We estimate that, in an unhedged situation, every $1 per mmBtu per month change in the market price of natural gas has a $150,000 impact on the monthly operating profit of Aluminum Extrusions. Substantially higher prices of natural gas in 2003 resulted in a reduction in operating profit in Aluminum Extrusions of approximately $3.2 million in 2003 compared with 2002.
| |  |
We sell to customers in foreign markets through our foreign operations and through exports from U.S. plants. The percentage of sales and total assets for manufacturing operations related to foreign markets for 2004 and 2003 are as follows:
|
| Tredegar Corporation - Manufacturing Operations
Percentage of Net Sales and Total Assets Related to Foreign Markets |
|---|
| | | 2004
| | 2003
| |
|---|
| | % of Total
Net Sales*
| | % Total
Assets -Foreign
Oper-
ations* | | % of Total
Net Sales*
| | % Total
Assets -Foreign
Oper-
ations* | |
|---|
| | Exports
From
U.S. | | Foreign
Oper-
ations | | | Exports
From
U.S. | | Foreign
Oper-
ations | | |
|---|
| |
| |
| |
| |
| |
|---|
| Canada | | 3 | | | 18 | | | 13 | | | 4 | | | 17 | | | 13 | | | Europe | | 2 | | | 14 | | | 17 | | | 4 | | | 12 | | | 15 | | | Latin America | | 2 | | | 2 | | | 1 | | | 3 | | | 2 | | | 2 | | | Asia | | 4 | | | 3 | | | 5 | | | 3 | | | 2 | | | 4 | |
| | Total % exposure
to foreign
markets | | 11 | | | 37 | | | 36 | | | 14 | | | 33 | | | 34 | |
| |
*
| The percentages for foreign markets are relative to Tredegar’s total net sales and total assets from manufacturing operations (consolidated net sales and total assets from continuing operations excluding cash and cash equivalents, Therics and in 2003, income taxes recoverable from the sale of the venture capital portfolio).
|
We attempt to match the pricing and cost of our products in the same currency (except in Canada where about 70% of our sales of aluminum extrusions are U.S. Dollar-based) and generally view the volatility of foreign currencies (see the chart below) and emerging markets, and the corresponding impact on earnings and cash flow, as part of the overall risk of operating in a global environment. Exports from the U.S. are generally denominated in U.S. Dollars. Our foreign currency exposure on income from foreign operations in Europe primarily relates to the Euro and the Hungarian Forint.
The relatively high percentage of U.S. Dollar-priced sales in Canada is partly due to the shifting of a large portion of the customers previously served by the aluminum extrusions plant in El Campo, Texas, in 2001. The resulting mismatch between the currency denomination of sales and costs causes lower U.S. Dollar translated profits when the Canadian Dollar appreciates since our costs are higher in U.S. Dollar equivalent terms while sales are mostly unaffected (the opposite effect occurs when the Canadian Dollar depreciates in value relative to the U.S. Dollar). We estimate that the appreciation of the Canadian Dollar relative to the U.S. Dollar had an adverse impact on operating profit of $2.4 million in 2004 compared with 2003. In Film Products, where we have been able to better match the currency of our sales and costs, we estimate that the appreciation of the Euro and Hungarian Forint relative to the U.S. Dollar had a positive impact on operating profit of about $1 million in 2004 compared with 2003.
|
We are continuing to review the loading of our aluminum extrusions plants in North America to optimize production mix and minimize cost in light of the increase in the U.S. Dollar equivalent cost structure of our plants in Canada. | |  | | Forward-looking and Cautionary Statements
From time to time, we may make statements that may constitute “forward-looking statements” within the meaning of the “safe-harbor” provisions of the Private Securities Litigation Reform Act of 1995. Such statements are based on our then current expectations and are subject to a number of risks and uncertainties that could cause actual results to differ materially from those addressed in the forward-looking statements. Factors that may cause such a difference include, but are not limited to the following:
General
| |
• | Our future performance is influenced by costs incurred by our operating companies including, for example, the cost of energy and raw materials.There is no assurance that we will be able to offset fully or on a timely basis the effects of higher raw material costs through price increases. Further, there is no assurance that cost control efforts will be sufficient to offset any additional future declines in revenue or increases in energy, raw material or other costs. | | | • | As part of our business strategy, we expect to pursue acquisitions of businesses or investments that we believe have unique and sustainable technologies, products and services in attractive end markets. The success of this strategy will depend upon our ability to identify, acquire and finance on acceptable terms such businesses and on our ability to manage such businesses and achieve planned synergies and operating results, none of which can be assured. |
• | Film Products is highly dependent on sales associated with one customer, P&G. P&G comprised 27% of Tredegar’s net sales in 2004, 29% in 2003 and 33% in 2002. The loss or significant reduction of sales associated with P&G would have a material adverse effect on our business, as would delays in P&G rolling out products utilizing new technologies developed by Tredegar. While we have undertaken efforts to expand our customer base, there can be no assurance that such efforts will be successful, or that they will offset any delay or loss of sales and profits associated with P&G. | | | • | Growth of Film Products depends on our ability to develop and deliver new products at competitive prices, especially in the personal care market. Personal care products are now being made with a variety of new materials, replacing traditional backsheet and other components. While we have substantial technical resources, there can be no assurance that our new products can be brought to market successfully, or if brought to market successfully, at the same level of profitability and market share of replaced films. A shift in customer preferences away from our technologies, our inability to develop and deliver new profitable products, or delayed acceptance of our new products in domestic or foreign markets, could have a material adverse effect on our business. |
• | Film Products operates in a field where our significant customers and competitors have substantial intellectual property portfolios. The continued success of this business depends on our ability not only to protect our own technologies and trade secrets, but also to develop and sell new products that do not infringe upon existing patents. Although we are not currently involved in any patent litigation, an unfavorable outcome of any such action could have a significant adverse impact on Film Products. | | | • | As Film Products expands its personal care business, we have greater credit risk that is inherent in broadening our customer base. |
• | Sales volume and profitability of Aluminum Extrusions is cyclical and highly dependent on economic conditions of end-use markets in the United States and Canada, particularly in the construction, distribution and transportation industries. Our market segments are also subject to seasonal slowdowns during the winter months. From 1992 to the second quarter of 2000, profits in Aluminum Extrusions grew as a result of positive economic conditions in the markets we serve and manufacturing efficiencies. However, a slowdown in these markets in the second half of 2000 resulted in a 13% decline in sales volume and 28% decline in ongoing operating profit compared with the second half of 1999. The aluminum extrusions industry continued to be affected by poor economic conditions in 2001 and 2002. In 2001, our sales volume declined 20% and operating profit declined 52% compared with 2000. Our sales volume declined 23% and operating profit declined 49% in 2002 compared with 2000. The decline in ongoing operating profit during these periods at approximately two to three times the rate of the decline in sales volume illustrates the operating leverage inherent in our operations (fixed operating costs). Moreover, in 2003 higher energy and insurance costs and the appreciation of the Canadian Dollar against the U.S. Dollar had an adverse impact on operating profits. Any benefits associated with cost reductions and productivity improvements may not be sufficient to offset the adverse effects on profitability from pricing and margin pressure and higher bad debts that usually accompany a downturn. | | | | In 2004, operating profit from ongoing operations in Aluminum Extrusions increased to $22.6 million from $15.1 million in 2003. The $7.5 million or 50% increase in operating profit on 6.7% volume growth is primarily due to operating leverage and pricing improvements. Based on existing operating levels, we expect future annual operating profits to change at 3 - 4 times the percentage change in volume. | | | • | The markets for our products are highly competitive with product quality, service, delivery performance and price being the principal competitive factors. Aluminum Extrusions has over 1,700 customers in a variety of end-use markets within the broad categories of building and construction, distribution, transportation, machinery and equipment, electrical and consumer durables. No single customer exceeds 3% of Aluminum Extrusion’s net sales. Due to the diverse customer mix across many end-use markets, we believe the industry generally tracks the real growth of the overall economy (historical cross-cycle volume growth has been in the 3% range). | | | | During improving economic conditions, excess industry capacity is absorbed and pricing pressure becomes less of a factor in many of our end-use markets. Conversely, during an economic slowdown, excess industry capacity often drives increased pricing pressure in many end-use markets as competitors protect their position with key customers.Because the business is susceptible to these changing economic conditions,Aluminum Extrusions targets complex, customized, service-intensive business with more challenging requirements which is competitively more defensible compared to higher volume, standard extrusion applications. | | | | Foreign imports, primarily from China, currently represent less than 5% of the North American aluminum extrusion market. Foreign competition to date has been primarily large volume, standard extrusion profiles that impact some of our less strategic end-use markets. Market share erosion in other end-use markets remains possible. |
| | | | | There can be no assurance that we will be able to maintain current margins and profitability. Our continued success and prospects depend on our ability to retain existing customers and participate in overall industry cross-cycle growth. |
• | Therics has incurred losses since inception, and we are unsure when, or if, it will become profitable. We are in the initial stages of commercializing certain orthobiologic products that have received FDA clearances. There can be no assurance that any of these products can be brought to market successfully. | | | | The commercialization of new future products will require significant research, development, preclinical and clinical testing, and regulatory approvals. Where potential new products do not advance beyond early product development or do not demonstrate preclinical or clinical efficacy, they will not likely be commercialized. In addition, there can be no assurance that the FDA and other regulatory authorities will clear our products in a timely manner. | | | • | Our ability to develop and commercialize products will depend on our ability to internally develop preclinical, clinical, regulatory, manufacturing and sales, distribution and marketing capabilities, or enter into arrangements with third parties to provide those functions. We may not be successful in developing these capabilities or entering into agreements with third parties on favorable terms. To the extent we rely on third parties for these capabilities, our control over such activities may be reduced which could make us dependent upon these parties. The inability to develop or contract for these capabilities would significantly impair our ability to develop and commercialize products and thus our ability to become profitable. | | | | Related factors that may impair our ability to develop and commercialize products include our reliance on pre-clinical and clinical data concerning our products and product introductions by competing companies. Likewise, in the event we are unable to manufacture our products efficiently or demonstrate to the relevant markets the value of our products or their advantages over competitive products, our ability to commercialize products and thus our operating results will be negatively affected. | | | | Sales and marketing efforts are evolving more slowly than expected. We have been relying to a significant degree on a sales force consisting of independent sales agents for the sale and marketing of our products. Market acceptance of our products, and thus our ability to become profitable, is largely dependent upon the competency of this sales force, whether they perform their duties in line with our expectations and their continued willingness to carry our products. We are exploring potential collaborations with other companies aimed at accelerating market penetration across a broader array of market segments, but we may not be able to enter into any such collaboration nor may such collaboration be successful even if we enter into one. | | | • | Our ability to develop and commercialize products will depend on market acceptance of those products.We are dependent upon the willingness of the medical community to learn about and try our products and then switch from currently used products to our products. In the event the community is reluctant or unwilling to utilize our products, our ability to generate profits will be significantly impaired. Commercial success is also dependent upon third party payor acceptance of our products. | | | • | Our ability to develop and commercialize certain products is dependent upon sufficient sources of supply for various raw materials. We may not be successful in procuring the types and quantities of raw materials necessary to commercialize certain orthobiologic products, which would significantly impair our ability to become profitable. | | | • | Future sales and profits are dependent upon obtaining and maintaining all necessary regulatory approvals. We have received clearances from the FDA for certain products as medical devices, which approvals must be maintained in order to commercialize these products. Similar FDA approval will need to be obtained for any new products in order to market those products. In addition, depending upon where we intend to engage in marketing activities, we may need to obtain the necessary approvals from the regulatory agencies of the applicable jurisdictions. Moreover, our manufacturing practices are regulated and periodically reviewed by the FDA. Failure to obtain and maintain the necessary regulatory approvals would significantly impair our ability to market our products and thus our ability to generate profits. Likewise, the marketing of our products and our profit generating capability would be impaired in the event approval of one or more of our products is limited or restricted by the FDA, either in conjunction with or subsequent to approval. |
• | We are highly dependent on several principal members of our management and scientific staff. The loss of key personnel (or the inability to recruit key personnel) could have a material adverse effect on Therics’ business and results of operations, and could inhibit product research and development, commercialization and sales and marketing efforts. Failure to retain and recruit executive management in key areas, including sales and marketing and product research and development, could prevent us from achieving our business objectives. | | | • | We are dependent upon certain license rights, patents and other proprietary rights. Future success is dependent in part on our ability to maintain and enforce license, patent and other proprietary rights. Complex legal and technical issues define the strength and value of our intellectual property portfolio. While we own or license certain patents, the issuance of a patent does not establish conclusively either validity or enforceability. | | | • | The patent positions of biotechnology firms generally are highly uncertain and involve complex legal and factual questions that can determine who has the right to develop a particular product. No clear policy has emerged regarding the breadth of claims covered by biotechnology patents in the U.S. The biotechnology patent situation outside the U.S. is even more uncertain and is currently undergoing review and revision in many countries. Changes in, or different interpretations of, patent laws in the U.S. and other countries might allow others to use our discoveries or to develop and commercialize our products without any compensation to us. | | | • | Our business exposes us to potential product liability claims. The testing, manufacturing, marketing and sale of our products subject us to product liability risk, an inherent risk for our industry. A successful product liability action against us may have a material adverse effect on our business. Moreover, present insurance coverage may not be adequate to cover potential future product liability claims. |
| Business Segment Review
Net sales (sales less freight) and operating profit from ongoing operations are the measures of sales and operating profit used by the chief operating decision maker of each segment for purposes of assessing performance.
Film Products
Net Sales. Net sales in Film Products were $413.3 million in 2004, $365.5 million in 2003 and $376.9 million in 2002. Net sales in 2002 include revenue related to volume shortfall payments of $9.3 million (none in 2003 and 2004). While we continue to have volume shortfall agreements in place for certain products, the majority of payments received in 2002 relate to older supply agreements for which volume commitments have expired. Total volume was 278.7 million pounds in 2004, 274.2 million pounds in 2003 and 303.2 million pounds in 2002. Total volume related to the business in Argentina sold in the third quarter of 2004 was 9.4 million pounds in 2004, 10.8 million pounds in 2003 and 10 million pounds in 2002.
See the executive summary beginning on page 15 for discussion of net sales and operating results for Film Products in 2004 compared with 2003.
Excluding the effects of volume shortfall payments, net sales and volume declines in 2003 compared with 2002 were primarily due to the loss of certain domestic backsheet business with P&G. Domestic backsheet net sales excluding volume shortfall payments were approximately $45 million in 2003 and $95 million in 2002.
|
We lost share in domestic backsheet as the market transitioned from products made from film to products made from laminates of film and nonwovens. We did not anticipate this market change and fell behind on the technology curve. Once initial business was lost, economies of scale began to increasingly favor the competition resulting in additional lost business. We have made a number of changes in response to losing this business, including increasing our marketing resources, conducting our own consumer research and selling to the broader marketplace. We also are continuously focused on reducing the cost of our products in light of competitive pricing pressures. While we continue to sell backsheet products on a global basis, our primary prospects for growth relate to:
| |
• | Apertured films and nonwoven materials used as topsheets in feminine hygiene products (for example, our new apertured topsheet product for P&G’s sanitary napkin business); | | | • | Elastic materials used in baby diapers (for example, our elastic fastening components improve overall comfort and fit); | | | • | Materials used in adult incontinent products (for example, our elastic materials and transfer layers meet the growing need for adult incontinent products that improve the lifestyles of an aging population); | | | • | Films used for surface protection (for example, our protective film is used to protect automobiles and flat panel display components such as glass during fabrication, shipping and handling); | | | • | Films used for packaging (for example, our thin-gauge high density polyethylene film used as overwrap for tissue and towel products provides customers with cost savings and is readily printable and convertible on conventional processing equipment); and | | | • | Continued global expansion efforts. |
| Excluding domestic backsheet sales, net sales in Film Products grew at a compounded annual growth rate of approximately 12% from 2000-2004 (7% on a volume basis).
Operating Profit. Operating profit in Film Products for 2004, 2003 and 2002 was as follows:
|
| | | (In Millions) | |
|---|
| | 2004 | | 2003 | | 2002 | |
|---|
| | Operating profit as reported | | | $ | 32.9 | | $ | 39.9 | | $ | 75.1 | |
| | Volume shortfall payments | | | | — | | | — | | | 9.3 | | | Unusual items: | | | | Gain (loss) on terminations and revisions of contracts with P&G: | | | | Proceeds from contract terminations and revisions | | | | — | | | — | | | 11.7 | | | Related asset write-downs | | | | — | | | — | | | (6.1 | ) |
| Gain (loss) on terminations and revisions of contracts
with P&G | | | | — | | | — | | | 5.6 | | Losses associated with plant shutdowns, asset
impairments and restructurings and other unusual items | | | | (10.4 | ) | | (5.8 | ) | | (2.9 | ) |
| | | | | | (10.4 | ) | | (5.8 | ) | | 2.7 | |
| Operating profit excluding volume shortfall payments,
losses associated with plant shutdowns, asset
impairments and restructurings and unusual items | | | $ | 43.3 | | $ | 45.7 | | $ | 63.1 | |
|
See the executive summary beginning on page 15 for discussion of net sales and operating results for Film Products in 2004 compared to 2003.
The decline in operating profit from ongoing operations excluding volume shortfall payments was $17.4 million or 28% in 2003 compared with 2002, and was almost entirely due to the loss of the domestic backsheet business with P&G discussed above.
Identifiable Assets. Identifiable assets in Film Products increased to $472.8 million at December 31, 2004, from $422.3 million at December 31, 2003, due primarily to capital expenditures in excess of depreciation of $22.9 million (see the depreciation, amortization and capital expenditures section below for more information), higher accounts receivable and inventories supporting higher sales and appreciation of the Euro and Hungarian Forint relative to the U.S. Dollar. See discussion regarding assets on page 23 for further information.
|
Identifiable assets in Film Products increased to $422.3 million at December 31, 2003, from $379.6 million at December 31, 2002, due primarily to capital expenditures in excess of depreciation of $37.4 million (see the depreciation, amortization and capital expenditures section below for more information) and appreciation of the Euro relative to the U.S. Dollar.
Depreciation, Amortization and Capital Expenditures. Depreciation and amortization for Film Products was $22 million in 2004, up from $19.8 million in 2003 due to the relatively high level of capital expenditures in 2003 and 2004. We project depreciation expense for Film Products to increase to about $27 million in 2005.
Depreciation and amortization for Film Products was $19.8 million in 2003, down from $20.1 million in 2002. Depreciation expense in 2003 does not fully reflect significantly higher capital expenditures in 2003 since a large portion of the related assets were not placed in service by the end of the year.
Capital expenditures in Film Products in 2004 totaled $44.8 million and reflect the normal replacement of machinery and equipment and:
| |
•· | Expansion of production capacity at our films plant in Kerkrade, The Netherlands, including capacity for the newan apertured topsheet product for P&G’s sanitary napkinfeminine hygiene business; |
| | • | Construction of a new films plant in Guangzhou, China, including production capacity for apertured film used in feminine hygiene products; | | | • | Expansion of production capacity at our films plant in Shanghai, China, including capacity for breathable film used in personal care products and protective clothing; | | | •· | Expansion of production capacity at our films plant in Lake Zurich, Illinois, including capacity for elastic materials used in baby diapers and photopolymeradult incontinent products; |
| · | Expansion of production capacity at our films used for surface protection;plant in Guangzhou, China; |
| · | Leasehold improvements and the addition of laminating capacity at our new films plant in Red Springs, North Carolina; |
•· | Expansion of production capacity at our plant in Pottsville, Pennsylvania, including capacity for polyethylene film used for packaging and masking film used for surface protection; |
| · | Leasehold improvements and equipment upgrades at our new R&D facility in Richmond, Virginia; and |
| | •· | A new global information system. |
Aluminum Extrusions
Net Sales and Operating Profit. Net sales were $577.3 million in 2006, up 22.4% versus $471.7 million in 2005. Operating profit from ongoing operations was $22.0 million in 2006, up 14.0% compared to $19.3 million in 2005. Volume increased to 259.9 million pounds in 2006, up 5.5% compared to 246.4 million pounds in 2005. Growth in shipments in 2006 was driven by demand for extrusions used in commercial construction and hurricane protection products, partially offset by a decline in extrusions used in residential construction. The increase in operating profit during 2006 was primarily due to higher volume and selling prices and lower energy costs (energy costs were down $1.1 million), partially offset by appreciation of the Canadian Dollar ($2.8 million) and higher charges for possible uncollectible accounts ($1.4 million).
Net sales in Aluminum Extrusions were $471.7 million in 2005, up 11% from $425.1 million in 2004 primarily due to higher selling prices driven by higher raw material and energy costs. Annual volume increased to 246.4 million pounds in 2005 from 243.4 million pounds in 2004, as stronger shipments in commercial construction and hurricane protection products were offset by lower shipments in other end markets. Operating profit from ongoing operations declined 15% to $19.3 million in 2005 from $22.6 million in 2004 due mainly to higher energy costs (approximately $7 million) and strength of the Canadian Dollar (about $3.5 million), partially offset by price increases, higher volume and an energy surcharge.
See the qualitative and quantitative disclosures about market risks section beginning on page 28 for discussion on the volatility of aluminum costs, energy costs and currency exchange rates.
Identifiable Assets. Identifiable assets in Aluminum Extrusions were $209.4 million at December 31, 2006, $214.4 million at December 31, 2005 and $210.9 million at December 31, 2004, with changes in each year due primarily to sales-driven fluctuations in accounts receivable and inventory levels. Depreciation, Amortization and Capital Expenditures. Depreciation and amortization for Aluminum Extrusions was $12.3 million in 2006, $11.5 million in 2005 and $10.9 million in 2004. The increases in 2006 and 2005 are primarily due to the start of depreciation in 2005 of capital expenditures associated with moving and upgrading the largest extrusions press at the facility shut down in Aurora, Ontario to the plant in Pickering, Ontario, and enlargement of the Pickering facility. We expect depreciation and amortization expense for Aluminum Extrusions to increase to about $12.8 million in 2007.
Capital expenditures totaled $7.4 million in 2006, $12.0 million in 2005 and $10.0 million in 2004, and reflect the normal replacement of machinery and equipment plus capital expenditures associated with the plant in Pickering, Ontario described above. Capital expenditures are expected to be approximately $14 million in 2007.
AFBS
On June 30, 2005, substantially all of the assets of AFBS, Inc. (formerly known as Therics, Inc.), a wholly-owned subsidiary of Tredegar, were sold or assigned to a newly-created limited liability company, Therics, LLC, which is controlled and managed by an individual not affiliated with Tredegar. AFBS received a 17.5% equity interest in Therics, LLC, valued at $170,000 and a 3.5% interest in Theken Spine, LLC, valued at $800,000, along with potential future payments based on the sale of certain products by Therics, LLC. AFBS retained substantially all of its liabilities in the transaction, which included customary indemnification provisions for pre-transaction liabilities. Tredegar has no obligation or intent to fund any future losses that may occur at Therics, LLC or Theken Spine, LLC. The ownership interest in Therics, LLC is accounted for under the equity method of accounting with losses limited to its initial carrying value of $170,000. The ownership interest in Theken Spine, LLC is accounted for under the cost method, with an impairment loss recognized and a new cost basis established for any write-down to estimated fair value, if necessary. The payments due from Therics, LLC that are based on the sale of certain products are recognized as income when earned. AFBS had operating losses of $3.5 million during the first six months of 2005 and $9.8 million in 2004. Results of operations for AFBS since June 30, 2005 are immaterial.
Venture Capital Investment Activities
On March 7, 2003, Tredegar Investments reached definitive agreements to sell substantially all of its portfolio of private equity partnership interests to GS Vintage Funds II, which are investment partnerships managed by Goldman Sachs Asset Management’s Private Equity Group. On the same date and in a separate transaction, Tredegar Investments also agreed to sell to W Capital Partners, an independent private equity manager, the subsidiary funds that hold substantially all of Tredegar Investments’ direct venture capital investments. The sale of these fund interests included the assumption by the buyer of Tredegar Investments’ obligations to make additional capital contributions to those funds in the future.
The sale to W Capital Partners of the subsidiary funds that hold the direct investments occurred on March 7, 2003. The sale of the private equity fund interests occurred in a series of closings.
Net proceeds from the sales totaled approximately $21.5 million. Additionally, in the first quarter of 2004 we received income tax recoveries of approximately $55 million from the carry-back of 2003 capital losses generated by these sales against gains realized in 2000 by Tredegar Investments.
The agreements governing these transactions contain customary contingent indemnification provisions that Tredegar believes will not have a material effect on its financial position or results of operations.
The operating results from venture capital investment activities have been reported as discontinued operations. Cash flows from venture capital investment activities have not been separately disclosed in the consolidated statements of cash flows. Discontinued operations in 2004 include an after-tax gain associated with venture capital investment activities of $2.9 million primarily related to the reversal of business and occupancy tax contingency accruals upon favorable resolution.
| Capital expenditures in Film Products in 2003 totaled $57.2 million and reflect the normal replacement of machinery and equipment and:
| |
• | Machinery and equipment purchased to upgrade lines and expand capacity at our films plant in Kerkrade, The Netherlands, including adding capacity for the new apertured topsheet product for P&G’s sanitary napkin business; | | | • | Expansion of capacity at our films plant in Shanghai, China; | | | • | Construction of a new films plant in Guangzhou, China; | | | • | Expansion of our polypropylene and masking film capacity at our plant in Pottsville, Pennsylvania; and | | | • | Commencing the design and implementation of a new global information system. |
| See the executive summary beginning on page 15 for further discussion of historical and projected capital expenditures (including information on related capital indemnification, take-or-pay or similar arrangements) for Film Products.
Aluminum ExtrusionsNet Sales and Operating Profit.Net sales in Aluminum Extrusions increased by 20% in 2004 (higher raw material-driven selling prices and higher volume) and declined 2% in 2003 (lower volume). Annual volume was 243.4 million pounds in 2004, 228.2 million pounds in 2003 and 234.3 million pounds in 2002 (see our market segments in the table on page 2).
See the executive summary beginning on page 15 for discussion of net sales and operating results for Aluminum Extrusions in 2004 compared with 2003.
Ongoing operating profit in Aluminum Extrusions declined by $12.2 million or 45% in 2003 due to appreciation of the Canadian Dollar against the U.S. Dollar (unfavorable impact of $3.8 million), higher energy costs (up $3.2 million), lower volume (unfavorable impact of $1.7 million) and higher insurance costs (up $1.6 million).
|
Identifiable Assets.Identifiable assets in Aluminum Extrusions increased to $210.9 million at December 31, 2004, from $185.3 million at December 31, 2003, due primarily to higher accounts receivable and inventories supporting higher sales and appreciation of the Canadian Dollar relative to the U.S. Dollar. See discussion regarding assets on page 23 for further information.
Identifiable assets in Aluminum Extrusions increased to $185.3 million at December 31, 2003, from $176.6 million at December 31, 2002, due primarily to the appreciation of the Canadian Dollar relative to the U.S. Dollar (positive impact of $6.8 million on the U.S. Dollar reported carrying value of property, plant and equipment).
Depreciation, Amortization and Capital Expenditures.Depreciation and amortization for Aluminum Extrusions was $10.9 million in 2004, $10.9 million in 2003 and $10.5 million in 2002.
Capital expenditures totaled $10 million in 2004, $8.3 million in 2003 and $4.8 million in 2002, and reflect the normal replacement of machinery and equipment. In addition, on November 21, 2003, we announced the acquisition of Apolo Tool and Die Manufacturing Inc. (“Apolo”) of Woodbridge, Ontario. The purchase price consisted of cash consideration of $1.6 million (including transaction costs of $110,000 and net cash acquired of $343,000). Apolo’s key capabilities include bending, CNC machining, drilling, mitering, punching, riveting, sawing and welding of aluminum extrusions and other materials. The company also has in-house tool and die design and manufacturing capability to support its fabrication services.
We project capital expenditures to be $13 million in 2005. We expect ongoing capital expenditures in Aluminum Extrusions in the $10 million range, with the excess in 2005 primarily relating to the shutdown of the Aurora Plant and the move of its largest press to our facility in Pickering, Ontario, including upgrading the press and enlarging the facility.
Therics
At Therics, sales and marketing efforts are evolving more slowly than expected, and we took steps in early January 2005 to reduce its expected loss rate from approximately $2.5 million to $2 million per quarter. We are exploring potential collaborations with other companies aimed at accelerating market penetration across a broader array of market segments.
Molecumetics
Operations at Molecumetics ceased on July 2, 2002, and results have been reported as discontinued operations. Cash flows relating to Molecumetics have not been separately disclosed in the consolidated statements of cash flows.
For the year ended December 31, 2002, the operating loss for Molecumetics was $5.9 million ($3.9 million after taxes), while revenues were $515,000. In addition to the operating loss, discontinued operations include a gain from the sale of intellectual property of $1.4 million ($891,000 after taxes) in 2003 and a loss on the disposal of $7.5 million ($4.9 million after taxes) in 2002. This loss on disposal is comprised of an impairment loss for assets of $4.9 million, severance and other employee-related costs of $1.4 million for 45 employees and estimated miscellaneous disposal costs of $1.2 million. The tangible assets were sold during the fourth quarter of 2002 for proceeds of $800,000.
Venture Capital Investment Activities
On March 7, 2003, Tredegar Investments reached definitive agreements to sell substantially all of its portfolio of private equity partnership interests to GS Vintage Funds II, which are investment partnerships managed by Goldman Sachs Asset Management’s Private Equity Group. On the same date and in a separate transaction, Tredegar Investments also agreed to sell to W Capital Partners, an independent private equity manager, the subsidiary funds that hold substantially all of Tredegar Investments’ direct venture capital investments. The sale of these fund interests included the assumption by the buyer of Tredegar Investments’ obligations to make additional capital contributions to those funds in the future.
|
The sale to W Capital Partners of the subsidiary funds that hold the direct investments occurred on March 7, 2003. The sale of the private equity fund interests occurred in a series of closings.
Net proceeds from the sales totaled approximately $21.5 million. Additionally, in the first quarter of 2004 we received income tax recoveries of approximately $55 million from the carry-back of 2003 capital losses generated by these sales against gains realized in 2000 by Tredegar Investments.
The agreements governing these transactions contain customary contingent indemnification provisions that Tredegar believes will not have a material effect on its financial position or results of operations.
The operating results from venture capital investment activities have been reported as discontinued operations. Cash flows from venture capital investment activities have not been separately disclosed in the consolidated statements of cash flows. A summary of venture capital investment activities from 2002 through disposal in 2003 is provided below:
|
| | | | | (In Thousands) | | | | | | 2003 | | 2002 | |
| Carrying value of venture capital investments,
beginning of period | | | $ | 93,765 | | $ | 155,084 | | Venture capital investment activity for period:
(pre-tax amounts): | | | | New investments | | | | 2,807 | | | 20,373 | | Proceeds from the sale of investments, including
broker receivables at end of period | | | | (21,504 | ) | | (8,918 | ) | | Realized gains | | | | — | | | 4,454 | | | Realized losses, write-offs and write-downs | | | | (70,256 | ) | | (65,154 | ) | (Decrease) increase in unrealized gain on
available-for-sale securities | | | | (917 | ) | | (12,074 | ) | Carrying value of public securities retained by
Tredegar Investments* | | | | (3,895 | ) | | — | |
| Carrying value of venture capital investments,
end of period | | | $ | — | | $ | 93,765 | |
| Summary of amounts reported as discontinued
operations in the consolidated statements of
income: | | | | Pretax gains (losses), net | | | $ | (70,256 | ) | $ | (60,700 | ) | Operating expenses (primarily management fee
expenses) | | | | (599 | ) | | (5,594 | ) |
| | Loss before income taxes | | | | (70,855 | ) | | (66,294 | ) | | Income tax benefits | | | | 24,286 | | | 23,866 | |
| | Loss from venture capital investment activities | | | $ | (46,569 | ) | $ | (42,428 | ) |
|
* | At December 31, 2003, Tredegar Investments held 596,492 shares of Vascular Solutions, Inc. (NASDAQ: VASC) and 265,955 shares of Illumina, Inc. (NASDAQ: ILMN). These securities, which were related to Tredegar Investments’ earlier venture capital investment activities, were sold in 2004 for $7.2 million, including gains recognized of $6.1 million ($4 million after taxes). At December 31, 2003, these securities were classified as available-for-sale, included in the consolidated balance sheets in “Other assets and deferred charges” ($5.4 million market value) and stated at market value with unrealized gains reported directly in shareholders’ equity net of related deferred income taxes. |
Discontinued operations in 2004 include an after-tax gain associated with venture capital investment activities of $2.9 million primarily related to the reversal of business and occupancy tax contingency accruals upon favorable resolution.
Item 7A. QUANTITATIVE AND QUALITATIVE DISCLOSURES ABOUT MARKET RISK
See discussion of quantitative and qualitative disclosures about market risk beginning on page 28 in Management’s Discussion and Analysis.
|
See discussion of quantitative and qualitative disclosures about market risk beginning on page 28 in Management’s Discussion and Analysis.
| FINANCIAL STATEMENTS AND SUPPLEMENTARY DATA See the index on page 43 for references to management’s report on internal control over financial reporting, report of the independent registered public accounting firm, the consolidated financial statements and selected quarterly financial data.
| |
See the index on page 40 for references to the report of the independent registered public accounting firm, the consolidated financial statements and selected quarterly financial data.
| CHANGES IN AND DISAGREEMENTS WITH ACCOUNTANTS ON ACCOUNTING AND FINANCIAL DISCLOSURESDISCLOSURE |
None.
| None.
| CONTROLS AND PROCEDURESEvaluation of Disclosure Controls and Procedures
Pursuant to Rule 13a-15(b) under the Securities Exchange Act of 1934, we carried out an evaluation, with the participation of our management, including our principal executive officer and principal financial officer, of the effectiveness of our disclosure controls and procedures (as defined under Rule 13a-15(e) under the Securities Exchange Act of 1934) as of the end of the period covered by this report. Based upon that evaluation, our principal executive officer and principal financial officer concluded that our disclosure controls and procedures are effective to ensure that information required to be disclosed by us in the reports that we file or submit under the Exchange Act, is recorded, processed, summarized and reported, within the time periods specified in the SEC's rules and forms, and that such information is accumulated and communicated to our management, including our principal executive officer and principal financial officer, as appropriate, to allow timely decisions regarding required disclosure.
There has been no change in our internal control over financial reporting during the quarter ended December 31, 2004, that has materially affected, or is reasonably likely to materially affect, our internal control over financial reporting.
Management’s Report on Internal Control Over Financial Reporting
Our management is responsible for establishing and maintaining adequate internal control over financial reporting, as such term is defined in Exchange Act Rule 13a-15(f) under the Securities Exchange Act of 1934, as amended. The Company’s internal control over financial reporting is designed to provide reasonable assurance to the Company’s management and board of directors regarding the reliability of financial reporting and the preparation and fair presentation of published financial statements in accordance with generally accepted accounting principles in the United States of America and includes policies and procedures that:
| |
Evaluation of Disclosure Controls and Procedures
Pursuant to Rule 13a-15(b) under the Securities Exchange Act of 1934, we carried out an evaluation, with the participation of our management, including ourprincipal executive officer and principal financial officer, of the effectiveness of our disclosure controls and procedures (as defined under Rule 13a-15(e) under the Securities Exchange Act of 1934) as of the end of the period covered by this report. Based upon that evaluation, ourprincipal executive officer and principal financial officer concluded that our disclosure controls and procedures are effective to ensure that information required to be disclosed by us in the reports that we file or submit under the Exchange Act, is recorded, processed, summarized and reported, within the time periods specified in the SEC's rules and forms, and that such information is accumulated and communicated to our management, including our principal executive officer and principal financial officer, as appropriate, to allow timely decisions regarding required disclosure.
Management’s Report on Internal Control Over Financial Reporting
Our management is responsible for establishing and maintaining adequate internal control over financial reporting, as such term is defined in Exchange Act Rule 13a-15(f) under the Securities Exchange Act of 1934, as amended. The Company’s internal control over financial reporting is designed to provide reasonable assurance to the Company’s management and board of directors regarding the reliability of financial reporting and the preparation and fair presentation of published financial statements in accordance with generally accepted accounting principles in the United States of America and includes policies and procedures that:
•· | Pertain to the maintenance of records that, in reasonable detail, accurately and fairly reflect the transactions and dispositions of our assets; |
| | •· | Provide reasonable assurance that transactions are recorded as necessary to permit preparation of financial statements in accordance with generally accepted accounting principles in the United States of America, and that our receipts and expenditures are being made only in accordance with authorization of our management and directors; and |
| | •· | Provide reasonable assurance regarding prevention or timely detection of unauthorized acquisition, use or disposition of our assets that could have a material effect on the consolidated financial statements. |
Internal control over financial reporting includes the controls themselves, monitoring (including internal auditing practices) and actions taken to correct deficiencies as identified.
Because of its inherent limitations, internal control over financial reporting may not prevent or detect misstatements. Also, projections of any evaluation of effectiveness to future periods are subject to the risk that controls may become inadequate because of changes in conditions, or that the degree of compliance with the policies or procedures may deteriorate.
Management conducted an evaluation of the effectiveness of our internal control over financial reporting based on the framework in Internal Control - Integrated Framework issued by the Committee of Sponsoring Organizations of the Treadway Commission. Based on their evaluation under the framework in Internal Control — Integrated Framework, our management concluded that our internal control over financial reporting was effective as of December 31, 2006.
Our management’s assessment of the effectiveness of our internal control over financial reporting as of December 31, 2006, has been audited by PricewaterhouseCoopers LLP, an independent registered public accounting firm, as stated in their report which is included on pages 40-41.
Changes in Internal Control Over Financial Reporting
During the fourth quarter of 2006, we completed the installation of a new information system at U.S. locations in Film Products. This was the only change in our internal control over financial reporting during the quarter ended December 31, 2006, that has materially affected, or is reasonably likely to materially affect, our internal control over financial reporting.
Internal control over financial reporting includes the controls themselves, monitoring (including internal auditing practices) and actions taken to correct deficiencies as identified.
Because of its inherent limitations, internal control over financial reporting may not prevent or detect misstatements. Also, projections of any evaluation of effectiveness to future periods are subject to the risk that controls may become inadequate because of changes in conditions, or that the degree of compliance with the policies or procedures may deteriorate.
Management conducted an evaluation of the effectiveness of our internal control over financial reporting based on the framework inInternal Control - Integrated Framework issued by the Committee of Sponsoring Organizations of the Treadway Commission. Based on their evaluation under the framework inInternal Control — Integrated Framework, our management concluded that our internal control over financial reporting was effective as of December 31, 2004. Our management’s assessment of the effectiveness of our internal control over financial reporting as of December 31, 2004, has been audited by PricewaterhouseCoopers LLP, an independent registered public accounting firm, as stated in their report which is included on pages 43-44.
Item 9B. 9B. | |
None.
| DIRECTORS, AND EXECUTIVE OFFICERS OF TREDEGARAND CORPORATE GOVERNANCE The information concerning directors and persons nominated to become directors of Tredegar included in the Proxy Statement under the heading “Election of Directors” is incorporated herein by reference.
The information included in the Proxy Statement under the headings “Stock Ownership” and “Audit Committee Matters” is incorporated herein by reference.
Set forth below are the names, ages and titles of our executive officers:
| |
The information concerning directors and persons nominated to become directors of Tredegar included in the Proxy Statement under the headings "Election of Directors" and “Tredegar’s Board of Directors” is incorporated herein by reference.
The information concerning corporate governance included in the Proxy Statement under the heading “Board Meetings, Meetings of Non-Management Directors and the Board Committees - Audit Committee Matters” is incorporated herein by reference.
The information included in the Proxy Statement under the heading “Section 16(a) Beneficial Ownership Reporting Requirements” is incorporated herein by reference.
Set forth below are the names, ages and titles of our executive officers:
Name | | Age | | Title |
John D. Gottwald | |
52 | |
| | | | | | Norman A. Scher
| | 67
| | President and Chief Executive Officer effective March 1, 2006 | | Nancy M. Taylor | | 47 | | | Nancy M. Taylor
| | 45
| | Senior Vice President of Strategy and Special Projects
| | | | | | Thomas G. Cochran
| | 43
| | Vice President and President, Tredegar Film Products Corporation
and Corporate Senior Vice President | | D. Andrew Edwards | | 48 | | | Tammy H. Cummings
| | 41
| | Vice President, Human Resources
| | | | | | D. Andrew Edwards
| | 46
| | Vice President, Chief Financial Officer and Treasurer | | McAlister C. Marshall, II | | 37 | | | Michael W. Giancaspro
| | 49
| | Vice President, Business Development
| | | | | | Larry J. Scott
| | 54
| | Vice President, Audit
| | | | | | W. Hildebrandt Surgner, Jr.
| | 39
| | Vice President, General Counsel and Corporate Secretary |
| Norman A. Scher. Mr. Scher was elected President and Chief Executive Officer effective September 10, 2001. Mr. Scher served as Executive Vice President and Chief Financial Officer from July 10, 1989 until September 10, 2001.
|
From July 10, 1989 until May 22, 1997, he served as Treasurer.
Nancy M. Taylor. Ms. Taylor was elected Senior Vice President, Strategy and Special Projects effective November 1, 2004. Ms. Taylor served as Managing Director, European Operations, of Tredegar Film Products from January 1, 2003 until November 1, 2004. Ms. Taylor served as Vice President, Administration and Corporate Development from September 10, 2001 until February 12, 2003. Ms. Taylor served as Secretary from February 24, 1994 until February 12, 2003. She served as Vice President, Law, from November 18, 1998 until September 10, 2001, and served as General Counsel from May 22, 1997 until July 25, 2000.
Thomas G. Cochran. Mr. Cochran was elected Vice President on November 28, 2001. Mr. Cochran has served as President of Tredegar Film Products since February 22, 2000. Mr. Cochran was the Managing Director of Tredegar Film Products’ European operations from January, 1998 until May, 1999, and Business Development Manager of those operations from September, 1996 until December, 1997. Mr. Cochran was President of Brudi, Inc., a former subsidiary of Tredegar, from January, 1995 until August, 1996.
Tammy H. Cummings. Ms. Cummings was elected Vice President, Human Resources, on August 28, 2003. Ms. Cummings served as Director of Human Resources from June 1, 2002 until August 28, 2003. Prior to her employment with Tredegar, she served as Vice President, Human Resources/Organization Development for Luck Stone Corporation from 1998 until 2002 and served as Human Resources Director of Luck Stone Corporation from 1996 until 1998.
D. Andrew Edwards. Mr. Edwards was elected Vice President, Chief Financial Officer and Treasurer on August 28, 2003. Mr. Edwards has served as Vice President, Finance since November 18, 1998. Mr. Edwards has served as Treasurer since May 22, 1997. From October 19, 1992 until July 10, 2000, Mr. Edwards served as Controller.
Michael W. Giancaspro. Mr. Giancaspro was elected Vice President, Business Development, effective September 1, 2003. Prior to his current employment with Tredegar, Mr. Giancaspro served as Director of Finance and Treasurer at the Association for the Preservation of Virginia Antiquities from September 2002 until July 2003, and as Executive Vice President of Aim Technologies from October 2000 until August 2002. Mr. Giancaspro served as Vice President, Corporate Development, of Tredegar from January 1998 until April 2000, and Vice President, Corporate Planning, of Tredegar from February 1992 to January 1998.
Larry J. Scott. Mr. Scott was elected | | 56 | | Vice President, Audit on May 24, 2000. Mr. Scott served as Director of Internal Audit from February 24, 1994 until May 24, 2000.W. Hildebrandt Surgner, Jr. Mr. Surgner was elected Corporate Secretary on February 12, 2003. He was elected Vice President and General Counsel on December 16, 2002. Prior to his employment with Tredegar, he served as Senior Counsel to Philip Morris U.S.A. in 2002 and served as Counsel to Philip Morris U.S.A. from 1999 until 2001. In this capacity, Mr. Surgner was employed by Philip Morris Management Corporation. He was an Associate at the law firm of Hunton & Williams LLP from 1994 until 1999.
We have adopted a Code of Conduct that applies to all of our directors, officers and employees (including our Chief Executive Officer, Chief Financial Officer and principal accounting officer) and have posted the Code of Conduct on our web site. We intend to satisfy the disclosure requirement under Item 10 of Form 8-K relating to amendments to or waivers from any provision of our Code of Conduct applicable to Chief Executive Officer, Chief Financial Officer and principal accounting officer by posting this information on our web site. Our Internet address is www.tredegar.com. The information on our website is not, and shall not be deemed to be, a part of this report or incorporated into other filings we make with the SEC.
Because our common stock is listed on the NYSE, our chief executive officer is required to make, and he has made, an annual certification to the NYSE stating that he was not aware of any violation by us of the corporate governance listing standards of the NYSE. Our chief executive officer made his annual certification to that effect to the NYSE as of May 12, 2004. In addition, we have filed, as exhibits to this Annual Report on Form 10-K, the certifications of our principal executive officer and principal financial officer required under Section 302 of the Sarbanes Oxley Act of 2002 to be filed with the SEC regarding the quality of our public disclosure.
|
John D. Gottwald. On January 16, 2006, Mr. Gottwald was elected President and Chief Executive Officer effective March 1, 2006. Mr. Gottwald had served as Chairman of the Board of Directors since September 10, 2001. Mr. Gottwald served as President and Chief Executive Officer from July 10, 1989 until September 10, 2001. Nancy M. Taylor. Ms. Taylor was elected President of Tredegar Film Products effective April 5, 2005. She was elected Senior Vice President effective November 1, 2004. Ms. Taylor served as Senior Vice President, Strategy and Special Projects from November 1, 2004 until April 5, 2005. Ms. Taylor served as Managing Director, European Operations, of Tredegar Film Products from January 1, 2003 until November 1, 2004. Ms. Taylor served as Vice President, Administration and Corporate Development from September 10, 2001 until February 12, 2003. Ms. Taylor served as Secretary from February 24, 1994 until February 12, 2003. She served as Vice President, Law, from November 18, 1998 until September 10, 2001, and served as General Counsel from May 22, 1997 until July 25, 2000. D. Andrew Edwards. Mr. Edwards was elected Vice President, Chief Financial Officer and Treasurer on August 28, 2003. Mr. Edwards has served as Vice President, Finance since November 18, 1998. Mr. Edwards has served as Treasurer since May 22, 1997. From October 19, 1992 until July 10, 2000, Mr. Edwards served as Controller. McAlister C. Marshall, II. Mr. Marshall was elected Vice President, General Counsel and Corporate Secretary on October 1, 2006, the date that he joined Tredegar. From July 2000 until September 2006, he served as Assistant General Counsel at The Brink’s Company. He was an Associate at the law firm of Hunton & Williams LLP from 1996 until 2000. Larry J. Scott. Mr. Scott was elected Vice President, Audit, on May 24, 2000. Mr. Scott served as Director of Internal Audit from February 24, 1994 until May 24, 2000. We have adopted a Code of Conduct that applies to all of our directors, officers and employees (including our Chief Executive Officer, Chief Financial Officer and principal accounting officer) and have posted the Code of Conduct on our web site. We intend to satisfy the disclosure requirement under Item 10 of Form 8-K relating to amendments to or waivers from any provision of our Code of Conduct applicable to Chief Executive Officer, Chief Financial Officer and principal accounting officer by posting this information on our website. Our Internet address is www.tredegar.com. The information on our website is not, and shall not be deemed to be, a part of this report or incorporated into other filings we make with the SEC.
Because our common stock is listed on the NYSE, our chief executive officer is required to make, and he has made, an annual certification to the NYSE stating that he was not aware of any violation by us of the corporate governance listing standards of the NYSE. Our chief executive officer made his annual certification to that effect to the NYSE as of May 26, 2006. In addition, we have filed, as exhibits to this Annual Report on Form 10-K, the certifications of our principal executive officer and principal financial officer required under Section 302 of the Sarbanes Oxley Act of 2002 to be filed with the SEC regarding the quality of our public disclosure.
Item 11. EXECUTIVE COMPENSATION The information included in the Proxy Statement under the headings “Compensation of Directors” and “Compensation of Executive Officers” is incorporated herein by reference.
| |
The information included in the Proxy Statement under the headings "Compensation of Directors”, “Board Meetings of Non-Management Directors and Board Committees - Executive Compensation Committee Interlocks and Insider Participation”, “Compensation Discussion and Analysis”, “Executive Compensation Committee Report” and “Compensation of Executive Officers" is incorporated herein by reference.
| SECURITY OWNERSHIP OF CERTAIN BENEFICIAL OWNERS AND MANAGEMENT AND RELATED STOCKHOLDER MATTERS |
The information included in the Proxy Statement under the heading "Stock Ownership" is incorporated herein by reference. The following table summarizes information with respect to equity compensation plans under which securities are authorized for issuance as of December 31, 2006.
| | | | | | | | | Column (a) | | Column (b) | | Column (c) | | Column (d) | | Plan Category | | Number of Securities to be Issued Upon Exercise of Outstanding Options, Warrants and Rights | | Weighted Average Exercise Price of Outstanding Options, Warrants and Rights | | Number of Securities Remaining Available for Future Issuance Under Equity Compensation Plans, Excluding Securities Reflected in Column (b) | | Equity compensation plans approved by security holders* | | 1,247,173 | | $18.16 | | 1,601,700 | | Equity compensation plans not approved by security holders | | - | | - | | - | | Total | | 1,247,173 | | $18.16 | | 1,601,700 |
* Includes shares issuable pursuant to options issued under both the 2004 Equity Incentive Plan and the Directors Stock Plan.
| The information included in the Proxy Statement under the heading “Stock Ownership” and “Equity Compensation Plan Table” is incorporated herein by reference.
Item 13. CERTAIN RELATIONSHIPS AND RELATED TRANSACTIONS, AND DIRECTOR INDEPENDENCE Thomas G. Slater, Jr., a member of our board of directors, is a partner of the law firm of Hunton & Williams LLP, which we engage for legal services.
|
The information included in the Proxy Statement under the headings "Certain Relationships and Related Transactions” and “Tredegar’s Board of Directors” is incorporated herein by reference.
| PRINCIPAL ACCOUNTING FEES AND SERVICESThe following is incorporated herein by reference:
| |
The following is incorporated herein by reference:
•· | Information on accounting fees and services included in the Proxy Statement under the heading “Audit"Audit Fees;”" and |
| | •· | Information on the Audit Committee’s procedures for pre-approving certain audit and non-audit services included in the Proxy Statement under the heading “Audit“Board Meetings, Meetings of Non-Management Directors and Board Committees - Audit Committee Matters.”Matters”. |
PART IV
| EXHIBITS AND FINANCIAL STATEMENT SCHEDULES |
| (a) | List of documents filed as a part of the report: |
Tredegar Corporation
| Index to Financial Statements and Supplementary Data | | |
| Page |
|---|
|
|---|
Management’s Report on Internal Control Over Financial Reporting | 39-40Page |
| | Report of Independent Registered Public Accounting Firm | 43-44 |
40-41 | | Financial Statements: | |
| Consolidated Statements of Income for the Years Ended
December 31, 2004, 20032006, 2005 and 20022004 | 45 | 42 |
| Consolidated Balance Sheets as of December 31, 20042006 and 20032005 | 46 | 43 |
| Consolidated Statements of Cash Flows for the Years Ended
December 31, 2004, 20032006, 2005 and 20022004 | 47 | 44 |
| Consolidated Statements of Shareholders’ Equity for
the Years Ended December 31, 2004, 20032006, 2005 and 20022004 | 48 | 45 |
| | Notes to Financial Statements | 49-73 | 46-72 |
| | Selected Quarterly Financial Data (Unaudited) | 74 |
73 |
| | (2) | Financial statement schedules: None.
(3) Exhibits:
See Exhibit Index on pages 81-82.
REPORT OF INDEPENDENT REGISTERED PUBLIC ACCOUNTING FIRM
|
None.
To the Board of Directors and Shareholders of
Tredegar Corporation
We have completed an integrated audit of Tredegar Corporation’s 2004 consolidated financial statements and of its internal control over financial reporting as of December 31, 2004 and audits of its 2003 and 2002 consolidated financial statements in accordance with the standards of the Public Company Accounting Oversight Board (United States). Our opinions, based on our audits, are presented below.
Consolidated Financial Statements
In our opinion, the consolidated financial statements listed in the index appearing under Item 15(a)(1) present fairly, in all material respects, the financial position of Tredegar Corporation and its subsidiaries at December 31, 2004 and 2003, and the results of their operations and their cash flows for each of the three years in the period ended December 31, 2004 in conformity with accounting principles generally accepted in the United States of America. These financial statements are the responsibility of the Company’s management. Our responsibility is to express an opinion on these financial statements based on our audits. We conducted our audits of these statements in accordance with the standards of the Public Company Accounting Oversight Board (United States). Those standards require that we plan and perform the audit to obtain reasonable assurance about whether the financial statements are free of material misstatement. An audit of financial statements includes examining, on a test basis, evidence supporting the amounts and disclosures in the financial statements, assessing the accounting principles used and significant estimates made by management, and evaluating the overall financial statement presentation. We believe that our audits provide a reasonable basis for our opinion.
(3) | Exhibits: |
Internal Control Over Financial ReportingSee Exhibit Index on pages 80-81.Also, in our opinion, management’s assessment, included in Management’s Report on Internal Control Over Financial Reporting appearing under Item 9A, that the Company maintained effective internal control over financial reporting as of December 31, 2004 based on criteria established inInternal Control – Integrated Framework issued by the Committee of Sponsoring Organizations of the Treadway Commission (COSO), is fairly stated, in all material respects, based on those criteria. Furthermore, in our opinion, the Company maintained, in all material respects, effective internal control over financial reporting as of December 31, 2004 based on criteria established inInternal Control – Integrated Framework issued by the COSO. The Company’s management is responsible for maintaining effective internal control over financial reporting and for its assessment of the effectiveness of internal control over financial reporting. Our responsibility is to express opinions on management’s assessment and on the effectiveness of the Company’s internal control over financial reporting based on our audit. We conducted our audit of internal control over financial reporting in accordance with the standards of the Public Company Accounting Oversight Board (United States). Those standards require that we plan and perform the audit to obtain reasonable assurance about whether effective internal control over financial reporting was maintained in all material respects. An audit of internal control over financial reporting includes obtaining an understanding of internal control over financial reporting, evaluating management’s assessment, testing and evaluating the design and operating effectiveness of internal control, and performing such other procedures as we consider necessary in the circumstances. We believe that our audit provides a reasonable basis for our opinions.
A company’s internal control over financial reporting is a process designed to provide reasonable assurance regarding the reliability of financial reporting and the preparation of financial statements for external purposes in accordance with generally accepted accounting principles. A company’s internal control over financial reporting includes those policies and procedures that (i) pertain to the maintenance of records that, in reasonable detail, accurately and fairly reflect the transactions and dispositions of the assets of the company; (ii) provide reasonable assurance that transactions are recorded as necessary to permit preparation of financial statements in accordance with generally accepted accounting principles, and that receipts and expenditures of the company are being made only in accordance with authorizations of management and directors of the company; and (iii) provide reasonable assurance regarding prevention or timely detection of unauthorized acquisition, use, or disposition of the company’s assets that could have a material effect on the financial statements.
Because of its inherent limitations, internal control over financial reporting may not prevent or detect misstatements. Also, projections of any evaluation of effectiveness to future periods are subject to the risk that controls may become inadequate because of changes in conditions, or that the degree of compliance with the policies or procedures may deteriorate.
PricewaterhouseCoopers LLP
Richmond, Virginia
March 14, 2005
|
To the Board of Directors and Shareholders of Tredegar Corporation
We have completed integrated audits of Tredegar Corporation’s consolidated financial statements and of its internal control over financial reporting as of December 31, 2006 in accordance with the standards of the Public Company Accounting Oversight Board (United States). Our opinions, based on our audits, are presented below.
Consolidated Financial Statements
In our opinion, the consolidated financial statements listed in the index appearing under Item 15(a)(1) present fairly, in all material respects, the financial position of Tredegar Corporation and its subsidiaries at December 31, 2006 and 2005, and the results of their operations and their cash flows for each of the three years in the period ended December 31, 2006 in conformity with accounting principles generally accepted in the United States of America. These financial statements are the responsibility of the Company’s management. Our responsibility is to express an opinion on these financial statements based on our audits. We conducted our audits of these statements in accordance with the standards of the Public Company Accounting Oversight Board (United States). Those standards require that we plan and perform the audit to obtain reasonable assurance about whether the financial statements are free of material misstatement. An audit of financial statements includes examining, on a test basis, evidence supporting the amounts and disclosures in the financial statements, assessing the accounting principles used and significant estimates made by management, and evaluating the overall financial statement presentation. We believe that our audits provide a reasonable basis for our opinion.
As discussed in Note 1 to the consolidated financial statements, the Company changed the method in which it accounts for its defined benefit and other postretirement plans and its share-based compensation in 2006.
Internal Control Over Financial Reporting
Also, in our opinion, management’s assessment, included in Management’s Report on Internal Control Over Financial Reporting appearing under Item 9A, that the Company maintained effective internal control over financial reporting as of December 31, 2006 based on criteria established in Internal Control - Integrated Framework issued by the Committee of Sponsoring Organizations of the Treadway Commission (COSO), is fairly stated, in all material respects, based on those criteria. Furthermore, in our opinion, the Company maintained, in all material respects, effective internal control over financial reporting as of December 31, 2006 based on criteria established in Internal Control - Integrated Framework issued by the COSO. The Company’s management is responsible for maintaining effective internal control over financial reporting and for its assessment of the effectiveness of internal control over financial reporting. Our responsibility is to express opinions on management’s assessment and on the effectiveness of the Company’s internal control over financial reporting based on our audit. We conducted our audit of internal control over financial reporting in accordance with the standards of the Public Company Accounting Oversight Board (United States). Those standards require that we plan and perform the audit to obtain reasonable assurance about whether effective internal control over financial reporting was maintained in all material respects. An audit of internal control over financial reporting includes obtaining an understanding of internal control over financial reporting, evaluating management’s assessment, testing and evaluating the design and operating effectiveness of internal control, and performing such other procedures as we consider necessary in the circumstances. We believe that our audit provides a reasonable basis for our opinions.
A company’s internal control over financial reporting is a process designed to provide reasonable assurance regarding the reliability of financial reporting and the preparation of financial statements for external purposes in accordance with generally accepted accounting principles. A company’s internal control over financial reporting includes those policies and procedures that (i) pertain to the maintenance of records that, in reasonable detail, accurately and fairly reflect the transactions and dispositions of the assets of the company; (ii) provide reasonable assurance that transactions are recorded as necessary to permit preparation of financial statements in accordance with generally accepted accounting principles, and that receipts and expenditures of the company are being made only in accordance with authorizations of management and directors of the company; and (iii) provide reasonable assurance regarding prevention or timely detection of unauthorized acquisition, use, or disposition of the company’s assets that could have a material effect on the financial statements.
Because of its inherent limitations, internal control over financial reporting may not prevent or detect misstatements. Also, projections of any evaluation of effectiveness to future periods are subject to the risk that controls may become inadequate because of changes in conditions, or that the degree of compliance with the policies or procedures may deteriorate.
PricewaterhouseCoopers LLP Richmond, Virginia March 1, 2007
CONSOLIDATED STATEMENTS OF INCOME
Tredegar Corporation and Subsidiaries | Years Ended December 31 | | 2006 | | 2005 | | 2004 | | | (In Thousands, Except Per-Share Data) | | | | | | | | | | | | | | | | | Revenues and other: | | | | | | | | | Sales | | $ | 1,116,525 | | $ | 956,969 | | $ | 861,165 | | | Other income (expense), net | | | 1,444 | | | (544 | ) | | 15,604 | | | | | | 1,117,969 | | | 956,425 | | | 876,769 | | | | | | | | | | | | | | Costs and expenses: | | | | | | | | | | | | Cost of goods sold | | | 944,839 | | | 810,621 | | | 717,120 | | | Freight | | | 28,096 | | | 24,691 | | | 22,398 | | | Selling, general and administrative | | | 68,360 | | | 64,723 | | | 60,030 | | | Research and development | | | 8,088 | | | 8,982 | | | 15,265 | | | Amortization of intangibles | | | 149 | | | 299 | | | 330 | | | Interest | | | 5,520 | | | 4,573 | | | 3,171 | | Asset impairments and costs associated with exit and disposal activities | | | 4,080 | | | 16,334 | | | 22,973 | | | Total | | | 1,059,132 | | | 930,223 | | | 841,287 | | | Income from continuing operations | | | | | | | | | | | | before income taxes | | | 58,837 | | | 26,202 | | | 35,482 | | | Income taxes | | | 20,636 | | | 9,973 | | | 9,222 | | | Income from continuing operations | | | 38,201 | | | 16,229 | | | 26,260 | | | Discontinued operations: | | | | | | | | | | | | Gain from venture capital investment activities (including an after-tax gain on a tax-related item of $2,275 in 2004) | | | - | | | - | | | 2,921 | | | Income from discontinued operations | | | - | | | - | | | 2,921 | | Net income | | $ | 38,201 | | $ | 16,229 | | $ | 29,181 | | Earnings per share: | | | | | | | | | | | | Basic: | | | | | | | | | | | | Continuing operations | | $ | .99 | | $ | .42 | | $ | .69 | | | Discontinued operations | | | - | | | - | | | .08 | | | Net income | | $ | .99 | | $ | .42 | | $ | .77 | | | Diluted: | | | | | | | | | | | | Continuing operations | | $ | .98 | | $ | .42 | | $ | .68 | | | Discontinued operations | | | - | | | - | | | .08 | | | Net income | | $ | .98 | | $ | .42 | | $ | .76 | | | | | | | | | | | | | | See accompanying notes to financial statements. | | | | | | | | | | |
Tredegar Corporation and Subsidiaries | December 31 | | 2006 | | 2005 | | | (In Thousands, Except Share Data) | | | | | | | | | | | | | Assets | | | | | | | Current assets: | | | | | | | Cash and cash equivalents | | $ | 40,898 | | $ | 23,434 | | | Accounts and notes receivable, net of allowance for doubtful accounts and sales returns of $8,559 in 2006 and $5,423 in 2005 | | | 121,834 | | | 119,330 | | | Income taxes recoverable | | | 10,975 | | | 7,163 | | | Inventories | | | 68,930 | | | 62,438 | | | Deferred income taxes | | | 6,055 | | | 7,778 | | | Prepaid expenses and other | | | 4,558 | | | 4,224 | | | Total current assets | | | 253,250 | | | 224,367 | | | Property, plant and equipment, at cost: | | | | | | | | | Land and land improvements | | | 12,540 | | | 12,496 | | | Buildings | | | 95,877 | | | 91,400 | | | Machinery and equipment | | | 567,989 | | | 528,821 | | | Total property, plant and equipment | | | 676,406 | | | 632,717 | | | Less accumulated depreciation | | | 350,643 | | | 309,841 | | | Net property, plant and equipment | | | 325,763 | | | 322,876 | | | Other assets and deferred charges | | | 64,078 | | | 96,527 | | | Goodwill and other intangibles (other intangibles of $581 in 2006 and $712 in 2005) | | | 138,696 | | | 137,988 | | | Total assets | | $ | 781,787 | | $ | 781,758 | | Liabilities and Shareholders' Equity | | | | | | | | | Current liabilities: | | | | | | | | | Accounts payable | | $ | 69,426 | | $ | 61,731 | | | Accrued expenses | | | 41,906 | | | 36,031 | | | Current portion of long-term debt | | | 678 | | | - | | | Total current liabilities | | | 112,010 | | | 97,762 | | | Long-term debt | | | 61,842 | | | 113,050 | | | Deferred income taxes | | | 75,772 | | | 74,287 | | | Other noncurrent liabilities | | | 15,568 | | | 11,297 | | | Total liabilities | | | 265,192 | | | 296,396 | | | Commitments and contingencies (Notes 13 and 16) | | | | | | | | | Shareholders' equity: | | | | | | | | | Common stock (no par value): | | | | | | | | | Authorized 150,000,000 shares; | | | | | | | | | Issued and outstanding - 39,286,079 shares in 2006 and 38,737,016 in 2005 (including restricted stock) | | | 120,508 | | | 110,706 | | | Common stock held in trust for savings restoration plan (58,632 shares in 2006 and 58,156 in 2005) | | | (1,291 | ) | | (1,284 | ) | | Unearned compensation on restricted stock (109,000 shares in 2005) | | | - | | | (966 | ) | | Accumulated other comprehensive income (loss): | | | | | | | | | Unrealized gain on available-for-sale securities | | | - | | | 23 | | | Foreign currency translation adjustment | | | 21,522 | | | 14,114 | | | Gain on derivative financial instruments | | | 654 | | | 776 | | | Pension and other postretirement benefit adjustments | | | (21,211 | ) | | (2,434 | ) | | Retained earnings | | | 396,413 | | | 364,427 | | | Total shareholders' equity | | | 516,595 | | | 485,362 | | | Total liabilities and shareholders' equity | | $ | 781,787 | | $ | 781,758 | |
Tredegar Corporation and Subsidiaries | Years Ended December 31 | | 2006 | | 2005 | | 2004 | | | (In Thousands) | | | | | | | | | | | | | | | | | Cash flows from operating activities: | | | | | | | | | Net income | | $ | 38,201 | | $ | 16,229 | | $ | 29,181 | | | Adjustments for noncash items: | | | | | | | | | | | | Depreciation | | | 44,132 | | | 38,490 | | | 34,092 | | | Amortization of intangibles | | | 149 | | | 299 | | | 330 | | | Deferred income taxes | | | 10,155 | | | 9,217 | | | 1,947 | | | Accrued pension income and postretirement benefits | | | 3,178 | | | (1,979 | ) | | (3,999 | ) | | Stock option-based compensation expense | | | 970 | | | - | | | - | | | Loss from write-down of investment in Novalux | | | - | | | 5,000 | | | - | | | Gain on sale of assets | | | (317 | ) | | (4,174 | ) | | (7,560 | ) | | Loss on asset impairments and divestitures | | | 1,150 | | | 9,378 | | | 13,811 | | | Changes in assets and liabilities, net of effects from acquisitions and divestitures: | | | | | | | | | | | | Accounts and notes receivable | | | 151 | | | (3,361 | ) | | (31,711 | ) | | Inventories | | | (5,080 | ) | | 2,803 | | | (13,962 | ) | | Income taxes recoverable | | | 1,991 | | | (12,966 | ) | | 61,538 | | | Prepaid expenses and other | | | (275 | ) | | 530 | | | (258 | ) | | Accounts payable and accrued expenses | | | 11,592 | | | (3,590 | ) | | 12,269 | | | Other, net | | | (1,392 | ) | | (2,173 | ) | | (1,858 | ) | | Net cash provided by operating activities | | | 104,605 | | | 53,703 | | | 93,820 | | Cash flows from investing activities: | | | | | | | | | | | | Capital expenditures | | | (40,573 | ) | | (62,543 | ) | | (55,651 | ) | | Acquisitions | | | - | | | - | | | (1,420 | ) | | Novalux investment | | | (542 | ) | | (1,095 | ) | | (5,000 | ) | | Proceeds from the sale of assets and property disposals | | | 475 | | | 8,018 | | | 10,209 | | | Other, net | | | - | | | 636 | | | (310 | ) | | Net cash used in investing activities | | | (40,640 | ) | | (54,984 | ) | | (52,172 | ) | Cash flows from financing activities: | | | | | | | | | | | | Dividends paid | | | (6,221 | ) | | (6,190 | ) | | (6,154 | ) | | Debt principal payments and financing costs | | | (54,530 | ) | | (147,846 | ) | | (72,750 | ) | | Borrowings | | | 4,000 | | | 156,500 | | | 36,573 | | | Proceeds from exercise of stock options | | | 9,702 | | | 1,130 | | | 1,871 | | | Net cash (used in) provided by financing activities | | | (47,049 | ) | | 3,594 | | | (40,460 | ) | Effect of exchange rate changes on cash | | | 548 | | | (1,873 | ) | | 1,863 | | Increase in cash and cash equivalents | | | 17,464 | | | 440 | | | 3,051 | | Cash and cash equivalents at beginning of period | | | 23,434 | | | 22,994 | | | 19,943 | | Cash and cash equivalents at end of period | | $ | 40,898 | | $ | 23,434 | | $ | 22,994 | | | | | | | | | | | | | | | Supplemental cash flow information: | | | | | | | | | | | | Interest payments (net of amount capitalized) | | $ | 5,734 | | $ | 4,388 | | $ | 3,264 | | | Income tax payments (refunds), net | | $ | 7,828 | | $ | 14,915 | | $ | (50,006 | ) | | | | | | | | | | | | | See accompanying notes to financial statements. |
Tredegar Corporation and Subsidiaries
| | | | | | | | | | | | | Accumulated Other | | | | | | | | | | | | | | | | | Comprehensive Income (Loss) | | | | | | | | | | | | | | | | | Unrealized | | | | Gain | | Pension & | | | | | | | | | | | | | Trust for | | Unearned | | Gain on | | Foreign | | (Loss) on | | Other Post- | | Total | | | | | | | | | | | Savings | | Restricted | | Available- | | Currency | | Derivative | | retirement | | Share- | | | | | Common Stock | | Retained | | Restora- | | Stock | | for-Sale | | Trans- | | Financial | | Benefit | | holders' | | | | | Shares | | Amount | | Earnings | | tion Plan | | Compensation | | Securities | | lation | | Instruments | | Adjust. | | Equity | | | (In Thousands, Except Share and Per-Share Data) | | | | | | | | | | | | | | | | | | | | | | | | | | | | | | | | | | | | | | | | | | | | | | Balance December 31, 2003 | | | 38,176,821 | | $ | 104,991 | | $ | 331,289 | | $ | (1,212 | ) | $ | - | | $ | 2,770 | | $ | 9,997 | | $ | 444 | | $ | (880 | ) | $ | 447,399 | | | Comprehensive income (loss): | | | | | | | | | | | | | | | | | | | | | | | | | | | | | | | | | Net income | | | - | | | - | | | 29,181 | | | - | | | - | | | - | | | - | | | - | | | - | | | 29,181 | | | Other comprehensive income (loss): | | | | | | | | | | | | | | | | | | | | | | | | | | | | | | | | | Available-for-sale securities adjustment, net of reclassification adjustment (net of tax of $1,556) | | | - | | | - | | | - | | | - | | | - | | | (2,770 | ) | | - | | | - | | | - | | | (2,770 | ) | Foreign currency translation adjustment (net of tax of $4,500) | | | - | | | - | | | - | | | - | | | - | | | - | | | 8,404 | | | - | | | - | | | 8,404 | | | Reclassification of foreign currency translation loss realized on the sale of the films business in Argentina (net of tax of $625) | | | - | | | - | | | - | | | - | | | - | | | - | | | 1,161 | | | - | | | - | | | 1,161 | | Derivative financial instruments adjustment (net of tax of $247) | | | - | | | - | | | - | | | - | | | - | | | - | | | - | | | 440 | | | - | | | 440 | | | Minimum pension liability adjustment (net of tax of $149) | | | - | | | - | | | - | | | - | | | - | | | - | | | - | | | - | | | (276 | ) | | (276 | ) | | Comprehensive income | | | | | | | | | | | | | | | | | | | | | | | | | | | | | | 36,140 | | | Cash dividends declared ($.16 per share) | | | - | | | - | | | (6,154 | ) | | - | | | - | | | - | | | - | | | - | | | - | | | (6,154 | ) | | Restricted stock grant, net of forfeitures | | | 120,000 | | | 1,674 | | | - | | | - | | | (1,674 | ) | | - | | | - | | | - | | | - | | | - | | | Restricted stock amortization | | | - | | | - | | | - | | | - | | | 272 | | | - | | | - | | | - | | | - | | | 272 | | Issued upon exercise of stock options (including related income tax benefits of $868) & other | | | 300,701 | | | 2,785 | | | - | | | - | | | - | | | - | | | - | | | - | | | - | | | 2,785 | | Tredegar common stock purchased by trust for savings restoration plan | | | - | | | - | | | 62 | | | (62 | ) | | - | | | - | | | - | | | - | | | - | | | - | | | Balance December 31, 2004 | | | 38,597,522 | | | 109,450 | | | 354,378 | | | (1,274 | ) | | (1,402 | ) | | - | | | 19,562 | | | 884 | | | (1,156 | ) | | 480,442 | | | Comprehensive income (loss): | | | | | | | | | | | | | | | | | | | | | | | | | | | | | | | | | Net income | | | - | | | - | | | 16,229 | | | - | | | - | | | - | | | - | | | - | | | - | | | 16,229 | | | Other comprehensive income (loss): | | | | | | | | | | | | | | | | | | | | | | | | | | | | | | | | Available-for-sale securities adjustment, net of reclassification adjustment (net of tax of $13) | | | - | | | - | | | - | | | - | | | - | | | 23 | | | - | | | - | | | - | | | 23 | | | Foreign currency translation adjustment (net of tax of $2,933) | | | - | | | - | | | - | | | - | | | - | | | - | | | (5,448 | ) | | - | | | - | | | (5,448 | ) | | Derivative financial instruments adjustment (net of tax of $60) | | | - | | | - | | | - | | | - | | | - | | | - | | | - | | | (108 | ) | | - | | | (108 | ) | Minimum pension liability adjustment (net of tax of $630) | | | - | | | - | | | - | | | - | | | - | | | - | | | - | | | - | | | (1,278 | ) | | (1,278 | ) | | Comprehensive income | | | | | | | | | | | | | | | | | | | | | | | | | | | | | | 9,418 | | | Cash dividends declared ($.16 per share) | | | - | | | - | | | (6,190 | ) | | - | | | - | | | - | | | - | | | - | | | - | | | (6,190 | ) | | Restricted stock grant, net of forfeitures and vested shares | | | (11,000 | ) | | (49 | ) | | - | | | - | | | 49 | | | - | | | - | | | - | | | - | | | - | | | Restricted stock amortization | | | - | | | - | | | - | | | - | | | 387 | | | - | | | - | | | - | | | - | | | 387 | | Issued upon exercise of stock options (including related income tax benefits of $175) & other | | | 150,494 | | | 1,305 | | | - | | | - | | | - | | | - | | | - | | | - | | | - | | | 1,305 | | Tredegar common stock purchased by trust for savings restoration plan | | | - | | | - | | | 10 | | | (10 | ) | | - | | | - | | | - | | | - | | | - | | | - | | | Balance December 31, 2005 | | | 38,737,016 | | | 110,706 | | | 364,427 | | | (1,284 | ) | | (966 | ) | | 23 | | | 14,114 | | | 776 | | | (2,434 | ) | | 485,362 | | | Comprehensive income (loss): | | | | | | | | | | | | | | | | | | | | | | | | | | | | | | | | | Net income | | | - | | | - | | | 38,201 | | | - | | | - | | | - | | | - | | | - | | | - | | | 38,201 | | | Other comprehensive income (loss): | | | | | | | | | | | | | | | | | | | | | | | | | | | | | | | | | Available-for-sale securities adjustment, net of reclassification adjustment (net of tax of $13) | | | - | | | - | | | - | | | - | | | - | | | (23 | ) | | - | | | - | | | - | | | (23 | ) | Foreign currency translation adjustment (net of tax of $3,921) | | | - | | | - | | | - | | | - | | | - | | | - | | | 7,408 | | | - | | | - | | | 7,408 | | | Derivative financial instruments adjustment (net of tax of $60) | | | - | | | - | | | - | | | - | | | - | | | - | | | - | | | (122 | ) | | - | | | (122 | ) | Minimum pension liability adjustment (net of tax of $422) | | | - | | | - | | | - | | | - | | | - | | | - | | | - | | | - | | | 821 | | | 821 | | | Comprehensive income | | | | | | | | | | | | | | | | | | | | | | | | | | | | | | 46,285 | | | Cumulative adjustment for the adoption of SFAS No. 158 relating to pension and other postretirement benefits (net of tax of $11,354) | | | - | | | - | | | - | | | - | | | - | | | - | | | - | | | - | | | (19,598 | ) | | (19,598 | ) | | Cash dividends declared ($.16 per share) | | | - | | | - | | | (6,221 | ) | | - | | | - | | | - | | | - | | | - | | | - | | | (6,221 | ) | | Stock-based Compensation expense | | | (25,500 | ) | | 1,066 | | | - | | | - | | | - | | | - | | | - | | | - | | | - | | | 1,066 | | | Restricted stock amortization | | | - | | | (966 | ) | | - | | | - | | | 966 | | | - | | | - | | | - | | | - | | | - | | | Issued upon exercise of stock options (including related income tax benefits of $678) & other | | | 574,563 | | | 9,702 | | | - | | | - | | | - | | | - | | | - | | | - | | | - | | | 9,702 | | | Tredegar common stock purchased by trust for savings restoration plan | | | - | | | - | | | 6 | | | (7 | ) | | - | | | - | | | - | | | - | | | - | | | (1 | ) | | Balance December 31, 2006 | | | 39,286,079 | | $ | 120,508 | | $ | 396,413 | | $ | (1,291 | ) | $ | - | | $ | - | | $ | 21,522 | | $ | 654 | | $ | (21,211 | ) | $ | 516,595 | | | | | | | | | | | | | | | | | | | | | | | | | | | | | | | | | | | See accompanying notes to financial statements. | | | | | | | | | | | | | | | | |
NOTES TO FINANCIAL STATEMENTS
Tredegar Corporation and Subsidiaries (In thousands, except Tredegar share and per-share amounts and unless otherwise stated)
CONSOLIDATED STATEMENTS OF INCOME1 |
| Tredegar Corporation and Subsidiaries | |
| Years Ended December 31 | 2004 | | 2003 | | 2002 | |
|---|
| | (In thousands, except per-share amounts) | | | |
|---|
| | | | |
|---|
| Revenues: | | | | | | | | | | | Sales | $ | 861,165 | | $ | 738,651 | | $ | 753,724 | | | Other income (expense), net | | 15,604 | | | 7,853 | | | 546 | |
| | | | 876,769 | | | 746,504 | | | 754,270 | |
| | Costs and expenses: | | | | | | | | | | | Cost of goods sold | | 717,120 | | | 606,242 | | | 582,658 | | | Freight | | 22,398 | | | 18,557 | | | 16,319 | | | Selling, general and administrative | | 60,030 | | | 53,341 | | | 52,252 | | | Research and development | | 15,265 | | | 18,774 | | | 20,346 | | | Amortization of intangibles | | 330 | | | 268 | | | 100 | | | Interest | | 3,171 | | | 6,785 | | | 9,352 | | Asset impairments and costs associated
with exit and disposal activities | | 22,973 | | | 11,426 | | | 3,884 | | | Unusual items | | — | | | 1,067 | | | (6,147 | ) |
| | Total | | 841,287 | | | 716,460 | | | 678,764 | |
| Income from continuing operations
before income taxes | | 35,482 | | | 30,044 | | | 75,506 | | | Income taxes | | 9,222 | | | 10,717 | | | 26,881 | |
| | Income from continuing operations | | 26,260 | | | 19,327 | | | 48,625 | |
| | Discontinued operations: | | | | | | | | | | Gain (loss) from venture capital investment activities (including an
after-tax gain on a tax-related item of $2,275 in 2004 and an after-tax
loss on the sale of the venture capital investment portfolio of
$46,269 in 2003) | | 2,921 | | | (46,569 | ) | | (42,428 | ) | Income (loss) from operations of Molecumetics
(including loss on disposal of $4,875 in 2002) | | — | | | 891 | | | (8,728 | ) |
| | Income (loss) from discontinued operations | | 2,921 | | | (45,678 | ) | | (51,156 | ) |
| | Net income (loss) | $ | 29,181 | | $ | (26,351 | ) | $ | (2,531 | ) |
| | Earnings (loss) per share: | | | | | | | | | | | Basic: | | | | | | | | | | | Continuing operations | $ | .69 | | $ | .51 | | $ | 1.27 | | | Discontinued operations | | .08 | | | (1.20 | ) | | (1.34 | ) |
| | Net income (loss) | $ | .77 | | $ | (.69 | ) | $ | (.07 | ) |
| | Diluted: | | Continuing operations | $ | .68 | | $ | .50 | | $ | 1.25 | | | Discontinued operations | | .08 | | | (1.19 | ) | | (1.32 | ) |
| | Net income (loss) | $ | .76 | | $ | (.69 | ) | $ | (.07 | ) |
| | | | | | | See accompanying notes to financial statements. |
CONSOLIDATED BALANCE SHEETS |
| Tredegar Corporation and Subsidiaries | |
| December 31 | 2004 | | 2003 | |
|---|
|
|---|
| (In thousands, except share amounts) | | |
|---|
| | |
|---|
| Assets | | | | | | | | Current assets: | | | | | | | | Cash and cash equivalents | $ | 22,994 | | $ | 19,943 | | | Accounts and notes receivable, net | | 117,314 | | | 84,110 | | | Income taxes recoverable | | — | | | 61,508 | | | Inventories | | 65,360 | | | 49,572 | | | Deferred income taxes | | 10,181 | | | 10,998 | | | Prepaid expenses and other | | 4,689 | | | 5,015 | |
| | Total current assets | | 220,538 | | | 231,146 | |
| | Property, plant and equipment, at cost: | | Land and land improvements | | 12,637 | | | 12,739 | | | Buildings | | 90,830 | | | 80,581 | | | Machinery and equipment | | 518,258 | | | 486,767 | |
| | Total property, plant and equipment | | 621,725 | | | 580,087 | | | Less accumulated depreciation | | 305,033 | | | 282,611 | |
| | Net property, plant and equipment | | 316,692 | | | 297,476 | | | Other assets and deferred charges | | 89,261 | | | 83,855 | | Goodwill and other intangibles (other intangibles
of $1,939 in 2004 and $1,297 in 2003) | | 142,983 | | | 140,548 | |
| | Total assets | $ | 769,474 | | $ | 753,025 | |
| | | | | Liabilities and Shareholders’ Equity | | | | | | | | Current liabilities: | | | | | | | | Accounts payable | $ | 63,852 | | $ | 46,706 | | | Accrued expenses | | 38,141 | | | 42,456 | | | Income taxes payable | | 1,446 | | | — | | | Current portion of long-term debt | | 13,125 | | | 8,750 | |
| | Total current liabilities | | 116,564 | | | 97,912 | | | Long-term debt | | 90,327 | | | 130,879 | | | Deferred income taxes | | 71,141 | | | 66,276 | | | Other noncurrent liabilities | | 11,000 | | | 10,559 | |
| | Total liabilities | | 289,032 | | | 305,626 | |
| Commitments and contingencies (Notes 13 and 16)
Shareholders’ equity: | | | | | | | | Common stock (no par value): | | | | | | | | Authorized 150,000,000 shares; | | | | | | | Issued and outstanding - 38,597,522 shares
in 2004 (including restricted stock) and 38,176,821 in 2003 | | 109,450 | | | 104,991 | | Common stock held in trust for savings restoration
plan (57,489 shares in 2004 and 53,871 in 2003) | | (1,274 | ) | | (1,212 | ) | Unearned compensation on restricted stock (120,000
shares in 2004) | | (1,402 | ) | | — | | | Accumulated other comprehensive income (loss): | | | | | | | | Unrealized gain on available-for-sale securities | | — | | | 2,770 | | | Foreign currency translation adjustment | | 19,562 | | | 9,997 | | | Gain on derivative financial instruments | | 884 | | | 444 | | | Minimum pension liability | | (1,156 | ) | | (880 | ) | | Retained earnings | | 354,378 | | | 331,289 | |
| | Total shareholders’ equity | | 480,442 | | | 447,399 | |
| | Total liabilities and shareholders’ equity | $ | 769,474 | | $ | 753,025 | |
| | | | See accompanying notes to financial statements. |
CONSOLIDATED STATEMENTS OF CASH FLOWS |
| Tredegar Corporation and Subsidiaries | |
| Years Ended December 31 | 2004 | | 2003 | | 2002 | |
|---|
| | (In thousands) | | | |
|---|
| | | |
|---|
| Cash flows from operating activities: | | | | | | | | | | | Net income (loss) | $ | 29,181 | | $ | (26,351 | ) | $ | (2,531 | ) | | Adjustments for noncash items: | | | | | | | | | | | Depreciation | | 34,092 | | | 32,354 | | | 31,834 | | | Amortization of intangibles | | 330 | | | 268 | | | 100 | | | Deferred income taxes | | 1,947 | | | 37,370 | | | 7,690 | | | Accrued pension income and postretirement benefits | | (3,999 | ) | | (4,812 | ) | | (9,101 | ) | | Loss on venture capital investments | | — | | | 70,256 | | | 60,700 | | | Gain on sale of corporate assets | | (7,560 | ) | | (5,155 | ) | | — | | | Loss on equipment writedowns and divestitures | | 13,811 | | | 2,456 | | | 12,514 | | | Allowance for doubtful accounts | | — | | | — | | | 1,207 | | Changes in assets and liabilities, net of effects from
acquisitions and divestitures: | | | | | | | | | | | Accounts and notes receivable | | (31,711 | ) | | 14,649 | | | (15,718 | ) | | Inventories | | (13,962 | ) | | (2,294 | ) | | 1,641 | | | Income taxes recoverable | | 61,538 | | | (48,737 | ) | | (7,453 | ) | | Prepaid expenses and other | | (258 | ) | | (763 | ) | | (1,579 | ) | | Accounts payable and accrued expenses | | 12,269 | | | 7,801 | | | (12,686 | ) | | Other, net | | (1,858 | ) | | (661 | ) | | (1,345 | ) |
| | Net cash provided by operating activities | | 93,820 | | | 76,381 | | | 65,273 | |
| | Cash flows from investing activities: | | | | | | | | | | | Capital expenditures | | (55,651 | ) | | (65,808 | ) | | (31,336 | ) | | Acquisitions (net of cash acquired of $343 in 2003) | | (1,420 | ) | | (1,579 | ) | | — | | Novalux investment in 2004 and venture
capital investments in 2003 and 2002 | | (5,000 | ) | | (2,807 | ) | | (20,373 | ) | | Proceeds from the sale of venture capital investments | | — | | | 21,504 | | | 8,918 | | Proceeds from the sale of corporate assets and
property disposals | | 10,209 | | | 9,602 | | | 2,020 | | | Other, net | | 1,553 | | | 2,600 | | | (1,317 | ) |
| | Net cash used in investing activities | | (50,309 | ) | | (36,488 | ) | | (42,088 | ) |
| | Cash flows from financing activities: | | | | | | | | | | | Dividends paid | | (6,154 | ) | | (6,103 | ) | | (6,134 | ) | | Debt principal payments | | (72,750 | ) | | (255,000 | ) | | (5,218 | ) | | Borrowings | | 36,573 | | | 135,349 | | | — | | | Repurchases of Tredegar common stock | | — | | | (5,170 | ) | | (1,429 | ) | | Proceeds from exercise of stock options | | 1,871 | | | 1,046 | | | 2,714 | |
| | Net cash used in financing activities | | (40,460 | ) | | (129,878 | ) | | (10,067 | ) |
| | Increase (decrease) in cash and cash equivalents | | 3,051 | | | (89,985 | ) | | 13,118 | | | Cash and cash equivalents at beginning of period | | 19,943 | | | 109,928 | | | 96,810 | |
| | Cash and cash equivalents at end of period | $ | 22,994 | | $ | 19,943 | | $ | 109,928 | |
| | Supplemental cash flow information: | | | | | | | | | | | Interest payments (net of amount capitalized) | $ | 3,264 | | $ | 6,709 | | $ | 9,301 | | | Income tax payments (refunds), net | $ | (50,006 | ) | $ | (1,701 | ) | $ | (3,660 | ) |
| | | | See accompanying notes to financial statements. |
CONSOLIDATED STATEMENTS OF SHAREHOLDERS’ EQUITY |
| Tredegar Corporation and Subsidiaries | |
| | | | | | | | | | | | | | | | | | | | | | | | | | | | | | | | Accumulated Other
Comprehensive Income (Loss) | | | | | | | | | | |
| | | | | | | | Retained
Earnings | | Trust for
Savings
Restora-
tion Plan | | Unearned
Restricted
Stock
Compen-
sation | | Unrealized
Gain on
Available-
for-Sale
Securities | | Foreign
Currency
Trans-
lation | | Gain
(Loss) on
Derivative
Financial
Instruments | | Minimum
Pension
Liability | | Total
Share–
holders’
Equity | | Common Stock |
| | Shares | | Amount |
| | (In thousands, except share and per-share data) | | | | | | | | | | | | | | | | | | | | | | | | | | | | | | | | | | | | | | | | | | | | | | | | | | | | | | | | | | | | | Balance December 31, 2001 | 38,142,404 | | $ | 107,104 | | $ | 372,408 | | $ | (1,212 | ) | $ | — | | $ | 8,314 | | $ | (6,007 | ) | $ | (2,708 | ) | $ | — | | $ | 477,899 | |
| | Comprehensive income (loss): | | | | | | | | | | | | | | | | | | | | | | | | | | | | | | | Net loss | — | | | — | | | (2,531 | ) | | — | | | — | | | — | | | — | | | — | | | — | | | (2,531 | ) | | Other comprehensive income (loss): | | | | | | | | | | | | | | | | | | | | | | | | | | | | | | Available–for–sale securities adjustment,
net of reclassification adjustment
(net of tax of $4,346) | — | | | — | | | — | | | — | | | — | | | (7,728 | ) | | — | | | — | | | — | | | (7,728 | ) | Foreign currency translation adjustment
(net of tax of $940) | — | | | — | | | — | | | — | | | — | | | — | | | 1,585 | | | — | | | — | | | 1,585 | | Derivative financial instruments
adjustment (net of tax of $1,041) | — | | | — | | | — | | | — | | | — | | | — | | | — | | | 1,866 | | | — | | | 1,866 | | Minimum pension liability adjustment
(net of tax of $1,821) | — | | | — | | | — | | | — | | | — | | | — | | | — | | | — | | | (3,310 | ) | | (3,310 | ) | | | | | | | | | | | | | | | | | | | | | | | | | | | | |
| | Comprehensive loss | | | | | | | | | | | | | | | | | | | | | | | | | | | | (10,118 | ) | | Cash dividends declared ($.16 per share) | — | | | — | | | (6,134 | ) | | — | | | — | | | — | | | — | | | — | | | — | | | (6,134 | ) | | Repurchases of Tredegar common stock | (110,700 | ) | | (1,429 | ) | | — | | | — | | | — | | | — | | | — | | | — | | | — | | | (1,429 | ) | Issued upon exercise of stock options (including
related income tax benefits of $1,250) & other | 291,321 | | | 2,714 | | | — | | | — | | | — | | | — | | | — | | | — | | | — | | | 2,714 | |
| | Balance December 31, 2002 | 38,323,025 | | | 108,389 | | | 363,743 | | | (1,212 | ) | | — | | | 586 | | | (4,422 | ) | | (842 | ) | | (3,310 | ) | | 462,932 | |
| | Comprehensive income (loss): | | | | | | | | | | | | | | | | | | | | | | | | | | | | | | | Net loss | — | | | — | | | (26,351 | ) | | — | | | — | | | — | | | — | | | — | | | — | | | (26,351 | ) | | Other comprehensive income (loss): | | | | | | | | | | | | | | | | | | | | | | | | | | | | | | Available-for-sale securities adjustment,
net of reclassification adjustment
(net of tax of $1,228) | — | | | — | | | — | | | — | | | — | | | 2,184 | | | — | | | — | | | — | | | 2,184 | | Foreign currency translation adjustment
(net of tax of $7,788) | — | | | — | | | — | | | — | | | — | | | — | | | 14,419 | | | — | | | — | | | 14,419 | | Derivative financial instruments
adjustment (net of tax of $715) | — | | | — | | | — | | | — | | | — | | | — | | | — | | | 1,286 | | | — | | | 1,286 | | Minimum pension liability adjustment
(net of tax of $1,347) | — | | | — | | | — | | | — | | | — | | | — | | | — | | | — | | | 2,430 | | | 2,430 | | | | | | | | | | | | | | | | | | | | | | | | | | | | | |
| | Comprehensive loss | | | | | | | | | | | | | | | | | | | | | | | | | | | | (6,032 | ) | | Cash dividends declared ($.16 per share) | — | | | — | | | (6,103 | ) | | — | | | — | | | — | | | — | | | — | | | — | | | (6,103 | ) | | Repurchases of Tredegar common stock | (406,400 | ) | | (5,170 | ) | | — | | | — | | | — | | | — | | | — | | | — | | | — | | | (5,170 | ) | Issued upon exercise of stock options (including
related income tax benefits of $726) & other | 260,196 | | | 1,772 | | | — | | | — | | | — | | | — | | | — | | | — | | | — | | | 1,772 | |
| | Balance December 31, 2003 | 38,176,821 | | | 104,991 | | | 331,289 | | | (1,212 | ) | | — | | | 2,770 | | | 9,997 | | | 444 | | | (880 | ) | | 447,399 | |
| | Comprehensive income (loss): | | | | | | | | | | | | | | | | | | | | | | | | | | | | | | | Net income | — | | | — | | | 29,181 | | | — | | | — | | | — | | | — | | | — | | | — | | | 29,181 | | | Other comprehensive income (loss): | | | | | | | | | | | | | | | | | | | | | | | | | | | | | | Available-for-sale securities adjustment,
net of reclassification adjustment
(net of tax of $1,556) | — | | | — | | | — | | | — | | | — | | | (2,770 | ) | | — | | | — | | | — | | | (2,770 | ) | Foreign currency translation adjustment
(net of tax of $4,500) | — | | | — | | | — | | | — | | | — | | | — | | | 8,404 | | | — | | | — | | | 8,404 | | Reclassification of foreign currency translation
loss realized on the sale of the films business
in Argentina (net of tax of $625) | — | | | — | | | — | | | — | | | — | | | — | | | 1,161 | | | — | | | — | | | 1,161 | | Derivative financial instruments
adjustment (net of tax of $247) | — | | | — | | | — | | | — | | | — | | | — | | | — | | | 440 | | | — | | | 440 | | Minimum pension liability adjustment
(net of tax of $149) | — | | | — | | | — | | | — | | | — | | | — | | | — | | | — | | | (276 | ) | | (276 | ) | | | | | | | | | | | | | | | | | | | | | | | | | | | | |
| | Comprehensive income | | | | | | | | | | | | | | | | | | | | | | | | | | | | 36,140 | | | Cash dividends declared ($.16 per share) | — | | | — | | | (6,154 | ) | | — | | | — | | | — | | | — | | | — | | | — | | | (6,154 | ) | | Repurchases of Tredegar common stock | — | | | — | | | — | | | — | | | — | | | — | | | — | | | — | | | — | | | — | | | Restricted stock grant, net of forfeitures | 120,000 | | | 1,674 | | | — | | | — | | | (1,674 | ) | | — | | | — | | | — | | | — | | | — | | | Restricted stock amortization | — | | | — | | | — | | | — | | | 272 | | | — | | | — | | | — | | | — | | | 272 | | Issued upon exercise of stock options (including
related income tax benefits of $868) & other | 300,701 | | | 2,785 | | | — | | | — | | | — | | | — | | | — | | | — | | | — | | | 2,785 | | Tredegar common stock purchased by trust
for savings restoration plan | — | | | — | | | 62 | | | (62 | ) | | — | | | — | | | — | | | — | | | — | | | — | |
| | Balance December 31, 2004 | 38,597,522 | | $ | 109,450 | | $ | 354,378 | | $ | (1,274 | ) | $ | (1,402 | ) | $ | — | | $ | 19,562 | | $ | 884 | | $ | (1,156 | ) | $ | 480,442 | |
| | | | | | | | | | | | | | | | | | | | | | | | | | | | | | | | See accompanying notes to financial statements. | | | | | | | | | | | | | | | | | | | | | | |
NOTES TO FINANCIAL STATEMENTS |
| Tredegar Corporation and Subsidiaries
(In thousands, except Tredegar share and per-share amounts and unless otherwise stated) | | 1 SUMMARY OF SIGNIFICANT ACCOUNTING POLICIES |
| |
Organization and Nature of Operations. Tredegar Corporation and subsidiaries (“Tredegar”) are engaged in the manufacture of plastic films and aluminum extrusions. See Note 15 regarding restructurings and Note 17 regarding discontinued operations. Basis of Presentation. The consolidated financial statements include the accounts and operations of Tredegar and all of its majority-owned subsidiaries. Intercompany accounts and transactions have been eliminated. The preparation of financial statements in conformity with generally accepted accounting principles requires us to make estimates and assumptions that affect the reported amounts of revenues, expenses, assets and liabilities and disclosure of contingent assets and liabilities at the date of the financial statements. Actual results could differ from those estimates.
Foreign Currency Translation. The financial statements of foreign subsidiaries, where the local currency is the functional currency, are translated into U.S. Dollars using exchange rates in effect at the period end for assets and liabilities and average exchange rates during each reporting period for results of operations. Adjustments resulting from the translation of these financial statements are reflected as a separate component of shareholders’ equity. We have no foreign subsidiaries where the U.S. Dollar is the functional currency.
Transaction and remeasurement gains or losses included in income were not material in 2006, 2005 and 2004. These amounts do not include the effects between reporting periods that exchange rate changes have on income of our foreign locations that result from translation into U.S. Dollars.
Cash and Cash Equivalents. Cash and cash equivalents consist of cash on hand in excess of daily operating requirements and highly liquid investments with original maturities of three months or less. At December 31, 2006 and 2005, Tredegar had cash and cash equivalents of $40,898 and $23,434, respectively, including funds held in foreign locations of $19,118 and $14,890, respectively.
Our policy permits investment of excess cash in marketable securities that have the highest credit ratings and maturities of less than one year. The primary objectives of the policy are safety of principal and liquidity.
Accounts and Notes Receivable. Accounts receivable are stated at the amount invoiced to customers less allowances for doubtful accounts and sales returns. Accounts receivable are non-interest bearing and arise from the sale of product to customers under typical industry trade terms. Notes receivable are not significant. Past due amounts are determined based on established terms and charged-off when deemed uncollectible. The allowance for doubtful accounts is determined based on our assessment of probable losses taking into account past due amounts, customer credit profile, historical experience and current economic conditions. Other receivables include insurance recoveries due within one year and value-added taxes related to certain foreign subsidiaries.
Inventories. Inventories are stated at the lower of cost or market, with cost determined on the last-in, first-out (“LIFO”) basis, the weighted average cost or the first-in, first-out basis. Cost elements included in work-in-process and finished goods inventories are raw materials, direct labor and manufacturing overhead.
Property, Plant and Equipment. Accounts include costs of assets constructed or purchased, related delivery and installation costs and interest incurred on significant capital projects during their construction periods. Expenditures for renewals and betterments also are capitalized, but expenditures for repairs and maintenance are expensed as incurred. The cost and accumulated depreciation applicable to assets retired or sold are removed from the respective accounts, and gains or losses thereon are included in income.
Property, plant and equipment include capitalized interest of $885 in 2006, $1,387 in 2005 and $762 in 2004.
Depreciation is computed primarily by the straight-line method based on the estimated useful lives of the assets, which range from 15 to 40 years for buildings and land improvements and 3 to 25 years for machinery and equipment. The average depreciation period for machinery and equipment is approximately 13 years in Film Products and 15 years in Aluminum Extrusions.
Goodwill and Other Intangibles. The excess of the purchase price over the fair value of identifiable net assets of acquired companies is allocated to goodwill. We assess goodwill for impairment when events or circumstances indicate the carrying value may not be recoverable, or, at a minimum, on an annual basis as of December 1 of each year. Impairment reviews may result in recognition of losses. We have made determinations as to what our reporting units are and what amounts of goodwill, intangible assets, other assets and liabilities should be allocated to those reporting units.
The components of goodwill and other intangibles at December 31, 2006 and 2005, and related amortization periods are as follows:
| | | | | | | | | | December 31 | | 2006 | | 2005 | | Amortization Periods | | | Carrying value of goodwill: | | | | | | | | | Film Products | | $ | 103,562 | | $ | 102,732 | | | Not amortized | | | Aluminum Extrusions | | | 34,553 | | | 34,544 | | | Not amortized | | | Total carrying value of goodwill | | | 138,115 | | | 137,276 | | | | | | Carrying value of other intangibles: | | | | | | | | | | | | Film Products (cost basis of $1,172 in 2006 and 2005) | | | 581 | | | 712 | | | Not more than 17 yrs. | | | Total carrying value of other intangibles | | | 581 | | | 712 | | | | | | Total carrying value of goodwill and other intangibles | | $ | 138,696 | | $ | 137,988 | | | | |
A reconciliation of the beginning and ending balances of goodwill and other intangibles for each of the three years in the period ended December 31, 2006 is as follows:
| | | | | | | | | | | | 2006 | | 2005 | | 2004 | | | Goodwill and other intangibles: | | | | | | | | | Net carrying value, beginning of year | | $ | 137,988 | | $ | 142,983 | | $ | 140,548 | | | Amortization | | | (149 | ) | | (299 | ) | | (330 | ) | | Decrease due to sale of AFBS (formerly Therics) assets | | | - | | | (4,329 | ) | | - | | | Increase (decrease) due to foreign currency translation and other | | | 857 | | | (367 | ) | | 2,765 | | | Total carrying value of goodwill and other intangibles | | $ | 138,696 | | $ | 137,988 | | $ | 142,983 | |
Impairment of Long-Lived Assets. We review long-lived assets for possible impairment when events indicate that impairment may exist. For assets to be held and used in operations, if events indicate that an asset may be impaired, we estimate the future unlevered pre-tax cash flows expected to result from the use of the asset and its eventual disposition. Assets are grouped for this purpose at the lowest level for which there are identifiable and independent cash flows. If the sum of these undiscounted pre-tax cash flows is less than the carrying amount of the asset, an impairment loss is recognized. Measurement of the impairment loss is based on the estimated fair value of the asset, generally determined on a discounted after-tax cash flow basis. Assets to be disposed of are reported at the lower of their carrying amount or estimated fair value less cost to sell, with an impairment loss recognized for any writedown required.
Pension Costs and Postretirement Benefit Costs Other than Pensions. Pension costs and postretirement benefit costs other than pensions are accrued over the period employees provide service to the company. Our policy is to fund our pension plans at amounts not less than the minimum requirements of the Employee Retirement Income Security Act of 1974 and to fund postretirement benefits other than pensions when claims are incurred. In September 2006, the Financial Accounting Standards Board (“FASB”) issued Statement of Financial Accounting Standards (“SFAS”) No. 158, Employers' Accounting for Defined Benefit Pension and Other Postretirement Plans, an amendment of FASB Statements No 87, 88, 106 and 132(R), effective forpublic companies for fiscal years ending after December 15, 2006. Accordingly, we were required to recognize the funded status of our pension and other postretirement plans in our December 31, 2006 financial statements, which resulted in a reduction of prepaid pension cost of $27,651 (included in “Other assets and deferred charges” in the consolidated balance sheets), an increase in related liabilities of $3,301 (included in “Other noncurrent liabilities” in the consolidated balance sheets), a decrease in noncurrent deferred income liabilities of $11,354 and a decrease in shareholders’ equity of $19,598. See Note 11 for more information.
Postemployment Benefits. We periodically provide certain postemployment benefits purely on a discretionary basis. Related costs for these programs are accrued when it is probable that benefits will be paid and amounts can be reasonably estimated. All other postemployment benefits are either accrued under current benefit plans or are not material to our financial position or results of operations.
Revenue Recognition. Revenue from the sale of products, which is shown net of estimated sales returns and allowances, is recognized when title has passed to the customer, the price of the product is fixed and determinable, and collectibility is reasonably assured. Amounts billed to customers related to freight have been classified as sales in the accompanying consolidated statements of income. The cost of freight has been classified as a separate line in the accompanying consolidated statements of income. Taxes assessed by a governmental authority that are both imposed on and concurrent with a specific revenue-producing transaction between Tredegar and its customers (such as value-added taxes) are accounted for on a net basis and therefore excluded from revenues.
Research & Development (“R&D”) Costs. R&D costs are expensed as incurred and include primarily salaries, wages, employee benefits, equipment depreciation, facility costs and the cost of materials consumed relating to R&D efforts. R&D costs include a reasonable allocation of indirect costs.
Income Taxes. Income taxes are recognized during the period in which transactions enter into the determination of income for financial reporting purposes, with deferred income taxes being provided at enacted statutory tax rates on the differences between the financial reporting and tax bases of assets and liabilities (see Note 14). We accrue U.S. federal income taxes on unremitted earnings of our foreign subsidiaries.
Earnings Per Share. Basic earnings per share is computed using the weighted average number of shares of common stock outstanding. Diluted earnings per share is computed using the weighted average common and potentially dilutive common equivalent shares outstanding, determined as follows: | | | | | | | | | | | | 2006 | | 2005 | | 2004 | | | Weighted average shares outstanding used to compute basic earnings per share | | | 38,670,757 | | | 38,471,348 | | | 38,294,996 | | | Incremental shares attributable to stock options and restricted stock | | | 260,305 | | | 125,356 | | | 211,688 | | | Shares used to compute diluted earnings per share | | | 38,931,062 | | | 38,596,704 | | | 38,506,684 | |
Incremental shares attributable to stock options and restricted stock are computed using the average market price during the related period. During 2006, 2005 and 2004, 1,128,393, 2,024,690 and 2,073,990 of average out-of-the-money options to purchase shares were excluded from the calculation of incremental shares attributable to stock options and restricted stock.
Stock-Based Employee Compensation Plans. Effective January 1, 2006, we adopted SFAS No. 123(R), Share-Based Payment (“SFAS 123(R)”). SFAS 123(R) requires us to record compensation expense for all share-based awards. Because we used the modified prospective method in adopting SFAS 123(R), prior periods have not been restated. In addition, the cumulative adjustment (estimated forfeitures) relating to the adoption of SFAS 123(R) in the first quarter of 2006 of $96,000 has not been separately shown in the income statement due to immateriality.
For periods presented prior to 2006, we applied Accounting Principles Board (“APB”) Opinion No. 25, Accounting for Stock Issued to Employees, and related interpretations and provided the required pro forma disclosures of SFAS No. 123, Accounting for Stock-Based Compensation (“SFAS 123”). Stock options, stock appreciation rights (“SARs”) and restricted stock grants are accounted for using the intrinsic value method under APB Opinion No. 25 and related interpretations whereby:
Organization and Nature of Operations.Tredegar Corporation and subsidiaries (“Tredegar”) are engaged in the manufacture of plastic films and aluminum extrusions. We also have developed and are marketing an initial line of bone graft substitutes through our Therics subsidiary. See Note 17 regarding discontinued operations.Basis of Presentation.The consolidated financial statements include the accounts and operations of Tredegar and all of its majority-owned subsidiaries. Intercompany accounts and transactions have been eliminated.
The preparation of financial statements in conformity with generally accepted accounting principles requires us to make estimates and assumptions that affect the reported amounts of revenues, expenses, assets and liabilities and disclosure of contingent assets and liabilities at the date of the financial statements. Actual results could differ from those estimates.
Foreign Currency Translation.The financial statements of foreign subsidiaries, where the local currency is the functional currency, are translated into U.S. Dollars using exchange rates in effect at the period end for assets and liabilities and average exchange rates during each reporting period for results of operations. Adjustments resulting from the translation of these financial statements are reflected as a separate component of shareholders’ equity.
The financial statements of foreign subsidiaries where the U.S. Dollar is the functional currency, and which have certain transactions in a local currency, are remeasured as if the functional currency were the U.S. Dollar. The remeasurement of local currencies into U.S. Dollars creates translation adjustments that are included in income.
Transaction and remeasurement gains or losses included in income were not material in 2004, 2003 and 2002. These amounts do not include the effects between reporting periods that exchange rate changes have on income of our foreign locations that result from translation into U.S. Dollars.
Cash and Cash Equivalents.Cash and cash equivalents consist of cash on hand in excess of daily operating requirements and highly liquid investments with original maturities of three months or less. At December 31, 2004 and 2003, Tredegar had cash and cash equivalents of $22,994 and $19,943, respectively, including funds held in foreign locations of $21,410 and $16,188, respectively.
Our policy permits investment of excess cash in marketable securities that have the highest credit ratings and maturities of less than one year. The primary objectives of the policy are safety of principal and liquidity.
Accounts and Notes Receivable. Accounts receivable are stated at cash due from customers less allowances for doubtful accounts and sales returns. Accounts receivable are non-interest bearing and arise from the sale of product to customers under typical industry trade terms (average days sales outstanding are in the 50-day range for our plastic films business and 45-day range for our aluminum extrusions business). Notes receivable are not significant. Past due amounts are determined based on established terms and charged-off when deemed uncollectible. The allowance for doubtful accounts is determined based on our assessment of probable losses taking into account past due amounts, customer credit profile, historical experience and current economic conditions. Other receivables include insurance recoveries due within one year and value-added taxes related to certain foreign subsidiaries.
Inventories. Inventories are stated at the lower of cost or market, with cost determined on the last-in, first-out (“LIFO”) basis, the weighted average cost or the first-in, first-out basis. Cost elements included in work-in-process and finished goods inventories are raw materials, direct labor and manufacturing overhead.
Property, Plant and Equipment. Accounts include costs of assets constructed or purchased, related delivery and installation costs and interest incurred on significant capital projects during their construction periods. Expenditures for renewals and betterments also are capitalized, but expenditures for repairs and maintenance are expensed as incurred. The cost and accumulated depreciation applicable to assets retired or sold are removed from the respective accounts, and gains or losses thereon are included in income.
|
Property, plant and equipment include capitalized interest of $762 in 2004, $593 in 2003 and $674 in 2002.
Depreciation is computed primarily by the straight-line method based on the estimated useful lives of the assets, which range from 15 to 40 years for buildings and land improvements and 3 to 25 years for machinery and equipment.
Goodwill and Other Intangibles. The excess of the purchase price over the fair value of identifiable net assets of acquired companies is allocated to goodwill. We assess goodwill for impairment when events or circumstances indicate the carrying value may not be recoverable, or, at a minimum, on an annual basis as of December 1 of each year. Impairment reviews may result in recognition of losses. We have made determinations as to what our reporting units are and what amounts of goodwill, intangible assets, other assets and liabilities should be allocated to those reporting units.
The components of goodwill and other intangibles at December 31, 2004 and 2003, and related amortization periods are as follows:
| |
| | December 31 | 2004 | | 2003 | | Amortization Periods |
|---|
| | Carrying value of goodwill: | | | | | | | | | Film Products | $ | 103,788 | | $ | 102,962 | | Not amortized | | Aluminum Extrusions | | 33,764 | | | 32,797 | | Not amortized | | Therics | | 3,492 | | | 3,492 | | Not amortized |
| | Total carrying value of goodwill | | 141,044 | | | 139,251 | | |
| | Carrying value of other intangibles: | | Film Products (cost basis of $1,575 & $603, respectively) | | 990 | | | 124 | | Not more than 17 yrs. | | Therics (cost basis of $2,236 in both years) | | 949 | | | 1,173 | | 10 years |
| | Total carrying value of other intangibles | | 1,939 | | | 1,297 | | |
| | Total carrying value of goodwill and other intangibles | $ | 142,983 | | $ | 140,548 | | |
|
| A reconciliation of the beginning and ending balances of goodwill and other intangibles for each of the three years in the period ended December 31, 2004 is as follows: | |
| | | 2004 | | 2003 | | 2002 | |
|---|
| | Goodwill and other intangibles: | | | | | | | | | | | Net carrying value, beginning of year | $ | 140,548 | | $ | 137,339 | | $ | 136,488 | | | Amortization | | (330 | ) | | (268 | ) | | (100 | ) | | Increase due to foreign currency translation and other | | 2,765 | | | 3,477 | | | 951 | |
| | Net carrying value, end of year | | 142,983 | | | 140,548 | | | 137,339 | | Goodwill and other intangibles related to Therics classified as
non-current assets held for sale in the consolidated balance
sheets | | — | | | — | | | (5,057 | ) |
| | Total carrying value of goodwill and other intangibles | $ | 142,983 | | $ | 140,548 | | $ | 132,282 | |
|
| Impairment of Long-Lived Assets. We review long-lived assets for possible impairment when events indicate that impairment may exist. For assets to be held and used in operations, if events indicate that an asset may be impaired, we estimate the future unlevered pre-tax cash flows expected to result from the use of the asset and its eventual disposition. Assets are grouped for this purpose at the lowest level for which there are identifiable and independent cash flows. If the sum of these undiscounted pre-tax cash flows is less than the carrying amount of the asset, an impairment loss is recognized. Measurement of the impairment loss is based on the estimated fair value of the asset, generally determined on a discounted after-tax cash flow basis.
Assets to be disposed of are reported at the lower of their carrying amount or estimated fair value less cost to sell, with an impairment loss recognized for any writedown required.
|
Pension Costs and Postretirement Benefit Costs Other than Pensions. Pension costs and postretirement benefit costs other than pensions are accrued over the period employees provide service to the company. Our policy is to fund our pension plans at amounts not less than the minimum requirements of the Employee Retirement Income Security Act of 1974 and to fund postretirement benefits other than pensions when claims are incurred.
Postemployment Benefits. We periodically provide certain postemployment benefits purely on a discretionary basis. Related costs for these programs are accrued when it is probable that benefits will be paid. All other postemployment benefits are either accrued under current benefit plans or are not material to our financial position or results of operations.
Revenue Recognition. Revenue from the sale of products, which is shown net of estimated sales returns and allowances, is recognized when delivery of product to the customer has occurred, the price of the product is fixed and determinable, and collectibility is reasonably assured. Amounts billed to customers related to freight have been classified as sales in the accompanying consolidated statements of income. The cost of freight has been classified as a separate line in the accompanying consolidated statements of income.
Research & Development (“R&D”) Costs. R&D costs are expensed as incurred and include primarily salaries, wages, employee benefits, equipment depreciation, facility costs and the cost of materials consumed relating to R&D efforts. R&D costs include a reasonable allocation of indirect costs.
Income Taxes. Income taxes are recognized during the period in which transactions enter into the determination of income for financial reporting purposes, with deferred income taxes being provided at enacted statutory tax rates on the differences between the financial reporting and tax bases of assets and liabilities (see Note 14). We accrue U.S. federal income taxes on unremitted earnings of our foreign subsidiaries.
Earnings Per Share. Basic earnings per share is computed using the weighted average number of shares of common stock outstanding. Diluted earnings per share is computed using the weighted average common and potentially dilutive common equivalent shares outstanding, determined as follows:
| |
| | | 2004 | | 2003 | | 2002 | |
|---|
| Weighted average shares outstanding used
to compute basic earnings (loss) per share | | 38,294,996 | | | 38,096,001 | | | 38,267,780 | | Incremental shares attribute to stock
options and restricted stock | | 211,688 | | | 345,009 | | | 601,452 | |
| Shares used to compute diluted
earnings (loss) per share | | 38,506,684 | | | 38,441,010 | | | 38,869,232 | |
|
| Incremental shares attributable to stock options and restricted stock are computed using the average market price during the related period. During 2004, 2003 and 2002, 2,073,990, 2,425,575 and 2,052,610 of average out-of-the-money options to purchase shares were excluded from the calculation of incremental shares attributable to stock options and restricted stock.
Stock-Based Employee Compensation Plans. Stock options, stock appreciation rights (“SARs”) and restricted stock grants are accounted for using the intrinsic value method under APB Opinion No. 25, “Accounting for Stock Issued to Employees,” and related interpretations whereby:
|
•· | No compensation cost is recognized for fixed stock option or restricted stock grants unless the quoted market price of the stock at the measurement date (ordinarily the date of grant or award) is in excess of the amount the employee is required to pay; and |
| | •· | Compensation cost for SARs is recognized and adjusted up through the date of exercise or forfeiture based on the estimated number of SARs expected to be exercised multiplied by the difference between the market price of our stock and the amount the employee is required to pay. |
Had compensation cost for stock option grants been determined in 2004, 2003 and 2002 based on the fair value at the grant dates, our income and diluted earnings per share from continuing operations would have been reduced to the pro forma amounts indicated below: |
| |
|---|
| | | 2004 | | 2003 | | 2002 | |
| Income from continuing operations:
As reported | $ | 26,260 | | $ | 19,327 | | $ | 48,625 | | Stock option-based employee
compensation cost, net of tax, based
on the fair value method | | (2,133 | ) | | (2,194 | ) | | (2,268 | ) |
| | Pro forma income from continuing operations | $ | 24,127 | | $ | 17,133 | | $ | 46,357 | |
| Basic earnings per share from
continuing operations: | | | | | | | | | | | As reported | $ | .69 | | $ | .51 | | $ | 1.27 | | | Pro forma | | .63 | | | .45 | | | 1.21 | |
| Diluted earnings per share from
continuing operations: | | | | | | | | | | | As reported | $ | .68 | | $ | .50 | | $ | 1.25 | | | Pro forma | | .63 | | | .45 | | | 1.19 | |
|
| Compensation cost related to stock-based compensation (restricted stock grants) included in determining net income from continuing operations was $272 in 2004, $95 in 2003 and $203 in 2002.
The fair value of each option was estimated as of the grant date using the Black-Scholes options-pricing model. The assumptions used in this model for valuing Tredegar stock options granted during 2004, 2003 and 2002 are as follows:
| |
| | | | | 2004 | | 2003 | | 2002 | |
| | Dividend yield | | | | 1.2 | % | | 1.0 | % | | .9 | % | | Volatility percentage | | | | 45.0 | % | | 45.0 | % | | 45.0 | % | | Weighted average risk-free interest rate | | | | 3.1 | % | | 4.0 | % | | 4.7 | % | | Holding period (years): | | | | | | | | | | | |
|---|
| Officers | | | | n/a | | | 7.0 | | | 7.0 | | | Management | | | | 5.0 | | | 5.0 | | | 5.0 | | | Other employees | | | | 3.0 | | | n/a | | | 3.0 | | Weighted average market prices at date of
grant (market price equals exercise price): | | | | | | | | | | | |
|---|
| Officers and management | | | $ | 13.97 | | $ | 16.44 | | $ | 18.71 | | | Other employees | | | | 13.95 | | | n/a | | | 18.90 | |
|
Tredegar Stock options granted during 2004, 2003 and 2002, and related estimated fair value at the date of grant, are as follows:
| |
| | | 2004 | | 2003 | | 2002 | |
|---|
| | Stock options granted (number of shares): | | | | | | | | | | | | | Officers | | | | n/a | | | 10,000 | | | 181,000 | | | Management | | | | 176,950 | | | 5,000 | | | 345,200 | | | Other employees | | | | 161,675 | | | n/a | | | 98,300 | |
| | | Total | | | | 338,625 | | | 15,000 | | | 624,500 | |
| Estimated weighted average fair value of
options per share at date of grant (exercise
price equaled market price on date of grant)
Officers | | | | n/a | | $ | 7.93 | | $ | 9.14 | | | Management | | | $ | 5.54 | | | 6.51 | | | 8.02 | | | Other employees | | | | 4.32 | | | n/a | | | 6.20 | |
| Total estimated fair value of stock
options granted | | | $ | 1,679 | | $ | 112 | | $ | 5,033 | |
|
| The table above excludes stock options granted to a consultant in 2004. The estimated fair value related to that grant of $50 was expensed in 2004 in conjunction with services rendered. Additional disclosure of Tredegar stock options is included in Note 10.
Therics stock options granted in 2004 and assumptions used in determining related pro forma compensation expense are as followspay (there were no significant grants of Therics stock options in 2003 and 2002):
| | SARs outstanding at December 31, 2005). |
| | Assumptions Used in Determining Pro Forma Comp. Expense for Therics Stock Options Granted in 2004 & Other Data |
| | Assumptions used in Black-Scholes | | | | Other assumptions and items: | | | | | | options-pricing model: | | | | Vesting period (years) | | | 0.4 - 4 | | | Dividend yield | | 0.0% | | Therics stock options granted: | | | | | | Volatility percentage (a) | | 95% | | 3rd quarter 2004 | | | 7,906,149 | | | Weighted average risk-free interest rate | | 4.1% | | 1st quarter 2004 | | | 30,809,000 | | | Holding period (years) | | 7.0 | | Aggregate estimated fair value of
options at date of grant: | | | | | Weighted average estimated fair value per share
of underlying stock at date of grant (b) | | $ .090 | | 3rd quarter 2004 | | $ | 584 | | Weighted average estimated fair value of
options per share at date of grant | | $ .074 | | 1st quarter 2004 | | $ | 2,271 | | | | | | | Therics voting stock issued and outstanding
at 12/31/04 (all held by Tredegar) | | | 202,829,760 | | | | | | | Therics stock options outstanding at 12/31/04
(all held by Therics employees) | | | 40,498,133 | |
|
Had compensation cost for stock option grants been determined in 2005 and 2004 based on the fair value at the grant dates, our income and diluted earnings per share from continuing operations would have been reduced to the pro forma amounts indicated below: | | | | | | | | | | 2005 | | 2004 | | | Income from continuing operations: | | | | | | | As reported | | $ | 16,229 | | $ | 26,260 | | | Pro forma for stock option-based employee compensation cost, net of tax, based on the fair value method | | | (1,073 | ) | | (2,133 | ) | | Pro forma income from continuing operations | | $ | 15,156 | | $ | 24,127 | | | Basic earnings per share from continuing operations: | | | | | | | | | As reported | | $ | .42 | | $ | .69 | | | Pro forma | | | .39 | | | .63 | | | Diluted earnings per share from continuing operations: | | | | | | | | | As reported | | $ | .42 | | $ | .68 | | | Pro forma | | | .39 | | | .63 | |
Stock option-based compensation expense included in determining net income in 2006 under SFAS 123(R) was $970 ($676 after taxes or 2 cents per share). Compensation cost related to restricted and phantom stock awards included in determining net income from continuing operations was $188 in 2006, $386 in 2005 and $272 in 2004.
The fair value of each option was estimated as of the grant date using the Black-Scholes options-pricing model. The assumptions used in this model for valuing Tredegar stock options granted in 2006 and 2004 are as follows (there were no Tredegar stock options granted in 2005): | | | | | | | | | | 2006 | | 2004 | | | Dividend yield | | | 1.1 | % | | 1.2 | % | | Weighted average volatility percentage | | | 38.3 | % | | 45.0 | % | | Weighted average risk-free interest rate | | | 4.7 | % | | 3.1 | % | | Holding period (years): | | | | | | | | | Officers | | | 6.0 | | | n/a | | | Management | | | 5.0 | | | 5.0 | | | Other employees | | | n/a | | | 3.0 | | | Weighted average excercise price at date of grant (also weighted average market price at date of grant): | | | | | | | | | Officers | | $ | 15.22 | | | n/a | | | Management | | | 15.32 | | $ | 13.97 | | | Other employees | | | n/a | | | 13.95 | |
The dividend yield is the dividend yield on our common stock at the date of grant, which we believe is a reasonable estimate of the expected yield during the holding period. We calculate expected volatility based on the historical volatility of our common stock using a sequential period of historical data equal to the expected holding period of the option. We have no reason to believe that future volatility is likely to differ from the past. The assumed risk-free interest rate is based on observed interest rates (zero coupon U.S. Treasury debt securities) appropriate for the expected holding period. The expected holding period and forfeiture assumptions are based on historical experience. Estimated forfeiture assumptions are reviewed through the vesting period. Adjustments are made if actual forfeitures differ from previous estimates. The cumulative effect of a change in estimated forfeitures is recognized in the period of the change.
Tredegar stock options granted during 2006 and 2004 (there were no Tredegar stock options granted in 2005), and related estimated fair value at the date of grant, are as follows: | | | | | | | | | | 2006 | | 2004 | | | Stock options granted (number of shares): | | | | | Officers | | | 107,500 | | | n/a | | | Management | | | 342,300 | | | 176,950 | | | Other employees | | | n/a | | | 161,675 | | | Total | | | 449,800 | | | 338,625 | | | Estimated weighted average fair value of options per share at date of grant: | | | | | | | | | Officers | | $ | 6.26 | | | n/a | | | Management | | | 5.69 | | $ | 5.54 | | | Other employees | | | n/a | | | 4.32 | | Total estimated fair value of stock options granted (in thousands) | | $ | | | $ | | |
The table above excludes stock options granted to a consultant in 2004. The estimated fair value related to that grant of $50 was expensed in 2004 in conjunction with services rendered. Additional disclosure of Tredegar stock options is included in Note 10.
AFBS, Inc. (formerly known as Therics, Inc. - see Note 15 for additional information regarding its restructuring in 2005) stock options granted in 2004 and assumptions used in determining related pro forma compensation expense are as follows (there were no significant grants of AFBS stock options after 2004):
| | | Assumptions Used in Determining Pro Forma Comp. Expense for AFBS Stock Options Granted in 2004 & Other Data | | Assumptions used in Black-Scholes | | | Other assumptions and items: | | | options-pricing model: | | | Vesting period (years) | 0.4 - 4 | | Dividend yield | 0.0% | | AFBS stock options granted: | | | Volatility percentage (a) | 95% | | 3rd quarter 2004 | 7,906,149 | | Weighted average risk-free interest rate | 4.1% | | 1st quarter 2004 | 30,809,000 | | Holding period (years) | 7.0 | | Aggregate estimated fair value of options | | | Weighted average estimated fair value per share | | | at date of grant: | | | of underlying stock at date of grant (b) | $ .090 | | 3rd quarter 2004 | $ 584 | | Weighted average estimated fair value of | | | 1st quarter 2004 | $ 2,271 | | options per share at date of grant | $ .074 | | | | | (a) Volatility estimated for AFBS based on Orthovita, Inc. (NASDAQ: VITA), a comparable company. | | (b) Estimated fair value of underlying stock equaled the stock option exercise price at date of grant. |
Financial Instruments. We use derivative financial instruments for the purpose of hedging aluminum price volatility and interest rate and currency exchange rate exposures that exist as part of ongoing business operations. Our derivative financial instruments are designated as and qualify as cash flow hedges and are recognized in the balance sheet at fair value. A change in the fair value of the derivative that is highly effective as and that is designated and qualifies as a cash flow hedge is recorded in other comprehensive income. Gains and losses reported in other comprehensive income are reclassified to earnings in the periods in which earnings are affected by the variability of cash flows of the hedged transaction. Such gains and losses are reported on the same line as the underlying hedged item. Any hedge ineffectiveness (which represents the amount by which the changes in the fair value of the derivative exceed the variability in the cash flows of the forecasted transaction) is recorded in current period earnings. The amount of gains and losses recognized for hedge ineffectiveness was immaterial in 2006, 2005 and 2004.
Our policy requires that we formally document all relationships between hedging instruments and hedged items, as well as our risk management objective and strategy for undertaking various hedge transactions. We also formally assess (both at the hedge’s inception and on an ongoing basis) whether the derivatives that are used in hedging transactions have been highly effective in offsetting changes in the fair value or cash flows of hedged items and whether those derivatives may be expected to remain highly effective in future periods. When it is determined that a derivative is not (or has ceased to be) highly effective as a hedge, we discontinue hedge accounting prospectively.
As a policy, we do not engage in speculative or leveraged transactions, nor do we hold or issue financial instruments for trading purposes.
The cash flows related to financial instruments are classified in the statements of cash flows in a manner consistent with those of the transactions being hedged.
Comprehensive Income. Comprehensive income, which is included in the consolidated statement of shareholders’ equity, is defined as net income and other comprehensive income. Other comprehensive income includes changes in unrealized gains and losses on available-for-sale securities, foreign currency translation adjustments, unrealized gains and losses on derivative financial instruments and minimum pension liability adjustments, all recorded net of deferred income taxes directly in shareholders’ equity. The available-for-sale securities adjustment included in the consolidated statement of shareholders’ equity is comprised of the following components: | | | | | | | | | | | | 2006 | | 2005 | | 2004 | | | Available-for-sale securities adjustment: | | | | | | | | | Unrealized net holding gains (losses) arising during the period | | $ | 20 | | $ | 36 | | $ | 1,872 | | | Income taxes | | | (7 | ) | | (13 | ) | | (655 | ) | | Reclassification adjustment for net losses (gains) realized in income | | | (56 | ) | | - | | | (6,134 | ) | | Income taxes | | | 20 | | | - | | | 2,147 | | | Available-for-sale securities adjustment | | $ | (23 | ) | $ | 23 | | $ | (2,770 | ) |
Recently Issued Accounting Standards. In September 2006, the FASB issued FASB Staff Position ("FSP") No. AUG AIR-1, Accounting for Planned Major Maintenance Activities. The FSP is effective for the first fiscal year beginning after December 15, 2006. The FSP eliminates the accrual method of accounting for major maintenance activities, but continues to permit the use of the direct expensing, built-in overhaul and deferral methods. The FSP also continues to require accruals or deferrals for interim periods of annual costs that clearly benefit two or more interim periods. We are evaluating the FSP and have not determined whether or not it will have a material effect on our financial position or results of operations.
In July 2006, the FASB issued FASB Interpretation No. 48, Accounting for Uncertainty in Income Taxes, clarifying the accounting for uncertain tax positions. The interpretation prescribes a recognition threshold and measurement attribute for the financial statement recognition and measurement of a tax position taken or expected to be taken in a tax return. This interpretation is effective for fiscal years beginning after December 15, 2006 with earlier application encouraged. We are evaluating the interpretation and have not determined if it will have a material effect on our financial position or results of operations.
(a)2 | Volatility estimated for Therics based on Orthovita, Inc. (NASDAQ: VITA), a comparable company. | | | (b) | Estimated fair value of underlying stock equaled the stock option exercise price at date of grant. |
Financial Instruments. We use derivative financial instruments for the purpose of hedging aluminum price volatility and interest rate exposures that exist as part of ongoing business operations. Our derivative financial instruments are designated as and qualify as cash flow hedges and are recognized in the balance sheet at fair value. A change in the fair value of the derivative that is highly effective as and that is designated and qualifies as a cash flow hedge is recorded in other comprehensive income. Gains and losses reported in other comprehensive income are reclassified to earnings in the periods in which earnings are affected by the variability of cash flows of the hedged transaction. Such gains and losses are reported on the same line as the underlying hedged item. Any hedge ineffectiveness (which represents the amount by which the changes in the fair value of the derivative exceed the variability in the cash flows of the forecasted transaction) is recorded in current period earnings. There was no hedge ineffectiveness recognized in earnings. Our policy requires that we formally document all relationships between hedging instruments and hedged items, as well as our risk management objective and strategy for undertaking various hedge transactions. We also formally assess (both at the hedge’s inception and on an ongoing basis) whether the derivatives that are used in hedging transactions have been highly effective in offsetting changes in the fair value or cash flows of hedged items and whether those derivatives may be expected to remain highly effective in future periods. When it is determined that a derivative is not (or has ceased to be) highly effective as a hedge, we discontinue hedge accounting prospectively.
As a policy, we do not engage in speculative or leveraged transactions, nor do we hold or issue financial instruments for trading purposes.
The cash flows related to financial instruments are classified in the statements of cash flows in a manner consistent with those of the transactions being hedged.
Comprehensive Income. Comprehensive income, which is included in the consolidated statement of shareholders’ equity, is defined as net income and other comprehensive income. Other comprehensive income includes changes in unrealized gains and losses on available-for-sale securities, foreign currency translation adjustments, unrealized gains and losses on derivative financial instruments and minimum pension liability adjustments, all recorded net of deferred income taxes directly in shareholders’ equity.
The available-for-sale securities adjustment included in the consolidated statement of shareholders’ equity is comprised of the following components:
| |
| | | 2004 | | 2003 | | 2002 | |
|---|
| | Available-for-sale securities adjustment: | | | | | | | | | | Unrealized net holding gains (losses)
arising during the period | $ | 1,872 | | $ | 7,294 | | $ | (9,419 | ) | | Income taxes | | (655 | ) | | (2,626 | ) | | 3,391 | | Reclassification adjustment for net
losses (gains) realized in income | | (6,134 | ) | | (3,851 | ) | | (2,656 | ) | | Income taxes | | 2,147 | | | 1,367 | | | 956 | |
| | Available-for-sale securities adjustment | $ | (2,770 | ) | $ | 2,184 | | $ | (7,728 | ) |
|
| Recently Issued Accounting Standards. In December 2004, the Financial Accounting Standards Board (“FASB”) revised Statement of Financial Accounting Standards (“SFAS”) No. 123, Share-Based Payment. This statement requires that the cost of employee services received in exchange for equity instruments be measured based on the fair value of the award on the grant date. The statement also requires that the cost be recognized over the employee service period required to receive the award. The statement applies to awards granted after the effective date and to awards modified, repurchased or cancelled after that date. The statement is effective as of the beginning of the first interim or annual reporting period that begins after June 15, 2005. Early adoption is permitted. The adoption of this standard will have no impact on cash flow. The primary impact of adoption on Tredegar will be the recognition of compensation expense for stock options granted. Currently, we disclose the pro forma effects of treating stock option grants as compensation expense under the fair value-based method (see the relevant section above). We expect to continue to use the Black-Scholes options-pricing model to determine the estimated fair value of option grants but are still evaluating our transition method. We believe that the pro forma effects that have been disclosed are not materially different from compensation expense that would have been recognized if this standard had been previously adopted.
|
In November 2004, the FASB issued SFAS No. 151,Inventory Costs – An Amendment of ARB No. 43, Chapter 4. This statement clarifies that abnormal amounts of idle facility expense, freight, handling costs and wasted material (spoilage) should be expensed as current-period charges. In addition, this statement requires that allocation of fixed production overheads to the costs of conversion be based on the normal capacity of the production facilities. The statement is effective for inventory costs incurred during the fiscal years beginning after June 15, 2005. Early adoption is permitted. The adoption of this standard will have no impact on cash flow, and we do not expect it to have a significant impact on amounts reported in the consolidated statement of income and balance sheet.
In October 2004, the American Jobs Creation Act of 2004 (“AJCA”) was signed into law. In December 2004, the FASB issued Staff Position No. 109-1 (“FSP 109-1”),Application of FASB Statement No. 109, Accounting for Income Taxes, to the Tax Deduction on Qualified Production Activities Provided by the American Jobs Creation Act of 2004 and Staff Position No. 109-2 (“FSP 109-2”),Accounting and Disclosure Guidance for the Foreign Earnings Repatriation Provision within the American Jobs Creation Act of 2004. FSP 109-1 clarifies that the manufacturer’s tax deduction provided for under the AJCA should be accounted for as a special deduction in accordance with SFAS No. 109 and not as a tax rate reduction. FSP 109-2 provides accounting and disclosure guidance for the repatriation of certain foreign earnings to a U.S. taxpayer as provided for in the AJCA. We do not expect that the tax benefits resulting from the AJCA will have a material impact on our financial statements.
2 ACQUISITIONS AND INVESTMENTS
|
| | On July 23, 2004, a subsidiary of Tredegar purchased the assets of Yaheng Perforated Film Material Co., Ltd. (“Yaheng”) for approximately $1,420. Yaheng, based in Shanghai, China, has 21 employees and manufactures apertured nonwovens used primarily in personal care markets. The purchase price was allocated to accounts receivable ($26), inventories ($45), property, plant and equipment ($288), patents ($822), employment agreements ($150), goodwill ($215), deferred income tax liabilities ($56) and accrued expenses ($70). Property, plant and equipment is being depreciated on a straight-line basis over approximately 10 years, patents are being amortized on a straight-line basis over approximately 7 years, and employment agreements are being amortized on a straight-line basis over approximately 3 years. |
| On November 21, 2003, Tredegar announced that its aluminum extrusions subsidiary, the William L. Bonnell Company, had acquired Apolo Tool and Die Manufacturing Inc. (“Apolo”) of Woodbridge, Ontario. The purchase price consisted of cash consideration of $1,579 (including transaction costs of $110 and net cash acquired of $343). Apolo’s key capabilities include bending, CNC machining, drilling, mitering, punching, riveting, sawing and welding of aluminum extrusions and other materials. The company also has in-house tool and die design and manufacturing capability to support its fabrication services. There was no goodwill (the excess of the purchase price over the estimated fair value of identifiable net assets acquired) associated with the Apolo acquisition. | | | The operating results for the acquired businesses have been included in the consolidated statements of income since the date acquired. Pro forma results for these acquisitions are immaterial. |
| In August of 2004, we invested $5,000 in Novalux, Inc., representing an ownership interest of approximately 18% (15% on a fully diluted basis). Novalux, based in Sunnyvale, California, is developing and commercializing a laser technology for use in a variety of applications, including flat panel displays for home theaters. We are already participating in the growing flat panel display market with our surface protection films. The investment in Novalux, which is included in “Other assets and deferred charges” in the consolidated balance sheet, is being accounted for under the cost method, with an impairment loss recognized and a new cost basis established for any write-down to estimated fair value.
|
On July 23, 2004, a subsidiary of Tredegar purchased the assets of Yaheng Perforated Film Material Co., Ltd. ("Yaheng") for approximately $1,420. Yaheng, based in Shanghai, China, had 21 employees at the acquisition date and manufactures apertured nonwovens used primarily in personal care markets. The purchase price was allocated to accounts receivable ($26), inventories ($45), property, plant and equipment ($288), patents ($822), employment agreements ($150), goodwill ($215), deferred income tax liabilities ($56) and accrued expenses ($70). Property, plant and equipment is being depreciated on a straight-line basis over approximately 10 years, patents are being amortized on a straight-line basis over approximately 7 years, and employment agreements are being amortized on a straight-line basis over approximately 3 years. The operating results for Yaheng have been included in the consolidated statements of income since the date acquired. Pro forma results for the acquisition are immaterial. In August of 2004, we invested $5,000 in Novalux, Inc., a developer of laser technology for potential use in a variety of applications. In October 2005, we invested an additional $1,095 in a new convertible secured bridge financing for Novalux bringing our aggregate investment to $6,095 at December 31, 2005. As of December 31, 2005, the investment in Novalux was written down to estimated fair value of $1,095. The reduction in estimated fair value at the end of 2005 was due to longer than anticipated delays both in bringing the company’s technology to market and in obtaining key development partnerships as well as liquidity issues. The loss from the write-down in 2005 is included in “Other income (expense), net” in the consolidated statements of income and separately shown in the operating profit by segment table in Note 3. Subsequent to the first quarter of 2006, Novalux prospects improved and we invested an aggregate of $542 in May and September of 2006. As of December 31, 2006, our investment in Novalux was $6,637. Our carrying value in Novalux of $1,637 and $1,095 at December 31, 2006 and 2005, respectively, is included in “Other assets and deferred charges” in the consolidated balance sheet. Our voting ownership of Novalux as of December 31, 2006 is approximately 12% (11% on a fully diluted basis).
Information by business segment and geographic area for the last three years is provided below. There are no accounting transactions between segments and no allocations to segments. Net sales (sales less freight) and operating profit from ongoing operations are the measures of sales and operating profit used by the chief operating decision maker for purposes of assessing performance. Film Products’ net sales to The Procter & Gamble Company (“P&G”) totaled $255,414 in 2006, $236,554 in 2005 and $226,122 in 2004. These amounts include plastic film sold to others that convert the film into materials used with products manufactured by P&G. | | | | | | | | | | | | Net Sales | | | | | 2006 | | 2005 | | 2004 | | | Film Products | | $ | 511,169 | | $ | 460,277 | | $ | 413,257 | | | Aluminum Extrusions | | | 577,260 | | | 471,749 | | | 425,130 | | | AFBS (formerly Therics) | | | - | | | 252 | | | 380 | | | Total net sales | | | 1,088,429 | | | 932,278 | | | 838,767 | | | Add back freight | | | 28,096 | | | 24,691 | | | 22,398 | | | Sales as shown in consolidated statements of income | | $ | 1,116,525 | | $ | 956,969 | | $ | 861,165 | | | | | | | | | | | | | | | | | | | | | | | | 2006 | | | 2005 | | | 2004 | | | Film Products: | | | | | | | | | | | | Ongoing operations | | $ | 57,645 | | $ | 44,946 | | $ | 43,259 | | | Plant shutdowns, asset impairments and restructurings, net of gains on the sale of assets (a) | | | 221 | | | (3,955 | ) | | (10,438 | ) | | Aluminum Extrusions: | | | | | | | | | | | | Ongoing operations | | | 22,031 | | | 19,302 | | | 22,637 | | | Plant shutdowns, asset impairments and restructurings, net of gains on the sale of assets (a) | | | (1,434 | ) | | 122 | | | (10,553 | ) | | Other (a) | | | - | | | - | | | 7,316 | | | AFBS (formerly Therics): | | | | | | | | | | | | Ongoing operations | | | - | | | (3,467 | ) | | (9,763 | ) | | Loss on investment in Therics, LLC | | | (25 | ) | | (145 | ) | | - | | | Restructurings (a) | | | (637 | ) | | (10,318 | ) | | (2,041 | ) | | Total | | | 77,801 | | | 46,485 | | | 40,417 | | | Interest income | | | 1,240 | | | 586 | | | 350 | | | Interest expense | | | 5,520 | | | 4,573 | | | 3,171 | | | Gain on sale of corporate assets (a) | | | 56 | | | 61 | | | 7,560 | | | Loss from write-down of investment in Novalux (a) | | | - | | | 5,000 | | | - | | | Stock option-based compensation expense | | | 970 | | | - | | | - | | | Corporate expenses, net (a) | | | 13,770 | | | 11,357 | | | 9,674 | | | Income from continuing operations before income taxes | | | 58,837 | | | 26,202 | | | 35,482 | | | Income taxes (a) | | | 20,636 | | | 9,973 | | | 9,222 | | | Income from continuing operations | | | 38,201 | | | 16,229 | | | 26,260 | | | Income from discontinued operations (a) | | | - | | | - | | | 2,921 | | | Net income | | $ | 38,201 | | $ | 16,229 | | $ | 29,181 | |
Information by business segment and geographic area for the last three years is provided below. There are no accounting transactions between segments and no allocations to segments. Net sales (sales less freight) and operating profit from ongoing operations are the measures of sales and operating profit used by the chief operating decision maker of each segment for purposes of assessing performance. Film Products’ net sales to The Procter & Gamble Company (“P&G”) totaled $226,122 in 2004, $207,049 in 2003 and $242,760 in 2002. These amounts include plastic film sold to others that convert the film into materials used in products manufactured by P&G.
| |
| | | Net Sales | |
|---|
| | | 2004 | | | 2003 | | | 2002 | |
| | Film Products | $ | 413,257 | | $ | 365,501 | | $ | 376,904 | | | Aluminum Extrusions | | 425,130 | | | 354,593 | | | 360,293 | | | Therics | | 380 | | | — | | | 208 | |
| | Total net sales | | 838,767 | | | 720,094 | | | 737,405 | | | Add back freight | | 22,398 | | | 18,557 | | | 16,319 | |
| Sales as shown in consolidated
statements of income | $ | 861,165 | | $ | 738,651 | | $ | 753,724 | |
|
| | | Operating Profit | |
|---|
| | | 2004 | | | 2003 | | | 2002 | |
| | Film Products: | | | | | | | | | | | Ongoing operations | $ | 43,259 | | $ | 45,676 | | $ | 72,307 | | Plant shutdowns,
asset impairments and
restructurings (a) | | (10,438 | ) | | (5,746 | ) | | (3,397 | ) | | Unusual items (a) | | — | | | — | | | 6,147 | |
| | Aluminum Extrusions: | | | | | | | | | | | Ongoing operations | | 22,637 | | | 15,117 | | | 27,304 | | Plant shutdowns,
asset impairments and
restructurings (a) | | (10,553 | ) | | (644 | ) | | (487 | ) | | Gain on sale of land (a) | | — | | | 1,385 | | | — | | | Other (a) | | 7,316 | | | — | | | — | |
| | Therics: | | Ongoing operations | | (9,763 | ) | | (11,651 | ) | | (13,116 | ) | | Restructurings (a) | | (2,041 | ) | | (3,855 | ) | | — | | | Unusual items (a) | | — | | | (1,067 | ) | | — | |
| | Total | | 40,417 | | | 39,215 | | | 88,758 | | | Interest income | | 350 | | | 1,183 | | | 1,934 | | | Interest expense | | 3,171 | | | 6,785 | | | 9,352 | | | Gain on sale of corporate assets (a) | | 7,560 | | | 5,155 | | | — | | | Corporate expenses, net (a) | | 9,674 | | | 8,724 | | | 5,834 | |
| Income from operations continuing operations
before income taxes | | 35,482 | | | 30,044 | | | 75,506 | | | Income taxes (a) | | 9,222 | | | 10,717 | | | 26,881 | |
| | Income from continuing operations | | 26,260 | | | 19,327 | | | 48,625 | | | Income (loss) from discontinued operations (a) | | 2,921 | | | (45,678 | ) | | (51,156 | ) |
| | Net income (loss) | $ | 29,181 | | $ | (26,351 | ) | $ | (2,531 | ) |
|
| | | (a) | See NoteNotes 2 and 15 for more information on losses associated with plant shutdowns, asset impairments and restructurings, unusual items, gains from sale of assets, investment write-down and other items, and Note 17 for more information on discontinued operations. | | |
| (b) | The difference between total consolidated sales as reported in the consolidated statements of income and segment and geographic net sales reported in this note is freight of $28,096 in 2006, $24,691 in 2005, and $22,398 in 2004, $18,557 in 2003 and $16,319 in 2002.2004. | | |
| (c) | Information on exports and foreign operations are provided on the next page. Cash and cash equivalents includes funds held in foreign locations of $21,410, $16,188$19,118, $14,890 and $16,550$21,410 at December 31, 2004, 2003,2006, 2005, and 2002,2004, respectively. Export sales relate almost entirely to Film Products. Foreign operations in The Netherlands, Hungary, China, Italy, Brazil and Argentina (operations in Argentina were sold in the third quarter of 2004) also relate to Film Products. Sales from our locations in The Netherlands, Hungary and Italy are primarily to customers located in Europe. Sales from our locations in China (Guangzhou and Shanghai) are primarily to customers located in China, but also include other customers in Asia. Foreign operations in Canada relate to Aluminum Extrusions. Sales from our locations in Canada are primarily to customers located in the U.S. and Canada. Certain previously reported amounts have been reclassified to conform to the current presentation. |
| | | | | | | | | | | | Identifiable Assets | | | December 31 | | 2006 | | 2005 | | 2004 | | | Film Products | | $ | 498,961 | | $ | 479,286 | | $ | 472,810 | | | Aluminum Extrusions | | | 209,395 | | | 214,374 | | | 210,894 | | | AFBS (formerly Therics) | | | 2,420 | | | 2,759 | | | 8,613 | | | Subtotal | | | 710,776 | | | 696,419 | | | 692,317 | | | General corporate | | | 30,113 | | | 61,905 | | | 54,163 | | | Cash and cash equivalents (c) | | | 40,898 | | | 23,434 | | | 22,994 | | | Total | | $ | 781,787 | | $ | 781,758 | | $ | 769,474 | |
| | | |
|---|
| | Identifiable Assets | | | | |
|---|
| December 31 | 2004 | | 2003 | | 2002 | | | | |
|---|
| | | | | | | | | | | Film Products | | | $ | 472,810 | | $ | 422,321 | | $ | 379,635 | | | | | | | | | | | | Aluminum Extrusions | | | | 210,894 | | | 185,336 | | | 176,631 | | | | | | | | | | | | Therics | | | | 8,613 | | | 8,917 | | | 10,643 | | | | | | | | | | |
| | | | | | | | | | | Subtotal | | | | 692,317 | | | 616,574 | | | 566,909 | | | | | | | | | | | | General corporate | | | | 54,163 | | | 61,508 | | | 52,412 | | | | | | | | | | | Income taxes recoverable
from sale of venture
capital investment portfolio | | | | — | | | 55,000 | | | — | | | | | | | | | | | | Cash and cash equivalents (c) | | | | 22,994 | | | 19,943 | | | 109,928 | | | | | | | | | | |
| | | | | | | | | | | Continuing operations | | | | 769,474 | | | 753,025 | | | 729,249 | | | | | | | | | | | | Discontinued operations: | | | | | | | | | | | | | | | | | | | | | | Venture capital | | | | — | | | — | | | 108,713 | | | | | | | | | | | | Molecumetics | | | | — | | | — | | | — | | | | | | | | | | |
| | | | | | | | | | | Total | | | $ | 769,474 | | $ | 753,025 | | $ | 837,962 | | | | | | | | | | |
| | | | | | | | | |
| | | Depreciation and Amortization | | Capital Expenditures | |
|---|
| | 2004 | | 2003 | | 2002 | | 2004 | | 2003 | | 2002 | |
|---|
| | Film Products | | | $ | 21,967 | | $ | 19,828 | | $ | 20,085 | | $ | 44,797 | | $ | 57,203 | | $ | 24,063 | | | Aluminum Extrusions | | | | 10,914 | | | 10,883 | | | 10,506 | | | 10,007 | | | 8,293 | | | 4,799 | | | Therics | | | | 1,300 | | | 1,641 | | | 463 | | | 275 | | | 219 | | | 1,621 | |
| | Subtotal | | | | 34,181 | | | 32,352 | | | 31,054 | | | 55,079 | | | 65,715 | | | 30,483 | | | General corporate | | | | 241 | | | 270 | | | 353 | | | 572 | | | 93 | | | 60 | |
| | Continuing operations | | | | 34,422 | | | 32,622 | | | 31,407 | | | 55,651 | | | 65,808 | | | 30,543 | | | Discontinued operations: | | | | Venture capital | | | | — | | | — | | | — | | | — | | | — | | | — | | | Molecumetics | | | | — | | | — | | | 527 | | | — | | | — | | | 793 | |
| | Total | | | $ | 34,422 | | $ | 32,622 | | $ | 31,934 | | $ | 55,651 | | $ | 65,808 | | $ | 31,336 | |
|
| | | |
|---|
| | Net Sales by Geographic Area (c) | | | | |
|---|
| | 2004 | | 2003 | | 2002 | | | | |
|---|
| | | | | | | | | | | United States | | | $ | 441,891 | | $ | 383,204 | | $ | 416,189 | | | | | | | | | | | | Exports from the United States to: | | | | Canada | | | | 27,663 | | | 25,188 | | | 24,026 | | | | | | | | | | | | Latin America | | | | 16,668 | | | 17,915 | | | 20,711 | | | | | | | | | | | | Europe | | | | 15,768 | | | 25,157 | | | 22,720 | | | | | | | | | | | | Asia | | | | 31,617 | | | 21,510 | | | 27,480 | | | | | | | | | | | | Foreign operations: | | | | | | | | | | | | | | | | | | | | | | Canada | | | | 147,145 | | | 125,347 | | | 130,356 | | | | | | | | | | | | The Netherlands | | | | 66,856 | | | 43,954 | | | 28,720 | | | | | | | | | | | | Hungary | | | | 34,721 | | | 32,204 | | | 31,156 | | | | | | | | | | | | China | | | | 25,291 | | | 17,426 | | | 14,202 | | | | | | | | | | | | Italy | | | | 12,423 | | | 12,698 | | | 9,402 | | | | | | | | | | | | Brazil and Argentina | | | | 18,724 | | | 15,491 | | | 12,443 | | | | | | | | | | |
| | | | | | | | | | | Total (b) | | | $ | 838,767 | | $ | 720,094 | | $ | 737,405 | | | | | | | | | | |
| | | | | | | | | |
| | | Identifiable Assets
by Geographic Area (c) | | Property, Plant & Equipment,
Net by Geographic Area (c) | |
|---|
| December 31 | 2004 | | 2003 | | 2002 | | 2004 | | 2003 | | 2002 | |
|---|
| | United States | | | $ | 427,240 | | $ | 394,415 | | $ | 515,542 | | $ | 163,383 | | $ | 159,127 | | $ | 158,979 | | | Foreign operations: | | | | Canada | | | | 92,290 | | | 86,564 | | | 78,544 | | | 38,610 | | | 44,179 | | | 38,383 | | | The Netherlands | | | | 75,449 | | | 47,809 | | | 15,843 | | | 58,370 | | | 38,956 | | | 10,036 | | | Hungary | | | | 27,308 | | | 26,815 | | | 27,022 | | | 19,371 | | | 20,449 | | | 21,596 | | | China | | | | 38,713 | | | 29,233 | | | 15,565 | | | 25,684 | | | 22,577 | | | 10,597 | | | Italy | | | | 20,785 | | | 20,951 | | | 14,486 | | | 3,991 | | | 3,826 | | | 2,351 | | | Brazil and Argentina | | | | 10,532 | | | 10,787 | | | 8,620 | | | 5,037 | | | 5,295 | | | 4,751 | | | General corporate | | | | 54,163 | | | 61,508 | | | 52,412 | | | 2,246 | | | 3,067 | | | 3,910 | | Income taxes recoverable
from sale of venture
capital investment portfolio | | | | — | | | 55,000 | | | — | | | n/a | | | n/a | | | n/a | | | Cash and cash equivalents (c) | | | | 22,994 | | | 19,943 | | | 109,928 | | | n/a | | | n/a | | | n/a | |
| | Total | | | $ | 769,474 | | $ | 753,025 | | $ | 837,962 | | $ | 316,692 | | $ | 297,476 | | $ | 250,603 | |
|
| See footnotes on prior page and a reconciliation of net sales to sales as shown in the consolidated statements of income. |
| | | | | | | | | Depreciation and Amortization | Capital Expenditures | | | | | 2006 | | 2005 | | 2004 | | 2006 | | 2005 | | 2004 | | | Film Products | | $ | 31,847 | | $ | 26,673 | | $ | 21,967 | | $ | 33,168 | | $ | 50,466 | | $ | 44,797 | | | Aluminum Extrusions | | | 12,323 | | | 11,484 | | | 10,914 | | | 7,381 | | | 11,968 | | | 10,007 | | | AFBS (formerly Therics) | | | - | | | 437 | | | 1,300 | | | - | | | 36 | | | 275 | | | Subtotal | | | 44,170 | | | 38,594 | | | 34,181 | | | 40,549 | | | 62,470 | | | 55,079 | | | General corporate | | | 111 | | | 195 | | | 241 | | | 24 | | | 73 | | | 572 | | | Total | | $ | 44,281 | | $ | 38,789 | | $ | 34,422 | | $ | 40,573 | | $ | 62,543 | | $ | 55,651 | |
| | | | | | | Net Sales by Geographic Area (c) | | | | | 2006 | | 2005 | | 2004 | | | United States | | $ | 606,410 | | $ | 495,900 | | $ | 441,891 | | | Exports from the United States to: | | | | | | | | | | | | Canada | | | 42,669 | | | 44,870 | | | 27,663 | | | Latin America | | | 4,364 | | | 9,428 | | | 16,668 | | | Europe | | | 8,944 | | | 8,311 | | | 15,768 | | | Asia | | | 50,096 | | | 40,476 | | | 31,617 | | | Foreign operations: | | | | | | | | | | | | Canada | | | 173,471 | | | 144,090 | | | 147,145 | | | The Netherlands | | | 91,476 | | | 83,649 | | | 66,856 | | | Hungary | | | 29,152 | | | 33,573 | | | 34,721 | | | China | | | 42,460 | | | 36,823 | | | 25,291 | | | Italy | | | 14,323 | | | 15,866 | | | 12,423 | | | Brazil and Argentina (2004) | | | 25,064 | | | 19,292 | | | 18,724 | | | Total (b) | | $ | 1,088,429 | | $ | 932,278 | | $ | 838,767 | |
| | | | | | | | | Identifiable Assetsby Geographic Area (c) | | Property, Plant & Equipment,Net by Geographic Area (c) | | | December 31 | | 2006 | | 2005 | | 2004 | | 2006 | | 2005 | | 2004 | | | United States | | $ | 446,005 | | $ | 444,144 | | $ | 427,240 | | $ | 176,160 | | $ | 178,154 | | $ | 163,383 | | | Foreign operations: | | | | | | | | | | | | | | | | | | | | | Canada | | | 89,354 | | | 92,328 | | | 92,290 | | | 38,151 | | | 41,208 | | | 38,610 | | | The Netherlands | | | 70,609 | | | 67,683 | | | 75,449 | | | 53,905 | | | 54,331 | | | 58,370 | | | Hungary | | | 20,039 | | | 18,505 | | | 27,308 | | | 12,475 | | | 12,787 | | | 19,371 | | | China | | | 53,633 | | | 40,599 | | | 38,713 | | | 34,671 | | | 26,104 | | | 25,684 | | | Italy | | | 16,734 | | | 17,997 | | | 20,785 | | | 3,565 | | | 3,093 | | | 3,991 | | | Brazil | | | 14,402 | | | 15,163 | | | 10,532 | | | 4,892 | | | 5,205 | | | 5,037 | | | General corporate | | | 30,113 | | | 61,905 | | | 54,163 | | | 1,944 | | | 1,994 | | | 2,246 | | | Cash and cash equivalents (c) | | | 40,898 | | | 23,434 | | | 22,994 | | | n/a | | | n/a | | | n/a | | | Total | | $ | 781,787 | | $ | 781,758 | | $ | 769,474 | | $ | 325,763 | | $ | 322,876 | | $ | 316,692 | | | | | | | | | | | | | | | | | | | | | | | | See footnotes on prior page and a reconciliation of net sales to sales as shown in the consolidated statements of income. |
| 4 | ACCOUNTS AND NOTES RECEIVABLE |
| |
Accounts and notes receivable consist of the following: | |
| | December 31 | 2004 | | 2003 | |
|---|
| | | | | | | | | | | Trade, less allowance for doubtful
accounts and sales returns of $5,313
in 2004 and $4,448 in 2003 | | | $ | 109,347 | | $ | 79,409 | | | Other | | | | 7,967 | | | 4,701 | |
| | Total | | | $ | 117,314 | | $ | 84,110 | |
|
| 5 INVENTORIES
|
| | Inventories consist of the following: | |
| | December 31 | 2004 | | 2003 | |
|---|
| | Finished goods | | | $ | 13,452 | | $ | 9,190 | | | Work-in-process | | | | 3,097 | | | 3,294 | | | Raw materials | | | | 36,567 | | | 25,730 | | | Stores, supplies and other | | | | 12,244 | | | 11,358 | |
| | Total | | | $ | 65,360 | | $ | 49,572 | |
|
| Inventories stated on the LIFO basis amounted to $20,837 at December 31, 2004 and $18,030 at December 31, 2003, which are below replacement costs by approximately $20,867 at December 31, 2004 and $16,289 at December 31, 2003. | | 6 FINANCIAL INSTRUMENTS |
| |
In the normal course of business, we enter into fixed-price forward sales contracts with certain customers for the sale of fixed quantities of aluminum extrusions at scheduled intervals. In order to hedge our exposure to aluminum price volatility under these fixed-price arrangements, which generally have a duration of not more than 12 months, we enter into a combination of forward purchase commitments and futures contracts to acquire or hedge aluminum, based on the scheduled deliveries. The futures contracts are designated as and accounted for as cash flow hedges. These contracts involve elements of credit and market risk that are not reflected on our balance sheet, including the risk of dealing with counterparties and their ability to meet the terms of the contracts. The counterparties to our forward purchase commitments are major aluminum brokers and suppliers, and the counterparties to our futures contracts are major financial institutions. Fixed-price forward sales contracts are only made available to our best and most credit-worthy customers. The amount of aluminum futures contracts that hedged fixed-price forward sales contracts was $11,253 (14,410 pounds of aluminum) at December 31, 2004, and $8,137 (12,210 pounds of aluminum) at December 31, 2003.
We use interest rate swaps to manage interest rate exposure. There were no interest rate swaps outstanding at December 31, 2004 and 2003. Interest rate swaps outstanding during 2003 and 2002 (there were none outstanding in 2004) were designated as and accounted for as cash flow hedges (see Note 8). Counterparties to our interest rate swaps consisted of large major financial institutions.
After-tax gains of $1,230 in 2004 and $395 in 2003 and after-tax losses of $1,512 in 2002, were reclassified from other comprehensive income to earnings and were offset by losses or gains, respectively, from transactions relating to the underlying hedged item. As of December 31, 2004, we expect $884 of unrealized after-tax gains on derivative instruments reported in accumulated other comprehensive income to be reclassified to earnings within the next twelve months. We also expect that these gains will be offset by losses from transactions relating to the underlying hedged item.
|
Accounts and notes receivable consist of the following: | | | | | | | | | 2006 | | 2005 | | | | | | | | | | Trade, less allowance for doubtful accounts and sales returns of $8,559 in 2006 and $5,423 in 2005 | | $ | 116,943 | | $ | 112,968 | | | Other | | | 4,891 | | | 6,362 | | | Total | | $ | 121,834 | | $ | 119,330 | |
The allowance for doubtful accounts and sales returns increased by $3,136 in 2006, $110 in 2005 and $865 in 2004. The changes in 2006, 2005 and 2004 were comprised of increases to the allowance for charges to expense of $3,911, $612 and $956, respectively, decreases in the allowance for income from recoveries of $57, $15 and $5, respectively, decreases in the allowance for write-offs of $696, $403 and $413, respectively, and foreign exchange and other adjustments to the allowance of minus $22, minus $84 and plus $327, respectively.
7 ACCRUED EXPENSES5 |
| | Accrued expenses consist of the following: | INVENTORIES |
| | December 31 | 2004 | | 2003 | |
|---|
| Payrolls, related taxes and medical and
other benefits | | | $ | 7,946 | | $ | 12,830 | | | Workmen’s compensation and disabilities | | | | 3,806 | | | 3,566 | | | Vacation | | | | 4,560 | | | 4,435 | | | Plant shutdowns and divestitures | | | | 8,485 | | | 5,192 | | | Other | | | | 13,344 | | | 16,433 | |
| | Total | | | $ | 38,141 | | $ | 42,456 | |
|
| A reconciliation of the beginning and ending balances of accrued expenses associated with plant shutdowns and divestitures for each of the three years in the period ended December 31, 2004 is as follows: | |
|
|---|
| Severance | | Asset
Impairments | | Accelerated
Depreciation* | | Other | | Total | |
|---|
| | Balance at December 31, 2001 | $ | 538 | | $ | — | | $ | — | | $ | 4,385 | | $ | 4,923 | | | 2002: | | Charges | | 826 | | | 1,457 | | | — | | | 1,601 | | | 3,884 | | | Cash spent | | (893 | ) | | — | | | — | | | (4,952 | ) | | (5,845 | ) | | Charged against assets | | — | | | (1,457 | ) | | — | | | — | | | (1,457 | ) | | Reversed to income | | (97 | ) | | — | | | — | | | — | | | (97 | ) |
| | Balance at December 31, 2002 | | 374 | | | — | | | — | | | 1,034 | | | 1,408 | | | 2003: | | Charges | | 5,505 | | | 1,051 | | | 1,733 | | | 3,137 | | | 11,426 | | | Cash spent | | (3,773 | ) | | — | | | — | | | (1,085 | ) | | (4,858 | ) | | Charged against assets | | — | | | (1,051 | ) | | (1,733 | ) | | — | | | (2,784 | ) | | Reversed to income | | — | | | — | | | — | | | — | | | — | |
| | Balance at December 31, 2003 | | 2,106 | | | — | | | — | | | 3,086 | | | 5,192 | | | 2004: | | Charges | | 6,456 | | | 11,554 | | | 2,572 | | | 2,450 | | | 23,032 | | | Cash spent | | (3,732 | ) | | — | | | — | | | (2,112 | ) | | (5,844 | ) | | Charged against assets | | — | | | (11,554 | ) | | (2,572 | ) | | — | | | (14,126 | ) | | Foreign currency translation | | 261 | | | — | | | — | | | — | | | 261 | | | Reversed to income | | — | | | — | | | — | | | (30 | ) | | (30 | ) |
| | Balance at December 31, 2004 | $ | 5,091 | | $ | — | | $ | — | | $ | 3,394 | | $ | 8,485 | |
|
| | * | Represents depreciation accelerated due to plant shutdowns based on a remaining useful life of less than one year. |
| See Note 15 for more information on plant shutdowns, asset impairments and restructurings. |
Inventories consist of the following:
| | | | | | | | | 2006 | | 2005 | | | Finished goods | | $ | 15,412 | | $ | 12,838 | | | Work-in-process | | | 4,540 | | | 3,685 | | | Raw materials | | | 34,185 | | | 33,043 | | | Stores, supplies and other | | | 14,793 | | | 12,872 | | | Total | | $ | 68,930 | | $ | 62,438 | |
Inventories stated on the LIFO basis amounted to $17,230 at December 31, 2006 and $19,843 at December 31, 2005, which are below replacement costs by approximately $26,139 at December 31, 2006 and $29,164 at December 31, 2005. During 2006, inventories accounted for on a LIFO basis declined, which resulted in cost of goods sold being stated at below current replacement costs by approximately $5,400 ($5,300 in Film Products, including $2,900 associated with the shutdown of the films manufacturing facility in LaGrange, Georgia, and $100 in Aluminum Extrusions). During 2005, inventories accounted for on a LIFO basis declined, which resulted in cost of goods sold being stated at below current replacement costs by approximately $2,300 ($2,100 in Film Products and $200 in Aluminum Extrusions).
In the normal course of business, we enter into fixed-price forward sales contracts with certain customers for the sale of fixed quantities of aluminum extrusions at scheduled intervals. In order to hedge our exposure to aluminum price volatility under these fixed-price arrangements, which generally have a duration of not more than 12 months, we enter into a combination of forward purchase commitments and futures contracts to acquire or hedge aluminum, based on the scheduled deliveries. The futures contracts are designated as and accounted for as cash flow hedges. These contracts involve elements of credit and market risk that are not reflected on our balance sheet, including the risk of dealing with counterparties and their ability to meet the terms of the contracts. The counterparties to our forward purchase commitments are major aluminum brokers and suppliers, and the counterparties to our futures contracts are major financial institutions. Fixed-price forward sales contracts are only made available to our best and most credit-worthy customers. The notional amount of aluminum futures contracts that hedged fixed-price forward sales contracts was $15,865 (13,016 pounds of aluminum) at December 31, 2006 and $5,367 (6,393 pounds of aluminum) at December 31, 2005. Unrealized gains in excess of losses on aluminum futures contracts that hedge fixed-price forward sales contracts of $1,184 ($728 after taxes) and $1,213 ($776 after taxes) at December 31, 2006 and 2005, respectively, are included as a separate component of shareholders’ equity. The portion of aluminum futures contracts that was ineffective in hedging fixed-price forward sales contracts was immaterial in 2006, 2005 and 2004.
In the past we have used interest rate swaps with large major financial institutions to manage interest rate exposure, but there have been no interest rate swaps outstanding since 2003.
We have partially hedged our exposure to the Canadian Dollar (“CAD”) and Euro (“EUR”) as shown in the following tables (accounted for as cash flow hedges): | (In Thousands Except Exchange Rates) | | | | | | | | | | | | | | | | | | | | | | | | | Notional Amount as a % of Forecasted USD-Equiv. | | Net | | USD-Equivalent Strike Prices of Options Bought & | | Pretax Unrealized Gain (Loss) on Options at | | USD-Equiv. Average | | Cash (Paid to) Recieved from | | Gain (Loss) on Options Recognized in Income for Period | | | | | Notional | | CAD- | | Option | | Sold on CAD/USD | | 12/31/06 | | Reference | | Counter- | | Portion | | Portion | | | Description of Currency | | Amount | | Related | | Premium | | Call | | Put | | Included in | | Price of | | party at | | Deemed | | Deemed | | | Exposure, Options Hedging Strategy | | of Option | | Costs for | | (Paid) | | Options | | Options | | Shareholders' | | CAD for | | Expiration | | Effective | | Ineffective | | | Used & Periods Covered | | Contracts | | Period | | Received | | Bought | | Sold | | Equity | | Period | | of Options | | as Hedge | | as Hedge | | Exposure: About 80% of sales of extrusions manufactured in facilities in Canada are denominated or economically priced in U.S. Dollars ("USD") while conversion costs are denominated or economically priced in Canadian Dollars ("CAD"). | | | | | | | | | | | | | | | | | | | | | | Hedge Strategy: Bought average rate call options & sold average rate put options on CAD/USD. | | | | | | | | | | | | | | | | | | | | Periods Covered by Option Contracts: | | | | | | | | | | | | | | | | | | | | | 5/11/06 to end of second quarter 2006 | | $ | 2,500 | | | 38 | % | $ | - | | $ | 0.9500 | | $ | 0.8850 | | | n/a | | $ | 0.8995 | | $ | - | | $ | - | | $ | - | | | Third quarter 2006 | | | 5,000 | | | 40 | % | | - | | | 0.9500 | | | 0.8749 | | | n/a | | | 0.8919 | | | - | | | - | | | - | | | Fourth quarter 2006 | | | 6,500 | | | 53 | % | | - | | | 0.9324 | | | 0.8650 | | | n/a | | | 0.8793 | | | - | | | - | | | - | | | First quarter 2007 | | | 3,500 | | | 28 | % | | - | | | 0.9100 | | | 0.8380 | | $ | (3 | ) | | n/a | | | n/a | | | n/a | | | - | | | First quarter 2007 | | | 3,500 | | | 28 | % | | - | | | 0.9000 | | | 0.8345 | | | (2 | ) | | n/a | | | n/a | | | n/a | | | - | | | Second quarter 2007 | | | 3,500 | | | 28 | % | | - | | | 0.9100 | | | 0.8430 | | | (18 | ) | | n/a | | | n/a | | | n/a | | | - | | | Second quarter 2007 | | | 3,500 | | | 28 | % | | - | | | 0.9000 | | | 0.8364 | | | (8 | ) | | n/a | | | n/a | | | n/a | | | - | | | Third quarter 2007 | | | 3,500 | | | 28 | % | | - | | | 0.9100 | | | 0.8473 | | | (27 | ) | | n/a | | | n/a | | | n/a | | | - | | | Third quarter 2007 | | | 3,500 | | | 28 | % | | - | | | 0.9000 | | | 0.8403 | | | (11 | ) | | n/a | | | n/a | | | n/a | | | - | | | Fourth quarter 2007 | | | 3,500 | | | 28 | % | | - | | | 0.9100 | | | 0.8516 | | | (33 | ) | | n/a | | | n/a | | | n/a | | | - | | | Fourth quarter 2007 | | | 3,500 | | | 28 | % | | - | | | 0.9000 | | | 0.8446 | | | (14 | ) | | n/a | | | n/a | | | n/a | | | - | | | | | | | | | | | | | | | | | | | | $ | (116 | ) | | | | | | | | | | | | |
| (In Thousands Except Exchange Rates) | | | | | | | | | | | | | Sensitivity Analysis of Amount Tredegar (Pays to) Receives | | | Average | | Average | | from Counterparty in 2007 for Settlement of CAD/USD Options | | | CAD Per | | USD Equiv. | | First | | Second | | Third | | Fourth | | | | | USD | | of CAD | | Quarter | | Quarter | | Quarter | | Quarter | | Total | | | 1.21951 | | $ | 0.8200 | | $ | (136 | ) | $ | (164 | ) | $ | (197 | ) | $ | (232 | ) | $ | (729 | ) | | 1.20482 | | | 0.8300 | | | (52 | ) | | (81 | ) | | (115 | ) | | (149 | ) | | (397 | ) | | 1.19048 | | | 0.8400 | | | - | | | (12 | ) | | (32 | ) | | (67 | ) | | (111 | ) | | 1.17647 | | | 0.8500 | | | - | | | - | | | - | | | (7 | ) | | (7 | ) | | 1.16279 | | | 0.8600 | | | - | | | - | | | - | | | - | | | - | | | 1.14943 | | | 0.8700 | | | - | | | - | | | - | | | - | | | - | | | 1.13636 | | | 0.8800 | | | - | | | - | | | - | | | - | | | - | | | 1.12360 | | | 0.8900 | | | - | | | - | | | - | | | - | | | - | | | 1.11111 | | | 0.9000 | | | - | | | - | | | - | | | - | | | - | | | 1.09890 | | | 0.9100 | | | 39 | | | 39 | | | 39 | | | 39 | | | 155 | | | 1.08696 | | | 0.9200 | | | 116 | | | 116 | | | 116 | | | 116 | | | 465 | | | 1.07527 | | | 0.9300 | | | 194 | | | 194 | | | 194 | | | 194 | | | 774 | | | 1.06383 | | | 0.9400 | | | 271 | | | 271 | | | 271 | | | 271 | | | 1,084 | |
| (In Thousands Except Exchange Rates) | | | | | | | | | | | | | | | | | Notional | | | | | | | | | | | | | | | Amount as | | | | | | | | Pretax | | | | | | | a % of | | | | USD-Equivalent | | Unrealized | | | | | | | Forecasted | | | | Strike Prices of | | Gain (Loss) | | | | | | | USD-Equiv. | | | | Options Bought & | | on Options at | | | | | Notional | | Royalty | | Net Option | | Sold on EUR/USD | | 12/31/06 | | | Description of Currency | | Amount | | from | | Premium | | Call | | Put | | Included in | | | Exposure, Options Hedging Strategy | | of Option | | Nether- | | (Paid) | | Options | | Options | | Shareholders' | | | Used & Periods Covered | | Contracts | | lands Sub | | Received | | Sold | | Bought | | Equity* | | Exposure: Significant royalty on sales from film technology licensed to subsidiary in the Netherlands is earned in Euros ("EUR"). | | | | | | | | | | | | Hedge Strategy: Sold average rate call options & bought average rate put options on EUR/USD. | | | | | | | | | | | | Periods Covered by Option Contracts: | | | | | | | | | | | | | First quarter 2007 | | $ | 3,200 | | | 74 | % | $ | - | | $ | 1.3350 | | $ | 1.2800 | | | n/a | | | Second quarter 2007 | | | 3,200 | | | 82 | % | | - | | | 1.3480 | | | 1.2800 | | | n/a | | | Third quarter 2007 | | | 3,200 | | | 75 | % | | - | | | 1.3575 | | | 1.2800 | | | n/a | | | Fourth quarter 2007 | | | 3,200 | | | 76 | % | | - | | | 1.3640 | | | 1.2800 | | | n/a | | | * Hedge transactions occurred on 1/4/07 and therefore there was no unrealized gain or loss at 12/31/06. | | | |
| (In Thousands Except Exchange Rates) | | | | | | | | | | | | | Sensitivity Analysis of Amount Tredegar (Pays to) Receives | | | Average | | Average | | from Counterparty in 2007 for Settlement of EUR/USD Options | | | EUR Per | | USD Equiv. | | First | | Second | | Third | | Fourth | | | | | USD | | of EUR | | Quarter | | Quarter | | Quarter | | Quarter | | Total | | | 0.84034 | | $ | 1.1900 | | $ | 225 | | $ | 225 | | $ | 225 | | $ | 225 | | $ | 900 | | | 0.82645 | | | 1.2100 | | | 175 | | | 175 | | | 175 | | | 175 | | | 700 | | | 0.81301 | | | 1.2300 | | | 125 | | | 125 | | | 125 | | | 125 | | | 500 | | | 0.80000 | | | 1.2500 | | | 75 | | | 75 | | | 75 | | | 75 | | | 300 | | | 0.78740 | | | 1.2700 | | | 25 | | | 25 | | | 25 | | | 25 | | | 100 | | | 0.77519 | | | 1.2900 | | | - | | | - | | | - | | | - | | | - | | | 0.76336 | | | 1.3100 | | | - | | | - | | | - | | | - | | | - | | | 0.75188 | | | 1.3300 | | | - | | | - | | | - | | | - | | | - | | | 0.74074 | | | 1.3500 | | | (36 | ) | | (5 | ) | | - | | | - | | | (41 | ) | | 0.72993 | | | 1.3700 | | | (84 | ) | | (52 | ) | | (29 | ) | | (14 | ) | | (180 | ) | | 0.71942 | | | 1.3900 | | | (132 | ) | | (100 | ) | | (77 | ) | | (61 | ) | | (369 | ) | | 0.70922 | | | 1.4100 | | | (180 | ) | | (147 | ) | | (124 | ) | | (108 | ) | | (559 | ) | | 0.69930 | | | 1.4300 | | | (228 | ) | | (195 | ) | | (171 | ) | | (155 | ) | | (748 | ) |
After-tax gains of $1,104 in 2006, $939 in 2005 and $1,230 in 2004 were reclassified from other comprehensive income to earnings and were offset by losses, respectively, from transactions relating to the underlying hedged item. As of December 31, 2006, we expect $654 of unrealized after-tax gains on derivative instruments reported in accumulated other comprehensive income to be reclassified to earnings within the next twelve months. We also expect that these gains will be offset by losses from transactions relating to the underlying hedged item.
Accrued expenses consist of the following: | | | | | | | | | 2006 | | 2005 | | | | | | | | | | Payrolls, related taxes and medical and other benefits | | $ | 8,620 | | $ | 6,687 | | | Workmen's compensation and disabilities | | | 4,335 | | | 4,226 | | | Vacation | | | 4,875 | | | 4,488 | | | Plant shutdowns and divestitures | | | 5,058 | | | 6,972 | | | Incentive compensation | | | 4,075 | | | 383 | | | Other | | | 14,943 | | | 13,275 | | | Total | | $ | 41,906 | | $ | 36,031 | |
A reconciliation of the beginning and ending balances of accrued expenses associated with plant shutdowns and divestitures for each of the three years in the period ended December 31, 2006 is as follows: | | | | | | | | | | | | | | | | Severance | | Asset Impairments | | Accelerated Depreciation (a) | | Other (b) | | Total | | | Balance at December 31, 2003 | | $ | 2,106 | | $ | - | | $ | - | | $ | 3,086 | | $ | 5,192 | | | 2004: | | | | | | | | | | | | | | | | | | Charges | | | 6,456 | | | 11,554 | | | 2,572 | | | 2,450 | | | 23,032 | | | Cash spent | | | (3,732 | ) | | - | | | - | | | (2,112 | ) | | (5,844 | ) | | Charged against assets | | | - | | | (11,554 | ) | | (2,572 | ) | | - | | | (14,126 | ) | | Foreign currency translation | | | 261 | | | - | | | - | | | - | | | 261 | | | Reversed to income | | | - | | | - | | | - | | | (30 | ) | | (30 | ) | | Balance at December 31, 2004 | | | 5,091 | | | - | | | - | | | 3,394 | | | 8,485 | | | 2005: | | | | | | | | | | | | | | | | | | Charges | | | 3,620 | | | 8,198 | | | 353 | | | 6,553 | | | 18,724 | | | Cash spent | | | (6,182 | ) | | - | | | - | | | (4,290 | ) | | (10,472 | ) | | Charged against assets | | | - | | | (8,198 | ) | | (353 | ) | | - | | | (8,551 | ) | | Foreign currency translation | | | (8 | ) | | - | | | - | | | - | | | (8 | ) | | Reversed to income | | | (1,036 | ) | | - | | | - | | | (170 | ) | | (1,206 | ) | | Balance at December 31, 2005 | | | 1,485 | | | - | | | - | | | 5,487 | | | 6,972 | | | 2006: | | | | | | | | | | | | | | | | | | Charges | | | 1,371 | | | 1,150 | | | - | | | 1,607 | | | 4,128 | | | Cash spent | | | (2,420 | ) | | - | | | - | | | (2,472 | ) | | (4,892 | ) | | Charged against assets | | | - | | | (1,150 | ) | | - | | | - | | | (1,150 | ) | | Foreign currency translation | | | - | | | - | | | - | | | - | | | - | | | Reversed to income | | | - | | | - | | | - | | | - | | | - | | | Balance at December 31, 2006 | | $ | 436 | | $ | - | | $ | - | | $ | 4,622 | | $ | 5,058 | | | (a) Represents depreciation accelerated due to plant shutdowns based on a remaining useful life of less than one year. | | (b) Other includes primarily accrued losses on a sub-lease at a facility in Princeton New, Jersey. |
The amount reversed to income in 2005 relates primarily to changes in estimates for severance and shutdown-related costs at our aluminum extrusions facility in Aurora, Ontario and in connection with the restructuring of the research and development operations in Film Products. See Note 15 for more information on plant shutdowns, asset impairments and restructurings.
| 8 | DEBT AND CREDIT AGREEMENTS |
| |
On December 15, 2005, we refinanced our debt with a new $300,000, five-year unsecured revolving credit agreement (the “Credit Agreement”). At December 31, 2006, available credit under the Credit Agreement was approximately $239,000. Total debt due and outstanding at December 31, 2006 is summarized below:
| | | | | | | | | | Debt Due and Outstanding at December 31, 2006 | | Year Due | | Credit Agreement | | Other | | Total Debt Due | | | 2007 | | $ | - | | $ | 678 | | $ | 678 | | | 2008 | | | - | | | 484 | | | 484 | | | 2009 | | | - | | | 495 | | | 495 | | | 2010 | | | 60,000 | | | 415 | | | 60,415 | | | 2011 | | | - | | | 221 | | | 221 | | | Remainder | | | - | | | 227 | | | 227 | | | Total | | $ | 60,000 | | $ | 2,520 | | $ | 62,520 | |
The credit spread over LIBOR and commitment fees charged on the unused amount under the Credit Agreement at various indebtedness-to-adjusted EBITDA levels are as follows: | | | | | | | | Pricing Under Credit Agreement (Basis Points) | | | | | Credit Spread Over LIBOR | | | | Indebtedness-to- Adjusted EBITDA Ratio | | ($60 Million Outstanding at 12/31/06) | | Commitment Fee | | | > 2.50x but <= 3x | | | 125 | | | 25 | | | > 1.75x but <= 2.50x | | | 100 | | | 20 | | | > 1x but <= 1.75x | | | 87.5 | | | 17.5 | | | <= 1x | | | 75 | | | 15 | |
At December 31, 2006, the interest cost on debt was priced at one-month LIBOR plus the applicable credit spread of 75 basis points.
The most restrictive covenants in the Credit Agreement include:
On October 17, 2003, we refinanced our debt with a new $250,000 credit agreement (the “Credit Agreement”) consisting of a $175,000 three-year revolving credit facility and a $75,000 three-year term loan. The amount available under the revolving credit facility was reduced by $50,000 (from $175,000 to $125,000) in the first quarter of 2004 upon the receipt of the approximately $55,000 in income tax recoveries related to the sale of the venture capital portfolio (see Note 17). At December 31, 2004, available credit under the revolving credit facility was approximately $91,000. Total debt due and outstanding at December 31, 2004 is summarized below: | |
| | Debt Due and Outstanding at December 31, 2004 |
|---|
| | | Credit Agreement
| | | | | |
|---|
Year
Due | | | Revolver | | Term
Loan | | Other | | Total Debt
Due | |
|---|
| | 2005 | | | $ | — | | $ | 13,125 | | $ | — | | $ | 13,125 | | | 2006 | | | | 33,000 | | | 51,250 | | | 4,637 | | | 88,887 | | | 2007 | | | | — | | | — | | | 361 | | | 361 | | | 2008 | | | | — | | | — | | | 264 | | | 264 | | | 2009 | | | | — | | | — | | | 269 | | | 269 | | | Remainder | | | | — | | | — | | | 546 | | | 546 | |
| | Total | | | $ | 33,000 | | $ | 64,375 | | $ | 6,077 | | $ | 103,452 | |
|
| The credit spread over LIBOR and commitment fees charged on the unused amount under the credit agreement at various indebtedness-to-adjusted EBITDA levels are as follows: | |
| | Pricing Under Credit Agreement (Basis Points) |
|---|
| | | | | Credit Spread Over LIBOR
| | | |
|---|
Indebtedness-to-
Adjusted EBITDA
Ratio | Revolver
($33 Million
Outstanding
at 12/31/04) | | Term Loan
($64 Million
Outstanding
at 12/31/04) | | Commitment
Fee | |
|---|
| | > 2x but <= 3x | | | | 150 | | | 150 | | | 30 | | | > 1x but <= 2x | | | | 125 | | | 125 | | | 25 | | | <= 1x | | | | 100 | | | 100 | | | 20 | |
|
| At December 31, 2004 and 2003, we had no interest rate swaps outstanding and the interest cost on debt was priced at one-month LIBOR plus the applicable credit spread of 125 basis points.
The most restrictive covenants in the Credit Agreement include:
| |
•· | Maximum aggregate dividends over the term of the Credit Agreement of $100,000;$100,000 plus, beginning October 1, 2005, 50% of net income ($119,546 million as of December 31, 2006); |
| | •· | Minimum shareholders’ equity ($344,248371,464 as of December 31, 2004)2006); |
| | •· | Maximum indebtedness-to-adjusted EBITDA through December 31, 2008 of 3x and 2.75x thereafter (2.5x on a pro forma basis for acquisitions); and |
| | •· | Minimum adjusted EBIT-to-interest expense of 2.5x. |
We believe we were in compliance with all of our debt covenants as of December 31, 2006. Noncompliance with any one or more of the debt covenants may have a material adverse effect on financial condition or liquidity in the event such noncompliance cannot be cured or should we be unable to obtain a waiver from the lenders. Renegotiation of the covenant through an amendment to the Credit Agreement may effectively cure the noncompliance, but may have an effect on financial condition or liquidity depending upon how the covenant is renegotiated. In the past we have used interest rate swaps with large major financial institutions to manage interest rate exposure, but there have been no interest rate swaps outstanding since 2003.
| 9 | We believe we were in compliance with all of our debt covenants as of December 31, 2004. Noncompliance with any one or more of the debt covenants may have an adverse effect on financial condition or liquidity in the event such noncompliance cannot be cured or should we be unable to obtain a waiver from the lenders. Renegotiation of the covenant through an amendment to the credit agreement may effectively cure the noncompliance, but may have an effect on financial condition or liquidity depending upon how the covenant is renegotiated.
On April 27, 2001, we entered into a two-year interest rate swap agreement, with a notional amount of $50,000, under which we paid to a counterparty a fixed interest rate of 4.85% and the counterparty paid us a variable interest rate based on one-month LIBOR reset each month. This swap was designated as and accounted for as a cash flow hedge. It effectively fixed the rate on $50,000 of our $250,000 term loan then outstanding at 4.85% plus the applicable credit spread (generally 62.5 basis points at that time).
|
On June 22, 2001, we entered into another two-year interest rate swap agreement, with a notional amount of $25,000, under which we paid to a counterparty a fixed interest rate of 4.64% and the counterparty paid us a variable interest rate based on one-month LIBOR reset each month. This swap was designated as and accounted for as a cash flow hedge. It effectively fixed the rate on $25,000 of our $250,000 term loan then outstanding at 4.64% plus the applicable credit spread (generally 62.5 basis points at that time).
|
| 9 SHAREHOLDER RIGHTS AGREEMENT
|
| | Pursuant to a Rights Agreement dated as of June 30, 1999 (as amended), between Tredegar and National City Bank as Rights Agent, one Right is attendant to each share of our common stock. Each Right entitles the registered holder to purchase from Tredegar one one-hundredth of a share of Participating Cumulative Preferred Stock, Series A (the “Preferred Stock”), at an exercise price of $150 (the “Purchase Price”). The Rights will become exercisable, if not earlier redeemed, only if a person or group acquires 10% or more of the outstanding shares of our common stock or announces a tender offer which would result in ownership by a person or group of 10% or more of our common stock. Any action by a person or group whose beneficial ownership is reported on Amendment No. 4 to the Schedule 13D filed with respect to Tredegar on May 20, 1997, cannot cause the Rights to become exercisable.
Each holder of a Right, upon the occurrence of certain events, will become entitled to receive, upon exercise and payment of the Purchase Price, Preferred Stock (or in certain circumstances, cash, property or other securities of Tredegar or a potential acquirer) having a value equal to twice the amount of the Purchase Price.
The Rights will expire on June 30, 2009.
|
Pursuant to a Rights Agreement dated as of June 30, 1999 (as amended), between Tredegar and National City Bank as Rights Agent, one Right is attendant to each share of our common stock. Each Right entitles the registered holder to purchase from Tredegar one one-hundredth of a share of Participating Cumulative Preferred Stock, Series A (the “Preferred Stock”), at an exercise price of $150 (the “Purchase Price”). The Rights will become exercisable, if not earlier redeemed, only if a person or group acquires 10% or more of the outstanding shares of our common stock or announces a tender offer which would result in ownership by a person or group of 10% or more of our common stock. Any action by a person or group whose beneficial ownership is reported on Amendment No. 4 to the Schedule 13D filed with respect to Tredegar on March 20, 1997, cannot cause the Rights to become exercisable.
Each holder of a Right, upon the occurrence of certain events, will become entitled to receive, upon exercise and payment of the Purchase Price, Preferred Stock (or in certain circumstances, cash, property or other securities of Tredegar or a potential acquirer) having a value equal to twice the amount of the Purchase Price. The Rights will expire on June 30, 2009.
| 10 | STOCK OPTION AND STOCK AWARD PLANS |
| |
We have two stock option plans under which stock options may be granted to purchase a specified number of shares of common stock at a price no lower than the fair market value on the date of grant and for a term not to exceed 10 years. One of those option plans is a directors’ stock plan. In addition, we have three other stock option plans under which there are options that remain outstanding, but no future grants can be made. Employee options ordinarily vest one to two years from the date of grant. The outstanding options granted to directors vest over three years. The option plans also permit the grant of stock appreciation rights (“SARs”), stock, restricted stock, stock unit awards and incentive awards. No SARs have been granted since 1992. All SARs outstanding at December 31, 2001, were exercised during 2002.
A summary of our stock options outstanding at December 31, 2006, 2005 and 2004, and changes during those years, is presented below: | | | | | | | | | | | | | | | | | | Option Exercise Price/Share | | | | | Number of Options | | | | Range | | | | Wgted. Ave. | | | Outstanding at 12/31/03 | | | 2,722,610 | | $ | 3.37 | | | to | | | 46.63 | | $ | 21.39 | | | Granted | | | 348,425 | | | 13.95 | | | to | | | 14.50 | | | 13.97 | | | Forfeited and Expired | | | (102,175 | ) | | 7.38 | | | to | | | 46.63 | | | 23.28 | | | Exercised | | | (306,870 | ) | | 3.37 | | | to | | | 19.75 | | | 6.99 | | | Outstanding at 12/31/04 | | | 2,661,990 | | | 4.17 | | | to | | | 46.63 | | | 22.01 | | | Granted | | | - | | | n/a | | | to | | | n/a | | | n/a | | | Forfeited and Expired | | | (274,575 | ) | | 13.95 | | | to | | | 46.63 | | | 21.90 | | | Exercised | | | (137,075 | ) | | 4.17 | | | to | | | 16.55 | | | 7.51 | | | Outstanding at 12/31/05 | | | 2,250,340 | | | 7.38 | | | to | | | 46.63 | | | 22.90 | | | Granted | | | 449,800 | | | 15.11 | | | to | | | 19.52 | | | 15.30 | | | Forfeited and Expired | | | (874,525 | ) | | 7.38 | | | to | | | 46.63 | | | 29.73 | | | Exercised | | | (578,442 | ) | | 7.38 | | | to | | | 19.75 | | | 16.47 | | | Outstanding at 12/31/06 | | | 1,247,173 | | $ | 13.95 | | | to | | $ | 29.94 | | $ | 18.16 | |
The following table summarizes additional information about stock options outstanding and exercisable and non-vested restricted stock outstanding at December 31, 2006:
| | | | | | | | | | | | | | | | | | | | | | | | | | | | Options Outstanding at | | Options Exercisable at | | | | | | | | | December 31, 2006 | | December 31, 2006 | | | | | | | | | | | Weighted Average | | Aggregate | | | | | | Aggregate | | | | | | | | | | | Remaining | | | | Intrinsic | | | | Weighted | | Intrinsic | | | | | | | | | | | Contract- | | | | Value | | | | Average | | Value | | | Range of | | | | ual Life | | Exercise | | (In | | | | Exercise | | (In | | | Exercise Prices | | Shares | | (Years) | | Price | | Thousands) | | Shares | | Price | | Thousands) | | | $ | 13.95 | | to | | $ | 17.88 | | | 627,068 | | | 4.6 | | $ | 15.18 | | $ | 4,660 | | | 243,268 | | $ | 15.14 | | $ | 1,816 | | | | 17.89 | | to | | | 19.75 | | | 361,650 | | | 1.7 | | | 19.06 | | | 1,282 | | | 350,150 | | | 19.05 | | | 1,247 | | | | 19.76 | | to | | | 25.65 | | | 188,300 | | | .2 | | | 21.98 | | | 131 | | | 188,300 | | | 21.98 | | | 131 | | | | 25.66 | | to | | | 29.94 | | | 70,155 | | | 1.4 | | | 29.84 | | | - | | | 70,155 | | | 29.84 | | | - | | | $ | 13.95 | | to | | $ | 29.94 | | | 1,247,173 | | | 2.9 | | $ | 18.16 | | $ | 6,073 | | | 851,873 | | $ | 19.47 | | $ | 3,194 | |
| | | | | | | | | | Non-vested Restricted Stock | | Number of Shares | | Wgtd. Ave. Grant Date Fair Value/Sh. | | Grant Date Fair Value (In Thousands) | | | Outstanding at 12/31/03 | | | - | | $ | - | | $ | - | | | Granted | | | 125,000 | | | 13.95 | | | 1,744 | | | Vested | | | - | | | - | | | - | | | Forfeited | | | (5,000 | ) | | 13.95 | | | (70 | ) | | Outstanding at 12/30/04 | | | 120,000 | | | 13.95 | | | 1,674 | | | Granted | | | 7,000 | | | 12.92 | | | 90 | | | Vested | | | (8,000 | ) | | 13.95 | | | (111 | ) | | Forfeited | | | (10,000 | ) | | 13.95 | | | (140 | ) | | Outstanding at 12/31/05 | | | 109,000 | | | 13.88 | | | 1,513 | | | Granted | | | 2,000 | | | 16.31 | | | 33 | | | Vested | | | (17,333 | ) | | 13.95 | | | (242 | ) | | Forfeited | | | (24,167 | ) | | 13.80 | | | (333 | ) | | Outstanding at 12/31/06 | | | 69,500 | | $ | 13.97 | | $ | 971 | |
The total intrinsic value of stock options exercised during 2006 was $2,174. The grant-date fair value of stock option-based awards vested during 2006 was $1,323. As of December 31, 2006, there was $1,300 and $380 of unrecognized compensation cost related to stock option-based awards and non-vested restricted stock, respectively. This cost is expected to be recognized over the remaining weighted average period of 1.23 years for stock option-based awards and 2.3 years for non-vested restricted stock. Compensation costs for non-vested restricted stock is subject to accelerated vesting based on meeting certain financial targets.
Stock options exercisable totaled 1,983,440 shares at December 31, 2005 and 2,316,390 shares at December 31, 2004. Stock options available for grant totaled 1,601,700 shares at December 31, 2006, 1,998,300 shares at December 31, 2005 and 2,030,300 shares at December 31, 2004. We have two stock option plans under which stock options may be granted to purchase a specified number of shares of common stock at a price no lower than the fair market value on the date of grant and for a term not to exceed 10 years. One of those option plans is a directors’ stock plan. In addition, we have three other stock option plans under which there are options that remain outstanding, but no future grants can be made. Employee options ordinarily vest one to two years from the date of grant. The outstanding options granted to directors vest over three years. The option plans also permit the grant of stock appreciation rights (“SARs”), stock, restricted stock, stock unit awards and incentive awards. No SARs have been granted since 1992. All SARs outstanding at December 31, 2001, were exercised during 2002.11 A summary of our stock options outstanding at December 31, 2004, 2003 and 2002, and changes during those years, is presented below:
| |
| | | | | Option Exercise Price/Share
| | | | Number of Shares | |
| | | |
| | | | | Wgted. | | | | Options
| | SARs
| | Range
| | | Ave. | |
| | Outstanding at 12/31/01 | | 2,877,020 | | | 104,100 | | $ | 2.70 | | to | | $ | 46.63 | | $ | 18.94 | | | Granted in 2002 | | 624,500 | | | — | | | 14.56 | | to | | | 18.90 | | | 18.74 | | | Lapsed in 2002 | | (57,150 | ) | | — | | | 18.90 | | to | | | 21.50 | | | 19.36 | | | Exercised in 2002 | | (283,490 | ) | | (104,100 | ) | | 2.70 | | to | | | 23.13 | | | 4.87 | |
| | Outstanding at 12/31/02 | | 3,160,880 | | | — | | | 3.37 | | to | | | 46.63 | | | 20.16 | | | Granted in 2003 | | 15,000 | | | — | | | 16.19 | | to | | | 16.57 | | | 16.44 | | | Lapsed in 2003 | | (179,970 | ) | | — | | | 16.55 | | to | | | 46.63 | | | 24.75 | | | Exercised in 2003 | | (273,300 | ) | | — | | | 3.37 | | to | | | 8.38 | | | 4.68 | |
| | Outstanding at 12/31/03 | | 2,722,610 | | | — | | | 3.37 | | to | | | 46.63 | | | 21.39 | | | Granted in 2004 | | 348,425 | | | — | | | 13.95 | | to | | | 14.50 | | | 13.97 | | | Lapsed in 2004 | | (102,175 | ) | | — | | | 7.38 | | to | | | 46.63 | | | 23.28 | | | Exercised in 2004 | | (306,870 | ) | | — | | | 3.37 | | to | | | 19.75 | | | 6.99 | |
| | Outstanding at 12/31/04 | | 2,661,990 | | | — | | $ | 4.17 | | to | | $ | 46.63 | | $ | 22.01 | |
|
| The following table summarizes additional information about stock options outstanding and exercisable at December 31, 2004:
| |
|
| | | Options Outstanding at
December 31, 2004 | | Options Exercisable at
December 31, 2004 | | | |
| |
| | | | | | | Weighted Average | | | | | | | | | | | |
| | | | | | Range of
Exercise Prices | | Shares | | | Remaining
Contract-
ual Life
(Years) | | Exercise
Price | | Shares | | Weighted
Average
Exercise
Price | |
| | $ | 4.17 | | to | | $ | 9.67 | | 199,735 | | | 1.0 | | $ | 7.81 | | | 199,735 | | $ | 7.81 | | | | 9.68 | | to | | | 17.88 | | 617,650 | | | 4.6 | | | 15.12 | | | 272,050 | | | 16.45 | | | | 17.89 | | to | | | 19.75 | | 831,600 | | | 3.1 | | | 19.22 | | | 831,600 | | | 19.22 | | | | 19.76 | | to | | | 25.65 | | 401,650 | | | 1.7 | | | 22.95 | | | 401,650 | | | 22.95 | | | | 25.66 | | to | | | 34.97 | | 347,355 | | | 1.6 | | | 31.52 | | | 347,355 | | | 31.52 | | | | 34.98 | | to | | | 46.63 | | 264,000 | | | 1.0 | | | 43.72 | | | 264,000 | | | 43.72 | |
| | $ | 4.17 | | to | | $ | 46.63 | | 2,661,990 | | | 2.7 | | $ | 22.01 | | | 2,316,390 | | $ | 23.19 | |
|
| Stock options exercisable totaled 2,127,610 shares at December 31, 2003 and 2,556,980 shares at December 31, 2002. Stock options available for grant totaled 2,030,300 shares at December 31, 2004, 642,625 shares at December 31, 2003 and 618,125 shares at December 31, 2002.
During the first quarter of 2004, we also granted 125,000 shares of restricted Tredegar common stock to senior management (5,000 shares were cancelled when an employee left the company prior to vesting). The price on the date of grant was $13.95 per share, and compensation expense of approximately $1,674 is being amortized over the vesting period of five years, subject to accelerated vesting based on meeting certain financial targets.
|
11 RETIREMENT PLANS AND OTHER POSTRETIREMENT BENEFITS
|
| |
We have noncontributory and contributory defined benefit (pension) plans covering most employees. The plans for salaried and hourly employees currently in effect are based on a formula using the participant’s years of service and compensation or using the participant’s years of service and a dollar amount.
On October 26, 2006, we announced changes to our U.S. defined benefit (pension) and savings plans covering salaried and certain other employees. The changes had no impact on our net income or earnings per share in 2006. The changes relating to the pension plan reduced our projected benefit obligation by approximately $10,000 as of December 31, 2006. In 2007, the changes to the pension plan are expected to reduce our service cost, interest cost and amortization of prior service cost components of pension expense by approximately $600, $600 and $1,500, respectively, and the savings plan changes (see Note 12) are expected to increase charges for company matching contributions by approximately $700.
In addition to providing pension benefits, we provide postretirement life insurance and health care benefits for certain groups of employees. Tredegar and retirees share in the cost of postretirement health care benefits, with employees hired on or before January 1, 1993, receiving a fixed subsidy to cover a portion of their health care premiums. On December 8, 2003, the Medicare Prescription Drug Improvement and Modernization Act of 2003 (the “Act”) was signed into law. We eliminated prescription drug coverage for Medicare-eligible retirees as of January 1, 2006. Consequently, we are not eligible for any federal subsidies.
Assumptions used for financial reporting purposes to compute net benefit income or cost and benefit obligations, and the components of net periodic benefit income or cost, are as follows: | | | | | | | | | | | | | | Pension Benefits | | Other Post- Retirement Benefits | | | | | 2006 | | 2005 | | 2004 | | 2006 | | 2005 | | 2004 | | | Weighted-average assumptions used to determine benefit obligations: | | | | | | | | | | | | | | | Discount rate | | | 5.70 | % | | 5.70 | % | | 6.00 | % | | 5.70 | % | | 5.70 | % | | 6.00 | % | | Rate of compensation increases | | | 4.00 | % | | 4.00 | % | | 4.00 | % | | 4.00 | % | | 4.00 | % | | 4.00 | % | | Weighted-average assumptions used to determine net periodic benefit cost: | | | | | | | | | | | | | | | | | | | | | Discount rate | | | 5.70 | % | | 6.00 | % | | 6.25 | % | | 5.70 | % | | 6.00 | % | | 6.25 | % | | Rate of compensation increases | | | 4.00 | % | | 4.00 | % | | 4.00 | % | | 4.00 | % | | 4.00 | % | | 4.00 | % | | Expected long-term return on plan assets, during the year | | | 8.40 | % | | 8.40 | % | | 8.40 | % | | n/a | | | n/a | | | n/a | | | Rate of increase in per-capita cost of covered health care benefits: | | | | | | | | | | | | | | | | | | | | | Indemnity plans, end of year | | | n/a | | | n/a | | | n/a | | | 6.00 | % | | 6.00 | % | | 6.00 | % | | Managed care plans, end of year | | | n/a | | | n/a | | | n/a | | | 6.00 | % | | 6.00 | % | | 6.00 | % | | Components of net periodic benefit income (cost): | | | | | | | | | | | | | | | | | | | | | Service cost | | $ | (6,327 | ) | $ | (6,469 | ) | $ | (5,519 | ) | $ | (70 | ) | $ | (109 | ) | $ | (115 | ) | | Interest cost | | | (13,497 | ) | | (12,661 | ) | | (12,283 | ) | | (535 | ) | | (576 | ) | | (562 | ) | | Employee contributions | | | 517 | | | 468 | | | 443 | | | - | | | - | | | - | | | Other | | | (127 | ) | | 12 | | | (212 | ) | | - | | | - | | | - | | | Expected return on plan assets | | | 21,583 | | | 22,050 | | | 22,678 | | | - | | | - | | | - | | | Amortization of: | | | | | | | | | | | | | | | | | | | | | Net transition asset | | | - | | | - | | | 7 | | | - | | | - | | | - | | | Prior service costs and gains or losses | | | (4,746 | ) | | (738 | ) | | (491 | ) | | 24 | | | 2 | | | 53 | | | Net periodic benefit income (cost) | | $ | (2,597 | ) | $ | 2,662 | | $ | 4,623 | | $ | (581 | ) | $ | (683 | ) | $ | (624 | ) |
The following tables reconcile the changes in benefit obligations and plan assets in 2006 and 2005, and reconcile the funded status to prepaid or accrued cost at December 31, 2006 and 2005:
| | | | | | | | | | Pension Benefits | | Other Post- Retirement Benefits | | | | | 2006 | | 2005 | | 2006 | | 2005 | | | Change in benefit obligation: | | | | | | | | | | | Benefit obligation, beginning of year | | $ | 238,533 | | $ | 214,037 | | $ | 10,070 | | $ | 9,994 | | | Service cost | | | 6,327 | | | 6,469 | | | 70 | | | 109 | | | Interest cost | | | 13,497 | | | 12,661 | | | 535 | | | 576 | | | Plan amendments | | | (10,039 | ) | | 1,372 | | | - | | | - | | | Effect of discount rate change | | | (985 | ) | | 10,424 | | | (4 | ) | | 326 | | | Employee contributions | | | 517 | | | 468 | | | - | | | - | | | Other | | | (3,615 | ) | | 3,500 | | | (329 | ) | | (290 | ) | | Benefits paid | | | (10,841 | ) | | (10,398 | ) | | (920 | ) | | (645 | ) | | Benefit obligation, end of year | | $ | 233,394 | | $ | 238,533 | | $ | 9,422 | | $ | 10,070 | | | Change in plan assets: | | | | | | | | | | | | | | | Plan assets at fair value, beginning of year | | $ | 257,101 | | $ | 247,505 | | $ | - | | $ | - | | | Actual return on plan assets | | | 36,086 | | | 18,487 | | | - | | | - | | | Employee contributions | | | 517 | | | 468 | | | - | | | - | | | Employer contributions | | | 1,074 | | | 1,158 | | | 920 | | | 645 | | | Other | | | (128 | ) | | (119 | ) | | - | | | - | | | Benefits paid | | | (10,841 | ) | | (10,398 | ) | | (920 | ) | | (645 | ) | | Plan assets at fair value, end of year | | $ | 283,809 | | $ | 257,101 | | $ | - | | $ | - | | | Reconciliation of prepaid (accrued) cost: | | | | | | | | | | | | | | | Funded status of the plans | | $ | 50,415 | | $ | 18,568 | | $ | (9,422 | ) | $ | (10,070 | ) | | Unrecognized prior service cost | | | - | | | 4,303 | | | - | | | - | | | Unrecognized net (gain) loss | | | - | | | 62,776 | | | - | | | (8 | ) | | Prepaid (accrued) cost, end of year | | $ | 50,415 | | $ | 85,647 | | $ | (9,422 | ) | $ | (10,078 | ) | | Amounts recognized in the consolidated balance sheets: | | | | | | | | | | | | | | | Prepaid benefit cost | | $ | 54,034 | | $ | 85,647 | | $ | - | | $ | - | | | Accrued benefit liability | | | (3,619 | ) | | (4,832 | ) | | (9,422 | ) | | (10,078 | ) | | Intangible asset | | | - | | | 1,145 | | | - | | | - | | | Decrease in deferred income tax liabilities relating to accumulated other comprehensive loss | | | - | | | 1,253 | | | - | | | - | | | Accumulated other comprehensive loss | | | - | | | 2,434 | | | - | | | - | | | Net amount recognized | | $ | 50,415 | | $ | 85,647 | | $ | (9,422 | ) | $ | (10,078 | ) |
Net benefit income or cost is determined using assumptions at the beginning of each year. Funded status is determined using assumptions at the end of each year.
At December 31, 2006, the effect of a 1% change in the health care cost trend rate assumptions would be immaterial.
Expected benefit payments over the next five years and in the aggregate for 2012-2016 are as follows: | | | | | | | | Years | | Pension Benefits | | Other Post- Retirement Benefits | | | 2007 | | | 11,027 | | | 496 | | | 2008 | | | 11,885 | | | 534 | | | 2009 | | | 12,418 | | | 572 | | | 2010 | | | 12,781 | | | 615 | | | 2011 | | | 13,363 | | | 642 | | | 2012 - 2016 | | | 76,660 | | | 3,546 | |
The incremental impact of adopting SFAS No. 158 (see the pension costs and postretirement benefit costs other than pensions section of Note 1 for further information on this new standard) and recognizing an additional minimum liability (the “AML”) is shown in the table below:
| | | | | | | | | | | | As of December 31, 2006 | | Prior to AML & SFAS No. 158 Adjustments | | AML Adjustment | | SFAS No. 158 Adjustment | | Post AML & SFAS No. 158 Adjustments | | | Prepaid pension costs | | $ | 80,442 | | $ | 1,243 | | $ | (27,651 | ) | $ | 54,034 | | | Pension liabilities | | | - | | | - | | | 3,619 | | | 3,619 | | | Postretirement liabilities | | | 9,740 | | | - | | | (318 | ) | | 9,422 | | | Decrease (increase) in deferred income tax liabilities relating to accumulated other comprehensive loss | | | 1,252 | | | (422 | ) | | 11,354 | | | 12,184 | | | Accumulated other comprehensive loss | | | 2,434 | | | (821 | ) | | 19,598 | | | 21,211 | |
Prepaid pension costs included in the table above are included in “Other assets and deferred charges” in the consolidated balance sheet at December 31, 2006. Pension and postretirement liabilities in the table above are included in “Other noncurrent liabilities” in the consolidated balance sheet at December 31, 2006.
The amounts before related deferred income taxes in accumulated other comprehensive income that are expected to be recognized as components of net periodic benefit cost during 2007 are as follows:
| | | | | | | | | | | | Pension | | Retirement | | Total | | | Prior service cost | | $ | (967 | ) | $ | - | | $ | (967 | ) | | Net (gain) loss | | | 2,855 | | | (47 | ) | | 2,808 | |
Amounts recognized before related deferred income taxes in accumulated other comprehensive income consist of:
| | | | | | | | | | Pension | | Other Post- Retirement | | | Prior service cost | | $ | (6,198 | ) | $ | - | | | Net (gain) loss | | | 39,910 | | | (317 | ) |
Prepaid pension cost at December 31, 2005 of $85,647, are included in “Other assets and deferred charges” in the related consolidated balance sheet. The accrued benefit liability of $4,832 and the intangible asset of $1,145 at December 31, 2005, are also included in “Other assets and deferred charges” in the consolidated balance sheet at December 31, 2005. Accrued postretirement benefit cost at December 31, 2005 of $10,078 is included in “Other noncurrent liabilities” in the related consolidated balance sheet.
The percentage composition of assets held by pension plans at December 31, 2006 and 2005, and the current expected long-term return on assets are as follows:
| | | | | | | | | | % Composition of Plan Assets | | Expected Long-term | | | December 31 | | 2006 | | 2005 | Return % | | | Pension plans related to operations in the U.S.: | | | | | | | | | Low-risk fixed income securities | | | 10.3 | % | | 14.1 | % | | 5.0 | % | | Large capitalization equity securities | | | 20.2 | | | 19.1 | | | 9.2 | | | Mid-capitalization equity securities | | | 8.0 | | | 7.3 | | | 9.8 | | | Small-capitalization equity securities | | | 4.6 | | | 4.3 | | | 10.4 | | | International equity securities | | | 24.8 | | | 22.4 | | | 10.4 | | | Total equity securities | | | 57.6 | | | 53.1 | | | 9.9 | | | Hedge and private equity funds | | | 20.3 | | | 21.0 | | | 7.0 | | | Other assets | | | 2.2 | | | 2.3 | | | 3.0 | | | Total for pension plans related to operations in the U.S. | | | 90.4 | | | 90.5 | | | 8.5 | | | Pension plans related to operations in Canada | | | 9.6 | | | 9.5 | | | 7.0 | | | Total | | | 100.0 | % | | 100.0 | % | | 8.4 | % |
Our targeted allocation percentage for pension plan assets is in the range of the percentage composition that existed at December 31, 2006. Expected long-term returns are estimated by asset class and generally are based on inflation-adjusted historical returns, volatilities, risk premiums and managed asset premiums. For pension plans related to operations in the U.S., the portfolio of fixed income securities is structured with maturities that generally match estimated benefit payments over the next 2-3 years. We believe that over the long term a diversified portfolio of equity securities, hedge funds and private equity funds have a better risk-return profile than fixed income securities. The average remaining duration of benefit payments for our pension plans is about 12 years. We expect our required contributions to approximate $1,100 in 2007.
The accumulated benefit obligation was $230,025 at December 31, 2006 and $223,821 at December 31, 2005. The projected benefit obligation, accumulated benefit obligation and fair value of plan assets for plans with accumulated benefit obligations in excess of plan assets were $13,740, $13,740 and $12,658, respectively, at December 31, 2006, and $13,200, $13,200 and $10,607, respectively, at December 31, 2005.
We also have a non-qualified supplemental pension plan covering certain employees. Effective December 31, 2005, further participation in this plan was terminated and benefit accruals for existing participants were frozen. The plan was designed to restore all or a part of the pension benefits that would have been payable to designated participants from our principal pension plans if it were not for limitations imposed by income tax regulations. The projected benefit obligation relating to this unfunded plan was $2,537 at December 31, 2006 and $2,655 at December 31, 2005. Pension expense recognized was $355 in 2006, $256 in 2005 and $275 in 2004. This information has been included in the preceding pension benefit tables.
Approximately 136 employees at our films manufacturing facility in Kerkrade, The Netherlands are covered by a collective bargaining agreement that includes participation in a multi-employer pension plan. Pension expense recognized for participation in this plan, which is equal to required contributions, was $807 in 2006, $364 in 2005 and $281 in 2004. This information has been excluded from the preceding pension benefit tables.
We have noncontributory and contributory defined benefit (pension) plans covering most employees. The plans for salaried and hourly employees currently in effect are based on a formula using the participant’s years of service and compensation or using the participant’s years of service and a dollar amount.
In addition to providing pension benefits, we provide postretirement life insurance and health care benefits for certain groups of employees. Tredegar and retirees share in the cost of postretirement health care benefits, with employees retiring after July 1, 1993, receiving a fixed subsidy to cover a portion of their health care premiums. On December 8, 2003, the Medicare Prescription Drug Improvement and Modernization Act of 2003 (the “Act”) was signed into law. We believe our prescription drug benefits are not actuarially equivalent to the Act and therefore do not expect that any federal subsidies will apply.
Assumptions used for financial reporting purposes to compute net benefit income or cost and benefit obligations, and the components of net periodic benefit income or cost, are as follows:
12 | SAVINGS PLAN |
| | | Pension Benefits | | | Other Post-
Retirement Benefits | | |
| | |
| | | 2004 | | 2003 | | 2002 | | 2004 | | 2003 | | 2002 | |
| Weighted-average assumptions used
to determine benefit obligations: | | | | | | | | | | | | | | Discount rate | | 6.00 | % | | 6.25 | % | | 6.75 | % | | 6.00 | % | | 6.25 | % | | 6.75 | % | | Rate of compensation increases | | 4.00 | % | | 4.00 | % | | 4.50 | % | | 4.00 | % | | 4.00 | % | | 4.50 | % | Weighted-average assumptions used
to determine net periodic benefit
cost: | | | | | | | | | | | | | | | | | | | | Discount rate | | 6.25 | % | | 6.75 | % | | 7.25 | % | | 6.25 | % | | 6.75 | % | | 7.25 | % | | Rate of compensation increases | | 4.00 | % | | 4.50 | % | | 5.00 | % | | 4.00 | % | | 4.50 | % | | 5.00 | % | Expected long-term return on
plan assets, during the year | | 8.40 | % | | 8.60 | % | | 9.00 | % | | n/a | | | n/a | | | n/a | | Rate of increase in per-capita cost
of covered health care benefits:
| | | | | | | | | | | | | | | | | | | | Indemnity plans, end of year | | n/a | | | n/a | | | n/a | | | 6.00 | % | | 6.00 | % | | 6.00 | % | | Managed care plans, end of year | | n/a | | | n/a | | | n/a | | | 6.00 | % | | 6.00 | % | | 6.00 | % | Components of net periodic benefit
income (cost): | | | | | | | | | | | | | | | | | | | | Service cost | $ | (5,519 | ) | $ | (5,851 | ) | $ | (4,397 | ) | $ | (115 | ) | $ | (101 | ) | $ | (103 | ) | | Interest cost | | (12,283 | ) | | (11,842 | ) | | (11,680 | ) | | (562 | ) | | (584 | ) | | (578 | ) | | Employee contributions | | 443 | | | 323 | | | 220 | | | — | | | — | | | — | | | Other | | (212 | ) | | (98 | ) | | (87 | ) | | — | | | — | | | — | | | Expected return on plan assets | | 22,678 | | | 23,003 | | | 23,701 | | | — | | | — | | | — | | | Amortization of: | | | | | | | | | | | | | | | | | | | | Net transition asset | | 7 | | | 8 | | | 20 | | | — | | | — | | | — | | Prior service costs and gains
or losses | | (491 | ) | | (89 | ) | | 1,941 | | | 53 | | | 43 | | | 64 | |
| | Net periodic benefit income (cost) | $ | 4,623 | | $ | 5,454 | | $ | 9,718 | | $ | (624 | ) | $ | (642 | ) | $ | (617 | ) |
|
We have a savings plan that allows eligible employees to voluntarily contribute a percentage (generally up to 15%) of their compensation. Under the provisions of the plan on or before December 31, 2006, we matched a portion (generally 50 cents for every $1 of employee contribution, up to a maximum of 10% of base pay) of the employee’s contribution to the plan with shares of our common stock. Effective January 1, 2007, and in conjunction with certain pension plan changes (see Note 11), the following changes were made to the savings plan for salaried and certain hourly employees:
The following tables reconcile the changes in benefit obligations and plan assets in 2004 and 2003, and reconcile the funded status to prepaid or accrued cost at December 31, 2004 and 2003: | |
| | | Pension Benefits | | Other Post-
Retirement Benefits | | |
| |
| | | 2004 | | 2003 | | 2004 | | 2003 | |
| | Change in benefit obligation: | | | | | | | | | | | | | | Benefit obligation, beginning of year | $ | 196,460 | | $ | 179,118 | | $ | 9,440 | | $ | 8,994 | | | Service cost | | 5,519 | | | 5,851 | | | 115 | | | 101 | | | Interest cost | | 12,283 | | | 11,842 | | | 562 | | | 584 | | | Plan amendments | | 88 | | | 263 | | | — | | | — | | | Effect of discount rate change | | 6,997 | | | 12,621 | | | 377 | | | 522 | | | Employee contributions | | 443 | | | 323 | | | — | | | — | | | Other | | 2,087 | | | (4,368 | ) | | 25 | | | (318 | ) | | Benefits paid | | (9,840 | ) | | (9,190 | ) | | (525 | ) | | (443 | ) |
| | Benefit obligation, end of year | $ | 214,037 | | $ | 196,460 | | $ | 9,994 | | $ | 9,440 | |
| | Change in plan assets: | | | | | | | | | | | | | Plan assets at fair value,
beginning of year | $ | 233,759 | | $ | 208,473 | | $ | — | | $ | — | | | Actual return on plan assets | | 22,428 | | | 32,270 | | | — | | | — | | | Employee contributions | | 443 | | | 323 | | | — | | | — | | | Employer contributions | | 830 | | | 1,982 | | | 525 | | | 443 | | | Other | | (115 | ) | | (99 | ) | | — | | | — | | | Benefits paid | | (9,840 | ) | | (9,190 | ) | | (525 | ) | | (443 | ) |
| | Plan assets at fair value, end of year | $ | 247,505 | | $ | 233,759 | | $ | — | | $ | — | |
| | Reconciliation of prepaid (accrued) cost: | | | | | | | | | | | | | | Funded status of the plans | $ | 33,468 | | $ | 37,300 | | $ | (9,993 | ) | $ | (9,440 | ) | Unrecognized net transition
(asset) obligation | | — | | | (8 | ) | | — | | | — | | | Unrecognized prior service cost | | 3,421 | | | 3,689 | | | — | | | — | | | Unrecognized net (gain) loss | | 44,859 | | | 34,994 | | | (20 | ) | | (448 | ) |
| | Prepaid (accrued) cost, end of year | $ | 81,748 | | $ | 75,975 | | $ | (10,013 | ) | $ | (9,888 | ) |
| Amounts recognized in the consolidated
balance sheets: | | | | | | | | | | | | | | Prepaid benefit cost | $ | 81,748 | | $ | 75,975 | | $ | — | | $ | — | | | Accrued benefit liability | | (3,000 | ) | | (2,650 | ) | | (10,013 | ) | | (9,888 | ) | | Intangible asset | | 1,222 | | | 1,296 | | | — | | | — | | | Deferred tax liability | | 622 | | | 474 | | | — | | | — | | Accumulated other comprehensive
loss | | 1,156 | | | 880 | | | — | | | — | |
| | Net amount recognized | $ | 81,748 | | $ | 75,975 | | $ | (10,013 | ) | $ | (9,888 | ) |
|
| Net benefit income or cost is determined using assumptions at the beginning of each year. Funded status is determined using assumptions at the end of each year.
At December 31, 2004, the effect of a 1% change in the health care cost trend rate assumptions would be immaterial.
|
Expected benefit payments over the next five years and in the aggregate for 2010-2014 are as follows: | |
|
|---|
| Years | Pension
Benefits | | Other
Post-
Retirement
Benefits | |
|---|
|
|---|
| 2005 | $ | 9,404 | | $ | 489 | | | 2006 | | 9,763 | | | 510 | | | 2007 | | 10,123 | | | 534 | | | 2008 | | 10,966 | | | 559 | | | 2009 | | 11,654 | | | 594 | | | 2010 - 2014 | | 69,713 | | | 3,384 | |
|
| Prepaid pension cost of $81,748 at December 31, 2004 and $75,975 at December 31, 2003, is included in “Other assets and deferred charges” in the consolidated balance sheets. The accrued benefit liability of $3,000 and the intangible asset of $1,222 at December 31, 2004, and the accrued benefit liability of $2,650 and the intangible asset of $1,296 at December 31, 2003, are also included in “Other assets and deferred charges” in the consolidated balance sheets. Accrued postretirement benefit cost of $10,013 at December 31, 2004 and $9,888 at December 31, 2003, is included in “Other noncurrent liabilities” in the consolidated balance sheets.
The percentage composition of assets held by pension plans at December 31, 2004 and 2003, and the current expected long-term return on assets are as follows:
| |
|
|---|
| December 31 | % Composition
of Plan Assets | | Expected
Long-term
Return % | |
|---|
|
|---|
| 2004 | | 2003 |
|---|
|
|---|
| Pension plans related to operations in the U.S.: | | | | | | | | Low-risk fixed income securities | 18.1 | % | 23.3 | % | 5.3 | % |
| | Large capitalization equity securities | 19.6 | | 18.7 | | 9.0 | | | Mid-capitalization equity securities | 7.3 | | 6.6 | | 9.3 | | | Small-capitalization equity securities | 4.1 | | 3.4 | | 10.2 | | | International equity securities | 19.1 | | 17.6 | | 10.2 | |
| | Total equity securities | 50.1 | | 46.3 | | 9.6 | |
| | Hedge and private equity funds | 20.9 | | 20.1 | | 9.3 | | | Other assets | 2.5 | | 2.6 | | 4.0 | |
| | Total for pension plans related to operations in the U.S. | 91.6 | | 92.3 | | 8.5 | |
| | Pension plans related to operations in Canada | 8.4 | | 7.7 | | 7.0 | |
| | Total | 100.0 | % | 100.0 | % | 8.4 | % |
|
| Our targeted allocation percentage for pension plan assets is in the range of the percentage composition that existed at December 31, 2004. Expected long-term returns are estimated by asset class and generally are based on inflation-adjusted historical returns, volatilities and risk premiums. For pension plans related to operations in the U.S., the portfolio of fixed income securities is structured with maturities that generally match estimated benefit payments over the next five years. We believe that over the long term a diversified portfolio of equity securities, hedge funds and private equity funds have a better risk-return profile than fixed income securities. The average remaining duration of benefit payments for our pension plans is about 14 years. We expect our requiredcompany will make matching contributions to be about $600 in 2005.
The accumulated benefit obligation was $196,715 at December 31, 2004 and $180,432 at December 31, 2003. The projected benefit obligation, accumulated benefit obligation and fair value of plan assets for plans with accumulated benefit obligations in excess of plan assets were $10,132, $10,132 and $8,199, respectively, at December 31, 2004, and $8,753, $8,753 and $6,409, respectively, at December 31, 2003.
|
We also have a non-qualified supplemental pension plan covering certain employees. The plan is designed to restore all or a part of the pension benefits that would have been payable to designated participants from our principal pension plans if it were not for limitations imposed by income tax regulations. The projected benefit obligation relating to this unfunded plan was $2,081 at December 31, 2004 and $2,197 at December 31, 2003. Pension expense recognized was $275 in 2004, $249 in 2003 and $255 in 2002. This information has been included in the preceding pension benefit tables.
12 SAVINGS PLAN
|
| |
We have a savings plan that allows eligible employees to voluntarily contribute a percentage (generally 10%) of their compensation. Under the provisions of the plan, we match a portion (generally 50%) of the employee’s contribution to the plan with shares of our common stock. We also have a non-qualified plan that restores matching benefits for employees suspended from the savings plan due to certain limitations imposed by income tax regulations. Charges recognizedof $1 for these plans were $2,716 in 2004, $2,697 in 2003every $1 of employee contribution. The maximum matching contribution will be 6% of base pay for 2007 and $2,573 in 2002. Our liability under2008 and 5% of base pay for 2009 and thereafter.
|
| · | The savings plan will include immediate vesting for active employees of past matching contributions as well as future matching contributions when made (compared with the restoration plan was $1,288previous 5-year graded vesting) and automatic enrollment at December 31, 2004 (consisting3% of 63,730 phantom shares of common stock) and $1,057 at December 31, 2003 (consisting of 68,068 phantom shares of common stock) valued atbase pay unless the closing market price on those dates. The Tredegar Corporation Benefits Plan Trust (the “Trust”) purchased 7,200 shares of our common stock in 1998 for $192 and 46,671 shares of our common stock in 1997 for $1,020, asemployee opts out or elects a partial hedge against the phantom shares held in the restoration plan. There have been no shares purchased since 1997 except for re-invested dividends. The cost of the shares held by the Trust is shown as a reduction to shareholders’ equity in the consolidated balance sheets.
different percentage. |
We also have a non-qualified plan that restores matching benefits for employees suspended from the savings plan due to certain limitations imposed by income tax regulations. Charges recognized for these plans were $2,770 in 2006, $1,889 in 2005 and $2,716 in 2004. The savings plan changes effective January 1, 2007 are expected to increase charges for company matching contributions by approximately $700. Our liability under the restoration plan was $1,332 at December 31, 2006 (consisting of 58,931 phantom shares of common stock) and $782 at December 31, 2005 (consisting of 60,674 phantom shares of common stock) valued at the closing market price on those dates.
The Tredegar Corporation Benefits Plan Trust (the “Trust”) purchased 7,200 shares of our common stock in 1998 for $192 and 46,671 shares of our common stock in 1997 for $1,020, as a partial hedge against the phantom shares held in the restoration plan. There have been no shares purchased since 1997 except for re-invested dividends. The cost of the shares held by the Trust is shown as a reduction to shareholders’ equity in the consolidated balance sheets.
| 13 | RENTAL EXPENSE AND CONTRACTUAL COMMITMENTS |
| | Rental expense for continuing operations was $4,549 in 2004, $3,822 in 2003 and $3,744 in 2002. Rental commitments under all non-cancelable operating leases as of December 31, 2004, are as follows: | |
|
|---|
| Year | Amount | |
|---|
|
|---|
| 2005 | $ | 2,925 | | | 2006 | | 2,847 | | | 2007 | | 2,717 | | | 2008 | | 2,488 | | | 2009 | | 1,760 | | | Remainder | | 2,645 | |
| | Total | $ | 15,382 | |
|
| Therics has future rental commitments under noncancelable operating leases through 2011 (most of which contain sublease options) totaling $9,663. These future rental commitments are included in the above table. Sublease rental commitments relating to excess space at Therics total about $1,000 (excluded from the above table).
Contractual obligations for plant construction and purchases of real property and equipment amounted to $16,108 at December 31, 2004 and $7,726 at December 31, 2003.
|
Rental expense for continuing operations was $4,302 in 2006, $4,316 in 2005 and $4,549 in 2004. Rental commitments under all non-cancelable operating leases as of December 31, 2006, are as follows:
| | | | | | | Amount | | | 2007 | | $ | 3,652 | | | 2008 | | | 3,165 | | | 2009 | | | 2,123 | | | 2010 | | | 2,120 | | | 2011 | | | 701 | | | Remainder | | | 818 | | | Total | | $ | 12,579 | |
AFBS, Inc. (formerly known as Therics, Inc. - see Note 15 for additional information regarding its restructuring in 2005), a wholly-owned subsidiary of Tredegar, has future rental commitments under noncancelable operating leases through 2011 (most of which contain sublease options) totaling $6,800. These future rental commitments are included in the above table. Sublease rental commitments relating to excess space at AFBS total about $900 (excluded from the above table).
Contractual obligations for plant construction and purchases of real property and equipment amounted to $6,025 at December 31, 2006 and $14,628 at December 31, 2005.
| 14 | INCOME TAXES |
| | Income from continuing operations before income taxes and income taxes are as follows: | |
|
|---|
| 2004 | | 2003 | | 2002 | |
|---|
|
|---|
| Income from continuing operations before income taxes: | | | | | | | | | | | Domestic | $ | 27,875 | | $ | 16,605 | | $ | 61,850 | | | Foreign | | 7,607 | | | 13,439 | | | 13,656 | |
| | Total | $ | 35,482 | | $ | 30,044 | | $ | 75,506 | |
| | Current income taxes: | | | | | | | | | | | Federal | $ | (2 | ) | $ | 4,345 | | $ | (430 | ) | | State | | 1,105 | | | 368 | | | 1,318 | | | Foreign | | 6,996 | | | 2,689 | | | 1,954 | |
| | Total | | 8,099 | | | 7,402 | | | 2,842 | |
| | Deferred income taxes: | | | | | | | | | | | Federal | | 3,385 | | | 649 | | | 20,421 | | | State | | 1,198 | | | 936 | | | 943 | | | Foreign | | (3,460 | ) | | 1,730 | | | 2,675 | |
| | Total | | 1,123 | | | 3,315 | | | 24,039 | |
| | Total income taxes | $ | 9,222 | | $ | 10,717 | | $ | 26,881 | |
| | | | |
Income from continuing operations before income taxes and income taxes are as follows: | | | | | | | | | | | 2006 | | 2005 | | 2004 | | | Income from continuing operations before income taxes: | | | | | | | | | Domestic | | $ | 52,408 | | $ | 19,709 | | $ | 27,875 | | | Foreign | | | 6,429 | | | 6,493 | | | 7,607 | | | Total | | $ | 58,837 | | $ | 26,202 | | $ | 35,482 | | | | | | | | | | | | | | | Current income taxes: | | | | | | | | | | | | Federal | | $ | 5,584 | | $ | 1,853 | | $ | (2 | ) | | State | | | 840 | | | 811 | | | 1,105 | | | Foreign | | | 4,057 | | | (1,908 | ) | | 6,996 | | | Total | | | 10,481 | | | 756 | | | 8,099 | | | Deferred income taxes: | | | | | | | | | | | | Federal | | | 9,807 | | | 7,900 | | | 3,385 | | | State | | | 687 | | | 600 | | | 1,198 | | | Foreign | | | (339 | ) | | 717 | | | (3,460 | ) | | Total | | | 10,155 | | | 9,217 | | | 1,123 | | | Total income taxes | | $ | 20,636 | | $ | 9,973 | | $ | 9,222 | |
The significant differences between the U.S. federal statutory rate and the effective income tax rate for continuing operations are as follows: | | | | | | | | | | | | Percent of Income Before Income Taxes for Continuing Operations | | | | | 2006 | | 2005 | | 2004 | | | Income tax expense at federal statutory rate | | | 35.0 | | | 35.0 | | | 35.0 | | | State taxes, net of federal income tax benefit | | | 1.7 | | | 3.5 | | | 4.2 | | | Valuation allowance for foreign operating loss carry-forwards | | | 1.3 | | | 1.6 | | | 1.7 | | | Unremitted earnings from foreign operations | | | 1.2 | | | 2.3 | | | (.1 | ) | | Non-deductible expenses | | | .7 | | | .6 | | | .8 | | | Foreign rate differences | | | - | | | - | | | 1.0 | | | Tax-exempt income | | | - | | | (1.6 | ) | | - | | | Reversal of income tax contingency accruals | | | - | | | - | | | (11.3 | ) | | Research and development tax credit | | | (.9 | ) | | (1.6 | ) | | (1.9 | ) | Valuation allowance for capital loss carry-forwards | | | (1.0 | ) | | 2.2 | | | - | | | Extraterritorial Income Exclusion and | | | | | | | | | | | | Domestic Production Activities Deduction | | | (1.7 | ) | | (2.4 | ) | | (2.3 | ) | | Other | | | (1.2 | ) | | (1.5 | ) | | (1.1 | ) | | Effective income tax rate | | | 35.1 | | | 38.1 | | | 26.0 | |
Deferred tax liabilities and deferred tax assets at December 31, 2006 and 2005, are as follows:
| | | | | | | | | 2006 | | 2005 | | | Deferred tax liabilities: | | | | | | | Depreciation | | $ | 37,188 | | $ | 37,438 | | | Pensions | | | 19,384 | | | 30,595 | | | Amortization of goodwill | | | 14,314 | | | 11,627 | | | Foreign currency translation gain adjustment | | | 11,607 | | | 7,686 | | | Unrealized gain on available-for-sale securities | | | - | | | 12 | | | Derivative financial instruments | | | 497 | | | 437 | | | Other | | | 1,315 | | | 351 | | | Total deferred tax liabilities | | | 84,305 | | | 88,146 | | | Deferred tax assets: | | | | | | | | | Employee benefits | | | 5,987 | | | 5,244 | | Tax in excess of book basis for venture capital and other investments (net of valuation allowance of $577 in 2005) | | | 2,372 | | | 1,863 | | Asset write-offs, divestitures and environmental accruals | | | | | | | | | Allowance for doubtful accounts and sales returns | | | 1,209 | | | 1,086 | | | Tax benefit on U.S. foreign and R&D tax credits and | | | | | | | | | NOL carryforwards | | | 731 | | | 7,895 | | | Inventory | | | 640 | | | 329 | | Other (net of valuation allowance of $2,120 in 2006 and $1,020 in 2005) | | | 2,398 | | | 2,618 | | | Total deferred tax assets | | | 14,588 | | | 21,637 | | | Net deferred tax liability | | $ | 69,717 | | $ | 66,509 | | | Included in the balance sheet: | | | | | | | | | Noncurrent deferred tax liabilities in excess of assets | | $ | 75,772 | | $ | 74,287 | | | Current deferred tax assets in excess of liabilities | | | 6,055 | | | 7,778 | | | Net deferred tax liability | | $ | 69,717 | | $ | 66,509 | |
During 2006, we realized substantially all of the tax benefits from tax credit and other carry-forwards existing at December 31, 2005. The remaining deferred tax asset associated with tax credit and other carry-forwards of $731 at December 31, 2006, relates to state income taxes and a net operating loss carry-forward for a foreign subsidiary that has no expiration. A valuation allowance at December 31, 2006 of approximately $2,120 is included in other deferred tax assets that offsets an amount included in that line item relating to possible future tax benefits on operating losses generated by another foreign subsidiary that may not be recoverable in its carry-forward period. In addition, a valuation allowance of $577 was established in 2005 in conjunction with the write-down of our investment in Novalux (see Note 2) for expected limitations on the utilization of assumed capital losses. In the fourth quarter of 2006, we reversed this valuation allowance and reduced our income tax provision by $577. Outside appraisal of the value of corporate assets, primarily real estate, performed in December 2006, indicates that realization of this deferred tax assets is more likely than not. We had current and non-current income taxes recoverable of $10,975 and zero, respectively, at December 31, 2006, and $7,163 and $5,803, respectively, at December 31, 2005.
| The significant differences between the U.S. federal statutory rate and the effective income tax rate for continuing operations are as follows: | |
|
|---|
| Percent of Income Before Income
Taxes for Continuing Operations | |
|---|
| |
|
|---|
| 2004 | | 2003 | | 2002 | |
|---|
| | Income tax expense at federal statutory rate | 35.0 | | 35.0 | | 35.0 | | | State taxes, net of federal income tax benefit | 4.2 | | 2.8 | | 1.9 | | | Unremitted earnings from foreign operations | (.1 | ) | 1.5 | | (.6 | ) | | Non-deductible expenses | .8 | | 1.0 | | .3 | | | Research and development tax credit | (1.9 | ) | (1.7 | ) | (.5 | ) | | Extraterritorial Income Exclusion | (2.3 | ) | (2.8 | ) | (.8 | ) | | Reversal of income tax contingency accruals | (11.3 | ) | — | | — | | | Foreign rate differences and other | 1.6 | | (.1 | ) | .3 | |
| | Effective income tax rate | 26.0 | | 35.7 | | 35.6 | |
|
Deferred tax liabilities and deferred tax assets at December 31, 2004 and 2003, are as follows: | |
| | December 31 | | | | 2004 | | | 2003 | |
| | Deferred tax liabilities: | | | | | | | | | | | | | | | | | | | | Depreciation | | | $ | 37,057 | | $ | 32,317 | | | Pensions | | | | 29,885 | | | 26,434 | | | Foreign currency translation gain adjustment | | | | 10,619 | | | 5,494 | | | Amortization of goodwill | | | | 7,975 | | | 3,750 | | | Unrealized gain on available-for-sale securities | | | | — | | | 1,556 | | | Income on derivative financial instruments | | | | 497 | | | 249 | | | Inventory | | | | — | | | 194 | | | Other | | | | 779 | | | 3,911 | |
| | Total deferred tax liabilities | | | | 86,812 | | | 73,905 | |
| | Deferred tax assets: | | | | | | | | | | Employee benefits | | | | 5,810 | | | 5,028 | | Tax benefit on U.S. foreign and R&D tax credits and
NOL carryforwards | | | | 10,979 | | | 7,052 | | Asset write-offs, divestitures and environmental
accruals | | | | 4,547 | | | 2,148 | | | Allowance for doubtful accounts and sales returns | | | | 1,119 | | | 1,254 | | Tax in excess of book basis for venture capital
investments | | | | 638 | | | 902 | | | Inventory | | | | 131 | | | — | | | Other | | | | 2,628 | | | 2,243 | |
| | Total deferred tax assets | | | | 25,852 | | | 18,627 | |
| | Net deferred tax liability | | | $ | 60,960 | | $ | 55,278 | |
| | Included in the balance sheet: | | | | | | | | | | Noncurrent deferred tax liabilities in excess of assets | | | $ | 71,141 | | $ | 66,276 | | | Current deferred tax assets in excess of liabilities | | | | 10,181 | | | 10,998 | |
| | Net deferred tax liability | | | $ | 60,960 | | $ | 55,278 | |
|
| As of December 31, 2004, Tredegar had net operating loss, foreign tax credit and R&D tax credit carry- forwards in the U.S. that expire as follows: | |
| | U.S. Tax Carry-Forward Items at December 31, 2004 by Year of Expiration | |
| | | | | Deferred Income Tax Assets | | Estimated Minimum Future Taxable
Income Required to Realize Deferred
Income Tax Assets | | | | | |
| |
| Year of
Expiration | | | | Foreign
Tax
Credits | | | R&D Tax
Credits | | | Net
Operating
Losses | | | Total | | | Foreign
Tax
Credits | | | R&D Tax
Credits | | | Net
Operating
Losses | | | Total | |
| | 2012 | | | $ | 1,209 | | $ | — | | $ | — | | $ | 1,209 | | $ | 3,454 | | $ | — | | $ | — | | $ | 3,454 | | | 2013 | | | | 1,555 | | | — | | | — | | | 1,555 | | | 4,443 | | | — | | | — | | | 4,443 | | | 2014 | | | | 2,818 | | | — | | | — | | | 2,818 | | | 8,051 | | | — | | | — | | | 8,051 | | | 2021 | | | | — | | | 1,403 | | | — | | | 1,403 | | | — | | | 4,009 | | | — | | | 4,009 | | | 2022 | | | | — | | | 1,185 | | | — | | | 1,185 | | | — | | | 3,386 | | | — | | | 3,386 | | | 2023 | | | | — | | | 690 | | | 1,429 | | | 2,119 | | | — | | | 1,971 | | | 4,083 | | | 6,054 | | | 2024 | | | | — | | | 690 | | | — | | | 690 | | | — | | | 1,971 | | | — | | | 1,971 | |
| | Total | | | $ | 5,582 | | $ | 3,968 | | $ | 1,429 | | $ | 10,979 | | $ | 15,948 | | $ | 11,337 | | $ | 4,083 | | $ | 31,368 | |
|
| We believe that it is more likely than not that the timing of future taxable income in the U.S. will be sufficient to cover future tax deductible amounts related to the deferred income tax assets shown in the table above. Accordingly, no valuation allowance has been recognized for these items. However, a valuation allowance of approximately $600,000 is included in other deferred tax assets that offsets an amount included in that line item relating to possible future tax benefits on operating losses generated in 2004 by certain foreign subsidiaries that may not be recoverable in the carryforward period. |
15 | LOSSES ASSOCIATED WITH PLANT SHUTDOWNS, ASSET IMPAIRMENTS AND RESTRUCTURINGS, UNUSUAL ITEMS, GAINS FROM SALE OF ASSETS AND OTHER ITEMS |
Losses associated with plant shutdowns, asset impairments and restructurings, net of gains on sale of related assets, in 2006 totaled $1,850 ($1,441 after taxes) and include:
· | | Losses associated with plant shutdowns, asset impairments and restructurings in 2004 totaled $23,032A fourth quarter net gain of $14 ($15,1928 after taxes), a third-quarter net gain of $1,022 ($615 after taxes), a second-quarter net gain of $822 ($494 after taxes) and include:
| | a first-quarter pretax charge of $404 ($243 after taxes) associated with the shutdown of the films manufacturing facility in LaGrange, Georgia, including a pretax gain of $2,889 for related LIFO inventory liquidations (included in "Cost of goods sold" in the consolidated statements of income), severance and other costs of $1,566, asset impairment charges of $130 and a gain on the disposal of equipment of $261 (included in “Other income (expense), net” in the consolidated statements of income); |
•· | A third-quarter charge of $920 ($566 after taxes) related to expected future environmental costs at the aluminum extrusions facility in Newnan, Georgia (included in "Cost of goods sold" in the consolidated statements of income); |
| · | A fourth quarter charge of $143 ($93 after taxes) and a third quarter charge of $494 ($321 after taxes) related to the estimated loss on the sub-lease of a portion of the AFBS facility in Princeton, New Jersey; |
| · | Second-quarter charges of $459 ($289 after taxes) and first-quarter charges of $268 ($170 after taxes) for severance and other employee-related costs in connection with restructurings in Aluminum Extrusions ($514) and Film Products ($213); and |
| · | First-quarter charges of $1,020 ($876 after taxes) for asset impairments relating to machinery & equipment in Film Products. |
In 2006, a pretax gain on the sale of public equity securities of $56 (proceeds also of $56) is included in “Other income (expense), net” in the consolidated statements of income and “Gain on the sale of corporate assets” in the segment operating profit table in Note 3. Income taxes in 2006 include a reversal of a valuation allowance of $577 for deferred tax assets associated with capital loss carry-forwards recorded with the write-down of the investment in Novalux (see Notes 2 and 14). Outside appraisal of the value of corporate assets, primarily real estate, performed in December 2006, indicates that realization of related deferred tax assets is more likely than not.
Losses associated with plant shutdowns, asset impairments and restructurings, net of gains on sale of related assets, in 2005 totaled $14,606 ($9,372 after taxes) and include:
| · | A fourth-quarter charge of $269 ($174 after taxes) and a second-quarter charge of $10,049 ($6,532 after taxes) related to the sale or assignment of substantially all of the assets of AFBS, Inc. (formerly known as Therics, Inc. - see below for additional information regarding its restructuring in 2005), including asset impairment charges of $5,638, lease-related losses of $3,326 and severance (31 people) and other transaction-related costs of $1,354 (see below for additional information on the transaction); |
| · | Fourth-quarter charges of $397 ($256 after taxes), third-quarter charges of $906 ($570 after taxes), second-quarter charges of $500 ($317 after taxes) and first-quarter charges of $418 ($266 after taxes) related to severance and other employee-related costs associated with restructurings in Film Products ($1,118 before taxes) and Aluminum Extrusions ($648 before taxes) and at corporate headquarters ($455 before taxes; included in “Corporate expenses, net” in the segment operating profit table in Note 3) (an aggregate of 21 people were affected by these restructurings); |
| · | A fourth-quarter charge of $2,101 ($1,263 after taxes) related to the shutdown of the films manufacturing facility in LaGrange, Georgia, including asset impairment charges of $1,615 and severance (15 people) and other costs of $486; |
| · | A fourth-quarter gain of $1,862 ($1,193 after taxes), a third-quarter charge of $198 ($127 after taxes), a second-quarter net gain of $71 ($46 after taxes) and a first-quarter charge of $470 ($301 after taxes) related to the shutdown of the aluminum extrusions facility in Aurora, Ontario, including a $1,667 gain on the sale of the facility (included in "Other income (expense), net" in the consolidated statements of income) and $1,111 of shutdown-related costs partially offset by the reversal to income of certain accruals associated with severance and other costs of $709; |
| · | A second-quarter charge of $27 ($16 after taxes) and a first-quarter gain of $1,618 ($973 after taxes) related to the shutdown of the films manufacturing facility in New Bern, North Carolina, including a $1,816 gain on the sale of the facility (included in "Other income (expense), net" in the consolidated statements of income), partially offset by shutdown-related expenses of $225; |
| · | A first-quarter charge of $1,019 ($653 after taxes) for process reengineering costs associated with the implementation of an information system in Film Products (included in "Costs of goods sold" in the consolidated statements of income); |
| · | Fourth-quarter charges of $118 ($72 after taxes), third-quarter charges of $595 ($359 after taxes), second-quarter charges of $250 ($150 after taxes) partially offset by a net first-quarter gain of $120 ($72 after taxes) related to severance and other employee-related accruals associated with the restructuring of the research and development operations in Film Products (of this amount, $1,366 in pretax charges for employee relocation and recruitment is included in SG&A expenses in the consolidated statements of income); |
| · | A second-quarter gain of $653 ($392 after taxes) related to the shutdown of the films manufacturing facility in Carbondale, Pennsylvania, including a $630 gain on the sale of the facility (included in “Other income (expense), net” in the consolidated statements on income), and the reversal to income of certain shutdown-related accruals of $23; |
| · | Fourth-quarter charges of $583 ($351 after taxes) for asset impairments in Film Products; |
| · | A net fourth-quarter charge of $495 ($310 after taxes) in Aluminum Extrusions, including an asset impairment of $597, partially offset by the reversal to income of certain shutdown-related accruals of $102; |
| · | Fourth-quarter charges of $31 ($19 after taxes), third-quarter charges of $117 ($70 after taxes), second-quarter charges of $105 ($63 after taxes) and first-quarter charges of $100 ($60 after taxes) for accelerated depreciation related to restructurings in Film Products; and |
| · | A fourth-quarter charge of $182 ($119 after taxes) in Film Products related to the write-off of an investment. |
On June 30, 2005, substantially all of the assets of AFBS, Inc. (formerly known as Therics, Inc.), a wholly-owned subsidiary of Tredegar, were sold or assigned to a newly-created limited liability company, Therics, LLC, which is controlled and managed by an individual not affiliated with Tredegar. AFBS received a 17.5% equity interest in Therics, LLC, valued at $170 and a 3.5% interest in Theken Spine, LLC, valued at $800, along with potential future payments based on the sale of certain products by Therics, LLC. AFBS retained substantially all of its liabilities in the transaction, which included customary indemnification provisions for pre-transaction liabilities. Tredegar has no obligation or intent to fund any future losses that may occur at Therics, LLC or Theken Spine, LLC. The ownership interest in Therics, LLC is accounted for under the equity method of accounting with losses limited to its initial carrying value of $170. The ownership interest in Theken Spine, LLC is accounted for under the cost method, with an impairment loss recognized and a new cost basis established for any write-down to estimated fair value, if necessary. The payments due from Therics, LLC that are based on the sale of certain products are recognized as income when earned. AFBS had operating losses of $3,467 during the first six months of 2005 and $9,763 in 2004. Results of operations for AFBS since June 30, 2005 are immaterial.
See Note 2 for information regarding the write-down in 2005 of our investment in Novalux, Inc.
Gain on sale of corporate assets in 2005 includes a pretax gain of $61 related to the sale of corporate real estate. This gain is included in “Other income (expense), net” in the consolidated statements of income and separately shown in the operating profit by segment table in Note 3.
During the first quarter of 2005, we recognized a pretax gain for interest receivable on tax refund claims of $508 ($327 after taxes) (included in "Other income (expense), net" in the consolidated statements of income and "Corporate expenses, net" in the segment operating profit table in Note 3).
Losses associated with plant shutdowns, asset impairments and restructurings in 2004 totaled $23,032 ($15,192 after taxes) and include:
| · | A fourth-quarter charge of $84 ($56 after taxes), a third-quarter charge of $828 ($537 after taxes), a second-quarter charge of $994 ($647 after taxes) and a first-quarter charge of $666 ($432 after taxes) related to accelerated depreciation from plant shutdowns and restructurings in Film Products; |
| | •· | A fourth-quarter charge of $569 (of this amount, $59 for employee relocation is included in selling, general and administrative expenses in the consolidated statements of income) ($369 after taxes) and a third-quarter charge of $709 ($461 after taxes) related to severance for 30 people and other employee-related costs associated with the restructuring of the R&D operations in Film Products, (we anticipate recognizing additional charges associated with this restructuring over the next 12 months of approximately $2,800 ($1,820 after taxes)), including costs associated with relocating R&D functions to Richmond, Virginia; |
| | •· | A fourth-quarter charge of $639 ($415 after taxes), a third-quarter charge of $617 ($401 after taxes), a second-quarter charge of $300 ($195 after taxes) and a first-quarter charge of $537 ($349 after taxes) primarily related to severance (63 people) and other employee-related costs associated with the shutdown of the films manufacturing facility in New Bern, North Carolina (the “New Bern Plant”) (the shut down was completed in the fourth quarter of 2004); |
| | •· | A third-quarter charge of $357 ($329 after taxes) and a second-quarter charge of $2,665 ($1,858 after taxes) for the loss on the sale of the films business in Argentina (proceeds net of transaction costs were $803 ($401 net of cash included in business sold)); |
| | •· | A fourth-quarter charge of $352 ($228 after taxes), a third-quarter charge of $195 ($127 after taxes) and a first-quarter charge of $9,580 ($6,228 after taxes) related to the planned shutdown of an aluminum extrusions facility in Aurora, Ontario, (the “Aurora Plant”), including asset impairment charges of $7,130 and severance and other employee-related costs of $2,450 (these costs arewere contractually-related for about 100 people and have been immediately accrued and we anticipate recognizing additional shutdown-related costs of about $2,000 in the first quarter of 2005)accrued); |
| | •· | A third-quarter charge of $170 ($111 after taxes) for additional costs incurred related to a plant shutdown in Film Products; |
| | •· | A second-quarter charge of $300 ($195 after taxes), partially offset by a fourth-quarter gain of $104 ($68 after taxes), related to the loss on the sale of the previously shutdown films manufacturing facility in Manchester, Iowa (the “Manchester Plant”);Iowa; |
| | •· | A fourth quarterfourth-quarter charge of $427 ($277 after taxes) and a second-quarter charge of $879 ($571 after taxes) related to the estimated loss on the sub-lease of a portion of the ThericsAFBS facility in Princeton, New Jersey; |
| | •· | Second-quarter charges of $575 ($374 after taxes) in Film Products and $146 ($95 after taxes) in Aluminum Extrusions related to asset impairments; and |
| · | | • | Fourth quarterFourth-quarter charges of $1,402 ($912 after taxes) related to severance and other employee-related costs associated with restructurings in Therics ($590 before taxes), Film Products ($532 before taxes) and Aluminum Extrusions ($280 before taxes) and a second-quarter charge of $145 ($94 after taxes) related to severance at ThericsAFBS (an aggregate of 24 people were affected by these restructurings). |
Gain on sale of corporate assets in 2004 includes a fourth-quarter gain on the sale of land of $1,013 ($649 after taxes and proceeds of $1,271), a second-quarter gain on the sale of land of $413 ($268 after taxes and proceeds of $647) and a first-quarter gain on the sale of public equity securities of $6,134 ($3,987 after taxes and proceeds of $7,182). These gains are included in “Other income (expense), net” in the consolidated statements of income and separately shown in the segment operating profit table in Note 3.
Income taxes in 2004 include a third-quarter tax benefit of $4,000 related to the reversal of income tax contingency accruals upon the favorable conclusion of IRS and state examinations through 2000.
The other gain of $7,316 ($4,756 after taxes) included in the Aluminum Extrusions section of the operating profit by segment table in Note 3 is comprised of the present value of an insurance settlement of $8,357 (future value of $8,455) associated with environmental matters related to prior years, partially offset by accruals for expected future environmental costs of $1,041. The company received $5,143 of the $8,455 insurance settlement in September of 2004 and recognized receivables at present value for future amounts due ($1,497 received in February of 2005 and $1,717 received in February 2006). The gain from the insurance settlement is included in "Other income (expense), net" in the consolidated statements of income, while the accruals for expected future environmental costs are included in "Cost of goods sold."
| 16 | Gain on sale of corporate assets in 2004 includes a fourth-quarter gain on the sale of land of $1,013 ($649 after taxes and proceeds of $1,271), a second-quarter gain on the sale of land of $413 ($268 after taxes and proceeds of $647) and a first-quarter gain on the sale of public equity securities of $6,134 ($3,987 after taxes and proceeds of $7,182). There were no public equity securities held at December 31, 2004. These gains are included in “Other income (expense), net” in the consolidated statements of income and separately shown in the operating profit by segment table in Note 3.
Income taxes in 2004 include a third-quarter tax benefit of $4,000 related to the reversal of income tax contingency accruals upon the favorable conclusion of IRS and state examinations through 2000.
CONTINGENCIES |
We are involved in various stages of investigation and remediation relating to environmental matters at certain current and former plant locations. Where we have determined the nature and scope of any required environmental remediation activity, estimates of cleanup costs have been obtained and accrued. As we continue efforts to maintain compliance with applicable environmental laws and regulations, additional contingencies may be identified. If additional contingencies are identified, our practice is to determine the nature and scope of those contingencies, obtain and accrue estimates of the cost of remediation, and perform remediation. We do not believe that additional costs that could arise from those activities will have a material adverse effect on our financial position. However, those costs could have a material adverse effect on quarterly or annual operating results at that time.
We are involved in various other legal actions arising in the normal course of business. After taking into consideration legal counsels’ evaluation of these actions, we believe that we have sufficiently accrued for probable losses and that the actions will not have a material adverse effect on our financial position. However, the resolution of the actions in a future period could have a material adverse effect on quarterly or annual operating results at that time.
From time to time, we enter into transactions with third parties in connection with the sale of assets or businesses in which we agree to indemnify the buyers or third parties involved in the sale for certain liabilities or risks related to the assets or business. Also, in the ordinary course of our business, we may enter into agreements with third parties for the sale of goods or services that may contain indemnification provisions. In the event that an indemnification claim is asserted, liability for indemnification would be subject to an assessment of the underlying facts and circumstances under the terms of the applicable agreement. Further, any indemnification payments may be limited or barred by a monetary cap, a time limitation, or a deductible or basket. For these reasons, we are unable to estimate the maximum potential amount of the potential future liability under the indemnity provisions of these agreements. We do, however, accrue for losses for any known contingent liability, including those that may arise from indemnification provisions, when future payment is probable. We disclose contingent liabilities if the probability of loss is reasonably possible and significant.
69
17 | DISCONTINUED OPERATIONS |
The other gain of $7,316 ($4,756 after taxes) included in the Aluminum Extrusions section of the operating profit by segment table in Note 3 is comprised of the present value of an insurance settlement of $8,357 (future value of $8,455) associated with environmental matters related to prior years, partially offset by accruals for expected future environmental costs of $1,041. The company received $5,143 of the $8,455 insurance settlement in September of 2004 and recognized receivables at present value for future amounts due ($1,497 due in February of 2005 and $1,717 due in February 2006). The gain from the insurance settlement is included in “Other income (expense), net” in the consolidated statements of income, while the accruals for expected future environmental costs are included in “Cost of goods sold.”
In 2003, losses associated with plant shutdowns, asset impairments and restructurings totaling $11,426 ($7,350 after taxes) included:
| |
• | A fourth-quarter charge of $875 ($560 after taxes) for asset impairments in the films business, including charges of $466 ($298 after taxes) relating to accelerated depreciation of assets at the New Bern Plant; | | | • | A fourth-quarter charge of $611 ($391 after taxes) for approximately 50% of the total severance costs for 63 people and other employee-related costs in connection with the shutdown of the New Bern Plant; | | | • | A third-quarter charge of $945 ($605 after taxes) relating to accelerated depreciation of assets at the New Bern Plant; | | | • | A third-quarter charge of $299, a second quarter charge of $53 and a first-quarter charge of $85 (collectively $280 after taxes) for additional costs incurred related to the shutdown of the films plants in Tacoma, Washington (the “Tacoma Plant”), Carbondale, Pennsylvania (the “Carbondale Plant”) and the Manchester Plant; | | | • | A third-quarter charge of $322 ($206 after taxes) for additional severance and other employee-related costs in connection with a previously announced restructuring in Film Products; | | | • | A third-quarter charge of $2,151 ($1,398 after taxes) and a second-quarter charge of $549 ($357 after taxes) related to the estimated loss on the sub-lease of a portion of the Therics facility in Princeton, New Jersey; | | | • | A third-quarter charge of $256 ($163 after taxes) for severance for seven people and other employee-related costs in connection with restructurings in Aluminum Extrusions; | | | • | A second-quarter charge of $3,936 ($2,530 after taxes) for severance for 47 people and other employee-related costs in connection with restructurings in Film Products ($1,600 before taxes), corporate headquarters ($1,181 before taxes and included in “Corporate expenses, net” in the operating profit by segment table in Note 3) and Therics ($1,155 before taxes); | | | • | A second-quarter charge of $956 ($612 after taxes) for asset impairments in the films business, including charges of $312 ($200 after taxes) related to accelerated depreciation of assets at the New Bern Plant; and | | | • | A second-quarter charge of $388 ($248 after taxes) related to an early retirement program for 10 people in Aluminum Extrusions. |
| The loss from unusual items in 2003 of $1,067 ($694 after taxes) relates to a first-quarter charge to adjust depreciation and amortization at Therics based on Tredegar’s decision to suspend divestiture efforts. Results for 2003 also included a fourth-quarter gain of $1,385 ($886 after taxes) on the sale of land at the facility in Richmond Hill, Ontario (total proceeds of approximately $1,800), and gains totaling $5,155 ($3,325 after taxes) on the sale of corporate assets. The gains from the sale of corporate assets included:
| |
• | A fourth-quarter gain of $2,554 ($1,647 after taxes) from the sale of 547,500 shares of Illumina, Inc. common stock (NASDAQ: ILMN) for total proceeds of $3,791; | | | • | A fourth-quarter gain of $355 ($229 after taxes) from the sale of 64,150 shares of Vascular Solutions, Inc. common stock (NASDAQ: VASC) for total proceeds of $403; | | | • | A third-quarter gain of $942 ($608 after taxes) from the sale of 200,000 shares of VASC for total proceeds of $1,092; and | | | • | A third-quarter gain of $1,289 and fourth-quarter gain of $15 (collectively $841 after taxes) from the sale of corporate real estate (total proceeds of approximately $1,800). |
| The gains from the sale of land and corporate assets are included in “Other income (expense), net” in the consolidated statements of income and separately shown in the segment operating profit table in Note 3.
At December 31, 2003, we held 265,955 shares of ILMN with a closing aggregate market value of $1,875 ($601 adjusted cost basis), and held 596,492 shares of VASC with a closing aggregate market value of $3,501 ($447 adjusted cost basis). These holdings, which are included in the consolidated balance sheets in “Other assets and deferred charges” at December 31, 2003, are stated at market value with unrealized gains reported directly in shareholders’ equity net of related deferred income taxes.
|
On March 7, 2003, Tredegar Investments, Inc. (“Tredegar Investments”) reached definitive agreements to sell substantially all of its portfolio of private equity partnership interests to GS Vintage Funds II, which are investment partnerships managed by Goldman Sachs Asset Management’s Private Equity Group. On the same date and in a separate transaction, Tredegar Investments also agreed to sell to W Capital Partners, an independent private equity manager, the subsidiary funds that hold substantially all of Tredegar Investments’ direct venture capital investments. The sale of these fund interests included the assumption by the buyer of Tredegar Investments’ obligations to make additional capital contributions to those funds in the future. In 2002, losses associated with plant shutdowns, asset impairments and restructurings totaling $3,884 ($2,486 after taxes) primarily included:
| |
• | A fourth-quarter charge of $1,457 ($932 after taxes) for asset impairments in the films business; | | | • | A fourth-quarter charge of $392 ($251 after taxes) for additional costs incurred related to the 2000 shutdown of the Manchester Plant; | | | • | A fourth-quarter charge of $318 ($204 after taxes) for additional costs incurred related to the shutdown of the aluminum extrusions plant in El Campo, Texas (the “El Campo Plant”); | | | • | A fourth-quarter charge of $259 ($166 after taxes) for additional costs incurred related to the shutdown of the Tacoma Plant; | | | • | A third-quarter charge of $178 ($114 after taxes) primarily for relocation and employee-related costs in connection with the shutdown of the Carbondale Plant; | | | • | A second-quarter charge of $268 ($172 after taxes) primarily for relocation and employee-related costs in connection with the shutdown of the Tacoma Plant; | | | • | A first-quarter charge of $800 ($512 after taxes) for severance for approximately 70 people and other employee-related costs in connection with the shutdown of the Carbondale Plant; and | | | • | A first-quarter charge of $196 ($125 after taxes) for costs incurred in the transfer of business related to the shutdown of the El Campo Plant. |
| In 2002, the gain from unusual items (net) totaling $6,147 ($3,934 after taxes) included:
| |
• | A fourth-quarter net gain of $5,618 ($3,596 after taxes) for payments received from P&G related to terminations and revisions to contracts of $11,718 and related asset write-downs of $6,100; and | | | • | A fourth-quarter gain of $529 ($338 after taxes) related to the sale of assets acquired in a prior acquisition. |
| 16 CONTINGENCIES |
| | We are involved in various stages of investigation and remediation relating to environmental matters at certain plant locations. Where we have determined the nature and scope of any required environmental remediation activity, estimates of cleanup costs have been obtained and accrued. As we continue efforts to maintain compliance with applicable environmental laws and regulations, additional contingencies may be identified. If additional contingencies are identified, our practice is to determine the nature and scope of those contingencies, obtain and accrue estimates of the cost of remediation, and perform remediation. We do not believe that additional costs that could arise from those activities will have a material adverse effect on our financial position. However, those costs could have a material adverse effect on quarterly or annual operating results at that time.
We are involved in various other legal actions arising in the normal course of business. After taking into consideration legal counsels’ evaluation of these actions, we believe that we have sufficiently accrued for probable losses and that the actions will not have a material adverse effect on our financial position. However, the resolution of the actions in a future period could have a material adverse effect on quarterly or annual operating results at that time.
From time to time, we enter into transactions with third parties in connection with the sale of assets or businesses in which we agree to indemnify the buyers or third parties involved in the sale for certain liabilities or risks related to the assets or business. Also, in the ordinary course of our business, we may enter into agreements with third parties for the sale of goods or services that may contain indemnification provisions. In the event that an indemnification claim is asserted, liability for indemnification would be subject to an assessment of the underlying facts and circumstances under the terms of the applicable agreement. Further, any indemnification payments may be limited or barred by a monetary cap, a time limitation, or a deductible or basket. For these reasons, we are unable to estimate the maximum potential amount of the potential future liability under the indemnity provisions of these agreements. We do, however, accrue for losses for any known contingent liability, including those that may arise from indemnification provisions, when future payment is probable. We disclose contingent liabilities if the probability of loss is reasonably possible and significant.
|
The sale to W Capital Partners of the subsidiary funds that hold the direct investments occurred on March 7, 2003. The sale of the private equity fund interests occurred in a series of closings. Net proceeds from the sales totaled $21,504. Additionally, in the first quarter of 2004 we received income tax recoveries of approximately $55,000 from the carry-back of 2003 capital losses generated by these sales against gains realized in 2000 by Tredegar Investments. 17 DISCONTINUED OPERATIONS
|
| | On March 7, 2003, Tredegar Investments, Inc. (“Tredegar Investments”) reached definitive agreements to sell substantially all of its portfolio of private equity partnership interests to GS Vintage Funds II, which are investment partnerships managed by Goldman Sachs Asset Management’s Private Equity Group. On the same date and in a separate transaction, Tredegar Investments also agreed to sell to W Capital Partners, an independent private equity manager, the subsidiary funds that hold substantially all of Tredegar Investments’ direct venture capital investments. The sale of these fund interests included the assumption by the buyer of Tredegar Investments’ obligations to make additional capital contributions to those funds in the future.
The sale to W Capital Partners of the subsidiary funds that hold the direct investments occurred on March 7, 2003. The sale of the private equity fund interests occurred in a series of closings.
Net proceeds from the sales totaled $21,504. Additionally, in the first quarter of 2004 we received income tax recoveries of approximately $55,000 from the carry-back of 2003 capital losses generated by these sales against gains realized in 2000 by Tredegar Investments.
The agreements governing these transactions contain customary contingent indemnification provisions that Tredegar believes will not have a material effect on its financial position or results of operations.
The operating results associated with venture capital investment activities have been reported as discontinued operations.
|
The agreements governing these transactions contain customary contingent indemnification provisions that Tredegar believes will not have a material effect on its financial position or results of operations. A summary of venture capital investment activities from 2002 through disposal in 2003 is provided below: | |
| | | (In Thousands) | | | | 2003 | | 2002 | |
| | Carrying value of venture capital investments, | | | | | | beginning of period | $ | 93,765 | | $ | 155,084 | | | Venture capital investment activity for period: | | | | | | | | (pre-tax amounts): | | | | | | | | New investments | | 2,807 | | | 20,373 | | | Proceeds from the sale of investments, including | | broker receivables at end of period | | (21,504 | ) | | (8,918 | ) | | Realized gains | | — | | | 4,454 | | | Realized losses, write-offs and write-downs | | (70,256 | ) | | (65,154 | ) | | (Decrease) increase in unrealized gain on | | available-for-sale securities | | (917 | ) | | (12,074 | ) | | Carrying value of public securities retained by | | Tredegar Investments* | | (3,895 | ) | | — | |
| | Carrying value of venture capital investments, | | | | | | | | end of period | $ | — | | $ | 93,765 | |
| | Summary of amounts reported as discontinued | | | | | | | | operations in the consolidated statements of | | | | | | | | income: | | | | | | | | Pretax gains (losses), net | $ | (70,256 | ) | $ | (60,700 | ) | | Operating expenses (primarily management fee | | | | | | | | expenses) | | (599 | ) | | (5,594 | ) |
| | Loss before income taxes | | (70,855 | ) | | (66,294 | ) | | Income tax benefits | | 24,286 | | | 23,866 | |
| | Loss from venture capital investment activities | $ | (46,569 | ) | $ | (42,428 | ) |
|
Discontinued operations in 2004 include an after-tax gain associated with venture capital investment activities of $2,921 primarily related to the reversal of business and occupancy tax contingency accruals upon favorable resolution. Cash flows for discontinued operations have not been separately disclosed in the accompanying statement of cash flows.
SELECTED QUARTERLY FINANCIAL DATA
Tredegar Corporation and Subsidiaries (In thousands, except per-share amounts) (Unaudited) | | | | | | | | | | | | | | | | First Quarter | | Second Quarter | | Third Quarter | | Fourth Quarter | | Year | | | 2006 | | | | | | | | | | | | | Sales | | $ | 267,964 | | $ | 282,491 | | $ | 296,256 | | $ | 269,814 | | $ | 1,116,525 | | | Gross profit | | | 34,852 | | | 35,550 | | | 36,143 | | | 37,045 | | | 143,590 | | | Net income | | | 8,215 | | | 9,250 | | | 9,690 | | | 11,046 | | | 38,201 | | | Earnings per share: | | | | | | | | | | | | | | | | | | Basic | | | .21 | | | .24 | | | .25 | | | .28 | | | .99 | | | Diluted | | | .21 | | | .24 | | | .25 | | | .28 | | | .98 | | | Shares used to compute earnings per share: | | | | | | | | | | | | | | | | | | Basic | | | 38,602 | | | 38,632 | | | 38,654 | | | 38,793 | | | 38,671 | | | Diluted | | | 38,664 | | | 38,837 | | | 39,123 | | | 39,092 | | | 38,931 | | | 2005 | | | | | | | | | | | | | | | | | | Sales | | $ | 232,757 | | $ | 243,724 | | $ | 240,716 | | $ | 239,772 | | $ | 956,969 | | | Gross profit | | | 28,462 | | | 33,245 | | | 32,518 | | | 27,432 | | | 121,657 | | | Net income | | | 5,550 | | | 2,132 | | | 7,657 | | | 890 | | | 16,229 | | | Earnings per share: | | | | | | | | | | | | | | | | | | Basic | | | .14 | | | .05 | | | .20 | | | .02 | | | .42 | | | Diluted | | | .14 | | | .05 | | | .20 | | | .02 | | | .42 | | | Shares used to compute earnings per share: | | | | | | | | | | | | | | | | | | Basic | | | 38,440 | | | 38,453 | | | 38,465 | | | 38,527 | | | 38,471 | | | Diluted | | | 38,636 | | | 38,592 | | | 38,565 | | | 38,594 | | | 38,597 | |
SIGNATURES
Pursuant to the requirements of Section 13 or 15(d) of the Securities Exchange Act of 1934, the registrant has duly caused this report to be signed on its behalf by the undersigned, thereunto duly authorized.
| | | * | At December 31, 2003, Tredegar Investments held 596,492 shares of Vascular Solutions, Inc. (NASDAQ: VASC) and 265,955 shares of Illumina, Inc. (NASDAQ: ILMN). These securities, which were related to Tredegar Investments’ earlier venture capital investment activities, were sold in 2004 for $7,182, including gains recognized of $6,134 ($3,987 after taxes). At December 31, 2003, these securities were classified as available-for-sale, included in the consolidated balance sheets in “Other assets and deferred charges” ($5,376 market value) and stated at market value with unrealized gains reported directly in shareholders' equity net of related deferred income taxes. |
| Loss from venture capital investment activities in 2003 of $70,855 ($46,569 after taxes) includes a loss on the sale of $70,256 ($46,269 after taxes). Discontinued operations in 2004 include an after-tax gain associated with venture capital investment activities of $2,921 primarily related to the reversal of business and occupancy tax contingency accruals upon favorable resolution.
On July 2, 2002, the operations at Molecumetics ceased. The operating results of Molecumetics have been reported as discontinued operations. For the year ended December 31, 2002, operating losses for Molecumetics were $5,928 ($3,853 after taxes), while revenues were $515. Discontinued operations also include a gain of $1,393 ($891 after taxes) in 2003 on the sale of intellectual property of Molecumetics and a charge of $7,500 ($4,875 after taxes) in 2002 for the loss on the disposal of Molecumetics. This charge is comprised of an impairment loss for assets of $4,860, severance and other employee related costs of $1,390 and miscellaneous disposal costs of $1,250. The tangible assets were sold during the fourth quarter of 2002 for proceeds of $800.
Cash flows for discontinued operations have not been separately disclosed in the accompanying statement of cash flows.
|
SELECTED QUARTERLY FINANCIAL DATA |
| |
Tredegar Corporation and Subsidiaries
(In thousands, except per-share amounts)
(Unaudited) | |
| | First
Quarter | | Second
Quarter | | Third
Quarter | | Fourth
Quarter | | Year | |
|---|
| | 2004 | | | | | | | | | | | | | | | |
| | Sales | $ | 195,919 | | $ | 216,053 | | $ | 222,515 | | $ | 226,678 | | $ | 861,165 | | | Gross profit | | 27,348 | | | 33,102 | | | 31,669 | | | 29,528 | | | 121,647 | | | Income from continuing operations | | 2,429 | | | 5,179 | | | 15,292 | | | 3,360 | | | 26,260 | | | Income (loss) from discontinued operations | | — | | | — | | | — | | | 2,921 | | | 2,921 | |
| | Net income (loss) | | 2,429 | | | 5,179 | | | 15,292 | | | 6,281 | | | 29,181 | | | Earnings (loss) per share: | | | | | | | | | | | | | | | | | Basic: | | | | | | | | | | | | | | | | | Continuing operations | | .06 | | | .14 | | | .40 | | | .09 | | | .69 | | | Discontinued operations | | — | | | — | | | — | | | .08 | | | .08 | |
| | Net income (loss) | | .06 | | | .14 | | | .40 | | | .17 | | | .77 | | | Diluted: | | | | | | | | | | | | | | | | | Continuing operations | | .06 | | | .14 | | | .40 | | | .09 | | | .68 | | | Discontinued operations | | — | | | — | | | — | | | .07 | | | .08 | |
| | Net income (loss) | | .06 | | | .14 | | | .40 | | | .16 | | | .76 | | | Shares used to compute earnings (loss) per share | | | | | | | | | | | | | | | | | Basic | | 38,229 | | | 38,235 | | | 38,317 | | | 38,398 | | | 38,295 | | | Diluted | | 38,435 | | | 38,427 | | | 38,519 | | | 38,655 | | | 38,507 | |
| | 2003 | | | |
| | Sales | $ | 182,045 | | $ | 181,574 | | $ | 193,125 | | $ | 181,907 | | $ | 738,651 | | | Gross profit | | 28,356 | | | 27,206 | | | 30,798 | | | 27,492 | | | 113,852 | | | Income from continuing operations | | 4,859 | | | 1,681 | | | 6,419 | | | 6,368 | | | 19,327 | | | Income (loss) from discontinued operations | | (49,516 | ) | | 891 | | | — | | | 2,947 | | | (45,678 | ) |
| | Net income (loss) | | (44,657 | ) | | 2,572 | | | 6,419 | | | 9,315 | | | (26,351 | ) | | Earnings (loss) per share: | | Basic: | | | | | | | | | | | | | | | | | Continuing operations | | .13 | | | .04 | | | .17 | | | .17 | | | .51 | | | Discontinued operations | | (1.30 | ) | | .02 | | | — | | | .08 | | | (1.20 | ) |
| | Net income (loss) | | (1.17 | ) | | .06 | | | .17 | | | .25 | | | (.69 | ) | | Diluted: | | | | | | | | | | | | | | | | | Continuing operations | | .12 | | | .04 | | | .17 | | | .17 | | | .50 | | | Discontinued operations | | (1.28 | ) | | .02 | | | — | | | .07 | | | (1.19 | ) |
| | Net income (loss) | | (1.16 | ) | | .06 | | | .17 | | | .24 | | | (.69 | ) | | Shares used to compute earnings (loss) per share | | | | | | | | | | | | | | | | | Basic | | 38,179 | | | 38,047 | | | 38,058 | | | 38,101 | | | 38,096 | | | Diluted | | 38,578 | | | 38,418 | | | 38,383 | | | 38,389 | | | 38,441 | |
|
SIGNATURES
Pursuant to the requirements of Section 13 or 15(d) of the Securities Exchange Act of 1934, the registrant has duly caused this report to be signed on its behalf by the undersigned, thereunto duly authorized.
| |
| TREDEGAR CORPORATION
(Registrant) | | | | | Dated: March 15, 20052, 2007 | By | /s/ N. A. ScherJohn D. Gottwald | | | |
| | | Norman A. Scher | | | John D. Gottwald | | | | President and Chief Executive Officer |
Pursuant to the requirements of the Securities Exchange Act of 1934, this report has been signed below by the following persons on behalf of the registrant and in the capacities indicated on March 2, 2007.
| Pursuant to the requirements of the Securities Exchange Act of 1934, this report has been signed below by the following persons on behalf of the registrant and in the capacities indicated on March 15, 2005.
| |
Signature | | Title |
| |
| /s/ John D. Gottwald | | Chairman of the Board of Directors |
| | | (John D. Gottwald) | | | | | | | /s/ N. A. ScherJohn D. Gottwald | | President, Chief Executive Officer and Director
| | (John D. Gottwald) | | (Principal Executive Officer) |
| | (Norman A. Scher) | | | | | | | /s/ D. Andrew Edwards | | Vice President, Chief Financial Officer and Treasurer
| | (D. Andrew Edwards) | | (Principal Financial and Accounting Officer) |
| | | | /s/ Richard L. Morrill | | Chairman of the Board of Directors | | (Richard L. Morrill) | | | (D. Andrew Edwards) | | | | /s/ William M. Gottwald | | Vice Chairman of the Board of Directors | | (William M. Gottwald) | | | | | | | /s/ N. A. Scher | | Vice Chairman of the Board of Directors | | (Norman A. Scher) | | | | | | | /s/ Horst R. Adam | | Director | | (Horst R. Adam) | | | | | | | | /s/ Austin Brockenbrough, III | | Director |
| | | (Austin(Austin Brockenbrough, III) | | | | | | /s/ Phyllis Cothran | | Director |
| | | (Phyllis Cothran) | | | | | | | | /s/ Donald T. Cowles | | Director |
| | | (Donald(Donald T. Cowles) | | | | | | /s/ R. W. Goodrum | | Director |
| | | (R. W. Goodrum) | | | | | | /s/ Floyd D. Gottwald, Jr. | | Director |
| | | (Floyd D. Gottwald, Jr.) | | | | | |
/s/ William M. Gottwald | | Director |
| | | (William M. Gottwald) | | | | | | /s/ Richard L. Morrill | | Director |
| | | (Richard L. Morrill) | | | | | | | | /s/ Thomas G. Slater, Jr. | | Director |
| | | (Thomas(Thomas G. Slater, Jr.) | | | | | | | | /s/ R. Gregory Williams | | Director |
| | | (R.(R. Gregory Williams) | | |
EXHIBIT INDEX | 3.1 | Amended and Restated Articles of Incorporation of Tredegar (previously filed(filed as Exhibit 3.1 to Tredegar’s Quarterly Report on Form 10-Q for the quarter ended June 30, 1989, and refiled herewith) | | | 3.2 | Amended By-laws of Tredegar (filed as Exhibit 3 to Tredegar’s Quarterly Report on Form 10-Q for the quarter ended June 30, 2003, and incorporated herein by reference) | | | 3.3 | Articles of Amendment (previously filed as Exhibit 3.3 to Tredegar’sTredegar's Annual Report on Form 10-K for the year ended December 31, 1999,2004, and refiled herewith)incorporated herein by reference) |
| 3.2 | | 4.1 | FormAmended By-laws of Common Stock Certificate (previously filedTredegar (filed as Exhibit 4.33.01 to Tredegar’sTredegar's Current Report on Form 8-K, filed January 17, 2006, and incorporated herein by reference) |
| 3.3 | Articles of Amendment (filed as Exhibit 3.3 to Tredegar's Annual Report on Form 10-K for the year ended December 31, 1989,2004, and refiled herewith)incorporated herein by reference) |
| 4.1 | Form of Common Stock Certificate (filed as Exhibit 4.1 to Tredegar's Annual Report on Form 10-K for the year ended December 31, 2004, and incorporated herein by reference) |
| 4.2 | Rights Agreement, dated as of June 30, 1999, by and between Tredegar and American Stock Transfer & Trust Company, as Rights Agent (previously filed(filed as Exhibit 99.14.2 to the Registration StatementTredegar's Annual Report on Form 8-A, filed June 16, 1999, as amended,10-K for the year ended December 31, 2004, and refiled herewith)incorporated herein by reference) | | |
| 4.2.1 | Amendment and Substitution Agreement (Rights Agreement) dated as of December 11, 2002, by and among Tredegar, American Stock Transfer and Trust Company and National City Bank (filed as Exhibit 4.2.1 to Tredegar’s Annual Report on Form 10-K for the year ended December 31, 2002, and incorporated herein by reference). | | |
| 4.3 | Credit Agreement dated as of October 17, 2003, by and among Tredegar Corporation, as borrower, itsthe domestic subsidiaries of Tredegar that from time to time become parties thereto, as guarantors, the several banks and the lenders (Wachoviaother financial institutions as may from time to time become parties thereto, Wachovia Bank, National Association, as administrative agent, SunTrust Bank, as syndication agent, and Bank of America, N.A., KeyBank National Association, and JPMorgan Chase Bank, N.A., as documentation agent)agents, dated as of December 15, 2005 (filed as Exhibit 410.16 to Tredegar’s QuarterlyTredegar's Current Report on Form 10-Q for the quarter ended September 30, 2003,8-K, filed December 20, 2005, and incorporated herein by reference) |
| 10.1 | | 10.1 | Reorganization and Distribution Agreement dated as of June 1, 1989, between Tredegar and Ethyl (previously filed(filed as Exhibit 10.1 to Tredegar’sTredegar's Annual Report on Form 10-K for the year ended December 31, 1989,2004, and refiled herewith)incorporated herein by reference) | | |
| *10.2 | Employee Benefits Agreement dated as of June 1, 1989, between Tredegar and Ethyl (previously filed(filed as Exhibit 10.2 to Tredegar’sTredegar's Annual Report on Form 10-K for the year ended December 31, 1989,2004, and refiled herewith)incorporated herein by reference) | | |
| 10.3 | Tax Sharing Agreement dated as of June 1, 1989, between Tredegar and Ethyl (previously filed(filed as Exhibit 10.3 to Tredegar’sTredegar's Annual Report on Form 10-K for the year ended December 31, 1989,2004, and refiled herewith)incorporated herein by reference) | | |
| 10.4 | Indemnification Agreement dated as of June 1, 1989, between Tredegar and Ethyl (previously filed(filed as Exhibit 10.510.4 to Tredegar’sTredegar's Annual Report on Form 10-K for the year ended December 31, 1989,2004, and refiled herewith)incorporated herein by reference) | | |
| *10.5 | Tredegar 1989 Incentive Stock Option Plan (previously included(filed as Exhibit A10.5 to Tredegar's Annual Report on Form 10-K for the Prospectus contained in the Form S-8 Registration Statement No. 33-31047,year ended December 31, 2004, and refiled herewith) | | incorporated herein by reference) |
| *10.5.1 | Amendment to the Tredegar 1989 Incentive Stock Option Plan (previously filed(filed as Exhibit 10.5.1 to Tredegar’sTredegar's Annual Report on Form 10-K for the year ended December 31, 1998,2004, and refiled herewith) | | incorporated herein by reference) |
| *10.6 | Tredegar 1992 Omnibus Stock Incentive Plan (previously filed(filed as Exhibit 10.1210.6 to Tredegar’sTredegar's Annual Report on Form 10-K for the year ended December 31, 1991,2004, and refiled herewith) | | incorporated herein by reference) |
| *10.6.1 | Amendment to the Tredegar 1992 Omnibus Incentive Plan (previously filed(filed as Exhibit 10.7.110.6.1 to Tredegar’sTredegar's Annual Report on Form 10-K for the year ended December 31, 1998,2004, and refiled herewith)incorporated herein by reference) | | |
| *10.7 | Tredegar Industries, Inc. Retirement Benefit Restoration Plan (previously filed(filed as Exhibit 10.1310.7 to Tredegar’sTredegar's Annual Report on Form 10-K for the year ended December 31, 1993,2004, and refiled herewith) | | incorporated herein by reference) |
| *10.7.1 | Amendment to the Tredegar Retirement Benefit Restoration Plan (previously filed(filed as Exhibit 10.8.110.7.1 to Tredegar’sTredegar's Annual Report on Form 10-K for the year ended December 31, 1998,2004, and refiled herewith)incorporated herein by reference) | | |
| *10.8 | Tredegar Industries, Inc. Savings Plan Benefit Restoration Plan (previously filed(filed as Exhibit 10.1410.8 to Tredegar’sTredegar's Annual Report on Form 10-K for the year ended December 31, 1993,2004, and refiled herewith)incorporated herein by reference) | | |
| *10.8.1 | Resolutions of the Executive Committee of the Board of Directors of Tredegar Corporation adopted on December 28, 2004 (effective as of December 31, 2004) amending the Tredegar Corporation Retirement Savings Plan Benefit Restoration Plan (filed as Exhibit 10.9.1 to Tredegar’s Current Report on Form 8-K, filed on December 30, 2004, and incorporated herein by reference) |
| *10.9 | Tredegar Industries, Inc. Amended and Restated Incentive Plan (previously included as Exhibit 99.2 to the Form S-8 Registration Statement No. 333-88177, filed on September 30, 1999, and incorporated herein by reference) | | | *10.10 | Consulting Agreement made as of April 1, 2000 between Tredegar and Richard W. Goodrum (filed as Exhibit 10 to Tredegar’s Quarterly Report on Form 10-Q for the quarter ended June 30, 2000, and incorporated herein by reference) | | | *10.11 | Tredegar Industries, Inc. Directors’ Stock Plan (previously filed as Exhibit 10.1210.9 to Tredegar’s Annual Report on Form 10-K for the year ended December 31, 1998,2005, and refiled herewith)incorporated herein by reference) | | |
*10.1210.10 | Tredegar Industries, Inc. Directors’ Stock Plan (filed as Exhibit 10.11 to Tredegar's Annual Report on Form 10-K for the year ended December 31, 2004, and incorporated herein by reference) |
| *10.11 | Tredegar Corporation’s 2004 Equity Incentive Plan (filed as Exhibit 10.13 to the Form S-8 Registration Statement No. 333-115423, filed on May 12, 2004 (incorporating from the Annex to Tredegar Corporation’s Definitive Proxy Statement on Schedule 14A filed on March 4, 2004 (No. 1-10258) and incorporated herein by reference) |
| *10.12 | Leave of Absence, Separation and Non-Competition Agreement, dated May 16, 2005, between Tredegar Film Products Corporation and Thomas G. Cochran (filed as Exhibit 10.16 to Tredegar's Current Report on Form 8-K, filed May 18, 2005, and incorporated herein by reference) |
| *10.13 | SummaryTransfer Agreement, by and between Old Therics and New Therics, dated as of CompensationJune 30, 2005 (filed as Exhibit 10.17 to Tredegar's Current Report on Form 8-K, filed July 1, 2005, and incorporated herein by reference) |
| 10.14 | Intellectual Property Transfer Agreement, by and between Old Therics and New Therics, dated as of June 30, 2005 (filed as Exhibit 10.18 to Tredegar's Current Report on Form 8-K, filed July 1, 2005, and incorporated herein by reference) |
| 10.15 | Unit Purchase Agreement, by and between Old Therics, New Therics and Randall R. Theken, dated as of June 30, 2005 (filed as Exhibit 10.19 to Tredegar's Current Report on Form 8-K, filed July 1, 2005, and incorporated herein by reference) |
| 10.16 | Payment Agreement, by and between Old Therics and New Therics, dated as of June 30, 2005 (filed as Exhibit 10.20 to Tredegar's Current Report on Form 8-K, filed July 1, 2005, and incorporated herein by reference) |
| *10.17 | Form of Stock Award Agreement (filed as Exhibit 10.21 to Tredegar's Current Report on Form 8-K, filed September 1, 2005, and incorporated herein by reference) |
| *10.18 | Description of Cash Incentive Plans for the President and Chief Executive Officer and each of the Named Executive Officers for Fiscal 2005fiscal 2006 (filed as Item 1.01 to Tredegar’s Current Report on Form 8-K, filed on February 8, 2005,22, 2006, and incorporated herein by reference) | | |
*10.1410.19 | DescriptionForm of Cash Incentive Plan for fiscal 2005Notice of Nonstatutory Stock Option Grant and Nonstatutory Stock Option Terms and Conditions (filed as Item 1.01 to Tredegar’s Current Report on Form 8-K, filed on December 16, 2004,March 10, 2006, and incorporated herein by reference) | | |
*10.1510.20 | Form of Notice of Stock Award and Stock Award Terms and Conditions (filed as Exhibit 10.22 to Tredegar’s Quarterly Report on Form 10-Q, and incorporated herein by reference) |
| *10.21 | Description of 2007 Long-Term Incentive Award for Chief Executive Officer and Form of Notice of Stock Unit Award (filed as Item 5.02 and Exhibit 10.21, respectively, to Tredegar’s Current Report on Form 8-K, filed on February 28, 2007, and incorporated herein by reference) |
| Summary of Director Compensation for Fiscal 20052007 |
| | | Consent of Independent Registered Public Accounting Firm |
| | | Section 302 Certification of Principal Executive Officer |
| | | Section 302 Certification of Principal Financial Officer |
| | | Section 906 Certification of Principal Executive Officer |
| | | Section 906 Certification of Principal Financial Officer | | | * Denotes compensatory plans or arrangements or management contracts. |
* Denotes compensatory plans or arrangements or management contracts. 77
|