UNITED STATES
SECURITIES AND EXCHANGE COMMISSION
WASHINGTON,
Washington, DC 20549


FORMForm 10-K

ANNUAL REPORT
PURSUANT TO SECTIONS 13 OR 15(d) OF THE
SECURITIES EXCHANGE ACT OF 1934

(Mark One)

xþ

ANNUAL REPORT PURSUANT TO SECTION 13 OR 15(d) OF THE

SECURITIES EXCHANGE ACT OF 1934

For the fiscal year ended March 31, 2008

2010

or

or

o

TRANSITION REPORT PURSUANT TO SECTION 13 OR 15(d) OF THE

SECURITIES EXCHANGE ACT OF 1934

Commission File Number: 001-12537
QUALITY SYSTEMS, INC.
(Exact name of Registrant as specified in its charter)

For the transition period from _____________ to _______________

California

Commission file number: 0-13801

Quality Systems, Inc.


(Exact name of Registrant as specified in its charter)


California

95-2888568


(State or other jurisdictionOther Jurisdiction of


Incorporation or Organization)

95-2888568
(I.R.S.IRS Employer
Identification No.)

incorporation or organization)


18111 Von Karman Avenue, Suite 600, Irvine, California 92612


(Address of principal executive offices, including zip code)

offices)
92612
(Zip Code)
Registrant’s telephone number, including area code:
(949) 255-2600
Securities registered pursuant to Section 12(b) of the Act:

(949) 255-2600


(Registrant’s telephone number, including area code)

Securities registered pursuant to Section 12(b) of the Act:


Common Stock, par value $.01 per share

$0.01 Par Value

Nasdaq

NASDAQ Global Select Market

(

Title of each class)

class

(Name of each exchange on which registered)

registered

Securities registered pursuant to Section 12(g) of the Act:

None


(Title of class)

Securities registered pursuant to Section 12(g) of the Act:
None
Indicate by check mark if the registrant is a well-known seasoned issuer, as defined in Rule 405 of the Securities Act.
Yes o     No xþ

Indicate by check mark if the registrant is not required to file reports pursuant to Section 13 or Section 15(d) of the Act.  Yes o     No Noþx

Indicate by check mark whether the registrant (1) has filed all reports required to be filed by Section 13 or 15(d) of the Securities Exchange Act of 1934 during the preceding 12 months (or for such shorter period that the registrant was required to file such reports), and (2) has been subject to such filing requirements for the past 90 days.  Yes xþ     No o
Indicate by check mark whether the registrant has submitted electronically and posted on its corporate Web site, if any, every Interactive Data File required to be submitted and posted pursuant to Rule 405 ofRegulation S-T

(§ 232.405 of this chapter) during the preceding 12 months (or for such shorter period that the registrant was required to submit and post such files).  Yes o     No o

Indicate by check mark if disclosure of delinquent filers pursuant to Item 405 ofRegulation S-K is not contained herein, and will not be contained, to the best of

-1-


registrant’s knowledge, in definitive proxy or information statements incorporated by reference in Part III of thisForm 10-K or any amendment to thisForm 10-K.  xo

Indicate by check mark whether the registrant is a large accelerated filer, an accelerated filer, a non-accelerated filer, or a non-accelerated filer.smaller reporting company. See definitionthe definitions of “large accelerated filer,” “accelerated filerfiler” and large accelerated filer”“smaller reporting company” in Rule12b-2 of the Exchange Act. (Check one):
Large Accelerated Filer o      Accelerated Filer x        Non-Accelerated Filer o

Large accelerated filer þAccelerated filer oNon-accelerated filer oSmaller reporting company o
(Do not check if a smaller reporting company)
Indicate by check mark whether the registrant is a shell company (as defined inRule 12b-2 of the Exchange Act).  Yes o     No xþ

The aggregate market value of the voting stock held by non-affiliates of the Registrant as of September 30, 2007: $640,154,0002009: $1,168,507,000 (based on the closing sales price of the Registrant’s common stock as reported inon the NASDAQ NationalGlobal Select Market System on that date $36.63of $61.57 per share).* (1)

The Registrant has no non-voting common equity.

Indicate the number of shares outstanding of each of the Registrant’s classes of common stock, as of the latest practicable date.

Common Stock, $.01 par value

$0.01 Par Value

27,454,221

28,884,481


(Class)

(Outstanding at June 1, 2008)

May 21, 2010)

          * For purposes of this Report, in addition to those shareholders which fall within the definition of “affiliates” under Rule 405 of the Securities Act of 1933, as amended, holders of ten percent or more of the Registrant’s common stock are deemed to be affiliates for purposes of this Report.

          (1)      On January 31, 2006, the registrant declared a 2-for-1 stock split with respect to its outstanding shares of common stock for shareholders of record on March 3, 2006. On February 2, 2005, the registrant declared a 2-for-1 stock split with respect to its outstanding shares of common stock for shareholders of record on March 4, 2005. All share prices and share amounts set forth herein have been retroactively adjusted to reflect such stock splits.

*For purposes of this Annual Report onForm 10-K, in addition to those shareholders which fall within the definition of “affiliates” under Rule 405 of the Securities Act of 1933, as amended, holders of ten percent or more of the Registrant’s common stock are deemed to be affiliates for purposes of this Report.
DOCUMENTS INCORPORATED BY REFERENCE

The following documents (or parts thereof) are incorporated by reference into the following parts of thisForm 10-K:


Proxy Statement for the 20082010 Annual Meeting of StockholdersShareholders — Part III Items 10, 11, 12, 13 and 14.

-2-


QUALITY SYSTEMS, INC.

FORM 10-K
For the Fiscal Year Ended March 31, 2010

INDEX
Item
Page
Business4
Risk Factors13
Unresolved Staff Comments24
Properties25
Legal Proceedings25
Reserved25
PART II
Market for Registrant’s Common Equity, Related Shareholder Matters and Issuer Purchases of Equity Securities25
Selected Financial Data28
Management’s Discussion and Analysis of Financial Condition and Results of Operations29
Quantitative and Qualitative Disclosures About Market Risk52
Financial Statements and Supplementary Data53
Changes in and Disagreements with Accountants on Accounting and Financial Disclosure53
Controls and Procedures53
Other Information54
PART III
Directors, Executive Officers and Corporate Governance54
Executive Compensation54
Security Ownership of Certain Beneficial Owners and Management and Related Shareholder Matters54
Certain Relationships and Related Transactions, and Director Independence54
Principal Accountant Fees and Services54
PART IV
Exhibits and Financial Statement Schedules55
Signatures59
EX-10.36
EX-10.37
EX-10.38
EX-10.39
EX-10.40
EX-10.41
EX-10.42
EX-10.43
EX-10.44
EX-21
EX-23.1
EX-23.2
EX-31.1
EX-31.2
EX-32.1


2


CAUTIONARY STATEMENT

Statements made in this report,Annual Report onForm 10-K (this “Report”), the Annual Report to Shareholders in which this reportReport is made a part, other reports and proxy statements filed with the Securities and Exchange Commission (“Commission”), communications to shareholders, press releases and oral statements made by our representatives that are not historical in nature, or that state our or management’s intentions, hopes, beliefs, expectations or predictions of the future, may constitute “forward-looking statements” within the meaning of Section 21E of the Securities and Exchange Act of 1934, as amended (the “Exchange Act”). Forward-looking statements can often be identified by the use of forward-looking terminology, such as “could,” “should,” “will,” “will be,” “will lead,” “will assist,” “intended,” “continue,” “believe,” “may,” “expect,” “hope,” “anticipate,” “goal,” “forecast,” “plan,” or “estimate” or variations thereof or similar expressions. Forward-looking statements are not guarantees of future performance.

Forward-looking statements involve risks, uncertainties and assumptions. It is important to note that any such performance and actual results, financial condition or business, could differ materially from those expressed in such forward-looking statements. Factors that could cause or contribute to such differences include, but are not limited to, the risk factors discussed in Item 1A of this reportReport as well as factors discussed elsewhere in this and other reports and documents we file with the Commission. Other unforeseen factors not identified herein could also have such an effect. We undertake no obligation to update or revise forward-looking statements to reflect changed assumptions, the occurrence of unanticipated events or changes in future operating results, financial condition or business over time unless required by law. Interested persons are urged to review the risks described under Item 1A. “Risk Factors” and in Item 7. “Management’s Discussion and Analysis of Financial Condition and Results of Operations” as well as in our other public disclosures and filings with the Commission.


3


PART I

ITEM 1.

BUSINESS

Company Overview

Quality Systems, Inc., including its wholly-owned subsidiaries, is comprised of the QSI Dental Division, (QSI Division) and a wholly-owned subsidiary, NextGen Healthcare Information Systems, Inc. (NextGen Division)(“NextGen Division”), including NextGen Sphere, LLC and Opus Healthcare Solutions, Inc., and Lackland Acquisition II, LLC dba Healthcare Strategic Initiatives (“HSI”) and Practice Management Partners, Inc. (“PMP”) (“Practice Solutions Division”) (collectively, “our company,” “we,” “our,”the “Company”, “we”, “our”, or “us”). The Company develops and markets healthcare information systems that automate certain aspects of medical and dental practices, networks of practices such as physician hospital organizations (PHO’s)(“PHOs”) and management service organizations (MSO’s)(“MSOs”), ambulatory care centers, community health centers, and medical and dental schools.

Quality Systems, Inc., The Company also provides revenue cycle management (“RCM”) services through the Practice Solutions Division.

The Company, a California corporation formed in 1974, was founded with an early focus on providing information systems to dental group practices. In the mid-1980’s, we capitalized on the increasing focus on medical cost containment and further expanded our information processing systems to serve the medical market. In the mid- 1990’smid-1990’s, we made two acquisitions that accelerated our penetration of the medical market. These two acquisitions formed the basis for the NextGen Division. Today, we serve the medical and dental markets through our NextGen Division and QSI Dental Division.
Business Segments
Historically, the Company has operated principally through two divisions.

operating divisions: QSI Dental Division and NextGen Division. Through our acquisitions of HSI and PMP in 2008, we continued to strengthen our RCM service offerings. During fiscal year 2010, as a result of certain organizational changes, the composition of the Company’s NextGen Division was revised to exclude the former NextGen Practice Solutions unit and the Company’s RCM entities (HSI and PMP), both of which are now administered and aggregated in the Company’s Practice Solutions Division. Following the reorganization, the Company now operates three reportable operating segments (not including Corporate), comprised of the NextGen Division, the QSI Dental Division and the Practice Solutions Division. As a result, our fiscal year 2010 and 2009 results have beenre-casted to reflect this change.

The two divisions operate largely as stand-alone operations, with eachfollowing table breaks down our reported segment revenue and segment revenue growth by division maintaining its own distinct product lines, product platforms, development, implementationfor the years ended March 31, 2010, 2009 and support teams, sales staffing, and branding. The two divisions share the resources of our “corporate office” which includes a variety of accounting and other administrative functions. Additionally, there are a small number of clients who are simultaneously utilizing software from each of our two divisions.

2008:

                         
  Segment Revenue Breakdown
  Segment Revenue Growth
 
  for the Year Ended March 31,  for the Year Ended March 31, 
  2010  2009  2008  2010  2009  2008 
 
QSI Dental Division  5.9%  6.5%  8.6%  8.1%  (1.2)%  (3.3)%
NextGen Division  79.4%  83.1%  91.4%  13.6%  19.6%  21.3%
Practice Solutions Division  14.7%  10.4%  0.0%  67.5%  N/A   N/A 
                         
Consolidated  100.0%  100.0%  100.0%  18.9%  31.6%  18.7%
                         
QSI Dental Division.The QSI Dental Division, co-located with our Corporate Headquarters in Irvine, California, currently focuses on developing, marketing and supporting software suites sold to dental and certain niche medical practices. In addition, the divisionDivision supports a number of medical clients that utilize the division’sits UNIX1 based medical practice management software product.

The NextGen Division, with headquarters in Horsham, Pennsylvania,product and Software as a second significant location in Atlanta, Georgia, focuses principally on developingService, or SaaS model, based NextDDS financial and marketing products and services for medical practices.

Both divisions develop and market practice management software that is designed to automate and streamline a number of the administrative functions required for operating a medical or dental practice. Examples of practice management software functions include scheduling and billing capabilities. It is important to note that in both the medical and dental environments, practice


clinical software.
1 UNIX is a registered trademark of the AT&T Corporation.


management software systems have already been implemented by the vast majority of practices. Therefore, we actively compete for the replacement market. In addition, both divisions develop and market software that automates the patient record. Adoption rates for this software, commonly referred to as clinical software, are relatively low. Therefore, we are typically competing to replace paper-based patient record alternatives as opposed to replacing previously purchased systems.

Electronic Data Interchange (EDI)/connectivity products are intended to automate a number of manual, often paper-based or telephony intensive communications between patients and/or providers and/or payors. Two of the more common EDI services are forwarding insurance claims electronically from providers to payors and assisting practices with issuing statements to patients. Most client practices utilize at least some of these services from us or one of our competitors. Other EDI/connectivity services are used more sporadically by client practices. We typically compete to displace incumbent vendors for claims and statements accounts, and attempt to increase usage of other elements in our EDI/connectivity product line. In general, EDI services are only sold to those accounts utilizing software from one of our divisions.

The NextGen Division also offers Revenue Cycle Management (RCM) services under the Practice Solutions name. Services provided through the Practice Solutions/RCM unit consist primarily of billing and collections services for medical practices. The Practice Solutions unit utilizes NextGen EPM software to a significant extent.

The QSI Dental Division’s practice management software suite utilizes a UNIX operating system. Its Clinical Product Suite (CPS)(“CPS”) utilizes a Windows NT2 operating system and can be fully integrated with the practice management software from each division.Division. CPS incorporates a wide range of clinical tools including, but not limited to, periodontal charting and digital imaging of X-ray and inter-oral camera images as part of the electronic patient record. The divisionDivision develops, markets, and manages our EDI/Electronic Data Interchange (“EDI”)/connectivity applications. The QSInet Application Service Provider (ASP/Internet)(“ASP/Internet”) offering is also developed and marketed by the Division.


4

Our


In July 2009, we licensed source code from PlanetDDS, Inc. that will allow us to deliver hosted, web-based SaaS model practice management and clinical software solutions to the dental industry. The software solution will be marketed primarily to the multi-location dental group practice market in which the Division has historically been a dominant player. This new software solution (NextDDS) brings the QSI Dental Division to the forefront of the emergence of internet based applications and cloud computing and represents a significant growth opportunity for the Division to sell both to its existing customer base as well as new customers.
NextGen Division.  The NextGen Division, developswith headquarters in Horsham, Pennsylvania, and sells proprietary electronic medical recordssignificant locations in Atlanta, Georgia and Austin, Texas, provides integrated clinical, financial and connectivity solutions for ambulatory, inpatient and dental provider organizations.
On August 12, 2009, we acquired NextGen Sphere, LLC (“Sphere”), a provider of financial information systems to the small hospital inpatient market. This acquisition is also part of our strategy to expand into the small hospital market and to add new customers by taking advantage of cross selling opportunities between the ambulatory and inpatient markets.
On February 10, 2010, we acquired Opus Healthcare Solutions, Inc. (“Opus”), a provider of clinical information systems to the small hospital inpatient market. Founded in 1987 and headquartered in Austin, Texas, Opus delivers web-based clinical solutions to hospital systems and integrated health networks nationwide. This acquisition complements and will be integrated with the assets of Sphere. Both companies are established developers of software and practice management systemsservices for the inpatient market and will operate under the NextGen®3 product name. MajorCompany’s NextGen Division.
The NextGen Division’s major product categories ofinclude:
• NextGen ambulatory product suite that integrates as one system to streamline patient care with standardized, real-time clinical and administrative workflow through the practice, which consists of:
○ NextGen Electronic Health Records (“NextGenehr”) to ensure complete, accurate documentation to manage patient care electronically and to improve clinical processes and patient outcomes with electronic charting at the point of care; and
○ NextGen Enterprise Practice Management (“NextGenepm”) to automate business processes, from front-end scheduling to back-end collections and financial and administrative processes for increased performance and efficiencies.
• NextGen inpatient products that deliver secure, highly adaptable, and easy to use applications to patient centered hospitals and health systems, which consists of:
○ NextGen Clinicals, which resides on an advanced truly active web 2.0 platform — and is designed to initiate widespread work efficiency and communication, reduce errors andtime-to-chart, and improve care; and
○ NextGen Financials, which is a financial and administrative system that helps hospitals significantly improve the smart operations and financial and regulatory management of their facilities.
• NextGen Community Connectivity, which consists of:
○ NextGen Health Information Exchange (“HIE”), formerly Community Health Solution, to exchange patient data securely with community healthcare organizations;
○ NextGen Patient Portal (“NextMD.com”) to communicate with patients online and import information directly into NextGenehr; and
○ NextGen Health Quality Measures (“HQM”) to allow seamless quality measurement and reporting for practice and physician performance initiatives.
The NextGen suite include Electronic Medical Records (NextGenemr), Enterprise Practice Management (NextGenepm), Enterprise Appointment Scheduling (NextGeneas), Enterprise Master Patient Index (NextGenepi), NextGen Image Control System (NextGenics), Managed Care Server (NextGenmcs), Electronic Data Interchange, System Interfaces, Internet Operability (NextGenweb), a Patient-centric and Provider-centric Web Portal solution (NextMD4.com), NextGen Express, a version of NextGenemr designed for small practices and NextGen Community Health Solution (NextGenchs). NextGenDivision products utilize Microsoft Windows technology and can operate in a client-server environment as well as via private intranet, the Internet, or in an ASP environment.


5


Services provided by the NextGen Division include:
• EDI services that are intended to automate a number of manual, often paper-based or telephony intensive communications between patientsand/or providersand/or payors;
• Hosting services that allow practices seeking the benefits of IT automation but not the maintenance of in-house hardware and networking;
• NextGuard — Data Protection services that provide an off-site, data archiving, restoration, and disaster recovery preparedness solution for practices to protect clinical and financial data;
• Consulting services, such as data conversions or interface development, that allow practices to build custom add-on features; and
• Physician Resources services that allow practices to consult with the NextGen Division’s physician team.
Practice Solutions Division.  The Practice Solutions Division, with locations in St. Louis, Missouri and Hunt Valley, Maryland, focuses primarily on providing physician practices with RCM services, primarily billing and collection services for medical practices. This Division combines a web-delivered SaaS model and the NextGenepm software platform to execute its service offerings. We intend to transition our customer base onto the NextGen platform within the next two years. The Practice Solutions Division provides technology solutions and consulting services to cover the full spectrum of providers’ revenue cycle needs from patient access to claims denials.
Practice Solutions Division revenue growth in both fiscal years 2010 and 2009 was impacted by the acquisitions of HSI and PMP in May 2008 and October 2008, respectively.
On May 20, 2008, we acquired St. Louis-based HSI, a full-service healthcare RCM company. HSI operates under the umbrella of the Company’s Practice Solutions Division. Founded in 1996, HSI provides RCM services to providers including health systems, hospitals, and physicians in private practice with an in-house team of more than 200 employees, including specialists in medical billing, coding and compliance, payor credentialing, and information technology. We intend to cross sell both software and RCM services to the acquired customer base of HSI and the NextGen Division.
On October 28, 2008, we acquired Maryland-based PMP, a full-service healthcare RCM company. This acquisition is also part of our growth strategy for our Practice Solutions Division. Similar to HSI, PMP operates under the umbrella of the Company’s Practice Solutions Division. Founded in 2001, PMP provides physician billing and technology management services to healthcare providers, primarily in the Mid-Atlantic region. We intend to cross sell both software and RCM services to the acquired customer base of PMP and the NextGen Division.
The three Divisions operate largely as stand-alone operations, with each Division maintaining its own distinct product lines, product platforms, development, implementation and support teams, sales staffing and branding. The three Divisions share the resources of our “corporate office,” which includes a variety of accounting and other administrative functions. Additionally, there are a small but growing number of clients who are simultaneously utilizing software or services from more than one of our three Divisions.
We continue to pursue product and service enhancement initiatives within each division.Division. The majority of such expenditures are currently targeted to the NextGen Division product line and client base.

Inclusive of divisional EDI revenue,

Industry Background
The turbulence in the NextGen Division accounted for approximately 91.4% of our revenue for fiscal year 2008 comparedworldwide economy has impacted almost all industries. While healthcare is not immune to 89.4% in fiscal year 2007. Inclusive of divisional EDI revenue, the QSI Division accounted for 8.6% and 10.6% of revenue in fiscal year 2008 and 2007, respectively. The NextGen Division’s revenue grew at 21.3% and 35.5% in fiscal year 2008 and 2007, respectively, while the QSI Division’s revenue decreased by 3.3% and increased by 6.7% in fiscal year 2008 and 2007, respectively.

In addition to the aforementioned software solutions whicheconomic cycles, we offer through our two divisions, each division offers comprehensive hardware and software installation services, maintenance and support services, and system training services.

On May 20, 2008, the Company acquired Lackland Acquisition II, LLC dba Healthcare Strategic Initiatives (HSI). The acquisition resulted in HSI becoming a wholly owned subsidiary of QSI. We plan to operate HSI as a stand alone Company within the NextGen Division.


2 Microsoft Windows, Windows NT, Windows 95, Windows 98, Windows XP, and Windows 2000 are registered trademarksbelieve it is more resilient than most segments of the Microsoft Corporation.economy. The impact of the current economic conditions on our existing and prospective clients has been mixed. We continue to see organizations that are doing fairly well operationally; however, some organizations with a large dependency on Medicaid populations are being impacted by the challenging financial condition of the many state governments in whose jurisdictions they conduct business. A positive factor for U.S. healthcare is the fact that the Obama Administration is pursuing broad healthcare reform aimed at improving issues surrounding healthcare. The American Recovery and Reinvestment Act (“ARRA”), which became law on February 17, 2009, includes more than $20 billion to help healthcare

3 NextGen is a registered trademark
6


organizations modernize operations through the acquisition of NextGen Healthcare Information Systems, Inc.

4 NextMD is a registered trademarkhealth care information technology. While we are unsure of NextGen Healthcare Information Systems, Inc.


HSI is a full-service healthcare revenue management company servicing the revenue cycle management needs of physician groups and a variety of other healthcare clients. HSI has historically and primarily focused on assisting its clients in increasingimmediate impact from the accuracy and speed of client billing and collections activities.

Industry Background

ToARRA, the long-term potential could be significant.

Moreover, to compete in the continually changing healthcare environment, providers are increasingly using technology to help maximize the efficiency of their business practices, to assist in enhancing patient care, and to maintain the privacy of patient information.

As the reimbursement environment continues to evolve, more healthcare providers enter into contracts, often with multiple entities, which define the terms under which care is administered and paid for.paid. The diversity of payor organizations, as well as additional government regulation and changes in reimbursement models, have greatly increased the complexity of pricing, billing, reimbursement, and records management for medical and dental practices. To operate effectively, healthcare provider organizations must efficiently manage patient care and other information and workflow processes, which increasingly extend across multiple locations and business entities.

In response, healthcare provider organizations have placed increasing demands on their information systems. Initially, these information systems automated financial and administrative functions. As it became necessary to manage patient flow processes, the need arose to integrate “back-office” data with such clinical information as patient test results and office visits. We believe information systems must facilitate management of patient information incorporating administrative, financial and clinical information from multiple entities. In addition, large healthcare organizations increasingly require information systems that can deliver high performance in environments with multiple concurrent computer users.

Many existing healthcare information systems were designed for limited administrative tasks such as billing and scheduling and can neither accommodate multiple computing environments nor operate effectively across multiple locations and entities. We believe that practices that leverage technology to more efficiently handle patient clinical data as well as administrative, financial and other practice management data will be best able to enhance patient flow, pursue cost efficiencies, and improve quality of care. As healthcare organizations transition to new computer platforms and newer technologies, we believe such organizations will be migrating toward the implementation of enterprise-wide, patient-centric computing systems embedded with automated clinical patient records.

Our Strategy

Our strategy is, at present, to focus on providing software and services to medical practices, dental practices, hospitals, health centers, and dental practices.other healthcare providers. Among the key elements of this strategy are:

• 

Continued development and enhancement of select software solutions in target markets;

• 

Continued investments in our infrastructure including, but not limited to, product development, sales, marketing, implementation, and support;

• 

Continued efforts to make infrastructure investments within an overall context of maintaining reasonable expense discipline;

• 

Addition of new customers through maintaining and expanding sales, marketing and product development activities; and

• 

Expanding our relationship with existing customers through delivery of newadd-on and complementary products and services.

services; and
• Continuing our gold standard commitment of service in support of our customers.

While these are the key elements of our current strategy, there can be no guaranteesguarantee that our strategy will not change, or that we will succeed in achieving these goals individually or collectively.

Products and Services

In response to the growing need for more comprehensive, cost-effective healthcare information solutions for physician andmedical practices, dental practices, hospitals, health centers, and other healthcare providers, our systems and services provide our clients with the ability to redesign patient care and other workflow processes while improving


7


productivity through facilitation of managed access to patient information. Utilizing our proprietary software in combination with third party hardware and software solutions, our products enable the integration of a variety of administrative and clinical information operations. Leveraging more than 30 years of experience in the healthcare information services industry, we believe that we continue to add value by providing our clients with sophisticated, full-featured software systems along with


comprehensive systems implementation, maintenance and support services. Any single transaction may or may not include software, hardware or services.

NextGen Ambulatory Practice Management Systems.  Our products consist primarily of proprietary healthcare software applications together with third party hardware and other non-industry specific software. The systems range in capacity from one to thousands of users, allowing us to address the needs of both small and large organizations. The systems are modular in design and may be expanded to accommodate changing client requirements.

The QSI Division’s character-based practice management system is available We offer both standard licenses and SaaS arrangements in both dental and medical versions and primarily uses the IBM RS6000[5] central processing unit and IBM’S AIX[6] version of the UNIX operating system as a platform for our application software enabling a wide range of flexible and functional systems. The hardware components, as well as the requisite operating system licenses, are purchased from manufacturers or distributors of those components.

We configure and test the hardware components and incorporate our software and other third party packages into completed systems. We continually evaluate third party hardware components with a view toward utilizing hardware that is functional, reliable and cost-effective.

offerings; although to date, SaaS arrangements have represented less than 5% of our arrangements.

NextGen EPMepm is the NextGen division’sDivision’s practice management offering. NextGen EPMepm has been developed usingwith a functionally graphical user interface (GUI) client-server platform(“GUI”) certified for compatibilityuse with Windows 2000 Windows NT and Windows XP operating systemssystems. The product leverages a relational database (Microsoft SQL Server) with support on both 32 and relational databases64 bit enterprise servers. NextGenepm is a scalable, multi-module solution that are ANSI SQL-compliant. NextGen EPM is scalable and includes a master patient index, enterprise-wide appointment scheduling with referral tracking, clinical support, and centralized or decentralized patient financial management based on either a managed care orfee-for-service model. The system’s multi-tiered architecture allows work to be performed on the database server, the application server and the client workstation.

We also offer practice management solutions for both dental and medical practices through the Internet. These products are marketed under the QSINet and NextGen WEB trade names, respectively.

Clinical Systems. Our dental charting software system, the Clinical Product Suite (CPS),epm product is a comprehensivehighly configurable, cost-effective proven solution designed specifically forthat enables the dental group practice environment. CPS integrates the dental practiceeffective management product with a computer-based clinical information system that incorporates a wide range of clinical tools, including:

Electronic charting of dental procedures, treatment plans and existing conditions;

Periodontal charting via light-pen, voice-activation, or keyboard entry for full periodontal examinations and PSR scoring;

Digital imaging of X-ray and intra-oral camera images;

Computer-based patient education modules, viewable chair-side to enhance case presentation;

Full access to patient information, treatment plans, and insurance plans via a fully integrated interface with our dental practice management product; and

Document and image scanning for digital storage and linkage to the electronic patient record.

both single and multi-practice settings.

NextGen Ambulatory Clinical Systems.The result is a comprehensive clinical information management system that helps practices save time, reduce costs, improve case presentation, and enhance the delivery of dental services and quality of care. Clinical information is managed and maintained electronically thus forming an electronic patient record that allows for the implementation of the “chartless” office.

CPS incorporates Windows-based client-server technology consisting of one or more file servers together with any combination of one or more desktop, laptop, or pen-based PC workstations. The file server(s) used in connection with CPS utilize(s) a Windows NT or Windows 2000 or Windows XP operating system and the hardware is typically a Pentium[7]-based single or multi-processor platform. Based on the server configuration chosen, CPS is scalable from one to hundreds of workstations. A typical configuration may also include redundant disk storage, magnetic tape units, intra- and extra-oral cameras, digital X-ray components, digital scanners, conventional and flat screen displays, and printers. The hardware components, including the requisite operating system licenses, are purchased from third party manufacturers or distributors either directly by the customer or by us for resale to the customer.


5 RS6000 is a registered trademark of International Business Machines Corporation.

6 AIX is a registered trademark of International Business Machines Corporation.

7 Pentium is a registered trademark of Intel Corporation.

8 Microsoft and SQL Server is a registered trademark of Microsoft Corporation.

9 Oracle is a registered trademark of Oracle Corporation.


NextGen Division provides clinical software applications that are complementary to, and are integrated with, our medical practice management offerings and interface with many of the other leading practice management software systems on the market. The applications incorporated into our practice management solutions and others such as scheduling, eligibility, billing and claims processing are augmented by clinical information captured by NextGen EMR,ehr, including services rendered and diagnoses used for billing purposes. We believe that we currently provide a comprehensive information management solution for the medical marketplace.

NextGen EMRehr was developed with client-server architecture and a GUI and utilizes Microsoft Windows 2000, Windows NT or Windows XP on each workstation and either Windows 2000, Windows NT, Windows XP or UNIX on the database server. NextGen EMRehr maintains data using industry standard relational database engines such as Microsoft SQL Server[8] or Oracle[9].Oracle. The system is scalable from one to thousands of workstations.

NextGen EMRehr stores and maintains clinical data including:

• 

Data captured using user-customizable input “templates”;

• 

Scanned or electronically acquired images, including X-rays and photographs;

• 

Data electronically acquired through interfaces with clinical instruments or external systems;

• 

Other records, documents or notes, including electronically captured handwriting and annotations; and

• 

Digital voice recordings.

NextGen EMRehr also offers a workflow module, prescription management, automatic document and letter generation, patient education, referral tracking, interfaces to billing and lab systems, physician alerts and reminders, and powerful reporting and data analysis tools. NextGen Express is a version of NextGen EMRehr designed for small practices.
QSI Dental Division Practice Management and Clinical Systems.  In fiscal year 2010, we began selling a hosted SaaS practice management and clinical software solutions to the dental industry. The software solution is marketed primarily to the multi-location dental group practice market for which the Division has historically been a dominate player. This new software solution brings the QSI Dental Division to the forefront of the emergence of internet based applications and cloud computing and represents a significant growth opportunity for us to sell both to our existing customer base as well as new customers.


8


In addition to the SaaS practice management offering, the QSI Dental Division also sells a character-based practice management system using the IBM RS6000 central processing unit and IBM’S AIX version of the UNIX operating system platform. The hardware components, as well as the requisite operating system licenses, are purchased from manufacturers or distributors of those components. We configure and test the hardware components and incorporate our software and other third party packages into completed systems. We continually evaluate third party hardware components with a view toward utilizing hardware that is functional, reliable and cost-effective.
In addition to the SaaS clinical offering, our dental charting software system, the CPS is a comprehensive solution designed specifically for the dental group practice environment. CPS integrates the dental practice management product with a computer-based clinical information system that incorporates a wide range of clinical tools, including electronic charting of dental procedures, treatment plans and existing conditions, periodontal charting via light-pen, voice-activation, or keyboard entry for full periodontal examinations and PSR scoring, digital imaging of X-ray and intra-oral camera images, computer-based patient education modules, viewable chair-side to enhance case presentation, full access to patient information, treatment plans, and insurance plans via a fully integrated interface with our dental practice management product and document and image scanning for digital storage and linkage to the electronic patient record.
The result is a comprehensive clinical information management system that helps practices save time, reduce costs, improve case presentation, and enhance the delivery of dental services and quality of care. Clinical information is managed and maintained electronically thus forming an electronic patient record that allows for the implementation of the “chartless” office.
CPS incorporates Windows-based client-server technology consisting of one or more file servers together with any combination of one or more desktop, laptop, or pen-based PC workstations. The file server(s) used in connection with CPS utilize(s) Windows 2000 or Windows 2003 operating system and the hardware is typically an Intel-based single or multi-processor platform. Based on the server configuration chosen, CPS is scalable from one to hundreds of workstations. The hardware components, including the requisite operating system licenses, are purchased from third party manufacturers or distributors either directly by the customer or by us for resale to the customer.
NextGen Inpatient Solutions.  NextGen inpatient solutions includes both clinical and financial applications to provide value based solutions for even rural and community hospitals to improve patient safety, automate order entry, and facilitate real-time communication of patient information throughout the hospital. NextGen inpatient solutions are highly scalable, secure and easy to use with a Web 2.0 based clinical component that leverages full “cloud computing” capabilities.
Revenue Cycle Management Services.  Our Practice Solutions Division offers RCM services to physicians. Our RCM service automates and manages billing-related functions for physician practices to help manage reimbursement quickly and efficiently. RCM services generally include:
• Electronic claims submission service that submits Health Insurance Portability and Accountability Act of 1996 (“HIPAA”) compliant insurance claims electronically to insurance payers;
• Electronic remittance and payment posting service that uses NextGen Document Management system to link an image of each explanation of benefit (“EOB”) to the corresponding encounter at the time of payment posting to minimizes the need for storage of paper EOBs; and
• Accounts receivablefollow-up methodology that allows practices to establish parameters, adjustment rules and standards for account elevation.
Electronic Data Interchange.  We make available EDI capabilities and connectivity services to our customers. The EDI/connectivity capabilities encompass direct interfaces between our products and external third party systems, as well as transaction-based services. EDI products are intended to automate a number of manual, often paper-based or telephony intensive communications between patientsand/or providersand/or payors. Two of the more common EDI services are forwarding insurance claims electronically from providers to payors and assisting practices with issuing statements to patients. Most client practices utilize at least some of these services from us or one of our competitors. Other EDI/connectivity services are used more sporadically by client practices.


9


We typically compete to displace incumbent vendors for claims and statements accounts and attempt to increase usage of other elements in our EDI/connectivity product line. In general, EDI services are only sold to those accounts utilizing software from either the QSI Dental or NextGen Divisions. Services include:
• Electronic claims submission through our relationships with a number of payors and national claims clearinghouses;
• Electronic patient statement processing, appointment reminder cards and calls, recall cards, patient letters, and other correspondence;
• Electronic insurance eligibility verification; and
• Electronic posting of remittances from insurance carriers into the accounts receivable application.
Community Connectivity.The NextGen Division also markets NextGen® Community Health Solution (NextGen CHS). NextGen CHS facilitates HIE to facilitate cross-enterprise data sharing, enabling individual medical practices in a given community to selectively share critical data, such as demographics, referrals, medications lists, allergies, diagnoses, lab results, histories and more. This is accomplished through a secure, community-wide data repository that links health care providers, whether they have the NextGen®ehs Electronic Medical Record (NextGen® EMR) system, another compatible EMRelectronic medical records system, or no EMR,electronic medical records system, together with hospitals, payors, labs and other entities. The product is designed to facilitate a Regional Health Information Organization, or “RHIO.”Organization. The result is that for every health care encounter in the community, a patient-centric and complete record is accessible for the provider. The availability, currency and completeness of information plus the elimination of duplicate data entry can lead to significantly improved patient safety, enhanced decision making capabilities, time efficiencies and cost savings.

NextGen also markets revenue cycle management services through our Practice Solutions unit. This service provides billing services to solo and group practices.

Connectivity Services. We make available EDI capabilities and connectivity services to our customers. The EDI/connectivity capabilities encompass direct interfaces between our products and external third party systems, as well as transaction-based services. Services include:

Electronic claims submission through our relationships with a number of payors and national claims clearinghouses;

Electronic patient statement processing, appointment reminder cards and calls, recall cards, patient letters, and other correspondence;

Electronic insurance eligibility verification; and

Electronic posting of remittances from insurance carriers into the accounts receivable application.

Revenue Cycle Management Services Our Nextgen Practice Solutions unit offers revenue cycle management services to physicians. On May 20, 2008, we acquired HSI, a full-service healthcare revenue management company servicing the revenue cycle management needs of physician groups and a variety of other healthcare clients. HSI has historically and primarily focused on assisting its clients in increasing the accuracy and speed of client billing and collections activities.


Internet Applications. Our NextGen Division maintains an Internet-based patient health portal, NextMD®. NextMDNextMD.com. NextMD.com is a vertical portal for the healthcare industry, linking patients with their physicians, while providing a centralized source of health-oriented information for both consumers and medical professionals. Patients whose physicians are linked to the portal are able to request appointments, send appointment changes or cancellations, receive test results on-line, request prescription refills, viewand/or pay their statements, and communicate with their physicians, all in a secure, on-line environment. Our NextGen suite of information systems are or can be linked to NextMD,NextMD.com, integrating a number of these features with physicians’ existing systems.

Sales and Marketing

We sell and market our products nationwide primarily through a direct sales force. The efforts of the direct sales force are augmented by a small number of reseller relationships established by us. Software license sales to resellers represented less than 10% of total revenue for the years ended March 31, 2008, 20072010, 2009 and 2006.

2008.

Our direct sales force typically makes presentations to potential clients by demonstrating the system and our capabilities on the prospective client’s premises. Sales efforts aimed at smaller practices can be performed on the prospective clients’ premises, or remotely via telephone or Internet-based presentations. Our sales and marketing employees identify prospective clients through a variety of means, including referrals from existing clients, industry consultants, contacts at professional society meetings, trade shows and seminars, trade journal advertising, direct mail advertising, and telemarketing.

Our sales cycle can vary significantly and typically ranges from six to twenty fourtwenty-four months from initial contact to contract execution. Software licenses are normally delivered to a customer almost immediately upon receipt of an order. Implementation and training services are normally rendered based on a mutually agreed upon timetable. As part of the fees paid by our clients, we normally receive up-front licensing fees. Clients have the option to purchase maintenance services which, if purchased, are invoiced on a monthly, quarterly or annual basis.

Several clients have purchased our practice management software and, in turn, are providing either time-share or billing services to single and group practice practitioners. Under the timesharetime-share or billing service agreements, the client provides the use of our software for a fee to one or more practitioners. Although we typically do not receive a fee directly from the distributor’s customers, implementation of such arrangements has, from time to time, resulted in the purchase of additional software capacity by the distributor, as well as new software purchases made by the distributor’s customers should such customers decide to perform the practice management functions in-house.


10


We continue to concentrate our direct sales and marketing efforts on medical and dental practices, networks of such practices including MSO’sMSOs and PHO’s,PHOs, professional schools, community health centers and other ambulatory care settings.

MSO’s, PHO’s

MSOs, PHOs and similar networks to which we have sold systems provide use of our software to those group and single physician practices associated with the organization or hospital on either a service basis or by directing us to contract with those practices for the sale of stand-alone systems.

We have also entered into marketing assistance agreements with certain of our clients pursuant to which the clients allow us to demonstrate to potential clients the use of systems on the existing clients’ premises.

From time to time we assist prospective clients in identifying third party sources for financing the purchase of our systems. The financing is typically obtained by the client directly from institutional lenders and typically takes the form of a loan from the institution secured by the system to be purchased or a leasing arrangement. We do not guarantee the financing nor retain any continuing interest in the transaction.

We have numerous clients and do not believe that the loss of any single client would adversely affect us. No client accounted for ten percent10% or more of our net revenue during the fiscal years ended March 31, 2008, 2007,2010, 2009 or 2006. However, one client did represent approximately 12.5% of gross accounts receivable as of March 31, 2007.

2008.

Customer Service and Support

We believe our success is attributable in part to our customer service and support departments. We offer support to our clients seven days a week, 24 hours a day.

Our client support staff is comprised of specialists who are knowledgeable in the areas of software and hardware as well as in theday-to-day operations of a practice. System support activities range from correcting minor procedural problems in the client’s system to performing complex database reconstructions or software updates.

We utilize automated online support systems which assist clients in resolving minor problems and facilitate automated electronic retrieval of problems and symptoms following a client’s call to the automated support system. Additionally, our online support systems maintain call records, available at both the client’s facility and our offices.

We offer our clients support services for most system components, including hardware and software, for a fixed monthly, quarterly or annual fee. Customers also receive access to future unspecified versions of the software, on awhen-and-if available basis, as part of support services. We also subcontract, in certain instances, with third party vendors to perform specific hardware maintenance tasks.

Implementation and Training

We offer full service implementation and training services. When a client signs a contract for the purchase of a system that includes implementation and training services, a client manager/implementation specialist trained in medicaland/or dental group practice procedures is assigned to assist the client in the installation of the system and the training of appropriate practice staff. Implementation services include loading the software, training customer personnel, data conversion, running test data, and assisting in the development and documentation of procedures. Implementation and training services are provided by our employees as well as certified third parties and certain resellers.

Training may include a combination of computer assisted instruction, (CAI)or CAI, for certain of our products, remote training techniques and training classes conducted at the client’s or our office(s). CAI consists of workbooks, computer interaction and self-paced instruction. CAI is also offered to clients, for an additional charge, after the initial training program is completed for the purpose of training new and additional employees. Remote training allows a trainer at our offices to train one or more people at a client site via telephone and computer connection, thus allowing an interactive and client-specific mode of training without the expense and time required for travel. In addition, our on-line “help” and other documentation features facilitate client training as well as ongoing support.


11


In addition, NextGen E-learning“E-learning” is an on-line learning subscription service which allows end users to train on the software on the internet.E-learning allows end users to self manage their own learning with their personal learning path.path and pace. The service allows users to track the status of courses taken.

At present, our training facilities are located in (i) Horsham, Pennsylvania, (ii) Atlanta, Georgia, (iii) Dallas, Texas, and (iv) Irvine, California.

Competition

The markets for healthcare information systems and services are intensely competitive. The industry is highly fragmented and includes numerous competitors, none of which we believe dominates these markets. Our principal existing competitors in the healthcare information systems and services market include: eClinicalWorks, GE Healthcare (“GE”), Allscripts-Misys Healthcare Solutions, Inc. (“Allscripts”), EPIC and other competitors.
Our recent entry into the small hospital market has introduced new competitors, including Computer Programs and Systems, Inc., Healthland and Healthcare Management Systems, Inc.
The electronic patient records and connectivity markets, in particular, are subject to rapid changes in technology, and we expect that competition in these market segments will increase as new competitors enter the market. We believe our principal competitive advantages are the features and capabilities of our products and services, our high level of customer support, and our extensive experience in the industry.

The revenue cycle management market is also intensely competitive as other healthcare information systems companies, such as GE and Allscripts, are also in the market of selling both practice management and electronic health records software and medical billing and collection services.
Product Enhancement and Development

The healthcare information management and computer software and hardware industries are characterized by rapid technological change requiring us to engage in continuing investments to update, enhance, and improve our systems. During fiscal years 2008, 2007,2010, 2009 and 2006,2008, we expended approximately $17.4$24.5 million, $15.2$19.7 million, and $11.4$17.4 million, respectively, on research and development activities, including capitalized software amounts of $6.0$7.9 million, $5.0$5.9 million, and $3.3$6.0 million, respectively. In addition, a portion of our product enhancements have resulted from software development work performed under contracts with our clients.


OTHER INFORMATION
Employees

As of June 1, 2008,March 31, 2010, we employed 704approximately 1,502 persons, of which 6921,466 were full-time employees. We believe that our future success depends in part upon recruiting and retaining qualified sales, marketing and technical personnel as well as other employees.
Intellectual Property
To protect our intellectual property, we enter into confidentiality agreements and invention assignment agreements with our employees with whom such controls are relevant. Certain qualified employees enter into additional agreements that permit them access under certain circumstances, to software matters that are both confidential and more strictly controlled. In addition, we include intellectual property protective provisions in many of our customer contracts.
Available Information
Our Internet Web site address iswww.qsii.com. We make our periodic and current reports, together with amendments to these reports, available on our Internet Web site, free of charge, as soon as reasonably practicable after such material is electronically filed with, or furnished to, the Commission. You may access such filings under the “Investor Relations” button on our Web site. Members of the public may also read and copy any materials we file with, or furnish to, the Commission at the Commission’s Public Reference Room at 100 F Street, NE, Washington, DC 20549. To


12


obtain information on the operation of the Public Reference Room, please call the SEC at1-800-SEC-0330. The Commission maintains an Internet site atwww.sec.gov that contains the reports, proxy statements and other information that we file electronically with the Commission. The information on our Internet Web site is not incorporated by reference into this Report or any other report or information we file with the Commission.

ITEM 1A.

RISK FACTORS

The more prominent risks and uncertainties inherent in our business are described below. However, additional risks and uncertainties may also impair our business operations. If any of the following risks actually occur, our business, financial condition or results of operations will likely suffer. Any of these or other factors could harm our business and future results of operations and may cause you to lose all or part of your investment.

Risks Related to Our Business
The effects of the recent global economic crisis may impact our business, operating results or financial condition.  The recent global economic crisis has caused a general tightening in the credit markets, lower levels of liquidity, increases in the rates of default and bankruptcy, and extreme volatility in credit, equity and fixed income markets. These macroeconomic developments could negatively affect our business, operating results or financial condition in a number of ways. For example, current or potential customers may be unable to fund software purchases, which could cause them to delay, decrease or cancel purchases of our products and services or to not pay us or to delay paying us for previously purchased products and services. Our clients may cease business operations or conduct business on a greatly reduced basis. Finally, our investment portfolio, which includes auction rate securities, is generally subject to general credit, liquidity, counterparty, market and interest rate risks that may be exacerbated by the recent global financial crisis. If the banking system or the fixed income, credit or equity markets continue to deteriorate or remain volatile, our investment portfolio may be impacted and the values and liquidity of our investments could be adversely affected as well.
We face significant, evolving competition which, if we fail to properly address, could adversely affect our business, results of operations, financial condition and price of our stock.  The markets for healthcare information systems are intensely competitive, and we face significant competition from a number of different sources. Several of our competitors have significantly greater name recognition as well as substantially greater financial, technical, product development and marketing resources than we do. There has been significant merger and acquisition activity among a number of our competitors in recent years. Transaction induced pressures, or other related factors may result in price erosion or other negative market dynamics that could adversely affect our business, results of operations, financial condition and price of our stock.

We compete in all of our markets with other major healthcare related companies, information management companies, systems integrators, and other software developers. Competitive pressures and other factors, such as new product introductions by ourselvesus or our competitors, may result in price or market share erosion that could adversely affect our business, results of operations and financial condition. Also, there can be no assurance that our applications will achieve broad market acceptance or will successfully compete with other available software products.

Our inability to make initial sales of our systems to newly formed groupsand/or healthcare providers that are replacing or substantially modifying their healthcare information systems could adversely affect our business, results of operations and financial condition. If new systems sales do not materialize, our near term and longer term revenue will be adversely affected.

The unpredictabilityMany of our quarterly operating results may causecompetitors have greater resources than we do. In order to compete successfully, we must keep pace with our competitors in anticipating and responding to the price ofrapid changes involving the industry in which we operate, or our common stock to fluctuate or decline. Our revenue may fluctuate in the future from quarter to quarter and period to period, as a result of a number of factors including, without limitation:

the size and timing of orders from clients;

the specific mix of software, hardware, and services in client orders;

the length of sales cycles and installation processes;

the ability of our clients to obtain financing for the purchase of our products;

changes in pricing policies or price reductions by us or our competitors;

the timing of new product announcements and product introductions by us or our competitors;

changes in revenue recognition or other accounting guidelines employed by us and/or established by the Financial Accounting Standards Board or other rule-making bodies;

the availability and cost of system components;

the financial stability of clients;

market acceptance of new products, applications and product enhancements;

our ability to develop, introduce and market new products, applications and product enhancements;

our success in expanding our sales and marketing programs;

deferrals of client orders in anticipation of new products, applications, product enhancements, or public/private sector initiatives;

accounting policies concerning the timing of the recognition of revenue;

execution of or changes to our strategy;

personnel changes; and

general market/economic factors.

Our software products are generally shipped as orders are received and accordingly, we have historically operated with a minimal backlog of license fees. As a result, revenue in any quarter is dependent on orders booked and shipped in that quarter and is not predictable with any degree of certainty. Furthermore, our systems can be relatively large and expensive and


individual systems sales can represent a significant portion of our revenue and profits for a quarter such that the loss or deferral of even one such sale can adversely affect our quarterly revenue and profitability.

Clients often defer systems purchases until our quarter end, so quarterly results generally cannot be predicted and frequently are not known until after the quarter has concluded.

Our sales are dependent upon clients’ initial decisions to replace or substantially modify their existing information systems, and subsequently a decision as to which products and services to purchase. These are major decisions for healthcare providers, and accordingly, the sales cycle for our systems can vary significantly and typically ranges from six to twenty four months from initial contact to contract execution/shipment.

Because a significant percentage of our expenses are relatively fixed, a variation in the timing of systems sales, implementations, and installations can cause significant variations in operating results from quarter to quarter. As a result, we believe that interim period-to-period comparisons of ourbusiness, results of operations are not necessarily meaningful and should notfinancial condition may be relied upon as indicationsadversely affected.  The software market generally is characterized by rapid technological change, changing customer needs, frequent new product introductions, and evolving industry standards. The introduction of future performance. Further,products incorporating new technologies and the emergence of new industry standards could render our historical operating results are not necessarily indicative of future performance for any particular period.

We currently recognize revenue pursuant to Statement of Position (SOP) 97-2, as modified by SOP 98-9existing products obsolete and Staff Accounting Bulletin (SAB) 104. SAB 104 summarizes the staff’s views in applying generally accepted accounting principles to revenue recognition in financial statements.

unmarketable. There can be no assurance that applicationwe will be successful in developing and subsequent interpretationsmarketing new products that respond to technological changes or evolving industry standards. New product development depends upon significant research and development expenditures which depend ultimately upon sales growth. Any material shortfall in revenue or research


13


funding could impair our ability to respond to technological advances or opportunities in the marketplace and to remain competitive. If we are unable, for technological or other reasons, to develop and introduce new products in a timely manner in response to changing market conditions or customer requirements, our business, results of operations and financial condition may be adversely affected.
In response to increasing market demand, we are currently developing new generations of certain of our software products. There can be no assurance that we will successfully develop these pronouncements will not further modify our revenue recognition policies,new software products or that these products will operate successfully, or that any such modifications would notdevelopment, even if successful, will be completed concurrently with or prior to introduction of competing products. Any such failure or delay could adversely affect our operating results reportedcompetitive position or could make our current products obsolete.
We face riskand/or the possibility of claims from activities related to strategic partners, which could be expensive and time-consuming, divert personnel and other resources from our business and result in any particular quarter adverse publicity that could harm our business.  We rely on third parties to provide services that affect our business. For example, we use national clearinghouses in the processing of some insurance claims and we outsource some of our hardware maintenance services and the printing and delivery of patient statements for our customers. These third parties could raise their pricesand/or year.

be acquired by competitors of ours, which could potentially create short and long-term disruptions to our business negatively impacting our revenue, profitand/or stock price. We also have relationships with certain third parties where these third parties serve as sales channels through which we generate a portion of our revenue. Due to allthese third-party relationships, we could be subject to claims as a result of the foregoing factors, itactivities, products, or services of these third-party service providers even though we were not directly involved in the circumstances leading to those claims. Even if these claims do not result in liability to us, defending and investigating these claims could be expensive and time-consuming, divert personnel and other resources from our business and result in adverse publicity that could harm our business.

We may engage in future acquisitions, which may be expensive and time consuming and from which we may not realize anticipated benefits.  We may acquire additional businesses, technologies and products if we determine that these additional businesses, technologies and products are likely to serve our strategic goals. During fiscal year 2009, we acquired HSI and PMP, both of which are full-service healthcare RCM companies servicing physician groups and other healthcare clients. During fiscal year 2010, we acquired Opus and Sphere, both of which are developers of software and services for the inpatient market. The specific risks we may encounter in these types of transactions include but are not limited to the following:
• potentially dilutive issuances of our securities, the incurrence of debt and contingent liabilities and amortization expenses related to intangible assets, which could adversely affect our results of operations and financial condition;
• use of cash as acquisition currency may adversely affect interest or investment income, thereby potentially adversely affecting our earnings and /or earnings per share;
• difficulty in effectively integrating any acquired technologies or software products into our current products and technologies;
• difficulty in predicting and responding to issues related to product transition such as development, distribution and customer support;
• the possible adverse effect of such acquisitions on existing relationships with third party partners and suppliers of technologies and services;
• the possibility that staff or customers of the acquired company might not accept new ownership and may transition to different technologies or attempt to renegotiate contract terms or relationships, including maintenance or support agreements;
• the possibility that the due diligence process in any such acquisition may not completely identify material issues associated with product quality, product architecture, product development, intellectual property issues, key personnel issues or legal and financial contingencies, including any deficiencies in internal controls and procedures and the costs associated with remedying such deficiencies;


14


• difficulty in integrating acquired operations due to geographical distance, and language and cultural differences; and
• the possibility that acquired assets become impaired, requiring us to take a charge to earnings which could be significant.
A failure to successfully integrate acquired businesses or technology for any of these reasons could have an adverse effect on our financial condition and results of operations.
Our failure to manage growth could harm our business, results of operations and financial condition.  We have in the past experienced periods of growth which have placed, and may continue to place, a significant strain on our non-cash resources. We also anticipate expanding our overall software development, marketing, sales, client management and training capacity. In the event we are unable to identify, hire, train and retain qualified individuals in such capacities within a reasonable timeframe, such failure could have an adverse effect on us. In addition, our ability to manage future increases, if any, in the scope of our operations or personnel will depend on significant expansion of our research and development, marketing and sales, management, and administrative and financial capabilities. The failure of our management to effectively manage expansion in our business could have an adverse effect on our business, results of operations and financial condition.
Our operations are dependent upon our key personnel. If such personnel were to leave unexpectedly, we may not be able to execute our business plan.  Our future performance depends in significant part upon the continued service of our key technical and senior management personnel, many of whom have been with us for a significant period of time. These personnel have acquired specialized knowledge and skills with respect to our business. We maintain key man life insurance on only one of our employees. Because we have a relatively small number of employees when compared to other leading companies in our industry, our dependence on maintaining our relationships with key employees is possibleparticularly significant. We are also dependent on our ability to attract high quality personnel, particularly in the areas of sales and applications development.
The industry in which we operate is characterized by a high level of employee mobility and aggressive recruiting of skilled personnel. There can be no assurance that our operatingcurrent employees will continue to work for us. Loss of services of key employees could have an adverse effect on our business, results of operations and financial condition. Furthermore, we may need to grant additional equity incentives to key employees and provide other forms of incentive compensation to attract and retain such key personnel. Equity incentives may be belowdilutive to our per share financial performance. Failure to provide such types of incentive compensation could jeopardize our recruitment and retention capabilities.
Continuing worldwide political and economic uncertainties may adversely affect our revenue and profitability.  The last several years have been periodically marked by concerns including but not limited to inflation, decreased consumer confidence, the expectationslingering effects of public market analystsinternational conflicts, energy costs and investors. In such event, the price ofterrorist and military activities. These conditions can make it extremely difficult for our common stock would likely be adversely affected.

customers, our vendors and us to accurately forecast and plan future business activities, and they could cause constrained spending on our products and services,and/or delay and lengthen sales cycles.

The failure of auction rate securities to sell at their reset dates could impact the liquidity of the investment and could negatively impact the carrying value of the investment. The Company’s  Our investments includesinclude auction rate securities. Auction rate securities (“ARS”). ARS are securities that are structured with short-term interest rate reset dates of generally less than ninety days but with longer contractual maturities that range, for our holdings, from nine to 28 years. At the end of each reset period, investors can typically sell at auction or continue to hold the securities at par. These securities are subject to fluctuations in interest rate depending on the supply and demand at each auction. Through March 31, 2008, auctions held for the Company’s auction rate securities with a total aggregate value of approximately $23.0 million failed. As of March 31, 2008, the Company was2010, we were holding a total of approximately $22.6$7.2 million, net of unrealized loss, in auction rate securities.ARS. The Company’s ARS are held by UBS Financial Services Inc. (“UBS”). On November 13, 2008, the Company entered into an Auction Rate Security Rights Agreement (the “Rights Agreement”) with UBS, whereby the Company accepted UBS’s offer to purchase the Company’s ARS investments at any time during the period of June 30, 2010 through July 2, 2012. As a result, the Company had obtained an asset, ARS put option rights, whereby the Company has a right to “put” the ARS back to UBS. The Company expects to exercise its ARS put option rights and put its ARS back to UBS on June 30, 2010, the earliest date allowable under the Rights Agreement. While we believe that UBS has the ability to honor the terms of its


15


agreement to purchase the ARS investments from the Company at par, the failure of UBS to purchase these investments would result in the Company being unable to liquidate these securities in the near future. While these debt securities are all highly-rated investments, generally with AAA/Aaa ratings, continued failure to sell at their reset dates could impact the liquidity of the investment which in turn could negatively impact theour liquidity of the Company. In addition, continued failureposition.
Risks Related to sell at their reset dates could also negatively impact the carrying value of the investment which resulted in temporary impairment losses in the current periodOur Products and could lead to permanent impairment charges in future periods should a decline in the value of those securities be other than temporary, which could have a material adverse effect on our financial position and results of operations.Service

Our common stock price has been volatile, which could result in substantial losses for investors purchasing shares of our common stock and in litigation against us. Volatility may be caused by a number of factors including but not limited to:

actual or anticipated quarterly variations in operating results;

rumors about our performance, software solutions, or merger and acquisition activity;

changes in expectations of future financial performance or changes in estimates of securities analysts;

governmental regulatory action;

health care reform measures;

client relationship developments;

purchases or sales of company stock;

activities by one or more of our major shareholders concerning our policies and operations;

changes occurring in the markets in general; and

other factors, many of which are beyond our control.


Furthermore, the stock market in general, and the market for software, healthcare and high technology companies in particular, has experienced extreme volatility that often has been unrelated to the operating performance of particular companies. These broad market and industry fluctuations may adversely affect the trading price of our common stock, regardless of actual operating performance.

Moreover, in the past, securities class action litigation has often been brought against a company following periods of volatility in the market price of its securities. We may in the future be the target of similar litigation. Securities litigation could result in substantial costs and divert management’s attention and resources.

Two of our directors are significant shareholders, which makes it possible for them to have significant influence over the outcome of all matters submitted to our shareholders for approval and which influence may be alleged to conflict with our interests and the interests of our other shareholders. Two of our directors and principal shareholders beneficially owned an aggregate of approximately 36% of the outstanding shares of our common stock at March 31, 2008. Our Bylaws permit our shareholders to cumulate their votes, the effect of which is to provide shareholders with sufficiently large concentrations of our shares the opportunity to assure themselves one or more seats on our Board. The amounts required to assure a Board position can vary based upon the number of shares outstanding, the number of shares voting, the number of directors to be elected, the number of “broker non-votes”, and the number of shares held by the shareholder exercising cumulative voting rights. In the event that cumulative voting is invoked, it is likely that the two of our directors holding an aggregate of approximately 36% of the outstanding shares of our common stock at March 31, 2008 will each have sufficient votes to assure themselves of one or more seats on our Board. With or without cumulative voting, these shareholders will have significant influence over the outcome of all matters submitted to our shareholders for approval, including the election of our directors and other corporate actions. In addition, such influence by one or both of these affiliates could have the effect of discouraging others from attempting to purchase us, take us over, and/or reducing the market price offered for our common stock in such an event.

If our principal products and our new product development fail to meet the needs of our clients, we may fail to realize future growth.  We currently derive substantially all of our net revenue from sales of our healthcare information systems and related services. We believe that a primary factor in the market acceptance of our systems has been our ability to meet the needs of users of healthcare information systems. Our future financial performance will depend in large part on our ability to continue to meet the increasingly sophisticated needs of our clients through the timely development and successful introduction and implementation of new and enhanced versions of our systems and other complementary products. We have historically expended a significant percentage of our net revenue on product development and believe that significant continuing product development efforts will be required to sustain our growth. Continued investment in our sales staff and our client implementation and support staffs will also be required to support future growth.

There can be no assurance that we will be successful in our product development efforts, that the market will continue to accept our existing products, or that new products or product enhancements will be developed and implemented in a timely manner, meet the requirements of healthcare providers, or achieve market acceptance. If new products or product enhancements do not achieve market acceptance, our business, results of operations and financial condition could be adversely affected. At certain times in the past, we have also experienced delays in purchases of our products by clients anticipating our launch, or the launch of our competitors, of new products. There can be no assurance that material order deferrals in anticipation of new product introductions from ourselves or other entities will not occur.

If the emerging technologies and platforms of Microsoft and others upon which we build our products do not gain or continue to maintain broad market acceptance, or if we fail to develop and introduce in a timely manner new products and services compatible with such emerging technologies, we may not be able to compete effectively and our ability to generate revenue will suffer.Our software products are built and depend upon several underlying and evolving relational database management system platforms such as those developed by Microsoft. To date, the standards and technologies upon which we have chosen to develop our products have proven to have gained industry acceptance. However, the market for our software products is subject to ongoing rapid technological developments, quickly evolving industry standards and rapid changes in customer requirements, and there may be existing or future technologies and platforms that achieve industry standard status, which are not compatible with our products.

We face the possibility of subscription pricing, which may force us to adjust our sales, marketing and pricing strategies.  In April, 2009 we announced a new subscription based, Software as a service delivery model which includes monthly subscription pricing. This model is designed for smaller practices to quickly access the NextGenehr or NextGenepm products at a modest monthly per provider price. We currently derive substantially all of our systems revenue


from traditional software license, implementation and training fees, as well as the resale of computer hardware. Today, the majority of our customers pay an initial license fee for the use of our products, in addition to a periodic maintenance fee. While the intent of the new subscription based delivery model is to further penetrate the smaller practice market, there can be no assurance that this delivery model will not become increasingly popular with both small and large customers. If the marketplace increasingly demands subscription pricing, we may be forced to further adjust our sales, marketing and pricing strategies accordingly, by offering a higher percentage of our products and services through these means. Shifting to a significantly greater degree of subscription pricing could adversely affect our financial condition, cash flows and quarterly and annual revenue and results of operations, as our revenue would initially decrease substantially. There can be no assurance that the marketplace will not increasingly embrace subscription pricing.

Many of our competitors have greater resources than we do. In order to compete successfully, we must keep pace with our competitors in anticipating and responding to the rapid changes involving the industry in which we operate, or our business, results of operations and financial condition may be adversely affected. The software market generally is characterized by rapid technological change, changing customer needs, frequent new product introductions, and evolving industry standards. The introduction of products incorporating new technologies and the emergence of new industry standards could render our existing products obsolete and unmarketable. There can be no assurance that we will be successful in developing and marketing new products that respond to technological changes or evolving industry standards. New product development depends upon significant research and development expenditures which depend ultimately upon sales growth. Any material shortfall in revenue or research funding could impair our ability to respond to technological advances or opportunities in the marketplace and to remain competitive. If we are unable, for technological or other reasons, to develop and introduce new products in a timely manner in response to changing market conditions or customer requirements, our business, results of operations and financial condition may be adversely affected.

In response to increasing market demand, we are currently developing new generations of certain of our software products. There can be no assurance that we will successfully develop these new software products or that these products will operate successfully, or that any such development, even if successful, will be completed concurrently with or prior to introduction of competing products. Any such failure or delay could adversely affect our competitive position or could make our current products obsolete.

We face risk and/or the possibility of claims from activities related to strategic partners, which could be expensive and time-consuming, divert personnel and other resources from our business and result in adverse publicity that could harm our business. We rely on third parties to provide services that affect our business. For example, we use national clearinghouses in the processing of some insurance claims and we outsource some of our hardware maintenance services and the printing and delivery of patient statements for our customers. These third parties could raise their prices and/or be acquired by competitors of our which could potentially create short and long-term disruptions to our business negatively impacting our revenue, profit and/or stock price. We also have relationships with certain third parties where these third parties serve as sales channels through which we generate a portion of our revenue. Due to these third-party relationships, we could be subject to claims as a result of the activities, products, or services of these third-party service providers even though we were not directly involved in the circumstances leading to those claims. Even if these claims do not result in liability to us, defending and investigating these claims could be expensive and time-consuming, divert personnel and other resources from our business and result in adverse publicity that could harm our business.

We face the possibility of claims based upon our website,Web site content, which may cause us expense and management distraction.distraction.  We could be subject to third party claims based on the nature and content of information supplied on our websiteWeb site by us or third parties, including content providers or users. We could also be subject to


16


liability for content that may be accessible through our websiteWeb site or third party websitesWeb sites linked from our websiteWeb site or through content and information that may be posted by users in chat rooms, bulletin boards or on websitesWeb sites created by professionals using our applications. Even if these claims do not result in liability to us, investigating and defending against these claims could be expensive and time consuming and could divert management’s attention away from our operations.

We may engage in future acquisitions, whichIf our security measures are breached or fail, and unauthorized access is obtained to a client’s data, our services may be expensiveperceived as not being secure, clients may curtail or stop using our services, and time consumingwe may incur significant liabilities.  Our services involve the storage and transmission of clients’ proprietary information and protected health information of patients. Because of the sensitivity of this information, security features of our software are very important. If our security measures are breached or fail as a result of third-party action, employee error, malfeasance, insufficiency, defective design, or otherwise, someone may be able to obtain unauthorized access to client or patient data. As a result, our reputation could be damaged, our business may suffer, and we could face damages for contract breach, penalties for violation of applicable laws or regulations, and significant costs for remediation and remediation efforts to prevent future occurrences. We rely upon our clients as users of our system for key activities to promote security of the system and the data within it, such as administration of client-side access credentialing and control of client-side display of data. On occasion, our clients have failed to perform these activities. Failure of clients to perform these activities may result in claims against us that this reliance was misplaced, which could expose us to significant expense and harm to our reputation. Because techniques used to obtain unauthorized access or to sabotage systems change frequently and generally are not recognized until launched against a target, we may be unable to anticipate these techniques or to implement adequate preventive measures. If an actual or perceived breach of our security occurs, the market perception of the effectiveness of our security measures could be harmed and we could lose sales and clients. In addition, our clients may authorize or enable third parties to access their client data or the data of their patients on our systems. Because we do not control such access, we cannot ensure the complete propriety of that access or integrity or security of such data in our systems.
Failure by our clients to obtain proper permissions and waivers may result in claims against us or may limit or prevent our use of data, which could harm our business.  We require our clients to provide necessary notices and to obtain necessary permissions and waivers for use and disclosure of the information that we receive, and we require contractual assurances from them that they have done so and will do so. If they do not obtain necessary permissions and waivers, then our use and disclosure of information that we receive from them or on their behalf may be limited or prohibited by state or federal privacy laws or other laws. This could impair our functions, processes, and databases that reflect, contain, or are based upon such data and may prevent use of such data. In addition, this could interfere with or prevent creation or use of rules, and analyses or limit other data-driven activities that benefit us. Moreover, we may be subject to claims or liability for use or disclosure of information by reason of lack of valid notice, permission, or waiver. These claims or liabilities could subject us to unexpected costs and adversely affect our operating results.
We face the possibility of damages resulting from internal and external security breaches, and viruses.  In the course of our business operations, we compile and transmit confidential information, including patient health information, in our processing centers and other facilities. A breach of security in any of these facilities could damage our reputation and result in damages being assessed against us. In addition, the other systems with which we may not realize anticipated benefits.interface, such as the Internet and related systems may be vulnerable to security breaches, viruses, programming errors, or similar disruptive problems. The effect of these security breaches and related issues could disrupt our ability to perform certain key business functions and could potentially reduce demand for our services. Accordingly, we have expended significant resources toward establishing and enhancing the security of our related infrastructures, although no assurance can be given that they will be entirely free from potential breach. Maintaining and enhancing our infrastructure security may require us to expend significant capital in the future.
The success of our strategy to offer our EDI services and Internet solutions depends on the confidence of our customers in our ability to securely transmit confidential information. Our EDI services and Internet solutions rely on encryption, authentication and other security technology licensed from third parties to achieve secure transmission of confidential information. We may acquire additional businesses, technologiesnot be able to stop unauthorized attempts to gain access to or disrupt the transmission of communications by our customers. Anyone who is able to circumvent our security measures could misappropriate confidential user information or interrupt our, or our customers’, operations. In addition, our EDI and products if we determine that these additional businesses, technologiesInternet solutions may be vulnerable to viruses, physical or electronic break-ins, and productssimilar disruptions.


17


Any failure to provide secure infrastructureand/or electronic communication services could result in a lack of trust by our customers causing them to seek out other vendors, and/or, damage our reputation in the market, making it difficult to obtain new customers.
We are likely to serve our strategic goals. On May 20, 2008, we acquired Lackland Acquisition II, LLC dba Healthcare Strategic Initiatives (HSI), a full-service healthcare revenue management company servicing healthcare clients. The specific risks we may encounter in these types of transactions include but are not limitedsubject to the following:


potentially dilutive issuances of our securities, the incurrence of debt and contingent liabilities and amortization expenses related to intangible assets, which could adversely affect our results of operations and financial conditions;

use of cash as acquisition currency may adversely affect interest or investment income, thereby potentially adversely affecting our earnings and /or earnings per share;

difficulty in effectively integrating any acquired technologies or software products into our current products and technologies;

difficulty in predicting and responding to issues related to product transition such as development, distribution and customer support;

the possible adverse effect of such acquisitions on existing relationships with third party partners and suppliers of technologies and services;

the possibility that staff or customers of the acquired company might not accept new ownership and may transition to different technologies or attempt to renegotiate contract terms or relationships, including maintenance or support agreements;

the possibility that the due diligence process in any such acquisition may not completely identify material issues associated with product quality, product architecture, product development, intellectual property issues, key personnel issues or legal and financial contingencies, including any deficiencies in internal controls and procedures and the costs associated with remedying such deficiencies;

difficulty in integrating acquired operations due to geographical distance, and language and cultural differences; and

the possibility that acquired assets become impaired, requiring us to take a charge to earnings which could be significant.

A failuredevelopment and maintenance of the Internet infrastructure, which is not within our control, and which may diminish Internet usage and availability as well as access to successfully integrate acquired businessesour Web site.  We deliver Internet-based services and, accordingly, we are dependent on the maintenance of the Internet by third parties. The Internet infrastructure may be unable to support the demands placed on it and our performance may decrease if the Internet continues to experience its historic trend of expanding usage. As a result of damage to portions of its infrastructure, the Internet has experienced a variety of performance problems which may continue into the foreseeable future. Such Internet related problems may diminish Internet usage and availability of the Internet to us for transmittal of our Internet-based services. In addition, difficulties, outages, and delays by Internet service providers, online service providers and other Web site operators may obstruct or technology for anydiminish access to our Web site by our customers resulting in a loss of these reasonspotential or existing users of our services.

Our products may be subject to product liability legal claims, which could have an adverse effect on our business, results of operations.operations and financial condition.  Certain of our products provide applications that relate to patient clinical information. Any failure by our products to provide accurate and timely information concerning patients, their medication, treatment, and health status, generally, could result in claims against us which could materially and adversely impact our financial performance, industry reputation and ability to market new system sales. In addition, a court or government agency may take the position that our delivery of health information directly, including through licensed practitioners, or delivery of information by a third party site that a consumer accesses through our Web sites, exposes us to assertions of malpractice, other personal injury liability, or other liability for wrongful delivery/handling of healthcare services or erroneous health information. We maintain insurance to protect against claims associated with the use of our products as well as liability limitation language in our end-user license agreements, but there can be no assurance that our insurance coverage or contractual language would adequately cover any claim asserted against us. A successful claim brought against us in excess of or outside of our insurance coverage could have an adverse effect on our business, results of operations and financial condition. Even unsuccessful claims could result in our expenditure of funds for litigation and management time and resources.
Certain healthcare professionals who use our Internet-based products will directly enter health information about their patients including information that constitutes a record under applicable law that we may store on our computer systems. Numerous federal and state laws and regulations, the common law, and contractual obligations, govern collection, dissemination, use and confidentiality of patient-identifiable health information, including:
• state and federal privacy and confidentiality laws;
• our contracts with customers and partners;
• state laws regulating healthcare professionals;
• Medicaid laws;
• the HIPAA and related rules proposed by the Health Care Financing Administration; and
• Health Care Financing Administration standards for Internet transmission of health data.
HIPAA establishes elements including, but not limited to, federal privacy and security standards for the use and protection of Protected Health Information. Any failure by us or by our personnel or partners to comply with applicable requirements may result in a material liability to us.
Although we have systems and policies in place for safeguarding Protected Health Information from unauthorized disclosure, these systems and policies may not preclude claims against us for alleged violations of applicable requirements. Also, third party sitesand/or links that consumers may access through our web sites may not maintain adequate systems to safeguard this information, or may circumvent systems and policies we have put in place. In addition, future laws or changes in current laws may necessitate costly adaptations to our policies, procedures, or systems.


18


There can be no assurance that we will not be subject to product liability claims, that such claims will not result in liability in excess of our insurance coverage, that our insurance will cover such claims or that appropriate insurance will continue to be available to us in the future at commercially reasonable rates. Such product liability claims could adversely affect our business, results of operations and financial condition.
We are subject to the effect of payor and provider conduct which we cannot control and accordingly, there is no assurance that revenue for our services will continue at historic levels.  We offer certain electronic claims submission products and services as part of our product line. While we have implemented certain product features designed to maximize the accuracy and completeness of claims submissions, these features may not be sufficient to prevent inaccurate claims data from being submitted to payors. Should inaccurate claims data be submitted to payors, we may be subject to liability claims.
Electronic data transmission services are offered by certain payors to healthcare providers that establish a direct link between the provider and payor. This process reduces revenue to third party EDI service providers such as us. As a result of this, or other market factors, we are unable to ensure that we will continue to generate revenue at or in excess of prior levels for such services.
A significant increase in the utilization of direct links between healthcare providers and payors could adversely affect our transaction volume and financial results. In addition, we cannot provide assurance that we will be able to maintain our existing links to payors or develop new connections on terms that are economically satisfactory to us, if at all.
Risks Related to Regulation
We face increasing involvement of the federal government in our industry, which may give rise to uncertain and unwarranted expectations concerning the benefits we are to receive from government funding and programs.  In February 2009, President Obama signed the American Recovery and Reinvestment Act (“ARRA”), which allocates over $20 billion dollars to healthcare IT over the next several years. The provision of the legislation that addresses health information technology specifically is known as the Health Information Technology for Economic and Clinical Health Act (“HITECH Act”). Under the provisions of HITECH Act, the ARRA includes significant financial incentives to healthcare providers who can demonstrate meaningful use of certified EHR technology beginning in 2011. While the Company expects the ARRA to create significant opportunities for sales of NextGenehr over the next several years, we are unsure of the immediate impact from the ARRA and the long-term potential could be significant.
We face the risks and uncertainties that are associated with litigation against us, which may adversely impact our marketing, distract management and have a negative impact upon our business, results of operations and financial condition.We face the risks associated with litigation concerning the operation of our business. The uncertainty associated with substantial unresolved litigation may have an adverse effect on our business. In particular, such litigation could impair our relationships with existing customers and our ability to obtain new customers. Defending such litigation may result in a diversion of management’s time and attention away from business operations, which could have an adverse effect on our business, results of operations and financial condition. Such litigation may also have the effect of discouraging potential acquirers from bidding for us or reducing the consideration such acquirers would otherwise be willing to pay in connection with an acquisition.

There can be no assurance that such litigation will not result in liability in excess of our insurance coverage, that our insurance will cover such claims or that appropriate insurance will continue to be available to us in the future at commercially reasonable rates.

Because we believe that proprietary rights are material to our success, misappropriation of these rights could adversely affect our financial condition.  We are heavily dependent on the maintenance and protection of our intellectual property and we rely largely on license agreements, confidentiality procedures, and employee nondisclosure agreements to protect our intellectual property. Our software is not patented and existing copyright laws offer only limited practical protection.

There can be no assurance that the legal protections and precautions we take will be adequate to prevent misappropriation of our technology or that competitors will not independently develop technologies equivalent or


19


superior to ours. Further, the laws of some foreign countries do not protect our proprietary rights to as great an extent as do the laws of the United States and are often not enforced as vigorously as those in the United States.

We do not believe that our operations or products infringe on the intellectual property rights of others. However, there can be no assurance that others will not assert infringement or trade secret claims against us with respect to our current or future products or that any such assertion will not require us to enter into a license agreement or royalty arrangement or other financial arrangement with the party asserting the claim. Responding to and defending any such claims may distract the attention of our management and adversely affect our business, results of operations and financial condition. In addition, claims may be brought against third parties from which we purchase software, and such claims could adversely affect our ability to access third party software for our systems.


If we are deemed to infringe on the proprietary rights of third parties,we could incur unanticipated expense and be prevented from providing ourproducts and services.  We are and may continue to be subject to intellectual property infringement claims as the number of our competitors grows and our applications’ functionality is viewed as similar or overlapping with competitive products. We do not believe that we have infringed or are infringing on any proprietary rights of third parties. However, claims are occasionally asserted against us, and we cannot assure you that infringement claims will not be asserted against us in the future. Also, we cannot assure you that any such claims will be unsuccessful. We could incur substantial costs and diversion of management resources defending any infringement claims  even if we are ultimately successful in the defense of such matters. Furthermore, a party making a claim against us could secure a judgment awarding substantial damages, as well as injunctive or other equitable relief that could effectively block our ability to provide products or services. In addition, we cannot assure you that licenses for any intellectual property of third parties that might be required for our products or services will be available on commercially reasonable terms, or at all.

We are dependent on our license rights and other services from third parties, which may cause us to discontinue, delay or reduce product shipments.shipments.  We depend upon licenses for some of the technology used in our products as well as other services from third-party vendors. Most of these arrangements can be continued/renewed only by mutual consent and may be terminated for any number of reasons. We may not be able to continue using the products or services made available to us under these arrangements on commercially reasonable terms or at all. As a result, we may have to discontinue, delay or reduce product shipments or services provided until we can obtain equivalent technology or services. Most of our third-party licenses are non-exclusive. Our competitors may obtain the right to use any of the business elements covered by these arrangements and use these elements to compete directly with us. In addition, if our vendors choose to discontinue providing their technology or services in the future or are unsuccessful in their continued research and development efforts, we may not be able to modify or adapt our own products.

We face the possibility of damages resulting from internal and external security breaches, and viruses. In the course of our business operations, we compile and transmit confidential information, including patient health information, in our processing centers and other facilities. A breach of security in any of these facilities could damage our reputation and result in damages being assessed against us. In addition, the other systems with which we may interface, such as the Internet and related systems may be vulnerable to security breaches, viruses, programming errors, or similar disruptive problems. The effect of these security breaches and related issues could disrupt our ability to perform certain key business functions and could potentially reduce demand for our services. Accordingly, we have expended significant resources toward establishing and enhancing the security of our related infrastructures, although no assurance can be given that they will be entirely free from potential breach. Maintaining and enhancing our infrastructure security may require us to expend significant capital in the future.

The success of our strategy to offer our EDI services and Internet solutions depends on the confidence of our customers in our ability to securely transmit confidential information. Our EDI services and Internet solutions rely on encryption, authentication and other security technology licensed from third parties to achieve secure transmission of confidential information. We may not be able to stop unauthorized attempts to gain access to or disrupt the transmission of communications by our customers. Anyone who is able to circumvent our security measures could misappropriate confidential user information or interrupt our, or our customers’ operations. In addition, our EDI and Internet solutions may be vulnerable to viruses, physical or electronic break-ins, and similar disruptions.

Any failure to provide secure infrastructure and/or electronic communication services could result in a lack of trust by our customers causing them to seek out other vendors, and/or, damage our reputation in the market making it difficult to obtain new customers.

We are subject to the development and maintenance of the Internet infrastructure, which is not within our control, and which may diminish Internet usage and availability as well as access to our website. We deliver Internet-based services and, accordingly, we are dependent on the maintenance of the Internet by third parties. The Internet infrastructure may be unable to support the demands placed on it and our performance may decrease if the Internet continues to experience it’s historic trend of expanding usage. As a result of damage to portions of its infrastructure, the Internet has experienced a variety of performance problems which may continue into the foreseeable future. Such Internet related problems may diminish Internet usage and availability of the Internet to us for transmittal of our Internet-based services. In addition, difficulties, outages, and delays by Internet service providers, online service providers and


other website operators may obstruct or diminish access to our website by our customers resulting in a loss of potential or existing users of our services.

Our failure to manage growth could harm our business, results of operations and financial condition. We have in the past experienced periods of growth which have placed, and may continue to place, a significant strain on our non-cash resources. We also anticipate expanding our overall software development, marketing, sales, client management and training capacity. In the event we are unable to identify, hire, train and retain qualified individuals in such capacities within a reasonable timeframe, such failure could have an adverse effect on us. In addition, our ability to manage future increases, if any, in the scope of our operations or personnel will depend on significant expansion of our research and development, marketing and sales, management, and administrative and financial capabilities. The failure of our management to effectively manage expansion in our business could have an adverse effect on our business, results of operations and financial condition.

Our operations are dependent upon our key personnel. If such personnel were to leave unexpectedly, we may not be able to execute our business plan. Our future performance depends in significant part upon the continued service of our key technical and senior management personnel, many of whom have been with us for a significant period of time. These personnel have acquired specialized knowledge and skills with respect to our business. We maintain key man life insurance on only one of our employees. Because we have a relatively small number of employees when compared to other leading companies in our industry, our dependence on maintaining our relationships with key employees is particularly significant. We are also dependent on our ability to attract high quality personnel, particularly in the areas of sales and applications development.

The industry in which we operate is characterized by a high level of employee mobility and aggressive recruiting of skilled personnel. There can be no assurance that our current employees will continue to work for us. Loss of services of key employees could have an adverse effect on our business, results of operations and financial condition. Furthermore, we may need to grant additional equity incentives to key employees and provide other forms of incentive compensation to attract and retain such key personnel. Failure to provide such types of incentive compensation could jeopardize our recruitment and retention capabilities.

Our products may be subject to product liability legal claims, which could have an adverse effect on our business, results of operations and financial condition. Certain of our products provide applications that relate to patient clinical information. Any failure by our products to provide accurate and timely information could result in claims against us. In addition, a court or government agency may take the position that our delivery of health information directly, including through licensed practitioners, or delivery of information by a third party site that a consumer accesses through our Web sites, exposes us to assertions of malpractice, other personal injury liability, or other liability for wrongful delivery/handling of healthcare services or erroneous health information. We maintain insurance to protect against claims associated with the use of our products as well as liability limitation language in our end-user license agreements, but there can be no assurance that our insurance coverage or contractual language would adequately cover any claim asserted against us. A successful claim brought against us in excess of or outside of our insurance coverage could have an adverse effect on our business, results of operations and financial condition. Even unsuccessful claims could result in our expenditure of funds for litigation and management time and resources.

Certain healthcare professionals who use our Internet-based products will directly enter health information about their patients including information that constitutes a record under applicable law that we may store on our computer systems. Numerous federal and state laws and regulations, the common law, and contractual obligations, govern collection, dissemination, use and confidentiality of patient-identifiable health information, including:

state and federal privacy and confidentiality laws;

our contracts with customers and partners;

state laws regulating healthcare professionals;

Medicaid laws;

the Health Insurance Portability and Accountability Act of 1996 (HIPAA) and related rules proposed by the Health Care Financing Administration; and

Health Care Financing Administration standards for Internet transmission of health data.

The Health Insurance Portability and Accountability Act of 1996 establishes elements including, but not limited to, federal privacy and security standards for the use and protection of Protected Health Information. Any failure by us or by our personnel or partners to comply with applicable requirements may result in a material liability to us.


Although we have systems and policies in place for safeguarding Protected Health Information from unauthorized disclosure, these systems and policies may not preclude claims against us for alleged violations of applicable requirements. Also, third party sites and/or links that consumers may access through our web sites may not maintain adequate systems to safeguard this information, or may circumvent systems and policies we have put in place. In addition, future laws or changes in current laws may necessitate costly adaptations to our policies, procedures, or systems.

There can be no assurance that we will not be subject to product liability claims, that such claims will not result in liability in excess of our insurance coverage, that our insurance will cover such claims or that appropriate insurance will continue to be available to us in the future at commercially reasonable rates. Such product liability claims could adversely affect our business, results of operations and financial condition.

We are subject to the effect of payor and provider conduct which we cannot control and accordingly, there is no assurance that revenues for our services will continue at historic levels. We offer certain electronic claims submission products and services as part of our product line. While we have implemented certain product features designed to maximize the accuracy and completeness of claims submissions, these features may not be sufficient to prevent inaccurate claims data from being submitted to payors. Should inaccurate claims data be submitted to payors, we may be subject to liability claims.

Electronic data transmission services are offered by certain payors to healthcare providers that establish a direct link between the provider and payor. This process reduces revenue to third party EDI service providers such as us. As a result of this, or other market factors, we are unable to ensure that we will continue to generate revenue at or in excess of prior levels for such services.

A significant increase in the utilization of direct links between healthcare providers and payors could adversely affect our transaction volume and financial results. In addition, we cannot provide assurance that we will be able to maintain our existing links to payors or develop new connections on terms that are economically satisfactory to us, if at all.

There is significant uncertainty in the healthcare industry in which we operate, and we are subject to the possibility of changing government regulation, which may adversely impact our business, financial condition and results of operations.The healthcare industry is subject to changing political, economic and regulatory influences that may affect the procurement processes and operation of healthcare facilities. During the past several years, the healthcare industry has been subject to an increase in governmental regulation of, among other things, reimbursement rates and certain capital expenditures.

In the past, various legislators have announced that they intend to examine proposals to reform certain aspects of the U.S. healthcare system including proposals which may change governmental involvement in healthcare and reimbursement rates, and otherwise alter the operating environment for us and our clients. Healthcare providers may react to these proposals, and the uncertainty surrounding such proposals, by curtailing or deferring investments, including those for our systems and related services. Cost-containment measures instituted by healthcare providers as a result of regulatory reform or otherwise could result in a reduction in the allocation of capital funds. Such a reduction could have an adverse effect on our ability to sell our systems and related services. On the other hand, changes in the regulatory environment have increased and may continue to increase the needs of healthcare organizations for cost-effective data management and thereby enhance the overall market for healthcare management information systems. We cannot predict what effect, if any, such proposals or healthcare reforms might have on our business, financial condition and results of operations.

As existing regulations mature and become better defined, we anticipate that these regulations will continue to directly affect certain of our products and services, but we cannot fully predict the effect at this time. We have taken


20


steps to modify our products, services and internal practices as necessary to facilitate our compliance with the regulations, but there can be no assurance that we will be able to do so in a timely or complete manner. Achieving compliance with these regulations could be costly and distract management’s attention and divert other company resources, and any noncompliance by us could result in civil and criminal penalties.

In addition, developments

Developments of additional federal and state regulations and policies have the potential to positively or negatively affect our business.


In addition, our

Our software may potentially be subject to regulation by the U.S. Food and Drug Administration (FDA)(“FDA”) as a medical device. Such regulation could require the registration of the applicable manufacturing facility and software and hardware products, application of detailed record-keeping and manufacturing standards, and FDA approval or clearance prior to marketing. An approval or clearance requirement could create delays in marketing, and the FDA could require supplemental filings or object to certain of these applications, the result of which could adversely affect our business, financial condition and results of operations.

The United States Congress in 2009 enacted legislation that would cut Medicare reimbursement to physicians by 21% per procedure. Congress has passed several successive acts postponing the cuts and there is discussion to rescind the cut. However, should the cuts be implemented by Medicare, there would be a direct material adverse revenue and earnings impact to our RCM revenue stream. The impact would vary by client depending on the client’s concentration of Medicare patients. Disruption could also affect system sales due to client reexamination of IT spending.
We may be subject to false or fraudulent Claim Laws.claim laws.  There are numerous federal and state laws that forbid submission of false information or the failure to disclose information in connection with submission and payment of physician claims for reimbursement. In some cases, these laws also forbid abuse of existing systems for such submission and payment. Any failure of our revenue cycle managementRCM services to comply with these laws and regulations could result in substantial liability including, but not limited to, criminal liability, could adversely affect demand for Ourour services and could force us to expend significant capital, research and development and other resources to address the failure. Errors by us or our systems with respect to entry, formatting, preparation or transmission of claim information may be determined or alleged to be in violation of these laws and regulations. Determination by a court or regulatory agency that Ourour services violate these laws could subject us to civil or criminal penalties, could invalidate all or portions of some of our client contracts, could require us to change or terminate some portions of Ourour business, could require us to refund portions of our services fees, could cause us to be disqualified from serving clients doing business with government payerspayors and could have an adverse effect on our business.

In most cases where we are permitted to do so, HSI calculateswe calculate charges for our RCM services based on a percentage of the collections that our clients receive as a result of our services. To the extent that violations or liability for violations of these laws and regulations require intent, it may be alleged that this percentage calculation provides the Companyus or it’sour employees with incentive to commit or overlook fraud or abuse in connection with submission and payment of reimbursement claims. The U.S. Centers for Medicare and Medicaid Services has stated that it is concerned that percentage-based billing services may encourage billing companies to commit or to overlook fraudulent or abusive practices.

A portion of our business involves billing of Medicare claims on behalf of its clients. In an effort to combat fraudulent Medicare claims, the federal government offers rewards for reporting of Medicare fraud which could encourage others to subject us to a charge of fraudulent claims, including charges that are ultimately proven to be without merit.

If our products fail to comply with evolving government and industry standards and regulations, we may have difficulty selling our products.  We may be subject to additional federal and state statutes and regulations in connection with offering services and products via the Internet. On an increasingly frequent basis, federal and state legislators are proposing laws and regulations that apply to Internet commerce and communications. Areas being affected by these regulations include user privacy, pricing, content, taxation, copyright protection, distribution, and quality of products and services. To the extent that our products and services are subject to these laws and regulations, the sale of our products and services could be harmed.


We are subject to changes in and interpretations of financial accounting matters that govern the measurement of our performance, one or more of which could adversely affect our business, financial condition, cash flows, revenue and results of operations.operations.  Based on our reading and interpretations of relevant guidance, principles or


21


concepts issued by, among other authorities, the American Institute of Certified Public Accountants, the Financial Accounting Standards Board, and the Commission, Management believeswe believe our current sales and licensing contract terms and business arrangements have been properly reported. However, there continue to be issued interpretations and guidance for applying the relevant standards to a wide range of sales and licensing contract terms and business arrangements that are prevalent in the software industry. Future interpretations or changes by the regulators of existing accounting standards or changes in our business practices could result in changes in our revenue recognitionand/or other accounting policies and practices that could adversely affect our business, financial condition, cash flows, revenue and results of operations.

If material weaknesses in ourFailure to maintain effective internal controls are identified by ourselves or our independent auditors, our per share price may be adversely affected. Any material weaknesses identified in our internal controls as part of the ongoing evaluation being undertaken by us and our independent public accountants pursuant toaccordance with Section 404 of the Sarbanes-Oxley Act of 2002 could have an adverse effect on our business, and our per share price may be adversely affected.  Pursuant to Section 404 of the price atSarbanes-Oxley Act of 2002 (“Section 404”) and the rules and regulations promulgated by the SEC to implement Section 404, we are required to include in ourForm 10-K a report by our management regarding the effectiveness of our internal control over financial reporting. The report includes, among other things, an assessment of the effectiveness of our internal control over financial reporting. The assessment must include disclosure of any material weakness in our internal control over financial reporting identified by management.
As part of the ongoing evaluation being undertaken by management and our independent registered public accountants pursuant to Section 404, our internal control over financial reporting was effective as of March 31, 2010. However, if we fail to maintain an effective system of disclosure controls or internal controls over financial reporting, we may discover material weaknesses that we would then be required to disclose. Any material weaknesses identified in our internal controls could have an adverse effect on our business. We may not be able to accurately or timely report on our financial results, and we might be subject to investigation by regulatory authorities. This could result in a loss of investor confidence in the accuracy and completeness of our financial reports, which may have an adverse effect on our stock trades.

price.

No evaluation process can provide complete assurance that our internal controls will detect and correct all failures within our company to disclose material information otherwise required to be reported. The effectiveness of our controls and procedures could also be limited by simple errors or faulty judgments. In addition, if we continue to expand, through either organic growth or through acquisitions (or both), the challenges involved in implementing appropriate controls will increase and may require that we evolve some or all of our internal control processes.

It is also possible that the overall scope of Section 404 of the Sarbanes-Oxley Act of 2002 may be revised in the future, thereby causing our auditors and ourselves to review, revise or reevaluate our internal control processes which may result in the expenditure of additional human and financial resources.
Risks Related to Ownership of Our Common Stock
The unpredictability of our quarterly operating results may cause the price of our common stock to fluctuate or decline.  Our revenue may fluctuate in the future from quarter to quarter and period to period, as a result of a number of factors including, without limitation:
• the size and timing of orders from clients;
• the specific mix of software, hardware, and services in client orders;
• the length of sales cycles and installation processes;
• the ability of our clients to obtain financing for the purchase of our products;
• changes in pricing policies or price reductions by us or our competitors;
• the timing of new product announcements and product introductions by us or our competitors;
• changes in revenue recognition or other accounting guidelines employed by usand/or established by the Financial Accounting Standards Board or other rule-making bodies;
• accounting policies concerning the timing of the recognition of revenue;
• the availability and cost of system components;


22

Continuing worldwide political


• the financial stability of clients;
• market acceptance of new products, applications and product enhancements;
• our ability to develop, introduce and market new products, applications and product enhancements;
• our success in expanding our sales and marketing programs;
• deferrals of client orders in anticipation of new products, applications, product enhancements, or public/private sector initiatives;
• execution of or changes to our strategy;
• personnel changes; and
• general market/economic factors.
Our software products are generally shipped as orders are received and economic uncertainties mayaccordingly, we have historically operated with a minimal backlog of license fees. As a result, revenue in any quarter is dependent on orders booked and shipped in that quarter and is not predictable with any degree of certainty. Furthermore, our systems can be relatively large and expensive, and individual systems sales can represent a significant portion of our revenue and profits for a quarter such that the loss or deferral of even one such sale can adversely affect our quarterly revenue and profitability. The last several years have been periodically marked by concerns including butprofitability.
Clients often defer systems purchases until our quarter end, so quarterly results generally cannot be predicted and frequently are not limitedknown until after the quarter has concluded.
Our sales are dependent upon clients’ initial decisions to inflation, decreased consumer confidence, the lingering effects of international conflicts, energy costsreplace or substantially modify their existing information systems, and terrorist and military activities. These conditions can make it extremely difficult for our customers, our vendors and ourselves to accurately forecast and plan future business activities, and they could cause constrained spending on oursubsequently, their decision concerning which products and services and/or delayto purchase. These are major decisions for healthcare providers and, lengthenaccordingly, the sales cycles.

Our future policy concerning stock splits is uncertain. While we effectedcycle for our systems can vary significantly and typically ranges from six to twenty four months from initial contact to contract execution/shipment.

Because a 2:1 splitsignificant percentage of our stockexpenses are relatively fixed, a variation in March 2005the timing of systems sales, implementations, and installations can cause significant variations in operating results from quarter to quarter. As a second 2:1 stock splitresult, we believe that interimperiod-to-period comparisons of our results of operations are not necessarily meaningful and should not be relied upon as indications of future performance. Further, our historical operating results are not necessarily indicative of future performance for any particular period.
We currently recognize revenue pursuant to Financial Accounting Standards Board (“FASB”) Accounting Standards Codification (“ASC”) Topic985-605,Software, Revenue Recognition, orASC 985-605.ASC 985-605 summarizes the FASB’s views in March 2006, thereapplying generally accepted accounting principles to revenue recognition in financial statements.
There can be no assurance that another stock splitapplication and subsequent interpretations of these pronouncements will occurnot further modify our revenue recognition policies, or that such modifications would not adversely affect our operating results reported in any particular quarter or year.
Due to all of the future. Unfulfilledforegoing factors, it is possible that our operating results may be below the expectations to the contrary could adversely affectof public market analysts and investors. In such event, the price of our stock.common stock would likely be adversely affected.
Our common stock price has been volatile, which could result in substantial losses for investors purchasing shares of our common stock and in litigation against us.  Volatility may be caused by a number of factors including but not limited to:
• actual or anticipated quarterly variations in operating results;
• rumors about our performance, software solutions, or merger and acquisition activity;
• changes in expectations of future financial performance or changes in estimates of securities analysts;
• governmental regulatory action;
• health care reform measures;


23


• client relationship developments;
• purchases or sales of company stock;
• activities by one or more of our major shareholders concerning our policies and operations;
• changes occurring in the markets in general;
• macroeconomic conditions, both nationally and internationally; and
• other factors, many of which are beyond our control.
Furthermore, the stock market in general, and the market for software, healthcare and high technology companies in particular, has experienced extreme volatility that often has been unrelated to the operating performance of particular companies. These broad market and industry fluctuations may adversely affect the trading price of our common stock, regardless of actual operating performance.
Moreover, in the past, securities class action litigation has often been brought against a company following periods of volatility in the market price of its securities. We may in the future be the target of similar litigation. Securities litigation could result in substantial costs and divert management’s attention and resources.
Two of our directors are significant shareholders, which makes it possible for them to have significant influence over the outcome of all matters submitted to our shareholders for approval and which influence may be alleged to conflict with our interests and the interests of our other shareholders.  Two of our directors and principal shareholders beneficially owned an aggregate of approximately 33.5% of the outstanding shares of our common stock at March 31, 2010. California law and our Bylaws permit our shareholders to cumulate their votes, the effect of which is to provide shareholders with sufficiently large concentrations of our shares the opportunity to assure themselves one or more seats on our Board of Directors. The amounts required to assure a Board position can vary based upon the number of shares outstanding, the number of shares voting, the number of directors to be elected, the number of “broker non-votes,” and the number of shares held by the shareholder exercising cumulative voting rights. In the event that cumulative voting is invoked, it is likely that the two of our directors holding an aggregate of approximately 33.5% of the outstanding shares of our common stock at March 31, 2010 will each have sufficient votes to assure themselves of one or more seats on our Board of Directors. With or without cumulative voting, these shareholders will have significant influence over the outcome of all matters submitted to our shareholders for approval, including the election of our directors and other corporate actions. In fiscal year 2009, one of the principal shareholders, Ahmed Hussein, proposed a different slate of directors than what the Company proposed to shareholders. The Company spent approximately $1.5 million to defend the Company’s slate. In addition, such influence by one or both of these shareholders could have the effect of discouraging others from attempting to purchase us, implement a change over our Board of Directors and management,and/or reducing the market price offered for our common stock in such an event.
Our future policy concerning the payment of dividends is uncertain, which could adversely affect the price of our stock.  We have announced our intention to pay a quarterly dividend commencing with the conclusion of our first fiscal quarter of 2008 (June 30, 2007) and pursuant to this policy theour Board of Directors has declared a quarterly cash dividend ranging from $0.25 to its most recent level of $0.25$0.30 per share on our outstanding shares of common stock, each quarter thereafter. We anticipate that future quarterly dividends, if and when declared by theour Board of Directors pursuant to this policy, would likely be distributable on or about the fifth day of each of the months of October, January, April and July. There can be no guarantees that we will have the financial wherewithal to fund this dividend in perpetuity or to pay it at historic rates. Further, theour Board of Directors may decide not to pay the dividend at some future time for financial or non-financial reasons. Unfulfilled expectations regarding future dividends could adversely affect the price of our stock.

ITEM 1B.

UNRESOLVED STAFF COMMENTS

None.


24


None.

ITEM 2.

PROPERTIES

Our principal administrative, accounting, QSI Dental Division operations and QSINextGen Division training operations are located in Irvine, California, under a lease that commenced in May 2005, and expired in May 2008. We leased approximately 12,000 square feet of space at this location. In October 2007, we executed a


lease for approximately 24,000 square feet where our principal administrative, accounting and QSI Division operations will reside after May 2008. This lease expires in May 2013.

In September 2005, we executed a lease for approximately 3,300 square feet of space in a building adjacent to our corporate office in Irvine to house additional corporate staff and NextGen training operations. This lease originally expires in January 2011, however, this lease will terminate early in December 2008 and the NextGen training center along with the additional corporate staff will move to the new corporate headquarters described above.

We lease approximately 78,000 square feet of space for the principal office of our NextGen Division in Horsham, Pennsylvania. This lease expires in March 2011. In January 2007, we executed a new lease for approximately 35,000 square feet of space for the NextGen Division in Atlanta, Georgia. This lease expires in October 2011. In May 2006, we executed a lease for approximately 3,000 square feet of space in Dallas, Texas for NextGen staff and a new NextGen training facility. In addition, we lease approximately 6,000 square feet of space in Santa Ana, California, to house our assembly and warehouse operations of the QSI Division. We also have an aggregate of approximately 3,000 square feet of space in Minnesota, Utah, Wisconsin, and Washington to house additional sales, training, development and service operations. These leases, excluding options, have expiration dates ranging from month-to-month to October 2011.California. Should we continue to grow, we may be required to lease additional space. We believe that suitable additional or substitute space is available, if needed, at market rates.

As a result of our acquisition of HSI on May 20, 2008,March 31, 2010, we lease an aggregate of approximately 46,400305,500 square feet for our HSI operations in St. Louis, Missouri under leases that expire in November 2010.

of space with expiration dates, excluding options, ranging frommonth-to-month to September 2016, as follows:

Square Feet
QSI Dental Division
Irvine, California — Corporate Headquarters24,000
Other U.S. locations5,000
NextGen Division
Horsham, Pennsylvania98,000
Austin, Texas39,000
Atlanta, Georgia35,000
Laguna Hills, California4,500
Practice Solutions Division
St. Louis, Missouri66,500
Hunt Valley, Maryland33,500
Total leased properties305,500
ITEM 3.

LEGAL PROCEEDINGS

In the normal course of business, we are involved in various claims and legal proceedings. While the ultimate resolution of these currently pending matters has yet to be determined, we do not presently believe that their outcome will adversely affect our financial position, results of operations or liquidity.

We have experienced legal claims by parties asserting that we have infringed their intellectual property rights. We believe that these claims are without merit and intend to defend them vigorously; however, we could incur substantial costs and diversion of management resources defending any infringement claim — even if we are ultimately successful in the defense of such matter. Litigation is inherently uncertain and always difficult to predict. We refer you to the discussion of infringement and litigation risks in our Risk Factors section of this Report.

ITEM 4.

SUBMISSION OF MATTERS TO A VOTE OF SECURITY HOLDERSRESERVED

No matter was submitted to a vote of security holders during the fourth quarter of fiscal year 2008.

PART II

ITEM 5.

MARKET FOR REGISTRANT’S COMMON STOCK,EQUITY, RELATED STOCKHOLDERSHAREHOLDER MATTERS AND ISSUER PURCHASES OF EQUITY SECURITIES

Market Price and Holders

Our common stock is traded on the NasdaqNASDAQ Global Select Market under the symbol “QSII.” The following table sets forth for the quarters indicated the high and low sales prices for each period indicated, as reported on the NasdaqNASDAQ Global Select Market and reflects all stock splits effected.Market:
         
  High Low
 
Quarter Ended        
June 30, 2008 $35.97  $29.00 
September 30, 2008 $47.94  $27.34 
December 31, 2008 $44.98  $25.70 
March 31, 2009 $48.46  $34.26 
June 30, 2009 $62.00  $43.44 
September 30, 2009 $64.16  $50.87 
December 31, 2009 $65.98  $57.63 
March 31, 2010 $68.59  $51.30 


25


Quarter Ended


High


Low


June 30, 2006


$

38.27


$

28.30


September 30, 2006


$

42.00


$

30.43


December 31, 2006


$

43.68


$

34.75


March 31, 2007


$

45.44


$

36.85


June 30, 2007


$

42.44


$

36.96


September 30, 2007


$

45.35


$

32.37


December 31, 2007


$

38.99


$

26.08


March 31, 2008


$

36.30


$

26.90


At June 1, 2008,May 21, 2010, there were approximately 9088 holders of record of our common stock.


Dividends and Splits

On January 30, 2008, the Board approved a quarterly cash dividend of $0.25 per share on our outstanding shares of common stock, payable to shareholders of record as of March 14, 2008 and was distributed to shareholders on or about April 7, 2008.

On October 25, 2007, the Board approved a quarterly cash dividend of $0.25 per share on our outstanding shares of common stock, payable to shareholders of record as of December 14, 2007 and was distributed to shareholders on or about January 7, 2008.

On July 31, 2007, our Board of Directors approved a regular quarterly dividend of $0.25 per share payable on its outstanding shares of common stock. The cash dividend record date was September 14, 2007 and was distributed to shareholders on or about October 5, 2007.

On May 31, 2007, the Board declared a quarterly cash dividend of $0.25 per share on our outstanding shares of common stock, payable to shareholders of record as of June 15, 2007 and was distributed to shareholders on July 5, 2007.

In February 2007, we paid a $1.00 per share dividend on shares of our common stock. The record date for the dividend was February 13, 2007.

In January 2007, our Board of Directors adopted a policy whereby we intend to pay a regular quarterly dividend of $0.25 per share on our outstanding common stock, commencing with conclusion of our first fiscal quarter of 2008 (June 30, 2007) and continuing each fiscal quarter thereafter, subject to further Board review and approval and establishment of record and distribution dates by our Board of Directors prior to the declaration of each such quarterly dividend. In August 2008, our Board of Directors increased the quarterly dividend to $0.30 per share. We anticipate that future quarterly dividends, if and when declared by theour Board of Directors pursuant to this policy, would likely be distributable on or about the fifth day of each of the months of October, January, April and July.

In March 2006, we paid a $0.875 per share dividend on shares of our common stock. The record date for

On May 26, 2010, the dividend was February 24, 2006. The dividend per share amount has been adjusted to reflect the stock split noted above.

In January 2006, we announced that our Board of Directors had declaredapproved a 2-for-1 stock split with respect toquarterly cash dividend of $0.30 per share on our outstanding shares of common stock, forpayable to shareholders of record as of June 17, 2010 with an expected distribution date on March 3, 2006. or about July 6, 2010.

The stock began trading post splitfollowing dividends have been declared in the 2010, 2009, and 2008 fiscal years on March 27, 2006.

In March 2005, we paid a one-time dividend on shares of our common stock equal to $0.75 per share. The record date for the dividend was February 24, 2005. The dividend per share amount has been adjusted to reflect the stock split noted above.

In February 2005, we announced that our Board of Directors declared a 2-for-1 stock split with respect to our outstanding shares of common stock. The stock split record date was March 4, 2005 and the stock began trading post split on March 28, 2005.

dates indicated:

         
  Record
 Payment
 Dividend
Board Approval Date
 
Date
 
Date
 
Amount
 
Fiscal year 2010
        
January 27, 2010 March 23, 2010 April 5, 2010 $0.30 
October 28, 2009 December 23, 2009 January 5, 2010  0.30 
July 23, 2009 September 25, 2009 October 5, 2009  0.30 
May 27, 2009 June 12, 2009 July 6, 2009  0.30 
Fiscal year 2009
        
January 28, 2009 March 11, 2009 April 3, 2009 $0.30 
October 30, 2008 December 15, 2008 January 5, 2009  0.30 
August 4, 2008 September 15, 2008 October 1, 2008  0.30 
May 29, 2008 June 15, 2008 July 2, 2008  0.25 
Fiscal year 2008
        
January 30, 2008 March 14, 2008 April 7, 2008 $0.25 
October 25, 2007 December 14, 2007 January 7, 2008  0.25 
July 31, 2007 September 14, 2007 October 5, 2007  0.25 
May 31, 2007 June 15, 2007 July 5, 2007  0.25 
Payment of future dividends, if any, will be at the discretion of our Board of Directors after taking into account various factors, including without limitation, our financial condition, operating results, current and anticipated cash needs and plans for expansion.


26


Performance Graph

The following graph compares the cumulative total returns of our common stock, the Total ReturnNASDAQ Composite Index, for The Nasdaq Stock Market, and the NasdaqNASDAQ Computer & Data Processing Services Stock Index over the five-year period ended March 31, 20082010 assuming $100 was invested on March 31, 20032005 with all dividends, if any, reinvested. This performance graph shall not be deemed to be “soliciting material” or “filed” for purposes of Section 18 of the Securities Exchange Act of 1934, as amended (the “Exchange Act”) or otherwise subject to the liabilities under that Section and shall not be deemed to be incorporated by reference into any filing of the Company under the Securities Act of 1933, as amended or the Exchange Act.


COMPARISON OF 5 YEAR CUMULATIVE TOTAL RETURN*
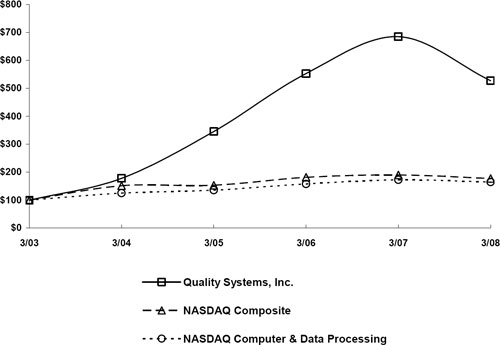
Among Quality Systems, Inc., The NASDAQ Composite Index
And The NASDAQ Computer & Data Processing Index

* $100 invested on 3/31/03 in stock or index-including reinvestment of dividends.

Fiscal year ending March 31.

* $100 invested on 3/31/2005 in stock or index, including reinvestment of dividends. Fiscal year ending March 31.
The last trade price of our common stock on each of March 31, 2004, 2005, 2006, 2007, 2008, 2009 and 20082010 was published by NasdaqNASDAQ and, accordingly for the periods ended March 31, 2004, 2005, 2006, 2007, 2008, 2009 and 20082010 the reported last trade price was utilized to compute the total cumulative return for our common stock for the respective periods then ended. Shareholder returns over the indicated periods should not be considered indicative of future stock prices or shareholder returns.


27

Recent Sales of Unregistered Securities


We did not make any unregistered sales of our common stock during the fourth quarter of 2008.

ITEM 6.

SELECTED FINANCIAL DATA

The following selected financial data with respect to our Consolidated Statements of Income data for each of the five years in the period ended March 31, 20082010 and the Consolidated Balance SheetSheets data as of the end of each such fiscal year are derived from our audited financial statements.Consolidated Financial Statements. The following information should be read in conjunction with our Consolidated Financial Statements and the related notes thereto and “Item 7. Management’s Discussion and Analysis of Financial Condition and Results of Operations” included elsewhere herein. All share prices in the table below have been retroactively adjusted to reflect the fiscal year 2006 and 2005 stock splits.


Consolidated Financial Data
                     
  Year Ended March 31, 
  2010  2009  2008  2007  2006 
  (In thousands, except per share data) 
 
Statements of Income Data:                    
Revenue $291,811  $245,515  $186,500  $157,165  $119,287 
Cost of revenue  110,807   88,890   62,501   50,784   39,828 
                     
Gross profit  181,004   156,625   123,999   106,381   79,459 
Selling, general and administrative expenses  86,951   69,410   53,260   45,337   35,554 
Research and development costs  16,546   13,777   11,350   10,166   8,087 
Amortization of acquired intangible assets  1,783   1,035          
                     
Income from operations  75,724   72,403   59,389   50,878   35,818 
Interest income  226   1,203   2,661   3,306   2,108 
Other income (expense)  268   (279)  953       
                     
Income before provision for income taxes  76,218   73,327   63,003   54,184   37,926 
Provision for income taxes  27,839   27,208   22,925   20,952   14,604 
                     
Net income $48,379  $46,119  $40,078  $33,232  $23,322 
                     
Basic net income per share $1.69  $1.65  $1.47  $1.24  $0.88 
Diluted net income per share $1.68  $1.62  $1.44  $1.21  $0.85 
Basic weighted average shares outstanding  28,635   28,031   27,298   26,882   26,413 
Diluted weighted average shares outstanding  28,796   28,396   27,770   27,550   27,356 
Dividends declared per common share $1.20  $1.15  $1.00  $1.00  $0.875 
                     
  March 31,
 March 31,
 March 31,
 March 31,
 March 31,
  2010 2009 2008 2007 2006
 
Balance Sheet Data:                    
Cash and cash equivalents $84,611  $70,180  $59,046  $60,028  $57,255 
Working capital $118,935  $98,980  $79,932  $76,616  $61,724 
Total assets $310,180  $242,101  $187,908  $150,681  $122,247 
Total liabilities $121,891  $86,534  $74,203  $59,435  $49,838 
Total shareholders’ equity $188,289  $155,567  $113,705  $91,246  $72,409 


28

(In Thousands, Except Per Share Data)


Year ended March 31,


2008


2007


2006


2005


2004


Statements of Income Data:


Revenue


$

186,500


$

157,165


$

119,287


$

88,961


$

70,934


Cost of revenue


62,501


50,784


39,828


32,669


28,673


Gross profit


123,999


106,381


79,459


56,292


42,261


Selling, general and administrative expenses


53,260


45,337


35,554


24,776


19,482


Research and development costs


11,350


10,166


8,087


6,903


6,139


Income from operations


59,389


50,878


35,818


24,613


16,640


Interest income


2,661


3,306


2,108


876


386


Other income


953


Income before provision for income taxes


63,003


54,184


37,926


25,489


17,026


Provision for income taxes


22,925


20,952


14,604


9,380


6,626


Net income


$

40,078


$

33,232


$

23,322


$

16,109


$

10,400


Basic net income per share


$

1.47


$

1.24


$

0.88


$

0.63


$

0.42


Diluted net income per share


$

1.44


$

1.21


$

0.85


$

0.61


$

0.40


Basic weighted average shares outstanding


27,298


26,882


26,413


25,744


24,872


Diluted weighted average shares outstanding


27,770


27,550


27,356


26,406


25,932


Balance Sheet Data (at end of period):


Cash and cash equivalents


$

59,046


$

60,028


$

57,255


$

51,157


$

51,395


Working capital


$

79,932


$

76,616


$

61,724


$

55,111


$

53,415


Total assets


$

187,908


$

150,681


$

122,247


$

99,442


$

86,678


Total liabilities


$

74,203


$

59,435


$

49,838


$

36,711


$

25,673


Total shareholders’ equity


$

113,705


$

91,246


$

72,409


$

62,731


$

61,005


ITEM 7.

MANAGEMENT’S DISCUSSION AND ANALYSIS OF FINANCIAL CONDITION AND RESULTS OF OPERATIONS

Except for the historical information contained herein, the matters discussed in this Annual Report on Form 10-K,management’s discussion and analysis of financial condition and results of operations, or MD&A, including discussions of our product development plans, business strategies and market factors influencing our results, may include forward-looking statements that involve certain risks and uncertainties. Actual results may differ from those anticipated by us as a result of various factors, both foreseen and unforeseen, including, but not limited to, our ability to continue to develop new products and increase systems sales in markets characterized by rapid technological evolution, consolidation, and competition from larger, better capitalized competitors. Many other economic, competitive, governmental and technological factors could affect our ability to achieve our goals, and interested persons are urged to review the risks described in “Item 1A. Risk Factors” as set forth above, as well as in our other public disclosures and filings with the Commission.

The

Overview
This MD&A is provided as a supplement to the Consolidated Financial Statements and notes thereto included in this Report, in order to enhance your understanding of our results of operations and financial condition and the following discussion should be read in conjunction with, and is qualified in its entirety by, the consolidated financial statementsConsolidated Financial Statements and related notes thereto included elsewhere in this Report. Historical results of operations, percentage margin fluctuations and any trends that may be inferred from the discussion below are not necessarily indicative of the operating results for any future period.
Our MD&A is organized as follows:
• Management Overview.  This section provides a general description of our Company and operating segments, a discussion as to how we derive our revenue, background information on certain trends and developments affecting our Company, a summary of our acquisition transactions and a discussion on management’s strategy for driving revenue growth.
• Critical Accounting Policies and Estimates.  This section discusses those accounting policies that are considered important to the evaluation and reporting of our financial condition and results of operations, and whose application requires us to exercise subjective or complex judgments in making estimates and assumptions. In addition, all of our significant accounting policies, including our critical accounting policies, are summarized in Note 2 to the Consolidated Financial Statements included in this Report.
• Overview of Results of Operations and Results of Operations by Operating Divisions.  These sections provide our analysis and outlook for the significant line items on our Consolidated Statements of Income, as well as other information that we deem meaningful to understand our results of operations on both a consolidated basis and an operating division basis.
• Liquidity and Capital Resources.  This section provides an analysis of our liquidity and cash flows and discussions of our contractual obligations and commitments as of March 31, 2010.
• New Accounting Pronouncements.  This section provides a summary of the most recent authoritative accounting standards and guidance that have either been recently adopted by our Company or may be adopted in the future.
Management Overview
Our Company is comprised of the QSI Dental Division, the NextGen Division, and the Practice Solutions Division. Operationally, HSI and PMP are considered and administered as part of the Practice Solutions Division while Opus and Sphere operate under the NextGen Division. We primarily derive revenue by developing and marketing healthcare information systems that automate certain aspects of medical and dental practices, networks of practices such as PHOs and MSOs, ambulatory care centers, community health centers, and medical and dental schools along with comprehensive systems implementation, maintenance and support and add on complementary services such as RCM and EDI. Our systems and services provide our clients with the ability to redesign patient care


29


and other workflow processes while improving productivity through facilitation of managed access to patient information. Utilizing our proprietary software in combination with third party hardware and software solutions, our products enable the integration of a variety of administrative and clinical information operations.
On May 20, 2008, we acquired HSI, a full-service healthcare RCM company. HSI operates under the umbrella of the Company’s Practice Solutions Division. Founded in 1996, HSI provides RCM services to providers including health systems, hospitals, and physicians in private practice with an in-house team of more than 200 employees, including specialists in medical billing, coding and compliance, payor credentialing, and information technology.
On October 28, 2008, we acquired PMP, a full-service healthcare RCM company. This acquisition is also part of our growth strategy for our Practice Solutions Division. Similar to HSI, PMP operates under the umbrella of the Company’s Practice Solutions Division. Founded in 2001, PMP provides physician billing and technology management services to healthcare providers, primarily in the Mid-Atlantic region.
On August 12, 2009, we acquired Sphere, a provider of financial information systems to the small hospital inpatient market. This acquisition is also part of our strategy to expand into the small hospital market and to add new customers by taking advantage of cross selling opportunities between the ambulatory and inpatient markets.
On February 10, 2010, we acquired Opus, a provider of clinical information systems to the small hospital inpatient market. Founded in 1987 and headquartered in Austin, Texas, Opus delivers web-based clinical solutions to hospital systems and integrated health networks nationwide. This acquisition complements and will be integrated with the assets of Sphere. Both companies are established developers of software and services for the inpatient market and will operate under the Company’s NextGen Division.
Our strategy is, at present, to focus on providing software and services to medical and dental practices. The key elements of this strategy are to continue development and enhancement of select software solutions in target markets, to continue investments in our infrastructure including but not limited to product development, sales, marketing, implementation, and support, to continue efforts to make infrastructure investments within an overall context of maintaining reasonable expense discipline, to add new customers through maintaining and expanding sales, marketing and product development activities, and to expand our relationship with existing customers through delivery of add-on and complementary products and services and to continue our gold standard commitment of service in support of our customers.
Critical Accounting Policies and Estimates

The discussion and analysis of our consolidated financial statementsConsolidated Financial Statements and results of operations is based upon our consolidated financial statementsConsolidated Financial Statements, which have been prepared in accordance with accounting principles generally accepted in the United States of America. The preparation of these consolidated financial statementsConsolidated Financial Statements requires us to make estimates and judgments that affect the reported amounts of assets, liabilities, revenue and expenses, and related disclosures of contingent assets and liabilities. On an on-going basis, we evaluate estimates, including but not limited to those related to revenue recognition, valuation of marketable securities, ARS put option rights, uncollectible accounts receivable, software development cost, intangible assets and income taxesself-insurance accruals for reasonableness. We base our estimates on historical experience and on various other assumptions that management believes to be reasonable under the circumstances, the results of which form the basis for making judgments about the carrying values of assets and liabilities that may not be readily apparent from other sources. Actual results may differ from these estimates under different assumptions or conditions.


30

We believe revenue recognition, valuation of marketable securities, the allowance for doubtful accounts, capitalized software costs, share-based compensation and income taxes are among the most critical accounting policies that affect our consolidated financial statements.


We believe that significant accounting policies, as described in Note 2 of our Consolidated Financial Statements, “Summary of Significant Accounting Policies”, should be read in conjunction with Management’s Discussion and Analysis of Financial Condition and Results of Operations.

Revenue Recognition. We currently recognize revenue pursuant to SOP 97-2, as amended by SOP 98-9. We generate revenue from the sale of licensing rights to use our software products sold directly to end-users and value-added resellers (VARs). We also generate revenue from sales of hardware and third party software, and implementation, training, software customization, EDI, post-contract support (“maintenance”) and other services performed for customers who license our products.

A typical system contract contains multiple elements of the above items. SOP 97-2, as amended, requires revenue earned on software arrangements involving multiple elements to be allocated to each element based on the relative fair values of those elements. The fair value of an element must be based on vendor specific objective evidence (VSOE). We limit our assessment of VSOE for each element to either the price charged when the same element is sold separately (using a rolling average of stand alone transactions) or the price established by management having the relevant authority to do so, for an element not yet sold separately. VSOE calculations are updated and reviewed at the end of each quarter or annually depending on the nature of the product or service.

When evidence of fair value exists for the delivered and undelivered elements of a transaction, then discounts for individual elements are aggregated and the total discount is allocated to the individual elements in proportion to the elements’ fair value relative to the total contract fair value.

When evidence of fair value exists for the undelivered elements only, the residual method, provided for under SOP 98-9, is used. Under the residual method, we defer revenue related to the undelivered elements in a system sale based on VSOE of fair value of each of the undelivered elements, and allocate the remainder of the contract price net of all discounts to revenue


recognized from the delivered elements. Undelivered elements of a system sale may include implementation and training services, hardware and third party software, maintenance, future purchase discounts, or other services. If VSOE of fair value of any undelivered element does not exist, all revenue is deferred until VSOE of fair value of the undelivered element is established or the element has been delivered.

We bill for the entire contract amount upon contract execution except for maintenance which is billed separately. Amounts billed in excess of the amounts contractually due are recorded in accounts receivable as advance billings. Amounts are contractually due when services are performed or in accordance with contractually specified payment dates. Provided the fees are fixed and determinable and collection is considered probable, revenue from licensing rights and sales of hardware and third party software is generally recognized upon shipment and transfer of title. In certain transactions whose collections risk is high, the cash basis method is used to recognize revenue. If the fee is not fixed or determinable, then the revenue recognized in each period (subject to application of other revenue recognition criteria) will be the lesser of the aggregate of amounts due and payable or the amount of the arrangement fee that would have been recognized if the fees were being recognized using the residual method. Fees which are considered fixed or determinable at the inception of our arrangements must includebelieve the following characteristics:

table depicts the most critical accounting policies that affect our Consolidated Financial Statements:

§

Revenue RecognitionJudgments and Uncertainties
We generate revenue from the sale of licensing rights to use our software products sold directly to end-users and value-added resellers, or VARs. We also generate revenue from sales of hardware and third party software, implementation, training, software customization, EDI, post-contract support (maintenance) and other services, including RCM services, performed for customers who license our products.

Revenue from implementation and training services is recognized as the corresponding services are performed. Maintenance revenue is recognized ratably over the contractual maintenance period. RCM revenue is derived from services fees, which include amounts charged for ongoing billing and other related services and are generally billed to the customer as a percentage of total collections. We do not recognize revenue for services fees until these collections are made as the services fees are not fixed or determinable until such time.
A typical system contract contains multiple elements of the above items. FASB ASC Topic 985-605-25,Software, Revenue Recognition, Multiple Elements,or ASC 985-605-25, requires revenue earned on software arrangements involving multiple elements to be allocated to each element based on the relative fair values of those elements. The fair value of an element must be based on vendor specific objective evidence (“VSOE”). We limit our assessment of VSOE for each element to either the price charged when the same element is sold separately or the price established by management having the relevant authority to do so, for an element not yet sold separately. VSOE calculations are updated and reviewed at the end of each quarter or annually depending on the nature of the product or service. We have established VSOE for the related undelivered elements based on the bell-shaped curve method. Maintenance VSOE for our largest customers is based on stated renewal rates only if the rate is determine d to be substantive and falls within our customary pricing practices.

When evidence of fair value exists for the undelivered elements only, the residual method, provided for under ASC 985-605, is used. Under the residual method, we defer revenue related to the undelivered elements in a system sale based on VSOE of fair value of each of the undelivered elements, and allocate the remainder of the contract price net of all discounts to revenue recognized from the delivered elements. Undelivered elements of a system sale may include implementation and training services, hardware and third party software, maintenance, future purchase discounts, or other services. If VSOE of fair value of any undelivered element does not exist, all revenue is deferred until VSOE of fair value of the undelivered element is established or the element has been delivered.

We bill for the entire system sales contract amount upon contract execution, except for maintenance which is billed separately. Amounts billed in excess of the amounts contractually due are recorded in accounts receivable as advance billings. Amounts are contractually due when services are performed or in accordance with contractually specified payment dates. Provided the fees are fixed or determinable and collection is considered probable, revenue from licensing rights and sales of hardware and third party software is generally recognized upon shipment and transfer of title. In certain transactions whose collections risk is high, the cash basis method is used to recognize revenue. If the fee is not fixed or determinable, then the revenue recognized in each period (subject to application of other revenue recognition criteria) will be the lesser of the aggregate of amounts due and payable or the amount of the arrangement fee that would have been recognized if the fees were being recognized using the residual method. Fees which are considered fixed or determinable at the inception of our arrangements must include the following characteristics:
•   The fee must be negotiated at the outset of an arrangement, and generally be based on the specific volume of products to be delivered without being subject to change based on variable pricing mechanisms such as the number of units copied or distributed or the expected number of users.

users; and

§

•   Payment terms must not be considered extended. If a significant portion of the fee is due more than 12 months after delivery or after the expiration of the license, the fee is presumed not fixed andor determinable.

Revenue from implementation and training services is recognized as the corresponding services are performed. Maintenance revenue is recognized ratably over the contractual maintenance period.
31

Contract accounting is applied where services include significant software modification, development or customization. In such instances, the arrangement fee is accounted for in accordance with Statement of Position No. 81-1 “Accounting for Performance of Construction-Type and Certain Production-Type Contracts” (SOP 81-1).


Pursuant to SOP 81-1, we use the percentage of completion method provided all of the following conditions exist:

Revenue Recognition (continued)Effect if Actual Results Differ from Assumptions
Although we believe that our approach to estimates and judgments as described herein is reasonable, actual results could differ and we may be exposed to increases or decreases in revenue that could be material.
Valuation of Marketable Securities and ARS Put Option Rights

Our investments at March 31, 2010 and 2009 are in tax exempt municipal ARS which are classified as either current or non-current marketable securities on our Consolidated Balance Sheets, depending on the liquidity and timing of expected realization of such securities.

Our ARS are held by UBS Financial Services Inc.. On November 13, 2008, we entered into an Auction Rate Security Rights Agreement with UBS, whereby the we accepted UBS’s offer to purchase the Company’s ARS investments at any time during the period of June 30, 2010 through July 2, 2012. As a result, we had obtained an asset, ARS put option rights, whereby the we have a right to “put” the ARS back to UBS. We expect to exercise its ARS put option rights and put its ARS back to UBS on June 30, 2010, the earliest date allowable under the Rights Agreement.
Judgments and Uncertainties

Marketable securities are recorded at fair value, based on quoted market rates or on valuation analysis when appropriate. The contract includes provisionscost of marketable securities sold is based upon the specific identification method. Realized gains or losses and other-than-temporary declines in the fair value of marketable securities are determined on a specific identification basis and reported in interest and other income, net, as incurred.

The fair value of our marketable securities has been estimated by management based on certain assumptions of what market participants would use in pricing the asset in a current transaction, or level 3 — unobservable inputs in accordance with FASB ASC Topic 820-10,Fair Value Measurements and Disclosures-Overall, or ASC 820-10. Management used a model to estimate the fair value of these securities that clearly specifyincluded certain level 2 inputs as well as assumptions, including a liquidity discount, based on management’s judgment, which are highly subjective and therefore considered level 3 inputs in the enforceable rights regarding goodsfair value hierarchy. The estimate of the fair value of the marketable securities could change based on market conditions.

Effect if Actual Results Differ from Assumptions

Although we believe that our approach to estimates and judgments as described herein is reasonable, actual results could differ and we may be exposed to increases or servicesdecreases in gains and losses that could be material.
Allowance for Doubtful AccountsJudgments and Uncertainties
We maintain allowances for doubtful accounts for estimated losses resulting from the inability of our customers to make required payments. We perform credit evaluations of our customers and maintain reserves for estimated credit losses. Reserves for potential credit losses are determined by establishing both specific and general reserves.
Specific reserves are based on management’s estimate of the probability of collection for certain troubled accounts. General reserves are established based on our historical experience of bad debt expense and the aging of our accounts receivable balances net of deferred revenue and specifically reserved accounts. If the financial condition of our customers were to deteriorate resulting in an impairment of their ability to make payments, additional allowances would be required.

Effect if Actual Results Differ from Assumptions

Although we believe that our approach to estimates and judgments as described herein is reasonable, actual results could differ and we may be exposed to increases or decreases in required reserves that could be material.

32


Software Development CostsJudgments and Uncertainties
Development costs incurred in the research and development of new software products and enhancements to existing software products are expensed as incurred until technological feasibility has been established. After technological feasibility is established with the completion of a working model of the enhancement or product, any additional development costs are capitalized in accordance with FASB ASC Topic985-20,Software, Costs of Computer Software to be provided and received bySold, Leased or Marketed,orASC 985-20. Such capitalized costs are amortized on a straight line basis over the parties,estimated economic life of the considerationrelated product, which is generally three years.
We perform an annual review of the recoverability of such capitalized software costs. At the time a determination is made that capitalized amounts are not recoverable based on the estimated cash flows to be exchanged,generated from the applicable software, any remaining capitalized amounts are written off.

Effect if Actual Results Differ from Assumptions

Although we believe that our approach to estimates and judgments as described herein is reasonable, actual results could differ and we may be exposed to increases or decreases in revenue that could be material.
GoodwillJudgments and Uncertainties
Goodwill is related to the NextGen Division and the mannerHSI, PMP, Sphere, and termsOpus acquisitions, which closed on May 20, 2008, October 28, 2008, August 12, 2009, and February 10, 2010, respectively.In accordance with FASB ASC Topic 350-20,Intangibles — Goodwill and Other, Goodwill, or ASC 350-20, we test goodwill for impairment annually at the end of settlement;

our first fiscal quarter, referred to as the annual test date. We will also test for impairment between annual test dates if an event occurs or circumstances change that would indicate the carrying amount may be impaired. Impairment testing for goodwill is performed at a reporting unit level, which is defined as an operating segment or one level below an operating segment (referred to as a component). A component of an operating segment is a reporting unit if the component constitutes a business for which discrete financial information is available and segment management regularly reviews the operating results of that component. An impairment loss would generally be recognized when the carrying amount of the reporting unit’s net assets exceeds the estimated fair value of the reporting unit.

The customer can be expected to satisfy its obligations under the contract;

Effect if Actual Results Differ from Assumptions

We can be expectedhave not made any material changes in the accounting methodology we use to perform our contractual obligations; and

assess impairment loss during the past three fiscal years.

Reliable estimates

The carrying values of progress towards completion can be made.

We measure completion using labor input hours. Costs of providing services, including services accounted for in accordance with SOP 81-1, are expensed as incurred.

If a situation occurs in which a contract is so short term that the consolidated financial statements would not vary materially from using the percentage-of-completion method or in which we are unable to make reliable estimates of progress of completion of the contract, the completed contract method is utilized.

Product returns are estimated in accordance with Statement of Financial Accounting Standards No. 48, “Revenue Recognition When Right of Return Exists” (SFAS 48). The Company also ensures that the other criteria in SFAS 48 have been met prior to recognition of revenue:

goodwill at March 31, 2010 were $46.2 million. We have determined that there was no risk of impairment to our goodwill as of March 31, 2010.

§

The price is fixed or determinable;

§

The customerWe do not believe there is obligated to pay anda reasonable likelihood that there are no contingencies surrounding the obligation or the payment;

§

The customer’s obligation would notwill be a material change in the eventfuture estimates or assumptions we use to test for impairment losses on goodwill and other intangible assets. However, if actual results are not consistent with our estimates or assumptions, we may be exposed to an impairment charge that could be material.

33


Business Combinations — Purchase Price Allocations

During the last three fiscal years, we completed three significant acquisitions:

In February 2010, we acquired Opus for $20.6 million.

In October 2008, we acquired PMP for $19.7 million, including transaction costs.

In May 2008, we acquired HSI for $15.6 million, including transaction costs.
Judgments and Uncertainties

In accordance with business combination accounting under FASB ASC Topic 805,Business Combinations, or ASC 805, we allocate the purchase price of theft or damageacquired businesses to the product;

tangible and intangible assets acquired and liabilities assumed based on estimated fair values. Our purchase price allocation methodology contains uncertainties because it requires management to make assumptions and to apply judgment to estimate the fair value of acquired assets and liabilities. Management estimates the fair value of assets and liabilities based upon quoted market prices, the carrying value of the acquired assets and widely accepted valuation techniques, including discounted cash flows and market multiple analyses. Unanticipated events or circumstances may occur which could affect the accuracy of our fair value estimates, including assumptions regarding industry economic factors and business strategies.

§

The customer has economic substance;

Effect if Actual Results Differ from Assumptions

§

The amount of returns can be reasonably estimated; and

§

We do not have significant obligationsbelieve there is a reasonable likelihood that there will be a material change in the future estimates or assumptions we use to complete the purchase price allocation and estimate the fair value of acquired assets and liabilities. However, if actual results are not consistent with our estimates or assumptions, we may be exposed to losses or gains that could be material.

Intangible AssetsJudgments and Uncertainties
Intangible assets consist of capitalized software costs, customer relationships, trade names and certain intellectual property. Intangible assets related to customer relationships and trade names arose in connection with the acquisition of HSI, PMP, Opus, and Sphere.These intangible assets were recorded at fair value and are stated net of accumulated amortization and impairments. Intangible assets are amortized over their remaining estimated useful lives, ranging from 3 to 9 years. Our amortization policy for future performanceintangible assets is based on the principles in order to bring about resaleFASB ASC Topic 350-30,Intangibles — Goodwill and Other, General Intangibles Other than Goodwill, or ASC 350-30, which requires that the amortization of intangible assets reflect the pattern that the economic benefits of the productintangible assets are consumed.
Effect if Actual Results Differ from Assumptions
Although we believe that our approach to estimates and judgments as described herein is reasonable, actual results could differ and we may be exposed to decreases in the fair value of our intangible assets, resulting in impairment charges that could be material.
Share-Based CompensationJudgments and Uncertainties
We have a stock-based compensation plan, which includes stock options and restricted stock units. See Note 2, “Summary of Significant Accounting Policies,” and Note 13, Consolidated Financial Statements of this Report for a complete discussion of our stock-based compensation programs.We apply the provisions of FASB ASC Topic 718,Compensation — Stock Compensation,or ASC 718, which requires the measurement and recognition of compensation expense for all share-based payment awards made to employees and directors based on estimated fair values. ASC 718 requires us to estimate the fair value of “Share-Based Awards,” to the share-based payment awards on the date of grant using an option-pricing model. We estimate the expected term of the option using historical exercise experience. We estimate volatility by using the customer.weighted average historical volatility of our common stock, which we believe approximates expected volatility. The risk free rate is the implied yield available on the U.S Treasury zero-coupon issues with remaining terms equal to the expected term. The expected dividend yield is the average dividend rate during a period equal to the expected term of the option. Those inputs are then entered into the Black Scholes model to determine the estimated fair value. The value of the portion of the award that is expected to vest is recognized as expense over the requisite service period in our Consolidated Statements of Income.

34


Share-Based Compensation (continued)Effect if Actual Results Differ from Assumptions
We do not believe there is a reasonable likelihood there will be a material change in the future estimates or assumptions we use to determine stock-based compensation expense. However, if actual results are not consistent with our estimates or assumptions, we may be exposed to changes in stock-based compensation expense that could be material.
Self-Insured LiabilitiesJudgments and Uncertainties
Effective January 1, 2010, the Company became self-insured with respect to healthcare claims, subject to stop-loss limits. The Company accrues for estimated self-insurance costs and uninsured exposures based on claims filed and an estimate of claims incurred but not reported as of each balance sheet date. However, it is possible that recorded accruals may not be adequate to cover the future payment of claims. Adjustments, if any, to estimated accruals resulting from ultimate claim payments will be reflected in earnings during the periods in which such adjustments are determined.
Our self-insured liabilities contain uncertainties because management is required to make assumptions and to apply judgment to estimate the ultimate cost to settle reported claims and claims incurred but not reported at the balance sheet date.

Effect if Actual Results Differ from Assumptions

We do not believe there is a reasonable likelihood that there will be a material change in the estimates or assumptions we use to calculate our self-insured liabilities. However, if actual results are not consistent with our estimates or assumptions, we may be exposed to losses or gains that could be material.


We have historically offered short-term rights of return of less than 30 days in certain sales arrangements. If we are able to estimate returns for these types of arrangements, revenue is recognized and these arrangements are recorded in the consolidated financial statements. If we are unable to estimate returns for these types of arrangements, revenue is not recognized in our consolidated financial statements until the rights of return expire.

Revenue related to sales arrangements which include the right to use software stored on the Company’s hardware are accounted for under the Emerging Issues Task Force Issue No. 00-3 “Application of AICPA Statement of Position 97-2 to arrangements that include the right to use software stored on another entity’s hardware”. EITF No. 00-3 requires that for software licenses and related implementation services to continue to fall under SOP No. 97-2, the customer must have the contractual right to take possession of the software without incurring a significant penalty and it must be feasible for the customer to either host the software themselves or through another third party. If an arrangement is not deemed to be accounted for under SOP 97-2, the entire arrangement is accounted for as a service contract in accordance with EITF Issue No. 00-21 “Revenue arrangements with multiple deliverables”. In that instance, the entire arrangement would be recognized as the hosting services are being performed.

From time to time, we offer future purchase discounts on our products and services as part of our sales arrangements. Pursuant to AICPA TPA 5100.51, discounts which are incremental to the range of discounts reflected in the pricing of the other elements of the arrangement, which are incremental to the range of discounts typically given in comparable transactions, and which are significant, are treated as an additional element of the contract to be deferred. Amounts deferred related to future purchase options are not recognized until either the customer exercises the discount offer or the offer expires.

Revenue is divided into two categories, “system sales” and “maintenance, EDI and other services”. Revenue in the system sales category includes software license fees, third party hardware and software, and implementation and training services related to purchase of the Company’s software systems. The majority of the revenue in the system sales category is related to the sale of software. Revenue in the maintenance, EDI and other services category includes, maintenance, EDI, follow on training and implementation services, annual third party license fees and other revenue.

Valuation of marketable securities. Marketable securities are classified as available-for-sale and accordingly are recorded at fair value, based on quoted market rates or on valuation analysis when appropriate, with unrealized gains and losses reflected as a separate component of shareholders’ equity titled accumulated other comprehensive income (loss), net of tax, until realized or until a determination is made that an other-than-temporary decline in market value has occurred. Factors considered in assessing whether an other-than-temporary impairment has occurred include: the nature of the investment; whether the decline in fair value is attributable to specific adverse conditions affecting the investment; the financial condition of the investee; the severity and the duration of the impairment; and whether the Company has the ability to hold the investment to maturity. When it is determined that an other-than-temporary impairment has occurred, the investment is written down to its market value at the end of the period in which it is determined that an other-than-temporary decline has occurred. The cost of marketable securities sold is based upon the specific identification method. In addition, the Company classifies marketable securities as current or non-current based upon whether such assets are reasonably expected to be realized in cash or sold or consumed during the normal operating cycle of the business. Realized gains or losses and other-than-temporary declines in the fair value of marketable securities are determined on a specific identification basis and reported in interest and other income, net, as incurred.

Allowance for Doubtful Accounts. We maintain allowances for doubtful accounts for estimated losses resulting from the inability of our customers to make required payments. We perform credit evaluations of our customers and maintain reserves for estimated credit losses. Reserves for potential credit losses are determined by establishing both specific and general reserves. Specific reserves are based on management’s estimate of the probability of collection for certain troubled accounts. General reserves are established based on our historical experience of bad debt expense and the aging of our accounts receivable balances net of deferred revenue and specifically reserved accounts. If the financial condition of our customers were to deteriorate resulting in an impairment of their ability to make payments, additional allowances would be required.

Software Development Costs. Development costs incurred in the research and development of new software products and enhancements to existing software products are expensed as incurred until technological feasibility has been established. After technological feasibility is established with the completion of a working model of the enhancement or product, any additional development


costs are capitalized in accordance with Statement of Financial Accounting Standards No. 86, “Accounting for the Costs of Computer Software to be Sold, Leased or Otherwise Marketed” (SFAS 86). Such capitalized costs are amortized on a straight line basis over the estimated economic life of the related product, which is generally three years. We perform an annual review of the recoverability of such capitalized software costs. At the time a determination is made that capitalized amounts are not recoverable based on the estimated cash flows to be generated from the applicable software, any remaining capitalized amounts are written off.

Share-Based Compensation. On April 1, 2006, we adopted Statement of Financial Accounting Standard No. 123R, “Share-Based Payment” (SFAS 123R) which requires the measurement and recognition of compensation expense for all share-based payment awards made to employees and directors based on estimated fair values. SFAS 123R supersedes our previous accounting under Accounting Principles Board Opinion No. 25, “Accounting for Stock Issued to Employees” (APB 25). SFAS 123R requires us to estimate the fair value of share-based payment awards on the date of grant using an option-pricing model. During fiscal year 2007 and 2008, we used the simplified method for estimating expected term equal to the midpoint between the vesting period and the contractual term. Prior to using the simplified method, we estimated the expected term of an option. We estimate volatility by using the weighted average historical volatility of our common stock, which we believe approximates expected volatility. The risk free rate is the implied yield available on the U.S Treasury zero-coupon issues with remaining terms equal to the expected term. The expected dividend yield is the average dividend rate during a period equal to the expected term of the option. Those inputs are then entered into the Black Scholes model to determine the estimated fair value. The value of the portion of the award that is expected to vest is recognized as expense over the requisite service period in our consolidated statement of income.

Research and Development Tax Credits. Management’s treatment of research and development tax credits represented a significant estimate which affected the effective income tax rate for the Company for the year ended March 31, 2008 and 2007. Research and development credits taken by the Company involve certain assumptions and judgments regarding qualified expenses under Internal Revenue Code Section 41. These credits are subject to examination by the federal and state taxing authorities.

During each of the years ended March 31, 2008 and 2007, we recognized approximately $0.8 million in credits related to research and development. The Company expects to capture this benefit on its tax returns.

Qualified Production Activities Deduction. Management’s treatment of this deduction represented an estimate that affected the effective income tax rate for the Company for the years ended March 31, 2008 and 2007. The deduction taken by the Company involved certain assumptions and judgments regarding the allocation of indirect expenses as prescribed under Internal Revenue Code Section 199.

During the years ended March 31, 2008 and 2007, we recognized approximately $3.1 million and $1.5 million, respectively, in deductions related to the qualified production activities deduction (QPAD) under Internal Revenue Code (IRS). The QPAD calculation was determined using interim guidance provided by proposed IRS Regulations and Notices. The Company expects to capture this benefit on its tax returns.

Overview of Our Results

Total Company• 

Our total revenue increased 18.7%18.9% and income from operations grew 16.7%4.6% on a consolidated basis for the year ended March 31, 2008. This performance2010. Revenue was drivenpositively impacted by growth in our NextGen Division,recurring revenue, including maintenance, EDI and RCM revenue, which grew 22.4%, 18.7% and 71.1% respectively, offset by decreaseshigher corporate expenses.
• Uncertainty over the final rules regarding incentive payments tied to the ARRA continued to negatively impact system sales revenue in revenue and operating incomefiscal year 2010. We have made investments in our QSI Divisionsales and higher corporate expenses.

marketing areas in anticipation of receiving the final rules related to the ARRA.

The• 

Our year over year growth in revenue and operating income for the company during the year ended March 31, 2008 trailed2010 was partially attributable to the growth rates achieved duringHSI and PMP acquisitions. HSI and PMP combined generated $42.7 million of revenue for fiscal year 2010 as compared to a total of $24.4 million of revenue for the ten and five months of respective results in fiscal year ended March 31, 2007 due in part to2009.
• Operating income was negatively impacted by a shift in revenue mix with an increased share of hardware, EDI, and RCM revenue, resulting in a decline in our gross profit margin. We also experienced higher selling, general and administrative expenses primarily due to higher selling related expenses incurred in preparation for the year, with hardware and EDI revenue accounting for a comparativelyARRA, which was enacted in February 2009, as well as higher percentage of revenue and system sales accounting for a comparatively lower percentage of revenue than the year prior.

corporate related expenses.

• 

We do not believe the revenue mix changes noted above represent a change in the overall purchasing environment. WeOn top of the potential benefits from the ARRA, we have benefited and hope to continue to benefit from the increased demands on healthcare providers for greater efficiency and lower costs, as well as increased adoption rates offor electronic medical records and other technology in the healthcare arena.

• While we expect to benefit from the increasing demands for greater efficiency as well as government support for increased adoption of electronic health records, the current economic environment, combined with unpredictability of the federal government’s plans to promote increased adoption of electronic medical records, makes the near term achievement of such benefits and, ultimately, their impact on system sales, uncertain.

35


NextGen Division

• 

NextGen Division revenue grew 21.3%increased 13.6% in the year ended March 31, 2010 and divisional operating income (excluding unallocated corporate expenses) increased 8.3% from operations increased 18.2%the year ended March 31, 2009. Organic revenue growth in the NextGen Division was 11.6% and 20.4% for the years ended March 31, 2010 and 2009, respectively.
• The acquisitions of Opus and Sphere in fiscal year 2010 added approximately $2.9 million in revenue for the year ended March 31, 2008.

2010 and $0.7 million in additional operating income in the same period a year ago.

The Divisions’• 

Recurring revenue, consisting of maintenance and EDI revenue, represented $111.9 million and accounted for 48.3% of total NextGen Division revenue during fiscal year over2010. In the same period a year growth inago, recurring revenue and operating income for the Company duringrepresented 44.3% of total NextGen Division revenue, or $90.3 million.
• During the year ended March 31, 2008 trailed the growth rates achieved during the year ended March 31, 2007 due in part to a shift in the revenue mix for the year, with hardware and EDI revenue accounting for a comparatively higher percentage of revenue and new systems sales accounting for a comparatively lower percentage of revenue than in the year prior.

Divisional headcount additions drove selling, general and administrative expenses to increase at a slightly faster pace than revenue as2010, we added staffing resources to departments including sales, marketing, support, software development, and administration andin anticipation of future growth from the ARRA. We intend to docontinue doing so in fiscal year 2009, as business conditions andfuture periods to maximize our opportunities from the hiring environment allow.

ARRA.

• 

Our goals include taking maximum advantage of future benefits related to the ARRA and continuing to further enhance and expand the marketing and sales of our existing products, developing new products for targeted markets, continuing to add new customers, selling additional software and services to existing customers, and expanding penetration of connectivity and other services to new and existing customers.

customers, and capitalizing on growth and cross selling opportunities within the Practice Solutions Division and the recently acquired acute care software product lines.

QSI Dental Division

• 

QSI Dental Division revenue decreased 3.3%increased 8.1% in the year ended March 31, 20082010 and Divisionaldivisional operating income decreased 16.6% (excluding unallocated corporate expenses) increased 2.2% from the year ended March 31, 2007. Divisional revenue and operating income performance for the Division, while below fiscal year 2007 levels, were within the Division’s historical performance range.

2009.

A drop• 

An increase in annualsystem sales revenue slight changesoffset by an increase in the Division’s sales mix in favor of lower margin hardwareselling, general and EDI products, and additional compensationadministrative expenses related to the passing of the Division’s lead executive were the chief contributors to the operating income decline.

results in fiscal year 2010.

• 

In July 2009, we licensed source code from PlanetDDS, Inc. that will allow us to deliver hosted, web-based SaaS practice management and clinical software solutions to the dental industry. The software solution will be marketed primarily to the multi-location dental group practice market in which the Division has historically been a dominant player. This new software solution (NextDDS) brings the QSI Dental Division to the forefront of the emergence of internet based applications and cloud computing and represents a significant growth opportunity for us to sell both to our existing customer base as well as new customers.
• Our goalsgoal for the QSI Dental Division include maximizing revenue andis to maximize profit performance given the constraints presentrepresented by a relatively weak purchasing environment in the dental group practice market while taking advantage of opportunities with the new NextDDS product. The QSI Dental Division also intends to leverage the NextGen Division’s target market.

sales force to sell its dental electronic medical records software to practices that provide both medical and dental services such as Federal Qualified Health Centers, which are receiving grants as part of the ARRA.
Practice Solutions Division
• Practice Solutions Division revenue increased 67.5% in the year ended March 31, 2010 and divisional operating income (excluding unallocated corporate expenses) decreased 5.7% from the year ended March 31, 2009. A significant driver of the increase in revenue was that fact that fiscal year 2010 included a full year of results for HSI and PMP versus approximately ten and five months of respective results in fiscal year 2009. The Practice Solutions Division also benefited from organic growth achieved through cross selling RCM services to existing NextGen Division customers.


36


• Operating income as a percentage of revenue declined to approximately 5.4% of revenue versus 9.5% of revenue primarily as a result of a smaller amount of software sales to RCM customers compared to the prior year as well as costs related to transitioning to the NextGen platform including training of staff and initial set up and other costs related to achieving higher production volumes.
The following table sets forth for the periods indicated the percentage of net revenue represented by each item in our consolidated statementsConsolidated Statements of income.


(Unaudited)


Year Ended March 31,


2008


2007


2006


Revenues:


Software, hardware and supplies


40.9

%

43.8

%

46.0

%

Implementation and training services


7.2


7.8


9.5


System sales


48.1


51.6


55.5


Maintenance


30.3


26.7


26.1


Electronic data interchange services


12.0


10.8


11.1


Other services


9.6


10.9


7.3


Maintenance, EDI and other services


51.9


48.4


44.5


Total revenue


100.0


100.0


100.0


Cost of revenue:


Software, hardware and supplies


5.8


5.4


6.8


Implementation and training services


5.5


5.5


6.8


Total cost of system sales


11.3


10.9


13.6


Maintenance


6.7


7.5


9.2


Electronic data interchange services


8.5


7.7


7.2


Other services


7.0


6.2


3.4


Total cost of maintenance, EDI and other services


22.2


21.4


19.8


Total cost of revenue


33.5


32.3


33.4


Gross profit


66.5


67.7


66.6


Selling, general and administrative


28.6


28.8


29.8


Research and development


6.1


6.5


6.8


Income from operations


31.8


32.4


30.0


Interest income


1.4


2.1


1.8


Other income


0.5


0.0


0.0


Income before provision for income taxes


33.7


34.5


31.8


Provision for income taxes


12.3


13.3


12.2


Net income


21.4

%

21.1

%*

19.6

%


* doesIncome (certain percentages below may not footsum due to roundingrounding):

             
  Year Ended March 31, 
  2010  2009  2008 
  (Unaudited) 
 
Revenues:            
Software, hardware and supplies  30.8%  34.8%  40.9%
Implementation and training services  4.9   5.4   7.2 
             
System sales  35.7   40.2   48.1 
Maintenance  30.6   29.7   30.3 
Electronic data interchange services  12.0   12.0   12.0 
Revenue cycle management and related services  12.6   8.7   0.5 
Other services  9.2   9.3   9.1 
             
Maintenance, EDI, RCM and other services  64.3   59.8   51.9 
             
Total revenues  100.0   100.0   100.0 
             
Cost of revenue:            
Software, hardware and supplies  4.2   5.4   5.8 
Implementation and training services  4.1   4.2   5.5 
             
Total cost of system sales  8.3   9.6   11.4 
Maintenance  4.6   4.8   6.7 
Electronic data interchange services  8.7   8.7   8.5 
Revenue cycle management and related services  9.5   6.0   0.3 
Other services  7.0   7.1   6.7 
             
Total cost of maintenance, EDI, RCM and other services  29.7   26.6   22.1 
Total cost of revenue  38.0   36.2   33.5 
             
Gross profit  62.0   63.8   66.5 
Operating expenses:            
Selling, general and administrative  29.8   28.3   28.6 
Research and development costs  5.7   5.6   6.1 
Amortization of acquired intangible assets  0.6   0.4   0.0 
             
Total operating expenses  36.1   34.3   34.6 
Income from operations  25.9   29.5   31.8 
Interest income  0.1   0.5   1.4 
Other income (expense)  0.1   (0.1)  0.5 
             
Income before provision for income taxes  26.1   29.9   33.8 
Provision for income taxes  9.5   11.1   12.3 
             
Net income  16.6%  18.8%  21.5%


37


Comparison of Fiscal Years Ended March 31, 20082010 and March 31, 20072009

Net Income.For the year ended March 31, 2008,2010, our net income was $40.1$48.4 million or $1.47$1.69 per share on a basic and $1.44$1.68 per share on a fully diluted basis. In comparison, we earned $33.2$46.1 million or $1.24$1.65 per share on a basic and $1.21$1.62 per share on a fully diluted basis in the year ended March 31, 2007.2009. The increase in net income for the year ended March 31, 20082010 was achieved primarily through the following:

a 18.7%• 

an 18.9% increase in consolidated revenue;

revenue, including an increase of $27.7 million in revenue from our NextGen Division and an increase of $17.4 million in revenue from our Practice Solutions Division;

• 

a 21.3%13.6% increase in NextGen Division revenue, which accounted for 91.4%79.4% of consolidated revenue; and

approximately $1.0 million gain on life insurance proceeds the Company recorded, which was• 

an increase of recurring revenue, including RCM, maintenance, and EDI revenue, offset by additional compensation expensea decline in our gross profit margin due primarily to both a shift in revenue mix with increased RCM revenue and lower gross margins related to RCM revenue;
• an increase in selling, general and administrative expenses as a percentage of approximately $0.2 million. The additional compensation expense was recordedrevenue related to higher selling and corporate expenses and
• a decrease in Selling, General and Administrative Expenses andinterest income primarily due significantly lower interest rates, as compared to the insurance proceeds were recorded as Other Incomeprior year, on money market accounts in the Consolidated Statementwhich we invest a majority of Income.

our cash.


The above increases to net income were offset by a decline in gross profit margin resulting from a greater proportion of revenue being derived from hardware and EDI revenue which have relatively lower gross margin percentages. The gross profit margin declined to 66.5% in the year ended March 31, 2008 versus 67.7% in the prior year period.

Revenue.  Revenue for the year ended March 31, 20082010 increased 18.7%18.9% to $186.5$291.8 million from $157.2$245.5 million for the year ended March 31, 2007. Revenue for2009. NextGen Division revenue increased 13.6% to $231.6 million from $204.0 million in the year ended March 31, 2007 increased 31.8% to $157.2 million from $119.3 million for the year ended March 31, 2006. NextGen2009 while QSI Dental Division revenue increased 21.3% from $140.6 million to approximately $170.5 million in the period ended March 31, 2008, while QSI Division revenue decreased by 3.3%8.1% during that same period to $17.1 million from $16.6$15.9 million and Practice Solutions Division revenue increased 67.5% during that same period to $16.0$43.1 million from $25.7 million.

Practice Solutions Division revenue was impacted positively in fiscal year 2010 as a result of including a full year of results versus approximately ten and five months of results for HSI and PMP, respectively, in fiscal year 2009.

We divide revenue into two categories, “system sales” and “maintenance, EDI, RCM and other services”.services.” Revenue in the system sales category includes software license fees, third party hardware and software, and implementation and training services related to purchase of the Company’sour software systems. The majority of the revenue in the system sales category is related to the sale of software. Revenue in the maintenance, EDI, RCM and other services category includes maintenance, EDI, RCM, follow-on training and implementation services, annual third party license fees, hosting and other services revenue. Maintenance revenue includes amounts initially deferred in conjunction with new customer arrangements and subsequently amortized and billings to existing customers.

System SalesSales..  Revenue earned from Company-wide sales of systems for the year ended March 31, 20082010 increased 10.8%5.4% to $89.8$104.1 million from $81.0$98.8 million in the prior year.

Our increase in revenue from sales of systems was principally the result of a 12.2%5.1% increase in category revenue at our NextGen Division whose sales in this category grew from $77.7$93.3 million during the year ended March 31, 20072009 to $87.1$98.1 million during the year ended March 31, 2008.2010. This increase was driven primarily by higher sales of NextGenemrambulatory practice management and NextGenepmhealth records software to both new and existing clients, as well as an increaseincreases in the delivery ofrevenue related to implementation services offset by a decline in the sale of related hardware, third party software and supplies.

training services.

Systems sales revenue in the QSI Dental Division decreasedincreased to approximately $2.6$3.9 million in the year ended March 31, 20082010 from $3.4$3.0 million in the year ended March 31, 2007.2009 while systems sales revenue in the Practice Solutions Division decreased to approximately $2.1 million in the year ended March 31, 2010 from $2.4 million in the year ended March 31, 2009. Systems sales in the QSI Dental Division was positively impacted by greater joint sales of dental and medical software to Federally Qualified Health Centers.


38


The following table breaks down our reported system sales into software, hardware, third party software, supplies, and implementation and training services components by division:


Software


Hardware, Third
Party Software
and Supplies


Implementation
and Training
Services


Total System
Sales


Year ended March 31, 2008


QSI Division


$

360


$

1,134


$

1,154


$

2,648


NextGen Division


69,276


5,593


12,252


87,121


Consolidated


$

69,636


$

6,727


$

13,406


$

89,769


Year ended March 31, 2007


QSI Division


$

355


$

2,356


$

655


$

3,366


NextGen Division


62,957


3,203


11,522


77,682


Consolidated


$

63,312


$

5,559


$

12,177


$

81,048


     Hardware, Third
  Implementation
    
     Party Software
  and Training
  Total System
 
  Software  and Supplies  Services  Sales 
 
Year ended March 31, 2010                
QSI Dental Division $1,699  $1,409  $825  $3,933 
NextGen Division  79,832   4,944   13,284   98,060 
Practice Solutions Division  1,877      267   2,144 
                 
Consolidated $83,408  $6,353  $14,376  $104,137 
                 
Year ended March 31, 2009                
QSI Dental Division $915  $1,171  $938  $3,024 
NextGen Division  74,128   6,775   12,437   93,340 
Practice Solutions Division  2,397         2,397 
                 
Consolidated $77,440  $7,946  $13,375  $98,761 
                 
NextGen Division software license revenue increased 10.0%7.7% between the year ended March 31, 20072009 and the year ended March 31, 2008.2010. The Division’s software revenue accounted for 79.5%81.4% of Divisionaldivisional system sales revenue during the year ended March 31, 2008, a decrease from 81.0% in the prior year period.

Sales of additional licenses2010, compared to existing customers grew to $31.3 million79.4% during the year ended March 31, 2008 compared2009. Software license revenue growth continues to $23.3be an area of primary emphasis for the NextGen Division. The Opus acquisition contributed approximately $0.9 million to the NextGen Division’s software license revenue during the prior year as an increasing number of customers who expanded their use of our software in their practices and purchased additional licenses.

ended March 31, 2010.

During the year ended March 31, 2008, 6.4%2010, 5.0% of the NextGen Division’s system sales revenue was represented by hardware and third party software compared to 4.1% in7.3% during the prior year.year ended March 31, 2009. The number of customers who purchase hardware and third party software and the dollar amount of hardware and third party software revenue fluctuates each quarter and year depending on the needs of


customers. The inclusion of hardware and third party software in the Division’s sales arrangements is typically at the request of the customer and is not a priority focus for us.

Implementation and training revenue related to system sales at the NextGen Division increased 6.3%6.8% in the year ended March 31, 20082010 compared to the year ended March 31, 2007. The growth in implementation and training revenue is the result of increases in the amount of implementation and training services rendered to our new customers. Implementation and training revenue at the NextGen Division decreased its share of Divisional system sales revenue to 14.0% in the year ended March 31, 2008 from 14.8% in the year ended March 31, 2007.2009. The amount of implementation and training services revenue in any given quarter is dependent on several factors, including timing of customer implementations, the availability of qualified staff, and the mix of services being rendered. The number of implementation and training staff increased during the year ended March 31, 20082010 versus 20072009 in order to accommodate the increased amount of implementation services sold in conjunction with increased software sales. In order to achieve growth in this area, additional staffing increases and additional training facilities are anticipated, though actual future increases in revenue and staff will depend upon the availability of qualified staff, business mix and conditions, and our ability to retain current staff members.

The NextGen Division’s growth has come in part from investments in sales and marketing activities including hiring additional sales representatives,a revamped NextGen.com Web site, new NextGen logo, new marketing campaigns, trade show attendance, and other expanded advertising and marketing expenditures. We have also benefited from winning numerous industry awards for the NextGen Division’s flagship NextGenemrehr and NextGenepm software products and the apparent increasing acceptance of electronic medical records technology in the healthcare industry.

For the QSI Dental Division, total system sales decreased by approximately $0.7 millionincreased 30.1% in the year ended March 31, 20082010 compared to the year ended March 31, 2007. We do not presently foresee any material changes2009. Systems sales in the business environment forQSI Dental Division were positively impacted by greater joint sales of dental and medical software to Federally Qualified Health Centers. In addition, the QSI Division with respectbegan selling the SaaS based NextDDS product during the year ended March 31, 2010.


39


For the Practice Solutions Division, total system sales decreased by 10.6% in the year ended March 31, 2010 compared to the constrained environment that has been in place foryear ended March 31, 2009. Systems sales revenue within the past several years.

Practice Solutions Division is composed of sales to existing RCM customers only.

Maintenance, EDI, Revenue Cycle Management and Other.Other Services.  For the year ended March 31, 2010, Company-wide revenue from maintenance, EDI, RCM and other services grew 27.1%27.9% to $96.7$187.7 million from $146.8 million for the year ended March 31, 2008 from $76.1 million for the year ended March 31, 2007.2009. The increase in this category resulted principally from an increase in maintenance, EDI, RCM and other services revenue generated from the NextGen Division’s client base.and Practice Solutions Divisions. Total NextGen Division maintenance revenue for the year ended March 31, 20082010 grew 41.3%24.9% to $49.3$81.9 million from $34.9$65.6 million in the prior year. The Opus acquisition contributed $1.2 million to the NextGen Division’s maintenance revenue during the fiscal year ended March 31, 2010. NextGen Division EDI revenue grew 21.2% to $30.0 million compared to $24.8 million in the prior year. RCM revenue grew to $36.7 million from $21.4 million in the prior year while EDIprimarily as a result of increases in RCM revenue grew 42.9% to $17.9 millionexisting customers as well as including a full year of results for theHSI and PMP in fiscal year ended March 31, 2008 compared to $12.5 million2010 versus approximately ten and five months of respective results in the prior year.fiscal year 2009. Other services revenue for the NextGen Division, which consists primarily of third party annual software license renewals, timeconsulting services and materials billings, travel reimbursements,hosting services increased 6.9% to $21.7 million from $20.3 million a year ago. QSI Dental Division maintenance, EDI and other services grew 4.4%revenue increased 2.9% to $16.2$13.2 million for the year ended March 31, 20082010 compared to $15.5 million a year ago. QSI Division maintenance revenue increased 1.5% to $7.2 million for the year ended March 31, 2007 compared to $7.1$12.8 million in the prior year while divisional EDI revenue increased by approximately 1.0% to $4.6 million for the year ended March 31, 2008 compared to $4.5 million in the prior year. Other revenue for the QSI Division was essentially flat for the year ended March 31, 2008 compared to a year ago.

The following table details maintenance, EDI, RCM, and other services revenue by category for the years ended March 31, 20082010 and 2007:


Maintenance


EDI


Other


Total


Year ended March 31, 2008


QSI Division


$

7,186


$

4,564


$

1,639


$

13,389


NextGen Division


49,269


17,886


16,187


83,342


Consolidated


$

56,455


$

22,450


$

17,826


$

96,731


Year ended March 31, 2007


QSI Division


$

7,081


$

4,529


$

1,615


$

13,225


NextGen Division


34,867


12,520


15,505


62,892


Consolidated


$

41,948


$

17,049


$

17,120


$

76,117


2009:

                     
        Revenue Cycle
       
  Maintenance  EDI  Management  Other  Total 
 
Year ended March 31, 2010                    
QSI Dental Division $7,217  $5,038  $  $940  $13,195 
NextGen Division  81,867   29,997      21,697   133,561 
Practice Solutions Division  108      36,665   4,145   40,918 
                     
Consolidated $89,192  $35,035  $36,665  $26,782  $187,674 
                     
Year ended March 31, 2009                    
QSI Dental Division $7,167  $4,766  $  $894  $12,827 
NextGen Division  65,559   24,756      20,299   110,614 
Practice Solutions Division  136      21,431   1,746   23,313 
                     
Consolidated $72,862  $29,522  $21,431  $22,939  $146,754 
                     
The following table providesgrowth in maintenance revenue for the number of billing sites which were receivingNextGen Division has come from new customers that have been added each quarter, existing customers who have purchased additional licenses, and our relative success in retaining existing maintenance services ascustomers. NextGen Division’s EDI revenue growth has come from new customers and from further penetration of the last business dayDivision’s existing customer base. The growth in RCM is a result of the year ended March 31, 2008HSI and 2007 respectively, as well asPMP acquisitions and future growth is expected from cross selling opportunities between the number of billing sites receivingcustomer bases. We intend to continue to promote maintenance, EDI and RCM services during the last month of each respective period at each division of our company. The table presents summary information onlyto both new and includes billing entities added and removed for any reason. Note also that a single client may include one or multiple billing sites.

existing customers.


NextGen


QSI


Consolidated


Maintenance


EDI


Maintenance


EDI


Maintenance


EDI


March 31, 2007


982


769


257


173


1,239


942


Billing sites added


194


289


9


29


203


318


Billing sites removed


(47

)


(65

)


(15

)


(37

)


(62

)


(102

)


March 31, 2008


1,129


993


251


165


1,380


1,158


Cost of revenue.Revenue.  Cost of revenue for the year ended March 31, 20082010 increased 23.1%24.7% to $62.5$110.8 million from $50.8$88.9 million for the year ended March 31, 2007, while2009 and the cost of revenue as a percentage of net revenue increased to 33.5%38.0% from 32.3%. Our consolidated gross profit is affected by the level of hardware content included in system sales, the percentage of EDI revenue in our overall sales mix, and certain headcount expenses directly related36.2% due to the fact that the rate of growth in cost of delivering our products and services. Consolidated gross profitrevenue grew faster than the aggregate revenue growth rate for fiscal year 2008 was impacted by the decline in gross profit percentage at the NextGen Division, offset by a slight increase in gross profit percentage at the QSI Division.Company.


40


The following table details revenue and cost of revenue on a consolidated and divisional basis for the years ended March 31, 20082010 and 2007:


Year Ended March 31,


2008


%


2007


%


QSI Division


Revenue


$

16,037


100.0

%

$

16,589


100.0

%

Cost of revenue


7,545


47.0

%


7,847


47.3

%


Gross profit


$

8,492


53.0

%

$

8,742


52.7

%


NextGen Division


Revenue


$

170,463


100.0

%

$

140,576


100.0

%

Cost of revenue


54,956


32.2

%


42,937


30.5

%


Gross profit


$

115,507


67.8

%

$

97,639


69.5

%


Consolidated


Revenue


$

186,500


100.0

%

$

157,165


100.0

%

Cost of revenue


62,501


33.5

%


50,784


32.3

%


Gross profit


$

123,999


66.5

%

$

106,381


67.7

%


2009:

                 
  Year Ended March 31, 
  2010  %  2009  % 
 
QSI Dental Division                
Revenue $17,128   100.0% $15,851   100.0%
Cost of revenue  7,788   45.5%  7,582   47.8%
                 
Gross profit $9,340   54.5% $8,269   52.2%
                 
NextGen Division                
Revenue $231,621   100.0% $203,954   100.0%
Cost of revenue  73,534   31.7%  65,311   32.0%
                 
Gross profit $158,087   68.3% $138,643   68.0%
                 
Practice Solutions Division                
Revenue $43,062   100.0% $25,710   100.0%
Cost of revenue  29,485   68.5%  15,997   62.2%
                 
Gross profit $13,577   31.5% $9,713   37.8%
                 
Consolidated                
Revenue $291,811   100.0% $245,515   100.0%
Cost of revenue  110,807   38.0%  88,890   36.2%
                 
Gross profit $181,004   62.0% $156,625   63.8%
                 
Gross profit margins at the NextGen Division for the year ended March 31, 2008 decreased2010 increased slightly to 67.8%68.3% from 69.5% primarily due to an increase in68.0% from the proportionate level of hardware and third party software content included in revenue. The QSI Division’s gross profit margin increased to 53.0% from 52.7% between the yearsyear ended March 31, 20082009 primarily as a result of a lower amount of hardware revenue in fiscal year 2010 versus fiscal year 2009. Gross profit margins at the QSI Dental Division for the year ended March 31, 2010 increased to 54.5% from 52.2% for the year ended March 31, 2009 also as result of lower percentage of payroll and 2007 primarily due to a decreaserelated benefits in system sales in fiscal year 2010 versus fiscal year 2009. Gross margin in the levelPractice Solutions Division declined as a result of hardware and third partya smaller proportion of software contentrevenue included in revenue.

revenue versus the prior year as well as costs related to transitioning to the NextGen Division platform and otherramp-up costs.

The following table details the individual components of cost of revenue and gross profit as a percentage of total revenue on a consolidated and divisional basis for the years ended March 31, 2010 and 2009:
                         
  Hardware,
  Payroll and
             
  Third Party
  Related
        Total Cost of
  Gross
 
  Software  Benefits  EDI  Other  Revenue  Profit 
 
Year ended March 31, 2010                        
QSI Dental Division  8.5%  13.8%  16.0%  7.2%  45.5%  54.5%
NextGen Division  2.5%  13.2%  9.5%  6.5%  31.7%  68.3%
Practice Solutions Division  0.5%  43.6%  1.1%  23.3%  68.5%  31.5%
                         
Consolidated  2.5%  17.7%  8.7%  9.1%  38.0%  62.0%
                         
Year ended March 31, 2009                        
QSI Dental Division  7.6%  19.8%  17.1%  3.3%  47.8%  52.2%
NextGen Division  3.9%  11.0%  9.1%  8.0%  32.0%  68.0%
Practice Solutions Division  0.2%  45.0%  0.0%  17.0%  62.2%  37.8%
                         
Consolidated  3.7%  15.1%  8.4%  9.0%  36.2%  63.8%


41


The increase in our companyconsolidated cost of revenue as a percentage of revenue between the year ended March 31, 2010 and our two divisions:

the year ended March 31, 2009 is primarily attributable to an increase in RCM revenue, which carries higher payroll and related benefits as a percentage of revenue and higher consolidated EDI costs, offset by a decrease in hardware and third party software as a percentage of revenue. Other expense, which consists of outside service costs, amortization of software development costs and other costs, increased slightly to 9.1% of total revenue during the year ended March 31, 2010 from 9.0% of total revenue during the year ended March 31, 2009.


Hardware,
Third Party
Software


Payroll and
related
Benefits


Other


Total Cost
of Revenue


Gross Profit


Year ended March 31, 2008


QSI Division


8.0

%


19.1

%


20.0

%


47.0

%


53.0

%


NextGen Division


3.8

%


11.2

%


17.3

%


32.2

%


67.8

%


Consolidated


4.2

%


11.8

%


17.5

%


33.5

%


66.5

%


Year ended March 31, 2007


QSI Division


10.0

%


17.3

%


20.0

%


47.3

%


52.7

%


NextGen Division


3.1

%


11.9

%


15.5

%


30.5

%


69.5

%


Consolidated


3.8

%


12.4

%


16.1

%


32.3

%


67.7

%


During the year ended March 31, 2008,2010, hardware and third party software constituted a largersmaller portion of consolidated cost of revenue compared to the prior year period.period in the NextGen Division. The number of customers who purchase hardware and third party software and the dollar amount of hardware and third party software purchased fluctuates each quarter depending on the needs of the customers and is not a priority focus for us.

Our payroll and benefits expense associated with delivering our products and services decreasedincreased to 11.8%17.7% of consolidated revenue forin the year ended March 31, 20082010 compared to 12.4%15.1% during the prior year ended March 31, 2007. 2009 primarily due to inclusion of a full year of HSI and PMP transactions in fiscal year 2010 versus a partial period in fiscal year 2009. RCM is a service business, which inherently has higher percentage of payroll costs as a percentage of revenue.
The absolute level of consolidated payroll and benefit expenses grew from $19.6$37.1 million in the year ended March 31, 20072009 to $22.1$51.8 million in the year ended March 31, 2008,2010, an increase of 13%39.4% or $2.5approximately $14.6 million. Of the $14.6 million primarily dueincrease, approximately $7.2 million of the increase is related to additionsthe Practice Solutions Division, which included a full year of HSI and PMP expenses during fiscal year 2010 versus approximately ten and five months of respective expense in fiscal year 2009. For the NextGen Division, an increase of approximately $8.2 million was related to relatedincreased headcount and payroll and benefits expense associated with delivering products and services in the NextGen Division. Payroll and benefits expense associated with delivering products and services in the QSI Dental Division increased on a percentage of revenue basis.decreased $0.7 million from $3.1 million in the year ended March 31, 2009 to $2.4 million in the year ended March 31, 2010. The application of SFAS 123R in fiscal year 2008 and 2007ASC 718 added approximately $0.5$0.1 million and $0.2 million in compensation expense to consolidated cost of revenue in both fiscal years.

the years ended March 31, 2010 and 2009, respectively.

As a result of the foregoing events and activities, the gross profit percentage for the Company decreased for the year ended March 31, 2010 versus the prior year.
We anticipate continued additions to headcount in the NextGen Division in areas related to delivering products and services in future periods but due to the uncertainties in the timing of our sales arrangements, our sales mix, the acquisition and training of qualified personnel, and other issues, we cannot accurately predict if related headcount expense as a percentage of revenue will increase or decrease in the future.

We do not currently intend to make any significant changes to related headcount at the QSI Division.

“Other”, which consists of outside service costs, amortization of software development costs, hosting service costs and other service costs, increased to 17.5% of revenue during the year ended March 31, 2008 from 16.1% during the year ended March 31, 2007.

Should the NextGen Division continue to represent a major and or increasing share of our revenue, our consolidated gross margin percentages should move in concert with those of the NextGen Division.

Selling, General and Administrative Expenses.  Selling, general and administrative expenses for the year ended March 31, 20082010 increased 17.5%25.3% to $53.3$87.0 million as compared to $45.3$69.4 million for the year ended March 31, 2007.2009. The increase in the amount of suchthese expenses resulted primarily from increasesa:
• $9.9 million increase in salaries and related expenses in the NextGen Division primarily as a result of headcount additions;
• $2.5 million increase in marketing and trade shows in the NextGen Division;
• $1.5 million increase from the acquisition of Sphere and Opus;
• $3.3 million increase in corporate related expenses, primarily as a result of headcount additions, and
• $0.4 million increase in other selling and administrative expenses.
The application of $3.6ASC 718 added approximately $1.9 million and $1.5 million in salaries, commissions,compensation expense to selling, general and related benefitsadministrative expenses for the year ended March 31, 2010 and 2009, respectively, and is included in the NextGen Division, $1.7 million in selling related expenses in the NextGen Division, $1.0 million in travel related costs in the NextGen Division, $0.8 million in other general expenses in the NextGen Division and $0.9 million in increased corporate related expenses. The increase in corporate expenses was primarily composed of salaries and related benefits.aforementioned amounts. Selling, general and administrative expenses as a percentage of revenue decreasedincreased from 28.9%28.3% in the year ended March 31, 20072009 to 28.6%29.8% in the year ended March 31, 2008 due in to the fact that revenue grew faster than selling, general and administrative expense for the Company.2010.


42


The application of SFAS 123R in fiscal year 2008 and 2007 added approximately $2.5 million in compensation expense to consolidated selling, general and administrative expenses and is included in the aforementioned amounts.


We anticipate increased expenditures for trade shows, advertising and the employment of additional sales and administrative staff at the NextGen Division. We also anticipate future increases in corporate expenditures being made in a wide range of areas including but not limited to staffing and professional services. While we expect selling, general and administrative expenses to increase on an absolute basis, we cannot accurately predict the impact these additional expenditures will have on selling, general and administrative expenses as a percentage of revenue.

Research and Development Costs.  Research and development costs for the years ended March 31, 20082010 and 20072009 were $11.4$16.5 million and $10.2$13.8 million, respectively. The increaseincreases in research and development costs was primarilyexpenses were due in part to increased investment in the NextGen Division product line. Additionally, the application of SFAS 123R in fiscal year 2008 and 2007ASC 718 added approximately $0.8$0.1 million and $0.2 million in both periods,the years ended March 31, 2010 and 2009, respectively, in compensation expense to research and development costs, net of amounts capitalized as software development in those fiscal years. Additions to capitalized software costs offset research and development costs. For the year ended March 31, 2008, $6.02010, $7.9 million was added to capitalized software costs while $5.0$5.9 million was capitalized during the year ended March 31, 2007.2009. Research and development costs as a percentage of net revenue decreasedincreased to 6.1%5.7% in the year ended March 31, 20082010 from 6.5%5.6% in the year ended March 31, 2007 primarily due to revenue growing at a faster rate than the increase in research and development costs.2009. Research and development costsexpenses are expected to continue at or above current dollar levels.

Amortization of Acquired Intangible Assets.  Amortization expense related to acquired intangible assets for the years ended March 31, 2010 and 2009 were $1.8 million and $1.0 million, respectively. The increase in amortization expense is primarily due to the addition of customer relationships and software technology intangible assets, which were acquired through the acquisitions of Opus and Sphere during fiscal year 2010.
Interest Income.  Interest income for the year ended March 31, 20082010 decreased to $2.7$0.2 million compared to $3.3$1.2 million in the year ended March 31, 2007. Interest income2009 primarily due to significantly lower interest rates received on the Company’s cash investments, which are primarily in institutional money market accounts. Short term interest rates were at historic lows for most of the year ended March 31, 2008 decreased primarily due to (i) a greater proportion of funds invested in tax favored auction rate securities which offer lower interest rates but higher after-tax yields compared to money market or short term U.S. Treasuries, and (ii) comparatively lower short term interest rates in the year ended March 31, 2008 versus 2007.

2010.

Our investment policy is determined by our Board of Directors. We currently maintain our cash in very liquid short term assets including tax exempt and taxable money market funds and 30-60 day treasury billsfunds. We owned approximately $7.2 million in ARS as well asof March 31, 2010, which are illiquid due to the auction rate securities (ARS).

failures in the ARS market. Our Board of Directors continues to review alternate uses for our cash including, but not limited to, payment of a special dividend, initiation of a stock buyback program, an expansion of our investment policy to include investments with longer maturities of greater than 90 days, or other items. Additionally, it is possible that we will utilize some or all of our cash to fund acquisitions or other similar business activities. Any or all of these programs could significantly impact our investment income in future periods.

Other Income.Income (Expense).  Other income (expense) for the year ended March 31, 2008 was approximately $1.0 million. There was no Other income2010 consists of gains and losses in fair value recorded for the year ended March 31, 2007. The Companyon our ARS investments as well as on our ARS put option rights. We recorded aan overall gain on life insurance proceeds as a resultour ARS and ARS put option rights of the passing of Gregory Flynn, Executive Vice President and General Manager of the Company’s QSI Division. Mr. Flynn participated in the Company’s deferred compensation plan which is funded through the purchase of life insurance policies with the Company named as beneficiary.

approximately $0.3 million.

Provision for Income Taxes.  The provision for income taxes for the year ended March 31, 20082010 was approximately $22.9$27.8 million as compared to approximately $21.0$27.2 million for the prior year. The effective tax rates for fiscal 2008years 2010 and 20072009 were 36.4%36.5% and 38.7%37.1%, respectively. The provision for income taxes for the years ended March 31, 20082010 and 20072009 differs from the combined statutory rates primarily due to the impact of varying state income tax rates, research and development tax credits, the qualified production activities deduction, and exclusions for company-ownedCompany-owned life insurance proceeds and tax-exempt interest income. The change in the effective rate for the year ended March 31, 2008 also2010 includes an increase in the benefit from the qualified production activities deduction which was mostly offset by non-deductible option expense related to incentive stock options.

and a decrease in the state income tax expense.

During the year ended March 31, 20082010 and 2007,2009, we claimed research and development tax credits of approximately $0.8$0.7 million in both years.and $1.0 million, respectively. The Company also claimed the qualified production activities deduction under Section 199 of the Internal Revenue Code (“IRC”) of approximately $3.1$4.1 million and $1.5$2.7 million during the years ended March 31, 20082010 and 2007,2009, respectively. Research


and development credits and the qualified production activities income deduction taken by us involve certain assumptions and judgments regarding qualification of expenses under the relevant tax code provision.


43


Comparison of Fiscal Years Ended March 31, 20072009 and March 31, 20062008

During fiscal year 2010, as a result of certain organizational changes, the composition of the Company’s NextGen Division was revised to exclude the former NextGen Practice Solutions unit and the Company’s RCM entities (HSI and PMP), both of which are now administered and aggregated in the Company’s Practice Solutions Division. Following the reorganization, the Company now operates three reportable operating segments (not including Corporate), comprised of the NextGen Division, the QSI Dental Division and the Practice Solutions Division. During fiscal year 2009, we strengthened our position in the RCM market with the acquisitions of HSI and PMP, which closed on May 20, 2008 and October 28, 2008, respectively. Prior to fiscal year 2009, the Company had no material operations in the RCM area and as such, fiscal year 2008 result of operations are not re-casted to reflect the change in reportable segments established in fiscal year 2010. Further for purposes of the presentation of the comparison of fiscal years ended March 31, 2009 and March 31, 2008, the tables and discussion therein are not re-casted to reflect the change in reportable segments. See the presentation of the comparison of fiscal years ended March 31, 2010 and March 31, 2009 for re-casted reportable segment results for fiscal year 2009.
Net Income.For the year ended March 31, 2007,2009, our net income was $33.2$46.1 million or $1.24$1.65 per share on a basic and $1.21$1.62 per share on a fully diluted basis. In comparison, we earned $23.3$40.1 million or $0.88$1.47 per share on a basic and $0.85$1.44 per share on a fully diluted basis in the year ended March 31, 2006.2008. The increase in net income for the year ended March 31, 20072009 was achieved primarily through the following:

• 

a 31.8%31.6% increase in consolidated revenue;

revenue, including $21.4 million in RCM revenue from our recently acquired entities;

• 

a 35.5%34.7% increase in NextGen Division revenue which accounted for 89.4%93.5% of consolidated revenue; and

• 

a shift in revenue mix with increased maintenance, EDI and RCM revenue resulting in a decline in our gross profit margin;
• an increase in our consolidated gross profit margin from 66.6%selling, general and administrative expenses as a percentage of revenue related to 67.7%.

higher than usual legal expenses, primarily as a result of certain legal matters related to intellectual property infringement claims in the NextGen Division and a proxy contest; and
• a decrease in interest income primarily due a greater proportion of funds invested in short-term U.S Treasuries and tax free money market accounts which returned significantly lower interest rates as compared to the prior year.

Revenue.  Revenue for the year ended March 31, 20072009 increased 31.8%31.6% to $157.2$245.5 million from $119.3$186.5 million for the year ended March 31, 2006.2008. NextGen Division revenue increased 35.5%34.7% to $229.7 million from $103.7 million to approximately $140.6$170.5 million in the period,year ended March 31, 2008, while QSI Dental Division revenue increaseddecreased by 6.7%1.2% during thethat same period, to $15.9 million from $15.5$16.0 million. NextGen Division revenue is inclusive of approximately $15.6 million to $16.6 million.

Revenue is dividedin revenue from HSI and $8.6 million in revenue from PMP, our two fiscal year 2009 RCM acquisitions.

We divide revenue into two categories, “system sales” and “maintenance, EDI, RCM and other services”.services.” Revenue in the system sales category includes software license fees, third party hardware and software, and implementation and training services related to purchase of the Company’sour software systems. The majority of the revenue in the system sales category is related to the sale of software. Revenue in the maintenance, EDI, RCM and other services category includes maintenance, EDI, follow onRCM, follow-on training and implementation services, annual third party license fees, hosting and other services revenue.

System SalesSales..  Revenue earned from Company-wide sales of systems for the year ended March 31, 20072009 increased 22.4%10.0% to $81.0$98.8 million from $66.2$89.8 million in the prior year.

Our increase in revenue from sales of systems was principally the result of a 21.7%9.9% increase in category revenue at our NextGen Division whose sales in this category grew from $63.8$87.1 million during the year ended March 31, 20062008 to $77.7$95.7 million during the year ended March 31, 2007.2009. This increase was driven primarily by higher sales of NextGenemrehr and NextGenepm software to both new and existing clients, as well as an increaseincreases in the deliverysales of related implementation services offset by a decline in the sale of related hardware, third party software and supplies.supplies and implementation and training services.


44


Systems sales revenue in the QSI Dental Division increased to approximately $3.4$3.0 million in the year ended March 31, 20072009 from $2.4$2.6 million in the year ended March 31, 2006.

2008.

The following table breaks down our reported system sales into software, hardware, third party software, supplies, and implementation and training services components by division:


Software


Hardware,
Third Party
Software and
Supplies


Implementation
and Training
Services


Total
System Sales


Year ended March 31, 2007


QSI Division


$

355


$

2,356


$

655


$

3,366


NextGen Division


62,957


3,203


11,522


77,682


Consolidated


$

63,312


$

5,559


$

12,177


$

81,048


Year ended March 31, 2006


QSI Division


$

984


$

1,013


$

411


$

2,408


NextGen Division


48,847


4,094


10,882


63,823


Consolidated


$

49,831


$

5,107


$

11,293


$

66,231


     Hardware, Third
  Implementation
    
     Party Software
  and Training
  Total System
 
  Software  and Supplies  Services  Sales 
 
Year ended March 31, 2009                
QSI Dental Division $915  $1,171  $938  $3,024 
NextGen Division  76,525   6,775   12,437   95,737 
                 
Consolidated $77,440  $7,946  $13,375  $98,761 
                 
Year ended March 31, 2008                
QSI Dental Division $360  $1,134  $1,154  $2,648 
NextGen Division  69,276   5,593   12,252   87,121 
                 
Consolidated $69,636  $6,727  $13,406  $89,769 
                 
NextGen Division software license revenue increased 28.9%10.5% between the year ended March 31, 20062008 and the year ended March 31, 2007.2009. The Division’s software revenue accounted for 81.0%79.9% of divisional system sales revenue during the year ended March 31, 2007, an increase from 76.5% in the prior year period.


Sales of additional licenses2009, compared to existing customers grew to $23.3 million79.5% during the year ended March 31, 2007 compared to $9.7 million during the prior year as a result of both an increasing number of customers who are expanding their use of our software in their practices and are purchasing additional licenses. Software revenue from VARs totaled approximately $13.6 million during the year ended March 31, 2007 compared to $7.0 million in the prior year. The increase in VAR revenue was affected in part by revenue from sales to Siemens Medical Solutions.

The increase in software’s share of systems sales was not the result of any change in emphasis on our part relative to software sales.2008. Software license revenue growth continues to be an area of primary emphasis for the NextGen Division and management was pleased with the NextGen Division’s performance in this area.

Division.

During the year ended March 31, 2007, 4.1%2009, 7.1% of the NextGen Division’s system sales revenue was represented by hardware and third party software compared to 6.4% induring the prior year. We have noted that the last several quarters’ and years’ results have generally included a relatively lower amount of hardware and third party software compared to prior years. However, this decrease is not the result of any change in emphasis on our part.year ended March 31, 2008. The number of customers who purchase hardware and third party software and the dollar amount of hardware and third party software revenue fluctuates each yearquarter depending on the needs of customers. The inclusion of hardware and third party software in the NextGen Division’s sales arrangements is typically at the request of the customer and is not a priority focus for us.

Implementation and training revenue related to system sales at the NextGen Division increased 5.9%1.5% in the year ended March 31, 20072009 compared to the year ended March 31, 2006. The growth in implementation and training revenue is the result of increases in the amount of implementation and training services rendered to our new customers. Implementation and training revenue at the NextGen Division decreased its share of Divisional system sales revenue to 14.8% in the twelve months ended March 31, 2007 from 17.0% in the twelve months ended March 31, 2006.2008. The amount of implementation and training services revenue and the corresponding rate of growth compared to a prior period in any given year is dependent on several factors, including timing of customer implementations, the availability of qualified staff, and the mix of services being rendered. The number of implementation and training staff increased during the year ended March 31, 2009 versus 2008 in order to accommodate the increased amount of implementation services sold in conjunction with increased software sales. In order to achieve continued increased revenuegrowth in this area, additional staffing increases and additional training facilities are anticipated, though actual future increases in revenue and staff will depend upon the availability of qualified staff, business mix and conditions, and our ability to retain current staff members.
The NextGen Division’s growth has come in part from investments in sales and marketing activities including hiring additional sales representatives,a revamped NextGen.com Web site, new NextGen logo, new marketing campaigns, trade show attendance, and other expanded advertising and marketing expenditures. We have also benefited from winning numerous industry awards for the NextGen Division’s flagship NextGenemrehr and NextGenepm software products in fiscal years 2007 and 2006, as well as in prior years, and the apparent increasing acceptance of electronic medical records technology in the healthcare industry.

For the QSI Dental Division, total system sales increased by approximately $1.0 million14.2% in the year ended March 31, 20072009 compared to the year ended March 31, 2006 due primarily to increases in hardware, third party software and implementation revenue.2008. We do not presently foresee any material changes in the business environment for the QSI Division with respect to the constrainedweak purchasing environment in the dental group practice market that has been in placeexisted for the past several years.

Maintenance, EDI, Revenue Cycle Management and Other.Other Services.  For the year ended March 31, 2009, Company-wide revenue from maintenance, EDI, RCM and other services grew 43.5%51.7% to $76.1$146.8 million from $96.7 million for the year ended March 31, 2007 from $53.1 million for the year ended March 31, 2006.2008. The increase in this category resulted principally from an increase in maintenance, EDI, RCM and Otherother services revenue generated from the NextGen Division’s client base.Division. Total NextGen Division maintenance revenue for the year ended March 31, 20072009 grew 44.2%33.3% to $34.9$65.7 million from $24.2$49.3 million in


45


the prior year, while EDI revenue grew 45.9%38.4% to $12.5$24.8 million for the year ended March 31, 2007 compared to $8.6$17.9 million in the prior year. RCM grew to $21.4 million primarily as a result of the HSI and PMP acquisitions. Other services revenue for the NextGen Division, which consists primarily of third party annual software license renewals, timeconsulting services and materials billings, travel reimbursements,hosting services increased 43.9% to $22.0 million from $15.3 million a year ago. QSI Dental Division maintenance, EDI and other services revenue grew 116.8%decreased 4.2% to $15.5$12.8 million for the year ended March 31, 20072009 compared to $7.2 million a year ago. The increase was due primarily to purchases of additional training and other services by existing NextGen customers. QSI Division maintenance revenue increased 2.0% to $7.1 million for the year ended March 31, 2007 compared to $6.9$13.4 million in the prior year while divisional EDI revenue declined by approximately 3.1% to $4.5 million for the year ended March 31, 2007 compared to $4.7 million in the prior year. Other revenue for the QSI Division grew 6.0% to $1.6 million for the year ended March 31, 2007 compared to $1.5 million a year ago.


The following table details maintenance, EDI, RCM, and other services revenue by category for the years ended March 31, 20072009 and 2006:


Maintenance


EDI


Other


Total


Year ended March 31, 2007


QSI Division


$

7,081


$

4,529


$

1,615


$

13,225


NextGen Division


34,867


12,520


15,505


62,892


Consolidated


$

41,948


$

17,049


$

17,120


$

76,117


Year ended March 31, 2006


QSI Division


$

6,939


$

4,673


$

1,524


$

13,136


NextGen Division


24,185


8,583


7,152


39,920


Consolidated


$

31,124


$

13,256


$

8,676


$

53,056


2008:

                     
        Revenue Cycle
       
  Maintenance  EDI  Management  Other  Total 
 
Year ended March 31, 2009                    
QSI Dental Division $7,167  $4,766  $  $894  $12,827 
NextGen Division  65,695   24,756   21,431   22,045   133,927 
                     
Consolidated $72,862  $29,522  $21,431  $22,939  $146,754 
                     
Year ended March 31, 2008                    
QSI Dental Division $7,186  $4,564  $  $1,639  $13,389 
NextGen Division  49,269   17,886   871   15,316   83,342 
                     
Consolidated $56,455  $22,450  $871  $16,955  $96,731 
                     
The following table providesgrowth in maintenance revenue for the number of billing sites which were receivingNextGen Division has come from new customers that have been added each quarter, existing customers who have purchased additional licenses, and our relative success in retaining existing maintenance services ascustomers. NextGen Division’s EDI revenue growth has come from new customers and from further penetration of the last business dayDivision’s existing customer base. The growth in RCM is a result of the year ended March 31, 2007HSI and 2006 respectively, as well asPMP acquisitions and future growth is expected from cross selling opportunities between the number of billing sites receiving EDI services during the last month of each respective period at each division of our company. The table presents summary information only and includes billing entities added and removed for any reason. Note also that a single client may include one or multiple billing sites.


NextGen


QSI


Consolidated


Maintenance


EDI


Maintenance


EDI


Maintenance


EDI


March 31, 2006


831


567


275


189


1,106


756


Billing sites added


178


232


4


11


182


243


Billing sites removed


(27

)


(30

)


(22

)


(27

)


(49

)


(57

)


March 31, 2007


982


769


257


173


1,239


942


customer bases.

Cost of revenue.Revenue.  Cost of revenue for the year ended March 31, 20072009 increased 27.5%42.2% to $50.8$88.9 million from $39.8$62.5 million for the year ended March 31, 2006, while2008 and the cost of revenue as a percentage of net revenue declinedincreased to 32.3%36.2% from 33.4%. Our consolidated gross profit is affected by the level of hardware content included in system sales, the percentage of EDI revenue in our overall sales mix, and certain headcount expenses directly related33.5% due to the fact that the rate of growth in cost of delivering our products and services. Consolidated gross profit is also affected byrevenue grew faster than the higher margin revenues ofaggregate revenue growth rate for the NextGen Division, which increased its share of total Company revenue to 89.4% from 87.0% in the prior year.

Company.

The following table details revenue and cost of revenue on a consolidated and divisional basis for the years ended March 31, 20072009 and 2006:2008:
                 
  Year Ended March 31, 
  2009  %  2008  % 
 
QSI Dental Division                
Revenue $15,851   100.0% $16,037   100.0%
Cost of revenue  7,582   47.8%  7,545   47.0%
                 
Gross profit $8,269   52.2% $8,492   53.0%
                 
NextGen Division                
Revenue $229,664   100.0% $170,463   100.0%
Cost of revenue  81,308   35.4%  54,956   32.2%
                 
Gross profit $148,356   64.6% $115,507   67.8%
                 
Consolidated                
Revenue $245,515   100.0% $186,500   100.0%
Cost of revenue  88,890   36.2%  62,501   33.5%
                 
Gross profit $156,625   63.8% $123,999   66.5%


46


Year ended March 31,


2007


%


2006


%


QSI Division


Revenue


$

16,589


100.0

%

$

15,544


100.0

%

Cost of revenue


7,847


47.3


7,765


50.0


Gross profit


$

8,742


52.7

%

$

7,779


50.0

%


NextGen Division


Revenue


$

140,576


100.0

%

$

103,743


100.0

%

Cost of revenue


42,937


30.5


32,063


30.9


Gross profit


$

97,639


69.5

%

$

71,680


69.1

%


Consolidated


Revenue


$

157,165


100.0

%

$

119,287


100.0

%

Cost of revenue


50,784


32.3


39,828


33.4


Gross profit


$

106,381


67.7

%

$

79,459


66.6

%


Gross profit margins at the NextGen Division for the year ended March 31, 2007 increased2009 decreased to 69.5%64.6% from 69.1% primarily due to a decrease in67.8% from the proportionate level of hardware and third party software content included in revenue. The QSI Division’s gross profit margin increased to 52.7% from 50.0% between the yearsyear ended March 31, 2007 and 2006 primarily due2008. Gross profit margins at the QSI Dental Division for the year ended March 31, 2009 decreased to a decrease in52.2% from 53.0% for the

year ended March 31, 2008.


relative level of applicable headcount expense associated with delivering our products and services.

The following table details the individual components of cost of revenue and gross profit as a percentage of total revenue on a consolidated and divisional basis for the years ended March 31, 2009 and 2008:
                         
  Hardware,
  Payroll and
             
  Third Party
  Related
        Total Cost of
  Gross
 
  Software  Benefits  EDI  Other  Revenue  Profit 
 
Year ended March 31, 2009                        
QSI Dental Division  7.6%  19.8%  17.1%  3.3%  47.8%  52.2%
NextGen Division  3.5%  14.8%  7.8%  9.3%  35.4%  64.6%
                         
Consolidated  3.7%  15.1%  8.4%  9.0%  36.2%  63.8%
                         
Year ended March 31, 2008                        
QSI Dental Division  8.0%  19.1%  15.7%  4.2%  47.0%  53.0%
NextGen Division  3.8%  11.2%  7.5%  9.7%  32.2%  67.8%
                         
Consolidated  4.2%  11.8%  8.2%  9.3%  33.5%  66.5%
                         
The increase in our companyconsolidated cost of revenue as a percentage of revenue between the year ended March 31, 2009 and our two divisions:


Hardware,
Third Party
Software


Payroll
and
related
Benefits


Outside
Services,
Amortization
of Software
Development
Costs and
Other


Total Cost
of Revenue


Gross
Profit


Year ended March 31, 2007


QSI Division


10.0

%


17.3

%


20.0

%


47.3

%


52.7

%


NextGen Division


3.1


11.9


15.5


30.5


69.5


Consolidated


3.8

%


12.4

%


16.1

%


32.3

%


67.7

%


Year ended March 31, 2006


QSI Division


9.8

%


19.1

%


21.1

%


50.0

%


50.0

%


NextGen Division


4.6


11.8


14.5


30.9


69.1


Consolidated


5.3

%


12.7

%


15.4

%


33.4

%


66.6

%


the year ended March 31, 2008 is primarily attributable to an increase in RCM revenue, which carries higher payroll and related benefits as a percentage of revenue and higher EDI costs in both divisions, offset by a decrease in hardware and third party software, and other expense as a percentage of revenue. Other expense, which consists of outside service costs, amortization of software development costs and other costs, decreased to 9.0% of total revenue during the year ended March 31, 2009 from 9.3% of total revenue during the year ended March 31, 2008.

During the year ended March 31, 2007,2009, hardware and third party software constituted a smaller portion of consolidated cost of revenue compared to the same prior year period driven principally both byin the composition of NextGen Division revenue and NextGen Division revenue increasing its share of total Company revenue. This year over year reduction continued a previously identified trend and did not result from any change in emphasis on our part.Division. The number of customers who purchase hardware and third party software and the dollar amount of hardware and third party software purchased fluctuates each quarter depending on the needs of the customers and is not a priority focus for us.

Our payroll and benefits expense associated with delivering our products and services decreasedincreased to 12.4%15.1% of consolidated revenue forin the year ended March 31, 20072009 compared to 12.7%11.8% during the prior year ended March 31, 2006. 2008 primarily due to the acquisition of HSI and PMP which as service businesses have an inherently higher percentage of payroll costs as a percentage of revenue.
The absolute level of consolidated payroll and benefit expenses grew from $15.2$22.1 million in the twelve monthsyear ended March 31, 20062008 to $19.6$37.1 million in the twelve monthsyear ended March 31, 2007,2009, an increase of 29%67.9% or $4.4approximately $15.0 million. Of the $15.0 million primarily due to additions toincrease, approximately $4.8 million was a result of the HSI acquisition and $3.9 million was a result of the PMP acquisition. In addition, related headcount, payroll and benefits expense associated with delivering products and services in the NextGen Division.Division increased by $6.1 million in the year ended March 31, 2009 to $25.1 million from $19.0 million in the year ended March 31, 2008. Payroll and benefits expense associated with delivering products and services in the QSI Dental Division declined on a percentage of revenue basis. The adoption of SFAS 123R in fiscal year 2007 added approximately $0.5remained consistent at $3.1 million in compensation to consolidated cost of revenue.

We anticipate continued additions to headcount in the NextGen Division in areas related to delivering products and services in future periods, but due to the uncertainties in the timing of our sales arrangements, our sales mix, the acquisition and training of qualified personnel, and other issues, we cannot accurately predict if related headcount expense as a percentage of revenue will increase or decrease in the future.

We do not currently intend to make any significant changes to related headcount at the QSI Division.

“Other”, which consists of outside service costs, amortization of software development costs and other costs, increased to 16.1% of revenue during the year ended March 31, 2007 from 15.4% during2009 and 2008, respectively. The application of ASC 718 added approximately $0.2 million and $0.5 million in compensation expense to cost of revenue in the yearyears ended March 31, 2006.

Should the NextGen Division continue to represent an increasing share of our revenue2009 and should the NextGen Division continue to carry higher gross margins than the QSI Division, our consolidated gross margin percentages should increase to match more closely those of the NextGen Division.

2008, respectively.

As a result of the foregoing events and activities, ourthe gross profit increasedpercentage for the Company and both our Divisions decreased for the year period endingended March 31, 20072009 versus the prior year.


Selling, General and Administrative Expenses.  Selling, general and administrative expenses for the year ended March 31, 20072009 increased 27.5%32.3% to $45.3$70.4 million as compared to $35.6$53.3 million for the year ended March 31, 2006.2008. The increase in these expenses resulted primarily from increases of $5.1 million in compensation expense and benefit expense in the NextGen Division, $0.9 million in commission expense in the NextGen Division, $1.9 million in other general and administrative expenses primarily in the NextGen Division and $1.8 million in increased corporate expenses. a:
• $2.7 million increase in legal expenses in the NextGen Division;
• $1.7 million increase in compensation expense in the NextGen Division;


47


• $1.2 million increase in outside services and consulting services in the NextGen Division;
• $0.9 million increase in advertising in the NextGen Division;
• $6.7 million increase in other selling, general and administrative expenses in the NextGen Division; and
• $3.9 million increase in corporate related expenses.
Approximately $1.4$1.5 million of the year over year increase in corporate related expense was related to expenses associated with the proxy contest which occurred in conjunction with the 2008 Annual Shareholders’ Meeting. Amortization of identifiable intangibles related to the HSI and PMP acquisitions of approximately $1.0 million and an increase in corporate salaries and related benefits of $0.7 million also contributed to the year over year corporate expenses was salaries and related benefits.

increase.

The adoptionapplication of SFAS 123R in fiscal year 2007ASC 718 added approximately $1.5 million and $2.5 million in compensation expense to consolidated selling, general and administrative expenses for the year ended March 31, 2009 and 2008, respectively, and is included in the aforementioned amounts.

Selling, general and administrative expenses as a percentage of revenue decreased to 28.9%increased slightly from 28.6% in the fiscal year ended March 31, 2007 from 29.8%2008 to 28.7% in the fiscal periodyear ended March 31, 2006 due to revenue growing at a faster rate than selling, general and administrative expenses.

We anticipate increased expenditures for trade shows, advertising and staff additions at the NextGen Division. We also anticipate increased expenditures at the corporate level related to headcount additions, compensation and professional service fees. While we expect selling, general and administrative expenses to increase on an absolute basis, we cannot accurately predict the effect these additional expenditures will have on selling, general, and administrative expenses as a percentage of revenue.

2009.

Research and Development Costs.  Research and development costs for the years ended March 31, 20072009 and 20062008 were $10.2$13.8 million and $8.1$11.4 million, respectively. The increaseincreases in research and development costs was primarilyexpenses were due in part to increased investment in the NextGen Division product line. Additionally, the adoptionapplication of SFAS 123R in fiscal year 2007ASC 718 added approximately $0.2 million and $0.8 million in the years ended March 31, 2009 and 2008, respectively, in compensation expense to research and development costs, net of amounts capitalized as software development.development in those fiscal years. Additions to capitalized software costs offset research and development costs. For the year ended March 31, 2007, $5.02009, $5.9 million was added to capitalized software costs while $3.3$6.0 million was capitalized during the year ended March 31, 2006.2008. Research and development costs as a percentage of net revenue decreased to 6.5%5.6% in the year ended March 31, 2009 from 6.8% primarily due6.1% in the year ended March 31, 2008.
Amortization of Acquired Intangible Assets.  Amortization expense related to revenue growing at a faster rate thanacquired intangible assets for the increase in researchyear ended March 31, 2009 was $1.0 million. The amortization expense relates to the addition of customer relationships and development costs. Researchtrade name intangible assets, which were acquired through the acquisitions of HSI and development costs are expected to continue at or above current levels.

PMP during fiscal year 2009.

Interest Income.  Interest income for the year ended March 31, 2007 increased 56.8%2009 decreased to approximately $3.3$1.2 million compared with $2.1to $2.7 million in the year ended March 31, 2006. The increase was2008 primarily due to:
• a lower amount of investments held in ARS when compared to the prior year;
• larger amounts invested in money market accounts which earned significantly lower interest rates as compared to the prior year; and
• overall comparatively lower amounts of funds available for investment during the year due to payments of $8.2 million and $17.0 million, respectively, for the Company’s acquisitions of HSI and PMP and increased quarterly dividend payments.
Other Income (Expense).  Other income (expense) for the effect of an increase in short term interest rates versus the prior year period as well as comparatively higher amounts available for investment during the fiscal year ended March 31, 2007. During the fourth quarter2009 consists of fiscal year 2007, we paidgains and losses in fair value recorded on our ARS investments as well as on our ARS put option rights. We recognized a dividend of $27.1 million, which reduced the amount of funds available for investment during this period. During the fourth quarter of fiscal year 2006, we paid a dividendpre-tax unrealized loss on our ARS of approximately $23.4$0.7 million. At the same time, we estimated the fair value of our ARS put option rights at approximately $0.4 million.
Included in other income for the year ended March 31, 2008 was approximately $1.0 million, resulting from a gain on life insurance proceeds due to the passing of Gregory Flynn, Executive Vice President and General Manager of the QSI Dental Division. Mr. Flynn participated in our deferred compensation plan which reducedis funded through the amountpurchase of funds available forlife insurance policies with the Company named as beneficiary. There was no gain or loss recorded on investment securities during such period.

the year ended March 31, 2008.

Provision for Income Taxes.  The provision for income taxes for the year ended March 31, 20072009 was approximately $21.0$27.2 million as compared to approximately $14.6$22.9 million for the prior year. The effective tax rates for fiscal 20072009 and 20062008 were 38.7%37.1% and 38.5%36.4%, respectively. The provision for income taxes for the years ended


48


March 31, 20072009 and 20062008 differs from the combined statutory rates primarily due to the impact of varying state income tax rates, research and development tax credits, and the qualified production activities deduction.deduction, and exclusions for Company-owned life insurance proceeds and tax-exempt interest income. The change in the effective rate for the year ended March 31, 2007 also2009 includes an increase in the benefit from the qualified production activities deduction,research and development credits, which was mostly offset by non-deductible option expense related to incentive stock options.

a decrease in qualified production activities deduction and an increase in state income tax expense.

During the year ended March 31, 20072009 and 2006,2008, we claimed research and development tax credits of approximately $1.0 million and $0.8 million, in both years.respectively. The Company also claimed the qualified production activities deduction under Section 199 of the Internal Revenue Code,IRC of approximately $1.5$2.7 million and $0.8$3.1 million during the years ended March 31, 20072009 and 2006,2008, respectively. Research and development credits and the qualified production activities income deduction taken by us involve certain assumptions and judgments regarding qualification of expenses under the relevant tax code provision.


Liquidity and Capital Resources

The following table presents selected financial statistics and information for each of the years ended March 31, 2008, 20072010, 2009 and 2006:


Year Ended March 31,


2008


2007


2006


Cash and cash equivalents


$

59,046


$

60,028


$

57,225


Net (decrease) increase in cash and cash equivalents


$

(982

)

$

2,803


$

6,068


Net income


$

40,078


$

33,232


$

23,322


Net cash provided by operations during the year


$

43,599


$

29,570


$

30,678


Number of days of sales outstanding


136


129


115


2008:

             
  Year Ended March 31,
  2010 2009 2008
 
Cash and cash equivalents $84,611  $70,180  $59,046 
Net increase (decrease) in cash and cash equivalents $14,431  $11,134  $(982)
Net income $48,379  $46,119  $40,078 
Net cash provided by operating activities $55,220  $48,712  $43,599 
Number of days of sales outstanding  125   125   136 
Cash Flow from Operating Activities

Cash provided by operations has historically been our primary source of cash and has primarily been driven by our net income and secondarily byplus adjustments to add back non-cash expenses, including depreciation, amortization of intangibles and capitalized software costs, provisions for bad debts and inventory obsolescence, share-based compensation and stock option expenses.

deferred taxes.

The following table summarizes our statementConsolidated Statements of cash flowsCash Flows for the years ended March 31, 2008, 20072010, 2009 and 2006:


Year Ended March 31,


2008


2007


2006


Net income


$

40,078


$

33,232


$

23,322


Non-cash expenses


11,299


8,977


4,140


Gain on life insurance proceeds, net


(755

)


Tax benefit from exercise of stock options, net


65


167


4,831


Change in deferred revenue


5,447


3,532


10,439


Change in accounts receivable


(13,811

)


(20,760

)


(12,484

)


Change in other assets and liabilities


1,276


4,422


430


Net cash provided by operating activities


$

43,599


$

29,570


$

30,678


2008:

             
  Year Ended March 31, 
  2010  2009  2008 
 
Net income $48,379  $46,119  $40,078 
Non-cash expenses  16,152   17,719   11,299 
Gain on life insurance proceeds, net        (755)
Tax benefit from exercise of stock options, net     1   65 
Change in deferred revenue  12,528   3,130   5,447 
Change in accounts receivable  (18,944)  (11,369)  (13,811)
Change in other assets and liabilities  (2,895)  (6,888)  1,276 
             
Net cash provided by operating activities $55,220  $48,712  $43,599 
             
Net Income.  As referenced in the above table, net income makes up the majority of our cash generated from operations for the years ended March 31, 2008, 20072010, 2009 and 2006. Our2008. The NextGen Division’s contribution to net income has increased each year due to that division’sDivision’s operating income increasing more quickly than our companyCompany as a whole.

Non-Cash ExpensesExpenses..  Non-cash expenses include depreciation, amortization of intangibles and capitalized software costs, provisions for bad debts and inventory obsolescence, share-based compensation and stock option expenses.deferred taxes. Total non-cash expenses increased by approximately $11.3were $16.2 million, $9.0$17.7 million and $4.1$11.3 million for the years ended March 31, 2008, 20072010,


49


2009 and 2006,2008, respectively. The change for the year ended March 31, 20082010 as compared to the prior year is primarily related to a $3.8an increase of approximately $0.8 million increase in stock option expenses related to our application of SFAS 123R, a $2.4 million increase in depreciation, $4.1$0.8 million inof amortization of capitalized software costs, $0.7 million of amortization of other intangibles, and a $1.2$1.4 million increase in the provisionallowance for bad debts.

debt, offset by a decrease of $5.2 million in deferred income tax expense.

Tax Benefits From Stock Options. Although  Tax benefits from the valueexercise of stock options exercised by employees grew inwere $1.6 million, $3.4 million and $1.4 million for the yearyears ended March 31, 2010, 2009 and 2008, and 2007, ourrespectively. Our application of SFAS 123RASC 718 required excess tax benefits of $1.3 million and $2.5 million, respectively, to be reclassed to financing activities, resulting in a corresponding decrease in our net decreasecash provided by operating activities of $1.6 million, $3.4 million and $1.3 million in the years ended March 31, 2010, 2009 and 2008, and 2007.

respectively.

Deferred Revenue.  Cash from operations benefited significantly from increases in deferred revenue primarily due to an increase in the volume of implementation and maintenance services invoiced by the NextGen Division which had not yet been rendered or recognized as revenue. This benefit is offset by the increase in unpaid deferred revenue. Deferred revenue grew by approximately $5.4


$12.5 million for the year ended March 31, 20082010 versus growth of $3.5$3.1 million and $5.4 million for the yearyears ended March 31, 2007,2009 and 2008, resulting in increases to cash provided by operating activities for the respective periods.

Accounts Receivable.  Accounts receivable grew by approximately $13.8$18.9 million, $20.8$11.4 million and $12.5$13.8 million for the years ended March 31, 2008, 20072010, 2009 and 2006,2008, respectively. The increase in accounts receivable in the periods is due to the following factors:

• 

NextGen Division revenue grew 21.3%13.6%, 35.5%19.6% and 41.0%21.3% for the years ended March 31, 2010, 2009 and 2008, 2007 and 2006, respectively;

• 

Turnover of accounts receivable is generally slower in the NextGen Division due to the fact that the systems sales related revenue have longer payment terms, generally up to one year, which historically have accounted for a major portion of NextGen Division sales;
• The Opus acquisition added approximately $2.1 million of accounts receivable as of March 31, 2010; and
• We experienced an increase in the volume of undelivered services billed in advance by the NextGen Division which were unpaid as of the end of each period and included in accounts receivable. This resulted in an increase in both deferred revenue and accounts receivable of approximately $4.9$9.5 million, $6.4$1.2 million and $4.4$4.9 million for the years ended March 31, 2010, 2009 and 2008, 2007 and 2006, respectively; and

The NextGen Division constituted a larger percentage of our receivables at March 31, 2008 compared to March 31, 2007. Turnover of accounts receivable in the NextGen Division is slower than the QSI Division due to the fact that the majority of the QSI Division’s revenue is coming from maintenance and EDI services which typically have shorter payment terms than systems sales related revenue which historically have accounted for a major portion of NextGen Division sales.

respectively.

The turnover of accounts receivable measured in terms of days sales outstanding (DSO)(“DSO”) fluctuated during the year, and increased from 129 days to 136but remained consistent at 125 days during the year ended March 31, 2008 primarily due2010 as compared to the above mentioned factors.

prior year.

If amounts included in both accounts receivable and deferred revenue were netted, our turnover of accounts receivable expressed as DSO would be 8579 days as of March 31, 20082010 and 8183 days as of March 31, 2007.2009. Provided turnover of accounts receivable, deferred revenue, and profitability remain consistent with the year ended March 31, 2008,2010, we anticipate being able to continue to generate cash from operations during fiscal 20092011 primarily from our net income.

Cash flows from investing activities

Net cash used in investing activities for the year ended March 31, 2008, 2007 and 2006 was $30.2 million, $8.3 million and $5.7 million, respectively. The increase in cash used in investing activities is a result of the Company’s net purchases of current investments in ARS of approximately $22.6 million, net of unrealized loss of $0.3 million as of March 31, 2008. These ARS are classified as current and non current investments on the accompanying Consolidated Balance Sheets. In addition to purchases and sales of marketable securities, net cash used in investing activities for the year ended March 31, 2008 consisted of additions to equipment and improvements and capitalized software.

Net cash used in investing activities for the years ended March 31, 20072010, 2009 and 2006 consisted2008 was $13.9 million, $19.4 million and $30.2 million, respectively. The decrease in cash used in investing activities for the year ended March 31, 2010 is due mainly to the fact that we acquired cash balances of $2.0 million from the acquisition of Opus whereas for the year ended March 31, 2009, we had paid approximately $8.2 million and $17.0 million for the acquisitions of HSI and PMP, respectively, offset by proceeds from the sale of marketable securities of $14.8 million. Other net cash outflows during the year ended March 31, 2010 include payments of $0.3 million for each of our two fiscal year 2010 acquisitions, Opus and Sphere, and payment of contingent consideration related to the PMP acquisition of $3.0 million as well as additions to equipment and improvements and capitalized software.software costs totaling $12.9 million.


50


Cash flows from financing activities

Net cash used in financing activities for the year ended March 31, 20082010 was $14.4$26.8 million and consisted of a dividenddividends paid to shareholders of $20.5totaling $34.3 million, offset by $4.8proceeds of $5.9 million of proceeds from the exercise of stock options. We recorded a reduction in income tax liability of $1.3$1.6 million related to excess tax deductions received from employee stock option exercises. The benefit was recorded as additional paid in capital.

Cash and cash equivalents and marketable securities

At March 31, 2008,2010, we had cash and cash equivalents of $59.0$84.6 million and marketable securities of $22.6$7.2 million. We intend to expend some of these funds for the development of products complementary to our existing product line as well as new versions of certain of our products. These developments are intended to take advantage of more powerful technologies and to increase the integration of our products. We have no additional significant current capital commitments.

On February 10, 2010, we acquired Opus and on August 12, 2009, we acquired Sphere. The Opus purchase price of $20.6 million consisted of approximately $0.3 million in cash plus up to $11.6 million in contingent consideration tied to future performance. The Sphere purchase price of $1.4 million consisted of approximately $0.3 million in cash plus an estimated $1.1 million (but in no event to exceed $2.5 million) in contingent consideration tied to future performance.
On October 28, 2008, we acquired PMP and on May 20, 2008, we acquired HSI. The PMP purchase price consisted of approximately $17.0 million in cash (including direct transaction costs) plus up to $3.0 million in contingent consideration tied to future performance, which has been paid as of March 31, 2010. The HSI purchase price consisted of approximately $8.2 million in cash (including direct transaction costs) plus up to approximately $1.7 million in contingent consideration tied to future performance.
In January 2007, our Board of Directors adopted a policy whereby we intend to pay a regular quarterly dividend of $0.25 per share on our outstanding common stock, commencing with conclusion of our first fiscal quarter of 2008 (June 30, 2007) and continuing each fiscal quarter thereafter, subject to further Board review and approval as well asand establishment of record and distribution dates by our Board of Directors prior to the declaration of each such quarterly dividend. In August 2008, our Board of Directors increased the quarterly dividend to $0.30 per share. We anticipate that future quarterly dividends, if and when declared by theour Board


of Directors pursuant to this policy, would likely be distributable on or about the fifth day of each of the months of October, January, April and July.

On May 31, 2007, our26, 2010, the Board of Directors approved a quarterly dividend of twenty-five cents ($0.25) per share payable on its outstanding shares of common stock. The cash dividend record date was June 15, 2007 and was distributed to shareholders on or about July 5, 2007.

On July 31, 2007, our Board of Directors approved a quarterly dividend of twenty-five cents ($0.25) per share payable on its outstanding shares of common stock. The cash dividend record date was September 14, 2007 and was distributed to shareholders on or about October 5, 2007.

On October 25, 2007, the Board approved a quarterly cash dividend of $0.25 per share on our outstanding shares of common stock, payable to shareholders of record as of December 14, 2007 with an expected distribution date on or about January 7, 2008.

On January 30, 2008, the Board approved a quarterly cash dividend of $0.25 per share on our outstanding shares of common stock, payable to shareholders of record as of March 14, 2008 with an expected distribution date on or about April 7, 2008.

On May 20, 2008, the Company acquired HSI. The acquisition resulted in HSI becoming a wholly owned subsidiary of QSI. The purchase price consists of approximately $15.4 million plus up to approximately $1.6 million in incentives tied to future performance. The $15.4 million consists of approximately equal parts of cash and restricted QSI common stock, subject to restrictions on resale lapsing over a two year period.

On May 29, 2008, the Board approved a quarterly cash dividend of $0.25$0.30 per share on our outstanding shares of common stock, payable to shareholders of record as of June 13, 200817, 2010 with an expected distribution date on or about July 2, 2008.6, 2010.


51


The following dividends have been declared in the 2010, 2009, and 2008 fiscal years on the dates indicated:
         
      Dividend
Board Approval Date
 
Record Date
 
Payment Date
 Amount
 
Fiscal year 2010
        
January 27, 2010 March 23, 2010 April 5, 2010 $0.30 
October 28, 2009 December 23, 2009 January 5, 2010  0.30 
July 23, 2009 September 25, 2009 October 5, 2009  0.30 
May 27, 2009 June 12, 2009 July 6, 2009  0.30 
Fiscal year 2009
        
January 28, 2009 March 11, 2009 April 3, 2009 $0.30 
October 30, 2008 December 15, 2008 January 5, 2009  0.30 
August 4, 2008 September 15, 2008 October 1, 2008  0.30 
May 29, 2008 June 15, 2008 July 2, 2008  0.25 
Fiscal year 2008
        
January 30, 2008 March 14, 2008 April 7, 2008 $0.25 
October 25, 2007 December 14, 2007 January 7, 2008  0.25 
July 31, 2007 September 14, 2007 October 5, 2007  0.25 
May 31, 2007 June 15, 2007 July 5, 2007  0.25 
Management believes that its cash and cash equivalents on hand at March 31, 2008,2010, together with its marketable securities and cash flows from operations, if any, will be sufficient to meet its working capital and capital expenditure requirements as well as any dividends to be paid in the ordinary course of business for the balanceremainder of fiscal 2009.

year 2011.

Contractual Obligations.  The following table summarizes our significant contractual obligations, all of which relate to operating leases, at March 31, 2008,2010 and the effect that such obligations are expected to have on our liquidity and cash in future periods:


Contractual Obligations – Non-cancelable lease obligations


(in thousands)


Year Ending March 31,


2009


$

3,156


2010


$

3,131


2011


$

3,164


2012


$

1,716


2013 and beyond


$

942


$

12,109


Year Ended March 31,    
2011 $4,413 
2012  4,565 
2013  4,577 
2014  3,963 
2015 and beyond  7,215 
     
  $24,733 
     
New Accounting Pronouncements

In May 2008, the FASB issued Statement

Refer to Note 2 of our Consolidated Financial Statements, “Summary of Significant Accounting Standards No. 162, “The HierarchyPolicies” for a discussion of Generally Accepted Accounting Principles (SFAS 162)”.SFAS No. 162 defines the order in whichnew accounting principles that are generally accepted should be followed. SFAS No. 162 is effective 60 days following the SEC’s approval of the Public Company Accounting Oversight Board (“PCAOB”) amendments to AU Section 411, The Meaning of Present Fairly in Conformity with Generally Accepted Accounting Principles. We do not expect the adoption of SFAS No. 162 to have a material impact on our consolidated financial statements.

In April 2008, the FASB finalized Staff Position (FSP) No. 142-3, “Determination of the Useful Life of Intangible Assets”. The position amends the factors that should be considered in developing renewal or extension assumptions used to determine the useful life of a recognized intangible asset under FASB SFAS No. 142, Goodwill and Other Intangible Assets. The position applies to intangible assets that are acquired individually or with a group of other assets and both intangible assets acquired in business combinations and asset acquisitions. FSP 142-3 is effective for fiscal years beginning after December 15, 2008, and interim periods within those fiscal years. Management is currently evaluating the impact of the pending adoption of FSP 142-3 on the consolidated financial statements.

standards.


In December 2007, the FASB issued SFAS No. 141 (Revised 2007), “Business Combinations” (SFAS 141R). SFAS 141(R) retains the fundamental requirements of the original pronouncement requiring that the purchase method be used for all business combinations. SFAS 141(R) defines the acquirer as the entity that obtains control of one or more businesses in the business combination, establishes the acquisition date as the date that the acquirer achieves control and requires the acquirer to recognize the assets acquired, liabilities assumed and any noncontrolling interest at their fair values as of the acquisition date. In addition, SFAS 141(R) requires expensing of acquisition-related and restructure-related costs, remeasurement of earn out provisions at fair value, measurement of equity securities issued for purchase at the date of close of the transaction and non-expensing of in-process research and development related intangibles. SFAS 141(R) applies prospectively to business combinations for which the acquisition date is on or after the beginning of the first annual reporting period beginning on or after December 15, 2008. An entity may not apply it before that date. This pronouncement will be applied by the Company when it becomes effective and when or if the Company effectuates a business combination, otherwise there is no impact on the Company’s financial statements.

In February 2007, the FASB issued SFAS No. 159, “The Fair Value Option for Financial Assets and Financial Liabilities—including an amendment of SFAS No. 115”, (SFAS 159) which applies to all entities with available-for-sale and trading securities. This Statement permits entities to choose to measure many financial instruments and certain other items at fair value. The objective is to improve financial reporting by providing entities with the opportunity to mitigate volatility in reported earnings caused by measuring related assets and liabilities differently without having to apply complex hedge accounting provisions. This Statement is effective as of the beginning of an entity’s first fiscal year that begins after November 15, 2007. Early adoption is permitted as of the beginning of a fiscal year that begins on or before November 15, 2007, provided the entity also elects to apply the provisions of FASB Statement No. 157, “Fair Value Measurements”. The Company plans to adopt SFAS 159 effective April 1, 2008 and is in the process of determining the effect, if any, the adoption of SFAS 159 will have on its consolidated financial statements.

In September 2006, the FASB issued Statement of Financial Accounting Standards No. 157, “Fair Value Measurements” (SFAS 157), which defines fair value, establishes a framework for measuring fair value in GAAP, and expands disclosures about fair value measurements. SFAS 157 does not require any new fair value measurements, but provides guidance on how to measure fair value by providing a fair value hierarchy used to classify the source of the information. This statement is effective for fiscal years beginning after November 15, 2007. The Company is currently evaluating the impact, if any, the adoption of this standard will have on its consolidated financial statements.

ITEM 7A.

QUANTITATIVE AND QUALITATIVE DISCLOSUREDISCLOSURES ABOUT MARKET RISKS

We maintain investments in tax exempt municipal Auction Rate Securities (ARS)ARS which are classified as current and non-current marketable securities on the Company’s Consolidated Balance Sheets. A small portion of the Company’sour portfolio is invested in closed-end funds which invest in tax exempt municipal auction rate securities.ARS. At March 31, 2008,2010, we had approximately $22.6$7.2 million of ARS on our Consolidated Balance Sheets. The ARS are rated by one or more national rating agencies and have contractual terms of up to 30 years but generally have interest rate reset dates that occur every 7, 28 or 35 days.

Despite the underlying long-term maturity of ARS, such securities were priced and subsequently traded as short-term investments because of the interest rate reset feature. If there are insufficient buyers, the auction is said to “fail” and the holders are unable to liquidate the investments through auction. A failed auction does not result in a


52


default of the debt instrument. The securities will continue to accrue interest and be auctioned until the auction succeeds, the issuer calls the securities, or the securities mature. In February 2008, the Companywe began to experience failed auctions on itsour ARS and auction rate preferred securities. To determine their estimated fair values at March 31, 2008,2010, factors including credit quality, the likelihood of redemption, and yields or spreads of fixed rate municipal bonds or other trading instruments issued by the same or comparable issuers, were considered.  Based on these factors, a temporary impairment of $326 was recorded to accumulated other comprehensive loss in the accompanying consolidated financial statements as of March 31, 2008.  If the Company sells any of the ARS, prior to maturity, at an amount below original purchase value, or if it becomes probable that the Company will not receive 100% of the principal and interest from the issuer as to any of the ARS, the Company will be required to recognize an other-than-temporary impairment charge against net income. Based on our ability to access our cash and other short-term investments, our expected operating cash flows, and our other sources of cash, we do not anticipate the current lack of liquidity on these investments to have a material impact on our financial condition or results of operation.


ITEM 8.

FINANCIAL STATEMENTS AND SUPPLEMENTARY DATA

Our Consolidated Financial Statements identified in the Index to Financial Statements appearing under “Item 15. Exhibits and Financial Statement Schedules” of this reportReport are incorporated herein by reference to Item 15.

ITEM 9.

CHANGES IN AND DISAGREEMENTS WITH ACCOUNTANTS ON ACCOUNTING AND FINANCIAL DISCLOSURE

None.

ITEM 9A.

CONTROLS AND PROCEDURES

Evaluation of Disclosure Controls and Procedures

Our Chief Executive Officer and Chief Financial Officer (our principal executive officer and principal financial officer, respectively) have concluded, based on their evaluation as of March 31, 2008,2010, that the design and operation of our “disclosure controls and procedures” (as defined inRule 13a-15(e) and15d-15(e) under the Exchange Act)Act of 1934, as amended) are effective to provide reasonable assurance that information required to be disclosed by us in the reports filed or submitted by us under the Security Exchange Act of 1934, as amended, is recorded, processed, summarized and reported, within the time periods specified in the Commission’s rules and forms, including to ensure that information required to be disclosed by us in the reports we file or submit under the Exchange Act is accumulated and communicated to our management, including our Chief Executive Officer and Chief Financial Officer, as appropriate to allow timely decisions regarding whether or not disclosure is required.

Changes in Internal Control over Financial Reporting

During the quarter ended March 31, 2008, there were no changes in our “internal control over financial reporting” (as defined in Rule 13a-15(f) under the Exchange Act) that have materially affected, or are reasonably likely to materially affect, our internal control over financial reporting.

Management’s Report on Internal Control over Financial Reporting

Our management is responsible for establishing and maintaining adequate internal control over financial reporting as defined inRule 13a-15(f) under the Exchange Act. UnderInternal control over financial reporting is a process designed by, or under the supervision and with the participation of our management, including our principal executive officer and principal financial officer, we conducted an evaluationto provide reasonable assurance regarding the reliability of the effectiveness of our internal control over financial reporting based onand the framework set forthpreparation of financial statements for external purposes in Internal Control — Integrated Framework issued by the Committee of Sponsoring Organizations of the Treadway Commission. Based on this evaluation, our management concluded that our internal control over financial reporting was effective as of March 31, 2008.

accordance with generally accepted accounting principles.

Our internal control over financial reporting is supported by written policies and procedures, that:

(1)

pertain to the maintenance of records that, in reasonable detail, accurately and fairly reflect the transactions and dispositions of our assets;

(2)

provide reasonable assurance that transactions are recorded as necessary to permit preparation of financial statements in accordance with generally accepted accounting principles, and that receipts and expenditures of our company are being made only in accordance with authorizations of our management and directors; and

(3)

provide reasonable assurance regarding prevention or timely detection of unauthorized acquisition, use or disposition of our assets that could have a material effect on our financial statements.

(1) pertain to the maintenance of records that, in reasonable detail, accurately and fairly reflect the transactions and dispositions of our assets;
(2) provide reasonable assurance that transactions are recorded as necessary to permit preparation of financial statements in accordance with generally accepted accounting principles, and that receipts and expenditures of our company are being made only in accordance with authorizations of our management and directors; and
(3) provide reasonable assurance regarding prevention or timely detection of unauthorized acquisition, use or disposition of our assets that could have a material effect on our financial statements.
Because of its inherent limitations, in allinternal control systems, no matter how well designed, no evaluation of controls can provide absolute assurance that all control issues within the Company have beenover financial reporting may not prevent or will be detected.detect misstatements. Also, projections of any evaluation of effectiveness to future periods are subject to the risks that


53


controls may become inadequate because of changes in conditions or that the degree of compliance with the policies or procedures may deteriorate.

Our independent registered public accounting firm

Management of the Company has auditedassessed the effectiveness of ourthe Company’s internal control over financial reporting as of March 31, 20082010 in making our assessment of internal control over financial reporting, management used the criteria set forth inInternal Control — Integrated Frameworkissued by the Committee of Sponsoring Organizations of the Treadway Commission. Based on our evaluation, our management concluded that our internal control over financial reporting was effective as of March 31, 2010.
The effectiveness of the Company’s internal control over financial reporting as of March 31, 2010 has been audited by PricewaterhouseCoopers LLP, an independent registered public accounting firm, as stated in their report which appears herein.
Changes in Internal Control over Financial Reporting
During the quarter ended March 31, 2010, there were no changes in our “internal control over financial reporting” (as defined inRule 13a-15(f) under the Exchange Act) that is included herein.

have materially affected, or are reasonably likely to materially affect, our internal control over financial reporting.


ITEM 9B.

OTHER INFORMATION

We have experienced legal claims by parties asserting that we have infringed their intellectual property rights. We believe that these claims are without merit and intend to defend against them vigorously; however, we could incur substantial costs and diversion of management resources defending any infringement claim – even if we are ultimately successful in the defense of such matter. Litigation is inherently uncertain and always difficult to predict. We refer you to the discussion of infringement and litigation risks in our Risk Factors section of this Report.

None.
PartPART III

ITEM 10. DIRECTORS, EXECUTIVE OFFICERS AND CORPORATE GOVERNANCE

ITEM 10.DIRECTORS, EXECUTIVE OFFICERS AND CORPORATE GOVERNANCE
The information required by Item 10 is incorporated herein by reference from our definitive proxy statement for our 2008 annual shareholders’ meeting2010 Annual Shareholders’ Meeting to be filed with the Commission.

ITEM 11. EXECUTIVE COMPENSATION

ITEM 11.EXECUTIVE COMPENSATION
The information required by Item 11 is incorporated herein by reference from our definitive proxy statement for our 2008 annual shareholders’ meeting2010 Annual Shareholders’ Meeting to be filed with the Commission.

ITEM 12. SECURITY OWNERSHIP OF CERTAIN BENEFICIAL OWNERS AND MANAGEMENT AND RELATED STOCKHOLDER MATTERS

ITEM 12.SECURITY OWNERSHIP OF CERTAIN BENEFICIAL OWNERS AND MANAGEMENT AND RELATED SHAREHOLDER MATTERS
The information required by Item 12 is incorporated herein by reference from our definitive proxy statement for our 2008 annual shareholders’ meeting2010 Annual Shareholders’ Meeting to be filed with the Commission.

ITEM 13. CERTAIN RELATIONSHIPS AND RELATED TRANSACTIONS, AND DIRECTOR INDEPENDENCE

ITEM 13.CERTAIN RELATIONSHIPS AND RELATED TRANSACTIONS, AND DIRECTOR INDEPENDENCE
The information required by Item 13 is incorporated herein by reference from our definitive proxy statement for our 2008 annual shareholders’ meeting2010 Annual Shareholders’ Meeting to be filed with the Commission.

ITEM 14. PRINCIPAL ACCOUNTANT FEES AND SERVICES

ITEM 14.PRINCIPAL ACCOUNTANT FEES AND SERVICES
The information required by Item 14 is incorporated herein by reference from our definitive proxy statement for our 2008 annual shareholders’ meeting2010 Annual Shareholders’ Meeting to be filed with the Commission.


54


PART IV

ITEM 15.

EXHIBITS AND FINANCIAL STATEMENT SCHEDULES


(a)

(1)

Index to Financial Statements:

Page


n

Report of Independent Registered Public Accounting Firm

52

n

Report of Independent Registered Public Accounting Firm

53

n

Consolidated Balance Sheets
March 31, 2008 and March 31, 2007

54

n

Consolidated Statements of Income — Years Ended
March 31, 2008, March 31, 2007 and March 31, 2006

55

n

Consolidated Statements of Shareholders’ Equity — Years Ended
March 31, 2008, March 31, 2007 and March 31, 2006

56

n

Consolidated Statements of Cash Flows — Years Ended
March 31, 2008, March 31, 2007 and March 31, 2006

57

n

Notes to Consolidated Financial Statements

58

(2)

The following financial statement schedule for the years ended March 31, 2008, March 31, 2007 and 2008, read in conjunction with the financial statements of Quality Systems, Inc., is filed as part of this Annual Report on Form 10-K.

n

Schedule II — Valuation and Qualifying Accounts

78

Schedules other than that listed above have been omitted since they are either not required, not applicable, or because the information required is included in the financial statements or the notes thereto.

(3)

The exhibits listed in the Index to Exhibits hereof are attached hereto or incorporated herein by reference and filed as a part of this Report.


INDEX TO EXHIBITS

(a) (1) Index to Financial Statements:

Exhibit
Number

Description


3.1

Restated Articles of Incorporation of Quality Systems, Inc. filed with the Secretary of State of California on September 8, 1989, are hereby incorporated by reference to Exhibit 3.1 to the registrant’s Registration Statement on Form S-1 (Registration No. 333-00161) filed January 11, 1996.

3.2

Certificate of Amendment to Articles of Incorporation of Quality Systems, Inc. filed with the Secretary of State of California effective March 4, 2005, is hereby incorporated by reference to Exhibit 3.1.1 of the registrant’s Annual Report on Form 10-K for the year ended March 31, 2005.

3.3

Certificate of Amendment to Articles of Incorporation of Quality Systems, Inc. filed with the Secretary of State of California effective October 6, 2005 is hereby incorporated by reference to Exhibit 3.01 of the registrant’s Current Report on Form 8-K filed October 11, 2005.

3.4

Certificate of Amendment to Articles of Incorporation of Quality Systems, Inc. filed with the Secretary of State of California effective March 3, 2006 is hereby incorporated by reference to Exhibit 3.1 of the registrant’s Current Report on Form 8-K filed March 6, 2006.

3.5

Amended and Restated Bylaws of Quality Systems, Inc., as amended and restated effective May 25, 2005, are hereby incorporated by reference to Exhibit 3.6 of the registrant’s Annual Report on Form 10K for the year ended March 31, 2005.

3.6

Certificate of Amendment of Bylaws of the Company effective September 20, 2006 is hereby incorporated by reference to Exhibit 3.1 to the registrant’s Current Report on Form 8-K filed September 25, 2006.

3.7

Amended Exhibit A to Amended and Restated Bylaws, adopted by the registrant’s Board of Directors on May 31, 2007, is hereby incorporated by reference to Exhibit 3.1 of the registrant’s Current Report on Form 8-K filed June 5, 2007.

3.8

Amended and Restated Bylaws of Quality Systems, Inc., effective May 29, 2008 is hereby incorporated by reference to Exhibit 3.1 to the registrant’s Current Report on Form 8-K filed June 2, 2008.

10.1

*

Amended and Restated 1998 Stock Option Plan is hereby incorporated by reference to Exhibit 10.10.1 of the registrant’s Annual Report on Form 10-K for the year ended March 31, 2005.

10.2

*

Form of Incentive Stock Option Agreement for Amended and Restated 1998 Stock Option Plan is hereby incorporated by reference to Exhibit 10.1 to the registrant’s Quarterly Report on Form 10-Q for the quarter ended September 30, 2004.

10.3

*

Form of Non-Qualified Stock Option Agreement for Amended and Restated 1998 Stock Option Plan is hereby incorporated by reference to Exhibit 10.2 to the registrant’s Quarterly Report on Form 10Q for the quarter ended September 20, 2004.

10.4

*

2005 Stock Option and Incentive Plan is incorporated by reference to Exhibit 10.01 to the registrant’s Current Report on Form 8-K filed October 5, 2005.

10.5

*

Form of Nonqualified Stock Option Agreement for 2005 Stock Incentive Plan is incorporated by reference to Exhibit 10.2 to the registrant’s Current Report on Form 8-K filed June 5, 2007.

10.6

*

Form of Incentive Stock Option Agreement for 2005 Stock Incentive Plan is incorporated by reference to Exhibit 10.3 to the registrant’s Current Report on Form 8-K filed June 5, 2007.


Exhibit
Number

Description


10.7

*

1993 Deferred Compensation Plan is hereby incorporated by reference to Exhibit 10.5 to the registrant’s Annual Report on Form 10-KSB for the year ended March 31, 1994.

10.8

*

1998 Employee Stock Contribution Plan is hereby incorporated by reference to Exhibit 4.1 to the registrant’s Registration Statement on Form S-8 (Registration No. 333-63131).

10.9

*

Employment Agreement dated July 20, 2000 between Quality Systems, Inc. and Lou Silverman is hereby incorporated by reference to Exhibit 10.18 to the registrant’s Quarterly Report on Form 10-Q for the quarter ended September 30, 2000.

10.10

*

Form of Indemnification Agreement for directors and executive officers authorized January 27, 2005 is hereby incorporated by reference to Exhibit 10.6.1 of the registrant’s Annual Report on Form 10-K for the year ended March 31, 2005.

10.11

Lease Agreement between Company and Tower Place, L.P. dated November 15, 2000, commencing February 5, 2001 is hereby incorporated by reference to Exhibit 10.14 to the registrant’s Annual Report on Form 10-K for the year ended March 31, 2001.

10.12

Fourth Amendment to lease agreement between the Company and Tower Place, L.P. dated September 22, 2005 is incorporated by reference to Exhibit 10.24 to the registrant’s Annual Report on Form 10-K for the year ended March 31, 2006.

10.13

Fifth Amendment to lease agreement between the Company and Tower Place, L.P. dated January 31, 2007 is incorporated by reference to Exhibit 10.13 to the registrant's Annual Report on Form 10-K for the year ended March 31, 2007.

10.14

Lease Agreement between Company and Orangewood Business Center Inc. dated April 3, 2000, amended February 22, 2001, is hereby incorporated by reference to Exhibit 10.15 to the registrant’s Annual Report on Form 10-K for the year ended March 31, 2001.

10.15

Lease Agreement between the Company and HUB Properties LLC dated May 8, 2002 is hereby incorporated by reference to Exhibit 10.18 to the registrant’s Annual Report on Form 10-K for the year ended March 31, 2003.

10.16

Second Amendment to Office Lease agreement between the Company and HUB Properties LLC dated February 14, 2006 is incorporated by reference to Exhibit 10.25 to the registrant’s Annual Report on Form 10-K for the year ended March 31, 2006.

10.17

Amended and Restated Second Amendment to Office Lease agreement between the Company and HUB Properties LLC dated May 31, 2006 is incorporated by reference to Exhibit 10.17 to the registrant's Annual Report on Form 10-K for the year ended March 31, 2007.

10.18

Lease Agreement between the Company and LakeShore Towers Limited Partnership Phase IV, a California limited partnership, dated September 15, 2004 is hereby incorporated by reference to Exhibit 10.19 of the registrant’s Annual Report on Form 10-K for the year ended March 31, 2005.

10.19

Lease agreement between the Company and Von Karman Michelson Corporation dated September 6, 2005 is incorporated by reference to Exhibit 10.23 to the registrant’s Annual Report on Form 10-K for the year ended March 31, 2006.

10.20

Office lease between the Company and SLTS Grand Avenue, L.P. dated May 3, 2006 is incorporated by reference to Exhibit 10.20 to the registrant's Annual Report on Form 10-K for the year ended March 31, 2007.

10.21

*

Board Service Agreement between the Company and Lou Silverman is incorporated by reference to Exhibit 10.2.1 to the registrant’s Current Report of Form 8-K, dated May 31, 2005.


Exhibit
Number

Description


10.22

*

Board Service Agreement between the Company and Patrick Cline is incorporated by reference to Exhibit 10.2.1 to the registrant’s Current Report of Form 8-K dated May 31, 2005.

10.23

*

Director Compensation Program approved May 25, 2006 is incorporated by reference to Exhibit 10.1 to the registrant’s Current Report on Form 8-K filed May 30, 2006.

10.24

Settlement Agreement dated as of August 8, 2006 between the registrant and Ahmed Hussein is incorporated by reference to Exhibit 10.1 to the registrant’s Current Report on Form 8-K filed August 9, 2006.

10.25

*

Description of Compensation Program for Named Executive Officers for Fiscal Year Ended March 31, 2008 is incorporated by reference to Exhibit 10.25 to the registrant's Annual Report on Form 10-K for the year ended March 31, 2007.

10.26

*

Description of Compensation Program for Named Executive Officers for Fiscal Year Ending March 31, 2007 is incorporated by reference to Exhibit 10.26 to the registrant's Annual Report on Form 10-K for the year ended March 31, 2007.

10.27

Agreement and Plan of Merger dated May 16, 2008 by and among Quality Systems, Inc., Bud Merger Sub, LLC and Lackland Acquisition II, LLC.**

10.28

Office lease between the Company and Lakeshore Towers Limited Partnership Phase II, a California limited partnership, dated October 18, 2007.**

10.29

Standard Service Center Lease Agreement between the Lincoln National Life Insurance Company and Lackland Acquisition II, LLC, dated November 28, 2001.**

10.30First Amendment to Standard Service Center Lease Agreement between the Lincoln National Life Insurance Company and Lackland Acquisition II, LLC, dated August 17, 2005.**
 
10.31Standard Service Center Lease Agreement between the Lincoln National Life Insurance Company and InfoNow Solutions of St. Louis, LLC, dated November 28, 2001.**
10.32Second Amendment to Service Center Lease Agreement between TM Properties, L.L.C., successor to The Lincoln National Life Insurance Company and Lackland Acquisition II, LLC, dated August 17, 2005.**
10.33Assignment of Lease between InfoNow Solutions of St. Louis, Lackland Acquisition II, LLC, and TM Properties, LLC, dated August 17, 2005.**
    

21     

List of subsidiaries.**

Page

23     

Consent

60

61

31.1  

Certification of Principal Executive Officer Required by Rule 13a-14(a) of the Securities Exchange Act of 1934, as amended, as Adopted Pursuant to Section 302 of the Sarbanes-Oxley Act of 2002 **

62

63

31.2  

Certification of Principal Financial Officer Required by Rule 13a-14(a) of the Securities Exchange Act of 1934, as amended, as Adopted Pursuant to Section 302 of the Sarbanes-Oxley Act of 2002 **

64

65

32.1  

Certification of Chief Executive Officer and Chief Financial Officer Pursuant to 18 U.S.C. Section 1350, as Adopted Pursuant to Section 906 of the Sarbanes-Oxley Act of 2002. **

67

(2) The following supplementary financial statement schedule of Quality Systems, Inc., required to be included in Item 15(a)(2) on Form10-K is filed as part of this Report.

• Schedule II — Valuation and Qualifying Accounts98
Schedules other than that listed above have been omitted since they are either not required, not applicable, or because the information required is included in the Consolidated Financial Statements or the notes thereto.
(3) The exhibits listed in the Index to Exhibits hereof are attached hereto or incorporated herein by reference and filed as a part of this Report.


55


INDEX TO EXHIBITS
     
Exhibit
  
Number
 
Description
 
 3.1 Restated Articles of Incorporation of Quality Systems, Inc. filed with the Secretary of State of California on September 8, 1989, are hereby incorporated by reference to Exhibit 3.1 to the registrant’s Registration Statement onForm S-1 (RegistrationNo. 333-00161) filed January 11, 1996.
 3.2 Certificate of Amendment to Articles of Incorporation of Quality Systems, Inc. filed with the Secretary of State of California effective March 4, 2005, is hereby incorporated by reference to Exhibit 3.1.1 of the registrant’s Annual Report onForm 10-K for the year ended March 31, 2005.
 3.3 Certificate of Amendment to Articles of Incorporation of Quality Systems, Inc. filed with the Secretary of State of California effective October 6, 2005 is hereby incorporated by reference to Exhibit 3.01 of the registrant’s Current Report onForm 8-K filed October 11, 2005.
 3.4 Certificate of Amendment to Articles of Incorporation of Quality Systems, Inc. filed with the Secretary of State of California effective March 3, 2006 is hereby incorporated by reference to Exhibit 3.1 of the registrant’s Current Report onForm 8-K filed March 6, 2006.
 3.5 Amended and Restated Bylaws of Quality Systems, Inc., effective October 30, 2008, are hereby incorporated by reference to Exhibit 3.1 of the registrant’s Current Report onForm 8-K filed October 31, 2008.
 10.1* Amended and Restated 1998 Stock Option Plan is hereby incorporated by reference to Exhibit 10.10.1 of the registrant’s Annual Report onForm 10-K for the year ended March 31, 2005.
 10.2* Form of Incentive Stock Option Agreement for Amended and Restated 1998 Stock Option Plan is hereby incorporated by reference to Exhibit 10.1 to the registrant’s Quarterly Report onForm 10-Q for the quarter ended September 30, 2004.
 10.3* Form of Non-Qualified Stock Option Agreement for Amended and Restated 1998 Stock Option Plan is hereby incorporated by reference to Exhibit 10.2 to the registrant’s Quarterly Report on Form 10Q for the quarter ended September 20, 2004.
 10.4* 2005 Stock Option and Incentive Plan is incorporated by reference to Exhibit 10.01 to the registrant’s Current Report onForm 8-K filed October 5, 2005.
 10.5* Form of Nonqualified Stock Option Agreement for 2005 Stock Incentive Plan is incorporated by reference to Exhibit 10.2 to the registrant’s Current Report onForm 8-K filed June 5, 2007.
 10.6* Form of Incentive Stock Option Agreement for 2005 Stock Incentive Plan is incorporated by reference to Exhibit 10.3 to the registrant’s Current Report onForm 8-K filed June 5, 2007.
 10.7* 1993 Deferred Compensation Plan is hereby incorporated by reference to Exhibit 10.5 to the registrant’s Annual Report onForm 10-KSB for the year ended March 31, 1994.
 10.8* 1998 Employee Stock Contribution Plan is hereby incorporated by reference to Exhibit 4.1 to the registrant’s Registration Statement onForm S-8 (RegistrationNo. 333-63131).
 10.9* Form of Second Amended and Restated Indemnification Agreement for directors and executive officers is hereby incorporated by reference to Exhibit 10.3 of the registrant’s Current Report onForm 8-K filed on February 2, 2010.
 10.10 Lease Agreement between Company and Tower Place, L.P. dated November 15, 2000, commencing February 5, 2001 is hereby incorporated by reference to Exhibit 10.14 to the registrant’s Annual Report onForm 10-K for the year ended March 31, 2001.
 10.11 Fourth Amendment to lease agreement between the Company and Tower Place, L.P. dated September 22, 2005 is incorporated by reference to Exhibit 10.24 to the registrant’s Annual Report onForm 10-K for the year ended March 31, 2006.
 10.12 Fifth Amendment to lease agreement between the Company and Tower Place, L.P. dated January 31, 2007 is incorporated by reference to Exhibit 10.13 to the registrant’s Annual Report onForm 10-K for the year ended March 31, 2007.
 10.13 Lease Agreement between the Company and HUB Properties LLC dated May 8, 2002 is hereby incorporated by reference to Exhibit 10.18 to the registrant’s Annual Report onForm 10-K for the year ended March 31, 2003.


56


Exhibit
  
Number
 
Description
 
 10.14 Second Amendment to Office Lease agreement between the Company and HUB Properties LLC dated February 14, 2006 is incorporated by reference to Exhibit 10.25 to the registrant’s Annual Report onForm 10-K for the year ended March 31, 2006.
 10.15 Amended and Restated Second Amendment to Office Lease agreement between the Company and HUB Properties LLC dated May 31, 2006 is incorporated by reference to Exhibit 10.17 to the registrant’s Annual Report onForm 10-K for the year ended March 31, 2007.
 10.16 Lease agreement between the Company and Von Karman Michelson Corporation dated September 6, 2005 is incorporated by reference to Exhibit 10.23 to the registrant’s Annual Report onForm 10-K for the year ended March 31, 2006.
 10.17 Office lease between the Company and SLTS Grand Avenue, L.P. dated May 3, 2006 is incorporated by reference to Exhibit 10.20 to the registrant’s Annual Report onForm 10-K for the year ended March 31, 2007.
 10.18* Board Service Agreement between the Company and Patrick Cline is incorporated by reference to Exhibit 10.2.1 to the registrant’s Current Report onForm 8-K dated May 31, 2005.
 10.19* Director Compensation Program is incorporated by reference to Exhibit 10.1 to the registrant’s Current Report onForm 8-K filed February 2, 2010.
 10.20 Settlement Agreement dated as of August 8, 2006 between the registrant and Ahmed Hussein is incorporated by reference to Exhibit 10.1 to the registrant’s Current Report onForm 8-K filed August 9, 2006.
 10.21* Description of Compensation Program for Named Executive Officers for Fiscal Year Ended March 31, 2010 is incorporated by reference to Exhibit 10.1 to the registrant’s Current Report onForm 8-K filed June 1, 2009.
 10.22 Agreement and Plan of Merger dated May 16, 2008 by and among Quality Systems, Inc., Bud Merger Sub, LLC and Lackland Acquisition II, LLC, is incorporated by reference to Exhibit 10.27 to the registrant’s Annual Report onForm 10-K for the year ended March 31, 2008.
 10.23 Office lease between the Company and Lakeshore Towers Limited Partnership Phase II, a California limited partnership, dated October 18, 2007, is incorporated by reference to Exhibit 10.28 to the registrant’s Annual Report onForm 10-K for the year ended March 31, 2008.
 10.24 Standard Service Center Lease Agreement between the Lincoln National Life Insurance Company and Lackland Acquisition II, LLC, dated November 28, 2001, is incorporated by reference to Exhibit 10.29 to the registrant’s Annual Report onForm 10-K for the year ended March 31, 2008.
 10.25 First Amendment to Standard Service Center Lease Agreement between the Lincoln National Life Insurance Company and Lackland Acquisition II, LLC, dated August 17, 2005, is incorporated by reference to Exhibit 10.30 to the registrant’s Annual Report onForm 10-K for the year ended March 31, 2008.
 10.26 Standard Service Center Lease Agreement between the Lincoln National Life Insurance Company and InfoNow Solutions of St. Louis, LLC, dated November 28, 2001, is incorporated by reference to Exhibit 10.31 to the registrant’s Annual Report onForm 10-K for the year ended March 31, 2008.
 10.27 Second Amendment to Service Center Lease Agreement between the TM Properties, LLC, successor to the Lincoln National Life Insurance Company and Lackland Acquisition II, LLC, dated August 17, 2005, is incorporated by reference to Exhibit 10.32 to the registrant’s Annual Report onForm 10-K for the year ended March 31, 2008.
 10.28 Assignment of Lease between InfoNow Solutions of St. Louis, Lackland Acquisition II, LLC and TM Properties, LLC dated August 17, 2005, is incorporated by reference to Exhibit 10.33 to the registrant’s Annual Report onForm 10-K for the year ended March 31, 2008.
 10.29 Agreement and Plan of Merger dated October 15, 2008 by and among (i) Quality Systems, Inc. (ii) NextGen Healthcare Information Systems, Inc. (iii) Ruth Merger Sub, Inc. (iv) Practice Management Partners, Inc. and (v) certain shareholders set forth therein, is incorporated by reference to Exhibit 10.1 to the registrant’s Quarterly Report onForm 10-Q for the quarter ended December 31, 2008.

57


Exhibit
  
Number
 
Description
 
 10.30 First Amendment to Lease Agreement between Hill Management Services, Inc. and Practice Management Partners, Inc., dated January 15, 2008, is incorporated by reference to Exhibit 10.2 to the registrant’s Quarterly Report onForm 10-Q for the quarter ended December 31, 2008.
 10.31 First Amendment to Sublease Agreement between RehabCare Group, Inc. and Practice Management Partners Inc., dated January 15 2008, is incorporated by reference to Exhibit 10.3 to the registrant’s Quarterly Report onForm 10-Q for the quarter ended December 31, 2008.
 10.32 Third Amendment to Lease Agreement between Pinecrest LLC and Practice Management Partners, Inc., dated April 30, 2007, is incorporated by reference to Exhibit 10.4 to the registrant’s Quarterly Report onForm 10-Q for the quarter ended December 31, 2008.
 10.33* Employment Agreement dated August 11, 2008 between Quality Systems, Inc., and Steven Plochocki, is incorporated by reference to Exhibit 10.1 to the registrant’s Current Report onForm 8-K filed on August 12, 2008.
 10.34* Outside Directors Amended and Restated Restricted Stock Agreement is incorporated by reference to Exhibit 10.2 to the Company’s Current Report onForm 8-K filed February 9, 2010.
 10.35* Employment Offer and Terms of Employment dated September 17, 2009, between Quality Systems, Inc. and Philip N. Kaplan, is incorporated by reference to Exhibit 10.1 to the registrant’s Current Report onForm 8-K filed on September 21, 2009.
 10.36** Agreement and Plan of Merger dated February 10, 2010, by and among Quality Systems, Inc., OHS Merger Sub, Inc., Opus Healthcare Solutions, Inc., and the Shareholders of Opus Healthcare Solutions, Inc.
 10.37** Sixth Amendment to Lease Agreement between the Company and Tower Place, L.P. dated April 1, 2010.
 10.38** Third Amendment to Office Lease agreement between the Company and HUB Properties LLC dated January 1, 2010.
 10.39** Fourth Amendment to Office Lease agreement between the Company and HUB Properties LLC dated March 17, 2010.
 10.40** Third Amendment to Service Center Lease Agreement between the TM Properties, LLC, successor to the Lincoln National Life Insurance Company and Lackland Acquisition II, LLC, dated March 15, 2010.
 10.41** Second Amendment to Lease Agreement between Hill Management Services, Inc. and Practice Management Partners, Inc., dated November 1, 2009.
 10.42** Modification of Lease #1 between Olen Commercial Realty Corp. and NXG Acute Care LLC, dated October 13, 2009.
 10.43** Lease between Olen Commercial Realty Corp. and NXG Acurate Care LLC, dated October 1, 2009.
 10.44** Sublease Agreement between Centex Homes and Opus Healthcare Solutions, Inc., dated February   , 2009.
 21** List of subsidiaries.
 23.1** Consent of Independent Registered Public Accounting Firm — PricewaterhouseCoopers LLP.
 23.2** Consent of Independent Registered Public Accounting Firm — Grant Thornton LLP.
 31.1** Certification of Principal Executive Officer Required byRule 13a-14(a) of the Securities Exchange Act of 1934, as amended, as Adopted Pursuant to Section 302 of the Sarbanes-Oxley Act of 2002.
 31.2** Certification of Principal Financial Officer Required byRule 13a-14(a) of the Securities Exchange Act of 1934, as amended, as Adopted Pursuant to Section 302 of the Sarbanes-Oxley Act of 2002.
 32.1** Certification of Chief Executive Officer and Chief Financial Officer Pursuant to 18 U.S.C. Section 1350, as Adopted Pursuant to Section 906 of the Sarbanes-Oxley Act of 2002.

*

This exhibit is a management contract or a compensatory plan or arrangement.

**

Filed herewith.

58


SIGNATURES

Pursuant to the requirements of Section 13 or 15(d) of the Securities Exchange Act of 1934, the registrant has duly caused this reportReport to be signed on its behalf by the undersigned, thereunto duly authorized.

By: /s/ LOUIS E. SILVERMAN


Louis E. Silverman,

President and Chief Executive Officer

/s/  Steven T. Plochocki

Steven T. Plochocki
President and Chief Executive Officer
Date: June 10, 2008

May 26, 2010

KNOW ALL PERSONS BY THESE PRESENTS, that each of the persons whose signature appears below hereby constitutes and appoints Louis E. SilvermanSteven T. Plochocki and Paul A. Holt, each of them acting individually, as his attorney-in-fact, each with the full power of substitution, for him in any and all capacities, to sign any and all amendments to this Annual Report onForm 10-K, and to file the same, with all exhibits thereto and other documents in connection therewith, with the Securities and Exchange Commission, granting unto said attorneys-in-fact, and each of them, full power and authority to do and perform each and every act and thing requisite and necessary to be done in and about the premises as fully to all intents and purposes as he might or could do in person, hereby ratifying and confirming our signatures as they may be signed by our said attorney-in-fact and any and all amendments to this Annual Report onForm 10-K.

Pursuant to the requirement of the Securities Exchange Act of 1934, this Report has been signed by the following persons on our behalf in the capacities and on the dates indicated.

Signature

Title

Date


/s/  Sheldon Razin

May 29, 2008


Sheldon Razin

Chairman of the Board and Director

May 26, 2010

/s/  Louis E. Silverman

Steven T. Plochocki

Steven T. Plochocki

President and Chief Executive Officer

May 29, 2008


(Principal Executive Officer) and

Director

May 26, 2010

Louis E. Silverman

Director

/s/  Paul A. Holt


Paul A. Holt

Chief Financial Officer (Principal

May 29, 2008


(Principal Financial Officer) and Secretary

May 26, 2010

Paul A. Holt

/s/  Patrick B. Cline

President, NextGen Healthcare Information

May 29, 2008


Patrick B. Cline

Systems Division, President and Chief Strategy Officer,
and Director

May 26, 2010


/s/  Murray Brennan

Murray Brennan

Director

May 26, 2010

Ibrahim Fawzy

Director

/s/  George Bristol

George Bristol

Director

May 26, 2010

/s/ Edwin Hoffman

May 29, 2008


Ahmed Hussein

Director

Edwin Hoffman

Director


Joseph Davis

Director


Ahmed Hussein

/s/  Craig Barbarosh

Craig Barbarosh

Director

May 26, 2010

/s/ Vincent J. Love

May 29, 2008


Vincent J. Love

Director


Signature

Title

Date


/s/  Russell Pflueger

May 29, 2008


Russell Pflueger

Director

/s/ Steven T. Plochocki

May 29, 2008


Steven T. Plochocki

Director

26, 2010


59


REPORT OF INDEPENDENT REGISTERED PUBLIC ACCOUNTING FIRM

To the Board of Directors and Shareholders
Quality Systems, Inc.

We have audited the accompanying consolidated balance sheets of Quality Systems, Inc. as of March 31, 2008 and 2007, and,

In our opinion, the related consolidated statements of income, shareholders’ equity, and cash flows for each of the three years ended March 31, 2008. Our audits of the basic financial statements included the financial statement Schedule II listed in the index appearing under Item 15 (a)(2). These15(a)(1), present fairly, in all material respects, the financial statementsposition of Quality Systems, Inc. and its subsidiaries at March 31, 2010, and the results of their operations and their cash flows for the year then ended in conformity with accounting principles generally accepted in the United States of America. In addition, in our opinion, the financial statement schedule arelisted in the responsibilityindex appearing under Item 15(a)(2), presents fairly, in all material respects, the information set forth therein for the year ended March 31, 2010 when read in conjunction with the related consolidated financial statements. Also in our opinion, the Company maintained, in all material respects, effective internal control over financial reporting as of March 31, 2010, based on criteria established in Internal Control — Integrated Framework issued by the Committee of Sponsoring Organizations of the Treadway Commission (COSO). The Company’s management. Our responsibilitymanagement is to express an opinion onresponsible for these financial statements and financial statement schedule, for maintaining effective internal control over financial reporting and for its assessment of the effectiveness of internal control over financial reporting, included in Management’s Report on Internal Control over Financial Reporting appearing under Item 9A. Our responsibility is to express opinions on these financial statements, on the financial statement schedule, and on the Company’s internal control over financial reporting based on our audits.

integrated audit. We conducted our audits in accordance with the standards of the Public Company Accounting Oversight Board (United States). Those standards require that we plan and perform the audit to obtain reasonable assurance about whether the financial statements are free of material misstatement and whether effective internal control over financial reporting was maintained in all material respects. Our audit of the financial statements included examining, on a test basis, evidence supporting the amounts and disclosures in the financial statements, assessing the accounting principles used and significant estimates made by management, and evaluating the overall financial statement presentation. Our audit of internal control over financial reporting included obtaining an understanding of internal control over financial reporting, assessing the risk that a material weakness exists, and testing and evaluating the design and operating effectiveness of internal control based on the assessed risk. Our audits also included performing such other procedures as we considered necessary in the circumstances. We believe that our audits provide a reasonable basis for our opinions.

We also have audited the adjustments to the financial statements for the years ended March 31, 2009 and 2008 to retrospectively apply the change in reportable segments as described in Note 15. In our opinion, such adjustments are appropriate and have been properly applied. We were not engaged to audit, review, or apply any procedures to financial statements for the years ended March 31, 2009 and 2008 of the Company other than with respect to the adjustments and, accordingly, we do not express an opinion or any other form of assurance on the financial statements for the years ended March 31, 2009 and 2008 taken as a whole.
A company’s internal control over financial reporting is a process designed to provide reasonable assurance regarding the reliability of financial reporting and the preparation of financial statements for external purposes in accordance with generally accepted accounting principles. A company’s internal control over financial reporting includes those policies and procedures that (i) pertain to the maintenance of records that, in reasonable detail, accurately and fairly reflect the transactions and dispositions of the assets of the company; (ii) provide reasonable assurance that transactions are recorded as necessary to permit preparation of financial statements in accordance with generally accepted accounting principles, and that receipts and expenditures of the company are being made only in accordance with authorizations of management and directors of the company; and (iii) provide reasonable assurance regarding prevention or timely detection of unauthorized acquisition, use, or disposition of the company’s assets that could have a material effect on the financial statements.
Because of its inherent limitations, internal control over financial reporting may not prevent or detect misstatements. Also, projections of any evaluation of effectiveness to future periods are subject to the risk that controls may become inadequate because of changes in conditions, or that the degree of compliance with the policies or procedures may deteriorate.
/s/  PricewaterhouseCoopers LLP
Orange County, California
May 28, 2010


60


REPORT OF INDEPENDENT REGISTERED PUBLIC ACCOUNTING FIRM
Board of Directors
Quality Systems, Inc.
We have audited, before the effects of the adjustments to retrospectively apply the change in operating segment information described in Note 15, the consolidated balance sheet of Quality Systems, Inc. as of March 31, 2009, and the related statements of income, shareholders’ equity, and cash flows for each of the two years in the period ended March 31, 2009 (the 2009 and 2008 consolidated financial statements before the effects of the adjustments discussed in Note 15 are not presented herein). Our audits of the basic financial statements included the financial statement Schedule II listed in the index appearing under Item 15 (a)(2). These 2009 and 2008 consolidated financial statements and financial statement schedule are the responsibility of the Company’s management. Our responsibility is to express an opinion on these consolidated financial statements and financial statement schedule based on our audits.
We conducted our audits in accordance with the standards of the Public Company Accounting Oversight Board (United States). Those standards require that we plan and perform the audit to obtain reasonable assurance about whether the consolidated financial statements are free of material misstatement. An audit includes examining, on a test basis, evidence supporting the amounts and disclosures in the financial statements. An audit also includes assessing the accounting principles used and significant estimates made by management, as well as evaluating the overall financial statement presentation. We believe that our audits provide a reasonable basis for our opinion.

In our opinion, the 2009 and 2008 consolidated financial statements referred to above, which are before the effects of the adjustments to retrospectively apply the change in operating segment information described in Note 15, present fairly, in all material respects, the financial position of Quality Systems, Inc. as of March 31, 2008 and 20072009 and the results of its operations and its cash flows for each of the threetwo years in the period ended March 31, 20082009 in conformity with accounting principles generally accepted in the United States of America. Also in our opinion, the related financial statement Schedule II, when considered in relation to the basic consolidated financial statements taken as a whole, presents fairly, in all material respects, the information set forth therein.

As discussed

We were not engaged to audit, review, or apply any procedures to the adjustments to retrospectively apply the change in operating segment information described in Note 2 to the Consolidated Financial Statements, the Company changed its method of accounting for share-based compensation as a result of adopting Statement of Financial Accounting Standards No. 123R, “Share-Based Payment”, effective April 1, 2006.

We have also audited, in accordance with the standards of the Public Company Accounting Oversight Board (United States), Quality Systems, Inc.’s internal control over financial reporting as of March 31, 2008, based on criteria established in Internal Control – Integrated Framework issued by the Committee of Sponsoring Organizations of the Treadway Commission15 and our report dated June 5, 2008, expressed an unqualified opinion.

/s/ GRANT THORNTON LLP

Irvine, California
June 5, 2008


REPORT OF INDEPENDENT REGISTERED PUBLIC ACCOUNTING FIRM

Board of Directors and Shareholders
Quality Systems, Inc.

We have audited Quality Systems, Inc.’s internal control over financial reporting as of March 31, 2008, based on criteria established in Internal Control – Integrated Framework issued by the Committee of Sponsoring Organizations of the Treadway Commission (COSO). Quality Systems, Inc.’s management is responsible for maintaining effective internal control over financial reporting and for its assessment of the effectiveness of internal control over financial reporting, included in the accompanying Quality Systems, Inc. Management’s Report on Internal Control Over Financial Reporting. Our responsibility is toaccordingly, we do not express an opinion on Quality Systems, Inc.’s internal control over financial reporting based on our audit.

We conducted our audit in accordance with the standardsor any other form of the Public Company Accounting Oversight Board (United States). Those standards require that we plan and perform the audit to obtain reasonable assurance about whether effective internal control over financial reporting was maintained in all material respects. Our audit included obtaining an understanding of internal control over financial reporting, assessing the risk that a material weakness exists, testingsuch adjustments are appropriate and evaluating the design and operating effectiveness of internal control based on the assessed risk, and performing suchhave been properly applied. Those adjustments were audited by other procedures as we considered necessary in the circumstances. We believe that our audit provides a reasonable basis for our opinion.

A company’s internal control over financial reporting is a process designed to provide reasonable assurance regarding the reliability of financial reporting and the preparation of financial statements for external purposes in accordance with generally accepted accounting principles. A company’s internal control over financial reporting includes those policies and procedures that (1) pertain to the maintenance of records that, in reasonable detail, accurately and fairly reflect the transactions and dispositions of the assets of the company; (2) provide reasonable assurance that transactions are recorded as necessary to permit preparation of financial statements in accordance with generally accepted accounting principles, and that receipts and expenditures of the company are being made only in accordance with authorizations of management and directors of the company; and (3) provide reasonable assurance regarding prevention or timely detection of unauthorized acquisition, use, or disposition of the company’s assets that could have a material effect on the financial statements.

Because of its inherent limitations, internal control over financial reporting may not prevent or detect misstatements. Also, projections of any evaluation of effectiveness to future periods are subject to the risk that controls may become inadequate because of changes in conditions, or that the degree of compliance with the policies or procedures may deteriorate. In our opinion, Quality Systems, Inc. maintained, in all material respects, effective internal control over financial reporting as of March 31, 2008, based on criteria established in Internal Control – Integrated Framework issued by COSO.

We have also audited, in accordance with the standards of the Public Company Accounting Oversight Board (United States), the consolidated balance sheets of Quality Systems, Inc. as of March 31, 2008 and 2007, and the related consolidated statements of income, shareholders’ equity, and cash flows for each of the three years ended March 31, 2008, and our report dated June 5, 2008 expressed an unqualified opinion.

auditors.

/s/  GRANT THORNTONGrant Thornton LLP

Irvine, California
May 27, 2009


June 5, 200861


QUALITY SYSTEMS, INC.

CONSOLIDATED BALANCE SHEETS

(IN THOUSANDS, EXCEPT PER SHARE DATA)


March 31, 2008


March 31, 2007


ASSETS


Current assets:


Cash and cash equivalents


$

59,046


$

60,028


Marketable securities


2,500


Accounts receivable, net


76,585


63,945


Inventories, net


1,024


1,175


Net current deferred tax assets


6,397


3,443


Other current assets


4,596


4,507


Total current assets


150,148


133,098


Marketable securities


20,124


Equipment and improvements, net


4,773


5,029


Capitalized software costs, net


8,852


6,982


Net deferred tax assets


1,180


Goodwill


1,840


1,840


Other assets


2,171


2,552


Total assets


$

187,908


$

150,681


LIABILITIES AND SHAREHOLDERS’ EQUITY


Current liabilities:


Accounts payable


$

4,685


$

5,246


Deferred revenue


44,389


38,774


Accrued compensation and related benefits


8,346


6,521


Income taxes payable


1,541


315


Dividends payable


6,861


Other current liabilities


4,394


5,626


Total current liabilities


70,216


56,482


Deferred revenue, net of current


506


674


Net deferred tax liabilities


1,575


Deferred compensation


1,906


2,279


Total liabilities


74,203


59,435


Commitments and contingencies


Shareholders’ equity:


Common stock


$0.01 par value; authorized 50,000 shares; issued and outstanding 27,448 and 27,123 shares at March 31, 2008 and March 31, 2007, respectively


274


271


Additional paid-in capital


75,556


65,666


Retained earnings


38,071


25,309


Accumulated other comprehensive loss


(196

)


Total shareholders’ equity


113,705


91,246


Total liabilities and shareholders’ equity


$

187,908


$

150,681


  March 31,
  March 31,
 
  2010  2009 
  (In thousands) 
 
ASSETS
Current assets:        
Cash and cash equivalents $84,611  $70,180 
Restricted cash  2,339   1,303 
Marketable securities  7,158    
Accounts receivable, net  107,458   90,070 
Inventories, net  1,340   1,125 
Income taxes receivable  2,953   5,605 
Net current deferred tax assets  5,678   3,994 
Other current assets  8,684   6,312 
         
Total current assets  220,221   178,589 
Marketable securities     7,395 
Equipment and improvements, net  8,432   6,756 
Capitalized software costs, net  11,546   9,552 
Intangibles, net  20,145   8,403 
Goodwill  46,189   28,731 
Other assets  3,647   2,675 
         
Total assets $310,180  $242,101 
         
 
LIABILITIES AND STOCKHOLDERS’ EQUITY
Current liabilities:        
Accounts payable $3,342  $5,097 
Deferred revenue  64,109   47,584 
Accrued compensation and related benefits  8,951   9,511 
Dividends payable  8,664   8,529 
Other current liabilities  16,220   8,888 
         
Total current liabilities  101,286   79,609 
Deferred revenue, net of current  474   521 
Net deferred tax liabilities  10,859   4,566 
Deferred compensation  1,883   1,838 
Other noncurrent liabilities  7,389    
         
Total liabilities  121,891   86,534 
Commitments and contingencies        
Shareholders’ equity:        
Common Stock        
$0.01 par value; authorized 50,000 shares; issued and        
outstanding 28,879 and 28,447 shares at March 31, 2010        
and March 31, 2009, respectively  289   284 
Additional paid-in capital  122,271   103,524 
Retained earnings  65,729   51,759 
         
Total shareholders’ equity  188,289   155,567 
         
Total liabilities and shareholders’ equity $310,180  $242,101 
         
The accompanying notes to these consolidated financial statementsConsolidated Financial Statements are an integral part
of these consolidated statements.Consolidated Statements.


62


QUALITY SYSTEMS, INC.

CONSOLIDATED STATEMENTS OF INCOME
(IN THOUSANDS, EXCEPT PER SHARE DATA)


Fiscal Year Ended


March 31, 2008


March 31, 2007


March 31, 2006


Revenues:


Software, hardware and supplies


$

76,363


$

68,871


$

54,938


Implementation and training services


13,406


12,177


11,293


System sales


89,769


81,048


66,231


Maintenance


56,455


41,948


31,124


Electronic data interchange services


22,450


17,049


13,256


Other services


17,826


17,120


8,676


Maintenance, EDI and other services


96,731


76,117


53,056


Total revenue


186,500


157,165


119,287


Cost of revenue:


Software, hardware and supplies


10,887


8,453


8,148


Implementation and training services


10,341


8,535


8,088


Total cost of system sales


21,228


16,988


16,236


Maintenance


12,446


11,834


9,330


Electronic data interchange services


15,776


12,181


8,569


Other services


13,051


9,781


5,693


Total cost of maintenance and other services


41,273


33,796


23,592


Total cost of revenue


62,501


50,784


39,828


Gross profit


123,999


106,381


79,459


Operating expenses:


Selling, general and administrative


53,260


45,337


35,554


Research and development costs


11,350


10,166


8,087


Total operating expenses


64,610


55,503


43,641


Income from operations


59,389


50,878


35,818


Interest income


2,661


3,306


2,108


Other income


953


Income before provision for income taxes


63,003


54,184


37,926


Provision for income taxes


22,925


20,952


14,604


Net income


$

40,078


$

33,232


$

23,322


Net income per share:


Basic


$

1.47


$

1.24


$

0.88


Diluted


$

1.44


$

1.21


$

0.85


Weighted average shares outstanding:


Basic


27,298


26,882


26,413


Diluted


27,770


27,550


27,356


Dividends declared per common share


$

1.00


$

1.00


$

0.875


  Fiscal Year Ended 
  March 31,
  March 31,
  March 31,
 
  2010  2009  2008 
  (In thousands, except per share data) 
 
Revenues:            
Software, hardware and supplies $89,761  $85,386  $76,363 
Implementation and training services  14,376   13,375   13,406 
             
System sales  104,137   98,761   89,769 
Maintenance  89,192   72,862   56,455 
Electronic data interchange services  35,035   29,522   22,450 
Revenue cycle management and related services  36,665   21,431   871 
Other services  26,782   22,939   16,955 
             
Maintenance, EDI, RCM and other services  187,674   146,754   96,731 
             
Total revenues  291,811   245,515   186,500 
             
Cost of revenue:            
Software, hardware and supplies  12,115   13,184   10,887 
Implementation and training services  11,983   10,286   10,341 
             
Total cost of system sales  24,098   23,470   21,228 
Maintenance  13,339   11,859   12,446 
Electronic data interchange services  25,262   21,374   15,776 
Revenue cycle management and related services  27,715   14,674   558 
Other services  20,393   17,513   12,493 
             
Total cost of maintenance, EDI, RCM and other services  86,709   65,420   41,273 
             
Total cost of revenue  110,807   88,890   62,501 
             
Gross profit  181,004   156,625   123,999 
Operating expenses:            
Selling, general and administrative  86,951   69,410   53,260 
Research and development costs  16,546   13,777   11,350 
Amortization of acquired intangible assets  1,783   1,035    
             
Total operating expenses  105,280   84,222   64,610 
             
Income from operations  75,724   72,403   59,389 
Interest income  226   1,203   2,661 
Other income (expense)  268   (279)  953 
             
Income before provision for income taxes  76,218   73,327   63,003 
Provision for income taxes  27,839   27,208   22,925 
             
Net income $48,379  $46,119  $40,078 
             
Net income per share:            
Basic $1.69  $1.65  $1.47 
Diluted $1.68  $1.62  $1.44 
Weighted average shares outstanding:            
Basic  28,635   28,031   27,298 
Diluted  28,796   28,396   27,770 
Dividends declared per common share $1.20  $1.15  $1.00 
The accompanying notes to these consolidated financial statementsConsolidated Financial Statements are an integral part
of these consolidated statements.Consolidated Statements.


63


QUALITY SYSTEMS, INC.

CONSOLIDATED STATEMENTS OF SHAREHOLDERS’ EQUITY

(IN THOUSANDS)


Accumulated
Other
Comprehensive
Loss


Common Stock


Total
Shareholders’
Equity


Retained
Earnings


Deferred
Compensation


Shares


Amount


APIC


Balance, March 31, 2005


26,222


$

262


$

44,368


$

19,213


$

(1,112

)

$


$

62,731


Exercise of stock options


489


5


4,476


4,481


Tax benefit resulting from exercise of stock options


4,831


4,831


Stock based compensation


428


428


Dividends declared


(23,384

)


(23,384

)

Net income


23,322


23,322


Balance, March 31, 2006


26,711


267


53,675


19,151


(684

)


72,409


Reclass of deferred compensation upon adoption of SFAS 123R


(684

)


684


Exercise of stock options


412


4


6,058


6,062


Tax benefit resulting from exercise of stock options


2,694


2,694


Stock based compensation


3,923


3,923


Dividends declared


(27,074

)


(27,074

)

Net income


33,232


33,232


Balance, March 31, 2007


27,123


271


65,666


25,309


91,246


Exercise of stock options


325


3


4,757


4,760


Tax benefit resulting from exercise of stock options


1,376


1,376


Stock based compensation


3,757


3,757


Dividends declared


(27,316

)


(27,316

)

Net income


40,078


40,078


Unrealized loss on marketable securities, net of tax


(196

)


(196

)


Balance, March 31, 2008


27,448


$

274


$

75,556


$

38,071


$


$

(196

)

$

113,705


              Accumulated
    
        Additional
     Other
  Total
 
  Common Stock  Paid-in
  Retained
  Comprehensive
  Shareholders’
 
  Shares  Amount  Capital  Earnings  Loss  Equity 
  (In thousands) 
 
Balance, March 31, 2007  27,123  $271  $65,666  $25,309  $  $91,246 
Exercise of stock options  325   3   4,757         4,760 
Tax benefit resulting from exercise of stock options        1,376         1,376 
Stock-based compensation        3,757         3,757 
Dividends declared           (27,316)     (27,316)
Net income           40,078      40,078 
Unrealized loss on marketable securities, net of tax              (196)  (196)
                         
Balance, March 31, 2008  27,448   274   75,556   38,071   (196)  113,705 
Exercise of stock options  697   7   12,512         12,519 
Tax benefit resulting from exercise of stock options        3,382         3,382 
Stock-based compensation        1,977         1,977 
Common stock issued for acquisitions  302   3   10,097         10,100 
Dividends declared           (32,431)     (32,431)
Net income           46,119      46,119 
Reclassification of unrealized loss on marketable securities, net of tax              196   196 
                         
Balance, March 31, 2009  28,447   284   103,524   51,759      155,567 
Exercise of stock options  238   3   5,852         5,855 
Tax benefit resulting from exercise of stock options        1,576         1,576 
Stock-based compensation        2,073         2,073 
Stock-based compensation related to acquisitions        433         433 
Common stock issued for acquisitions  194   2   8,813         8,815 
Dividends declared           (34,409)     (34,409)
Net income           48,379      48,379 
                         
Balance, March 31, 2010  28,879  $289  $122,271  $65,729  $  $188,289 
                         
The accompanying notes to these consolidated financial statementsConsolidated Financial Statements are an integral part
of these consolidated statements.Consolidated Statements.


64


  Fiscal Year Ended 
  March 31,
  March 31,
  March 31,
 
  2010  2009  2008 
  (In thousands) 
 
Cash flows from operating activities:            
Net income $48,379  $46,119  $40,078 
Adjustments to reconcile net income to net cash provided by operating activities:            
Depreciation  3,663   2,911   2,369 
Amortization of capitalized software costs  5,927   5,163   4,149 
Amortization of other intangibles  1,783   1,034    
Gain on life insurance proceeds, net        (755)
Provision for bad debts  3,465   2,089   1,171 
Provision (recovery) for inventory obsolescence  27   (13)  52 
Share-based compensation  2,073   1,977   3,757 
Deferred income tax (benefit) expense  (786)  4,462   (199)
Tax benefit from exercise of stock options  1,576   3,382   1,376 
Excess tax benefit from share-based compensation  (1,576)  (3,381)  (1,311)
Loss on disposal of equipment and improvements     96    
Changes in assets and liabilities, net of amounts acquired:            
Accounts receivable  (18,944)  (11,369)  (13,811)
Inventories  (238)  (88)  99 
Income taxes receivable  3,875   (5,433)   
Other current assets  (2,310)  (1,202)  (89)
Other assets  (894)  (448)  381 
Accounts payable  (1,810)  (299)  (561)
Deferred revenue  12,528   3,130   5,447 
Accrued compensation and related benefits  (1,006)  136   1,825 
Income taxes payable  (1,404)  (1,541)  1,226 
Other current liabilities  846   2,055   (1,232)
Deferred compensation  46   (68)  (373)
             
Net cash provided by operating activities  55,220   48,712   43,599 
             
Cash flows from investing activities:            
Additions to capitalized software costs  (7,921)  (5,863)  (6,019)
Additions to equipment and improvements  (4,935)  (3,218)  (2,113)
Proceeds from sale of marketable securities  425   14,825   91,825 
Purchases of marketable securities        (114,645)
Proceeds from life insurance policy, net        755 
Cash acquired from purchase of Opus  2,036       
Purchase of Opus  (250)      
Purchase of Sphere  (300)      
Purchase of PMP, including direct transaction costs     (16,950)   
Purchase of HSI, including direct transaction costs     (8,241)   
Payment of contingent consideration related to purchase of PMP  (3,000)      
             
Net cash used in investing activities  (13,945)  (19,447)  (30,197)


65


QUALITY SYSTEMS, INC.
(IN THOUSANDS)
CONSOLIDATED STATEMENTS OF CASH FLOWS — (Continued)


Fiscal Year Ended


March 31, 2008


March 31, 2007


March 31, 2006


Cash flows from operating activities:


Net income


$

40,078


$

33,232


$

23,322


Adjustments to reconcile net income to net cash provided by operating activities:


Depreciation


2,369


1,950


1,368


Amortization of capitalized software costs


4,149


3,231


2,460


Gain on life insurance proceeds, net


(755

)


Provision for bad debts


1,171


1,480


1,181


Provision for inventory obsolescense


52


35


179


Non-cash stock-based compensation


3,757


3,923


428


Deferred income taxes


(199

)


(1,642

)


(1,476

)

Tax benefit from exercise of stock options


1,376


2,694


4,831


Excess tax benefit from share-based compensation


(1,311

)


(2,527

)


Changes in assets and liabilities:


Accounts receivable


(13,811

)


(20,760

)


(12,484

)

Inventories


99


(649

)


220


Income tax receivable


1,195


(1,180

)

Other current assets


(89

)


(1,595

)


(1,235

)

Other assets


381


(594

)


(354

)

Accounts payable


(561

)


2,312


650


Deferred revenue


5,447


3,532


10,439


Accrued compensation and related benefits


1,825


1,031


2,054


Income taxes payable


1,226


315


Other current liabilities


(1,232

)


1,814


(209

)

Deferred compensation


(373

)


593


484


Net cash provided by operating activities


43,599


29,570


30,678


Cash flows from investing activities:


Additions to capitalized software costs


(6,019

)


(5,042

)


(3,297

)

Additions to equipment and improvements


(2,113

)


(3,240

)


(2,410

)

Purchases of marketable securities


91,825


Sales of marketable securities


(114,645

)


Proceeds from life insurance policy, net


755


Net cash used in investing activities


(30,197

)


(8,282

)


(5,707

)


Cash flows from financing activities:


Dividends paid


(20,455

)


(27,074

)


(23,384

)

Excess tax benefit from share-based compensation


1,311


2,527


Proceeds from the exercise of stock options


4,760


6,062


4,481


Net cash used in financing activities


(14,384

)


(18,485

)


(18,903

)


Net (decrease) increase in cash and cash equivalents


(982

)


2,803


6,068


Cash and cash equivalents at beginning of year


60,028


57,225


51,157


Cash and cash equivalents at end of year


$

59,046


$

60,028


$

57,225


Supplemental disclosures of cash flow information:


Cash paid during the year for income taxes, net of refunds


$

20,546


$

18,360


$

11,022


Non-cash investing and financing activities:


Unrealized loss on marketable securities


$

(326

)

$


$


Dividends declared and accrued


$

6,861


$


$


  Fiscal Year Ended 
  March 31,
  March 31,
  March 31,
 
  2010  2009  2008 
  (In thousands) 
 
Cash flows from financing activities:            
Excess tax benefit from share-based compensation  1,576   3,381   1,311 
Proceeds from exercise of stock options  5,855   12,519   4,760 
Dividends paid  (34,275)  (30,763)  (20,455)
Loan repayment     (3,268)   
             
Net cash used in financing activities  (26,844)  (18,131)  (14,384)
             
Net increase (decrease) in cash and cash equivalents  14,431   11,134   (982)
Cash and cash equivalents at beginning of year  70,180   59,046   60,028 
             
Cash and cash equivalents at end of year $84,611  $70,180  $59,046 
             
Supplemental disclosures of cash flow information:            
Cash paid during the period for income taxes, net of refunds $24,506  $26,455  $20,546 
             
Non-cash investing and financing activities:            
Unrealized gain (loss) on marketable securities, net of tax $  $196  $(196)
             
Issuance of stock options with fair value of $433 in connection with the purchase of PMP $433  $  $ 
             
Effective February 10, 2010, the Company acquired Opus in a transaction summarized as follows:            
Fair value of net assets acquired $32,209  $  $ 
Cash paid  (250)      
Common stock issued for Opus stock  (8,815)      
Fair value of contingent consideration  (11,516)      
             
Liabilities assumed $11,628  $  $ 
             
Effective August 12, 2009, the Company acquired Sphere in a transaction summarized as follows:            
Fair value of net assets acquired $1,453  $  $ 
Cash paid  (300)      
Fair value of contingent consideration  (1,074)      
             
Liabilities assumed $79  $  $ 
             
Effective October 28, 2008, the Company acquired PMP in a transaction summarized as follows:            
Fair value of net assets acquired $  $23,875  $ 
Cash paid     (16,950)   
Common stock issued for PMP stock     (2,750)   
             
Liabilities assumed $  $4,175  $ 
             
Effective May 20, 2008, the Company acquired HSI in a transaction summarized as follows:            
Fair value of net assets acquired $  $20,609  $ 
Cash paid     (8,241)   
Common stock issued for HSI stock     (7,350)   
             
Liabilities assumed $  $5,018  $ 
             
The accompanying notes to these consolidated financial statementsConsolidated Financial Statements are an integral part
of these consolidated statements.Consolidated Statements.


66


QUALITY SYSTEMS, INC.

NOTES TO CONSOLIDATED FINANCIAL STATEMENTS
MARCH 31, 20082010 and 20072009
(DOLLAR AND SHARE AMOUNTS IN THOUSANDS, EXCEPT SHARES AND PER SHARE AMOUNTS)DATA)

1.  Organization of Business
Description of Business

Quality Systems, Inc., is comprised of the QSI Dental Division (QSI Division) and a wholly-owned subsidiary,subsidiaries, NextGen Healthcare Information Systems, Inc. (NextGen Division)(“NextGen Division”), Lackland Acquisition II, LLC dba Healthcare Strategic Initiatives (“HSI”) and Practice Management Partners, Inc. (“PMP”) and most recently NextGen Sphere, LLC and Opus Healthcare Solutions, Inc. (collectively, the Company),. The Company develops and markets proprietary healthcare information systems for a wide rangethat automate certain aspects of entities including medical and dental group practices, networks of practices such as physician hospital organizations (“PHOs”) and management service organizations (“MSOs”), ambulatory care centers, community health centers, physician hospital organizations, management service organizations,and medical and dental schools. The Company’s softwareCompany also provides revenue cycle management (“RCM”) services through the Practice Solutions Division.
The Company, a California corporation formed in 1974, was founded with an early focus on providing information systems include general patient information, appointment scheduling, billing, insurance claims submission and processing, managed care plan implementation and referral management, treatment planning, drug formularies, electronic patient records,to dental charting and letter generation.group practices. In addition to providing fully integrated solutions,the mid-1980’s, the Company offerscapitalized on the increasing focus on medical cost containment and further expanded its clients comprehensive hardwareinformation processing systems to serve the medical market. In the mid-1990’s, the Company made two acquisitions that accelerated its penetration of the medical market. These two acquisitions formed the basis for the NextGen Division. Today, the Company serves the medical and software maintenance and support services, system training services and Electronic Data Interchange (EDI) services which provide a variety of connectivity services to and between patients, providers and payors. The Company’s principal administrative, accountingdental markets through its NextGen Division and QSI Dental Division.
During fiscal year 2010, as a result of certain organizational changes, the composition of the Company’s NextGen Division operationswas revised to exclude the former NextGen Practice Solutions unit and the Company’s RCM entities (HSI and PMP), both of which are locatednow administered and aggregated in Irvine, California. The principal officethe Company’s Practice Solutions Division. Following the reorganization, the Company now operates three reportable operating segments (not including Corporate), comprised of the NextGen Division, is locatedthe QSI Dental Division and the Practice Solutions Division.
The QSI Dental Division, co-located with the Corporate Headquarters in Irvine, California, currently focuses on developing, marketing and supporting software suites sold to dental and certain niche medical practices. In addition, the Division supports a number of medical clients that utilize its UNIX based medical practice management software product and Software as a Service, or SaaS model, based NextDDS financial and clinical software.
The NextGen Division, with headquarters in Horsham, Pennsylvania.Pennsylvania, and significant locations in Atlanta, Georgia and Austin, Texas, provides integrated clinical, financial and connectivity solutions for ambulatory, inpatient and dental provider organizations.
The Practice Solutions Division, with locations in St. Louis, Missouri and Hunt Valley, Maryland, focuses primarily on providing physician practices with RCM services, primarily billing and collection services for medical practices. This Division combines a web-delivered SaaS model and the NextGenepm software platform to execute its service offerings.
The three Divisions operate largely as stand-alone operations, with each Division maintaining its own distinct product lines, product platforms, development, implementation and support teams, sales staffing and branding. The three Divisions share the resources of the Company’s “corporate office,” which includes a variety of accounting and other administrative functions. Additionally, there are a small but growing number of clients who are simultaneously utilizing software or services from more than one of the three Divisions.
Acquisitions
On May 20, 2008, the Company acquired St. Louis-based HSI, a full-service healthcare RCM company. HSI operates under the umbrella of the Company’s Practice Solutions Division. Founded in 1996, HSI provides RCM


67

On January 31, 2006, the Board


QUALITY SYSTEMS, INC.
NOTES TO CONSOLIDATED FINANCIAL STATEMENTS — (Continued)
services to providers including health systems, hospitals, and physicians in private practice with an in-house team of Directors declared a 2-for-1 stock split with respectmore than 200 employees, including specialists in medical billing, coding and compliance, payor credentialing, and information technology. The Company intends to cross sell both software and RCM services to the Company’s outstanding sharesacquired customer base of common stock. The stock split record date was March 3, 2006HSI and the stock began trading post split on March 27, 2006. NextGen Division.
On October 28, 2008, the Company acquired Maryland-based PMP, a full-service healthcare RCM company. This acquisition is also part of the Company’s growth strategy for the Practice Solutions Division. Similar to HSI, PMP operates under the umbrella of the Company’s Practice Solutions Division. Founded in 2001, PMP provides physician billing and technology management services to healthcare providers, primarily in the Mid-Atlantic region. The Company intends to cross sell both software and RCM services to the acquired customer base of PMP and the NextGen Division.
On August 12, 2009, the Company acquired NextGen Sphere, LLC (“Sphere”), a provider of financial information systems to the small hospital inpatient market. This acquisition is also part of the Company’s strategy to expand into the small hospital market and to add new customers by taking advantage of cross selling opportunities between the ambulatory and inpatient markets.
On February 2, 2005,10, 2010, the BoardCompany acquired Opus Healthcare Solutions, Inc. (“Opus”), a provider of Directors declared a 2-for-1 stock split with respectclinical information systems to the small hospital inpatient market. Founded in 1987 and headquartered in Austin, Texas, Opus delivers web-based clinical solutions to hospital systems and integrated health networks nationwide. This acquisition complements and will be integrated with the assets of Sphere. Both companies are established developers of software and services for the inpatient market and will operate under the Company’s outstanding shares of common stock. The stock split record date was March 4, 2005 and the stock began trading post split on March 28, 2005.

References to share and per share data contained in the consolidated financial statements and notes to the consolidated financial statements have been retroactively adjusted to reflect the stock splits.

2. Summary of Significant Accounting Policies

NextGen Division.

2.  Summary of Significant Accounting Policies
Principles of ConsolidationConsolidation..  The consolidated financial statementsConsolidated Financial Statements include the accounts of the CompanyQuality Systems, Inc. and its wholly-owned subsidiary.subsidiaries, which consists of NextGen Healthcare Information Systems, Lackland Acquisition II, LLC dba Healthcare Strategic Initiatives, Practice Management Partners, Inc., NextGen Sphere, LLC, and Opus Healthcare Solutions, Inc. All significant intercompany accounts and transactions have been eliminated.

Business Segments.  The Company has prepared operating segment information in accordance with Financial Accounting Standards Board (“FASB”) Accounting Standards Codification (“ASC”) Topic 280,Segment Reporting,or ASC 280, which requires that companies disclose “operating segments” based on the manner in which management disaggregates the Company’s operations for making internal operating decisions. See Note 15.
Basis of Presentation.  The accompanying consolidated financial statementsConsolidated Financial Statements have been prepared in accordance with accounting principles generally accepted in the United States of America.

America (“GAAP”).

Certain prior year amounts have been reclassified to conform with fiscal year 2010 presentation.
References to dollar amounts in the consolidated financial statementConsolidated Financial Statement sections are in thousands, except for shares and per share data, unless otherwise specified.

Revenue RecognitionRecognition..  The Company recognizes system sales revenue pursuant to Statement of Position No. 97-2, “Software Revenue Recognition” (SOP 97-2), as amended by Statement of Position No. 98-9 “Modification of SOP 97-2, FASB ASC Topic985-605,Software, Revenue Recognition” (SOP 98-9).Recognition, orASC 985-605. The Company generates revenue from the sale of licensing rights to its software products directly to end-users and value-added resellers, (VARs).or VARs. The Company also generates revenue from sales of hardware and third party software, implementation, training, EDI,Electronic Data Interchange (“EDI”), post-contract support (maintenance), and other services, including RCM, performed for customers who license its products.

A typical system contract contains multiple elements of the above items. SOP 98-9FASB ASC Topic985-605-25,Software, Revenue Recognition, Multiple Elements,orASC 985-605-25, requires revenue earned on software arrangements involving multiple elements to be allocated to each element based on the relative fair values of those


68


QUALITY SYSTEMS, INC.
NOTES TO CONSOLIDATED FINANCIAL STATEMENTS — (Continued)
elements. The fair value of an element must be based on vendor specific objective evidence (VSOE)(“VSOE”). The Company limits its assessment of VSOE for each element to either the price charged when the same element is sold separately (using a rolling average of stand alone transactions) or the price established by management having the relevant authority to do so, for an element not yet sold separately. VSOE calculations are updated and reviewed quarterly or annually depending on the nature of the product or service.

The Company has established VSOE for the related undelivered elements based on the bell-shaped curve method. Maintenance VSOE for the Company’s largest customers is based on stated renewal rates only if the rate is determined to be substantive and falls within the Company’s customary pricing practices.

When evidence of fair value exists for the delivered and undelivered elements of a transaction, then discounts for individual elements are aggregated and the total discount is allocated to the individual elements in proportion to the elements’ fair value relative to the total contract fair value.

When evidence of fair value exists for the undelivered elements only, the residual method, provided for under SOP 98-9,ASC 985-605, is used. Under the residual method, the Company defers revenue related to the undelivered elements in a system sale based on VSOE of fair value of each of the


undelivered elements, and allocates the remainder of the contract price net of all discounts to revenue recognized from the delivered elements. If VSOE of fair value of any undelivered element does not exist, all revenue is deferred until VSOE of fair value of the undelivered element is established or the element has been delivered.

The Company bills for the entire system sales contract amount upon contract execution except for maintenance which is billed separately. Amounts billed in excess of the amounts contractually due are recorded in accounts receivable as advance billings. Amounts are contractually due when services are performed or in accordance with contractually specified payment dates. Provided the fees are fixed andor determinable and collection is considered probable, revenue from licensing rights and sales of hardware and third party software is generally recognized upon physical or electronic shipment and transfer of title. In certain transactions where collections risk is high, the cash basis method is used to recognize revenue. If the fee is not fixed or determinable, then the revenue recognized in each period (subject to application of other revenue recognition criteria) will be the lesser of the aggregate of amounts due and payable or the amount of the arrangement fee that would have been recognized if the fees were being recognized using the residual method. Fees which are considered fixed or determinable at the inception of the Company’s arrangements must include the following characteristics:

§

• 

The fee must be negotiated at the outset of an arrangement, and generally be based on the specific volume of products to be delivered without being subject to change based on variable pricing mechanisms such as the number of units copied or distributed or the expected number of users.

§

• 

Payment terms must not be considered extended. If a significant portion of the fee is due more than 12 months after delivery or after the expiration of the license, the fee is presumed not fixed andor determinable.

Revenue from implementation and training services is recognized as the corresponding services are performed. Maintenance revenue is recognized ratably over the contractual maintenance period.

Contract accounting is applied where services include significant software modification, development or customization. In such instances, the arrangement fee is accounted for in accordance with Statement of Position No. 81-1 “Accounting for Performance ofFASB ASC Topic605-35,Revenue Recognition, Construction-Type and Certain Production-Type Contracts” (SOP 81-1).Contracts,orASC 605-35. Pursuant to SOP 81-1,ASC 605-35, the Company uses the percentage of completion method provided all of the following conditions exist:

§

• 

the contract includes provisions that clearly specify the enforceable rights regarding goods or services to be provided and received by the parties, the consideration to be exchanged, and the manner and terms of settlement;

§

• 

the customer can be expected to satisfy its obligations under the contract;

§

• 

the Company can be expected to perform its contractual obligations; and

§

• 

reliable estimates of progress towards completion can be made.


69


QUALITY SYSTEMS, INC.
NOTES TO CONSOLIDATED FINANCIAL STATEMENTS — (Continued)
The Company measures completion using labor input hours. Costs of providing services, including services accounted for in accordance with SOP 81-1,ASC 605-35, are expensed as incurred.

If a situation occurs in which a contract is so short term that the financial statements would not vary materially from using thepercentage-of-completion method or in which the Company is unable to make reliable estimates of progress of completion of the contract, the completed contract method is utilized.

Individual product

Product returns are estimated in accordance with Statement of Financial Accounting Standards No. 48, “RevenueFASB ASC Topic605-15,Revenue Recognition, When Right of Return Exists” (SFAS 48).Products,orASC 605-15. The Company also ensures that the other criteria in SFAS 48ASC 605-15 have been met prior to recognition of revenue:

§

• 

the price is fixed or determinable;

§

• 

the customer is obligated to pay and there are no contingencies surrounding the obligation or the payment;

§

• 

the customer’s obligation would not change in the event of theft or damage to the product;

§

• 

the customer has economic substance;

§

• 

the amount of returns can be reasonably estimated; and

§

• 

the Company does not have significant obligations for future performance in order to bring about resale of the product by the customer.

The Company has historically offered short-term rights of return in certain sales arrangements. If the Company is able to estimate returns for these types of arrangements, revenue is recognized and these arrangements are recorded in the consolidated financial statements.Consolidated Financial Statements. If the Company is


unable to estimate returns for these types of arrangements, revenue is not recognized in the consolidated financial statementsConsolidated Financial Statements until the rights of return expire.

Revenue related to sales arrangements whichthat include the right to use software stored on the Company’s hardware is accounted for under the Emerging Issues Task Force Issue (EITF) No. 00-3 “Application of AICPA Statement of Position 97-2 to arrangements that include the right to use software stored on another entity’s hardware”. EITF No. 00-3FASB ASC Topic985-605-05,Software, Revenue Recognition,Hosting Arrangements,orASC 985-605-05, which requires that for software licenses and related implementation services to continue to fall under SOP No. 97-2,ASC 985-605-05, the customer must have the contractual right to take possession of the software without incurring a significant penalty and it must be feasible for the customer to either host the software themselves or through another third party. If an arrangement is not deemed to be accounted for under SOP 97-2,ASC 985-605-05, the entire arrangement is accounted for as a service contract in accordance with EITF Issue No. 00-21 “Revenue arrangements with multiple deliverables”.ASC 985-605-25. In that instance, the entire arrangement would be recognized as the hosting services are being performed.

From time to time, the Company offers future purchase discounts on its products and services as part of its sales arrangements. Pursuant to AICPA TPA 5100.50,FASB ASC Topic985-605-55,Software, Revenue Recognition, Flowchart of Revenue Recognition on Software Arrangements, orASC 985-605-55, such discounts whichthat are incremental to the range of discounts reflected in the pricing of the other elements of the arrangement, whichthat are incremental to the range of discounts typically given in comparable transactions, and whichthat are significant, are treated as an additional element of the contract to be deferred. Amounts deferred related to future purchase options are not recognized until either the customer exercises the discount offer or the offer expires.

RCM service revenue is derived from services fees, which include amounts charged for ongoing billing and other related services, and are generally billed to the customer as a percentage of total collections. The Company does not recognize revenue for services fees until these collections are made, as the services fees are not fixed or determinable until such time.
Revenue is divided into two categories, “system sales” and “maintenance, EDI, RCM and other services”. Revenue in the system sales category includes software license fees, third party hardware and software, and implementation and training services related to purchase of the Company’s software systems. The majority of the revenue in the system sales category is related to the sale of software. Revenue in the maintenance, EDI, RCM and other services category includes maintenance, EDI, RCM services, follow on training and implementation services, annual third party license fees, hosting services and other services revenue.


70


QUALITY SYSTEMS, INC.
NOTES TO CONSOLIDATED FINANCIAL STATEMENTS — (Continued)
Cash and Cash Equivalents.  Cash and cash equivalents generally consist of cash, money market funds and short-term U.S. Treasury securities with original maturities of less than 90 days. The Company had cash deposits at U.S. banks and financial institutions at March 31, 2010 of which $82,223 was in excess of the Federal Deposit Insurance Corporation insurance limit of $250 per owner. The Company is exposed to credit loss for amounts in excess of insured limits in the event of non-performance by the institutions; however, the Company does not anticipate non-performance by these institutions. The money market fund in which the Company holds a portion of its cash invests in only investment grade money market instruments from a variety of industries, and therefore bears relatively low market risk. The average maturity of the investments owned by the money market fund is approximately two months.

Restricted Cash.  Restricted cash consists of cash which is being held by HSI acting as agent for the disbursement of certain state social services programs. The Company records an offsetting “Care Services liability” (see also Note 9) when it initially receives such cash from the government social service programs and relieves both restricted cash and the Care Services liability when amounts are disbursed. HSI earns an administrative fee which is based on a percentage of funds disbursed on behalf of certain government social service programs.
Marketable securities.Securities and ARS Put Option Rights.  Marketable securities are classified as available-for-sale and accordingly are recorded at fair value, based on quoted market rates or valuation analysis when appropriate, with unrealized gains and losses reflected as a separate component of shareholders’ equity titled accumulated other comprehensive income (loss), net of tax, until realized or until a determination is made that an other-than-temporary decline in market value has occurred. Factors considered in assessing whether an other-than-temporary impairment has occurred include: the nature of the investment; whether the decline in fair value is attributable to specific adverse conditions affecting the investment; the financial condition of the investee; the severity and the duration of the impairment; and whether the Company has the ability to hold the investment to maturity. If it is determined that an other-than-temporary impairment has occurred, the investment is written down to its market value at the end of the period in which it is determined that an other-than-temporary decline has occurred. In addition, the Company classifies marketable securities as current or non-current based upon whether such assets are reasonably expected to be realized in cash or sold or consumed during the normal operating cycle of the business.

appropriate.

The Company’s investments at March 31, 20082010 and 2009 are in tax exempt municipal Auction Rate Securities (ARS)(“ARS”) which are classified as either current or non-current marketable securities on the Company’s Consolidated Balance Sheets, depending on the liquidity and timing of expected realization of such securities. A small portion of the Company’s portfolio is invested in closed-end funds which invest in tax exempt municipal auction rate securities. These instruments are known as auction rate preferred securities (ARPS). The ARS are rated by one or more national rating agencies and have contractual terms of up to 30 years, but generally have interest rate reset dates that occur every 7, 28 or 35 days. Despite the underlying long-term maturity of ARS, such securities were priced and subsequently traded as short-term investments because of the interest rate reset feature. If there are insufficient buyers, the auction is said to “fail” and the holders are unable to liquidate the investments through auction. A failed auction does not result in a default of the debt instrument. TheUnder their respective terms, the securities will continue to accrue interest and be auctioned until the auction succeeds, the issuer calls the securities or the securities mature.


In February 2008, the Company began to experience failed auctions on its ARS.

The Company’s ARS are held by UBS Financial Services Inc. (“UBS”). On November 13, 2008, the Company entered into an Auction Rate Security Rights Agreement (the “Rights Agreement”) with UBS, whereby the Company accepted UBS’s offer to purchase the Company’s ARS investments at any time during the period of June 30, 2010 through July 2, 2012. As a result, the Company had obtained an asset, ARS put option rights, whereby the Company has a right to “put” the ARS back to UBS. The Company expects to exercise its ARS put option rights and put its ARS back to UBS on June 30, 2010, the earliest date allowable under the Rights Agreement.
Prior to signing the Rights Agreement the Company had asserted that it had the intent and ability to hold these securities until anticipated recovery and classified its ARS as held for sale securities on its Consolidated Balance Sheets. By accepting the Rights Agreement, the Company could no longer assert that it has the intent to hold the auction rate preferred securities. securities until anticipated recovery and consequently elected to reclassify its investments in ARS as trading securities, as defined by FASB ASC Topic 320,Investments — Debt and Equity Securities,or ASC 320, on the date of Company’s acceptance of the Rights Agreement. As trading securities, the ARS are carried at fair value with changes recorded through earnings.
To determine theirthe estimated fair values of the ARS at March 31, 2008,2010 and 2009, factors including credit quality, assumptions about the likelihood of redemption, observable market data such as yields or spreads of fixed rate municipal bonds orand other trading instruments issued by the same or comparable issuers, were considered. The Company has valued the ARS as the approximate midpoint between various fair values, measured as the difference between the par value of the ARS and the fair value of the securities, discounted by the credit risk of the broker and other factors such as the Company’s historical experience to sell ARS at par. Based on this analysis, the Company recognized a temporary impairment lossgain of $196, netapproximately $188 through its earnings for the year ended March 31, 2010. The estimated fair


71


QUALITY SYSTEMS, INC.
NOTES TO CONSOLIDATED FINANCIAL STATEMENTS — (Continued)
value of income tax benefit, was recorded to accumulated other comprehensive loss in the accompanying financial statementsARS as of March 31, 2008. If2010 was determined to be $7,158 and is included on the accompanying Consolidated Balance Sheets.
As the Company sells anywill be permitted to put the ARS back to UBS at par value, the Company accounted for the ARS put option right as a separate asset that was measured at its fair value with changes recorded through earnings. The Company has valued the ARS put option right as the approximate midpoint between various fair values, measured as the difference between the par value of the ARS priorand the fair value of the securities, discounted by the credit risk of the broker and other factors such as the Company’s historical experience to maturity,sell ARS at an amount below original purchasepar. Based on this analysis, the Company recognized a gain of approximately $80 through its earnings for the year ended March 31, 2010. The estimated fair value of the ARS put option rights as of March 31, 2010 was determined to be $548 and is included on the accompanying Consolidated Balance Sheets in other current assets.
The Company is required to assess the fair value of these two individual assets and to record corresponding changes in fair value in each reporting period through the Consolidated Statements of Income until the ARS put option rights are exercised and the ARS are redeemed or if it becomes probablesold. The Company expects that the Companyfair value movements in the ARS will not receive 100%be largely offset by the future changes in the fair value of the principal and interest fromARS put option rights. Since the issuer of any ARS put option rights represent the right to sell the securities back to UBS at par, the Company will be required to recognize an other-than-temporary impairment charge against net income.

periodically assess the economic ability of UBS to meet that obligation in assessing the fair value of the ARS put option rights.

Allowance for Doubtful AccountsAccounts..  The Company provides credit terms typically ranging from thirty days to less than twelve months for most system and maintenance contract sales and generally does not require collateral. The Company performs credit evaluations of its customers and maintains reserves for estimated credit losses. Reserves for potential credit losses are determined by establishing both specific and general reserves. Specific reserves are based on management’s estimate of the probability of collection for certain troubled accounts. General reserves are established based on the Company’s historical experience of bad debt expense and the aging of the Company’s accounts receivable balances net of deferred revenuesrevenue and specifically reserved accounts. Accounts are written off as uncollectible only after the Company has expended extensive collection efforts.

Included in accounts receivable are amounts related to maintenance and services which were billed, but which had not yet been rendered as of the end of the period. Undelivered maintenance and services are included on the accompanying Consolidated Balance Sheets in deferred revenue (see also Note 6)9).

InventoriesInventories..  Inventories consist of hardware for specific customer orders and spare parts, and are valued at lower of cost (first-in,(first-in, first-out) or market. Management provides a reserve to reduce inventory to its net realizable value.

Equipment and Improvements.  Equipment and improvements are stated at cost less accumulated depreciation and amortization. Depreciation and amortization of equipment and improvements are provided over the estimated useful lives of the assets, or the related lease terms if shorter, by the straight-line method. Useful lives range as follows:

§

Computers and electronic test equipment

3-5 years

§

Furniture and fixtures

5-7 years

§

Leasehold improvementslesser of lease term or estimated useful life of asset

Software Development Costs.  Development costs incurred in the research and development of new software products and enhancements to existing software products are expensed as incurred until technological feasibility has been established. After technological feasibility is established, any additional development costs are capitalized in accordance with Statement of Financial Accounting Standards No. 86, “Accounting for theFASB ASC Topic985-20,Software, Costs of Computer Software to be Sold, Leased or Otherwise Marketed” (SFAS 86).Marketed,orASC 985-20. Such capitalized costs are amortized on a straight-line basis over the estimated economic life of the related product, ofwhich is typically three years. The Company provides support services on the current and prior two versions of its software. Management performs an annual review of the estimated economic life and the


72


QUALITY SYSTEMS, INC.
NOTES TO CONSOLIDATED FINANCIAL STATEMENTS — (Continued)
recoverability of such capitalized software costs. If a determination is made that capitalized amounts are not recoverable based on the estimated cash flows to be generated from the applicable software, any remaining capitalized amounts are written off.

Goodwill.Goodwill and Intangible Assets. The Company follows Statement of Financial Accounting Standards No. 142, “Goodwill and Other Intangible Assets” (SFAS 142). This statement applies to the amortization of goodwill and other intangible assets. The balance of goodwill is related to the NextGen Division. Under SFAS 142, managementDivision and the HSI, PMP, Sphere, and Opus acquisitions, which closed on May 20, 2008, October 28, 2008, August 12, 2009, and February 10, 2010, respectively (see Notes 5, 6 and 7). In accordance with FASB ASC Topic350-20,Intangibles — Goodwill and Other, Goodwill, orASC 350-20, the Company tests goodwill for impairment annually at the end of its first fiscal quarter, referred to as the annual test date. The Company will also test for impairment between annual test dates if an event occurs or circumstances change that would indicate the carrying amount may be impaired. Impairment testing for goodwill is required to perform an annual assessmentperformed at areporting-unit level. An impairment loss would generally be recognized when the carrying amount of the implied fair value of goodwill and intangiblereporting unit’s net assets with indefinite lives for impairment. The Company comparedexceeds the estimated fair value of the NextGen Divisionreporting unit. The Company has determined that there was no indication of impairment to its goodwill as of March 31, 2010. See also Note 6.
Intangible Assets.  Intangible assets consist of capitalized software costs, customer relationships, trade names and certain intellectual property. Intangible assets related to customer relationships and trade names arose in connection with the carrying amountacquisition of itsHSI, PMP, Sphere, and Opus. These intangible assets were recorded at fair value and determinedare stated net of accumulated amortization and impairments. Intangible assets are amortized over their remaining estimated useful lives, ranging from 3 to 9 years. The Company’s amortization policy for intangible assets is based on the principles in FASB ASC Topic350-30,Intangibles — Goodwill and Other, General Intangibles Other than Goodwill, orASC 350-30, which requires that nonethe amortization of intangible assets reflect the pattern that the economic benefits of the goodwill recorded was impaired as of June 30, 2007 (the date of the Company’s last annual impairment test). The fair value of the NextGen Division was determined using an estimate of future cash flows for the NextGen Division over ten years and risk adjusted discount rates of between 15 and 25 percent to compute a net present value of future cash flows.

intangible assets are consumed.

Long-Lived AssetsAssets..  The Company follows Statementassesses the recoverability of Financial Accounting Standards No. 144, “Accounting for thelong-lived assets at least annually or whenever adverse events or changes in circumstances indicate that impairment may have occurred in accordance with FASB ASC Topic360-10,Property, Plant, and Equipment, Impairment or Disposal of Long-Lived Assets” (SFAS 144). Assets, orASC 360-10. If the future undiscounted cash flows expected to result from the use of the related assets are less than the carrying value of such assets, an impairment has been incurred and a loss is recognized to reduce the carrying value of the long-lived assets to fair value, which is determined by discounting estimated future cash flows.
Management periodically reviews the carrying value of long-lived assets to determine whether or not


impairment to such value has occurred and has determined that there was no impairment atto its long-lived assets as of March 31, 2008.

2010. In addition to the recoverability assessment, the Company routinely reviews the remaining estimated lives of its long-lived assets.

Income Taxes.  The Company accounts for income taxes in accordance with FASB ASC Topic 740,Income Taxes,or ASC 740.  Income taxes are provided based on current taxable income and the future tax consequences of temporary differences between the basis of assets and liabilities for financial and tax reporting. The deferred income tax assets and liabilities represent the future state and federal tax return consequences of those differences, which will either be taxable or deductible when the assets and liabilities are recovered or settled. Deferred income taxes are also recognized for operating losses that are available to offset future taxable income and tax credits that are available to offset future income taxes. At each reporting period, management assesses the realizable value of deferred tax assets based on, among other things, estimates of future taxable income, and adjusts the related valuation allowance as necessary. In June 2006, the FASB issued Interpretation No. 48 (FIN 48), “Accounting for Uncertainty in Income Taxes – an Interpretation of SFAS No. 109.” FIN 48 clarifies the accounting for uncertainty in income taxes recognized in an enterprise’s financial statements in accordance with SFAS No. 109, “Accounting for Income Taxes.” FIN 48 prescribes a recognition threshold of more-likely-than-not and measurement of a tax position taken or expected to be taken in an enterprise’s tax return. Management makes a number of assumptions and estimates in determining the appropriate amount of expense to record for income taxes. These assumptions and estimates consider the taxing jurisdiction in which the Company operates as well as current tax regulations. Accruals are established for estimates of tax effects for certain transactions and future projected profitability of the Company’s businesses based on management’s interpretation of existing facts and circumstances. The
On April 1, 2007, the Company adopted FIN 48 effective April 1, 2007.the provisions of ASC 740 related to the accounting for uncertain tax provisions. The adoption of FIN 48the provisions of ASC 740 did not have a material impacteffect on the Consolidated Financial Statements. As a result, there was no cumulative effect related to adopting ASC 740. However, certain amounts have


73


QUALITY SYSTEMS, INC.
NOTES TO CONSOLIDATED FINANCIAL STATEMENTS — (Continued)
been reclassified in the Company’s consolidated financial statements.Consolidated Balance Sheets in order to comply with the requirements of the statement. See Note 8.

11.

Self-Insurance Liabilities.  Effective January 1, 2010, the Company became self-insured with respect to healthcare claims, subject to stop-loss limits. The Company accrues for estimated self-insurance costs and uninsured exposures based on claims filed and an estimate of claims incurred but not reported as of each balance sheet date. However, it is possible that recorded accruals may not be adequate to cover the future payment of claims. Adjustments, if any, to estimated accruals resulting from ultimate claim payments will be reflected in earnings during the periods in which such adjustments are determined. Periodically, the Company reevaluates the adequacy of the accruals by comparing amounts accrued on the balance sheet for anticipated losses to an updated actuarial loss forecasts and third party claim administrator loss estimates and makes adjustments to the accruals as needed.
As of March 31, 2010, the self-insurance accrual was approximately $516, which is included in other current liabilities on the accompanying Consolidated Balance Sheet. If any of the factors that contribute to the overall cost of insurance claims were to change, the actual amount incurred for the self-insurance liabilities would be directly affected.
Advertising Costs.  Advertising costs are charged to operations as incurred. The Company does not have any direct-response advertising. Advertising costs, which includes trade shows and conventions, were approximately $2,580, $2,159$6,198, $3,459 and $1,915$2,580 for the years ended March 31, 2008, 20072010, 2009 and 2006,2008, respectively, and were included in selling, general and administrative expenses in the Consolidated Statements of Income.

Marketing Assistance Agreements.  The Company has entered into marketing assistance agreements with certain existing users of the Company’s products, which provide the opportunity for those users to earn commissions if and only if they host specific site visits upon ourthe Company’s request for prospective customers whichthat directly result in a purchase of ourthe Company’s software by the visiting prospects. Amounts earned by existing users under this program are treated as a selling expense in the period when earned.

Other Comprehensive Income.  Comprehensive income includes all changes in Shareholders’ Equity during a period except those resulting from investments by owners and distributions to owners. The components of accumulated other comprehensive income (loss), net of income tax, consist of unrealized losses on marketable securities of $(196) as of March 31, 2008. There were no other comprehensive income items for the yearyears ended March 31, 2007 and 2006.


Year Ended March 31,


2008


2007


2006


Net income


$

40,078


$

33,232


$

23,322


Other comprehensive income:


Unrealized loss on marketable securities, net of tax


(196

)


Comprehensive income


$

39,882


$

33,232


$

23,322


2010 or 2009.

             
  Year Ended March 31, 
  2010  2009  2008 
 
Net income $48,379  $46,119  $40,078 
Other comprehensive income:            
Unrealized loss on marketable securities, net of tax        (196)
             
Comprehensive income $48,379  $46,119  $39,882 
             
Earnings per Share.  Pursuant to Statement of Financial Accounting Standards No. 128, “EarningsFASB ASC Topic 260,Earnings Per Share” (SFAS 128)Share, or ASC 260, the Company provides dual presentation of “basic” and “diluted” earnings per share (EPS)(“EPS”).

Basic EPS excludes dilution from common stock equivalents and is computed by dividing income available to common stockholdersshareholders by the weighted average number of common shares outstanding for the period. Diluted EPS reflects the potential dilution from common stock equivalents.


74


QUALITY SYSTEMS, INC.
NOTES TO CONSOLIDATED FINANCIAL STATEMENTS — (Continued)
The following table reconciles the weighted average shares outstanding for basic and diluted net income per share for the periods presented.

presented:


Year ended March 31,


2008


2007


2006


Net income


$

40,078


$

33,232


$

23,322


Basic net income per common share:


Weighted average of common shares outstanding


27,298


26,882


26,413


Basic net income per common share


$

1.47


$

1.24


$

0.88


Net income


$

40,078


$

33,232


$

23,322


Diluted net income per common share:


Weighted average of common shares outstanding


27,298


26,882


26,413


Effect of potentially dilutive securities (options)


472


668


943


Weighted average of common shares outstanding - diluted


27,770


27,550


27,356


Diluted net income per common share


$

1.44


$

1.21


$

0.85


  Year Ended March 31, 
  2010  2009  2008 
 
Net income $48,379  $46,119  $40,078 
Basic net income per share:            
Weighted average shares outstanding — Basic  28,635   28,031   27,298 
             
Basic net income per common share $1.69  $1.65  $1.47 
             
Net income $48,379  $46,119  $40,078 
Diluted net income per share:            
Weighted average shares outstanding — Basic  28,635   28,031   27,298 
Effect of potentially dilutive securities  161   365   472 
             
Weighted average shares outstanding — Diluted  28,796   28,396   27,770 
             
Diluted net income per common share $1.68  $1.62  $1.44 
             

The computation of diluted net income per share does not include 279,752, 92,50074,962, 440,338 and 124,000279,752 options for the years ended March 31, 2008, 20072010, 2009 and 2006,2008, respectively, because their inclusion would have an anti-dilutive effect on earnings per share.

Share-Based Compensation. On April 1, 2006, the Company adopted Statement of Financial Accounting Standards No. 123R, “Share-Based Payment” (SFAS 123R) which requires the measurement and recognition of compensation expense for all share-based payment awards made to employees and directors based on estimated fair values. SFAS 123R supersedes the Company’s previous accounting under Accounting Principles Board Opinion No. 25, “Accounting for  FASB ASC Topic 718Compensation — Stock Issued to Employees” (APB 25).

The Company adopted SFAS 123R using the modified prospective transition method, which requires the application of the accounting standard as of April 1, 2006, the first day of the Company’s fiscal year 2007. The Company’s Consolidated Statements of Income for the years ended March 31, 2008 and 2007 reflect the impact of SFAS 123R. In accordance with the modified prospective transition method, the Company’s Consolidated Financial Statements for prior periods have not been restated to reflect, and do not include, the impact of SFAS 123R. Share-based compensation expense recognized under SFAS 123R for the years ended March 31, 2008 and 2007 was $3,757 and $3,923, respectively, which consisted of stock-based compensation expense related to employee and director stock options and included $430 expensed under APB 25 for “in the money” options issued prior to the adoption of SFAS 123R. Excess tax benefits from share-based compensation are presented as cash outflows from operating activities and cash inflows from financing activities. The Company has elected to adopt the alternative transition method provided in FASB Staff Position No. SFAS 123R-3 (FSP 123(R)-3) for calculating the tax effects of share-based compensation pursuant to SFAS 123R. The alternative transition method includes a simplified method to establish the beginning balance of the additional paid-in capital (APIC pool) related to the tax effects of employee and director stock-based compensation, and to determine the subsequent impact on the APIC pool and the consolidated statement of cash flows of the tax effects of employee and director share-based awards that are outstanding upon adoption of SFAS 123R.

SFAS 123RCompensation,or ASC 718, requires companies to estimate the fair value of share-based payment awards on the date of grant using an option-pricing model. Expected term is estimated using historical exercise experience. Volatility is estimated by using the weighted average historical volatility of the Company’s common stock, which approximates expected volatility. The risk free rate is the implied yield available on the U.S Treasury zero-coupon issues with remaining terms equal to the expected term. The expected dividend yield is the average dividend rate during a period equal to the expected term of the option. Those inputs are then entered into the Black Scholes model to determine the estimated fair value. The value of the portion of the award that is ultimately expected to vest is recognized ratably as expense over the requisite service period in the Company’s Consolidated StatementStatements of Income. Prior to the adoption of SFAS 123R, the Company applied the intrinsic-value-based method of accounting prescribed by APB 25 to account for its fixed-plan stock options. Under this method, compensation expense was recorded on the date of grant only if the current market price of the underlying stock exceeded the exercise price. As previously allowed under SFAS 123, the Company only adopted the disclosure requirements of SFAS 123, which established a fair-value-based method of accounting for share-based employee compensation plans. The following is a reconciliation of reported net earnings to adjusted net earnings had the Company recorded compensation expense based on the fair value at the grant date for its stock options under SFAS 123 for the year ended March 31, 2006.


Year Ended
March 31, 2006


Reported net earnings


$

23,322


Add: Option compensation expense, net of tax


262


Less: Share-based compensation expense determined under fair value-based method for all awards


(3,280

)


Pro forma net earnings


$

20,304


Basic earnings per share:


Reported


$

0.88


Pro forma


$

0.77


Diluted earnings per share:


Reported


$

0.85


Pro forma


$

0.74


In arriving at the stock-based compensation expense reported in the table above, the Company utilized the Black-Scholes valuation model for estimating fair value with the following assumptions: expected life – 48 - 57 months from the date of the grant; stock volatility – 47.7 – 57.0%, risk free interest rate of 3.0 - 3.7% and no dividends during the expected term. For stock options issued subsequent to March 31, 2006, the Company used the simplified method for estimating expected term, which derives a term equal to the midpoint between the vesting period and the contractual term as allowed by SAB 107. Prior to using the simplified method, the Company estimated the expected life of an option. The Company estimates volatility by using the weighted average historical volatility of the Company’s common stock which the Company believes approximates expected volatility. The risk free rate is the implied yield available on the U.S Treasury zero-coupon issues with remaining terms equal to the expected life input to the Black Scholes model. Although the Company announced a one-time $0.75 per share dividend on January 31, 2005, no commitment to any future dividends was made at the time the dividend was announced and no commitment to any future dividends existed at the time when the February 11, 2005 options were granted. The Company had not paid a dividend to its shareholders prior to the one-time dividend announced on January 31, 2005. On January 31, 2006, the Company announced a one-time dividend of $0.875 per share. This dividend was announced subsequent to the options granted in fiscal year 2006 and was not considered in the fair value calculations of such options. Therefore, management believes that using a zero dividend rate in the valuation of the stock options granted during fiscal year 2006 was appropriate. The above pro forma disclosure was not presented for the years ended March 31, 2008 and 2007 because stock-based compensation has been accounted under SFAS 123R for these years.

The following table shows total stock-based employee compensation expense included in the Consolidated StatementStatements of Income for years ended March 31, 2010, 2009 and 2008, and 2007, respectively.


Year Ended
March 31, 2008


Year Ended
March 31, 2007


Costs and expenses:


Cost of revenue


$

496


$

524


Research and development


800


870


Selling, general and administrative


2,461


2,529


Total share-based compensation


$

3,757


$

3,923


Amounts capitalized in software development costs


(39

)


(38

)


Amounts charged against earnings, before income tax benefit


$

3,718


$

3,885


Amount of related income tax benefit recognized in earnings


$

969


$

910


respectively:

             
  Year Ended March 31, 
  2010  2009  2008 
 
Costs and expenses:            
Cost of revenue $85  $195  $496 
Research and development  108   242   800 
Selling, general and administrative  1,880   1,540   2,461 
             
Total share-based compensation  2,073   1,977   3,757 
Amounts capitalized in software development costs  (27)  (21)  (39)
             
Amounts charged against earnings, before income tax benefit $2,046  $1,956  $3,718 
Related income tax benefit  (608)  (549)  (969)
             
Decrease in net income $1,438  $1,407  $2,749 
             
Sales Taxes.  In accordance with the guidance of EITF Issue No. 06-3, “How Taxes Collected from Customers and Remitted to Governmental Authorities Should Be Presented in the Income Statement” (EITF 06-3)FASB ASC Topic605-45,Revenue Recognition, Principal Agent Considerations, orASC 605-45, the Company accounts for sales taxes imposed on its goods and services on a net basis in the consolidated statementConsolidated Statements of operations.Income.


75


QUALITY SYSTEMS, INC.


NOTES TO CONSOLIDATED FINANCIAL STATEMENTS — (Continued)
Use of EstimatesEstimates..  The preparation of consolidated financial statementsConsolidated Financial Statements in conformity with accounting principles generally accepted in the United States of America (GAAP)GAAP requires management to make estimates and assumptions that affect the reported amounts of assets and liabilities and disclosure of contingent assets and liabilities at the date of the financial statements, and the reported amounts of revenue and expenses during the reporting period. On an on-goingongoing basis, the Company evaluates its estimates, including those related to uncollectible receivables, vendor specific objective evidence, valuation of marketable securities and ARS put option rights, self-insurance accruals, and income taxes and related credits and deductions. The Company bases its estimates on historical experience and on various other assumptions that are believed to be reasonable under the circumstances, the results of which form the basis for making judgments about the carrying values of assets and liabilities that are not readily apparent from other sources. Actual results may differ from these estimates under different assumptions or conditions.

NewNewly Adopted Accounting PronouncementsStandards..  In May 2008,September 2009, the FASB issued Statementan accounting standards update to ASC 740. This update addresses the need for additional implementation guidance on accounting for uncertainties in income taxes, specifically, whether income tax paid by an entity is attributable to the entity or its owners; what constitutes a tax position for a pass-through entity or a tax-exempt entity; and how to apply the uncertainty in income taxes when a group of Financial Accounting Standards No. 162, “The Hierarchy of Generally Accepted Accounting Principles” (SFAS 162).SFAS No. 162 definesrelated entities comprise both taxable and nontaxable entities. This update also eliminates certain disclosures for nonpublic entities. Since the orderCompany currently applies the standards for accounting for uncertainty in which accounting principles that are generally accepted should be followed. SFAS No. 162 isincome taxes, this update was effective 60 days following the SEC’s approval of the Public Company Accounting Oversight Board (PCAOB) amendments to AU Section 411, “The Meaning of Present Fairly in Conformity with Generally Accepted Accounting Principles”. We do not expect thefor financial statements issued for interim and annual periods ending after September 15, 2009. The adoption of SFAS No. 162 tothis update did not have a material impact on our consolidated financial statements.

the Company’s Consolidated Financial Statements.

In August 2009, the FASB issued an accounting standards update to ASC Topic 820,Fair Value Measurements and Disclosures, or ASC 820. This update provides clarification that in circumstances in which a quoted price in an active market for the identical liability is not available, a reporting entity is required to measure fair value using one or more of the following techniques: (i) a valuation technique that uses the quoted price of the identical liability when traded as an asset or the quoted prices for similar liabilities when traded as assets and (ii) another valuation technique that is consistent with the principles of ASC 820. This update also clarifies that when estimating the fair value of a liability, a reporting entity is not required to include a separate input or adjustment to other inputs relating to the existence of a restriction that prevents the transfer of the liability. Additionally, this update clarifies that both a quoted price in an active market for the identical liability at the measurement date and the quoted price for the identical liability when traded as an asset in an active market when no adjustments to the quoted price of the asset are required are Level 1 fair value measurements. This update was effective for the first reporting period beginning after issuance (the Company’s interim period ended September 30, 2009). The adoption of this update did not have a material impact on the Company’s Consolidated Financial Statements.
In April 2008,2009, the FASB finalized Staff Position (FSP) No. 142-3, “Determinationissued three related accounting provisions intended to provide additional application guidance and enhanced disclosures regarding fair value measurements andother-than-temporary impairments of securities: (i) FASB ASC Topic820-10-65,Fair Value Measurements and Disclosures — Transition and Open Effective Date Information, orASC 820-10-65; (ii) FASB ASC Topic320-10-65,Investments — Debt and Equity Securities — Transition and Open Effective Date Information, orASC 320-10-65; and (iii) FASB ASC Topic825-10-65,Financial Instruments — Transition and Open Effective Date Information, orASC 825-10-65.ASC 820-10-65 provides guidelines for making fair value measurements more consistent with the principles presented inASC 820-10.ASC 820-10-65 must be applied prospectively and retrospective application is not permitted.ASC 820-10-65 is effective for interim and annual periods ending after June 15, 2009, with early adoption permitted for periods ending after March 15, 2009. An entity early adoptingASC 820-10-65 must also early adoptASC 320-10-65.ASC 320-10-65 provides additional guidance designed to create greater clarity and consistency in accounting for and presenting impairment losses on debt securities.ASC 320-10-65 is effective for interim and annual periods ending after June 15, 2009, with early adoption permitted for periods ending after March 15, 2009. An entity may early adopt these provisions only if it also elects to early adoptASC 820-10-65. ASC825-10-65 enhances consistency in financial reporting by increasing the frequency of fair value disclosures.ASC 825-10-65 is effective for interim periods ending after June 15, 2009, with early adoption permitted for periods


76


QUALITY SYSTEMS, INC.
NOTES TO CONSOLIDATED FINANCIAL STATEMENTS — (Continued)
ending after March 15, 2009. However, an entity may early adopt these interim fair value disclosure requirements only if it also elects to early adoptASC 820-10-65 andASC 320-10-65. The adoption of these provisions did not have a material impact on the Company’s Consolidated Financial Statements.
In April 2009, the FASB issued ASC Topic805-20,Business Combinations, Identifiable Assets and Liabilities, and Any Noncontrolling Interest, orASC 805-20.ASC 805-20 amends the guidance in ASC 805 to: (i) require that assets acquired and liabilities assumed in a business combination that arise from contingencies be recognized at fair value if fair value can be reasonably estimated (if fair value of such an asset or liability cannot be reasonably estimated, the asset or liability would generally be recognized in accordance with FASB ASC Topic 450,Contingencies, or ASC 450), (ii) eliminate the requirement to disclose an estimate of the Useful Liferange of Intangible Assets”. The position amendsoutcomes of recognized contingencies at the factorsacquisition date (for unrecognized contingencies, the FASB decided to require that entities include only the disclosures required by ASC 450 and that those disclosures be included in the business combination footnote); and (iii) require that contingent consideration arrangements of an acquiree assumed by the acquirer in a business combination be treated as contingent consideration of the acquirer and should be consideredinitially and subsequently measured at fair value in developing renewalaccordance with ASC 805.ASC 805-20 is effective for assets or extension assumptions used to determine the useful life of a recognized intangible asset under FASB SFAS No. 142, “Goodwill and Other Intangible Assets”. The position applies to intangible assets that are acquired individually or with a group of other assets and both intangible assets acquiredliabilities arising from contingencies in business combinations and asset acquisitions. FSP 142-3for which the acquisition date is effective for fiscal yearson or after the beginning of the first annual reporting period beginning on or after December 15, 2008, and interim periods within those fiscal years. Management is currently evaluating the impact of the pending adoption of FSP 142-3 on the consolidated financial statements.

2008.

In December 2007, the FASB issued Statement of Financial Accounting StandardsASC Topic805-10-65-1,Business Combinations — Overall — Transition Related toSFAS No. 141 (Revised(revised 2007), “Business Combinations” (SFAS 141R). Business Combinations(SFAS 141(R)) and SFAS No. 160,Noncontrolling Interests in Consolidated Financial Statements — an amendment of Accounting Review Bulletin No. 51, orASC 805-10-65-1, the provisions of which have been incorporated in ASC Topic805-10,Business Combinations — Overall, orASC 805-10, andASC 805-20.ASC 805-10-65-1 retains the fundamental requirements of the original pronouncement requiring that the purchase method be used for all business combinations. SFAS 141(R)ASC 805-10-65-1 defines the acquirer as the entity that obtains control of one or more businesses in the business combination, establishes the acquisition date as the date that the acquirer achieves control and requires the acquirer to recognize the assets acquired, liabilities assumed and any noncontrolling interest (including goodwill) at their fair values as of the acquisition date. In addition, SFAS 141(R)ASC 805-10-65-1 requires expensing of acquisition-related and restructure-related costs, remeasurement of earn out provisions at fair value, measurement of equity securities issued for purchase at the date of close of the transaction and non-expensing of in-process research and development related intangibles. SFAS 141(R)ASC805-10-65-1 applies prospectively to business combinations for which the acquisition date is on or after the beginning of the first annual reporting period beginning on or after December 15, 2008. An entity may not apply it before that date. ThisThe Company adoptedASC 805-10 andASC 805-20 and applied the provisions of the pronouncement will be applied byto the Company when it becomes effectivebusiness combinations completed during fiscal year 2010.
In November 2008, the FASB ratified ASC Topic350-30-55,Intangibles — Goodwill and whenOther, Defensive Intangible Asset, or ifASC 350-30-55.ASC 350-30-55 clarifies the Company effectuatesaccounting for certain separately identifiable intangible assets that an acquirer does not intend to actively use but instead intends to hold to prevent its competitors from obtaining access to them.ASC 350-30-55 requires an acquirer in a business combination otherwise there is no impact onto account for a defensive intangible asset as a separate unit of accounting, which should be amortized to expense over the Company’s consolidated financial statements.

In February 2007,period the FASB issued SFAS No. 159, “The Fair Value Option for Financial Assets and Financial Liabilities—including an amendment of SFAS No. 115”, (SFAS 159) which applies to all entities with available-for-sale and trading securities. This Statement permits entities to choose to measure many financial instruments and certain other items at fairasset diminishes in value. The objective is to improve financial reporting by providing entities with the opportunity to mitigate volatility in reported earnings caused by measuring related assets and liabilities differently without having to apply complex hedge accounting provisions. This Statement is effective as of the beginning of an entity’s first fiscal year that begins after November 15, 2007. Early adoption is permitted as of the beginning of a fiscal year that begins on or before November 15, 2007, provided the entity also elects to apply the provisions of FASB Statement No. 157, “Fair Value Measurements”. The Company plans to adopt SFAS 159 effective April 1, 2008 and is in the process of determining the effect, if any, the adoption of SFAS 159 will have on its consolidated financial statements.

In September 2006, the FASB issued Statement of Financial Accounting Standards No. 157, “Fair Value Measurements” (SFAS 157), which defines fair value, establishes a framework for measuring fair value in GAAP, and expands disclosures about fair value measurements. SFAS 157 does not require any new fair value measurements, but provides guidance on how to measure fair value by providing a fair value hierarchy used to classify the source of the information. This statementASC 350-30-55 is effective for fiscal years beginning after NovemberDecember 15, 2007.2008, with early adoption prohibited. The adoption ofASC 350-30-55 did not have a material impact on the Company’s Consolidated Financial Statements.

In June 2008, the FASB issued ASC Topic260-10-45,Earnings Per Share, Required EPS Presentation on the Face of the Income Statement, orASC 260-10-45.ASC 260-10-45 concluded that unvested share-based payment awards that contain nonforfeitable rights to dividends or dividend equivalents (whether paid or unpaid) are participating securities and shall be included in the computation of basic earnings per share (“EPS”) pursuant to the two-class method.ASC 260-10-45 became effective on April 1, 2009. Early adoption was not permitted; however, it does apply retrospectively to EPS data for all periods presented in the financial statements or in financial data. The Company does not currently have any share-based awards with nonforfeitable rights to dividends or dividend


77


QUALITY SYSTEMS, INC.
NOTES TO CONSOLIDATED FINANCIAL STATEMENTS — (Continued)
equivalents and thereforeASC 260-10-45 did not have an impact on the Company’s EPS data in fiscal year 2010 or on EPS for any prior periods presented in the Company’s Consolidated Financial Statements or financial data.
In April 2008, the FASB finalized ASC Topic350-30-65,Intangibles — Goodwill and Other, General Intangibles Other than Goodwill — Transition and Open Effective Date Information, orASC 350-30-65.ASC 350-30-65 amends the factors that should be considered in developing renewal or extension assumptions used to determine the useful life of a recognized intangible asset under FASB ASC Topic350-20,Intangibles — Goodwill and Other, Goodwill.ASC350-30-65 applies to intangible assets that are acquired individually or with a group of other assets and both intangible assets acquired in business combinations and asset acquisitions.ASC 350-30-65 is effective for fiscal years beginning after December 15, 2008 and interim periods within those fiscal years. The adoption ofASC 350-30-65 did not have a material impact on the Company’s Consolidated Financial Statements.
Recently Issued Accounting Standards.  In January 2010, the FASB issued guidance that requires reporting entities to make new disclosures about recurring or nonrecurring fair value measurements, including significant transfers into and out of Level 1 and Level 2 fair value measurements and information on purchases, sales, issuances, and settlements on a gross basis in the reconciliation of Level 3 fair value measurements. The guidance is effective for interim and annual reporting periods beginning after December 15, 2009, except for Level 3 reconciliation disclosures that are effective for annual periods beginning after December 15, 2010. The Company does not expect the disclosure provisions for Level 3 reconciliation to have a significant impact on its Consolidated Financial Statements.
In September 2009, the FASB reached a consensus on Accounting Standards Update, or ASU,2009-13,Revenue Recognition (Topic 605) — Multiple-Deliverable Revenue Arrangements, or ASU2009-13, and ASU2009-14,Software (Topic 985) — Certain Revenue Arrangements That Include Software Elements, or ASU2009-14. ASU2009-13 modifies the requirements that must be met for an entity to recognize revenue from the sale of a delivered item that is part of a multiple-element arrangement when other items have not yet been delivered. ASU2009-13 eliminates the requirement that all undelivered elements must have either: (i) VSOE or (ii) third-party evidence, or TPE, before an entity can recognize the portion of an overall arrangement consideration that is attributable to items that already have been delivered. In the absence of VSOE or TPE of the standalone selling price for one or more delivered or undelivered elements in a multiple-element arrangement, entities will be required to estimate the selling prices of those elements. Overall arrangement consideration will be allocated to each element (both delivered and undelivered items) based on their relative selling prices, regardless of whether those selling prices are evidenced by VSOE or TPE or are based on the entity’s estimated selling price. The residual method of allocating arrangement consideration has been eliminated. ASU2009-14 modifies the software revenue recognition guidance to exclude from its scope tangible products that contain both software and non-software components that function together to deliver a product’s essential functionality. These new updates are effective for revenue arrangements entered into or materially modified in fiscal years beginning on or after June 15, 2010. Early adoption is permitted. The Company is currently


evaluating the impact if any,that the adoption of this standardthese ASUs will have on its consolidated financial statements.

3. Cash and Cash Equivalents

Consolidated Financial Statements.

3.  Cash and Cash Equivalents
At March 31, 20082010 and 2007,2009, the Company had cash and cash equivalents of $59,046$84,611 and $60,028, respectively, invested in both a major national brokerage firm’s institutional fund that specializes in U.S. government securities$70,180, respectively. Cash and commercial paper with high credit ratings,cash equivalents consist of cash, money market funds and short-term U.S. treasury securities.Treasury securities with original maturities of less than 90 days. The money market fund in which the Company holds a portion of its cash invests in only investment grade money market instruments from a variety of industries, and therefore bears relatively low market risk. The average maturity of the investments owned by the money market fund is approximately two months.


78


QUALITY SYSTEMS, INC.
NOTES TO CONSOLIDATED FINANCIAL STATEMENTS — (Continued)
4.  Fair Value Measurements
The Company applies ASC 820 with respect to fair value measurements of (a) nonfinancial assets and liabilities that are recognized or disclosed at fair value in the Company’s Consolidated Financial Statements on a recurring basis (at least annually) and (b) all financial assets and liabilities. The Company adopted the aspects of ASC 820 relative to nonfinancial assets and liabilities that are measured at fair value, but are recognized and disclosed at fair value on a nonrecurring basis, prospectively effective April 1, 2009. ASC 820 prioritizes the inputs used in measuring fair value into the following hierarchy:
Level 1Quoted market prices in active markets for identical assets or liabilities;
Level 2Observable inputs other than those included in Level 1 (for example, quoted prices for similar assets in active markets or quoted prices for identical assets in inactive markets); and
Level 3Unobservable inputs reflecting management’s own assumptions about the inputs used in estimating the value of the asset.
The following table summarizes the Company’s financial assets measured at fair value on a recurring basis in accordance with ASC 820 as of March 31, 2010 and March 31, 2009:
                 
     Quoted Prices
  Significant
    
     in Active
  Other
    
  Balance at
  Markets for
  Observable
  Unobservable
 
  March 31,
  Identical Assets
  Inputs
  Inputs
 
  2010  (Level 1)  (Level 2)  (Level 3) 
 
Cash and cash equivalents $84,611  $84,611  $  $ 
Restricted cash  2,339   2,339       
Marketable securities(1)  7,158         7,158 
ARS put option rights(2)  548         548 
                 
  $94,656  $86,950  $  $7,706 
                 
                 
     Quoted Prices
  Significant
    
     in Active
  Other
    
  Balance at
  Markets for
  Observable
  Unobservable
 
  March 31,
  Identical Assets
  Inputs
  Inputs
 
  2009  (Level 1)  (Level 2)  (Level 3) 
 
Cash and cash equivalents $70,180  $70,180  $  $ 
Restricted cash  1,303   1,303       
Marketable securities(1)  7,395         7,395 
ARS put option rights(3)  468         468 
                 
  $79,346  $71,483  $  $7,863 
                 
(1)Marketable securities consist of ARS
(2)ARS put option rights are included on the accompanying Consolidated Balance Sheets in other current assets as of March 31, 2010.
(3)ARS put option rights are included on the accompanying Consolidated Balance Sheets in other assets as of March 31, 2009.
The fair value of the Company’s ARS, including the Company’s ARS put option rights, has been estimated by management based on its assumptions of what market participants would use in pricing the asset in a current transaction, or Level 3 — unobservable inputs, in accordance with ASC 820, and represents $7,706 and $7,863 or


79


QUALITY SYSTEMS, INC.
NOTES TO CONSOLIDATED FINANCIAL STATEMENTS — (Continued)
8.1% and 9.9%, of total financial assets measured at fair value in accordance with ASC 820 at March 31, 2010 and 2009, respectively. Management used a model to estimate the fair value of these securities that included certain Level 2 inputs as well as assumptions, such as a liquidity discount and credit rating of the issuers, based on management’s judgment, which are highly subjective and therefore considered Level 3 inputs in the fair value hierarchy. The estimate of the fair value of the ARS could change based on market conditions. For additional information on cash and cash equivalents, restricted cash or marketable securities, see Note 2.
The following table presents activity in the Company’s assets measured at fair value using significant unobservable inputs (Level 3), as defined by ASC 820, as of and for the year ended March 31, 2010:
     
Balance at March 31, 2009 $7,863 
Transfer in/(out) of Level 3   
Proceeds from sale (at par)  (425)
Recognized gain  268 
     
Balance at March 31, 2010 $7,706 
     
To determine the estimated fair values of the ARS at March 31, 2010 and 2009, factors including credit quality, assumptions about the likelihood of redemption, observable market data such as yields or spreads of fixed rate municipal bonds and other trading instruments issued by the same or comparable issuers, were considered. The Company has valued the ARS as the approximate midpoint between various fair values, measured as the difference between the par value of the ARS and the fair value of the securities, discounted by the credit risk of the broker and other factors such as the Company’s historical experience to sell ARS at par.
Interest income related to cash and cash equivalents for each of the three years ended March 31 is as follows:


Year Ended
March 31, 2008


Year Ended
March 31, 2007


Year Ended
March 31, 2006


Interest income


$

1,444


$

3,306


$

2,108


4. Marketable Securities

At March 31, 2008, the cost and estimated fair values of the Company’s marketable securities in ARS were as follows:


Cost


Gross
Unrealized
Gains


Gross
Unrealized
Losses


Fair Value/
Carrying
Value


Current marketable securities:


Auction rate securities


$

2,500


$


$

(50

)

$

2,450


Non-current marketable securities:


Auction rate securities


20,450


(276

)


20,174


Total marketable securities


$

22,950


$


$

(326

)

$

22,624


At March 31, 2007, the Company did not have investments in marketable securities.

Interest income related to marketable securities for each of the three years ended March 31, 2010 is as follows:

             
  Year Ended March 31,
  2010 2009 2008
 
Interest Income $226  $1,203  $2,661 
             
5.  Business Combinations
On May 20, 2008, the Company acquired HSI, a full-service healthcare RCM company, and on October 28, 2008, the Company acquired PMP, a full-service healthcare RCM company. The Company accounted for these acquisitions as a business combination using the purchase method of accounting. The purchase price was allocated to HSI and PMP’s tangible and intangible assets acquired and liabilities assumed based on their estimated fair values as of the respective acquisitions dates. The fair value of the assets acquired and liabilities assumed represent management’s estimate of fair value.
During fiscal year 2010, the Company paid $3,000 in cash and issued stock options with a fair value of $433 as part of a contingent earn-out agreement relating to the acquisition of PMP. The additional consideration was recorded as an increase to goodwill. See Note 6.
Acquisition of Sphere
On August 12, 2009, the Company acquired certain assets of Sphere. The Company accounted for this acquisition as a purchase business combination as defined in ASC 805. Under the acquisition method of accounting, the purchase price was allocated to the tangible and intangible assets acquired and liabilities assumed based on their estimated fair values as of the acquisition date. The fair value of the assets acquired and liabilities assumed represent management’s estimate of fair value.


80


Year Ended
March 31, 2008


Year Ended
March 31, 2007


Year Ended
March 31, 2006


Interest income


$

1,217


$


$


5. Intangible Assets – Capitalized Software Costs

As


QUALITY SYSTEMS, INC.
NOTES TO CONSOLIDATED FINANCIAL STATEMENTS — (Continued)
The purchase price totaled $1,374, including contingent consideration payable over a five year period, consisting of maintenance revenue and license fee payments, estimated at approximately $1,074 based on the probability of achieving certain business milestones, but which in no event shall exceed $2,500. The total purchase price for Sphere is as follows:
     
Cash paid $300 
Contingent consideration  1,074 
     
Total purchase price $1,374 
     
In connection with the acquisition, the Company recorded $275 of intangible assets related to customer relationships and software technology and $1,020 of goodwill. The Company is amortizing the customer relationships intangible asset over 4 years and the software technology over 3 years.
The following table summarizes the final allocation of the purchase price:
     
  August 12,
 
  
2009
 
 
Fair value of the net tangible assets acquired and liabilities assumed:    
Current assets (consisting of accounts receivable only) $158 
Current liabilities, including long-term debt due within one year  (79)
     
Total tangible assets acquired and liabilities assumed  79 
Fair value of identifiable intangible assets acquired:    
Customer relationships  156 
Software technology  119 
Goodwill (including assembled workforce of $84)  1,020 
     
Total identifiable intangible assets acquired  1,295 
     
Total purchase price $1,374 
     
The pro forma effects of this acquisition would not have been material to the Company’s results of operations for the year ended March 31, 20082010 and 2007,is therefore not presented.
Acquisition of Opus
On February 10, 2010, the Company acquired Opus. The Company accounted for this acquisition as a purchase business combination as defined in ASC 805. Under the acquisition method of accounting, the purchase price was allocated to the tangible and intangible assets acquired and liabilities assumed based on their estimated fair values as of the acquisition date. The fair value of the assets acquired and liabilities assumed represent management’s estimate of fair value.
The estimated fair value of the acquired tangible and intangible assets and liabilities assumed were determined using multiple valuation approaches depending on the type of tangible or intangible asset acquired, including but not limited to the income approach, the excess earnings method as well as the relief from royalty method approach.
Key assumptions used to determine the fair value of tangible and intangible assets acquired were (a) expected cash flow period of 5 to 10 years; (b) a weighted average cost of capital discount rate ranging from 24% to 26%, calculated using the capital asset pricing model, thebuild-up and IRR methodologies; and (c) a risk free rate of 4.5%, which is based on the rates of long-term treasury securities.
The Company recognized approximately $200 of acquisition and integration related costs that were expensed in the year ended March 31, 2010.


81


QUALITY SYSTEMS, INC.
NOTES TO CONSOLIDATED FINANCIAL STATEMENTS — (Continued)
The purchase price totaled $20,581, including approximately $11,516 in contingent consideration based primarily on Opus achieving certain EBITDA and strategic goal targets. The total purchase price for Opus is as follows:
     
Cash paid $250 
Common stock issued at fair value  8,815 
Contingent consideration  11,516 
     
Total purchase price $20,581 
     
In connection with the acquisition, the Company recorded $13,250 of intangible assets related to customer relationships and software technology and $13,005 of goodwill. The Company is amortizing the customer relationships intangible asset over 4 years and the software technology over 8 years.
The following table summarizes the final allocation of the purchase price:
     
  February 10,
 
  2010 
 
Fair value of the net tangible assets acquired and liabilities assumed:    
Cash and cash equivalents $2,036 
Current assets (including accounts receivable of $1,753)  3,435 
Equipment and improvements and other long-term assets  483 
Accounts payable and accrued liabilities  (7,678)
Deferred revenues  (3,950)
     
Total tangible assets acquired and liabilities assumed  (5,674)
Fair value of identifiable intangible assets acquired:    
Customer relationships  1,250 
Software technology  12,000 
Goodwill (including assembled workforce of $1,000)  13,005 
     
Total identifiable intangible assets acquired  26,255 
     
Total purchase price $20,581 
     
The pro forma effects of this acquisition would not have been material to the Company’s results of operations for the year ended March 31, 2010 and is therefore not presented.
6.  Goodwill
In accordance withASC 350-20, the Company does not amortize goodwill as the goodwill has been determined to have an indefinite useful life.


82


QUALITY SYSTEMS, INC.
NOTES TO CONSOLIDATED FINANCIAL STATEMENTS — (Continued)
Goodwill consists of the following:
             
  Balance at
     Balance at
 
  March 31,
  Additions to
  March 31,
 
  2009  Goodwill  2010 
 
NextGen Division            
Opus Healthcare Solutions, Inc.  $  $13,005  $13,005 
NextGen Sphere, LLC     1,020   1,020 
NextGen Healthcare Information Systems, Inc.   1,840      1,840 
             
Total NextGen Division goodwill  1,840   14,025   15,865 
Practice Solutions Division            
Practice Management Partners, Inc.   16,052   3,433   19,485 
Healthcare Strategic Initiatives  10,839      10,839 
             
Total Practice Solutions Division goodwill  26,891   3,433   30,324 
             
Total goodwill $28,731  $17,458  $46,189 
             
7.  Intangible Assets
The Company had the following amounts related to intangible assets, other than capitalized software development costs, with definite lives:

determinable lives as of March 31, 2010:


March 31, 2008


March 31, 2007


 Customer
 Trade
 Software


 Relationships Name Technology Total 


Gross carrying amount


$

27,645


$

21,626


 $10,206  $637  $12,119  $22,962 

Accumulated amortization


(18,793

)


(14,644

)

  (2,357)  (269)  (191)  (2,817)


Net capitalized software development


$

8,852


$

6,982


Net intangible assets $7,849  $368  $11,928  $20,145 


Aggregate amortization expense during the year


$

4,149


$

3,231


 $1,434  $158  $191  $1,783 


Activity related to net capitalized software coststhe intangible assets for the yearsyear ended March 31, 2008 and 20072010 is as follows:


March 31, 2008


March 31, 2007


Beginning of the year


$

6,982


$

5,171


Capitalization


6,019


5,042


Amortization


(4,149

)


(3,231

)


End of the year


$

8,852


$

6,982


  Customer
  Trade
  Software
    
  Relationships  Name  Technology  Total 
 
Balance as of April 1, 2009 $7,877  $526  $  $8,403 
Acquisition  1,406      12,119   13,525 
Amortization  (1,434)  (158)  (191)  (1,783)
                 
Balance as of March 31, 2010 $7,849  $368  $11,928  $20,145 
                 
The following table represents the remaining estimated amortization of intangible assets with determinable lives as of March 31, 2008:2010:
     
For the year ended March 31,    
2011 $3,255 
2012  3,320 
2013  3,184 
2014  3,055 
2015 and beyond  7,331 
     
Total $20,145 


83


For the year ending March 31,


2009


$

4,381


2010


3,212


2011


1,259


Total


$

8,852


6. CompositionQUALITY SYSTEMS, INC.
NOTES TO CONSOLIDATED FINANCIAL STATEMENTS — (Continued)
8.  Capitalized Software Costs
As of Certain Financial Statement Captions

March 31, 2010 and 2009, the Company had the following amounts related to capitalized software costs:

         
  March 31,
  March 31,
 
  2010  2009 
 
Gross carrying amount $41,429  $33,508 
Accumulated amortization  (29,883)  (23,956)
         
Net capitalized software costs $11,546  $9,552 
         
Aggregate amortization expense during the year $5,927  $5,163 
         
Activity related to net capitalized software costs for the years ended March 31, 2010 and 2009 is as follows:
         
  Year Ended March 31, 
  2010  2009 
 
Beginning of the year $9,552  $8,852 
Capitalization  7,921   5,863 
Amortization  (5,927)  (5,163)
         
End of the year $11,546  $9,552 
         
The following table represents the remaining estimated amortization of capitalized software costs as of March 31, 2010:
     
For the year ended March 31,    
2011 $5,729 
2012  3,783 
2013  1,768 
2014  266 
2015 and beyond   
     
Total $11,546 
     
9.  Composition of Certain Financial Statement Captions
Accounts receivable include amounts related to maintenance and services whichthat were billed but not yet rendered as of the end of the fiscal year. Undelivered maintenance and services are included on the accompanying Consolidated Balance Sheets as part of the deferred revenue balance.
         
  March 31,
  March 31,
 
  2010  2009 
 
Accounts receivable, excluding undelivered software, maintenance and services $72,500  $64,003 
Undeliverable software, maintenance and implementation services billed in advance, included in deferred revenue  39,447   29,944 
         
Accounts receivable, gross  111,947   93,947 
Allowance for doubtful accounts  (4,489)  (3,877)
         
Accounts receivable, net $107,458  $90,070 


84


March 31, 2008


March 31, 2007


Accounts receivable, excluding undelivered software, maintenance and services


$

50,417


$

42,574


Undelivered software, maintenance and implementation services billed in advance, included in deferred revenue


28,696


23,809


Accounts receivable, gross


79,113


66,383


Allowance for doubtful accounts


(2,528

)


(2,438

)


Accounts receivable, net


$

76,585


$

63,945


QUALITY SYSTEMS, INC.
NOTES TO CONSOLIDATED FINANCIAL STATEMENTS — (Continued)
Inventories are summarized as follows:


March 31, 2008


March 31, 2007


Computer systems and components, net of reserve for obsolescence of $223 and $324, respectively


$

992


$

1,147


Miscellaneous parts and supplies


32


28


Inventories, net


$

1,024


$

1,175


  March 31,
  March 31,
 
  2010  2009 
 
Computer systems and components, net of reserve for obsolescence of $237 and $210, respectively $1,322  $1,105 
Miscellaneous parts and supplies  18   20 
         
Inventories, net $1,340  $1,125 
         

Equipment and improvements are summarized as follows:
         
  March 31,
  March 31,
 
  2010  2009 
 
Computer and electronic test equipment $18,599  $15,384 
Furniture and fixtures  5,136   3,520 
Leasehold improvements  1,969   1,595 
         
   25,704   20,499 
Accumulated depreciation and amortization  (17,272)  (13,743)
         
Equipment and improvements, net $8,432  $6,756 
         
Accrued compensation and related benefits are summarized as follows:
         
  March 31,
  March 31,
 
  2010  2009 
 
Payroll, bonus and commission $4,185  $5,768 
Vacation  4,766   3,743 
         
Accrued compensation and related benefits $8,951  $9,511 
         
Short and long-term deferred revenue are summarized as follows:
         
  March 31,
  March 31,
 
  2010  2009 
 
Maintenance $13,242  $8,776 
Implementation services  38,137   28,631 
Annual license services  8,214   7,988 
Undelivered software and other  4,516   2,189 
         
Deferred revenue $64,109  $47,584 
         
Deferred revenue, net of current $474  $521 


85


March 31, 2008


March 31, 2007


Computer and electronic test equipment


$

11,454


$

9,801


Furniture and fixtures


2,975


2,845


Leasehold improvements


1,259


929


15,688


13,575


Accumulated depreciation and amortization


(10,915

)


(8,546

)


Equipment and improvements, net


$

4,773


$

5,029


Accrued compensation and related benefits are summarized as follows:


March 31, 2008


March 31, 2007


Bonus and commission


$

5,443


$

4,158


Vacation


2,903


2,363


Accrued compensation and related benefits


$

8,346


$

6,521


Short and long-term deferred revenue are summarized as follows:


March 31, 2008


March 31, 2007


Maintenance


$

10,175


$

10,241


Implementation services


25,929


24,246


Annual license services


6,532


2,219


Undelivered software and other


2,259


2,742


Deferred Revenue


$

44,895


$

39,448


Other current liabilities are summarized as follows:


March 31, 2008


March 31, 2007


Sales tax payable


$

765


$

805


Customer deposits


621


703


Deferred rent


607


652


Professional fees


600


425


Commission payable


346


767


Accrued EDI expenses


613


Accrued royalties


216


463


Other accrued expenses


1,239


1,198


Other current liabilities


$

4,394


$

5,626


7. QUALITY SYSTEMS, INC.
NOTES TO CONSOLIDATED FINANCIAL STATEMENTS — (Continued)
Other Income - Gain from Life Insurance Proceeds

On September 26, 2007, Mr. Gregory Flynn, Executive Vice Presidentcurrent liabilities are summarized as follows:

         
  March 31,
  March 31,
 
  2010  2009 
 
Contingent consideration related to acquisition $5,275  $ 
Care services liabilities  2,336   1,303 
Accrued EDI expense  2,000   1,258 
Customer deposits  1,036   674 
Accrued royalties  926   933 
Deferred rent  641   782 
Self insurance reserve  516    
Sales tax payable  506   602 
Commission payable  468   385 
Professional services  391   409 
Other accrued expenses  2,125   2,542 
         
Other accrued liabilities $16,220  $8,888 
         
10.  Other Income (Expense)
Other income (expense) of $268 for the year ended March 31, 2010 consists predominantly of gains and General Manager oflosses in fair value recorded on the Company’s QSI Division passed away. Mr. Flynn participated inARS investments as well as on its ARS put option rights. For the Company’s deferred compensation plan which is funded through the purchase of life insurance policies withyear ended March 31, 2010, the Company named as beneficiary. Asrecognized a resultgain on the ARS of Mr. Flynn’s passing,approximately $188 and a gain on the Company recorded additional compensation expenseARS put option rights of $198 which was offset by net insurance proceeds of $953. The additional compensation expense was recorded in Selling, General and Administrative Expenses and the insurance proceeds were recorded as Other Income in the Consolidated Statement of Income.

approximately $80. See Note 2.


8. Income Taxes

11.  Income Taxes

During the years ended March 31, 2008, 20072010, 2009 and 2006,2008, the Company claimed federal research and development tax credits of $779, $787$605, $859 and $821,$779, respectively, and state research and development tax credits of approximately $113, $99$129, $166 and $60,$113, respectively. Due to the expiration of the Internal Revenue Service (“IRS”) statute related to research and development credits on December 31, 2007,2009, the Company’s research and development credits for the year ended March 31, 20082010 represent credits for the nine-month period from April 1, 20072009 through December 31, 2007.2009. The Company also claimed the qualified production activities deduction under Section 199 of the Internal Revenue Code (“IRC”) for $3,069, $1,457$4,133, $2,747 and $840$3,069 during the years ended March 31, 2008, 20072010, 2009 and 2006,2008, respectively. The research and development credits and the qualified production activities income deduction taken by the Company involve certain assumptions and judgments regarding qualification of expenses under the relevant tax code provisions.


86


QUALITY SYSTEMS, INC.
NOTES TO CONSOLIDATED FINANCIAL STATEMENTS — (Continued)
The provision (benefit) for income taxes consists of the following components:
             
  Year Ended March 31, 
  2010  2009  2008 
 
Current:            
Federal taxes $23,750  $18,818  $18,120 
State taxes  5,043   4,992   4,348 
             
   28,793   23,810   22,468 
             
Deferred:            
Federal taxes  (768)  2,802   333 
State taxes  (186)  596   124 
             
   (954)  3,398   457 
             
Total $27,839  $27,208  $22,925 
             
The provision for income taxes differs from the amount computed at the federal statutory rate as follows:
             
  Year Ended March 31, 
  2010  2009  2008 
 
Current:            
Federal income tax statutory rate  35.0%  35.0%  35.0%
Increase (decrease) resulting from:            
State income taxes, net of Federal benefit  4.3   5.2   4.8 
Research and development tax credits  (0.9)  (1.3)  (1.3)
Qualified production activities income deduction  (2.0)  (1.4)  (1.8)
Other  0.1   (0.4)  (0.3)
             
Effective income tax rate  36.5%  37.1%  36.4%


87


Year ended March 31,


2008


2007


2006


Current:


Federal taxes


$

18,120


$

18,106


$

12,824


State taxes


4,348


4,488


3,256


Total


22,468


22,594


16,080


Deferred:


Federal taxes


333


(1,347

)


(1,168

)

State taxes


124


(295

)


(308

)


Total


457


(1,642

)


(1,476

)


Total


$

22,925


$

20,952


$

14,604


The provision for income taxes differs from the amount computed at the federal statutory rate as follows:


Year ended March 31,


2008


2007


2006


Current:


Federal income tax statutory rate


35.0

%


35.0

%


35.0

%

Increase (decrease) resulting from:


State income taxes, net of Federal benefit


4.8


5.0


5.0


Research and development tax credits


(1.3

)


(1.7

)


(2.3

)

Qualified Production Activities Income Deduction


(1.8

)


(0.9

)


(0.8

)

Other


(0.3

)


1.3


1.6


Effective income tax rate


36.4

%


38.7

%


38.5

%


QUALITY SYSTEMS, INC.

NOTES TO CONSOLIDATED FINANCIAL STATEMENTS — (Continued)
The net deferred tax assets (liabilities) in the accompanying Consolidated Balance Sheets consist of the following:


March 31, 2008


March 31, 2007


Deferred tax assets:


Deferred revenue and allowance for doubtful accounts


$

4,534


$

4,528


Inventory valuation


137


206


Purchased in-process research and development


1,187


1,490


Intangibles assets


102


100


Accrued compensation and benefits


1,701


917


Deferred compensation


806


975


State income taxes


92


55


Compensatory stock option expense


1,139


707


Unrealized loss on marketable securities


130


Other


801


387


Total deferred tax assets


10,629


9,365


Deferred tax liabilities:


Accelerated depreciation


(545

)


(387

)

Capitalized software


(3,746

)


(2,955

)

Prepaid expense


(1,516

)


(1,400

)


Total deferred tax liabilities


(5,807

)


(4,742

)


Deferred tax assets, net


$

4,822


$

4,623


  March 31,
  March 31,
 
  2010  2009 
 
Deferred tax assets:        
Deferred revenue and allowance for doubtful accounts $5,577  $3,271 
Inventory valuation  115   100 
Purchased in-process research and development  601   912 
Accrued compensation and benefits  2,325   1,955 
Deferred compensation  783   789 
State income taxes  640   185 
Compensatory stock option expense  252   125 
Other  125   779 
         
Total deferred tax assets  10,418   8,116 
         
Deferred tax liabilities:        
Accelerated depreciation  (1,529)  (1,114)
Capitalized software  (4,806)  (4,126)
Intangibles assets  (6,938)  (1,412)
Prepaid expense  (2,326)  (2,036)
         
Total deferred tax liabilities  (15,599)  (8,688)
         
Deferred tax assets (liabilities), net $(5,181) $(572)
         
The deferred tax assets and liabilities have been shown net in the accompanying Consolidated Balance Sheets based on the long-term or short-term nature of the items whichthat give rise to the deferred amount. No valuation allowance has been made against the deferred tax assets as management expects to receive the full benefit of the assets recorded.

On April 1, 2007, the Company adopted the provisions of FASB Interpretation No. 48, “Accounting for Uncertainty in Income Taxes (FIN 48) an interpretation of FASB Statement No. 109 (SFAS 109).” The adoption of the provisions of FIN 48 had no material effect on the consolidated financial statements. As a result, there was no cumulative effect related to adopting FIN 48. However, certain amounts have been reclassified in the Company’s Consolidated Balance Sheets in order to comply with the requirements of the statement. At adoption, the Company had $394 of unrecognized

Uncertain tax benefits, $89 of which would affect the Company’s effective tax rate if recognized in the future. positions
A reconciliation of the beginning and ending amount of unrecognized tax benefits, which is recorded in income taxes payable in the Company’s Consolidated Balance Sheet, is as follows:


Balance as of April 1, 2007


$

394


Additions for prior year tax positions


307


Reductions for prior year tax positions


(88

)


Balance at March 31, 2008


$

613


Balance at March 31, 2008 $613 
Additions for prior year tax positions  15 
Reductions for prior year tax positions  (561)
     
Balance at March 31, 2009 $67 
Additions for prior year tax positions  598 
Reductions for prior year tax positions  (9)
     
Balance at March 31, 2010 $656 
     
The total amount of unrecognized tax benefit that, if recognized, would decrease the income tax provision is $52.

$656.

The Company’s continuing practice is to recognize estimated interestand/or penalties related to income tax matters in general and administrative expenses. The Company had approximately $8$59 and $45$12 of accrued interest related to income tax matters at March 31, 20082010 and 2007,2009, respectively. No penalties were accrued.

The Company’s income tax returns filed for tax years 20042006 through 20062008 and 20032005 through 20062008 are subject to examination by the federal and state taxing authorities, respectively. The Company is currently not under examination by the Internal Revenue Service (IRS). However, the Company is under routine examination by two states.IRS or any state income tax authority. The Company does not anticipate that total unrecognized


88


QUALITY SYSTEMS, INC.
NOTES TO CONSOLIDATED FINANCIAL STATEMENTS — (Continued)
tax benefits will significantly change due to the settlement of audits or the expiration of statute of limitations within the next twelve months. The Company has filed three applications to change tax accounting methods. It is reasonably possible that the Company will receive consent to change these accounting methods within the next twelve months which would reduce the


unrecognized tax benefit balance as of March 31, 2008 by $561 with no impact on the tax provision.

9. Employee Benefit Plans

12.  Employee Benefit Plans

The Company has a 401(k) plan available to substantially all of its employees. Participating employees may defer up to the Internal Revenue ServiceIRS limit based on the Internal Revenue CodeIRC per year. The annual contribution is determined by a formula set by the Company’s Board of Directors and may include matchingand/or discretionary contributions. The amount of the Company match is discretionary and subject to change. The retirement plans may be amended or discontinued at the discretion of the Board of Directors. Contributions of $317, $250$371, $357 and $202$317 were made by the Company to the 401(k) plan for the fiscal years ended March 31, 2010, 2009 and 2008, 2007 and 2006, respectively.

The Company has a deferred compensation plan (the Deferral Plan)“Deferral Plan”) for the benefit of those officers and employees who qualify for inclusion. Participating employees may defer between 5% and 50%up to 75% of their compensationsalary and 100% of their annual bonus for a Deferral Plan year. In addition, the Company may, but is not required to, make contributions into the Deferral Plan on behalf of participating employees, and the amount of the Company match is discretionary and subject to change. Each employee’s deferrals together with earnings thereon are accrued as part of the long-term liabilities of the Company. Investment decisions are made by each participating employee from a family of mutual funds. Deferred compensation liability was $1,906$1,883 and $2,279$1,838 at March 31, 20082010 and 2007,2009, respectively. To offset this liability, the Company has purchased life insurance policies on some of the participants. The Company is the owner and beneficiary of the policies and the cash values are intended to produce cash needed to help make the benefit payments to employees when they retire or otherwise leave the Company. The Company intends to hold the life insurance policy until the death of the plan participant. The net cash surrender value of the life insurance policies for deferred compensation was $1,858$2,670 and $2,276$1,715 at March 31, 20082010 and 2007,2009, respectively. The values of the life insurance policies and the related Company obligation are included on the accompanying Consolidated Balance Sheets in long-term other assets and long-term deferred compensation, respectively. The Company made contributions of $29,$48, $29 and $25$29 to the Deferral Plan for each of the fiscal years ended March 31, 2010, 2009 and 2008, 2007 and 2006, respectively.

The Company has a voluntary employee stock contribution plan for the benefit of full-time employees. The plan is designed to allow certainqualified employees to acquire shares of the Company’s common stock through automatic payroll deduction. Each eligible employee may authorize the withholding of up to 10% of his/his or her gross payroll each pay period to be used to purchase shares on the open market by a broker designated by the Company. In addition, the Company will match 5% of each employee’s contribution and will pay all brokerage commissions and fees in connection with each purchase. The amount of the Company match is discretionary and subject to change. The plan is not intended to be an employee benefit plan under the Employee Retirement Income Security Act of 1974, and is therefore not required to comply with that Act. Contributions of approximately $28, $10$35, $14 and $14$28 were made by the Company for the fiscal years ended March 31, 2010, 2009 and 2008, 2007 and 2006, respectively.

13.  Share-Based Awards
10. Employee Stock Option Plans

In September 1998, the Company’s shareholders approved a stock option plan (the “1998 Plan”) under which 4,000,000 shares of Common Stock were reserved for the issuance of options. The 1998 Plan provides that employees, directors and consultants of the Company may, at the discretion of the Board of Directors or a duly designated compensation committee, be granted options to purchase shares of Common Stock. The exercise price of each option granted shall bewas determined by the Board of Directors at the date of grant, and options under the 1998 Plan expire no later than ten years from the grant date. Options granted will generally become exercisable in accordance with the terms of the agreement pursuant to which they were granted. Certain option grants to directors became exercisable three months from the date of grant. Upon an acquisition of the Company by merger or asset sale, each


89


QUALITY SYSTEMS, INC.
NOTES TO CONSOLIDATED FINANCIAL STATEMENTS — (Continued)
outstanding option may be subject to accelerated vesting under certain circumstances. The 1998 Plan terminated on December 31, 2007. As of March 31, 2008,2010, there were 1,278,734301,462 outstanding options related to this Plan.

In October 2005, the Company’s shareholders approved a stock option and incentive plan (the “2005 Plan”) under which 2,400,000 shares of Common Stock have beenwere reserved for the issuance of awards, including stock options, incentive stock options and non-qualified stock options, stock appreciation rights, restricted stock, unrestricted stock, restricted stock units, performance shares, performance units (including performance options) and other share-based awards. The 2005 Plan provides that employees, directors and consultants of the Company may, at the discretion of the Board of Directors or a duly designated compensation committee, be granted awards to purchaseacquire shares of Common Stock. The exercise price of each option award granted shall be determined by the Board of Directors at the date of grant in accordance with the terms of the 2005 Plan, and under the


2005 Plan awards expire no later than ten years from the grant date. Options granted will generally become exercisable in accordance with the terms of the agreement pursuant to which they were granted. Upon an acquisition of the Company by merger or asset sale, each outstanding awardoption may be subject to accelerated vesting under certain circumstances. The 2005 Plan terminates on May 25, 2015, unless sooner terminated earlier by the Board.Board of Directors. At March 31, 2008, 2,375,0002010, 1,771,185 shares were available for future grant under the 2005 Plan. As of March 31, 2008,2010, there were 25,000570,501 outstanding options related to this Plan.

A summary of stock option transactions during the years ended March 31, 2010, 2009 and 2008 is as follows:
                 
        Weighted
    
     Weighted
  Average
  Aggregate
 
     Average
  Remaining
  Intrinsic
 
     Exercise
  Contractual
  Value
 
  Number of Shares  Price  Life  (In thousands) 
 
Outstanding, March 31, 2007  1,461,950  $18.46         
Granted  225,500  $38.78         
Exercised  (325,266) $14.64      $4,955 
Forfeited/Canceled  (58,450) $21.12         
                 
Outstanding, March 31, 2008  1,303,734  $22.81         
Granted  298,331  $38.71         
Exercised  (697,083) $17.96      $17,182 
Forfeited/Canceled  (84,900) $25.93         
                 
Outstanding, March 31, 2009  820,082  $32.39   3.63     
Granted  289,484  $58.44   7.75     
Exercised  (237,603) $24.64   2.49  $8,254 
Forfeited/Canceled               
                 
Outstanding, March 31, 2010  871,963  $43.15   4.51  $15,945 
                 
Vested and expected to vest, March 31, 2010  861,701  $43.10   4.50  $15,806 
                 
Exercisable, March 31, 2010  261,127  $31.92   2.49  $7,708 


90


QUALITY SYSTEMS, INC.
NOTES TO CONSOLIDATED FINANCIAL STATEMENTS — (Continued)
The Company continues to utilize the Black-Scholes valuation model for estimating the fair value of share-based compensation after the adoption of ASC 718 with the following assumptions:
       
  Year Ended March 31,
  2010 2009 2008
 
Expected life 4.42 - 4.75 years 4.01 years 3.75 - 4.01 years
Expected volatility 45.49% - 47.65% 42.00% - 46.70% 42.37% - 44.81%
Expected dividends 1.90% - 2.20% 2.90% - 3.50% 2.67% - 3.38%
Risk-free rate 0.82% - 2.41% 1.07% - 3.40% 2.46% - 5.09%
During the years ended March 31, 2010 and 2009, 289,484 and 298,331 options were granted, respectively, under the 2005 Plan. The Company issues new shares to satisfy option exercises. Based on historical experience of option cancellations, the Company has estimated an annualized forfeiture rate of 1.7% for employee options and 0.0% for director options. Forfeiture rates will be adjusted over the requisite service period when actual forfeitures differ, or are expected to differ, from the estimate. The weighted average grant date fair value of stock options granted during the years ended March 31, 2010, 2009 and 2008 was $19.30, $11.22 and $12.41 per share, respectively. The expected dividend yield is the average dividend rate during a period equal to the expected life of the option.
On February 8, 2008,16, 2010, the Board of Directors granted 25,000a total of 121,059 options under the Company’s 2005 Plan to selected employees at an exercise price equal to the market price of the Company’s common stock on the date of grant ($33.5156.95 per share). Of the total options, 118,059 options vest in five equal annual installments beginning February 16, 2011 and expire on February 16, 2018 and 3,000 options vest in two equal annual installments beginning February 16, 2011 and expire on February 16, 2013.
On December 7, 2009, the Board of Directors granted a total of 63,425 options under the Company’s 2005 Plan to selected employees at an exercise price equal to the market price of the Company’s common stock on the date of grant ($60.29 per share). The options vest in fourfive equal annual installments beginning February 8, 2009December 7, 2010 and expire on February 8, 2013.

December 7, 2017.

On November 5, 2007,30, 2009, the Board of Directors granted 6,000a total of 75,000 options under the Company’s 19982005 Plan, of which 53,000 were granted to selected employees and 22,000 options were granted as part of an earn-out provision relating to the acquisition of PMP (see Note 6), at an exercise price equal to the market price of the Company’s common stock on the date of grant ($59.49 per share). The options vest in five equal annual installments beginning November 30, 2010 and expire on November 30, 2017.
On September 17, 2009, the Board of Directors granted a total of 30,000 options under the Company’s 2005 Plan to an employee at an exercise price equal to the market price of the Company’s common stock on the date of grant ($33.2558.03 per share). The options vest in five equal annual installments beginning September 17, 2010 and expire on September 17, 2017.
On November 5, 2008, the Board of Directors granted a total of 80,141 options under the Company’s 2005 Plan to selected employees at an exercise price equal to the market price of the Company’s common stock on the date of grant ($42.20 per share). The options vest in four equal annual installments beginning November 5, 20082009 and expire on November 5, 2012.

2013.

On AugustSeptember 9, 2007,2008, the Board of Directors granted a total of 35,000 options under the Company’s 19982005 Plan to non-management directors pursuant to the Company’s previously announced compensation plan for non-management directors, at an exercise price equal to the market price of the Company’s common stock on the date of grant ($43.2645.61 per share). The options vest in four equal annual installments beginning AugustSeptember 9, 20082009 and expire on September 9, 2015.
On August 9, 2012.

On June 12, 2007,18, 2008, the Board of Directors granted a total of 159,50050,000 options under a previously approved performance-based equity incentive program for selected employees based on fiscal year 2007 performance. These shares were issued under the Company’s 1998 Stock Option2005 Plan to an employee at an exercise price equal to the market price of the Company’s common stock on the date of grant ($38.8340.08 per share). The options vest in four equal annual installments beginning June 12, 2008August 18, 2009 and expire on June 12, 2012.August 18, 2013.


91


QUALITY SYSTEMS, INC.
NOTES TO CONSOLIDATED FINANCIAL STATEMENTS — (Continued)
On September 20, 2006,August 11, 2008, the Board of Directors granted a total of 35,00025,000 options under the Company’s 1998 Plan to non-management directors pursuant to the Company’s previously announced compensation plan for non-management directors, at an exercise price equal to the market price of the Company’s common stock on the date of grant ($39.81 per share). The options vest in four equal annual installments beginning September 20, 2007 and expire on September 20, 2013.

On August 11, 2006, the Board of Directors granted a total of 40,000 options under the Company’s 19982005 Plan to selected employees at an exercise price equal to the market price of the Company’s common stock on the date of the grant ($37.0940.71 per share). The options vest in four equal annual installments beginning August 11, 20072009 and expire on August 11, 2011.

2013.

On July 25, 2006,June 13, 2008, the Board of Directors granted a total of 108,190 options under the Company’s 2005 Plan to selected employees at an exercise price equal to the market price of the Company’s common stock on the date of grant ($32.79 per share). The options vest in four equal annual installments beginning June 13, 2009 and expire on June 13, 2013.
Performance-Based Awards
On May 27, 2009, the Board of Directors approved a performance-basedits fiscal 2010 equity incentive program for employees to be awarded options to purchase the Company’s common stockstock. The maximum number of options available under the equity incentive program plan is 320,000, of which 105,000 are reserved for the Company’s Named Executive Officers and 215,000 for non-executive employees of the Company. Under the program, executives are eligible to receive options based on meeting certain target increases in earnings per share performance and revenue growth during fiscal year 2007.2010 and for one executive, a portion of the options is based on retention of employment status through the end of fiscal 2010. Under the program, the non-executive employees are eligible to receive options based on recommendation of senior management. The options shall be issued pursuant to one of the Company’s shareholder approved option plans, have an exercise price equal to the closing price of the Company’s shares on the date of grant, a term of eight years, vesting in five years, vest in four equal annual installments commencing one year following the date of grant. The maximumCompensation expense for the non-executive options will commence when granted. Compensation expense associated with the executive performance based awards are initially based on the number of options originally available underexpected to vest after assessing the performance-based equity incentive program plan was 115,000. On January 29, 2007, a committee comprisedprobability that certain performance criteria will be met. Cumulative adjustments are recorded quarterly to reflect subsequent changes in the estimated outcome of allperformance-related conditions. The Company utilized the independent directors ofBlack-Scholes option valuation model and the Board of Directors modified the Company’s previously approved performance based equity incentive program for employees. Modificationsrecorded stock compensation expense related to the program included an increase in the maximum number of options available under the program from 115,000 to 290,000 and revisions to certain revenue targets. Compensation expense of $425 for these optionsexecutive performance awards was recorded inapproximately $35 during the year ended March 31, 2007. A total of 159,500 options was granted during the quarter ended June 30, 20072010.
The following assumptions were utilized for performance based on the achievement of certain fiscal 2007 revenue and earnings per share performance targets included in the fiscal year 2007 equity incentive program.

On October 5, 2005, the Board of Directors granted a total of 124,000 stock optionsawards under the Company’s 1998 Plan to non-management directors pursuant to the Company’s previously announced compensation2010 incentive plan for non-management directors, at an exercise price equal to the market price of the Company’s common stock on the date of the grant ($34.065 per share). The options fully vested on January 5, 2006 and expire on October 5, 2012.

On August 8, 2005, the Board of Directors granted 19,000 options under the Company’s 1998 Plan to selected employees at an exercise price equal to the market price of the Company’s common stock on the date of the grant ($32.445 per share). The options vest in four equal annual installments beginning August 8, 2006 and expire on August 8, 2012.


A summary of stock option transactions during the years ended March 31, 2008, 2007 and 2006 is as follows:


Number of
Shares


Weighted
Average
Exercise Price


Weighted
Average
Remaining
Contractual
Life


Aggregate
Intrinsic Value
(in thousands)


Outstanding, March 31, 2005


2,169,444


$

13.89


Granted


143,000


$

33.85


Exercised


(486,772

)


$

9.20


$

11,169


Forfeited/Canceled


(27,300

)


$

12.37


Outstanding, March 31, 2006


1,798,372


$

16.78


Granted


75,000


$

38.36


Exercised


(411,414

)


$

14.74


$

10,393


Forfeited/Canceled


(8

)


$

3.25


Outstanding, March 31, 2007


1,461,950


$

18.46


Granted


225,500


$

38.78


4.31


Exercised


(325,266

)


$

14.64


2.48


$

4,955


Forfeited/Canceled


(58,450

)


$

21.12


3.33


Outstanding, March 31, 2008


1,303,734


$

22.81


3.40


$

12,220


Vested and expected to vest, March 31, 2008


1,293,863


$

22.79


3.40


$

12,143


Exercisable, March 31, 2006


471,297


$

20.88


Exercisable, March 31, 2007


520,650


$

20.32


Exercisable, March 31, 2008


654,298


$

19.90


3.26


$

7,127


The Company continues to utilize the Black-Scholes valuation model for estimating the fair value of share-based compensation after the adoption of SFAS 123R with the following assumptions:

Year Ended
March 31, 2008

Year Ended
March 31, 2007


Expected life

3.75 - 4.01 years

3.75 - 4.75 years

Expected volatility

42.37% - 44.81%

47.7% - 48.5%

Expected dividends

2.67% - 3.38%

2.05% - 2.36%

Risk-free rate

2.46% - 5.09%

4.53% - 5.09%

During the year ended March 31, 2008, 25,000 options were granted under the 2005 Plan and 200,500 were granted under the 1998 Plan. During the year ended March 31, 2007, 75,000 options were granted under the 1998 Plan. The Company issues new shares to satisfy2010:

Year Ended
March 31, 2010
Expected life4.42 years
Expected volatility45.49%
Expected dividends2.20%
Risk-free rate2.32%
Non-vested stock option exercises. Based on historical experience of option cancellations, the Company has estimated an annualized forfeiture rate of ranging from 1.2% to 1.5% foraward activity, including employee stock options and 0.0% for director options for the year ended March 31, 2008. Based on historical experience of option cancellations, the Company has estimated an annualized forfeiture rate of 1.2% for employee options and 0.0% for director options for the year ended March 31, 2007. The weighted average grant date fair value of stock options granted during the years ended March 31, 2008, 2007 and 2005 was $12.41, $14.33 and $15.23 per share, respectively. The expected dividend yield is the average dividend rate during a period equal to the expected life of the option.


Non-vested stock award activity includingperformance-based awards, for the year ended March 31, 20082010, is summarized as follows:


Non-vested
Number of
Shares


Weighted-Average
Grant Date Fair
Value per Share


Non-vested, April 1, 2007


941,300


$

7.89


Granted


225,500


$

12.41


Vested


(458,914

)

$

2.93


Forfeited/Canceled


(58,450

)

$

9.16


Non-vested, March 31, 2008


649,436


$

9.57


     Weighted
 
  Non-Vested
  Average
 
  Number of
  Fair Value
 
  Shares  Price 
 
Outstanding, April 1, 2009  465,345  $11.74 
Granted  289,484  $19.30 
Vested  (143,993) $12.03 
Forfeited/Canceled       
         
Outstanding, March 31, 2010  610,836  $15.26 
         
As of March 31, 2008, $4,7552010, $7,995 of total unrecognized compensation costs related to stock options is expected to be recognized over a weighted average period of 3.545.38 years. This amount does not include the cost of new options


92


QUALITY SYSTEMS, INC.
NOTES TO CONSOLIDATED FINANCIAL STATEMENTS — (Continued)
that may be granted in future periods noror any changes in the Company’s forfeiture percentage. The total fair value of options vested during years ended March 31, 2010, 2009 and 2008 was $1,732, $3,236 and $1,345, respectively.
Restricted Stock Units
On May 27, 2009, the Board of Directors approved its Outside Director Compensation Plan, whereby each non-employee Director is to be awarded shares vestedof restricted stock units upon election or re-election to the Board. The restricted stock units are awarded under the 2005 Plan. Such restricted units vest in two equal, annual installments on the first and second anniversaries of the grant date and are nontransferable for one year following vesting. Upon each vesting of the award, two shares of common stock shall be issued for each restricted stock unit. The Company estimated the fair value of the restricted stock units using the market price of its common stock on the date of the grant ($53.86 per share on August 13, 2009, the grant date). The fair value of these restricted units is amortized on a straight-line basis over the vesting period. As of March 31, 2010, 8,000 restricted units were issued and approximately $136 of compensation expense was recorded under this Plan during the year ended March 31, 2008 was $1,345.

11. Commitments and Contingencies

Litigation. The Company has experienced legal claims by parties asserting2010.

As of March 31, 2010, $295 of total unrecognized compensation costs related to restricted stock units is expected to be recognized over a weighted average period of 1.37 years. This amount does not include the cost of new restricted stock units that it has infringed their intellectual property rights. The Company believes that these claims are not material, are without merit, and the Company intends to defend against them vigorously. However, litigation is inherently uncertain, always difficult to predict, and the impact that these claims may have onbe granted in future periods or any changes in the Company’s business, results of operations and financial condition cannot be accurately ascertained at this time. The Company could incur substantial costs and diversion of management resources defending any infringement claim - even if it is ultimately successful inforfeiture percentage. During the defense of such matters.

year ended March 31, 2010, no restricted stock units became vested.

14.  Commitments, Guarantees and Contingencies
Rental Commitments.Commitments
The Company leases facilities and offices under irrevocable operating lease agreements expiring at various dates through May 20132017 with rent escalation clauses. Rent expense related to these leases is recognized on a straight-line basis over the lease terms. Rent expense for the years ended March 31, 2010, 2009 and 2008 2007was $4,264, $3,560 and 2006 was $2,737, $2,329 and $1,634, respectively. Rental commitments under these agreements are as follows:


Year Ending March 31,


2009


$

3,156


2010


3,131


2011


3,164


2012


1,716


2013 and beyond


942


$

12,109


Year Ended March 31,    
2011 $4,413 
2012  4,565 
2013  4,577 
2014  3,963 
2015 and beyond  7,215 
     
  $24,733 
     
Commitments and Guarantees.Guarantees
Software license agreements in both the QSI and NextGen Divisions include a performance guarantee that the Company’s software products will substantially operate as described in the applicable program documentation for a period of 365 days after delivery. To date, the Company has not incurred any significant costs associated with theseits performance guarantee or other related warranties and does not expect to incur significant warranty costs in the future. Therefore, no accrual has been made for potential costs associated with these warranties. Certain arrangements also include performance guarantees related to response time, availability for operational use, and other performance-related guarantees. Certain arrangements also include penalties in the form of maintenance credits should the performance of the software fail to meet the performance guarantees. To date, the Company has not incurred any significant costs associated with these warranties and does not expect to incur significant warranty costs in the future. Therefore, no accrual has been made for potential costs associated with these warranties.


93


QUALITY SYSTEMS, INC.
NOTES TO CONSOLIDATED FINANCIAL STATEMENTS — (Continued)
The Company has historically offered short-term rights of return in certain sales arrangements. If the Company is able to estimate returns for these types of arrangements and all other criteria for revenue recognition have been met, revenue is recognized and these arrangements are recorded in the consolidated financial statements.Consolidated Financial Statements. If the Company is unable to estimate returns for these types of arrangements, revenue is not recognized in the consolidated financial statementsConsolidated Financial Statements until


the rights of return expire, provided also, that all other criteria of revenue recognition have been met.

The Company’s standard sales agreements in the NextGen Division contain an indemnification provision pursuant to which it shall indemnify, hold harmless, and reimburse the indemnified party for losses suffered or incurred by the indemnified party in connection with any United States patent, any copyright or other intellectual property infringement claim by any third party with respect to its software. The QSI Dental Division arrangements occasionally utilize this type of language as well. As the Company has not incurred any significant costs to defend lawsuits or settle claims related to these indemnification agreements, the Company believes that its estimated exposure on these agreements is currently minimal. Accordingly, the Company has no liabilities recorded for these indemnification obligations.

From time to time, the Company offers future purchase discounts on its products and services as part of its sales arrangements. Discounts which are incremental to the range of discounts reflected in the pricing of the other elements of the arrangement, which are incremental to the range of discounts typically given in comparable transactions, and which are significant, are treated as an additional element of the contract to be deferred. Amounts deferred related to future purchase options are not recognized until either the customer exercises the discount offer or the offer expires.

The Company has entered into marketing assistance agreements with existing users of the Company’s products which provide the opportunity for those users to earn commissions if and only if they host specific site visits upon the Company’s request for prospective customers whichthat directly result in a purchase of the Company’s software by the visiting prospects. Amounts earned by existing users under this program are treated as a selling expense in the period when earned.

12. Fair Value of Financial InstrumentsLitigation

The Company’s financial instruments include cash and cash equivalents, marketable securities, accounts receivable, accounts payable, deferred revenue and accrued liabilities. ManagementCompany has experienced certain legal claims by parties asserting that it has infringed certain intellectual property rights. The Company believes that these claims are without merit and the fair valueCompany has defended them vigorously. However, in order to avoid the further legal costs and diversion of cash and cash equivalents, accounts receivable, accounts payable, deferred revenue, and accrued liabilities approximate their carrying values duemanagement resources it is reasonably possible that a settlement may be reached which could result in a liability to the short-term nature of these instruments.

Marketable securities are recordedCompany. However, at fair value, based on quoted market rates or on valuation analysis when appropriate,this time it is not possible to estimate with unrealized gains and losses reflectedreasonable certainty what amount, if any, may be incurred as a separate componentresult of shareholders’ equity titled accumulated other comprehensive income (loss), net of tax, until realized or until a determinationsettlement. Litigation is made that an other-than-temporary decline in market value has occurred (see also Notes 2inherently uncertain and 4).

13. Operating Segment Information

always difficult to predict.

15.  Operating Segment Information
The Company has prepared operating segment information in accordance with SFAS 131 “Disclosures About Segments of an Enterprise and Related Information”ASC 280 to report components that are evaluated regularly by its chief operating decision maker, or decision making group, in deciding how to allocate resources and in assessing performance. Reportable
As a result of certain organizational changes, the composition of the Company’s NextGen Division was revised to exclude the former NextGen Practice Solutions unit and the Company’s RCM entities (HSI and PMP), both of which are now administered and aggregated in the Company’s Practice Solutions Division. Following the reorganization, the Company now operates three reportable operating segments include(not including Corporate), comprised of the NextGen Division, the QSI Dental Division and the QSIPractice Solutions Division.

The two divisions operate largely as stand-alone operations, with each division maintaining its own distinct product lines, product platforms, development, implementation and support teams, sales staffing, and branding. The two divisions share the resources of

Prior period segment results were revised to reflect this reorganization for the Company’s “corporate office” which includes a varietyNextGen Division and Practice Solution Division. The results of accountingoperations related to the HSI and other administrative functions. Additionally, therePMP acquisitions are a small numberincluded in the Practice Solutions Division. The results of clients whooperations related to the Opus and Sphere acquisitions are simultaneously utilizing software from each ofincluded in the Company’s two divisions.

NextGen Division.

The QSI Dental Division, co-located with the Company’s Corporate Headquarters in Irvine, California, currently focuses on developing, marketing and supporting software suites sold to dental and certain niche medical practices. In addition, the divisionDivision supports a number of medical clients that utilize the division’sDivision’s UNIXa based medical practice management software product.


94


QUALITY SYSTEMS, INC.
NOTES TO CONSOLIDATED FINANCIAL STATEMENTS — (Continued)
The NextGen Division, with headquarters in Horsham, Pennsylvania, and a second significant locationlocations in Atlanta, Georgia and Austin, Texas, focuses principally on developing and marketing products and services for medical practices.

The Practice Solutions Division, with locations in St. Louis, Missouri and Hunt Valley, Maryland, focuses primarily on providing physician practices with RCM services, primarily billing and collection services for medical practices. This Division combines a web-delivered SaaS model and the NextGenepm software platform to execute its service offerings.
The three Divisions operate largely as stand-alone operations, with each Division maintaining its own distinct product lines, product platforms, development, implementation and support teams, sales staffing and branding. The three Divisions share the resources of the Company’s “corporate office” which includes a variety of accounting and other administrative functions. Additionally, there are a small but growing number of clients who are simultaneously utilizing software or services from more than one of its three Divisions.
The accounting policies of the Company’s operating segments are the same as those described in Note 2 - Summaryof the Consolidated Financial Statements, “Summary of Significant Accounting Policies, except that the disaggregated financial results of the segments reflect allocation of certain functional expense categories consistent with the basis and manner in which Company management internally disaggregates financial information for the purpose of assisting in making internal operating decisions. Certain


a UNIX is a registered trademark of the AT&T Corporation.


corporate overhead costs, such as executive and accounting department personnel-related expenses, are not allocated to the individual segments by management. Management evaluates performance based on stand-alone segment operating income. Because the Company does not evaluate performance based on return on assets at the operating segment level, assets are not tracked internally by segment. Therefore, segment asset information is not presented.

Operating segment data foris as follows:
             
  March 31,
  March 31,
  March 31,
 
  2010  2009  2008 
 
Revenue:            
QSI Dental Division $17,128  $15,851  $16,037 
NextGen Division  231,621   203,954   170,463 
Practice Solutions Division  43,062   25,710    
             
Consolidated revenue $291,811  $245,515  $186,500 
             
Operating income:            
QSI Dental Division $3,460  $3,385  $3,662 
NextGen Division  88,108   81,323   66,558 
Practice Solutions Division  2,314   2,455    
Unallocated corporate expense  (18,158)  (14,760)  (10,831)
             
Consolidated operating income $75,724  $72,403  $59,389 
             
All of the three years endedrecorded goodwill at March 31, was as follows:2010 relates to the Company’s NextGen Division and Practice Solutions Division. As a result of the reorganization discussed above, the goodwill relating to the fiscal year 2009 acquisitions of HSI and PMP is now recorded in the Practice Solutions Division. The goodwill relating to the acquisitions of Opus and Sphere is recorded in the NextGen Division.


95


QSI Division


NextGen
Division


Unallocated
Corporate
Expenses


Consolidated


2008


Revenue:


$

16,037


$

170,463


$


$

186,500


Operating income (loss):


3,662


66,558


(10,831

)


59,389


2007


Revenue:


16,589


140,576


157,165


Operating income (loss):


4,391


56,317


(9,830

)


50,878


2006


Revenue:


15,544


103,743


119,287


Operating income (loss):


$

3,610


$

40,245


$

(8,037

)

$

35,818


14. Customer Concentration

No customer represented more than 10% of gross accounts receivable as of March 31, 2008. One customer represented approximately 12.5% of total gross accounts receivable as of March 31, 2007.


15. Subsequent Events

QUALITY SYSTEMS, INC.
NOTES TO CONSOLIDATED FINANCIAL STATEMENTS — (Continued)
16.  Subsequent Events
On May 16, 2008, the Company entered into an agreement to acquire Lackland Acquisition II, LLC dba Healthcare Strategic Initiatives (HSI), a full-service healthcare revenue management company servicing healthcare clients. The acquisition was made under the terms of an Agreement and Plan of Merger resulting in HSI becoming a wholly owned subsidiary of QSI. The closing of the HSI acquisition occurred on May 20, 2008. The purchase price consists of approximately $15,400 plus up to approximately $1,650 in incentives tied to future performance. The $15,400 consists of approximately equal parts of cash and restricted QSI common stock, subject to restrictions on resale lapsing over a two year period.

On May 29, 2008,26, 2010, the Board declaredof Directors approved a quarterly cash dividend of $0.25$0.30 per share on the Company’s outstanding shares of common stock, payable to shareholders of record as of June 13, 200817, 2010 with an anticipatedexpected distribution date of July 2, 2008. The Company anticipates that future quarterly dividends, if and when declared by the Board pursuant to this policy, would likely be distributable on or about the fifth day of each of the months of October, January, April and July subject to review by the Board of Directors.

16. Selected Quarterly Operating Results (unaudited)

6, 2010.

17.  Selected Quarterly Operating Results (unaudited)
The following table presents quarterly unaudited consolidated financial information for the eight quarters in the period ended March 31, 2008.2010. Such information is presented on the same basis as the annual information presented in the accompanying consolidated financial statements.Consolidated Financial Statements. In management’s opinion, this information reflects all adjustments that are necessary for a fair presentation of the results for these periods.
                                 
  Quarter Ended 
  06/30/08  09/30/08  12/31/08  03/31/09  06/30/09  09/30/09  12/31/09  03/31/10 
  (Unaudited) 
 
Revenues:                                
Software, hardware and supplies $21,369  $21,297  $22,336  $20,384  $17,776  $22,856  $24,346  $24,783 
Implementation and training services  3,585   3,486   2,675   3,629   3,457   3,380   3,313   4,226 
                                 
System sales  24,954   24,783   25,011   24,013   21,233   26,236   27,659   29,009 
Maintenance  17,136   17,234   19,152   19,340   21,640   21,475   22,139   23,938 
Electronic data interchange services  6,670   6,985   8,008   7,859   8,161   8,796   8,897   9,181 
Revenue cycle management and related services  1,957   4,527   6,835   8,112   8,992   8,888   9,602   9,183 
Other services  4,507   5,452   6,473   6,507   6,612   6,303   6,665   7,202 
                                 
Maintenance, EDI, RCM and other services  30,270   34,198   40,468   41,818   45,405   45,462   47,303   49,504 
                                 
Total revenues  55,224   58,981   65,479   65,831   66,638   71,698   74,962   78,513 
                                 
Cost of revenue:                                
Software, hardware and supplies  3,486   3,395   3,030   3,273   2,704   3,737   2,810   2,864 
Implementation and training services  3,015   2,626   2,143   2,502   2,881   3,296   2,898   2,908 
                                 
Total cost of system sales  6,501   6,021   5,173   5,775   5,585   7,033   5,708   5,772 
Maintenance  3,082   2,947   2,826   3,004   3,025   3,255   3,392   3,667 
Electronic data interchange services  4,891   5,256   5,541   5,686   5,890   6,164   6,525   6,683 
Revenue cycle management and related services  1,305   3,132   4,475   5,762   6,522   6,856   7,124   7,213 
Other services  3,448   3,866   5,085   5,114   4,867   5,003   5,560   4,963 
                                 
Total cost of maintenance, EDI, RCM and other services  12,726   15,201   17,927   19,566   20,304   21,278   22,601   22,526 
                                 
Total cost of revenue  19,227   21,222   23,100   25,341   25,889   28,311   28,309   28,298 
                                 
Gross profit  35,997   37,759   42,379   40,490   40,749   43,387   46,653   50,215 


96


QUALITY SYSTEMS, INC.

COMPARISON BY QUARTERNOTES TO CONSOLIDATED FINANCIAL STATEMENTS — (Continued)


Quarter Ended (Unaudited)


6/30/2006


9/30/2006


12/31/2006


3/31/2007


6/30/2007


9/30/2007


12/31/2007


3/31/2008


Revenue:


Software, hardware and supplies


$

15,029


$

16,737


$

16,088


$

21,017


$

16,739


$

18,514


$

20,591


$

20,519


Implementation and training


2,954


2,848


2,885


3,490


3,248


3,182


3,115


3,861


Total System sales


17,983


19,585


18,973


24,507


19,987


21,696


23,706


24,380


Maintenance


9,399


9,639


11,069


11,841


12,559


13,442


14,861


15,593


EDI


3,977


4,066


4,290


4,716


5,024


5,406


5,739


6,281


Other services


4,715


4,169


4,164


4,072


4,462


4,602


3,784


4,978


Total Maintenance, EDI and Other services


18,091


17,874


19,523


20,629


22,045


23,450


24,384


26,852


Total revenue


36,074


37,459


38,496


45,136


42,032


45,146


48,090


51,232


Cost of revenue:


Software, hardware and supplies


1,689


1,723


1,798


3,243


2,488


2,477


2,984


2,938


Implementation and training


1,963


2,154


2,169


2,249


2,409


2,423


2,638


2,871


Total cost of system sales


3,652


3,877


3,967


5,492


4,897


4,900


5,622


5,809


Maintenance


3,137


2,792


3,058


2,847


3,127


3,033


3,131


3,155


EDI


2,780


2,926


3,144


3,331


3,509


3,742


4,162


4,363


Other services


1,888


2,238


2,528


3,127


3,009


3,100


3,233


3,709


Total cost of Maintenance, EDI and Other services


7,805


7,956


8,730


9,305


9,645


9,875


10,526


11,227


Total cost of revenue


11,457


11,833


12,697


14,797


14,542


14,775


16,148


17,036


Gross profit


24,617


25,626


25,799


30,339


27,490


30,371


31,942


34,196


Selling, general and administrative


10,200


9,994


10,593


14,550


12,643


13,188


13,283


14,146


Research and development


2,318


2,591


2,601


2,656


2,800


2,688


2,874


2,988


Income from operations


12,099


13,041


12,605


13,133


12,047


14,495


15,785


17,062


Interest income


667


819


935


885


739


645


710


567


Other income


953


Income before provision for income taxes


12,766


13,860


13,540


14,018


12,786


15,140


17,448


17,629


Provision for income taxes


5,097


5,523


4,819


5,513


4,846


5,468


6,234


6,377


Net income


$

7,669


$

8,337


$

8,721


$

8,505


$

7,940


$

9,672


$

11,214


$

11,252


Net income per share – basic*


$

0.29


$

0.31


$

0.32


$

0.31


$

0.29


$

0.35


$

0.41


$

0.41


Net income per share – diluted*


$

0.28


$

0.30


$

0.32


$

0.31


$

0.29


$

0.35


$

0.40


$

0.41


Weighted average shares outstanding – basic


26,714


26,802


26,966


27,049


27,134


27,287


27,362


27,408


Weighted average shares outstanding – diluted


27,232


27,380


27,507


27,600


27,657


27,718


27,696


27,712


  Quarter Ended 
  06/30/08  09/30/08  12/31/08  03/31/09  06/30/09  09/30/09  12/31/09  03/31/10 
  (Unaudited) 
 
Operating expenses:                                
Selling, general and administrative  15,182   18,000   18,276   17,952   20,093   20,061   21,574   25,223 
Research and development costs  3,119   3,342   3,624   3,692   3,977   4,346   3,954   4,269 
Amortization of acquired intangible assets  70   283   325   357   357   367   377   682 
                                 
Total operating expenses  18,371   21,625   22,225   22,001   24,427   24,774   25,905   30,174 
                                 
Income from operations  17,626   16,134   20,154   18,489   16,322   18,613   20,748   20,041 
Interest income  374   340   328   161   78   59   43   46 
Other income           (279)  58      136   74 
                                 
Income before provision for income taxes  18,000   16,474   20,482   18,371   16,458   18,672   20,927   20,161 
Provision for income taxes  6,886   5,975   7,332   7,015   6,112   6,852   7,775   7,100 
                                 
Net income $11,114  $10,499  $13,150  $11,356  $10,346  $11,820  $13,152  $13,061 
                                 
Net income per share:                                
Basic* $0.40  $0.38  $0.46  $0.40  $0.36  $0.41  $0.46  $0.45 
Diluted* $0.40  $0.37  $0.46  $0.40  $0.36  $0.41  $0.46  $0.45 
Weighted average shares outstanding:                                
Basic  27,465   27,930   28,340   28,393   28,492   28,597   28,667   28,784 
Diluted  27,771   28,211   28,473   28,526   28,635   28,742   28,833   28,929 
Dividends declared per common share $0.25  $0.30  $0.30  $0.30  $0.30  $0.30  $0.30  $0.30 

*

Will

Quarterly EPS will not addsum to annual EPS due to rounding

97


Schedule II — Valuation and Qualifying Accounts

ALLOWANCE FOR DOUBTFUL ACCOUNTS
(in thousands)


For the Year Ended


Balance at
Beginning of
Year


Additions
Charged to
Costs and
Expenses


Deductions


Balance at End
of Year


March 31, 2008


$

2,438


$

1,171


$

(1,081

)

$

2,528


March 31, 2007


$

2,556


$

1,480


$

(1,598

)

$

2,438


March 31, 2006


$

1,837


$

1,181


$

(462

)

$

2,556


  Balance at
 Additions
   Balance at
  Beginning of
 Charged to Costs
   End of
  Year and Expenses Deductions Year
  (In thousands)
 
For the Year Ended                
March 31, 2010 $3,877  $3,465  $(2,853) $4,489 
March 31, 2009 $2,528  $2,089  $(740) $3,877 
March 31, 2008 $2,438  $1,171  $(1,081) $2,528 
ALLOWANCE FOR INVENTORY OBSOLESCENSEOBSOLESCENCE
                 
  Balance at
 Additions
   Balance at
  Beginning of
 Charged to Costs
   End of
  Year and Expenses Deductions Year
  (In thousands)
 
For the Year Ended                
March 31, 2010 $210  $27  $  $237 
March 31, 2009 $223  $  $(13) $210 
March 31, 2008 $324  $52  $(153) $223 


(in thousands)98


For the Year Ended


Balance at
Beginning of
Year


Additions
Charged to
Costs and
Expenses


Deductions


Balance at End
of Year


March 31, 2008


$

324


$

52


$

(153

)

$

223


March 31, 2007


$

304


$

35


$

(15

)

$

324


March 31, 2006


$

146


$

179


$

(21

)

$

304


INDEX TO EXHIBITS ATTACHED TO THIS REPORT
     
Exhibit
  
Number
 
Description
 
 10.36 Agreement and Plan of Merger dated February 10, 2010, by and among Quality Systems, Inc., OHS Merger Sub, Inc., Opus Healthcare Solutions, Inc., and the Shareholders of Opus Healthcare Solutions, Inc.
 10.37 Sixth Amendment to Lease Agreement between the Company and Tower Place, L.P. dated April 1, 2010.
 10.38 Third Amendment to Office Lease agreement between the Company and HUB Properties LLC dated January 1, 2010.
 10.39 Fourth Amendment to Office Lease agreement between the Company and HUB Properties LLC dated March 17, 2010.
 10.40 Third Amendment to Service Center Lease Agreement between the TM Properties, LLC, successor to the Lincoln National Life Insurance Company and Lackland Acquisition II, LLC, dated March 15, 2010.
 10.41 Second Amendment to Lease Agreement between Hill Management Services, Inc. and Practice Management Partners, Inc., dated November 1, 2009.
 10.42 Modification of Lease #1 between Olen Commercial Realty Corp. and NXG Acute Care LLC, dated October 13, 2009.
 10.43 Lease between Olen Commercial Realty Corp. and NXG Acurate Care LLC, dated October 1, 2009.
 10.44 Sublease Agreement between Centex Homes and Opus Healthcare Solutions, Inc., dated February   , 2009.
 21  List of subsidiaries.
 23.1 Consent of Independent Registered Public Accounting Firm — PricewaterhouseCoopers LLP.
 23.2 Consent of Independent Registered Public Accounting Firm — Grant Thornton LLP.
 31.1 Certification of Principal Executive Officer Required byRule 13a-14(a) of the Securities Exchange Act of 1934, as amended, as Adopted Pursuant to Section 302 of the Sarbanes-Oxley Act of 2002.
 31.2 Certification of Principal Financial Officer Required byRule 13a-14(a) of the Securities Exchange Act of 1934, as amended, as Adopted Pursuant to Section 302 of the Sarbanes-Oxley Act of 2002.
 32.1 Certification of Chief Executive Officer and Chief Financial Officer Pursuant to 18 U.S.C. Section 1350, as Adopted Pursuant to Section 906 of the Sarbanes-Oxley Act of 2002.


99

EXHIBIT
NUMBER

DESCRIPTION


10.27

Agreement and Plan of Merger dated May 16, 2008 by and among Quality Systems, Inc., Bud Merger Sub, LLC and Lackland Acquisition II, LLC.

10.28

Office lease between the Company and LAKESHORE TOWERS LIMITED PARTNERSHIP PHASE II, a California limited partnership, dated October 18, 2007.

10.29

Standard Service Center Lease Agreement between the Lincoln National Life Insurance Company and Lackland Acquisition II, LLC, dated November 28, 2001.

10.30First Amendment to Standard Service Center Lease Agreement between the Lincoln National Life Insurance Company and Lackland Acquisition II, LLC, dated August 17, 2005.
10.31Standard Service Center Lease Agreement between the Lincoln National Life Insurance Company and InfoNow Solutions of St. Louis, LLC, dated November 28, 2001.
10.32Second Amendment to Service Center Lease Agreement between TM Properties, LLC, successor to the Lincoln National Life Insurance Company and Lackland Acquisition II, LLC, dated August 17, 2005.
10.33Assignment of Lease between InfoNow Solutions of St. Louis, Lackland Acquisition II, LLC, and TM Properties, LLC, dated August 17, 2005.

21

List of Subsidiaries

23

Consent of Independent Registered Public Accounting Firm – Grant Thornton LLP

31.1

Certification of Principal Executive Officer Required by Rule 13a-14(a) of the Securities Exchange Act of 1934, as amended, as Adopted Pursuant to Section 302 of the Sarbanes-Oxley Act of 2002

31.2

Certification of Principal Financial Officer Required by Rule 13a-14(a) of the Securities Exchange Act of 1934, as amended, as Adopted Pursuant to Section 302 of the Sarbanes-Oxley Act of 2002

32.1

Certification of Chief Executive Officer and Chief Financial Officer Pursuant to 18 U.S.C. Section 1350, as Adopted Pursuant to Section 906 of the Sarbanes-Oxley Act of 2002.

79