2
2011 ANNUAL REPORT ON FORM 10-KFor the Fiscal Year Ended March 31, 2009INDEX
QSI Dental Division, NextGen Division, Inpatient Solutions Division and Practice Solutions Division.
Divisions.
The NextGen Division, with headquarters in Horsham, Pennsylvania, and significant locations in Atlanta, Georgia, St. Louis, Missouri and Hunt Valley, Maryland, focuses principally on developing and marketing products and services for medical practices.
Both divisionsDivisions develop and market practice management software that is designed to automate and streamline a number of the administrative functions required for operating a medical or dental practice. Examples of practice management software functions include scheduling and billing capabilities. Itcapabilities, and it is important to note that in both the medical and dental environments, practice management software systems have already been implemented by the vast majority of practices. Therefore, we actively compete for the replacement market.
In addition, both divisionsthe QSI Dental and NextGen Divisions develop and market software that automates theautomate patient record. Adoption rates for this software, commonly referred to as clinical software, are relatively low.records in both a practice and hospital setting. Therefore, we are typically competing to replace paper-based patient record alternatives as opposed to replacing previously purchased systems.
3
Electronic Data Interchange (“EDI”)/connectivity products
| Segment Revenue Breakdown | Segment Revenue Growth | |||||||||||||||||||||||
| Fiscal Year Ended March 31, | Fiscal Year Ended March 31, | |||||||||||||||||||||||
| 2011 | 2010 | 2009 | 2011 | 2010 | 2009 | |||||||||||||||||||
| QSI Dental Division | 5.7 | % | 5.9 | % | 6.5 | % | 16.6 | % | 8.1 | % | (1.2 | )% | ||||||||||||
| NextGen Division | 75.3 | % | 78.3 | % | 83.0 | % | 16.5 | % | 12.1 | % | 19.6 | % | ||||||||||||
| Inpatient Solutions Division (1) | 5.1 | % | 1.0 | % | 0.0 | % | 519.1 | % | N/A | N/A | ||||||||||||||
| Practice Solutions Division (2) | 13.9 | % | 14.8 | % | 10.5 | % | 13.7 | % | 67.5 | % | N/A | |||||||||||||
| Consolidated | 100.0 | % | 100.0 | % | 100.0 | % | 21.1 | % | 18.9 | % | 31.6 | % | ||||||||||||
| (1) | Inpatient Solutions Division consists of two acquisitions, Opus and NextGen IS, acquired in February 2010 and August 2009, respectively. | |
| (2) | Practice Solutions Division consists of two acquisitions, HSI and PMP, acquired in May 2008 and October 2008, respectively. |
The NextGen Division also offers RCM services under the Practice Solutions name. Services provided through the Practice Solutions/RCM unit consist primarily of billing and collections services for medical practices. The Practice Solutions unit utilizes NextGen Enterprise Practice Management software to a significant extent.
product.
OurThe NextGen Division, developswith headquarters in Horsham, Pennsylvania and sells proprietary electronic medical records softwaresignificant locations in Atlanta, Georgia and practice management systems underAustin, Texas, provides integrated clinical, financial and connectivity solutions for ambulatory and dental provider organizations.
| • | NextGen Electronic Health Records (“NextGenehr”) to ensure complete, accurate documentation to manage patient care electronically and to improve clinical processes and patient outcomes with electronic charting at the point of care; | ||
| • | NextGen Practice Management (“NextGenpm”) to automate business processes, from front-end scheduling to back-end collections and financial and administrative processes for increased performance and efficiencies; | ||
| • | NextGen Dashboard, which allows providers to view patient data in a visually rich graphical format. Using bar charts, pie charts, gauges and more, the system displays information at the practice or single provider level; | ||
| • | NextGen Mobile improves patient care through anytime, anywhere access of patient data. In addition, Mobile has the capability to increase revenue by easily capturing charges at the point of care resulting in potential reduction of medical liability through better documentation of out-of-office actions; and | ||
| • | NextGen NextPen is a revolutionary digital pen that quickly captures data into NextGen Ambulatory EHR. NextPen captures structured data and graphic drawings as part of the patient record without scanning or transcription. This technology requires no learning curve for adoption. |
4
| • | NextGen Health Information Exchange (“HIE”), formerly Community Health Solution, to exchange patient data securely with community healthcare organizations; | ||
| • | NextGen Patient Portal (“NextMD.com”) to communicate with patients online and import information directly into NextGenehr; and | ||
| • | NextGen Health Quality Measures (“HQM”) to allow seamless quality measurement and reporting for practice and physician performance initiatives. |
We continue to pursue product enhancement initiatives within each division. The majority of such expenditures are currently targeted to
Inclusive of divisional maintenance, EDI and RCM revenue, the NextGen Division accounted for approximately 93.5% of our revenue for fiscal year 2009 compared to 91.4% in fiscal year 2008. Inclusive of divisional maintenance and EDI revenue, the QSI Division accounted for approximately 6.5% and 8.6% of revenue in fiscal year 2009 and 2008, respectively. The NextGen Division’s revenue grew 34.7% and 21.3% in fiscal year 2009 and 2008, respectively, while the QSI Division’s revenue decreased by 1.2% and decreased by 3.3% in fiscal year 2009 and 2008, respectively, over the prior year.
include:
| • | EDI services that are intended to automate the entire patient statement process, reducing labor and printing costs associated with producing statements in house. In addition,
| ||
| • | Hosting services that allow practices seeking the benefits of IT automation but not the maintenance of in-house hardware and networking; | ||
| • | NextGuard — Data Protection services that provide an off-site, data archiving, restoration and disaster recovery preparedness solution for practices to protect clinical and financial data; | ||
| • | Consulting services, such as strategic governance models and operational transformation, technical consulting such as data conversions or interface development, that also allow practices to build custom add-on features; Physician Consulting Resources, services that allow practices to consult with the NextGen Division’s physician team; and eHealth consulting services that assist in connecting communities of practice for data sharing. |
RCM services.services, primarily billing and collection services for medical practices. This divisionDivision combines a web-delivered Software as a Service, orWeb-delivered SaaS model and the NextGenepmpm software platform to execute its service offerings. Clients may also deployExecution of the plan to transition our client base onto the NextGenehr as part of their platform is under execution. The Practice Solutions implementation.
Division provides technology solutions and consulting services to cover the full spectrum of providers’ revenue cycle needs from patient access through claims denials.
5
health systems consist of:
| • | NextGen Clinicals, which resides on an advanced truly active web 2.0 platform — and is designed to initiate widespread work efficiency and communication, reduce errors and time-to-chart, and improve care; and | ||
| • | NextGen Financials, which is a financial and administrative system that helps hospitals significantly improve the smart operations and financial and regulatory management of their facilities. |
well positioned to aid physicians and hospitals with their EHR decisions as they prepare to make incentive-based purchases.
Our Strategy
• |
| Continue development and enhancement of select software solutions in target markets; | |
|
| Continue investments in our infrastructure including, but not limited to, | |
|
| Continue investment in product development, which includes developing a new integrated inpatient and outpatient, web-based software platform; | |
| • | Continue efforts to make infrastructure investments within an overall context of maintaining reasonable expense discipline; |
6
• | Addition of new | ||
|
| Expand our relationship with existing | |
| • | Continue our gold standard commitment of service in support of our client satisfaction programs. |
and Services
We offer both standard licenses and SaaS arrangements in our software offerings; although to date, SaaS arrangements have represented less than 5% of our arrangements.
| • | Data captured using user-customizable input “templates”; | ||
| • | Scanned or electronically acquired images, including X-rays and photographs; | ||
| • | Data electronically acquired through interfaces with clinical instruments or external systems; | ||
| • | Other records, documents or notes, including electronically captured handwriting and annotations; and | ||
| • | Digital voice recordings. |
7
NextGenepm is
We also offer a practice management solution for dental practices and an electronic health records and practice management system for medical practices through the Internet (software as a service). These products are marketed under the QSINet and NextGenweb trade names, respectively.
Clinical Systems. Ouroffering, our dental charting software system, the Clinical Product Suite (CPS),CPS is a comprehensive solution designed specifically for the dental group practice environment. CPS integrates the dental practice management product with a computer-based clinical information system that incorporates a wide range of clinical tools, including:
|
|
|
|
|
|
|
|
|
|
|
|
The result is a comprehensive clinical information management system that helps practices save time, reduce costs, improve case presentation and enhance the delivery of dental services and quality of care. Clinical information is managed and maintained electronically thus forming an electronic patient record that allows for the implementation of the “chartless” office.
NextGen provides
| • | Electronic claims submission service that submits Health Insurance Portability and Accountability Act of 1996 (“HIPAA”) compliant insurance claims electronically to insurance payors; | ||
| • | Electronic remittance and payment posting service that uses NextGen Document Management system to link an image of each explanation of benefit (“EOB”) to the corresponding encounter at the time of payment posting to minimizes the need for storage of paper EOBs; and | ||
| • | Accounts receivable follow-up methodology that allows practices to establish parameters, adjustment rules and standards for account elevation. |
NextGenehr was developed with client-server architecture and a GUI and utilizes Microsoft Windows 2000, Windows NT or Windows XP on each workstation and either Windows 2000, Windows NT, Windows XP or UNIX on the database server. NextGenehr maintains data using industry standard relational database engines such as Microsoft SQL Server or Oracle. The system is scalable from one to thousands of workstations.
NextGenehr stores and maintains clinical data including:
| • | Electronic claims submission through our relationships with a number of payors and national claims clearinghouses; | ||
|
| ||
| • | Electronic patient statement processing, appointment reminder cards and calls, recall cards, patient letters and other correspondence; | ||
|
| ||
| • | Electronic insurance eligibility verification; and | ||
|
| ||
• |
| ||
|
|
NextGenehr also offers a workflow module, prescription management, automatic document and letter generation, patient education, referral tracking, interfaces to billing and lab systems, physician alerts and reminders, and powerful reporting and data analysis tools. NextGen Express is a version of NextGenehr designed for small practices.
NextGen also markets RCM services through our Practice Solutions unit. This service provides billing services to solo and group practices.
Connectivity Services. We make available EDI capabilities and connectivity services to our customers. The EDI/connectivity capabilities encompass direct interfaces between our products and external third party systems, as well as transaction-based services. Services include:
|
|
|
|
|
|
|
|
Revenue Cycle Management Services. Our NextGen Practice Solutions unit offers RCM services to physicians. On May 20, 2008, we acquired HSI, a full-service healthcare RCM company servicing the RCM needs of physician groups and a variety of other healthcare clients. HSI has historically and primarily focused on assisting its clients in increasing the accuracy and speed of client billing and collections activities. On October 28, 2008, we acquired PMP, a full-service healthcare RCM company. Founded in 2001, PMP provides physician billing and technology management services to healthcare providers, primarily in the Mid-Atlantic region.
Internet Applications. Our NextGen Division maintains an Internet-based patient health portal, NextMD.com.NextGen Patient Portal. NextMD.com is athe URL for our vertical portal for the healthcare industry, linking patients with their physicians, while providing a centralized source of health-oriented information for both consumers and medical professionals. Patients whose physicians are linked to the portal are able to request appointments, send appointment changes or cancellations, receive test results on-line, request prescription refills, view and/or pay their statements, and communicate with their physicians, all in a secure, on-line environment. Our NextGen suite of information systems are or can be linked to NextMD.com, integrating a number of these features with physicians’ existing systems.
8
2009.
MSOs, PHOs and similar networks to which we have sold systems provide use of our software to those group and single physician practices associated with the organization or hospital on either a service basis or by directing us to contract with those practices for the sale of stand-alone systems.
Customer2009.
9
Competition
Competition
10
EHR technology beginning in 2011. While the Company expects the ARRA to create significant opportunities for sales of NextGenehr over the next several years, the lack of a final definition of “meaningful use” as well as other details we believe has negatively impacted sales cycles in the March, 2009 quarter. While the Federal government has set a deadline of December 31, 2009 to publish final rules, there can be no assurance that the slowdown in sales cycles resulting from such uncertainty will not continue into the fiscal year, 2010 or beyond.
The effects of the recent global economic crisis may impact our business, operating results or financial condition. The recent global economic crisis has caused a general tightening in the credit markets, lower levels of liquidity, increases in the rates of default and bankruptcy and extreme volatility in credit, equity and fixed income markets. These macroeconomic developments could negatively affect our business, operating results or financial condition in a number of ways. For example, current or potential customersclients may be unable to fund software purchases, which could cause them to delay, decrease or cancel purchases of our products and services or to not pay us or to delay paying us for previously purchased products and services. Our clients may cease business operations or conduct business on a greatly reduced basis. Finally, our investment portfolio which includes auction rate securities, is generally subject to general credit, liquidity, counterparty, market and interest rate risks that may be exacerbated by the recent global financial crisis. If the banking system or the fixed income, credit or equity markets continue to deteriorate or remain volatile, our investment portfolio may be impacted and the values and liquidity of our investments could be adversely affected as well.
|
|
|
|
|
|
|
|
|
|
|
|
|
|
|
|
|
|
|
|
|
|
|
|
|
|
|
|
|
|
|
|
|
|
Our software products are generally shipped as orders are received and accordingly, we have historically operated with a minimal backlog of license fees. As a result, revenue in any quarter is dependent on orders booked and shipped in that quarter and is not predictable with any degree of certainty. Furthermore, our systems can be relatively large and expensive, and individual systems sales can represent a significant portion of our revenue and profits for a quarter such that the loss or deferral of even one such sale can adversely affect our quarterly revenue and profitability.
Clients often defer systems purchases until our quarter end, so quarterly results generally cannot be predicted and frequently are not known until after the quarter has concluded.
Our sales are dependent upon clients’ initial decisions to replace or substantially modify their existing information systems, and subsequently, their decision concerning which products and services to purchase. These are major decisions for healthcare providers and, accordingly, the sales cycle for our systems can vary significantly and typically ranges from six to twenty four months from initial contact to contract execution/shipment.
Because a significant percentage of our expenses are relatively fixed, a variation in the timing of systems sales, implementations, and installations can cause significant variations in operating results from quarter to quarter. As a result, we believe that interim period-to-period comparisons of ourbusiness, results of operations are not necessarily meaningful and should notfinancial condition may be relied upon as indicationsadversely affected.The software market generally is characterized by rapid technological change, changing client needs, frequent new product introductions and evolving industry standards. The introduction of future performance. Further,products incorporating new technologies and the emergence of new industry standards could render our historical operating results are not necessarily indicative of future performance for any particular period.
We currently recognize revenue pursuant to Statement of Position (“SOP”) 97-2, as modified by SOP 98-9existing products obsolete and Staff Accounting Bulletin (SAB) 104. SAB 104 summarizes the Commission staff’s views in applying generally accepted accounting principles to revenue recognition in financial statements.
unmarketable. There can be no assurance that applicationwe will be successful in developing and subsequent interpretationsmarketing new products that respond to technological changes or evolving industry standards. New product development depends upon significant research and development expenditures which depend ultimately upon sales growth. Any material shortfall in revenue or research funding could impair our ability to respond to technological advances or opportunities in the marketplace and to remain competitive. If we are unable, for technological or other reasons, to develop and introduce new products in a timely manner in response to changing market conditions or client requirements, our business, results of operations and financial condition may be adversely affected.
11
| • | potentially dilutive issuances of our securities, the incurrence of debt and contingent liabilities and amortization expenses related to intangible assets with indefinite useful lives, which could adversely affect our results of operations and financial condition; | ||
| • | use of cash as acquisition currency may adversely affect interest or investment income, thereby potentially adversely affecting our earnings and /or earnings per share; | ||
| • | difficulty in fully or effectively integrating any acquired technologies or software products into our current products and technologies, where we may not receive the intended benefits of an acquisition; | ||
| • | difficulty in predicting and responding to issues related to product transition such as development, distribution and client support; | ||
| • | the possible adverse effect of such acquisitions on existing relationships with third party partners and suppliers of technologies and services; | ||
| • | the possibility that staff or clients of the acquired company might not accept new ownership and may transition to different technologies or attempt to renegotiate contract terms or relationships, including maintenance or support agreements; | ||
| • | the possibility that the due diligence process in any such acquisition may not completely identify material issues associated with product quality, product architecture, product development, intellectual property issues, key personnel issues or legal and financial contingencies, including any deficiencies in internal controls and procedures and the costs associated with remedying such deficiencies; | ||
| • | difficulty in entering geographic and business markets in which we have no or limited prior experience; | ||
| • | difficulty in integrating acquired operations due to geographical distance and language and cultural differences; and | ||
| • | the possibility that acquired assets become impaired, requiring us to take a charge to earnings which could be significant. |
12
Duemalfunctioning could also disrupt our ability to alltimely and accurately process and report results of our operations, financial position and cash flows, which could impact our ability to timely complete important business processes such as the evaluation of its internal controls and attestation activities pursuant to Section 404 of the foregoing factors, itSarbanes-Oxley Act of 2002.
The failure of auction rate securitiesaffected by general economic conditions and economic and fiscal policy in India, including changes in exchange rates and controls, interest rates and taxation policies, as well as social stability and political, economic or diplomatic developments affecting India in the future. In particular, India has experienced significant economic growth over the last several years, but faces major challenges in sustaining that growth in the years ahead. These challenges include the need for substantial infrastructure development and improving access to sell at their reset dates could impact the liquidity of the investment and could negatively impact the carrying value of the investment. Our investments include auction rate securities (“ARS”). ARS are securities that are structured with short-term interest rate reset dates of generally less than ninety days but with longer contractual maturities that range, for our holdings, from nine to 28 years. At the end of each reset period, investors can typically sell at auction or continue to hold the securities at par. These securities are subject to fluctuations in interest rate depending on the supply and demand at each auction. Through March 31, 2009, auctions held for the Company’s ARS with a total aggregate value of approximately $8.1 million failed. As of March 31, 2009, we were holding a total of approximately $7.4 million, net of unrealized loss, in ARS. While these debt securities are all highly-rated investments, generally with AAA/Aaa ratings, continued failure to sell at their reset dates could impact the liquidity of the investment which in turn could negatively impact our liquidity position.
Our common stock price has been volatile, which could result in substantial losses for investors purchasing shares of our common stock and in litigation against us. Volatility may be caused by a number of factors including but not limited to:
|
|
|
|
|
|
|
|
|
|
|
|
|
|
|
|
|
|
|
|
|
|
Furthermore, the stock market in general, and the market for software, healthcare and high technology companies in particular, has experienced extreme volatility that often has been unrelatededucation. Our ability to the operating performance of particular companies. These broad marketrecruit, train and industry fluctuations mayretain qualified employees, develop and operate our captive facility could be adversely affect the trading price of our common stock, regardless of actual operating performance.
Moreover, in the past, securities class action litigation has often been brought against a company following periods of volatility in the market price of its securities. We may in the future be the target of similar litigation. Securities litigation could result in substantial costsaffected if India does not successfully meet these challenges.
Two of our directors are significant shareholders, which makes it possible for them to have significant influence over the outcome of all matters submitted to our shareholders for approval and which influence may be alleged to conflict with our interests and the interests of our other shareholders.Service Two of our directors and principal shareholders beneficially owned an aggregate of approximately 34.2% of the outstanding shares of our common stock at March 31, 2009. California law and our Bylaws permit our shareholders to cumulate their votes, the effect of which is to provide shareholders with sufficiently large concentrations of our shares the opportunity to assure themselves one or more seats on our Board. The amounts required to assure a Board position can vary based upon the number of shares outstanding, the number of shares voting, the number of directors to be elected, the number of “broker non-votes,” and the number of shares held by the shareholder exercising cumulative voting rights. In the event that cumulative voting is invoked, it is likely that the two of our directors holding an aggregate of approximately 34.2% of the outstanding shares of our common stock at March 31, 2009 will each have sufficient votes to assure themselves of one or more seats on our Board. With or without cumulative voting, these shareholders will have significant influence over the outcome of all matters submitted to our shareholders for approval, including the election of our directors and other corporate actions. In fiscal year 2009, one of the principal shareholders, Ahmed Hussein, proposed a different slate of directors than what the Company proposed to shareholders. The Company spent approximately $1.5 million to defend the Company’s slate. In addition, such influence by one or both of these shareholders could have the effect of discouraging others from attempting to purchase us, implement a change over our Board and management, and/or reducing the market price offered for our common stock in such an event.
If the emerging technologies and platforms of Microsoft and others upon which we build our products do not gain or continue to maintain broad market acceptance, or if we fail to develop and introduce in a timely manner new products and services compatible with such emerging technologies, we may not be able to compete effectively and our ability to generate revenue will suffer.Our software products are built and depend upon several underlying and evolving relational database management system platforms such as those developed by Microsoft. To date, the standards and technologies upon which we have chosen to develop our products have proven to have gained industry acceptance. However, the market for our software products is subject to ongoing rapid technological developments, quickly evolving industry standards and rapid changes in customerclient requirements, and there may be existing or future technologies and platforms that achieve industry standard status, which are not compatible with our products.
13
Many of our competitors have greater resources than we do. In order to compete successfully, we must keep pace with our competitors in anticipating and responding to the rapid changes involving the industry in which we operate, or our business, results of operations and financial condition may be adversely affected. The software market generally is characterized by rapid technological change, changing customer needs, frequent new product introductions, and evolving industry standards. The introduction of products incorporating new technologies and the emergence of new industry standards could render our existing products obsolete and unmarketable. There can be no assurance that we will be successful in developing and marketing new products that respond to technological changes or evolving industry standards. New product development depends upon significant research and development expenditures which depend ultimately upon sales growth. Any material shortfall in revenue or research funding could impair our ability to respond to technological advances or opportunities in the marketplace and to remain competitive. If we are unable, for technological or other reasons, to develop and introduce new products in a timely manner in response to changing market conditions or customer requirements, our business, results of operations and financial condition may be adversely affected.
In response to increasing market demand, we are currently developing new generations of certain of our software products. There can be no assurance that we will successfully develop these new software products or that these products will operate successfully, or that any such development, even if successful, will be completed concurrently with or prior to introduction of competing products. Any such failure or delay could adversely affect our competitive position or could make our current products obsolete.
We face risk and/or the possibility of claims from activities related to strategic partners, which could be expensive and time-consuming, divert personnel and other resources from our business and result in adverse publicity that could harm our business. We rely on third parties to provide services that affect our business. For example, we use national clearinghouses in the processing of some insurance claims and we outsource some of our hardware maintenance services and the printing and delivery of patient statements for our customers. These third parties could raise their prices and/or be acquired by competitors of ours, which could potentially create short and long-term disruptions to our business negatively impacting our revenue, profit and/or stock price. We also have relationships with certain third parties where these third parties serve as sales channels through which we generate a portion of our revenue. Due to these third-party relationships, we could be subject to claims as a result of the activities, products, or services of these third-party service
providers even though we were not directly involved in the circumstances leading to those claims. Even if these claims do not result in liability to us, defending and investigating these claims could be expensive and time-consuming, divert personnel and other resources from our business and result in adverse publicity that could harm our business.
We face the possibility of claims based upon our Web site content, which may cause us expense and management distraction. We could be subject to third party claims based on the nature and content of information supplied on our Web site by us or third parties, including content providers or users. We could also be subject to liability for content that may be accessible through our Web site or third party Web sites linked from our Web site or through content and information that may be posted by users in chat rooms, bulletin boards or on Web sites created by professionals using our applications. Even if these claims do not result in liability to us, investigating and defending against these claims could be expensive and time consuming and could divert management’s attention away from our operations.
14
|
|
|
|
|
|
|
|
|
|
|
|
|
|
|
|
|
|
A failure to successfully integrate acquired businesses or technology for any of these reasons could have an adverse effect on our financial condition andbusiness, results of operations.operations and financial condition.Certain of our products provide applications that relate to patient clinical information. Any failure by our products to provide accurate and timely information concerning patients, their medication, treatment and health status, generally, could result in claims against us which could materially and adversely impact our financial performance, industry reputation and ability to market new system sales. In addition, a court or government agency may take the position that our delivery of health information directly, including through licensed practitioners, or delivery of information by a third party site that a consumer accesses through our Web sites, exposes us to assertions of malpractice, other personal injury liability, or other liability for wrongful delivery/handling of healthcare services or erroneous health information. We maintain insurance to protect against claims associated with the use of our products as well as liability limitation language in our end-user license agreements, but there can be no assurance that our insurance coverage or contractual language would adequately cover any claim asserted against us. A successful claim brought against us in excess of or outside of our insurance coverage could have an adverse effect on our business, results of operations and financial condition. Even unsuccessful claims could result in our expenditure of funds for litigation and management time and resources.
| • | state and federal privacy and confidentiality laws; | ||
| • | our contracts with clients and partners; | ||
| • | state laws regulating healthcare professionals; | ||
| • | Medicaid laws; | ||
| • | the HIPAA and related rules proposed by the Health Care Financing Administration; and | ||
| • | Health Care Financing Administration standards for Internet transmission of health data. |
15
Because we believe that proprietary rights are material to our success, misappropriation of these rights could adversely affect our financial condition.We are heavily dependent on the maintenance and protection of our intellectual property and we rely largely on license agreements, confidentiality procedures and employee nondisclosure agreements to protect our intellectual property. Our software is not patented and existing copyright laws offer only limited practical protection.
16
We face the possibility of damages resulting from internal and external security breaches, and viruses. In the course of our business operations, we compile and transmit confidential information, including patient health information, in our processing centers and other facilities. A breach of security in any of these facilities could damage our reputation and result in damages being assessed against us. In addition, the other systems with which we may interface, such as the Internet and related systems may be vulnerable to security breaches, viruses, programming errors, or similar disruptive problems. The effect of these security breaches and related issues could disrupt our ability to perform certain key business functions and could potentially reduce demand for our services. Accordingly, we have expended significant resources toward establishing and enhancing the security of our related infrastructures, although no assurance can be given that they will be entirely free from potential breach. Maintaining and enhancing our infrastructure security may require us to expend significant capital in the future.
The success of our strategy to offer our EDI services and Internet solutions depends on the confidence of our customers in our ability to securely transmit confidential information. Our EDI services and Internet solutions rely on encryption, authentication and other security technology licensed from third parties to achieve secure transmission of confidential information. We may not be able to stop unauthorized attempts to gain access to or disrupt the transmission of communications by our customers. Anyone who is able to circumvent our security measures could misappropriate confidential user information or interrupt our, or our customers’, operations. In addition, our EDI and Internet solutions may be vulnerable to viruses, physical or electronic break-ins, and similar disruptions.
Any failure to provide secure infrastructure and/or electronic communication services could result in a lack of trust by our customers causing them to seek out other vendors, and/or, damage our reputation in the market, making it difficult to obtain new customers.
We are subject to the development and maintenance of the Internet infrastructure, which is not within our control, and which may diminish Internet usage and availability as well as access to our Web site. We deliver Internet-based services and, accordingly, we are dependent on the maintenance of the Internet by third parties. The Internet infrastructure may be unable to support the demands placed on it and our performance may decrease if the Internet continues to experience its historic trend of expanding usage. As a result of damage to portions of its infrastructure, the Internet has experienced a variety of performance problems which may continue into the foreseeable future. Such Internet related problems may diminish Internet usage and availability of the Internet to us for transmittal of our Internet-based services. In addition, difficulties, outages, and delays by Internet service providers, online service providers and other Web site operators may obstruct or diminish access to our Web site by our customers resulting in a loss of potential or existing users of our services.
Our failure to manage growth could harm our business, results of operations and financial condition. We have in the past experienced periods of growth which have placed, and may continue to place, a significant strain on our non-cash resources. We also anticipate expanding our overall software development, marketing, sales, client management and training capacity. In the event we are unable to identify, hire, train and retain qualified individuals in such capacities within a reasonable timeframe, such failure could have an adverse effect on us. In addition, our ability to manage future increases, if any, in the scope of our operations or personnel will depend on significant expansion of our research and development, marketing and sales, management, and administrative and financial capabilities. The failure of our management to effectively manage expansion in our business could have an adverse effect on our business, results of operations and financial condition.
Our operations are dependent upon our key personnel. If such personnel were to leave unexpectedly, we may not be able to execute our business plan. Our future performance depends in significant part upon the continued service of our key technical and senior management personnel, many of whom have been with us for a significant period of time. These personnel have acquired specialized knowledge and skills with respect to our business. We maintain key man life insurance on only one of our employees. Because we have a relatively small number of employees when compared to other leading companies in our industry, our dependence on maintaining our relationships with key employees is particularly significant. We are also dependent on our ability to attract high quality personnel, particularly in the areas of sales and applications development.
The industry in which we operate is characterized by a high level of employee mobility and aggressive recruiting of skilled personnel. There can be no assurance that our current employees will continue to work for us. Loss of services of key employees could have an adverse effect on our business, results of operations and financial condition. Furthermore, we may need to grant additional equity incentives to key employees and provide other forms of incentive compensation to attract and retain such key personnel. Equity incentives may be dilutive to our per share financial performance. Failure to provide such types of incentive compensation could jeopardize our recruitment and retention capabilities.
Our products may be subject to product liability legal claims, which could have an adverse effect on our business, results of operations and financial condition. Certain of our products provide applications that relate to patient clinical information. Any failure by our products to provide accurate and timely information concerning patients, their medication, treatment, and health status, generally, could result in claims against us which could materially and adversely impact our financial performance, industry reputation and ability to market new system sales. In addition, a court or government agency may take the position that our delivery of health information directly, including through licensed practitioners, or delivery of information by a third party site that a consumer accesses through our Web sites, exposes us to assertions of malpractice, other personal injury liability, or other liability for wrongful delivery/handling of healthcare services or erroneous health information. We maintain
insurance to protect against claims associated with the use of our products as well as liability limitation language in our end-user license agreements, but there can be no assurance that our insurance coverage or contractual language would adequately cover any claim asserted against us. A successful claim brought against us in excess of or outside of our insurance coverage could have an adverse effect on our business, results of operations and financial condition. Even unsuccessful claims could result in our expenditure of funds for litigation and management time and resources.
Certain healthcare professionals who use our Internet-based products will directly enter health information about their patients including information that constitutes a record under applicable law that we may store on our computer systems. Numerous federal and state laws and regulations, the common law, and contractual obligations, govern collection, dissemination, use and confidentiality of patient-identifiable health information, including:
|
|
|
|
|
|
|
|
|
|
|
|
HIPAA establishes elements including, but not limited to, federal privacy and security standards for the use and protection of Protected Health Information. Any failure by us or by our personnel or partners to comply with applicable requirements may result in a material liability to us.
Although we have systems and policies in place for safeguarding Protected Health Information from unauthorized disclosure, these systems and policies may not preclude claims against us for alleged violations of applicable requirements. Also, third party sites and/or links that consumers may access through our web sites may not maintain adequate systems to safeguard this information, or may circumvent systems and policies we have put in place. In addition, future laws or changes in current laws may necessitate costly adaptations to our policies, procedures, or systems.
There can be no assurance that we will not be subject to product liability claims, that such claims will not result in liability in excess of our insurance coverage, that our insurance will cover such claims or that appropriate insurance will continue to be available to us in the future at commercially reasonable rates. Such product liability claims could adversely affect our business, results of operations and financial condition.
We are subject to the effect of payor and provider conduct which we cannot control and accordingly, there is no assurance that revenues for our services will continue at historic levels. We offer certain electronic claims submission products and services as part of our product line. While we have implemented certain product features designed to maximize the accuracy and completeness of claims submissions, these features may not be sufficient to prevent inaccurate claims data from being submitted to payors. Should inaccurate claims data be submitted to payors, we may be subject to liability claims.
Electronic data transmission services are offered by certain payors to healthcare providers that establish a direct link between the provider and payor. This process reduces revenue to third party EDI service providers such as us. As a result of this, or other market factors, we are unable to ensure that we will continue to generate revenue at or in excess of prior levels for such services.
A significant increase in the utilization of direct links between healthcare providers and payors could adversely affect our transaction volume and financial results. In addition, we cannot provide assurance that we will be able to maintain our existing links to payors or develop new connections on terms that are economically satisfactory to us, if at all.
via the Internet. On an increasingly frequent basis, federal and state legislators are proposing laws and regulations that apply to Internet commerce and communications. Areas being affected by these regulations include user privacy, pricing, content, taxation, copyright protection, distribution, and quality of products and services. To the extent that our products and services are subject to these laws and regulations, the sale of our products and services could be harmed. 17InRecently enacted public laws reforming the past,U.S. healthcare system may have an impact on our business. The Patient Protection and Affordable Care Act (H.R. 3590; Public Law 111-148) (“PPACA”) and The Health Care and Education Reconciliation Act of 2010 (H.R. 4872) (the “Reconciliation Act”), which amends the PPACA (collectively the “Health Reform Laws”), were signed into law in March 2010. The Health Reform Laws contain various provisions which may impact us and our customers. Some of these provisions may have a positive impact, by expanding the use of electronic health records in certain federal programs, for example, while others, such as reductions in reimbursement for certain types of providers, may have a negative impact due to fewer available resources. Increases in fraud and abuse penalties may also adversely affect participants in the health care sector, including us.system including proposals which may change governmental involvement in healthcare and reimbursement rates, and otherwise alter the operating environment for us and our clients.system. Healthcare providers may react to these proposals, and the uncertainty surrounding such proposals, by curtailing or deferring investments, including those for our systems and related services. Cost-containment measures instituted by healthcare providers as a result of regulatory reform or otherwise could result in a reduction in the allocation of capital funds. Such a reduction could have an adverse effect on our ability to sell our systems and related services. On the other hand, changes in the regulatory environment have increased and may continue to increase the needs of healthcare organizations for cost-effective data management and thereby enhance the overall market for healthcare management information systems. We cannot predict what effect, if any, such proposals or healthcare reforms might have on our business, financial condition and results of operations.In addition, developmentsIn addition, our
price.
| • | the size and timing of orders from clients; | ||
| • | the specific mix of software, hardware and services in client orders; | ||
| • | the length of sales cycles and installation processes; | ||
| • | the ability of our clients to obtain financing for the purchase of our products; | ||
| • | changes in pricing policies or price reductions by us or our competitors; | ||
| • | the timing of new product announcements and product introductions by us or our competitors; | ||
| • | changes in revenue recognition or other accounting guidelines employed by us and/or established by the Financial Accounting Standards Board or other rule-making bodies; | ||
| • | accounting policies concerning the timing of the recognition of revenue; | ||
| • | the availability and cost of system components; | ||
| • | the financial stability of clients; | ||
| • | market acceptance of new products, applications and product enhancements; | ||
| • | our ability to develop, introduce and market new products, applications and product enhancements; | ||
| • | our success in expanding our sales and marketing programs; | ||
| • | deferrals of client orders in anticipation of new products, applications, product enhancements, or public/private sector initiatives; | ||
| • | execution of or changes to our strategy; | ||
| • | personnel changes; and | ||
| • | general market/economic factors. |
18
Our future policy concerning stock splits is uncertain. While we effectedcycle for our systems can vary significantly and typically ranges from six to twenty four months from initial contact to contract execution/shipment.
| • | actual or anticipated quarterly variations in operating results; | ||
| • | rumors about our performance, software solutions, or merger and acquisition activity; | ||
| • | changes in expectations of future financial performance or changes in estimates of securities analysts; | ||
| • | governmental regulatory action; | ||
| • | health care reform measures; | ||
| • | client relationship developments; | ||
| • | purchases or sales of company stock; | ||
| • | activities by one or more of our major shareholders concerning our policies and operations; | ||
| • | changes occurring in the markets in general; | ||
| • | macroeconomic conditions, both nationally and internationally; and | ||
| • | other factors, many of which are beyond our control. |
19
|
We lease approximately 78,000 square feet of space for the principal office of our NextGen Division in Horsham, Pennsylvania. This lease expires in March 2011. In January 2007, we executed a new lease for approximately 35,000 square feet of space for the NextGen Division in Atlanta, Georgia. This lease expires in October 2011. In May 2006, we executed a lease for approximately 3,000 square feet of space in Dallas, Texas for NextGen staff and a new NextGen training facility. In addition, we lease approximately 6,000 square feet of space in Santa Ana, California, to house our assembly and warehouse operations of the QSI Division. We also have an aggregate of approximately 3,000 square feet of space in Minnesota, Utah, Wisconsin, and Washington to house additional sales, training, development and service operations. These leases, excluding options, have expiration dates ranging from month-to-month to October 2011.California. Should we continue to grow, we may be required to lease additional space. We believe that suitable additional or substitute space is available, if needed, at market rates.
As a result of our acquisition of PMP on October 28, 2008, we lease approximately 40,500 square feet for our PMP operations in Hunt Valley, Maryland under various leases which will expire in July 2010.
| Square Feet | |||
| QSI Dental Division | ||||
| Irvine, California — Corporate Headquarters | 34,800 | |||
| NextGen Division | ||||
| Horsham, Pennsylvania | 98,000 | |||
| Atlanta, Georgia | 35,000 | |||
| Inpatient Solutions Division | ||||
| Austin, Texas | 39,000 | |||
| Irvine, California | 4,200 | |||
| Practice Solutions Division | ||||
| St. Louis, Missouri | 67,000 | |||
| Hunt Valley, Maryland | 33,000 | |||
| Other U.S. locations | 10,000 | |||
| Total leased properties | 321,000 | |||
|
No matter was submitted
20
|
|
Market Price and Holders
|
|
|
|
|
|
|
|
|
Quarter Ended |
| High |
| Low |
| |||
|
|
|
| |||||
|
|
|
|
|
|
|
| |
June 30, 2007 |
| $ | 42.44 |
| $ | 36.96 |
| |
September 30, 2007 |
| $ | 45.35 |
| $ | 32.37 |
| |
December 31, 2007 |
| $ | 38.99 |
| $ | 26.08 |
| |
March 31, 2008 |
| $ | 36.30 |
| $ | 26.90 |
| |
June 30, 2008 |
| $ | 35.97 |
| $ | 29.00 |
| |
September 30, 2008 |
| $ | 47.94 |
| $ | 27.34 |
| |
December 31, 2008 |
| $ | 44.98 |
| $ | 25.70 |
| |
March 31, 2009 |
| $ | 48.46 |
| $ | 34.26 |
| |
Market:
| High | Low | |||||||
| Three Months Ended | ||||||||
| June 30, 2009 | $ | 62.00 | $ | 43.44 | ||||
| September 30, 2009 | $ | 64.16 | $ | 50.87 | ||||
| December 31, 2009 | $ | 65.98 | $ | 57.63 | ||||
| March 31, 2010 | $ | 68.59 | $ | 51.30 | ||||
| June 30, 2010 | $ | 68.89 | $ | 53.86 | ||||
| September 30, 2010 | $ | 67.27 | $ | 52.90 | ||||
| December 31, 2010 | $ | 71.81 | $ | 58.35 | ||||
| March 31, 2011 | $ | 83.68 | $ | 69.33 | ||||
On May 27, 2009, our Board approved a quarterly cash dividend of $0.30 per share on our outstanding shares of common stock, payable to shareholders of record as of June 12, 2009 with an expected distribution date on or about July 6, 2009.
On January 28, 2009, our Board approved a quarterly cash dividend of $0.30 per share on our outstanding shares of common stock, payable to shareholders of record as of March 11, 2009 with a distribution date on or about April 3, 2009.
On October 30, 2008, our Board approved a quarterly cash dividend of $0.30 per share on our outstanding shares of common stock, payable to shareholders of record as of December 15, 2008 with a distribution date on or about January 5, 2009.
On August 4, 2008, our Board approved a quarterly cash dividend of $0.30 per share on our outstanding shares of common stock, payable to shareholders of record as of September 15, 2008 with a distribution date on or about October 1, 2008.
On May 29, 2008, our Board approved a quarterly cash dividend of $0.25 per share on our outstanding shares of common stock, payable to shareholders of record as of June 15, 2008 with a distribution date on or about July 2, 2008.
On January 30, 2008, our Board approved a quarterly cash dividend of $0.25 per share on our outstanding shares of common stock, payable to shareholders of record as of March 14, 2008 and was distributed to shareholders on or about April 7, 2008.
On October 25, 2007, our Board approved a quarterly cash dividend of $0.25 per share on our outstanding shares of common stock, payable to shareholders of record as of December 14, 2007 and was distributed to shareholders on or about January 7, 2008.
On July 31, 2007, our Board approved a quarterly cash dividend of $0.25 per share on our outstanding shares of common stock, payable to shareholders of record as of September 14, 2007 and was distributed to shareholders on or about October 5, 2007.
On May 31, 2007, our Board declared a quarterly cash dividend of $0.25 per share on our outstanding shares of common stock, payable to shareholders of record as of June 15, 2007 and was distributed to shareholders on July 5, 2007.
In February 2007, we paid a $1.00 per share cash dividend on shares of our common stock. The record date for the dividend was February 13, 2007.
In January 2007, our Board of Directors adopted a policy whereby we intend to pay a regular quarterly dividend of $0.25 per share on our outstanding common stock commencing with conclusion of our first fiscal quarter of 2008 (June 30, 2007) and continuing each fiscal quarter thereafter,Common Stock, subject to further Board review and approval and establishment of record and distribution dates by our Board of Directors prior to the declaration of each such quarterly dividend. In August 2008, ourOur Board of Directors increased the quarterly dividend to $0.30 per share.share in August 2008 and to $0.35 per share in January 2011. We anticipate that future quarterly dividends, if and when declared by our Board of Directors pursuant to this policy, would likely be distributable on or about the fifth day of each of the months of October, January, April and July.
| Per Share | ||||||||
| Declaration Date | Record Date | Payment Date | Dividend | |||||
| May 26, 2010 | June 17, 2010 | July 6, 2010 | $ | 0.30 | ||||
| July 28, 2010 | September 17, 2010 | October 5, 2010 | 0.30 | |||||
| October 25, 2010 | December 17, 2010 | January 5, 2011 | 0.30 | |||||
| January 26, 2011 | March 17, 2011 | April 5, 2011 | 0.35 | |||||
| Fiscal year 2011 | $ | 1.25 | ||||||
| May 27, 2009 | June 12, 2009 | July 6, 2009 | $ | 0.30 | ||||
| July 23, 2009 | September 25, 2009 | October 5, 2009 | 0.30 | |||||
| October 28, 2009 | December 23, 2009 | January 5, 2010 | 0.30 | |||||
| January 27, 2010 | March 23, 2010 | April 5, 2010 | 0.30 | |||||
| Fiscal year 2010 | $ | 1.20 | ||||||
| May 29, 2008 | June 15, 2008 | July 2, 2008 | $ | 0.25 | ||||
| August 4, 2008 | September 15, 2008 | October 1, 2008 | 0.30 | |||||
| October 30, 2008 | December 15, 2008 | January 5, 2009 | 0.30 | |||||
| January 28, 2009 | March 11, 2009 | April 3, 2009 | 0.30 | |||||
| Fiscal year 2009 | $ | 1.15 | ||||||
21
Among Quality Systems, Inc., The NASDAQ Composite Index
And The NASDAQ Computer & Data Processing Index
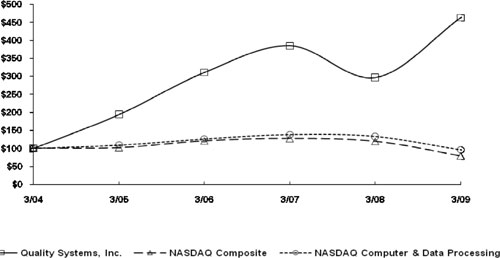
| * |
| $100 invested on 3/31/ |
Fiscal year ending March 31. |
22
|
(In thousands, except per share data)
| Fiscal Year Ended March 31, | ||||||||||||||||||||
| 2011 | 2010 | 2009 | 2008 | 2007 | ||||||||||||||||
| Statements of Income Data: | ||||||||||||||||||||
| Revenue | $ | 353,363 | $ | 291,811 | $ | 245,515 | $ | 186,500 | $ | 157,165 | ||||||||||
| Cost of revenue | 127,482 | 110,807 | 88,890 | 62,501 | 50,784 | |||||||||||||||
| Gross profit | 225,881 | 181,004 | 156,625 | 123,999 | 106,381 | |||||||||||||||
| Selling, general and administrative | 108,310 | 86,951 | 69,410 | 53,260 | 45,337 | |||||||||||||||
| Research and development costs | 21,797 | 16,546 | 13,777 | 11,350 | 10,166 | |||||||||||||||
| Amortization of acquired intangible assets | 1,682 | 1,783 | 1,035 | — | — | |||||||||||||||
| Income from operations | 94,092 | 75,724 | 72,403 | 59,389 | 50,878 | |||||||||||||||
| Interest income | 263 | 226 | 1,203 | 2,661 | 3,306 | |||||||||||||||
| Other income (expense), net | 61 | 268 | (279 | ) | 953 | — | ||||||||||||||
| Income before provision for income taxes | 94,416 | 76,218 | 73,327 | 63,003 | 54,184 | |||||||||||||||
| Provision for income taxes | 32,810 | 27,839 | 27,208 | 22,925 | 20,952 | |||||||||||||||
| Net income | $ | 61,606 | $ | 48,379 | $ | 46,119 | $ | 40,078 | $ | 33,232 | ||||||||||
| Basic net income per share | $ | 2.13 | $ | 1.69 | $ | 1.65 | $ | 1.47 | $ | 1.24 | ||||||||||
| Diluted net income per share | $ | 2.12 | $ | 1.68 | $ | 1.62 | $ | 1.44 | $ | 1.21 | ||||||||||
| Basic weighted average shares outstanding | 28,947 | 28,635 | 28,031 | 27,298 | 26,882 | |||||||||||||||
| Diluted weighted average shares outstanding | 29,118 | 28,796 | 28,396 | 27,770 | 27,550 | |||||||||||||||
| Dividends declared per common share | $ | 1.25 | $ | 1.20 | $ | 1.15 | $ | 1.00 | $ | 1.00 | ||||||||||
| March 31, | March 31, | March 31, | March 31, | March 31, | ||||||||||||||||
| 2011 | 2010 | 2009 | 2008 | 2007 | ||||||||||||||||
| Balance Sheet Data: | ||||||||||||||||||||
| Cash and cash equivalents | $ | 116,617 | $ | 84,611 | $ | 70,180 | $ | 59,046 | $ | 60,028 | ||||||||||
| Working capital | $ | 145,758 | $ | 118,935 | $ | 98,980 | $ | 79,932 | $ | 76,616 | ||||||||||
| Total assets | $ | 378,686 | $ | 310,180 | $ | 242,101 | $ | 187,908 | $ | 150,681 | ||||||||||
| Total liabilities | $ | 154,016 | $ | 121,891 | $ | 86,534 | $ | 74,203 | $ | 59,435 | ||||||||||
| Total shareholders’ equity | $ | 224,670 | $ | 188,289 | $ | 155,567 | $ | 113,705 | $ | 91,246 | ||||||||||
23
|
|
|
|
|
|
|
|
|
|
|
|
|
|
|
|
|
|
| Year ended March 31, |
| |||||||||||||
|
| 2009 |
| 2008 |
| 2007 |
| 2006 |
| 2005 |
| |||||
|
| |||||||||||||||
|
|
|
|
|
|
|
|
|
|
|
| |||||
Statements of Income Data: |
|
|
|
|
|
|
|
|
|
|
|
|
|
|
|
|
Revenue |
| $ | 245,515 |
| $ | 186,500 |
| $ | 157,165 |
| $ | 119,287 |
| $ | 88,961 |
|
Cost of revenue |
|
| 88,890 |
|
| 62,501 |
|
| 50,784 |
|
| 39,828 |
|
| 32,669 |
|
|
|
| ||||||||||||||
Gross profit |
|
| 156,625 |
|
| 123,999 |
|
| 106,381 |
|
| 79,459 |
|
| 56,292 |
|
|
|
|
|
|
|
|
|
|
|
|
|
|
|
|
|
|
Selling, general and administrative expenses |
|
| 70,445 |
|
| 53,260 |
|
| 45,337 |
|
| 35,554 |
|
| 24,776 |
|
Research and development costs |
|
| 13,777 |
|
| 11,350 |
|
| 10,166 |
|
| 8,087 |
|
| 6,903 |
|
|
|
| ||||||||||||||
Income from operations |
|
| 72,403 |
|
| 59,389 |
|
| 50,878 |
|
| 35,818 |
|
| 24,613 |
|
Interest income |
|
| 1,203 |
|
| 2,661 |
|
| 3,306 |
|
| 2,108 |
|
| 876 |
|
Other income (expense) |
|
| (279 | ) |
| 953 |
|
| — |
|
| — |
|
| — |
|
|
|
| ||||||||||||||
Income before provision for income taxes |
|
| 73,327 |
|
| 63,003 |
|
| 54,184 |
|
| 37,926 |
|
| 25,489 |
|
Provision for income taxes |
|
| 27,208 |
|
| 22,925 |
|
| 20,952 |
|
| 14,604 |
|
| 9,380 |
|
|
|
| ||||||||||||||
Net income |
| $ | 46,119 |
| $ | 40,078 |
| $ | 33,232 |
| $ | 23,322 |
| $ | 16,109 |
|
|
|
| ||||||||||||||
|
|
|
|
|
|
|
|
|
|
|
|
|
|
|
|
|
Basic net income per share |
| $ | 1.65 |
| $ | 1.47 |
| $ | 1.24 |
| $ | 0.88 |
| $ | 0.63 |
|
Diluted net income per share |
| $ | 1.62 |
| $ | 1.44 |
| $ | 1.21 |
| $ | 0.85 |
| $ | 0.61 |
|
|
|
|
|
|
|
|
|
|
|
|
|
|
|
|
|
|
Basic weighted average shares outstanding |
|
| 28,031 |
|
| 27,298 |
|
| 26,882 |
|
| 26,413 |
|
| 25,744 |
|
Diluted weighted average shares outstanding |
|
| 28,396 |
|
| 27,770 |
|
| 27,550 |
|
| 27,356 |
|
| 26,406 |
|
|
|
|
|
|
|
|
|
|
|
|
|
|
|
|
|
|
Balance Sheet Data (at end of year): |
|
|
|
|
|
|
|
|
|
|
|
|
|
|
|
|
Cash and cash equivalents |
| $ | 70,180 |
| $ | 59,046 |
| $ | 60,028 |
| $ | 57,255 |
| $ | 51,157 |
|
Working capital |
| $ | 98,980 |
| $ | 79,932 |
| $ | 76,616 |
| $ | 61,724 |
| $ | 55,111 |
|
Total assets |
| $ | 242,101 |
| $ | 187,908 |
| $ | 150,681 |
| $ | 122,247 |
| $ | 99,442 |
|
Total liabilities |
| $ | 86,534 |
| $ | 74,203 |
| $ | 59,435 |
| $ | 49,838 |
| $ | 36,711 |
|
Total shareholders’ equity |
| $ | 155,567 |
| $ | 113,705 |
| $ | 91,246 |
| $ | 72,409 |
| $ | 62,731 |
|
|
| • | |||
| Management Overview.This section provides a general description of our Company and operating segments, a discussion as to how we derive our revenue, background information on certain trends and developments affecting our Company, a summary of our acquisition transactions and a discussion on management’s strategy for driving revenue growth. | ||
• | Critical Accounting Policies and Estimates.This section discusses those accounting policies that are considered important to the evaluation and reporting of our financial condition and results of operations, and whose application requires us to exercise subjective or complex judgments in making estimates and assumptions. In addition, all of our significant accounting policies, including our critical accounting policies, are summarized in Note 2, “Summary of Significant Accounting Policies,” of our notes to | ||
• | Company Overview.This section provides a more detailed description of our Company, operating segments, products and services offered. | ||
| • | Overview of Results of Operations and Results of Operations by Operating Divisions.These sections provide our analysis and outlook for the significant line items on our consolidated statements of | ||
• | Liquidity and Capital Resources.This section provides an analysis of our liquidity and cash flows and discussions of our contractual obligations and commitments as of March 31, | ||
• |
24
Our Company
The turbulence in the worldwide economy has impacted almost all industries. While healthcare is not immune to economic cycles, we believe it is more resilient than most segments of the economy. The impact of the current economic conditions on our existing and prospective clients has been mixed. We continue to see organizations that are doing fairly well operationally, however, some organizations with a large dependency on Medicaid populations are being impacted by the challenging financial condition of the many state governments in whose
jurisdictions they conduct business. A positive factor for U.S. healthcare is the fact that the Obama administration is pursuing broad healthcare reform aimed at improving issues surrounding healthcare. The ARRA, which became law on February 17, 2009, includes more than $20 billion to help healthcare organizations modernize operations through the acquisition of health careclinical information technology. While we are unsure of the immediate impact from the ARRA, the long-term potential could be significant.
operations.
services and continuing our gold-standard commitment of service in support of our client satisfaction programs.
25
Revenue Recognition. We currently recognize system sales revenue pursuant to SOP 97-2, as amended by SOP 98-9. We generate revenue from the sale of licensing rights to use our software products sold directly to end-users and value-added resellers, or VARs. We also generate revenue from sales of hardware and third party software, implementation, training, software customization, EDI, post-contract support (maintenance) and other services, including RCM services, performed for customers who license our products.
A typical system contract contains multiple elements of the above items. SOP 97-2, as amended, requires revenue earned on software arrangements involving multiple elements to be allocated to each element based on the relative fair values of those elements. The fair value of an element must be based on vendor specific objective evidence (“VSOE”). We limit our assessment of VSOE for each element to either the price charged when the same element is sold separately or the price established by management having the relevant authority to do so, for an element not yet sold separately. VSOE calculations are updated and reviewed at the end of each quarter or annually depending on the nature of the product or service. We have
established VSOE for the related undelivered elements based on the bell-shaped curve method. Maintenance VSOE for our largest customers is based on stated renewal rates only if the rate is determined to be substantive and falls within our customary pricing practices.
When evidence of fair value exists for the undelivered elements only, the residual method, provided for under SOP 98-9, is used. Under the residual method, we defer revenue related to the undelivered elements in a system sale based on VSOE of fair value of each of the undelivered elements, and allocate the remainder of the contract price net of all discounts to revenue recognized from the delivered elements. Undelivered elements of a system sale may include implementation and training services, hardware and third party software, maintenance, future purchase discounts, or other services. If VSOE of fair value of any undelivered element does not exist, all revenue is deferred until VSOE of fair value of the undelivered element is established or the element has been delivered.
We bill for the entire system sales contract amount upon contract execution, except for maintenance which is billed separately. Amounts billed in excess of the amounts contractually due are recorded in accounts receivable as advance billings. Amounts are contractually due when services are performed or in accordance with contractually specified payment dates. Provided the fees are fixed and determinable and collection is considered probable, revenue from licensing rights and sales of hardware and third party software is generally recognized upon shipment and transfer of title. In certain transactions whose collections risk is high, the cash basis method is used to recognize revenue. If the fee is not fixed or determinable, then the revenue recognized in each period (subject to application of other revenue recognition criteria) will be the lesser of the aggregate of amounts due and payable or the amount of the arrangement fee that would have been recognized if the fees were being recognized using the residual method. Fees which are considered fixed or determinable at the inception of our arrangements must include the following characteristics:
Revenue Recognition | Judgments and Uncertainties | |
| ||
| We generate revenue from the sale of licensing rights to use our software products sold directly to end-users and value-added resellers, or VARs. We also generate revenue from sales of hardware and third party software, implementation, training, software customization, EDI, post-contract support (maintenance) and other services, including RCM services, performed for clients who license our products. Revenue from implementation and training services is recognized as the corresponding services are performed. Maintenance revenue is recognized ratably over the contractual maintenance period. RCM revenue is derived from services fees, which include amounts charged for ongoing billing and other related services and are generally billed to the client as a percentage of total collections. We do not recognize revenue for services fees until these collections are made as the services fees are not fixed or determinable until such time. | A typical system contract contains multiple elements of the above items. FASB ASC Topic 985-605-25,Software, Revenue Recognition, Multiple Elements,or ASC 985-605-25, requires revenue earned on software arrangements involving multiple elements to be allocated to each element based on the relative fair values of those elements. The fair value of an element must be based on vendor specific objective evidence (“VSOE”). We limit our assessment of VSOE for each element to either the price charged when the same element is sold separately or the price established by management having the relevant authority to do so, for an element not yet sold separately. VSOE calculations are updated and reviewed at the end of each quarter or annually depending on the nature of the product or service. We have established VSOE for the related undelivered elements based on the bell-shaped curve method. Maintenance VSOE for our largest clients is based on stated renewal rates only if the rate is determined to be substantive and falls within our customary pricing practices. When evidence of fair value exists for the undelivered elements only, the residual method, provided for under ASC 985-605, is used. Under the residual method, we defer revenue related to the undelivered elements in a system sale based on VSOE of fair value of each of the undelivered elements and allocate the remainder of the contract price net of all discounts to revenue recognized from the delivered elements. Undelivered elements of a system sale may include implementation and training services, hardware and third party software, maintenance, future purchase discounts, or other services. If VSOE of fair value of any undelivered element does not exist, all revenue is deferred until VSOE of fair value of the undelivered element is established or the element has been delivered. We bill for the entire system sales contract amount upon contract execution, except for maintenance which is billed separately. Amounts billed in excess of the amounts contractually due are recorded in accounts receivable as advance billings. Amounts are contractually due when services are performed or in accordance with contractually specified payment dates. Provided the fees are fixed or determinable and collection is considered probable, revenue from licensing rights and sales of hardware and third party software is generally recognized upon shipment and transfer of title. In certain transactions whose collections risk is high, the cash basis method is used to recognize revenue. If the fee is not fixed or determinable, then the revenue recognized in each period (subject to application of other revenue recognition criteria) will be the lesser of the aggregate of amounts due and payable or the amount of the arrangement fee that would have been recognized if the fees were being recognized using the residual method. Fees which are considered fixed or determinable at the inception of our arrangements must include the following characteristics: | |
§The fee must be negotiated at the outset of an arrangement and generally be based on the specific volume of products to be delivered without being subject to change based on variable pricing mechanisms such as the number of units copied or distributed or the expected number of users; and | ||
| §Payment terms must not be considered extended. If a significant portion of the fee is due more than 12 months after delivery or after the expiration of the license, the fee is presumed not fixed |
Revenue from implementation and training services is recognized as the corresponding services are performed. Maintenance revenue is recognized ratably over the contractual maintenance period.
Contract accounting is applied where services include significant software modification, development or customization. In such instances, the arrangement fee is accounted for in accordance with SOP 81-1 “Accounting for Performance of Construction-Type and Certain Production-Type Contracts.”
Pursuant to SOP 81-1, we use the percentage of completion method provided all of the following conditions exist:
|
| |
| Effect if Actual Results Differ from Assumptions | ||
| Although we believe that |
26
Allowance for Doubtful Accounts | Judgments and Uncertainties | |
| We maintain allowances for doubtful accounts for estimated losses resulting from the | Specific reserves are based on management’s estimate of the probability of collection for certain troubled accounts. General reserves are established based on our historical experience of bad debt expense and the aging of our accounts receivable balances net of deferred revenue and specifically reserved accounts. If the financial condition of our clients were to deteriorate resulting in an impairment of their ability to make payments, additional allowances would be required. Effect if Actual Results Differ from Assumptions Although we believe that our approach to estimates and judgments as described herein is reasonable, actual results could differ and we may be exposed to increases or | |
Software Development Costs | Judgments and Uncertainties | |
Development costs incurred in the research and development of new software products and enhancements to existing software products for external use are expensed as incurred until technological feasibility has been established. After technological feasibility is established, any additional external software development costs are capitalized in accordance with FASB ASC Topic 985-20,Software, Costs of Computer Software to be | We perform an annual review of the estimated economic life and Effect if Actual Results Differ from Assumptions Although we believe that our approach to estimates and judgments as described herein is reasonable, actual results could differ and we may be exposed to increases or decreases in revenue that could be material. | |
Goodwill | Judgments and Uncertainties | |
| Goodwill is related to NextGen and the | In accordance with FASB ASC Topic 350-20,Intangibles — Goodwill and Other, Goodwill, or ASC 350-20, we test goodwill for impairment annually at the end of | |
| our first fiscal quarter, referred to as the annual test date, and have determined that there was no impairment to our goodwill as of June 30, 2010. We will also test for impairment between annual test dates if an event occurs or circumstances change that would indicate the carrying amount may be impaired. Impairment testing for goodwill is performed at a reporting-unit level, which is defined as an operating segment or one level below and operating segment (referred to as a component). A component of an operating segment is a reporting unit if the component constitutes a business for which discrete financial information is available and segment management regularly reviews the operating results of that component. | |
| carrying amount of the reporting unit’s net assets exceeds the estimated fair value of the reporting unit. As of March 31, 2011 and 2010, we have not identified any events or circumstances that would require an interim goodwill impairment test. | |
|
|
We measure completion using labor input hours. Costs of providing services, including services accounted for in accordance with SOP 81-1, are expensed as incurred.
If a situation occurs in which a contract is so short term that the consolidated financial statements would not vary materially from using the percentage-of-completion method or in which we are unable to make reliable estimates of progress of completion of the contract, the completed contract method is utilized.
Product returns are estimated in accordance with Statement of Financial Accounting Standards (“SFAS”) No. 48, “Revenue Recognition When Right of Return Exists”. The Company also ensures that the other criteria in SFAS 48 have been met prior to recognition of revenue:
|
|
|
|
|
|
27
Business Combinations — Purchase Price Allocations During the last three fiscal years, we completed three significant acquisitions: In February 2010, we acquired Opus for $20.6 million. In October 2008, we acquired PMP for $19.7 million, including transaction costs. In May 2008, we acquired HSI for $15.6 million, including transaction costs. | Judgments and Uncertainties In accordance with business combination accounting under FASB ASC Topic 805,Business Combinations, or ASC 805, we allocate the purchase price of | |
|
| |
|
| |
| business strategies. | |
Intangible Assets | Judgments and Uncertainties | |
| Intangible assets consist of capitalized software costs, customer relationships, trade names and certain intellectual property. Intangible assets related to customer relationships, trade names and software technology arose in connection with the acquisition of HSI, PMP, NextGen IS and Opus. | These intangible assets were recorded at fair value and are stated net of accumulated amortization. Intangible assets are amortized over their remaining estimated useful lives, ranging from 3 to 9 years. Our amortization policy for Effect if Actual Results Differ from Assumptions Although we believe that our approach to estimates and judgments as described herein is reasonable, actual results could differ and we may be exposed to decreases in the |
We have historically offered short-term rights of return of less than 30 days in certain sales arrangements. If we are able to estimate returns for these types of arrangements, revenue is recognized and these arrangements are recorded in the consolidated financial statements. If we are unable to estimate returns for these types of arrangements, revenue is not recognized in our consolidated financial statements until the rights of return expire.
Revenue related to sales arrangements which include the right to use software stored on the Company’s hardware are accounted for under the Emerging Issues Task Force Issue (“EITF”) No. 00-3 “Application of AICPA Statement of Position 97-2 to arrangements that include the right to use software stored on another entity’s hardware”. EITF No. 00-3 requires that for software licenses and related implementation services to continue to fall under SOP No. 97-2, the customer must have the contractual right to take possession of the software without incurring a significant penalty and it must be feasible for the customer to either host the software themselves or through another third party. If an arrangement is not deemed to be accounted for under SOP 97-2, the entire arrangement is accounted for as a service contract in accordance with EITF Issue No. 00-21 “Revenue Arrangements with Multiple Deliverables”. In that instance, the entire arrangement would be recognized as the hosting services are being performed.
RCM revenue is derived from services fees, which include amounts charged for ongoing billing and other related services and are generally billed to the customer as a percentage of total collections. We do not recognize revenue for services fees until these collections are made as the services fees are not fixed and determinable until such time.
From time to time, we offer future purchase discounts on our products and services as part of our sales arrangements. Pursuant to AICPA TPA 5100.51, discounts which are incremental to the range of discounts reflected in the pricing of the other elements of the arrangement, which are incremental to the range of discounts typically given in comparable transactions, and which are significant, are treated as an additional element of the contract to be deferred. Amounts deferred related to future purchase options are not recognized until either the customer exercises the discount offer or the offer expires.
Revenue is divided into two categories, “system sales” and “maintenance, EDI, RCM and other services”. Revenue in the system sales category includes software license fees, third party hardware and software, and implementation and training services related to purchase of the Company’s software systems. The majority of the revenue in the system sales category is related to the sale of software. Revenue in the maintenance, EDI, RCM and other services category includes, maintenance, EDI, RCM, follow on training and implementation services, annual third party license fees, hosting services and other revenue.
Valuation of marketable securities and ARS put option rights. Marketable securities are recorded at fair value, based on quoted market rates or on valuation analysis when appropriate. The cost of marketable securities sold is based upon the specific identification method. In addition, the Company classifies marketable securities as current or non-current based upon whether such assets are reasonably expected to be realized in cash or sold or consumed during the normal operating cycle of the business. Realized gains or losses and other-than-temporary declines in the fair value of marketable securities are determined on a specific identification basis and reported in interest and other income, net, as incurred.
The fair value of our marketable securities has been estimated by management based on certain assumptions of what market participants would use in pricing the asset in a current transaction, or level 3 - unobservable inputs in accordance with SFAS 157 (see Note 4 of our Notes to the Consolidated Financial Statements: “Fair Value Measurements”). Management used a model to estimate the fair value of these securities that included certain level 2 inputs as well as assumptions, including a liquidity discount, based on management’s judgment, which are highly subjective and therefore considered level 3 inputs in the fair value hierarchy. The estimate of the fair value of the marketable securities could change based on market conditions.
Our ARS are managed by UBS Financial Services Inc. (“UBS”). On November 13, 2008, we entered into an Auction Rate Security Rights Agreement (the Rights Agreement) with UBS, whereby we accepted UBS’ offer to purchase our ARS investments at any time during the period of June 30, 2010 through July 2, 2012. As a result we had obtained an asset, ARS put option rights, whereby we have a right to “put” the ARS back to UBS. We expect to exercise our ARS put option rights and put our ARS back to UBS on June 30, 2010, the earliest date allowable under the Rights Agreement.
As we will be permitted to put the ARS back to UBS at par value, we have accounted for the ARS put option rights as a separate asset that was initially measured and will continue to be measured at its fair value. We are required to assess the fair value of these two individual assets and to record corresponding changes in fair value in each reporting period through the Consolidated Statements of Operations until the ARS put option rights are exercised and the ARS are redeemed or sold. Since the ARS put option rights represent the right to sell the securities back to UBS at par, we will be required to periodically assess the economic ability of UBS to meet that obligation in assessing the fair value of the ARS put options rights.
Allowance for Doubtful Accounts. We maintain allowances for doubtful accounts for estimated losses resulting from the inability of our customers to make required payments. We perform credit evaluations of our customers and maintain reserves for estimated credit losses. Reserves for potential credit losses are determined by establishing both specific and general reserves. Specific reserves are based on management’s estimate of the probability of collection for certain troubled accounts. General reserves are established based on our historical experience of bad debt expense and the aging of our accounts receivable balances net of deferred revenue and specifically reserved accounts. If the financial condition of our customers were to deteriorate resulting in an impairment of their ability to make payments, additional allowances would be required.
Software Development Costs. Development costs incurred in the research and development of new software products and enhancements to existing software products are expensed as incurred until technological feasibility has been established. After technological feasibility is established with the completion of a working model of the enhancement or product, any additional development costs are capitalized in accordance with SFAS 86, “Accounting for the Costs of Computer Software to be Sold, Leased or Otherwise Marketed.” Such capitalized costs are amortized on a straight line basis over the estimated economic life of the related product, which is generally three years. We perform an annual review of the recoverability of such capitalized software costs. At the time a determination is made that capitalized amounts are not recoverable based on the estimated cash flows to be generated from the applicable software, any remaining capitalized amounts are written off.
Share-Based Compensation. We apply the provisions of SFAS 123R, “Share-Based Payment,” which requires the measurement and recognition of compensation expense for all share-based payment awards made to employees and directors based on estimated fair values. SFAS 123R requires us to estimate the fair value of share-based payment awards on the date of grant using an option-pricing model. During fiscal year 2009, we estimate the expected term of the option using historical exercise experience. Prior to fiscal year 2009 we used the simplified method to estimate the expected term of an option. We estimate volatility by using the weighted average historical volatility of our common stock, which we believe approximates expected volatility. The risk free rate is the implied yield available on the U.S Treasury zero-coupon issues with remaining terms equal to the expected term. The expected dividend yield is the average dividend rate during a period equal to the expected term of the option. Those inputs are then entered into the Black Scholes model to determine the estimated fair value. The value of the portion of the award that is expected to vest is recognized as expense over the requisite service period in our consolidated statement of income.
Research and Development Tax Credits. Management’s treatment of research and development tax credits represented a significant estimate which affected the effective income tax rate for us for the years ended March 31, 2009, 2008 and 2007. Research and development credits taken by us involve certain assumptions and judgments regarding qualified expenses under Internal Revenue Code (“IRC”) Section 41. These credits are subject to examination by the federal and state taxing authorities.
During each of the years ended March 31, 2009, 2008 and 2007, we recognized approximately $1.0 million, $0.8 million and $0.8 million in credits, respectively, related to research and development. We expect to capture this benefit on our federal tax returns.
Qualified Production Activities Deduction. Management’s treatment of this deduction represented an estimate that affected the effective income tax rate for us for the years ended
March 31, 2009, 2008 and 2007. The deduction taken by us involved certain assumptions and judgments regarding the allocation of indirect expenses as prescribed under IRC Section 199.
During the years ended March 31, 2009, 2008 and 2007, we recognized approximately $2.7 million, $3.1 million and $1.5 million, respectively, in deductions related to the qualified production activities deduction (“QPAD”) under IRC. The QPAD calculation was determined using interim guidance provided by proposed Internal Revenue Service regulations and notices. We expect to capture this benefit on our tax returns.
Business Combinations. In accordance with business combination accounting under SFAS No. 141,“Business Combinations,” we allocate the purchase price of acquired businesses to the tangible and intangible assets acquired and liabilities assumed based on estimated fair values. Such allocations require management to make significant estimates and assumptions, especially with respect to intangible assets acquired. Management’s estimates of fair value are based upon assumptions believed to be reasonable. These estimates are based on information obtained from management of the acquired companies and are inherently uncertain. Critical estimates in valuing certain of the intangible assets include, but are not limited to:
| fair value of our intangible assets, resulting in impairment charges that could be material. | ||
|
| |
Share-Based Compensation | Judgments and Uncertainties | |
| ||
| Our stock-based compensation plans consist of stock options and restricted stock units. See Note 9 of our consolidated financial statements for a complete discussion of our stock-based compensation programs. | We apply the On May 26, 2010, the Board of Directors approved its fiscal year 2011 equity incentive program for certain employees to be awarded options to purchase the Company’s common stock. Under the program, executives are eligible to receive options based on meeting certain target increases in earnings per share performance and revenue growth during fiscal year 2011. Non-executive employees also are eligible to receive options based on satisfying certain management established criteria and recommendations of senior management. Compensation expense associated with the performance based awards under the Company’s 2011 incentive plan are initially based on the number of options expected to vest after assessing the probability that certain performance criteria will be met. Cumulative adjustments are recorded quarterly to reflect subsequent changes in the estimated outcome of performance-related conditions. |
Unanticipated events and circumstances may occur which may affect the accuracy or validity of such assumptions, estimates or actual results and we will continue to evaluate events and circumstances on an ongoing basis.28
Share-Based Compensation (continued) | Effect if Actual Results Differ from Assumptions | |
| We do not believe there is a reasonable likelihood there will be a material change in the future estimates or assumptions we use to determine stock-based compensation expense. However, if actual results are not consistent with our estimates or assumptions, we may be exposed to changes in stock-based compensation expense that could be material. | ||
Self-Insured Liabilities | Judgments and Uncertainties | |
| Effective January 1, 2010, we became self-insured with respect to healthcare claims, subject to stop-loss limits. We accrue for estimated self-insurance costs and uninsured exposures based on claims filed and an estimate of claims incurred but not reported as of each balance sheet date. However, it is possible that recorded accruals may not be adequate to cover the future payment of claims. Adjustments, if any, to estimated accruals resulting from ultimate claim payments will be reflected in earnings during the periods in which such adjustments are determined. | Our self-insured liabilities contain uncertainties because management is required to make assumptions and to apply judgment to estimate the ultimate cost to settle reported claims and claims incurred but not reported at the balance sheet date. Effect if Actual Results Differ from Assumptions We do not believe there is a reasonable likelihood that there will be a material change in the estimates or assumptions we use to calculate our self-insured liabilities. However, if actual results are not consistent with our estimates or assumptions, we may be exposed to losses or gains that could be material. |
29
| § | ||
|
| |
|
| |
| § | The increase in income from operations was partially | |
|
| |
| We | |
| While |
| § | |
| |
| NextGen Division revenue increased |
| § | Recurring revenue, which consists of maintenance and EDI revenue, increased 17.7% to $130.0 million and accounted for 48.8% of total NextGen Division revenue for the year ended March 31, | |
|
| |
|
|
| § | |
|
|
| During the year ended March 31, |
| growth from the ARRA. Our goals include taking maximum advantage of |
| § | The NextGen Division’s growth is attributed to a strong brand name and reputation within a growing marketplace for electronic health records and investments in sales and marketing activities, including new marketing campaigns, trade show attendance and other expanded advertising and marketing expenditures. We have also benefited from winning numerous industry awards for the NextGen Division’s flagship NextGenehr and NextGenpm software products and more recently in 2010 for its NextGen HIE product. Further, the increasing acceptance of electronic records technology in the healthcare industry continues to provide growth opportunities. |
§ | QSI | |
|
|
| § | An increase of 65.2% in system sales revenue during the year ended March 31, | |
|
|
| § | The QSI Dental Division is well-positioned to sell to the FQHCs market and intends to continue leveraging the NextGen Division’s sales force to sell its dental electronic medical records software to practices that provide both medical and dental services, such as FQHCs, which are receiving grants as part of the ARRA. |
| Our |
| § | Practice Solutions Division revenue increased 13.7% in the year ended March 31, 2011 and divisional operating income (excluding unallocated corporate expenses) increased 83.0% as compared to the prior year period. |
| § | The |
| § | Gross margin of $14.1 million in the year ended March 31, 2011 was negatively impacted by initial startup costs and other costs related to achieving higher production volume from a new business. |
| § | Operating income as a percentage of revenue increased to approximately 8.7% of revenue in the year ended March 31, 2011 versus 5.4% of revenue in the prior year period primarily as a result of higher RCM revenue, offset by increased costs related to transitioning to the NextGen |
30
| § | Inpatient Solutions Division revenue in the year ended March 31, 2011 was $17.9 million as compared to $2.9 million in the prior year period. This Division consists of two acquisitions, Opus and NextGen IS, acquired in February 2010 and August 2009, respectively. |
| Fiscal Year Ended March 31, | ||||||||||||
| (Unaudited) | 2011 | 2010 | 2009 | |||||||||
| Revenues: | ||||||||||||
| Software, hardware and supplies | 30.1 | % | 30.8 | % | 34.8 | % | ||||||
| Implementation and training services | 5.1 | 4.9 | 5.4 | |||||||||
| System sales | 35.2 | 35.7 | 40.2 | |||||||||
| Maintenance | 31.1 | 30.6 | 29.7 | |||||||||
| Electronic data interchange services | 11.6 | 12.0 | 12.0 | |||||||||
| Revenue cycle management and related services | 12.8 | 12.6 | 8.7 | |||||||||
| Other services | 9.3 | 9.2 | 9.3 | |||||||||
| Maintenance, EDI, RCM and other services | 64.8 | 64.3 | 59.8 | |||||||||
| Total revenues | 100.0 | 100.0 | 100.0 | |||||||||
| Cost of revenue: | ||||||||||||
| Software, hardware and supplies | 5.6 | 4.2 | 5.4 | |||||||||
| Implementation and training services | 4.2 | 4.1 | 4.2 | |||||||||
| Total cost of system sales | 9.8 | 8.3 | 9.6 | |||||||||
| Maintenance | 3.7 | 4.6 | 4.8 | |||||||||
| Electronic data interchange services | 7.8 | 8.7 | 8.7 | |||||||||
| Revenue cycle management and related services | 9.6 | 9.5 | 6.0 | |||||||||
| Other services | 5.2 | 7.0 | 7.1 | |||||||||
| Total cost of maintenance, EDI, RCM and other services | 26.2 | 29.7 | 26.6 | |||||||||
| Total cost of revenue | 36.1 | 38.0 | 36.2 | |||||||||
| Gross profit | 63.9 | 62.0 | 63.8 | |||||||||
| Operating expenses: | ||||||||||||
| Selling, general and administrative | 30.7 | 29.8 | 28.3 | |||||||||
| Research and development costs | 6.2 | 5.7 | 5.6 | |||||||||
| Amortization of acquired intangible assets | 0.5 | 0.6 | 0.4 | |||||||||
| Total operating expenses | 37.3 | 36.1 | 34.3 | |||||||||
| Income from operations | 26.6 | 25.9 | 29.5 | |||||||||
| Interest income | 0.1 | 0.1 | 0.5 | |||||||||
| Other income (expense), net | 0.0 | 0.1 | (0.1 | ) | ||||||||
| Income before provision for income taxes | 26.7 | 26.1 | 29.9 | |||||||||
| Provision for income taxes | 9.3 | 9.5 | 11.1 | |||||||||
| Net income | 17.4 | % | 16.6 | % | 18.8 | % | ||||||
31
|
|
|
|
|
|
|
|
|
|
|
(Unaudited) |
| Year Ended March 31, |
| |||||||
|
|
| ||||||||
|
| 2009 |
| 2008 |
| 2007 |
| |||
|
|
|
|
| ||||||
Revenues: |
|
|
|
|
|
|
|
|
|
|
Software, hardware and supplies |
|
| 34.8 | % |
| 40.9 | % |
| 43.8 | % |
Implementation and training services |
|
| 5.4 |
|
| 7.2 |
|
| 7.8 |
|
|
|
|
|
| ||||||
|
|
|
|
|
|
|
|
|
|
|
System sales |
|
| 40.2 |
|
| 48.1 |
|
| 51.6 |
|
|
|
|
|
|
|
|
|
|
|
|
Maintenance |
|
| 29.7 |
|
| 30.3 |
|
| 26.7 |
|
Electronic data interchange services |
|
| 12.0 |
|
| 12.0 |
|
| 10.8 |
|
Revenue cycle management |
|
| 8.7 |
|
| 0.5 |
|
| 0.3 |
|
Other services |
|
| 9.3 |
|
| 9.1 |
|
| 10.6 |
|
|
|
|
|
| ||||||
|
|
|
|
|
|
|
|
|
|
|
Maintenance, EDI, RCM and other services |
|
| 59.8 | * |
| 51.9 |
|
| 48.4 |
|
|
|
|
|
| ||||||
|
|
|
|
|
|
|
|
|
|
|
Total revenue |
|
| 100.0 |
|
| 100.0 |
|
| 100.0 |
|
|
|
|
|
| ||||||
|
|
|
|
|
|
|
|
|
|
|
Cost of revenue: |
|
|
|
|
|
|
|
|
|
|
Software, hardware and supplies |
|
| 5.4 |
|
| 5.8 |
|
| 5.4 |
|
Implementation and training services |
|
| 4.2 |
|
| 5.5 |
|
| 5.5 |
|
|
|
|
|
| ||||||
Total cost of system sales |
|
| 9.6 |
|
| 11.3 |
|
| 10.9 |
|
|
|
|
|
|
|
|
|
|
|
|
Maintenance |
|
| 4.8 |
|
| 6.7 |
|
| 7.5 |
|
Electronic data interchange services |
|
| 8.7 |
|
| 8.5 |
|
| 7.7 |
|
Revenue cycle management |
|
| 6.0 |
|
| 0.3 |
|
| 0.2 |
|
Other services |
|
| 7.1 |
|
| 6.7 |
|
| 6.0 |
|
|
|
|
|
| ||||||
Total cost of maintenance, EDI, RCM and other services |
|
| 26.6 |
|
| 22.2 |
|
| 21.4 |
|
|
|
|
|
| ||||||
|
|
|
|
|
|
|
|
|
|
|
Total cost of revenue |
|
| 36.2 |
|
| 33.5 |
|
| 32.3 |
|
|
|
|
|
| ||||||
Gross profit |
|
| 63.8 | * |
| 66.5 |
|
| 67.7 |
|
|
|
|
|
| ||||||
Operating expenses: |
|
|
|
|
|
|
|
|
|
|
Selling, general and administrative |
|
| 28.7 |
|
| 28.6 |
|
| 28.8 |
|
Research and development |
|
| 5.6 |
|
| 6.1 |
|
| 6.5 |
|
|
|
|
|
| ||||||
Income from operations |
|
| 29.5 | * |
| 31.8 |
|
| 32.4 |
|
|
|
|
|
| ||||||
Interest income |
|
| 0.5 |
|
| 1.4 |
|
| 2.1 |
|
Other income (expense) |
|
| (0.1 | ) |
| 0.5 |
|
| 0.0 |
|
|
|
|
|
| ||||||
Income before provision for income taxes |
|
| 29.9 | * |
| 33.7 |
|
| 34.5 |
|
Provision for income taxes |
|
| 11.1 |
|
| 12.3 |
|
| 13.3 |
|
|
|
|
|
| ||||||
Net income |
|
| 18.8 | %* |
| 21.4 | % |
| 21.1 | %* |
|
|
|
|
| ||||||
|
|
|
|
|
|
|
|
|
|
|
* does not foot due to rounding |
|
|
|
|
|
|
|
|
|
|
• • • year period. The following table breaks down our reported system sales into software, hardware, 32 Software Hardware, Third Implementation Total System Year ended March 31, 2009 QSI Division $ 915 $ 1,171 $ 938 $ 3,024 NextGen Division 76,525 6,775 12,437 95,737 Consolidated $ 77,440 $ 7,946 $ 13,375 $ 98,761 Year ended March 31, 2008 QSI Division $ 360 $ 1,134 $ 1,154 $ 2,648 NextGen Division 69,276 5,593 12,252 87,121 Consolidated $ 69,636 $ 6,727 $ 13,406 $ 89,769 20092011 and March 31, 2008For20102009, our2010 were included with the NextGen Division. During fiscal year 2011, as a result of certain organization changes, the composition of the Company’s NextGen Division was revised to exclude Opus and NextGen IS, both of which are now aggregated in the Company’s Inpatient Solutions Division. The Company now operates four reportable segments (not including Corporate), comprised of the NextGen Division, the Inpatient Solutions Division, the QSI Dental Division and the Practice Solutions Division.$46.1$61.6 million, or $1.65$2.13 per share on a basic and $1.62$2.12 per share on a fully diluted basis. In comparison, we earned $40.1$48.4 million, or $1.47$1.69 per share on a basic and $1.44$1.68 per share on a fully diluted basis infor the year ended March 31, 2008.2010. The increase in net income for the year ended March 31, 20092011 was achieved primarily throughattributed to the following:a 31.6%21.1% increase in consolidated revenue, including $21.4an increase in revenues of $37.8 million in RCM revenue from our recently acquired entities;NextGen Division, $15.0 million from our Inpatient Solutions Division and $5.9 million from our Practice Solutions Division;•a 34.7%16.5% increase in NextGen Division revenue, which accounted for 93.5%75.4% of consolidated revenue;•a shift in•an increase of recurring revenue, mix with increasedincluding RCM, maintenance and EDI and RCM revenue, resulting in a decline in our gross profit margin;which accounted for 55.5% of total consolidated revenue;•offset by an increase in selling, general and administrative expenses as a percentage of revenue related to higher than usual legal expenses, primarily as a result of certain legal matters related to intellectual property infringement claims in the NextGen Division and a proxy contest;research and•a decrease in interest income primarily due a greater proportion of funds invested in short-term U.S Treasuries and tax free money market accounts which returned significantly lower interest rates as compared to the prior year.20092011 increased 31.6%21.1% to $245.5$353.4 million from $186.5$291.8 million for the year ended March 31, 2008.2010. NextGen Division revenue increased 34.7%16.5% to $229.7$266.5 million from $170.5$228.7 million in the year ended March 31, 2008,2010 while QSI Dental Division revenue decreased by 1.2%increased 16.6% to $20.0 million from $17.1 million and Practice Solutions Division revenue increased 13.7% during that same period to $15.9$49.0 million from $16.0$43.1 million. NextGen revenue is inclusive of approximately $15.6 million in revenue from HSI and $8.6 million in revenue from PMP, our two recent RCM acquisitions.We divide revenue into two categories, “system sales” and “maintenance, EDI, RCM and other services.” Revenue in the system sales category includes software license fees, third party hardware and software, and implementation and training services related to purchase of our software systems. The majority of the revenue in the system sales category is related to the sale of software. Revenue in the maintenance, EDI, RCM and other services category includes maintenance, EDI, RCM, follow-on training and implementation services, annual third party license fees, hosting and other revenue. Maintenance revenue includes amounts initially deferred in conjunction with new customer arrangements and subsequently amortized and billings to existing customers.20092011 increased 10.0%19.6% to $98.8$124.5 million from $89.8$104.1 million in the prior year.9.9%12.6% increase in category revenue at our NextGen Division, whose sales in this category grew from $87.1to $108.9 million during the year ended March 31, 2008 to $95.72011 from $96.7 million during the same prior year ended March 31, 2009.period. This increase was driven by higher sales of NextGenehr and NextGenepm software to both new and existing clients, as well as increases in sales of hardware third partyand third-party software and supplies and implementation and training services.Systems sales revenue in the QSI Division increased to approximately $3.0 million in the year ended March 31, 2009 from $2.6 million in the year ended March 31, 2008.third partythird-party software, supplies and implementation and training services components by division:on a consolidated and divisional basis for the years ended March 31, 2011 and 2010 (in thousands): Hardware, Third Implementation Party Software and Training Total System Software and Supplies Services Sales Fiscal Year Ended March 31, 2011 QSI Dental Division $ 3,239 $ 2,190 $ 1,066 $ 6,495 NextGen Division 84,812 8,979 15,097 108,888 Inpatient Solutions Division 6,187 612 1,482 8,281 Practice Solutions Division 473 22 370 865 Consolidated $ 94,711 $ 11,803 $ 18,015 $ 124,529 Fiscal Year Ended March 31, 2010 QSI Dental Division $ 1,699 $ 1,409 $ 825 $ 3,933 NextGen Division 78,703 4,931 13,058 96,692 Inpatient Solutions Division 1,129 13 226 1,368 Practice Solutions Division 1,877 — 267 2,144 Consolidated $ 83,408 $ 6,353 $ 14,376 $ 104,137
Party Software
and Supplies
and Training
Services
Sales
our clients.
The NextGen Division’s growth has come in part from investments in sales and marketing activities including a revamped NextGen.com Web site, new NextGen logo, new marketing campaigns, trade show attendance, and other expanded advertising and marketing expenditures. We have also benefited from winning numerous industry awards for the NextGen Division’s flagship NextGenehr and NextGenepm software products and the apparent increasing acceptance of electronic medical records technology in the healthcare industry.
year ended March 31, 2011.
Dental Division maintenance, EDI and other revenue decreased 4.2% to $12.8 million for the year ended March 31, 20092011 increased $0.3 million to $13.5 million compared to $13.4$13.2 million for the same prior year period. For the year ended March 31, 2011, RCM revenue grew $8.4 million to $45.1 million compared to $36.7 million in the prior year.
year period primarily as a result of increases in RCM revenue to new and existing clients.
| Maintenance | EDI | RCM | Other | Total | ||||||||||||||||
| Fiscal Year Ended March 31, 2011 | ||||||||||||||||||||
| QSI Dental Division | $ | 7,329 | $ | 4,891 | $ | — | $ | 1,251 | $ | 13,471 | ||||||||||
| NextGen Division | 93,890 | 36,131 | — | 27,637 | 157,658 | |||||||||||||||
| Inpatient Solutions Division | 8,642 | — | — | 975 | 9,617 | |||||||||||||||
| Practice Solutions Division | 158 | — | 45,065 | 2,865 | 48,088 | |||||||||||||||
| Consolidated | $ | 110,019 | $ | 41,022 | $ | 45,065 | $ | 32,728 | $ | 228,834 | ||||||||||
| �� | ||||||||||||||||||||
| Fiscal Year Ended March 31, 2010 | ||||||||||||||||||||
| QSI Dental Division | $ | 7,217 | $ | 5,038 | $ | — | $ | 940 | $ | 13,195 | ||||||||||
| NextGen Division | 80,451 | 29,997 | — | 21,589 | 132,037 | |||||||||||||||
| Inpatient Solutions Division | 1,416 | — | — | 108 | 1,524 | |||||||||||||||
| Practice Solutions Division | 108 | — | 36,665 | 4,145 | 40,918 | |||||||||||||||
| Consolidated | $ | 89,192 | $ | 35,035 | $ | 36,665 | $ | 26,782 | $ | 187,674 | ||||||||||
33
|
|
|
|
|
|
|
|
|
|
|
|
|
|
|
|
|
|
| Maintenance |
| EDI |
| Revenue Cycle |
| Other |
| Total |
| |||||
|
|
|
|
|
|
| ||||||||||
|
|
|
|
|
|
|
|
|
|
|
|
|
|
|
|
|
Year ended March 31, 2009 |
|
|
|
|
|
|
|
|
|
|
|
|
|
|
|
|
QSI Division |
| $ | 7,167 |
| $ | 4,766 |
| $ | — |
| $ | 894 |
| $ | 12,827 |
|
NextGen Division |
|
| 65,695 |
|
| 24,756 |
|
| 21,431 |
|
| 22,045 |
|
| 133,927 |
|
|
|
|
|
|
|
| ||||||||||
Consolidated |
| $ | 72,862 |
| $ | 29,522 |
| $ | 21,431 |
| $ | 22,939 |
| $ | 146,754 |
|
|
|
|
|
|
|
| ||||||||||
|
|
|
|
|
|
|
|
|
|
|
|
|
|
|
|
|
Year ended March 31, 2008 |
|
|
|
|
|
|
|
|
|
|
|
|
|
|
|
|
QSI Division |
| $ | 7,186 |
| $ | 4,564 |
| $ | — |
| $ | 1,639 |
| $ | 13,389 |
|
NextGen Division |
|
| 49,269 |
|
| 17,886 |
|
| 871 |
|
| 15,316 |
|
| 83,342 |
|
|
|
|
|
|
|
| ||||||||||
Consolidated |
| $ | 56,455 |
| $ | 22,450 |
| $ | 871 |
| $ | 16,955 |
| $ | 96,731 |
|
|
|
|
|
|
|
| ||||||||||
The following table providesclients. Growth in other services revenue is primarily due to increases in third-party annual software licenses, consulting services and hosting services revenue.
|
|
|
|
|
|
|
|
|
|
|
|
|
|
|
|
|
|
|
|
|
| NextGen |
| QSI |
| Consolidated |
| ||||||||||||
|
|
|
|
| |||||||||||||||
|
| Maintenance |
| EDI |
| Maintenance |
| EDI |
| Maintenance |
| EDI |
| ||||||
|
|
|
|
| |||||||||||||||
|
|
|
|
|
|
|
|
|
|
|
|
|
|
|
|
|
|
|
|
March 31, 2008 |
|
| 1,129 |
|
| 993 |
|
| 251 |
|
| 165 |
|
| 1,380 |
|
| 1,158 |
|
Billing sites added |
|
| 246 |
|
| 533 |
|
| 14 |
|
| 39 |
|
| 260 |
|
| 572 |
|
Billing sites removed |
|
| (15 | ) |
| (258 | ) |
| (14 | ) |
| (44 | ) |
| (29 | ) |
| (302 | ) |
|
|
|
|
|
|
|
| ||||||||||||
|
|
|
|
|
|
|
|
|
|
|
|
|
|
|
|
|
|
|
|
March 31, 2009 |
|
| 1,360 |
|
| 1,268 |
|
| 251 |
|
| 160 |
|
| 1,611 |
|
| 1,428 |
|
|
|
|
|
|
|
|
| ||||||||||||
2011.
The following table details revenue and cost of revenue on a consolidated and divisional basis for the years ended March 31, 20092011 and 2008:
|
|
|
|
|
|
|
|
|
|
|
|
|
|
|
| Year Ended March 31, |
| ||||||||||
|
|
| |||||||||||
|
| 2009 |
| % |
| 2008 |
| % |
| ||||
|
|
|
|
|
| ||||||||
QSI Division |
|
|
|
|
|
|
|
|
|
|
|
|
|
Revenue |
| $ | 15,852 |
|
| 100.0 | % | $ | 16,037 |
|
| 100.0 | % |
Cost of revenue |
|
| 7,582 |
|
| 47.8 | % |
| 7,545 |
|
| 47.0 | % |
|
|
|
|
|
| ||||||||
Gross profit |
| $ | 8,270 |
|
| 52.2 | % | $ | 8,492 |
|
| 53.0 | % |
|
|
|
|
|
| ||||||||
|
|
|
|
|
|
|
|
|
|
|
|
|
|
NextGen Division |
|
|
|
|
|
|
|
|
|
|
|
|
|
Revenue |
| $ | 229,663 |
|
| 100.0 | % | $ | 170,463 |
|
| 100.0 | % |
Cost of revenue |
|
| 81,308 |
|
| 35.4 | % |
| 54,956 |
|
| 32.2 | % |
|
|
|
|
|
| ||||||||
Gross profit |
| $ | 148,355 |
|
| 64.6 | % | $ | 115,507 |
|
| 67.8 | % |
|
|
|
|
|
| ||||||||
|
|
|
|
|
|
|
|
|
|
|
|
|
|
Consolidated |
|
|
|
|
|
|
|
|
|
|
|
|
|
Revenue |
| $ | 245,515 |
|
| 100.0 | % | $ | 186,500 |
|
| 100.0 | % |
Cost of revenue |
|
| 88,890 |
|
| 36.2 | % |
| 62,501 |
|
| 33.5 | % |
|
|
|
|
|
| ||||||||
Gross profit |
| $ | 156,625 |
|
| 63.8 | % | $ | 123,999 |
|
| 66.5 | % |
|
|
|
|
|
| ||||||||
2010 (in thousands):
| Fiscal Year Ended March 31, | ||||||||||||||||
| 2011 | % | 2010 | % | |||||||||||||
| QSI Dental Division | ||||||||||||||||
| Revenue | $ | 19,966 | 100.0 | % | $ | 17,128 | 100.0 | % | ||||||||
| Cost of revenue | 9,034 | 45.2 | % | 7,788 | 45.5 | % | ||||||||||
| Gross profit | $ | 10,932 | 54.8 | % | $ | 9,340 | 54.5 | % | ||||||||
| NextGen Division | ||||||||||||||||
| Revenue | $ | 266,546 | 100.0 | % | $ | 228,730 | 100.0 | % | ||||||||
| Cost of revenue | 78,496 | 29.4 | % | 73,122 | 32.0 | % | ||||||||||
| Gross profit | $ | 188,050 | 70.6 | % | $ | 155,608 | 68.0 | % | ||||||||
| Inpatient Solutions Division | ||||||||||||||||
| Revenue | $ | 17,898 | 100.0 | % | $ | 2,891 | 100.0 | % | ||||||||
| Cost of revenue | 4,671 | 26.1 | % | 412 | 14.3 | % | ||||||||||
| Gross profit | $ | 13,227 | 73.9 | % | $ | 2,479 | 85.7 | % | ||||||||
| Practice Solutions Division | ||||||||||||||||
| Revenue | $ | 48,953 | 100.0 | % | $ | 43,062 | 100.0 | % | ||||||||
| Cost of revenue | 34,896 | 71.3 | % | 29,485 | 68.5 | % | ||||||||||
| Gross profit | $ | 14,057 | 28.7 | % | $ | 13,577 | 31.5 | % | ||||||||
| Unallocated cost of revenue (1) | $ | 385 | N/A | $ | — | N/A | ||||||||||
| Consolidated | ||||||||||||||||
| Revenue | $ | 353,363 | 100.0 | % | $ | 291,811 | 100.0 | % | ||||||||
| Cost of revenue | 127,482 | 36.1 | % | 110,807 | 38.0 | % | ||||||||||
| Gross profit | $ | 225,881 | 63.9 | % | $ | 181,004 | 62.0 | % | ||||||||
| (1) | Relates to the amortization of software technology intangible assets acquired from the purchases of NextGen IS and Opus. |
34
|
|
|
|
|
|
|
|
|
|
|
|
|
|
|
|
|
|
|
|
|
| Hardware, |
| Payroll and |
| EDI |
| Other |
| Total |
| Gross |
| ||||||
|
|
|
|
|
|
|
| ||||||||||||
|
|
|
|
|
|
|
|
|
|
|
|
|
|
|
|
|
|
|
|
Year ended March 31, 2009 |
|
|
|
|
|
|
|
|
|
|
|
|
|
|
|
|
|
|
|
QSI Division |
| 7.6 | % |
| 19.8 | % |
| 17.1 | % |
| 3.3 | % |
| 47.8 | % |
| 52.2 | % |
|
NextGen Division |
| 3.5 | % |
| 14.8 | % |
| 7.8 | % |
| 9.3 | % |
| 35.4 | % |
| 64.6 | % |
|
|
|
|
|
|
|
|
|
|
|
|
|
|
| ||||||
Consolidated |
| 3.7 | % |
| 15.1 | % |
| 8.4 | % |
| 9.0 | % |
| 36.2 | % |
| 63.8 | % |
|
|
|
|
|
|
|
|
|
|
|
|
|
|
| ||||||
|
|
|
|
|
|
|
|
|
|
|
|
|
|
|
|
|
|
|
|
Year ended March 31, 2008 |
|
|
|
|
|
|
|
|
|
|
|
|
|
|
|
|
|
|
|
QSI Division |
| 8.0 | % |
| 19.1 | % |
| 15.7 | % |
| 4.2 | % |
| 47.0 | % |
| 53.0 | % |
|
NextGen Division |
| 3.8 | % |
| 11.2 | % |
| 7.5 | % |
| 9.7 | % |
| 32.2 | % |
| 67.8 | % |
|
|
|
|
|
|
|
|
|
|
|
|
|
|
| ||||||
Consolidated |
| 4.2 | % |
| 11.8 | % |
| 8.2 | % |
| 9.3 | % |
| 33.5 | % |
| 66.5 | % |
|
|
|
|
|
|
|
|
|
|
|
|
|
|
| ||||||
The increase in our consolidated cost of revenue as a percentage of revenue between the year ended March 31, 2009 and the year ended March 31, 2008 is primarily attributable to an increase in RCM revenue, which carries higher payroll and related benefits as a percentage of revenue and higher EDI costs in both divisions, offset by a decrease in hardware and third party software, and other expense as a percentage of revenue. Other expense, which consists of outside service costs, amortization of software development costs and other costs, decreased to 9.0% of total revenue during the year ended March 31, 2009 from 9.3% of total revenue during the year ended March 31, 2008.
2010:
| Hardware, | Payroll and | |||||||||||||||||||||||
| Third Party | Related | Total Cost | ||||||||||||||||||||||
| Software | Benefits | EDI | Other | of Revenue | Gross Profit | |||||||||||||||||||
| Fiscal Year Ended March 31, 2011 | ||||||||||||||||||||||||
| QSI Dental Division | 8.7 | % | 17.7 | % | 11.6 | % | 7.2 | % | 45.2 | % | 54.8 | % | ||||||||||||
| NextGen Division | 2.9 | % | 11.8 | % | 8.1 | % | 6.6 | % | 29.4 | % | 70.6 | % | ||||||||||||
| Inpatient Solutions Division | 5.4 | % | 16.7 | % | 0.0 | % | 4.0 | % | 26.1 | % | 73.9 | % | ||||||||||||
| Practice Solutions Division | 0.0 | % | 43.8 | % | 0.5 | % | 27.0 | % | 71.3 | % | 28.7 | % | ||||||||||||
| Consolidated | 3.0 | % | 16.8 | % | 6.9 | % | 9.4 | % | 36.1 | % | 63.9 | % | ||||||||||||
| Fiscal Year Ended March 31, 2010 | ||||||||||||||||||||||||
| QSI Dental Division | 8.5 | % | 13.8 | % | 16.0 | % | 7.2 | % | 45.5 | % | 54.5 | % | ||||||||||||
| NextGen Division | 2.5 | % | 13.4 | % | 9.6 | % | 6.5 | % | 32.0 | % | 68.0 | % | ||||||||||||
| Inpatient Solutions Division | 3.1 | % | 0.0 | % | 0.0 | % | 11.2 | % | 14.3 | % | 85.7 | % | ||||||||||||
| Practice Solutions Division | 0.5 | % | 43.6 | % | 1.1 | % | 23.3 | % | 68.5 | % | 31.5 | % | ||||||||||||
| Consolidated | 2.5 | % | 17.7 | % | 8.7 | % | 9.1 | % | 38.0 | % | 62.0 | % | ||||||||||||
Our payroll and benefits expense associated with delivering our products and services increaseddecreased to 15.1%16.8% of consolidated revenue in the year ended March 31, 20092011 compared to 11.8%17.7% during the year ended March 31, 2008 primarily due to the acquisition of HSI and PMP which as service businesses have an inherently higher percentage of payroll costs as a percentage of revenue.same period last year. The absolute level of consolidated payroll and benefit expenses grew from $22.1$51.8 million in the year ended March 31, 20082010 to $37.1$59.3 million in the year ended March 31, 2009,2011, an increase of 67.9%14.7%, or approximately $15.0$7.5 million. Of the $15.0$7.5 million increase, approximately $4.8$2.7 million was a result of the HSI acquisitionincrease is related to the Practice Solutions Division because RCM is a service business, which inherently has higher percentage of payroll costs as a percentage of revenue. Increases of $1.2 million in the QSI Dental Division and $3.9$0.7 million was a result ofin the PMP acquisition. In addition, relatedNextGen Division for the year ended March 31, 2011 are primarily due to headcount additions and increased headcount and payroll and benefits expense associated with delivering products and services inservices. For the NextGenInpatient Solutions Division, increased by $6.1 million in the year ended March 31, 2009 to $25.1 million from $19.0 million in the year ended March 31, 2008. Payrollpayroll and benefits expense associated with delivering our products and services increased $2.9 million because fiscal year 2010 included only two months of payroll and benefits expenses for Opus, which was acquired in the QSI Division remained consistent at $3.1 million inFebruary 2010, as compared to a full year of expenses for the year ended March 31, 2009 and 2008, respectively.2011. The applicationamount of SFAS 123R added approximately $0.2 million and $0.5 million inshare-based compensation expense toincluded in cost of revenue in thewas $0.3 million and $0.1 million for years ended March 31, 20092011 and 2008,2010, respectively.
year period.
We do not currently intend to make any significant additions to related headcount at the QSI Division.
| • | |||
| $ | ||
| • | $4.6 million increase due to a full year of selling and administrative expenses from Opus, which was acquired in February 2010; | ||
| • | $3.2 million increase in sales commissions primarily related to the NextGen Division; | ||
• | $ | ||
• | $ | ||
• | $ | ||
• | $ | ||
|
|
Approximately $1.5 million of the year over year increase in corporate related35
The application of SFAS 123R added approximately $1.5 million and $2.5 million in compensation expense to selling, general and administrative expenses for the yearyears ended March 31, 20092011 and 2008,2010, respectively, and is included in the aforementioned amounts. Selling, general and administrative expenses as a percentage of revenue increased slightly from 28.6%29.8% in the year ended March 31, 20082010 to 28.7%30.7% in the year ended March 31, 2009.
2011.
compensation expense to research and development costs net of amounts capitalized as software development in those fiscal years.2011. Additions to capitalized software costs offset increases in research and development costs. For the year ended March 31, 2009, $5.9 million was added2011, our additions to capitalized software costs while $6.0increased to $10.7 million wascompared to $7.9 million capitalized during the same prior year ended March 31, 2008.period as we continue to enhance our software to meet the Meaningful Use definitions under the ARRA. Research and development costs as a percentage of revenue decreasedincreased to 5.6%6.2% in the year ended March 31, 20092011 from 6.1% in5.7% for the same prior year ended March 31, 2008.period. Research and development expenses are expected to continue at or above current dollar levels.
levels as the Company is developing a new integrated inpatient and outpatient, web-based software platform. Share-based compensation expense included in research and development costs, net of amounts capitalized as software development, was $0.2 million and $0.1 million for years ended March 31, 2011 and 2010, respectively.
|
| |
|
| |
|
|
of dividends and interest earned on our investments.
Other Income (Expense). Other income (expense) for the year ended March 31, 2009 consists of gains and losses in fair value recorded on our ARS investments as well as on our ARS Put Option Rights. We recognized a pre-tax unrealized loss on our ARS of approximately $0.7 million. At the same time, we estimated the fair value of our ARS Put Option Rights at approximately $0.4 million.
Included in other income for the year ended March 31, 2008 was approximately $1.0 million, resulting from a gain on life insurance proceeds due to the passing of Gregory Flynn, Executive Vice President and General Manager of the QSI Division. Mr. Flynn participated in our deferred compensation plan which is funded through the purchase of life insurance policies with the Company named as beneficiary. There was no gain or loss recorded on investment securities during the year ended March 31, 2008.
rate.
36
2009
• |
| an 18.9% increase in consolidated |
| revenue, including an increase of $27.7 million in revenue from our NextGen Division and an increase of $17.4 million in revenue from our Practice Solutions Division; | |||
| • | a | |
|
| an increase of recurring revenue, including RCM, maintenance and EDI revenue, offset by | |
| • | an increase in selling, general and administrative expenses as a percentage of | ||
| • | a decrease in |
The above increases to net income were offset by a decline in gross profit margin resulting from a greater proportion of revenue being derived from hardware and EDI revenue which have relatively lower gross margin percentages. The gross profit margin declined to 66.5% in the year ended March 31, 2008 versus 67.7% in the prior year period.
We divide Practice Solutions Division revenue into two categories, “system sales”was impacted positively in fiscal year 2010 as a result of including a full year of results versus approximately ten and “maintenance, EDI, RCMfive months of results for HSI and other services”. RevenuePMP, respectively, in the system sales category includes software license fees, third party hardware and software, and implementation and training services related to purchase of our software systems. The majority of the revenue in the system sales category is related to the sale of software. Revenue in the maintenance, EDI, RCM and other services category includes maintenance, EDI, RCM, follow-on training and implementation services, annual third party license fees, hosting and other revenue. Maintenance revenue includes amounts initially deferred in conjunction with new customer arrangements and subsequently amortized and billings to existing customers.
fiscal year 2009.
year period.
Systems sales revenue in the QSI Division decreased to approximately $2.6 million in the year ended March 31, 2008 from $3.4 million in the year ended March 31, 2007.
training services.
| Hardware, Third | Implementation | |||||||||||||||
| Party Software | and Training | Total System | ||||||||||||||
| Software | and Supplies | Services | Sales | |||||||||||||
| Fiscal Year Ended March 31, 2010 | ||||||||||||||||
| QSI Dental Division | $ | 1,699 | $ | 1,409 | $ | 825 | $ | 3,933 | ||||||||
| NextGen Division | 79,832 | 4,944 | 13,284 | 98,060 | ||||||||||||
| Practice Solutions Division | 1,877 | — | 267 | 2,144 | ||||||||||||
| Consolidated | $ | 83,408 | $ | 6,353 | $ | 14,376 | $ | 104,137 | ||||||||
| Fiscal Year Ended March 31, 2009 | ||||||||||||||||
| QSI Dental Division | $ | 915 | $ | 1,171 | $ | 938 | $ | 3,024 | ||||||||
| NextGen Division | 74,128 | 6,775 | 12,437 | 93,340 | ||||||||||||
| Practice Solutions Division | 2,397 | — | — | 2,397 | ||||||||||||
| Consolidated | $ | 77,440 | $ | 7,946 | $ | 13,375 | $ | 98,761 | ||||||||
37
|
|
|
|
|
|
|
|
|
|
|
|
|
|
|
| Software |
| Hardware, Third |
| Implementation |
| Total System |
| ||||
|
|
| |||||||||||
Year ended March 31, 2008 |
|
|
|
|
|
|
|
|
|
|
|
|
|
QSI Division |
| $ | 360 |
| $ | 1,134 |
| $ | 1,154 |
| $ | 2,648 |
|
NextGen Division |
|
| 69,276 |
|
| 5,593 |
|
| 12,252 |
|
| 87,121 |
|
|
|
|
|
|
| ||||||||
Consolidated |
| $ | 69,636 |
| $ | 6,727 |
| $ | 13,406 |
| $ | 89,769 |
|
|
|
|
|
|
| ||||||||
|
|
|
|
|
|
|
|
|
|
|
|
|
|
Year ended March 31, 2007 |
|
|
|
|
|
|
|
|
|
|
|
|
|
QSI Division |
| $ | 355 |
| $ | 2,356 |
| $ | 655 |
| $ | 3,366 |
|
NextGen Division |
|
| 62,957 |
|
| 3,203 |
|
| 11,522 |
|
| 77,682 |
|
|
|
|
|
|
| ||||||||
Consolidated |
| $ | 63,312 |
| $ | 5,559 |
| $ | 12,177 |
| $ | 81,048 |
|
|
|
|
|
|
| ||||||||
During the year ended March 31, 2008, 6.4%2010, 5.0% of the NextGen Division’s system sales revenue was represented by hardware and third partythird-party software compared to 4.1% in the prior year.7.3% during same period a year ago. The number of customersclients who purchase hardware and third partythird-party software and the dollar amount of hardware and third partythird-party software revenue fluctuates each quarter and year depending on the needs of customers.clients. The inclusion of hardware and third partythird-party software in the Division’s sales arrangements is typically at the request of the customer and is not a priority focus for us.
our clients.
The NextGen Division’s growth has come in part from investments in sales and marketing activities including hiring additional sales representatives, trade show attendance, and advertising expenditures. We have also benefited from winning numerous industry awards for the NextGen Division’s flagship NextGenehr and NextGenepm software products and the apparent increasing acceptance of electronic medical records technology in the healthcare industry.
current client base of the Practice Solutions Division.
The following table details maintenance, EDI, RCM and other services revenue by category on a consolidated and divisional basis for the years ended March 31, 20082010 and 2007:
|
|
|
|
|
|
|
|
|
|
|
|
|
|
|
|
|
|
| Maintenance |
| EDI |
| Revenue Cycle |
| Other |
| Total |
| |||||
|
|
|
|
|
|
| ||||||||||
Year ended March 31, 2008 |
|
|
|
|
|
|
|
|
|
|
|
|
|
|
|
|
QSI Division |
| $ | 7,186 |
| $ | 4,564 |
| $ | — |
| $ | 1,639 |
| $ | 13,389 |
|
NextGen Division |
|
| 49,269 |
|
| 17,886 |
|
| 871 |
|
| 15,316 |
|
| 83,342 |
|
|
|
|
|
|
|
| ||||||||||
Consolidated |
| $ | 56,455 |
| $ | 22,450 |
| $ | 871 |
| $ | 16,955 |
| $ | 96,731 |
|
|
|
|
|
|
|
| ||||||||||
|
|
|
|
|
|
|
|
|
|
|
|
|
|
|
|
|
Year ended March 31, 2007 |
|
|
|
|
|
|
|
|
|
|
|
|
|
|
|
|
QSI Division |
| $ | 7,081 |
| $ | 4,529 |
| $ | — |
| $ | 1,615 |
| $ | 13,225 |
|
NextGen Division |
|
| 34,867 |
|
| 12,520 |
|
| 534 |
|
| 14,971 |
|
| 62,892 |
|
|
|
|
|
|
|
| ||||||||||
Consolidated |
| $ | 41,948 |
| $ | 17,049 |
| $ | 534 |
| $ | 16,586 |
| $ | 76,117 |
|
|
|
|
|
|
|
| ||||||||||
The following table provides2009 (in thousands):
| Maintenance | EDI | RCM | Other | Total | ||||||||||||||||
| Fiscal Year Ended March 31, 2010 | ||||||||||||||||||||
| QSI Dental Division | $ | 7,217 | $ | 5,038 | $ | — | $ | 940 | $ | 13,195 | ||||||||||
| NextGen Division | 81,867 | 29,997 | — | 21,697 | 133,561 | |||||||||||||||
| Practice Solutions Division | 108 | — | 36,665 | 4,145 | 40,918 | |||||||||||||||
| Consolidated | $ | 89,192 | $ | 35,035 | $ | 36,665 | $ | 26,782 | $ | 187,674 | ||||||||||
| Fiscal Year Ended March 31, 2009 | ||||||||||||||||||||
| QSI Dental Division | $ | 7,167 | $ | 4,766 | $ | — | $ | 894 | $ | 12,827 | ||||||||||
| NextGen Division | 65,559 | 24,756 | — | 20,299 | 110,614 | |||||||||||||||
| Practice Solutions Division | 136 | — | 21,431 | 1,746 | 23,313 | |||||||||||||||
| Consolidated | $ | 72,862 | $ | 29,522 | $ | 21,431 | $ | 22,939 | $ | 146,754 | ||||||||||
38
|
|
|
|
|
|
|
|
|
|
|
|
|
|
|
| NextGen |
| QSI |
| Consolidated |
| ||||||
|
|
|
|
| |||||||||
|
| Maintenance |
| EDI |
| Maintenance |
| EDI |
| Maintenance |
| EDI |
|
|
|
|
|
|
|
|
| ||||||
March 31, 2007 |
| 982 |
| 769 |
| 257 |
| 173 |
| 1,239 |
| 942 |
|
Billing sites added |
| 194 |
| 289 |
| 9 |
| 29 |
| 203 |
| 318 |
|
Billing sites removed |
| (47 | ) | (65 | ) | (15 | ) | (37 | ) | (62 | ) | (102 | ) |
|
|
|
|
|
|
|
| ||||||
March 31, 2008 |
| 1,129 |
| 993 |
| 251 |
| 165 |
| 1,380 |
| 1,158 |
|
|
|
|
|
|
|
|
| ||||||
hosting services revenue.
The following table details revenue and cost of revenue on a consolidated and divisional basis for the years ended March 31, 20082010 and 2007:
|
|
|
|
|
|
|
|
|
|
|
|
|
|
|
| Year Ended March 31, |
| ||||||||||
|
|
| |||||||||||
|
| 2008 |
| % |
| 2007 |
| % |
| ||||
|
|
|
|
|
| ||||||||
QSI Division |
|
|
|
|
|
|
|
|
|
|
|
|
|
Revenue |
| $ | 16,037 |
|
| 100.0 | % | $ | 16,589 |
|
| 100.0 | % |
Cost of revenue |
|
| 7,545 |
|
| 47.0 | % |
| 7,847 |
|
| 47.3 | % |
|
|
|
|
|
| ||||||||
Gross profit |
| $ | 8,492 |
|
| 53.0 | % | $ | 8,742 |
|
| 52.7 | % |
|
|
|
|
|
| ||||||||
|
|
|
|
|
|
|
|
|
|
|
|
|
|
NextGen Division |
|
|
|
|
|
|
|
|
|
|
|
|
|
Revenue |
| $ | 170,463 |
|
| 100.0 | % | $ | 140,576 |
|
| 100.0 | % |
Cost of revenue |
|
| 54,956 |
|
| 32.2 | % |
| 42,937 |
|
| 30.5 | % |
|
|
|
|
|
| ||||||||
Gross profit |
| $ | 115,507 |
|
| 67.8 | % | $ | 97,639 |
|
| 69.5 | % |
|
|
|
|
|
| ||||||||
|
|
|
|
|
|
|
|
|
|
|
|
|
|
Consolidated |
|
|
|
|
|
|
|
|
|
|
|
|
|
Revenue |
| $ | 186,500 |
|
| 100.0 | % | $ | 157,165 |
|
| 100.0 | % |
Cost of revenue |
|
| 62,501 |
|
| 33.5 | % |
| 50,784 |
|
| 32.3 | % |
|
|
|
|
|
| ||||||||
Gross profit |
| $ | 123,999 |
|
| 66.5 | % | $ | 106,381 |
|
| 67.7 | % |
|
|
|
|
|
| ||||||||
2009 (in thousands):
| Fiscal Year Ended March 31, | ||||||||||||||||
| 2010 | % | 2009 | % | |||||||||||||
| QSI Dental Division | ||||||||||||||||
| Revenue | $ | 17,128 | 100.0 | % | $ | 15,851 | 100.0 | % | ||||||||
| Cost of revenue | 7,788 | 45.5 | % | 7,582 | 47.8 | % | ||||||||||
| Gross profit | $ | 9,340 | 54.5 | % | $ | 8,269 | 52.2 | % | ||||||||
| NextGen Division | ||||||||||||||||
| Revenue | $ | 231,621 | 100.0 | % | $ | 203,954 | 100.0 | % | ||||||||
| Cost of revenue | 73,534 | 31.7 | % | 65,311 | 32.0 | % | ||||||||||
| Gross profit | $ | 158,087 | 68.3 | % | $ | 138,643 | 68.0 | % | ||||||||
| Practice Solutions Division | ||||||||||||||||
| Revenue | $ | 43,062 | 100.0 | % | $ | 25,710 | 100.0 | % | ||||||||
| Cost of revenue | 29,485 | 68.5 | % | 15,997 | 62.2 | % | ||||||||||
| Gross profit | $ | 13,577 | 31.5 | % | $ | 9,713 | 37.8 | % | ||||||||
| Consolidated | ||||||||||||||||
| Revenue | $ | 291,811 | 100.0 | % | $ | 245,515 | 100.0 | % | ||||||||
| Cost of revenue | 110,807 | 38.0 | % | 88,890 | 36.2 | % | ||||||||||
| Gross profit | $ | 181,004 | 62.0 | % | $ | 156,625 | 63.8 | % | ||||||||
39
| Hardware, | Payroll and | |||||||||||||||||||||||
| Third Party | Related | Total Cost | ||||||||||||||||||||||
| Software | Benefits | EDI | Other | of Revenue | Gross Profit | |||||||||||||||||||
| Fiscal Year Ended March 31, 2010 | ||||||||||||||||||||||||
| QSI Dental Division | 8.5 | % | 13.8 | % | 16.0 | % | 7.2 | % | 45.5 | % | 54.5 | % | ||||||||||||
| NextGen Division | 2.5 | % | 13.4 | % | 9.6 | % | 6.2 | % | 31.7 | % | 68.3 | % | ||||||||||||
| Practice Solutions Division | 0.5 | % | 43.6 | % | 1.1 | % | 23.3 | % | 68.5 | % | 31.5 | % | ||||||||||||
| Consolidated | 2.5 | % | 17.7 | % | 8.7 | % | 9.1 | % | 38.0 | % | 62.0 | % | ||||||||||||
| Fiscal Year Ended March 31, 2009 | ||||||||||||||||||||||||
| QSI Dental Division | 7.6 | % | 19.8 | % | 17.1 | % | 3.3 | % | 47.8 | % | 52.2 | % | ||||||||||||
| NextGen Division | 3.9 | % | 11.0 | % | 9.1 | % | 8.0 | % | 32.0 | % | 68.0 | % | ||||||||||||
| Practice Solutions Division | 0.2 | % | 45.0 | % | 0.0 | % | 17.0 | % | 62.2 | % | 37.8 | % | ||||||||||||
| Consolidated | 3.7 | % | 15.1 | % | 8.4 | % | 9.0 | % | 36.2 | % | 63.8 | % | ||||||||||||
|
|
|
|
|
|
|
|
|
|
|
|
|
|
|
|
|
|
|
|
|
| Hardware, |
| Payroll and |
| EDI |
| Other |
| Total |
| Gross |
| ||||||
|
|
|
|
|
|
|
| ||||||||||||
Year ended March 31, 2008 |
|
|
|
|
|
|
|
|
|
|
|
|
|
|
|
|
|
|
|
QSI Division |
| 8.0 | % |
| 19.1 | % |
|
| 15.7 | % | 4.2 | % |
| 47.0 | % |
| 53.0 | % |
|
NextGen Division |
| 3.8 | % |
| 11.2 | % |
|
| 7.5 | % | 9.7 | % |
| 32.2 | % |
| 67.8 | % |
|
|
|
|
|
|
|
|
|
|
|
|
|
| |||||||
Consolidated |
| 4.2 | % |
| 11.8 | % |
|
| 8.2 | % | 9.3 | % |
| 33.5 | % |
| 66.5 | % |
|
|
|
|
|
|
|
|
|
|
|
|
|
| |||||||
|
|
|
|
|
|
|
|
|
|
|
|
|
|
|
|
|
|
|
|
Year ended March 31, 2007 |
|
|
|
|
|
|
|
|
|
|
|
|
|
|
|
|
|
|
|
QSI Division |
| 10.0 | % |
| 17.3 | % |
|
| 15.1 | % | 4.9 | % |
| 47.3 | % |
| 52.7 | % |
|
NextGen Division |
| 3.1 | % |
| 11.9 | % |
|
| 6.4 | % | 9.1 | % |
| 30.5 | % |
| 69.5 | % |
|
|
|
|
|
|
|
|
|
|
|
|
|
| |||||||
Consolidated |
| 3.8 | % |
| 12.4 | % |
|
| 7.4 | % | 8.7 | % |
| 32.3 | % |
| 67.7 | % |
|
|
|
|
|
|
|
|
|
|
|
|
|
| |||||||
the prior year period is primarily attributable to an increase in RCM revenue, which carries higher payroll and related benefits as a percentage of revenue and higher consolidated EDI costs, offset by a decrease in hardware and third party software as a percentage of revenue. Other expense, which primarily consists of third-party annual license and hosting costs, increased slightly to 9.1% of total revenue during the year ended March 31, 2010 as compared to 9.0% for the same period a year ago.
our clients.
application of SFAS 123R in fiscal year 2008 and 2007 added approximately $0.5decreased $0.7 million from $3.1 million in compensation to consolidated cost of revenue in both fiscal years.
We anticipate continued additions to headcount in the NextGen Division in areas related to delivering products and services in future periods, but due to the uncertainties in the timing of our sales arrangements, our sales mix, the acquisition and training of qualified personnel, and other issues, we cannot accurately predict if related headcount expense as a percentage of revenue will increase or decrease in the future.
We do not currently intend to make any significant changes to related headcount at the QSI Division.
“Other,” which consists of outside service costs, amortization of software development costs, hosting service costs and other service costs, increased to 17.5% of revenue during the year ended March 31, 2008 from 16.1% during2009 to $2.4 million in the year ended March 31, 2007.
Should the NextGen Division continue2010 primarily due to representheadcount additions. The amount of share-based compensation expense included in cost of revenue was $0.1 million and $0.2 million for years ended March 31, 2010 and 2009, respectively.
foregoing events and activities, the gross profit percentage for the Company decreased to 62.0% for the year ended March 31, 2010 versus 63.8% for the prior year period.
| • | $9.9 million increase in salaries and related expenses in the NextGen Division primarily as a result of headcount additions; | ||
| • | $2.5 million increase in marketing and trade shows in the NextGen Division; | ||
| • | $1.5 million increase from the acquisition of NextGen IS and Opus; | ||
| • | $3.3 million increase in corporate related expenses, primarily as a result of headcount additions and | ||
| • | $0.4 million increase in other selling and administrative expenses. |
40
The application of SFAS 123R in fiscal year 2008 and 2007 added approximately $2.5 million in compensation expense to consolidated selling, general and administrative expenses and is included in the aforementioned amounts.
We anticipate increased expenditures for trade shows, advertising and the employment of additional sales and administrative staff at the NextGen Division. We also anticipate future increases in corporate expenditures being made in areas including but not limited to staffing and professional services. While we expect selling, general and administrative expenses to increase on an absolute basis, we cannot accurately predict the impact these additional expenditures will have on selling, general, and administrative expenses as a percentage of revenue.
NextGen IS during fiscal year 2010. Other approximately $0.3 million. and a decrease in the state income tax expense. 4120082010 and 20072009 were $11.4$16.5 million and $10.2$13.8 million, respectively. The increaseincreases in research and development costs was primarilyexpenses were due in part to increased investment in the NextGen Division product line. Additionally,Additions to capitalized software costs offset increases in research and development costs. For the applicationyear ended March 31, 2010, our additions to capitalized software increased to $7.9 million compared to $5.9 million capitalized during the same prior year period. Research and development costs as a percentage of SFAS 123Rrevenue increased to 5.7% in fiscalthe year 2008 and 2007 added approximately $0.8 million in both periods, inended March 31, 2010 from 5.6% for the same prior year period. Share-based compensation expense toincluded in research and development costs, net of amounts capitalized as software development, in those fiscal years. Additions to capitalized software costs offset researchwas $0.1 million and development costs. For the year$0.2 million for years ended March 31, 2008, $6.0 million was added2010 and 2009, respectively.capitalized software costs while $5.0 million was capitalized duringacquired intangible assets for the yearyears ended March 31, 2007. Research2010 and development costs as a percentage of net revenue decreased to 6.1%2009 were $1.8 million and $1.0 million, respectively. The increase in the year ended March 31, 2008 from 6.5% in the year ended March 31, 2007amortization expense is primarily due to revenue growing at a faster rate than the increase in researchaddition of customer relationships and development costs. Researchsoftware technology intangible assets, which were acquired through the acquisitions of Opus and development costs are expected to continue at or above current levels.20082010 decreased to $2.7$0.2 million compared to $3.3$1.2 million in the prior year period primarily due to significantly lower interest rates received on the Company’s cash investments, which are primarily in institutional money market accounts. Short term interest rates were at historic lows for most of the year ended March 31, 2007. Interest income in the year ended March 31, 2008 decreased primarily due to (i) a greater proportion of funds invested in tax favored ARS which offer lower interest rates but higher after-tax yields compared to money market or short term U.S. Treasuries, and (ii) comparatively lower short term interest rates in the year ended March 31, 2008 versus 2007.2010.Our investment policy is determined by our Board. We currently maintain our cash in very liquid short term assets including money market funds, 30-60 day treasury bills as well as ARS.Income.Income (Expense).Other income (expense) for the year ended March 31, 2008 was approximately $1.0 million. There was no other income2010 consists of gains and losses in fair value recorded for the year ended March 31, 2007.on our auction rate securities (“ARS”) investments as well as on our ARS put option rights. We recorded aan overall gain on life insurance proceeds as a resultour ARS and ARS put option rights of the passing of Gregory Flynn, Executive Vice President and General Manager of the QSI Division. Mr. Flynn participated in our deferred compensation plan which is funded through the purchase of life insurance policies with the Company named as beneficiary.yearyears ended March 31, 2008 was approximately $22.92010 and 2009 were $27.8 million as compared to approximately $21.0and $27.2 million, for the prior year.respectively. The effective tax rates were 36.5% and 37.1% for fiscal 2008the years ended March 31, 2010 and 2007 were 36.4% and 38.7%,2009, respectively. The provision for income taxes for the years ended March 31, 20082010 and 20072009 differs from the combined statutory rates primarily due to the impact of varying state income tax rates, research and development tax credits, the qualified production activities deduction and exclusions for company-ownedCompany-owned life insurance proceeds and tax-exempt interest income. The change in the effective rate for the year ended March 31, 2008 also2010 includes an increase in the benefit from the qualified production activities deduction which was mostly offset by non-deductible option expense related to incentive stock options.20082010 and 2007,2009, we claimedrecognized research and development tax credits of approximately $0.8$0.7 million in both years. Weand $1.0 million, respectively. The Company also claimed the qualified production activities deduction under Section 199 of the IRC of approximately $3.1$4.1 million and $1.5$2.7 million during the years ended March 31, 20082010 and 2007,2009, respectively. Research and development credits and the qualified production activities income deduction takencalculated by us involve certain assumptions and judgments regarding qualification of expenses under the relevant tax code provision.
|
|
|
|
|
|
|
|
|
|
|
|
| Year Ended March 31, |
| |||||||
|
|
| ||||||||
|
| 2009 |
| 2008 |
| 2007 |
| |||
|
|
|
|
| ||||||
Cash and cash equivalents |
| $ | 70,180 |
| $ | 59,046 |
| $ | 60,028 |
|
|
|
|
|
|
|
|
|
|
|
|
Net increase (decrease) in cash and cash equivalents |
| $ | 11,134 |
| $ | (982 | ) | $ | 2,803 |
|
|
|
|
|
|
|
|
|
|
|
|
Net income |
| $ | 46,119 |
| $ | 40,078 |
| $ | 33,232 |
|
|
|
|
|
|
|
|
|
|
|
|
Net cash provided by operations during the year |
| $ | 48,712 |
| $ | 43,599 |
| $ | 29,570 |
|
|
|
|
|
|
|
|
|
|
|
|
Number of days of sales outstanding |
|
| 125 |
|
| 136 |
|
| 129 |
|
(dollar amounts in thousands):
| Fiscal Year Ended March 31, | ||||||||||||
| 2011 | 2010 | 2009 | ||||||||||
| Cash and cash equivalents | $ | 116,617 | $ | 84,611 | $ | 70,180 | ||||||
| Net increase in cash and cash equivalents | $ | 32,006 | $ | 14,431 | $ | 11,134 | ||||||
| Net income | $ | 61,606 | $ | 48,379 | $ | 46,119 | ||||||
| Net cash provided by operating activities | $ | 70,064 | $ | 55,220 | $ | 48,712 | ||||||
| Number of days of sales outstanding | 131 | 125 | 125 | |||||||||
The following table summarizes our statementconsolidated statements of cash flows for the years ended March 31, 2011, 2010 and 2009 2008 and 2007:
|
|
|
|
|
|
|
|
|
|
|
|
| Year Ended March 31, |
| |||||||
|
|
| ||||||||
|
| 2009 |
| 2008 |
| 2007 |
| |||
|
|
|
|
| ||||||
Net income |
| $ | 46,119 |
| $ | 40,078 |
| $ | 33,232 |
|
|
|
|
|
|
|
|
|
|
|
|
Non-cash expenses |
|
| 17,719 |
|
| 11,299 |
|
| 8,977 |
|
|
|
|
|
|
|
|
|
|
|
|
Gain on life insurance proceeds, net |
|
| — |
|
| (755 | ) |
| — |
|
|
|
|
|
|
|
|
|
|
|
|
Tax benefit from exercise of stock options, net |
|
| 1 |
|
| 65 |
|
| 167 |
|
|
|
|
|
|
|
|
|
|
|
|
Change in deferred revenue |
|
| 3,130 |
|
| 5,447 |
|
| 3,532 |
|
|
|
|
|
|
|
|
|
|
|
|
Change in accounts receivable |
|
| (11,369 | ) |
| (13,811 | ) |
| (20,760 | ) |
|
|
|
|
|
|
|
|
|
|
|
Change in other assets and liabilities |
|
| (6,888 | ) |
| 1,276 |
|
| 4,422 |
|
|
|
|
|
| ||||||
|
|
|
|
|
|
|
|
|
|
|
Net cash provided by operating activities |
| $ | 48,712 |
| $ | 43,599 |
| $ | 29,570 |
|
|
|
|
|
| ||||||
(in thousands):
| Fiscal Year Ended March 31, | ||||||||||||
| 2011 | 2010 | 2009 | ||||||||||
| Net income | $ | 61,606 | $ | 48,379 | $ | 46,119 | ||||||
| Non-cash expenses | 17,978 | 16,152 | 17,720 | |||||||||
| Change in deferred revenue | 13,211 | 12,528 | 3,130 | |||||||||
| Change in accounts receivable | (36,094 | ) | (18,944 | ) | (11,369 | ) | ||||||
| Change in other assets and liabilities | 13,363 | (2,895 | ) | (6,888 | ) | |||||||
| Net cash provided by operating activities | $ | 70,064 | $ | 55,220 | $ | 48,712 | ||||||
Tax Benefits From Stock Options. Althoughnon-cash expenses for the value of stock options exercised by employees grew inyear ended March 31, 2010 as compared to the yearsyear ended March 31, 2009 March 31, 2008is primarily related to decreases of approximately $5.2 million in deferred income tax benefit and 2007, our application$0.1 million in loss on the disposal of SFAS 123R required excess tax benefitsequipment and improvements, offset by increases of $3.4approximately $0.8 million $1.3in depreciation, $0.8 million of amortization of capitalized software costs, $0.7 million of amortization of other intangibles, $1.4 million in bad debt expense and $2.5$0.1 million respectively, to be reclassed to financing activities, resulting in a net decrease in the years ended March 31, 2009, 2008 and 2007.
share-based compensation.
42
Accounts Receivable. Accounts receivable grew by approximately $11.4 million, $13.8 million and $20.8 million for the years ended March 31, 2009, 2008 and 2007, respectively. The increase in accounts receivable in the periods is due to the following factors:
• | NextGen Division revenue grew | ||
|
| Inpatient Division | |
| • | Turnover of accounts receivable is | |
|
| ||
| • | |||
| We experienced an increase in the volume of undelivered services billed in advance by the NextGen Division, which were unpaid as of the end of each period and included in accounts receivable. This resulted in an increase in both deferred revenue and accounts receivable |
of approximately |
factors mentioned.
operations benefited from increases in other liabilities and decreases in other assets. For the year ended March 31, 2011, the $13.4 million change in other assets and liabilities consists of a total increase in other liabilities of $14.9 million, offset by a decrease in other assets of $1.5 million. The $14.9 million increase in other liabilities consisted of a $1.1 million increase in contingent consideration related to the Opus and NextGen IS acquisitions, $3.3 million increase in accounts payable and $10.5 million increase in all other liabilities.
offset by $14.8 million proceeds from the sale of marketable securities.
Financing Activities
43
Marketable Securities
expenditures will increase in fiscal year 2012 and will be funded from cash on hand and cash flows from operations.
On January 28, 2009, our5, 2011.
On October 30, 2008, our Board approved a quarterly cash dividend of $0.30 per share on our outstanding shares of common stock, payable to shareholders of record as of December 15, 2008 with a distribution date on or about January 5, 2009.
On October 28, 2008, we acquired PMP. The purchase price consisted of approximately $19.7 million, plus up to $3.0 million in incentives tied to future performance. The $19.7 million
consisted of approximately $17.0 million in cash and $2.75 million in shares of our common stock.
On August 4, 2008, our Board approved a quarterly cash dividend of $0.30 per share on our outstanding shares of common stock, payable to shareholders of record as of September 15, 2008 with a distribution date on or about October 1, 2008.
On May 29, 2008, our Board approved a quarterly cash dividend of $0.25 per share on our outstanding shares of common stock, payable to shareholders of record as of June 15, 2008 with a distribution date on or about July 2, 2008.
On May 20, 2008, we acquired HSI. The purchase price consisted of approximately $15.6 million, plus up to approximately $1.7 million in incentives tied to future performance. The $15.6 million consisted of cash and shares of common stock.
On January 30, 2008, our Board approved a quarterly cash dividend of $0.25 per share on our outstanding shares of common stock, payable to shareholders of record as of March 14, 2008 and was distributed to shareholders on or about April 7, 2008.
On October 25, 2007, our Board approved a quarterly cash dividend of $0.25 per share on our outstanding shares of common stock, payable to shareholders of record as of December 14, 2007 and was distributed to shareholders on or about January 7, 2008.
On July 31, 2007, our Board approved a quarterly cash dividend of $0.25 per share on our outstanding shares of common stock, payable to shareholders of record as of September 14, 2007 and was distributed to shareholders on or about October 5, 2007.
On May 31, 2007, our BoardDirectors declared a quarterly cash dividend of $0.25 per share on our outstanding shares of common stock, payable to shareholders of record as of June 15, 2007 and was distributed to shareholders on July 5, 2007.
In February 2007, we paid a $1.00 per share cash dividend on shares of our common stock. The record date for the dividend was February 13, 2007.
following dividends during the periods presented:
| Per Share | ||||||||
| Declaration Date | Record Date | Payment Date | Dividend | |||||
| May 26, 2010 | June 17, 2010 | July 6, 2010 | $ | 0.30 | ||||
| July 28, 2010 | September 17, 2010 | October 5, 2010 | 0.30 | |||||
| October 25, 2010 | December 17, 2010 | January 5, 2011 | 0.30 | |||||
| January 26, 2011 | March 17, 2011 | April 5, 2011 | 0.35 | |||||
| Fiscal year 2011 | $ | 1.25 | ||||||
| May 27, 2009 | June 12, 2009 | July 6, 2009 | $ | 0.30 | ||||
| July 23, 2009 | September 25, 2009 | October 5, 2009 | 0.30 | |||||
| October 28, 2009 | December 23, 2009 | January 5, 2010 | 0.30 | |||||
| January 27, 2010 | March 23, 2010 | April 5, 2010 | 0.30 | |||||
| Fiscal year 2010 | $ | 1.20 | ||||||
| May 29, 2008 | June 15, 2008 | July 2, 2008 | $ | 0.25 | ||||
| August 4, 2008 | September 15, 2008 | October 1, 2008 | 0.30 | |||||
| October 30, 2008 | December 15, 2008 | January 5, 2009 | 0.30 | |||||
| January 28, 2009 | March 11, 2009 | April 3, 2009 | 0.30 | |||||
| Fiscal year 2009 | $ | 1.15 | ||||||
year 2012.
| Year ended March 31, | ||||
| 2012 | $ | 5,137 | ||
| 2013 | 5,475 | |||
| 2014 | 5,424 | |||
| 2015 | 5,008 | |||
| 2016 and beyond | 5,697 | |||
| $ | 26,741 | |||
44
Non-cancelable lease obligations
|
|
|
|
|
Year Ending March 31, |
|
|
|
|
2010 |
| $ | 4,475 |
|
2011 |
|
| 4,311 |
|
2012 |
|
| 2,439 |
|
2013 |
|
| 985 |
|
2014 |
|
| 135 |
|
|
|
| ||
|
| $ | 12,345 |
|
|
|
|
Recent
On April 9, 2009, the FASB issued three FSPs intended
FSP FAS 157-4, “Determining Fair Value When the Volume and LevelSignificant Accounting Policies,” of Activity for the Asset or Liability Have Significantly Decreased and Identifying Transactions That Are Not Orderly,” provides guidelines for making fair value measurements more consistent with the principles presented in FASB Statement No. 157, “Fair Value Measurements.” FSP FAS 157-4 must be applied prospectively and retrospective application is not permitted. FSP FAS 157-4 is effective for interim and annual periods ending after June 15, 2009, with early adoption
permitted for periods ending after March 15, 2009. An entity early adopting FSP FAS 157-4 must also early adopt FSP FAS 115-2 and FAS 124-2.
FSP FAS 115-2 and FAS 124-2. “Recognition and Presentation of Other-Than-Temporary Impairments,” provides additional guidance designedour notes to create greater clarity and consistency in accounting for and presenting impairment losses on debt securities. FSP FAS 115-2 and FAS 124-2 is effective for interim and annual periods ending after June 15, 2009, with early adoption permitted for periods ending after March 15, 2009. An entity may early adopt this FSP only if it also elects to early adopt FSP FAS 157-4.
FSP FAS 107-1 and APB 28-1, “Interim Disclosures about Fair Value of Financial Instruments,” enhances consistency in financial reporting by increasing the frequency of fair value disclosures. FSP 107-1 and APB 28-1 is effective for interim periods ending after June 15, 2009, with early adoption permitted for periods ending after March 15, 2009. However, an entity may early adopt these interim fair value disclosure requirements only if it also elects to early adopt FSP FAS 157-4 and FSP FAS 115-2 and FAS 124-2.
We are currently evaluating the impact, if any, that the adoption of these FSPs will have on our consolidated financial statements.
On April 1, 2009, the FASB issued FASB Staff Position (FSP) FAS 141(R)-1, “Accounting for Assets Acquired and Liabilities Assumedstatements included elsewhere in a Business Combination That Arise from Contingencies.” The FSP amends the guidance in FASB Statement No. 141 (Revised 2007), “Business Combinations,” to: (i) require that assets acquired and liabilities assumed in a business combination that arise from contingencies be recognized at fair value if fair value can be reasonably estimated. If fair value of such an asset or liability cannot be reasonably estimated, the asset or liability would generally be recognized in accordance with FASB Statement No. 5, “Accounting for Contingencies,” and FASB Interpretation No. 14, “Reasonable Estimation of the Amount of a Loss;” (ii) eliminate the requirement to disclose an estimate of the range of outcomes of recognized contingencies at the acquisition date. For unrecognized contingencies, the FASB decided to require that entities include only the disclosures required by Statement No. 5 and that those disclosures be included in the business combination footnote; and (iii) require that contingent consideration arrangements of an acquiree assumed by the acquirer in a business combination be treated as contingent consideration of the acquirer and should be initially and subsequently measured at fair value in accordance with Statement No. 141R. This FSP is effective for assets or liabilities arising from contingencies in business combinations for which the acquisition date is on or after the beginning of the first annual reporting period beginning on or after December 15, 2008.
In November 2008, the FASB ratified Emerging Issues Task Force (EITF) Issue No. 08-6, “Equity Method Investment Accounting Considerations” or EITF 08-6. EITF 08-6 clarifies the accounting for certain transactions and impairment considerations involving equity method investments. EITF 08-6 is effective for fiscal years beginning after December 15, 2008, with early adoption prohibited. We do not currently have any investments that are accounted for under the equity method and therefore EITF 08-6 will not have a significant impact on our consolidated financial statements.
In November 2008, the FASB ratified EITF Issue No. 08-7, “Accounting for Defensive Intangible Assets” or EITF 08-7. EITF 08-7 clarifies the accounting for certain separately identifiable intangible assets which an acquirer does not intend to actively use but intends to hold to prevent its competitors from obtaining access to them. EITF 08-7 requires an acquirer in a business combination to accountthis Report for a defensive intangible asset as a separate unitdiscussion of new accounting which should be amortized to expense over the period the asset diminishes in value. EITF 08-7 is effective for fiscal years beginning after December 15, 2008, with early adoption prohibited. We are currently in the process of evaluating the impact the new EITF will have on our consolidated financial statements.standards.
45
In October 2008, the FASB issued FSP SFAS No. 157-3, “Determining the Fair Value of a Financial Asset When The Market for That Asset Is Not Active,” or FSP 157-3, to clarify the application of the provisions of SFAS 157 in an inactive market and how an entity would determine fair value in an inactive market. FSP 157-3 was effective upon issuance. We have considered the FSP in our determination of estimated fair values of our ARS for fiscal year 2009.
In June 2008, the FASB issued FSP No. EITF 03-6-1, “Determining Whether Instruments Granted in Share-Based Payment Transactions Are Participating Securities.” FSP No. EITF 03-6-1 concluded that unvested share-based payment awards that contain nonforfeitable rights to dividends or dividend equivalents (whether paid or unpaid) are participating securities and shall be
included in the computation of basic earnings per share (“EPS”) pursuant to the two-class method. This FSP becomes effective on April 1, 2009. Early adoption of the FSP is not permitted; however, it will apply retrospectively to EPS data for all periods presented in the financial statements or in financial data. We do not currently anticipate that this FSP will have a material impact on our EPS data in fiscal year 2010 or on EPS for any prior periods presented in the financial data upon adoption.
In May 2008, the FASB issued SFAS 162 “The Hierarchy of Generally Accepted Accounting Principles.” SFAS 162 defines the order in which accounting principles that are generally accepted should be followed. SFAS 162 is effective 60 days following the Commission’s approval of the Public Company Accounting Oversight Board (“PCAOB”) amendments to AU Section 411 “The Meaning of Present Fairly in Conformity with Generally Accepted Accounting Principles.” We do not expect the adoption of SFAS 162 to have a material impact on our consolidated financial statements.
In April 2008, the FASB finalized Staff Position (FSP) No. 142-3, “Determination of the Useful Life of Intangible Assets.” The position amends the factors that should be considered in developing renewal or extension assumptions used to determine the useful life of a recognized intangible asset under FASB SFAS No. 142, “Goodwill and Other Intangible Assets.” The position applies to intangible assets that are acquired individually or with a group of other assets and both intangible assets acquired in business combinations and asset acquisitions. FSP 142-3 is effective for fiscal years beginning after December 15, 2008, and interim periods within those fiscal years. Management is currently evaluating the impact of the pending adoption of FSP 142-3 on the consolidated financial statements.
In December 2007, the FASB issued SFAS 141 (Revised 2007) “Business Combinations.” SFAS 141(R) retains the fundamental requirements of the original pronouncement requiring that the purchase method be used for all business combinations. SFAS 141(R) defines the acquirer as the entity that obtains control of one or more businesses in the business combination, establishes the acquisition date as the date that the acquirer achieves control and requires the acquirer to recognize the assets acquired, liabilities assumed and any noncontrolling interest at their fair values as of the acquisition date. In addition, SFAS 141(R) requires expensing of acquisition-related and restructure-related costs, remeasurement of earn out provisions at fair value, measurement of equity securities issued for purchase at the date of close of the transaction and non-expensing of in-process research and development related intangibles. SFAS 141(R) applies prospectively to business combinations for which the acquisition date is on or after the beginning of the first annual reporting period beginning on or after December 15, 2008. An entity may not apply it before that date. This pronouncement will be applied by us when it becomes effective and when or if the we effectuate a business combination post adoption, otherwise there is no impact on our consolidated financial statements.
Despite the underlying long-term maturity of ARS, such securities were priced and subsequently traded as short-term investments because of the interest rate reset feature. If there are insufficient buyers, the auction is said to “fail” and the holders are unable to liquidate the investments through auction. A failed auction does not result in a default of the debt instrument. The securities will continue to accrue interest and be auctioned until the auction succeeds, the issuer calls the securities, or the securities mature. In February 2008, we began to experience failed auctions on our ARS and auction rate preferred securities. To determine their estimated fair values at March 31, 2009, factors including credit quality, the likelihood of redemption, and yields or spreads of fixed rate municipal bonds or other trading instruments issued by the same or comparable issuers were considered. Based on our ability to access our cash and other short-term investments, our expected operating cash flows, and our other sources of cash, we do not anticipate the current lack of liquidity on these investments to have a material impact on our financial condition or results of operation.
Changes in Internal Control over Financial Reporting
During the quarter ended March 31, 2009, there were no changes in our “internal control over financial reporting” (as defined in Rule 13a-15(f) under the Exchange Act) that have materially affected, or are reasonably likely to materially affect, our internal control over financial reporting.
accordance with generally accepted accounting principles.
| (1) | |
| pertain to the maintenance of records that, in reasonable detail, accurately and fairly reflect the transactions and dispositions of our assets; |
| (2) | |
| provide reasonable assurance that transactions are recorded as necessary to permit preparation of financial statements in accordance with generally accepted accounting principles, and that receipts and expenditures of our company are being made only in accordance with authorizations of our management and directors; and |
| (3) | |
| provide reasonable assurance regarding prevention or timely detection of unauthorized acquisition, use or disposition of our assets that could have a material effect on our financial statements. |
Our independent registered public accounting firm
We have experienced legal claims by parties asserting that we have infringed their intellectual property rights. We believe that these claims are without merit and intend to defend them vigorously; however, we could incur substantial costs and diversion of management resources defending any infringement claim – even if we are ultimately successful in the defense of such matter. Litigation is inherently uncertain and always difficult to predict. We refer you to the discussion of infringement and litigation risks in our Risk Factors section of this Report.46
SECURITY OWNERSHIP OF CERTAIN BENEFICIAL OWNERS AND MANAGEMENT AND RELATED | |||
47
|
| Page | ||||||||
| (1) | Index to Financial Statements: | ||||||
| ||||||||
|
| 54 | ||||||
|
| |||||||
|
| 55 | ||||||
|
| 56 | ||||||
|
| 57 | ||||||
|
| 58 | ||||||
|
| 60 | ||||||
(2) | The following supplementary financial statement schedule of Quality Systems, Inc., required to be included in Item 15(a)(2) on Form 10-K is filed as part of this | |||||||
|
| 84 | ||||||
Schedules other than that listed above have been omitted since they are either not required, not applicable, or because the information required is included in the | ||||||||
(3) | The exhibits listed in the Index to Exhibits hereof are attached hereto or incorporated herein by reference and filed as a part of this Report. | |||||||
INDEX TO EXHIBITS
|
| ||||
| 85 | |||||
48
| ||||
| Number | Description | |||
| 3.1 | Restated Articles of Incorporation of Quality Systems, Inc. filed with the Secretary of State of California on September 8, 1989, are hereby incorporated by reference to Exhibit 3.1 to the registrant’s Registration Statement on Form S-1 (Registration No. 333-00161) filed January 11, 1996. | |||
| 3.2 | Certificate of Amendment to Articles of Incorporation of Quality Systems, Inc. filed with the Secretary of State of California effective March 4, 2005, is hereby incorporated by reference to Exhibit 3.1.1 of the registrant’s Annual Report on Form 10-K for the year ended March 31, 2005. | ||
| 3.3 | Certificate of Amendment to Articles of Incorporation of Quality Systems, Inc. filed with the Secretary of State of California effective October 6, 2005 is hereby incorporated by reference to Exhibit 3.01 of the registrant’s Current Report on Form 8-K filed October 11, 2005. | ||
| 3.4 | Certificate of Amendment to Articles of Incorporation of Quality Systems, Inc. filed with the Secretary of State of California effective March 3, 2006 is hereby incorporated by reference to Exhibit 3.1 of the registrant’s Current Report on Form 8-K filed March 6, 2006. | ||
| 3.5 | Amended and Restated Bylaws of Quality Systems, Inc., effective October 30, 2008, are hereby incorporated by reference to Exhibit 3.1 of the registrant’s Current Report on Form 8-K filed October 31, 2008. | ||
|
| * | Amended and Restated 1998 Stock Option Plan is hereby incorporated by reference to Exhibit 10.10.1 of the registrant’s Annual Report on Form 10-K for the year ended March 31, 2005. | |
|
| * | Form of Incentive Stock Option Agreement for Amended and Restated 1998 Stock Option Plan is hereby incorporated by reference to Exhibit 10.1 to the registrant’s Quarterly Report on Form 10-Q for the quarter ended September 30, 2004. | |
|
| * | Form of Non-Qualified Stock Option Agreement for Amended and Restated 1998 Stock Option Plan is hereby incorporated by reference to Exhibit 10.2 to the registrant’s Quarterly Report on Form 10Q for the quarter ended September 20, 2004. | |
|
| * | 2005 Stock Option and Incentive Plan is incorporated by reference to Exhibit 10.01 to the registrant’s Current Report on Form 8-K filed October 5, 2005. | |
|
| * | Form of Nonqualified Stock Option Agreement for 2005 Stock Incentive Plan is incorporated by reference to Exhibit 10.2 to the registrant’s Current Report on Form 8-K filed June 5, 2007. | |
|
| * | Form of Incentive Stock Option Agreement for 2005 Stock Incentive Plan is incorporated by reference to Exhibit 10.3 to the registrant’s Current Report on Form 8-K filed June 5, 2007. | |
|
| * | 1993 Deferred Compensation Plan is hereby incorporated by reference to Exhibit 10.5 to the registrant’s Annual Report on Form 10-KSB for the year ended March 31, 1994. | |
|
| * | 1998 Employee Stock Contribution Plan is hereby incorporated by reference to Exhibit 4.1 to the registrant’s Registration Statement on Form S-8 (Registration No. 333-63131). | |
|
| ||||
| 10.9 | * | ||||
|
|
| |||
|
|
| |||
| Lease Agreement between Company and Tower Place, L.P. dated November 15, 2000, commencing February 5, 2001 is hereby incorporated by reference to Exhibit 10.14 to the registrant’s Annual Report on Form 10-K for the year ended March 31, 2001. | ||||
| 10.11 | Fourth Amendment to lease agreement between the Company and Tower Place, L.P. dated September 22, 2005 is incorporated by reference to Exhibit 10.24 to the registrant’s Annual Report on Form 10-K for the year ended March 31, 2006. | |||
49
| Exhibit | ||||||
| Description | |||||
| 10.12 | Fifth Amendment to lease agreement between the Company and Tower Place, L.P. dated January 31, 2007 is incorporated by reference to Exhibit 10.13 to the registrant’s Annual Report on Form 10-K for the year ended March 31, 2007. | |||||
| 10.13 |
| ||||
| Lease Agreement between the Company and HUB Properties LLC dated May 8, 2002 is hereby incorporated by reference to Exhibit 10.18 to the registrant’s Annual Report on Form 10-K for the year ended March 31, 2003. | |||||
| 10.14 | Second Amendment to Office Lease agreement between the Company and HUB Properties LLC dated February 14, 2006 is incorporated by reference to Exhibit 10.25 to the registrant’s Annual Report on Form 10-K for the year ended March 31, 2006. | ||||
| 10.15 | Amended and Restated Second Amendment to Office Lease agreement between the Company and HUB Properties LLC dated May 31, 2006 is incorporated by reference to Exhibit 10.17 to the registrant’s Annual Report on Form 10-K for the year ended March 31, 2007. | ||||
| 10.16 |
| ||||
| Lease agreement between the Company and Von Karman Michelson Corporation dated September 6, 2005 is incorporated by reference to Exhibit 10.23 to the registrant’s Annual Report on Form 10-K for the year ended March 31, 2006. | |||||
| 10.17 | Office lease between the Company and SLTS Grand Avenue, L.P. dated May 3, 2006 is incorporated by reference to Exhibit 10.20 to the registrant’s Annual Report on Form 10-K for the year ended March 31, 2007. | ||||
|
| * |
| |||
|
| Board Service Agreement between the Company and Patrick Cline is incorporated by reference to Exhibit 10.2.1 to the registrant’s Current Report on Form 8-K dated May 31, 2005. | ||||
|
| ||||
| 10.19 | * | ||||
|
| Director Compensation Program | |||
| 10.20 | Settlement Agreement dated as of August 8, 2006 between the registrant and Ahmed Hussein is incorporated by reference to Exhibit 10.1 to the registrant’s Current Report on Form 8-K filed August 9, 2006. | |||
|
| * | Description of Compensation Program for Named Executive Officers for Fiscal Year Ended March 31, | ||
|
|
| |||
| Agreement and Plan of Merger dated May 16, 2008 by and among Quality Systems, Inc., Bud Merger Sub, LLC and Lackland Acquisition II, LLC, is incorporated by reference to Exhibit 10.27 to the registrant’s Annual Report on Form 10-K for the year ended March 31, 2008. | ||||
| 10.23 | Office lease between the Company and Lakeshore Towers Limited Partnership Phase II, a California limited partnership, dated October 18, 2007, is incorporated by reference to Exhibit 10.28 to the registrant’s Annual Report on Form 10-K for the year ended March 31, 2008. | |||
| 10.24 | Standard Service Center Lease Agreement between the Lincoln National Life Insurance Company and Lackland Acquisition II, LLC, dated November 28, 2001, is incorporated by reference to Exhibit 10.29 to the registrant’s Annual Report on Form 10-K for the year ended March 31, 2008. | |||
| 10.25 | First Amendment to Standard Service Center Lease Agreement between the Lincoln National Life Insurance Company and Lackland Acquisition II, LLC, dated August 17, 2005, is incorporated by reference to Exhibit 10.30 to the registrant’s Annual Report on Form 10-K for the year ended March 31, 2008. | |||
| 10.26 | Standard Service Center Lease Agreement between the Lincoln National Life Insurance Company and InfoNow Solutions of St. Louis, LLC, dated November 28, 2001, is incorporated by reference to Exhibit 10.31 to the registrant’s Annual Report on Form 10-K for the year ended March 31, 2008. | |||
| 10.27 | Second Amendment to Service Center Lease Agreement between the TM Properties, LLC, successor to the Lincoln National Life Insurance Company and Lackland Acquisition II, LLC, dated August 17, 2005, is incorporated by reference to Exhibit 10.32 to the registrant’s Annual Report on Form 10-K for the year ended March 31, 2008. | |||
50
| Exhibit | ||||||
| Description | |||||
| 10.28 | Assignment of Lease between InfoNow Solutions of St. Louis, Lackland Acquisition II, LLC and TM Properties, LLC dated August 17, 2005, is incorporated by reference to Exhibit 10.33 to the registrant’s Annual Report on Form 10-K for the year ended March 31, 2008. | |||||
| 10.29 | Agreement and Plan of Merger dated October 15, 2008 by and among (i) Quality Systems, Inc. (ii) NextGen Healthcare Information Systems, Inc. (iii) Ruth Merger Sub, Inc. (iv) Practice Management Partners, Inc. and (v) certain shareholders set forth therein, is incorporated by reference to Exhibit 10.1 to the registrant’s Quarterly Report on Form 10-Q for the quarter ended December 31, 2008. | ||||
|
| ||||
| 10.30 | |||||
| First Amendment to Lease Agreement between Hill Management Services, Inc. and Practice Management Partners, Inc., dated January 15, 2008, is incorporated by reference to Exhibit 10.2 to the registrant’s Quarterly Report on Form 10-Q for the quarter ended December 31, 2008. | ||||
| 10.31 | First Amendment to Sublease Agreement between RehabCare Group, Inc. and Practice Management Partners Inc., dated January 15 2008, is incorporated by reference to Exhibit 10.3 to the registrant’s Quarterly Report on Form 10-Q for the quarter ended December 31, 2008. | |||
| 10.32 | Third Amendment to Lease Agreement between Pinecrest LLC and Practice Management Partners, Inc., dated April 30, 2007, is incorporated by reference to Exhibit 10.4 to the registrant’s Quarterly Report on Form 10-Q for the quarter ended December 31, 2008. | |||
|
| * | Employment Agreement dated August 11, 2008 between Quality Systems, Inc., and Steven Plochocki, is incorporated by reference to Exhibit 10.1 to the registrant’s Current Report on Form 8-K filed on August 12, 2008. | ||
| 10.34 | * | Outside Directors Amended and Restated Restricted Stock Agreement is incorporated by reference to Exhibit 10.2 to the Company’s Current Report on Form 8-K filed February 9, 2010. | |||
| 10.35 | * | Employment Offer and Terms of Employment dated September 17, 2009, between Quality Systems, Inc. and Philip N. Kaplan, is incorporated by reference to Exhibit 10.1 to the registrant’s Current Report on Form 8-K filed on September 21, 2009. | |||
| 10.36 | Agreement and Plan of Merger dated February 10, 2010, by and among Quality Systems, Inc., OHS Merger Sub, Inc., Opus Healthcare Solutions, Inc., and the Shareholders of Opus Healthcare Solutions, Inc. | ||||
| 10.37 | Sixth Amendment to Lease Agreement between the Company and Tower Place, L.P. dated April 1, 2010. | ||||
| 10.38 | Third Amendment to Office Lease agreement between the Company and HUB Properties LLC dated January 1, 2010. | ||||
| 10.39 | Fourth Amendment to Office Lease agreement between the Company and HUB Properties LLC dated March 17, 2010. | ||||
| 10.40 | Third Amendment to Service Center Lease Agreement between the TM Properties, LLC, successor to the Lincoln National Life Insurance Company and Lackland Acquisition II, LLC, dated March 15, 2010. | ||||
| 10.41 | Second Amendment to Lease Agreement between Hill Management Services, Inc. and Practice Management Partners, Inc., dated November 1, 2009. | ||||
| 10.42 | Modification of Lease #1 between Olen Commercial Realty Corp. and NXG Acute Care LLC, dated October 13, 2009. | ||||
| 10.43 | Lease between Olen Commercial Realty Corp. and NXG Acurate Care LLC, dated October 1, 2009. | ||||
| 10.44 | Sublease Agreement between Centex Homes and Opus Healthcare Solutions, Inc., dated February __, 2009. | ||||
| 21 | ** | List of | |||
| 23.1 | ** | Consent of Independent Registered Public Accounting Firm | ||
| 23.2 | ** | Consent of Independent Registered Public Accounting Firm — Grant Thornton | |||
51
| Exhibit | |||||||
| Description | ||||||
| 31.1 | ** | Certification of Principal Executive Officer Required by Rule 13a-14(a) of the Securities Exchange Act of 1934, as amended, as Adopted Pursuant to Section 302 of the Sarbanes-Oxley Act of | |||||
| 31.2 | ** | Certification of Principal Financial Officer Required by Rule 13a-14(a) of the Securities Exchange Act of 1934, as amended, as Adopted Pursuant to Section 302 of the Sarbanes-Oxley Act of | ||||
| 32.1 | ** | Certification of Chief Executive Officer and Chief Financial Officer Pursuant to 18 U.S.C. Section 1350, as Adopted Pursuant to Section 906 of the Sarbanes-Oxley Act of 2002. | ||||
101.INS** * | XBRL Instance | |||
| 101.SCH*** | XBRL Taxonomy Extension Schema | |||
| 101.CAL*** | XBRL Taxonomy Extension Calculation | |||
| 101.LAB*** | XBRL Taxonomy Extension Label | |||
| 101.PRE*** | XBRL Taxonomy Extension Presentation | |||
| * | This exhibit is a management contract or a compensatory plan or arrangement. | |
** | Filed herewith. | |
| *** | XBRL information is furnished and not filed or a part of a registration statement or prospectus for purposes of section 11 or 12 of the Securities and Exchange Act of 1933, as amended, is deemed not filed for purposes of section 18 of the Securities and Exchange Act of 1934, as amended, and otherwise is not subject to liability under these section. | |
52
Signature Title Date Chairman of the Board and Director May 27, Chief Financial Officer (Principal May 27, President May 27, May 27, Director May 27, Director Director Director May 27, 53By: /s/ Steven Plochocki By: /s/ Steven T. Plochocki President and Steven T. Plochocki Chief Executive Officer (Principal Executive Officer) Date: May 29, 2009By: /s/ Paul A. Holt Paul A. Holt Chief Financial Officer (Principal Accounting Officer) May 27, 2009 Sheldon Razin/s/ Steven PlochockiPresident and Chief Executive Officer(Principal Executive Officer) andDirector2009 Chief Executive Officer (Principal Executive Officer) and Director May 27, 2011 Financial Accounting Officer) and Secretary2009 Paul A. HoltNextGen Healthcare InformationSystems Division,and Chief Strategy Officer and Director2009 Patrick B. ClineMurray BrennanCraig BarbaroshCraig BarbaroshDirector 2009 /s/ George Bristol2009 /s/May 27, 2011 /s/ Philip KaplanMay 27, 2009 Philip KaplanSignatureTitleDate Vincent LoveMaureen SpivackMaureen Spivack Director Vincent J. LoveDirector2009/s/ Russell PfluegerRussell PfluegerDirectorMay 27, 2009
54Quality Systems, Inc.We have audited the accompanying consolidated balance sheets of Quality Systems, Inc.,2008,have been properly applied. We were not engaged to audit, review, or apply any procedures to financial statements for the year ended March 31, 2009 of the Company other than with respect to the adjustments and, accordingly, we do not express an opinion or any other form of assurance on the financial statements for the year ended March 31, 2009 taken as a whole.relatedpreparation of financial statements for external purposes in accordance with generally accepted accounting principles. A company’s internal control over financial reporting includes those policies and procedures that (i) pertain to the maintenance of records that, in reasonable detail, accurately and fairly reflect the transactions and dispositions of the assets of the company; (ii) provide reasonable assurance that transactions are recorded as necessary to permit preparation of financial statements in accordance with generally accepted accounting principles, and that receipts and expenditures of the company are being made only in accordance with authorizations of management and directors of the company; and (iii) provide reasonable assurance regarding prevention or timely detection of unauthorized acquisition, use, or disposition of the company’s assets that could have a material effect on the financial statements.
May 27, 2011
Quality Systems, Inc.
audit.
other auditors.
May 27, 2009
55
REPORT OF INDEPENDENT REGISTERED PUBLIC ACCOUNTING FIRM
Board of Directors and ShareholdersQuality Systems, Inc.
We have audited Quality Systems, Inc.’s internal control over financial reporting as of March 31, 2009, based on criteria established in Internal Control – Integrated Framework issued by the Committee of Sponsoring Organizations of the Treadway Commission (COSO). Quality Systems, Inc.’s management is responsible for maintaining effective internal control over financial reporting and for its assessment of the effectiveness of internal control over financial reporting, included in the accompanying Quality Systems, Inc. Management’s Report on Internal Control Over Financial Reporting. Our responsibility is to express an opinion on Quality Systems, Inc.’s internal control over financial reporting based on our audit.
We conducted our audit in accordance with the standards of the Public Company Accounting Oversight Board (United States). Those standards require that we plan and perform the audit to obtain reasonable assurance about whether effective internal control over financial reporting was maintained in all material respects. Our audit included obtaining an understanding of internal control over financial reporting, assessing the risk that a material weakness exists, testing and evaluating the design and operating effectiveness of internal control based on the assessed risk, and performing such other procedures as we considered necessary in the circumstances. We believe that our audit provides a reasonable basis for our opinion.
A company’s internal control over financial reporting is a process designed to provide reasonable assurance regarding the reliability of financial reporting and the preparation of financial statements for external purposes in accordance with generally accepted accounting principles. A company’s internal control over financial reporting includes those policies and procedures that (1) pertain to the maintenance of records that, in reasonable detail, accurately and fairly reflect the transactions and dispositions of the assets of the company; (2) provide reasonable assurance that transactions are recorded as necessary to permit preparation of financial statements in accordance with generally accepted accounting principles, and that receipts and expenditures of the company are being made only in accordance with authorizations of management and directors of the company; and (3) provide reasonable assurance regarding prevention or timely detection of unauthorized acquisition, use, or disposition of the company’s assets that could have a material effect on the consolidated financial statements.
Because of its inherent limitations, internal control over financial reporting may not prevent or detect misstatements. Also, projections of any evaluation of effectiveness to future periods are subject to the risk that controls may become inadequate because of changes in conditions, or that the degree of compliance with the policies or procedures may deteriorate. In our opinion, Quality Systems, Inc. maintained, in all material respects, effective internal control over financial reporting as of March 31, 2009, based on criteria established in Internal Control – Integrated Framework issued by COSO.
We have also audited, in accordance with the standards of the Public Company Accounting Oversight Board (United States), the consolidated balance sheets of Quality Systems, Inc. as of March 31, 2009 and 2008, and the related consolidated statements of income, shareholders’ equity, and cash flows for each of the three years ended March 31, 2009, and our report dated May 27, 2009 expressed an unqualified opinion.
/s/ GRANT THORNTON LLP
Irvine, CaliforniaMay 27, 2009
March 31, March 31, ASSETS Current assets: Cash and cash equivalents $ 70,180 $ 59,046 Restricted cash 1,303 — Marketable securities — 2,500 Accounts receivable, net 90,070 76,585 Inventories, net 1,125 1,024 Income tax receivable 5,605 — Net current deferred tax assets 3,994 6,397 Other current assets 6,312 4,596 Total current assets 178,589 150,148 Marketable securities 7,395 20,124 Equipment and improvements, net 6,756 4,773 Capitalized software costs, net 9,552 8,852 Intangibles, net 8,403 — Goodwill 28,731 1,840 Other assets 2,675 2,171 Total assets $ 242,101 $ 187,908 LIABILITIES AND SHAREHOLDERS’ EQUITY Current liabilities: Accounts payable $ 5,097 $ 4,685 Deferred revenue 47,584 44,389 Accrued compensation and related benefits 9,511 8,346 Income taxes payable — 1,541 Dividends payable 8,529 6,861 Other current liabilities 8,888 4,394 Total current liabilities 79,609 70,216 Deferred revenue, net of current 521 506 Net deferred tax liabilities 4,566 1,575 Deferred compensation 1,838 1,906 Total liabilities 86,534 74,203 Commitments and contingencies Shareholders’ equity: Common stock $0.01 par value; authorized 50,000 shares; issued and outstanding 28,447 and 27,448 shares at March 31, 2009 and March 31, 2008, respectively 284 274 Additional paid-in capital 103,524 75,556 Retained earnings 51,759 38,071 Accumulated other comprehensive loss, net of tax — (196 ) Total shareholders’ equity 155,567 113,705 Total liabilities and shareholders’ equity $ 242,101 $ 187,908 In thousands, except per share data) 56IN THOUSANDS, EXCEPT PER SHARE DATA)
2009
2008 March 31, March 31, 2011 2010 ASSETS Current assets: Cash and cash equivalents $ 116,617 $ 84,611 Restricted cash 3,787 2,339 Marketable securities 1,120 7,158 Accounts receivable, net 139,772 107,458 Inventories 1,933 1,340 Income taxes receivable — 2,953 Deferred income taxes, net 10,397 5,678 Other current assets 8,768 8,684 Total current assets 282,394 220,221 Equipment and improvements, net 12,599 8,432 Capitalized software costs, net 15,150 11,546 Intangibles, net 16,890 20,145 Goodwill 46,721 46,189 Other assets 4,932 3,647 Total assets $ 378,686 $ 310,180 LIABILITIES AND SHAREHOLDERS’ EQUITY Current liabilities: Accounts payable $ 6,686 $ 3,342 Deferred revenue 76,695 64,109 Accrued compensation and related benefits 10,247 8,951 Income taxes payable 3,530 — Dividends payable 10,162 8,664 Other current liabilities 29,316 16,220 Total current liabilities 136,636 101,286 Deferred revenue, net of current 1,099 474 Deferred income taxes, net 11,384 10,859 Deferred compensation 2,488 1,883 Other noncurrent liabilities 2,409 7,389 Total liabilities 154,016 121,891 Commitments and contingencies (Note 13) Shareholders’ equity: Common stock $0.01 par value; authorized 50,000 shares; issued and outstanding 29,034 and 28,879 shares at March 31, 2011 and March 31, 2010, respectively 290 289 Additional paid-in capital 133,259 122,271 Retained earnings 91,121 65,729 Total shareholders’ equity 224,670 188,289 Total liabilities and shareholders’ equity $ 378,686 $ 310,180 to these consolidated financial statements are an integral part of these
consolidated financial statements.
Fiscal Year Ended March 31, March 31, March 31, Revenues: Software, hardware and supplies $ 85,386 $ 76,363 $ 68,871 Implementation and training services 13,375 13,406 12,177 System sales 98,761 89,769 81,048 Maintenance 72,862 56,455 41,948 Electronic data interchange services 29,522 22,450 17,049 Revenue cycle management and related services 21,431 871 534 Other services 22,939 16,955 16,586 Maintenance, EDI, RCM and other services 146,754 96,731 76,117 Total revenue 245,515 186,500 157,165 Cost of revenue: Software, hardware and supplies 13,184 10,887 8,453 Implementation and training services 10,286 10,341 8,535 Total cost of system sales 23,470 21,228 16,988 Maintenance 11,859 12,446 11,834 Electronic data interchange services 21,374 15,776 12,181 Revenue cycle management and related services 14,674 558 341 Other services 17,513 12,493 9,440 Total cost of maintenance, EDI, RCM and other services 65,420 41,273 33,796 Total cost of revenue 88,890 62,501 50,784 Gross profit 156,625 123,999 106,381 Operating expenses: Selling, general and administrative 70,445 53,260 45,337 Research and development costs 13,777 11,350 10,166 Total operating expenses 84,222 64,610 55,503 Income from operations 72,403 59,389 50,878 Interest income 1,203 2,661 3,306 Other (expense) income (279 ) 953 — Income before provision for income taxes 73,327 63,003 54,184 Provision for income taxes 27,208 22,925 20,952 Net income $ 46,119 $ 40,078 $ 33,232 Net income per share: Basic $ 1.65 $ 1.47 $ 1.24 Diluted $ 1.62 $ 1.44 $ 1.21 Weighted average shares outstanding: Basic 28,031 27,298 26,882 Diluted 28,396 27,770 27,550 Dividends declared per common share $ 1.15 $ 1.00 $ 1.00 In thousands, except per share data) 57IN THOUSANDS, EXCEPT PER SHARE DATA)
2009
2008
2007 Fiscal Year Ended March 31, 2011 2010 2009 Revenues: Software, hardware and supplies $ 106,514 $ 89,761 $ 85,386 Implementation and training services 18,015 14,376 13,375 System sales 124,529 104,137 98,761 Maintenance 110,019 89,192 72,862 Electronic data interchange services 41,022 35,035 29,522 Revenue cycle management and related services 45,065 36,665 21,431 Other services 32,728 26,782 22,939 Maintenance, EDI, RCM and other services 228,834 187,674 146,754 Total revenues 353,363 291,811 245,515 Cost of revenue: Software, hardware and supplies 19,779 12,115 13,184 Implementation and training services 15,010 11,983 10,286 Total cost of system sales 34,789 24,098 23,470 Maintenance 12,948 13,339 11,859 Electronic data interchange services 27,711 25,262 21,374 Revenue cycle management and related services 33,815 27,715 14,674 Other services 18,219 20,393 17,513 Total cost of maintenance, EDI, RCM and other services 92,693 86,709 65,420 Total cost of revenue 127,482 110,807 88,890 Gross profit 225,881 181,004 156,625 Operating expenses: Selling, general and administrative 108,310 86,951 69,410 Research and development costs 21,797 16,546 13,777 Amortization of acquired intangible assets 1,682 1,783 1,035 Total operating expenses 131,789 105,280 84,222 Income from operations 94,092 75,724 72,403 Interest income 263 226 1,203 Other income (expense), net 61 268 (279 ) Income before provision for income taxes 94,416 76,218 73,327 Provision for income taxes 32,810 27,839 27,208 Net income $ 61,606 $ 48,379 $ 46,119 Net income per share: Basic $ 2.13 $ 1.69 $ 1.65 Diluted $ 2.12 $ 1.68 $ 1.62 Weighted-average shares outstanding: Basic 28,947 28,635 28,031 Diluted 29,118 28,796 28,396 Dividends declared per common share $ 1.25 $ 1.20 $ 1.15 to these consolidated financial statements are an integral
part of these consolidated financial statements.
APIC Retained Deferred Accumulated Total Common Stock Shares Amount Balance, March 31, 2006 26,711 $ 267 $ 53,675 $ 19,151 $ (684 ) $ — $ 72,409 Reclass of deferred compensation upon adoption of SFAS 123R — — (684 ) — 684 — — Exercise of stock options 412 4 6,058 — — — 6,062 Tax benefit resulting from exercise of stock options — — 2,694 — — — 2,694 Stock based compensation — — 3,923 — — — 3,923 Dividends declared — — — (27,074 ) — — (27,074 ) Net income — — — 33,232 — — 33,232 Balance, March 31, 2007 27,123 271 65,666 25,309 — — 91,246 Exercise of stock options 325 3 4,757 — — — 4,760 Tax benefit resulting from exercise of stock options — — 1,376 — — — 1,376 Stock based compensation — — 3,757 — — — 3,757 Dividends declared — — — (27,316 ) — — (27,316 ) Net income — — — 40,078 — — 40,078 Unrealized loss on marketable securities, net of tax — — — — — (196 ) (196 ) Balance, March 31, 2008 27,448 274 75,556 38,071 — (196 ) 113,705 Exercise of stock options 697 7 12,512 — — — 12,519 Tax benefit resulting from exercise of stock options — — 3,382 — — — 3,382 Stock based compensation — — 1,977 — — — 1,977 Common stock issued for acquisitions 302 3 10,097 — — — 10,100 Dividends declared — — — (32,431 ) — — (32,431 ) Net income — — — 46,119 — — 46,119 Reclassification of unrealized loss on marketable securities, net of tax — — — — — 196 196 Balance, March 31, 2009 28,447 $ 284 $ 103,524 $ 51,759 $ — $ — $ 155,567 In thousands) 58IN THOUSANDS)
Earnings
Compensation
Other
Comprehensive
Loss
Shareholders’
Equity Accumulated Additional Other Total Common Stock Paid-in Retained Comprehensive Shareholders’ Shares Amount Capital Earnings Loss Equity Balance, March 31, 2008 27,448 $ 274 $ 75,556 $ 38,071 $ (196 ) $ 113,705 Exercise of stock options 697 7 12,512 — — 12,519 Tax benefit resulting from exercise of stock options — — 3,382 — — 3,382 Stock-based compensation — — 1,977 — — 1,977 Common stock issued for acquisitions 302 3 10,097 — — 10,100 Dividends declared — — — (32,431 ) — (32,431 ) Net income — — — 46,119 — 46,119 Reclassification of unrealized loss on marketable securities, net of tax — — — — 196 196 Balance, March 31, 2009 28,447 284 103,524 51,759 — 155,567 Exercise of stock options 238 3 5,852 — — 5,855 Tax benefit resulting from exercise of stock options — — 1,576 — — 1,576 Stock-based compensation — — 2,073 — — 2,073 Stock-based compensation related to acquisitions — — 433 — — 433 Common stock issued for acquisitions 194 2 8,813 — — 8,815 Dividends declared — — — (34,409 ) — (34,409 ) Net income — — — 48,379 — 48,379 Balance, March 31, 2010 28,879 289 122,271 65,729 — 188,289 Exercise of stock options 155 1 5,716 — — 5,717 Tax benefit resulting from exercise of stock options — — 1,524 — — 1,524 Stock-based compensation — — 3,748 — — 3,748 Dividends declared — — — (36,214 ) — (36,214 ) Net income — — — 61,606 — 61,606 Balance, March 31, 2011 29,034 $ 290 $ 133,259 $ 91,121 $ — $ 224,670 to these consolidated financial statements are an integral
part of these consolidated financial statements.
59 Fiscal Year Ended March 31, March 31, March 31, Cash flows from operating activities: Net income $ 46,119 $ 40,078 $ 33,232 Adjustments to reconcile net income to net cash provided by operating activities: Depreciation 2,911 2,369 1,950 Amortization of capitalized software costs 5,163 4,149 3,231 Amortization of other intangibles 1,034 — — Gain on life insurance proceeds, net — (755 ) — Provision for bad debts 2,089 1,171 1,480 (Recovery)/provision for inventory obsolescense (13 ) 52 35 Share-based compensation 1,977 3,757 3,923 Deferred income taxes 4,462 (199 ) (1,642 ) Tax benefit from exercise of stock options 3,382 1,376 2,694 Excess tax benefit from share-based compensation (3,381 ) (1,311 ) (2,527 ) Loss on disposal of equipment and improvements 96 — — Changes in assets and liabilities: Accounts receivable (11,369 ) (13,811 ) (20,760 ) Inventories (88 ) 99 (649 ) Income tax receivable (5,433 ) — 1,195 Other current assets (1,202 ) (89 ) (1,595 ) Other assets (448 ) 381 (594 ) Accounts payable (299 ) (561 ) 2,312 Deferred revenue 3,130 5,447 3,532 Accrued compensation and related benefits 136 1,825 1,031 Income taxes payable (1,541 ) 1,226 315 Other current liabilities 2,055 (1,232 ) 1,814 Deferred compensation (68 ) (373 ) 593 Net cash provided by operating activities 48,712 43,599 29,570 Cash flows from investing activities: Additions to capitalized software costs (5,863 ) (6,019 ) (5,042 ) Additions to equipment and improvements (3,218 ) (2,113 ) (3,240 ) Proceeds from sale of marketable securities 14,825 91,825 — Purchases of marketable securities — (114,645 ) — Proceeds from life insurance policy, net — 755 — Purchase of HSI, including direct transaction costs (8,241 ) — — Purchase of PMP, including direct transaction costs (16,950 ) — — Net cash used in investing activities (19,447 ) (30,197 ) (8,282 ) Cash flows from financing activities: Excess tax benefit from share-based compensation 3,381 1,311 2,527 Proceeds from the exercise of stock options 12,519 4,760 6,062 Dividends paid (30,763 ) (20,455 ) (27,074 ) Loan repayment (3,268 ) — — Net cash used in financing activities (18,131 ) (14,384 ) (18,485 ) Net increase (decrease) in cash and cash equivalents 11,134 (982 ) 2,803 Cash and cash equivalents at beginning of year 59,046 60,028 57,225 Cash and cash equivalents at end of year $ 70,180 $ 59,046 $ 60,028 IN THOUSANDS)In thousands) Fiscal Year Ended March 31, 2011 2010 2009 Cash flows from operating activities: Net income $ 61,606 $ 48,379 $ 46,119 Adjustments to reconcile net income to net cash provided by operating activities: Depreciation 4,304 3,663 2,911 Amortization of capitalized software costs 7,091 5,927 5,163 Amortization of other intangibles 3,255 1,783 1,034 Provision for bad debts 3,780 3,465 2,089 Provision (recovery) for inventory obsolescence 27 27 (13 ) Share-based compensation 3,748 2,073 1,977 Deferred income tax (benefit) expense (4,194 ) (786 ) 4,462 Tax benefit associated with stock options 1,524 1,576 3,382 Excess tax benefit from share-based compensation (1,524 ) (1,576 ) (3,381 ) Loss (gain) on disposal of equipment and improvements (33 ) — 96 Changes in assets and liabilities, net of amounts acquired: Accounts receivable (36,094 ) (18,944 ) (11,369 ) Inventories (620 ) (238 ) (88 ) Income taxes receivable 2,953 3,875 (5,433 ) Other current assets (2,074 ) (2,310 ) (1,202 ) Other assets (1,817 ) (894 ) (448 ) Accounts payable 3,344 (1,810 ) (299 ) Deferred revenue 13,211 12,528 3,130 Accrued compensation and related benefits 1,296 (1,006 ) 136 Income taxes payable 3,530 (1,404 ) (1,541 ) Other current liabilities 13,096 846 2,055 Deferred compensation 605 46 (68 ) Other noncurrent liabilities (6,950 ) — — Net cash provided by operating activities 70,064 55,220 48,712 Cash flows from investing activities: Additions to capitalized software costs (10,695 ) (7,921 ) (5,863 ) Additions to equipment and improvements (6,804 ) (4,935 ) (3,218 ) Proceeds from disposal of equipment and improvements 336 — — Proceeds from sale of marketable securities 7,700 425 14,825 Purchases of marketable securities (1,120 ) — — Cash acquired from purchase of Opus — 2,036 — Purchase of Opus — (250 ) — Purchase of NextGen IS — (300 ) — Purchase of PMP, including direct transaction costs — — (16,950 ) Purchase of HSI, including direct transaction costs — — (8,241 ) Payment of contingent consideration related to purchase of PMP — (3,000 ) — Net cash used in investing activities (10,583 ) (13,945 ) (19,447 ) Cash flows from financing activities: Excess tax benefit from share-based compensation 1,524 1,576 3,381 Proceeds from exercise of stock options 5,717 5,855 12,519 Dividends paid (34,716 ) (34,275 ) (30,763 ) Loan repayment — (3,268 ) Net cash used in financing activities (27,475 ) (26,844 ) (18,131 ) Net increase in cash and cash equivalents 32,006 14,431 11,134 Cash and cash equivalents at beginning of period 84,611 70,180 59,046 Cash and cash equivalents at end of period $ 116,617 $ 84,611 $ 70,180
2009
2008
2007
Fiscal Year Ended March 31, March 31, March 31, Supplemental disclosures of cash flow information: Cash paid during the year for income taxes, net of refunds $ 26,455 $ 20,546 $ 18,360 Non-cash investing and financing activities: Unrealized loss on marketable securities $ — $ (326 ) $ — Tax effect of unrealized loss on marketable securities — 130 — Reclassification of unrealized loss on marketable securities, net of tax 196 — — Unrealized loss on marketable securities, net of tax $ 196 $ (196 ) $ — Effective May 20, 2008, the Company acquired HSI in a transaction summarized as follows: Fair value of net assets assumed $ 20,609 $ — $ — Cash paid for HSI stock (8,241 ) — — Common stock issued for HSI stock (7,350 ) — — Liabilities assumed $ 5,018 $ — $ — Effective October 28, 2008, the Company acquired PMP in a transaction summarized as follows: Fair value of net assets assumed $ 23,875 $ — $ — Cash paid for PMP stock (16,950 ) — — Common stock issued for PMP stock (2,750 ) — — Liabilities assumed $ 4,175 $ — $ — In thousands) 60
CONSOLIDATED STATEMENTS OF CASH FLOWS — (Continued)
(IN THOUSANDS)
2009
2008
2007 Fiscal Year Ended March 31, 2011 2010 2009 Supplemental disclosures of cash flow information: Cash paid during the period for income taxes, net of refunds $ 29,044 $ 24,506 $ 26,455 Non-cash investing activities: Tenant improvement allowance received from landlord $ 1,970 $ — $ — Unrealized gain on marketable securities, net of tax $ — $ — $ 196 Issuance of stock options with fair value of $433 in connection with the acquisition of PMP $ — $ 433 $ — Effective February 10, 2010, the Company acquired Opus in a transaction summarized as follows: Fair value of net assets acquired $ — $ 32,209 $ — Cash paid — (250 ) — Common stock issued for Opus stock — (8,815 ) — Fair value of contingent consideration — (11,516 ) — Liabilities assumed $ — $ 11,628 $ — Effective August 12, 2009, the Company acquired NextGen IS in a transaction summarized as follows: Fair value of net assets acquired $ — $ 1,453 $ — Cash paid — (300 ) — Fair value of contingent consideration — (1,074 ) — Liabilities assumed $ — $ 79 $ — Effective October 28, 2008, the Company acquired PMP in a transaction summarized as follows: Fair value of net assets acquired $ — $ — $ 23,875 Cash paid — — (16,950 ) Common stock issued for PMP stock — — (2,750 ) Liabilities assumed $ — $ — $ 4,175 Effective May 20, 2008, the Company acquired HSI in a transaction summarized as follows: Fair value of net assets acquired $ — $ — $ 20,609 Cash paid — — (8,241 ) Common stock issued for HSI stock — — (7,350 ) Liabilities assumed $ — $ — $ 5,018 to these consolidated financial statements are an integral
part of these consolidated financial statements.
In thousands, except shares and per share data) QSI Dental Division, NextGen Division, Inpatient Solutions Division and Practice Solutions Division. 61
MARCH 31, 20092011 and 20082010
(DOLLAR AND SHARE AMOUNTS IN THOUSANDS, EXCEPT PER SHARE AMOUNTS)1.Description of Business, and its wholly-owned subsidiaries operates as four business divisions and is comprised ofof: (i) the QSI Dental Division; (ii) the NextGen Division, (“QSI Division”) and wholly-owned subsidiaries,which consists of NextGen Healthcare Information Systems, Inc.(“NextGen”); (iii) the Inpatient Solutions Division, which consists of NextGen Inpatient Solutions, LLC (“NextGen Division”IS” f/k/a Sphere) and Opus Healthcare Solutions, LLC (“Opus”),; (iv) the Practice Solutions Division, which consists of Lackland Acquisition II, LLC dba Healthcare Strategic Initiatives (“HSI”) and Practice Management Partners, Inc. (“PMP”) and (v) Quality Systems India Healthcare Private Limited (“QSIH”) (collectively, the Company)“Company”). The Company develops and markets healthcare information systems that automate certain aspects of medical and dental practices, networks of practices such as physician hospital organizations (“PHOs”) and management service organizations (“MSOs”), ambulatory care centers, community health centers and medical and dental schools. The Company also provides revenue cycle management (“RCM”) services through itsthe Practice Solutions division of NextGen. Operationally, HSI and PMP are administered as part of the NextGen Division.wethe Company capitalized on the increasing focus on medical cost containment and further expanded ourits information processing systems to serve the medical market. In the mid-1990’s, wethe Company made two acquisitions that accelerated ourits penetration of the medical market. These two acquisitions formed the basis for what is today the NextGen Division. Today, we serve the medicalphysician, inpatient and dental markets through our two divisions.two divisionsQSI Dental Division, co-located with the Corporate Headquarters in Irvine, California, currently focuses on developing, marketing and supporting software suites sold to dental practices.divisionDivision maintaining its own distinct product lines, product platforms, development, implementation and support teams, sales staffing and branding. The two divisionsDivisions share the resources of the Company’s “corporate office”office,” which includes a variety of accounting and other administrative functions. Additionally, there are a small but growing number of clients who are simultaneously utilizing software or services from eachmore than one of our two divisions.the Divisions.
The QSI Division, co-located
The NextGen Division, with headquarters in Horsham, Pennsylvania, and significant locations in Atlanta, Georgia, St. Louis, Missouri and Hunt Valley, Maryland, focuses principally on developing and marketing products and services for medical practices.
|
|
the inpatient market and will operate under the Company’s Inpatient Solutions Division.
America (“GAAP”).
A typical system contract contains multiple elements of the above items. SOP 98-9FASB ASC Topic 985-605-25,Software, Revenue Recognition, Multiple Elements,or ASC 985-605-25, requires revenue earned on software arrangements involving multiple elements to be allocated to each element based on the relative fair values of those elements. The fair value of an element must be based on vendor specificvendor-specific objective evidence (VSOE)(“VSOE”). The Company limits its assessment of VSOE for each element to either the price charged when the same element is sold separately or the price established by management having the relevant authority to do so, for an element not yet sold separately. VSOE calculations are updated and reviewed quarterly or annually depending on the nature of the product or service. The Company has established VSOE for the related undelivered elements based on the bell-shaped curve method. Maintenance VSOE for the Company’s largest customersclients is based on stated renewal rates only if the rate is determined to be substantive and falls within the Company’s customary pricing practices.
| § | |
| The fee must be negotiated at the outset of an arrangement and generally be based on the specific volume of products to be delivered without being subject to change based on variable pricing mechanisms such as the number of units copied or distributed or the expected number of users. |
62
| § | |
| Payment terms must not be considered extended. If a significant portion of the fee is due more than 12 months after delivery or after the expiration of the license, the fee is presumed not fixed |
| § | |
| the contract includes provisions that clearly specify the enforceable rights regarding goods or services to be provided and received by the parties, the consideration to be exchanged and the manner and terms of settlement; |
| § | |
| the customer can be expected to satisfy its obligations under the contract; |
| § | |
| the Company can be expected to perform its contractual obligations; and |
| § | |
| reliable estimates of progress towards completion can be made. |
If a situation occurs in which a contract is so short term that the financial statements would not vary materially from using the percentage-of-completion method or in which the Company is unable to make reliable estimates of progress of completion of the contract, the completed contract method is utilized.
| § | |
| the price is fixed or determinable; |
| § | |
| the customer is obligated to pay and there are no contingencies surrounding the obligation or the payment; |
| § | |
| the customer’s obligation would not change in the event of theft or damage to the product; |
| § | |
| the customer has economic substance; |
| § | |
| the amount of returns can be reasonably estimated; and |
| § | |
| the Company does not have significant obligations for future performance in order to bring about resale of the product by the customer. |
63
of industries, and therefore bears relatively low market risk. The average maturity of the investments owned by the money market fund is approximately two months.
The Company’salso held investments at March 31, 2009 and 2008 are in tax exempt municipal Auction Rate Securities (ARS)auction-rate securities (“ARS”), which arewere classified as either current or non-current marketable securities on the Company’s Consolidated Balance Sheets, depending on the liquidity and timing of expected realization of such securities. The ARS arewere rated by one or more national rating agencies and havehad contractual terms of up to 30 years, but generally havehad interest rate reset dates that occuroccurred every 7, 28 or 35 days. Despite the underlying long-term maturity of ARS, such securities were priced and subsequently traded as short-term investments because of the interest rate reset feature. If there arewere insufficient buyers, the auction is said to “fail” and the holders arewere unable to liquidate the investments through auction. A failed auction doesdid not result in a default of the debt instrument. Under their respective terms, the securities will continuecontinued to accrue interest and be auctioned until the auction succeeds,succeeded, the issuer callscalled the securities or the securities mature.
matured. In February 2008, the Company began to experience failed auctions on its ARS. To determine their estimated fair values at March 31, 2009 and 2008, factors including credit quality, assumptions about the likelihood of redemption, observable market data such as yields or spreads of fixed rate municipal bonds and other trading instruments issued by the same or comparable issuers were considered.
As of September 30, 2008, the Company had the intent and ability to hold these securities until anticipated recovery. As a result, the Company recognized the unrealized loss through September 30, 2008 as a temporary impairment in other comprehensive income within shareholders’ equity.
By accepting the Rights Agreement, the Company can no longer assert that it has the intent to hold the auction rate securities until anticipated recovery and has elected to reclassify its investments in ARS as trading securities, as defined by SFAS No. 115 “Accounting in Certain Investments in Debt and Equity Securities”, on the date of Company’s acceptanceat 100% of the Rights Agreement. As trading securities, the ARS are carried at fair value with changes recorded through earnings. At March 31, 2009, the Company held ARS with a$7,700 par value of $8,125. In the fourth quarter of fiscal year 2009, the Company recognized a pre-tax unrealized loss of approximately $730 through its earnings. The charge was measured as the approximate midpoint between various losses in values.
As the Company will be permitted to put the ARS back to UBS at par value, the Company accounted for the ARS put option rights as a separate asset that was measured at its fair value with changes recorded through earnings. The Company has valued the ARS put option right as the approximate midpoint between various fair values, measured as the difference between the par value of the ARS and the fair value of the securities, discounted by the credit risk of the broker and other factors such as the Company’s historical experience to sell ARS at par. The estimated fair value of the ARS put option rights as of March 31, 2009 was determined to be $468. The Company is required to assess the fair value of these two individual assets and to record corresponding changes in fair value in each reporting period through the Consolidated Statements of Income until the ARS put option rights are exercised
and the ARS are redeemed or sold. The Company expects that the fair value movements in the ARS will be largely offset by the future changes in the fair value of the ARS put option rights. Since the ARS put option rights represent the right to sell the securities back to UBS at par, the Company will be required to periodically assess the economic ability of UBS to meet that obligation in assessing the fair value of the ARS put option rights. The Company will continue to classify the ARS as long-term investments until June 30, 2009, one year prior to the expected settlement.
Allowance for Doubtful AccountsAccounts..The Company provides credit terms typically ranging from thirty days to less than twelve months for most system and maintenance contract sales and generally does not require collateral. The Company performs credit evaluations of its customersclients and maintains reserves for estimated credit losses. Reserves for potential credit losses are determined by establishing both specific and general reserves. Specific reserves are based on management’s estimate of the probability of collection for certain troubled accounts. General reserves are established based on the Company’s historical experience of bad debt expense and the aging of the Company’s accounts receivable balances, net of deferred revenuesrevenue and specifically reserved accounts. Accounts are written off as uncollectible only after the Company has expended extensive collection efforts.
• | Computers equipment | 3-5 years | ||
• |
|
| ||
| Furniture and fixtures | 5-7 years | ||
• | ||||
| Leasehold improvements | lesser of lease term or estimated useful life of asset |
64
Long-Lived Assets. The Company follows SFAS No. 144, “Accounting for theEquipment, Impairment or Disposal of Long-Lived Assets” (SFAS 144). Assets, or ASC 360-10. If the future undiscounted cash flows expected to result from the use of the related assets are less than the carrying value of such assets, impairment has been incurred and a loss is recognized to reduce the carrying value of the long-lived assets to fair value, which is determined by discounting estimated future cash flows.
of long-lived assets to determine whether or not impairment to such value has occurred and has determined that there was no impairment atto its long-lived assets as of March 31, 2009.
2011. In addition to the recoverability assessment, the Company routinely reviews the remaining estimated lives of its long-lived assets.
65
income.
1 |
|
|
|
|
|
|
|
|
|
|
|
| Year Ended March 31, |
| |||||||
|
|
| ||||||||
|
| 2009 |
| 2008 |
| 2007 |
| |||
|
|
|
|
| ||||||
Net income |
| $ | 46,119 |
| $ | 40,078 |
| $ | 33,232 |
|
Other comprehensive income: |
|
|
|
|
|
|
|
|
|
|
Unrealized gain (loss) on marketable securities, net of tax |
|
| — |
|
| (196 | ) |
| — |
|
|
|
|
|
| ||||||
Comprehensive income |
| $ | 46,119 |
| $ | 39,882 |
| $ | 33,232 |
|
|
|
|
|
| ||||||
and 2008, respectively.
equivalents and is based on the assumption that the Company’s outstanding options are included in the calculation of diluted earnings per share, except when their effect would be anti-dilutive. Dilution is computed by applying the treasury stock method. Under this method, options are assumed to be exercised at the beginning of the period (or at the time of issuance, if later), and as if funds obtained thereby were used to purchase common stock at the average market price during the period. The following table reconciles the weighted averageweighted-average shares outstanding for basic and diluted net income per share for the periods presented.
|
|
|
|
|
|
|
|
|
|
|
|
| Year ended March 31, |
| |||||||
|
|
| ||||||||
|
| 2009 |
| 2008 |
| 2007 |
| |||
|
|
|
|
| ||||||
|
|
|
|
|
|
|
|
|
|
|
Net income |
| $ | 46,119 |
| $ | 40,078 |
| $ | 33,232 |
|
Basic net income per common share: |
|
|
|
|
|
|
|
|
|
|
Weighted average of common shares outstanding |
|
| 28,031 |
|
| 27,298 |
|
| 26,882 |
|
|
|
|
|
| ||||||
Basic net income per common share |
| $ | 1.65 |
| $ | 1.47 |
| $ | 1.24 |
|
|
|
|
|
| ||||||
|
|
|
|
|
|
|
|
|
|
|
Net income |
| $ | 46,119 |
| $ | 40,078 |
| $ | 33,232 |
|
Diluted net income per common share: |
|
|
|
|
|
|
|
|
|
|
Weighted average of common shares outstanding |
|
| 28,031 |
|
| 27,298 |
|
| 26,882 |
|
Effect of potentially dilutive securities (options). |
|
| 365 |
|
| 472 |
|
| 668 |
|
|
|
|
|
| ||||||
Weighted average of common shares outstanding - diluted |
|
| 28,396 |
|
| 27,770 |
|
| 27,550 |
|
|
|
|
|
| ||||||
Diluted net income per common share |
| $ | 1.62 |
| $ | 1.44 |
| $ | 1.21 |
|
|
|
|
|
| ||||||
indicated:
| Fiscal Year Ended March 31, | ||||||||||||
| 2011 | 2010 | 2009 | ||||||||||
| Net income | $ | 61,606 | $ | 48,379 | $ | 46,119 | ||||||
| Basic net income per share: | ||||||||||||
| Weighted-average shares outstanding — Basic | 28,947 | 28,635 | 28,031 | |||||||||
| Basic net income per common share | $ | 2.13 | $ | 1.69 | $ | 1.65 | ||||||
| Net income | $ | 61,606 | $ | 48,379 | $ | 46,119 | ||||||
| Diluted net income per share: | ||||||||||||
| Weighted-average shares outstanding — Basic | 28,947 | 28,635 | 28,031 | |||||||||
| Effect of potentially dilutive securities | 171 | 161 | 365 | |||||||||
| Weighted-average shares outstanding — Diluted | 29,118 | 28,796 | 28,396 | |||||||||
| Diluted net income per common share | $ | 2.12 | $ | 1.68 | $ | 1.62 | ||||||
66
The Company adopted SFAS 123R using the modified prospective transition method, which requires the application of the accounting standard as of April 1, 2006, the first day of the Company’s fiscal year 2007. The Company’s Consolidated Statements of Income for the years ended March 31, 2009, 2008 and 2007 reflect the impact of SFAS 123R. Share-based compensation expense recognized under SFAS 123R for the years ended March 31, 2009, 2008 and 2007 was $1,977, $3,757 and $3,923, respectively, which consisted of stock-based compensation expense related to employee and director stock options and included $430 expensed under APB 25 for “in the money” options issued prior to the adoption of SFAS 123R. Excess tax benefits from share-based compensation are presented as cash outflows from operating activities and cash inflows from financing activities. The Company has elected to adopt the alternative transition method provided in FASB Staff Position No. SFAS 123R-3 (FSP 123(R)-3) for calculating the tax effects of share-based compensation pursuant to SFAS 123R. The alternative transition method includes a simplified method to establish the beginning balance of the additional paid-in capital (APIC pool) related to the tax effects of employee and director stock-based compensation, and to determine the subsequent impact on the APIC pool and the consolidated statement of cash flows of the tax effects of employee and director share-based awards that were outstanding upon adoption of SFAS 123R.
SFAS 123RCompensation,or ASC 718, requires companies to estimate the fair value of share-based payment awards on the date of grant using an option-pricing model. Expected term is estimated using historical exercise experience. Volatility is estimated by using the weighted averageweighted-average historical volatility of the Company’s common stock, which approximates expected volatility. The risk free rate is the implied yield available on the U.S Treasury zero-coupon issues with remaining terms equal to the expected term. The expected dividend yield is the average dividend rate during a period equal to the expected term of the option. Those inputs are then entered into the Black Scholes model to determine the estimated fair value. The value of the portion of the award that is ultimately expected to vest is recognized ratably as expense over the requisite service period in the Company’s Consolidated Statementsconsolidated statements of Income.
Share-based compensation is adjusted on a quarterly basis for changes to estimated forfeitures based on a review of historical forfeiture activity. To the extent that actual forfeitures differ, or are expected to differ, from the estimate, share-based compensation expense is adjusted accordingly. The effect of the forfeiture adjustments for years ended March 31, 2011, 2010 and 2009 was not significant.
|
|
|
|
|
|
|
|
|
|
|
|
| Year ended March 31, |
| |||||||
|
|
| ||||||||
|
| 2009 |
| 2008 |
| 2007 |
| |||
|
|
|
|
| ||||||
Costs and expenses: |
|
|
|
|
|
|
|
|
|
|
Cost of revenue |
| $ | 195 |
| $ | 496 |
| $ | 524 |
|
Research and development |
|
| 242 |
|
| 800 |
|
| 870 |
|
Selling, general and administrative |
|
| 1,540 |
|
| 2,461 |
|
| 2,529 |
|
|
|
|
|
| ||||||
|
|
|
|
|
|
|
|
|
|
|
Total share-based compensation |
| $ | 1,977 |
| $ | 3,757 |
| $ | 3,923 |
|
Amounts capitalized in software development costs |
|
| (21 | ) |
| (39 | ) |
| (38 | ) |
|
|
|
|
| ||||||
Amounts charged against earnings, before income tax benefit |
| $ | 1,956 |
| $ | 3,718 |
| $ | 3,885 |
|
|
|
|
|
| ||||||
|
|
|
|
|
|
|
|
|
|
|
Amount of related income tax benefit recognized |
| $ | 549 |
| $ | 969 |
| $ | 910 |
|
|
|
|
|
| ||||||
2009:
| Fiscal Year Ended March 31, | ||||||||||||
| 2011 | 2010 | 2009 | ||||||||||
| Costs and expenses: | ||||||||||||
| Cost of revenue | $ | 272 | $ | 85 | $ | 195 | ||||||
| Research and development costs | 152 | 108 | 242 | |||||||||
| Selling, general and administrative | 3,324 | 1,880 | 1,540 | |||||||||
| Total share-based compensation | 3,748 | 2,073 | 1,977 | |||||||||
| Amounts capitalized in software development costs | (2 | ) | (27 | ) | (21 | ) | ||||||
| Amounts charged against earnings, before income tax benefit | $ | 3,746 | $ | 2,046 | $ | 1,956 | ||||||
| Related income tax benefit | (1,343 | ) | (608 | ) | (549 | ) | ||||||
| Decrease in net income | $ | 2,403 | $ | 1,438 | $ | 1,407 | ||||||
income.
FSP FAS 157-4, “Determining Fair Value When the Volume and Level of Activity for the Asset or Liability Have Significantly Decreased and Identifying Transactions That Are Not Orderly,” provides guidelines for makingclarifies some existing disclosure requirements about fair value measurements more consistent with the principles presented in FASB Statement No. 157, “Fair Value Measurements.” FSP FAS 157-4 must be applied prospectivelymeasurement. The new disclosures and retrospective application is not permitted. FSP FAS 157-4 isclarifications of existing disclosures are effective for interim and annual reporting periods endingbeginning after JuneDecember 15, 2009, with early adoption permittedexcept for periods ending after March 15, 2009. An entity early adopting FSP FAS 157-4 must also early adopt FSP FAS 115-2the disclosures about purchases, sales, issuances and FAS 124-2.
FSP FAS 115-2 and FAS 124-2. “Recognition and Presentationsettlements in the roll forward of Other-Than-Temporary Impairments,” provides additional guidance designed to create greater clarity and consistencyactivity in accounting for and presenting impairment losses on debt securities. FSP FAS 115-2 and FAS 124-2 isLevel 3 fair value measurements. Those disclosures are effective for interimfiscal years beginning after December 15, 2010 and annual periods ending after June 15, 2009, with early adoption permitted for periods ending after March 15, 2009. An entity may early adopt this FSP only if it also elects to early adopt FSP FAS 157-4.
FSP FAS 107-1 and APB 28-1, “Interim Disclosures about Fair Value of Financial Instruments,” enhances consistency in financial reporting by increasing the frequency of fair value disclosures. FSP 107-1 and APB 28-1 is effective for interim periods ending after June 15, 2009, with early adoption permitted for periods ending after March 15, 2009. However, an entity may early adopt these interim fair value disclosure requirements only if it also elects to early adopt FSP FAS 157-4 and FSP FAS 115-2 and FAS 124-2.
The Company is currently evaluating thewithin those fiscal years. There was no impact if any, thatfrom the adoption of these FSPs will have on itsthis guidance to our consolidated financial statements.position or results of operations as the amendment only addresses disclosures.
67
On
In November 2008, the FASB ratified EITF Issue No. 08-6, “Equity Method Investment Accounting Considerations” (EITF 08-6). EITF 08-6 clarifies the accounting for certain transactions and impairment considerations involving equity method investments. EITF 08-62010. Early adoption is effective for fiscal years beginning after December 15, 2008, with early adoption prohibited.permitted but was not elected. The Company does not currently have any investments that are accounted for underexpect the equity method and therefore EITF 08-6 will notamendments to have a significant impact on the Company’s consolidated financial statements.
In November 2008, the FASB ratified EITF Issue No. 08-7, “Accounting for Defensive Intangible Assets” (EITF 08-7). EITF 08-7 clarifies the accounting for certain separately identifiable intangible assets which an acquirer does not intend to actively use but intends to hold to prevent its competitors from obtaining access to them. EITF 08-7 requires an acquirer in a business combination to account for a defensive intangible asset as a separate unit of accounting which should be amortized to expense over the period the asset diminishes in value. EITF 08-7 is effective for fiscal years beginning after December 15, 2008, with early adoption prohibited. The Company is currently in the process of evaluating the impact the new EITF will have on its consolidated financial statements.
In October 2008, the FASB issued Staff Position (FSP) FAS 157-3, “Determining the Fair Value of a Financial Asset When The Market for That Asset Is Not Active” (FSP FAS 157-3), to clarify the application of the provisions of SFAS No. 157, “Fair Value Measurements,” in an inactive market and how an entity would determine fair value in an inactive market. FSP FAS 157-3 was effective upon issuance. The Company has considered the FSP in its determination of estimated fair values of its ARS for the fiscal year 2009. The Company does not currently have any assets that are inactive and therefore FAS 157-3 will not have a significant impact on the Company’s consolidated financial statements.
In June 2008, the FASB issued FSP EITF 03-6-1, “Determining Whether Instruments Granted in Share-Based Payment Transactions Are Participating Securities” (FSP EITF 03-6-1). FSP EITF 03-6-1 concluded that unvested share-based payment awards that contain nonforfeitable rights to dividends or dividend equivalents (whether paid or unpaid) are participating securities and shall be included in the computation of basic earnings per share (“EPS”) pursuant to the two-class method. This FSP becomes effective on April 1, 2009. Early adoption of the FSP is not permitted; however, it will apply retrospectively to EPS data for all periods presented in the financial statements or in financial data. We do not currently anticipate that this FSP will have a material impact on the Company’s EPS data in fiscal year 2010 or on EPS for any prior periods presented in the financial data upon adoption.
In May 2008, the FASB issued SFAS No. 162, “The Hierarchy of Generally Accepted Accounting Principles” (SFAS 162). SFAS 162 defines the order in which accounting principles that are generally accepted should be followed. SFAS 162 is effective 60 days following the Securities and Exchange Commission’s approval of the Public Company Accounting Oversight Board (PCAOB) amendments to AU Section 411, “The Meaning of Present Fairly in Conformity with Generally Accepted Accounting Principles”. We do not expect the adoption of SFAS 162 to have a material impact on the Company’s consolidated financial statements.
In April 2008, the FASB finalized FSP FAS No. 142-3, “Determination of the Useful Life of Intangible Assets” (FSP FAS 142-3). The position amends the factors that should be considered in developing renewal or extension assumptions used to determine the useful life of a recognized intangible asset under SFAS No. 142, “Goodwill and Other Intangible Assets”. The position applies to intangible assets that are acquired individually or with a group of other assets and both intangible assets acquired in business combinations and asset acquisitions. FSP 142-3 is effective for fiscal years beginning after December 15, 2008, and interim periods within those fiscal years. Management is currently evaluating the impact of the pending adoption of FSP FAS 142-3 on the consolidated financial statements.
In December 2007, the FASB issued SFAS No. 141 (Revised 2007), “Business Combinations” (SFAS 141(R)). SFAS 141(R) retains the fundamental requirements of the original pronouncement requiring that the purchase method be used for all business combinations. SFAS 141(R) defines the acquirer as the entity that obtains control of one or more businesses in the business combination, establishes the acquisition date as the date that the acquirer achieves control and requires the acquirer to recognize the assets acquired, liabilities assumed and any noncontrolling interest at their fair values as of the acquisition date. In addition, SFAS 141(R) requires expensing of acquisition-related and restructure-related costs, remeasurement of earn out provisions at fair value, measurement of equity securities issued for purchase at the date of close of the transaction and non-expensing of in-process research and development related intangibles. SFAS 141(R) applies prospectively to business combinations for which the acquisition date is on or after the beginning of the first annual reporting period beginning on or after December 15, 2008. An entity may not apply it before that date. This pronouncement will be applied by the Company when it becomes effective and when or if the Company effectuates a business combination, otherwise there is no impact on the Company’s consolidated financial statements.
3.Cash and Cash Equivalents
Effective April 1, 2008, the
Level 1 | Quoted market prices in active markets for identical assets or liabilities; | |
Level 2 | Observable inputs other than those included in Level | |
Level 3 | Unobservable inputs reflecting management’s own assumptions about the inputs used in estimating the value of the asset. |
68
On February 12, 2008, the FASB amended the implementation of SFAS 157 related to non-financial assets and liabilities until fiscal periods beginning after November 15, 2008. As a result,
are classified in their entirety based on the Company has not appliedlowest level of input that is significant to the above fair value proceduresmeasurement. The Company’s assessment of the significance of a particular input to its goodwillthe fair value measurement requires judgment and long-lived asset impairment analyses duringmay affect the current year. The Company believes that the adoptionvaluation of SFAS 157 for non-financialfair value assets and liabilities will not have a material impact on its consolidated financial position or results of operations.
and their placement within the fair value hierarchy levels. The following table summarizestables sets forth by level within the fair value hierarchy the Company’s financial assets measuredand liabilities that were accounted for at fair value on a recurring basis in accordance with SFAS 157 as ofat March 31, 20092011 and March 31, 2008:
|
|
|
|
|
|
|
|
|
|
|
|
|
|
|
| Balance as of |
| Quoted Prices in |
| Significant |
| Unobservable |
| ||||
|
|
|
|
|
| ||||||||
Cash and cash equivalents |
| $ | 70,180 |
| $ | 70,180 |
| $ | — |
| $ | — |
|
Restricted cash |
|
| 1,303 |
|
| 1,303 |
|
| — |
|
| — |
|
Marketable securities (1) |
|
| 7,395 |
|
| — |
|
| — |
|
| 7,395 |
|
ARS put option rights |
|
| 468 |
|
| — |
|
| — |
|
| 468 |
|
|
|
|
|
|
| ||||||||
|
| $ | 79,346 |
| $ | 71,483 |
| $ | — |
| $ | 7,863 |
|
|
|
|
|
|
| ||||||||
|
|
|
|
|
|
|
|
|
|
|
|
|
|
|
| Balance as of |
| Quoted Prices in |
| Significant |
| Unobservable |
| ||||
|
|
|
|
|
| ||||||||
Cash and cash equivalents |
| $ | 59,046 |
| $ | 59,046 |
| $ | — |
| $ | — |
|
Restricted cash |
|
| — |
|
| — |
|
| — |
|
| — |
|
Marketable securities (1) |
|
| 22,624 |
|
| — |
|
| — |
|
| 22,624 |
|
|
|
|
|
|
| ||||||||
|
| $ | 81,670 |
| $ | 59,046 |
| $ | — |
| $ | 22,624 |
|
|
|
|
|
|
| ||||||||
(1) 2010:
| Quoted Prices | ||||||||||||||||
| in Active | Significant | |||||||||||||||
| Markets for | Other | |||||||||||||||
| Balance at | Identical | Observable | Unobservable | |||||||||||||
| March 31, | Assets | Inputs | Inputs | |||||||||||||
| 2011 | (Level 1) | (Level 2) | (Level 3) | |||||||||||||
| ASSETS | ||||||||||||||||
| Cash and cash equivalents | $ | 116,617 | $ | 116,617 | $ | — | $ | — | ||||||||
| Restricted cash | 3,787 | 3,787 | — | — | ||||||||||||
| Marketable securities | 1,120 | 1,120 | — | — | ||||||||||||
| $ | 121,524 | $ | 121,524 | $ | — | $ | — | |||||||||
| LIABILITIES | ||||||||||||||||
| Contingent consideration related to acquisitions | $ | 13,658 | — | $ | 12,743 | $ | 915 | |||||||||
| $ | 13,658 | $ | — | $ | 12,743 | $ | 915 | |||||||||
| Quoted Prices | ||||||||||||||||
| in Active | Significant | |||||||||||||||
| Markets for | Other | |||||||||||||||
| Balance at | Identical | Observable | Unobservable | |||||||||||||
| March 31, | Assets | Inputs | Inputs | |||||||||||||
| 2010 | (Level 1) | (Level 2) | (Level 3) | |||||||||||||
| ASSETS | ||||||||||||||||
| Cash and cash equivalents | $ | 84,611 | $ | 84,611 | $ | — | $ | — | ||||||||
| Restricted cash | 2,339 | 2,339 | — | — | ||||||||||||
| Marketable securities (1) | 7,158 | — | — | 7,158 | ||||||||||||
| ARS put option rights (2) | 548 | — | — | 548 | ||||||||||||
| $ | 94,656 | $ | 86,950 | $ | — | $ | 7,706 | |||||||||
| LIABILITIES | ||||||||||||||||
| Contingent consideration related to acquisitions | $ | 12,590 | $ | — | $ | — | $ | 12,590 | ||||||||
| $ | 12,590 | $ | — | $ | — | $ | 12,590 | |||||||||
| (1) | Marketable securities consist of ARS. | |
| (2) | ARS put option rights are included in other current assets. |
$6, which is included in other income on the accompanying consolidated statements of income. The ARS were sold and settled on July 1, 2010 at 100% of the $7,700 par value. The Company recorded interest of $83 from the ARS for year ended March 31, 2011. The Company has no outstanding ARS or ARS put option rights at March 31, 2011.
69
|
|
|
|
|
Balance at March 31, 2008 |
| $ | 22,624 |
|
Transfer in/(out) of Level 3 |
|
| — |
|
Proceeds from sales (at par) |
|
| (14,825 | ) |
Unrealized loss, net of tax |
|
| (404 | ) |
Recognition of ARS put option rights |
|
| 468 |
|
|
|
| ||
Balance at March 31, 2009 |
| $ | 7,863 |
|
|
|
|
Upon execution2011:
| Assets | Liabilities | |||||||
| Balance at March 31, 2009 | $ | 7,863 | $ | — | ||||
| Transfer into Level 3 | — | 12,590 | ||||||
| Proceeds from sale at par | (425 | ) | — | |||||
| Recognized gain | 268 | — | ||||||
| Balance at March 31, 2010 | $ | 7,706 | $ | 12,590 | ||||
| Transfer out of Level 3 | — | (12,743 | ) | |||||
| Earnout payments | — | (253 | ) | |||||
| Goodwill adjustment (1) | — | 532 | ||||||
| Fair value adjustments, net | — | 789 | ||||||
| Proceeds from sale at par | (7,700 | ) | — | |||||
| Recognized loss | (6 | ) | — | |||||
| Balance at March 31, 2011 | $ | — | $ | 915 | ||||
| (1) | Adjustment made to goodwill that should have been recorded as part of |
other (expense) income within the Consolidated Statement of Income forunobservable inputs used. During the year ended March 31, 20092011, there were no adjustments to fair value of such assets.
these assets and liabilities approximates fair value because of the short-term nature of these instruments.
|
|
|
|
|
|
|
|
|
|
|
|
| Year ended March 31, |
| |||||||
|
|
| ||||||||
|
| 2009 |
| 2008 |
| 2007 |
| |||
|
|
|
|
| ||||||
|
|
|
|
|
|
|
|
|
|
|
Interest income |
| $ | 1,203 |
| $ | 2,661 |
| $ | 3,306 |
|
|
|
|
|
| ||||||
| Fiscal Year Ended March 31, | ||||||||||||
| 2011 | 2010 | 2009 | ||||||||||
| Interest Income | $ | 263 | $ | 226 | $ | 1,203 | ||||||
Acquisition of Healthcare Strategic Initiatives
This acquisition is a part of the Company’s growth strategy for NextGen Practice Solutions. HSI operates under the umbrella of NextGen Practice Solutions. Founded in 1996, HSI currently provides RCM services to providers including healthclinical information systems hospitals, and physicians in private practice with an in-house team of employees including specialists in medical billing, coding and compliance, payor credentialing, and information technology. The Company intends to cross sell both software and RCM services to the acquired customer base of HSI and NextGen.
small hospital inpatient market. The Opus purchase price totaled approximately $15,591 plus up$21,113, which includes a fair value adjustment of $532 to approximately $1,650 in incentives tiedgoodwill and the contingent consideration liability that was recorded during the year ended March 31, 2011. The fair value of the total Opus contingent consideration of $12,048 was estimated at the time of purchase based on the probability of Opus achieving certain earnout payments to future performance. The purchase price consisted of cash and restricted QSI common stock, subject to restrictions on resale lapsingbe paid over a two year period to the selling security holders and transaction related costs. former stock option holders (“option holders”) of Opus if certain operational and strategic objectives were met.
70
|
|
|
|
|
Cash |
| $ | 8,000 |
|
Common stock |
|
| 7,350 |
|
Direct transaction costs |
|
| 241 |
|
|
|
| ||
Total purchase price |
| $ | 15,591 |
|
|
|
|
The acquisition of HSI was accounted forOpus and NextGen IS acquisitions as a purchase business combination as defined in Statement of Financial Accounting Standards No. 141, “Business Combinations” (SFAS 141).FASB ASC Topic 805,Business Combinations, or ASC 805. Under the purchaseacquisition method of accounting, the purchase price was allocated to HSI’sthe tangible and intangible assets acquired and liabilities assumed based on their estimated fair values as of May 20, 2008.the acquisition date. The fair value of the assets acquired and liabilities assumed represent management’s estimate of fair value. The Company is amortizingestimated fair value of the customer relationshipsacquired tangible and intangible assets and liabilities assumed were determined using multiple valuation approaches depending on the type of tangible or intangible asset over six yearsacquired, including but not limited to the income approach, the excess earnings method as well as the relief from royalty method approach.
| Opus | NextGen IS | |||||||
| Cash paid | $ | 250 | $ | 300 | ||||
| Common stock issued at fair value | 8,815 | — | ||||||
| Contingent consideration | 12,048 | 1,074 | ||||||
| Total purchase price | $ | 21,113 | $ | 1,374 | ||||
|
|
|
|
|
Current assets (including restricted cash of $1,470 and accounts receivable of $2,176) |
| $ | 3,808 |
|
Equipment and improvements and other long-term assets |
|
| 342 |
|
|
|
| ||
Total tangible assets acquired |
|
| 4,150 |
|
Customer relationships |
|
| 5,241 |
|
Trade name |
|
| 379 |
|
Goodwill |
|
| 10,839 |
|
Current liabilities, including long-term debt due within one year |
|
| (4,369 | ) |
Long-term debt |
|
| (649 | ) |
|
|
| ||
Net assets acquired |
| $ | 15,591 |
|
|
|
|
| Opus | NextGen IS | |||||||
| Fair value of the net tangible assets acquired and liabilities assumed: | ||||||||
| Cash and cash equivalents | $ | 2,036 | $ | — | ||||
| Current assets (including accounts receivable of $1,753 and $158 for Opus and NextGen IS, respectively) | 3,435 | 158 | ||||||
| Equipment and improvements and other long-term assets | 483 | — | ||||||
| Accounts payable and accrued liabilities | (7,678 | ) | — | |||||
| Current liabilities, including long-term debt due within one year | — | (79 | ) | |||||
| Deferred revenues | (3,950 | ) | — | |||||
| Total tangible assets acquired and liabilities assumed | (5,674 | ) | 79 | |||||
| Fair value of identifiable intangible assets acquired: | ||||||||
| Customer relationships | 1,250 | 156 | ||||||
| Software technology | 12,000 | 119 | ||||||
| Goodwill (including assembled workforce of $1,000 and and $84 for Opus and NextGen IS, respectively) | 13,537 | 1,020 | ||||||
| Total identifiable intangible assets acquired | 26,787 | 1,295 | ||||||
| Total purchase price | $ | 21,113 | $ | 1,374 | ||||
71
Acquisition of Practice Management Partners, Inc.
On October 28, 2008, the Company, through its NextGen subsidiary, acquired PMP, a full-service healthcare RCM company, resulting in PMP becoming a wholly-owned subsidiary of NextGen and, ultimately QSI. PMP’s results of operations have been included in the consolidated financial statements since the date of acquisition.
This acquisition is also part of the Company’s growth strategy for NextGen Practice Solutions. Similar to HSI, PMP operates under the umbrella of NextGen Practice Solutions. Founded in 2001, PMP provides physician billing and technology management services to healthcare providers, primarily in the Mid-Atlantic region. The Company intends to cross sell both software and RCM services to the acquired customer base of PMP and NextGen.
The purchase price totaled approximately $19,700 plus up to approximately $3,000 in incentives tied to future performance. The purchase price consisted of $16,950 in cash, including direct transaction costs and $2,750 in restricted QSI common stock, subject to restrictions on resale lapsing over a two year period, and transaction related costs. The value of the 67,733 shares of common stock issued was determined based on a formula which took the average of the closing price of QSI’s common shares during the 45 day trading period ending on October 27, 2008. The total purchase price for PMP is as follows:
|
|
|
|
|
Cash |
| $ | 16,622 |
|
Common stock |
|
| 2,750 |
|
Direct transaction costs |
|
| 328 |
|
|
|
| ||
Total purchase price |
| $ | 19,700 |
|
|
|
|
The acquisition of PMP was accounted for as a purchase business combination as defined in SFAS 141. Under the purchase method of accounting, the purchase price was allocated to PMP’s tangible and intangible assets acquired and liabilities assumed based on their estimated fair values as of October 28, 2008. The fair value of the assets acquired and liabilities assumed represent management’s estimate of fair value. The Company is amortizing the customer relationships intangible asset over nine years and the trade name over four years. The $16,052 assigned to goodwill is not expected to be deductible for tax purposes. See Notes 6 and 7 for a discussion of goodwill and intangibles acquired. As stated above, the Company has agreed to pay additional consideration in future periods, based upon the attainment by the acquired entity of defined operating objectives.
The following table summarizes the allocation of the purchase price:
|
|
|
|
|
Current assets (including restricted cash of $125 and accounts receivable of $2,029) |
| $ | 2,518 |
|
Equipment and improvements and other long-term assets |
|
| 1,485 |
|
|
|
| ||
Total tangible assets acquired |
|
| 4,003 |
|
Customer relationships |
|
| 3,559 |
|
Trade name |
|
| 259 |
|
Goodwill |
|
| 16,052 |
|
Current liabilities, including long-term debt due within one year |
|
| (1,882 | ) |
Long-term liabilies and debt, including deferred tax liability |
|
| (2,291 | ) |
|
|
| ||
Net assets acquired |
| $ | 19,700 |
|
|
|
|
The pro forma effects of this acquisition would not have been material to the Company’s results of operations for the year ended March 31, 2009 and therefore is not presented.
|
|
In accordance with SFAS 142,ASC 350-20, the Company does not amortize goodwill as the goodwill has been determined to have an indefinite useful life.
|
|
|
|
|
|
| March 31, |
| |
|
|
| ||
| ||||
NextGen Healthcare Information Systems, Inc. |
| $ | 1,840 |
|
Healthcare Strategic Initiatives |
|
| 10,839 |
|
Practice Management Partners |
|
| 16,052 |
|
|
|
| ||
Total |
| $ | 28,731 |
|
|
|
| ||
| Balance at | Balance at | |||||||||||
| March 31, | March 31, | |||||||||||
| 2010 | Adjustment (1) | 2011 | ||||||||||
| NextGen Division | ||||||||||||
| NextGen Healthcare Information Systems, Inc. | $ | 1,840 | $ | — | $ | 1,840 | ||||||
| Total NextGen Division goodwill | 1,840 | — | 1,840 | |||||||||
| Inpatient Solutions Division | ||||||||||||
| Opus Healthcare Solutions, Inc. | 13,005 | 532 | 13,537 | |||||||||
| NextGen Inpatient Solutions, LLC | 1,020 | — | 1,020 | |||||||||
| Total Inpatient Solutions Division goodwill | 14,025 | 532 | 14,557 | |||||||||
| Practice Solutions Division | ||||||||||||
| Practice Management Partners, Inc. | 19,485 | — | 19,485 | |||||||||
| Healthcare Strategic Initiatives | 10,839 | — | 10,839 | |||||||||
| Total Practice Solutions Division goodwill | 30,324 | — | 30,324 | |||||||||
| Total goodwill | $ | 46,189 | $ | 532 | $ | 46,721 | ||||||
|
| Adjustment made to goodwill that should have been recorded as part of the final purchase price allocation as of March 31, 2010. Refer to Note 5 — Business Combinations for additional details. |
| March 31, 2011 | ||||||||||||||||
| Customer | Software | |||||||||||||||
| Relationships | Trade Name | Technology | Total | |||||||||||||
| Gross carrying amount | $ | 10,206 | $ | 637 | $ | 12,119 | $ | 22,962 | ||||||||
| Accumulated amortization | (3,879 | ) | (429 | ) | (1,764 | ) | (6,072 | ) | ||||||||
| Net intangible assets | $ | 6,327 | $ | 208 | $ | 10,355 | $ | 16,890 | ||||||||
| Aggregate amortization expense during the year | $ | 1,522 | $ | 160 | $ | 1,573 | $ | 3,255 | ||||||||
| March 31, 2010 | ||||||||||||||||
| Customer | Software | |||||||||||||||
| Relationships | Trade Name | Technology | Total | |||||||||||||
| Gross carrying amount | $ | 10,206 | $ | 637 | $ | 12,119 | $ | 22,962 | ||||||||
| Accumulated amortization | (2,357 | ) | (269 | ) | (191 | ) | (2,817 | ) | ||||||||
| Net intangible assets | $ | 7,849 | $ | 368 | $ | 11,928 | $ | 20,145 | ||||||||
| Aggregate amortization expense during the year | $ | 1,434 | $ | 158 | $ | 191 | $ | 1,783 | ||||||||
72
|
|
|
|
|
|
|
|
|
|
|
|
| Customer |
| Trade Name |
| Total |
| |||
|
|
|
|
| ||||||
Balance as of April 1, 2008 |
| $ | — |
| $ | — |
| $ | — |
|
Acquisition |
|
| 8,800 |
|
| 637 |
|
| 9,437 |
|
Amortization |
|
| (923 | ) |
| (111 | ) |
| (1,034 | ) |
|
|
|
|
| ||||||
Balance as of March 31, 2009 |
| $ | 7,877 |
| $ | 526 |
| $ | 8,403 |
|
|
|
|
|
| ||||||
| Customer | Software | |||||||||||||||
| Relationships | Trade Name | Technology | Total | |||||||||||||
| Balance as of March 31, 2009 | $ | 7,877 | $ | 526 | $ | — | $ | 8,403 | ||||||||
| Acquisition | 1,406 | — | 12,119 | 13,525 | ||||||||||||
| Amortization (1) | (1,434 | ) | (158 | ) | (191 | ) | (1,783 | ) | ||||||||
| Balance as of March 31, 2010 | 7,849 | 368 | 11,928 | 20,145 | ||||||||||||
| Acquisition | — | — | — | — | ||||||||||||
| Amortization (1) | (1,522 | ) | (160 | ) | (1,573 | ) | (3,255 | ) | ||||||||
| Balance as of March 31, 2011 | $ | 6,327 | $ | 208 | $ | 10,355 | $ | 16,890 | ||||||||
| (1) | Amortization of the customer relationships and trade name intangible assets is included in operating expenses and amortization of the software technology intangible assets is included in cost of revenue for software, hardware and supplies. |
|
|
|
|
|
Year ending March 31, |
|
|
|
|
2010 |
| $ | 1,428 |
|
2011 |
|
| 1,428 |
|
2012 |
|
| 1,428 |
|
2013 |
|
| 1,317 |
|
2014 |
|
| 1,269 |
|
2015 and beyond |
|
| 1,533 |
|
|
|
| ||
Total |
| $ | 8,403 |
|
|
|
|
| For the year ended March 31, | ||||
| 2012 | $ | 3,320 | ||
| 2013 | 3,184 | |||
| 2014 | 3,055 | |||
| 2015 | 2,013 | |||
| 2016 and beyond | 5,318 | |||
| Total | $ | 16,890 | ||
|
|
As of March 31, 2009 and 2008, the Company had the following amounts
| March 31, | March 31, | |||||||
| 2011 | 2010 | |||||||
| Gross carrying amount | $ | 52,123 | $ | 41,429 | ||||
| Accumulated amortization | (36,973 | ) | (29,883 | ) | ||||
| Net capitalized software costs | $ | 15,150 | $ | 11,546 | ||||
| Aggregate amortization expense during the year | $ | 7,091 | $ | 5,927 | ||||
| Fiscal Year Ended March 31, | ||||||||
| 2011 | 2010 | |||||||
| Beginning of the year | $ | 11,546 | $ | 9,552 | ||||
| Capitalized | 10,695 | 7,921 | ||||||
| Amortization | (7,091 | ) | (5,927 | ) | ||||
| End of the year | $ | 15,150 | $ | 11,546 | ||||
73
|
|
|
|
|
|
|
|
|
| March 31, 2009 |
| March 31, 2008 |
| ||
|
|
|
| ||||
| |||||||
Gross carrying amount |
| $ | 33,508 |
| $ | 27,645 |
|
Accumulated amortization |
|
| (23,956 | ) |
| (18,793 | ) |
|
|
|
| ||||
Net capitalized software costs |
| $ | 9,552 |
| $ | 8,852 |
|
|
|
|
| ||||
Aggregate amortization expense during the year |
| $ | 5,163 |
| $ | 4,149 |
|
|
|
|
| ||||
|
|
|
|
|
|
|
|
Activity related to net capitalized software costs for the years ended March 31, 2009 and 2008 is as follows: | |||||||
|
| March 31, 2009 |
| March 31, 2008 |
| ||
|
|
|
| ||||
Beginning of the year |
| $ | 8,852 |
| $ | 6,982 |
|
Capitalization |
|
| 5,863 |
|
| 6,019 |
|
Amortization |
|
| (5,163 | ) |
| (4,149 | ) |
|
|
|
| ||||
End of the year |
| $ | 9,552 |
| $ | 8,852 |
|
|
|
|
| ||||
|
|
|
|
|
Year ending March 31, |
|
|
|
|
2010 |
| $ | 5,165 |
|
2011 |
|
| 3,213 |
|
2012 |
|
| 1,174 |
|
|
|
| ||
|
|
|
|
|
Total |
| $ | 9,552 |
|
|
|
|
|
|
2011:
| For the year ended March 31, | ||||
| 2012 | $ | 6,975 | ||
| 2013 | 5,269 | |||
| 2014 | 2,705 | |||
| 2015 | 201 | |||
| Total | $ | 15,150 | ||
|
|
|
|
|
|
|
|
|
| March 31, 2009 |
| March 31, 2008 |
| ||
|
|
|
| ||||
| |||||||
Accounts receivable, excluding undelivered software, maintenance and services |
| $ | 64,003 |
| $ | 50,417 |
|
| |||||||
Undelivered software, maintenance and implementation services billed in advance, included in deferred revenue |
|
| 29,944 |
|
| 28,696 |
|
|
|
|
| ||||
Accounts receivable, gross |
|
| 93,947 |
|
| 79,113 |
|
| |||||||
Allowance for doubtful accounts |
|
| (3,877 | ) |
| (2,528 | ) |
|
|
|
| ||||
Accounts receivable, net |
| $ | 90,070 |
| $ | 76,585 |
|
|
|
|
| ||||
|
|
|
|
|
|
|
|
Inventories are summarized as follows: |
|
|
|
|
|
|
|
|
|
|
|
|
|
|
|
|
| March 31, 2009 |
| March 31, 2008 |
| ||
|
|
|
| ||||
| |||||||
Computer systems and components, net of reserve for obsolescence of $210 and $223, respectively |
| $ | 1,105 |
| $ | 992 |
|
Miscellaneous parts and supplies |
|
| 20 |
|
| 32 |
|
|
|
|
| ||||
Inventories, net |
| $ | 1,125 |
| $ | 1,024 |
|
|
|
|
| ||||
| March 31, | March 31, | |||||||
| 2011 | 2010 | |||||||
| Accounts receivable, excluding undelivered software, maintenance and services | $ | 90,487 | $ | 72,500 | ||||
| Undelivered software, maintenance and implementation services billed in advance, included in deferred revenue | 56,002 | 39,447 | ||||||
| Accounts receivable, gross | 146,489 | 111,947 | ||||||
| Allowance for doubtful accounts | (6,717 | ) | (4,489 | ) | ||||
| Accounts receivable, net | $ | 139,772 | $ | 107,458 | ||||
| March 31, | March 31, | |||||||
| 2011 | 2010 | |||||||
| Computer systems and components, net of reserve for obsolescence of $264 and $237, respectively | $ | 1,925 | $ | 1,322 | ||||
| Miscellaneous parts and supplies | 8 | 18 | ||||||
| Inventories | $ | 1,933 | $ | 1,340 | ||||
| March 31, | March 31, | |||||||
| 2011 | 2010 | |||||||
| Computer equipment | $ | 23,567 | $ | 18,599 | ||||
| Furniture and fixtures | 5,861 | 5,136 | ||||||
| Leasehold improvements | 4,434 | 1,969 | ||||||
| 33,862 | 25,704 | |||||||
| Accumulated depreciation and amortization | (21,263 | ) | (17,272 | ) | ||||
| Equipment and improvements, net | $ | 12,599 | $ | 8,432 | ||||
74
|
|
|
|
|
|
|
|
|
| March 31, 2009 |
| March 31, 2008 |
| ||
|
|
|
| ||||
Computer and electronic test equipment |
| $ | 15,384 |
| $ | 11,454 |
|
Furniture and fixtures |
|
| 3,520 |
|
| 2,975 |
|
Leasehold improvements |
|
| 1,595 |
|
| 1,259 |
|
|
|
|
| ||||
|
|
| 20,499 |
|
| 15,688 |
|
Accumulated depreciation and amortization |
|
| (13,743 | ) |
| (10,915 | ) |
|
|
|
| ||||
Equipment and improvements, net |
| $ | 6,756 |
| $ | 4,773 |
|
|
|
|
| ||||
|
|
|
|
|
|
|
|
Accrued compensation and related benefits are summarized as follows: |
|
|
| ||||
|
|
|
|
|
|
|
|
|
| March 31, 2009 |
| March 31, 2008 |
| ||
|
|
|
| ||||
Payroll, bonus and commission |
| $ | 5,768 |
| $ | 5,443 |
|
Vacation |
|
| 3,743 |
|
| 2,903 |
|
|
|
|
| ||||
Accrued compensation and related benefits |
| $ | 9,511 |
| $ | 8,346 |
|
|
|
|
| ||||
|
|
|
|
|
|
|
|
Short and long-term deferred revenue are summarized as follows: |
|
|
|
|
|
|
|
|
|
|
|
|
|
|
|
|
| March 31, 2009 |
| March 31, 2008 |
| ||
|
|
|
| ||||
Maintenance |
| $ | 9,083 |
| $ | 10,175 |
|
Implementation services |
|
| 28,655 |
|
| 25,929 |
|
Annual license services |
|
| 8,176 |
|
| 6,532 |
|
Undelivered software and other |
|
| 2,191 |
|
| 2,259 |
|
|
|
|
| ||||
Deferred Revenue |
| $ | 48,105 |
| $ | 44,895 |
|
|
|
|
| ||||
|
|
|
|
|
|
|
|
Other current liabilities are summarized as follows: |
|
|
|
|
|
|
|
|
|
|
|
|
|
|
|
|
| March 31, 2009 |
| March 31, 2008 |
| ||
|
|
|
| ||||
Care services liabilities |
| $ | 1,303 |
| $ | — |
|
Accrued EDI expenses |
|
| 1,258 |
|
| — |
|
Accrued royalties |
|
| 933 |
|
| 216 |
|
Deferred rent |
|
| 782 |
|
| 607 |
|
Customer deposits |
|
| 674 |
|
| 621 |
|
Sales tax payable |
|
| 602 |
|
| 765 |
|
Professional fees |
|
| 409 |
|
| 600 |
|
Commission payable |
|
| 385 |
|
| 346 |
|
Other accrued expenses |
|
| 2,542 |
|
| 1,239 |
|
|
|
|
| ||||
Other current liabilities |
| $ | 8,888 |
| $ | 4,394 |
|
|
|
|
| ||||
|
|
| March 31, | March 31, | |||||||
| 2011 | 2010 | |||||||
| Maintenance | $ | 11,108 | $ | 13,242 | ||||
| Implementation services | 52,197 | 38,137 | ||||||
| Annual license services | 10,127 | 8,214 | ||||||
| Undelivered software and other | 3,263 | 4,516 | ||||||
| Deferred revenue | $ | 76,695 | $ | 64,109 | ||||
| Deferred revenue, net of current | $ | 1,099 | $ | 474 | ||||
| March 31, | March 31, | |||||||
| 2011 | 2010 | |||||||
| Payroll, bonus and commission | $ | 5,014 | $ | 4,185 | ||||
| Vacation | 5,233 | 4,766 | ||||||
| Accrued compensation and related benefits | $ | 10,247 | $ | 8,951 | ||||
|
|
On September 26, 2007, Mr. Gregory Flynn, Executive Vice President and General Manager of the Company’s QSI Division passed away. Mr. Flynn participated in the Company’s deferred compensation plan which is funded through the purchase of life insurance policies with the Company named as beneficiary. As a result of Mr. Flynn’s passing, for the year ended March
| March 31, | March 31, | |||||||
| 2011 | 2010 | |||||||
| Contingent consideration related to acquisitions | $ | 13,658 | $ | 5,275 | ||||
| Care services liabilities | 3,787 | 2,336 | ||||||
| Accrued EDI expense | 2,801 | 2,000 | ||||||
| Accrued royalties | 1,752 | 926 | ||||||
| Accrued travel | 1,026 | 125 | ||||||
| Customer deposits | 962 | 1,036 | ||||||
| Outside commission payable | 599 | 468 | ||||||
| Sales tax payable | 589 | 506 | ||||||
| Self insurance reserve | 475 | 516 | ||||||
| Deferred rent | 437 | 641 | ||||||
| Professional services | 155 | 391 | ||||||
| Other accrued expenses | 3,075 | 2,000 | ||||||
| Other current liabilities | $ | 29,316 | $ | 16,220 | ||||
31, 2008 the Company recorded additional compensation expense of $198 which was offset by net insurance proceeds of $953. The additional compensation expense was recorded in Selling, General and Administrative Expenses and the insurance proceeds were recorded as Other
|
|
Tax
75
|
|
|
|
|
|
|
|
|
|
|
|
| Year ended March 31, |
| |||||||
|
|
| ||||||||
|
| 2009 |
| 2008 |
| 2007 |
| |||
|
|
|
|
| ||||||
Current: |
|
|
|
|
|
|
|
|
|
|
Federal taxes |
| $ | 18,818 |
| $ | 18,120 |
| $ | 18,106 |
|
State taxes |
|
| 4,992 |
|
| 4,348 |
|
| 4,488 |
|
|
|
|
|
| ||||||
Total |
|
| 23,810 |
|
| 22,468 |
|
| 22,594 |
|
|
|
|
|
| ||||||
|
|
|
|
|
|
|
|
|
|
|
Deferred: |
|
|
|
|
|
|
|
|
|
|
Federal taxes |
|
| 2,802 |
|
| 333 |
|
| (1,347 | ) |
State taxes |
|
| 596 |
|
| 124 |
|
| (295 | ) |
|
|
|
|
| ||||||
Total |
|
| 3,398 |
|
| 457 |
|
| (1,642 | ) |
|
|
|
|
| ||||||
|
|
|
|
|
|
|
|
|
|
|
Total |
| $ | 27,208 |
| $ | 22,925 |
| $ | 20,952 |
|
|
|
|
|
| ||||||
|
|
|
|
|
|
|
|
|
|
|
The provision for income taxes differs from the amount computed at the federal statutory rate as follows: | ||||||||||
|
|
|
|
|
|
|
|
|
|
|
|
| Year ended March 31, |
| |||||||
|
|
| ||||||||
|
| 2009 |
| 2008 |
| 2007 |
| |||
|
|
|
|
| ||||||
Current: |
|
|
|
|
|
|
|
|
|
|
Federal income tax statutory rate |
|
| 35.0 | % |
| 35.0 | % |
| 35.0 | % |
Increase (decrease) resulting from: |
|
|
|
|
|
|
|
|
|
|
State income taxes, net of Federal benefit |
|
| 5.2 |
|
| 4.8 |
|
| 5.0 |
|
Research and development tax credits |
|
| (1.3 | ) |
| (1.3 | ) |
| (1.7 | ) |
Qualified Production Activities Income Deduction |
|
| (1.4 | ) |
| (1.8 | ) |
| (0.9 | ) |
Other |
|
| (0.4 | ) |
| (0.3 | ) |
| 1.3 |
|
|
|
|
|
| ||||||
Effective income tax rate |
|
| 37.1 | % |
| 36.4 | % |
| 38.7 | % |
|
|
|
|
| ||||||
| Fiscal Year Ended March 31, | ||||||||||||
| 2011 | 2010 | 2009 | ||||||||||
| Current: | ||||||||||||
| Federal taxes | $ | 28,979 | $ | 23,750 | $ | 18,818 | ||||||
| State taxes | 6,501 | 5,043 | 4,992 | |||||||||
| Total current taxes | 35,480 | 28,793 | 23,810 | |||||||||
| Deferred: | ||||||||||||
| Federal taxes | $ | (2,168 | ) | $ | (768 | ) | $ | 2,802 | ||||
| State taxes | (502 | ) | (186 | ) | 596 | |||||||
| Total deferred taxes | (2,670 | ) | (954 | ) | 3,398 | |||||||
| Provision for income taxes | $ | 32,810 | $ | 27,839 | $ | 27,208 | ||||||
| Fiscal Year Ended March 31, | ||||||||||||
| 2011 | 2010 | 2009 | ||||||||||
| Current: | ||||||||||||
| Federal income tax statutory rate | 35.0 | % | 35.0 | % | 35.0 | % | ||||||
| Increase (decrease) resulting from: | ||||||||||||
| State income taxes, net of Federal benefit | 4.1 | 4.3 | 5.2 | |||||||||
| Research and development tax credits | (1.0 | ) | (0.9 | ) | (1.3 | ) | ||||||
| Qualified production activities income deduction | (3.0 | ) | (2.0 | ) | (1.4 | ) | ||||||
| Other | (0.3 | ) | 0.1 | (0.4 | ) | |||||||
| Effective income tax rate | 34.8 | % | 36.5 | % | 37.1 | % | ||||||
| March 31, | March 31, | |||||||
| 2011 | 2010 | |||||||
| Deferred tax assets: | ||||||||
| Deferred revenue and allowance for doubtful accounts | $ | 8,646 | $ | 5,577 | ||||
| Inventory valuation | 122 | 115 | ||||||
| Purchased in-process research and development | — | 601 | ||||||
| Accrued compensation and benefits | 3,180 | 2,325 | ||||||
| Deferred compensation | 1,078 | 783 | ||||||
| State income taxes | 452 | 640 | ||||||
| Compensatory stock option expense | 1,759 | 252 | ||||||
| Other | 1,071 | 125 | ||||||
| Total deferred tax assets | 16,308 | 10,418 | ||||||
| Deferred tax liabilities: | ||||||||
| Accelerated depreciation | $ | (2,181 | ) | $ | (1,529 | ) | ||
| Capitalized software | (5,913 | ) | (4,806 | ) | ||||
| Intangibles assets | (6,132 | ) | (6,938 | ) | ||||
| Prepaid expense | (3,069 | ) | (2,326 | ) | ||||
| Total deferred tax liabilities | (17,295 | ) | (15,599 | ) | ||||
| Deferred tax assets (liabilities), net | $ | (987 | ) | $ | (5,181 | ) | ||
76
|
|
|
|
|
|
|
|
|
| March 31, 2009 |
| March 31, 2008 |
| ||
|
|
|
| ||||
Deferred tax assets: |
|
|
|
|
|
|
|
Deferred revenue and allowance for doubtful accounts |
| $ | 3,271 |
| $ | 4,534 |
|
Inventory valuation |
|
| 100 |
|
| 137 |
|
Purchased in-process research and development |
|
| 912 |
|
| 1,187 |
|
Intangibles assets |
|
| — |
|
| 102 |
|
Accrued compensation and benefits |
|
| 1,955 |
|
| 1,701 |
|
Deferred compensation |
|
| 789 |
|
| 806 |
|
State income taxes |
|
| 185 |
|
| 92 |
|
Compensatory stock option expense |
|
| 125 |
|
| 1,139 |
|
Unrealized loss on marketable securities |
|
| — |
|
| 130 |
|
Other |
|
| 779 |
|
| 801 |
|
|
|
|
| ||||
Total deferred tax assets |
|
| 8,116 |
|
| 10,629 |
|
|
|
|
| ||||
|
|
|
|
|
|
|
|
Deferred tax liabilities: |
|
|
|
|
|
|
|
Accelerated depreciation |
|
| (1,114 | ) |
| (545 | ) |
Capitalized software |
|
| (4,126 | ) |
| (3,746 | ) |
Intangibles assets |
|
| (1,412 | ) |
| — |
|
Prepaid expense |
|
| (2,036 | ) |
| (1,516 | ) |
|
|
|
| ||||
Total deferred tax liabilities |
|
| (8,688 | ) |
| (5,807 | ) |
|
|
|
| ||||
Deferred tax assets (liabilities), net |
| $ | (572 | ) | $ | 4,822 |
|
|
|
|
| ||||
On April 1, 2007, the Company adopted the provisions of FASB Interpretation No. 48, “Accounting for Uncertainty in Income Taxes (FIN 48) an interpretation of FASB Statement No. 109 (SFAS 109).” The adoption of the provisions of FIN 48 had no material effect on the consolidated financial statements. As a result, there was no cumulative effect related to adopting FIN 48. However, certain amounts have been reclassified in the Company’s Consolidated Balance Sheets in order to comply with the requirements of the statement. At adoption, the Company had $394 of unrecognized
|
|
|
|
|
Balance at April 1, 2008 |
| $ | 613 |
|
Additions for prior year tax positions |
|
| 15 |
|
Reductions for prior year tax positions |
|
| (561 | ) |
|
|
| ||
| ||||
Balance at March 31, 2009 |
| $ | 67 |
|
|
|
|
| Balance as of March 31, 2009 | $ | 67 | ||
| Additions for prior year tax positions | 598 | |||
| Reductions for prior year tax positions | (9 | ) | ||
| Balance as of March 31, 2010 | $ | 656 | ||
| Additions for prior year tax positions | 34 | |||
| Reductions for prior year tax positions | (18 | ) | ||
| Balance as of March 31, 2011 | $ | 672 | ||
$672.
Uncertain tax positions
that total unrecognized tax benefits will significantly change due to the settlement of audits or the expiration of statute of limitations within the next twelve months.
13.
77
14.
granted awards to purchaseacquire shares of Common Stock.common stock. The exercise price of each option award granted shall be determined by the Board of Directors at the date of grant in accordance with the terms of the 2005 Plan, and under the 2005 Plan awards expire no later than ten years from the grant date. Options granted will generally become exercisable in accordance with the terms of the agreement pursuant to which they were granted. Upon an acquisition of the Company by merger or asset sale, each outstanding awardoption may be subject to accelerated vesting under certain circumstances. The 2005 Plan terminates on May 25, 2015, unless terminated earlier by the Board. AtBoard of Directors. As of March 31, 2009, 2,076,6992011, there were 470,268 outstanding options and 1,786,624 shares were available for future grant under the 2005 Plan. As of March 31, 2009, there were 323,331 outstanding options related to this Plan.
| Weighted- | Weighted- | |||||||||||||||
| Average | Average | Aggregate | ||||||||||||||
| Exercise | Remaining | Intrinsic | ||||||||||||||
| Number of | Price | Contractual | Value | |||||||||||||
| Shares | per Share | Life (years) | (in thousands) | |||||||||||||
| Outstanding, March 31, 2008 | 1,303,734 | $ | 22.81 | |||||||||||||
| Granted | 298,331 | $ | 38.71 | |||||||||||||
| Exercised | (697,083 | ) | $ | 17.96 | $ | 17,182 | ||||||||||
| Forfeited/Canceled | (84,900 | ) | $ | 25.93 | ||||||||||||
| Outstanding, March 31, 2009 | 820,082 | $ | 32.39 | |||||||||||||
| Granted | 289,484 | $ | 58.44 | |||||||||||||
| Exercised | (237,603 | ) | $ | 24.64 | $ | 8,254 | ||||||||||
| Outstanding, March 31, 2010 | 871,963 | $ | 43.15 | 4.5 | ||||||||||||
| Granted | 55,000 | $ | 58.29 | 7.3 | ||||||||||||
| Exercised | (153,714 | ) | $ | 37.19 | 2.0 | $ | 7,093 | |||||||||
| Forfeited/Canceled | (74,471 | ) | $ | 55.01 | 5.8 | |||||||||||
| Outstanding, March 31, 2011 | 698,778 | $ | 44.40 | 3.9 | $ | 27,213 | ||||||||||
| Vested and expected to vest, March 31, 2011 | 679,965 | $ | 44.21 | 3.9 | $ | 26,608 | ||||||||||
| Exercisable, March 31, 2011 | 297,260 | $ | 36.66 | 2.3 | $ | 13,875 | ||||||||||
78
|
|
|
|
|
|
|
|
|
|
|
|
|
|
|
| Number of |
| Weighted |
| Weighted |
| Aggregate |
| ||||
|
|
|
|
|
| ||||||||
|
|
|
|
|
|
|
|
|
|
|
|
|
|
Outstanding, March 31, 2006 |
|
| 1,798,372 |
| $ | 16.78 |
|
|
|
|
|
|
|
Granted |
|
| 75,000 |
| $ | 38.36 |
|
|
|
|
|
|
|
Exercised |
|
| (411,414 | ) | $ | 14.74 |
|
|
|
| $ | 10,393 |
|
Forfeited/Canceled |
|
| (8 | ) | $ | 3.25 |
|
|
|
|
|
|
|
|
|
|
|
|
|
|
|
|
|
|
| ||
|
|
|
|
|
|
|
|
|
|
|
|
|
|
Outstanding, March 31, 2007 |
|
| 1,461,950 |
| $ | 18.46 |
|
|
|
|
|
|
|
Granted |
|
| 225,500 |
| $ | 38.78 |
|
| 4.31 |
|
|
|
|
Exercised |
|
| (325,266 | ) | $ | 14.64 |
|
| 2.48 |
| $ | 4,955 |
|
Forfeited/Canceled |
|
| (58,450 | ) | $ | 21.12 |
|
| 3.33 |
|
|
|
|
|
|
|
|
|
|
|
|
|
|
|
| ||
|
|
|
|
|
|
|
|
|
|
|
|
|
|
Outstanding, March 31, 2008 |
|
| 1,303,734 |
| $ | 22.81 |
|
| 3.40 |
| $ | 12,220 |
|
Granted |
|
| 298,331 |
| $ | 38.71 |
|
| 4.62 |
|
|
|
|
Exercised |
|
| (697,083 | ) | $ | 17.96 |
|
| 2.27 |
| $ | 17,182 |
|
Forfeited/Canceled |
|
| (84,900 | ) | $ | 25.93 |
|
| 2.89 |
|
|
|
|
|
|
|
|
|
|
|
|
|
|
|
| ||
|
|
|
|
|
|
|
|
|
|
|
|
|
|
Outstanding, March 31, 2009 |
|
| 820,082 |
| $ | 32.39 |
|
| 3.63 |
|
|
|
|
|
|
|
|
|
|
|
|
|
|
|
| ||
|
|
|
|
|
|
|
|
|
|
|
|
|
|
|
|
|
|
|
|
|
|
|
|
|
|
|
|
Vested and expected to vest, March 31, 2009 |
|
| 811,056 |
| $ | 32.32 |
|
| 3.62 |
| $ | 10,496 |
|
|
|
|
|
|
|
|
|
|
|
|
| ||
|
|
|
|
|
|
|
|
|
|
|
|
|
|
Exercisable, March 31, 2007 |
|
| 520,650 |
| $ | 20.32 |
|
|
|
|
|
|
|
|
|
|
|
|
|
|
|
|
|
|
| ||
Exercisable, March 31, 2008 |
|
| 654,298 |
| $ | 19.90 |
|
|
|
|
|
|
|
|
|
|
|
|
|
|
|
|
|
|
| ||
Exercisable, March 31, 2009 |
|
| 354,737 |
| $ | 24.25 |
|
| 2.84 |
| $ | 7,448 |
|
|
|
|
|
|
|
|
|
|
|
|
| ||
Year Ended | Year Ended | Year Ended | |||||||||||||||
| March 31, 2011 | March 31, 2010 | March 31, 2009 |
|
| |||||||||||||
| Expected life | 4.2 years | 4.4 - 4.8 years | 4.0 years | ||||||||||||||
| Expected volatility | 42.6% - 44.7 | % | 45.5% - 47.7 | % | 42.0% - 46.7 | % | |||||||||||
Expected |
| 1.9% - 2.2 |
| 1.9% - | % |
| 2.9% - | % | |||||||||
|
|
|
| ||||||||||||||
|
|
|
| ||||||||||||||
Risk-free rate |
| 1.5% - | % |
| 0.8% - | % |
| 1.1% - | % | ||||||||
During
forrequisite service period when actual forfeitures differ, or are expected to differ, from the year ended March 31, 2008. The weighted average grant date fair value of stock options granted duringestimate.
On November 5, 2008, the Board of Directors granted2009, a total of 80,14155,000, 289,484 and 298,331 options, respectively, were granted under the Company’s 2005 Plan to selected employees at an exercise price equal to the market price of the Company’s common stock on the date of grant ($42.20 per share). The options vest in four equal annual installments beginning November 5, 2009 and expire on November 5, 2013. The fair value of these options was $12.48 per share.
On September 9, 2008, the Board of Directors granted a total of 35,000 options under the Company’s 2005 Plan to non-management directors pursuant to the Company’s previously announced compensation plan for non-management directors, at an exercise price equal to the market price of the Company’s common stock on the date of grant ($45.61 per share). The options vest in four equal annual installments beginning September 9, 2009 and expire on September 9, 2015. The fair value of these options was $13.21 per share.
On August 18, 2008, the Board of Directors granted a total of 50,000 options under the Company’s 2005 Plan to an employee at an exercise price equal to the market price of the Company’s common stock on the date of grant ($40.08 per share). The options vest in four equal annual installments beginning August 18, 2009 and expire on August 18, 2013. The fair value of these options was $11.72 per share.
On August 11, 2008, the Board of Directors granted a total of 25,000 options under the Company’s 2005 Plan to selected employees at an exercise price equal to the market price of the Company’s common stock on the date of grant ($40.71 per share). The options vest in four equal annual installments beginning August 11, 2009 and expire on August 11, 2013. The fair value of these options was $11.96 per share.
On June 13, 2008, the Board of Directors granted a total of 108,190 options under the Company’s 2005 Plan to selected employees at an exercise price equal to the market price of the Company’s common stock on the date of grant ($32.79 per share). The options vest in four equal annual installments beginning June 13, 2009 and expire on June 13, 2013. The fair value of these options was $9.24 per share.
On May 31, 2008, the Board of Directors approved a performance-based equity incentive program for employees to be awarded options to purchase the Company’s common stock based on meeting certain target increases in earnings per share performance and revenue growth during fiscal year 2009. Under the program, options may also be granted as an incentive to prospective employees to join the Company. If earned, the options shall be issued pursuant to one of the Company’s shareholder approved option plans, have an exercise price equal to the closing price of the Company’s shares on the date of grant, a term of five years, vesting in four equal installments commencing one year following the date of grant. The maximum number of options available under the performance-based equity incentive program plan is 285,000, of which 20,000 is reserved for new employees (such new employee grants not being subject to the earnings and revenue criteria set forth above). Based on performance versus established plan targets, no expense related to the performance plan was recorded for the year ended March 31, 2009 and no options were issued under the program in fiscal year 2009.
On February 8, 2008, the Board of Directors granted 25,000 options under the Company’s 2005 Plan to selected employees, at an exercise price equal to the market price of the Company’s common stock on the date of grant ($33.51 per share). The options vest in four equal annual installments beginning February 8, 2009 and expire on February 8, 2013. The fair value of these options was $9.42 per share.
On November 5, 2007, the Board of Directors granted 6,000 options under the Company’s 1998 Plan to an employee, at an exercise price equal to the market price of the Company’s common stock on the date of grant ($33.25 per share). The options vest in four equal annual installments beginning November 5, 2008 and expire on November 5, 2012. The fair value of these options was $9.69 per share.
On August 9, 2007, the Board of Directors granted a total of 35,000 options under the Company’s 1998 Plan to non-management directors pursuant to the Company’s previously announced compensation plan for non-management directors, at an exercise price equal to the market price of the Company’s common stock on the date of grant ($43.26 per share). The options vest in four equal annual installments beginning August 9, 2008 and expire on August 9, 2012. The fair value of these options was $12.97 per share.
On June 12, 2007, the Board of Directors granted a total of 159,500 options under a previously approved performance-based equity incentive program for selected employees based on fiscal year 2007 performance. These shares were issued under the Company’s 1998 Stock Option Plan at an exercise price equal to the market price of the Company’s common stock on the date of grant ($38.83 per share). Thegrant. A summary of stock options vest in four equal annual installments beginning June 12, 2008 and expire on June 12, 2012. The fair value of these options was $12.86 per share.
On September 20, 2006, the Board of Directors granted a total of 35,000 options under the Company’s 19982005 Plan to non-management directors pursuant toduring the Company’s previously announced compensation plan for non-management directors, at an exercise price equal to the market price of the Company’s common stock on the date of grant ($39.81 per share). The options vest in four equal annual installments beginning September 20, 2007years ended March 31, 2011, 2010 and expire on September 20, 2013. The fair value of these options was $15.52 per share.
2009 is as follows:
| Number of | Vesting | |||||||||||
| Option Grant Date | Shares | Exercise Price | Terms (1) | Expires | ||||||||
| November 29, 2010 | 10,000 | $ | 64.32 | Five years | November 29, 2018 | |||||||
| August 3, 2010 | 5,000 | $ | 55.24 | Five years | August 3, 2018 | |||||||
| June 4, 2010 | 25,000 | $ | 56.29 | Five years | June 4, 2018 | |||||||
| June 2, 2010 | 15,000 | $ | 58.62 | Five years | June 2, 2018 | |||||||
| Fiscal year 2011 option grants | 55,000 | |||||||||||
| February 16, 2010 | 118,059 | $ | 56.95 | Five years | February 16, 2018 | |||||||
| February 16, 2010 | 3,000 | $ | 56.95 | Two years | February 16, 2013 | |||||||
| December 7, 2009 | 63,425 | $ | 60.29 | Five years | December 7, 2017 | |||||||
| November 30, 2009 | 75,000 | $ | 59.49 | Five years | November 30, 2017 | |||||||
| September 17, 2009 | 30,000 | $ | 58.03 | Five years | September 17, 2017 | |||||||
| Fiscal year 2010 option grants | 289,484 | |||||||||||
| November 5, 2008 | 80,141 | $ | 42.20 | Four years | November 5, 2013 | |||||||
| September 9, 2008 | 35,000 | $ | 45.61 | Four years | September 9, 2015 | |||||||
| August 18, 2008 | 50,000 | $ | 40.08 | Four years | August 18, 2013 | |||||||
| August 11, 2008 | 25,000 | $ | 40.71 | Four years | August 11, 2013 | |||||||
| June 13, 2008 | 108,190 | $ | 32.79 | Four years | June 13, 2013 | |||||||
| Fiscal year 2009 option grants | 298,331 | |||||||||||
| (1) | Options vest in equal annual installments on each grant anniversary date beginning one year after the grant date. |
On July 25, 2006,May 26, 2010, the Board of Directors approved a performance-basedits fiscal year 2011 equity incentive program for certain employees to be awarded options to purchase the Company’s common stockstock. The maximum number of options available under the equity incentive program plan is 280,000, of which 115,000 are reserved for the Company’s named executive officers and 165,000 for non-executive employees of the Company. Under the program, executives are eligible to receive options based on meeting certain target increases in earnings per share performance and revenue growth during fiscal year 2007.2011. Under the program, the non-executive employees are eligible to receive options based on satisfying certain management established criteria and recommendations of senior management. The options shall be issued pursuant to one of the Company’s shareholder approved option plans, have an exercise price equal to the closing price of the Company’s shares on the date of grant, a term of eight years and vesting in five years, vest in four equal annual installments commencing one year following the date of grant. The maximum
79
awards.
| Year Ended | Year Ended | |||||||
| March 31, 2011 | March 31, 2010 | |||||||
| Expected life | 4.3 years | 4.4 years | ||||||
| Expected volatility | 41.6 | % | 45.5 | % | ||||
| Expected dividends | 1.5 | % | 2.2 | % | ||||
| Risk-free rate | 2.2 | % | 2.3 | % | ||||
|
|
|
|
|
|
|
|
|
| Non-vested |
| Weighted-Average |
| ||
|
|
|
| ||||
|
|
|
|
|
|
|
|
Non-vested, March 31, 2008 |
|
| 649,436 |
| $ | 9.57 |
|
Granted |
|
| 298,331 |
| $ | 11.22 |
|
Vested |
|
| (397,522 | ) | $ | 8.14 |
|
Forfeited/Canceled |
|
| (84,900 | ) | $ | 10.17 |
|
|
|
|
|
|
| ||
Non-vested, March 31, 2009 |
|
| 465,345 |
| $ | 11.74 |
|
|
|
|
|
|
| ||
| Weighted- | ||||||||
| Average | ||||||||
| Non-Vested | Grant-Date | |||||||
| Number of | Fair Value | |||||||
| Shares | per Share | |||||||
| Outstanding, March 31, 2008 | 649,436 | $ | 9.57 | |||||
| Granted | 298,331 | $ | 11.22 | |||||
| Vested | (397,522 | ) | $ | 8.14 | ||||
| Forfeited/Canceled | (84,900 | ) | $ | 10.17 | ||||
| Outstanding, March 31, 2009 | 465,345 | $ | 11.74 | |||||
| Granted | 289,484 | $ | 19.30 | |||||
| Vested | (143,993 | ) | $ | 12.03 | ||||
| Outstanding, March 31, 2010 | 610,836 | $ | 15.26 | |||||
| Granted | 55,000 | $ | 18.48 | |||||
| Vested | (189,847 | ) | $ | 12.86 | ||||
| Forfeited/Canceled | (74,471 | ) | $ | 18.82 | ||||
| Outstanding, March 31, 2011 | 401,518 | $ | 16.17 | |||||
80
| Weighted- | ||||||||
| Average | ||||||||
| Grant-Date | ||||||||
| Number of | Fair Value | |||||||
| Shares | per Share | |||||||
| Outstanding, March 31, 2009 | — | |||||||
| Granted | 8,000 | $ | 53.86 | |||||
| Outstanding, March 31, 2010 | 8,000 | $ | 53.86 | |||||
| Granted | 9,146 | $ | 54.62 | |||||
| Vested | (5,698 | ) | $ | 54.43 | ||||
| Outstanding, March 31, 2011 | 11,448 | $ | 54.18 | |||||
|
|
Year Ending March 31, 2010 $ 4,475 2011 4,311 2012 2,439 2013 985 2014 135 $ 12,345 81Commitments.CommitmentsMay 2013September 2016 with rent escalation clauses. Rent expense related to these leases is recognized on a straight-line basis over the lease terms. Rent expense for the years ended March 31, 2011, 2010 and 2009 2008was $3,964, $4,264 and 2007 was $3,560, $2,737 and $2,329, respectively. Rental commitments under these agreements are as follows: Year ended March 31, 2012 $ 5,137 2013 5,475 2014 5,424 2015 5,008 2016 and beyond 5,697 $ 26,741 Guarantees.GuaranteesDivisionsDivision include a performance guarantee that the Company’s software products will substantially operate as described in the applicable program documentation for a period of 365 days after delivery. To date, the Company has not incurred any significant costs associated with theseits performance guarantee or other related warranties and does not expect to incur significant warranty costs in the future. Therefore, no accrual has been made for potential costs associated with these warranties. Certain arrangements also include performance guarantees related to response time, availability for operational use, and other performance-related guarantees. Certain arrangements also include penalties in the form of maintenance credits should the performance of the software fail to meet the performance guarantees. To date, the Company has not incurred any significant costs associated with these warranties and does not expect to incur significant warranty costs in the future. Therefore, no accrual has been made for potential costs associated with these warranties.third partythird-party with respect to its software. The QSI Dental Division arrangements occasionally utilize this type of language as well. As the Company has not incurred any significant costs to defend lawsuits or settle claims related to these indemnification agreements, the Company believes that its estimated exposure on these agreements is currently minimal. Accordingly, the Company has no liabilities recorded for these indemnification obligations.
From time to time, the Company offers future purchase discounts on its products and services as part of its sales arrangements. Discounts which are incremental to the range of discounts reflected in the pricing of the other elements of the arrangement, which are incremental to the range of discounts typically given in comparable transactions, and which are significant, are treated as an additional element of the contract to be deferred. Amounts deferred related to future purchase options are not recognized until either the customer exercises the discount offer or the offer expires.
without merit and the Company has defended them vigorously. However, in order to avoid the further legal costs and diversion of management resources it is reasonably possible that a settlement may be reached which could result in a liability to the Company. However, at this time it is not possible to estimate with reasonable certainty what amount, if any, may be incurred as a result of a settlement. Litigation is inherently uncertain and always difficult to predict.
|
|
Division, with headquarters in Horsham, Pennsylvania, provides integrated clinical, financial and connectivity solutions for ambulatory and dental provider organizations.
The QSI Division, co-located with the Company’s Corporate Headquarters in Irvine, California, currently focuses on developing, marketing and supporting software suites sold to dental and certain niche medical practices. In addition, the division supports a number of medical clients that utilize the division’s UNIX based medical practice management software product. The NextGen Division, with headquarters in Horsham, Pennsylvania, and significant locations in Atlanta, Georgia, St. Louis, Missouri and Hunt Valley, Maryland, focuses principally on developing and marketing products and services for medical practices.
Divisions.
82
| Fiscal Year Ended March 31, | ||||||||||||
| 2011 | 2010 | 2009 | ||||||||||
| Revenue: | ||||||||||||
| QSI Dental Division | $ | 19,966 | $ | 17,128 | $ | 15,851 | ||||||
| NextGen Division | 266,546 | 228,730 | 203,954 | |||||||||
| Inpatient Solutions Division | 17,898 | 2,891 | — | |||||||||
| Practice Solutions Division | 48,953 | 43,062 | 25,710 | |||||||||
| Consolidated revenue | $ | 353,363 | $ | 291,811 | $ | 245,515 | ||||||
| Operating income: | ||||||||||||
| QSI Dental Division | $ | 4,672 | $ | 3,460 | $ | 3,385 | ||||||
| NextGen Division | 104,391 | 87,432 | 81,323 | |||||||||
| Inpatient Solutions Division | 5,362 | 676 | — | |||||||||
| Practice Solutions Division | 4,235 | 2,314 | 2,455 | |||||||||
| Unallocated corporate expense | (24,568 | ) | (18,158 | ) | (14,760 | ) | ||||||
| Consolidated operating income | $ | 94,092 | $ | 75,724 | $ | 72,403 | ||||||
Operating segment data forPMP is recorded in the Practice Solutions Division. The goodwill relating to the fiscal year 2010 acquisitions of Opus and NextGen IS is recorded in the Inpatient Solutions Division. See Note 6.
|
|
|
|
|
|
|
|
|
|
|
|
|
|
|
| QSI Division |
| NextGen |
| Unallocated |
| Consolidated |
| ||||
|
|
|
|
|
| ||||||||
2009 |
|
|
|
|
|
|
|
|
|
|
|
|
|
Revenue |
| $ | 15,852 |
| $ | 229,663 |
| $ | — |
| $ | 245,515 |
|
Operating income(loss) |
|
| 3,385 |
|
| 83,778 |
|
| (14,760 | ) |
| 72,403 |
|
|
|
|
|
|
|
|
|
|
|
|
|
|
|
2008 |
|
|
|
|
|
|
|
|
|
|
|
|
|
Revenue |
|
| 16,037 |
|
| 170,463 |
|
| — |
|
| 186,500 |
|
Operating income(loss) |
|
| 3,662 |
|
| 66,558 |
|
| (10,831 | ) |
| 59,389 |
|
|
|
|
|
|
|
|
|
|
|
|
|
|
|
2007 |
|
|
|
|
|
|
|
|
|
|
|
|
|
Revenue |
|
| 16,589 |
|
| 140,576 |
|
| — |
|
| 157,165 |
|
Operating income(loss) |
|
| 4,391 |
|
| 56,317 |
|
| (9,830 | ) |
| 50,878 |
|
|
|
defined in the Agreement, not to exceed $1,650.
83
|
|
COMPARISON BY QUARTER
|
|
|
|
|
|
|
|
|
|
|
|
|
|
|
|
|
|
|
|
|
|
|
|
|
|
|
| Quarter Ended (Unaudited) | |||||||||||||||||||||||
|
| ||||||||||||||||||||||||
|
| 06/30/07 |
| 09/30/07 |
| 12/31/07 |
| 03/31/08 |
| 06/30/08 |
| 09/30/08 |
| 12/31/08 |
| 03/31/09 |
| ||||||||
|
| ||||||||||||||||||||||||
Revenues: |
|
|
|
|
|
|
|
|
|
|
|
|
|
|
|
|
|
|
|
|
|
|
|
|
|
Software, hardware and supplies |
| $ | 16,739 |
| $ | 18,514 |
| $ | 20,591 |
| $ | 20,519 |
| $ | 21,369 |
| $ | 21,297 |
| $ | 22,336 |
| $ | 20,384 |
|
Implementation and training services |
|
| 3,248 |
|
| 3,182 |
|
| 3,115 |
|
| 3,861 |
|
| 3,585 |
|
| 3,486 |
|
| 2,675 |
|
| 3,629 |
|
|
| ||||||||||||||||||||||||
System sales |
|
| 19,987 |
|
| 21,696 |
|
| 23,706 |
|
| 24,380 |
|
| 24,954 |
|
| 24,783 |
|
| 25,011 |
|
| 24,013 |
|
|
|
|
|
|
|
|
|
|
|
|
|
|
|
|
|
|
|
|
|
|
|
|
|
|
|
Maintenance |
|
| 12,559 |
|
| 13,442 |
|
| 14,861 |
|
| 15,593 |
|
| 17,136 |
|
| 17,234 |
|
| 19,152 |
|
| 19,340 |
|
Electronic data interchange services |
|
| 5,024 |
|
| 5,406 |
|
| 5,739 |
|
| 6,281 |
|
| 6,670 |
|
| 6,985 |
|
| 8,008 |
|
| 7,859 |
|
RCM and related services |
|
| 134 |
|
| 222 |
|
| 256 |
|
| 259 |
|
| 1,957 |
|
| 4,527 |
|
| 6,835 |
|
| 8,112 |
|
Other services |
|
| 4,328 |
|
| 4,380 |
|
| 3,528 |
|
| 4,719 |
|
| 4,507 |
|
| 5,452 |
|
| 6,473 |
|
| 6,507 |
|
|
| ||||||||||||||||||||||||
Maintenance, EDI, RCM and other services |
|
| 22,045 |
|
| 23,450 |
|
| 24,384 |
|
| 26,852 |
|
| 30,270 |
|
| 34,198 |
|
| 40,468 |
|
| 41,818 |
|
|
| ||||||||||||||||||||||||
Total revenue |
|
| 42,032 |
|
| 45,146 |
|
| 48,090 |
|
| 51,232 |
|
| 55,224 |
|
| 58,981 |
|
| 65,479 |
|
| 65,831 |
|
|
|
|
|
|
|
|
|
|
|
|
|
|
|
|
|
|
|
|
|
|
|
|
|
|
|
Cost of revenue: |
|
|
|
|
|
|
|
|
|
|
|
|
|
|
|
|
|
|
|
|
|
|
|
|
|
Software, hardware and supplies |
|
| 2,488 |
|
| 2,477 |
|
| 2,984 |
|
| 2,938 |
|
| 3,486 |
|
| 3,395 |
|
| 3,030 |
|
| 3,273 |
|
Implementation and training services |
|
| 2,409 |
|
| 2,423 |
|
| 2,638 |
|
| 2,871 |
|
| 3,015 |
|
| 2,626 |
|
| 2,143 |
|
| 2,502 |
|
|
| ||||||||||||||||||||||||
Total cost of system sales |
|
| 4,897 |
|
| 4,900 |
|
| 5,622 |
|
| 5,809 |
|
| 6,501 |
|
| 6,021 |
|
| 5,173 |
|
| 5,775 |
|
|
|
|
|
|
|
|
|
|
|
|
|
|
|
|
|
|
|
|
|
|
|
|
|
|
|
Maintenance |
|
| 3,127 |
|
| 3,033 |
|
| 3,131 |
|
| 3,155 |
|
| 3,082 |
|
| 2,947 |
|
| 2,826 |
|
| 3,004 |
|
Electronic data interchange services |
|
| 3,509 |
|
| 3,742 |
|
| 4,162 |
|
| 4,363 |
|
| 4,891 |
|
| 5,256 |
|
| 5,541 |
|
| 5,686 |
|
RCM and related services |
|
| 98 |
|
| 138 |
|
| 166 |
|
| 156 |
|
| 1,305 |
|
| 3,132 |
|
| 4,475 |
|
| 5,762 |
|
Other services |
|
| 2,911 |
|
| 2,962 |
|
| 3,067 |
|
| 3,553 |
|
| 3,448 |
|
| 3,866 |
|
| 5,085 |
|
| 5,114 |
|
|
| ||||||||||||||||||||||||
Total cost of maintenance, EDI, RCM and other services |
|
| 9,645 |
|
| 9,875 |
|
| 10,526 |
|
| 11,227 |
|
| 12,726 |
|
| 15,201 |
|
| 17,927 |
|
| 19,566 |
|
|
| ||||||||||||||||||||||||
Total cost of revenue |
|
| 14,542 |
|
| 14,775 |
|
| 16,148 |
|
| 17,036 |
|
| 19,227 |
|
| 21,222 |
|
| 23,100 |
|
| 25,341 |
|
|
| ||||||||||||||||||||||||
Gross profit |
|
| 27,490 |
|
| 30,371 |
|
| 31,942 |
|
| 34,196 |
|
| 35,997 |
|
| 37,759 |
|
| 42,379 |
|
| 40,490 |
|
|
| ||||||||||||||||||||||||
|
|
|
|
|
|
|
|
|
|
|
|
|
|
|
|
|
|
|
|
|
|
|
|
|
|
Operating expenses: |
|
|
|
|
|
|
|
|
|
|
|
|
|
|
|
|
|
|
|
|
|
|
|
|
|
Selling, general and administrative |
|
| 12,643 |
|
| 13,188 |
|
| 13,283 |
|
| 14,146 |
|
| 15,252 |
|
| 18,283 |
|
| 18,601 |
|
| 18,309 |
|
Research and development costs |
|
| 2,800 |
|
| 2,688 |
|
| 2,874 |
|
| 2,988 |
|
| 3,119 |
|
| 3,342 |
|
| 3,624 |
|
| 3,692 |
|
|
| ||||||||||||||||||||||||
Total operating expenses |
|
| 15,443 |
|
| 15,876 |
|
| 16,157 |
|
| 17,134 |
|
| 18,371 |
|
| 21,625 |
|
| 22,225 |
|
| 22,001 |
|
|
| ||||||||||||||||||||||||
Income from operations |
|
| 12,047 |
|
| 14,495 |
|
| 15,785 |
|
| 17,062 |
|
| 17,626 |
|
| 16,134 |
|
| 20,154 |
|
| 18,489 |
|
Interest income |
|
| 739 |
|
| 645 |
|
| 710 |
|
| 567 |
|
| 374 |
|
| 340 |
|
| 328 |
|
| 161 |
|
Other income (expense) |
|
| — |
|
| — |
|
| 953 |
|
| — |
|
| — |
|
| — |
|
| — |
|
| (279 | ) |
|
| ||||||||||||||||||||||||
Income before provision for income taxes |
|
| 12,786 |
|
| 15,140 |
|
| 17,448 |
|
| 17,629 |
|
| 18,000 |
|
| 16,474 |
|
| 20,482 |
|
| 18,371 |
|
Provision for income taxes |
|
| 4,846 |
|
| 5,468 |
|
| 6,234 |
|
| 6,377 |
|
| 6,886 |
|
| 5,975 |
|
| 7,332 |
|
| 7,015 |
|
|
| ||||||||||||||||||||||||
Net income |
| $ | 7,940 |
| $ | 9,672 |
| $ | 11,214 |
| $ | 11,252 |
| $ | 11,114 |
| $ | 10,499 |
| $ | 13,150 |
| $ | 11,356 |
|
|
| ||||||||||||||||||||||||
|
|
|
|
|
|
|
|
|
|
|
|
|
|
|
|
|
|
|
|
|
|
|
|
|
|
Net income per share |
|
|
|
|
|
|
|
|
|
|
|
|
|
|
|
|
|
|
|
|
|
|
|
|
|
Basic* |
| $ | 0.29 |
| $ | 0.35 |
| $ | 0.41 |
| $ | 0.41 |
| $ | 0.40 |
| $ | 0.38 |
| $ | 0.46 |
| $ | 0.40 |
|
Diluted* |
| $ | 0.29 |
| $ | 0.35 |
| $ | 0.40 |
| $ | 0.41 |
| $ | 0.40 |
| $ | 0.37 |
| $ | 0.46 |
| $ | 0.40 |
|
|
|
|
|
|
|
|
|
|
|
|
|
|
|
|
|
|
|
|
|
|
|
|
|
|
|
Weighted average shares outstanding: |
|
|
|
|
|
|
|
|
|
|
|
|
|
|
|
|
|
|
|
|
|
|
|
|
|
Basic |
|
| 27,134 |
|
| 27,287 |
|
| 27,362 |
|
| 27,408 |
|
| 27,465 |
|
| 27,930 |
|
| 28,340 |
|
| 28,393 |
|
Diluted |
|
| 27,657 |
|
| 27,718 |
|
| 27,696 |
|
| 27,712 |
|
| 27,771 |
|
| 28,211 |
|
| 28,473 |
|
| 28,526 |
|
Dividends declared per common share |
| $ | 0.25 |
| $ | 0.25 |
| $ | 0.25 |
| $ | 0.25 |
| $ | 0.25 |
| $ | 0.30 |
| $ | 0.30 |
| $ | 0.30 |
|
| Quarter Ended | ||||||||||||||||||||||||||||||||
| (Unaudited) | 06/30/09 | 09/30/09 | 12/31/09 | 03/31/10 | 06/30/10 | 09/30/10 | 12/31/10 | 03/31/11 | ||||||||||||||||||||||||
| Revenues: | ||||||||||||||||||||||||||||||||
| Software, hardware and supplies | $ | 17,776 | $ | 22,856 | $ | 24,346 | $ | 24,783 | $ | 24,756 | $ | 20,375 | $ | 29,675 | $ | 31,708 | ||||||||||||||||
| Implementation and training services | 3,457 | 3,380 | 3,313 | 4,226 | 4,308 | 4,499 | 4,262 | 4,946 | ||||||||||||||||||||||||
| System sales | 21,233 | 26,236 | 27,659 | 29,009 | 29,064 | 24,874 | 33,937 | 36,654 | ||||||||||||||||||||||||
| Maintenance | 21,640 | 21,475 | 22,139 | 23,938 | 25,536 | 27,529 | 27,908 | 29,046 | ||||||||||||||||||||||||
| Electronic data interchange services | 8,161 | 8,796 | 8,897 | 9,181 | 9,764 | 10,142 | 10,360 | 10,756 | ||||||||||||||||||||||||
| Revenue cycle management and related services | 8,992 | 8,888 | 9,602 | 9,183 | 10,772 | 11,175 | 11,496 | 11,622 | ||||||||||||||||||||||||
| Other services | 6,612 | 6,303 | 6,665 | 7,202 | 7,791 | 7,737 | 8,170 | 9,030 | ||||||||||||||||||||||||
| Maintenance, EDI, RCM and other services | 45,405 | 45,462 | 47,303 | 49,504 | 53,863 | 56,583 | 57,934 | 60,454 | ||||||||||||||||||||||||
| Total revenues | 66,638 | 71,698 | 74,962 | 78,513 | 82,927 | 81,457 | 91,871 | 97,108 | ||||||||||||||||||||||||
| Cost of revenue: | ||||||||||||||||||||||||||||||||
| Software, hardware and supplies | 2,704 | 3,737 | 2,810 | 2,864 | 6,212 | 4,696 | 5,667 | 3,204 | ||||||||||||||||||||||||
| Implementation and training services | 2,881 | 3,296 | 2,898 | 2,908 | 2,990 | 3,475 | 3,677 | 4,868 | ||||||||||||||||||||||||
| Total cost of system sales | 5,585 | 7,033 | 5,708 | 5,772 | 9,202 | 8,171 | 9,344 | 8,072 | ||||||||||||||||||||||||
| Maintenance | 3,025 | 3,255 | 3,392 | 3,667 | 3,454 | 3,238 | 3,381 | 2,875 | ||||||||||||||||||||||||
| Electronic data interchange services | 5,890 | 6,164 | 6,525 | 6,683 | 6,709 | 6,773 | 6,908 | 7,321 | ||||||||||||||||||||||||
| Revenue cycle management and related services | 6,522 | 6,856 | 7,124 | 7,213 | 8,145 | 8,222 | 8,715 | 8,733 | ||||||||||||||||||||||||
| Other services | 4,867 | 5,003 | 5,560 | 4,963 | 4,349 | 3,724 | 3,981 | 6,165 | ||||||||||||||||||||||||
| Total cost of maintenance, EDI, RCM and other services | 20,304 | 21,278 | 22,601 | 22,526 | 22,657 | 21,957 | 22,985 | 25,094 | ||||||||||||||||||||||||
| Total cost of revenue | 25,889 | 28,311 | 28,309 | 28,298 | 31,859 | 30,128 | 32,329 | 33,166 | ||||||||||||||||||||||||
| Gross profit | 40,749 | 43,387 | 46,653 | 50,215 | 51,068 | 51,329 | 59,542 | 63,942 | ||||||||||||||||||||||||
| Operating expenses: | ||||||||||||||||||||||||||||||||
| Selling, general and administrative | 20,093 | 20,061 | 21,574 | 25,223 | 26,238 | 24,829 | 27,958 | 29,285 | ||||||||||||||||||||||||
| Research and development costs | 3,977 | 4,346 | 3,954 | 4,269 | 5,456 | 5,232 | 5,358 | 5,751 | ||||||||||||||||||||||||
| Amortization of acquired intangible assets | 357 | 367 | 377 | 682 | 347 | 445 | 445 | 445 | ||||||||||||||||||||||||
| Total operating expenses | 24,427 | 24,774 | 25,905 | 30,174 | 32,041 | 30,506 | 33,761 | 35,481 | ||||||||||||||||||||||||
| Income from operations | 16,322 | 18,613 | 20,748 | 20,041 | 19,027 | 20,823 | 25,781 | 28,461 | ||||||||||||||||||||||||
| Interest income | 78 | 59 | 43 | 46 | 60 | 129 | 55 | 19 | ||||||||||||||||||||||||
| Other income (expense), net | 58 | — | 136 | 74 | (6 | ) | 65 | — | 2 | |||||||||||||||||||||||
| Income before provision for income taxes | 16,458 | 18,672 | 20,927 | 20,161 | 19,081 | 21,017 | 25,836 | 28,482 | ||||||||||||||||||||||||
| Provision for income taxes | 6,112 | 6,852 | 7,775 | 7,100 | 6,989 | 7,587 | 8,305 | 9,929 | ||||||||||||||||||||||||
| Net income | $ | 10,346 | $ | 11,820 | $ | 13,152 | $ | 13,061 | $ | 12,092 | $ | 13,430 | $ | 17,531 | $ | 18,553 | ||||||||||||||||
| Net income per share: | ||||||||||||||||||||||||||||||||
| Basic* | $ | 0.36 | $ | 0.41 | $ | 0.46 | $ | 0.45 | $ | 0.42 | $ | 0.46 | $ | 0.60 | $ | 0.64 | ||||||||||||||||
| Diluted* | $ | 0.36 | $ | 0.41 | $ | 0.46 | $ | 0.45 | $ | 0.42 | $ | 0.46 | $ | 0.60 | $ | 0.64 | ||||||||||||||||
| Weighted-average shares outstanding: | ||||||||||||||||||||||||||||||||
| Basic | 28,492 | 28,597 | 28,667 | 28,784 | 28,896 | 28,935 | 28,978 | 29,005 | ||||||||||||||||||||||||
| Diluted | 28,635 | 28,742 | 28,833 | 28,929 | 29,057 | 29,078 | 29,140 | 29,202 | ||||||||||||||||||||||||
| Dividends declared per common share | $ | 0.30 | $ | 0.30 | $ | 0.30 | $ | 0.30 | $ | 0.30 | $ | 0.30 | $ | 0.30 | $ | 0.35 | ||||||||||||||||
* | Quarterly EPS |
84
85 Allowance for Doubtful Accounts Balance at Additions Balance at (in thousands) Beginning of Charged to Costs End of For the year ended Year and Expenses Deductions Year March 31, 2011 $ 4,489 $ 3,780 $ (1,552 ) $ 6,717 March 31, 2010 $ 3,877 $ 3,465 $ (2,853 ) $ 4,489 March 31, 2009 $ 2,528 $ 2,089 $ (740 ) $ 3,877 Allowance for Inventory Obsolescence Balance at Additions Balance at (in thousands) Beginning of Charged to Costs End of For the year ended Year and Expenses Deductions Year March 31, 2011 $ 237 $ 27 $ — $ 264 March 31, 2010 $ 210 $ 27 $ — $ 237 March 31, 2009 $ 223 $ — $ (13 ) $ 210
|
|
|
|
|
|
|
|
|
|
|
|
|
|
For the Year Ended |
| Balance at |
| Additions |
| Deductions |
| Balance at |
| ||||
| |||||||||||||
|
| ||||||||||||
March 31, 2009 |
| $ | 2,528 |
| $ | 2,089 |
| $ | (740 | ) | $ | 3,877 |
|
March 31, 2008 |
| $ | 2,438 |
| $ | 1,171 |
| $ | (1,081 | ) | $ | 2,528 |
|
March 31, 2007 |
| $ | 2,556 |
| $ | 1,480 |
| $ | (1,598 | ) | $ | 2,438 |
|
|
|
|
|
|
|
|
|
|
|
|
|
|
|
ALLOWANCE FOR INVENTORY OBSOLESCENCE | |||||||||||||
(in thousands) | |||||||||||||
|
|
|
|
|
|
|
|
|
|
|
|
|
|
For the Year Ended |
| Balance at |
| Additions |
| Deductions |
| Balance at |
| ||||
| |||||||||||||
|
| ||||||||||||
March 31, 2009 |
| $ | 223 |
| $ | — |
| $ | (13 | ) | $ | 210 |
|
March 31, 2008 |
| $ | 324 |
| $ | 52 |
| $ | (153 | ) | $ | 223 |
|
March 31, 2007 |
| $ | 304 |
| $ | 35 |
| $ | (15 | ) | $ | 324 |
|
INDEX TO EXHIBITS ATTACHED TO THIS REPORT
| |||||
|
| Description | |||
| 21 | List of subsidiaries. | ||||
| 23.1 | |||||
Consent of Independent Registered Public Accounting Firm | |||||
| 23.2 | Consent of Independent Registered Public Accounting Firm — Grant Thornton | ||||
| 31.1 | 2002. | ||||
| 31.2 | 2002. | ||||
| 32.1 | |||||
| 101.INS* | XBRL Instance | ||||
| 101.SCH* | XBRL Taxonomy Extension Schema | ||||
| 101.CAL* | XBRL Taxonomy Extension Calculation | ||||
| 101.LAB* | XBRL Taxonomy Extension Label | ||||
| 101.PRE* | XBRL Taxonomy Extension Presentation | ||||
| * | XBRL information is furnished and not filed or a part of a registration statement or prospectus for purposes of section 11 or 12 of the Securities and Exchange Act of 1933, as amended, is deemed not filed for purposes of section 18 of the Securities and Exchange Act of 1934, as amended, and otherwise is not subject to liability under these section. |
9386