UNITED STATES SECURITIES AND EXCHANGE COMMISSION
Washington, D.C. 20549
Form 10-K
☑ANNUAL REPORT PURSUANT TO SECTION 13 OR 15(d)
OF THE SECURITIES EXCHANGE ACT OF 1934
For the fiscal year ended March 31, 20162020
OR
☐TRANSITIONREPORT PURSUANT TO SECTION 13 OR 15(d) OF THE SECURITIES EXCHANGE ACT OF 1934
Commission File Number: 1-33026

Commvault Systems, Inc.
(Exact name of registrant as specified in its charter)
| Delaware | 22-3447504 | |
(State or other jurisdiction of incorporation or organization) | (I.R.S. Employer Identification No.) | |
Tinton Falls, New Jersey
07724
(Address of principal executive offices)
(Zip Code)
(732) 870-4000
(Registrant’s telephone number, including area code)
Securities registered pursuant to Section 12(b) of the Act: None
| Title of each class | Trading Symbol(s) | Name of each exchange on which registered |
| Common Stock, $0.01 par value | CVLT | The NASDAQ Stock Market |
| Preferred Stock Purchase Rights | The NASDAQ Stock Market | |
Securities registered pursuant to Section 12(g) of the Act: None
Indicate by check mark if the registrant is a well-known seasoned issuer, as defined in Rule 405 of the Securities Act. Yesþ No ¨
Indicate by check mark if the registrant is not required to file reports pursuant to Section 13 or Section 15(d) of the Act. Yes ¨Noþ
Indicate by check mark whether the registrant (1) has filed all reports required to be filed by the Section 13 or 15(d) of the Securities Exchange Act of 1934 during the preceding 12 months (or for such shorter period that the Registrant was required to file such reports), and (2) has been subject to such filing requirements for the past 90 days. Yesþ No ¨
Indicate by check mark whether the registrant has submitted electronically and posted on its corporate Web site, if any, every Interactive Data File required to be submitted and posted pursuant to Rule 405 of Regulation S-T (§232.405 of this chapter) during the preceding 12 months (or for such shorter period that registrant was required to submit and post such files.) Yesþ No ¨
Indicate by check mark whether the registrant is a large accelerated filer, an accelerated filer, a non-accelerated filer, or a smaller reporting company or an emerging growth company. See definition of “large accelerated filer,” “accelerated filer”filer,” "smaller reporting company" and “smaller reporting“emerging growth company” in rule 12b-2 of the Exchange Act.
Large accelerated filer | þ | Accelerated filer | ☐ | Non-accelerated filer | ☐ | Smaller reporting company | ☐ |
| Emerging growth company | ☐ | ||||||
If an emerging growth company, indicate by check mark if the registrant has elected not to use the extended transition period for complying with any new or revised financial accounting standards provided pursuant to Section 13 (a) of the Exchange Act o
Indicate by check mark whether the registrant is a shell company (as defined in Rule 12b-2 of the Exchange Act). Yes ¨☐ No þ
As of September 30, 2015,2019, the last business day of the Registrant’s most recently completed second fiscal quarter; the aggregate market value of voting and non-voting common stock held by non-affiliates of the registrant (based upon the closing price of the common stock as reported by The NASDAQ Stock Market) was approximately $1.4$2.0 billion.
As of April 29, 2016,May 14, 2020, there were 44,223,24446,170,350 shares of the registrant’s common stock ($0.01 par value) outstanding.
DOCUMENTS INCORPORATED BY REFERENCE
Information required by Part III (Items 10, 11, 12, 13 and 14) is incorporated by reference to portions of the registrant’s definitive Proxy Statement for its 20162020 Annual Meeting of Stockholders (the “Proxy Statement”), which is expected to be filed not later than 120 days after the registrant’s fiscal year ended March 31, 2016.2020. Except as expressly incorporated by reference, the Proxy Statement shall not be deemed to be part of this report on Form 10-K.
COMMVAULT SYSTEMS, INC.
FORM 10-K
FISCAL YEAR ENDED MARCH 31, 20162020
TABLE OF CONTENTS
| Page | ||
| PART I | ||
| Item 1. | ||
| Item 1A. | ||
| Item 1B. | ||
| Item 2. | ||
| Item 3. | ||
| Item 4. | ||
| PART II | ||
| Item 5. | ||
| Item 6. | ||
| Item 7. | ||
| Item 7A. | ||
| Item 8. | ||
| Item 9. | ||
| Item 9A. | ||
| Item 9B. | ||
| PART III | ||
| Item 10. | ||
| Item 11. | ||
| Item 12. | ||
| Item 13. | ||
| Item 14. | ||
| PART IV | ||
| Item 15. | ||
| Item 16. | ||
FORWARD-LOOKING STATEMENTS
The discussion throughout this Annual Report on Form 10-K contains forward-looking statements. In some cases, you can identify these statements by our use of forward-looking words such as “may,” “will,” “should,” “anticipate,” “estimate,” “expect,” “plan,” “believe,” “predict,” “potential,” “project,” “intend,” “could” or similar expressions. In particular, statements regarding our plans, strategies, prospects and expectations regarding our business are forward-looking statements within the meaning of Section 21E of the Securities Exchange Act of 1934, as amended (the "Exchange Act"). You should be aware that these statements and any other forward-looking statements in this document reflect only our expectations and are not guarantees of performance. These statements involve risks, uncertainties and assumptions. Many of these risks, uncertainties and assumptions are beyond our control and may cause actual results and performance to differ materially from our expectations. Important factors that could cause our actual results to be materially different from our expectations include the risks and uncertainties set forth under the heading “Risk Factors.” Accordingly, you should not place undue reliance on the forward-looking statements contained in this Annual Report on Form 10-K. These forward-looking statements speak only as of the date on which the statements were made. We undertake no obligation to update or revise publicly any forward-looking statements, whether as a result of new information, future events or otherwise, except as required by law.
3
PART I
| Item 1. | Business |
Company Overview
Commvault is a leading provider of data protection and information management software applications and related services. Commvault was incorporated in 1996 as a Delaware corporation. The Commvault software platform is an enterprise level, integratedintelligent data and information management solution, built from the ground up on a single platform and unified code base. All software functionality shareshares the same back-end technologies to deliver the benefits of a holistic approach to protecting, managing, and accessing data. The software addresses many aspects of storage and data management in the enterprise, while providing scalability and control of data and information. Key featuresWe also provide our customers with a broad range of professional services that are delivered by our worldwide support and field operations.
Commvault software is built upon an innovative single platform architecture. Our software platform include:
Commvault software enables our customers to simply, and cost effectively, protect and manage their enterprise data throughout its lifecycle, from the mobile worker to the remote office, to the data center, covering the leading operating systems, relational databases, virtualized environments and applications. In addition to addressing today’s data and information management challenges, our customers can realize lower capital costs through more efficient use of their enterprise-wide storage infrastructure assets. This includes the automated movement of data from higher cost to lower cost storage devices, throughout its lifecycle,including cloud storage, and through sharing and better utilization of storage resources across the enterprise. We can also provide our customers with reduced operating costs through a variety of methods, including fast application deployment, reduced training time, lower cost of storage media consumables, proactive monitoring and analysis, and lower administrative overhead. We also provide
In the third quarter of fiscal 2020 Commvault completed the acquisition of Hedvig Inc., a California-based developer of software-defined storage solutions. The primary reason for the business combination is the complementary nature of Hedvig’s technology, with our other technology, which will expand our addressable market. Hedvig software allows customers withto tailor their storage environment to their application and data demands through a broad rangesoftware-defined storage platform. This transaction supports Commvault’s intelligent data management strategy of professional services that are delivered by our worldwide supportunified storage and field operations.
We have established a worldwide, multi-channel distribution network to sell our software and products, and services to large global enterprises, small and medium sized businesses and government agencies, both directly through our sales force and indirectly through our global network of value-added reseller partners, systems integrators, corporate resellers and original equipment manufacturers. As of March 31, 2016, we had licensed our data and information management software to over 22,500 registered customers.
Our internet address is www.commvault.com. On the investor relations section of this website, we post the following filings as soon as reasonably practicable after they are electronically filed with or furnished to the U.S. Securities and Exchange Commission (SEC):("SEC") including: our Annual Reports on Form 10-K, our quarterly reports on Form 10-Q, our current reports on Form 8-K, our proxy statements related to our annual stockholders’ meetings and any amendment to those reports or statements filed or furnished pursuant to Section 13(a) or 15(d) of the Securities Exchange Act of 1934, as amended. All such filings are available on the Investors Relations portion of our web site free of charge. The contents of our web site are not incorporated by reference into this Form 10-K or in any other report, statement or document we file with the SEC.
Industry Background
The driving force behind the growth of the data and information management software industry is the rapid growth of data, coupled with the need to reliably protect and quickly access that data, while maintaining the ability to effectively manage the emerging regulations around compliance and e-discovery.
The increasing reliance on critical enterprise software applications such as e-mail, relational databases, enterprise resource planning, customer relationship management and workgroup collaboration tools is resulting in the rapid growth of data across all enterprises. This data is widely considered to be one of an organization’s most valued and strategic assets. Given the need for actionable and intelligent insights into data sets and file systems, organizations increasingly must scale and store information at unprecedented levels. Big data initiatives leverage new approaches and technologies to store, index and analyze huge data sets, while minimizing storage requirements and driving faster outcomes.
Ensuring the security, availability and integrity of the data has become a critical task as regulatory compliance and corporate governance objectives affecting many organizations mandate the creation of multiple copies of data with longer and more complex retention requirements. Government regulations, such as those issued under the Sarbanes-Oxley Act, the Health Insurance Portability and Accountability Act ("HIPAA"), Government Paper Elimination Act ("GPEA"), Homeland Security, the Patriot Act, Freedom of Information Act ("FOIA"), the Basel Committee on Banking Supervision, ("The Basel Accords"), the Dodd-Frank Wall Street Reform and Consumer Protection Act, General Data Protection Regulation ("GDPR"), as well as company policies requiring data access, protection and preservation, are expanding the proportion of data that must be archived and easily accessible for future use. In addition, ensuring the security, availability and integrity of the data has become a critical task as regulatory compliance and corporate governance objectives affecting many organizations mandate the creation of multiple copies of data with longer and more complex retention requirements.
In addition to rapid data growth, data storage has transitioned from being server-attached to becoming widely distributed across local and global networked storage systems.systems and leading to mass data fragmentation. Data previously stored on primary disk and backed up on tape is increasingly being backed up, managed and stored on a broader array of storage tiers ranging from high-cost, high-performance disk systems, to lower-cost mid-range and low-end disk systems, to tape libraries and both public and private cloud storage services. This transition has been driven by the growth of data, the pervasive use of distributed critical enterprise software applications, the decrease in disk cost, and the demand for 24/7 business continuity.
The recent innovations in storage and networking technologies, coupled with the rapid growth of data, have caused information technology managers to redesign their data and storage infrastructures to deliver greater efficiency, broaden access to data and reduce costs. The result has been the wide adoption of virtualized environments with larger and more complex networked data and storage solutions. We also believe the cloud computing, in its various forms, represents a long term industry trend inwill continue to significantly impact the way that applications are delivered, data is stored and information is retrieved.
The rapid growth of data and the need to securely protect, manage and access this data is driving substantial opportunities for managed service providers ("MSPs") to help organizations deploy and manage solutions that deliver data management capabilities. The result is reduced long-term management costs with increased offerings to customers, which we believe represents a long-term industry trend in the way that services are offered.
We believe that these trends are increasing the demand for software applications and services that can simplify data and information management, provide secure and reliable access to all data across a broad spectrum of tiered storage and computing systems and seamlessly scale to accommodate growth, while reducing the total cost of ownership to the customer.
Our Software and Products
Prior to fiscal 2018, an insignificant amount of our revenue has beenwas sold under subscription, or term based,term-based, license arrangements. Any of our licensing models (capacity, instance, etc.) can be sold via a subscription arrangement. In these arrangements the customer has the right to use the software over a designated period of time. RevenueThe capacity of the license is fixed and the customer has made an unconditional commitment to pay. Software revenue in these arrangements is generally recognized ratably overwhen the term ofsoftware is delivered. In fiscal 2018, we started to introduce more subscription arrangements into the agreement. Over the next several years wemarket. We expect revenue from these types of arrangements to becomeas a more significant portionpercentage of our total revenue.revenue to continue to increase in the next few years. Beginning in fiscal 2021, we also expect to generate material revenue from renewals of subscription licenses sold in prior years.
We also sell to some customers, primarily managed service providers, via utility, or pay-as-you-go models. In these arrangements actual usage is regularly measured and billed. Revenue in these utility arrangements is recognized as the software is used over time.
Commvault Software Solutions
The Commvault software suite contains solutions that are all built on a single unified code base and platform to protect, manage and access data and information. Within the platform, tightly integrated, powerful software features deliver functionality throughout physical and virtual environments to help protect and recover data, manage costs and complexity and gain better insight into information. Our primary software solutions are Data Protection, Backup and Recovery; Cloud and Infrastructure Management; and Retention and Compliance.
 | Commvault Complete™ Backup & Recovery – Backup and recovery for the enterprise with one solution. Commvault Complete Backup & Recovery, is a fully featured and comprehensive backup and recovery solution. Designed to meet the needs of any size business, it covers workloads across all locations: hybrid environments include on-premises and multiple cloud providers; physical servers; virtual machines; applications and databases; endpoint devices; cloud applications and more. Commvault Complete also includes disaster recovery capabilities, snapshot management, endpoint user protection, mailbox protection for on-premises, and SaaS offerings, replication, disaster recovery, reporting and integrated archiving. Historically, the vast majority of our licensing revenue has been generated by sales of our core backup and recovery products. |
| Commvault HyperScale™ Technology – Commvault HyperScale™ Technology delivers an on-premises, cloud-like infrastructure to support scale-out secondary storage with integrated data protection. This is available in two form factors: 1) a Commvault-branded integrated appliance, or 2) as a software solution that can be used with a customer’s preferred hardware provider. |
| Commvault Orchestrate™ – Automated service delivery technology that enables users to provision, sync and validate data in any environment for important IT needs such as disaster recovery ("DR") testing, development testing ("Dev/Test") operations and workload migrations. Commvault Orchestrate™ allows customers to extend the value of their data sitting in secondary storage. Secondary copies of data can now be used for activities like accelerating Dev/Test routines or performing application migrations. Operations that were previously manual can now be orchestrated and automated, saving customers time and money. |
| Commvault Activate™ – Discover and extract new business insights from data under management to better meet governance requirements like GDPR and deliver data to the business for analysis. Commvault Activate™ allows customers to comply with privacy regulations by detecting and taking action on data risks, use data insights to drive file efficiencies and accountability and gives an enterprise the tools to reveal and extend the value of data across the enterprise. |
 | A Commvault Venture - Hedvig ® - Allows customers to tailor their storage environment to their application and data demands through a software-defined storage platform. Built on x86 servers, the Distributed Storage Platform provides the multi-protocol support required across block, file, and object storage with native application, hypervisor, container, and cloud integration to consolidation storage silos – eliminating data fragmentation issues. |
 | A Commvault Venture - Metallic™ - A new offering launched in fiscal 2020, Metallic brings software-as-a-service ("SaaS") data protection to the market, delivering Commvault's powerful core technology simply through the cloud. Metallic offers a growing portfolio of SaaS backup and recovery solutions to help today's companies keep their data protected, compliant and safe from deletion, corruption and attack. Metallic revenue is recognized as Services revenue in the Consolidated Statements of Operations and was immaterial in fiscal 2020. |
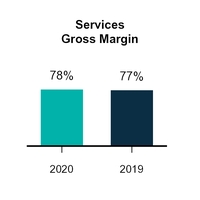
Services
A comprehensive global offering of customer support and other professional services is critical to the successful marketing, sale and deployment of our software. From planning, to deployment, to operations, we offer a complete set of technical services, training and support options that maximize the operational benefits of our suite of software applications. Our commitment to superior customer support is reflected in the breadth and depth of our service offerings as well as in our ongoing initiatives to engineer resiliency, automation and serviceability features directly into our products.
We have established a global customer support organization built specifically to handle our expanding customer base. We offer multiple levels of customer support that can be tailored to the customer’s response needs and business sensitivities.
Our customer support services consist of:
| • | Real-Time Support. Our support staff is available 24/7 by telephone to provide first response and manage the resolution of customer issues. In addition to phone support, our customers have access to an |
support database allowing customers to analyze problems without engaging our technical support personnel.
| • | Significant Network and Hardware Expertise. Our support engineers have extensive knowledge of complex applications, servers and networks. We proactively take ownership of the customer’s problem, regardless of whether the issue is directly related to our products or to those of another vendor. We have also developed and maintain a knowledge library of storage systems and software products to further enable our support organization to quickly and effectively resolve customer problems. |
| • | Global Operations. Our global customer support headquarters is located at our state-of-the-art technical support center in Tinton Falls, New Jersey. We also have established support operations in Reading, United Kingdom; Sydney, Australia; Bangalore, India; and Shanghai, China, which are complemented by regional support centers. Our cloud-based support system creates a virtual global support center combining these locations to allow for the fastest possible resolution times for customer incidents. We have designed our support infrastructure to be able to scale with the increasing globalization of our customers. |
| • | Enhanced Support Options. We offer several enhanced customer support services such as Enterprise Support. Our Enterprise Support service is for customers with critical support needs and builds on our 24/7 real-time support deliverables and includes various levels of enhanced services to ensure dedicated support and customized reporting. Enterprise Support adds a specialized team of technical support engineers, an assigned support account manager and innovative tools to achieve our customers’ mission. |
Our technology consultants ensure that our customerscustomers' software environment is designed for optimal results and will continue to deliver over the long term. This same team of experts can install, configure, personalize and validate that environment so customers can achieve a better return on investment, faster and with more confidenceconfidence.
| • | Technology Consulting Services. Our technology consulting ensures that a customer’s software environment is designed for optimal results and will continue to deliver over the long term. We offer services such as architecture design; implementation; personalization; data migration; and health assessment. In addition, our residency services offer customers staff-augmentation options to assist with the rapid expert deployment of the Commvault software suite. |
| • | Business Consulting Services. Our business consultants provide transformational insights that align to how specific businesses gather, retain and employ data. We offer services such as disaster recovery readiness and policy implementation; private cloud services design; data classification and archive policy implementation; and operational efficiency assessment. |
| • | Education Services. We provide global onsite training, offsite training and self-paced online alternatives for our products. Packaged or customized customer training courses are available in instructor-led or computer-based formats. We offer in-depth training and certification for our resellers in pre- and post-sales support methodologies, including web access to customizable documentation and training materials. In addition, we offer a Commvault Certification Program that validates expertise and advanced knowledge in topics, including Commvault Core Fundamentals, Implementation and Maintenance. We also offer more advanced Specialist, Engineer and Master technologies certifications. We believe certified personnel can increase a company's productivity and reduce operating costs. |
| • | Remote Managed Services. Commvault Remote Managed Services provides remote monitoring and management of the Commvault data management platform deployed on a customer's environment. Our engineers configure, maintain and optimize a customer's Commvault software environment remotely via a secure connection. |
| • | Commvault Software-as-a-Service (Metallic). In fiscal 2020, we launched Metallic. Metallic brings SaaS data protection to the market, delivering Commvault's powerful core technology simply through the cloud. Metallic revenue, which was immaterial in fiscal 2020, is recognized as Services revenue in the Consolidated Statements of Operations. |
Strategic Relationships
An important element of Commvault’s strategy is to establish relationships with third parties that assist us in developing, marketing, selling and implementing our software and services. We believe that strategic and technology-based relationships with industry leaders are fundamental to our success. We have forged numerous relationships with software application and hardware vendors to enhance our combined capabilities and to create the optimal combination of data and information management applications. This approach enhances our ability to expand our product offerings and customer base and to enter new markets. We have established the following types of strategic relationships:
Technology Alliance Partners. We maintain strategic product and technology relationships with major industry leaders to ensure that our software applications are integrated with, supported by and add value to our partners’ hardware and software products. Collaboration with these market leaders allows us to provide applications that enable our customers to improve data and information management efficiency. Our significant strategic relationships include Bull,Atos, Cisco, Citrix, Fujitsu, HP,Hewlett Packard Enterprise ("HPE"), Microsoft, Oracle, SAP, Netapp, AWS and VMware. In addition to these relationships, we maintain relationships with a broad range of industry operating system, application and infrastructure vendors to verify and demonstrate the interoperability of our software applications with their equipment and technologies.
Distributors, Value-Added Reseller, Systems Integrator, Corporate Reseller and Original Equipment Manufacturer Relationships. Our corporate resellers bundle or sell our software applications together with their own products, and our value-added resellers resell our software applications independently. As of March 31, 2016,2020, we had more than 500 reseller partners and systems integrators that have distributed our software worldwide.
In order to broaden our market coverage, we work closely with our Global Original Equipment Manufacturer ("OEM") Partners, investing significant time and resources to deliver unique, joint solutions incorporating Commvault software. These partners team with our technical, engineering, marketing and sales force on helping to enhance integration, tuning, operational management, implementation and vision for solutions that are designed to meet current and future data and information management needs. Our alliance managers work directly with Global OEM Partners to design, deliver and support field activities that make it easier for customers to locate, learn about, and purchase these differentiated solutions. Our most significant OEM partner is Hitachi Data Systems.Vantara ("Hitachi"). Hitachi Data Systems has no obligation to recommend or offer our software applications exclusively or at all, and they have no minimum sales requirements and can terminate our relationship at any time. Sales through our original equipment manufacturer agreements,agreement, accounted for 15%10% of our total revenues in fiscal 20162020 and in11% of our total revenues for fiscal 2015.
2019.
Additionally, we have a non-exclusive distribution agreementsagreement covering our North American commercial markets and our U.S. Federal Government markets with Arrow Enterprise Computing Solutions, Inc. (“Arrow”("Arrow"), a subsidiary of Arrow Electronics, Inc., and Avnet Technology Solutions (“Avnet”), a subsidiary of Avent Inc. Pursuant to thesethis distribution agreements, these distributors'agreement, Arrow's primary role is to enable a more efficient and effective distribution channel for our products and services by managing our reseller partners and leveraging their own industry experience. Sales generated through our distribution agreement with Arrow accounted for approximately 37% of our total revenue in fiscal 2020 and 38% of our total revenue in fiscal 2016 and 36% in fiscal 2015.2019.
Service Provider Partners. Our software is the data protection platform for over 200 service providers, which provide cloud-based solutions to client systems worldwide. As companies of all sizes and markets rapidly adopt cloud infrastructures for improved costs, speed and agility, we remain committed to these strategic relationships to address this growing trend. Customers looking to move IT operations into the cloud depend on service providers to help them migrate, manage and protect their cloud infrastructures. We have partnered with a broad ecosystem of managed service provider and cloud partners so they can effectively deliver data management-as-a-service solutions based on Commvault software across geographies, vertical markets and offerings. Leading providers who have integrated Commvault software into their cloud solution portfolios include Microsoft Windows Azure, Amazon S3, Glacier,Web Services ("AWS"), Google Cloud, Dimension Data, NetApp, and Rackspace.
Customers
We sell Commvault software applications and related services directly to large global enterprises, small and medium sized businesses and government agencies, and indirectly through value-added resellers, systems integrators, corporate resellers and original equipment manufacturerOEM partners. As of March 31, 2016, we had licensedWe license our software applications to over 22,500 registered customers in a broad range of industries, including banking, insurance and financial services, government, healthcare, pharmaceuticals and medical services, technology, legal, manufacturing, utilities and energy.
Technology
We believe our Single Platformsoftware platform serves as a major differentiator versus our competitors’ data and information management software products. Our Single Platform’splatform’s unique indexing, cataloging, data movement, media management and policy technologies are the source of the performance, scale, management, cost of ownership benefits and seamless interoperability inherent in all of our data and information management software applications. Additional options enable content search, data encryption and auditing features to support data discovery and compliance requirements. Each of these solutions share a common architecture consisting of three core components: intelligent agent software, data movement software and command and control software. These components may be installed on a single host server, or each may be distributed over many servers in a global network. Additionally, the modularity of our software provides deployment flexibility. The ability to share storage resources across multiple data and information management applications provides easier data and information management and lower total cost of ownership. We participate in industry standards groups and activities that we believe will have a direct bearing on the data and information management software market.
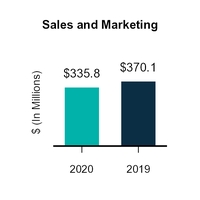
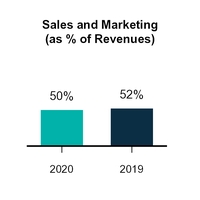
Sales and Marketing
We sell our data and information management software applications and related services to large global enterprises, small and medium sized businesses, and government agencies. We sell through our worldwide direct sales force and our global network of distributors, value-added resellers, systems integrators, corporate resellers and original equipment manufacturerOEM partners. As of March 31, 2016,2020, we had 775653 employees in sales and marketing. These employees are primarilymarketing located in North America, Europe, Australia and Asia.worldwide.
We have a variety of marketing programs designed to create brand awareness and market recognition for our product offerings and for sales lead generation. Our marketing efforts include active participation at trade shows, technical conferences and technology seminars; advertising; content development and distribution; public relations; social media; industry analyst relations; publication of technical and educational articles in industry journals; sales training; and preparation of competitive analyses. In addition, our strategic partners augment our marketing and sales campaigns through seminars, trade shows and joint public relations and advertising campaigns. Our customers and strategic partners provide references and recommendations that we often feature in external marketing activities.
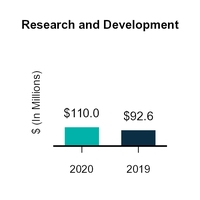
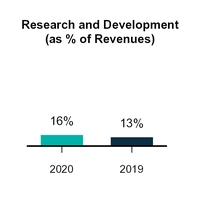
Research and Development
Our research and development organization is responsible for the design, development, testing and certification of our data and information management software applications. As of March 31, 2016,2020, we had 526615 employees in our research and development group, more than half of which 169 are located in our Hyderabad and Bangalore development centers in India.New Jersey. Our engineering efforts support product development across all major operating systems, databases, applications and network storage devices. A substantial amount of our development effort goes into certification, integration and support of our applications to ensure interoperability with our strategic partners’ hardware and software products. We have also made substantial investments in the automation of our product test and quality assurance laboratories. We spent $69.3 million on research and development activities in fiscal 2016, $64.1 million in fiscal 2015 and $55.1 million in fiscal 2014.
Competition
The data storage management market is intensely competitive, highly fragmented and characterized by rapidly changing technology and evolving standards. We currently compete with other providers of data and information management software as well as large and emerging storage hardware manufacturers that have developed or acquired their own data and information management software products. These manufacturers have the resources and capabilities to develop their own data and information management software applications, and many have been making acquisitions and broadening their efforts to include broader data and information management and storage products. These manufacturers and/or our other current and potential competitors may establish cooperative relationships among themselves or with third parties, creating new competitors or alliances. Large operating system and application vendors have introduced products or functionality that includes some of the same functions offered by our software applications. In the future, further development by these vendors could cause some features of our software applications to become redundant.
The principal competitive factors in our industry include product functionality, product performance, product integration, platform coverage, ability to scale, price, worldwide sales infrastructure, global technical support, name recognition and reputation. The ability of major system vendors to bundle hardware and software solutions is also a significant competitive factor in our industry. Although some of our competitors have greater resources, a larger installed customer base and greater name recognition, we believe we compete favorably on the basis of these competitive factors.
Our unique product architecture is one of the primary reasons why we compete so successfully. Whereas many other competitive solutions in the market are based on multiple, disparate products, our modular offering is based on a single, unified, underlying code base resulting in favorable efficiencies in functionality, integration, scalability and support. Our focused approach to data and information management and our ability to respond to customer feedback also drives the functionality and features of our products, which we believe lead the industry in terms of performance and usability, as evidenced by numerous industry awards we have received.
From a customer perspective, highly integrated products such as ours, which are based on a single, unified, underlying code base, are easier and less expensive to deploy, operate and manage. This flexibility, in turn, makes it significantly easier to scale our products over a customer’s entire IT environment. Supporting and enhancing our products is made more efficient due to this single, unified, underlying code base, unlike our competitors who are required to support and enhance multiple, disparate products, most of which are based on differing underlying software code. Supporting multiple, disparate products places more onerous and costly demands on our competitors’ internal human and operational capital. We believe that Commvault software, because of its unique architecture, creates a compelling functional, integration, scalability and support advantage. We continue to expand our worldwide sales infrastructure and increase our distribution throughout the Americas, Europe, Middle East, Africa, Australia and Asia to meet the needs of our business.
Some of our competitors have greater financial resources and may have the ability to offer their products at lower prices than ours. In addition, some of our competitors have greater name recognition than us, which could provide them a competitive advantage with some customers. Some of our competitors also have longer operating histories, have substantially greater technical, sales, marketing and other global resources than we do, as well as a larger installed customer base and broader product offerings, including hardware. As a result, these competitors can devote greater resources to the development, promotion, sale and support of their products than we can.
Intellectual Property and Proprietary Rights
Our success and ability to compete depend on our continued development and protection of our proprietary software and other technologies. We rely primarily on a combination of trade secret, patent, copyright and trademark laws, as well as contractual provisions, to establish and protect our intellectual property rights. We provide our software to customers pursuant to license agreements that impose certain restrictions on use. These license agreements are primarily in the form of shrink-wrap or click-wrap licenses, which are not negotiated with or signed by our end-user customers. These measures may afford only limited protection of our intellectual property and proprietary rights associated with our software. We also enter into confidentiality agreements with employees and consultants involved in product development. We routinely require our employees, customers and potential business partners to enter into confidentiality agreements before we disclose any sensitive aspects of our software, technology or business plans.
As of March 31, 2016,2020, we had 428778 issued patents and 266367 pending patent applications in the United States, as well as 89115 issued patents in foreign countries and 3122 pending foreign patent applications. No single patent, copyright, trademark, license, or other intellectual property right is solely responsible for protecting our products or services. Moreover, we may lack adequate patent or other intellectual property protection for certain innovations that later turn out to be important to our business. Pending patent applications may receive unfavorable examination and are not guaranteed allowance as issued patents. We may elect to abandon or otherwise not pursue prosecution of certain pending patent applications due to patent examination results, economic considerations, strategic concerns or other factors. We will continue to assess appropriate occasions to seek patent and other intellectual property protection for innovative aspects of our technology that we believe provide us a significant competitive advantage.
Changes to patent laws or regulations in the U.S. and other foreign jurisdictions, or new interpretations of these laws and regulations, could also diminish the value of our patents and patent applications or narrow the scope of our patent protection. For example, changes in patent laws and regulations in the U.S. and new patent laws in Europe may affect the ability of companies, including Commvault, to protect innovations, bring patent infringement claims, and defend against claims of patent infringement. The costs of compliance with these laws and regulations are high and are likely to increase in the future.
Despite our efforts to protect our trade secrets and proprietary rights through patents and license and confidentiality agreements, unauthorized parties may still attempt to copy or otherwise obtain and use our software and technology. In addition, we intend to expand our international operations but effective patent, copyright, trademark and trade secret protection may not be available or may be limited in foreign countries. If we fail to protect our intellectual property and other proprietary rights, our business could be negatively impacted.
We currently resell certain software from Microsoft, including Microsoft SQL Server, used in conjunction with our software applications pursuant to an independent software vendor royalty license and distribution agreement that we have and plan to continue renewing annually. We have also entered into and may enter into agreements with additional third parties, including RedHat, to license their technology for use with our software applications.
Some of the products or technologies acquired, licensed or developed by us may incorporate so-called “open source” software and we may incorporate open source software into other products in the future. The use of such open source software may ultimately subject some products to unintended conditions, such as royalty-free licensing of proprietary portions of our products, disclosing proprietary parts of our source code, or commencing costly product redesigns that could result in a loss of intellectual property rights, product performance degradation, or a delay in shipping products to customers, and which may negatively affect our business, financial condition, operating results, cash flow and ability to commercialize our products or technologies.
From time to time, we are participants or members of various industry standard-setting organizations or other industry technical organizations. Our participation or membership in such organizations may, in some circumstances, require us to enter into royalty or licensing agreements with third parties regarding our intellectual property under terms established by those organizations, which we may find unfavorable.
In the United States, we own federal registrations for or have common law trademark rights in the following marks: Commvault, the “C hexagon” logo & Commvault the “CV” Logo & Commvault, the “C hexagon”and logo, the “CV”"C hexagon” logo, Commvault Systems, Solving Forward, SIM, Singular Information Management, Simpana, Simpana (logo), Commvault Galaxy,HyperScale, ScaleProtect, Commvault Edge,OnePass, Unified Data Management, Edge Drive, QiNetix, Quick Recovery, QR, CommNet, GridStor, Vault Tracker, InnerVault, Quick Snap, QSnap, IntelliSnap, Simpana OnePass, Recovery Director, CommServe, CommCell, ROMS, DistinctlyAPSS, Commvault Edge, Commvault GO, Commvault Advantage, Commvault Complete, Commvault Activate, Commvault Orchestrate, Commvault Command Center, Hedvig, Universal Data Plane, the “Cube” logo, Metallic, the “M Wave” logo, Be Ready and CommValue. We also have several otherCommValue are trademarks and have obtained or are actively pursuing trademark registrations in several foreign jurisdictions.registered trademarks of Commvault Systems, Inc.
Employees
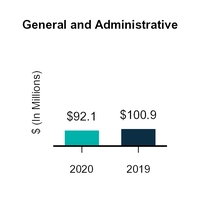
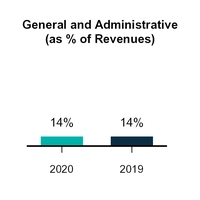
As of March 31, 2016,2020, we had 2,3792,533 employees worldwide, including 775653 in sales and marketing, 526615 in research and development, 842912 in customer services and support and 236353 in general and administration.
Information about our Executive Officers of the Registrant
The following table presents information with respect to our executive officers as of May 1, 2016:14, 2020:
| Name | Age | Position | |||
55 | |||||
| Brian Carolan | 48 | Vice President, Chief Financial Officer | |||
48 | |||||
Brian Carolan has served as our Vice President, Finance and Chief Financial Officer since October 2012. Prior to his current role, Mr. Carolan served as our Vice President, Finance and Chief Accounting Officer from July 2006 until September 2012. He also held the position of Controller from February 2001 until June 2006. Prior to joining our company,Commvault, Mr. Carolan was with Ernst & Young LLP in its Technology, Communications and Entertainment audit practice from 1993 until January 2001. Mr. Carolan obtained his bachelor’s degree in accounting from Villanova University, his master’s degree in business administration from New York University and is a certified public accountant in the State of New Jersey.
13
| Item 1A. | Risk Factors |
You should consider each of the following factors as well as the other information in this Annual Report in evaluating our business and our prospects. The risks and uncertainties described below are not the only ones we face. Additional risks and uncertainties not presently known to us or that we currently consider immaterial may also impair our business operations. If any of the following risks actually occurs,occur, our business and financial results could be harmed. In that case, the trading price of our common stock could decline. You should also refer to the other information set forth in this Annual Report, including our financial statements and the related notes.
Risks Related to Our Business
The novel coronavirus (COVID-19) pandemic could adversely affect our business in a material way.
As a global company, with customers located around the world in a variety of industries, our performance may be impacted by global economic and other conditions, including the COVID-19 pandemic which has caused global economic uncertainty. Efforts to combat this pandemic to date include a range of travel restrictions, shelter in place orders, and mandatory business and other closure, each of which may cause significant disruption to our customers and cause them to curtail or limit spending. As a software company, our ability to support our customers has not been significantly impacted by work-from-home orders or travel restrictions. However, these measures have caused disruptions to our sales efforts and decreased customer spending, which may negatively impact our performance. The extent to which COVID-19 will impact our business is difficult to predict as it depends on factors outside of our control, including the duration of the pandemic and the impact on our customers’ businesses. We have taken precautionary measures to protect the health and safety of our employees and to preserve our cash position and we continue to monitor events.
Our business could be materially and adversely affected as a result of natural disasters, terrorism or other catastrophic events.
Any economic failure or other material disruption caused by natural disasters, including fires, floods, hurricanes, earthquakes, and tornadoes; power loss or shortages; environmental disasters; telecommunications or business information systems failures or break-ins and similar events could also adversely affect our ability to conduct business. If such disruptions result in cancellations of customer orders or contribute to a general decrease in economic activity or corporate spending on IT, or impair our ability to meet our customer demands, our operating results and financial condition could be materially adversely affected.
In addition, our business has been and will likely be adversely affected by the impact of a widespread outbreak of contagious diseases, including the recent outbreak of COVID-19. This, or any other outbreak of contagious diseases, and other adverse public health developments, may cause us or our customers to temporarily suspend operations. Further, a significant outbreak of contagious diseases in the human population could result in a widespread health crisis that could adversely affect the economies and financial markets of many countries, resulting in an economic downturn that could affect demand for our products, our ability to collect against existing trade receivables and our operating results.
We have engaged, and may continue to engage, in strategic acquisitions or transactions, which could have a material adverse effect on our business, results of operations, financial condition and cash flows.
On October 1, 2019, Commvault completed the acquisition of Hedvig, Inc., a California-based developer of software-defined storage ("SDS").
Acquisitions involve a number of risks, including diversion of management’s attention, ability to finance the acquisition on attractive terms, failure to retain key personnel or valuable customers, legal liabilities and the need to amortize acquired intangible assets, any of which could have a material adverse effect on our business, results of operations, financial condition and cash flows. Any additional future acquisitions may also result in the incurrence of indebtedness or the issuance of additional equity securities.
The intellectual property of an acquired business may be an important component of the value that we agree to pay for such a business. Although we conduct due diligence in connection with each of our acquisitions, such acquisitions are subject to the risks that the acquired business may not own the intellectual property that we
believe we are acquiring, that the intellectual property is dependent upon licenses from third parties, that the acquired business infringes upon the intellectual property rights of others or that the technology does not have the acceptance in the marketplace that we anticipated.
We could also experience financial or other setbacks if transactions encounter unanticipated problems, including problems related to execution, integration or underperformance relative to prior expectations. Our management may not be able to successfully integrate any acquired business into our operations or maintain our standards, controls and policies, which could have a material adverse effect on our business, results of operations and financial condition. Consequently, any acquisition we complete may not result in long-term benefits to us or we may not be able to further develop the acquired business in the manner we anticipated.
Following the completion of acquisitions, we may have to rely on the seller to provide administrative and other support, including financial reporting and internal controls, and other transition services to the acquired business for a period of time. There can be no assurance that the seller will do so in a manner that is acceptable to us.
Certain provisions of our certificate of formation and our amended and restated bylaws, Delaware law, and our short-term shareholder rights plan could prevent or delay a potential acquisition of control of our Company, which could decrease the trading price of our common stock.
Our certificate of formation, amended and restated bylaws and the laws in the State of Delaware contain provisions that are intended to deter coercive takeover practices and inadequate takeover bids by making such practices or bids unacceptably expensive to the prospective acquirer and to encourage prospective acquirers to negotiate with our Board of Directors rather than to attempt a hostile takeover. Delaware law also imposes restrictions on mergers and other business combinations between us and any holder of 15% or more of our outstanding common stock. On April 3, 2020, the Board of Directors adopted a 364-day duration shareholder rights plan, which may cause substantial dilution to a person or group that attempts to acquire control of the Company on terms not approved by our Board of Directors.
We believe that these provisions protect our shareholders from coercive or otherwise unfair takeover tactics by effectively requiring those who seek to obtain control of the Company to negotiate with our Board of Directors and by providing our Board of Directors with more time to assess any acquisition of control. However, these provisions could apply even if an acquisition of control of the Company may be considered beneficial by some shareholders and could delay or prevent an acquisition of control that our Board of Directors determines is not in the best interests of our Company and our shareholders.
Our industry is intensely competitive, and many of our competitors have greater financial, technical and sales and marketing resources and larger installed customer bases than we do, which could enable them to compete more effectively than we do.
The data and information management software market is intensely competitive, highly fragmented and characterized by rapidly changing technology and evolving standards, changing customer requirements and frequent new product introductions. Competitors vary in size and in the scope and breadth of the products and services offered. Our primary competitors include EMC,Dell-EMC, IBM, Veritas, Veeam, Rubrik and Veeam.Cohesity.
The principal competitive factors in our industry include product functionality, product integration, platform coverage, ability to scale, price, worldwide sales infrastructure, global technical support, name recognition and reputation. The ability of major system vendors to bundle hardware and software solutions is also a significant competitive factor in our industry. If we are unable to address these factors, our competitive position could weaken and we could experience a decline in revenues that could adversely affect our business.
Many of our current and potential competitors have longer operating histories and have substantially greater financial, technical, sales, marketing and other resources than we do, as well as larger installed customer bases, greater name recognition and broader product offerings, including hardware. Some of these competitors can devote greater resources to the development, promotion, sale and support of their products than we can and have the ability to bundle their hardware and software products in a combined offering. As a result, these competitors may be able to respond more quickly to new or emerging technologies and changes in customer requirements.
It is also costly and time-consuming to change data and information management systems. Most of our new customers have installed data and information management software, which gives an incumbent competitor an
advantage in retaining a customer because it already understands the network infrastructure, user demands and information technology needs of the customer, and also because some customers are reluctant to invest the time and money necessary to change vendors.
Our current and potential competitors may establish cooperative relationships among themselves or with third parties. If so, new competitors or alliances that include our competitors may emerge that could acquire significant market share. In addition, large operating system and application vendors, as well as some hardware manufacturers, have introduced products or functionality that includes some of the same functions offered by our software applications. In the future, further development by these vendors could cause our software applications and services to become redundant, which could seriously harm our sales, results of operations and financial condition.
New competitors entering our markets can have a negative impact on our competitive positioning. In addition, we expect to encounter new competitors as we enter new markets. Furthermore, many of our existing competitors are broadening their operating systems platform coverage. We also expect increased competition from original equipment manufacturers,OEMs, including those we partner with, and from systems and network management companies, especially those that have historically focused on the mainframe computer market and have been making acquisitions and broadening their efforts to include data and information management and storage products. We expect that competition will increase as a result of future software industry consolidation. Increased competition could harm our business by causing, among other things, price reductions of our products, reduced profitability and loss of market share.
We rely on indirect sales channels, such as value-added resellers, systems integrators, corporate resellers, distributors, and original equipment manufacturers,OEMs, for the distribution of our software applications, and the failure of these channels to effectively sell our software applications could have a material adverse effect on our revenues and results of operations.
We rely significantly on our value-added resellers, systems integrators and corporate resellers, which we collectively refer to as resellers, for the marketing and distribution of our software applications and services. Resellers are our most significant distribution channel. However, our agreements with resellers are generally not exclusive, are generally renewable annually, typically do not contain minimum sales requirements and in many cases may be terminated by either party without cause. Many of our resellers carry software applications that compete with ours. These resellers may give a higher priority to other software applications, including those of our competitors, or may not continue to carry our software applications at all. If a number of resellers were to discontinue or reduce the sales of our products, or were to promote our competitors’ products in lieu of our own, it could have a material adverse effect on our future revenues. Events or occurrences of this nature could seriously harm our sales and results of operations. If we fail to manage our resellers successfully, there may be conflicts between resellers or they could fail to perform as we anticipate, including required compliance with the terms and obligations of our reseller agreement, either of which could reduce our sales or impact our reputation in the market. In addition, we expect that a portion of our sales growth will depend upon our ability to identify and attract new reseller partners. Our competitors also use reseller arrangements and may be more successful in attracting reseller partners and could enter into exclusive relationships with resellers that make it difficult to expand our reseller network. Any failure on our part to maintain and/or expand our network of resellers could impair our ability to grow revenues in the future.
Some of our resellers possess significant resources and advanced technical abilities. These resellers, particularly our corporate resellers, may, either independently or jointly with our competitors, develop and market products and related services that compete with our offerings. If this were to occur, these resellers might discontinue marketing and distributing our software applications and services. In addition, these resellers would have an advantage over us when marketing their competing products and related services because of their existing customer relationships. The occurrence of any of these events could have a material adverse effect on our revenues and results of operations.
In addition, we have a distribution agreementsagreement covering our North American commercial markets and our U.S. Federal Government market with Arrow and Avnet.Arrow. Pursuant to thesethis distribution agreements, these distributors’agreement, Arrow’s primary role is to enable a more efficient and effective distribution channel for our products and services by managing our reseller partners and leveraging their own industry experience. Many of our North American resellers have been transitioned to either Arrow or Avnet.buy from Arrow. Sales through our distribution agreement with Arrow accounted for approximately 37% of our total revenues for fiscal 2020 and 38% of our total revenues for fiscal 2016 and approximately 36% for fiscal 2015.2019. If Arrow or Avnet werewas to discontinue or reduce the sales of our products or if our agreement with Arrow or Avnet was terminated, and if we were unable to take back the management of our reseller
channel or find another North American distributor to replace Arrow, or Avnet, then it could have a material adverse effect on our future revenues.
Our original equipment manufacturersOEMs sell our software applications and in some cases incorporate our data and information management software into systems that they sell. A material portion of our revenues is generated through these arrangements. However, we have no control over the shipping dates or volumes of systems these original equipment manufacturersOEMs ship and they have no obligation to ship systems incorporating our software applications. They also have no obligation to recommend or offer our software applications exclusively or at all, and they have no minimum sales requirements and can terminate our relationship at any time. These original equipment manufacturersOEMs also could choose to develop their own data and information management software internally and incorporate those products into their systems instead of our software applications. The original equipment manufacturersOEMs that we do business with also compete with one another. If one of our original equipment manufacturerOEM partners views our arrangement with another original equipment manufacturerOEM as competing with its products, it may decide to stop doing business with us. Any material decrease in the volume of sales generated by original equipment manufacturersOEMs we do business with, as a result of these factors or otherwise, could have a material adverse effect on our revenues and results of operations in future periods. Sales through our original equipment manufacturerOEM agreements accounted for approximately 15%10% of our total revenues for fiscal 20162020 and fiscal 2015.
We may not be able to respond to rapid technological changes with new software applications and services offerings, which could have a material adverse effect on our sales and profitability.
The markets for our software applications are characterized by rapid technological changes, changing customer needs, frequent new product introductions and evolving industry standards. The introduction of software applications embodying new technologies and the emergence of new industry standards could make our existing and future software applications obsolete and unmarketable. As a result, we may not be able to accurately predict the lifecycle of our software applications, and they may become obsolete before we receive the amount of revenues that we anticipate from them. If any of the foregoing events were to occur, our ability to retain or increase market share in the data and information management software market could be materially adversely affected.
We devote significant resources to the development of new products and the enhancement of existing products. To be successful, we need to anticipate, develop and introduce new software applications and services on a timely and cost-effective basis that keep pace with technological developments and emerging industry standards and that address the increasingly sophisticated needs of our customers. We may fail to develop and market software applications and services that respond to technological changes or evolving industry standards, experience difficulties that could delay or prevent the successful development, introduction and marketing of these applications and services or fail to develop applications and services that adequately meet the requirements of the marketplace or achieve market acceptance. Our failure to develop and market such applications and services on a timely basis, or at all, could have a material adverse effect on our sales and profitability.
If the cost for annual maintenance and support agreements, or our term-based subscription licenses, with our customers is not competitive in the market or if our customers do not renew their annual maintenance and support agreements either at all, or on terms that are less favorable to us, our business and financial performance might be adversely impacted.
Most of our maintenance agreements are for a one yearone-year term. As the end of the annual period approaches, we pursue the renewal of the agreement with the customer. Historically, maintenance renewals have represented a significant portion of our total revenue. Because of this characteristic of our business, if our customers do not renew their annual maintenance and support agreements either at all, or on terms that are less favorable to us, our business and financial performance might be adversely impacted.
Volatility in the global economy could adversely impact our continued growth, results of operations and our ability to forecast future business.
As our business has expanded globally, we have become increasingly subject to the risks arising from adverse changes in domestic and global economic and political conditions. Uncertainty in the macroeconomic environment and associated global economic conditions have resulted in volatility in credit, equity, debt and foreign currency markets as well as government budgets worldwide.
These global economic conditions can result in slower economic activity, decreased consumer confidence, reduced corporate profits and capital spending, adverse business conditions and liquidity concerns. There has also been increased volatility in foreign exchange markets. These factors make it difficult for our customers, our vendors and us to accurately forecast and plan future business activities. In addition, these factors could cause customers to slow or defer spending on our software products and services, which would delay and lengthen sales cycles and negatively affect our results of operations. If such conditions deteriorate or if the pace of economic recovery is slower or more uneven, our results of operations could be adversely affected, we may not be able to sustain the growth rates we have experienced recently, and we could fail to meet the expectations of stock analysts and investors, which could cause the price of our common stock to decline.
We continue to invest in our business in the Asia-Pacific and Europe, Middle East, and Africa regions. There are significant risks with overseas investments and growth prospects in these regions. Increased volatility or declines in the credit, equity, debt and foreign currency markets in these regions could cause delays in or cancellations of orders. Deterioration of economic conditions in the countries in which we do business could also cause slower or impaired collections on accounts receivable. In addition, we could experience delays in the payment obligations of our worldwide resellers if they experience weakness in the end-user market, which would increase our credit risk exposure and harm our financial condition.
In periods of volatile economic conditions, our exposure to credit risk and payment delinquencies on our accounts receivable significantly increases.
Our outstanding accounts receivables are generally not secured. In addition, ourOur standard terms and conditions permit payment within a specified number of days following the receipt of our product. DueVolatile economic conditions, including those related to the recent volatile economic conditions in some of the markets we operate in, certain of our customers and resellers have faced or may face liquidity concerns whichCOVID-19 pandemic, could result in our customers orand resellers facing liquidity concerns leading to them not being able to satisfy their payment obligations to us, which would have a material adverse effect on our financial condition, operating results and cash flows. While
In addition, in the future we may transition a more significant percentage of our revenue to subscription, or term based, arrangements. In these arrangements, our customers may pay for software and related services over a period of several years. Due to the potential for extended period of collection, we may be exposed to more significant credit risk.
We develop software applications that interoperate with certain software, operating systems and hardware developed by others, and if the developers of those operating systems and hardware do not cooperate with us or we are unable to devote the necessary resources so that our applications interoperate with those systems, our software development efforts may be delayed or foreclosed and our business and results of operations may be adversely affected.
Our software applications operate primarily on the Windows, UNIX, Linux and Novell Netware operating systems; used in conjunction with Microsoft SQL; and on hardware devices of numerous manufacturers. When new or updated versions of these operating systems, software applications, and hardware devices are introduced, it is often necessary for us to develop updated versions of our software applications so that they interoperate properly with these systems and devices. We may not accomplish these development efforts quickly or cost-effectively, and it is not clear what the relative growth rates of these operating systems and hardware will be. These development efforts require the cooperation of the developers of the operating systems, software applications, and hardware, substantial capital investment and the devotion of substantial employee or financial resources. For some operating systems, we must obtain some proprietary application program interfaces from the owner in order to develop software applications that interoperate with the operating system. Operating system and software owners have proceduresno obligation to monitor and limit exposureassist in these development efforts. If they do not provide us with assistance, the contractual right, or the necessary proprietary application program interfaces on a timely basis, we may experience delays or be unable to credit risk onexpand our receivables and have not suffered any material losses to date, there can be no assurance such procedures will continue to effectively limit our credit risk and avoid future losses.software applications into other areas.
We have started selling a backup appliance which integrates our software with hardware. If we fail to accurately predict our manufacturing requirements and manage our supply chain we could incur additional costs or experience manufacturing delays that could harm our business.
We generally provide forecasts of our requirements to our supply chain partners on a rolling basis. If our forecast exceeds our actual requirements, a supply chain partner may assess additional charges or we may incur costs for excess inventory, each of which could negatively affect our gross margins. If our forecast is less than our actual requirements, the applicable supply chain partner may have insufficient time or components to produce or fulfill our product requirements, which could delay or interrupt manufacturing of our products or fulfillment of orders for our products, and result in delays in shipments, customer dissatisfaction, and deferral or loss of revenue. Further, we may be required to purchase sufficient inventory to satisfy our future needs in situations where a component or product is being discontinued. If we fail to accurately predict our requirements, we may be unable to fulfill those orders or we may be required to record charges for excess inventory. Any of the foregoing could adversely affect our business, financial condition or results of operations.
We are, and may in the future become, involved in litigation that may have a material adverse effect on our business.
We may experience a decline in revenues or volatility in our quarterly operating results, which may adversely affect the market price of our common stock.
We cannot predict our future quarterly revenues or operating results with certainty because of many factors outside of our control. A significant revenue or profit decline, lowered forecasts or volatility in our operating results could cause the market price of our common stock to decline substantially. Factors that could affect our revenues and operating results include the following:
the unpredictability of the timing and magnitude of orders for our software applications, particularly software transactions greater than $100,000 — in recent fiscal years, a majority of our quarterly revenues were earned and recorded near the end of each quarter;
the possibility that our customers may cancel, defer or limit purchases as a result of reduced information technology budgets;
the possibility that our customers may defer purchases of our software applications in anticipation of new software applications or updates from us or our competitors;
the ability of our original equipment manufacturersOEMs and resellers to meet their sales objectives;
market acceptance of our new applications and enhancements;
our ability to control expenses;
changes in our pricing, packaging and distribution terms or those of our competitors; and
the demands on our management, sales force and services infrastructure as a result of the introduction of new software applications or updates.
Our expense levels are relatively fixed and are based, in part, on our expectations of future revenues. If revenue levels fall below our expectations and we are profitable at the time, our net income would decrease because only a small portion of our expenses varies with our revenues. Therefore, any significant decline in revenues for any period could have an immediate adverse impact on our results of operations for that period. We believe that period-to-period comparisons of our results of operations should not be relied upon as an indication of future performance. In addition, our results of operations could be below expectations of public market analysts and investors in future periods, which would likely cause the market price of our common stock to decline.
We encounter long sales and implementation cycles, particularly for our larger customers, which could have an adverse effect on the size, timing and predictability of our revenues.
Potential or existing customers, particularly larger enterprise customers, generally commit significant resources to an evaluation of available software and require us to expend substantial time, effort and money educating them as to the value of our software and services. Sales of our core software products to these larger customers often require an extensive education and marketing effort.
We could expend significant funds and resources during a sales cycle and ultimately fail to win the customer. Our sales cycle for all of our products and services is subject to significant risks and delays over which we have little or no control, including:
our customers’ budgetary constraints;
the timing of our customers’ budget cycles and approval processes;
our customers’ willingness to replace their current software solutions;
our need to educate potential customers about the uses and benefits of our products and services; and
the timing of the expiration of our customers’ current license agreements or outsourcing agreements for similar services.
If our sales cycles lengthen unexpectedly, they could adversely affect the timing of our revenues or increase costs, which may cause fluctuations in our quarterly revenues and results of operations. Finally, if we are unsuccessful in closing sales of our products after spending significant funds and management resources, our operating margins and results of operations could be adversely impacted, and the price of our common stock could decline.
We depend on growth in the data and information management software market, and lack of growth or contraction in this market could have a material adverse effect on our sales and financial condition.
Demand for data and information management software is linked to growth in the amount of data generated and stored, demand for data retention and management (whether as a result of regulatory requirements or otherwise) and demand for and adoption of new storage devices and networking technologies. Because our software applications are concentrated within the data and information management software market, if the demand for storage devices, storage software applications, storage capacity or storage networking devices declines, our sales, profitability and financial condition would be materially adversely affected. Segments of the computer and software industry have in the past experienced significant economic downturns. The occurrence of any of these factors in the data and information management software market could materially adversely affect our sales, profitability and financial condition.
Furthermore, the data and information management software market is dynamic and evolving. Our future financial performance will depend in large part on continued growth in the number of organizations adopting data and information management software for their computing environments. The market for data and information management software may not continue to grow at historic rates, or at all. If this market fails to grow or grows more slowly than we currently anticipate, our sales and profitability could be adversely affected.
Our software applications are complex and may contain undetected errors, which could adversely affect not only our software applications’ performance but also our reputation and the acceptance of our software applications in the market.
Software applications as complex as those we offer contain undetected errors or failures, especially when products are first introduced or new versions are released. Despite extensive testing by us and by our customers, we have in the past discovered errors in our software applications and will do so in the future. As a result of past discovered errors, we experienced delays and lost revenues while we corrected those software applications. In addition, customers in the past have brought to our attention “bugs” in our software created by the customers’ unique operating environments, which are often characterized by a wide variety of both standard and non-standard configurations that make pre-release testing very difficult and time consuming. Although we have been able to fix these software bugs in the past, we may not always be able to do so. Our software products may also be subject to intentional attacks by viruses that seek to take advantage of these bugs, errors or other weaknesses. Any of these events may result in the loss of, or delay in, market acceptance of our software applications and services, which would seriously harm our sales, results of operations and financial condition.
Furthermore, we believe that our reputation and name recognition are critical factors in our ability to compete and generate additional sales. Promotion and enhancement of our name will depend largely on our success in continuing to provide effective software applications and services. The occurrence of errors in our software applications or the detection of bugs by our customers may damage our reputation in the market and our relationships with our existing customers, and as a result, we may be unable to attract or retain customers.
In addition, because our software applications are used to manage data that is often critical to our customers, they may have a greater sensitivity to defects in our products than to defects in other, less critical, applications. As a result, the licensing and support of our software applications involve the risk of product liability claims. Our license agreements with our customers typically contain provisions designed to limit our exposure to potential product liability claims. However, the limitation of liability provisions contained in our license agreements vary and may not be effective as a result of existing or future national, federal, state, or local laws or ordinances or unfavorable judicial decisions. Although we have not experienced any material product liability claims to date, the sale and support of our products entail the risk of such claims, which could be substantial in light of the use of our products in enterprise-wide environments. In addition, our insurance against product liability may not be adequate to cover all potential claims.
We may not receive significant revenues from our current research and development efforts for several years, if at all.
Developing software is expensive, and the investment in product development may involve a long payback cycle. Our research and development expenses were $69.3$110.0 million, or 12%16% of our total revenues in fiscal 2016, $64.12020, $92.6 million, or 11%13% of our total revenues in fiscal 20152019 and $55.1$91.0 million, or 9%13% of our total revenues in fiscal 2014.2018. Our future plans include significant investments in software research and development and related product opportunities. We believe that we must continue to dedicate a significant amount of resources to our research and development efforts to maintain our competitive position. However, we may not recognize significant revenues from these investments for several years, if at all.
Our international sales and operations are subject to factors that could have an adverse effect on our results of operations.
We have significant sales and services operations outside the United States and derive a substantial portion of our revenues from these operations. We also plan to continue to expand our international operations. We generated approximately 42%49% of our revenues from outside the United States in fiscal 20162020 and 43% for47% were outside the United States in fiscal 2015.2019. International revenue decreased 4%1% in fiscal 20162020 compared to fiscal 2015.2019. Expansion of our international operations will require a significant amount of attention from our management and substantial financial resources and might require us to add qualified management in these markets.
In addition to facing risks similar to the risks faced by our domestic operations, our international operations are also subject to risks related to the differing legal, political, social and regulatory requirements and economic conditions of many countries, including:
adverse effects in economic conditions in the countries in which we operate related specifically to the COVID-19 outbreak and the governmental regulations put in place as a result of the virus;
difficulties in staffing and managing our international operations;
foreign countries may impose additional withholding taxes or otherwise tax our foreign income, impose tariffs or adopt other restrictions on foreign trade or investment, including currency exchange controls;
difficulties in coordinating the activities of our geographically dispersed and culturally diverse operations;
general economic conditions in the countries in which we operate, including seasonal reductions in business activity in the summer months in Europe and in other periods in other countries, could have an adverse effect on our earnings from operations in those countries;
imposition of, or unexpected adverse changes in, foreign laws or regulatory requirements may occur, including those pertaining to export restrictions, privacy and data protection, trade and employment restrictions and intellectual property protections;
longer payment cycles for sales in foreign countries and difficulties in collecting accounts receivable;
competition from local suppliers;
greater risk of a failure of our employees and partners to comply with both U.S. and foreign laws, including antitrust regulations, the U.S. Foreign Corrupt Practices Act, the U.K. Bribery Act of 2010, and any trade regulations ensuring fair trade practices;
costs and delays associated with developing software in multiple languages; and
political unrest, war or acts of terrorism.
Our business in emerging markets requires us to respond to rapid changes in market conditions in those markets. Our overall success in international markets depends, in part, upon our ability to succeed in differing legal, regulatory, economic, social and political conditions. We may not continue to succeed in developing and implementing policies and strategies that will be effective in each location where we do business. Furthermore, the occurrence of any of the foregoing factors may have a material adverse effect on our business and results of operations.
We implemented a restructuring program in fiscal 2019, which we cannot guarantee will achieve its intended result.
In fiscal 2019 we initiated a restructuring plan to increase efficiency in our sales, marketing and distribution functions while reducing costs across all functional areas. We cannot guarantee the restructuring program will achieve its intended result. Risks associated with this restructuring program also include additional unexpected costs, adverse effects on employee morale and the failure to meet operational and growth targets due to the loss of key employees, any of which may impair our ability to achieve anticipated results of operations or otherwise harm our business.
We may experience fluctuations in foreign currency exchange rates that could adversely impact our results of operations.
Our international sales are generally denominated in foreign currencies, and this revenue could be materially affected by currency fluctuations. Our primary exposure is to fluctuations in exchange rates for the U.S. dollar versus the Euro and, to a lesser extent, the Australian dollar, British pound sterling, Canadian dollar, Chinese yuan, Indian rupee, Korean won and Singapore dollar. Changes in currency exchange rates could adversely affect our reported revenues and could require us to reduce our prices to remain competitive in foreign markets, which could also have a material adverse effect on our results of operations. An unfavorable change in the exchange rate of foreign currencies against the U.S. dollar would result in lower revenues when translated into U.S. dollars, although operating expenditures would be lower as well.
In recent fiscal years, we have selectively hedged our exposure to changes in foreign currency exchange rates on the balance sheet. In the future, we may enter into additional foreign currency-based hedging contracts to reduce our exposure to significant fluctuations in currency exchange rates on the balance sheet, although there can be no assurances that we will do so. However, as our international operations grow, or if dramatic fluctuations in foreign currency exchange rates continue or increase or if our hedging strategies become ineffective, the effect of changes in the foreign currency exchange rates could become material to revenue, operating expenses, and income.
Our ability to sell our software applications is highly dependent on the quality of our service offerings, and our failure to offer high quality support and professional services would have a material adverse effect on our sales of software applications and results of operations.
Our services include the assessment and design of solutions to meet our customers’ storage management requirements and the efficient installation and deployment of our software applications based on specified business objectives. Further, once our software applications are deployed, our customers depend on us to resolve issues relating to our software applications. A high level of service is critical for the successful marketing and sale of our software. If we or our partners do not effectively install or deploy our applications, or succeed in helping our customers quickly resolve post-deployment issues, it would adversely affect our ability to sell software products to existing customers and could harm our reputation with prospective customers. As a result, our failure to maintain high quality support and professional services would have a material adverse effect on our sales of software applications and results of operations.
A portion of our revenue is generated by sales to government entities, which are subject to a number of challenges and risks.
Sales to U.S. and foreign federal, state, and local governmental agency end-customers have accounted for a portion of our revenue, and we may in the future increase sales to government entities. However, government entities have recently announced reductions in, or experienced increased pressure to reduce spending. In particular, such measures have adversely affected European public sector transactions, and U.S. debt issues and budget concerns may adversely impact future U.S. public sector transactions. Such budgetary constraints or shifts in spending priorities of government entities may adversely affect sales of our products and services to such entities. In addition, sales to government entities are subject to a number of risks. Selling to government entities can be highly competitive, expensive and time consuming, often requiring significant upfront time and expense without any assurance that we will successfully sell our products to such governmental entity. Government entities may require contract terms that differ from our standard arrangements. Government contracts may require the maintenance of certain security clearances for facilities and employees which can entail administrative time and effort possibly resulting in additional costs and delays. In addition, government demand for our products may be more volatile as they are affected by public sector budgetary cycles, funding authorizations, and the potential for funding reductions or delays, making the time to close such transactions more difficult to predict. This risk is enhanced as the size of such sales to the government entities increases. If the use of our products expands to more sensitive, secure or mission critical uses by our government customers, we may be subject to increased scrutiny, potential reputational risk, or potential liability should our products fail to perform as expected or should we not comply with the terms of our government contracts or government contracting requirements.
Most of our sales to government entities have been made indirectly through providers that sell our products. Government entities may have contractual or other legal rights to terminate contracts with our providers for convenience or due to a default, and any such termination may adversely impact our future results of operations. Governments routinely audit and investigate government contractors, and we may be subject to such audits and investigations. If an audit or investigation uncovers improper or illegal activities, including any misuse of confidential or classified information by our employees, we may be subject to civil or criminal penalties and administrative sanctions.
We may be subject to information technology system failures, network disruptions and breaches in data security.
Information technology system failures, network disruptions and breaches of data security could disrupt our operations by causing delays or cancellation of customer orders, impeding the shipment of software products, negatively affecting our service offerings, preventing the processing of transactions and reporting of financial results. Information technology system failures, network disruptions and breaches of data security could also result in the unintentional disclosure of customer or our information as well as damage our reputation. While management has taken steps to address these concerns by implementing sophisticated network security, internal control measures and developed certain disaster recovery plans, thereThere can be no assurance that a system failure, network disruption or data security breach will not have a material adverse effect on our financial condition and operating results.
Protection of our intellectual property is limited, and any misuse of our intellectual property by others could materially adversely affect our sales and results of operations.
Our success depends significantly upon proprietary technology in our software, documentation and other written materials. To protect our proprietary rights, we rely on a combination of:
patents;
copyright and trademark laws;
trade secrets;
confidentiality procedures; and
contractual provisions.
These methods afford only limited protection. Despite this limited protection, any issued patent may not provide us with any competitive advantages or may be challenged by third parties, and the patents of others may seriously impede our ability to conduct our business. Further, our pending patent applications may not result in the issuance of patents, and any patents issued to us may not be timely or broad enough to protect our proprietary rights. We may also develop proprietary products or technologies that cannot be protected under patent law. We also seek to maintain certain intellectual property as trade secrets. The secrecy could be compromised by outside
parties, or by our employees, which would cause us to lose the competitive advantage resulting from these trade secrets.
Despite our efforts to protect our proprietary rights, unauthorized parties may attempt to copy aspects of our software applications or to obtain and use information that we regard as proprietary. Policing unauthorized use of our software applications is difficult, and we expect software piracy to continue to be a persistent problem. In licensing our software applications, we typically rely on “shrink wrap” or “click wrap” licenses that are not signed by licensees. We may have difficulty enforcing these licenses in some jurisdictions. In addition, the laws of some foreign countries do not protect our proprietary rights to as great an extent as do the laws of the United States. Our attempts to protect our proprietary rights may not be adequate. Our competitors may independently develop similar technology, duplicate our software applications or design around patents issued to us or other intellectual property rights of ours. Litigation may be necessary in the future to enforce our intellectual property rights, protect our trade secrets or determine the validity and scope of the proprietary rights of others. Litigation could result in substantial costs and diversion of resources and management attention. In addition, from time to time we are participants or members of various industry standard-setting organizations or other industry technical organizations. Our participation or membership in such organizations may, in some circumstances, require us to enter into royalty or licensing agreements with third parties regarding our intellectual property under terms established by those organizations, which we may not find favorable. In addition, many of our agreements with our customers and partners require us to indemnify them for certain intellectual property infringement claims against them, which would increase our costs as a result of defending such claims, and may require that we pay significant damages if there were an adverse ruling in any such claims. Furthermore, such customers and partners may discontinue the use of our products, services, and technologies, as a result of injunctions or otherwise, which could result in loss of revenues and adversely impact our business.
On April 21, 2020, the Company filed suit against Cohesity, Inc. ("Cohesity") in the District of Delaware alleging that Cohesity has infringed and continues to infringe at least one claim of each of U.S. Patent Nos. 7,725,671, 7,840,533, 8,762,335, 9,740,723, 10,210,048, and 10,248,657. Due to the inherent uncertainties of litigation, the Company cannot accurately predict the ultimate timing or outcome of this matter. The Company is unable at this time to determine whether the outcome of the litigation will have a material impact on its results of operations, financial condition, or cash flows.
On April 21, 2020, the Company filed suit against Rubrik, Inc. ("Rubrik") in the District of Delaware alleging that Rubrik has infringed and continues to infringe at least one claim of each of U.S. Patent Nos. 7,725,671, 7,840,533, 8,447,728, 9,740,723, 10,210,048, and 10,248,657. Due to the inherent uncertainties of litigation, the Company cannot accurately predict the ultimate timing or outcome of this matter. The Company is unable at this time to determine whether the outcome of the litigation will have a material impact on its results of operations, financial condition, or cash flows.
Change in senior management could cause disruption in the Company and have a material effect on our business. Furthermore, the loss of key personnel or the failure to attract and retain highly qualified personnel could have an adverse effect on our business.
We have had, and could have, changes in senior management which could be disruptive to management and operations of the Company and could have a material effect on our business, operating results and financial conditions. Turnover at the senior management level may create instability within the Company, which could impede the Company’s day to day operations. Such instability could impede our ability to fully implement our business plan and growth strategy, which would harm our business and prospects.
Our future performance depends on the continued service of our key technical, sales, services and management personnel. We rely on our executive officers and senior management to execute our existing business operations and identify and pursue new growth opportunities. The loss of key employees could result in significant disruptions to our business, and the integration and training of replacement personnel could be time consuming, cause additional disruptions to our business and be unsuccessful. We do not carry key person life insurance covering any of our employees.
Our future success also depends on our continued ability to attract and retain highly qualified technical, sales, services and management personnel. Competition for such personnel is intense, and we may fail to retain our key technical, sales, services and management employees or attract or retain other highly qualified technical, sales, services and management personnel in the future.
Furthermore, in the past, we have experienced higher levels of turnover in our sales force compared to other employee groups in our company. Increases in the turnover rate of our sales force may affect our ability to generate license revenue growth. Although we have hired replacements in our sales force and are continuing to hire additional sales personnel to grow our business, we sometimes experience lower productivity from newly hired sales personnel for a period up to twelve months. In addition, we periodically make adjustments to our sales organization in response to a variety of internal and external factors, such as market opportunities, competitive threats, product introductions or enhancements and sales performance. Such adjustments could be temporarily disruptive and result in reduced productivity.
The volatility of our stock price may from time to time adversely affect our ability to attract or retain employees. If we are unable to hire or retain qualified employees across our organization, or conversely, if we fail to manage employee performance or reduce staffing levels when required by market conditions, our personnel costs would be excessive and our business and profitability could be adversely affected.
Our Omnibus Plan has approximately 2.1 million shares left available for grant until we will be required to ask our shareholders for additional shares. If our shareholders do not approve additional shares it could make it difficult to attract, retain and motivate our key personnel.
Claims that we misuse the intellectual property of others could subject us to significant liability and disrupt our business, which could have a material adverse effect on our results of operations and financial condition.
Due to the nature of our business, we may become subject to material claims of infringement by competitors and other third parties with respect to current or future software applications, trademarks or other proprietary rights. We expect that software developers will increasingly be subject to infringement claims as the number of software applications and competitors in our industry segment grows and the functionality of software applications in different industry segments overlaps. Future litigation may also involve third parties such as individuals, non-practicing entities, patent holding companies, and/or patent assertion entities that have no relevant product offerings or revenue in the marketplace, and against whom our own patents may provide little or no deterrence or protection. Such parties may purchase or otherwise obtain intellectual property assets for the purpose of monetizing these assets; they often make broad and sweeping claims of infringement against product manufacturing companies such as Commvault and its customers, seeking a percentage of sales as license fees, seeking injunctions to pressure us into taking a license, or a combination thereof. Claims such as these have increased in recent years and may continue to do so. Any such claims, whether meritorious or not, could be time-consuming, result in costly litigation, cause shipment delays or require us to enter into royalty or licensing agreements with third parties, which may not be available on terms that we deem acceptable, if at all. In addition, we may decide to settle a claim or action against us, which settlement could be costly. We may also be liable for any past infringement. If there is an adverse ruling against us in an infringement lawsuit, an injunction could be issued barring production or sale of any infringing product. It could also result in a damage award equal to a reasonable royalty or lost profits or, if there is a finding of willful infringement, treble damages. Any of these claims could disrupt our business and have a material adverse effect on our results of operations and financial condition.
In addition, we license and use software from third parties in our business. These third-party software licenses may not continue to be available to us on acceptable terms or at all, and may expose us to additional liability. This liability, or our inability to use any of this third-party software, could result in shipment delays or other disruptions in our business that could materially and adversely affect our operating results.
Our use of “open source” software could negatively affect our business and subjects us to possible litigation.
Some of the products or technologies acquired, licensed or developed by us may incorporate so-called “open source” software, and we may incorporate open source software into other products in the future. Such open source software is generally licensed by its authors or other third parties under open source licenses, including, for example, the GNU General Public License, the GNU Lesser General Public License, the Common Public License, “Apache-style” licenses, “Berkley Software Distribution or BSD-style” licenses and other open source licenses. We monitor our use of open source software to avoid subjecting our products to conditions we do not intend, but these efforts may not be successful. Although we believe that we have complied with our obligations under the various applicable licenses for open source software that we use, there is little or no legal precedent governing the interpretation of many of the terms of certain of these licenses, and therefore the potential impact of these terms on our business is somewhat unknown and may result in unanticipated obligations regarding our products and technologies. The use of such open source software may ultimately subject some of our products to unintended conditions, which may negatively affect our business, financial condition, operating results, cash flow and ability to commercialize our products or technologies.
Some of these open source licenses may subject us to certain conditions, including requirements that we offer our products that use the open source software for no cost, that we make available source code for modifications or derivative works we create based upon, incorporating or using the open source software and/or that we license such modifications or derivative works under the terms of the particular open source license. If an author or other third-party that distributes such open source software were to allege that we had not complied with the conditions of one or more of these licenses, we could be required to incur significant legal expenses defending against such allegations. If our defenses were not successful, we could be enjoined from the distribution of our products that contained the open source software and required to make the source code for the open source software available to others, to grant third parties certain rights of further use of our software or to remove the open source software from our products, which could disrupt the distribution and sale of some of our products. In addition, if we combine our proprietary software with open source software in a certain manner, under some open source licenses we could be required to release the source code of our proprietary software. If an author or other third-party that distributes open source software were to obtain a judgment against us based on allegations that we had not complied with the terms of any such open source licenses, we could also be subject to liability for copyright infringement damages and breach of contract for our past distribution of such open source software.
Our effective tax rate is difficult to project, and changes in such tax rate or adverse results of tax examinations could adversely affect our operating results.
We are a U.S.-based multinational company subject to tax in multiple U.S. and foreign tax jurisdictions. Our results of operations would be adversely affected to the extent that our geographical mix of income becomes more weighted toward jurisdictions with higher tax rates and would be favorably affected to the extent the relative geographic mix shifts to lower tax jurisdictions. Any change in our mix of earnings is dependent upon many factors and is therefore difficult to predict.
The process of determining our anticipated tax liabilities involves many calculations and estimates that are inherently complex and make the ultimate tax obligation determination uncertain. As part of the process of preparing our consolidated financial statements, we are required to estimate our income taxes in each of the jurisdictions in which we operate prior to the completion and filing of tax returns for such periods. These estimates involve complex issues, require extended periods of time to resolve, and require us to make judgments, such as anticipating the outcomes of audits with tax authorities and the positions that we will take on tax returns prior to our actually preparing the returns.
Furthermore, our overall effective income tax rate and tax expenses may be affected by various factors in our business, including changes in our legal structure, changes in the geographic mix of income and expenses, changes in tax laws and applicable accounting pronouncements and variations in the estimated and actual level of annual profits before income tax.
We also determine the need to record deferred tax liabilities and the recoverability of deferred tax assets. A valuation allowance is established to the extent recovery of deferred tax assets is not likely based on our estimation of future taxable income and other factors in each jurisdiction. In assessing the need for a valuation allowance in fiscal 2018, we considered all available objective and verifiable evidence both positive and negative, including historical levels of pre-tax income (loss) both on a consolidated basis and tax reporting entity basis, legislative developments, expectations and risks associated with estimates of future pre-tax income, and prudent and feasible tax planning strategies. As a result of March 31, 2016,this analysis, we had netdetermined that it is more likely than not that we will not realize the benefits of our gross deferred tax assets and therefore have recorded a valuation allowance to reduce the carrying value of approximately $50.0 million, which were primarily related to stock compensation,these gross deferred revenue and tax credits. We expect our cash taxes to continue to align with our effective tax rate over the next several years.
The 2017 Tax Cuts and Jobs Act (the "Act") was enacted on December 22, 2017, and significantly affected U.S. tax law by changing how the U.S. imposes income tax on multinational corporations. The U.S. Department of Treasury has broad authority to issue regulations and interpretative guidance that significantly impacted how we deposit fails or is subject to other adverse conditions inwill apply the financial or credit markets. To date, we have experienced no loss or lack of access tolaw and impact our invested cash or cash equivalents; however, we can provide no assurance that access to our invested cash and cash equivalents will not be impacted by adverse conditions in the financial and credit markets.
Many of our key financial systems used for internal purposes are cloud-based solutions provided by third parties.
Our enterprise resource planning system as well as certain other stand-alone internal financial systems are cloud-based solutions provided by third parties. The use of cloud-based systems provided by third parties exposes us to certain risks of those third parties. If a disruption of services by these third party cloud financial system providers were to occur it could have a material adverse effect on our financial position, results of operations and cash flows.
Generally accepted accounting principles in the United States are subject to interpretation by the Financial Accounting Standards Board, the SEC, and the industryvarious bodies formed to promulgate and interpret appropriate accounting principles. A change in which we operate;
Risks from investing in growth opportunities could impact our business.
We may invest in growth opportunities, such as high-value market segments of enterprise computing, managed services and cloud computing. Even though we believe cloud computing, in its various forms, represents a long term industry trend in the way that applications are delivered, data is stored and information is retrieved, there can be no assurance that our investment in cloud, and related managed services and infrastructure management will be validated in the marketplace. Similarly, there is no assurance that our investments in high-value market segments will drive revenue growth or market share gains. Customer adoption rates and viable economic models are less certain in high-value and rapidly-growing segments, and new product and services offerings may unfavorably impact demand for our other products or services.
Risks Relating to Ownership of Our Common Stock
The price of our common stock may be highly volatile and may decline regardless of our operating performance.
The market price of our common stock could be subject to significant fluctuations in response to:
variations in our quarterly or annual operating results;
changes in financial estimates, treatment of our tax assets or liabilities or investment recommendations by securities analysts following our business or our competitors;
the public’s response to our press releases, rumors, our other public announcements and our filings with the SEC;
changes in accounting standards, policies, guidance or interpretations or principles;
sales of common stock by our directors, officers and significant stockholders;
announcements of technological innovations or enhanced or new products by us or our competitors;
our failure to achieve operating results consistent with securities analysts’ projections;
the operating and stock price performance of other companies that investors may deem comparable to us;
broad market and industry factors; and
other events or factors, including those resulting from war, incidents of terrorism or responses to such events.
The market prices of software companies have been extremely volatile. Stock prices of many software companies have often fluctuated in a manner unrelated or disproportionate to the operating performance of such companies. In the past, following periods of market volatility, stockholders have often instituted securities class action litigation. Securities litigation could have a substantial cost and divert resources and the attention of management from our business.
Although we believe we currently have adequate internal control over financial reporting, we are required to assess our internal control over financial reporting on an annual basis, and any future adverse results from such assessment could result in a loss of investor confidence in our financial reports and have an adverse effect on our stock price.
Pursuant to Section 404 of the Sarbanes-Oxley Act of 2002 (“("SOX 404”404"), and the rules and regulations promulgated by the SEC to implement SOX 404, we are required to furnish a report in our Form 10-K regarding the effectiveness of our internal control over financial reporting. The report’s assessment of our internal control over financial reporting as of the end of our fiscal year must include disclosure of any material weaknesses in our internal control over financial reporting identified by management. Management’s assessment of internal control over financial reporting requires management to make subjective judgments and some of our judgments will be in areas that may be open to interpretation.
Although we currently believe our internal control over financial reporting is effective, the effectiveness of our internal controls in future periods is subject to the risk that our controls may become inadequate or may not operate effectively. In future years, if we fail to timely complete this assessment, or if our independent auditors cannot timely attest,are unable to express an opinion on the effectiveness of our internal controls, there may be a loss of public confidence in our internal controls, the market price of our stock could decline and we could be subject to regulatory sanctions or investigations by the NASDAQ Stock Market, the Securities and Exchange Commission or other regulatory authorities, which would require additional financial and management resources. In addition, any failure to implement required new or improved controls, or difficulties encountered in their implementation, could harm our operating results or cause us to fail to timely meet our regulatory reporting obligations.
During the past several years, our organizational structure has increased in complexity due to compliance with tax regulations and tax accounting requirements and other regulatory and compliance requirements, including compliance with anti-corruption and anti-bribery laws such as the U.S. Foreign Corrupt Practices Act (the “FCPA”) and the UK Bribery Act of 2010 (the “UK Bribery Act”). Further, we have expanded our presence in the Asia-Pacific region, where business practices can differ from those in other regions of the world and can create internal control risks. We provide business practices training to our employees worldwide. Overall, the combination of increased structural complexity and the ever-increasing regulatory complexity make it more critical for us to attract and retain qualified and technically competent employees.
| Item 1B. | Unresolved Staff Comments |
None.
| Item 2. | Properties |
Our principal administrative, sales, marketing, customer support and research and development facility is located at our owned corporate headquarters in Tinton Falls, New Jersey.
In addition, we have offices in the United States in California, Colorado, Florida, Georgia, Illinois, Massachusetts, Minnesota, New York, Oregon, Texas, and Virginia; and outside the United States in Kanata, Ontario; Toronto, Ontario; Reading, United Kingdom; Oberhausen, Germany; Utrecht, Netherlands; Milan, Italy; Stockholm, Sweden; Zurich, Switzerland; Istanbul, Turkey; Paris, France; Madrid, Spain; Dubai,Australia, Austria, Belgium, Brazil, Canada, China, Denmark, France, Hong Kong, India, Israel, Italy, Japan, Netherlands, New Zealand, Poland, Russia, Singapore, South Africa, South Korea, Spain, Sweden, Switzerland, United Arab Emirates; Moscow, Russia; Warsaw, Poland; Johannesburg, South Africa; Riyadh, Saudi Arabia; Tel Aviv, Israel; Beijing, China; Shanghai, China; Guangzhou, China; Chengdu, China; Hong Kong; Sydney, Australia; Melbourne, Australia; Canberra, Australia; Auckland, New Zealand; Tokyo, Japan; Singapore; Mexico City, Mexico; Kuala Lumpar, Malaysia; Bangkok, Thailand; Sao Paulo, Brazil; Seoul, South Korea; Mumbai, India; New Delhi, India; Bangalore, India;Emirates, and Hyderabad, India.United Kingdom.
| Item 3. | Legal Proceedings |
From time to time, we are subject to claims in legal proceedings arising in the normal course of our business. Except as discussed below, weWe do not believe that we are currently party to any pending legal action that could reasonably be expected to have a material adverse effect on our business or operating results.
| Item 4. | Mine Safety Disclosures |
Not ApplicableApplicable.
29
PART II
| Item 5. | Market for Registrant’s Common Equity, Related Stockholder Matters and Issuer Purchases of Equity Securities |
Market for our Common Stock
Our common stock is listed and traded on The NASDAQ Global Market under the symbol “CVLT.” The following table sets forth, for the periods indicated, the high and the low closing sales prices of our common stock, as reported on The NASDAQ Global Market.
| Common Stock | ||||||||||||||||
| 2016 | 2015 | |||||||||||||||
| High | Low | High | Low | |||||||||||||
| First Quarter | $ | 47.46 | $ | 42.41 | $ | 70.80 | $ | 46.07 | ||||||||
| Second Quarter | $ | 41.31 | $ | 33.96 | $ | 55.83 | $ | 47.13 | ||||||||
| Third Quarter | $ | 42.91 | $ | 34.54 | $ | 54.03 | $ | 42.88 | ||||||||
| Fourth Quarter | $ | 43.17 | $ | 30.41 | $ | 51.55 | $ | 43.45 | ||||||||
Stockholders
As of April 29, 2016,May 14, 2020, there were approximately 5549 holders of our common stock. The number of record holders does not represent the actual number of beneficial owners of shares of our common stock because shares are frequently held in street name by securities dealers and others for the benefit of individual owners who have the right to vote their shares.
Dividend Policy
We have never paid cash dividends on our common stock, and we intend to retain our future earnings, if any, to fund the growth of our business. We therefore do not anticipate paying any cash dividends on our common stock in the foreseeable future. Our future decisions concerning the payment of dividends on our common stock will depend upon our results of operations, financial condition and capital expenditure plans, as well as any other factors that the Board of Directors, in its sole discretion, may consider relevant.
Stock Performance Graph
The graph set forth below compares the cumulative total stockholder return on our common stock between March 31, 20112015 and March 31, 2016,2020, with the cumulative total return of (i) The NASDAQ Computer Index and (ii) The NASDAQ Composite Index, over the same period. This graph assumes the investment of $100,000 on March 31, 20112015 in our common stock, The NASDAQ Composite Index and The NASDAQ Computer Index, and assumes the reinvestment of dividends, if any. The graph assumes the initial value of our common stock on March 31, 20112015 was the closing sales price of $39.88$43.70 per share.
The comparisons shown in the graph below are based upon historical data. The stock price performance shown in the graph below is not necessarily indicative of, nor is it intended to forecast, the future performance of our common stock. Information used in the graph was obtained from NASDAQ, a source we believe to be reliable, but we are not responsible for any errors or omissions in such information.
The performance graph shall not be deemed “filed” for purposes of Section 18 of the Exchange Act or otherwise subject to the liabilities under that Section, and shall not be deemed to be incorporated by reference into any filing of Commvault under the Securities Act or the Exchange Act.

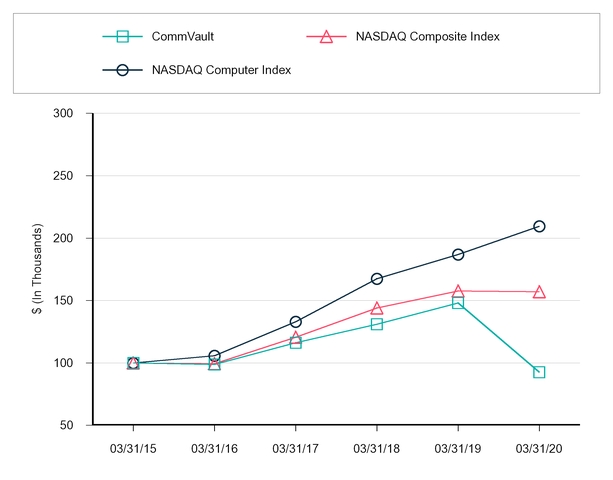
| 3/31/2011 | 3/30/2012 | 3/28/2013 | 3/31/2014 | 3/31/2015 | 3/31/2016 | 3/31/2015 | 3/31/2016 | 3/31/2017 | 3/31/2018 | 3/31/2019 | 3/31/2020 | |||||||||||||
| Commvault | 100.0 | 124.5 | 205.6 | 162.9 | 109.6 | 108.2 | 100.0 | 98.8 | 116.2 | 130.9 | 148.1 | 92.6 | ||||||||||||
| NASDAQ Composite Index | 100.0 | 111.2 | 117.5 | 151.0 | 176.2 | 175.1 | 100.0 | 99.4 | 120.6 | 144.1 | 157.7 | 157.1 | ||||||||||||
| NASDAQ Computer Index | 100.0 | 119.3 | 111.0 | 145.5 | 174.0 | 184.1 | 100.0 | 105.8 | 132.9 | 167.5 | 186.8 | 209.5 | ||||||||||||
Issuer Purchases of Equity Securities
During the three months ended March 31, 2016,2020, we repurchased $56.9$37.2 million of common stock (1.6(0.9 million shares)., under our repurchase program. During the year ended March 31, 2016,2020, we repurchased $91.5$77.2 million of common stock (2.6(1.7 million shares), under our share repurchase program. As of May 6, 2016, there is $93.1 million remaining in the share repurchase program which expires on March 31, 2017.
| Period | Total number of shares purchased as part of publicly announced programs | Average price paid per share | Total of Purchases | Approximate dollar value of shares that may yet be purchased under the program | ||||||||||||
| January 2016 | 476,967 | $ | 31.13 | $ | 14,847,884 | $ | 135,152,116 | |||||||||
| February 2016 | 1,120,688 | $ | 37.52 | $ | 42,049,402 | $ | 93,102,714 | |||||||||
| March 2016 | — | $ | — | — | $ | 93,102,714 | ||||||||||
| Three months ended March 31, 2016 | 1,597,655 | $ | 35.61 | $ | 56,897,286 | |||||||||||
| Period | Total number of shares purchased as part of publicly announced programs | Average price paid per share | Total of Purchases | Approximate dollar value of shares that may yet be purchased under the program | |||||||||||
| January 2020 | 17,786 | $ | 43.96 | $ | 781,791 | $ | 199,218,209 | ||||||||
| February 2020 | 361,100 | $ | 45.91 | $ | 16,577,950 | $ | 182,640,259 | ||||||||
| March 2020 | 492,800 | $ | 40.20 | $ | 19,811,466 | $ | 162,828,793 | ||||||||
| Three months ended March 31, 2020 | 871,686 | $ | 42.64 | $ | 37,171,207 | ||||||||||
31
| Item 6. | Selected Financial Data |
The following selected financial data should be read in conjunction with our financial statements and related notes, “Risk Factors” and “Management’s Discussion and Analysis of Financial Condition and Results of Operations” included elsewhere in this Annual Report on Form 10-K. The selected statements of operations and the selected balance sheet data are derived from our audited financial statements. The historical results presented below are not necessarily indicative of the results to be expected in any future period.
Statement of Operations Data | Year Ended March 31, | |||||||||||||||||||||||||||||||||||||||
| 2020 | 2019 | 2018 | 2017 | 2016 | ||||||||||||||||||||||||||||||||||||
| (In thousands, except per share data) | ||||||||||||||||||||||||||||||||||||||||
| Year Ended March 31, | ||||||||||||||||||||||||||||||||||||||||
| 2016 | 2015 | 2014 | 2013 | 2012 | ||||||||||||||||||||||||||||||||||||
| (In thousands, except per share data) | ||||||||||||||||||||||||||||||||||||||||
| Statement of Operations Data: | ||||||||||||||||||||||||||||||||||||||||
| Revenues: | ||||||||||||||||||||||||||||||||||||||||
| Software | $ | 258,793 | $ | 283,254 | $ | 294,411 | $ | 251,508 | $ | 201,800 | ||||||||||||||||||||||||||||||
| Software and products | $ | 275,308 | $ | 309,899 | $ | 311,745 | $ | 290,668 | $ | 258,091 | ||||||||||||||||||||||||||||||
| Services | 336,333 | 324,289 | 291,929 | 244,342 | 204,839 | 395,577 | 401,058 | 387,648 | 354,337 | 335,676 | ||||||||||||||||||||||||||||||
| Total revenues | 595,126 | 607,543 | 586,340 | 495,850 | 406,639 | 670,885 | 710,957 | 699,393 | 645,005 | 593,767 | ||||||||||||||||||||||||||||||
| Cost of revenues: | ||||||||||||||||||||||||||||||||||||||||
| Software | 2,385 | 2,442 | 2,588 | 2,863 | 2,747 | |||||||||||||||||||||||||||||||||||
| Software and products | 28,082 | 25,691 | 7,223 | 3,045 | 2,385 | |||||||||||||||||||||||||||||||||||
| Services | 80,327 | 79,626 | 71,713 | 62,089 | 50,660 | 88,996 | 91,315 | 90,929 | 82,147 | 80,327 | ||||||||||||||||||||||||||||||
| Total cost of revenues | 82,712 | 82,068 | 74,301 | 64,952 | 53,407 | 117,078 | 117,006 | 98,152 | 85,192 | 82,712 | ||||||||||||||||||||||||||||||
| Gross margin | 512,414 | 525,475 | 512,039 | 430,898 | 353,232 | 553,807 | 593,951 | 601,241 | 559,813 | 511,055 | ||||||||||||||||||||||||||||||
| Operating expenses: | ||||||||||||||||||||||||||||||||||||||||
| Sales and marketing | 352,669 | 335,980 | 283,304 | 247,696 | 219,025 | 335,785 | 370,088 | 410,727 | 383,933 | 349,199 | ||||||||||||||||||||||||||||||
| Research and development | 69,287 | 64,143 | 55,134 | 47,356 | 39,936 | 110,020 | 92,647 | 91,030 | 79,558 | 66,936 | ||||||||||||||||||||||||||||||
| General and administrative | 78,848 | 78,063 | 67,106 | 50,119 | 40,619 | 92,130 | 100,946 | 90,709 | 88,929 | 81,199 | ||||||||||||||||||||||||||||||
| Net change in contingent consideration | (3,783 | ) | — | |||||||||||||||||||||||||||||||||||||
| Restructuring | 21,348 | 14,765 | — | — | — | |||||||||||||||||||||||||||||||||||
| Depreciation and amortization | 9,611 | 8,505 | 6,075 | 4,832 | 4,353 | 15,815 | 10,597 | 9,721 | 8,635 | 9,611 | ||||||||||||||||||||||||||||||
| Total operating expenses | 510,415 | 486,691 | 411,619 | 350,003 | 303,933 | 571,315 | 589,043 | 602,187 | 561,055 | 506,945 | ||||||||||||||||||||||||||||||
| Income from operations | 1,999 | 38,784 | 100,420 | 80,895 | 49,299 | |||||||||||||||||||||||||||||||||||
| Income (loss) from operations | (17,508 | ) | 4,908 | (946 | ) | (1,242 | ) | 4,110 | ||||||||||||||||||||||||||||||||
| Other income and expenses: | ||||||||||||||||||||||||||||||||||||||||
| Interest income | 4,962 | 5,519 | 2,228 | 1,163 | 862 | |||||||||||||||||||||||||||||||||||
| Interest expense | (933 | ) | (665 | ) | — | — | (57 | ) | — | — | (1,161 | ) | (957 | ) | (933 | ) | ||||||||||||||||||||||||
| Interest income | 862 | 773 | 890 | 1,059 | 750 | |||||||||||||||||||||||||||||||||||
| Equity in loss of affiliate | (83 | ) | — | — | — | — | — | — | (3,621 | ) | (958 | ) | (83 | ) | ||||||||||||||||||||||||||
| Income before income taxes | 1,845 | 38,892 | 101,310 | 81,954 | 49,992 | |||||||||||||||||||||||||||||||||||
| Income tax expense | 1,709 | 13,242 | 37,246 | 28,745 | 18,052 | |||||||||||||||||||||||||||||||||||
| Net income | $ | 136 | $ | 25,650 | $ | 64,064 | $ | 53,209 | $ | 31,940 | ||||||||||||||||||||||||||||||
| Net income per common share: | ||||||||||||||||||||||||||||||||||||||||
| Income (loss) before income taxes | (12,546 | ) | 10,427 | (3,500 | ) | (1,994 | ) | 3,956 | ||||||||||||||||||||||||||||||||
| Income tax expense (benefit) | (6,901 | ) | 6,866 | 58,400 | (1,486 | ) | 2,236 | |||||||||||||||||||||||||||||||||
| Net income (loss) | $ | (5,645 | ) | $ | 3,561 | $ | (61,900 | ) | $ | (508 | ) | $ | 1,720 | |||||||||||||||||||||||||||
| Net income (loss) per common share: | ||||||||||||||||||||||||||||||||||||||||
| Basic | $ | 0.00 | $ | 0.56 | $ | 1.36 | $ | 1.17 | $ | 0.72 | $ | (0.12 | ) | $ | 0.08 | $ | (1.37 | ) | $ | (0.01 | ) | $ | 0.04 | |||||||||||||||||
| Diluted | $ | 0.00 | $ | 0.54 | $ | 1.29 | $ | 1.10 | $ | 0.68 | $ | (0.12 | ) | $ | 0.07 | $ | (1.37 | ) | $ | (0.01 | ) | $ | 0.04 | |||||||||||||||||
| Weighted average shares used in computing per share amounts: | ||||||||||||||||||||||||||||||||||||||||
| Basic | 45,159 | 45,464 | 46,976 | 45,463 | 44,089 | 45,793 | 45,827 | 45,242 | 44,700 | 45,159 | ||||||||||||||||||||||||||||||
| Diluted | 46,489 | 47,222 | 49,642 | 48,330 | 47,201 | 45,793 | 47,601 | 45,242 | 44,700 | 46,489 | ||||||||||||||||||||||||||||||
Note: Commvault adopted Accounting Standards Codification ("ASC") Topic 606, Revenue from Contracts with Customers, in fiscal 2018 using the full retrospective method. As a result, all financial information in fiscal 2016 and fiscal 2017 were restated.
| Balance Sheet Data | As of March 31, | |||||||||||||||||||||||||||||||||||||||
| 2020 | 2019 | 2018 | 2017 | 2016 | ||||||||||||||||||||||||||||||||||||
| (In thousands) | ||||||||||||||||||||||||||||||||||||||||
| As of March 31, | ||||||||||||||||||||||||||||||||||||||||
| 2016 | 2015 | 2014 | 2013 | 2012 | ||||||||||||||||||||||||||||||||||||
| (In thousands) | ||||||||||||||||||||||||||||||||||||||||
| Balance Sheet Data: | ||||||||||||||||||||||||||||||||||||||||
| Cash and cash equivalents | $ | 288,107 | $ | 337,673 | $ | 457,733 | $ | 433,964 | $ | 297,088 | ||||||||||||||||||||||||||||||
| Cash, cash equivalents and restricted cash (1) | $ | 296,082 | $ | 327,992 | $ | 330,784 | $ | 329,491 | $ | 288,107 | ||||||||||||||||||||||||||||||
| Short-term investments | 99,072 | 49,936 | 24,976 | 1,948 | 3,146 | 43,645 | 130,338 | 131,637 | 120,693 | 99,072 | ||||||||||||||||||||||||||||||
| Working capital | 252,413 | 267,480 | 387,004 | 343,094 | 222,301 | 185,132 | 328,656 | 322,615 | 318,142 | 252,413 | ||||||||||||||||||||||||||||||
| Total assets | 714,573 | 713,466 | 755,384 | 604,854 | 432,688 | 845,076 | 822,453 | 818,642 | 829,878 | 714,573 | ||||||||||||||||||||||||||||||
| Deferred revenue | 244,866 | 229,735 | 209,575 | 184,270 | 147,373 | 326,220 | 337,696 | 325,774 | 279,902 | 244,866 | ||||||||||||||||||||||||||||||
| Total stockholders’ equity | 396,268 | 407,010 | 462,578 | 354,017 | 229,984 | |||||||||||||||||||||||||||||||||||