UNITED STATES SECURITIES AND EXCHANGE COMMISSION
Washington, D.C. 20549
FormFORM 10-K
☑ANNUAL REPORT PURSUANT TO SECTION 13 OR 15(d)
OF THE SECURITIES EXCHANGE ACT OF 1934
For the fiscal year ended March 31, 20162024
OR
☐TRANSITIONREPORT PURSUANT TO SECTION 13 OR 15(d) OF THE SECURITIES EXCHANGE ACT OF 1934
Commission File Number: 1-33026
Commvault Systems, Inc.
(Exact name of registrant as specified in its charter)
| | | | | | | | |
| Delaware | | 22-3447504 |
| | |
Delaware | | 22-3447504 |
(State or other jurisdiction of incorporation or organization) | | (I.R.S. Employer Identification No.) |
1 Commvault Way
Tinton Falls, New Jersey
| | 07724 |
(Address of principal executive offices) | | (Zip Code)
|
1 Commvault Way
Tinton Falls, New Jersey 07724
(Address of principal executive offices, including zip code)
(732) 870-4000
(Registrant’s telephone number, including area code)
Securities registered pursuant to Section 12(b) of the Act: None
| | | | | | | | |
| Title of each class | Trading Symbol(s) | Name of each exchange on which registered |
| Common Stock, $0.01 par value | CVLT | The Nasdaq Stock Market |
Securities registered pursuant to Section 12(g) of the Act:
| | |
| | |
Title of each class | | Name of each exchange on which registered |
Common Stock, $0.01 par value | | The NASDAQ Stock Market |
Indicate by check mark if the registrant is a well-known seasoned issuer, as defined in Rule 405 of the Securities Act. Yes þ No ¨
Indicate by check mark if the registrant is not required to file reports pursuant to Section 13 or Section 15(d) of the Act. Yes ¨ No þ
Indicate by check mark whether the registrant (1) has filed all reports required to be filed by the Section 13 or 15(d) of the Securities Exchange Act of 1934 during the preceding 12 months (or for such shorter period that the Registrantregistrant was required to file such reports), and (2) has been subject to such filing requirements for the past 90 days. Yes þ No ¨
Indicate by check mark whether the registrant has submitted electronically and posted on its corporate Web site, if any, every Interactive Data File required to be submitted and posted pursuant to Rule 405 of Regulation S-T (§232.405 of this chapter) during the preceding 12 months (or for such shorter period that the registrant was required to submit and post such files.)files). Yes þ No ¨
Indicate by check mark if disclosure of delinquent filers pursuant to Item 405 of Regulation S-K is not contained herein, and will not be contained, to the best of the registrant’s knowledge, in definitive proxy or information statements incorporated by reference in Part III of this Form 10-K or any amendment to this Form 10-K. þ
Indicate by check mark whether the registrant is a large accelerated filer, an accelerated filer, a non-accelerated filer, or a smaller reporting company, or an emerging growth company. See definitionthe definitions of “large accelerated filer,” “accelerated filer” andfiler,” “smaller reporting company” and “emerging growth company” in ruleRule 12b-2 of the Exchange Act.
| | | | | | | | | | | | | | | | | | | | | | | |
| | | |
Large accelerated filer | þ | Accelerated filero | ☐ | Non-accelerated filero | ☐ | Smaller reporting companyo | ☐ |
| Emerging growth company | ☐ | | | | | | |
If an emerging growth company, indicate by check mark if the registrant has elected not to use the extended transition period for complying with any new or revised financial accounting standards provided pursuant to Section 13(a) of the Exchange Act. ¨
Indicate by check mark whether the registrant has filed a report on and attestation to its management’s assessment of the effectiveness of its internal control over financial reporting under Section 404(b) of the Sarbanes-Oxley Act (15 U.S.C. 7262(b)) by the registered public accounting firm that prepared or issued its audit report. ☑
If securities are registered pursuant to Section 12(b) of the Act, indicate by check mark whether the financial statements of the registrant included in the filing reflect the correction of an error to previously issued financial statements. ¨
Indicate by check mark whether any of those error corrections are restatements that required a recovery analysis of incentive-based compensation received by any of the registrant’s executive officers during the relevant recovery period pursuant to §240.10D-1(b). ¨
Indicate by check mark whether the registrant is a shell company (as defined in Rule 12b-2 of the Exchange Act). Yes ¨☐ No þ
As of September 30, 2015,2023, the last business day of the Registrant’sregistrant’s most recently completed second fiscal quarter;quarter, the aggregate market value of voting and non-voting common stock held by non-affiliates of the registrant (based upon the closing price of the common stock as reported by The NASDAQNasdaq Stock Market) was approximately $1.4$2.9 billion.
As of April 29, 2016,May 9, 2024, there were 44,223,24443,401,217 shares of the registrant’s common stock ($0.01 par value) outstanding.
DOCUMENTS INCORPORATED BY REFERENCE
Information required by Part III (Items 10, 11, 12, 13 and 14) is incorporated by reference to portions of the registrant’s definitive Proxy Statement for its 20162024 Annual Meeting of Stockholders (the “Proxy Statement”), which is expected to be filed not later than 120 days after the registrant’s fiscal year ended March 31, 2016.2024. Except as expressly incorporated by reference, the Proxy Statement shall not be deemed to be part of this report on Form 10-K.
COMMVAULT SYSTEMS, INC.
FORM 10-K
FISCAL YEAR ENDED MARCH 31, 20162024
TABLE OF CONTENTS
| | | | | | | | |
| | Page |
| PART I | | |
| | Page |
| PART I | |
| Item 1. | | |
| Item 1A. | | |
| Item 1B. | | |
Item 2.1C. | | |
| Item 2. | | |
| Item 3. | | |
| Item 4. | | |
| PART II | |
| Item 5. | | |
| Item 6. | | |
| Item 7. | | |
| Item 7A. | | |
| Item 8. | | |
| Item 9. | | |
| Item 9A. | | |
| Item 9B. | | |
| Item 9C. | PART III | |
| PART III | |
| Item 10. | | |
| Item 11. | | |
| Item 12. | | |
| Item 13. | | |
| Item 14. | | |
| PART IV | |
| Item 15. | | |
| Item 16. | | |
| |
FORWARD-LOOKING STATEMENTS
The discussion throughout this Annual Report on Form 10-K contains forward-looking statements. In some cases, you can identify these statements by our use of forward-looking words such as “may,” “will,” “should,” “anticipate,” “estimate,” “expect,” “plan,” “believe,” “predict,” “potential,” “project,” “intend,” “could”“could,” “feel” or similar expressions. In particular, statements regarding our plans, strategies, prospects and expectations regarding our business are forward-looking statements within the meaning of Section 21E of the Securities Exchange Act of 1934, as amended (the "Exchange Act"). You should be aware that these statements and any other forward-looking statements in this document reflect only our expectations and are not guarantees of performance. These statements involve risks, uncertainties and assumptions. Many of these risks, uncertainties and assumptions are beyond our control and may cause actual results and performance to differ materially from our expectations. Important factors that could cause our actual results to be materially different from our expectations include the risks and uncertainties set forth under the heading “Risk Factors.” Accordingly, you should not place undue reliance on the forward-looking statements contained in this Annual Report on Form 10-K. These forward-looking statements speak only as of the date on which the statements were made. We undertake no obligation to update or revise publicly any forward-looking statements, whether as a result of new information, future events or otherwise, except as required by law.
References in this Annual Report on Form 10-K to "Commvault," the "Company", "we," "our" or "us" refer to Commvault Systems, Inc., including as the context requires, its direct and indirect subsidiaries.
PART I
Company Overview
Incorporated in Delaware in 1996, Commvault Systems, Inc. provides its customers with a scalable platform that enhances customers' cyber resiliency by protecting their data in a world of increasing threats. We provide these products and services for their data across many types of environments, including on-premises, hybrid and multi-cloud. Our offerings are delivered via self-managed software, software-as-a-service ("SaaS"), integrated appliances, or managed by partners. Customers use our Commvault Cloud platform to protect themselves from threats like ransomware and recover their data efficiently.
With Commvault Cloud, customers have access to business-critical capabilities such as layered defenses to detect and minimize the impact of bad actors; automation to verify clean recovery points; and cloud-native capabilities to dedupe, scale, and as necessary, recover business. We believe in solving hard problems for our customers by enabling them to protect their data in a difficult world. Our comprehensive solutions address the critical aspects of modern cyber resiliency, from data security to data recovery, data governance and compliance in a flexible and scalable platform.
Products
Commvault helps customers protect their data and be cyber resilient in a hybrid multi-cloud environment. Commvault delivers a portfolio of products and services to effectively secure, quickly capture intelligence, and rapidly recover from ransomware attacks or any other threats. Our solutions create an intuitive cyber resilience experience across customer-managed enterprise software and SaaS-delivered cloud native solutions that mitigate data sprawl, facilitate cloud adoption, and help customers modernize and transform their enterprise IT environment.
We do this by offering unified visibility and management across the entire hybrid enterprise so our customers can secure and recover data from any location to any location. Our Commvault Cloud offerings are organized in the following packages – Operational Recovery, Autonomous Recovery and Cyber Recovery.
Operational Recovery includes Commvault’s leading backup and recovery capabilities which can be utilized across hybrid enterprise workloads. It includes features like Zero Trust Architecture and immutable storage to ensure critical data is protected and recoverable. This solution can be delivered as customer-managed software, as SaaS, or a leading providermix of the two to meet the requirements of hybrid enterprises worldwide. It is designed to meet the needs of any size business protecting workloads across all locations, including hybrid environments such as on-premises and multiple cloud providers; physical servers; virtual machines (“VMs”); applications and databases; endpoint devices; and cloud applications. Operational Recovery provides backup, verifiable recovery, and cost-optimized cloud workload mobility, helping to ensure data availability and granular recovery, even across multiple clouds all managed with Commvault’s Command Center.
Autonomous Recovery aims to reduce recovery time, downtime, and costs by bringing automation and validation to Operational Recovery. Designed for automated disaster and cyber recovery use cases, Autonomous Recovery can deliver backup, replication, and disaster recovery for all workloads, on-premises, in the cloud, across multiple clouds, and in hybrid environments. It provides trusted recovery of data and information management software applications, VMs, and related services.containers, along with verifiable recoverability of replicas, cost-optimized cloud data mobility and resilience. Organizations can automatically failover applications to the secondary site in the event of a data incident and continue running without interruption.
Cyber Recovery offers the most comprehensive set of Commvault was incorporatedCloud capabilities. Building on Operational and Autonomous Recovery Solutions, Cyber Recovery adds data backup and data validation capabilities which help organizations scan for risks, remediate issues, identify compromises in 1996 as a Delaware corporation. The Commvault software platform is an enterprise level, integratedthe backup data, and information management solution, built from the ground up on a single platform and unified code base. All software functionality share the same back-end technologiesrecover clean data at scale. This includes threat scanning to deliver the benefits of a holistic approach to protecting, managing, and accessing data. The software addresses many aspects of data management in the enterprise, while providing scalability and control ofhunt for threats within backup data and information. Key featurescyber deception and threat detection to provide early warning of our software platform include:attacks. This enables organizations to minimize the impact of attacks and aims towards a fast recovery after a cyber incident.
Data protection solutions supporting all major operating systems, applications, and databases on virtual and physical servers, NAS shares, cloud-based infrastructures, and mobile devices;
Management through a single console; view, manage, and access all functions and all data and information across the enterprise;
Multiple protection methods including backup and archive, snapshot management, replication, and content indexing for eDiscovery;
Efficient storage management using deduplication for disk, tape and cloud;
Integration with the industry's top storage arrays to automate the creation of indexed, application-aware hardware snapshot copies across multi-vendor storage environments;
Complete virtual infrastructure management supporting multiple hypervisors, including VMware and Hyper-V;
Security capabilities to limit access to critical data, provide granular management capabilities, and provide single sign on access for Active Directory users;
Policy based data management, allowing users to manage data based on business needs and not physical location; and
An end-user experience that allows them to protect, find and recover their own data using common tools such as web browsers, Microsoft Outlook and File Explorer.
Commvault software enables our customers to simply and cost effectively protect and manage their enterprise data throughout its lifecycle, from the mobile worker to the remote office, to the data center, covering the leading operating systems, relational databases, virtualized environments and applications. In addition, to addressing today’s data and information management challenges, ourCommvault provides customers can realize lower capital costs through more efficient use of their enterprise-wide storage infrastructure assets. This includes the automated movement of data from higher cost to lower cost storage devices throughout its lifecycle, and through sharing and better utilization of storage resources across the enterprise. We can also provide our customers with reduced operating costs through a variety of methods,industry-leading offerings, including fast application deployment, reduced training time, lower cost of storage media consumables, proactive monitoringCleanroom Recovery, HyperScale X, Air Gap Protect and analysis, and lower administrative overhead. We also provide our customers withCompliance.
Commvault Cloud’s Cleanroom Recovery is a broad range of professional services that are delivered by our worldwide support and field operations.
Commvault software is built upon an innovative single platform architecture. We referresilience offering. Traditional isolated on-premises cleanrooms can be expensive to the single, unified code base underlying each of our applications as our Single Platform. Our Single Platform is unique and differentiates us from our competitors, some of whom address market needs by offering multiple and disparate point products that have come together as a collection often as a result of acquisition strategies. We believe that the disparate and point product approach forces users to installbuild and maintain, separate products requiring their own infrastructure, training, maintenance and management which can result in a complex and costly environment for customers who are looking for a single solution that will improve operations, minimizeincident response plans often go untested, increasing an
organization’s risk and reduce overall costs.
We have establishedrecovery time objectives. Our Cleanroom Recovery solution empowers organizations to be ready to recover by providing a worldwide, multi-channel distribution network to sell our softwareclean, isolated, and services to large global enterprises, small and medium sized businesses and government agencies, both directly through our sales force and indirectly through our global network of value-added reseller partners, systems integrators, corporate resellers and original equipment manufacturers. As of March 31, 2016, we had licensed our data and information management software to over 22,500 registered customers.
Our internet address is www.commvault.com. On this website, we poston-demand recovery location in the following filingscloud, as soonwell as reasonably practicable after they are electronically filed with or furnished to the U.S. Securities and Exchange Commission (SEC): our Annual Reports on Form 10-K, our quarterly reports on Form 10-Q, our current reports on Form 8-K, our proxy statements related to our annual stockholders’ meetings and any amendment to those reports or statements filed or furnished pursuant to Section 13(a) or 15(d) of the Securities Exchange Act of 1934, as amended. All such filings are available on the Investors Relations portion of our web site free of charge. The contents of our web site are not incorporated by reference into this Form 10-K or in any other report, statement or document we file with the SEC.
Industry Background
The driving force behind the growth of the data and information management software industry is the rapid growth of data, coupled with the need to reliably protect and quickly access that data, while maintaining the ability to effectively manage the emerging regulations around complianceregularly and e-discovery.proactively test their response plans and recover quickly.
DataCommvault HyperScale X is widely consideredan intuitive, easy-to-deploy and scale-out, integrated data protection solution to be one of an organization’s most valued and strategic assets. The increasing reliance on critical enterprise software applications such as e-mail, relational databases, enterprise resource planning, customer relationship management and workgroup collaboration tools is resulting in the rapid growth of data across all enterprises. Government regulations, such as those issued under the Sarbanes-Oxley Act, the Health Insurance Portability and Accountability Act ("HIPAA"), Government Paper Elimination Act ("GPEA"), Homeland Security, the Patriot Act, Freedom of Information Act ("FOIA"), the Basel Committee on Banking Supervision ("The Basel Accords"), the Dodd-Frank Wall Street Reform and Consumer Protection Act, as well as company policies requiring data access, protection and preservation, are expanding the proportion of data that must be archived and easily accessible for future use. In addition, ensuring the security, availability and integrity of the data has become a critical task as regulatory compliance and corporate governance objectives affecting many organizations mandate the creation of multiple copies of data with longer and more complex retention requirements.
In addition to rapid data growth, data storage has transitionedhelp enterprises transition from being server-attached to becoming widely distributed across local and global networked storage systems. Data previously stored on primary disk and backed up on tape is increasingly being backed up, managed and stored on a broader array of storage tiers ranging from high-cost, high-performance disk systems, to lower-cost mid-range and low-end disk systems, to tape libraries and both public and private cloud storage services. This transition has been driven by the growth of data, the pervasive use of distributed critical enterprise software applications, the decrease in disk cost, and the demand for 24/7 business continuity.
The recent innovations in storage and networking technologies, coupled with the rapid growth of data, have caused information technology managers to redesign their data and storagelegacy scale-up infrastructures to deliver greater efficiency, broaden accessthe hybrid cloud, container and virtualized environments. Its flexible architecture allows customers to get up, run quickly and scale while delivering comprehensive data protection for all workloads, including containers, VMs and reduce costs. The result has beendatabases, from a single, extensible platform. With HyperScale X, customers can leverage the wide adoption of virtualized environments with larger and more complex networked data and storage solutions. We also believe cloud computing, in its various forms, represents a long term industry trend in the way that applications are delivered, data is stored and information is retrieved.
The rapid growth of data and the need to securely protect, manage and access this data is driving substantial opportunities for managed service providers ("MSPs") to help organizations deploy and manage solutions that deliver data management capabilities. The result is reduced long-term management costs with increased offerings to customers, which we believe represents a long-term industry trend in the way that services are offered.
We believe that these trends are increasing the demand for software applications that can simplify data and information management, provide secure and reliableentire Commvault portfolio, giving them access to all data across a broad spectrum of tiered storagethe features, functions, and computingindustry-leading integration with applications, databases, public cloud environments, hypervisors, operating systems, NAS systems, and seamlessly scale to accommodate growth, while reducingprimary storage arrays, wherever the total cost of ownership to the customer.
Our Software
Our software licenses typically provide fordata resides. It is available as a perpetual right to use our software and are sold on a per terabyte capacity basis, per-copy, as site licensesfully integrated appliance or as a solution set. In recent years,reference architecture depending on an organization’s requirements.
Commvault Cloud Air Gap Protect is the vast majority of our software revenue has been sold on a capacity basis“easy button” to adopt secure and we expect this to remain truescalable cloud storage in the near future. Software licenses sold on a capacity basis provide the customer with unlimited licenses of specified software products based on a defined level of terabytes of data under management. As a result, when we sell our platform through a capacity license, certain of the various functionalities discussed below are bundled into one capacity based price. Site licenses give the customer the additional right to deploy the software on a limited basis during a specified term.
Our solution sets are generally sold on a per unit basis such as per virtual machine for our virtual machine backup, recovery and cloud management solution set; per mailbox for our email archive solution set, and per user for our endpoint data protection solution set. These Solution Sets are purpose-built offerings designed to accelerate private, public andminutes, supporting an organization's hybrid cloud adoption that seamlessly integrate with our single platform software, offering a path towards holistic data management while allowing customers to utilize functionality that addresses the point solution requirements their business dictates. We primarily sell Solution Sets for virtual machine backup, recovery and cloud management; endpoint data protection; and email archive.
Historically, an insignificant amount of our revenue has been sold under subscription, or term based, license arrangements. In these arrangements the customer has the right to use the software over a designated period of time. Revenue in these arrangements is recognized ratably over the term of the agreement. Over the next several years we expect revenue from these types of arrangements to become a more significant portion of our total revenue.
Commvault Software Solutions
The Commvault software suite contains solutions that are all built on a single unified code base and platform to protect, manage and access data and information. Within the platform, tightly integrated, powerful software features deliver functionality throughout physical and virtual environments to help protect and recover data, manage costs and complexity and gain better insight into information. Our primary software solutions are Data Protection, Backup and Recovery; Cloud and Infrastructure Management; and Retention and Compliance.
Data Protection, Backup and Recovery
Our Data Protection, Backup and Recovery software solutions provide enterprise-level backup and recovery from a single, centralized management console. It covers the full range of data sources, file types, storage media and backup modes - from snapshots to streaming. Our integrated, automated data protection approach provides a single, complete view of all stored data no matter where if it is on premise or in the cloud. Our software solution allows for the backup of databases, files, applications, endpoints and virtual machines (VMs) with maximum efficiency according to data type and recovery profile. It also helps to optimize storage with deduplication, recover data rapidly and easily and leverage reports to continually improve backup and recovery processes.
Virtual Machines (VMs) and Cloud Platforms
Our software solution for VM backup, recovery and cloud management delivers a number of benefits such as: VM recovery with live recovery options; backup to and in the cloud; custom-fit data protection for SLAs; broad hardware snapshot management; and workload portability across physical, virtual and cloud platforms. We offer a cloud management solution across multiple VM and cloud platforms, including Amazon Web Services (AWS), Microsoft Azure and VMware.
Databases
We provide a simple way to protect and recover business-critical databases through automatic discovery, push-button recovery, intuitive deduplication, cloning/replication, and by hardware snapshots through built-in application integration. We believe we eliminatestrategy without the need for multiple, costly backup toolsadditional cloud expertise. It is an integrated, air-gapped cloud storage target that enables IT organizations to efficiently adopt cloud storage for Operational Recovery, HyperScale X or SaaS to ease digital transformation, save costs, reduce risk and complex scripting, while improving database performance. Our objective isscale. This minimizes IT complexities and allows customers to accelerate recoveryeasily store, isolate, and shrink backup windows,secure data while providing granular, table-level recovery.the foundation for predictable costs and reduced overhead.
EmailCommvault's Compliance is an add-on product that facilitates efficient compliance and Enterprise Applicationsaids in ensuring relevant legal data remains unaltered. It provides built-in reporting, auditing, and logging to help ensure data is not modified or deleted for legal and compliance purposes. It reduces the time and costs spent between IT and legal departments to expedite discovery and review.
Email along with enterprise applications are critical to a business. We believe a significant portion of business-critical information is stored in email so reliable backup and recovery is essential.
Professional & Customer Support Services
Commvault Data Protection, Backup and Recovery gives users self-service access to search and restore messages without IT intervention. Our solution provides an enterprise a single solution to backup, restore and archive their important messaging applications. In addition, we provide our customers the ability to protectoffers a wide range of applications, such as SharePoint, Exchange, Outlook, Office 365,professional and SAP enterprise software solutions.
File Protection and Recovery
Our software solution brings unstructured data into management. Our File Protection and Recovery solution make it easy to find, recover and restore lost or damaged files at any level of granularity, from single files to whole file systems. In addition, business files stored in third-party file sharing applications can be protected in a secure, searchable and centralized virtual repository. Our integrated snapshot management indexes snapshots to make them searchable, making file recovery an easy process.
Endpoint Data Protection
Our Endpoint Data Protection solution enables data created and stored on laptops and desktops to be accessible anytime with a self-service recovery portal accessible from any web browser or mobile device. Our solution covers endpoint data on laptops, desktops and other devices with source-side deduplication, opportunistic scheduling and bandwidth throttling.
Source-side Deduplication
Our software solutions integrate deduplication functionality directly into our software for a backup and recovery approach that is scalable and cost effective. Source-side deduplication can boost backup speeds while decreasing storage and network resource consumption whether protecting data in private or public clouds, remote office servers, laptops or critical applications in the data center.
Cloud and Infrastructure Management
Our Cloud and Infrastructure Management software solutions provide an efficient way to manage storage hardware and virtual infrastructure as data volumes grow and more applications move to the cloud.
VM and Cloud Management
Our holistic approach to cloud management allows companies to manage a virtual infrastructure across multiple hypervisors and cloud platforms. Our VM and Cloud Management solution can streamline operations over the entire VM lifecycle, from provisioning to protection to decommissioning. With our software solution, companies can manage VMware, Microsoft Hyper-V, Amazon Web Services EC2 and Microsoft Azure hypervisors through a single solution to get the most out of all their technologies.
Snapshot Management
Our software solutions can simplify snapshot management with a single console for many hardware storage vendors. Our built-in reporting and alerting lets users perform more detailed utilization and capacity planning for hardware snapshots. With our Snapshot Management software solution, hardware snapshots can be managed across a wide selection of vendors such as DataCore, Dell, EMC, Fujitsu, Hewlett Packard, Hitachi Data Systems, Huawei, IBM, INFINIDAT, NetApp, Nimble Storage, Nutanix, Oracle ZFS and Pure Storage. Our underlying IntelliSnap™ technology provides the multi-vendor flexibility.
Workflow Automation
Our software solutions automate repetitive or highly complex data management tasks by combining individual process sets in a specific order or decision tree. Configuring our software to meet company specific IT needs can be achieved whether using our pre-built workflows or design or a company’s own with our graphical user interface.
Retention and Compliance
Our single virtual content repository makes it easier to index, archive and search managed data using our Retention and Compliance software solutions.
Content Based Retention
Our Content Based Retention solution provides for user-defined retention policies to automatically organize, classify and store information based on relevant and usable criteria, such as file name, type, content, tags and keywords which can reduce complexity and risk of storing massive volumes of data.
Enterprise Search and E-Discovery
Our Enterprise Search and E-Discovery solution allows users to find information needed to satisfy internal search requirements or respond to external eDiscovery requests. We believe our software solution can minimize risk and exposure by providing a single, integrated platform for enterprise search and eDiscovery across the full range of devices, apps and file types.
Email Archiving
Our single, unified data management platform supports detailed archiving policies for email environments, including cloud email solutions like Microsoft Office 365. Users can classify data by application and automate email data management, even as volumes continue to grow. We also streamline eDiscovery across data silos, making email data accessible via a single, comprehensive platform.
Data Loss Prevention
Our software solutions include a number of built-in endpoint data protection and security features to help prevent unauthorized access and, if necessary, quickly restore files or applications to a new device. We believe our comprehensive approach to data loss prevention makes it easy to minimize compliance and litigation risks associated with losing critical business data.
Secure File Sharing
Our enterprise file-sharing capabilities allow for anytime access to data through a private cloud that is more secure than email or consumer file-sharing services. End-users can collaborate and still remain compliant with data-governance requirements while reducing the risk of exposing sensitive corporate data to unauthorized access.
Services
A comprehensive global offering of customer support and other professional services is critical to the successful marketing, sale and deployment of our software. From planning, to deployment, to operations, we offer a complete set of technical services, training and support options that maximize the operational benefits of our suite of software applications. Our commitment to superior customer support is reflected in the breadth and depth of our service offerings as well as in our ongoing initiatives to engineer resiliency, automation and serviceability features directly into our products.
We have established a global customer support organization built specifically to handle our expanding customer base.complement its product portfolio. We offer multiple levels of customer supportservice that can be tailored to the customer’s response needs and business sensitivities. our customers’ needs.
Our customer support services consist of:
•Real-Time Support. OurCustomers have 24/7 access to support with our support staff is available 24/7 by telephonephone for first responses and to provide first response and manage the resolution of customer issues. In addition to phone support, ourresolutions. Our customers also have access to an online product support database for help with troubleshooting and operational questions. Innovative use of web-based diagnostic tools provides problem analysis and resolution. Our software design is also an important element in our comprehensive customer support including “root cause”includes “summary of findings” problem analysis, intelligent alerting and troubleshooting assistance. Our software is directly linked to our online support database allowing customers to analyze problems without engaging our technical support personnel.
Significant Network and Hardware•Broad Expertise. Our support engineers have extensive knowledge of complex applications, servers and networks. We proactively take ownership of the customer’s problem, regardless of whether the issue is directly related to our products or to those of another vendor.problem. We have also developed and maintain a knowledge library of storage systems and software products to further enable our support organization to quickly and effectively resolve customer problems.
•Global Operations. Our We offer our global customer support headquarters is located at our state-of-the-art technical support center in Tinton Falls, New Jersey. We also have established support operations in Reading, United Kingdom; Sydney, Australia; and Shanghai, China,from physical locations around the world, which are complemented by regional support centers in other worldwide locations.allows us to provide 24/7 support. Our cloud-based support system creates a virtual global support center combining these locations to allow for the fastest possible resolution times for customer incidents. We have designed our support infrastructure to be able to scale with the increasing globalization of our customers.
Enhanced Support•Customer Success Options. We offer severalvarious enhanced customer support services such asCustomer Success options, including Enterprise Support.Success Program ("ESP") offerings, to our software and SaaS customers. Our Enterprise Support service is forCustomer Success offerings provide resources focused on proactively helping our customers with critical support needsachieve their goals and builds on our 24/7 real-time support deliverablesare aligned to their business initiatives. Our ESP provides additional industry technical experts who provide strategic guidance and includes various levels of enhanced servicesadvice to ensure dedicated supportour enterprise customers achieve their cyber resiliency objectives. The entire Customer Success program is centered around driving customer adoption, customer satisfaction and customized reporting. Enterprise Support adds a specialized team of technical support engineers, an assigned support account manager and innovative toolsquick time to achieve our customers’ mission.value.
•Technology Consulting Services.Our technologytechnical consultants ensure that our customers softwarecustomers’ data protection environment is designed for optimal results, configured quickly, and will continueis easy to deliver over the long term. This same team of experts can install, configure, personalize and validate that environment so customers can achieve a better return on investment, faster and with more confidence
Technology Consulting Services. Our technology consulting ensure that a customer’s software environment is designed for optimal results and will continue to deliver over the long term.maintain. We offer services such as architecture design; implementation; personalization;automation and orchestration; data migration; and health assessment.assessment services. In addition, our residency serviceswe offer customers staff-augmentation options via resident support engineers to assist with the rapid expert deployment and operation of the Commvault software suite.
portfolio.Business Consulting•Recovery Services. Our Commvault Readiness Solutions provide the resources and expertise to quickly accelerate returning to normal business consultants provide transformational insights that align to how specific businesses gather, retainoperations through the proper design, implementation, administration, and employ data. support of our customers' data protection and cyber resilience environment.
•Education Services. We offer services such as disaster recovery readinesstraining content for learners at all levels, with basic, intermediate, and policy implementation; private cloud services design; data classification and archive policy implementation; and operational efficiency assessment.
Education Services. expert certifications available. We also provide global onsite training, offsite training anda selection of self-paced online alternativescontent for our products. Packagedproducts in our On-Demand Learning Library.
•Remote Managed Services. Commvault Remote Managed Services provide results-oriented data protection and cyber resilience to customers worldwide. Commvault experts provide secure, reliable, and cost-effective remote monitoring and management of our customers' data protection environment.
Customers
Our current customer base spans thousands of organizations across a variety of sizes, including large global enterprise companies, and small or customized customer training courses are availablemid-sized businesses and government agencies. We support customers in instructor-led or computer-based formats. We offer in-depth traininga range of industries, including banking, insurance and certification for our resellers in pre-financial services, government, healthcare, pharmaceuticals and post-sales support methodologies, including web access to customizable documentationmedical services, technology, legal, manufacturing, utilities and training materials. In addition, we offer a Commvault Certification Program that validates expertise and advanced knowledge in topics, including Commvault Core Fundamentals, Implementation and Maintenance. We also offer more advanced Specialist, Engineer and Master technologies. We believe certified personnel can increase a company's productivity and reduce operating costs.energy.
Strategic Relationships
An important element of Commvault’s strategy is to establish relationships with third partiespartnerships that assist us in developing,support development, marketing, selling and implementingimplementation of our software and services.solutions. We believe that strategic and technology-based relationships with industry leaders are fundamental to our success. We have forged numerous relationships with software, applicationhardware, cloud and hardware vendorscybersecurity partners to enhance our combined capabilities and to create the optimal combination of data and information management applications. ThisWe believe this approach enhances our ability to expand our product offerings and customer base and to enter new markets. We have established the following types of strategic relationships:
Alliance and Technology Alliance Partners. We maintain strategic productsales, marketing and technology relationships with major industry leaders to ensure that our software applicationsproducts are integrated with, supported by and add value to our partners’ hardware and software products.portfolios. Collaboration with these market leaders allows us to provide applicationssolutions that enable our customers to improve data and information management efficiency. Our significant strategic relationships include Bull, Cisco, Citrix, Fujitsu, HP, Microsoft, Oracle, SAP, and VMware. In addition to these relationships, weWe also maintain relationships with a broad range of industry operating system, application and infrastructure vendors to verify and demonstrate the interoperability of our software applicationsportfolio with their equipment and technologies. We believe these partnerships enhance our position in the market and serve as an accelerator to sales.
Distributors, Value-Added Reseller, Systems Integrator, Corporate Reseller and Original Equipment Manufacturer Relationships. Our corporate resellers These partners either bundle or sell our software applicationssolutions together with their own products and our value-added resellersor resell our software applicationssolutions independently. As of March 31, 2016, we had more than 500 reseller partners and systems integrators that have distributed our software worldwide.
In order toTo broaden our market coverage, we work closely with our Global Original Equipment Manufacturerglobal original equipment manufacturer ("OEM") Partners,partners, investing significant time and resources to deliver unique, joint solutions incorporating Commvault software.solutions. These partners team with our technical, engineering, marketing and sales force on helping to enhance integration, tuning, operational management, implementation and vision for solutions that are designed to meet current and future data protection and information managementcyber resilience needs. Our alliance managers work directly with Globalglobal OEM Partnerspartners to design, deliver and support field activities that make it easier for customers to locate, learn about, and purchase these differentiated solutions. Our most significant OEM partner is Hitachi Data Systems. Hitachi Data Systems has no obligation to recommend or offer our software applications exclusively or at all, and they have no minimum sales requirements and can terminate our relationship at any time. Sales through our original equipment manufacturer agreements, accounted for 15% of our total revenues in fiscal 2016 and in fiscal 2015.
Additionally, we have a non-exclusive distribution agreements covering our North American commercial markets and our U.S. Federal Government marketsagreement with Arrow Enterprise Computing Solutions, Inc. (“Arrow”("Arrow"), a subsidiary of Arrow Electronics, Inc., and Avnet Technology Solutions (“Avnet”), a subsidiary of Avent Inc. Pursuant to these distribution agreements, these distributors' Arrow's primary role is to enable a more efficient and effective distribution channel for our products and services by managing our reseller partners and leveraging their own industry experience. Sales generated through our distribution agreement with Arrow accounted for approximately 38%36% of our total revenue in fiscal 20162024 and 36%37% in fiscal 2015.2023.
Service Provider Partners. Our software issolutions are the data protectioncyber resilience platform for over 200many service providers, which provide cloud-based solutions to client systemscustomers worldwide.As companies of all sizes and markets rapidly adopt cloud infrastructures for improved costs,cost efficiencies, speed and agility, we remain committed to these strategic relationships to address this growing trend. Customers looking to move IT operations intoto the cloud depend on service providers to help them migrate, manage and protect their data and cloud infrastructures. We have partneredpartner with a broad ecosystem of managed service providerproviders and cloud partners so they canto effectively deliver data management-as-a-serviceprotection-as-a-service solutions based on Commvault softwaresolutions across geographies, vertical markets and offerings. Leading providers who have integrated Commvault software into their cloud solution portfolios
Marketplace. During fiscal year 2024, we began selling our solutions via marketplace offerings which enable customers to purchase our solutions through online platforms, such as Microsoft, AWS or Google. The marketplace allows us to publish an offer which an end user can then purchase directly, or through the assistance of a partner.
Competition
The data protection and cyber resilience market is intensely competitive and highly fragmented. The principal competitive factors in our industry include Microsoft Windows Azure, Amazon S3, Glacier, NetApp,product functionality, performance, integration, platform coverage, scalability, price, global sales infrastructure, technical support, branding and Rackspace. reputation. The ability of major system vendors to bundle solutions is also a significant competitive factor in our industry.
Customers
We sell CommvaultOur primary competitors in the data protection software applications market, each of which has one or more products that compete with a part of or our entire product suite, include Avepoint, Cohesity, Dell-EMC, Druva, IBM, Rubrik, Veeam, and related services directly to large global enterprises, small and medium sized businesses and government agencies, and indirectly through value-added resellers, systems integrators, corporate resellers and original equipment manufacturer partners. As of March 31, 2016, we had licensed our software applications to over 22,500 registered customers in a broad range of industries, including banking, insurance and financial services, government, healthcare, pharmaceuticals and medical services, technology, legal, manufacturing, utilities and energy.Veritas.
Technology
We believe our Single Platform serves as a major differentiator versus our competitors’ data and information management software products. Our Single Platform’s unique indexing, cataloging, data movement, media management and policy technologies are the source of the performance, scale, management, cost of ownership benefits and seamless interoperability inherent in allSome of our datacompetitors have greater financial resources and information management software applications. Additional options enable content search, data encryption and auditing features to support data discovery and compliance requirements. Each of these solutions share a common architecture consisting of three core components: intelligent agent software, data movement software and command and control software. These components may be installed on a single host server, or each may be distributed over many servers in a global network. Additionally,have the modularity of our software provides deployment flexibility. The ability to share storageoffer their products at lower prices than ours. In addition, some have greater name recognition, longer operating histories, substantially larger technical, sales, marketing and other global resources, across multiple data and information management applications provides easier datalarger installed customer base with broader product offerings. As a result, these competitors can devote greater resources to the development, promotion, sale and information management and lower total costsupport of ownership. We participate in industry standards groups and activities thattheir products than we believe will have a direct bearing on the data and information management software market.can. Refer to our "Risk Factors" below.
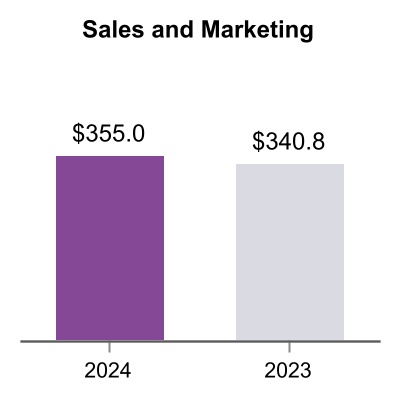
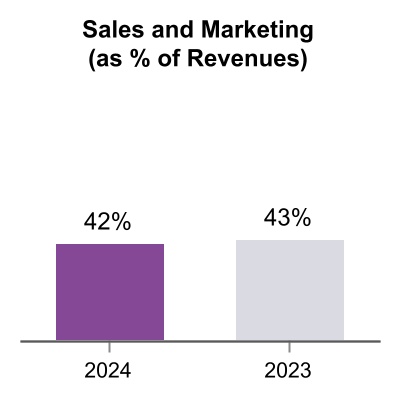
Sales and Marketing
We sell our data and information management software applications and related servicescyber resilience solutions to large global enterprises, small and medium sized businesses of all sizes and government agencies. We sell through our worldwideglobal direct sales force and our global network of distributors, value-added resellers, systems integrators, corporate resellers and original equipment manufacturer partners. As of March 31, 2016, we had 775 employees in sales and marketing. These employees are primarily located in North America, Europe, Australia and Asia.partner channels.
We have a variety of marketing programs designed to create brand awareness and market recognition for our product offerings and for sales lead generation. Our marketing efforts include sales campaigns, webinars, active participation at trade shows, technical conferences and technology seminars; advertising; content development and distribution; public relations; social media; industry analyst relations; publication of technical and educational articles in industry journals; sales training; and preparation of competitive analyses. In addition, our strategic partners augment our marketing and sales campaigns through seminars, trade shows, and joint public relations and advertising campaigns. Our customers and strategic partners provide references and recommendations that we often feature in external marketing activities.
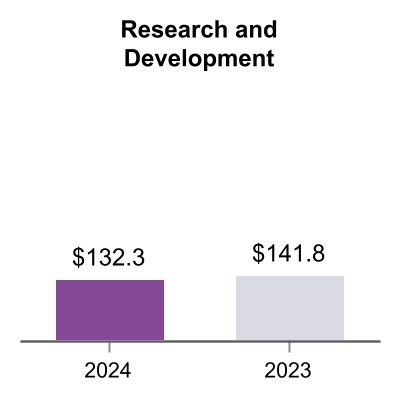
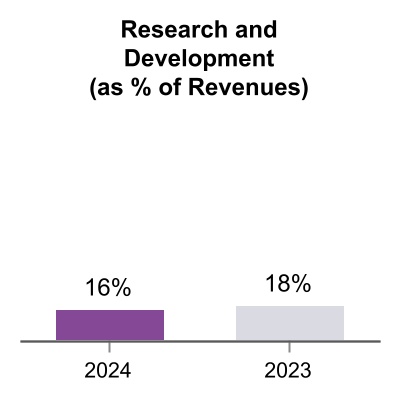
Research and Development
Our research and development organization is responsible for the design, development, testing and certification of our datacyber resilience platform and information management software applications. As of March 31, 2016, we had 526 employees in our research and development group, of which 169 are located in our Hyderabad and Bangalore development centers in India.solutions. Our engineering efforts support product development across all major operating systems, databases, applications, hyperscalers and network storage devices. A substantial amount of our development effort goes into certification, integration and support of our applicationssolutions to ensure interoperability with our strategic partners’ hardware and software products.solutions. We have also made substantial investments in the automation of our product test and quality assurance laboratories. We spent $69.3 million on research and development activities in fiscal 2016, $64.1 million in fiscal 2015 and $55.1 million in fiscal 2014.
Competition
The data storage management market is intensely competitive, highly fragmented and characterized by rapidly changing technology and evolving standards. We currently compete with other providers of data and information management software as well as large storage hardware manufacturers that have developed or acquired their own data and information management software products. These manufacturers have the resources and capabilities to develop their own data and information management software applications, and many have been making acquisitions and broadening their efforts to include broader data and information management and storage products. These manufacturers and/or our other current and potential competitors may establish cooperative relationships among themselves or with third parties, creating new competitors or alliances. Large operating system and application vendors have introduced products or functionality that includes some of the same functions offered by our software applications. In the future, further development by these vendors could cause some features of our software applications to become redundant.
The following are our primary competitors in the data and information management software applications market, each of which has one or more products that compete with a part of or our entire software suite:
EMC
IBM
Veritas
Veeam
The principal competitive factors in our industry include product functionality, product performance, product integration, platform coverage, ability to scale, price, worldwide sales infrastructure, global technical support, name recognition and reputation. The ability of major system vendors to bundle hardware and software solutions is also a significant competitive factor in our industry. Although some of our competitors have greater resources, a larger installed customer base and greater name recognition, we believe we compete favorably on the basis of these competitive factors.
Our unique product architecture is one of the primary reasons why we compete so successfully. Whereas other competitive solutions in the market are based on multiple, disparate products, our modular offering is based on a single, unified, underlying code base resulting in favorable efficiencies in functionality, integration, scalability and support. Our focused approach to data and information management and our ability to respond to customer feedback also drives the functionality and features of our products, which we believe lead the industry in terms of performance and usability, as evidenced by numerous industry awards we have received.
From a customer perspective, highly integrated products such as ours, which are based on a single, unified, underlying code base, are easier and less expensive to deploy, operate and manage. This flexibility, in turn, makes it significantly easier to scale our products over a customer’s entire IT environment. Supporting and enhancing our products is made more efficient due to this single, unified, underlying code base, unlike our competitors who are required to support and enhance multiple, disparate products, most of which are based on differing underlying software code. Supporting multiple, disparate products places more onerous and costly demands on our competitors’ internal human and operational capital. We believe that Commvault software, because of its unique architecture, creates a compelling functional, integration, scalability and support advantage. We continue to expand our worldwide sales infrastructure and increase our distribution throughout the Americas, Europe, Middle East, Africa, Australia and Asia to meet the needs of our business.
Some of our competitors have greater financial resources and may have the ability to offer their products at lower prices than ours. In addition, some of our competitors have greater name recognition than us, which could provide them a competitive advantage with some customers. Some of our competitors also have longer operating histories, have substantially greater technical, sales, marketing and other global resources than we do, as well as a larger installed customer base and broader product offerings, including hardware. As a result, these competitors can devote greater resources to the development, promotion, sale and support of their products than we can.
Technology, Intellectual Property and Proprietary Rights
We believe our solutions are a major differentiator versus our competitors’ portfolios. Our Commvault Cloud platform powered by Metallic AI aims to deliver the highest security, most intelligence, and fastest recovery across on-premises, hybrid and multi-cloud environments. Our solutions’ unique features drive the performance, scale, TCO benefits and interoperability of our offerings. Such features include encryption, indexing and immutable recovery. Additional options enable content search and auditing features to support data discovery and compliance.
Our success and ability to compete depend on our continued development and protection of our proprietary software and other technologies.solutions. We rely primarily on a combination of trade secret, patent, copyright and trademark laws, as well as contractual provisions, to establish and protect our intellectual property rights.
We providepatent our softwaretechnical infrastructure and key usability and design concepts. Our software’s unique capabilities are covered by a robust portfolio of patents worldwide. Areas such as cyber resilience, data protection, security, transformation, insights, and compliance and governance, including our SaaS and HyperScale X solutions, are core to customers pursuantour competitive advantage. More than 1,400 patents have been issued to license agreements that impose certain restrictions on use. These license agreements are primarily in the form of shrink-wrap or click-wrap licenses, which are not negotiated with or signed by our end-user customers. These measures may afford only limited protectionCommvault globally as a result of our strategic patenting. We also have established proprietary trademark rights in markets across the globe, and Commvault owns over 150 worldwide trademark registrations and pending registration applications. Refer to our “Risk Factors” below.
Government Regulations
The global legal environment of technology businesses is evolving rapidly and is often unclear. These topics include data privacy and security, pricing, advertising, taxation, economic sanctions, content regulation and intellectual property ownership and proprietary rights associated with our software. infringement.
We also enter into confidentiality agreements with employeesare subject to several local, state, federal and consultants involved in product development. We routinely require our employees, customersforeign laws and potential business partners to enter into confidentiality agreements before we disclose any sensitive aspectsregulations regarding privacy and data protection. Regulators around the world have adopted or proposed limitations on, or requirements regarding, the collection, distribution, use, security and storage of our software, technology or business plans.
As of March 31, 2016, we had 428 issued patents and 266 pending patent applications in the United States, as well as 89 issued patents in foreign countries and 31 pending foreign patent applications. No single patent, copyright, trademark, license,personal information, payment card information or other intellectual property right is solely responsible for protecting our products or services. Moreover, we may lack adequate patent or other intellectual property protection for certain innovations that later turn out to be important to our business. Pending patent applications may receive unfavorable examinationconfidential information of individuals, and are not guaranteed allowance as issued patents. We may elect to abandon or otherwise not pursue prosecution of certain pending patent applications due to patent examination results, economic considerations, strategic concerns or other factors. We will continue to assess appropriate occasions to seek patent and other intellectual property protection for innovative aspects of our technology that we believe provide us a significant competitive advantage.
Changes to patent laws or regulations in the U.S. Federal Trade Commission and other foreign jurisdictions,many state attorneys general are applying federal and state consumer protection laws to impose standards on the online collection, use and dissemination of data. In the event of a security breach, these laws may subject us to incident response, notice and remediation costs. Failure to safeguard data adequately or new interpretationsto destroy data securely could subject us to regulatory investigations or enforcement actions under applicable data security, unfair practices or consumer protection laws. The scope and interpretation of these laws could change, and regulations,the associated burdens and our compliance costs could also diminish the value of our patents and patent applications or narrow the scope of our patent protection. For example, changes in patent laws and regulations in the U.S. and new patent laws in Europe may affect the ability of companies, including Commvault, to protect innovations, bring patent infringement claims, and defend against claims of patent infringement. The costs of compliance with these laws and regulations are high and are likely to increase in the future.
DespiteWe are also subject to global laws and regulations that govern or restrict our efforts to protect our trade secretsbusiness and proprietary rights through patentsactivities in certain countries and licensewith certain persons, including the U.S. Commerce Department’s Export Administration Regulations and confidentiality agreements, unauthorized parties may still attempt to copy or otherwise obtain and use our software and technology. In addition, we intend to expand our international operations but effective patent, copyright, trademarkeconomic and trade secret protection may not be available or may be limitedsanctions regulations maintained by OFAC, as well as anti-bribery and anti-corruption laws and regulations, including the FCPA and the U.K. Bribery Act.
People
Commvault aims to unlock potential in foreign countries. If we fail to protect our intellectual property and other proprietary rights, our business could be negatively impacted.
We currently resell certain software from Microsoft, including Microsoft SQL Server, used in conjunction with our software applications pursuant to an independent software vendor royalty license and distribution agreement that we have and plan to continue renewing annually. We have entered into and may enter into agreements with additional third parties to license their technology for use with our software applications.
Some of the products or technologies acquired, licensed or developed by us may incorporate so-called “open source” software and we may incorporate open source software into other products in the future. The use of such open source software may ultimately subject some products to unintended conditions, such as royalty-free licensing of proprietary portions of our products, disclosing proprietary parts of our source code, or commencing costly product redesigns that could result in a loss of intellectual property rights, product performance degradation, or a delay in shipping products todata, customers and which may negatively affect our business, financial condition, operating results, cash flowemployees. To accomplish that, our employees are empowered to drive innovation and abilityhelp our customers—by inspiring one another and working to commercialize our productsmake what’s already great, even greater—whether that’s product, process or technologies.
From time to time, we are participants or members of various industry standard-setting organizations or other industry technical organizations. Our participation or membership in such organizations may, in some circumstances, require us to enter into royalty or licensing agreements with third parties regarding our intellectual property under terms established by those organizations, which we may find unfavorable.
In the United States, we own federal registrations for or have common law trademark rights in the following marks: Commvault, the “C hexagon” logo & Commvault, the “CV” Logo & Commvault, the “C hexagon” logo, the “CV” logo, Commvault Systems, Solving Forward, SIM, Singular Information Management, Simpana, Simpana (logo), Commvault Galaxy, Commvault Edge, Unified Data Management, Edge Drive, QiNetix, Quick Recovery, QR, CommNet, GridStor, Vault Tracker, InnerVault, Quick Snap, QSnap, IntelliSnap, Simpana OnePass, Recovery Director, CommServe, CommCell, ROMS, Distinctly Data and CommValue. We also have several other trademarks and have obtained or are actively pursuing trademark registrations in several foreign jurisdictions.
Employees
team. As of March 31, 2016,2024, we had 2,3792,882 employees worldwide, of which approximately 40% were in the United States and 60% were located internationally.
We remain committed to providing employees with opportunities and resources that enable them to work successfully and creatively, while also investing in their professional and personal development. Throughout fiscal 2024, our employees participated in over 1,200 training programs, totaling more than 190,000 hours.
Diversity, Equity and Inclusion
At Commvault, we believe that diversity is a business imperative at the heart of our human capital management strategy. We not only drive the ability to be a best-in-class cyber resilience organization but also uphold our value in the marketplace by leading as an employer of choice.
We continue to elevate our employee engagement and belonging efforts which is the foundation of our approach. We have implemented an Employee Resource Group (“ERG”) operating model and have established five ERGs for cross-cultural learning, mentoring and relationship building across employees:
1.Women in Technology (WiT)
2.Multi-Culture
3.PRISM (LGBTQ+ & Allies)
4.VALOR (Veterans & Allies)
5.CapAbilities (Disability inclusion)
We also have two Employee Affinity Groups: Family Support Network and Environmental Group - VAST (Vaulters Advocating Sustainable Technology). Foundational to these engagement initiatives is our Courageous
Conversations program designed to foster difficult conversations in an open, safe and respectful manner. This program has become the hub for all diversity, equity and inclusion issues and related conversations, where employees and senior leaders share courageous life experiences related to bias and social injustice. Since its inception, we have hosted powerful sessions, each virtually, reaching our workforce around the globe.
We continue to be committed to securing the best talent with a concerted effort to expound on and build an inclusive and diverse pipeline of candidates. We are committed to providing an environment that fosters career growth, investing in the development, creativity and aspirational needs of all employees.
Employee Health, Safety and Wellness
Commvault values its people and their contribution to our company. In return for their contribution, we are committed to providing a corporate culture that is focused on the health, safety and well-being of our employees. We take a holistic approach to health and wellness to support the dynamic aspects of our employees’ lives, including 775their physical, social, emotional, family and financial well-being. We operate in salesaccordance with applicable safety laws and marketing, 526 in research and development, 842 in customer services and support and 236 in general and administration.procedures to ensure we provide a safe work environment for all.
Information about our Executive Officers of the Registrant
The following table presents information with respect to our executive officers as of May 1, 2016:9, 2024:
| | | | | | | | | | | | | | |
| Name | | Age | | Position |
| Sanjay Mirchandani | | 59 | | | | |
Name | | Age |
| | Position |
N. Robert Hammer | | 74 |
| | Chairman, President and Chief Executive Officer |
Alan G. BunteGary Merrill | | 49 | | 62
| | Executive Vice President, Chief Operating Officer |
Brian Carolan | | 45 |
| | Vice President, Chief Financial Officer |
Ron Miiller | | 49 |
| | Senior Vice President of Worldwide Sales |
N. Robert HammerSanjay Mirchandani has served as our Chairman, President and Chief Executive Officer ("CEO") since March 1998. Mr. Hammer was also a venture partner from 1997 until December 2003 of the Sprout Group, the venture capital arm of Credit Suisse’s asset management business.February 2019. Prior to joining the Sprout Group,Commvault, Mr. HammerMirchandani served from September 2016 to January 2019 as the Chairman, President and Chief Executive Officer of Norand Corporation, a portable computer systems manufacturer, from 1988 until its acquisition by Western Atlas,Puppet, Inc. (“Puppet”), an Oregon-based IT automation company. Mr. Mirchandani joined Puppet in 1997. Mr. Hammer led Norand following its leveraged buy-out from Pioneer Hi-Bred International, Inc. and through its initial public offering in 1993. Prior to joining Norand, Mr. Hammer also servedMay 2016 as Chairman, President and Chief Executive OfficerOperating Officer. Mr. Mirchandani brings a wealth of publicly-held Telequest Corporationinternational business experience through his diverse well-rounded career in technology. Before joining Puppet, from 1987 until 1988 and of privately-held Material Progress Corporation from 1982 until 1987. PriorOctober 2013 to joining Material Progress Corporation,April 2016, Mr. Hammer spent 15 years in various sales, marketing and management positions with Celanese Corporation, rising to the level ofMirchandani served as Corporate Senior Vice President and General Manager of Asia Pacific and Japan at VMware, Inc. and, from June 2006 to October 2013, Mr. Mirchandani held various senior leadership positions at EMC Corporation, including Chief Information Officer and leader of the structural composites materials business.Global Centers of Excellence. Prior to that, Mr. Hammer obtained hisMirchandani held various positions at Microsoft Corporation and Arthur Andersen LLP. Mr. Mirchandani has a Master of Business Administration degree from the University of Pittsburgh and a bachelor’s degree and master’s degree in business administrationmathematics from ColumbiaDrew University.
Alan G. BunteGary Merrill has served as our Executive Vice President and Chief Operating Officer since October 2003 and served as our Senior Vice President from December 1999 until October 2003. Since January 2008, Mr. Bunte has also served as a Director of Commvault. Prior to joining our company, Mr. Bunte was with Norand Corporation from 1986 to January 1998, serving as its Senior Vice President of planning and business development from 1991 to January 1998. Mr. Bunte obtained his bachelor’s and master’s degrees in business administration from the University of Iowa.
Brian Carolan has served as our Vice President, Finance and Chief Financial Officer ("CFO") since October 2012.July 2022. Prior to his current role, Mr. CarolanMerrill served as our Vice President, Finance and Chief Accounting Officerof Business Operations from July 2006April 2021 until September 2012.June 2022. He also held the position of ControllerVice President of Operations from February 2001 until June 2006.April 2019 through March 2021 and from December 2012 to March 2019, served as Chief Accounting Officer. Prior to joining our company,Commvault, Mr. Carolan wasMerrill held accounting management positions with Ernst & Youngseveral publicly traded companies. Mr. Merrill began his career with Arthur Anderson LLP in its Technology, Communications and Entertainment audit practice from 1993 until January 2001.practice. Mr. CarolanMerrill obtained his bachelor’s degree in accounting from Villanova University, his master’s degreeElizabethtown College.
Available Information
Our website is located at: www.commvault.com. On the Investor Relations section of the website, we post filings as soon as reasonably practicable after they are electronically filed with or furnished to the U.S. Securities and Exchange Commission ("SEC"), including: our Annual Reports on Form 10-K, our quarterly reports on Form 10-Q, our current reports on Form 8-K, our proxy statements related to our annual stockholders’ meetings and any amendment to those reports or statements filed or furnished pursuant to Section 13(a) or 15(d) of the Exchange Act. All such filings are available on the Investor Relations portion of our website free of charge. The contents of our website are not incorporated by reference into this Form 10-K or in business administration from New York University and is a certified public accountant inany other report, statement or document we file with the State of New Jersey.
Ron Miiller has served as our Senior Vice President of Worldwide Sales since April 2011. Prior to his current role, Mr. Miiller served as our Vice President of Sales, Americas from January 2005 to March 2011 and as our Central Region Sales Manager from March 2000 to December 2004. Prior to joining our company, Mr. Miiller served as Director, Central Region Sales for Softworks, Inc., an EMC company, from March 1997 through March 2000, and prior to that Mr. Miiller was with Moore Corporation, a diversified print and electronic communications company from 1989 through March 1997 in various leadership roles. Mr. Miiller received his bachelor of science degree in marketing from Ball State University.
SEC.
You should consider each of the following factors as well as the other information in this Annual Report in evaluating our business and our prospects. The risks and uncertainties described below are not the only ones we face. Additional risks and uncertainties not presently known to us or that we currently consider immaterial may also impair our business operations. If any of the following risks actually occurs,occur, our business and financial results could be harmed. In that case, the trading price of our common stock could decline. You should also refer to the other information set forth in this Annual Report, including our financial statements and the related notes.
Risks Related to Our Business
Our industry is intensely competitive, and many of our competitors have greater financial, technical and sales and marketing resources and larger installed customer bases, than we do, which could enable them to compete more effectively than we do.
The data and information management softwarecyber resiliency market is intensely competitive, highly fragmented and characterized by rapidly changing technology and evolving standards, changing customer requirements and frequent new product introductions. Competitors vary in size and in the scope and breadth of the products and services offered. Our primary competitors include EMC, IBM, Veritas and Veeam.
The principal competitive factors in our industry include product functionality productand integration, platform coverage, ability to scale, price, worldwide sales infrastructure, global technical support, namebrand recognition and reputation. The ability of major system vendors to bundle hardware and software solutions is also a significant competitive factor in our industry. If we are unable to address these factors, our competitive position could weaken and we could experience a decline in revenues that could adversely affect our business.
Many of our current and potential competitors have longer operating histories and have substantially greater financial, technical, sales, marketing and other resources than we do, as well as larger installed customer bases, greater name recognition and broader product offerings, including hardware. Some of these competitors can devote greater resources to the development, promotion, sale and support of their products than we can and have the ability to bundle their hardware and software products in a combined offering. As a result, these competitors may be able to respond more quickly to new or emerging technologies and changes in customer requirements.
It is also costly and time-consuming to change data and information management systems. Most of our new customers have installed data and information management software,systems, which gives an incumbent competitor an advantage in retaining a customer because itthe incumbent already understands the network infrastructure, user demands and information technology needs of the customer, and also because some customers are reluctant to invest the time and money necessary to change vendors.
Our current and potential competitors may establish cooperative relationships among themselves or with third parties. If so, new competitors or alliances that include our competitors may emerge that could acquire significant market share. In addition, large operating system and application vendors, as well as some hardware manufacturers, have introduced products or functionality that includes some of the same functions offered by our software applications. In the future, further development by these vendors could cause our software applications and services to become redundant, which could seriously harm our sales, results of operations and financial condition.
New competitors entering our markets can have a negative impact on our competitive positioning. In addition, we expect to encounter new competitors as we enter new markets. Furthermore, many of our existing competitors are broadening their operating systems platform coverage. We also expect increased competition from original equipment manufacturers,OEMs, including those we partner with, and from systems and network management companies, especially those that have historically focused on the mainframe computer market and have been making acquisitions and broadening their efforts to include data and information management and storageprotection products. We expect that competition will increase as a result of future software industry consolidation. Increased competition could harm our business by causing, among other things, price reductions of our products, reduced profitability and loss of market share.
We rely on indirect sales channels, such as value-added resellers, systems integrators, corporate resellers, distributors, OEMs, and original equipment manufacturers,marketplaces for the distribution of our software applications,solutions, and the failure of these channels to effectively sell our software applicationssolutions could have a material adverse effect on our revenues and results of operations.
We rely significantly on our value-added resellers, systems integrators and corporate resellers, which we collectively refer to as resellers, for the marketing and distribution of our software applicationsproducts and services. Resellers are our most significant distribution channel. However, our agreements with resellers are generally not exclusive, are generally renewable annually, typically do not contain minimum sales requirements and in many cases may be terminated by either party without cause. Many of our resellers carry software applicationsdata protection solutions that compete with ours. These resellers may give a higher priority to other software or SaaS applications, including those of our competitors, or may not continue to carry our software applications at all.data protection solutions. If a number of resellers were to discontinue or reduce the sales of our products, or were to promote our competitors’ products in lieu of our own, it could have a material adverse effect on our future revenues. Events or occurrences of this nature could seriously harm our sales and results of operations. If we fail to manage our resellers successfully, there may be conflicts between resellers or they could fail to perform as we anticipate, including required compliance with the terms and obligations of our reseller agreement, either of which could reduce our sales or impact our reputation in the market. In addition, we expect that a portion of our sales growth will depend upon our ability to identify and attract new reseller partners.resellers. Our competitors also use reseller arrangements and may be more successful in attracting reseller partners and could enter into exclusive relationships with resellers that make it difficult to expand our reseller network. Any failure on our part to maintain and/or expand our network of resellers could impair our ability to grow revenues in the future.
Some of our resellers possess significant resources and advanced technical abilities. These resellers, particularly our corporate resellers may, either independently or jointly with our competitors, develop and market products and related servicessolutions that compete with our offerings. If this were to occur, these resellers might discontinue marketing and distributing our software applications and services.solutions. In addition, these resellers would have an advantage over us when marketing their competing products and related services because of their existing customer relationships. The occurrence of any of these events could have a material adverse effect on our revenues and results of operations.
In addition, we have a non-exclusive distribution agreements covering our North American commercial markets and our U.S. Federal Government marketagreement with Arrow and Avnet. Pursuantpursuant to these distribution agreements, these distributors’which Arrow’s primary role is to enable a more efficient and effective distribution channel for our products and servicessolutions by managing our reseller partnersresellers and leveraging their own industry experience. Many of our North American resellers have been transitioned to either Arrow or Avnet. Sales through our distribution agreement with Arrow accounted for approximately 38%36% of our total revenues for fiscal 20162024 and approximately 36% for37% of our total revenues in both fiscal 2015.2023 and fiscal 2022. If Arrow or Avnet were to discontinue or reduce the sales of our productssolutions or if our agreement with Arrow or Avnet was terminated, and if we were unable to take back the management of our reseller channel or find another North American distributor to replace Arrow, or Avnet, then itthere could havebe a material adverse effect on our future revenues.business.
Our original equipment manufacturersOEMs sell and integrate our software applications and in some cases incorporate our data and information management software into systems that they sell. Asolutions which represents a material portion of our revenues is generated through these arrangements. However, werevenues. We have no control over the shipping dates or volumes of systems these original equipment manufacturers shipOEMs sell and they have no obligation to shipsell systems incorporating our software applications.solutions. They also have no obligation to recommend or offer our software applicationssolutions exclusively or at all, and theyall. They have no minimum sales requirements and can terminate our relationship at any time. These original equipment manufacturersOEMs also could choose to develop their own data and information management software internally and incorporate those products into their systems instead of our software applications. The original equipment manufacturers that we do business with alsoprotection solutions. Our OEM partners compete with one another. If one of our original equipment manufacturerOEM partners views our arrangement with another original equipment manufacturerOEM as competing, with its products, it may decide to stop doing business with us. Any material decrease in the volume of sales generated by original equipment manufacturers we do business with, as a result of these factors or otherwise,OEMs could have a material adverse effect on our revenues and results of operations in future periods.
We also sell our solutions via marketplace offerings which enable customers to purchase our solutions through online platforms, typically hosted by a cloud provider. The marketplace allows us to publish an offer which an end user can then purchase directly, or through the assistance of a partner. Similar to our resellers and OEMs, marketplace providers have no obligation to sell or recommend our solutions or offer our solutions exclusively or at all. Sales through our original equipment manufacturer agreements accounted for approximately 15% of our total revenues for fiscal 2016 and fiscal 2015.
Ifthe marketplace have not been material to date; however, we transition a significant amount of our software revenue to subscription, or term based, license arrangements it could have a significant adverse impact on our results of operations.
Historically,anticipate an insignificant amount of our revenue has been sold under subscription or term based, license arrangements. In these arrangements, the customer generally has the right to use the software on either a per terabyte capacity basis or per-copy basis over a designated period of time. Revenue in these arrangements is recognized ratably over the term of the agreement. This is different from our sales of perpetual software licenses, in which revenue is typically recognized upon the receipt of a purchase order or other persuasive evidence and when all other basic revenue recognition criteria are met. If a more significant proportion of our transactions were to be sold under a time-based arrangement there could be a declineincrease in revenue income from operations, net income and net income per common share versus if those transactions were sold under a perpetual model.
We may not be ablethrough this channel. Failure to respond to rapid technological changes with new software applications and services offerings, whicheffectively compete in the marketplace could have a material adverse effect on our salesrevenues and profitability.
The markets for our software applications are characterized by rapid technological changes, changing customer needs, frequent new product introductions and evolving industry standards. The introductionresults of software applications embodying new technologies and the emergence of new industry standards could make our existing andoperations in future software applications obsolete and unmarketable. As a result, we may not be able to accurately predict the lifecycle of our software applications, and they may become obsolete before we receive the amount of revenues that we anticipate from them. If any of the foregoing events were to occur, our ability to retain or increase market share in the data and information management software market could be materially adversely affected.
We devote significant resources to the development of new products and the enhancement of existing products. To be successful, we need to anticipate, develop and introduce new software applications and services on a timely and cost-effective basis that keep pace with technological developments and emerging industry standards and that address the increasingly sophisticated needs of our customers. We may fail to develop and market software applications and services that respond to technological changes or evolving industry standards, experience difficulties that could delay or prevent the successful development, introduction and marketing of these applications and services or fail to develop applications and services that adequately meet the requirements of the marketplace or achieve market acceptance. Our failure to develop and market such applications and services on a timely basis, or at all, could have a material adverse effect on our sales and profitability.periods.
If the cost for annual maintenance and support agreements, or our term-based subscription licenses and SaaS arrangements, with our customers is not competitive in the market or if our customers do not renew their agreements either at all, or on terms that are less favorable to us, our business and financial performance might be adversely impacted.
Most of our support and maintenance agreements are for a one-year term and thereafter, we pursue renewal thereof. Historically, such renewals have represented a significant portion of our total revenue. If our customers do not renew their annual maintenance and support agreements either at all, or on terms that are less favorable to us, our business and financial performance might be adversely impacted.
MostAdditionally, a significant amount of our maintenance agreementsrevenues are for afrom term-based software license and SaaS arrangements. The arrangements are typically one year term. Asto three years in duration. If at the end of the annual period approaches, we pursue the renewal of the agreement with the customer. Historically, maintenance renewals have represented a significant portion of our total revenue. Because of this characteristic of our business, if ourinitial term, customers doelect to not renew, their annual maintenance and support agreements either at all, or onthey renew terms that are less favorable to us, our business and financial performance might be adversely impacted.
In periods of volatile economic conditions, our exposure to credit risk and payment delinquencies on our accounts receivable significantly increases.
Our outstanding accounts receivables are generally not secured. Our standard terms and conditions permit payment within a specified number of days following the receipt of our solution. Volatile economic conditions, including those related to the wars in Israel and Ukraine and the global response to the conflicts, the COVID-19 pandemic and its variants, or the financial instability of banking institutions could result in our customers and resellers facing liquidity concerns leading to them not being able to satisfy their payment obligations to us, which would have a material adverse effect on our financial condition, operating results and cash flows.
In addition, we are currently going throughhave transitioned a re-alignmentmore significant percentage of our maintenance pricingrevenue to be more competitive in the market and make it easier forsubscription, or term-based, arrangements. In these arrangements, our customers may pay for solutions over a period of several years. Due to do business with Commvault. This maintenance pricing re-alignment will phase in over the next 12 months and is primarily focused on the mid-potential for extended period of collection, we may be exposed to lower-end of the market (non-enterprise customers) which impacts approximately a quarter of our existing maintenance revenue dollar base. If we are not successful with our maintenance pricing re-alignment strategy, our business and financial performance might also be adversely impacted.more significant credit risk.
We develop software applicationssolutions that interoperate with certain software,products, operating systems and hardware developed by others, and if the developers of those operating systems and hardware do not cooperate with us or we are unable to devote the necessary resources so that our applicationssolutions interoperate with those systems, our software development efforts may be delayed or foreclosed and our business and results of operations may be adversely affected.
Our software applicationssolutions operate primarily on the Windows, UNIX, Linux and Novell Netware operating systems; used in conjunction with Microsoft SQL; and on hardware devices of numerous manufacturers. When new or updated versions of these operating systems, softwaresolution applications, and hardware devices are introduced, it is often necessary for us to develop updated versions of our softwaresolution applications so that they interoperate properly with these systems and devices. We may not accomplish these development efforts quickly or cost-effectively, and it is not clear what the relative growth rates of these operating systems and hardware will be. These
We encounter long sales and implementation cycles, particularly for our larger customers, which could have an adverse effect on the size, timing and predictability of our revenues.
Potential or existing customers, particularly larger enterprise customers, generally commit significant resources to an evaluation of available solutions and require us to expend substantial time, effort and money educating them as to the value of our solutions. Sales often require an extensive education and marketing effort.
We could expend significant funds and resources during a sales cycle and ultimately fail to win the customer. Our sales cycle for all of our products and services is subject to significant risks and delays over which we have little or no control, including:
•our customers’ budgetary constraints;
•the timing of our customers’ budget cycles and approval processes;
•our customers’ willingness to replace their current solutions;
•our need to educate potential customers about the uses and benefits of our solutions; and
•the timing of the expiration of our customers’ current agreements for similar solutions.
If our sales cycles lengthen unexpectedly, they could adversely affect the timing of our revenues or increase costs, which may cause fluctuations in our quarterly revenues and results of operations. Finally, if we are unsuccessful in closing sales of our solutions after spending significant funds and management resources, our operating margins and results of operations could be adversely impacted, and the price of our common stock could decline.
We depend on growth in the data protection and cyber resiliency market, and lack of growth or contraction in this market could have a material adverse effect on our sales and financial condition.
Demand for data protection and cyber resilience solutions is linked to growth in the amount of data generated and stored, demand for data retention and management (whether as a result of regulatory requirements or otherwise) demand for and adoption of new backup devices and networking technologies, and ability to respond to and recover from data breaches in a secure environment. Because our solutions are concentrated within the data protection and cyber resiliency market, if the demand for backup and data protection solutions devices declines, our sales, profitability and financial condition would be materially adversely affected.
Furthermore, the data protection and cyber resiliency market is dynamic and evolving. Our future financial performance will depend in large part on continued growth in the number of organizations adopting data protection and cyber resilience solutions for their environments. The market for data protection and cyber resilience solutions may not continue to grow at historic rates, or at all. If this market fails to grow or grows more slowly than we currently anticipate, our sales and profitability could be adversely affected.
Our SaaS offerings require costly and continual infrastructure investments and if these investments do not yield the expected return, our business and financial performance might be adversely impacted.
In order to deliver our SaaS offerings via a cloud-based deployment, we have made and will continue to make capital investments and incur substantial costs to implement and maintain this business model. In addition, as we look to deliver new or different cloud-based services, we are making significant technology investments to deliver new capabilities and advance our software to deliver cloud-native customer experiences. Our revenues
related to SaaS offerings have increased in recent years. If there is a reduction in demand for these services caused by a lack of customer acceptance, technological challenges, weakening economic or political conditions, security or privacy concerns, inability to properly manage such services, competing technologies and products, decreases in corporate spending or otherwise, our financial results and competitive position could suffer. If these investments do not yield the expected return, or we are unable to decrease the cost of delivering our cloud services, our gross margins, overall financial results, business model and competitive position could suffer.
We rely on third-party hosting providers to deliver our SaaS offerings. Therefore, any disruption or interference with our use of these services could adversely affect our business.
Our use of third-party hosting facilities requires us to rely on the functionality and availability of the third parties’ services, as well as their data security, which despite our due diligence, may be or become inadequate. Our continued growth depends in part on the ability of our existing and potential customers to use and access our cloud services or our website to download our software within an acceptable amount of time. Third-party service providers operate platforms that we access, and we are vulnerable to their service interruptions. We may experience interruptions, delays, and outages in service and availability due to problems with our third-party service providers’ infrastructure. This infrastructure’s lack of availability could be due to many potential causes, including technical failures, power shortages, natural disasters, fraud, terrorism, or security attacks that we cannot predict or prevent. Such outages could trigger our service level agreements and the issuance of credits to our customers, which may impact our business and consolidated financial statements.
If we are unable to renew our agreements with our cloud service providers on commercially reasonable terms, an agreement is prematurely terminated, or we need to add new cloud services providers to increase capacity and uptime, we could experience interruptions, downtime, delays, and additional expenses related to transferring to and providing support for these new platforms. Any of the above circumstances or events may harm our reputation and brand, reduce our platforms’ availability or usage, and impair our ability to attract new users, any of which could adversely affect our business, financial condition, and results of operations.
We sell a backup appliance which integrates our solution with hardware. If we fail to accurately predict manufacturing requirements and manage our supply chain we could incur additional costs or experience manufacturing delays that could harm our business.
We generally provide forecasts of our requirements to our supply chain partners on a rolling basis. If our forecast exceeds our actual requirements, a supply chain partner may assess additional charges or we may incur costs for excess inventory they hold, each of which could negatively affect our gross margins. If our forecast is less than our actual requirements, the applicable supply chain partner may have insufficient time or components to produce or fulfill our solutions' requirements, which could delay or interrupt manufacturing of our products or fulfillment of orders for our solutions, and result in delays in shipments, customer dissatisfaction, and deferral or loss of revenue. If we fail to accurately predict our requirements, we may be unable to fulfill those orders or we may be required to record charges for excess inventory. Any of the foregoing could adversely affect our business, financial condition or results of operations.
Our complex solutions may contain undetected errors, which could adversely affect not only their performance but also our reputation and the acceptance of our solutions in the market.
Our complex solutions may contain undetected errors or failures, especially when they are made generally available or new versions are released. Despite extensive testing by us and customers, we have discovered errors in our solutions in the past and will do so in the future. As a result of past discovered errors, we experienced delays and lost revenues while we corrected those solutions. In addition, customers in the past have brought to our attention “bugs” in our software created by the customers’ unique operating environments, which are often characterized by a wide variety of both standard and non-standard configurations that make pre-release testing very difficult and time consuming. Although we have been able to fix these bugs in the past, we may not always be able to do so. Our solutions may also be subject to intentional attacks by viruses that seek to take advantage of these bugs, errors or other weaknesses. Any of these events may result in the loss of, or delay in, market acceptance of our solutions or damage to our reputation, which would seriously harm our sales, results of operations and financial condition.
Incorrect or improper implementation or use of our data security solutions could result in customer dissatisfaction and harm our business, financial condition, and results of operations.
Our products are deployed by our customers and partners in a wide variety of IT infrastructures, including large-scale, complex technology environments, and we believe our future success will depend, at least in part, on our ability to support such deployments. Implementations of our products may be technically complicated, and it may not be easy to maximize the value of our products without proper implementation, training, and support. Some of our customers have experienced difficulties implementing our products in the past and may experience implementation difficulties in the future. If our customers and partners are unable to implement our products successfully, perceptions of our products may be impaired, our reputation and brand may suffer, or customers may choose not to renew their subscriptions or purchase additional products from us.
Any failure by customers or partners to appropriately implement our products could result in customer dissatisfaction, impact the perceived reliability of our products, result in negative press coverage, negatively affect our reputation, and harm our business, financial condition, and results of operations.
We may not receive significant revenues from our current research and development efforts requirefor several years, if at all.
Developing software and technology is expensive, and the cooperationinvestment in product development may involve a long payback cycle. Our research and development expenses were $132.3 million, or 16% of our total revenues in fiscal 2024, $141.8 million, or 18% of our total revenues in fiscal 2023 and $153.6 million, or 20% of our total revenues in fiscal 2022. We believe that we must continue to dedicate a significant amount of resources to our research and development efforts to maintain our competitive position. However, we may not recognize significant revenues from these investments for several years, if at all.
Our ability to sell our solutions is highly dependent on the developersquality of our customer support and professional services, and failure to offer high quality customer support and professional services would have a material adverse effect on our sales and results of operations.
Our services include the operating systems,assessment and design of solutions to meet our customers’ storage management requirements and the efficient installation and deployment of our software applications based on specified business objectives. Further, once our software applications are deployed, our customers depend on us to resolve issues relating to our software applications. A high level of service is critical for the successful marketing and sale of our software. If we or our partners do not effectively install or deploy our applications, or succeed in helping our customers quickly resolve post-deployment issues, it would adversely affect our ability to sell software products to existing customers and could harm our reputation with prospective customers. As a result, our failure to maintain high quality support and professional services would have a material adverse effect on our sales of software applications and hardware, substantial capital investmentresults of operations.
We implemented a restructuring plan in fiscal 2024, which we cannot guarantee will achieve its intended results.
In fiscal 2024, we initiated a restructuring plan to enhance customer satisfaction, optimize operational efficiency, and align our customer experience functions with our strategic goals. We cannot guarantee the restructuring plan will achieve its intended results. Risks associated with this restructuring plan also include additional unexpected costs, adverse effects on employee morale and the devotionfailure to meet operation and growth targets due to the loss of substantial employeekey employees, any of which may impair our ability to achieve anticipated results of operations or otherwise harm our business.
We are subject to several local, state, federal and foreign laws and regulations regarding privacy and data protection, and any actual or perceived failure by us to comply with such laws and regulations could adversely affect our business.
We are currently subject, and may become further subject, to local, state, federal and foreign laws and regulations regarding the privacy and protection of personal data or other potentially sensitive information. In the United States, federal, state, and local governments have enacted numerous data privacy security laws, including data breach notification laws, data privacy laws, consumer protection laws, and other similar laws. For example, the California Consumer Privacy Act of 2018, as amended by the California Privacy Rights Act of 2020 (collectively, the "CCPA"), imposes obligations on certain businesses to provide specific disclosures in privacy notices and grants California residents certain rights related to their personal data. The CCPA imposes statutory fines for noncompliance (up to $7,500 per violation). Other states have enacted or proposed similar laws. These developments may increase legal risk and compliance costs for us and our customers.
Outside the United States, an increasing number of laws, regulations, and industry standards govern data privacy and security. For example, the European Union’s ("E.U.") General Data Protection Regulation ("E.U. GDPR"), and the United Kingdom’s ("U.K.") GDPR ("U.K. GDPR"), impose strict requirements for processing the personal data of individuals. Violations of these obligations carry significant potential consequences. For example, under the E.U. GDPR, government regulators may impose temporary or definitive bans on processing, as well as fines of up to €20 million or 4% of the annual global revenue, whichever is greater. Additionally, new and emerging data privacy regimes may be applicable in Asia, including India's Digital Personal Data Protection Act, China's Personal Information Protection Law, Japan's Act on the Protection of Personal Information, and Singapore's Personal Data Protection Act.
In addition, as a technology provider, our customers expect us to demonstrate compliance with current data privacy laws and further make contractual commitments and implement processes to enable the customer to comply with their own obligations under data privacy laws, and our actual or perceived inability to do so may adversely impact sales of our products and services, particularly to customers in highly regulated industries.
Our actual or perceived failure to comply with laws, regulations, contractual commitments, or other actual or asserted obligations, including certain industry standards, regarding personal information, or other confidential information of individuals could lead to costly legal action, brand and reputational damage, significant liability, inability to process data, and decreased demand for our services, which could adversely affect our business. In addition, any security breach that results in the release of, or unauthorized access to, personal information, or other confidential information of individuals could subject us to incident response, notice and remediation costs. Failure to safeguard data adequately or to destroy data securely could subject us to regulatory investigations or enforcement actions under applicable data security, unfair practices or consumer protection laws which could have an adverse effect on our business, financial resources.condition or operating results. The scope and interpretation of these laws could change and the associated burdens and our compliance costs could increase in the future.
A portion of our revenue is generated by sales to government entities, which are subject to a number of challenges and risks.
Sales to global federal, state, and local governmental agencies account for a portion of our revenue, and we may in the future increase sales to government entities. This customer base experiences budgetary constraints or shifts in spending priorities regularly which may adversely affect sales of our solutions to government entities.
Selling to government entities can be highly competitive, expensive and time consuming, often requiring significant upfront time and expense without any assurance that we will successfully sell our solutions. Government entities may require contract terms that differ from our standard terms and conditions including termination rights favorable for the customer, audit rights, and maintenance of certain security clearances for facilities and employees which can entail administrative time and effort resulting in costs and delays. Government demand for our solutions may be more volatile as they are affected by stringent regulations, public sector budgetary cycles, funding authorizations, and the potential for funding reductions or delays, making the time to close such transactions more difficult to predict.
Changes in senior management or key personnel could cause disruption in the Company and have a material effect on our business.
We have had, and could have, changes in senior management which could be disruptive to management and operations of the Company and could have a material effect on our business, operating results and financial conditions. Turnover at the senior management level may create instability within the Company, which could impede the Company’s day-to-day operations. Such instability could impede our ability to fully implement our business plan and growth strategy, which would harm our business and prospects.
We rely on our key personnel to execute our existing business operations and identify and pursue new growth opportunities. The loss of key employees could result in significant disruptions to our business, and the integration and training of replacement personnel could be costly, time consuming, cause additional disruptions to our business and be unsuccessful.
We have engaged, and may continue to engage, in strategic acquisitions or transactions, which could have a material adverse effect on our business, results of operations, financial condition and cash flows.
Acquisitions involve a number of risks, including diversion of management’s attention, ability to finance the acquisition on attractive terms, failure to retain key personnel or valuable customers, legal liabilities, the need to amortize acquired intangible assets, and intellectual property ownership and infringement risks, any of which could have a material adverse effect on our business, results of operations, financial condition and cash flows. Any additional future acquisitions may also result in the incurrence of indebtedness or the issuance of additional equity securities.
We could also experience financial or other setbacks if transactions encounter unanticipated problems, including problems related to governmental approval, execution, integration or underperformance relative to prior expectations. Acquisitions may not result in long-term benefits to us or we may not be able to further develop the acquired business in the manner we anticipated.
Following the completion of acquisitions, we may have to rely on the seller to provide administrative and other support, including financial reporting and internal controls, and other transition services to the acquired business for a period of time. There can be no assurance that the seller will do so in a manner that is acceptable to us.
Actual or threatened public health crises could adversely affect our business in a material way.
As a global company, with employees and customers located around the world in a variety of industries, our performance may be impacted by public health crises, including the COVID-19 pandemic and its variants, which has caused global economic uncertainty. The emergence of a public health threat could pose the risk that our employees, partners, and customers may be prevented from conducting business activities at full capacity for an indefinite period, due to the spread of the disease or suggested or mandated by governmental authorities. Moreover, these conditions can affect the rate of information technology spending and may adversely affect our customers’ willingness to purchase our solutions, delay prospective customers’ purchasing decisions, reduce the value or duration of their contracts, cause our customers to request concessions including extended payment terms or better pricing, or affect attrition rates, all of which could adversely affect our future sales and operating results. The global spread of COVID-19 has created significant uncertainty, and economic disruption. We have undertaken measures to protect our employees, partners, and customers, including allowing our employees to work remotely; however, there can be no assurance that these measures will be sufficient or that we can implement them without adversely affecting our business operations.
Borrowing against our revolving credit facility could adversely affect our operations and financial results.
We have a $100 million revolving credit facility. As of March 31, 2024, there were no borrowings under the credit facility. If we were to borrow substantially against this facility the indebtedness could have adverse consequences, including:
•requiring us to devote a portion of our cash flow from operations to payments of indebtedness, which would reduce the availability of cash flow to fund working capital requirements, capital expenditures and other general purposes;
•limiting our flexibility in planning for, or reacting to, general adverse economic conditions or changes in our business and the industry in which we operate in;
•placing us at a competitive disadvantage compared to our competitors that have less debt; and
•limiting our ability to fund potential acquisitions.
The credit facility also contains financial maintenance covenants, including a leverage ratio and interest coverage ratio, and customary events of defaults. Failure to comply with these covenants could result in an event of default, which, if not cured or waived, could accelerate our repayment obligations. For some operating systems,further discussion on our revolving credit facility, see Note 16 of the notes to the consolidated financial statements.
Risks Related to our International Operations
If we are unable to effectively manage certain risks and challenges related to our India operations, our business could be harmed.
Our India operations are a key factor to our success. We believe that our significant presence in India provides certain important advantages for our business, such as direct access to a large pool of skilled professionals and assistance in growing our business internationally. However, it also creates certain risks that we must obtain some proprietary application program interfaces fromeffectively manage. As of March 31, 2024, we had 1,037 employees located in India. Wage costs differentiate depending on regions throughout the ownerworld. Wages in orderIndia are increasing at a faster rate than in the many other countries, including the United States. These increases could result in us incurring increased costs for technical professionals and reduced margins. There is intense competition in India for skilled technical professionals, and we expect such competition to develop software applications that interoperate with the operating system. Operating system and software owners have no obligation to assist in these development efforts. If they do not provide us with assistance, the contractual right, or the necessary proprietary application program interfaces onincrease. As a timely basis,result, we may experience delays or be unable to expandcost-effectively retain our software applications into other areas.current employee base in India or hire additional new talent. In addition, India has experienced significant inflation, low growth in gross domestic product and shortages of foreign exchange. India also has experienced civil unrest and has been involved in conflicts with neighboring countries. The occurrence of any of these circumstances could result in disruptions to our India operations, which, if continued for an extended period of time, could have a material adverse effect on our business.
In recent years, India’s government has adopted policies that are designed to promote foreign investment, including significant tax incentives, relaxation of regulatory restrictions, liberalized import and export duties and preferential rules on foreign investment and repatriations. These policies may not continue. If we are unable to effectively manage any of the foregoing risks related to our India operations, our development efforts could be impaired, our growth could be slowed and our results of operations could be negatively impacted.
Volatility in the global economy could adversely impact our continued growth, results of operations and our ability to forecast future business.
As our business has expanded globally,a global company, we have become increasingly subject to the risks arising from adverse changes in domestic and global economic and political conditions. Uncertainty in the macroeconomic environment and associated global economic conditions have resulted in volatility in credit, equity, debt and foreign currency markets as well as government budgets worldwide.markets.
These global economic conditions can result in slower economic activity, decreased consumer confidence, reduced corporate profits and capital spending, inflation, adverse business conditions and liquidity concerns. There has also been increased volatility in foreign exchange markets. These factors make it difficult for our customers, our vendors and us to accurately forecast and plan future business activities. In addition, theseThese factors could cause customers to slow or defer spending on our software products and services,solutions, which would delay and lengthen sales cycles and negatively affect our results of operations. If such conditions deteriorate or if the pace of economic recovery is slower or more uneven, our results of operations could be adversely affected, we may not be able to sustain the growth rates we have experienced recently, and we could fail to meet the expectations of stock analysts and investors, which could cause the price of our common stock to decline.
We continue to invest in our business in the Asia-Pacific and Europe, Middle East, and Africa regions. There areinternationally where there may be significant risks with overseas investments and growth prospects in these regions.prospects. Increased volatility or declines in the credit, equity, debt and foreign currency markets in these regions could cause delays in or cancellations of orders. Deterioration of economic conditions in the countries in which we do business could also cause slower or impaired collections on accounts receivable. In addition, we could experience delays in the payment obligations of our worldwide resellers if they experience weakness in the end-user market, which would increase our credit risk exposure and harm our financial condition.
In periods of volatile economic conditions, our exposure to credit risk and payment delinquencies on our accounts receivable significantly increases.
Our outstanding accounts receivables are generally not secured. In addition, our standard terms and conditions permit payment within a specified number of days following the receipt of our product. Due to the recent volatile economic conditions in some of the markets we operate in, certain of our customers and resellers have faced or may face liquidity concerns which could result in our customers or resellers not being able to satisfy their payment obligations to us, which would have a material adverse effect on our financial condition, operating results and cash flows. While we have procedures to monitor and limit exposure to credit risk on our receivables and have not suffered any material losses to date, there can be no assurance such procedures will continue to effectively limit our credit risk and avoid future losses.
We are, and may in the future become, involved in litigation that may have a material adverse effect on our business.
On September 10, 2014, a purported class action complaint was filed in the United States District Court for the District of New Jersey against the Company, our Chief Executive Officer and our Chief Financial Officer. The case is captioned In re Commvault Systems, Inc. Securities Litigation (Master File No. 3:14-cv-05628-MAS-LHG). The suit alleges that we made materially false and misleading statements, or failed to disclose material facts, regarding our financial results, business, operations and prospects in violation of Sections 10(b) and 20(a) of the Securities Exchange Act of 1934 and Rule 10b-5 promulgated thereunder. The suit asserts claims covering an alleged class period from May 7, 2013 through April 24, 2014. It is purportedly brought on behalf of purchasers of our common stock during that period, and seeks compensatory damages, costs and expenses, as well as equitable or other relief. Lead plaintiff, the Arkansas Teachers Retirement System, was appointed on January 12, 2015, and on March 18, 2015, an amended complaint was filed by the plaintiffs. On December 17, 2015, the defendant’s motion to dismiss the case was granted and the case dismissed; however, the plaintiffs were permitted to re-file their claim, which they did on February 5, 2016. Defendants filed another motion to dismiss on April 5, 2016, which remains pending with the court. Due to the inherent uncertainties of litigation, we cannot accurately predict the ultimate outcome of this matter. We are unable at this time to determine whether the outcome of the litigation will have a material impact on our results of operations, financial condition or cash flows.
In addition, from time to time, we may become involved in various other legal proceedings relating to matters incidental to the ordinary course of our business, including patent, commercial, product liability, employment, class action, whistleblower and other litigation and claims, and governmental and other regulatory investigations and proceedings. Such matters can be time-consuming, divert management’s attention and resources and cause us to incur significant expenses. Furthermore, because litigation is inherently uncertain, there can be no assurance that the results of any of these actions will not have a material adverse effect on our business, results of operations or financial condition.
We may experience a decline in revenues or volatility in our quarterly operating results, which may adversely affect the market price of our common stock.
We cannot predict our future quarterly revenues or operating results with certainty because of many factors outside of our control. A significant revenue or profit decline, lowered forecasts or volatility in our operating results could cause the market price of our common stock to decline substantially. Factors that could affect our revenues and operating results include the following:
the unpredictability of the timing and magnitude of orders for our software applications, particularly software transactions greater than $100,000 — in recent fiscal years, a majority of our quarterly revenues were earned and recorded near the end of each quarter;
the possibility that our customers may cancel, defer or limit purchases as a result of reduced information technology budgets;
the possibility that our customers may defer purchases of our software applications in anticipation of new software applications or updates from us or our competitors;
the ability of our original equipment manufacturers and resellers to meet their sales objectives;
market acceptance of our new applications and enhancements;
our ability to control expenses;
changes in our pricing, packaging and distribution terms or those of our competitors; and
the demands on our management, sales force and services infrastructure as a result of the introduction of new software applications or updates.
Our expense levels are relatively fixed and are based, in part, on our expectations of future revenues. If revenue levels fall below our expectations and we are profitable at the time, our net income would decrease because only a small portion of our expenses varies with our revenues. Therefore, any significant decline in revenues for any period could have an immediate adverse impact on our results of operations for that period. We believe that period-to-period comparisons of our results of operations should not be relied upon as an indication of future performance. In addition, our results of operations could be below expectations of public market analysts and investors in future periods, which would likely cause the market price of our common stock to decline.
We encounter long sales and implementation cycles, particularly for our larger customers, which could have an adverse effect on the size, timing and predictability of our revenues.
Potential or existing customers, particularly larger enterprise customers, generally commit significant resources to an evaluation of available software and require us to expend substantial time, effort and money educating them as to the value of our software and services. Sales of our core software products to these larger customers often require an extensive education and marketing effort.
We could expend significant funds and resources during a sales cycle and ultimately fail to win the customer. Our sales cycle for all of our products and services is subject to significant risks and delays over which we have little or no control, including:
our customers’ budgetary constraints;
the timing of our customers’ budget cycles and approval processes;
our customers’ willingness to replace their current software solutions;
our need to educate potential customers about the uses and benefits of our products and services; and
the timing of the expiration of our customers’ current license agreements or outsourcing agreements for similar services.
If our sales cycles lengthen unexpectedly, they could adversely affect the timing of our revenues or increase costs, which may cause fluctuations in our quarterly revenues and results of operations. Finally, if we are unsuccessful in closing sales of our products after spending significant funds and management resources, our operating margins and results of operations could be adversely impacted, and the price of our common stock could decline.
We depend on growth in the data and information management software market, and lack of growth or contraction in this market could have a material adverse effect on our sales and financial condition.
Demand for data and information management software is linked to growth in the amount of data generated and stored, demand for data retention and management (whether as a result of regulatory requirements or otherwise) and demand for and adoption of new storage devices and networking technologies. Because our software applications are concentrated within the data and information management software market, if the demand for storage devices, storage software applications, storage capacity or storage networking devices declines, our sales, profitability and financial condition would be materially adversely affected. Segments of the computer and software industry have in the past experienced significant economic downturns. The occurrence of any of these factors in the data and information management software market could materially adversely affect our sales, profitability and financial condition.
Furthermore, the data and information management software market is dynamic and evolving. Our future financial performance will depend in large part on continued growth in the number of organizations adopting data and information management software for their computing environments. The market for data and information management software may not continue to grow at historic rates, or at all. If this market fails to grow or grows more slowly than we currently anticipate, our sales and profitability could be adversely affected.
Our software applications are complex and may contain undetected errors, which could adversely affect not only our software applications’ performance but also our reputation and the acceptance of our software applications in the market.
Software applications as complex as those we offer contain undetected errors or failures, especially when products are first introduced or new versions are released. Despite extensive testing by us and by our customers, we have in the past discovered errors in our software applications and will do so in the future. As a result of past discovered errors, we experienced delays and lost revenues while we corrected those software applications. In addition, customers in the past have brought to our attention “bugs” in our software created by the customers’ unique operating environments, which are often characterized by a wide variety of both standard and non-standard configurations that make pre-release testing very difficult and time consuming. Although we have been able to fix these software bugs in the past, we may not always be able to do so. Our software products may also be subject to intentional attacks by viruses that seek to take advantage of these bugs, errors or other weaknesses. Any of these events may result in the loss of, or delay in, market acceptance of our software applications and services, which would seriously harm our sales, results of operations and financial condition.
Furthermore, we believe that our reputation and name recognition are critical factors in our ability to compete and generate additional sales. Promotion and enhancement of our name will depend largely on our success in continuing to provide effective software applications and services. The occurrence of errors in our software applications or the detection of bugs by our customers may damage our reputation in the market and our relationships with our existing customers, and as a result, we may be unable to attract or retain customers.
In addition, because our software applications are used to manage data that is often critical to our customers, they may have a greater sensitivity to defects in our products than to defects in other, less critical, applications. As a result, the licensing and support of our software applications involve the risk of product liability claims. Our license agreements with our customers typically contain provisions designed to limit our exposure to potential product liability claims. However, the limitation of liability provisions contained in our license agreements vary and may not be effective as a result of existing or future national, federal, state, or local laws or ordinances or unfavorable judicial decisions. Although we have not experienced any material product liability claims to date, the sale and support of our products entail the risk of such claims, which could be substantial in light of the use of our products in enterprise-wide environments. In addition, our insurance against product liability may not be adequate to cover all potential claims.
We may not receive significant revenues from our current research and development efforts for several years, if at all.
Developing software is expensive, and the investment in product development may involve a long payback cycle. Our research and development expenses were $69.3 million, or 12% of our total revenues in fiscal 2016, $64.1 million, or 11% of our total revenues in fiscal 2015 and $55.1 million, or 9% of our total revenues in fiscal 2014. Our future plans include significant investments in software research and development and related product opportunities. We believe that we must continue to dedicate a significant amount of resources to our research and development efforts to maintain our competitive position. However, we may not recognize significant revenues from these investments for several years, if at all.
The loss of key personnel or the failure to attract and retain highly qualified personnel could have an adverse effect on our business.
Our future performance depends on the continued service of our key technical, sales, services and management personnel. We rely on our executive officers and senior management to execute our existing business operations and identify and pursue new growth opportunities. The loss of key employees could result in significant disruptions to our business, and the integration and training of replacement personnel could be time consuming, cause additional disruptions to our business and be unsuccessful. We do not carry key person life insurance covering any of our employees.
Our future success also depends on our continued ability to attract and retain highly qualified technical, sales, services and management personnel. Competition for such personnel is intense, and we may fail to retain our key technical, sales, services and management employees or attract or retain other highly qualified technical, sales, services and management personnel in the future.
Furthermore, in the past, we have experienced higher levels of turnover in our sales force compared to other employee groups in our company. Increases in the turnover rate of our sales force may affect our ability to generate license revenue growth. Although we have hired replacements in our sales force and are continuing to hire additional sales personnel to grow our business, we sometimes experience lower productivity from newly hired sales personnel for a period up to twelve months. In addition, we periodically make adjustments to our sales organization in response to a variety of internal and external factors, such as market opportunities, competitive threats, product introductions or enhancements and sales performance. Such adjustments could be temporarily disruptive and result in reduced productivity.
The volatility of our stock price may from time to time adversely affect our ability to attract or retain employees. If we are unable to hire or retain qualified employees across our organization, or conversely, if we fail to manage employee performance or reduce staffing levels when required by market conditions, our personnel costs would be excessive and our business and profitability could be adversely affected.
Our 2006 Long-Term Stock Incentive Plan expires during 2016. If our shareholders do not approve a new stock inventive plan it could make it more difficult to attract, retain and motivate key personnel.
Our international sales and operations are subject to factors that could have an adverse effect on our results of operations.
We have significant sales and services operations outside the United States, and derive a substantial portion of our revenues from these operations. We also plan to continue to expand our international operations. We generated approximately 42% of our revenues from outside the United States in fiscal 2016 and 43% for fiscal 2015. International revenue decreased 4% in fiscal 2016 compared to fiscal 2015. Expansion of our international operations will require a significant amount of attention from our management and substantial financial resources and might require us to add qualified management in these markets.
In addition to facing risks similar to the risks faced by our domestic operations, our international operations are also subject to risks related to the differing legal, political, social and regulatory requirements and economic conditions of many countries, including:
difficulties in staffing and managing our international operations;
foreign countries may impose additional withholding taxes or otherwise tax our foreign income, impose tariffs or adopt other restrictions on foreign trade or investment, including currency exchange controls;
difficulties in coordinating the activities of our geographically dispersed and culturally diverse operations;
general economic conditions in the countries in which we operate, including seasonal reductions in business activity in the summer months in Europe and in other periods in other countries, could have an adverse effect on our earnings from operations in those countries;
imposition of, or unexpected adverse changes in, foreign laws or regulatory requirements may occur, including those pertaining to export restrictions, privacy and data protection, trade and employment restrictions and intellectual property protections;
longer payment cycles for sales in foreign countries and difficulties in collecting accounts receivable;
competition from local suppliers;
greater risk of a failure of our employees and partners to comply with both U.S. and foreign laws, including antitrust regulations, the U.S. Foreign Corrupt Practices Act, the U.K. Bribery Act of 2010, and any trade regulations ensuring fair trade practices;
costs and delays associated with developing software in multiple languages; and
political unrest, war or acts of terrorism.
Our business in emerging markets requires us to respond to rapid changes in market conditions in those markets. Our overall success in international markets depends, in part, upon our ability to succeed in differing legal, regulatory, economic, social and political conditions. We may not continue to succeed in developing and implementing policies and strategies that will be effective in each location where we do business. Furthermore, the occurrence of any of the foregoing factors may have a material adverse effect on our business and results of operations.
We may experience fluctuations in foreign currency exchange rates that could adversely impact our results of operations.
Our international sales are generally denominated in foreign currencies, and this revenue could be materially affected by currency fluctuations. Our primary exposure is to fluctuations in exchange rates for the U.S. dollar versus the Euro and, to a lesser extent, the Australian dollar, British pound sterling, Canadian dollar, Chinese yuan, Indian rupee, Korean won and Singapore dollar. Changes in currency exchange rates could adversely affect our reported revenues and could require us to reduce our prices to remain competitive in foreign markets, which could also have a material adverse effect on our results of operations. An unfavorable change in the exchange rate of foreign currencies against the U.S. dollar would result in lower revenues when translated into U.S. dollars, although operating expenditures would be lower as well.
In recent fiscal years, we have selectively hedged our exposure to changes in foreign currency exchange rates on the balance sheet. In the future, we may enter into additional foreign currency-based hedging contracts to
reduce our exposure to significant fluctuations in currency exchange rates on the balance sheet, although there can be no assurances that we will do so. However, as our international operations grow, or if dramatic fluctuations in foreign currency exchange rates continue or increase or if our hedging strategies become ineffective, the effect of changes in the foreign currency exchange rates could become material to revenue, operating expenses, and income.
Our international sales and operations are subject to factors that could have an adverse effect on our results of operations.
We have significant sales and services operations outside the United States and derive a substantial portion of our revenues from these operations. We generated approximately 48% and 47% of our revenues from outside the United States in fiscal 2024 and fiscal 2023, respectively. International revenue increased 9% in fiscal 2024 compared to fiscal 2023. Expansion of our international operations will require a significant amount of attention from our management and substantial financial resources and might require us to add qualified management in these markets.
In addition to facing risks similar to the risks faced by our domestic operations, our international operations are also subject to risks related to the differing legal, political, social and regulatory requirements and economic conditions of many countries, including:
•adverse effects in economic conditions in the countries in which we operate related specifically to the wars in Israel and Ukraine, the COVID-19 pandemic and the governmental regulations put in place as a result of the virus, and the financial instability of banking institutions;
•difficulties in staffing and managing our international operations;
•foreign countries may impose additional withholding taxes or otherwise tax our foreign income, impose tariffs or adopt other restrictions on foreign trade or investment, including currency exchange controls;
•difficulties in coordinating the activities of our geographically dispersed and culturally diverse operations;
•general economic conditions in the countries in which we operate, including seasonal reductions in business activity in the summer months in Europe and in other periods in other countries, could have an adverse effect on our earnings from operations in those countries;
•imposition of, or unexpected adverse changes in, foreign laws or regulatory requirements may occur, including those pertaining to sanctions, export restrictions, privacy and data protection, trade and employment restrictions and intellectual property protections;
•longer payment cycles for sales in foreign countries and difficulties in collecting accounts receivable;
•competition from local suppliers;
•greater risk of a failure of our employees and partners to comply with both U.S. and foreign laws, including antitrust regulations, the U.S. Foreign Corrupt Practices Act, the U.K. Bribery Act of 2010, and any trade regulations ensuring fair trade practices;
•costs and delays associated with developing solutions in multiple languages; and
•political unrest, war or acts of terrorism.
Our business in emerging markets requires us to respond to rapid changes in market conditions in those markets. Our overall success in international markets depends, in part, upon our ability to sell our software applications is highly dependent onsucceed in differing legal, regulatory, economic, social and political conditions. We may not continue to succeed in developing and implementing policies and strategies that will be effective in each location where we do business. The occurrence of any of the quality of our service offerings, and our failure to offer high quality support and professional services wouldforegoing factors may have a material adverse effect on our sales of software applicationsbusiness and results of operations.
Our services include the assessment
Risks Related to Technology and design of solutions to meet our customers’ storage management requirements and the efficient installation and deployment of our software applications based on specified business objectives. Further, once our software applications are deployed, our customers depend on us to resolve issues relating to our software applications. A high level of service is critical for the successful marketing and sale of our software. If we or our partners do not effectively install or deploy our applications, or succeed in helping our customers quickly resolve post-deployment issues, it would adversely affect our ability to sell software products to existing customers and could harm our reputation with prospective customers. As a result, our failure to maintain high quality support and professional services would have a material adverse effect on our sales of software applications and results of operations.
A portion of our revenue is generated by sales to government entities, which are subject to a number of challenges and risks.
Sales to U.S. and foreign federal, state, and local governmental agency end-customers have accounted for a portion of our revenue, and we may in the future increase sales to government entities. However, government entities have recently announced reductions in, or experienced increased pressure to reduce spending. In particular, such measures have adversely affected European public sector transactions, and U.S. debt issues and budget concerns may adversely impact future U.S. public sector transactions. Such budgetary constraints or shifts in spending priorities of government entities may adversely affect sales of our products and services to such entities. In addition, sales to government entities are subject to a number of risks. Selling to government entities can be highly competitive, expensive and time consuming, often requiring significant upfront time and expense without any assurance that we will successfully sell our products to such governmental entity. Government entities may require contract terms that differ from our standard arrangements. Government contracts may require the maintenance of certain security clearances for facilities and employees which can entail administrative time and effort possibly resulting in additional costs and delays. In addition, government demand for our products may be more volatile as they are affected by public sector budgetary cycles, funding authorizations, and the potential for funding reductions or delays, making the time to close such transactions more difficult to predict. This risk is enhanced as the size of such sales to the government entities increases. If the use of our products expands to more sensitive, secure or mission critical uses by our government customers, we may be subject to increased scrutiny, potential reputational risk, or potential liability should our products fail to perform as expected or should we not comply with the terms of our government contracts or government contracting requirements.
Most of our sales to government entities have been made indirectly through providers that sell our products. Government entities may have contractual or other legal rights to terminate contracts with our providers for convenience or due to a default, and any such termination may adversely impact our future results of operations. Governments routinely audit and investigate government contractors, and we may be subject to such audits and investigations. If an audit or investigation uncovers improper or illegal activities, including any misuse of confidential or classified information by our employees, we may be subject to civil or criminal penalties and administrative sanctions.Security
We may be subject to information technologyIT system failures, network disruptions, cybersecurity incidents and breaches in data security.
Information technologyIT system failures, network disruptions, cybersecurity incidents and breaches of data security could disrupt our operations by causing delays or cancellation of customer orders, impeding the shipmentdelivery of software products,our solutions, negatively affecting our service offerings,customer support or professional services, preventing the processing of transactions and reporting of financial results. Information technologyresults, and disturbing our enterprise resource planning system. IT system failures, network disruptions, cybersecurity incidents and breaches of data security could also result in the unintentional disclosure of customer or our information as well as damage our reputation. While management has taken steps to address these concerns by implementing sophisticated network security, internal control measures and developed certain disaster recovery plans, thereThere can be no assurance that a system failure, network disruption, cybersecurity incident or data security breach will not have a material adverse effect on our financial condition and operating results.
Protection of our intellectual property is limited, and any misuse of our intellectual property by others could materially adversely affect our sales and results of operations.
Our success depends significantly upon proprietary technology in our software, documentation Cybersecurity breaches or incidents and other written materials. To protect our proprietary rights, we rely on a combination of:
patents;
copyright and trademark laws;
trade secrets;
confidentiality procedures; and
contractual provisions.
These methods afford only limited protection. Despite this limited protection, any issued patent may not provide us with any competitive advantages or may be challenged by third parties, and the patents of others may seriously impede our ability to conduct our business. Further, our pending patent applications may not result in the issuance of patents, and any patents issued to us may not be timely or broad enough to protect our proprietary rights. We may also develop proprietary products or technologies that cannot be protected under patent law. We also seek to maintain certain intellectual property as trade secrets. The secrecy could be compromised by outside parties, or by our employees, which would cause us to lose the competitive advantage resulting from these trade secrets.
Despite our efforts to protect our proprietary rights, unauthorized parties may attempt to copy aspects of our software applications or to obtain and use information that we regard as proprietary. Policing unauthorized use of our software applications is difficult, and we expect software piracy to continue to be a persistent problem. In licensing our software applications, we typically rely on “shrink wrap” or “click wrap” licenses that are not signed by licensees. We may have difficulty enforcing these licenses in some jurisdictions. In addition, the laws of some foreign countries do not protect our proprietary rights to as great an extent as do the laws of the United States. Our attempts to protect our proprietary rights may not be adequate. Our competitors may independently develop similar technology, duplicate our software applications or design around patents issued to us or other intellectual property rights of ours. Litigation may be necessary in the future to enforce our intellectual property rights, protect our trade secrets or determine the validity and scope of the proprietary rights of others. Litigation could result in substantial costs and diversion of resources and management attention. In addition, from time to time we are participants or members of various industry standard-setting organizations or other industry technical organizations. Our participation or membership in such organizations may, in some circumstances, require us to enter into royalty or licensing agreements with third parties regarding our intellectual property under terms established by those organizations, which we may not find favorable. In addition, many of our agreements with our customers and partners require us to indemnify them for certain intellectual property infringement claims against them, which would increase our costs as a result of defending such claims, and may require that we pay significant damages if there were an adverse ruling in any such claims. Furthermore, such customers and partners may discontinue the use of our products, services, and technologies, as a result of injunctions or otherwise, which could result in loss of revenues and adversely impact our business.
Claims that we misuse the intellectual property of othersexploited security vulnerabilities could subject us to significant liabilitycosts and disruptthird-party liabilities, result in improper disclosure of data and violations of applicable privacy and other laws, require us to change our business practices, cause us to incur significant remediation costs, lead to loss of customer confidence in, or decreased use of our products and services, damage our reputation, divert the attention of management from the operation of our business, result in significant compensation or contractual penalties from us to our customers and their business partners as a result of losses to or claims by them, or expose us to litigation, regulatory investigations, and significant fines and penalties.
Bad actors regularly attempt to gain unauthorized access to our IT systems, and many such attempts are increasingly sophisticated. These attempts, which might be related to industrial, corporate or other espionage, criminal hackers or state-sponsored intrusions, include trying to covertly introduce malware or ransomware to our environments and impersonating authorized users.
Third-party service providers that we may rely on to back up and process our confidential information may also be subject to similar threats. Such threats could result in the misappropriation, theft, misuse, disclosure, loss or destruction of the technology, intellectual property, or the proprietary, confidential or personal information, of us or our employees, customers, licensees, suppliers or partners, as well as damage to or disruptions in our IT systems. These threats are constantly evolving, increasing the difficulty of successfully defending against them or implementing adequate preventative measures. We seek to detect and investigate all cybersecurity incidents and to prevent their recurrence, but attempts to gain unauthorized access to our IT systems or other attacks may be successful, and in some cases, we might be unaware of an incident or its magnitude and effects.
In addition, any failure to successfully implement new information systems and technologies, or improvements or upgrades to existing information systems and technologies in a timely manner could adversely impact our business, internal controls, results of operations, and financial condition.
We may not be successful in our initiatives that utilize AI, which could adversely affect our business, reputation, or financial results.
There are significant risks involved in utilizing AI and no assurance can be provided that such usage will enhance our business or assist our business in being more efficient or profitable. Known risks currently include accuracy, bias, toxicity, intellectual property infringement or misappropriation, data privacy, and cybersecurity and data provenance. In addition, AI may have errors or inadequacies that are not easily detectable. For example, certain AI may utilize historical data in its analytics. To the extent that such historical data is not indicative of the current or future conditions, or models fail to filter biases in the underlying data or collection methods, such AI usage may lead us to make determinations on behalf of our business, recommendations to our clients, or developments to our products and services, in each case, that may have an adverse effect on our business and financial results. If AI models are incorrectly designed or the data used to train them is overbroad, incomplete, inadequate or biased in some way, our use may inadvertently reduce our efficiency or cause unintentional or unexpected outputs that are incorrect, do not match our business goals, do not comply with our policies or interfere with the performance of our products and services, business and reputation.
AI is a complex and rapidly evolving regulatory landscape. The use of AI may increase intellectual property, cybersecurity and data protection, operational and technological risks, and our related efforts may result in new or enhanced governmental or regulatory scrutiny, litigation, ethical concerns, or other complications that could adversely affect our business, reputation, or financial results or subject us to legal liability. In particular, technologies underlying AI and their use cases are subject to a variety of laws, including intellectual property, cybersecurity and data protection, consumer protection and equal opportunity laws. If we do not have sufficient rights to use the data on which these models rely, we may incur liability through the violation of such laws, third-party privacy or other
rights or contracts to which we are a party. Changes in laws, rules, directives and regulations may adversely affect the ability of our business to develop and use AI.
We may also market our own products as containing AI features. Some of our customers, especially those in highly regulated industries, may be reluctant or unwilling to adopt such AI features which could reduce or delay customer adoption.
Any of these factors could adversely affect our business, reputation, or financial results or subject us to legal liability.
If we fail to adapt and respond effectively to rapidly changing technology, evolving industry standards, changing regulations, or to changing customer needs, requirements, or preferences, our products may become less competitive.
Our ability to attract new users and customers and increase revenue from existing customers depends in large part on our ability to enhance, improve, and differentiate our products, increase adoption and usage of our products, and introduce new products and capabilities. The market in which we compete is subject to rapid technological change, evolving industry standards, and changing regulations, as well as changing customer needs, requirements, and preferences. The success of our business will depend, in part, on our ability to adapt and respond effectively to these changes on a timely basis. If we are unable to enhance our products and keep pace with rapid technological change, or if new technologies emerge that are able to deliver competitive products at lower prices, more efficiently, more conveniently, or more securely than our products, our business, financial condition, and results of operations could be adversely affected.
Risks Related to Legal Matters
We have been, and may in the future become, involved in litigation that may have a material adverse effect on our results of operations and financial condition.business.
DueFrom time to time, we may become involved in various other legal proceedings relating to matters incidental to the natureordinary course of our business, we may become subject to material claims of infringement by competitorsincluding intellectual property, commercial, product liability, employment, class action, whistleblower and other third parties with respect to current or future software applications, trademarks orlitigation and claims, and governmental and other proprietary rights. We expect that software developers will increasingly be subject to infringement claims as the number of software applicationsregulatory investigations and competitors in our industry segment grows and the functionality of software applications in different industry segments overlaps. Future litigation may also involve third parties such as individuals, non-practicing entities, patent holding companies, and/or patent assertion entities that have no relevant product offerings or revenue in the marketplace, and against whom our own patents may provide little or no deterrence or protection.proceedings. Such parties may purchase or otherwise obtain intellectual property assets for the purpose of monetizing these assets; they often make broad and sweeping claims of infringement against product manufacturing companies such as Commvault and its customers, seeking a percentage of sales as license fees, seeking injunctions to pressure us into taking a license, or a combination thereof. Claims such as these have increased in recent years and may continue to do so. Any such claims, whether meritorious or not, couldmatters can be time-consuming, result in costly litigation,divert management’s attention and resources and cause shipment delays or require us to enter into royalty or licensing agreements with third parties, which may notincur significant expenses. Furthermore, because litigation is inherently uncertain, there can be available on termsno assurance that we deem acceptable, if at all. In addition, we may decide to settle a claim or action against us, which settlement could be costly. We may also be liable for any past infringement. If there is an adverse ruling against us in an infringement lawsuit, an injunction could be issued barring production or salethe results of any infringing product. It could also result in a damage award equal to a reasonable royalty or lost profits or, if there is a finding of willful infringement, treble damages. Any of these claims could disrupt our business andactions will not have a material adverse effect on our business, results of operations andor financial condition.
In addition, we licenseRisks Related to Tax and use software from third parties in our business. These third-party software licenses may not continue to be available to us on acceptable terms or at all, and may expose us to additional liability. This liability, or our inability to use any of this third-party software, could result in shipment delays or other disruptions in our business that could materially and adversely affect our operating results.
Our use of “open source” software could negatively affect our business and subjects us to possible litigation.
Some of the products or technologies acquired, licensed or developed by us may incorporate so-called “open source” software, and we may incorporate open source software into other products in the future. Such open source software is generally licensed by its authors or other third parties under open source licenses, including, for example, the GNU General Public License, the GNU Lesser General Public License, the Common Public License, “Apache-style” licenses, “Berkley Software Distribution or BSD-style” licenses and other open source licenses. We monitor our use of open source software to avoid subjecting our products to conditions we do not intend, but these efforts may not be successful. Although we believe that we have complied with our obligations under the various applicable licenses for open source software that we use, there is little or no legal precedent governing the interpretation of many of the terms of certain of these licenses, and therefore the potential impact of these terms on our business is somewhat unknown and may result in unanticipated obligations regarding our products and technologies. The use of such open source software may ultimately subject some of our products to unintended conditions, which may negatively affect our business, financial condition, operating results, cash flow and ability to commercialize our products or technologies.
Some of these open source licenses may subject us to certain conditions, including requirements that we offer our products that use the open source software for no cost, that we make available source code for modifications or derivative works we create based upon, incorporating or using the open source software and/or that we license such modifications or derivative works under the terms of the particular open source license. If an author or other third-party that distributes such open source software were to allege that we had not complied with the conditions of one or more of these licenses, we could be required to incur significant legal expenses defending against such allegations. If our defenses were not successful, we could be enjoined from the distribution of our products that contained the open source software and required to make the source code for the open source software available to others, to grant third parties certain rights of further use of our software or to remove the open source software from our products, which could disrupt the distribution and sale of some of our products. In addition, if we combine our proprietary software with open source software in a certain manner, under some open source licenses we could be required to release the source code of our proprietary software. If an author or other third-party that distributes open source software were to obtain a judgment against us based on allegations that we had not complied with the terms of any such open source licenses, we could also be subject to liability for copyright infringement damages and breach of contract for our past distribution of such open source software.Accounting
Our effective tax rate is difficult to project, and changes in such tax rate or adverse results of tax examinations could adversely affect our operating results.
We are a U.S.-based multinational company subject to tax in multiple U.S. and foreign tax jurisdictions. Our results of operations would be adversely affected to the extent that our geographical mix of income becomes more weighted toward jurisdictions with higher tax rates and would be favorably affected to the extent the relative geographic mix shifts to lower tax jurisdictions. Any change in our mix of earnings is dependent upon many factors and is therefore difficult to predict.
The process of determining our anticipated tax liabilities involves many calculations and estimates that are inherently complex and make the ultimate tax obligation determination uncertain. As part of the process of preparing our consolidated financial statements, we are required to estimate our income taxes in each of the jurisdictions in which we operate prior to the completion and filing of tax returns for such periods. These estimates involve complex issues, require extended periods of time to resolve, and require us to make judgments, such as anticipating the outcomes of audits with tax authorities and the positions that we will take on tax returns prior to our actually preparing the returns. In the normal course of business, we are subject to examination by taxing authorities throughout the world. The final determination of tax audits and any related litigation could be materially different from our historical tax provisions and accruals. For further discussion on income taxes, see Note 11 of the notes to the consolidated financial statements.
Furthermore, our overall effective income tax rate and tax expenses may be affected by various factors in our business, including changes in our legalentity structure, changes in the geographic mix of income and expenses, changes in tax laws, and applicable accounting pronouncements and variations in the estimated and actual level of annual profits before income tax.
We also determine the need to record deferred tax liabilities and the recoverability of deferred tax assets. A valuation allowance is established to the extent recovery of deferred tax assets is not likely based on our estimation of future taxable income and other factors in each jurisdiction. As of March 31, 2016, we had net deferred tax assets of approximately $50.0 million, which were primarily related to stock compensation, deferred revenue and tax credits. We expect our cash taxes to continue to align with our effective tax rate over the next several years.
Our cash and cash equivalents couldreported financial results may be adversely affected ifby changes in accounting principles generally accepted in the United States.
Generally accepted accounting principles in the United States are subject to interpretation by the Financial Accounting Standards Board, the SEC, and various bodies formed to promulgate and interpret appropriate accounting principles. A change in these principles or interpretations could have a significant effect on our reported financial institutions inresults, and may even affect the reporting of transactions completed before the announcement or effectiveness of a change.
Risks Related to our Common Stock
Goodwill represents a portion of our assets and any impairment of these assets could negatively impact our results of operations.
At March 31, 2024, our goodwill was approximately $127.8 million, which we holdrepresented approximately 14% of our cash and cash equivalents fail.
Our cash and cash equivalents are highly liquid investments with original maturities of three months or lesstotal assets. We test goodwill for impairment at least annually at the time of purchase. We maintain the cash and cash equivalents with major financial institutions. Deposits with these banks exceed the Federal Deposit Insurance Corporation (“FDIC”) insurance limits or similar limits in foreign jurisdictions. While we monitor daily the cash balances in the operating accounts and adjust the balances as appropriate, these balances could be impacted if onereporting unit level, or more often if an event occurs or circumstances change that would more likely than not reduce the fair value of its carrying amount. This qualitative assessment requires us to assess and make judgments regarding a variety of factors which impact the fair value of the financial institutions with which we deposit failsreporting unit or is subject toasset being tested, including business plans, anticipated future cash flows, economic projections and other adverse conditionsmarket data. Because there are inherent uncertainties involved in the financial or credit markets. To date, we have experienced no loss or lack of access to our invested cash or cash equivalents; however, we can provide no assurance that access to our invested cashthese factors, significant differences between these estimates and cash equivalents will not be impacted by adverse conditionsactual results could result in the financialfuture impairment charges and credit markets.
We cannot predictcould materially impact our future capital needs and we may be unablefinancial results. For additional information on our goodwill impairment testing, see Note 2 of the notes to obtain financing, whichthe consolidated financial statements. Any future impairment of this asset could have a material adverse effect on our business, results of operations, and financial condition.
Wewhich may need to raise additional funds inadversely affect the future in order to acquire complementary businesses, technologies, products or services. Any required financing may not be available on terms acceptable to us, or at all. If we raise additional funds by issuing equity securities, you may experience significant dilution of your ownership interest, and the newly-issued securities may have rights senior to those of the holdersmarket price of our common stock. If we raise additional funds by obtaining loans from third parties, the terms
Impairment charges of those financing arrangements may include negative covenants or other restrictions on our business thatlong-lived assets, including assets held for sale, could impair our operational flexibility, and would also require us to fund additional interest expense. If additional financing is not available when required or is not available on acceptable terms, we may be unable to successfully develop or enhance our software and services through acquisitions in order to take advantage of business opportunities or respond to competitive pressures, which could have a material adverse effect on our software and services offerings, revenues, results of operations and financial condition.
We are subject to the risks of owning real property.
We own our corporate campus headquarters in Tinton Falls, New Jersey. We have limited experience in the ownership and management of real property. In addition, we are subject to the risks of owning real property including the possible need for structural improvements in order to comply with zoning and other legal or regulatory requirements. Furthermore, we are subject to adverse changes in the value of this property due to interest rate changes, changes in the market in which the property is located or other factors. Also, if we decide to sell our real property in the future and are not able to recover all capitalized costs, it could have a material adverse effect onadversely affect our financial condition and operating results.results of operations.
ManyWe review our long-lived assets for impairment whenever events or changes in circumstances indicate that the carrying amount of the assets may not be fully recoverable. In January 2023, we entered into an exclusive agreement to sell our owned corporate headquarters and reclassified the assets as held for sale. As a result, we evaluated the carrying value of our key financial systems used for internal purposes are cloud-based solutions provided by third parties.
Our enterprise resource planning system as well as certain other stand-alone internal financial systems are cloud-based solutions provided by third parties. The use of cloud-based systems provided by third parties exposes uslong-lived assets related to certain risksthe property and determined that the carrying value of those third parties.assets may not be fully recoverable, and as such, recorded an impairment charge of $53.5 million in the fourth quarter of fiscal 2023. As of March 31, 2024, the sale has not yet been finalized and the exclusivity of the agreement has expired. We are continuing to market the building for sale and expect the transaction to be completed within calendar year 2024. While classified as held for sale, we may need to reassess the fair value of the building at each of our reporting periods and determine whether the carrying value is recoverable. If the carrying value is not deemed to be recoverable based on current market conditions, we may be required to record additional impairment charges in the future. In addition, if certain events or changes in circumstances arise, such as being unable to sell the building within a disruption of services by these third party cloud financial system providers werereasonable timeframe or if selling the building would result in a negative economic future state, we may need to occur it couldreclassify the building from “assets held for sale” to “assets held and used,” and record a cumulative catch-up on the depreciable assets, which may have a material adverse effectimpact on our operating results and could impact the market price of our common stock. See Note 5 of the notes to the consolidated financial position,statements for additional information on our assets held for sale.
We may experience a decline in revenues or volatility in our quarterly operating results, of operations and cash flows.
If we were to borrow against our revolving credit facility, it couldwhich may adversely affect the market price of our operations and financial results and prevent us from fulfilling our obligations.
common stock.
We havecannot predict our future quarterly revenues or operating results with certainty because of many factors outside of our control. A significant revenue or profit decline, lowered forecasts or volatility in our operating results could cause the market price of our common stock to decline substantially. Factors that could affect our revenues and operating results include the following:
•the unpredictability of the timing and magnitude of orders for our solutions, particularly transactions greater than $100,000, as a $250 million revolving credit facility.majority of our quarterly revenues were earned and recorded near the end of each quarter;
•failure to develop substantial sales pipeline for our products;
•failure to attract new customers and expand sales to our existing customers, including by effectively marketing and pricing our products;
•the possibility that our customers may cancel, defer or limit purchases as a result of reduced information technology budgets;
•the possibility that our customers may defer purchases of our solutions in anticipation of new solutions or updates from us or our competitors;
•the ability of our OEMs and resellers to meet their sales objectives;
•market acceptance of our new solutions and enhancements;
•our ability to control expenses;
•changes in our pricing, packaging and distribution terms or those of our competitors; and
•the demands on our management, sales force and customer services infrastructure as a result of the introduction of new solutions or updates.
Our expense levels are relatively fixed and are based, in part, on our expectations of future revenues. If revenue levels fall below our expectations and we were to borrow substantially against this facilityare profitable at the indebtedness could have adverse consequences, including:
requiring us to dedicatetime, our net income would decrease because only a small portion of our cash flow from operations to payments of indebtedness, which would reduce the availability of cash flow to fund working capital requirements, capital expenditures and other general corporate purposes;
limitingexpenses varies with our flexibilityrevenues. Therefore, any significant decline in planningrevenues for or reacting to, general adverse economic conditions or changes in our business and the industry in which we operate;
placing us at a competitive disadvantage compared to our competitors that have less debt; and
limiting our ability to fund potential acquisitions.
Changes in existing financial accounting standards or practices, or taxation rules or practices may adversely affect our results of operations.
Changes in existing accounting or taxation rules or practices, new accounting pronouncements or taxation rules, or varying interpretations of current accounting pronouncements or taxation practiceany period could have a significantan immediate adverse effectimpact on our results of operations orfor that period. We believe that period-to-period comparisons of our results of operations should not be relied upon as an indication of future performance. Our results of operations could be below expectations of public market analysts and investors in future periods which would likely cause the manner in which we conductmarket price of our business. Further, such changes could potentially affect our reporting of transactions completed before such changes are effective.
For example, the U.S.-based Financial Accounting Standards Board (“FASB”) is currently working together with the International Accounting Standards Board (“IASB”) on several projectscommon stock to further align accounting principles and facilitate more comparable financial reporting between companies who are required to follow U.S. Generally Accepted Accounting Principles (“GAAP”) under SEC regulations and those who are required to follow IFRS outside of the U.S. These efforts by the FASB and IASB may result in different accounting principles under GAAP that may result in materially different financial results for us.
Risks from investing in growth opportunities could impact our business.
We may invest in growth opportunities, such as high-value market segments of enterprise computing, managed services and cloud computing. Even though we believe cloud computing, in its various forms, represents a long term industry trend in the way that applications are delivered, data is stored and information is retrieved, there can be no assurance that our investment in cloud, and related managed services and infrastructure management will be validated in the marketplace. Similarly, there is no assurance that our investments in high-value market segments will drive revenue growth or market share gains. Customer adoption rates and viable economic models are less certain in high-value and rapidly-growing segments, and new product and services offerings may unfavorably impact demand for our other products or services.
Risks Relating to Ownership of Our Common Stockdecline.
The price of our common stock may be highly volatile and may decline regardless of our operating performance.
The market price of our common stock could be subject to significant fluctuations in response to:
•variations in our quarterly or annual operating results;
•changes in financial estimates, treatment of our tax assets or liabilities or investment recommendations by securities analysts following our business or our competitors;
•the public’s response to our press releases, rumors, our other public announcements and our filings with the SEC;
•changes in accounting standards, policies, guidance or interpretations or principles;
•sales of common stock by our directors, officers and significant stockholders;
•announcements of technological innovations or enhanced or new products by us or our competitors;
•our failure to achieve operating results consistent with securities analysts’ projections;
•the operating and stock price performance of other companies that investors may deem comparable to us;
•broad market and industry factors;factors, including financial instability of banking institutions; and
•other events or factors, including those resulting from war, incidents of terrorism or responses to such events.
The market prices of softwaredata protection solutions companies have been extremely volatile. Stock prices of many softwareof those companies have often fluctuated in a manner unrelated or disproportionate to thetheir operating performance of such companies.performance. In the past, following periods of market volatility, stockholders have often instituted securities class
action litigation. Securities litigation could have a substantial cost and divert resources and the attention of management from our business.
Future sales of our common stock, or the perception that such future sales may occur, may cause our stock price to decline and impair our ability to obtain capital through future stock offerings.
A substantial number of shares of our common stock are available for sale into the public market. The occurrence of such sales, or the perception that such sales could occur, could materially and adversely affect our stock price and could impair our ability to obtain capital through an offering of equity securities.
Certain provisions in our charter documents and agreements and Delaware law, as well as our stockholder rights plan, may inhibit potential acquisition bids for Commvault and prevent changes in our management.
Our certificate of incorporation and bylaws contain provisions that could depress the trading price of our common stock by acting to discourage, delay or prevent a change of control of our company or changes in management that our stockholders might deem advantageous. Specific provisions in our certificate of incorporation include:
our ability to issue preferred stock with terms that the Board of Directors may determine, without stockholder approval;
a classified board in which only a third of the total board members will be elected at each annual stockholder meeting;
advance notice requirements for stockholder proposals and nominations; and
limitations on convening stockholder meetings.
In addition to the provision described above, on November 13, 2008, our Board of Directors adopted a stockholders rights plan and declared a dividend distribution of one Right for each outstanding share of our common stock to shareholders of record on November 24, 2008. Each Right, when exercisable, entitles the registered holder to purchase from us one one-thousandth of a share of Series A Junior Participating Preferred Stock, par value $0.01 per share, at a purchase price of $80 per one one-thousandth of a share, subject to adjustment. The Rights may discourage a third-party from making an unsolicited proposal to acquire us, as exercise of the Rights would cause substantial dilution to such third-party attempting to acquire us.
As a result of the provisions in our certificate of incorporation and our stockholder rights plan, the price investors may be willing to pay in the future for shares of our common stock may be limited.
Also, we are subject to Section 203 of the Delaware General Corporation Law, which imposes certain restrictions on mergers and other business combinations between us and any holder of 15% or more of our common stock. Further, certain of our employment agreements and incentive plans provide for vesting of stock options and/or payments to be made to the employees thereunder if their employment is terminated in connection with a change of control, which could discourage, delay or prevent a merger or acquisition at a premium price.
We do not expect to pay any dividends in the foreseeable future.
We do not anticipate paying any cash dividends to holders of our common stock in the foreseeable future. Consequently, investors must rely on sales of their common stock after price appreciation, which may never occur, as the only way to realize any future gains on their investment. Investors seeking cash dividends should not purchase our common stock.
Although we believe we currently have adequate internal control over financial reporting, we are required to assess our internal control over financial reporting on an annual basis, and any future adverse results from such assessment could result in a loss of investor confidence in our financial reports and have an adverse effect on our stock price.
Pursuant to Section 404 of the Sarbanes-Oxley Act of 2002 (“SOX 404”), and the rules and regulations promulgated by the SEC to implement SOX 404, we are required to furnish a report in our Form 10-K regarding the effectiveness of our internal control over financial reporting. The report’s assessment of our internal control over financial reporting as of the end of our fiscal year must include disclosure of any material weaknesses in our internal control over financial reporting identified by management. Management’s assessment of internal control over financial reporting requires management to make subjective judgments and some of our judgments will be in areasManagement has assessed that may be open to interpretation.
Although we currently believe our internal control over financial reporting is effective theand lacks any material weaknesses. Such assessment is made through subjective judgment of our management that may be open to interpretation. The effectiveness of our internal controlscontrol in the future periods is subject to the risk that oursuch internal controls may become inadequate or may not operate effectively.inadequate. In the future, years, if we fail to timely complete this assessment, or if our independent auditors cannot timely attest,are unable to express an opinion on the effectiveness of our internal controls, there may be a loss of public confidence in our internal controls,financial reporting, the market price of our stock could decline and we could be subject to regulatory sanctions or investigations by the NASDAQNasdaq Stock Market, the Securities and Exchange CommissionSEC or other regulatory authorities, which would require additional financial and management resources. In addition, anyAny failure to implement required new or improved controls, or difficulties encountered in their implementation, could harm our operating results or cause us to fail to timely meet our regulatory reporting obligations.
DuringCertain provisions of our certificate of formation and our amended and restated bylaws or Delaware law could prevent or delay a potential acquisition of control of our Company, which could decrease the trading price of our common stock.
Our certificate of formation, amended and restated bylaws and the laws in the State of Delaware contain provisions that are intended to deter coercive takeover practices and inadequate takeover bids by making such practices or bids unacceptably expensive to the prospective acquirer and to encourage prospective acquirers to negotiate with our Board of Directors rather than to attempt a hostile takeover. Delaware law also imposes restrictions on mergers and other business combinations between us and any holder of 15% or more of our outstanding common stock.
We believe that these provisions protect our shareholders from coercive or otherwise unfair takeover tactics by effectively requiring those who seek to obtain control of the Company to negotiate with our Board of Directors and by providing our Board of Directors with more time to assess any acquisition of control. However, these provisions could apply even if an acquisition of control of the Company may be considered beneficial by some shareholders and could delay or prevent an acquisition of control that our Board of Directors determines is not in the best interests of our Company and our shareholders.
General Risks
Our business could be materially and adversely affected as a result of natural disasters, terrorism or other catastrophic events.
Any economic failure or other material disruption caused by war, climate change or natural disasters, including fires, floods, hurricanes, earthquakes, and tornadoes; power loss or shortages; environmental disasters; telecommunications or business information systems failures or similar events could also adversely affect our ability to conduct business. If such disruptions result in cancellations of customer orders or contribute to a general decrease in economic activity or corporate spending on IT, or impair our ability to meet our customer demands, our operating results and financial condition could be materially adversely affected.
There is also an increasing concern over the risks of climate change and related environmental sustainability matters. In addition to physical risks, climate change risk includes longer-term shifts in climate patterns, such as extreme heat, sea level rise, and more frequent and prolonged drought. Such events could disrupt our operations or those of our customers or third parties on which we rely, including through direct damage to assets and indirect impacts from supply chain disruption and market volatility.
Our business may be adversely affected by the impact of the wars in Israel and Ukraine and a widespread outbreak of contagious diseases, including the COVID-19 pandemic and its variants. These events may cause us or our customers to temporarily suspend operations and could adversely affect the economies and financial markets of many countries, resulting in an economic downturn that could affect demand for our solutions, our ability to collect against existing trade receivables and our operating results.
We currently, and may in the future, have assets held at financial institutions that may exceed the insurance coverage offered by the Federal Deposit Insurance Corporation (“FDIC”), the loss of which would have a severe negative affect on our operations and liquidity.
We may maintain our cash assets at financial institutions in the U.S. in amounts that may be in excess of the FDIC insurance limit of $250,000. Actual events involving limited liquidity, defaults, non-performance or other adverse developments that affect financial institutions, transactional counterparties or other companies in the financial services industry or the financial services industry generally, or concerns or rumors about any events of these kinds or other similar risks, have in the past several years, our organizational structure has increased in complexity due to compliance with tax regulations and tax accounting requirements and other regulatory and compliance requirements, including compliance with anti-corruption and anti-bribery laws such as the U.S. Foreign Corrupt Practices Act (the “FCPA”) and the UK Bribery Act of 2010 (the “UK Bribery Act”). Further, we have expanded our presencemay in the Asia-Pacific region, where business practices can differ from those in other regionsfuture lead to market-wide liquidity problems. In the event of a failure or liquidity issues of or at any of the worldfinancial institutions where we maintain our deposits or other assets, we may incur a loss to the extent such loss exceeds the FDIC insurance limitation, which could have a material adverse effect upon our liquidity, financial condition and can create internal control risks. We provide business practices trainingour results of operations.
Similarly, if our customers or partners experience liquidity issues as a result of financial institution defaults or non-performance where they hold cash assets, their ability to pay us may become impaired and could have a material adverse effect on our employees worldwide. Overall,results of operations, including the combinationcollection of increased structural complexityaccounts receivable and the ever-increasing regulatory complexity make it more critical for us to attract and retain qualified and technically competent employees.cash flows.
| | | | | |
| |
| Item 1B. | Unresolved Staff Comments |
None.
Risk Management and Strategy
Commvault has established a cybersecurity program for the benefit of the company, our customers, partners and stockholders. The cybersecurity program includes policies, processes and practices that are designed to assess, identify and manage material risks from cybersecurity threats and is integrated into our enterprise risk management program. Led by the Chief Information Security Officer (“CISO”), Commvault’s cybersecurity program leverages the National Institute of Standards and Technology ("NIST") Cybersecurity Framework, with the primary objective of securing systems and data from cyber threats. We procure security technologies, consistently work to mature our cybersecurity program, and partner with security service providers. We have established a Security Incident Response Plan ("SIRP") which outlines our processes for incident preparation, detection, analysis, containment, eradication, and post-incident analysis. In addition to the SIRP, we maintain a Crisis Management Plan to organize roles and responsibilities in the event of a crisis, a Disaster Recovery Plan to provide guidance in the recovery of systems following an outage, and a Business Continuity Plan to identify alternative means of conducting business in the event of business disruption. We partner with third parties to enhance monitoring and response capabilities and facilitate readiness activities including tabletop exercises and penetration testing. All employees are required to undergo annual security awareness training on current and potential cybersecurity threats and report suspicious activity. We also assess third-party service provider cybersecurity controls through a risk assessment questionnaire and include security and privacy terms in contracts as appropriate.
Commvault maintains a variety of third-party certifications and undergoes annual assessments for SOC 2 Type 2, ISO 27001, HIPAA, CJIS, and PCI DSS. In support of these certifications and assessments, our products also undergo security testing. Annually, internal auditors complete a risk assessment of specific business operations like privacy and sanctions compliance or travel & expense policy compliance, identify areas of heightened risk, and conduct dedicated audit engagements at the direction of Management. The findings, observations, and recommendations from these engagements are shared with Management and the Audit Committee, as appropriate.
To date, Commvault is not aware of any cybersecurity incidents that have materially affected Commvault’s financial condition or business operations. Given the increasingly complex and sophisticated cyber threat landscape, we try to be vigilant to predict and prevent attacks. Commvault has prioritized cyber resilience measures and leverages governance processes and procedures to mitigate potential business impacts if and when an adverse event occurs. Although no material impacts have been recorded to date, IT system failures, network disruptions, cybersecurity incidents, and data breaches could adversely impact our business, internal controls, results of operations, and financial condition.
For additional description of cybersecurity risks and potential related impacts on Commvault, refer to the risk factor captioned “Risks Related to Technology and Security – We may be subject to IT system failures, network disruptions, cybersecurity incidents and breaches in data security” in Part 1, Item 1A. “Risk Factors.”
Governance
Commvault’s Board of Directors (the "Board") provides oversight of Commvault’s enterprise risk management strategy, which includes risks from cybersecurity threats. The Audit Committee of the Board of Directors receives quarterly briefings on the cybersecurity program from the CISO and briefings on the Enterprise Risk Management Committee (“ERMC”) and Cybersecurity Oversight Team (“CSOT”) from the Chief Legal and Compliance Officer (“CLCO”). The Board is kept apprised of cybersecurity updates through quarterly, or as needed, reporting from the Audit Committee Chair and annual, or as needed, reporting directly to the Board from the CISO.
Commvault’s Management, including the CEO, CFO, CLCO, CISO, Chief Information Officer (“CIO”), and Senior Vice President of Engineering, is responsible for our cybersecurity risk management strategy, operational decision-making, and incident preparedness and response. The current CISO holds a Bachelor of Science in Information Technology, industry certifications such as CISSP, CISA, CISM, is affiliated with various CISO professional working groups, and has over twenty-five years of experience in information security, compliance, technology, and program management across financial, telecommunications, audit, healthcare, retail, and professional services organizations. Management ensures cybersecurity risks are communicated through the establishment of the ERMC and the CSOT and regular, or as needed, reporting to the Audit Committee and the Board. The ERMC is responsible for the implementation, maintenance, and execution of our enterprise risk management program. The ERMC meets quarterly, or as needed, to assess, consider, and manage material risks including cybersecurity threats across the business. The CSOT is responsible for the significant operational decisions in the event of an active cybersecurity incident. The CSOT meets as needed, with the Audit Committee Chair as an optional attendee, to provide counsel and foster productive communication between Management and the Board.
Our principal administrative, sales, marketing, customer support and research and development facility is located at our owned corporate headquarters in Tinton Falls, New Jersey. In January 2023, we entered into an exclusive agreement to sell the property. The exclusivity expired in January 2024 and we are currently marketing the corporate headquarters for sale. We believe the sale will be completed in calendar year 2024. Upon closing of the transaction, we intend to enter into a lease for a portion of the premises.
In addition, we have offices in the United States in California, Colorado, Florida Georgia, Illinois, Massachusetts, Minnesota, New York, Oregon, Texas, and Virginia;Texas; and outside the United States in Kanata, Ontario; Toronto, Ontario; Reading, United Kingdom; Oberhausen, Germany; Utrecht, Netherlands; Milan, Italy; Stockholm, Sweden; Zurich, Switzerland; Istanbul, Turkey; Paris, France; Madrid, Spain; Dubai,Australia, Belgium, Brazil, Canada, China, Denmark, France, Germany, India, Israel, Italy, Japan, Malaysia, Netherlands, Saudi Arabia, Singapore, South Africa, South Korea, Spain, Switzerland, Taiwan, United Arab Emirates; Moscow, Russia; Warsaw, Poland; Johannesburg, South Africa; Riyadh, Saudi Arabia; Tel Aviv, Israel; Beijing, China; Shanghai, China; Guangzhou, China; Chengdu, China; Hong Kong; Sydney, Australia; Melbourne, Australia; Canberra, Australia; Auckland, New Zealand; Tokyo, Japan; Singapore; Mexico City, Mexico; Kuala Lumpar, Malaysia; Bangkok, Thailand; Sao Paulo, Brazil; Seoul, South Korea; Mumbai, India; New Delhi, India; Bangalore, India;Emirates, and Hyderabad, India.United Kingdom.
From time to time, we are subject to claims in legal proceedings arising in the normal course of our business. Except as discussed below, weWe do not believe that we are currently party to any pending legal action that could reasonably be expected to have a material adverse effect on our business or operating results.
On September 10, 2014, a purported class action complaint was filed in the United States District Court for the District of New Jersey against the Company, our Chief Executive Officer and our Chief Financial Officer. The case is captioned In re Commvault Systems, Inc. Securities Litigation (Master File No. 3:14-cv-05628-MAS-LHG). The suit alleges that we made materially false and misleading statements, or failed to disclose material facts, regarding our financial results, business, operations and prospects in violation of Sections 10(b) and 20(a) of the Securities Exchange Act of 1934 and Rule 10b-5 promulgated thereunder. The suit asserts claims covering an alleged class period from May 7, 2013 through April 24, 2014. It is purportedly brought on behalf of purchasers of our common stock during that period, and seeks compensatory damages, costs and expenses, as well as equitable or other relief. Lead plaintiff, the Arkansas Teachers Retirement System, was appointed on January 12, 2015, and on March 18, 2015, an amended complaint was filed by the plaintiffs. On December 17, 2015, the defendant’s motion to dismiss the case was granted and the case dismissed; however, the plaintiffs were permitted to re-file their claim, which they did on February 5, 2016. Defendants filed another motion to dismiss on April 5, 2016, which remains pending with the court. Due to the inherent uncertainties of litigation, we cannot accurately predict the ultimate outcome of this matter. We are unable at this time to determine whether the outcome of the litigation will have a material impact on our results of operations, financial condition or cash flows.
| | | | | |
| |
| Item 4. | Mine Safety Disclosures |
Not ApplicableApplicable.
PART II
| | | | | |
| |
| Item 5. | Market for Registrant’s Common Equity, Related Stockholder Matters and Issuer Purchases of Equity Securities |
Market for our Common Stock
Our common stock is listed and traded on The NASDAQ GlobalNasdaq Stock Market under the symbol “CVLT.” The following table sets forth, for the periods indicated, the high and the low closing sales prices of our common stock, as reported on The NASDAQ Global Market.
|
| | | | | | | | | | | | | | | | |
| | | Common Stock |
| | | 2016 | | 2015 |
| | | High | | Low | | High | | Low |
| First Quarter | | $ | 47.46 |
| | $ | 42.41 |
| | $ | 70.80 |
| | $ | 46.07 |
|
| Second Quarter | | $ | 41.31 |
| | $ | 33.96 |
| | $ | 55.83 |
| | $ | 47.13 |
|
| Third Quarter | | $ | 42.91 |
| | $ | 34.54 |
| | $ | 54.03 |
| | $ | 42.88 |
|
| Fourth Quarter | | $ | 43.17 |
| | $ | 30.41 |
| | $ | 51.55 |
| | $ | 43.45 |
|
On April 29, 2016, the last reported sale price of our common stock as reported on The NASDAQ Global Market was $43.77 per share.“CVLT”.
Stockholders
As of April 29, 2016,May 9, 2024, there were approximately 5541 holders of our common stock. The number of record holders does not represent the actual number of beneficial owners of shares of our common stock because shares are frequently held in street name by securities dealers and others for the benefit of individual owners who have the right to vote their shares.
Dividend Policy
We have never paid cash dividends on our common stock, and we intend to retain our future earnings, if any, to fund the growth of our business. We therefore do not anticipate paying any cash dividends on our common stock in the foreseeable future. Our future decisions concerning the payment of dividends on our common stock will depend upon our results of operations, financial condition and capital expenditure plans, as well as any other factors that the Board of Directors, in its sole discretion, may consider relevant.
Stock Performance Graph
The graph set forth below compares the cumulative total stockholder return on our common stock between March 31, 20112019 and March 31, 2016,2024, with the cumulative total return of (i) The NASDAQ ComputerNasdaq Composite Index and (ii) The NASDAQ CompositeNasdaq Computer Index, over the same period. This graph assumes the investment of $100,000 on March 31, 20112019 in our common stock, The NASDAQNasdaq Composite Index and The NASDAQNasdaq Computer Index, and assumes the reinvestment of dividends, if any. The graph assumes the initial value of our common stock on March 31, 20112019 was the closing sales price of $39.88$64.74 per share.
The comparisons shown in the graph below are based upon historical data. The stock price performance shown in the graph below is not necessarily indicative of, nor is it intended to forecast, the future performance of our common stock. Information used in the graph was obtained from NASDAQ,Nasdaq, a source we believe to be reliable, but we are not responsible for any errors or omissions in such information.
The performance graph shall not be deemed “filed” for purposes of Section 18 of the Exchange Act or otherwise subject to the liabilities under that Section, and shall not be deemed to be incorporated by reference into any filing of Commvault under the Securities Act or the Exchange Act.
| | | | | | | | | | | | | | | | | | | | |
| 3/31/2019 | 3/31/2020 | 3/31/2021 | 3/31/2022 | 3/31/2023 | 3/31/2024 |
| Commvault | 100.00 | | 62.53 | | 99.63 | | 102.49 | | 87.64 | | 156.67 | |
| Nasdaq Composite Index | 100.00 | | 99.62 | | 171.38 | | 183.98 | | 158.12 | | 211.91 | |
| Nasdaq Computer Index | 100.00 | | 112.16 | | 196.63 | | 236.26 | | 211.45 | | 316.72 | |
|
| | | | | | | | | | | | |
| | 3/31/2011 | 3/30/2012 | 3/28/2013 | 3/31/2014 | 3/31/2015 | 3/31/2016 |
| Commvault | 100.0 |
| 124.5 |
| 205.6 |
| 162.9 |
| 109.6 |
| 108.2 |
|
| NASDAQ Composite Index | 100.0 |
| 111.2 |
| 117.5 |
| 151.0 |
| 176.2 |
| 175.1 |
|
| NASDAQ Computer Index | 100.0 |
| 119.3 |
| 111.0 |
| 145.5 |
| 174.0 |
| 184.1 |
|
Issuer Purchases of Equity Securities
During the three months ended March 31, 2016,2024, we repurchased $56.9$50.4 million of common stock, (1.6or approximately 0.5 million shares). Duringshares, under our repurchase program. As a result, $71.9 million remained available under the year ended March 31, 2016, we repurchased $91.5 millioncurrent authorization. A summary of our repurchases of common stock (2.6 million shares), underis as follows:
| | | | | | | | | | | | | | | | | | | | | | | | | | | | | |
| Period | | Total number of shares purchased | | Average price paid per share | | Total number of shares purchased as part of publicly announced programs | | Approximate dollar value of shares that may yet be purchased under the program
(in thousands) |
| January 1-31, 2024 | | 132,303 | | | $ | 78.88 | | | 132,303 | | | $ | 111,875 | | |
| February 1-29, 2024 | | 210,163 | | | 93.78 | | | 210,163 | | | 92,166 | | |
| March 1-31, 2024 | | 204,571 | | | 98.85 | | | 204,571 | | | 71,944 | | * |
| Three months ended March 31, 2024 | | 547,037 | | | $ | 92.07 | | | 547,037 | | | | |
*On April 18, 2024, the Board of Directors approved an increase in our share repurchase program. As of May 6, 2016, there is $93.1program so that $250.0 million remaining in the share repurchase program which expires on March 31, 2017.was available. The Board's authorization has no expiration date.
|
| | | | | | | | | | | | | | | | |
| Period | | Total number of shares purchased as part of publicly announced programs | | Average price paid per share | | Total of Purchases | | Approximate dollar value of shares that may yet be purchased under the program | |
| January 2016 | | 476,967 |
| | $ | 31.13 |
| | $ | 14,847,884 |
| | $ | 135,152,116 |
| |
| February 2016 | | 1,120,688 |
| | $ | 37.52 |
| | $ | 42,049,402 |
| | $ | 93,102,714 |
| |
| March 2016 | | — |
| | $ | — |
| | — |
| | $ | 93,102,714 |
| |
| Three months ended March 31, 2016 | | 1,597,655 |
| | $ | 35.61 |
| | $ | 56,897,286 |
| | | |
| | | | | |
| |
| Item 6. | Selected Financial Data[Reserved] |
The following selected financial data should be read in conjunction with our financial statements and related notes, “Risk Factors” and “Management’s Discussion and Analysis of Financial Condition and Results of Operations” included elsewhere in this Annual Report on Form 10-K. The selected statements of operations and the selected balance sheet data are derived from our audited financial statements. The historical results presented below are not necessarily indicative of the results to be expected in any future period.
|
| | | | | | | | | | | | | | | | | | | | |
| | | Year Ended March 31, |
| | | 2016 | | 2015 | | 2014 | | 2013 | | 2012 |
| | | (In thousands, except per share data) |
| Statement of Operations Data: | | | | | | | | | | |
| Revenues: | | | | | | | | | | |
| Software | | $ | 258,793 |
| | $ | 283,254 |
| | $ | 294,411 |
| | $ | 251,508 |
| | $ | 201,800 |
|
| Services | | 336,333 |
| | 324,289 |
| | 291,929 |
| | 244,342 |
| | 204,839 |
|
| Total revenues | | 595,126 |
| | 607,543 |
| | 586,340 |
| | 495,850 |
| | 406,639 |
|
| Cost of revenues: | | | | | | | | | | |
| Software | | 2,385 |
| | 2,442 |
| | 2,588 |
| | 2,863 |
| | 2,747 |
|
| Services | | 80,327 |
| | 79,626 |
| | 71,713 |
| | 62,089 |
| | 50,660 |
|
| Total cost of revenues | | 82,712 |
| | 82,068 |
| | 74,301 |
| | 64,952 |
| | 53,407 |
|
| Gross margin | | 512,414 |
| | 525,475 |
| | 512,039 |
| | 430,898 |
| | 353,232 |
|
| Operating expenses: | | | | | | | | | | |
| Sales and marketing | | 352,669 |
| | 335,980 |
| | 283,304 |
| | 247,696 |
| | 219,025 |
|
| Research and development | | 69,287 |
| | 64,143 |
| | 55,134 |
| | 47,356 |
| | 39,936 |
|
| General and administrative | | 78,848 |
| | 78,063 |
| | 67,106 |
| | 50,119 |
| | 40,619 |
|
| Depreciation and amortization | | 9,611 |
| | 8,505 |
| | 6,075 |
| | 4,832 |
| | 4,353 |
|
| Total operating expenses | | 510,415 |
| | 486,691 |
| | 411,619 |
| | 350,003 |
| | 303,933 |
|
| | | | | | | | | | | |
| Income from operations | | 1,999 |
| | 38,784 |
| | 100,420 |
| | 80,895 |
| | 49,299 |
|
| Interest expense | | (933 | ) | | (665 | ) | | — |
| | — |
| | (57 | ) |
| Interest income | | 862 |
| | 773 |
| | 890 |
| | 1,059 |
| | 750 |
|
| Equity in loss of affiliate | | (83 | ) | | — |
| | — |
| | — |
| | — |
|
| Income before income taxes | | 1,845 |
| | 38,892 |
| | 101,310 |
| | 81,954 |
| | 49,992 |
|
| Income tax expense | | 1,709 |
| | 13,242 |
| | 37,246 |
| | 28,745 |
| | 18,052 |
|
| Net income | | $ | 136 |
| | $ | 25,650 |
| | $ | 64,064 |
| | $ | 53,209 |
| | $ | 31,940 |
|
| Net income per common share: | | | | | | | | | | |
| Basic | | $ | 0.00 |
| | $ | 0.56 |
| | $ | 1.36 |
| | $ | 1.17 |
| | $ | 0.72 |
|
| Diluted | | $ | 0.00 |
| | $ | 0.54 |
| | $ | 1.29 |
| | $ | 1.10 |
| | $ | 0.68 |
|
| Weighted average shares used in computing per share amounts: | | | | | | | | | | |
| Basic | | 45,159 |
| | 45,464 |
| | 46,976 |
| | 45,463 |
| | 44,089 |
|
| Diluted | | 46,489 |
| | 47,222 |
| | 49,642 |
| | 48,330 |
| | 47,201 |
|
|
| | | | | | | | | | | | | | | | | | | | |
| | | As of March 31, |
| | | 2016 | | 2015 | | 2014 | | 2013 | | 2012 |
| | | (In thousands) |
| Balance Sheet Data: | | | | | | | | | | |
| Cash and cash equivalents | | $ | 288,107 |
| | $ | 337,673 |
| | $ | 457,733 |
| | $ | 433,964 |
| | $ | 297,088 |
|
| Short-term investments | | 99,072 |
| | 49,936 |
| | 24,976 |
| | 1,948 |
| | 3,146 |
|
| Working capital | | 252,413 |
| | 267,480 |
| | 387,004 |
| | 343,094 |
| | 222,301 |
|
| Total assets | | 714,573 |
| | 713,466 |
| | 755,384 |
| | 604,854 |
| | 432,688 |
|
| Deferred revenue | | 244,866 |
| | 229,735 |
| | 209,575 |
| | 184,270 |
| | 147,373 |
|
| Total stockholders’ equity | | 396,268 |
| | 407,010 |
| | 462,578 |
| | 354,017 |
| | 229,984 |
|
| | | | | |
| |
| Item 7. | Management’s Discussion and Analysis of Financial Condition and Results of Operations |
You should read the following discussion and analysis along with our consolidated financial statements and the related notes included elsewhere in this Annual Report on Form 10-K. The statements in this discussion regarding our expectations of our future performance, liquidity and capital resources, and other non-historical statements are forward-looking statements. These forward-looking statements are subject to numerous risks and uncertainties, including, but not limited to, the risks and uncertainties described under “Risk Factors” and elsewhere in this Annual Report on Form 10-K. Our actual results may differ materially from those contained in or implied by any forward-looking statements. For discussion comparing the period ended March 31, 2023 to March 31, 2022, please refer to our Annual Report on Form 10-K, filed with the SEC on May 5, 2023.
Overview
Incorporated in Delaware in 1996, Commvault Systems, Inc. provides its customers with a scalable platform that enhances customers' cyber resiliency by protecting their data in a world of increasing threats. We provide these products and services for their data across many types of environments, including on-premises, hybrid and multi-cloud. Our offerings are a leading provider of data and information managementdelivered via self-managed software, applications and related services. Our softwaresoftware-as-a-service ("SaaS"), integrated appliances, or managed by partners. Customers use our Commvault Cloud platform is an enterprise level, integrated data and information management solution, built from the ground up on a single platform and unified code base. Our platform contains software functionality that that works together seamlessly, sharing a single code and common function set to deliver Data Protection - Backup & Recovery; Cloud and Infrastructure Management; and Retention and Compliance across physical, virtual and cloud environments. All software functionality share the same back-end technologies to deliver the benefits of a holistic approach to protecting, managing, and accessing data. Our software addresses many aspects of data management in the enterprise, while providing scalability and control of data and information. Key features of our software platform include:
Data protection solutions supporting all major operating systems, applications, and databases on virtual and physical servers, NAS shares, cloud-based infrastructures, and mobile devices;
Management through a single console; view, manage, and access all functions and all data and information across the enterprise;
Multiple protection methods including backup and archive, snapshot management, replication, and content indexing for eDiscovery;
Efficient storage management using deduplication for disk, tape and cloud;
Integration with the industry's top storage arrays to automate the creation of indexed, application-aware hardware snapshot copies across multi-vendor storage environments;
Complete virtual infrastructure management supporting multiple hypervisors, including VMware and Hyper-V;
Security capabilities to limit access to critical data, provide granular management capabilities, and provide single sign on access for Active Directory users;
Policy based data management, allowing users to manage data based on business needs and not physical location; and
An end-user experience that allows them to protect findthemselves from threats like ransomware and recover their own data using common tools such as web browsers, Microsoft Outlook and File Explorer.efficiently.
Industry
Our software enables our customers to simply and cost effectively protect and manage their enterprise data throughout its lifecycle, from the mobile worker to the remote office, to the data center, covering the leading operating systems, relational databases, virtualized environments and applications. In addition to addressing today’s data and information management challenges, our customers can realize lower capital costs through more efficient use of their enterprise-wide storage infrastructure assets. This includes the automated movement of data from higher cost to lower cost storage devices throughout its lifecycle, and through sharing and better utilization of storage resources across the enterprise. We can also provide our customers with reduced operating costs through a variety of methods, including fast application deployment, reduced training time, lower cost of storage media consumables, proactive monitoring and analysis, and lower administrative overhead. We also provide our customers with a broad range of professional services that are delivered by our worldwide support and field operations. As of March 31, 2016 we had licensed our software applications to over 22,500 registered customers.
History and Background
In early 2000, we launched Commvault Galaxy for backup and recovery, a storage industry award winner. In the years since, Commvault has forged numerous alliances with top software application and hardware vendors, such as HP, Hitachi Data Systems, Microsoft, Network Appliance, Fujitsu, Novell and Oracle, to enhance capabilities and to create a premiere suite of data and information management solutions. In 2002, we launched our single-platform technology that provides the foundation of our information management approach to storing, managing, and accessing data. In addition to Data Protection - Backup & Recovery, the subsequent release of our other software application technologies has increased our addressable market. Each software technology can be used individually or in combination with other technologies from our single platform suite.
Our software licenses typically provide for a perpetual right to use our software and are sold on a per terabyte capacity basis, on a per-copy basis, as site licenses or as a solution set. During the fiscal year ended March 31, 2016, approximately 73% of software license revenue was sold on a capacity basis. Capacity based software licenses provide our customers with unlimited licenses of specified software products based on a defined level of terabytes of data under management. As a result, when we sell our platform through a capacity license, certain of the various Commvault functionalities are bundled into one capacity based price. We anticipate that capacity based licenses will continue to account for the majority of our software license revenue for the near future. Site licenses give the customer the additional right to deploy the software on a limited basis during a specified term. Our primary solution sets in our software suite include virtual machine backup, recovery and cloud management; endpoint data protection; and email archive. These solution sets can be individually deployed or combined as part of a comprehensive data protection and information management solution. Our solution sets are generally sold on a per unit basis such as per virtual machine for our virtual machine backup, recovery and cloud management solution set; per mailbox for our email archive solution set and per user for our endpoint data protection solution set.
Historically, an insignificant amount of our revenue has been sold under subscription, or term based, license arrangements. In these arrangements, the customer generally has the right to use the software on either a capacity basis or per-copy or per-unit basis over a designated period of time. Revenue in these arrangements is recognized ratably over the term of the agreement. Over the next several years we expect revenue from these types of arrangements to become a more significant portion of our total revenue.
The industry in which we currently operate continues to go through accelerating changes as the result of compounding data growth, increasing security threats, and the introduction of new technologies. WeThese changes are continuing to pursue an aggressive product development program in both data and information management solutions. Our data management solutions include not only traditional backup, but also new innovations in de-duplication, data movement, virtualization, snap-based backups and enterprise reporting. Our information management innovations are primarily inshifting the areasdemands on the importance of archiving, eDiscovery, records management, governance, operational reporting and compliance. We remain focused on both the data and information management trends in the marketplace and, in fact, a material portion of our existing research and development expenses are utilized toward the development of such new technologies discussed above. While we are confident in our ability to meet these changing industry demands with our Commvault suite and potential future releases, the development, release and timing of any features or functionality remain at our sole discretion and our solutions or other technologies may not be widely adopted.
Given the nature of the industry in which we operate, our software applications are subject to obsolescence. As noted above, we continually develop and introduce updates to our existing software applications in order to keep pace with evolving industry technologies. In addition, we must address evolving industry standards, changing customer requirements and competitive software applications that may render our existing software applications obsolete. For each of our software applications, we provide full supportresilience for the current generally available releasemodern enterprise. Companies now require a comprehensive cyber resilience platform that simplifies and one prior release. When we declare a product release obsolete, a customer noticemanages these forces holistically. Commvault Cloud is delivered twelve months priordesigned to secure and accelerate the effective date of obsolescence announcing continuation of full product support for the first six months. We provide an additional six months of extended assistance support in which we only provide existing workarounds or fixesrecovery so that do not require additional development activity. We do not have existing plansdata can be restored from anywhere to make any of our software products permanently obsolete.anywhere, rapidly, reliably, and at scale.
Sources of Revenues
We derive agenerate revenues through subscription arrangements, perpetual software licenses, customer support contracts and other services. A significant portion of our total revenues comes from subscription arrangements, which include both sales of term-based licenses and SaaS offerings. We are focused on these types of recurring revenue arrangements.
We expect our subscription arrangements will continue to generate revenues from the renewals of term-based licenses and SaaS offerings sold in prior years. Any of our pricing models (capacity, instance based, etc.) can be sold via a subscription arrangement, either through term-based licensing or hosted services. In term-based license arrangements, the customer has the right to use the software applications. We do not customize ourover a designated period of time. The capacity of the license is fixed and the customer has made an unconditional commitment to pay. Software revenue in these arrangements is generally recognized when the software for a specific end-user customer. is delivered. In SaaS offerings, customers use hosted software over the contract period without taking possession of the software. Revenue related to SaaS is recognized ratably over the contract period.
We sell our software applications to end-user customers both directly through our sales force and indirectly through our global network of value-added reseller partners, systems integrators, corporate resellers, OEMs and original equipment manufacturers. Our software revenue was 43% of our total revenues for fiscal 2016, 47% for fiscal 2015 and 50% for fiscal 2014.
In recent fiscal years, we generated approximately three-quarters of our software revenue from our existing customer base and approximately one-quarter of our software revenue from new customers. In addition, our total software revenue in any particular period is, to a certain extent, dependent upon our ability to generate revenues from large customer software deals, which we refer to as enterprise software transactions. Enterprise software transactions (transactions greater than $0.1 million) represented approximately 53% of our software revenue in fiscal 2016, 56% for fiscal 2015 and 57% for fiscal 2014.
Softwaremarketplaces. Subscription revenue generated through indirect distribution channels was 86%accounted for approximately 90% of total softwaresubscription revenue in recent fiscal 2016, 82% in fiscal 2015 and 87% in fiscal 2014. Softwareyears. Subscription revenue generated through direct distribution channels was 14%accounted for approximately 10% of total softwaresubscription revenue in recent fiscal 2016, 18% in fiscal 2015 and 13% in fiscal 2014. The dollar value of software revenue generated through indirect distribution channels decreased approximately $11.4 million, or 5%, in fiscal 2016 compared to fiscal 2015. The dollar value of software revenue generated through direct distribution decreased $13.1 million, or 26%, in fiscal 2016 compared to fiscal 2015. The decrease in the dollar value of software revenue growth generated through our direct sales force
compared to our indirect distribution channels in fiscal 2016 is primarily the result of a decrease in software revenue from several large enterprise transactions which were conducted through our direct sales force in fiscal 2015.years. Deals initiated by our direct sales force are sometimes transacted through indirect channels based on end-user customer requirements, which are not always in our control and can cause this overall percentage split to vary from fiscal year to fiscal year.period-to-period. As such, there may be fluctuations in the dollars and percentage of softwaresubscription revenue generated through our direct distribution channels from time to time.time-to-time. We believe that the growth of our softwaresubscription revenue, derived from both our indirect channel partners and direct sales force, are key attributes to our long-term growth strategy. We willintend to continue to invest in both our channel relationships and direct sales force in the future, but we continue to expect more revenue to be generated through indirect distribution channels over the long term. The failure of our indirect distribution channels or our direct sales force to effectively sell our software applicationsproducts and services could have a material adverse effect on our revenues and results of operations.
Our primary original equipment manufacturer agreement is with Hitachi Data Systems (HDS) and allows them to market, sell and support our software applications and services onWe have a stand-alone basis and/or incorporate our software applications into their own hardware products. Our OEM partners, including HDS, have no obligation to recommend or offer our software applications exclusively or at all, and they have no minimum sales requirements and can terminate our relationship at any time. Sales through our original equipment manufacturer agreements accounted for 15% of our total revenues for fiscal 2016 and fiscal 2015.
We also have non-exclusive distribution agreements covering our North American commercial markets and our U.S. Federal Government marketagreement with Arrow Enterprise Computing Solutions, Inc. (“Arrow”), a subsidiary of Arrow Electronics, Inc., and Avnet Technology Solutions (“Avnet”), a subsidiary of Avnet, Inc. Pursuantpursuant to these distribution agreements, these distributors’which Arrow's primary role is to enable a more efficient and effective distribution channel for our products and servicessolutions by managing our reseller partnersresellers and leveraging their own industry experience. We generated approximately 38%36% of our total revenues through Arrow in fiscal 2016, approximately 36%2024, and 37% of our total revenues in both fiscal 20152023 and approximately 31% of our total revenues in fiscal 2014.2022. If Arrow or Avnet were to discontinue or reduce the sales of our productssolutions or if our agreement with Arrow or Avnet was terminated, and if we were unable to take back the management of our reseller channel or find another North American distributor to replace Arrow, or Avnet, then itthere could havebe a material adverse effect on our future business.
Our servicescustomer support revenue was 57% of our total revenues for fiscal 2016, 53% for fiscal 2015 and 50% for fiscal 2014. Our services revenue is made up of fees from the delivery of customerincludes support and other professional services, which are typically sold in connection with the sale ofcontracts tied to our software applications.products. Customer support agreements provide technical support and unspecifiedincludes software updates on a when-and-if-available basis, telephone support, integrated web-based support, and other premium support offerings, for an annual fee basedboth term-based software license and perpetual software license arrangements. We sell our customer support contracts as a percentage of net software. Customer support revenue is recognized ratably over the term of the customer support agreement, which is typically one year on licenses purchasedour perpetual licenses. The term of our subscription arrangements is typically one to three years, but can range between one and the levelfive years.
Our other services revenue consists primarily of professional service subscribed. Other professional services include consulting,offerings, including consultation, assessment and design, services, implementation and post-deploymentinstallation services, and training, all of which to date have predominantly been sold in connection with the sale of software applications.
Most of our customer support agreements are for a one year term. As the end of the annualeducation. Revenues from other services can vary period approaches, we pursue the renewal of the agreement with the customer. Historically, maintenance renewals have represented a significant portion of our total revenue. Because of this characteristic of our business, if our customers choose not to renew their maintenance and support agreements with us on beneficial terms, or at all, our business, operating results and financial condition could be harmed. In addition, we are currently going through a re-alignment of our maintenance pricing to be more competitive in the market and make it easier for our customers to do business with Commvault. This maintenance pricing re-alignment will phase in over the next 12 months and is primarily focusedperiod based on the mid- to lower-end oftiming services are delivered and are typically recognized as the market (non-enterprise customers) which impacts approximately a quarter of our existing maintenance revenue dollar base. If weservices are not successful with our maintenance pricing re-alignment strategy, our business and financial performance might also be adversely impacted.performed.
The gross margin of our services revenue was 76.1% for fiscal 2016, and 75.4% for fiscal 2015 and fiscal 2014. Overall, our services revenue has lower gross margins than our software revenue. The gross margin of our software revenue was 99.1% for fiscal 2016, fiscal 2015 and fiscal 2014. An increase in the percentage of total revenues represented by services revenue may adversely affect our overall gross margins.
Description of Costs and Expenses
Our cost of revenues is as follows:
•Cost of SoftwareSubscription Revenue, consists primarily of the cost of third-party royalties and other costs such as media, manuals, translation and distribution costs;costs, and
hardware associated with our appliances as well as third-party hosting fees related to our SaaS offerings;
•Cost of ServicesPerpetual License Revenue, consists primarily of the cost of third-party royalties and other costs such as media, manuals, translation and distribution costs;
•Cost of Customer Support Revenue, consists of salary and employee benefit costs in providing customer support services; and
•Cost of Other Services Revenue, consists of salary and otheremployee benefit costs in providing professional services.
Our operating expenses are as followsfollows:
•Sales and Marketing, consists primarily of salaries, commissions, employee benefits, stock-based compensation and other direct and indirect business expenses, including travel and related expenses, sales promotion expenses, public relations expenses and costs for marketing materials and other marketing events (such as trade shows and advertising);
•Research and Development, which is primarily the expense of developing new software applications and modifying existing software applications, consists principally of salaries, stock-based compensation and benefits for research and development personnel and related expenses; contract labor expense and consulting fees as well as other expenses associated with the design, certification and testing of our software applications; and legal costs associated with the patent registration of such software applications;
•General and Administrative, consists primarily of salaries, stock-based compensation and benefits for our executive, accounting, human resources, legal, information systems and other administrative personnel. Also included in this category are other general corporate expenses, such as outside legal and accounting services, compliance costs and insurance; and
•Depreciation and Amortization, consists of depreciation expense primarily for our owned Corporate Campus Headquarters location and computer equipment we use for information services and in our development and test labs.
labs, amortization of intangible assets, and in fiscal years 2023 and 2022, depreciation for our owned corporate headquarters.Foreign Currency Exchange Rates’ Impact on Results of Operations
Sales outside the United States were approximately 42%48% of our total revenue for fiscal 2016, 43%2024, 47% for fiscal 20152023 and 48% for fiscal 2014.2022. The income statements of our non-U.S. operations are translated into U.S. dollars at the average exchange rates for each applicable month in a period. To the extent the U.S. dollar weakens against foreign currencies, the translation of these foreign currency denominated transactions generally results in increased revenue, operating expenses and income from operations for our non-U.S. operations. Similarly, our revenue, operating expenses and net income will generally decrease for our non-U.S. operations if the U.S. dollar strengthens against foreign currencies.
Using the average foreign currency exchange rates from fiscal 2015,2023, our software revenuetotal revenues would have been lower by $4.1 million, our cost of revenues would have been higher by $12.4 million, our services revenue would have been higher by $16.3 million, our cost of sales would have been higher by $4.2$0.1 million, and our operating expenses would have been higherlower by $17.3$1.4 million from non-U.S. operations for fiscal 2016.
Using the average foreign currency exchange rates from fiscal 2014, our software revenue would have been higher by $7.1 million, our services revenue would have been higher by $5.7 million, our cost of sales would have been higher by $1.2 million and our operating expenses would have been higher by $5.7 million from non-U.S. operations for fiscal 2015.2024.
In addition, we are exposed to risks of foreign currency fluctuation primarily from cash balances, accounts receivables and intercompany accounts denominated in foreign currencies and are subject to the resulting transaction gains and losses, which are recorded as a component of general and administrative expenses. We recognized net foreign currency transaction gainslosses of $0.2$2.4 million and $1.2 million in fiscal 2016, $0.1 million2024 and fiscal 2023, respectively, and insignificant losses in fiscal 2015, and $0.3 million in fiscal 2014.2022.
Critical Accounting Policies
In presenting our consolidated financial statements in conformity with U.S. generally accepted accounting principles ("GAAP"), we are required to make estimates and judgments that affect the amounts reported therein. Some of the estimates and assumptions we are required to make relate to matters that are inherently uncertain as they pertain to future events. We base these estimates on historical experience and on various other assumptions that we believe to be reasonable and appropriate. Actual results may differ significantly from these estimates. To the extent that there are material differences between these estimates and actual results, our future financial statement presentation, financial condition, results of operations and cash flows may be affected.
In many cases, the accounting treatment of a particular transaction is specifically dictated by GAAP and does not require management’s judgment in its application, while in other cases, significant judgment is required in selecting among available alternative accounting standards that allow different accounting treatment for similar transactions. We consider these policies requiring significant management judgment to be critical accounting policies. The following is a description of ourthese critical accounting policies that we believe require subjective and complex judgments, which could potentially have a material effect on our reported financial condition or results of operations.policies.
Revenue Recognition
We account for revenue in accordance with Accounting Standards Codification ("ASC") 606, Revenue from Contracts with Customers. Our revenue recognition policy is based on complex rules thatpolicies require us to make significant judgments and estimates. In applying our revenue recognition policy, we must determine which portions of our revenue are recognized currently (generally software related revenue) and which portions must be deferred and recognized in future periods (generally SaaS, customer support, and other services revenue). We analyze various factors including, but not limited to, the salesselling price of undelivered services when sold on a stand-alone basis, our pricing policies, the credit-worthiness of our customers, and resellers, accounts receivable aging data and contractual terms and conditions in helping us to make such judgments about revenue recognition. Changes in judgment on any of these factors could materially impact the timing and amount of revenue recognized in a given period. We recognize revenue net of sales tax.
Currently, we deriveWe generate revenues through subscription arrangements, perpetual software licenses, customer support contracts and other services. A significant portion of our total revenues comes from subscription arrangements, which include both sales of term-based licenses and SaaS offerings. We are focused on these types of recurring revenue arrangements.
We expect our subscription arrangements will continue to generate revenues from two primary sources: softwarethe renewals of term-based licenses and SaaS offerings sold in prior years. Any of our pricing models (capacity, instance based, etc.) can be sold via a subscription arrangement, either through term-based licensing or hosted services. Services includeIn term-based license arrangements, the customer support, consulting, assessment and design services, installation services and training. A typical sales arrangement includes both of these sources.
For sales arrangements involving multiple elements, we recognize revenue usinghas the residual method. Under the residual method, we allocate and defer revenue for the undelivered elements based on fair value and recognize the difference between the total arrangement fee and the amount deferred for the undelivered elements as revenue. The determination of fair value of the undelivered elements in multiple-element arrangements is based on the price charged when such elements are sold separately, which is commonly referred to as vendor-specific objective evidence (“VSOE”).
Our software licenses typically provide for a perpetual right to use the software over a designated period of time. The capacity of the license is fixed and the customer has made an unconditional commitment to pay. Software revenue in these arrangements is generally recognized when the software is delivered. In SaaS offerings, customers use hosted software over the contract period without taking possession of the software. Revenue related to SaaS is recognized ratably over the contract period.
We sell both perpetual and term-based licenses of our software. We refer to our term-based software licenses as subscription arrangements. We do not customize our software and installation services are sold on a per-copy basis, on a per terabyte capacity basisnot required. The software is delivered before related services are provided and is functional without professional services, updates and technical support. We have concluded that our software licenses (both perpetual and subscription) are functional intellectual property that is distinct, as a solution set or as site licenses. Software licenses sold on a capacity basis provide the customer with unlimited licenses of specified software products based on a defined level of terabytes of data under management. Site licenses give the customer the additional right to deployuser can benefit from the software on a limited basis during a specified term. Our solution sets are generally sold on a per unit basis suchits own. Revenues for both perpetual and term-based licenses is typically recognized when the software is delivered and/or made available for download as per virtual machine for our virtual machine backup, recoverythis is the point the user of the software can direct the use of, and cloud management solution set; per mailbox for our email archive solution set, and per user for our endpoint data protection solution set.obtain substantially all of the remaining benefits from, the functional intellectual property. We do not recognize software revenue through direct sales channels upon receiptrelated to the renewal of a purchase order or other persuasive evidence and whensubscription software licenses earlier than the other three basic revenue recognition criteria are met as described inbeginning of the revenue recognition section in Note 2 of our “Notes to Consolidated Financial Statements.”new subscription period.
We recognize software revenue through all indirect sales channels on a sell-through model. A sell-through model requiresalso offer appliances that we recognize revenue when the basic revenue recognition criteria are met and these channels complete the sale ofintegrate our software productswith hardware and address a wide-range of business needs and use cases, ranging from support for remote or branch offices with limited IT staff up to large corporate data centers. Our appliances are almost exclusively sold via a software only model in which we sell software to a third party, which assembles an integrated appliance that is sold to end user customers. As a result, the end-user. Revenue from software licenses sold through an original equipment manufacturer partner is recognized upon the receipt of a royalty report or purchase order from that original equipment manufacturer partner.revenues and costs associated with hardware are usually not included in our financial statements.
ServicesOur customer support revenue includes revenue from customer support and other professional services.contracts tied to our software products. Customer support includes software updates on a when-and-if-available basis, telephone support, integrated web-based support, and bug fixes or patches.other premium support offerings, for both term-based software license and perpetual software license arrangements. We sell our customer support contracts as a percentage of net software. Customer support revenue is recognized ratably over the term of the customer support agreement, which is typically one year. To determineyear on our perpetual licenses. The term of our subscription arrangements is typically one to three years, but can range between one and five years.
Our other services revenue consists primarily of professional service offerings, including consultation, assessment and design, installation services, and customer education. Revenues from other services can vary period over period based on the timing services are delivered and are typically recognized as the services are performed.
Most of our contracts with customers contain multiple performance obligations. For these contracts, we evaluate and account for individual performance obligations separately if they are determined to be distinct. The transaction price is allocated to the separate performance obligations on a relative standalone selling price basis. Standalone selling prices of software licenses (both perpetual and term-based) are typically estimated using the residual approach. Standalone selling prices for theSaaS, customer support element when sold separately, we primarily use historical renewal rates. Historical renewal ratescontracts, and other services are supported by a rolling 12-month VSOE analysis in which we segregate our customer support renewal contracts into different classestypically estimated based on specific criteria including, but not limited to, dollar amount of software purchased, level of customer support being provided and distribution channel. The purpose of such an analysis is to determine if the customer support element that is deferred at the time of a software sale is consistent with how it isobservable transactions when these services are sold on a stand-alone renewalstandalone basis.
Our other professional servicestypical performance obligations include consulting; implementation and post deployment services; and education services. Other professional services provided by us are not mandatory and can also be performed by the customer or a third-party. In addition to a signed purchase order, our consulting, assessment and design services and installation services are, in some cases, evidenced by a Statement of Work, which defines the specific scope of the services to be performed when sold and performed on a stand-alone basis or included in multiple-element sales arrangements. Revenues from consulting, assessment and design services and installation services are based upon a daily, weekly or monthly rate and are recognized when the services are completed. Training includes courses taught by our instructors or third-party contractors either at one of our facilities or at the customer’s site. Training fees are recognized as revenue after the training course has been provided. Based on our analysis of such other professional services transactions sold on a stand-alone basis, we have concluded we have established VSOE for such other professional services when sold in connection with a multiple-element sales arrangement.following:
In summary, we have analyzed all of the undelivered elements included in our multiple-element sales arrangements and determined that we have VSOE of fair value to allocate revenues to services. Our analysis of the undelivered elements has provided us with results that are consistent with the estimates and assumptions used to determine the timing and amount of revenue recognized in our multiple-element sales arrangements. Accordingly, assuming all basic revenue recognition criteria are met, software revenue is recognized upon delivery of the software license using the residual method. We are not likely to materially change our pricing and discounting practices in the future.
Our sales arrangements generally do not include acceptance clauses. However, if an arrangement does include an acceptance clause, we defer the revenue for such an arrangement and recognize it upon acceptance. Acceptance occurs upon the earliest of receipt of a written customer acceptance, waiver of customer acceptance or expiration of the acceptance period.
Stock-Based Compensation
As of March 31, 2016, we maintain two stock incentive plans, which are described more fully in Note 8 of our “Notes to Consolidated Financial Statements.” We account for our stock incentive plans based on the grant date fair value recognition provisions in accordance with ASC 718. Compensation for share-based payment awards is generally recognized on a straight-line basis over the requisite service period of the awards, which is generally the vesting period. However, awards granted to senior executives that include market or performance conditions are recognized using the accelerated method.
We estimated the fair value of stock options granted using the Black-Scholes formula. The fair value of restricted stock units awarded is determined based on the number of shares granted and the closing price of our common stock on the date of grant. We expect in the future that we will no longer grant stock options and all awards will be granted as restricted stock units.
We incorporate our historical data into the expected term calculation for stock options granted. As a result, our calculation of expected term includes a combination of actual exercise data and an assumption on when the remaining outstanding options with similar characteristics will be exercised based on our historical data. In determining expected life, we separate employees into groups that have historically exhibited similar behavior with regard to option exercises. Expected volatility is calculated based on a blended approach that includes the implied volatility of our traded options with a remaining maturity greater than six months and the historical realized volatility of our common stock. The risk-free interest rate is determined by reference to U.S. Treasury yield curve rates with a remaining term that is approximately the expected life assumed at the date of grant. Forfeitures are estimated based on our historical analysis of actual stock option forfeitures. The assumptions used in the Black-Scholes option-pricing model in the fiscal years ended March 31, 2016 and 2015 are as follows:
| | | | | | | | | | | |
| Performance Obligation | When Performance Obligation
is Typically Satisfied | When Payment is
Typically Due | How Standalone Selling Price is
Typically Estimated |
| Subscription |
| Term-based software licenses | Upon shipment or made available for download (point in time) | Within 90 days of shipment except for certain subscription licenses which are paid for over time | Residual approach |
| Software-as-a-service (SaaS) | Ratably over the course of the contract (over time) | Annually or at the beginning of the contract period | Observable in transactions without multiple performance obligations |
| Perpetual License |
| Perpetual software licenses | Upon shipment or made available for download (point in time) | Within 90 days of shipment | Residual approach |
| Customer Support |
| Software updates | Ratably over the course of the support contract (over time) | At the beginning of the contract period | Observable in renewal transactions |
| Customer support | Ratably over the course of the support contract (over time) | At the beginning of the contract period | Observable in renewal transactions |
| Other Services |
| Other professional services (except for education services) | As work is performed (over time) | Within 90 days of services being performed | Observable in transactions without multiple performance obligations |
| Education services | When the class is taught (point in time) | Within 90 days of services being performed | Observable in transactions without multiple performance obligations |
|
| | | | |
| | | Year Ended March 31, |
| | | 2016 | | 2015 |
| Dividend yield | | None | | None |
| Expected volatility | | 39% - 43% | | 41% - 47% |
| Weighted average expected volatility | | 41% | | 46% |
| Risk-free interest rates | | 1.29% - 1.75% | | 1.22% - 2.18% |
| Weighted average expected life (in years) | | 4.6 | | 5.7 |
The weighted average fair value of stock options granted was $15.20 per option during the year ended March 31, 2016 and $20.16 per option during the year ended March 31, 2015. In addition, the weighted average fair value of restricted stock units awarded was $37.27 per share during the year ended March 31, 2016 and $46.62 per share during the year ended March 31, 2015.
In October 2015, we granted 133,000 market performance stock units to certain executives. The vesting of these awards is contingent upon meeting certain total shareholder return (TSR) levels as compared to a market index over the next three years. The awards vest in 3 annual tranches and have a maximum potential to vest at 200% (266,000 shares) based on TSR performance. The related stock-based compensation expense is determined based on the estimated fair value of the underlying shares on the date of grant and is recognized using the accelerated method over the vesting term. The estimated fair value was calculated using a Monte Carlo simulation model. The fair value of the awards granted in October was $42.69.
As of March 31, 2016, there was approximately $105.5 million of unrecognized stock-based compensation expense related to all of the Company's employee stock plans, net of estimated forfeitures, that is expected to be recognized over a weighted average period of 2.15 years. The intrinsic value of the options outstanding as of March 31, 2016 was $53.2 million, of which $52.8 million related to vested options and $0.4 million related to unvested options. We anticipate that future grants under our stock incentive plans will include restricted stock units.
Accounting for Income Taxes
As part of the process of preparing our financial statements, we are required to estimate ourUnder ASC 740, deferred income taxes arise from temporary differences between the tax basis of assets and liabilities and their reported amounts. Valuation allowances are established when, in each of the jurisdictions in which we operate. This process involves estimating our actual currentjudgment, it is more likely than not that deferred tax exposure, includingassets will not be realized. In assessing the need for a valuation allowance, we considered all available objective and verifiable evidence both positive and negative, including historical levels of pre-tax income (loss) both on a consolidated basis and tax reporting entity basis, legislative developments, expectations and risks associated with estimates of future pre-tax income, and prudent and feasible tax audits, and assessing temporary differences resulting from different treatmentplanning strategies. In prior years, we believed that it was more likely than not that we would not realize the benefits of items for tax and accounting purposes. These differences result inour gross deferred tax assets and liabilities. Astherefore had recorded a valuation allowance to reduce the carrying value of March 31, 2016, we had netthose deferred tax assets, net of approximately $50.0 million, which were primarily relatedthe impact of the reversals of taxable temporary differences, to stock-based compensation, deferred revenuezero. As and tax credits. We assessfor the likelihood that our deferred tax assets will be recovered from future taxable income, and to the extent that we believe recovery is not likely, we establish a valuation allowance. During thefiscal year ended March 31, 2016,2024, we increasedbelieve that it is more likely than not that we will realize the valuation allowance by $1.4 million againstbenefits of our gross deferred tax assets which now totals $2.8 million. All ofand therefore we have released the previously recorded valuation allowance, we have recorded at March 31, 2016 is relatedresulting in an income tax benefit in the current period. In the future, changes to New Jersey state research tax credits due to uncertainties related to the ability to utilize such state research tax credits before they expire. We based our valuation allowance on our estimates regarding the realizability of taxable income by legal entity and the period over which our state researchgross deferred tax credits will be recoverable.
At March 31, 2016, we have federal and state research tax credit ("R&D") carryforwardsassets could materially impact our results of approximately $3.4 million and $3.9 million, respectively. The federal research tax credit carryforwards expire from 2025 through 2036, and the state research tax credit carryforwards expire from 2016 through 2023. At March 31, 2016, we have federal Alternative Minimum Tax credit carryforwards of $1.1 million.
As of March 31, 2016, we had unrecognized tax benefits of $2.0 million, all of which, if recognized, would favorably affect the effective tax rate. In addition, we have accrued interest and penalties of $0.3 million related to the unrecognized tax benefits. Interest and penalties, if any, related to unrecognized tax benefits are recorded in income tax expense.operations.
We conduct business globally and as a result, file income tax returns in the United States and in various state and foreign jurisdictions. In the normal course of business, we are subject to examination by taxing authorities throughout the world, including such major jurisdictions as the United States, Australia, Canada, Germany, Netherlands and United Kingdom. The following table summarizes
Goodwill
We test goodwill for impairment at least annually, on January 1, by performing a qualitative assessment of whether the taxfair value of each reporting unit or asset exceeds its carrying amount. We have one reporting unit. Goodwill is tested at this reporting unit level. This requires us to assess and make judgments regarding a variety of factors which impact the fair value of the reporting unit or asset being tested, including business plans, anticipated future cash flows, economic projections and other market data. Because there are inherent uncertainties involved in these factors, significant differences between these estimates and actual results could result in future impairment charges and could materially impact our future financial results. During the fourth quarter of fiscal 2024, we performed a qualitative impairment test for goodwill and concluded that the carrying amount of the reporting unit does not exceed the fair value. No goodwill impairment charges were recorded for the years in the major tax jurisdictions that remain subject to income tax examinations by tax authorities as ofended March 31, 2016. The years subject to income tax examination in our foreign jurisdictions cover the maximum time period with respect to these jurisdictions. Due to NOL carryforwards, in some cases the tax years continue to remain subject to examination with respect to such NOLs.2024, 2023, and 2022.
|
| | |
Tax Jurisdiction | Years Subject to Income
Tax Examination
|
U.S. Federal | 2013 - Present |
New Jersey | 2012 - Present |
Foreign jurisdictions | 2011 - Present |
Software Development Costs
Research and development expenditures are charged to operations as incurred. Based on our software development process, technological feasibility is established upon completion of a working model, which also requires certification and extensive testing. Costs incurred by us between completion of the working model and the point at which the product is ready for general release are immaterial.
Results of Operations
The following table sets forth eachAmounts reported in millions are rounded based on the amounts in thousands. As a result, the sum of our sources of revenues and costs of revenues for the specified periods as a percentage of our total revenues for those periods (due to rounding numberscomponents reported in columnmillions may not sumequal the total amount reported in millions due to totals):rounding.
|
| | | | | | | | | |
| | | Year Ended March 31, |
| | | 2016 | | 2015 | | 2014 |
| Revenues: | | | | | | |
| Software | | 43 | % | | 47 | % | | 50 | % |
| Services | | 57 | % | | 53 | % | | 50 | % |
| Total revenues | | 100 | % | | 100 | % | | 100 | % |
| Cost of revenues: | | | | | | |
| Software | | — | % | | — | % | | — | % |
| Services | | 13 | % | | 13 | % | | 12 | % |
| Total cost of revenues | | 14 | % | | 14 | % | | 13 | % |
| Gross margin | | 86 | % | | 86 | % | | 87 | % |
Fiscal year ended March 31, 20162024 compared to fiscal year ended March 31, 20152023
Revenues (in millions)
–Total revenues decreased $12.4increased $54.7 million, or 2%, from $607.5 million7% year over year, driven primarily by an increase in fiscal 2015 to $595.1 millionsubscription revenue, offset by decreases in fiscal 2016.perpetual license and customer support revenues. We remain focused on selling subscription arrangements through both term-based software licenses and SaaS offerings.
Software Revenue. Software–Subscription revenue decreased $24.5increased $81.4 million, or 9%, from $283.3 million23% year over year, driven primarily by an 87% increase in fiscal 2015our SaaS revenue compared to $258.8 millionthe same period in fiscal 2016. Softwarethe prior year. Term-based license revenue represented 43%increased 8% year over year, due to an increase in the number of ourlarger term-based license transactions (deals greater than $0.1 million) period over period. Subscription revenue accounted for 51% of total revenues in fiscal 20162024 compared to 47%44% in fiscal 2015.2023.
The overall–Perpetual license revenue decreased $17.3 million, or 23% year over year. This decrease is primarily a result of our preferred route to market which is led by the sale of term-based licenses. Perpetual licenses are generally only sold in softwarecertain verticals and geographies. Perpetual license revenue was primarilyaccounted for 7% of total revenues in fiscal 2024 compared to 10% in fiscal 2023.
–Customer support revenue decreased $6.5 million, or 2% year over year, driven by a decline$32.4 million decrease in the number of enterprise software transactions (transactions greater than $0.1 million), whichcustomer support revenue attached to perpetual license support renewals, partially offset by a $25.9 million increase in customer support allocated to term-based license arrangements.
–Other services revenue decreased by $22.8$2.9 million, or 14%6% year over year. Changes in fiscal 2016 compared to fiscal 2015. Enterprise software transactions represented approximately 53% and 56% of our softwareother services revenue in fiscal 2016 and fiscal 2015, respectively. The decrease in enterprise software transactions iscan vary period over period primarily due to a 10% decrease in the number of transactions of this type and a 4% decrease in the average dollar amount of such transactions. The average dollar amount of enterprise transactions was approximately $268,000 in fiscal 2016 and approximately $281,000 in fiscal 2015. Software revenue derived from transactions less than $0.1 million decreased $1.6 million, or 1%, in fiscal 2016 compared to fiscal 2015.timing professional services are delivered.
We track software revenuetotal revenues on a geographic basis. The geographic regions that are tracked areOur Americas region includes the Americas (UnitedUnited States, Canada, and Latin America), EMEA (Europe,America. Our International region primarily includes Europe, Middle East, Africa) and APAC (Australia, New Zealand,Africa, Australia, India, Southeast Asia China).and China. Americas EMEA and APACInternational represented 60%, 29%59% and 11%41% of total software revenue,revenues, respectively, for the fiscal year ended March 31, 2016. The year over year decline of Software Revenue2024. Total revenues increased 6% and 8% in the Americas EMEA and APAC was 11%, 1% and 11%,International, respectively.
Software revenue for the fiscal year ended March 31, 2016▪Total revenues in the Americas was impacted by lower productivitya 24% increase in our Americas sales organization which resulted insubscription revenue, offset by a decline in both enterprise transactions and non-enterprise transactions during fiscal 2016 compared to fiscal 2015. The45% decrease in enterprise transactionsperpetual license revenue, driven by the shift from selling perpetual licenses to subscription arrangements. Customer support and other services revenues declined 5% and 9%, respectively.
▪The increase in International total revenues was primarily due to a result of a decline21% increase in the number of enterprise transactions. The declinesubscription revenue, offset by an 8% decrease in EMEA softwareperpetual license revenue. Customer support revenue increased 2% year over year. Other services revenue was the result of changesflat year over year.
Our total revenues in foreign exchange rates as the U.S. dollar strengthened significantly against the Euro and British pound sterling. Using average foreign exchange rates from fiscal 2015, fiscal 2016 EMEA software revenue increased 8% compared to an actual reported EMEA software revenue decline of 1%. APAC software revenue was also impacted by the strengthening of the U.S. dollar. Using average foreign exchange rates from fiscal 2015, fiscal 2016 APAC software revenue decreased 1% compared to an actual reported APAC software revenue decrease of 11%. APAC software revenue was also adversely impacted by a decline in enterprise transactions. Our software revenue in EMEA and APACInternational is subject to changes in foreign exchange rates as more fullyfurther discussed above in the “Foreign“Foreign Currency Exchange Rates’ Impact on Results of Operations” section.
Software revenue derived from our indirect distribution channel (resellers
Cost of Revenues and original equipment manufacturers) decreased $11.4Gross Margin ($ in millions)
| | | | | | | | | | | | | | | | | | | | |
| | | Year Ended March 31, |
| | 2024 | | 2023 |
| | Cost of Revenues | Gross
Margin | | Cost of Revenues | Gross
Margin |
| Subscription | | $ | 58.4 | | 86 | % | | $ | 44.5 | | 87 | % |
| Perpetual license | | 2.2 | | 96 | % | | 2.4 | | 97 | % |
| Customer support | | 60.8 | | 80 | % | | 58.3 | | 81 | % |
| Other services | | 30.3 | | 32 | % | | 30.2 | | 37 | % |
| Total | | $ | 151.6 | | 82 | % | | $ | 135.4 | | 83 | % |
–Total cost of revenues increased $16.2 million or 5% in fiscal 2016 compared to fiscal 2015, and software revenue through our direct sales force decreased $13.1 million, or 26% in fiscal 2016 compared to fiscal 2015. For additional discussion on software revenue derived from our direct sales force see the “Sources of Revenue” section.
Services Revenue. Services revenue increased $12.0 million, or 4%, from $324.3 million in fiscal 2015 to $336.3 million in fiscal 2016. Services revenue represented 57%18% and 17% of our total revenues in fiscal 2016 compared to 53% in2024 and fiscal 2015. The net increase in services revenue is due to a $15.2 million increase in revenue from customer support agreements as a result of software sales to new customers and renewal agreements with our installed software base.2023, respectively.
–Cost of Revenues
Total cost of revenuessubscription revenue increased $0.6$13.9 million, or 1%, from $82.1 million in fiscal 2015 to $82.7 million in fiscal 2016. Total cost of revenues representedrepresenting 14% of our total revenuessubscription revenue in both fiscal 2016 and2024 compared to 13% in fiscal 2015.2023. The year over year increase is primarily the result of an increase in the cost of infrastructure related to growth in our SaaS offerings.
–Cost of Software Revenue.perpetual license revenue decreased $0.3 million and represented 4% of our total perpetual revenue in fiscal 2024 compared to 3% in fiscal 2023.
–Cost of softwarecustomer support revenue was $2.4increased $2.5 million and represented 20% of our total customer support revenue in both fiscal 2016 and 2015, representing approximately 1% of software revenue.2024 compared to 19% in fiscal 2023.
–Cost of Services Revenue. Cost ofother services revenue increased $0.7$0.1 million, or 1%, from $79.6 million in fiscal 2015 to $80.3 million in fiscal 2016. Costrepresenting 68% of services revenue represented 24% and 25% of our total other services revenue in fiscal 2016 and2024 compared to 63% in fiscal 2015, respectively.2023. The increase in cost of other services revenue was driven by timing of the delivery of certain professional services.
Operating Expenses ($ in millions)
–Sales and marketing expenses increased $16.7$14.2 million, or 5%4%, from $336.0driven by increases in employee compensation and sales commissions associated with increased revenues relative to the same period in the prior year as well as increases in marketing spend related to Commvault's SHIFT event in New York City. These increases were partially offset by a $6.5 milliondecrease in fiscal 2015stock-based compensation.
–Research and development expenses decreased $9.5 million, or 7%, driven by decreases in employee compensation and related expenses, including a $7.0 million decrease in stock-based compensation. Investing in research and development remains a priority for Commvault and we anticipate continued responsible spending related to $352.7the development of our software applications and hosted services.
–General and administrative expenses increased $9.8 million, in fiscal 2016. The increase isor 9%, primarily due todriven by a $16.3$4.4 million increase in employee compensation and related expenses attributableincluding a $1.3 million increase in stock-based compensation year over year. In addition, we recorded $2.4 million in foreign currency transaction losses compared to $1.2 million in foreign currency transaction losses recorded in the expansionprior fiscal year.
–Restructuring: Our restructuring plan, initiated in the fourth quarter of fiscal 2024, is intended to enhance customer satisfaction through the reorganization and redesign of our sales force fromcustomer success functions. The realignment of the prior year. Salescustomer success structure aims to optimize operational efficiency and marketingimprove continuity for our customers through the pre-sales and post-sales experience. Restructuring expenses were $4.5 million for the year ended March 31, 2024. These charges relate primarily to severance and related costs associated with headcount reductions as a percentage of total revenues increased to 59% in fiscal 2016 compared to 55% in fiscal 2015, primarily due to higher compensationwell as costs as a percentage of total revenues related to our field sales teams.
Researchoffice termination and Development. Research and developmentexit charges. These expenses increased $5.1 million, or 8%, from $64.1included $1.5 million in fiscal 20152024 of stock-based compensation related to $69.3modifications of existing awards granted to certain employees impacted by the plan. We anticipate the restructuring plan will be completed in the second half of fiscal 2025.
In the fourth quarter of fiscal 2022 we initiated a restructuring plan which was completed in fiscal 2023. It was aimed to increase efficiency in our sales, marketing and distribution functions as well as reduce costs across all functional areas. Restructuring expenses were $15.5 million for the year ended March 31, 2023. These restructuring charges relate primarily to severance and related costs associated with headcount reductions. These expenses included $2.6 million in fiscal 2016. The increase is primarily2023 of stock-based compensation related to modifications of existing awards granted to certain employees impacted by the plan.
Risks associated with our restructuring plans include additional unexpected costs, adverse effects on employee morale and the failure to meet operational and growth targets due to a $4.8the loss of key employees, any of which may impair our ability to achieve anticipated results of operations or otherwise harm our business.
–Depreciation and amortization expense decreased $2.9 million, increase in employee compensation and related expenses attributable to the expansion of our engineering group from the prior year. Research and development expenses as a percentage of total revenues increased to 12% in fiscal 2016 compared to 11% in fiscal 2015. Investing in research and development has been a priority for Commvault, and we anticipate continued spending related to the development of our data and information management software applications.
General and Administrative. General and administrative expenses increased $0.8 million, or 1%, from $78.1$9.3 million in fiscal 20152023 to $78.8$6.4 million in fiscal 2016. This increase is primarily due2024, driven by the reclassification of our owned corporate headquarters as assets held for sale in the fourth quarter of fiscal 2023.
–Impairment charges: During the fourth quarter of fiscal 2023, we entered into an exclusive agreement to a $4.5 million increase in employee and related compensation due to higher headcount which is partially offset by a $3.6 million decline in expenses related tosell our move to a newowned corporate headquarters in fiscal 2015. GeneralTinton Falls, New Jersey. The property was reclassified as assets held for sale and administrative expensesthe previous carrying amount was written down to its estimated fair value, less estimated costs to sell, resulting in fiscal 2016 also includes $0.2 milliona noncash impairment charge of net foreign currency transaction gains compared to $0.1 million of net foreign currency transaction gains recognized in general and administrative expenses in fiscal 2015. General and administrative expenses as a percentage of total revenues was 13% in both fiscal 2016 and fiscal 2015.$53.5 million.
Depreciation and Amortization. Depreciation expenseInterest Income
Interest income increased $1.1$4.1 million, from $8.5$1.3 million in fiscal 20152023 to $9.6$5.4 million in fiscal 2016. The increase in depreciation expense is the2024 primarily as a result of increases in interest rates and the moveamount of invested funds subject to our new corporate campus headquarters in the third quarter of fiscal 2015.interest income.
Interest Expense
Interest expense of $0.9 million in fiscal 2016 was related to the amortization of debt issuance costs and commitment fees related to our Revolving Credit Facility. If we were to borrow against the facility in the future we would incur additional interest expense.
Interest Income
Interest income increased $0.1 million, from $0.8 million in fiscal 2015 to $0.9 million in fiscal 2016.
Income Tax Expense
Income tax expense was $1.7 million in fiscal 2016 compared to $13.2 million in fiscal 2015. The decline in income tax expense is the result of a decline in income before taxes. The effective tax rate in fiscal 2016 was 93% as compared to 34% in fiscal 2015. In fiscal 2016, the effective tax rate is higher than the statutory rate due to the amount of unfavorable permanent differences and an increase to the valuation allowance for New Jersey research tax credits. The Company increased the valuation allowance $1.4 million in fiscal 2016 due to lower estimates of forecasted New Jersey taxable income in the periods prior to the research tax credits expiration.
In fiscal 2015, the effective tax rate is lower than the statutory rate due to the impact of domestic production deduction, foreign tax credits and release of reserves, partially offset by state income taxes and permanent differences in both the United States and foreign jurisdictions.
Fiscal year ended March 31, 2015 compared to fiscal year ended March 31, 2014
Revenues
Total revenues increased $21.2 million, or 4%, from $586.3 million in fiscal 2014 to $607.5 million in fiscal 2015.
Software Revenue. Software revenue decreased $11.2 million, or 4%, from $294.4 million in fiscal 2014 to $283.3 million in fiscal 2015. Software revenue represented 47% of our total revenues in fiscal 2015 compared to 50% in fiscal 2014.
The overall decrease in software revenue was primarily driven by a decline in the number of enterprise software transactions (transactions greater than $0.1 million), which decreased by $9.3 million, or 6% in fiscal 2015 compared to fiscal 2014. Enterprise software transactions represented approximately 56% and 57% of our software revenue in fiscal 2015 and fiscal 2014, respectively. The decrease in enterprise software transactions is due to a 9% decrease in the number of transactions of this type partially offset by a 3% increase in the average dollar amount of such transactions. The average dollar amount of enterprise transactions was approximately $281,000 in fiscal 2015 and approximately $272,000 in fiscal 2014. Software revenue derived from transactions less than $0.1 million decreased $1.8 million, or 1%, in fiscal 2015 compared to fiscal 2014.
We track software revenue on a geographic basis. The geographic regions that are tracked are the Americas (United States, Canada, Latin America), EMEA (Europe, Middle East, Africa) and APAC (Australia, New Zealand, Southeast Asia, China). Americas, EMEA and APAC represented 61%, 27% and 12% of total software revenue, respectively, for the fiscal year ended March 31, 2015. The year over year growth (decline) of Software Revenue in the Americas, EMEA and APAC was (6%), (4%) and 9%, respectively, resulting in consolidated Software Revenue decline of 4%.
Software revenue growth for the fiscal year ended March 31, 2015 in the Americas was impacted by lower productivity in our Americas sales organization which resulted in a decline in both enterprise transactions and non-enterprise transactions during fiscal 2015 compared to fiscal 2014. The decrease in enterprise transactions was a result of a decline in the number of enterprise transactions partially offset by a modest increase the average dollar amount of enterprise transactions. The decline in EMEA software revenue was primarily the result of changes in foreign exchange rates as the U.S. dollar strengthened significantly against the Euro and British pound sterling. Using average foreign exchange rates from fiscal 2014, fiscal 2015 EMEA software revenue increased 2% compared to an actual reported EMEA software revenue decline of 4%. APAC software revenue growth was positively impacted by a year over year increase in enterprise transaction revenue due to a significant increase in the average dollar value of such transactions. The overall increase in APAC software revenue was also partially offset by a strengthening of the U.S. dollar. Using average foreign exchange rates from fiscal 2014, fiscal 2015 APAC software revenue increased 13% compared to an actual reported APAC software revenue increase of 9%. Our software revenue in EMEA and APAC is subject to changes in foreign exchange rates as more fully discussed above in the section.
Software revenue derived from our indirect distribution channel (resellers and original equipment manufacturers) decreased $23.1 million, or 9% in fiscal 2015 compared to fiscal 2014, and software revenue through our direct sales force increased $12.0 million, or 32% in fiscal 2015 compared to fiscal 2014. For additional discussion on software revenue derived from our direct sales force see the section.
Services Revenue. Services revenue increased $32.4 million, or 11%, from $291.9 million in fiscal 2014 to $324.3 million in fiscal 2015. Services revenue represented 53% of our total revenues in fiscal 2015 compared to 50% in fiscal 2014. The increase in services revenue is primarily due to a $32.2 million increase in revenue from customer support agreements as a result of software sales to new customers and renewal agreements with our installed software base.
Cost of Revenues
Total cost of revenues increased $7.8 million, or 10%, from $74.3 million in fiscal 2014 to $82.1 million in fiscal 2015. Total cost of revenues represented 14% and 13% of our total revenues in fiscal 2015 and fiscal 2014, respectively.
Cost of Software Revenue. Cost of software revenue decreased approximately $0.1 million from $2.6 million in fiscal 2014 to $2.4 million in fiscal 2015. Cost of software revenue represented 1% of our total software revenue in both fiscal 2015 and fiscal 2014.
Cost of Services Revenue. Cost of services revenue increased $7.9 million, or 11%, from $71.7 million in fiscal 2014 to $79.6 million in fiscal 2015. Cost of services revenue represented 25% of our services revenue in both fiscal 2015 and fiscal 2014.
Operating Expenses
Sales and Marketing. Sales and marketing expenses increased $52.7 million, or 19%, from $283.3 million in fiscal 2014 to $336.0 million in fiscal 2015. The increase is primarily due to a $36.2 million increase in employee compensation and related expenses attributable to the expansion of our sales force from the prior year. The increase in sales and marketing expenses also includes a $6.0 million increase in stock-based compensation expenses and a $3.3 million increase in advertising and marketing related expenses as we continue to build brand awareness for our Simpana products. Sales and marketing expenses as a percentage of total revenues increased to 55% in fiscal 2015compared to 48% in fiscal 2014, primarily due to higher compensation costs as a percentage of total revenues related to our field sales teams.
Research and Development. Research and development expenses increased $9.0 million, or 16%, from $55.1 million in fiscal 2014 to $64.1 million in fiscal 2015. The increase is primarily due to higher compensation and related expenses resulting from the expansion of our engineering group totaling approximately $7.6 million. The increase in research and development also includes a $1.4 million increase in stock-based compensation expenses. Research and development expenses as a percentage of total revenues increased to 11% in fiscal 2015 compared to 9% in fiscal 2014. Investing in research and development has been a priority for CommVault, and we anticipate continued spending related to the development of our data and information management software applications.
General and Administrative. General and administrative expenses increased $11.0 million, or 16%, from $67.1 million in fiscal 2014 to $78.1 million in fiscal 2015. This increase is primarily due to expenses of $3.6 million associated with the move of our corporate headquarters, a $2.6 million increase in employee and related compensation due to higher headcount, and a $2.6 million increase in stock-based compensation expenses. General and administrative expenses in fiscal 2015 also includes $0.1 million of net foreign currency transaction gains compared to $0.3 million of net foreign currency transaction gains recognized in general and administrative expenses in fiscal 2014. General and administrative expenses as a percentage of total revenues increased to 13% in fiscal 2015 compared to 11% in fiscal 2014.
Depreciation and Amortization. Depreciation expense increased $2.4 million, from $6.1 million in fiscal 2014 to $8.5 million in fiscal 2015. The increase in depreciation expense is the result of the move to our new corporate campus headquarters. We expect depreciation expenses associated with our new headquarters to total approximately $4.5 million on an annual basis. During the fiscal 2015, we recorded $0.6 million of accelerated depreciation for leasehold improvements associated with our previous headquarters location.
Interest Expense
Interest expense was $0.7$0.4 million in fiscal 2015, relating2024 compared to $0.5 millionin fiscal 2023. These charges relate primarily to our revolving credit facility. Refer to Note 16 of the notes to the amortizationconsolidated financial statements for further discussion on the revolving credit facility.
Other Income (Expense)
Other income was $3.3 millionin fiscal 2024 compared to expense of debt issuance costs$0.3 millionin fiscal 2023. Other income for the fiscal year ended March 31, 2024 includes a $1.7 million gain on a non-refundable escrow payment, $1.6 million related to U.S. business incentive programs and commitment feesinsignificant changes in fair value related to our Revolving Credit Facility. If we were to borrow against the facilityinvestments in the future we would incur additional interest expense.
Interest Income
Interest income decreased $0.1 million, from $0.9 million in fiscal 2014 to $0.8 million in fiscal 2015. The decrease in interest income is primarily due to decreased yield on our investment portfolio.
equity securities.
Income Tax Expense (Benefit)
Income tax expensebenefit was $13.2$85.3 million in fiscal 20152024 compared to $37.2expense of $20.4 million in fiscal 2014.2023. The effectiveincome tax rate inbenefit for the fiscal 2015 was 34% as compared to 37% in fiscal 2014. In fiscal 2015, the effective tax rate is lower than the statutory rate dueyear ended March 31, 2024 relates primarily to the impact of domestic production deduction, foreign tax credits and release of reserves, partially offset by state income taxes and permanent differencesthe previously recorded valuation allowance against certain deferred tax assets in both the United StatesU.S. and foreign jurisdictions.
In fiscal 2014, the effective tax rate approximated the statutory rate but was benefited by the impact of domestic production deduction, foreign tax credits and release of reserves, which were offset by state income taxes and permanent differences in both the United States and foreign jurisdictions. Additionally, the research and development credit expired on December 31, 2013; therefore, the effective tax rate only reflects nine months of a benefit.
Liquidity and Capital Resources
As of March 31, 2016, our cash and cash equivalents balance of $288.1 million primarily consisted of money market funds. In addition, we have approximately $99.1 million of short-term investments invested in U.S. Treasury Bills at March 31, 2016. In recent fiscal years, our principal source of liquidity has been cash provided by operations.
As of March 31, 2016, the amount of2024, our cash and cash equivalents balance was $312.8 million, of which approximately $214.2 million was held outside of the United States by our foreign legal entities was approximately $144.9 million.entities. These balances are dispersed across manyapproximately 35 international locations around the world. We believe that such dispersion meets the current and anticipated future liquidity needs of our foreign legal entities. In addition, it is our intention to indefinitely reinvest undistributed earnings of our foreign legal entities. In the event we neededneed to repatriate funds from outside of the United States, such repatriation would likely be subject to restrictions by local laws and/or tax consequences, including foreign withholding taxes or U.S. income taxes. It is not currently practical to estimate the legal restrictions or tax liability that would arise from such repatriations.
On June 30, 2014,December 13, 2021, we entered into a five-year $250$100 million senior secured revolving credit facility (the “Credit Facility”). with JPMorgan Chase Bank, N.A. The Credit Facility is available for share repurchases, general corporate purposes, and letters of credit. The Credit Facility contains financial maintenance covenants including a leverage ratio and interest coverage ratio. The Credit Facility also contains certain customary events of default
which would permit the lenderslender to, among other things, declare all loans then outstanding to be immediately due and payable if such default is not cured within applicable grace periods. The Credit Facility also limits our ability to incur certain additional indebtedness, create or permit liens on assets, make acquisitions, make investments, loans or advances, sell or transfer assets, pay dividends or distributions, and engage in certain transactions with foreign affiliates. Outstanding borrowings under the Credit Facility accrue interest at an annual rate equal to London Interbank Offeredthe Secured Overnight Financing Rate plus 1.50%1.25% subject to increases based on the Company'sour actual leverage. The unused balance on the Credit Facility is also subject to a 0.25% annual interest charge subject to increases based on the Company'sour actual leverage. As of March 31, 2016,2024, there were no borrowings under the Credit Facility and we believe we arewere in compliance with all covenants.
During the fiscal year ended March 31, 2016,2024, we repurchased $91.5$184.0 million of common stock, (2.6or approximately 2.5 million shares) undershares. On April 18, 2024, the Board of Directors approved an increase in our share repurchase program. In fiscal 2016, we bought back approximately 6% of our common stockprogram so that $250.0 million was outstanding at the beginning of the fiscal year. Our future stock repurchase activity is subject to the business judgment of our management and Board of Directors, taking into consideration our historical and projected results of operations, financial condition, cash flows and other anticipated capital requirements or investment alternatives. Our stock repurchase program reduces the dilutive impact on our common shares outstanding associated with stock option exercises and our previous public and private stock offerings through the repurchase of common stock we believe is undervalued. As of May 6, 2016, there is $93.1 million remaining in the share repurchase program which expires on March 31, 2017. Our stock repurchase programavailable. The Board's authorization has been funded by our existing cash and cash equivalent balances as well as cash flows provided by our operations.
Our summarized annual cash flow information is as follows (in thousands):
|
| | | | | | | | | | | | |
| | | Year Ended March 31, |
| | | 2016 | | 2015 | | 2014 |
| Net cash provided by operating activities | | $ | 84,413 |
| | $ | 123,847 |
| | $ | 119,137 |
|
| Net cash used in investing activities | | (62,189 | ) | | (90,041 | ) | | (90,158 | ) |
| Net cash used in financing activities | | (69,970 | ) | | (133,640 | ) | | (4,078 | ) |
| Effects of exchange rate — changes in cash | | (1,820 | ) | | (20,226 | ) | | (1,132 | ) |
| Net increase (decrease) in cash and cash equivalents | | $ | (49,566 | ) | | $ | (120,060 | ) | | $ | 23,769 |
|
Net cash provided by operating activities was $84.4 million in fiscal 2016, $123.8 million in fiscal 2015 and $119.1 million in fiscal 2014. In fiscal 2016, cash generated by operating activities was primarily due to net income adjusted for impact of non-cash charges and increases in deferred services revenue as a result of customer support agreements from new customers and renewal agreements with our installed customer base. In both fiscal 2015 and fiscal 2014, cash generated by operating activities was primarily due to net income adjusted for the impact of non-cash charges; an increase in deferred services revenue; and an increase in accrued liabilities. These increases were partially offset by an increase in accounts receivable due to higher revenues and timing of cash receipts.
Net cash used in investing activities was $62.2 million in fiscal 2016, $90.0 million in fiscal 2015 and $90.2 million in fiscal 2014. In fiscal 2016, cash used in investing activities was primarily related to $49.1 million of net purchases of short-term investments of U.S. Treasury Bills, $6.3 million of capital expenditures as we continue to invest in and enhance our global infrastructure and a $4.7 million investment in Laitek, Inc (Laitek). Laitek develops solutions for acquiring, processing and presenting scientific and medical image information. We have an option to acquire the remaining ownership of Laitek at a fixed price for the next two years. In fiscal 2015, cash used in investing activities was due to the purchase of property and equipment in the amounts of $59.3 million for purchases relating to our corporate campus headquarters and $5.8 million of capital expenditures as we continue to invest in and enhance our global infrastructure. We also made net purchases of short-term investments of U.S. Treasury Bills of $25.0 million. In fiscal 2014, cash used in investing activities was due to the purchase of property and equipment in the amounts of $62.2 million for purchases relating to our corporate campus headquarters and $4.9 million of capital expenditures. We also made net purchases of short-term investments of $23.0 million.
Net cash used in financing activities was $70.0 million in fiscal 2016, $133.6 million in fiscal 2015 and $4.1 million in fiscal 2014. The cash used in financing activities in fiscal 2016 was primarily due to $91.5 million used to repurchase shares of our common stock under our repurchase program, partially offset by $14.8 million of proceeds from the exercise of stock options and the employee stock purchase plan and $6.7 million of excess tax benefits related to employee stock-based compensation. The cash used in financing activities in fiscal 2015 was due to $155.1 million used to repurchase shares of our common stock under our repurchase program, partially offset by $17.7 million of proceeds from the exercise of stock options and the employee stock purchase plan and $5.1 million of excess tax benefits related to employee stock-based compensation. The cash used in financing activities in fiscal 2014 was due to $50.0 million used to repurchase shares of our common stock under our repurchase program, partially offset by $28.3 million of excess tax benefits related to employee stock-based compensation and $17.6 million of proceeds from the exercise of stock options.no expiration date.
A summary of the cash used for the stock repurchase program consists of the following:
| | | | | | | | | | | | | | | | | | | | | | | | | | | | | | | | |
| | | Year Ended March 31, |
| | | 2024 | | 2023 | | 2022 | | 2021 | | 2020 |
| Cash used for repurchases (in thousands) | | $ | 184,021 | | | $ | 150,921 | | | $ | 305,239 | | | $ | 95,259 | | | $ | 77,198 | |
| Shares repurchased (in thousands) | | 2,479 | | | 2,521 | | | 4,307 | | | 1,643 | | | 1,701 | |
| Average price per share | | $ | 74.24 | | | $ | 59.90 | | | $ | 70.87 | | | $ | 57.97 | | | $ | 45.37 | |
Our summarized cash flow information is as follows (in thousands):
| | | | | | | | | | | | | | |
| | | Year Ended March 31, |
| | | 2024 | | 2023 |
| Net cash provided by operating activities | | $ | 203,798 | | | $ | 170,288 | |
| Net cash used in investing activities | | (5,521) | | | (5,286) | |
| Net cash used in financing activities | | (170,581) | | | (135,579) | |
| Effects of exchange rate — changes in cash | | (2,720) | | | (9,152) | |
| Net increase in cash and cash equivalents | | $ | 24,976 | | | $ | 20,271 | |
- Net cash provided by operating activities was impacted by:
•Fiscal 2024: net income adjusted for the impact of non-cash charges and increases in deferred revenue, partially offset by increases in accounts receivable.
|
| | | | | | | | | | | | |
| | | Year Ended March 31, |
| | | 2016 | | 2015 | | 2014 |
| Cash used for repurchases (in thousands) | | $ | 91,477 |
| | $ | 155,125 |
| | $ | 50,030 |
|
| Shares repurchased (in thousands) | | 2,563 |
| | 3,171 |
| | 775 |
|
| Average price per share | | $ | 35.69 |
| | $ | 48.92 |
| | $ | 64.54 |
|
- Net cash used in investing activities was impacted by:
•Fiscal 2024: $4.1 million of capital expenditures and $1.4 million for the purchase of equity securities.
•Fiscal 2023: $3.2 million of capital expenditures and $2.1 million for the purchase of equity securities.
- Net cash used in financing activities was impacted by:
•Fiscal 2024: $184.0 million used to repurchase shares of our common stock under our repurchase program, partially offset by $13.4 million of proceeds from the exercise of stock options and the Employee Stock Purchase Plan.
•Fiscal 2023: $150.9 million used to repurchase shares of our common stock under our repurchase program and $0.1 million of debt issuance costs paid, partially offset by $15.4 million of proceeds from the exercise of stock options and the Employee Stock Purchase Plan.
Working capital decreased $15.1$30.6 million from $267.5$140.8 million as of March 31, 20152023 to $252.4$110.2 million as of March 31, 2016.2024. The decrease in working capital is primarily due to a $10.7 million increaseincreases in short-term deferred revenue. The increase inaccrued liabilities and the current portion of deferred revenue, is primarily due to higher deferred services revenue from customer support agreements from software sales to new customerspartially offset by increases in cash and renewal agreements with our installed software base.cash equivalents and accounts receivable.
We believe that our existing cash, cash equivalents and our cash from operations will be sufficient to meet our anticipated cash needs for working capital, income taxes, capital expenditures and potential stock repurchases for at least the next 12twelve months. We may seek additional funding through public or private financings or other arrangements during this period. Adequate funds may not be available when needed or may not be available on terms favorable to us, or at all. If additional funds are raised by issuing equity securities, dilution to existing stockholders will result. If we raise additional funds by obtaining loans from third parties, including borrowing under our revolving credit facility, the terms of those financing arrangements may include negative covenants or other restrictions on our business that could impair our operational flexibility, and would also require us to fund additional interest expense. If funding is insufficient at any time in the future, we may be unable to develop or enhance our products or services, take advantage of business opportunities or respond to competitive pressures, any of which could have a material adverse effect on our business, financial condition and results of operations.
Summary Disclosures about Contractual Obligations and Commercial Commitments
Our material capital commitments consist of obligations under facilities and operating leases. Some of these leases have free or escalating rent payment provisions. We recognize rent expense under leasesRefer to Note 15 of the notes to the consolidated financial statements for further discussion on a straight-line basis. We anticipate that we will experience an increase in our capital expenditures and lease commitments as a result of our anticipated growth in operations, infrastructure, personnel and resources devoted to building our brand name.
The following table summarizes our obligations as of March 31, 2016 (dollars in thousands):
|
| | | | | | | | | | | | | | | | | | | | |
| | | Payments Due by Period |
| | | Total | | Less Than 1 Year | | 2-3 Years | | 4-5 Years | | More Than 5 Years |
| Operating lease obligations | | $ | 33,902 |
| | $ | 8,540 |
| | $ | 12,886 |
| | $ | 8,848 |
| | $ | 3,628 |
|
| Purchase obligations | | 13,708 |
| | 11,591 |
| | 2,075 |
| | 42 |
| | — |
|
| Total | | $ | 47,610 |
| | $ | 20,131 |
| | $ | 14,961 |
| | $ | 8,890 |
| | $ | 3,628 |
|
We generally do not enter into binding purchase obligations. The purchase obligations above relate primarily to marketing and software development services, IT infrastructure costs and costs associated with the construction of our corporate campus headquarters. The contractual obligations table above excludes unrecognized tax benefits, plus related interest and penalties totaling $2.2 million because we cannot reasonably estimate in which future periods these amounts will ultimately be settled. The $2.2 million is classified as long-term in our Consolidated Balance Sheet as of March 31, 2016 as none of these obligations are anticipated to be paid within one year from April 1, 2016.operating leases.
We have certain software royalty commitments associated with the shipment and licensing of certain products. Royalty expense is generally based on a fixed cost per unit shipped or a fixed fee for unlimited units shipped over a designated period. Royalty expense, included in cost of softwaresubscription and perpetual license revenues, was $1.9$9.7 million in fiscal 20162024 and $1.8$9.3 million in fiscal 2015.2023.
We offer a 90-day limited product warranty for our software. To date, costs relating to this product warranty have not been material.
Off-Balance Sheet Arrangements
As of March 31, 2016 and 2015, other than our operating leases,2024, we dodid not have off-balance sheet financing arrangements, including any relationships with unconsolidated entities or financial partnerships, such as entities often referred to as structured finance or special purpose entities.
Indemnifications
Certain of our software licensing agreements contain certain provisions that indemnify our customers from any claim, suit or proceeding arising from alleged or actual intellectual property infringement. These provisions continue in perpetuity along with our software licensing and SaaS agreements. We have never incurred a liability relating to one of these indemnification provisions in the past and we believe that the likelihood of any future payout relating to these provisions is remote. Therefore, we have not recorded a liability during any period related to these indemnification provisions.
Impact of Recently Issued Accounting Standards
Deferred Taxes
In November 2015,See Note 2 of the Financial Accounting Standards Board ("FASB") issued new accounting guidance regarding balance sheet classification of deferred taxes. The guidance requires companies to classify all deferred tax assets and liabilities as noncurrent on the balance sheet instead of separating deferred taxes into current and noncurrent. The Company has elected to early adopt the guidance on a retrospective basis. The adoption had an effect on the Consolidated Balance sheet as of March 31, 2015 and no effect on the Consolidated Statement of Income, Comprehensive Income (Loss), Cash Flow, or Statement of Stockholder’s Equity.
The following table summarizes the Company's As Reported and As Adjusted changesnotes to the Consolidated Balance Sheet at March 31, 2015 (in thousands).
|
| | | | | | | |
| | | March 31,
2015 |
| | | As Reported | As Adjusted |
| Current assets: | | | |
| Deferred tax assets, net | | $ | 16,142 |
| $ | — |
|
| Total Current Assets | | $ | 541,551 |
| $ | 525,409 |
|
| | | | |
| Deferred tax assets, net | | $ | 24,903 |
| $ | 41,045 |
|
Revenue Recognition
In May 2014, the FASB issued ASU No. 2014-09, "Revenue from Contracts with Customers (Topic 606)" (ASU 2014-09) and has since modified the standard with ASU 2015-14, "Deferralconsolidated financial statements for a discussion of the Effective Date." These standards replace existing revenue recognition rules with a comprehensive revenue measurement and recognition standard and expanded disclosure requirements. The new standard becomes effective for our fiscal 2019 with early adoption permitted in fiscal 2018. We are still in the process of determining the impact of the standard on our financial statements and the timing of our adoption. The FASB allows two adoption methods under the new standard. Under one method, a company will apply the rules to contracts in all reporting periods presented. We currently believe we will apply this method of adoption. While we continue to evaluate the impact of the new standard, we believe the standard may require us to implement new revenue recognition processes, which will change our internal controls over revenue recognition.recently issued accounting standards.
Leases
In February 2016, the FASB issued ASU 2016-02 “Leases (Topic 842)” (“ASU 2016-02”). Under ASU 2016-02, a lessee will recognize in the balance sheet a liability to make lease payments (the lease liability) and a right-to-use asset representing its right to use the underlying asset for the lease term. The amendments of this ASU are effective for our fiscal 2020, with early adoption permitted. An entity will be required to recognize and measure leases at the beginning of the earliest period presented using a modified retrospective approach. We are currently assessing the impact the adoption of ASU 2016-02 will have on our financial statements.
Stock-based Compensation
In March 2016, the FASB issued ASU 2016-09, "Improvements to Employee Share-Based Payment Accounting," which simplifies several aspects of the accounting for employee share-based payment transactions, including the accounting for income taxes, forfeitures, and statutory tax withholding requirements, as well as classification in the statement of cash flows. The Company is required to adopt the new guidance in fiscal 2018 with early adoption permitted. We are currently assessing the impact the adoption of ASU 2016-09 will have on the financial statements.
| | | | | |
| |
| Item 7A. | Quantitative and Qualitative Disclosures about Market Risk |
Interest Rate Risk
As of March 31, 2016, our cash, cash equivalent and short-term investment balances consisted primarily of money market funds and U.S. Treasury Bills. Due to the short-term nature of these investments, we are not subject to any material interest rate risk on these balances.None.
Foreign Currency Risk
Economic Exposure
As a global company, we face exposure to adverse movements in foreign currency exchange rates. Our international sales are generally denominated in foreign currencies and this revenue could be materially affected by currency fluctuations. Approximately 42%48% of our sales were outside the United States in fiscal 20162024 and 43% were outside the United States47% in fiscal 2015.2023. Our primary exposures are to fluctuations in exchange rates for the U.S. dollar versus the Euro, and to a lesser extent, the Australian dollar, British pound sterling, Canadian dollar, Chinese yuan, Indian rupee, Korean won and Singapore dollar. Changes in currency exchange rates could adversely affect our reported revenues and require us to reduce our prices to remain competitive in foreign markets, which could also have a material adverse effect on our results of operations. Historically, we have periodically reviewed and revised the pricing of our products available to our customers in foreign countries and we have not maintained excess cash balances in foreign accounts.
We estimate that a 10% change in all foreign exchange rates would impact our reported operating profit by approximately $4.5$13.4 million annually. This sensitivity analysis disregards the possibilities that rates can move in opposite directions and that losses from one geographic area may be offset by gains from another geographic area.
Transaction Exposure
Our exposure to foreign currency transaction gains and losses is primarily the result of certain net receivables due from our foreign subsidiaries and customers being denominated in currencies other than the functional currency of the subsidiary. Our foreign subsidiaries conduct their businesses in local currency and we generally do not maintain excess U.S. dollar cash balances in foreign accounts.
Foreign currency transaction gains and losses are recorded in “Generalgeneral and administrative expenses”expenses in the Consolidated Statementsconsolidated statements of Income.operations. We recognized net foreign currency transaction gainslosses of $0.2 million, $0.1$2.4 million and $0.3$1.2 million in fiscal 2016, fiscal 2015,2024 and fiscal 2014 respectively. The net foreign currency transaction gains2023, respectively, and losses recorded in “General and administrative expenses” include settlement gains and losses on forward contracts disclosed below.
To date, we have selectively hedged our exposure to foreign currency transaction gains and losses on the balance sheet through the use of forward contracts, which were not designated as hedging instruments. The duration of forward contracts utilized for hedging our balance sheet exposure is generally one to three months. As of March 31, 2016 and March 31, 2015, we did not have any forward contracts outstanding. We recorded net realizedinsignificant losses in general and administrative expenses of less than $0.1 million in fiscal 2016 and net realized gains of less than of $0.1 million in fiscal 2015 and net realized losses of $0.1 million in fiscal 2014. In the future, we may enter into additional foreign currency based hedging contracts to reduce our exposure to significant fluctuations in currency exchange rates on the balance sheet.
2022.
| | | | | |
| |
| Item 8. | Financial Statements and Supplementary Data |
Commvault Systems, Inc.
Consolidated Financial Statements
Fiscal Years Ended March 31, 2016, 20152024, 2023 and 20142022
Index to Consolidated Financial Statements
Report of Independent Registered Public Accounting Firm
TheTo the Stockholders and Board of Directors and Stockholders of
Commvault Systems, Inc.
Opinion on the Financial Statements
We have audited the accompanying consolidated balance sheets of Commvault Systems, Inc. (the Company) as of March 31, 20162024 and 2015, and2023, the related consolidated statements of income,operations, comprehensive income (loss), shareholders'stockholders' equity and cash flows for each of the three years in the period ended March 31, 2016. Our audits also included2024, and the related notes (collectively referred to as the “consolidated financial statement schedule listed in the Index at Item 15. These financial statements and schedule are the responsibility of the Company's management. Our responsibility is to express an opinion on these financial statements and schedule based on our audits.
We conducted our audits in accordance with the standards of the Public Company Accounting Oversight Board (United States)statements”). Those standards require that we plan and perform the audit to obtain reasonable assurance about whether the financial statements are free of material misstatement. An audit includes examining, on a test basis, evidence supporting the amounts and disclosures in the financial statements. An audit also includes assessing the accounting principles used and significant estimates made by management, as well as evaluating the overall financial statement presentation. We believe that our audits provide a reasonable basis for our opinion.
In our opinion, the consolidated financial statements referred to above present fairly, in all material respects, the consolidated financial position of Commvault Systems, Inc.the Company at March 31, 20162024 and 2015,2023, and the consolidated results of theirits operations and theirits cash flows for each of the three years in the period ended March 31, 2016,2024, in conformity with U.S. generally accepted accounting principles. Also in our opinion, the related financial statement schedule, when considered in relation to the basic financial statements taken as a whole, presents fairly in all material respects in the information set forth therein.
As discussed in Note 2 to the consolidated financial statements, Commvault Systems, Inc. changed the classification of all deferred tax assets and liabilities to noncurrent on the consolidated balance sheet as a result of the adoption of the amendments to the FASB Accounting Standards Codification resulting from Accounting Standards Update No. 2015-17, "Balance Sheet Classification of Deferred Taxes,” effective December 31, 2015.
We also have audited, in accordance with the standards of the Public Company Accounting Oversight Board (United States) (PCAOB), Commvault Systems, Inc.’sthe Company’s internal control over financial reporting as of March 31, 2016,2024, based on criteria established in Internal Control-Integrated Framework issued by the Committee of Sponsoring Organizations of the Treadway Commission (2013 framework) and our report dated May 6, 201613, 2024 expressed an unqualified opinion thereon.
Basis for Opinion
These financial statements are the responsibility of the Company’s management. Our responsibility is to express an opinion on the Company’s financial statements based on our audits. We are a public accounting firm registered with the PCAOB and are required to be independent with respect to the Company in accordance with the U.S. federal securities laws and the applicable rules and regulations of the Securities and Exchange Commission and the PCAOB.
We conducted our audits in accordance with the standards of the PCAOB. Those standards require that we plan and perform the audit to obtain reasonable assurance about whether the financial statements are free of material misstatement, whether due to error or fraud. Our audits included performing procedures to assess the risks of material misstatement of the financial statements, whether due to error or fraud, and performing procedures that respond to those risks. Such procedures included examining, on a test basis, evidence regarding the amounts and disclosures in the financial statements. Our audits also included evaluating the accounting principles used and significant estimates made by management, as well as evaluating the overall presentation of the financial statements. We believe that our audits provide a reasonable basis for our opinion.
Critical Audit Matters
The critical audit matters communicated below are matters arising from the current period audit of the financial statements that were communicated or required to be communicated to the audit committee and that: (1) relate to accounts or disclosures that are material to the financial statements and (2) involved our especially challenging, subjective or complex judgments. The communication of the critical audit matters does not alter in any way our opinion on the consolidated financial statements, taken as a whole, and we are not, by communicating the critical audit matters below, providing a separate opinion on the critical audit matters or on the accounts or disclosures to which they relate.
| | | | | | | | |
| | Accounting for Revenue Recognition |
Description of the Matter
| | As described in Note 3 to the consolidated financial statements, the Company derives revenues from two primary sources: software and products, and services. Most of the Company’s contracts with customers contain multiple performance obligations which are accounted for separately if they are distinct. The transaction price is allocated to separate performance obligations on a relative standalone selling price basis. Auditing the identification of performance obligations in a software contract requires significant judgment as it relates to the evaluation of the contractual terms of the arrangement. |
How We Addressed the Matter in Our Audit
| | We obtained an understanding, evaluated the design and tested the operating effectiveness of controls over the Company’s revenue recognition process, including the evaluation of the contractual terms of the revenue arrangements.
To test the amount of revenue recognized, we performed audit procedures that included, among others, testing a sample of revenue transactions during the year and evaluating the identification of performance obligations based on an analysis of the contractual terms and independent confirmations of the terms and conditions of the contract directly with customers. |
| | Realizability of Deferred Tax Assets |
| Description of the Matter | | As described in Note 11 to the consolidated financial statements, the Company reduced its valuation allowance by approximately $105 million as it determined that certain deferred tax assets were now more likely than not to be realized. Deferred tax assets are reduced by a valuation allowance if, based on the weight of all available evidence, in management’s judgment it is more likely than not that some portion, or all, of the deferred tax assets will not be realized. Once established, the valuation allowance is released when, based on the weight of all available evidence, management concludes that related deferred tax assets are more likely than not to be realized. As of March 31, 2024, the Company was in a three-year cumulative income position. As a result of the removal of this negative evidence and the existence of other positive evidence, including projected future taxable income, the Company has determined that the majority of deferred tax assets are now more likely than not to be realized, and the valuation allowance on those deferred tax assets should be released.
Auditing management’s assessment of the realizability of the Company’s deferred tax assets involved complex judgments due to the significant estimation involved regarding projected future taxable income. |
| How We Addressed the Matter in Our Audit | | We obtained an understanding, evaluated the design and tested the operating effectiveness of controls over management’s process for assessing the realization of the Company’s deferred tax assets, including controls over management’s review of its projected future taxable income.
To test the realizability of deferred tax assets, we performed audit procedures that included, among others, testing the Company’s scheduling of the reversal of existing temporary differences, performing sensitivity analyses on and testing significant assumptions used by the Company in determining its projected future taxable income, and testing the completeness and accuracy of the underlying data used in its projections. We compared the projections of future taxable income with the actual results of the current period and that of industry peers. We involved our tax professionals to evaluate the application of tax law in the Company’s projected future taxable income, the scheduling of the reversal of existing temporary differences, and the evaluation of the realizability of the deferred tax assets. |
We have served as the Company’s auditor since 1998.
/s/ Ernst & Young LLP
MetroPark,Iselin, New Jersey
May 6, 201613, 2024
Commvault Systems, Inc.
Consolidated Balance Sheets
(In thousands, except per share data)
| | | | | | | | | | | | | | |
| | | March 31, |
| | | 2024 | | 2023 |
| ASSETS |
| Current assets: | | | | |
| Cash and cash equivalents | | $ | 312,754 | | | $ | 287,778 | |
| | | | |
| | | | |
| Trade accounts receivable, net | | 222,683 | | | 210,441 | |
| Assets held for sale | | 38,680 | | | 38,680 | |
| Other current assets | | 21,009 | | | 14,015 | |
| Total current assets | | 595,126 | | | 550,914 | |
| Deferred tax assets, net | | 111,181 | | | — | |
| Property and equipment, net | | 7,961 | | | 8,287 | |
| Operating lease assets | | 10,545 | | | 11,784 | |
| Deferred commissions cost | | 62,837 | | | 59,612 | |
| Intangible assets, net | | 1,042 | | | 2,292 | |
| Goodwill | | 127,780 | | | 127,780 | |
| Other assets | | 27,441 | | | 21,905 | |
| Total assets | | $ | 943,913 | | | $ | 782,574 | |
| | | | |
| LIABILITIES AND STOCKHOLDERS’ EQUITY |
| Current liabilities: | | | | |
| Accounts payable | | $ | 299 | | | $ | 108 | |
| Accrued liabilities | | 117,244 | | | 97,888 | |
| Current portion of operating lease liabilities | | 4,935 | | | 4,518 | |
| Deferred revenue | | 362,450 | | | 307,562 | |
| Total current liabilities | | 484,928 | | | 410,076 | |
| Deferred revenue, less current portion | | 168,472 | | | 174,393 | |
| Deferred tax liabilities | | 1,717 | | | 134 | |
| Long-term operating lease liabilities | | 7,155 | | | 8,260 | |
| Other liabilities | | 3,556 | | | 3,613 | |
| Commitments and contingencies (Note 8) | | | | |
| Stockholders’ equity: | | | | |
| Preferred stock, $0.01 par value: 50,000 shares authorized, no shares issued and outstanding | | — | | | — | |
| Common stock, $0.01 par value, 250,000 shares authorized, 43,548 shares and 44,140 shares issued and outstanding at March 31, 2024 and 2023, respectively | | 435 | | | 440 | |
| Additional paid-in capital | | 1,349,603 | | | 1,264,608 | |
| Accumulated deficit | | (1,056,011) | | | (1,062,900) | |
| Accumulated other comprehensive loss | | (15,942) | | | (16,050) | |
| Total stockholders’ equity | | 278,085 | | | 186,098 | |
| Total liabilities and stockholders’ equity | | $ | 943,913 | | | $ | 782,574 | |
See accompanying notes to consolidated financial statements
|
| | | | | | | | |
| | | March 31, |
| | | 2016 | | 2015 |
| ASSETS |
| Current assets: | | | | |
| Cash and cash equivalents | | $ | 288,107 |
| | $ | 337,673 |
|
| Short-term investments | | 99,072 |
| | 49,936 |
|
| Trade accounts receivable, less allowance for doubtful accounts of $315 and $104 at March 31, 2016 and 2015, respectively | | 113,429 |
| | 117,716 |
|
| Prepaid expenses and other current assets | | 16,769 |
| | 20,084 |
|
| Total current assets | | 517,377 |
| | 525,409 |
|
| Deferred tax assets, net | | 49,976 |
| | 41,045 |
|
| Property and equipment, net | | 135,904 |
| | 140,208 |
|
| Equity method investment | | 4,579 |
| | — |
|
| Other assets | | 6,737 |
| | 6,804 |
|
| Total assets | | $ | 714,573 |
| | $ | 713,466 |
|
| | | | | |
| LIABILITIES AND STOCKHOLDERS’ EQUITY |
| Current Liabilities: | | | | |
| Accounts payable | | $ | 309 |
| | $ | 860 |
|
| Accrued liabilities | | 69,678 |
| | 72,757 |
|
| Deferred revenue | | 194,977 |
| | 184,312 |
|
| Total current liabilities | | 264,964 |
| | 257,929 |
|
| Deferred revenue, less current portion | | 49,889 |
| | 45,423 |
|
| Other liabilities | | 3,452 |
| | 3,104 |
|
| Commitments and contingencies (Note 5) | |
| |
|
| Stockholders’ equity: | | | | |
| Preferred stock, $0.01 par value: 50,000 shares authorized, no shares issued and outstanding at March 31, 2016 and 2015 | | — |
| | — |
|
| Common stock, $0.01 par value, 250,000 shares authorized, 44,134 shares and 45,122 shares issued and outstanding at March 31, 2016 and 2015, respectively | | 440 |
| | 451 |
|
| Additional paid-in capital | | 602,999 |
| | 539,565 |
|
| Accumulated deficit | | (197,962 | ) | | (125,502 | ) |
| Accumulated other comprehensive loss | | (9,209 | ) | | (7,504 | ) |
| Total stockholders’ equity | | 396,268 |
| | 407,010 |
|
| Total liabilities and stockholders’ equity | | $ | 714,573 |
| | $ | 713,466 |
|
Commvault Systems, Inc.
Consolidated Statements of IncomeOperations
(In thousands, except per share data)
| | | | | | | | | | | | | | | | | | | | |
| | | Year Ended March 31, |
| | | 2024 | | 2023 | | 2022 |
| Revenues: | | | | | | |
| Subscription | | $ | 429,167 | | | $ | 347,784 | | | $ | 268,359 | |
| Perpetual license | | 57,613 | | | 74,918 | | | 111,857 | |
| Customer support | | 307,771 | | | 314,313 | | | 347,115 | |
| Other services | | 44,696 | | | 47,575 | | | 42,260 | |
| Total revenues | | 839,247 | | | 784,590 | | | 769,591 | |
| Cost of revenues: | | | | | | |
| Subscription | | 58,406 | | | 44,482 | | | 24,578 | |
| Perpetual license | | 2,168 | | | 2,439 | | | 4,563 | |
| Customer support | | 60,752 | | | 58,273 | | | 54,719 | |
| Other services | | 30,284 | | | 30,208 | | | 29,999 | |
| Total cost of revenues | | 151,610 | | | 135,402 | | | 113,859 | |
| Gross margin | | 687,637 | | | 649,188 | | | 655,732 | |
| Operating expenses: | | | | | | |
| Sales and marketing | | 354,994 | | | 340,783 | | | 341,644 | |
| Research and development | | 132,328 | | | 141,847 | | | 153,615 | |
| General and administrative | | 113,997 | | | 104,240 | | | 103,049 | |
| Restructuring | | 4,548 | | | 15,452 | | | 6,192 | |
| Depreciation and amortization | | 6,415 | | | 9,270 | | | 9,666 | |
| Headquarters impairment | | — | | | 53,481 | | | — | |
| Total operating expenses | | 612,282 | | | 665,073 | | | 614,166 | |
| Income (loss) from operations | | 75,355 | | | (15,885) | | | 41,566 | |
| Interest income | | 5,423 | | | 1,300 | | | 656 | |
| Interest expense | | (415) | | | (472) | | | (109) | |
| Other income (expense), net | | 3,250 | | | (305) | | | 1,301 | |
| Income (loss) before income taxes | | 83,613 | | | (15,362) | | | 43,414 | |
| Income tax expense (benefit) | | (85,293) | | | 20,412 | | | 9,790 | |
| Net income (loss) | | $ | 168,906 | | | $ | (35,774) | | | $ | 33,624 | |
| Net income (loss) per common share: | | | | | | |
| Basic | | $ | 3.85 | | | $ | (0.80) | | | $ | 0.74 | |
| Diluted | | $ | 3.75 | | | $ | (0.80) | | | $ | 0.71 | |
| Weighted average common shares outstanding: | | | | | | |
| Basic | | 43,885 | | | 44,664 | | | 45,443 | |
| Diluted | | 45,100 | | | 44,664 | | | 47,220 | |
See accompanying notes to consolidated financial statements
|
| | | | | | | | | | | | |
| | | Year Ended March 31, |
| | | 2016 | | 2015 | | 2014 |
| Revenues: | | | | | | |
| Software | | $ | 258,793 |
| | $ | 283,254 |
| | $ | 294,411 |
|
| Services | | 336,333 |
| | 324,289 |
| | 291,929 |
|
| Total revenues | | 595,126 |
| | 607,543 |
| | 586,340 |
|
| Cost of revenues: | | | | | | |
| Software | | 2,385 |
| | 2,442 |
| | 2,588 |
|
| Services | | 80,327 |
| | 79,626 |
| | 71,713 |
|
| Total cost of revenues | | 82,712 |
| | 82,068 |
| | 74,301 |
|
| Gross margin | | 512,414 |
| | 525,475 |
| | 512,039 |
|
| Operating expenses: | | | | | | |
| Sales and marketing | | 352,669 |
| | 335,980 |
| | 283,304 |
|
| Research and development | | 69,287 |
| | 64,143 |
| | 55,134 |
|
| General and administrative | | 78,848 |
| | 78,063 |
| | 67,106 |
|
| Depreciation and amortization | | 9,611 |
| | 8,505 |
| | 6,075 |
|
| Total operating expenses | | 510,415 |
| | 486,691 |
| | 411,619 |
|
| | | | | | | |
| Income from operations | | 1,999 |
| | 38,784 |
| | 100,420 |
|
| Interest expense | | (933 | ) | | (665 | ) | | — |
|
| Interest income | | 862 |
| | 773 |
| | 890 |
|
| Equity in loss of affiliate | | (83 | ) | | — |
| | — |
|
| Income before income taxes | | 1,845 |
| | 38,892 |
| | 101,310 |
|
| Income tax expense | | 1,709 |
| | 13,242 |
| | 37,246 |
|
| Net income | | $ | 136 |
| | $ | 25,650 |
| | $ | 64,064 |
|
| Net income per common share: | | | | | | |
| Basic | | $ | 0.00 |
| | $ | 0.56 |
| | $ | 1.36 |
|
| Diluted | | $ | 0.00 |
| | $ | 0.54 |
| | $ | 1.29 |
|
| Weighted average common shares outstanding: | | | | | | |
| Basic | | 45,159 |
| | 45,464 |
| | 46,976 |
|
| Diluted | | 46,489 |
| | 47,222 |
| | 49,642 |
|
Commvault Systems, Inc.
Consolidated Statements of Comprehensive Income (Loss)
(In thousands, except per share data)thousands)
| | | | | | | | | | | | | | | | | | | | |
| | | Year Ended March 31, |
| | | 2024 | | 2023 | | 2022 |
| Net income (loss) | | $ | 168,906 | | | $ | (35,774) | | | $ | 33,624 | |
| Other comprehensive income (loss): | | | | | | |
| Foreign currency translation adjustment | | 108 | | | (4,187) | | | (1,513) | |
| Comprehensive income (loss) | | $ | 169,014 | | | $ | (39,961) | | | 32,111 | |
See accompanying notes to consolidated financial statements
|
| | | | | | | | | | | | |
| | | Year Ended March 31, |
| | | 2016 | | 2015 | | 2014 |
| Net income | | $ | 136 |
| | $ | 25,650 |
| | $ | 64,064 |
|
| Other comprehensive loss: | | | | | | |
| Foreign currency translation adjustment | | (1,705 | ) | | (6,587 | ) | | (628 | ) |
| Comprehensive income (loss) | | $ | (1,569 | ) | | $ | 19,063 |
| | 63,436 |
|
Commvault Systems, Inc.
Consolidated Statements of Stockholders’ Equity
(In thousands)
| | | | | | | | | | | | | | | | | | | | | | | | | | | | | | | | | | | | | | |
| | | Common Stock | | Additional
Paid-In
Capital | | Accumulated
Deficit | | Accumulated
Other
Comprehensive
Loss | | Total |
| | | Shares | | Amount | |
| Balance at March 31, 2021 | | 46,482 | | | $ | 463 | | | $ | 1,069,695 | | | $ | (665,774) | | | $ | (10,350) | | | $ | 394,034 | |
| Stock-based compensation | | | | | | 105,163 | | | | | | | 105,163 | |
| Share issuance related to stock-based compensation | | 2,336 | | | 23 | | | 29,737 | | | | | | | 29,760 | |
| Repurchase of common stock | | (4,307) | | | (43) | | | (38,647) | | | (266,549) | | | | | (305,239) | |
| Net income | | | | | | | | 33,624 | | | | | 33,624 | |
| Other comprehensive loss | | | | | | | | | | (1,513) | | | (1,513) | |
| Balance at March 31, 2022 | | 44,511 | | | 443 | | | 1,165,948 | | | (898,699) | | | (11,863) | | | 255,829 | |
| Stock-based compensation | | | | | | 105,746 | | | | | | | 105,746 | |
| Share issuance related to stock-based compensation | | 2,150 | | | 22 | | | 15,383 | | | | | | | 15,405 | |
| Repurchase of common stock | | (2,521) | | | (25) | | | (22,469) | | | (128,427) | | | | | (150,921) | |
| Net loss | | | | | | | | (35,774) | | | | | (35,774) | |
| Other comprehensive loss | | | | | | | | | | (4,187) | | | (4,187) | |
| Balance at March 31, 2023 | | 44,140 | | | 440 | | | 1,264,608 | | | (1,062,900) | | | (16,050) | | | 186,098 | |
| Stock-based compensation | | | | | | 94,551 | | | | | | | 94,551 | |
| Share issuance related to stock-based compensation | | 1,887 | | | 19 | | | 13,421 | | | | | | | 13,440 | |
| Repurchase of common stock | | (2,479) | | | (24) | | | (22,977) | | | (162,017) | | | | | (185,018) | |
| Net income | | | | | | | | 168,906 | | | | | 168,906 | |
| Other comprehensive income | | | | | | | | | | 108 | | | 108 | |
| Balance at March 31, 2024 | | 43,548 | | | $ | 435 | | | $ | 1,349,603 | | | $ | (1,056,011) | | | $ | (15,942) | | | $ | 278,085 | |
See accompanying notes to consolidated financial statements
|
| | | | | | | | | | | | | | | | | | | | | | | |
| | | Common Stock | | Additional Paid-In Capital | | Accumulated Deficit | | Accumulated Other Comprehensive Loss | | Total |
| | | Shares | | Amount | |
| Balance at March 31, 2013 | | 46,397 |
| | $ | 464 |
| | $ | 391,772 |
| | $ | (37,930 | ) | | $ | (289 | ) | | $ | 354,017 |
|
| Stock-based compensation | | | | | | 49,124 |
| | | | | | 49,124 |
|
| Tax benefits relating to share-based payments | | | | | | 28,416 |
| | | | | | 28,416 |
|
| Share issuances related to stock-based compensation | | 1,472 |
| | 15 |
| | 17,600 |
| | | | | | 17,615 |
|
| Repurchase of common stock | | (775 | ) | | (8 | ) | | (5,829 | ) | | (44,193 | ) | | | | (50,030 | ) |
| Net income | | | | | | | | 64,064 |
| | | | 64,064 |
|
| Other comprehensive loss | | | | | | | | | | (628 | ) | | (628 | ) |
| Balance at March 31, 2014 | | 47,094 |
| | 471 |
| | 481,083 |
| | (18,059 | ) | | (917 | ) | | 462,578 |
|
| Stock-based compensation | | | | | | 60,663 |
| | | | | | 60,663 |
|
| Tax benefits relating to share-based payments | | | | | | 2,141 |
| | | | | | 2,141 |
|
| Share issuances related to stock-based compensation | | 1,199 |
| | 12 |
| | 17,678 |
| | | | | | 17,690 |
|
| Repurchase of common stock | | (3,171 | ) | | (32 | ) | | (22,000 | ) | | (133,093 | ) | | | | (155,125 | ) |
| Net income | | | | | | | | 25,650 |
| | | | 25,650 |
|
| Other comprehensive loss | | | | | | | | | | (6,587 | ) | | (6,587 | ) |
| Balance at March 31, 2015 | | 45,122 |
| | 451 |
| | 539,565 |
| | (125,502 | ) | | (7,504 | ) | | 407,010 |
|
| Stock-based compensation | | | | | | 64,196 |
| | | | | | 64,196 |
|
| Tax benefits relating to share-based payments | | | | | | 3,265 |
| | | | | | 3,265 |
|
| Share issuances related to stock-based compensation | | 1,575 |
| | 15 |
| | 14,828 |
| | | | | | 14,843 |
|
| Repurchase of common stock | | (2,563 | ) | | (26 | ) | | (18,855 | ) | | (72,596 | ) | | | | (91,477 | ) |
| Net income | | | | | | | | 136 |
| | | | 136 |
|
| Other comprehensive loss | | | | | | | | | | (1,705 | ) | | (1,705 | ) |
| Balance at March 31, 2016 | | 44,134 |
| | $ | 440 |
| | $ | 602,999 |
| | $ | (197,962 | ) | | $ | (9,209 | ) | | $ | 396,268 |
|
Commvault Systems, Inc.
Consolidated Statements of Cash Flows
(In thousands)
| | | | | | | | | | | | | | | | | | | | |
| | | Year Ended March 31, |
| | | 2024 | | 2023 | | 2022 |
| Cash flows from operating activities | | | | | | |
| Net income (loss) | | $ | 168,906 | | | $ | (35,774) | | | $ | 33,624 | |
| Adjustments to reconcile net income (loss) to net cash provided by operating activities: | | | | | | |
| Depreciation and amortization | | 6,530 | | | 10,323 | | | 10,950 | |
| Noncash stock-based compensation | | 94,551 | | | 105,746 | | | 105,163 | |
| Noncash change in fair value of equity securities | | 17 | | | 305 | | | (301) | |
| | | | | | |
| Noncash headquarters impairment | | — | | | 53,481 | | | — | |
| | | | | | |
| Deferred income taxes | | (109,598) | | | (674) | | | 49 | |
| | | | | | |
| Amortization of deferred commissions cost | | 26,531 | | | 22,626 | | | 18,339 | |
| | | | | | |
| Changes in operating assets and liabilities: | | | | | | |
| Trade accounts receivable, net | | (21,725) | | | (11,596) | | | (20,371) | |
| Operating lease assets and liabilities, net | | 550 | | | (56) | | | (925) | |
| Other current assets and Other assets | | 336 | | | 6,179 | | | 3,732 | |
| Deferred commissions cost | | (29,952) | | | (30,529) | | | (33,512) | |
| Accounts payable | | 195 | | | (297) | | | 60 | |
| Accrued liabilities | | 16,998 | | | (24,213) | | | 10,400 | |
| Deferred revenue | | 50,394 | | | 73,756 | | | 48,295 | |
| Other liabilities | | 65 | | | 1,011 | | | 1,677 | |
| Net cash provided by operating activities | | 203,798 | | | 170,288 | | | 177,180 | |
| Cash flows from investing activities | | | | | | |
| | | | | | |
| | | | | | |
| Purchase of property and equipment | | (4,086) | | | (3,241) | | | (3,911) | |
| Purchase of equity securities | | (1,435) | | | (2,045) | | | (4,139) | |
| Business combination, net of cash acquired | | — | | | — | | | (16,894) | |
| Other | | — | | | — | | | 500 | |
| Net cash used in investing activities | | (5,521) | | | (5,286) | | | (24,444) | |
| Cash flows from financing activities | | | | | | |
| Repurchase of common stock | | (184,021) | | | (150,921) | | | (305,239) | |
| Proceeds from stock-based compensation plans | | 13,440 | | | 15,405 | | | 29,760 | |
| Debt issuance costs | | — | | | (63) | | | (609) | |
| Net cash used in financing activities | | (170,581) | | | (135,579) | | | (276,088) | |
| Effects of exchange rate — changes in cash | | (2,720) | | | (9,152) | | | (6,378) | |
| Net increase (decrease) in cash and cash equivalents | | 24,976 | | | 20,271 | | | (129,730) | |
| Cash and cash equivalents at beginning of year | | 287,778 | | | 267,507 | | | 397,237 | |
| Cash and cash equivalents at end of year | | $ | 312,754 | | | $ | 287,778 | | | $ | 267,507 | |
| | | | | | |
| Supplemental disclosures of cash flow information | | | | | | |
| Interest paid | | $ | 253 | | | $ | 253 | | | $ | 13 | |
| Income taxes paid | | $ | 19,970 | | | $ | 15,175 | | | $ | (1,493) | |
See accompanying notes to consolidated financial statements
|
| | | | | | | | | | | | |
| | | Year Ended March 31, |
| | | 2016 | | 2015 | | 2014 |
| Cash flows from operating activities | | | | | | |
| Net income | | $ | 136 |
| | $ | 25,650 |
| | $ | 64,064 |
|
| Adjustments to reconcile net income to net cash provided by operating activities: | | | | | | |
| Depreciation and amortization | | 11,179 |
| | 9,046 |
| | 6,207 |
|
| Noncash stock-based compensation | | 64,196 |
| | 60,663 |
| | 49,124 |
|
| Excess tax benefits from stock-based compensation | | (6,664 | ) | | (5,057 | ) | | (28,337 | ) |
| Deferred income taxes | | (9,332 | ) | | 4,072 |
| | (6,430 | ) |
| Equity in loss of affiliate | | 83 |
| | — |
| | — |
|
| Changes in operating assets and liabilities: | | | | | | |
| Trade accounts receivable | | 3,879 |
| | (6,581 | ) | | (33,482 | ) |
| Prepaid expenses and other current assets | | 3,414 |
| | (11,907 | ) | | 3,948 |
|
| Other assets | | (571 | ) | | 1,229 |
| | (160 | ) |
| Accounts payable | | (454 | ) | | (267 | ) | | (2,695 | ) |
| Accrued liabilities | | 1,972 |
| | 13,221 |
| | 43,187 |
|
| Deferred revenue | | 16,317 |
| | 35,818 |
| | 25,156 |
|
| Other liabilities | | 258 |
| | (2,040 | ) | | (1,445 | ) |
| Net cash provided by operating activities | | 84,413 |
| | 123,847 |
| | 119,137 |
|
| Cash flows from investing activities | | | | | | |
| Purchase of short-term investments | | (99,071 | ) | | (68,933 | ) | | (28,976 | ) |
| Proceeds from maturity of short-term investments | | 49,935 |
| | 43,973 |
| | 5,948 |
|
| Purchase of equity method investment | | (4,662 | ) | | — |
| | — |
|
| Purchases for corporate campus headquarters | | (2,111 | ) | | (59,297 | ) | | (62,214 | ) |
| Purchase of property and equipment | | (6,280 | ) | | (5,784 | ) | | (4,916 | ) |
| Net cash used in investing activities | | (62,189 | ) | | (90,041 | ) | | (90,158 | ) |
| Cash flows from financing activities | | | | | | |
| Repurchase of common stock | | (91,477 | ) | | (155,125 | ) | | (50,030 | ) |
| Debt issuance costs | | — |
| | (1,262 | ) | | — |
|
| Proceeds from the exercise of stock options and the Employee Stock Purchase Plan | | 14,843 |
| | 17,690 |
| | 17,615 |
|
| Excess tax benefits from stock-based compensation | | 6,664 |
| | 5,057 |
| | 28,337 |
|
| Net cash used in financing activities | | (69,970 | ) | | (133,640 | ) | | (4,078 | ) |
| Effects of exchange rate — changes in cash | | (1,820 | ) | | (20,226 | ) | | (1,132 | ) |
| Net increase (decrease) in cash and cash equivalents | | (49,566 | ) | | (120,060 | ) | | 23,769 |
|
| Cash and cash equivalents at beginning of year | | 337,673 |
| | 457,733 |
| | 433,964 |
|
| Cash and cash equivalents at end of year | | $ | 288,107 |
| | $ | 337,673 |
| | $ | 457,733 |
|
| | | | | | | |
| Supplemental disclosures of cash flow information | | | | | | |
| Interest paid | | $ | 635 |
| | $ | 475 |
| | $ | — |
|
| Income taxes paid, net | | $ | 1,989 |
| | $ | 15,590 |
| | $ | 12,442 |
|
| Purchases for corporate campus headquarters in accounts payable and accrued liabilities | | $ | — |
| | $ | 2,111 |
| | $ | 6,805 |
|
Commvault Systems, Inc.
Notes to Consolidated Financial Statements
(In thousands, except per share data)
1. Nature of Business
Commvault Systems, Inc. and its subsidiaries (“Commvault”("Commvault," "we," "us," or the “Company”"our") is a leading provider of data and information management software applications and related services. The Company develops, markets and sells a suite of software applications and services, primarily in North America, Europe, Australia and Asia, that provides its customers with data protection solutions supporting all major operating systems, applications, and databases on virtual and physical servers, NAS shares, cloud-based infrastructures, and mobile devices; management through a single console; multiple protection methods including backup and archive, snapshot management, replication, and content indexing for eDiscovery; efficient storage management using deduplication for disk, tape and cloud; integration with the industry's top storage arrays; complete virtual infrastructure management supporting multiple hypervisors; security capabilities to limit access to critical data; policy based data management; and an end-user experience that allows them to protect, find and recover their own data using common tools such as web browsers, Microsoft Outlook and File Explorer. The Company also provides its customers with a broad rangescalable platform that enhances customers' cyber resiliency by protecting their data in a world of professionalincreasing threats. We provide these products and customer support services.services across many types of environments, including on-premises, hybrid and multi-cloud. Our offerings are delivered via self-managed software, software-as-a-service ("SaaS"), integrated appliances, or managed by partners. Customers use our Commvault Cloud platform to protect themselves from threats like ransomware and recover their data efficiently.
2. Summary of Significant Accounting Policies
Reclassification of Prior Year Balances
Certain prior year amounts have been reclassified for consistency with the current year presentation. These reclassifications have no impact on the amount of total revenues or net income. Beginning in fiscal 2024, the software and services line items on the consolidated statements of operations, related to revenues and cost of revenues, are being presented in the following categories:
Subscription - The amounts on this line include the revenues and costs of recurring time-based arrangements, including the software portion of term-based licenses and SaaS offerings. The software component of term-based licenses is typically recognized when the software is delivered or made available for download. For SaaS offerings, revenue is generally recognized ratably over the contract term beginning on the date that the service is made available to the customer.
Perpetual license - The amounts on this line include the revenues and costs from the sale of perpetual software licenses. Perpetual software license revenue is typically recognized when the software is delivered or made available for download.
Customer support - The amounts on this line include customer support revenues and costs associated with our software products. Customer support includes software updates on a when-and-if-available basis, telephone support, integrated web-based support, and other premium support offerings, for both subscription software and perpetual software license arrangements. Customer support revenue is typically recognized ratably over the term of the customer support agreement.
Other services - The amounts included on this line consist primarily of revenues and costs related to professional service offerings, including consultation, assessment and design, installation services, and customer education. Revenues related to other professional services are typically recognized as the services are performed.
Basis of Presentation
The consolidated financial statements include the accounts of the Company.Commvault. All intercompany transactions and balances have been eliminated.eliminated in consolidation.
Use of Estimates
The preparation of financial statements and related disclosures in conformity with U.S. GAAPgenerally accepted accounting principles ("GAAP") requires management to make judgments and estimates that affect the amounts reported in the Company’sour consolidated financial statements and the accompanying notes. The Company bases itsWe base our estimates and judgments on historical experience and on various other assumptions that it believeswe believe are reasonable under the circumstances. The amounts of assets and liabilities reported in the Company’sour balance sheets and the amounts of revenues and expenses reported for each of itsthe periods presented are affected by estimates and assumptions, which are used for, but not limited to, the accounting for revenue recognition, allowance for doubtful accounts, income taxes and related reserves, stock-based compensationdeferred commissions, purchased intangible assets and accounting for research and development costs.goodwill. Actual results could differ from those estimates.
Revenue Recognition
The Company derives revenues from two primary sources: software licenses and services. Services include customer support, consulting, assessment and design services, installation services and training. A typical sales arrangement includes both licenses and services.
For sales arrangements involving multiple elements, the Company recognizes revenue using the residual method. Under the residual method, the Company allocates and defers revenue for the undelivered elements based on fair value and recognizes the difference between the total arrangement fee and the amount deferred for the undelivered elements as revenue. The determination of fair value of the undelivered elements in multiple-element arrangements is based on the price charged when such elements are sold separately, which is commonly referred to as vendor-specific objective-evidence, or VSOE.
The Company’s software licenses typically provide for a perpetual right to use the Company’s software and are sold on a per terabyte basis, on a per-copy basis, as site licenses or as a solution set. Software licenses sold on a capacity basis provide the customer with unlimited licenses of specified software products based on a defined level of terabytes of data under management. Site licenses give the customer the additional right to deploy the software on a limited basis during a specified term. Solution sets are generally sold on a per unit basis such as per virtual machine for our virtual machine backup, recovery and cloud management solution set; per mailbox for our email archive solution set and per user for our endpoint data protection solution set.
Commvault Systems, Inc.
Notes to Consolidated Financial Statements — (Continued)
(In thousands, except per share data)
Revenue
We account for revenue in accordance with Accounting Standards Codification ("ASC") Topic 606, Revenue from Contracts with Customers ("ASC 606"). We record revenue net of sales tax. For a further discussion of our accounting policies related to revenue, see Note 3 of the notes to the consolidated financial statements.
Accounting for Stock-Based Compensation
Restricted stock units without a market condition are measured based on the fair market values of the underlying stock on the date of grant. We recognize stock-based compensation expense using the straight-line method for all stock awards that do not include a market or performance condition. Awards that include a market or performance condition are expensed using the accelerated method.
Software Development Costs
The Company recognizescosts for the development of new products and substantial enhancements to existing products are expensed as incurred until technological feasibility has been established, at which time any additional costs would be capitalized in accordance with the accounting guidance for software. Because our current process for developing software revenue through direct sales channelsis essentially completed concurrently with the establishment of technological feasibility, which occurs upon receiptthe completion of a purchase order or other persuasive evidenceworking model, no costs have been capitalized for any of the periods presented.
Advertising Costs
We expense advertising costs as incurred. Advertising expenses were $8,514, $8,663, and when all other basic revenue recognition criteria$9,572 for the years ended March 31, 2024, 2023 and 2022, respectively.
Accounting for Income Taxes
We account for income taxes in accordance with ASC Topic 740, Income Taxes ("ASC 740"). The provision for income taxes and effective tax rates are met as described below. The Company recognizes software revenue through all indirect sales channelscalculated by legal entity and jurisdiction and are based on a sell-through model. A sell-through model requires that the Company recognize revenue when the basic revenue recognition criteria are met as described below and these channels complete the salenumber of the Company’s software products to the end-user. Revenue from software licenses sold through an original equipment manufacturer partner is recognized upon the receipt of a royalty report or purchase order from that original equipment manufacturer partner.
Services revenue includes revenue from customer support and other professional services. Customer support includes software updates on a when-and-if-available basis, telephone support, integrated web-based support and bug fixes or patches. Customer support revenue is recognized ratably over the term of the customer support agreement, which is typically one year. To determine the price for the customer support element when sold separately, the Company primarily uses historical renewal rates. Historical renewal rates are supported by performing an analysis in which the Company segregates its customer support renewal contracts into different classes based on specific criteriafactors, including but not limited to, the dollar amount of the software purchased, the level of customer support being providedpre-tax earnings, income tax planning strategies, differences between tax laws and accounting rules, statutory tax rates and credits, uncertain tax positions and valuation allowances. We provide for global intangible low-taxed income (“GILTI”) earned by certain foreign subsidiaries in the distribution channel. Asyear the tax is incurred and record an estimate of GILTI as a resultcomponent of this analysis, the Company has concludedtax provision. We use significant judgment and estimates in evaluating tax positions. The effective tax rate in a given financial statement period may be materially impacted by changes in the mix and level of earnings by taxing jurisdiction.
Under ASC 740, deferred income taxes arise from temporary differences between the tax basis of assets and liabilities and their reported amounts. Valuation allowances are established when, in our judgment, it is more likely than not that it has established VSOEdeferred tax assets will not be realized. In assessing the need for a valuation allowance, we weigh the available positive and negative evidence, including historical levels of pre-tax income, legislative developments, expectations and risks associated with estimates of future pre-tax income, and prudent and feasible tax planning strategies.
Foreign Currency Translation
The functional currencies of our foreign operations are deemed to be the local country’s currency. Assets and liabilities of our international subsidiaries are translated at their respective period-end exchange rates, and revenues and expenses are translated at average currency exchange rates for the different classesperiod. The resulting balance sheet translation adjustments are included in other comprehensive income (loss) and are reflected as a separate component of customer support whenstockholders’ equity.
Foreign currency transaction gains and losses are recorded in general and administrative expenses in the support is sold as partconsolidated statements of a multiple-element sales arrangement. The Company’s determination of fair value for customer support has not changed for the periods presented.
The Company’s other professional services include consulting services, implementationoperations. These gains and post-deployment serviceslosses relate primarily to receivables and education services. Other professional services provided by the Companypayables that are not mandatory and can also be performed bydenominated in the customer or a third-party. In addition to a signed purchase order, the Company’s consulting services and implementation and post-deployment services are, in some cases, evidenced by a Statement of Work, which defines the specific scope of such services to be performed when sold and performed on a stand-alone basis or included in multiple-element sales arrangements. Revenues from consulting services and implementation and post-deployment services are based upon a daily or weekly rate and are recognized when the services are completed. Education services include courses taught by the Company’s instructors or third-party contractors either at onefunctional currency of the Company’s facilities or atsubsidiary they relate to. We recognized net foreign currency transaction losses of $2,388 and $1,163 in the customer’s site. Education services fees are recognized as revenue afteryears ended March 31, 2024, and 2023, respectively, and insignificant losses in the course has been provided. Based on the Company’s analysis of such other professional services transactions sold on a stand-alone basis, the Company has concluded it has established VSOE for such other professional services when sold in connection with a multiple-element sales arrangement. The Company generally performs its other professional services within 90 days of entering into an agreement. The Company’s determination of fair value for other professional services has not changed for the periods presented.
The Company has analyzed all of the undelivered elements included in its multiple-element sales arrangements and determined that VSOE of fair value exists to allocate revenues to services. Accordingly, assuming all basic revenue recognition criteria are met, software revenue is recognized upon delivery of the software license using the residual method.
The Company considers the four basic revenue recognition criteria for each of the elements as follows:
year ended March 31, 2022.
Persuasive evidence of an arrangement with the customer exists. The Company’s customary practice is to require a purchase order and, in some cases, a written contract signed by both the customer and the Company, or other persuasive evidence that an arrangement exists prior to recognizing revenue related to an arrangement.50
Delivery or performance has occurred. The Company’s software applications are either physically or electronically delivered to customers with standard transfer terms such as FOB shipping point. Software and/or software license keys for add-on orders or software updates are typically delivered in an electronic format. If products that are essential to the functionality of the delivered software in an arrangement have not been delivered, the Company does not consider delivery to have occurred. Services revenue is recognized when the services are completed, except for customer support, which is recognized ratably over the term of the customer support agreement, which is typically one year.
Vendor’s fee is fixed or determinable. The fee customers pay for software applications, customer support and other professional services is negotiated at the outset of a sales arrangement. The fees are therefore considered to be fixed or determinable at the inception of the arrangement. The Company evaluates instances when extended payment terms are granted to determine if revenue should be deferred until payment becomes due.
Commvault Systems, Inc.
Notes to Consolidated Financial Statements — (Continued)
(In thousands, except per share data)
Collection is probable. Probability of collection is assessed on a customer-by-customer basis. Each new customer undergoes a credit review process to evaluate its financial position and ability to pay. If the Company determines from the outset of an arrangement that collection is not probable based upon the review process, revenue is recognized at the earlier of when cash is collected or when sufficient credit becomes available, assuming all of the other basic revenue recognition criteria are met.
The Company’s sales arrangements generally do not include acceptance clauses. However, if an arrangement does include an acceptance clause, revenue for such an arrangement is deferred and recognized upon acceptance. Acceptance occurs upon the earliest of receipt of a written customer acceptance, waiver of customer acceptance or expiration of the acceptance period.
Net Income (Loss) per Common Share
Basic net income (loss) per common share is computed by dividing net income (loss) by the weighted average number of common shares during the period. Diluted net income (loss) per share is computed using the weighted average number of common shares and, if dilutive, potential common shares outstanding during the period. Potential common shares consist of the incremental common shares issuable upon the exercise of stock options, vesting of restricted stock units, and shares to be purchased under the Employee Stock Purchase Plan.Plan ("ESPP"), and the exercise of stock options. The dilutive effect of such potential common shares is reflected in diluted earnings (loss) per share by application of the treasury stock method.
The following table sets forth the computationreconciliation of basic and diluted net income (loss) per common share:
| | | | | | | | | | | | | | | | | | | | |
| | | Year Ended March 31, |
| | | 2024 | | 2023 | | 2022 |
| Net income (loss) | | $ | 168,906 | | | $ | (35,774) | | | $ | 33,624 | |
| Basic net income (loss) per common share: | | | | | | |
| Basic weighted average shares outstanding | | 43,885 | | | 44,664 | | | 45,443 | |
| Basic net income (loss) per common share | | $ | 3.85 | | | $ | (0.80) | | | $ | 0.74 | |
| Diluted net income (loss) per common share: | | | | | | |
| Basic weighted-average shares outstanding | | 43,885 | | | 44,664 | | | 45,443 | |
Dilutive effect of stock options and restricted stock units (1) | | 1,215 | | | — | | | 1,777 | |
| Diluted weighted-average shares outstanding | | 45,100 | | | 44,664 | | | 47,220 | |
| Diluted net income (loss) per common share | | 3.75 | | | (0.80) | | | 0.71 | |
|
| | | | | | | | | | | | |
| | | Year Ended March 31, |
| | | 2016 | | 2015 | | 2014 |
| Net income | | $ | 136 |
| | $ | 25,650 |
| | $ | 64,064 |
|
| Basic net income per common share: | | | | | | |
| Basic weighted average shares outstanding | | 45,159 |
| | 45,464 |
| | 46,976 |
|
| Basic net income per common share | | $ | 0.00 |
| | $ | 0.56 |
| | $ | 1.36 |
|
| Diluted net income per common share: | | | | | | |
| Basic weighted average shares outstanding | | 45,159 |
| | 45,464 |
| | 46,976 |
|
| Dilutive effect of stock options, restricted stock units, and employee stock purchase plan | | 1,330 |
| | 1,758 |
| | 2,666 |
|
| Diluted weighted average shares outstanding | | 46,489 |
| | 47,222 |
| | 49,642 |
|
| Diluted net income per common share | | $ | 0.00 |
| | $ | 0.54 |
| | $ | 1.29 |
|
The following table summarizes the potential outstanding common stock equivalents of the Company at the end of each period, which(1) In fiscal 2023 dilutive shares have been excluded frombecause we were in a net loss position.
The diluted weighted-average shares outstanding exclude restricted stock units, performance restricted stock units, shares to be purchased under the computation of diluted net income per common share, as its effect is anti-dilutive.
|
| | | | | | | | | |
| | | Year Ended March 31, |
| | | 2016 | | 2015 | | 2014 |
| Stock options, restricted stock units, and shares under the employee stock purchase plan | | 4,183 |
| | 3,136 |
| | 964 |
|
Software Development Costs
ResearchESPP and development expenditures are charged to operations as incurred. Based onoutstanding stock options totaling 271, 3,939 and 505 for the Company’s software development process, technological feasibility is established upon completion of a working model, which also requires certification and extensive testing. Costs incurred by the Company between completion of the working model and the point at which the product is ready for general release are immaterial.
Commvault Systems, Inc.
Notes to Consolidated Financial Statements — (Continued)
(In thousands, except per share data)
Accounts Receivable and Allowance for Doubtful Accounts
Accounts receivable consist of amounts due to the Company from normal business activities. The Company maintains an allowance for estimated losses resulting from the inability of its customers to make required payments. The Company estimates uncollectible amounts based upon historical bad debts, evaluation of current customer receivable balances, age of customer receivable balances, the customer’s financial condition and current economic trends.
Accounting for Income Taxes
As part of the process of preparing financial statements, the Company is required to estimate its income taxes in each of the jurisdictions in which it operates. This process involves estimating actual current tax exposure, including assessing the risks associated with tax audits, and assessing temporary differences resulting from different treatment of items for tax and accounting purposes. These differences result in deferred tax assets and liabilities. As offiscal years ended March 31, 2016,2024, 2023 and 2022, respectively, because the Company had net deferred tax assets of approximately $49,976, which were primarily related to stock-based compensation, deferred revenue, and tax credits. The Company assesses the likelihood that its deferred tax assets will be recovered from future taxable income, and to the extent that the Company believes recovery is not likely, the Company establishes a valuation allowance. As of March 31, 2016, the Company maintains a valuation allowance related to its deferred tax assets totaling $2,772 primarily related to the uncertainty of the Company’s ability to utilize New Jersey state research tax credits before expiration. The Company based its valuation allowance on its estimates of taxable income and the period over which its state research tax credits will be recoverable.
The calculation of the Company’s tax liabilities involves dealing with uncertainties in the application of complex tax regulations in each of its tax jurisdictions. The number of years with open tax audits varies depending on the tax jurisdiction. A number of years may lapse before a particular matter is audited and finally resolved. The Company applies the guidance issued to address the accounting for uncertain tax positions. This guidance clarifies the accounting for income taxes, by prescribing a minimum recognition threshold a tax position is required to meet before being recognized in the financial statements as well as provides guidance on derecognition, measurement, classification, interest and penalties, accounting in interim periods, disclosure and transition.
As of March 31, 2016, the Company had unrecognized tax benefits of $1,794, all of which, if recognized,effect would favorably affect the effective tax rate. In addition, the Company had accrued interest and penalties of $452 related to the unrecognized tax benefits. Interest and penalties, if any, related to unrecognized tax benefits are recorded in income tax expense. Components of the reserve are classified as either current or long-term in the Consolidated Balance Sheet based on when we expect each of the items to be settled. However, unrecognized tax benefits which are related to a Deferred Tax Asset recorded in the Consolidated Balance Sheet are presented as a reduction against the related Deferred Tax Asset.have been anti-dilutive.
Cash and Cash Equivalents
The Company considersWe consider all highly liquid investments purchased with maturities of three months or less at the date of purchase to be cash equivalents. As
Trade and Other Receivables
Trade and other receivables are primarily comprised of trade receivables that are recorded at the invoice amount, net of an allowance for doubtful accounts, which is not material. Unbilled receivables represent amounts for which revenue has been recognized but which have not yet been invoiced to the customer. The current portion of unbilled receivables is included in trade accounts receivable on the consolidated balance sheets. Long-term unbilled receivables are included in other assets. The allowance for doubtful accounts was $173 as of March 31, 2016,2024 and $197 as of March 31, 2023. For the Company’s cashyears ended March 31, 2024, 2023 and cash equivalents balance consisted primarily of money market funds.2022, bad debt expense was immaterial.
Short-term Investments
Short-term investments consist of investments with maturities of twelve months or less that doHistorically, we have not meet the criteria to be cash equivalents. The company determines classification of the investment as trading, available-for-sale or held-to-maturity at the time of purchase and reevaluates classification whenever changes in circumstances indicate changes in classification may be necessary. The Company’s current short-term investments are classified as held-to-maturity. Held-to-maturity investments consist of securities that the Company has the intent and ability to retain until maturity. Held-to-maturity investments are initially recorded at cost and adjusted for the amortization of discounts from the date of purchase through maturity. Income related to investments is recorded as interest income in the Consolidated Statement of Income. Cash inflows and outflowsexperienced material losses related to the sale, maturity and purchaseinability to collect receivables from our customers. There is presently no indication that we will not collect material amounts of investments are classifiedaccounts receivable as investing activities in the Company’s Consolidated Statements of Cash Flows.March 31, 2024. The inability to collect receivables could have a material impact on our results of operations.
Concentration of Credit Risk
The Company grantsWe grant credit to customers in a wide variety of industries worldwide and generally doesdo not require collateral. Credit losses relating to these customers have been minimal.
Sales through our distribution agreement with Arrow Enterprise Computing Solutions, Inc. ("Arrow") totaled approximately 36% of total revenues for the year ended March 31, 2024, and 37% of total revenues for the years
Commvault Systems, Inc.
Notes to Consolidated Financial Statements — (Continued)
(In thousands, except per share data)
Sales through the Company’s distribution agreement with Arrow Enterprise Computing Solutions, Inc. (“Arrow”) totaled approximately 38%, 36% and 31% of total revenues for the years ended March 31, 2016, 20152023 and 2014, respectively.2022. Arrow accounted for approximately 43%29% and 41%34% of total accounts receivable as of March 31, 20162024 and 2015,2023, respectively.
The Company has an original equipment manufacturer agreement with Hitachi Data Systems (“HDS”) for them to market, sell and support our software applications and services on a stand-alone basis and/or incorporate our software applications into their own hardware products. HDS accounted for 11% and 10% of total revenues for the year ended March 31, 2016 and March 31, 2015, respectively.
Fair Value of Financial Instruments
The carrying amounts of the Company’s cash and cash equivalents, accounts receivable and accounts payable approximate their fair values due to the short-term maturity of these instruments. As of March 31, 2016 and 2015, the Company’s short-term investments balance consisted of U.S. Treasury Bills.
Fair value is defined as the exchange price that would be received for an asset or paid to transfer a liability (an exit price) in the principal or most advantageous market for such asset or liability in an orderly transaction between market participants on the measurement date. Valuation techniques used to measure fair value should maximize the use of observable inputs and minimize the use of unobservable inputs. To measure fair value, the Company useswe use the following fair value hierarchy based on three levels of inputs, of which the first two are considered observable and the last unobservable:
Level 1 — QuotedObservable inputs such as quoted prices in active markets for identical assets or liabilities.liabilities;
Level 2 — Inputs other than Level 1, that are observable for the asset or liability, either directly or indirectly, such as quoted prices for similar assetsindirectly; and liabilities in active markets; quoted prices for identical or similar assets or liabilities in markets that are not active; or other inputs that are observable or can be corroborated by observable market data by correlation or other means.
Level 3 — Unobservable inputs that are supported by little or no market activity and that are significantrequire the reporting entity to develop its own assumptions.
The carrying amounts of our cash, cash equivalents, accounts receivable and accounts payable approximate their fair values due to the fair valueshort-term maturity of the assetsthese instruments. Our cash equivalents balance consists primarily of U.S. Treasury Bills with maturities of one month or liabilities.
less.
The following table summarizes the composition of the Company’sour financial assets measured at fair value at March 31, 2024:
| | | | | | | | | | | | | | | | | | | | | | | |
| Level 1 | | Level 2 | | Level 3 | | Total |
| Cash equivalents | $ | 24,902 | | | — | | | — | | | $ | 24,902 | |
There were no financial assets or liabilities measured at fair value on a recurring basis atfor the year ended March 31, 2016 and2023.
Equity Securities Accounted for at Net Asset Value
We held equity interests in private equity funds of $7,318 as of March 31, 2015:2024, which are accounted for under the net asset value practical expedient as permitted under ASC 820, Fair Value Measurement. These investments are included in other assets in the accompanying consolidated balance sheets. The net asset values of these investments are determined using quarterly capital statements from the funds, which are based on our contributions to the funds, allocation of profit and loss and changes in fair value of the underlying fund investments. Changes in fair value as reported on the capital statements are recorded through the consolidated statements of operations as non-operating income or expense. These private equity funds focus on making investments in key technology sectors, principally by investing in companies at expansion capital and growth equity stages. We have total unfunded commitments in private equity funds of $2,645 as of March 31, 2024.
Leases
|
| | | | | | | | | | | | | | | |
| March 31, 2016 | | Level 1 | | Level 2 | | Level 3 | | Total |
| Cash equivalents | | $ | 95,735 |
| | — |
| | — |
| | $ | 95,735 |
|
| Short-term investments | | — |
| | $ | 99,215 |
| | — |
| | $ | 99,215 |
|
|
| | | | | | | | | | | | | | | |
| March 31, 2015 | | Level 1 | | Level 2 | | Level 3 | | Total |
| Cash equivalents | | $ | 204,939 |
| | — |
| | — |
| | $ | 204,939 |
|
| Short-term investments | | — |
| | $ | 49,955 |
| | — |
| | $ | 49,955 |
|
Property and Equipment
Property and equipment are stated at cost, less accumulated depreciation and amortization. Land is not depreciated. The Company provides for depreciationDepreciation is calculated on a straight-line basis over the estimated useful lives of the assets. The depreciable assets that comprise the Company's owned headquarters classified as Buildings are being depreciated over lives ranging from ten to sixty years. Computer and related equipment is generally depreciated over eighteen months to three years and furniture and fixtures are generally depreciated over three to twelve years. Leasehold improvements are amortized over the shorter of the useful life of the improvement or the term of the related lease. Expenditures for routine maintenance and repairs are charged against operations. Major replacements, improvements and additions are capitalized.
Commvault Systems, Inc.
Notes to Consolidated Financial Statements — (Continued)
(In thousands, except per share data)
In January 2023, the assets that previously comprised our owned corporate headquarters met the held for sale criteria in accordance with ASC 360, Property, Plant and Equipment ("ASC 360"), and were reclassified as such. These assets are no longer being depreciated. For further discussion on assets held for sale, see Note 5 of the notes to the consolidated financial statements.
Asset Retirement ObligationGoodwill and Intangible Assets
A liabilityGoodwill is recorded when the consideration paid for an acquisition exceeds the fair value of an asset retirement obligationnet tangible and corresponding increase to theintangible assets acquired. The carrying value of goodwill is tested for impairment on an annual basis on January 1, or more often if an event occurs or circumstances change that would more likely than not reduce the related leasehold improvements are recorded atfair value of its carrying amount. For the time leasehold improvements are acquired.purpose of impairment testing, we have a single reporting unit. The Company maintains certain office space forimpairment test consists of comparing the fair value of the reporting unit with its carrying amount that includes goodwill. If the carrying amount of the reporting unit exceeds the fair value of the reporting unit, an impairment loss would be recognized to reduce the carrying amount to its fair value.
Our finite lived purchased intangible asset, developed technology, was valued using the replacement cost method and is being amortized on a straight-line basis over its economic life of three years as we believed this method most closely reflects the pattern in which the lease agreement requires that the Company return the office space to its original condition upon vacating the premises. Accordingly, the balanceeconomic benefits of the assets will be consumed. Impairment losses are recognized if the carrying amount of an intangible asset retirement obligation was $1,071 as of March 31, 2016is both not recoverable and $687 as of March 31, 2015.exceeds its fair value.
Long-Lived Assets
The Company reviews itsWe review our long-lived assets for impairment whenever events or changes in circumstances indicate that the carrying amount of the assets may not be fully recoverable. To determine the recoverability of itsour long-lived assets, the Company evaluateswe evaluate the estimated future undiscounted cash flows that are directly associated with, and that are expected to arise as a direct result of, the use and eventual disposition of the long-lived asset. If the estimated future undiscounted cash flows demonstrate that recoverability is not probable, an impairment loss would be recognized. An impairment loss would be calculated based on the excess carrying amount of the long-lived asset over the long-lived asset’s fair value. The fair value would be determined based on valuation techniques such as a comparison to fair values of similar assets. There were no impairment charges
Deferred Commissions Cost
Sales commissions, bonuses, and related payroll taxes earned by our employees are considered incremental and recoverable costs of obtaining a contract with a customer. Our typical contracts include performance obligations related to term-based software licenses, SaaS offerings, perpetual software licenses, software updates, and customer support. In these contracts, incremental costs of obtaining a contract are allocated to the performance obligations based on the relative estimated standalone selling prices and then recognized duringon a systematic basis that is consistent with the transfer of the goods or services to which the asset relates. We do not pay commissions on annual renewals of customer support contracts for perpetual licenses. The costs allocated to software and products are expensed at the time of sale, when revenue for the functional software license or appliance is recognized. The costs allocated to software updates and customer support for perpetual licenses are amortized ratably over a period of approximately five years, ended March 31, 2016, 2015the expected period of benefit of the asset capitalized. We currently estimate a period of five years is appropriate based on consideration of historical average customer life and 2014.the estimated useful life of the underlying software sold as part of the transaction. The commission paid on the renewal of subscription arrangements is not commensurate with the commission paid on the initial purchase. As a result, the cost of commissions allocated to SaaS offerings, software updates and customer support on the initial term-based software license transactions are amortized over a period of approximately five years, consistent with the accounting for these costs associated with perpetual licenses. The costs of commissions allocated to SaaS offerings, software updates and support for the renewal of term-based software licenses is limited to the contractual period of the arrangement, as we pay a commensurate renewal commission upon the next renewal of the subscription software license and related updates and support.
Equity Method Investment
In fiscal 2016,The incremental costs attributable to professional services are generally amortized over the Company acquired a 34% ownershipperiod the related services are provided and revenue is recognized. Amortization expense related to these costs is included in Laitek, Inc. ("Laitek"). The Company also has an option to acquire the remaining ownership of Laitek at a fixed price until December 2017. Laitek develops solutions for acquiring, processingsales and presenting scientific and medical image information. The Company uses the equity method to account for its investment. In the event that management identifies an other than temporary declinemarketing expenses in the estimated fair valueaccompanying consolidated statements of an equity method investmentoperations.
Commvault Systems, Inc.
Notes to an amount below its carrying value, such investment is written down to its estimated fair value. The Company also has development and original equipment manufacturing agreements with Laitek to jointly develop healthcare related software products. Certain employees of Laitek were also provided restricted stock units in exchange for consultative services provided to the Company. The awards are included in the information in Note 8.Consolidated Financial Statements — (Continued)
(In thousands, except per share data)
Deferred Revenue
Deferred revenues represent amounts collected from, or invoiced to, customers in excess of revenues recognized. This results primarily from the billing of annual customer support agreements, the billing of SaaS subscription arrangements and billings for other professional services fees that have not yet been performed by the Company and receipt of license fees that are deferred due to one or more of the revenue recognition criteria not being met.us. The value of deferred revenues will increase or decrease based on the timing of invoices and recognition of revenue. The Company expenses internal direct and incremental costs related to contract acquisition and origination as incurred.
Deferred revenue consists of the following:
|
| | | | | | | | |
| | | March 31, |
| | | 2016 | | 2015 |
| Current: | | | | |
| Deferred software revenue | | $ | 1,578 |
| | $ | 1,305 |
|
| Deferred services revenue | | 193,399 |
| | 183,007 |
|
| | | 194,977 |
| | 184,312 |
|
| Non-current: | | | | |
| Deferred services revenue | | 49,889 |
| | 45,423 |
|
| Total Deferred Revenue | | $ | 244,866 |
| | $ | 229,735 |
|
Commvault Systems, Inc.
Notes to Consolidated Financial Statements — (Continued)
(In thousands, except per share data)
Accounting for Stock-Based Compensation
The Company utilizes the Black-Scholes pricing model to determine the fair value of non-qualified stock options on the dates of grant. Restricted stock units without a market condition are measured based on the fair market values of the underlying stock on the date of grant. The Company recognizes stock-based compensation using the straight-line method for all stock awards that don't include a market or performance condition.
In fiscal 2016, the Company granted certain executive officers and other senior employees performance stock units that vest over three years based upon the Company's stock performance versus the Russell 3000 Index. The performance of the stock versus the index is a market condition performance criteria so the Company used a Monte Carlo simulation model to determine the fair value of the restricted stock units. Expense related to stock based compensation that includes market or performance conditions is recognized using the accelerated method.
Share Repurchases
The Company considersWe consider all shares repurchased as canceled shares restored to the status of authorized but unissued shares on the trade date. The aggregate purchase price of the shares of the Company’sour common stock repurchased is reflected as a reduction to Stockholders’ Equity. The Company accountsstockholders’ equity. We account for shares repurchased as an adjustment to common stock (at par value) with the excess repurchase price allocated between Additional Paid-in Capitaladditional paid-in capital and Accumulated Deficit.
Sales Tax
The Company records revenue net of sales tax.
Advertising Costs
The Company expenses advertising costs as incurred. Advertising expenses were $5,083, $5,401, and $6,174 for the years ended March 31, 2016, 2015 and 2014, respectively.
Shipping and Handling Costs
Shipping and handling costs are included in cost of revenues for all periods presented.
Foreign Currency Translation
The functional currencies of the Company’s foreign operations are deemed to be the local country’s currency. Assets and liabilities of the Company’s international subsidiaries are translated at their respective period-end exchange rates, and revenues and expenses are translated at average currency exchange rates for the period. The resulting balance sheet translation adjustments are included in Other Comprehensive Loss and are reflected as a separate component of Stockholders’ Equity.
Foreign currency transaction gains and losses are recorded in “General and administrative expenses” in the Consolidated Statements of Income. The Company recognized net foreign currency transaction gains of $195, $127 and $324 in the years ended March 31, 2016, 2015, and 2014, respectively. The net foreign currency transaction gains recorded in “General and administrative expenses” include settlement gains and losses on forward contracts disclosed below.
To date, the Company has selectively hedged its exposure to foreign currency transaction gains and losses on the balance sheet through the use of forward contracts, which were not designated as hedging instruments. The duration of forward contracts utilized for hedging the Company’s balance sheet exposure is generally one month to three months. As of March 31, 2016 and March 31, 2015, the Company did not have any forward contracts outstanding. The Company recorded net realized losses in general and administrative expenses of $53 in fiscal 2016, gains of $33 in fiscal 2015 and losses of $82 in fiscal 2014 related to the settlement of a forward exchange contracts. In the future, the Company may enter into additional foreign currency-based hedging contracts to reduce its exposure to significant fluctuations in currency exchange rates on the balance sheet.accumulated deficit.
Comprehensive Income (Loss)
Comprehensive income (loss) is defined to include all changes in equity, except those resulting from investments by stockholders and distribution to stockholders.
Recently Adopted and Recently Issued Accounting Standards
There were no recently adopted accounting standards that had a material effect on our condensed consolidated financial statements and accompanying disclosures. The table below outlines recently issued accounting standards not yet adopted.
| | | | | | | | | | | |
| Standard | Description | Effective Date | Effect on the Consolidated Financial Statements (or Other Significant Matters) |
| Accounting Standards Update ("ASU") No. 2023-07 (Topic 280): Segment Reporting | In November 2023, the Financial Accounting Standards Board ("FASB") issued a new standard to improve reportable segment disclosure requirements, primarily through enhanced disclosures about significant segment expenses. In addition, the amendments enhance interim disclosure requirements, clarify circumstances in which an entity can disclose multiple segment measures of profit or loss, provide new segment disclosure requirements for entities with a single reportable segment, and contain other disclosure requirements. | This standard will be effective for our fiscal year beginning April 1, 2024, and interim periods within our fiscal year beginning April 1, 2025. | We will adopt this standard using a retrospective approach on April 1, 2024. We are currently evaluating the impact of this standard in our consolidated financial statements, including accounting policies, processes, and systems. |
| ASU No. 2023-09 (Topic 740): Income Taxes | In December 2023, the FASB issued a new standard to improve income tax disclosures. The standard requires greater disaggregated information about a reporting entity’s effective tax rate reconciliation as well as information on income taxes paid. | This standard will be effective for our fiscal year beginning April 1, 2025. | We are currently evaluating the impact of this standard in our consolidated financial statements, including accounting policies, processes, and systems. |
Commvault Systems, Inc.
Notes to Consolidated Financial Statements — (Continued)
(In thousands, except per share data)
3. Revenue
Recently Issued Accounting StandardsWe derive revenues from various sources, including subscriptions, perpetual software licenses, customer support contracts and other services.
Deferred TaxesSubscription
In November 2015,Subscription includes the Financial Accounting Standards Board ("FASB") issued new accounting guidance regarding balance sheet classificationrevenues derived from term-based arrangements, including the software portion of deferred taxes.term-based licenses and SaaS offerings. The guidance requires companiessoftware component of term-based licenses is typically recognized when the software is delivered or made available for download. The term of our subscription arrangements is typically one to classify all deferred tax assetsthree years, but can range between one and liabilities as noncurrentfive years. For SaaS offerings, revenue is generally recognized ratably over the contract term beginning on the balance sheet insteaddate that the service is made available to the customer.
Perpetual License
Perpetual license includes the revenues from the sale of separating deferred taxes into current and noncurrent. The Company has electedperpetual software licenses. Perpetual software license revenue is typically recognized when the software is delivered or made available for download.
Customer Support
Customer support includes revenues associated with support contracts tied to early adopt the guidanceour software products. Customer support includes software updates on a retrospective basis. The adoption had an effectwhen-and-if-available basis, telephone support, integrated web-based support, and other premium support offerings, for both subscription software and perpetual software license arrangements. We sell our customer support contracts as a percentage of net software purchases. Customer support revenue is recognized ratably over the term of the customer support agreement, which is typically one year on our perpetual licenses and over the term on our term-based licenses.
Other Services
Other services consist primarily of revenues related to professional service offerings, including consultation, assessment and design, installation services, and customer education. Revenues related to other services can vary period over period based on the Consolidated Balance sheettiming services are delivered and are typically recognized as the services are performed.
We do not customize our software licenses (both perpetual and term-based) and installation services are not required. Software licenses are delivered before related services are provided and are functional without professional services, updates and technical support. We have concluded that our software licenses (both perpetual and term-based) are functional intellectual property that is distinct, as the user can benefit from the software on its own. Revenues for both perpetual and term-based licenses are typically recognized when the software is delivered and/or made available for download as this is the point the user of March 31, 2015the software can direct the use of, and no effect onobtain substantially all of the Consolidated Statement of Income, Comprehensive Income (Loss), Cash Flow, or Statement of Stockholder’s Equity.
The following table summarizesremaining benefits from, the Company's As Reported and As Adjusted changesfunctional intellectual property. We do not recognize software revenue related to the Consolidated Balance Sheet at March 31, 2015.
|
| | | | | | | |
| | | March 31,
2015 |
| | | As Reported | As Adjusted |
| Current assets: | | | |
| Deferred tax assets, net | | $ | 16,142 |
| $ | — |
|
| Total Current Assets | | $ | 541,551 |
| $ | 525,409 |
|
| | | | |
| Deferred tax assets, net | | $ | 24,903 |
| $ | 41,045 |
|
Revenue Recognition
In May 2014, the FASB issued Accounting Standards Update ("ASU") No. 2014-09, "Revenue from Contracts with Customers (Topic 606)" (ASU 2014-09) and has since modified the standard with ASU 2015-14, "Deferralrenewal of the Effective Date." These standards replace existing revenue recognition rules with a comprehensive revenue measurement and recognition standard and expanded disclosure requirements. The new standard becomes effective for the Company's fiscal 2019 with early adoption permitted in fiscal 2018. The Company is in the process of determining the impact of the standard on the financial statements and the timing of adoption. The FASB allows two adoption methods under the new standard. Under one method, a company will apply the rules to contracts in all reporting periods presented. The Company currently believes it will apply this method of adoption.
Leases
In February 2016, the FASB issued ASU 2016-02 “Leases (Topic 842)” (“ASU 2016-02”). Under ASU 2016-02, a lessee will recognize in the balance sheet a liability to make lease payments (the lease liability) and a right-to-use asset representing its right to use the underlying asset for the lease term. The amendments of this ASU are effective for the Company's fiscal 2020, with early adoption permitted. A company will be required to recognize and measure leases atsubscription software licenses earlier than the beginning of the earliest period presented usingnew subscription period.
We also offer appliances that integrate our software with hardware and address a modified retrospective approach. The Companywide-range of business needs and use cases, ranging from support for remote or branch offices with limited IT staff up to large corporate data centers. Our appliances are almost exclusively sold via a software only model in which we sell software to a third party, which assembles an integrated appliance that is currently assessingsold to end user customers. As a result, the impact the adoption of ASU 2016-02 will have on therevenues and costs associated with hardware are usually not included in our financial statements.
Stock-based Compensation
In March 2016, the FASB issued ASU 2016-09, "Improvements to Employee Share-Based Payment Accounting," which simplifies several aspects of the accounting for employee share-based payment transactions, including the accounting for income taxes, forfeitures, and statutory tax withholding requirements, as well as classification in the statement of cash flows. The Company is required to adopt the new guidance in fiscal 2018 with early adoption permitted. The Company is currently assessing the impact the adoption of ASU 2016-09 will have on the financial statements.
Commvault Systems, Inc.
Notes to Consolidated Financial Statements — (Continued)
(In thousands, except per share data)
3. Property and Equipment
Property and equipment consist ofOur typical performance obligations include the following:
| | | | | | | | | | | |
| Performance Obligation | When Performance Obligation
is Typically Satisfied | When Payment is
Typically Due | How Standalone Selling Price is
Typically Estimated |
| Subscription |
| Term-based software licenses | Upon shipment or made available for download (point in time) | Within 90 days of shipment except for certain subscription licenses which are paid for over time | Residual approach |
| Software-as-a-service (SaaS) | Ratably over the course of the contract (over time) | Annually or at the beginning of the contract period | Observable in transactions without multiple performance obligations |
| Perpetual License |
| Perpetual software licenses | Upon shipment or made available for download (point in time) | Within 90 days of shipment | Residual approach |
| Customer Support |
| Software updates | Ratably over the course of the support contract (over time) | At the beginning of the contract period | Observable in renewal transactions |
| Customer support | Ratably over the course of the support contract (over time) | At the beginning of the contract period | Observable in renewal transactions |
| Other Services |
| Other professional services (except for education services) | As work is performed (over time) | Within 90 days of services being performed | Observable in transactions without multiple performance obligations |
| Education services | When the class is taught (point in time) | Within 90 days of services being performed | Observable in transactions without multiple performance obligations |
|
| | | | | | | | |
| | | March 31, |
| | | 2016 | | 2015 |
| Land | | $ | 9,445 |
| | $ | 9,445 |
|
| Buildings | | 103,193 |
| | 102,880 |
|
| Computers, servers and other equipment | | 33,120 |
| | 33,914 |
|
| Furniture and fixtures | | 14,458 |
| | 14,399 |
|
| Leasehold improvements | | 6,948 |
| | 4,621 |
|
| Purchased software | | 1,279 |
| | 2,463 |
|
| Construction in process | | 165 |
| | 619 |
|
| | | 168,608 |
| | 168,341 |
|
| Less: Accumulated depreciation and amortization | | (32,704 | ) | | (28,133 | ) |
| | | $ | 135,904 |
| | $ | 140,208 |
|
Most of our contracts with customers contain multiple performance obligations. For these contracts, we evaluate and account for individual performance obligations separately if they are determined to be distinct. The Company recorded depreciationtransaction price is allocated to the separate performance obligations on a relative standalone selling price basis. Standalone selling prices of software licenses (both perpetual and amortization expense of $10,927, $8,856, and $6,207term-based) are typically estimated using the residual approach. Standalone selling prices for the years ended March 31, 2016, 2015 and 2014, respectively.
4. Accrued Liabilities
Accrued liabilities consist of the following:
|
| | | | | | | | |
| | | March 31, |
| | | 2016 | | 2015 |
| Compensation and related payroll taxes | | $ | 36,789 |
| | $ | 38,518 |
|
| Other | | 32,889 |
| | 34,239 |
|
| | | $ | 69,678 |
| | $ | 72,757 |
|
5. Commitments and Contingencies
Leases
The Company leases various office facilities under non-cancelable leases, which expire on various dates through April 2022. Future minimum lease payments under all operating leases at March 31, 2016 are as follows:
|
| | | |
| Year Ending March 31, | |
| 2017 | $ | 8,540 |
|
| 2018 | 6,815 |
|
| 2019 | 6,071 |
|
| 2020 | 4,973 |
|
| 2021 and thereafter | 7,503 |
|
| | $ | 33,902 |
|
Rent expenses were $9,856, $10,845, and $11,405 for the years ended March 31, 2016, 2015 and 2014, respectively.
Rent expense is calculated by amortizing total rental payments (net of any rental abatements, allowancesSaaS, customer support contracts, and other rental concessions),services are typically estimated based on observable transactions when these services are sold on a straight-line basis, over the lease term. Accordingly, rent expense charged to operations differs from rent paid resulting in the Company recording deferred rent.standalone basis. We recognize revenue net of sales tax.
Commvault Systems, Inc.
Notes to Consolidated Financial Statements — (Continued)
(In thousands, except per share data)
Disaggregation of Revenue
We disaggregate revenues from contracts with customers into geographical regions. Our Americas region includes the United States, Canada, and Latin America. Our International region primarily includes Europe, Middle East, Africa, Australia, India, Southeast Asia, and China.
| | | | | | | | | | | | | | | | | |
| Year Ended March 31, |
| 2024 | | 2023 | | 2022 |
| Americas | $ | 498,545 | | | $ | 469,244 | | | $ | 457,895 | |
| International | 340,702 | | | 315,346 | | | 311,696 | |
| Total revenues | $ | 839,247 | | | $ | 784,590 | | | $ | 769,591 | |
Remaining Performance Obligations
Remaining performance obligations represent expected future revenue from existing contracts where performance obligations are unsatisfied or partially unsatisfied at the end of the reporting period. As of March 31, 2024, our remaining performance obligations (inclusive of deferred revenues) were $618,907, of which approximately 68% is expected to be recognized as revenue over the next 12 months and the remainder recognized thereafter. The vast majority of these revenues consist of SaaS arrangements, customer support, and other services. Other services consists primarily of professional services revenue which is contingent upon a number of factors, including customers' needs and scheduling.
Information about Contract Balances
Amounts collected in advance of services being provided are accounted for as deferred revenue. Nearly all of our deferred revenue balance is related to SaaS arrangements, customer support, and other services.
In some arrangements we allow customers to pay for term-based licenses over the term of the software license. Amounts recognized as revenue in excess of amounts billed are recorded as unbilled receivables. Unbilled receivables which are anticipated to be invoiced in the next twelve months are included in accounts receivable on the consolidated balance sheets. Long-term unbilled receivables are included in other assets. The opening and closing balances of our accounts receivable, unbilled receivables and deferred revenues are as follows:
| | | | | | | | | | | | | | | | | |
| Accounts Receivable | Unbilled Receivable
(current) | Unbilled Receivable
(long-term) | Deferred Revenue
(current) | Deferred Revenue
(long-term) |
| Opening balance as of March 31, 2023 | $ | 188,736 | | $ | 21,705 | | $ | 9,867 | | $ | 307,562 | | $ | 174,393 | |
| Increase/(decrease), net | 8,215 | | 4,027 | | 4,604 | | 54,888 | | (5,921) | |
| Ending balance as of March 31, 2024 | $ | 196,951 | | $ | 25,732 | | $ | 14,471 | | $ | 362,450 | | $ | 168,472 | |
The net increase in accounts receivable (inclusive of unbilled receivables) is primarily a result of an increase in revenue relative to the prior year period. The net increase in deferred revenue is a result of an increase in SaaS contracts which are billed upfront but recognized ratably over the contract period and an increase in deferred customer support revenue.
The amount of revenue recognized in the period that was included in the opening deferred revenue balance was approximately $313,766 for the year ended March 31, 2024. The vast majority of this revenue consists of customer support and SaaS arrangements. The amount of revenue recognized from performance obligations satisfied in prior periods was not significant.
Commvault Systems, Inc.
Notes to Consolidated Financial Statements — (Continued)
(In thousands, except per share data)
4. Goodwill and Intangible Assets, Net
Goodwill
Goodwill represents the residual purchase price paid in a business combination after the fair value of all identified assets and liabilities have been recorded. It includes the estimated value of potential expansion with new customers, the opportunity to further develop sales relationships with new customers and intangible assets that do not qualify for separate recognition. Goodwill is not amortized. None of the goodwill recorded is expected to be deductible for income tax purposes.
There were no impairments to the carrying amount of goodwill during the fiscal years ended March 31, 2024, 2023 or 2022.
Goodwill balances are as follows:
| | | | | | | | | | | | | | |
| | 2024 | | 2023 |
| Opening balance | | $ | 127,780 | | | $ | 127,780 | |
| Additions/(Impairments) | | — | | | — | |
| Ending balance | | $ | 127,780 | | | $ | 127,780 | |
Intangible assets, net
Intangible assets are recorded at cost and amortized over useful lives of three years.
| | | | | | | | | | | | | | | | | | | | | | | | | | | | | | | | | | | |
| March 31, 2024 | | March 31, 2023 |
| Gross Carrying Amount | | Accumulated Amortization | | Net Carrying Value | | Gross Carrying Amount | | Accumulated Amortization | | Net Carrying Value |
| Developed technology | $ | 3,750 | | | $ | (2,708) | | | $ | 1,042 | | | $ | 3,750 | | | $ | (1,458) | | | $ | 2,292 | |
Amortization expense from acquired intangible assets was $1,250 for the fiscal years ended March 31, 2024 and 2023 and $208 for fiscal year ended 2022.
As of March 31, 2024, the estimated future amortization expense of intangible assets with finite lives is $1,042, which will be fully recognized in fiscal year 2025.
Commvault Systems, Inc.
Notes to Consolidated Financial Statements — (Continued)
(In thousands, except per share data)
5. Assets Held for Sale
During the fourth quarter of fiscal 2023, we entered into an exclusive agreement to sell our owned corporate headquarters in Tinton Falls, New Jersey for $40,000 in cash consideration and determined the assets and land related to headquarters met the criteria for classification as assets held for sale in accordance with ASC 360, Impairment and Disposal of Long-Lived Assets ("ASC 360"). The property's previous carrying amount of $92,161 was written down to its estimated fair value, less estimated costs to sell, of $38,680, resulting in a non-cash impairment charge of $53,481 on our consolidated statements of operations for the period ended March 31, 2023. Upon closing of the transaction, we intend to enter into a lease for a portion of the premises.
As of March 31, 2024, the sale has not yet been finalized and the exclusivity of the agreement has expired. As a result of the expiration of the exclusivity, we received a payment for $1,670 related to non-refundable escrow, which is recorded in other income (loss) on our consolidated statements of operations for the period ended March 31, 2024.
The assets have been classified as held for sale for more than one year. In accordance with ASC 360, assets not sold by the end of the one-year period may still qualify as held for sale, if certain conditions are met. The Board of Directors reconfirmed their approval of the sale at the January 2024 meeting and we believe the sale will be completed in calendar year 2024. As of March 31, 2024, we concluded all of the held for sale criteria is still met, and the assets are properly classified on the consolidated balance sheets. In addition, we have assessed whether there are any indicators of impairment and have concluded that the current carrying amount represents the estimated fair value, less estimated costs to sell, and no additional remeasurement should be recorded.
6. Property and Equipment
Property and equipment consist of the following:
| | | | | | | | | | | | | | |
| | | March 31, |
| | | 2024 | | 2023 |
| | | | |
| | | | |
| Computers, servers and other equipment | | $ | 45,620 | | | $ | 43,135 | |
| Furniture and fixtures | | 2,965 | | | 3,264 | |
| Leasehold improvements | | 8,180 | | | 8,433 | |
| Purchased software | | 2,586 | | | 1,862 | |
| Construction in process | | 189 | | | 111 | |
| | 59,540 | | | 56,805 | |
| Less: Accumulated depreciation and amortization | | (51,579) | | | (48,518) | |
| | $ | 7,961 | | | $ | 8,287 | |
We recorded depreciation and amortization expense of $5,165, $8,958, and $10,708 for the years ended 2024, 2023 and 2022, respectively. Depreciation expense allocated to our cost of goods sold was approximately $938 for the year ended 2023, and $1,250 for the year ended 2022. There was no depreciation expense allocated to our cost of goods sold for the year ended 2024.
As discussed in Note 5 of the notes to the consolidated financial statements, assets related to the sale of the Tinton Falls, New Jersey headquarters were reclassified to assets held for sale in the fourth quarter of fiscal 2023, at which time depreciation ended.
Commvault Systems, Inc.
Notes to Consolidated Financial Statements — (Continued)
(In thousands, except per share data)
7. Accrued Liabilities
Accrued liabilities consist of the following:
| | | | | | | | | | | | | | |
| | | March 31, |
| | | 2024 | | 2023 |
| Compensation and related payroll taxes | | $ | 70,961 | | | $ | 58,112 | |
| Other | | 46,283 | | | 39,776 | |
| | $ | 117,244 | | | $ | 97,888 | |
8. Commitments and Contingencies
Purchase Commitments
The Company,
We, in the normal course of business, entersenter into various purchase commitments for goods or services. Our outstanding commitments primarily relate to marketing and IT services and also include the remaining purchase commitments for our use of certain cloud services with third-party providers. Total non-cancellable purchase commitments as of March 31, 20162024 are approximately $11,591 for fiscal 2017, $1,721 for fiscal 2018, $354 for fiscal 2019 and $42 for fiscal 2020, totaling $13,708 for all periods through fiscal 2020. These purchase commitments primarily result from contractsas follows:
| | | | | | | | | | | | | | | | | | | | | | | | | | | | | | | | |
| | Year Ended March 31, |
| | 2025 | | 2026 | | 2027 | | 2028 and beyond | | Total |
| Purchase commitments | | $ | 42,011 | | | $ | 9,652 | | | $ | 1,532 | | | $ | 111,527 | | | $ | 164,722 | |
In June 2022, we entered into an amended agreement with a third-party provider, in the ordinary course of business, for the acquisitionuse of IT infrastructure, marketing and software developmentcertain cloud services andthrough June 2027. Under the constructionamended agreement, we committed to a purchase of $200,000 throughout the term of the Company’s corporate campus headquarters.agreement. As of March 31, 2024, we had $111,500 of remaining obligations under the purchase agreement.
The Company hasWe have certain software royalty commitments associated with the shipment and licensing of certain products. Royalty expense is generally based on a fixed cost per unit shipped or a fixed fee for unlimited units shipped over a designated period. Royalty expense, included in cost of softwaresubscription and perpetual license revenues, was $1,933 in fiscal 2016, $1,768 in fiscal 2015 and $1,350 in fiscal 2014.as follows:
| | | | | | | | | | | | | | | | | | | | |
| | Year Ended March 31, |
| | 2024 | | 2023 | | 2022 |
| Royalty expense | | $ | 9,717 | | | $ | 9,339 | | | $ | 11,188 | |
Warranties and Indemnifications
The Company offersWe typically offer a 90-day limited product warranty for itsour software. To date, costs related to this product warranty have not been material.significant.
The Company providesWe provide certain provisions within itsour software licensing agreements to indemnify itsour customers from any claim, suit or proceeding arising from alleged or actual intellectual property infringement. These provisions continue in perpetuity, along with the Company’sour software licensing agreements. The Company hasWe have never incurred a liability relating to one of these indemnification provisions, and management believes that the likelihood of any future payout relating to these provisions is remote. Therefore, the Company haswe have not recorded a liability during any period for these indemnification provisions.
Legal Proceedings
In the normal course of its business, the Company may be involved in various claims, negotiations and legal actions. As of March 31, 2016, the Company is not aware of any asserted or unasserted claims, negotiations and legal actions for which a loss is considered reasonably possible of occurring and would require disclosure under the guidance.
On September 10, 2014, a purported class action complaint was filed in the United States District Court for the District of New Jersey against the Company, its Chief Executive Officer and its Chief Financial Officer. The case is captioned In re Commvault Systems, Inc. Securities Litigation (Master File No. 3:14-cv-05628-MAS-LHG). The suit alleges that the Company made materially false and misleading statements, or failed to disclose material facts, regarding the Company's financial results, business, operations and prospects in violation of Sections 10(b) and 20(a) of the Securities Exchange Act of 1934 and Rule 10b-5 promulgated thereunder. The suit asserts claims covering an alleged class period from May 7, 2013 through April 24, 2014. It is purportedly brought on behalf of purchasers of the Company's common stock during that period, and seeks compensatory damages, costs and expenses, as well as equitable or other relief. Lead plaintiff, the Arkansas Teachers Retirement System, was appointed on January 12, 2015, and on March 18, 2015, an amended complaint was filed by the plaintiffs. On December 17, 2015, the defendant’s motion to dismiss the case was granted and the case dismissed; however, the plaintiffs were permitted to re-file their claim, which they did on February 5, 2016. Defendants filed another motion to dismiss on April 5, 2016, which remains pending with the court. Due to the inherent uncertainties of litigation, the Company cannot accurately predict the ultimate outcome of this matter. The Company are unable at this time to determine whether the outcome of the litigation will have a material impact on our results of operations, financial condition or cash flows. As of March 31, 2016 the Company has not recorded a reserve for this matter.
6. Revolving Credit Facility
On June 30, 2014, the Company entered into a five-year $250,000 revolving credit facility (the “Credit Facility”). The Credit Facility is available for share repurchases, general corporate purposes, and letters of credit. The Credit Facility contains financial maintenance covenants including a leverage ratio and interest coverage ratio. The Credit Facility also contains certain customary events of default which would permit the lenders to, among other things, declare all loans then outstanding to be immediately due and payable if such default is not cured within applicable grace periods. The Credit Facility also limits the Company's ability to incur certain additional indebtedness, create or permit liens on assets, make acquisitions, make investments, loans or advances, sell or transfer assets, pay dividends or distributions, and engage in certain transactions with foreign affiliates. Outstanding borrowings under the Credit Facility accrue interest at an annual rate equal to London Interbank
Commvault Systems, Inc.
Notes to Consolidated Financial Statements — (Continued)
(In thousands, except per share data)
Lease Obligations
Offered Rate plus 1.50% subject
Please refer to increases based on the Company's actual leverage. The unused balance on the Credit Facility is also subject to a 0.25% annual interest charge subject to increases based on the Company's actual leverage. As of March 31, 2016, there were no borrowings under the Credit Facility and the Company was in compliance with all covenants.
The Company has deferred the expense related to debt issuance costs, which are classified as Other Assets, and will amortize the costs into interest expense over the termNote 15 of the Credit Facility. Unamortizednotes to the financial statements for more detail on our minimum lease commitments.
Legal Proceedings
We do not believe that we are currently party to any pending legal action that could reasonably be expected to have a material adverse effect on our business or operating results.
During fiscal 2022, we entered into settlement agreements resulting in a $7,900 gain which resolved certain legal matters. The settlement amounts at March 31, 2016 were $820are recorded in general and $1,072 as of March 31, 2015. The amortization of debt issuance costs was $252 for year ended March 31, 2016 and $190 for the year ended March 31, 2015. Amortization of debt issuances costs is included in Interest expense.administrative expenses net against related legal expenses.
7.
9. Capitalization
As of March 31, 2016 and 2015, the Company had 250,000 shares of common stock and 50,000 shares of preferred stock authorized. As of March 31, 2016 and 2015 there were no shares of preferred stock outstanding.
On November 13, 2008, the Board of Directors of the Company adopted a Rights Plan and declared a dividend distribution of one Right for each outstanding share of common stock to shareholders of record on November 24, 2008. Each Right, when exercisable, entitles the registered holder to purchase one one-thousandth of a share of Series A Junior Participating Preferred Stock, par value $0.01 per share, at a purchase price of eighty dollars per one one thousandth of a share, subject to adjustment. Of the 50,000 shares of preferred stock authorized under the Company’s certificate of incorporation, 150 have been designated as Series A Junior Participating Preferred.
The Rights will become exercisable following the tenth business day after (i) a person or group announces the acquisition of 15% or more of the Company’s common stock or (ii) commencement of a tender or exchange offer, the consummation of which would result in ownership by the person or group of 15% or more of the Company’s common stock. The Company is also entitled to redeem the Rights at $0.001 per right under certain circumstances. The Rights expire on November 14, 2018, if not exercised or redeemed.
Common Stock
The Company had 44,134We have 43,548 and 45,12244,140 shares of common stock, par value $0.01, outstanding at March 31, 20162024 and March 31, 2015,2023, respectively.
Our share repurchase program has been funded by our existing cash and cash equivalent balances, as well as cash flows provided by our operations.
The Board of Directors (the "Board") had previously approved a share repurchase program of $250,000 in April 2023. The Board's authorization has no expiration date. During fiscal 2016, the Company2024, we repurchased $91,477$184,021 of our common stock, or 2,563 shares,approximately 2,479 shares. As a result, $71,944 remained available under its share repurchase program. Asthe current authorization as of March 31, 2016, $93,102 remained2024.
Subsequent Event
On April 18, 2024, the Board of Directors approved an increase in the current stockour share repurchase program so that $250,000 was available. The Board's authorization which expires on March 31, 2017.has no expiration date.
Shares Reserved for Issuance
The Company hasAt March 31, 2024, we have reserved 10,7936,149 shares in connection with itsour Stock Plans discussed in Note 8 at March 31, 2016.10 of the notes to the consolidated financial statements.
8.
10. Stock Plans
We maintain the Omnibus Incentive Plan (the “2016 Incentive Plan”) for granting awards to employees. On August 29, 2023, our shareholders approved an amendment to the 2016 Incentive Plan to increase the maximum number of shares of common stock that may be delivered under the plan to 14,250, an increase of 3,200 shares. The 2016 Incentive Plan authorizes a broad range of awards including stock options, stock appreciation rights, full value awards (including restricted stock, restricted stock units, performance shares or units and other stock-based awards) and cash-based awards. As of March 31, 2016, the Company maintains two stock incentive plans, the 1996 Stock Option Plan (the “Plan”) and the 2006 Long-Term Stock Incentive Plan (the “LTIP”).
Under the Plan, the Company may grant non-qualified stock options to purchase 11,7052024, approximately 3,754 shares of common stock to certain officers and employees. Stock options are granted at the discretion of the Board and expire 10 years from the date of the grant. At March 31, 2016, there were 572 options available for future grant under the 2016 Incentive Plan.
The LTIP permits the grantAs of incentive stock options,March 31, 2024, we have granted non-qualified stock options, restricted stock awards, restricted stock units stock appreciation rights,and performance stock awards and stock unit awards based on, or related to, shares of the Company’s common stock. On each April 1, the number of shares available for issuance under the LTIP is increased, if applicable, such that the total number of shares available for awards under the LTIP as of any April 1 is equal to 5% of the number of outstanding shares of the Company’s common stock on that April 1. As of March 31, 2016, approximately 1,058 shares were available for future issuance under the LTIP.
As of March 31, 2016, the Company has granted non-qualified stock options and restricted stock units under itsour stock incentive plans. Historically, most equity awards granted by the Companyus under itsour stock incentive plans generally vest quarterly over a four-yearthree-year period, except that the shares that would otherwise vest quarterly over the first twelve months do not vest until
Commvault Systems, Inc.
Notes to Consolidated Financial Statements — (Continued)
(In thousands, except per share data)
the first anniversary of the grant. Beginning in October of 2015, the Company began granting its equity awards with a three-year vest period, and retained the practice that shares that would otherwise vest quarterly over the first twelve months do not vest until the first anniversary of the grant. However, from time to time the company grants equity awards that vest between one and three years. The Company anticipatesWe anticipate that future grants under itsour stock incentive plans will be restricted stock units and doesperformance stock awards and do not anticipate that itwe will grant stock options.
As of March 31, 2016, there was approximately $105,498 of unrecognized stock-based compensation expense related to all of the Company's employee stock plans, net of estimated forfeitures, that is expected to be recognized over a weighted average period of 2.15 years. To the extent the actual forfeiture rate is different from what the Company has anticipated, stock-based compensation related to these awards will be different from the Company’s expectations.
The Company estimated the fair value of stock options granted using the Black-Scholes formula. The Company’s calculation of expected term includes a combination of actual exercise data and an assumption on when the remaining outstanding options with similar characteristics would be exercised based on the Company’s historical data. In determining expected life, the Company separates employees into groups that have historically exhibited similar behavior with regard to option exercises. Expected volatility is calculated based on a blended approach that included the implied volatility of the Company’s traded options with a remaining maturity greater than six months and the historical realized volatility of the Company’s common stock. The risk-free interest rate is determined by reference to U.S. Treasury yield curve rates with a remaining term that is approximately the expected life assumed at the date of grant. Forfeitures are estimated based on the Company’s historical analysis of actual stock option forfeitures.
The assumptions used in the Black-Scholes option-pricing model are as follows:
|
| | | | | | |
| | | Year Ended March 31, |
| | | 2016 | | 2015 | | 2014 |
| Dividend yield | | None | | None | | None |
| Expected volatility | | 39% - 43% | | 41% - 47% | | 42% - 47% |
| Weighted average expected volatility | | 41% | | 46% | | 45% |
| Risk-free interest rates | | 1.29% - 1.75% | | 1.22% - 2.18% | | 0.70% - 2.11% |
| Weighted average expected life (in years) | | 4.6 | | 5.7 | | 6.9 |
Commvault Systems, Inc.
Notes to Consolidated Financial Statements — (Continued)
(In thousands, except per share data)
The following summarizestable presents the activitystock-based compensation expense included in cost of revenues, sales and marketing, research and development, general and administrative and restructuring expenses for the Company’s two stock incentive plans from March 31, 2013 to March 31, 2016:
|
| | | | | | | | | | | | | |
| Options | | Number of
Options | | Weighted-
Average
Exercise Price | | Weighted-
Average
Remaining
Contractual
Term (Years) | | Aggregate
Intrinsic
Value |
| Outstanding at March 31, 2013 | | 6,439 |
| | $ | 28.31 |
| | | | |
| Options granted | | 1,035 |
| | 85.91 |
| | | | |
| Options exercised | | (999 | ) | | 17.62 |
| | | | |
| Options forfeited | | (87 | ) | | 50.05 |
| | | | |
| Options expired | | — |
| | — |
| | | | |
| Outstanding at March 31, 2014 | | 6,388 |
| | 39.03 |
| | | | |
| Options granted | | 1,155 |
| | 46.08 |
| | | | |
| Options exercised | | (504 | ) | | 19.44 |
| | | | |
| Options forfeited | | (159 | ) | | 65.93 |
| | | | |
| Options expired | | (27 | ) | | 68.84 |
| | | | |
| Outstanding at March 31, 2015 | | 6,853 |
| | 40.91 |
| | | | |
| Options granted | | 148 |
| | 41.84 |
| | | | |
| Options exercised | | (764 | ) | | 8.80 |
| | | | |
| Options forfeited | | (172 | ) | | 59.79 |
| | | | |
| Options expired | | (126 | ) | | 61.81 |
| | | | |
| Outstanding at March 31, 2016 | | 5,939 |
| | $ | 44.07 |
| | 5.63 | | $ | 53,192 |
|
| Vested or expected to vest at March 31, 2016 | | 5,867 |
| | $ | 43.96 |
| | 5.60 | | $ | 53,161 |
|
| Exercisable at March 31, 2016 | | 4,613 |
| | $ | 40.25 |
| | 4.94 | | $ | 52,814 |
|
The weighted average fair value of stock options granted was $15.20 per share, $20.16 per share, and $41.70 per share during the years ended March 31, 2016, 20152024, 2023 and 2014, respectively. 2022. Stock-based compensation is attributable to restricted stock units, performance-based awards and the ESPP.
| | | | | | | | | | | | | | | | | | | | |
| | | Year Ended March 31, |
| | | 2024 | | 2023 | | 2022 |
| Cost of revenues | | $ | 6,832 | | | $ | 4,787 | | | $ | 4,474 | |
| Sales and marketing | | 36,630 | | | 43,081 | | | 37,431 | |
| Research and development | | 21,585 | | | 28,540 | | | 33,870 | |
| General and administrative | | 27,987 | | | 26,731 | | | 27,679 | |
| Restructuring | | 1,517 | | | 2,607 | | | 1,709 | |
| Stock-based compensation expense | | $ | 94,551 | | | $ | 105,746 | | | $ | 105,163 | |
As of March 31, 2024, there was approximately $125,213 of unrecognized stock-based compensation expense related to all of our employee stock plans that is expected to be recognized over a weighted-average period of 1.76 years. We account for forfeitures as they occur. To the extent that awards are forfeited, stock-based compensation will be different from our current estimate.
Stock option activity is as follows:
| | | | | | | | | | | | | | | | | | | | | | | | | | |
| Options | | Number of
Options | | Weighted-
Average
Exercise Price | | Weighted-
Average
Remaining
Contractual
Term (Years) | | Aggregate
Intrinsic
Value |
| Outstanding at March 31, 2023 | | 553 | | | $ | 73.58 | | | | | |
| Granted | | — | | | — | | | | | |
| Exercised | | (58) | | | 48.88 | | | | | |
| Forfeited | | — | | | — | | | | | |
| Expired | | (371) | | | 86.95 | | | | | |
| Outstanding at March 31, 2024 | | 124 | | | $ | 45.25 | | | 0.63 | | $ | 6,969 | |
| | | | | | | | |
| Exercisable at March 31, 2024 | | 124 | | | $ | 45.25 | | | 0.63 | | $ | 6,969 | |
The total intrinsic value of options exercised was $23,391, $15,069,$1,378, $1,176, and $59,509$12,704 in the years ended March 31, 2016, 20152024, 2023 and 2014,2022, respectively.
Restricted stock unit activity is as follows:
| | | | | | | | | | | | | | |
| Non-Vested Restricted Stock Units | | Number
of
Awards | | Weighted-
Average
Grant Date
Fair Value |
| Non-vested as of March 31, 2023 | | 2,953 | | | $ | 62.52 | |
| Granted | | 1,483 | | | 70.42 | |
| Vested | | (1,641) | | | 60.08 | |
| Forfeited | | (378) | | | 65.74 | |
| Non-vested as of March 31, 2024 | | 2,417 | | | $ | 68.52 | |
The total fair value of the restricted stock units that vested during the years ended March 31, 2024, 2023 and 2022 was $118,047, $114,422 and $122,259, respectively. The Company’s policy is to issue new shares upon exercisefair value of options asawards includes the Company does not hold shares in treasury.
The following table summarizes information on stock options outstanding under the Plan and LTIP at March 31, 2016:
awards with a market condition described below.
|
| | | | | | | | | | | | | | | | |
| Range of Exercise Prices | | Options
Outstanding at
March 31,
2016 | | Weighted-Average | | Options
Exercisable at
March 31,
2016 | | Weighted-
Average
Exercise Price |
Remaining
Contractual Life | | Exercise Price | |
| $11.12 - 13.81 | | 918 |
| | 2.31 | | $ | 12.38 |
| | 918 |
| | $ | 12.38 |
|
| 15.88 - 26.83 | | 1,122 |
| | 3.52 | | 23.17 |
| | 1,122 |
| | 23.17 |
|
| 27.02 - 41.31 | | 192 |
| | 6.99 | | 36.29 |
| | 107 |
| | 34.34 |
|
| 41.55 | | 723 |
| | 5.51 | | 41.55 |
| | 723 |
| | 41.55 |
|
| 43.30 - 45.39 | | 90 |
| | 8.94 | | 44.39 |
| | 5 |
| | 44.31 |
|
| 45.44 | | 794 |
| | 8.45 | | 45.44 |
| | 254 |
| | 45.44 |
|
| 45.84 - 55.58 | | 292 |
| | 7.78 | | 49.76 |
| | 173 |
| | 50.50 |
|
| 56.57 | | 692 |
| | 6.28 | | 56.57 |
| | 564 |
| | 56.57 |
|
| 58.25 - 86.64 | | 351 |
| | 7.02 | | 76.75 |
| | 308 |
| | 77.43 |
|
| 87.20 | | 765 |
| | 7.34 | | 87.20 |
| | 439 |
| | 87.20 |
|
| $11.12 - 87.20 | | 5,939 |
| | 5.63 | | $ | 44.07 |
| | 4,613 |
| | $ | 40.25 |
|
Commvault Systems, Inc.
Notes to Consolidated Financial Statements — (Continued)
(In thousands, except per share data)
Restricted stock unit activity is as follows:
|
| | | | | | | |
| Non-Vested Restricted Stock Units | | Number
of
Awards | | Weighted
Average
Grant Date
Fair Value |
| Non-vested as of March 31, 2013 | | 1,198 |
| | $ | 46.45 |
|
| Granted | | 562 |
| | 84.66 |
|
| Vested | | (473 | ) | | 42.11 |
|
| Forfeited | | (85 | ) | | 53.57 |
|
| Non-vested as of March 31, 2014 | | 1,202 |
| | 65.63 |
|
| Granted | | 815 |
| | 46.62 |
|
| Vested | | (491 | ) | | 59.22 |
|
| Forfeited | | (114 | ) | | 63.70 |
|
| Non-vested as of March 31, 2015 | | 1,412 |
| | 56.82 |
|
| Granted | | 1,543 |
| | 37.27 |
|
| Vested | | (547 | ) | | 38.38 |
|
| Forfeited | | (196 | ) | | 49.24 |
|
| Non-vested as of March 31, 2016 | | 2,212 |
| | $ | 43.43 |
|
The total fair value of the restricted stock units that vested during the years ended March 31, 2016, 2015 and 2014 was $20,981, $24,592 and $37,584, respectively.
The following table presents the stock-based compensation expense included in cost of services revenue, sales and marketing, research and development and general and administrative expenses for the years ended March 31, 2016, 2015 and 2014.
|
| | | | | | | | | | | | |
| | | Year Ended March 31, |
| | | 2016 | | 2015 | | 2014 |
| Cost of services revenue | | $ | 3,106 |
| | $ | 2,930 |
| | $ | 1,428 |
|
| Sales and marketing | | 28,557 |
| | 26,853 |
| | 20,813 |
|
| Research and development | | 6,722 |
| | 5,908 |
| | 4,512 |
|
| General and administrative | | 25,811 |
| | 24,972 |
| | 22,371 |
|
| Stock-based compensation expense | | $ | 64,196 |
| | $ | 60,663 |
| | $ | 49,124 |
|
The Company recognized a tax benefit related to stock-based compensation of $17,010 in the year ended March 31, 2016, $18,570 in the year ended March 31, 2015 and $15,940 in the year ended March 31, 2014.
Performance Based Awards
On March 31, 2015, the Company’s CEO was
In fiscal 2024, we granted 48120 performance stock options (“PSO”units ("PSUs") and 24 performance restricted stock units (“PSU”).to certain executives. Vesting of these awards wasis contingent upon the Companyi) us meeting certain company-wide revenue and non-GAAP operating margin performance goals (performance-based) in fiscal 2016 in addition to the Company's2024 and ii) our customary service periods. The awards vest over three years. The related stock-based compensation expense is determined based on the value of the underlying shares on the date of grant and is recognized over the vesting term using the accelerated method. During the interimeach financial periods,period, management estimatedestimates the probable number of PSO’s and PSU’sPSUs that would vest until the ultimate achievement of the performance goals wasis known. Based on the Company's financialour results, the CEO will be eligible to vest in 24 options and 5 PSU's if all time based service requirements are met.PSUs achieved at 108%. The awards are included in the tables above.restricted stock unit table.
Commvault Systems, Inc.
NotesIn fiscal 2023, we granted 126 PSUs to Consolidated Financial Statements — (Continued)certain executives. Vesting of these awards is contingent upon i) us meeting certain non-GAAP performance goals (performance-based) in fiscal 2023 and ii) our customary service periods. The awards vest over three years. The related stock-based compensation expense is determined based on the value of the underlying shares on the date of grant and is recognized over the vesting term using the accelerated method. Based on our results, the PSUs achieved at 128%. The awards are included in the restricted stock unit table.
(In thousands, except per share data)
Awards with a Market Condition
In October 2015, the Companyfiscal 2024, we granted 133120 market performance stock unitsPSUs to certain executives. The vesting of these awards is contingent upon the Companyus meeting certain total shareholder return (TSR)("TSR") levels as compared to athe Russell 3000 market index over the next three years. The awards vest in three annual tranches and have a maximum potential to vest at 200% (266(240 shares) based on TSR performance. The related stock-based compensation expense is determined based on the estimated fair value of the underlying shares on the date of grant and is recognized using the accelerated method over the vesting term. The estimated fair value was calculated using a Monte Carlo simulation model. The fair value of the awards granted in Octoberduring the year was $42.69.$87.90 per unit. The awards are included in the restricted stock unit table above.
In fiscal 2023, we granted 126 market PSUs to certain executives. The vesting of these awards is contingent upon us meeting certain TSR levels as compared to the Russell 3000 market index over the next three years. The awards vest in three annual tranches and have a maximum potential to vest at 200% (252 shares) based on TSR performance. The related stock-based compensation expense is determined based on the estimated fair value of the underlying shares on the date of grant and is recognized using the accelerated method over the vesting term. The estimated fair value was calculated using a Monte Carlo simulation model. The fair value of the awards granted during the year was $76.48 per unit. The awards are included in the restricted stock unit table above.
Employee Stock Purchase Plan
The Employee Stock Purchase Plan (the “Purchase Plan”)ESPP is a shareholder approved plan under which substantially all employees may purchase the Company’sour common stock through payroll deductions at a price equal to 85% of the lower of the fair market values of the stock as of the beginning or the end of six-month offering periods. An employee’s payroll deductions under the Purchase PlanESPP are limited to 10% of the employee’s salary and employees may not purchase more than $25 of stock during any calendar year. Employees purchased 263188 shares in exchange for $8,116$10,578 of proceeds in fiscal 20162024 and 204213 shares in exchange for $7,906$10,873 of proceeds in fiscal 2015.2023. The Purchase PlanESPP is considered compensatory and the fair value of the discount and look back provision are estimated using the Black-Scholes formula and recognized over the six monthsix-month withholding period prior to purchase. The total expense associated with the Purchase PlanESPP for fiscal 2016, 20152024, 2023 and 20142022 was $2,418, $2,960$3,146, $3,740 and $395,$3,341, respectively. As of March 31, 2016,2024, there was approximately $1,019$1,177 of unrecognized cost related to the current purchase period of our Employee Stock Purchase Plan.ESPP.
9. Income Taxes
The components of income (loss) before income taxes were as follows:
|
| | | | | | | | | | | | |
| | | Year Ended March 31, |
| | | 2016 | | 2015 | | 2014 |
| Domestic | | $ | (6,869 | ) | | $ | 28,048 |
| | $ | 89,946 |
|
| Foreign | | 8,714 |
| | 10,844 |
| | 11,364 |
|
| | | $ | 1,845 |
| | $ | 38,892 |
| | $ | 101,310 |
|
The components of income tax expense (benefit) were as follows:
|
| | | | | | | | | | | | |
| | | Year Ended March 31, |
| | | 2016 | | 2015 | | 2014 |
| Current: | | | | | | |
| Federal | | $ | 4,983 |
| | $ | 1,777 |
| | $ | 34,406 |
|
| State | | 1,076 |
| | 2,533 |
| | 4,063 |
|
| Foreign | | 4,982 |
| | 4,791 |
| | 5,207 |
|
| Deferred: | | | | | | |
| Federal | | (9,171 | ) | | 4,237 |
| | (5,453 | ) |
| State | | 324 |
| | (24 | ) | | (616 | ) |
| Foreign | | (485 | ) | | (72 | ) | | (361 | ) |
| | | $ | 1,709 |
| | $ | 13,242 |
| | $ | 37,246 |
|
Commvault Systems, Inc.
Notes to Consolidated Financial Statements — (Continued)
(In thousands, except per share data)
11. Income Taxes
The components of income (loss) before income taxes were as follows:
| | | | | | | | | | | | | | | | | | | | |
| | | Year Ended March 31, |
| | | 2024 | | 2023 | | 2022 |
| Domestic | | $ | 62,082 | | | $ | (35,288) | | | $ | 25,905 | |
| Foreign | | 21,531 | | | 19,926 | | | 17,509 | |
| | $ | 83,613 | | | $ | (15,362) | | | $ | 43,414 | |
Commvault Systems, Inc.
Notes to Consolidated Financial Statements — (Continued)
(In thousands, except per share data)
The components of income tax expense (benefit) were as follows:
| | | | | | | | | | | | | | | | | | | | |
| | | Year Ended March 31, |
| | | 2024 | | 2023 | | 2022 |
| Current: | | | | | | |
| Federal | | $ | 7,845 | | | $ | 6,986 | | | $ | 284 | |
| State | | 4,242 | | | 3,375 | | | 361 | |
| Foreign | | 12,220 | | | 10,725 | | | 9,096 | |
| Deferred: | | | | | | |
| Federal | | (82,773) | | | (607) | | | 28 | |
| State | | (19,740) | | | — | | | — | |
| Foreign | | (7,087) | | | (67) | | | 21 | |
| | $ | (85,293) | | | $ | 20,412 | | | $ | 9,790 | |
A reconciliation of the statutory tax rates and the effective tax rates for the years ended March 31, 2016, 20152024, 2023 and 20142022 are as follows:
| | | | | | | | | | | | | | | | | | | | |
| | | Year Ended March 31, |
| | | 2024 | | 2023 | | 2022 |
| Statutory federal income tax expense (benefit) rate | | 21.0 | % | | (21.0) | % | | 21.0 | % |
| State and local income tax expense, net of federal income tax effect | | 2.4 | % | | (11.8) | % | | 0.8 | % |
| Foreign earnings taxed at different rates | | 5.7 | % | | 28.0 | % | | 6.2 | % |
| U.S. tax on GILTI & FDII | | (3.3) | % | | (17.1) | % | | 0.5 | % |
| Domestic permanent differences including acquisition items | | 1.1 | % | | 4.7 | % | | 3.6 | % |
| Foreign tax credits | | (2.5) | % | | (35.5) | % | | (5.3) | % |
| Research credits | | (9.3) | % | | (74.6) | % | | (28.3) | % |
| Tax reserves | | — | % | | (1.2) | % | | 2.6 | % |
| Valuation allowance | | (125.3) | % | | 219.9 | % | | 18.3 | % |
| Enacted tax law changes | | (0.4) | % | | 3.6 | % | | 0.3 | % |
| Stock-based compensation | | 6.7 | % | | 41.6 | % | | (1.6) | % |
| | | | | | |
| | | | | | |
| Other differences, net | | 1.9 | % | | (3.7) | % | | 4.5 | % |
| Effective income tax expense (benefit) | | (102.0) | % | | 132.9 | % | | 22.6 | % |
Commvault Systems, Inc.
Notes to Consolidated Financial Statements — (Continued)
(In thousands, except per share data)
|
| | | | | | | | | |
| | | Year Ended March 31, |
| | | 2016 | | 2015 | | 2014 |
| Statutory federal income tax expense rate | | 35.0 | % | | 35.0 | % | | 35.0 | % |
| State and local income tax expense, net of federal income tax effect | | 11.2 | % | | 3.0 | % | | 2.5 | % |
| Impact of limit on executive compensation | | — | % | | 3.2 | % | | 1.5 | % |
| Foreign earnings taxed at different rates | | 67.9 | % | | 1.0 | % | | 0.7 | % |
| Domestic permanent differences | | 116.8 | % | | 4.1 | % | | 0.3 | % |
| Foreign tax credits | | (54.1 | )% | | (2.8 | )% | | (1.3 | )% |
| Research credits | | (141.2 | )% | | (4.9 | )% | | (1.9 | )% |
| Tax reserves | | 8.7 | % | | (5.3 | )% | | (0.8 | )% |
| Valuation allowance | | 50.1 | % | | — | % | | — | % |
| Statutory tax rate changes | | (20.1 | )% | | — | % | | — | % |
| Other differences, net | | 18.3 | % | | 0.7 | % | | 0.8 | % |
| Effective income tax expense | | 92.6 | % | | 34.0 | % | | 36.8 | % |
| | | | | | | | | | | | | | |
| | | March 31, |
| | | 2024 | | 2023 |
| Deferred tax assets: | | | | |
| Net operating losses | | $ | 6,533 | | | $ | 9,106 | |
| Equity investment/Capital losses | | 952 | | | 889 | |
| Stock-based compensation | | 5,338 | | | 11,912 | |
| Deferred revenue | | 29,748 | | | 24,025 | |
| Tax credits | | 28,020 | | | 42,986 | |
| Accrued expenses | | 1,775 | | | 1,816 | |
| Allowance for doubtful accounts and other reserves | | 928 | | | 572 | |
| R&D Capitalization under IRC § 174 | | 58,867 | | | 32,091 | |
| Depreciation and amortization | | 9,305 | | | 9,449 | |
| Other, DTA | | 2,228 | | | 98 | |
| Less: valuation allowance | | (18,140) | | | (122,921) | |
| Total deferred tax assets | | 125,554 | | | 10,023 | |
| Deferred tax liabilities: | | | | |
| | | | |
| Withholding taxes | | (1,091) | | | (393) | |
| Deferred commissions | | (12,573) | | | (9,764) | |
| Other, DTL | | (2,426) | | | — | |
| Total deferred tax liabilities | | (16,090) | | | (10,157) | |
| Net deferred tax asset (liability) | | $ | 109,464 | | | $ | (134) | |
Net deferred tax assets arise due to the recognition of income and expense items for tax purposes, which differ from those used for financial statement purposes. The Company assessesASC 740, Income Taxes, provides for the likelihood that itsrecognition of deferred tax assets will be recovered fromif realization of such assets is more likely than not. In assessing the need for a valuation allowance, we considered all available objective and verifiable evidence both positive and negative, including historical levels of pre-tax income (loss) both on a consolidated basis and tax reporting entity basis, legislative developments, expectations and risks associated with estimates of future taxablepre-tax income, and toprudent and feasible tax planning strategies. As a result of this analysis, we determined that it is more likely than not that we will realize the extent that the Company believes recovery is not likely, the Company establishes a valuation allowance. The significant componentsbenefits of the Company’smajority of our gross deferred tax assets areand therefore recorded the release of the previously established valuation allowance as follows:an income tax benefit in the current period. At March 31, 2024 and 2023, we recorded valuation allowances of $18,140 and $122,921, respectively, representing an increase in deferred tax benefit of $104,781 for the period ended March 31, 2024.
|
| | | | | | | | |
| | | March 31, |
| | | 2016 | | 2015 |
| Deferred tax assets: | | | | |
| Stock-based compensation | | $ | 40,033 |
| | $ | 30,561 |
|
| Deferred revenue | | 12,496 |
| | 10,542 |
|
| Tax credits | | 6,970 |
| | 6,229 |
|
| Accrued expenses | | 1,155 |
| | 1,570 |
|
| Allowance for doubtful accounts and other reserves | | 753 |
| | 697 |
|
| Net operating losses | | — |
| | 26 |
|
| Less: valuation allowance | | (2,772 | ) | | (1,343 | ) |
| Total deferred tax assets | | 58,635 |
| | 48,282 |
|
| Deferred tax liabilities: | | | | |
| Depreciation and amortization | | (8,659 | ) | | (7,237 | ) |
| Net deferred tax asset | | $ | 49,976 |
| | $ | 41,045 |
|
At March 31, 20162024, we had federal net operating loss ("NOL") carryforwards of $5,981, all of which will not expire. As of March 31, 2024, we had deferred tax assets related to state NOL carryforwards of $1,013 which expire over various years beginning in March 2033 depending on the Company maintained valuation allowances totaling $2,772 against New Jerseyjurisdiction. As of March 31, 2024, we had foreign NOL carryforwards of $3,064 that will expire over various years beginning in March 2028 depending on the jurisdiction and $34,035 that will not expire. As of March 31, 2024, we had federal capital loss carryforwards of $3,988 that will expire in March 2027. At March 31, 2024, we had foreign capital loss carryforwards of $310 that will not expire.
We also had federal and state research tax credits due to uncertainties related to("R&D credit") carryforwards of approximately $5,177 and $26,467, respectively. The federal R&D credit carryforwards expire from March 2039 through March 2044, and the ability to utilize such state researchNew Jersey R&D credit carryforwards of $16,857 expire over various years beginning from March 2025 through March 2038. The California R&D credits of $9,610 do not expire. We also had federal foreign tax credits before they expire.(“FTC”) carryforwards of approximately $3,999. The Company increased the valuation allowance $1,429federal FTC carryforwards expire from March 2030 through March 2034. We also had $215 in fiscal 2016 due to lower estimates of forecasted New Jersey taxable incomeforeign FTC carryforwards that will expire over various years beginning in the periods prior to the expiration of the research tax credits. The Company based its valuation allowance on its estimates of taxable income and the period over which its state research tax credits will be recoverable.March 2025.
Commvault Systems, Inc.
Notes to Consolidated Financial Statements — (Continued)
(In thousands, except per share data)
It is the Company’s intention to reinvest undistributed earnings of its foreign subsidiaries and thereby infinitely postpone their remittance. As a result, deferred U.S. income taxes have not been provided on undistributed earnings of foreign subsidiaries of the Company. In the event we needed to repatriate funds from outside of the United States, such repatriation would likely be subject to restrictions by local laws and/or tax consequences including foreign withholding taxes or U.S. income taxes. It is not currently practical to estimate the legal restrictions or tax liability that would arise from such repatriations. The cumulative amount of unremitted earnings from the foreign subsidiaries that is expected to be permanently reinvested was approximately $22,565 on March 31, 2016.
Excess tax benefits related to share-based payments are credited to equity. When determining this excess tax benefit, the Company elected to follow the tax law approach. As a result, the Company’s excess tax benefit which was recorded to equity was approximately $3,265 and $2,141 for the years ended March 31, 2016 and 2015, respectively.
At March 31, 2016, the Company has federal and state research tax credit (R&D credits) carryforwards of approximately $3,350 and $3,868, respectively. The federal research tax credit carryforwards expire from 2025 through 2036, and the state research tax credit carryforwards expire from 2016 through 2023. At March 31, 2016, the Company has federal Alternative Minimum Tax credit carryforwards of $1,149.
The Company conductsWe conduct business globally and as a result, filesfile income tax returns in the United States and in various state and foreign jurisdictions. In the normal course of business, the Company iswe are subject to examination by taxing authorities throughout the world, including such major jurisdictions as the United States, Australia, Canada, Germany, Netherlands and United Kingdom.world. The following table summarizes the tax years in the Company’s major tax jurisdictions that remain subject to income tax examinations by tax authorities as of March 31, 2016.2024. The years subject to income tax examination in the Company’sour foreign jurisdictions cover the maximum time period with respect to these jurisdictions. Due to NOL carryforwards,NOLs, in some cases the tax years continue to remain subject to examination with respect to such NOLs.
| | | | | |
| |
| Tax Jurisdiction | Years Subject to Income
Tax Examination |
| U.S. Federal | 2020 - Present |
| Foreign jurisdictions | 2013 - Present |
New Jersey | 2012 - Present |
Foreign jurisdictions | 2011 - Present |
Commvault Systems, Inc.
Notes to Consolidated Financial Statements — (Continued)
(In thousands, except per share data)
The calculation of the Company’sour tax liabilities involves dealing with uncertainties in the application of complex tax regulations in each of itsour tax jurisdictions. The number of years with open tax audits varies depending on the tax jurisdiction. A number of years may lapse before a particular matter is audited and finally resolved. A reconciliation of the amounts of unrecognized tax benefits is as follows:
| | | | | |
| Balance at March 31, 2021 | $ | 2,211 | |
| Additions for tax positions related to fiscal 2022 | 2,808 | |
| Additions for tax positions related to prior years | 90 | |
| Settlements and effective settlements with tax authorities and related remeasurements | — | |
| Reductions related to the expiration of statutes of limitations | (117) | |
| Additions for tax positions related to purchase accounting | 4,232 | |
| Foreign currency translation adjustment | — | |
| Balance at March 31, 2022 | 9,224 | |
| Additions for tax positions related to fiscal 2023 | 394 | |
| Reductions for tax positions related to prior years | (90) | |
| Settlements and effective settlements with tax authorities and related remeasurements | — | |
| Reductions related to the expiration of statutes of limitations | (140) | |
| Additions for tax positions related to purchase accounting | — | |
| Foreign currency translation adjustment | — | |
| Balance at March 31, 2023 | 9,388 | |
| Additions for tax positions related to fiscal 2024 | 502 | |
| Additions for tax positions related to prior years | 3 | |
| Settlements and effective settlements with tax authorities and related remeasurements | — | |
| Reductions related to the expiration of statutes of limitations | (220) | |
| Additions for tax positions related to purchase accounting | — | |
| Foreign currency translation adjustment | — | |
| Balance at March 31, 2024 | $ | 9,673 | |
|
| | | |
| Balance at March 31, 2013 | $ | 4,570 |
|
| Additions for tax positions related to fiscal 2014 | 316 |
|
| Additions for tax positions related to prior years | 433 |
|
| Settlements and effective settlements with tax authorities and remeasurements | (1,283 | ) |
| Reductions related to the expiration of statutes of limitations | — |
|
| Foreign currency translation adjustment | 77 |
|
| Balance at March 31, 2014 | 4,113 |
|
| Additions for tax positions related to fiscal 2015 | 490 |
|
| Additions for tax positions related to prior years | 252 |
|
| Settlements and effective settlements with tax authorities and remeasurements | (2,838 | ) |
| Reductions related to the expiration of statutes of limitations | — |
|
| Foreign currency translation adjustment | (12 | ) |
| Balance at March 31, 2015 | 2,005 |
|
| Additions for tax positions related to fiscal 2016 |
|
|
| Additions for tax positions related to prior years | 170 |
|
| Settlements and effective settlements with tax authorities and remeasurements | (171 | ) |
| Reductions related to the expiration of statutes of limitations | (64 | ) |
| Foreign currency translation adjustment | 12 |
|
| Balance at March 31, 2016 | $ | 1,952 |
|
All of the Company’s unrecognized tax benefits at March 31, 2016 of $1,952, if recognized, would favorably affect the effective tax rate. Components of the reserve are classified as either current or long-term in the Consolidated Balance Sheet based on when the Company expects each of the items to be settled.Unrecognized tax benefits and the related accrued interest and penalties totaling $1,346 are recorded as Other Liabilities on the Consolidated Balance Sheet, of which $207 represents interest and penalties. The Company also has unrecognized tax benefits and related accrued interest and penalties totaling $901 as a reduction of Deferred Tax Assets on the Consolidated Balance Sheet, of which $88 represents interest and penalties.
The Company estimatesWe estimate that no significant remaining unrecognized tax benefits will be realized during the fiscal year ending March 31, 2017.2025. Interest income, expense and penalties related to unrecognized tax benefits are recorded in income tax expense.expense in the consolidated statements of operations. In the years ended March 31, 2016, 20152024, 2023, and 2014,2022, the Company recognized $52, $224 and $89, respectively, ofimpact related to interest expense, interest income and penalties in thewas not significant.
Commvault Systems, Inc.
Notes to Consolidated Statement of Income.Financial Statements — (Continued)
(In thousands, except per share data) 10.12. Employee Benefit Plan
The Company hasWe have a defined contribution plan, as allowed under Section 401(k) of the Internal Revenue Code, covering substantially all US employees. Effective January 1, 2012, the Company makeswe make contributions equal to a discretionary percentage of the employee’s contributions determined by the Company.us. During the years ended March 31, 2016, 20152024, 2023 and 2014, the Company2022, we made contributions of $2,047, $1,955,$2,889, $2,525, and $1,451,$2,923, respectively.
11.13. Segment Information
The Company operatesWe operate in one segment. The Company’sOur products and services are sold throughout the world, through direct and indirect sales channels. The Company’sOur chief operating decision maker (the “CODM”) is the chief executive officer.Chief Executive Officer. The CODM makes operating performance assessment and resource allocation decisions on a global basis. The CODM does not receive discrete financial information about asset allocation, expense allocation or profitability by product or geography.
Commvault Systems, Inc.
Notes to Consolidated Financial Statements — (Continued)
(In thousands, except per share data)
Revenues by geography are based upon the billing address of the customer. All transfers between geographic regions have been eliminated from consolidated revenues. The following table sets forth revenue and long-lived assets by geographic area:
| | | | | Year Ended March 31, | | | Year Ended March 31, |
| | | 2016 | | 2015 | | 2014 | | | 2024 | | 2023 | | 2022 |
| Revenue: | | | | | | |
| United States | | $ | 343,015 |
| | $ | 344,931 |
| | $ | 333,700 |
|
| United States | |
| United States | |
| Other | | 252,111 |
| | 262,612 |
| | 252,640 |
|
| | | $ | 595,126 |
| | $ | 607,543 |
| | $ | 586,340 |
|
| | $ | |
No individual country other than the United States accounts for 10% or more of revenues in the years ended March 31, 2016, 20152024, 2023 and 2014.2022. Revenue included in the “Other” caption above primarily relates to the Company’sour operations in Europe, Australia, Canada and Asia.
| | | | | | | | | | | | | | |
| | | March 31, |
| | | 2024 | | 2023 |
| Long-lived assets: | | | | |
| United States | | $ | 192,485 | | | $ | 184,356 | |
| Other | | 45,121 | | | 47,304 | |
| | $ | 237,606 | | | $ | 231,660 | |
|
| | | | | | | | |
| | | March 31, |
| | | 2016 | | 2015 |
| Long-lived assets: | | | | |
| United States | | $ | 135,562 |
| | $ | 143,975 |
|
| Other | | 7,079 |
| | 3,037 |
|
| | | $ | 142,641 |
| | $ | 147,012 |
|
At March 31, 20162024 and 20152023 no other individual country, other than the United States, accounts for 10% or more of long-lived assets.
12. Selected Quarterly14. Restructuring
Beginning in the fourth quarter of fiscal 2024, we initiated a restructuring plan intended to enhance customer satisfaction through the reorganization and redesign of our customer success functions. The realignment of the customer success structure aims to optimize operational efficiency and improve continuity for our customers through the pre-sales and post-sales experience. These charges relate primarily to severance and related costs associated with headcount reductions, stock-based compensation related to modifications of existing awards granted to certain employees impacted by the plan and office termination and exit charges. We anticipate the restructuring plan will be completed in the second half of fiscal 2025. The total costs to be incurred related to the restructuring plan cannot be estimated at this time.
In the fourth quarter of fiscal 2022 we initiated a restructuring program which was completed in fiscal 2023. It was aimed to increase efficiency in our sales, marketing and distribution functions as well as reduce costs across all functional areas. The plan included a reorganization to combine our EMEA and APJ field organizations into our
Commvault Systems, Inc.
Notes to Consolidated Financial Data (unaudited)Statements — (Continued)
(In thousands, except per share data)
|
| | | | | | | | | | | | | | | | |
| | | Quarter Ended |
| | | June 30 | | September 30 | | December 31 | | March 31 |
| Fiscal 2016 | | | | | | | | |
| Total revenue | | $ | 139,123 |
| | $ | 140,742 |
| | $ | 155,696 |
| | $ | 159,565 |
|
| Gross margin | | 118,576 |
| | 119,803 |
| | 135,267 |
| | 138,768 |
|
| Net income (loss) | | (1,300 | ) | | (9,236 | ) | | 4,878 |
| | 5,794 |
|
| Net income (loss) per common share: | | | | | | | | |
| Basic (1) | | $ | (0.03 | ) | | $ | (0.20 | ) | | $ | 0.11 |
| | $ | 0.13 |
|
| Diluted (1) | | $ | (0.03 | ) | | $ | (0.20 | ) | | $ | 0.10 |
| | $ | 0.13 |
|
| | | Quarter Ended |
| | | June 30 | | September 30 | | December 31 | | March 31 |
| Fiscal 2015 | | | | | | | | |
| Total revenue | | $ | 152,643 |
| | $ | 151,144 |
| | $ | 153,021 |
| | $ | 150,735 |
|
| Gross margin | | 131,716 |
| | 130,858 |
| | 133,080 |
| | 129,821 |
|
| Net income | | 12,729 |
| | 6,496 |
| | 3,073 |
| | 3,352 |
|
| Net income per common share: | | | | | | | | |
| Basic (1) | | $ | 0.28 |
| | $ | 0.14 |
| | $ | 0.07 |
| | $ | 0.07 |
|
| Diluted (1) | | $ | 0.27 |
| | $ | 0.14 |
| | $ | 0.07 |
| | $ | 0.07 |
|
For the years ended March 31, 2024, 2023 and 2022, restructuring charges were comprised of the following:
| |
(1) | Per common share amounts for the quarters and full year have been calculated separately. Accordingly, quarterly amounts do not add to the annual amount because of differences in the weighted average common shares outstanding during each period used in the basic and diluted calculations. |
| | | | | | | | | | | | | | | | | | | | |
| | Year Ended March 31, |
| | | 2024 | | 2023 | | 2022 |
| Employee severance and related costs | | $ | 2,811 | | | $ | 12,845 | | | $ | 4,483 | |
Lease exit costs (1) | | 220 | | | — | | | — | |
| Stock-based compensation | | 1,517 | | | 2,607 | | | 1,709 | |
| Total restructuring charges | | $ | 4,548 | | | $ | 15,452 | | | $ | 6,192 | |
(1) Lease exit costs relate to one office for the year ended March 31, 2024. There were no lease exit charges for the years ended March 31,2023 and 2022.
Restructuring accrual
The accrual activity related to our restructuring plans for the years ended March 31, 2024 and 2023 were as follows:
| | | | | | | | | | | | | | |
| | Year Ended March 31, |
| | | 2024 (1) | | 2023 |
| Beginning balance | | $ | 3,211 | | | $ | 2,261 | |
| Employee severance and related costs | | 2,811 | | | 12,845 | |
| Payments | | (3,276) | | | (11,895) | |
| Ending balance | | $ | 2,746 | | | $ | 3,211 | |
(1) During fiscal 2024, there were no new charges incurred related to the completed restructuring plan. Payments made related to the completed plan were $3,149, resulting in an insignificant remaining accrual at March 31, 2024.
15. Leases
We determine if an arrangement contains a lease at inception. We generally lease our facilities under operating leases. Operating lease right-of-use ("ROU") assets are included in operating lease assets on our consolidated balance sheets. Current portion of operating lease liabilities and long-term operating lease liabilities are included on our consolidated balance sheets.
ROU assets represent our right to use an underlying asset for the lease term and lease liabilities represent our obligation to make lease payments arising from the lease. Operating lease ROU assets and liabilities are recognized at the commencement date based on the present value of lease payments over the lease term. As most of our leases do not provide an implicit rate, we generally use our incremental borrowing rate based on the estimated rate of interest for collateralized borrowing over a similar term of the lease payments at the commencement date.
We recognize operating lease costs over the estimated term of the lease, which includes options to extend lease terms that are reasonably certain of being exercised, starting when possession of the property is taken from the landlord. When a lease contains a predetermined fixed escalation of the minimum rent, we recognize the related
Commvault Systems, Inc.
Notes to Consolidated Financial Statements — (Continued)
(In thousands, except per share data)
operating lease cost on a straight-line basis over the lease term. In addition, certain of our lease agreements include variable lease payments, such as estimated tax and maintenance charges. These variable lease payments are excluded from minimum lease payments and are included in the determination of lease cost when it is probable that the expense has been incurred and the amount can be reasonably estimated.
Our lease liabilities relate primarily to operating leases for our global office infrastructure. These operating leases expire at various dates through fiscal 2031. We did not have any finance leases for the years ended March 31, 2024 or 2023.
Net lease cost recognized in our consolidated statements of operations is summarized as follows:
| | | | | | | | | | | | | | | | | |
| Year Ended March 31, |
| 2024 | | 2023 | | 2022 |
| Operating lease cost | $ | 5,770 | | | $ | 5,449 | | | $ | 7,129 | |
| Short-term lease cost | 272 | | | 631 | | | 123 | |
| Variable lease cost | 1,333 | | | 1,360 | | | 1,608 | |
| Net lease cost | $ | 7,375 | | | $ | 7,440 | | | $ | 8,860 | |
Cash flow information
| | | | | | | | | | | | | | | | | |
| Year Ended March 31, |
| 2024 | | 2023 | | 2022 |
| Cash paid for operating lease liabilities | $ | 5,033 | | | $ | 5,421 | | | $ | 8,277 | |
| Additions of operating lease assets (non-cash) | $ | 5,528 | | | $ | 3,023 | | | $ | 1,827 | |
As of March 31, 2024, the maturities of lease liabilities based on the total minimum lease commitment amount including options to extend lease terms that are reasonably certain of being exercised are as follows:
| | | | | |
| 2025 | $ | 4,624 | |
| 2026 | 2,973 | |
| 2027 | 1,740 | |
| 2028 | 1,601 | |
| 2029 | 932 | |
| Thereafter | 683 | |
| Total minimum lease payments | 12,553 | |
| Less: Imputed interest | 463 | |
| Present value of operating lease liabilities | 12,090 | |
| Less: Current portion of operating lease liabilities | 4,935 | |
| Long-term operating lease liabilities | $ | 7,155 | |
As of March 31, 2024, the minimum lease commitment amount for operating leases signed but not yet commenced was $743. These commitments are related to office lease renewals that expire at various dates through fiscal 2030.
Commvault Systems, Inc.
Notes to Consolidated Financial Statements — (Continued)
(In thousands, except per share data)
Lease term and Discount rate
| | | | | | | | | | | |
| Year Ended March 31, |
| 2024 | | 2023 |
| Weighted-average remaining term (in years) | 3.60 | | 3.72 |
| Weighted-average discount rate | 4 | % | | 4 | % |
16. Revolving Credit Facility
On December 13, 2021, we entered into a five-year $100,000 senior secured revolving credit facility (the “Credit Facility”) with JPMorgan Chase Bank, N.A. The Credit Facility is available for share repurchases, general corporate purposes, and letters of credit. The Credit Facility contains financial maintenance covenants, including a leverage ratio and interest coverage ratio. The Credit Facility also contains certain customary events of default which would permit the lender to, among other things, declare all loans then outstanding to be immediately due and payable if such default is not cured within applicable grace periods. The Credit Facility also limits our ability to incur certain additional indebtedness, create or permit liens on assets, make acquisitions, make investments, loans or advances, sell or transfer assets, pay dividends or distributions, and engage in certain transactions with foreign affiliates. Outstanding borrowings under the Credit Facility accrue interest at an annual rate equal to the Secured Overnight Financing Rate plus 1.25% subject to increases based on our actual leverage. The unused balance on the Credit Facility is also subject to a 0.25% annual interest charge subject to increases based on our actual leverage. As of March 31, 2024, there were no borrowings under the Credit Facility and we were in compliance with all covenants.
We have deferred the expense related to debt issuance costs, which are classified as other assets, and will amortize the costs into interest expense over the term of the Credit Facility. Unamortized amounts at March 31, 2024 and 2023 were $313 and $428, respectively. The amortization of debt issuance costs and interest expense incurred for the years ended March 31, 2024, 2023, and 2022 was as follows:
| | | | | | | | | | | | | | | | | |
| Year Ended March 31, |
| 2024 | | 2023 | | 2022 |
| Amortization of debt issuance costs | $ | 115 | | | $ | 115 | | | $ | 34 | |
| Interest expense | 253 | | | 253 | | | 75 | |
| Total charges | $ | 368 | | | $ | 368 | | | $ | 109 | |
17. Subsequent Event
On April 15, 2024, we signed an agreement to acquire all of the shares of Appranix, Inc., a Boston based cloud cyber resilience company, for total consideration of approximately $26,000, subject to customary transaction adjustments. There is an additional potential earn out if certain financial metrics are met through the initial fourteen-month period after the closing date. The primary reason for the business combination is to extend our product offerings in our existing cyber resiliency market opportunity. As the transaction occurred subsequent to year-end, we are still evaluating the purchase price allocation of the transaction but expect the primary assets acquired to be intangible assets and goodwill. Acquired tangible assets and assumed liabilities are expected to be immaterial. The allocation is expected to be finalized during fiscal 2025.
| | | | | |
| |
| Item 9. | Changes Inin and Disagreements withWith Accountants on Accounting and Financial Disclosure |
Not applicableNone.
| | | | | |
| |
| Item 9A. | Controls and Procedures |
| |
(a) | Evaluation of Disclosure Controls and Procedures |
(a)Evaluation of Disclosure Controls and Procedures
Our management, with the participation of the Chief Executive Officer and Chief Financial Officer, has evaluated the effectiveness of our disclosure controls and procedures, as defined in Rules 13a-15(e) and 15d-15(e) of the Securities Exchange Act of 1934, as of March 31, 2016.2024. Based on that evaluation, the Chief Executive Officer and Chief Financial Officer concluded that our disclosure controls and procedures were effective as of March 31, 2016.2024.
| |
(b) | Management’s Report on Internal Control over Financial Reporting |
(b)Management’s Report on Internal Control over Financial Reporting
Our management is responsible for establishing and maintaining adequate internal control over our financial reporting as defined in Rules 13a-15(f) of the Exchange Act. There are inherent limitations in the effectiveness of any internal control, including the possibility of human error and the circumvention or overriding of controls. Accordingly, even an effective internal control can provide only reasonable assurance with respect to financial statement preparation. Further, because of changes in conditions, the effectiveness of any internal control may vary over time.
Our management, with the participation of our principal executive officer and principal financial officer, has evaluated the effectiveness of our internal control over financial reporting as of March 31, 2016.2024. In making this assessment, management used the framework set forth by the Committee of Sponsoring Organizations of the Treadway Commission (“COSO”("COSO") in the 2013 Internal Control—Integrated Framework.
Based on our assessment, using those criteria, our management concluded that, as of March 31, 2016,2024, our internal control over financial reporting was effective. The effectiveness of our internal control over financial reporting as of March 31, 20162024 has been audited by Ernst & Young LLP, our independent registered public accounting firm, as stated in their report, which is included below in this Annual Report on Form 10-K.
| |
(c) | Changes in Internal Control over Financial Reporting |
(c)Changes in Internal Control over Financial Reporting
There was no change in our internal control over financial reporting that occurred during the fourth quarter of fiscal 20162024 that has materially affected, or is reasonably likely to materially affect, our internal control over financial reporting.
Report of Independent Registered Public Accounting Firm
To the Stockholders and Board of Directors of Commvault Systems, Inc.
Opinion on Internal Control overOver Financial Reporting
The Board of Directors and Stockholders of
Commvault Systems, Inc.
We have audited Commvault System,Systems, Inc.’s internal control over financial reporting as of March 31, 20162024, based on criteria established in Internal Control-IntegratedControl—Integrated Framework issued by the Committee of Sponsoring Organizations of the Treadway Commission (2013 framework) (the COSO criteria). In our opinion, Commvault Systems, Inc.’s (the Company) maintained, in all material respects, effective internal control over financial reporting as of March 31, 2024, based on the COSO criteria.
We also have audited, in accordance with the standards of the Public Company Accounting Oversight Board (United States) (PCAOB), the consolidated balance sheets of the Company as of March 31, 2024 and 2023, the related consolidated statements of operations, comprehensive income (loss), stockholders' equity and cash flows for each of the three years in the period ended March 31, 2024, and the related notes and our report dated May 13, 2024 expressed an unqualified opinion thereon.
Basis for Opinion
The Company’s management is responsible for maintaining effective internal control over financial reporting and for its assessment of the effectiveness of internal control over financial reporting included in the accompanying Management’s Report on Internal Control over Financial Reporting. Our responsibility is to express an opinion on the company’sCompany’s internal control over financial reporting based on our audit. We are a public accounting firm registered with the PCAOB and are required to be independent with respect to the Company in accordance with the U.S. federal securities laws and the applicable rules and regulations of the Securities and Exchange Commission and the PCAOB.
We conducted our audit in accordance with the standards of the Public Company Accounting Oversight Board (United States).PCAOB. Those standards require that we plan and perform the audit to obtain reasonable assurance about whether effective internal control over financial reporting was maintained in all material respects.
Our audit included obtaining an understanding of internal control over financial reporting, assessing the risk that a material weakness exists, testing and evaluating the design and operating effectiveness of internal control based on the assessed risk, and performing such other procedures as we considered necessary in the circumstances. We believe that our audit provides a reasonable basis for our opinion.
Definition and Limitations of Internal Control Over Financial Reporting
A company’s internal control over financial reporting is a process designed to provide reasonable assurance regarding the reliability of financial reporting and the preparation of financial statements for external purposes in accordance with generally accepted accounting principles. A company’s internal control over financial reporting includes those policies and procedures that (1) pertain to the maintenance of records that, in reasonable detail, accurately and fairly reflect the transactions and dispositions of the assets of the company; (2) provide reasonable assurance that transactions are recorded as necessary to permit preparation of financial statements in accordance with generally accepted accounting principles, and that receipts and expenditures of the company are being made only in accordance with authorizations of management and directors of the company; and (3) provide reasonable assurance regarding prevention or timely detection of unauthorized acquisition, use, or disposition of the company’s assets that could have a material effect on the financial statements.
Because of its inherent limitations, internal control over financial reporting may not prevent or detect and correct misstatements. Also, projections of any evaluation of effectiveness to future periods are subject to the risk that controls may become inadequate because of changes in conditions, or that the degree of compliance with the policies or procedures may deteriorate.
In our opinion, Commvault Systems, Inc. maintained, in all material respects, effective internal control over financial reporting as of March 31, 2016, based on the COSO criteria. We also have audited, in accordance with the standards of the Public Company Accounting Oversight Board (United States), the consolidated balance sheets of Commvault Systems, Inc. as of March 31, 2016 and 2015, and the related consolidated statements of income, comprehensive income (loss), stockholders’ equity and cash flows for each of the three years in the period ended March 31, 2016 of Commvault Systems, Inc. and our report dated May 6, 2016 expressed an unqualified opinion thereon.
/s/ Ernst & Young LLP
MetroPark,Iselin, New Jersey
May 6, 201613, 2024
| | | | | |
| Item 9B. | Other Information |
On February 1, 2024, Nicholas Adamo, Chairman of our Board of Directors, adopted a Rule 10b5-1 trading arrangement intended to satisfy the affirmative defense of Rule 10b5-1(c) for the sale of up to approximately 2,450 shares of the Company’s common stock. The plan is in effect until September 6, 2024.
On February 2, 2024, Vivie Lee, a member of our Board of Directors, adopted a Rule 10b5-1 trading arrangement intended to satisfy the affirmative defense of Rule 10b5-1(c) for the sale of up to approximately 4,100 shares of the Company’s common stock. The plan is in effect until September 6, 2024.
On February 16, 2024, Allison Pickens, a member of our Board of Directors, adopted a Rule 10b5-1 trading arrangement intended to satisfy the affirmative defense of Rule 10b5-1(c) for the sale of up to approximately 4,100 shares of the Company’s common stock. The plan is in effect until March 4, 2025.
During the three months ended March 31, 2024, no other directors or officers of the Company adopted or terminated any Rule 10b5-1 trading arrangement or “Non-Rule 10b5-1 trading arrangement” as each term is defined in Item 408 of Regulation S-K.
| | | | | |
Item 9B.9C. | Other InformationDisclosure Regarding Foreign Jurisdictions that Prevent Inspections |
Not applicableapplicable.
PART III
| | | | | |
| |
| Item 10. | Directors, Executive Officers and Corporate Governance |
We will furnish to the SEC a definitive Proxy Statement not later than 120 days after the close of the fiscal year ended March 31, 2016.2024. Information with respect to this Item is incorporated herein by reference from the sections of our 20162024 Proxy Statement including in the sections captioned, “Our Board“Board of Directors” and “Corporate Governance”.
Our Board of Directors has adopted a code of business ethics and conduct, which applies to all of our employees. The code of business ethics and conduct is in addition to our code of ethics for senior financial officers. The full texts of our code of business ethics and conduct and our code of ethics for senior financial officers can be found on our website, www.commvault.com.
| | | | | |
| |
| Item 11. | Executive Compensation |
Information with respect to this Item is incorporated herein by reference from the sections of our 20162024 Proxy Statement including incaptioned “Executive Compensation” (excluding the section captioned “Compensation Discussion and Analysis”information under the subheading "Pay Versus Performance").
| | | | | |
| |
| Item 12. | Security Ownership of Certain Beneficial Owners and Management and Related Stockholder Matters |
Information with respect to this Item is incorporated herein by reference from the section of our 20162024 Proxy Statement including in the section captioned “Security"Security Ownership of Certain Beneficial OwnershipOwners and Management”.
Securities Authorized for Issuance underManagement" and "Fiscal 2024 Equity Compensation PlansPlan Information".
The following table provides information as of March 31, 2016 with respect to the shares of our common stock that may be issuable upon the exercise of options, warrants and rights under or existing equity compensation plans. The following information is as of March 31, 2016:
|
| | | | | | | | | | |
| | | Number of Securities to be Issued Upon Exercise of Outstanding Options, Warrants and Rights (a) | | Weighted-Average Exercise Price of Outstanding Options, Warrants and Rights (b) | | Number of Securities Remaining Available for Future Issuance Under Equity Compensation Plans (Excluding Securities Reflected in Column (a)) (c)(2) |
| Equity compensation plans approved by security holders(1) | | 8,150,000 |
| | $ | 43.90 |
| | 1,629,000 |
|
| Equity compensation plans not approved by security holder | | — |
| | — |
| | — |
|
| Totals | | 8,150,000 |
| | $ | 43.90 |
| | 1,629,000 |
|
| |
(1) | Consists of shares of common stock to be issued upon exercise of outstanding options and vesting of restricted stock awards under our 1996 Stock Option Plan and 2006 Long-Term Stock Incentive Plan. These amounts do not include potentially issuable shares under the Employee Stock Purchase Plan. The company has reserved 2,642,832 shares for the future issuance of shares under the Employee Stock Purchase Plan. |
| |
(2) | On each April 1, the number of shares available for issuance under the 2006 Long-Term Stock Incentive Plan is increased, if applicable, such that the total number of shares available for awards under the 2006 Long-Term Stock Incentive Plan as of any April 1 is equal to 5% of the number of outstanding shares of our common stock on that April 1. |
| | | | | |
| |
| Item 13. | Certain Relationships and Related Transactions, and Director Independence |
Information with respect to this Item is incorporated herein by reference from the sections of our 2024 Proxy Statement captioned “Transactions with Related Persons” and "Corporate Governance - Independence and Composition of our Board of Directors".
| | | | | |
| Item 14. | Principal Accountant Fees and Services |
Information with respect to this Item is incorporated herein by reference from the section of our 20162024 Proxy Statement including incaptioned “Ratification of the section captioned, “Transactions with Related Persons”.
|
| |
Item 14. | Principal Accountant Fees and Services |
Information with respect to this Item is incorporated herein by reference from our 2016 Proxy Statement, including in the sections captioned “Audit,Appointment of Independent Auditors - Audit, Audit-related, Tax and All Other Fees”.
PART IV
| | | | | |
| |
| Item 15. | Exhibits and Financial Statement Schedules |
Financial Statements
See “Index to Consolidated Financial Statements” set forth in Item 8 for a list of financial statements filed as part of this report.
Financial Statement Schedules
The following financial statement schedule should be read in conjunction with the Consolidated Financial Statements set forth in Item 8 and appears below:
Schedule II — Valuation and Qualifying Accounts for the years ended March 31, 2014, 2015 and 2016.
All other schedules are omitted because they are not required or because the required information is shownincluded in the financial statementsConsolidated Financial Statements or notes thereto.
Schedule II — Valuation and Qualifying Accounts
|
| | | | | | | | | | | | | | | | |
| | | Balance at Beginning of Year | | Charged (Credited) to Costs and Expenses | | Deductions | | Balance at End of Year |
| | | (In thousands) |
| Year Ended March 31, 2014 | | | | | | | | |
| Allowance for doubtful accounts | | $ | 103 |
| | $ | 8 |
| | $ | — |
| | $ | 111 |
|
| Valuation allowance for deferred taxes | | $ | 1,395 |
| | $ | — |
| | $ | 13 |
| | $ | 1,382 |
|
| Year Ended March 31, 2015 | | | | | | | | |
| Allowance for doubtful accounts | | $ | 111 |
| | $ | 1 |
| | $ | 8 |
| | $ | 104 |
|
| Valuation allowance for deferred taxes | | $ | 1,382 |
| | $ | (39 | ) | | $ | — |
| | $ | 1,343 |
|
| Year Ended March 31, 2016 | | | | | | | | |
| Allowance for doubtful accounts | | $ | 104 |
| | $ | 247 |
| | $ | 36 |
| | $ | 315 |
|
| Valuation allowance for deferred taxes | | $ | 1,343 |
| | $ | 1,429 |
| | $ | — |
| | $ | 2,772 |
|
Exhibits
The following exhibits are incorporated by reference or filed herewith.
| | | | | |
| Exhibit No. | Description |
| Amended and Restated Certificate of Incorporation of Commvault Systems, Inc., as amended (Incorporated by reference to Exhibit 3.1 to the Registrant’s Form 10-Q for the quarter ended September 30, 2019). |
Exhibit No. | Description |
3.1 | Certificate of Amendment of Amended and Restated Certificate of Incorporation of Commvault Systems, Inc. (Incorporated by reference to Exhibit 3.1 to Registrant’s Registration Statement onthe Registrant's Form S-1, Commission File No. 333-132550)8-K dated August 28, 2020). |
3.2 | Certificate of Amendment of Amended and Restated Certificate of Incorporation of Commvault Systems, Inc. (Incorporated by reference to Exhibit 3.1 to the Registrant's Form 10-Q for the quarter ended September 30, 2023). |
| Amended and Restated Bylaws of Commvault Systems, Inc. (Incorporated by reference to Exhibit 3.13.3 to the Registrant’s Annual Report on Form 8-K dated April 25, 2014)10-K for the year ended March 31, 2022). |
3.3 | Certification of Designation of Series A Junior Participating Preferred Stock of Commvault Systems, Inc. (Incorporated by reference to Exhibit 3.1 to the Registrant’s Form 8-K dated November 14, 2008). |
| Form of Common Stock Certificate (Incorporated by reference to Exhibit 4.1 to the Registrant’s Registration Statement on Form S-1, Commission File No. 333-132550). |
| Rights Agreement between Commvault Systems, Inc. and Registrar and Transfer CompanyDescription of Securities. (Incorporated by reference to Exhibit 4.14.2 to Registrant’sthe Registrant's Annual Report on Form 8-K dated November 14, 2008)10-K for the year ended March 31, 2023). |
| Form of Voting Trust Agreement (Incorporated by reference to Exhibit 9.1 to the Registrant’s Registration Statement on Form S-1, Commission File No. 333-132550). |
| Commvault Systems, Inc. 1996 Stock Option Plan, as amended (Incorporated by reference to Exhibit 10.2 to the Registrant’s Registration Statement on Form S-1, Commission File No. 333-132550). |
10.2* | Form of Commvault Systems, Inc. 2006 Long-Term Stock Incentive Plan (Incorporated by reference to Exhibit 10.3 to the Registrant’s Registration Statement on Form S-1, Commission File No. 333-132550). |
10.3* | Form of Non-Qualified Stock Option Agreement (Incorporated by reference to Exhibit 10.4 to the Registrant’s Registration Statement on Form S-1, Commission File No. 333-132550). |
10.4* | Form of Restricted Stock Unit Agreement (Incorporated by reference to Exhibit 10.5 to the Registrant’s Annual Report on Form 10-K for the year ended March 31, 2007). |
10.5* | Employment Agreement, dated as of February 1, 2004, between Commvault Systems, Inc. and N. Robert Hammer (Incorporated by reference to Exhibit 10.5 to the Registrant’s Registration Statement on Form S-1, Commission File No. 333-132550). |
10.6* | Form of Employment Agreement between Commvault Systems, Inc. and Alan G. Bunte and Louis F. Miceli (Incorporated by reference to Exhibit 10.6 to the Registrant’s Registration Statement on Form S-1, Commission File No. 333-132550). |
10.7* | Form of Corporate Change of Control Agreement between Commvault Systems, Inc. and Alan G. Bunte and Louis F. Miceli (Incorporated by reference to Exhibit 10.7 to the Registrant’s Registration Statement on Form S-1, Commission File No. 333-132550). |
10.8* | Form of Corporate Change of Control Agreement between Commvault Systems, Inc. and Brian Carolan, and Ron Miiller (Incorporated by reference to Exhibit 10.8 to the Registrant’s Registration Statement on Form S-1, Commission File No. 333-132550). |
10.9* | Form of Indemnity Agreement between Commvault Systems, Inc. and each of its current officers and directors (Incorporated by reference to Exhibit 10.910.3 to the Registrant’s Registration StatementRegistrant's Annual Report on Form S-1, Commission File No. 333-132550)10-K for the year ended March 31, 2022). |
10.10* | Commvault Systems, Inc. Employee Stock Purchase Plan dated December 9, 2013 (Incorporated by reference to Exhibit 10.10 to the Registrant’s Annual Report on Form 10-K for the year ended March 31, 2014). |
10.11 | Revolving Employment Agreement, dated January 8, 2019, between the Company and Sanjay Mirchandani. (Incorporated by reference to Exhibit 10.1 to the Registrant’s Form 8-K dated February 5, 2019). |
| Commvault Systems, Inc. Omnibus Incentive Plan (as amended by the Sixth Amendment thereof) (Incorporated by reference to Exhibit 10.1 to the Registrant's Form 10-Q for the quarter ended September 30, 2022). |
| Credit Agreement, dated June 30, 2014December 13, 2021, by and among Commvault Systems, Inc. as, the Borrower, certain subsidiaries of the Borrower Party hereto, as the Guarantors,Lenders from time to time party thereto, and JPMorgan Chase Bank, of America, N.A., as Administrative Agent Swingline Lender and L/C Issuer, and the Lenders Party hereto (Incorporated by reference to Exhibit 10.1010.1 to the Registrant's Form 10-Q for the quarter ended December 31, 2021). |
| Offer Letter with Gary Merrill, dated April 28, 2022 (Incorporated by reference to Exhibit 10.1 to the Company's Form 8-K dated April 28, 2022). |
| Executive Retention Agreement with Gary Merrill dated July 27, 2022 (Incorporated by reference to Exhibit 10.2 to the Registrant’s Annual Report on Form 10-Q for the quarter ended June 30, 2014)2022). |
|
| |
* | Management contract or compensatory plan or arrangement. |
|
| |
Exhibit No. | Description |
21.1 | List of Subsidiaries of Commvault Systems, Inc. |
| Consent of Ernst & Young LLP |
| Certification of Chief Executive Officer Pursuant to Section 302 of the Sarbanes-Oxley Act of 2002 |
| Certification of Chief Financial Officer Pursuant to Section 302 of the Sarbanes-Oxley Act of 2002 |
32.1 | Certification of Chief Executive Officer Pursuant to Section 906 of the Sarbanes-Oxley Act of 2002 |
32.2 | Certification of Chief Financial Officer Pursuant to Section 906 of the Sarbanes-Oxley Act of 2002 |
101.INS | Commvault Systems, Inc. Clawback Policy dated October 16, 2023. |
| 101.INS | XBRL Instance Document |
| 101.SCH | XBRL Taxonomy Extension Schema Document |
| 101.CAL | XBRL Taxonomy Extension Calculation Linkbase Document |
| 101.DEF | XBRL Taxonomy Extension Definition Linkbase Document |
| 101.LAB | XBRL Taxonomy Extension Label Linkbase Document |
| 101.PRE | XBRL Taxonomy Extension Presentation Linkbase Document |
| 104 | Cover Page Interactive Data File (formatted as Inline XBRL and contained in Exhibit 101) |
| | | | | |
| * | Management contract or compensatory plan or arrangement. |
| ** | Furnished herewith. |
| | | | | |
| Item 16. | Form 10-K Summary |
None.
SIGNATURES
Pursuant to the requirements of Section 13 or 15(d) of the Securities Exchange Act of 1934, the registrant has duly caused this report to be signed on its behalf by the undersigned, thereunto duly authorized, in the city of Tinton Falls, State of New Jersey, on May 6, 2016.13, 2024.
| | | | | |
| |
| COMMVAULT SYSTEMS, INC. |
| |
| By: | /s/ SANJAY MIRCHANDANI |
| By:/s/ N. ROBERT HAMMERSanjay Mirchandani |
| N. Robert Hammer |
| Chairman,Director, President and Chief Executive Officer |
Pursuant to the requirements of the Securities Exchange Act of 1934, this report has been signed below by the following persons on behalf of the registrant and in the capacities indicated on May 6, 2016.13, 2024.
| | | | | | | | |
| Signature | | Title |
| | |
Signature | | Title |
| |
/s/ N. ROBERT HAMMERSANJAY MIRCHANDANI | | Chairman,Director, President and Chief Executive Officer (Principal Executive Officer) |
N. Robert HammerSanjay Mirchandani | |
/s/ BRIAN CAROLAN | | Vice President, Chief Financial Officer |
Brian Carolan | |
| /s/ GARY MERRILL | | Vice President, Chief Financial Officer (Principal Financial and Accounting OfficerOfficer) |
| Gary Merrill | |
| /s/ NICHOLAS ADAMO | | Chairman of the Board |
| Nicholas Adamo | |
/s/ ALAN G. BUNTEMARTHA H. BEJAR | | Director |
Alan G. BunteMartha H. Bejar | | |
/s/ JOSEPH F. EAZOR | | Director |
Joseph F. Eazor | | |
/s/ FRANK J. FANZILLI, JR. | | Director |
Frank J. Fanzilli, Jr. | |
/s/ ARMANDO GEDAY | | Director |
Armando Geday | |
| /s/ KEITH GEESLIN | | Director |
| Keith Geeslin | |
| /s/ VIVIE LEE | | Director |
| Vivie Lee | |
/s/ F. ROBERT KURIMSKYCHARLES E. MORAN | | Director |
F. Robert KurimskyCharles E. Moran | |
| /s/ ALLISON PICKENS | | Director |
| Allison Pickens | |
/s/ DANIEL PULVERA. SHANE SANDERS | | Director |
Daniel PulverA. Shane Sanders | | |
| /s/ ARLEN SHENKMAN | | Director |
/s/ GARY SMITHArlen Shenkman | | Director |
Gary Smith | |
/s/ DAVID F. WALKER | | Director |
David F. Walker | | |