UNITED STATES
SECURITIES AND EXCHANGE COMMISSION
Washington, D.C. 20549
FORM 10-K
ANNUAL REPORT PURSUANT TO SECTION 13 OR 15(d) OF
THE SECURITIES EXCHANGE ACT OF 1934
For the fiscal year ended December 31, 20162018
Commission file number 001-33013
FLUSHING FINANCIAL CORPORATION
(Exact name of registrant as specified in its charter)
Delaware (State or other jurisdiction of incorporation or organization) | 11-3209278 (I.R.S. Employer Identification No.) |
220 RXR Plaza, Uniondale, New York 11556
(Address of principal executive offices)
(718) 961-5400
(Registrant’s telephone number, including area code)
Securities registered pursuant to Section 12(b) of the Act:
Common Stock $0.01 par value (and associated Preferred Stock Purchase Rights) (Title of each class) | NASDAQ Global Select Market (Name of exchange on which registered) |
Securities registered pursuant to Section 12(g) of the Act: None.
Indicate by check mark if the registrant is a well-known seasoned issuer, as defined in rule 405 of the Securities Act. __Yes___ Yes X No
Indicate by check mark if the registrant is not required to file reports pursuant to Section 13 or Section 15(d) of the Act. __Yes___ Yes X No
Indicate by check mark whether the registrant (1) has filed all reports required to be filed by Section 13 or 15(d) of the Securities Exchange Act of 1934 during the preceding 12 months (or for such shorter period that the registrant was required to file such reports), and (2) has been subject to such filing requirements for the past 90 days. X Yes __No___ No
Indicate by check mark whether the registrant has submitted electronically and posted on its corporate Web site, if any, every Interactive Data File required to be submitted and posted pursuant to Rule 405 of Regulation S-T (§232.405 of this chapter) during the preceding 12 months (or for such shorter period that the registrant was required to submit and post such files). X Yes __No___ No
Indicate by check mark if disclosure of delinquent filers pursuant to Item 405 of Regulation S-K (§229.405 of this chapter) is not contained herein, and will not be contained, to the best of registrant’s knowledge, in definitive proxy or information statements incorporated by reference in Part III of this Form 10-K or any amendment to this Form 10-K. [ ]
Indicate by check mark whether the registrant is a large accelerated filer, an accelerated filer, a non-accelerated filer, or a smaller reporting company, or an emerging growth company. See definitions of “large accelerated filer,” “accelerated filer”, “smaller reporting company” and “smaller reporting“emerging growth company” in Rule 12b-2 of the Exchange Act. (Check one):
Large accelerated filer Non-accelerated filer ___ | Accelerated filer Smaller reporting company __ Emerging growth company __ |
If an emerging growth company, indicate by check mark if the registrant has elected not to use the extended transition period for complying with any new or revised financial accounting standards provided pursuant to Section 13(a) of the Exchange Act. __
Indicate by check mark whether the registrant is a shell company (as defined in Rule 12b-2 of the Act). __Yes___ Yes X No
As of June 30, 2016,29, 2018, the last business day of the registrant’s most recently completed second fiscal quarter; the aggregate market value of the voting stock held by non-affiliates of the registrant was $542,576,000.$704,607,000. This figure is based on the closing price on that date on the NASDAQ Global Select Market for a share of the registrant’s Common Stock, $0.01 par value, which was $19.88.$26.10.
The number of shares of the registrant’s Common Stock outstanding as of February 28, 20172019 was 28,810,85528,187,184 shares.
DOCUMENTS INCORPORATED BY REFERENCE
Portions of the Company’s definitive Proxy Statement for the Annual Meeting of Stockholders to be held on May 31, 201729, 2019 are incorporated herein by reference in Part III.
i
TABLE OF CONTENTS
Page
ii
i
iii
ii
iviii
CAUTIONARY NOTE REGARDING FORWARD LOOKING STATEMENTS
Statements contained in this Annual Report on Form 10-K (this “Annual Report”) relating to plans, strategies, economic performance and trends, projections of results of specific activities or investments and other statements that are not descriptions of historical facts may be forward-looking statements within the meaning of Section 27A of the Securities Act of 1933 and Section 21E of the Securities Exchange Act of 1934. Forward-looking information is inherently subject to risks and uncertainties, and actual results could differ materially from those currently anticipated due to a number of factors, which include, but are not limited to, factors discussed under the captions “Business — General — Allowance for Loan Losses” and “Business — General — Market Area and Competition” in Item 1 below, “Risk Factors” in Item 1A below, in “Management’s Discussion and Analysis of Financial Condition and Results of Operations – Overview” in Item 7 below, and elsewhere in this Annual Report and in other documents filed by the Company with the Securities and Exchange Commission from time to time. Forward-looking statements may be identified by terms such as “may,” “will,” “should,” “could,” “expects,” “plans,” “intends,” “anticipates,” “believes,” “estimates,” “predicts,”, “goals”, “forecasts,” “potential” or “continue” or similar terms or the negative of these terms. Although we believe that the expectations reflected in the forward-looking statements are reasonable, we cannot guarantee future results, levels of activity, performance or achievements. We have no obligation to update these forward-looking statements.
As used in this Annual Report, on Form 10-K, the words “we,” “us,” “our” and the “Company” are used to refer to Flushing Financial Corporation (the “Holding Company”) and our consolidated subsidiaries, including the surviving entity of the merger (the “Merger”) on February 28, 2013 of ourits direct and indirect wholly owned subsidiary,subsidiaries, Flushing Savings Bank, FSB (the “Savings Bank”) with and into Flushing Commercial Bank (the “Commercial Bank”“Bank”). The surviving entity of the Merger was the Commercial Bank, whose name has been changed to “Flushing Bank.” References herein to the “Bank” mean the Savings Bank (including its wholly owned subsidiary, the Commercial Bank) prior to the Merger, Flushing Preferred Funding Corporation, Flushing Service Corporation, and the surviving entity after the Merger.FSB Properties Inc.
| Item 1. | Business. |
We areThe Holding Company is a Delaware corporation organized in May 1994. The Bank was organized in 1929 as a New York State-chartered mutual savings bank. In 1994,Today the Bank converted to a federally chartered mutual savings bank and changed its name from Flushing Savings Bank to Flushing Savings Bank, FSB. The Bank converted from a federally chartered mutual savings bank to a federally chartered stock savings bank on November 21, 1995, at which time Flushing Financial Corporation acquired all of the stock of the Savings Bank. On February 28, 2013, the Savings Bank merged with and into the Commercial Bank, with the Commercial Bankoperates as the surviving entity. Pursuant to the Merger, the Commercial Bank’s charter was changed to a full-service New York State commercial bank charter, and its name was changed to Flushing Bank. Also in connection with the Merger, Flushing Financial Corporation became a bank holding company. We have not made any significant changes to our operations or services as a result of the Merger. Thebank. Our primary business of Flushing Financial Corporation has beenis the operation of the Bank. The Bank owns three subsidiaries: Flushing Preferred Funding Corporation, Flushing Service Corporation, and FSB Properties Inc. The Bank hasalso operates an internet branch iGObanking.com®(the “Internet Branch”), which operates under the brands of iGObanking.com® and BankPurely®. The activities of Flushing Financial Corporationthe Holding Company are primarily funded by dividends, if any, received from the Bank, issuances of subordinated debt and junior subordinated debt, and issuances of equity securities. Flushing Financial Corporation’sThe Holding Company’s common stock is traded on the NASDAQ Global Select Market under the symbol “FFIC.”
Flushing Financial CorporationThe Holding Company also owns Flushing Financial Capital Trust II, Flushing Financial Capital Trust III, and Flushing Financial Capital Trust IV (the “Trusts”), which are special purpose business trusts formed to issue a total of $60.0 million of capital securities and $1.9 million of common securities (which are the only voting securities). Flushing Financial CorporationThe Holding Company owns 100% of the common securities of the Trusts. The Trusts used the proceeds from the issuance of these securities to purchase junior subordinated debentures from Flushing Financial Corporation.the Holding Company. The Trusts are not included in our consolidated financial statements as we would not absorb the losses of the Trusts if losses were to occur.
Unless otherwise disclosed, the information presented in this Annual Report reflects the financial condition and results of operations of Flushing Financial Corporation, the Bank and the Bank’s subsidiaries on a consolidated basis (collectively, the “Company”).Company. Management views the Company as operating a single unit – a community bank. Therefore, segment information is not provided. At December 31, 2016,2018, the Company had total assets of $6.1$6.8 billion, deposits of $4.2$5.0 billion and stockholders’ equity of $513.9$549.5 million.
Our principal business is attracting retail deposits from the general public and investing those deposits together with funds generated from ongoing operations and borrowings, primarily in (1) originations and purchases of multi-family residential properties, commercial business loans, commercial real estate mortgage loans and, to a lesser extent, one-to-four family (focusing on mixed-use properties, which are properties that contain both residential dwelling units and commercial units); (2) construction loans, primarily for residential properties;loans; (3) Small Business Administration (“SBA”) loans and other small business loans; (4) mortgage loan surrogates such as mortgage-backed securities; and (5) U.S. government securities, corporate fixed-income securities and other marketable securities. We also originate certain other consumer loans including overdraft lines of credit. At December 31, 2016,2018, we had gross loans outstanding of $4,819.1$5,536.3 million (before the allowance for loan losses and net deferred costs), with gross mortgage loans totaling $4,187.8$4,638.8 million, or 86.9%83.8% of gross loans, and non-mortgage loans totaling $631.3$897.5 million, or 13.1%16.2% of gross loans. Mortgage loans are primarily multi-family, commercial and one-to-four family mixed-use properties, which totaled 82.6%79.3% of gross loans. Our revenues are derived principally from interest on our mortgage and other loans and mortgage-backed securities portfolio, and interest and dividends on other investments in our securities portfolio. Our primary sources of funds are deposits, Federal Home Loan Bank of New York (“FHLB-NY”) borrowings, repurchase agreements, principal and interest payments on loans, mortgage-backed, other securities and to a lesser extent proceeds from sales of securities and loans. The Bank’s primary regulator is the New York State Department of Financial Services (“NYDFS”) (formerly, the New York State Banking Department), and its primary federal regulator is the Federal Deposit Insurance Corporation (“FDIC”). Deposits are insured to the maximum allowable amount by the FDIC. Additionally, the Bank is a member of the Federal Home Loan Bank (“FHLB”) system.
| 1 |
Our operating results are significantly affected by national and local economic conditions, including the strength of the local economy. TheAccording to the New York Department of Labor, the unemployment rate was 5.2% at December 2016 and 2015, for the New York City region accordingimproved to the New York Department of Labor.4.0% at December 2018 from 4.3% at December 2017. In this economic environment, we sawcontinued to experience improvements in our non-performing loans. Non-performing loans totaled $21.4$16.3 million, $26.1$18.1 million and $34.2$21.4 million at December 31, 2018, 2017 and 2016, 2015 and 2014, respectively. Foreclosed properties decreased by 89.2%We had net recoveries of impaired loans in 2018 totaling $19,000 compared to $0.5 million at December 31, 2016 from $4.9 million at December 31, 2015. Additionally, net charge-offs of impaired loans decreased in 2016 to a recovery of $0.7 million from net charge-offs of $2.6$11.7 million for the year ended December 31, 2015, as we continue to maintain conservative underwriting standards to reduce risk.
2017 and net recoveries of $0.7 million for the year ended December 31, 2016. Our operating results are also affected by extensions, renewals, modifications and restructuring of loans in our loan portfolio. Loans which are renewed, modified or restructured are required to be fully underwritten in accordance with our policy for new loans, except when the borrower is seeking a reduction in the interest rate due to a decline in interest rates in the market, or for a loan classified as a troubled debt restructured (“TDR”). Our policy for modifying a loan due to the borrower’s request for changes in the terms will depend on the change requested. The borrower must be current and have a good payment history to have a loan modified. If the borrower is seeking additional funds, the loan is fully underwritten in accordance with our policy for new loans. If the borrower is seeking a reduction in the interest rate due to a decline in interest rates in the market, we generally limit our review as follows: (1) for income producing properties and business loans, to a review of the operating results of the property/business and a satisfactory inspection of the property, and (2) for one-to-four residential properties, to a satisfactory inspection of the property. Our policy on restructuring a loan when the loan will be classified as a TDR requires the loan to be fully underwritten in accordance with Company policy. The borrower must demonstrate the ability to repay the loan under the new terms. When the restructuring results in a TDR, we may waive some requirements of Company policy provided the borrower has demonstrated the ability to meet the requirements of the restructured loan and repay the restructured loan. While our formal lending policies do not prohibit making additional loans to a borrower or any related interest of the borrower who is past due in principal or interest more than 90 days, it has been our practice not to make additional loans to a borrower or a related interest of the borrower if the borrower is past due more than 90 days as to principal or interest. During the last three fiscal years, we did not make any additional loans to a borrower or any related interest of the borrower who was past due in principal or interest more than 90 days. All extensions, renewals, restructurings and modifications must be approved by either the Board of Directors of the Bank (the “Bank Board of Directors”) or its Loan Committee (the “Loan Committee”).
Our operating results are also affected by losses on non-performing loans. Our policy requiresWe obtain a reappraisal by an independent third party when a loan becomes twelve months delinquent. We generally obtain such a reappraisal by an independent third party for loans over 90 days delinquent when the outstanding loan balance is at least $1.0 million. We also obtain reappraisalssuch a reappraisal when our internally preparedinternal valuation of a property indicates there has been a decline in value below the outstanding balance of the loan, or when a property inspection has indicated significant deterioration in the condition of the property. TheseSuch an internal valuations arevaluation is prepared whenfor a loan becomesover 90 days delinquent.
The Bank has a business banking unit which focuses on the development of a full complement of commercial business deposit, loan and cash management products. As of December 31, 2016 and 2015, the business banking unit had $613.0 million and $525.3 million, respectively, in gross loans outstanding and $144.4 million and $146.3 million, respectively, of customer deposits.
The Bank has an internet branch, iGObanking.com®, which provides access to consumers in markets outside our geographic locations. Accounts can be opened online at www.iGObanking.com or by mail. Currently iGObanking.com® does not accept loan applications. As of December 31, 2016 and 2015, iGObanking.com® had $417.3 million and $323.7 million, respectively, of customer deposits.
The Bank has a governmental banking unit, which provides banking services to public entities including counties, cities, towns, villages, school districts, libraries, fire districts and the various courts throughout the New York City metropolitan area. At December 31, 2016 and 2015, the government banking unit had $1,062.1 million and $975.9 million, respectively, in customer deposits.
We are a community oriented financial institution offering a wide variety of financial services to meet the needs of the communities we serve. The Bank’s main office is in Uniondale, New York, located in Nassau County. At December 31, 2016,2018, the Bank operated out of 19 full-service offices and the Internet Branch. We have offices located in the New York City Boroughs of Queens, Brooklyn, and Manhattan, and in Nassau County, New York. We also operate an internet branch, iGObanking.com®. We maintain our executive offices in Uniondale in Nassau County, New York. Substantially all of our mortgage loans are secured by properties located in the New York City metropolitan area.
We face intense competition both in making loans and in attracting deposits. Competition for loans in our market is primarily based on the types of loans offered and the related terms for these loans, including fixed-rate versus adjustable-rate loans and the interest rate on the loan. For adjustable rate loans, competition is also based on the repricing period, the index to which the rate is referenced, and the spread over the index rate. Also, competition is influenced by the ability of a financial institution to respond to customer requests and to provide the borrower with a timely decision to approve or deny the loan application.
Our market area has a high density of financial institutions, many of which have greater financial resources, name recognition and market presence, and all of which are competitors to varying degrees. Particularly intense competition exists for deposits, as we compete with 115114 banks and thrifts in the counties in which we have branch locations. Our market share of deposits, as of June 30, 2016,2018, in these counties was approximately 0.33%0.35% of the total deposits of these FDIC insured competing financial institutions, and we are the 25th largest financial institution.1In addition, we compete with credit unions, the stock market and mutual funds for customers’ funds. Competition for deposits in our market and for national brokered deposits is primarily based on the types of deposits offered and rate paid on the deposits. Particularly intense competition also exists in all of the lending activities we emphasize. In addition to the financial institutions mentioned above, we compete against mortgage banks and insurance companies located both within our market and available on the internet. Competition for loans in our market is primarily based on the types of loans offered and the related terms for these loans, including fixed-rate versus adjustable-rate loans and the interest rate on the loan. For adjustable rate loans, competition is also based on the repricing period, the index to which the rate is referenced, and the spread over the index rate. Also, competition is influenced by the ability of a financial institution to respond to customer requests and to provide the borrower with a timely decision to approve or deny the loan application. The internet banking arena also has many larger financial institutions which have greater financial resources, name recognition and market presence. Our future earnings prospects will be affected by our ability to compete effectively with other financial institutions and to implement our business strategies. Our strategy for attracting deposits includes using various marketing techniques, delivering enhanced technology and customer friendly banking services, and focusing on the unique personal and small business banking needs of the multi-ethnic communities we serve. Our strategy for attracting new loans is primarily dependent on providing timely response to applicants and maintaining a network of quality brokers. See “Risk Factors – The Markets in Which We Operate Are Highly Competitive” included in Item 1A of this Annual Report.
____________________
1 Per June 2018 FDIC Summary of Deposits for the New York State Counties of New York, Kings, Queens and Nassau.
For a discussion of our business strategies, see “Management’s Discussion and Analysis of Financial Condition and Results of Operations — Overview — Management Strategy” included in Item 7 of this Annual Report.
Loan Portfolio Composition. Our loan portfolio consists primarily of mortgage loans secured by multi-family residential, commercial real estate, one-to-four family mixed-use property, one-to-four family residential property, and commercial business loans. In addition, we also offer construction loans, SBA loans and other consumer loans. Substantially all of our mortgage loans are secured by properties located within our market area. At December 31, 2016,2018, we had gross loans outstanding of $4,819.1$5,536.3 million (before the allowance for loan losses and net deferred costs).
In recent years weWe have focused our mortgage loan origination efforts on multi-family residential mortgage loans, although starting in 2014 we increased our focus on commercial real estate and commercial business loans with full banking relationships. In prior years we had focused our mortgageAll of these loan originations on multi-family residential, commercial real estate and one-to-four family mixed-use property mortgage loans. These loanstypes generally have higher yields than one-to-four family residential properties, and include prepayment penalties that we collect if the loans pay in full prior to the contractual maturity. We expect to continue this emphasis on multi-family residential mortgage loans, commercial real estate and business loans with full banking relationships through marketing and by maintaining competitive interest rates and origination fees. Our marketing efforts include frequent contact with mortgage brokers and other professionals who serve as referral sources.
Fully underwritten one-to-four family residential mortgage loans generally are considered by the banking industry to have less risk than other types of loans. Multi-family residential, commercial real estate and one-to-four family mixed-use property mortgage loans generally have higher yields than one-to-four family residential property mortgage loans and shorter terms to maturity, but typically involve higher principal amounts and may expose the lender to a greater risk of credit loss than one-to-four family residential property mortgage loans. The greater risk associated with multi-family residential, commercial real estate and one-to-four family mixed-use property mortgage loans could require us to increase our provisions for loan losses and to maintain an allowance for loan losses as a percentage of total loans in excess of the allowance we currently maintain. We continually review the composition of our mortgage loan portfolio to manage the risk in the portfolio. See “General – Overview” in this Item 1 of this Annual Report. To date, we have not experienced significant losses in our multi-family residential, commercial real estate and one-to-four family mixed-use property mortgage loan portfolios.
Our mortgage loan portfolio consists of adjustable rate mortgage (“ARM”) loans and fixed-rate mortgage loans. Interest rates we charge on loans are affected primarily by the demand for such loans, the supply of money available for lending purposes, the rate offered by our competitors and the creditworthiness of the borrower. Many of those factors are, in turn, affected by local and national economic conditions, and the fiscal, monetary and tax policies of the federal, state and local governments.
In general, consumers show a preference for ARM loans in periods of high interest rates and for fixed-rate loans when interest rates are low. In periods of declining interest rates, we may experience refinancing activity in ARM loans, as borrowers show a preference to lock-in the lower rates available on fixed-rate loans. In the case of ARM loans we originated, volume and adjustment periods are affected by the interest rates and other market factors as discussed above as well as consumer preferences. We have not in the past, nor do we currently, originate ARM loans that provide for negative amortization.
At December 31, 2016, we had $11.5 million in constructionThe majority of our commercial business loans outstanding. We obtain a first lien position onare generated by the underlying collateral, and generally obtain guarantees on construction loans. These loans generally have a term of two years or less. Construction loans involve a greater degree of risk than other loans because, among other things, the underwriting of such loans is based on an estimated value of the developed property, which can be difficult to ascertain in light of uncertainties inherent in such estimations. In addition, construction lending entails the risk that the project may not be completed due to cost overruns or changes in market conditions. The greater risk associated with construction loans could require us to increase our provision for loan losses, and to maintain an allowance for loan losses as a percentage of total loans in excess of the allowance we currently maintain.
TheCompany’s business banking unitgroup which focuses on loan and deposit relationships to businesses located within our market area. These loans are generally personally guaranteed by the owners, and may be secured by the assets of the business, includingwhich at times may include real estate. The interest rate on these loans is generally an adjustable rate based on a published index. These loans, while providing us a higher rate of return, also present a higher level of risk. The greater risk associated with commercial business loans could require us to increase our provision for loan losses, and to maintain an allowance for loan losses as a percentage of total loans in excess of the allowance we currently maintain. To date, we have not incurred significant losses in our business loan portfolio.
At times, we may purchase whole or participations in loans from banks, mortgage bankers and other financial institutions when the loans complement our loan portfolio strategy. Loans purchased must meet our underwriting standards when they were originated. Our lending activities are subject to federal and state laws and regulations. See “— Regulation.”
The following table sets forth the composition of our loan portfolio at the dates indicated.indicated:
| At December 31, | At December 31, | |||||||||||||||||||||||||||||||||||||||||||||||||||||||||||||||||||||||||||||||
| 2016 | 2015 | 2014 | 2013 | 2012 | 2018 | 2017 | 2016 | 2015 | 2014 | |||||||||||||||||||||||||||||||||||||||||||||||||||||||||||||||||||||||
| Percent | Percent | Percent | Percent | Percent | Percent | Percent | Percent | Percent | Percent | |||||||||||||||||||||||||||||||||||||||||||||||||||||||||||||||||||||||
| Amount | of Total | Amount | of Total | Amount | of Total | Amount | of Total | Amount | of Total | Amount | of Total | Amount | of Total | Amount | of Total | Amount | of Total | Amount | of Total | |||||||||||||||||||||||||||||||||||||||||||||||||||||||||||||
| (Dollars in thousands) | (Dollars in thousands) | |||||||||||||||||||||||||||||||||||||||||||||||||||||||||||||||||||||||||||||||
| Mortgage Loans: | ||||||||||||||||||||||||||||||||||||||||||||||||||||||||||||||||||||||||||||||||
| Multi-family residential | $ | 2,178,504 | 45.21 | % | $ | 2,055,228 | 46.98 | % | $ | 1,923,460 | 50.64 | % | $ | 1,712,039 | 50.02 | % | $ | 1,534,438 | 47.62 | % | $ | 2,269,048 | 41.00 | % | $ | 2,273,595 | 44.08 | % | $ | 2,178,504 | 45.21 | % | $ | 2,055,228 | 46.98 | % | $ | 1,923,460 | 50.64 | % | ||||||||||||||||||||||||||||||||||||||||
| Commercial real estate | 1,246,132 | 25.86 | 1,001,236 | 22.90 | 621,569 | 16.36 | 512,552 | 14.97 | 515,438 | 16.00 | 1,542,547 | 27.86 | 1,368,112 | 26.51 | 1,246,132 | 25.86 | 1,001,236 | 22.90 | 621,569 | 16.36 | ||||||||||||||||||||||||||||||||||||||||||||||||||||||||||||
| One-to-four family - | ||||||||||||||||||||||||||||||||||||||||||||||||||||||||||||||||||||||||||||||||
| mixed-use property | 558,502 | 11.59 | 573,043 | 13.11 | 573,779 | 15.10 | 595,751 | 17.40 | 637,353 | 19.79 | ||||||||||||||||||||||||||||||||||||||||||||||||||||||||||||||||||||||
| One-to-four family - | ||||||||||||||||||||||||||||||||||||||||||||||||||||||||||||||||||||||||||||||||
| residential (1) | 185,767 | 3.85 | 187,838 | 4.30 | 187,572 | 4.94 | 193,726 | 5.66 | 198,968 | 6.18 | ||||||||||||||||||||||||||||||||||||||||||||||||||||||||||||||||||||||
| One-to-four family - mixed-use property | 577,741 | 10.44 | 564,206 | 10.93 | 558,502 | 11.59 | 573,043 | 13.11 | 573,779 | 15.10 | ||||||||||||||||||||||||||||||||||||||||||||||||||||||||||||||||||||||
| One-to-four family - residential (1) | 190,350 | 3.44 | 180,663 | 3.50 | 185,767 | 3.85 | 187,838 | 4.30 | 187,572 | 4.94 | ||||||||||||||||||||||||||||||||||||||||||||||||||||||||||||||||||||||
| Co-operative apartment (2) | 7,418 | 0.15 | 8,285 | 0.19 | 9,835 | 0.26 | 10,137 | 0.30 | 6,303 | 0.20 | 8,498 | 0.15 | 6,895 | 0.13 | 7,418 | 0.15 | 8,285 | 0.19 | 9,835 | 0.26 | ||||||||||||||||||||||||||||||||||||||||||||||||||||||||||||
| Construction | 11,495 | 0.24 | 7,284 | 0.17 | 5,286 | 0.14 | 4,247 | 0.12 | 14,381 | 0.45 | 50,600 | 0.91 | 8,479 | 0.16 | 11,495 | 0.24 | 7,284 | 0.17 | 5,286 | 0.14 | ||||||||||||||||||||||||||||||||||||||||||||||||||||||||||||
| Gross mortgage loans | 4,187,818 | 86.90 | 3,832,914 | 87.65 | 3,321,501 | 87.44 | 3,028,452 | 88.47 | 2,906,881 | 90.24 | 4,638,784 | 83.80 | 4,401,950 | 85.31 | 4,187,818 | 86.90 | 3,832,914 | 87.65 | 3,321,501 | 87.44 | ||||||||||||||||||||||||||||||||||||||||||||||||||||||||||||
| Non-mortgage loans: | ||||||||||||||||||||||||||||||||||||||||||||||||||||||||||||||||||||||||||||||||
| Small Business Administration | 15,198 | 0.32 | 12,194 | 0.28 | 7,134 | 0.19 | 7,792 | 0.23 | 9,496 | 0.29 | 15,210 | 0.27 | 18,479 | 0.36 | 15,198 | 0.32 | 12,194 | 0.28 | 7,134 | 0.19 | ||||||||||||||||||||||||||||||||||||||||||||||||||||||||||||
| Taxi medallion | 18,996 | 0.39 | 20,881 | 0.48 | 22,519 | 0.59 | 13,123 | 0.38 | 9,922 | 0.31 | 4,539 | 0.08 | 6,834 | 0.13 | 18,996 | 0.39 | 20,881 | 0.48 | 22,519 | 0.59 | ||||||||||||||||||||||||||||||||||||||||||||||||||||||||||||
| Commercial business and other | 597,122 | 12.39 | 506,622 | 11.59 | 447,500 | 11.78 | 373,641 | 10.92 | 295,076 | 9.16 | 877,763 | 15.85 | 732,973 | 14.20 | 597,122 | 12.39 | 506,622 | 11.59 | 447,500 | 11.78 | ||||||||||||||||||||||||||||||||||||||||||||||||||||||||||||
| Gross non-mortgage loans | 631,316 | 13.10 | 539,697 | 12.35 | 477,153 | 12.56 | 394,556 | 11.53 | 314,494 | 9.76 | 897,512 | 16.20 | 758,286 | 14.69 | 631,316 | 13.10 | 539,697 | 12.35 | 477,153 | 12.56 | ||||||||||||||||||||||||||||||||||||||||||||||||||||||||||||
| Gross loans | 4,819,134 | 100.00 | % | 4,372,611 | 100.00 | % | 3,798,654 | 100.00 | % | 3,423,008 | 100.00 | % | 3,221,375 | 100.00 | % | 5,536,296 | 100.00 | % | 5,160,236 | 100.00 | % | 4,819,134 | 100.00 | % | 4,372,611 | 100.00 | % | 3,798,654 | 100.00 | % | ||||||||||||||||||||||||||||||||||||||||||||||||||
| Unearned loan fees and deferred | ||||||||||||||||||||||||||||||||||||||||||||||||||||||||||||||||||||||||||||||||
| costs, net | 16,559 | 15,368 | 11,719 | 11,170 | 12,746 | |||||||||||||||||||||||||||||||||||||||||||||||||||||||||||||||||||||||||||
| Unearned loan fees and deferred costs, net | 15,188 | 16,763 | 16,559 | 15,368 | 11,719 | |||||||||||||||||||||||||||||||||||||||||||||||||||||||||||||||||||||||||||
| Less: Allowance for loan losses | (22,229 | ) | (21,535 | ) | (25,096 | ) | (31,776 | ) | (31,104 | ) | (20,945 | ) | (20,351 | ) | (22,229 | ) | (21,535 | ) | (25,096 | ) | ||||||||||||||||||||||||||||||||||||||||||||||||||||||||||||
| Loans, net | $ | 4,813,464 | $ | 4,366,444 | $ | 3,785,277 | $ | 3,402,402 | $ | 3,203,017 | $ | 5,530,539 | $ | 5,156,648 | $ | 4,813,464 | $ | 4,366,444 | $ | 3,785,277 | ||||||||||||||||||||||||||||||||||||||||||||||||||||||||||||
| (1) | One-to-four family residential mortgage loans also include home equity and condominium loans. At December 31, |
| (2) | Consists of loans secured by shares representing interests in individual co-operative units that are generally owner occupied. |
The following table sets forth our loan originations (including the net effect of refinancing) and the changes in our portfolio of loans, including purchases, sales and principal reductions for the years indicated:
| For the years ended December 31, | For the years ended December 31, | |||||||||||||||||||||||
| (In thousands) | 2016 | 2015 | 2014 | 2018 | 2017 | 2016 | ||||||||||||||||||
| Mortgage Loans | ||||||||||||||||||||||||
| At beginning of year | $ | 3,832,914 | $ | 3,321,501 | $ | 3,028,452 | $ | 4,401,950 | $ | 4,187,818 | $ | 3,832,914 | ||||||||||||
| Mortgage loans originated: | ||||||||||||||||||||||||
| Multi-family residential | 245,175 | 205,393 | 314,148 | 275,409 | 318,903 | 245,175 | ||||||||||||||||||
| Commercial real estate | 296,620 | 376,036 | 165,054 | 240,755 | 212,130 | 296,620 | ||||||||||||||||||
| One-to-four family mixed-use property | 62,735 | 68,295 | 50,070 | 73,471 | 65,247 | 62,735 | ||||||||||||||||||
| One-to-four family residential | 24,820 | 40,831 | 24,727 | 41,402 | 26,168 | 24,820 | ||||||||||||||||||
| Co-operative apartment | 470 | 1,625 | 170 | 2,448 | 332 | 470 | ||||||||||||||||||
| Construction | 15,772 | 4,999 | 1,566 | 36,155 | 7,847 | 15,772 | ||||||||||||||||||
| Total mortgage loans originated | 645,592 | 697,179 | 555,735 | 669,640 | 630,627 | 645,592 | ||||||||||||||||||
| Mortgage loans purchased: | ||||||||||||||||||||||||
| Multi-family residential | 126,022 | 168,450 | 106,830 | 64,323 | 54,609 | 126,022 | ||||||||||||||||||
| Commercial real estate | 26,101 | 76,053 | 14,794 | 30,030 | 25,927 | 26,101 | ||||||||||||||||||
| One-to-four family mixed-use property | 685 | - | - | |||||||||||||||||||||
| One-to-four family residential | 1,258 | - | - | |||||||||||||||||||||
| Construction | 3,440 | - | - | |||||||||||||||||||||
| Total mortgage loans purchased | 152,123 | 244,503 | 121,624 | 99,736 | 80,536 | 152,123 | ||||||||||||||||||
| Less: | ||||||||||||||||||||||||
| Principal reductions | 434,587 | 416,101 | 363,206 | 523,064 | 445,561 | 434,587 | ||||||||||||||||||
| Loans transferred to loans held for sale | - | 300 | - | - | 30,565 | - | ||||||||||||||||||
| Mortgage loan sales | 7,259 | 11,057 | 12,871 | 8,737 | 19,993 | 7,259 | ||||||||||||||||||
| Charge-offs | 419 | 1,440 | 1,780 | 103 | 912 | 419 | ||||||||||||||||||
| Loans transferred to ORE | 638 | - | - | |||||||||||||||||||||
| Mortgage loan foreclosures | 546 | 1,371 | 6,453 | - | - | 546 | ||||||||||||||||||
| At end of year | $ | 4,187,818 | $ | 3,832,914 | $ | 3,321,501 | $ | 4,638,784 | $ | 4,401,950 | $ | 4,187,818 | ||||||||||||
| Non-mortgage loans | ||||||||||||||||||||||||
| At beginning of year | $ | 539,697 | $ | 477,153 | $ | 394,556 | $ | 758,286 | $ | 631,316 | $ | 539,697 | ||||||||||||
| Loans originated: | ||||||||||||||||||||||||
| Small Business Administration | 8,447 | 11,261 | 1,611 | 3,843 | 11,559 | 8,447 | ||||||||||||||||||
| Commercial business | 290,444 | 243,316 | 227,904 | 280,704 | 198,476 | 290,444 | ||||||||||||||||||
| Other | 1,738 | 2,777 | 3,056 | 1,920 | 2,352 | 1,738 | ||||||||||||||||||
| Total other loans originated | 300,629 | 257,354 | 232,571 | 286,467 | 212,387 | 300,629 | ||||||||||||||||||
| Non-mortgage loans purchased: | ||||||||||||||||||||||||
| Taxi Medallion | - | - | 14,431 | |||||||||||||||||||||
| Commercial business | 34,594 | 34,425 | 33,805 | 194,948 | 115,920 | 34,594 | ||||||||||||||||||
| Total non-mortgage loans purchased | 34,594 | 34,425 | 48,236 | 194,948 | 115,920 | 34,594 | ||||||||||||||||||
| Less: | ||||||||||||||||||||||||
| Non-mortgage loan sales | 3,211 | 3,935 | 4 | 5,266 | 4,842 | 3,211 | ||||||||||||||||||
| Loans transferred to loans held for sale | - | - | 1,150 | |||||||||||||||||||||
| Principal reductions | 239,653 | 222,895 | 196,394 | 336,094 | 184,935 | 239,653 | ||||||||||||||||||
| Charge-offs | 740 | 2,405 | 662 | 829 | 11,560 | 740 | ||||||||||||||||||
| At end of year | $ | 631,316 | $ | 539,697 | $ | 477,153 | $ | 897,512 | $ | 758,286 | $ | 631,316 | ||||||||||||
Loan Maturity and Repricing. The following table shows the maturity of our total loan portfolio at December 31, 2016.2018. Scheduled repayments are shown in the maturity category in which the payments become due.
| Mortgage loans | Non-mortgage loans | Mortgage loans | Non-mortgage loans | |||||||||||||||||||||||||||||||||||||||||||||||||||||||||||||||||||||||||||||
| One-to-four | One-to-four | |||||||||||||||||||||||||||||||||||||||||||||||||||||||||||||||||||||||||||||||
| family | One-to-four | Commercial | family | One-to-four | Commercial | |||||||||||||||||||||||||||||||||||||||||||||||||||||||||||||||||||||||||||
| Multi-family | Commercial | mixed-use | family | Co-operative | Small Business | Taxi | business | Multi-family | Commercial | mixed-use | family | Co-operative | Small Business | Taxi | business | |||||||||||||||||||||||||||||||||||||||||||||||||||||||||||||||||
| (In thousands) | residential | real estate | property | residential | apartment | Construction | Administration | Medallion | and other | Total loans | residential | real estate | property | residential | apartment | Construction | Administration | Medallion | and other | Total loans | ||||||||||||||||||||||||||||||||||||||||||||||||||||||||||||
| Amounts due within one year | $ | 206,074 | $ | 176,764 | $ | 38,803 | $ | 7,756 | $ | 251 | $ | 7,799 | $ | 2,176 | $ | 12,055 | $ | 180,982 | $ | 632,660 | $ | 216,335 | $ | 211,655 | $ | 31,691 | $ | 6,640 | $ | 280 | $ | 12,387 | $ | 1,863 | $ | 4,130 | $ | 282,294 | $ | 767,275 | ||||||||||||||||||||||||||||||||||||||||
| Amounts due after one year: | ||||||||||||||||||||||||||||||||||||||||||||||||||||||||||||||||||||||||||||||||
| One to two years | 184,443 | 132,153 | 28,609 | 7,170 | 260 | 3,696 | 1,463 | 4,235 | 79,689 | 441,718 | 199,705 | 164,159 | 31,212 | 6,803 | 287 | 7,171 | 1,235 | 409 | 156,305 | 567,286 | ||||||||||||||||||||||||||||||||||||||||||||||||||||||||||||
| Two to three years | 181,955 | 113,596 | 27,404 | 7,048 | 260 | - | 1,309 | 2,706 | 65,210 | 399,488 | 197,466 | 149,992 | 31,584 | 6,939 | 299 | 4,160 | 1,193 | - | 132,809 | 524,442 | ||||||||||||||||||||||||||||||||||||||||||||||||||||||||||||
| Three to five years | 179,895 | 106,904 | 27,268 | 7,128 | 260 | - | 1,151 | - | 55,841 | 378,447 | 196,149 | 145,514 | 32,262 | 7,186 | 309 | 4,427 | 1,196 | - | 103,373 | 490,416 | ||||||||||||||||||||||||||||||||||||||||||||||||||||||||||||
| Over five years | 1,426,137 | 716,715 | 436,418 | 156,665 | 6,387 | - | 9,099 | - | 215,400 | 2,966,821 | 1,459,393 | 871,227 | 450,992 | 162,782 | 7,323 | 22,455 | 9,723 | - | 202,982 | 3,186,877 | ||||||||||||||||||||||||||||||||||||||||||||||||||||||||||||
| Total due after one year | 1,972,430 | 1,069,368 | 519,699 | 178,011 | 7,167 | 3,696 | 13,022 | 6,941 | 416,140 | 4,186,474 | 2,052,713 | 1,330,892 | 546,050 | 183,710 | 8,218 | 38,213 | 13,347 | 409 | 595,469 | 4,769,021 | ||||||||||||||||||||||||||||||||||||||||||||||||||||||||||||
| Total amounts due | $ | 2,178,504 | $ | 1,246,132 | $ | 558,502 | $ | 185,767 | $ | 7,418 | $ | 11,495 | $ | 15,198 | $ | 18,996 | $ | 597,122 | $ | 4,819,134 | $ | 2,269,048 | $ | 1,542,547 | $ | 577,741 | $ | 190,350 | $ | 8,498 | $ | 50,600 | $ | 15,210 | $ | 4,539 | $ | 877,763 | $ | 5,536,296 | ||||||||||||||||||||||||||||||||||||||||
| Sensitivity of loans to changes in | ||||||||||||||||||||||||||||||||||||||||||||||||||||||||||||||||||||||||||||||||
| interest rates - loans due | ||||||||||||||||||||||||||||||||||||||||||||||||||||||||||||||||||||||||||||||||
| after one year: | ||||||||||||||||||||||||||||||||||||||||||||||||||||||||||||||||||||||||||||||||
| Sensitivity of loans to changes in interest rates - loans due after one year: | ||||||||||||||||||||||||||||||||||||||||||||||||||||||||||||||||||||||||||||||||
| Fixed rate loans | $ | 354,707 | $ | 86,742 | $ | 87,321 | $ | 31,701 | $ | 858 | $ | - | $ | 3,828 | $ | 6,357 | $ | 171,436 | $ | 742,950 | $ | 291,845 | $ | 82,230 | $ | 118,968 | $ | 27,279 | $ | 1,215 | $ | - | $ | 2,208 | $ | 409 | $ | 259,291 | $ | 783,445 | ||||||||||||||||||||||||||||||||||||||||
| Adjustable rate loans | 1,617,723 | 982,626 | 432,378 | 146,310 | 6,309 | 3,696 | 9,194 | 584 | 244,704 | 3,443,524 | 1,760,868 | 1,248,662 | 427,082 | 156,431 | 7,003 | 38,213 | 11,139 | - | 336,178 | 3,985,576 | ||||||||||||||||||||||||||||||||||||||||||||||||||||||||||||
| Total loans due after one year | $ | 1,972,430 | $ | 1,069,368 | $ | 519,699 | $ | 178,011 | $ | 7,167 | $ | 3,696 | $ | 13,022 | $ | 6,941 | $ | 416,140 | $ | 4,186,474 | $ | 2,052,713 | $ | 1,330,892 | $ | 546,050 | $ | 183,710 | $ | 8,218 | $ | 38,213 | $ | 13,347 | $ | 409 | $ | 595,469 | $ | 4,769,021 | ||||||||||||||||||||||||||||||||||||||||
Multi-Family Residential Lending. Loans secured by multi-family residential properties were $2,178.5$2,269.0 million, or 45.21%41.00% of gross loans at December 31, 2016.2018. Our multi-family residential mortgage loans had an average principal balance of $1.0 million at December 31, 2016,2018, and the largest multi-family residential mortgage loan held in our portfolio had a principal balance of $28.0$29.3 million. We offer both fixed-rate and adjustable-rate multi-family residential mortgage loans, with maturities of up to 30 years.
In underwriting multi-family residential mortgage loans, we review the expected net operating income generated by the real estate collateral securing the loan, the age and condition of the collateral, the financial resources and income level of the borrower and the borrower’s experience in owning or managing similar properties. We typically require debt service coverage of at least 125% of the monthly loan payment. We generally originate these loans up to only 75% of the appraised value or the purchase price of the property, whichever is less. Any loan with a final loan-to-value ratio in excess of 75% must be approved by the BankBank’s Board of Directors or the Loan Committee as an exception to policy. We generally rely on the income generated by the property as the primary means by which the loan is repaid. However, personal guarantees may be obtained for additional security from these borrowers. We typically order an environmental report on our multi-family and commercial real estate loans.
Loans secured by multi-family residential property generally involve a greater degree of risk than residential mortgage loans and carry larger loan balances. The increased credit risk is the result of several factors, including the concentration of principal in a smaller number of loans and borrowers, the effects of general economic conditions on income producing properties and the increased difficulty in evaluating and monitoring these types of loans. Furthermore, the repayment of loans secured by multi-family residential property is typically dependent upon the successful operation of the related property, which is usually owned by a legal entity with the property being the entity’s only asset. If the cash flow from the property is reduced, the borrower’s ability to repay the loan may be impaired. If the borrower defaults, our only remedy may be to foreclose on the property, for which the market value may be less than the balance due on the related mortgage loan. Loans secured by multi-family residential property also may involve a greater degree of environmental risk. We seek to protect against this risk through obtaining an environmental report. See “—Asset Quality — Environmental Concerns Relating to Loans.”
At December 31, 2016, $1,792.92018, $1,928.4 million, or 82.30%84.99%, of our multi-family mortgage loans consisted of ARM loans. We offer ARM loans with adjustment periods typically of five years and for terms of up to 30 years. Interest rates on ARM loans currently offered by us are adjusted at the beginning of each adjustment period based upon a fixed spread above the FHLB-NY corresponding Regular Advance Rate. From time to time, due to competitive forces, we may originate ARM loans at an initial rate lower than the fully indexed rate as a result of a discount on the spread for the initial adjustment period. Multi-family adjustable-rate mortgage loans generally are not subject to limitations on interest rate increases either on an adjustment period or aggregate basis over the life of the loan; however, the loans generally contain interest rate floors. We originated and purchased multi-family ARM loans totaling $281.8 million, $298.5 million and $330.6 million $339.5 millionduring 2018, 2017 and $398.9 million during 2016, 2015 and 2014, respectively.
At December 31, 2016, $385.72018, $340.6 million, or 17.70%15.01%, of our multi-family mortgage loans consisted of fixed rate loans. Our fixed-rate multi-family mortgage loans are generally originated for terms up to 15 years and are competitively priced based on market conditions and our cost of funds. We originated and purchased $40.6$57.9 million, $34.3$75.0 million and $22.1$40.6 million of fixed-rate multi-family mortgage loans in 2016, 20152018, 2017 and 2014,2016, respectively.
Commercial Real Estate Lending. Loans secured by commercial real estate were $1,246.1$1,542.5 million, or 25.86%27.86% of gross loans, at December 31, 2016.2018. Our commercial real estate mortgage loans are secured by properties such as office buildings, hotels/motels, nursing homes, small business facilities, strip shopping centers and warehouses. At December 31, 2016,2018, our commercial real estate mortgage loans had an average principal balance of $1.8$2.1 million and the largest of such loans, which wasis secured by sevena multi-tenant shopping centers,center, had a principal balance of $42.7$40.3 million. Commercial real estate mortgage loans are generally originated in a range of $100,000 to $6.0$10.0 million.
In underwriting commercial real estate mortgage loans, we employ the same underwriting standards and procedures as are employed in underwriting multi-family residential mortgage loans.
Commercial real estate mortgage loans generally carry larger loan balances than one-to-four family residential mortgage loans and involve a greater degree of credit risk for the same reasons applicable to multi-family residential mortgage loans.
At December 31, 2016, $1,132.52018, $1,414.0 million, or 90.88%91.67%, of our commercial mortgage loans consisted of ARM loans. We offer ARM loans with adjustment periods of one to five years and generally for terms of up to 15 years. Interest rates on ARM loans currently offered by us are adjusted at the beginning of each adjustment period based upon a fixed spread above the FHLB-NY corresponding Regular Advance Rate. From time to time, we may originate ARM loans at an initial rate lower than the index as a result of a discount on the spread for the initial adjustment period. Commercial adjustable-rate mortgage loans generally are not subject to limitations on interest rate increases either on an adjustment period or aggregate basis over the life of the loan; however, the loans generally contain interest rate floors. We originated and purchased commercial ARM loans totaling $243.6 million, $219.6 million and $293.9 million $441.1 millionduring 2018, 2017 and $169.6 million during 2016, 2015 and 2014, respectively.
At December 31, 2016, $113.62018, $128.5 million, or 9.12%8.33%, of our commercial mortgage loans consisted of fixed-rate loans. Our fixed-rate commercial mortgage loans are generally originated for terms up to 20 years and are competitively priced based on market conditions and our cost of funds. We originated and purchased $28.8$27.2 million, $11.0$18.5 million and $10.2$28.8 million of fixed-rate commercial mortgage loans in 2016, 20152018, 2017 and 2014,2016, respectively.
One-to-Four Family Mortgage Lending – Mixed-Use Properties. We offer mortgage loans secured by one-to-four family mixed-use properties. These properties contain up to four residential dwelling units and include a commercial unit.component. We offer both fixed-rate and adjustable-rate one-to-four family mixed-use property mortgage loans with maturities of up to 30 years and a general maximum loan amount of $1.0 million. Loan originations primarily result from applications received from mortgage brokers and mortgage bankers, existing or past customers, and persons who respond to our marketing efforts and referrals. One-to-four family mixed-use property mortgage loans were $558.5$577.7 million, or 11.59%10.44% of gross loans, at December 31, 2016.2018.
In underwriting one-to-four family mixed-use property mortgage loans, we employ the same underwriting standards as are employed in underwriting multi-family residential mortgage loans.
At December 31, 2016, $452.62018, $444.7 million, or 81.03%76.97%, of our one-to-four family mixed-use property mortgage loans consisted of ARM loans. We offer adjustable-rate one-to-four family mixed-use property mortgage loans with adjustment periods typically of five years and for terms of up to 30 years. Interest rates on ARM loans currently offered by the Bank are adjusted at the beginning of each adjustment period based upon a fixed spread above the FHLB-NY corresponding Regular Advance Rate. From time to time, we may originate ARM loans at an initial rate lower than the index as a result of a discount on the spread for the initial adjustment period. One-to-four family mixed-use property adjustable-rate mortgage loans generally are not subject to limitations on interest rate increases either on an adjustment period or aggregate basis over the life of the loan; however, the loans generally contain interest rate floors. We originated and purchased one-to-four family mixed-use property ARM loans totaling $34.5 million, $47.9 million and $72.4 million $54.6 millionduring 2018, 2017 and $39.4 million during 2016, 2015 and 2014, respectively.
At December 31, 2016, $105.92018, $133.1 million, or 18.97%23.03%, of our one-to-four family mixed-use property mortgage loans consisted of fixed-rate loans. Our fixed-rate one-to-four family mixed-use property mortgage loans are originated for terms of up to 15 years and are competitively priced based on market conditions and the Bank’s cost of funds. We originated and purchased $15.6$39.7 million, $13.7$17.3 million and $10.7$15.6 million of fixed-rate one-to-four family mixed-use property mortgage loans in 2016, 20152018, 2017 and 2014,2016, respectively.
One-to-Four Family Mortgage Lending – Residential Properties. We offer mortgage loans secured by one-to-four family residential properties, including townhouses and condominium units. For purposes of the description contained in this section, one-to-four family residential mortgage loans, co-operative apartment loans and home equity loans are collectively referred to herein as “residential mortgage loans.” We offer both fixed-rate and adjustable-rate residential mortgage loans with maturities of up to 30 years and a general maximum loan amount of $1.0 million. Loan originations generally result from applications received from mortgage brokers and mortgage bankers, existing or past customers, and referrals. Residential mortgage loans were $193.2$198.8 million, or 4.00%3.59% of gross loans, at December 31, 2016.2018.
We generally originate residential mortgage loans in amounts up to 80% of the appraised value or the sale price, whichever is less. We may make residential mortgage loans with loan-to-value ratios of up to 90% of the appraised value of the mortgaged property; however, privatePrivate mortgage insurance is required whenever loan-to-value ratios exceed 80% of the appraised value of the property securing the loan.
In addition to income verified loans, we have in the past originated residential mortgage loans to self-employed individuals within our local community based on stated income and verifiable assets that allowed us to assess repayment ability, provided that the borrower’s stated income is considered reasonable for the borrower’s type of business. The preponderance of stated income one-to-four family residential mortgage loans were made available to self-employed individuals within our local community for their primary residence. Our underwriting standards required that we verify the assets of the borrowers and the sources of their cash flows. The information reviewed for purchases included at least three months and refinances included at least one month of personal bank statements (checking and savings accounts), statements of investment accounts, business checking account statements (when applicable), and other information provided by the borrowers about their personal holdings. Our review of these bank statements allowed us to assess whether or not their stated income appeared reasonable in comparison to their cash flows, and if their income level supported their personal holdings. We also obtained and reviewed credit reports on these borrowers. An acceptable credit report was one of the key factors in approving this type of mortgage loan. We obtained appraisals from an independent third party for the property, and limited the amount we lent on the properties to 80% of the lesser of the property’s appraised value or the purchase price. Home equity lines of credit were offered on one-to-four residential properties to homeowners based on various levels of income verification. We limited the amount available under a home equity line of credit to 80% of the lesser of the appraised value of the property or the purchase price. These loans involve a higher degree of risk as compared to our other fully underwritten residential mortgage loans as there is a greater opportunity for self-employed borrowers to falsify or overstate their level of income and ability to service indebtedness. This risk is mitigated by the requirements discussed above in our loan policy. In addition, since 2009, the underwriting standards for home equity loans were modified to discontinue originating home equity lines of credit without verifying the borrower’s income. We also discontinued offering one-to-four family residential property mortgage loans to self-employed individuals based on stated income and verifiable assets in June 2010. We had $9.0 million and $9.9 million outstanding of one-to four family residential mortgage loans originated to individuals based on stated income and verifiable assets at December 31, 2016 and 2015, respectively. We had $38.6 million and $41.4 million advanced on home equity lines of credit for which we did not verify the borrowers’ income at December 31, 2016 and 2015, respectively.
At December 31, 2016, $151.02018, $168.1 million, or 81.29%84.53%, of our residential mortgage loans consisted of ARM loans. We offer ARM loans with adjustment periods of one, three, five, seven or ten years. Interest rates on ARM loans currently offered by us are adjusted at the beginning of each adjustment period based upon a fixed spread above the FHLB-NY corresponding Regular Advance Rate. From time to time, we may originate ARM loans at an initial rate lower than the index as a result of a discount on the spread for the initial adjustment period. ARM loans generally are subject to limitations on interest rate increases of 2% per adjustment period and an aggregate adjustment of 6% over the life of the loan and have interest rate floors. We originated and purchased adjustable rate residential mortgageARM loans totaling $40.8 million, $24.4 million and $24.3 million $39.2 millionduring 2018, 2017 and $21.0 million during 2016, 2015 and 2014, respectively.
The retention of ARM loans in our portfolio helps us reduce our exposure to interest rate risks. However, in an environment of rapidly increasing interest rates, it is possible for the interest rate increase to exceed the maximum aggregate adjustment on one-to-four family residential ARM loans and negatively affect the spread between our interest income and our cost of funds.
| 8 |
ARM loans generally involve credit risks different from those inherent in fixed-rate loans, primarily because if interest rates rise, the underlying payments of the borrower rise, thereby increasing the potential for default. However, this potential risk is lessened by our policy of originating one-to-four family residential ARM loans with annual and lifetime interest rate caps that limit the increase of a borrower’s monthly payment.
At December 31, 2016, $34.82018, $30.8 million, or 18.71%15.47%, of our residential mortgage loans consisted of fixed-rate loans. Our fixed-rate residential mortgage loans typically are originated for terms of 15 and 30 years and are competitively priced based on market conditions and our cost of funds. We originated and purchased $0.9$4.3 million, $3.3$2.1 million and $3.9$0.9 million in 15-year fixed-rate residential mortgages in 2016, 20152018, 2017 and 2014,2016, respectively. We did not originate or purchase any 30-year fixed-rate residential mortgages in 2016, 20152018, 2017 and 2014.2016.
At December 31, 2016,2018, home equity loans totaled $52.4$42.4 million, or 1.09%0.77%, of gross loans. Home equity loans are included in our portfolio of residential mortgage loans. These loans are offered as adjustable-rate “home equity lines of credit” on which interest only is due for an initial term of 10 years and thereafter principal and interest payments sufficient to liquidate the loan are required for the remaining term, not to exceed 30 years. These adjustable “home equity lines of credit” may include a “floor” and/or a “ceiling” on the interest rate that we charge for these loans. These loans also may be offered as fully amortizing closed-end fixed-rate loans for terms up to 15 years. The majority of home equity loans originated are owner occupied one-to-four family residential properties and condominium units. To a lesser extent, home equity loans are also originated on one-to-four residential properties held for investment and second homes. All home equity loans are subject to an 80% loan-to-value ratio computed on the basis of the aggregate of the first mortgage loan amount outstanding and the proposed home equity loan. They are generally granted in amounts from $25,000 to $300,000.
Construction Loans. At December 31, 2016,2018, construction loans totaled $11.5$50.6 million, or 0.24%0.91%, of gross loans. Our construction loans primarily have been madeare adjustable rate loans to finance the construction of one-to-four family residential properties, multi-family residential properties and residential condominiums.owner-occupied commercial properties. We also, to a limited extent, finance the construction of commercial real estate.properties. Our policies provide that construction loans may be made in amounts up to 70% of the estimated value of the developed property and only if we obtain a first lien position on the underlying real estate. However, we generally limit construction loans to 60% of the estimated value of the developed property. In addition, we generally require personal guarantees on all construction loans. Construction loans are generally made with terms of two years or less. Advances are made as construction progresses and inspection warrants, subject to continued title searches to ensure that we maintain a first lien position. We made construction loans of $39.6 million, $7.8 million and $15.8 million $5.0 millionduring 2018, 2017 and $1.6 million during 2016, 2015 and 2014, respectively.
Construction loans involve a greater degree of risk than other loans because, among other things, the underwriting of such loans is based on an estimated value of the developed property, which can be difficult to ascertain in light of uncertainties inherent in such estimations. In addition, construction lending entails the risk that the project may not be completed due to cost overruns or changes in market conditions.
Small Business Administration Lending. At December 31, 2016,2018, SBA loans totaled $15.2 million, representing 0.32%0.27%, of gross loans. These loans are extended to small businesses and are guaranteed by the SBA up to a maximum of 85% of the loan balance for loans with balances of $150,000 or less, and to a maximum of 75% of the loan balance for loans with balances greater than $150,000. We also provide term loans and lines of credit up to $350,000 under the SBA Express Program, on which the SBA provides a 50% guaranty. The maximum loan size under the SBA guarantee program was $2.0 million, with a maximum loan guarantee of $1.5 million. The Small Business Jobs Act of 2010 permanently increased the limits to a maximum loan size ofis $5.0 million, with a maximum loan guarantee of $3.75 million. All SBA loans are underwritten in accordance with SBA Standard Operating Procedures which requires collateral and the personal guarantee of the owners with more than 20% ownership from SBA borrowers. Typically, SBA loans are originated in the range of $25,000 to $2.0 million with terms ranging from one to seven years and up to 25 years for owner occupied commercial real estate mortgages. SBA loans are generally offered at adjustable rates tied to the prime rate (as published in the Wall Street Journal) with adjustment periods of one to three months. At times, we may sell the guaranteed portion of certain SBA term loans in the secondary market, realizing a gain at the time of sale, and retaining the servicing rights on these loans, collecting a servicing fee of approximately 1%. We originated and purchased $8.4$3.8 million, $11.3$11.6 million and $1.6$8.4 million of SBA loans during 2016, 20152018, 2017 and 2014,2016, respectively.
Taxi Medallion. At December 31, 2016,2018, taxi medallion loans consisted of loans made primarily to New York City taxi medallion owners and to a lesser extent Chicago taxi medallion owners, which are secured by liens on the taxi medallions, totaling $19.0$4.5 million, or 0.39%0.08%, of gross loans. In 2015, we decided to no longer originate or purchase taxi medallion loans. Therefore, we did not originate or purchase any taxi medallion loans in 2016 or 2015, but originated and purchased $14.4 million during 2014.
| 9 |
Commercial Business and Other Lending. At December 31, 2016,2018, commercial business and other loans totaled $597.1$877.8 million, or 12.39%15.85%, of gross loans. We originate and purchase commercial business loans and other loans for business, personal, or household purposes. Commercial business loans are provided to businesses in the New York City metropolitan area with annual sales of up to $250.0 million. Our commercial business loans include lines of credit and term loans including owner occupied mortgages. These loans are secured by business assets, including accounts receivables, inventory and real estate and generally require personal guarantees. The Bank also at times, enters into participations/syndications with other banks on senior secured commercial business loans.loans, which are serviced by other banks. Commercial business loans are generally originated in a range of $100,000 to $10.0 million.
At December 31, 2016, $409.7 million, or 68.61%, of our commercial business loans consisted of adjustable rate loans. We generally offer adjustable rate loans with adjustment periods of five years for owner occupied mortgages and for lines of credit the adjustment period is generally monthly. Interest rates on adjustable rate loans currently offered by us are adjusted at the beginning of each adjustment period based upon a fixed spread above the FHLB-NY corresponding Regular Advance Rate for owner occupied mortgages and a fixed spread above the London Interbank Offered Rate (“LIBOR”) or Prime Rate for lines of credit. Commercial business adjustable-rate loans generally are not subject to limitations on interest rate increases either on an adjustment period or aggregate basis over the life of the loan, however they generally are subject to interest rate floors.
At December 31, 2016, $187.4 million, or 31.39%, of our commercial business loans consisted of fixed-rate loans. Our fixed-rate commercial business loans are generally originated for terms up to 20 years and are competitively priced based on market conditions and our cost of funds. We originated and purchased $475.7 million, $314.4 million and $325.0 million of commercial business loans during 2018, 2017 and 2016, respectively.
Other loans generally consist of overdraft lines of credit. Generally, unsecured consumer loans are limited to amounts of $5,000 or less for terms of up to five years. We originated and purchased $1.7$1.9 million, $2.8$2.4 million and $3.1$1.7 million of other loans during 2016, 20152018, 2017 and 2014,2016, respectively. The underwriting standards employed by us for consumer and other loans include a determination of the applicant’s payment history on other debts and assessment of the applicant’s ability to meet payments on all of his or her obligations. In addition to the creditworthiness of the applicant, the underwriting process also includes a comparison of the value of the collateral, if any, to the proposed loan amount. Unsecured loans tend to have higher risk, and therefore command a higher interest rate.
Loan Extensions, Renewals, Modifications and Restructuring. Extensions, renewals, modifications or restructuring a loan, other than a loan that is classified as a TDR,troubled debt restructured (“TDR”), requires the loan to be fully underwritten in accordance with our policy. The borrower must be current to have a loan extended, renewed or restructured. Our policy for modifying a mortgage loan due to the borrower’s request for changes in the terms will depend on the changes requested. The borrower must be current and have a good payment history to have a loan modified. If the borrower is seeking additional funds, the loan is fully underwritten in accordance with our policy for new loans. If the borrower is seeking a reduction in the interest rate due to a decline in interest rates in the market, we generally limit our review as follows: (1) for income producing properties and commercial business loans, to a review of the operating results of the property/business and a satisfactory inspection of the property, and (2) for one-to-four residential properties, to a satisfactory inspection of the property. Our policy on restructuring a loan when the loan will be classified as a TDR requires the loan to be fully underwritten in accordance with Company policy. The borrower must demonstrate the ability to repay the loan under the new terms. When the restructuring results in a TDR, we may waive some requirements of Company policy provided the borrower has demonstrated the ability to meet the requirements of the restructured loan and repay the restructured loan. While our formal lending policies do not prohibit making additional loans to a borrower or any related interest of the borrower who is past due in principal or interest more than 90 days, it has been our practice not to make additional loans to a borrower or a related interest of the borrower if the borrower is past due more than 90 days as to principal or interest. During the most recent three fiscal years, we did not make any additional loans to a borrower or any related interest of the borrower who was past due in principal or interest more than 90 days. All extensions, renewals, restructurings and modifications must be approved by the appropriate Loan Committee.
Loan Approval Procedures and Authority. The Board of Directors of the Company (the “Board of Directors”) approved lending policies establishing loan approval requirements for our various types of loan products. Our Residential Mortgage Lending Policy (which applies to all one-to-four family mortgage loans, including residential and mixed-use property) establishes authorized levels of approval. One-to-four family mortgage loans that do not exceed $750,000 require two signatures for approval, one of which must be from either the Senior Executive Vice President, the Executive Vice President or a Senior Vice President (collectively, “Authorized Officers”) and the other from a Senior Underwriter, Manager, Underwriter or Junior Underwriter in the Residential Mortgage Loan Department (collectively, “Loan Officers”), and ratification by the Management Loan Committee. For one-to-four family mortgage loans in excess of $750,000 up to $2.5$2.0 million, three signatures are required for approval, at least two of which must be from Authorized Officers, and the other one may be a Loan Officer, and ratification by the Management Loan Committee and the Director’s Loan Committee. The Director’s Loan Committee or the Bank Board of Directors also must approve one-to-four family mortgage loans in excess of $2.5 million. Pursuant to our Commercial Real Estate Lending Policy, loans secured by commercial real estate and multi-family residential properties up to $2.0 million are approved by the Executive Vice President of Commercial Real Estate and the Senior Executive Vice President, Chief of Real Estate Lending and then ratified by the Management Loan Committee and/or the Director’s Loan Committee. Loans provided in excess of $2.0 million and up to and including $5.0 million must be submitted to the Management Loan Committee for final approval and then to the Director’s Loan Committee and/or Board of Directors for ratification. Loans in excess of $5.0 million and up to and including $25.0 million must be submitted to the Director’s Loan Committee and/ or the Board of Directors for approval. Loan amounts in excess of $25.0 million must be approved by the Board of Directors.
| 10 |
In accordance with our Business Credit Policy allCommercial business and other loans require two signatures from the Business Loan Committee for approval. All commercial business loans and SBA loans up to $2.5 million must be approved by the Business Loan Committee and ratified by the Management Loan Committee. BusinessCommercial business loans and SBA loans in excess of $2.5 million up to $5.0 million must be approved by the Management Loan Committee and ratified by the Director’s Loan Committee. Commercial business and other loans require two signatures fromLoans in excess of $5.0 million must be submitted to the BusinessDirector’s Loan Committee and/ or the Board of Directors for approval.
Our Construction Loan Policy requires construction loans up to and including $1.0 million must be approved by the Senior Executive Vice President, Chief of Real Estate Lending and the Executive Vice President of Commercial Real Estate, and ratified by the Management Loan Committee or the Director’s Loan Committee. Such loans in excess of $1.0$2.0 million up to and including $2.5$5.0 million require the same officer approvals, approval of the Management Loan Committee, and ratification of the Director’s Loan Committee or the Bank Board of Directors. Construction loans in excess of $15.0$25.0 million require the same officer approvals, approval by the Management Loan Committee, and approval of the Bank Board of Directors. Any loan, regardless of type, that deviates from our written credit policies must be approved by the Loan Committee or the Bank Board of Directors.
For all loans originated by us, upon receipt of a completed loan application, a credit report is ordered and certain other financial information is obtained. An appraisal of the real estate intended to secure the proposed loan is required to be received. An independent appraiser designated and approved by us currently performs such appraisals. Our staff appraisers review all appraisals. The Bank Board of Directors annually approves the independent appraisers used by the Bank and approves the Bank’s appraisal policy. It is our policy to require borrowers to obtain title insurance and hazard insurance on all real estate loans prior to closing. For certain borrowers, and/or as required by law, the Bank may require escrow funds on a monthly basis together with each payment of principal and interest to a mortgage escrow account from which we make disbursements for items such as real estate taxes and, in some cases, hazard insurance premiums.
Loan Concentrations. The maximum amount of credit that the Bank can extend to any single borrower or related group of borrowers generally is limited to 15% of the Bank’s unimpaired capital and surplus, or $91.1$99.1 million at December 31, 2016.2018. Applicable laws and regulations permit an additional amount of credit to be extended, equal to 10% of unimpaired capital and surplus, if the loan is secured by readily marketable collateral, which generally does not include real estate. See “-Regulation.” However, it is currently our policy not to extend such additional credit. At December 31, 2016,2018, there were no loans in excess of the maximum dollar amount of loans to one borrower that the Bank was authorized to make. At that date, the three largest concentrations of loans to one borrower consisted of loans secured by commercial real estate, multi-family income producing properties and commercial business loans with an aggregate principal balance of $74.0$83.1 million, $60.0$80.2 million and $54.5$66.4 million for each of the three borrowers, respectively.
Loan Servicing. At December 31, 2016,2018, we were servicing $1.3$36.5 million of mortgage loans and $13.1$18.4 million of SBA loans for others. Our policy is to retain the servicing rights to the mortgage and SBA loans that we sell in the secondary market, other than non-performingsales of delinquent loans, thatwhich are sold with servicing released to the buyer. In orderOn mortgage loans and commercial business loan participations purchased by us for whom the seller retains the servicing rights, we receive monthly reports with which we monitor the loan portfolio. Based upon servicing agreements with the servicers of the loans, we rely upon the servicer to increase revenue, management intendscontact delinquent borrowers, collect delinquent amounts and initiate foreclosure proceedings, when necessary, all in accordance with applicable laws, regulations and the terms of the servicing agreements between us and our servicing agents. The servicers are required to continue this policy.submit monthly reports on their collection efforts on delinquent loans. At December 31, 2018 and 2017, we held $856.8 million and $811.5 million, respectively, of loans that were serviced by others.
Loan Collection. When a borrower fails to make a required payment on a loan, except for serviced loans as described above, we take a number of steps to induce the borrower to cure the delinquency and restore the loan to current status. In the case of mortgage loans, personal contact is made with the borrower after the loan becomes 30 days delinquent. We take a proactive approach to managing delinquent loans, including conducting site examinations and encouraging borrowers to meet with one of our representatives. When deemed appropriate, we develop short-term payment plans that enable borrowers to bring their loans current, generally within six to nine months. At times, when a borrower is experiencing financial difficulties, we may restructure a loan to enable a borrower to continue making payments when it is deemed to be in our best long-term interest. This restructure may include reducing the interest rate or amount of the monthly payment for a specified period of time, after which the interest rate and repayment terms revert to the original terms of the loan. We classify these loans as TDR. At December 31, 2016, we had $17.8 million of loans classified as TDR, with $17.4 million of these loans performing according to their restructured terms and $0.4 million not performing according to their restructured terms. We review delinquencies on a loan by loan basis, diligently exploring ways to help borrowers meet their obligations and return them back to current status,status.
| 11 |
In the case of commercial business or other loans, we generally send the borrower a written notice of non-payment when the loan is first past due. In the event payment is not then received, additional letters and phone calls generally are made in order to encourage the borrower to meet with one of our representatives to discuss the delinquency. If the loan still is not brought current and it becomes necessary for us to take legal action, which typically occurs after a loan is delinquent 90 days or more, we have increased staffingmay attempt to handle delinquent loans by hiring people experienced inrepossess personal or business property that secures an SBA loan, workouts.commercial business loan or consumer loan.
When the borrower has indicated that they will be unable to bring the loan current, or due to other circumstances which, in our opinion, indicate the borrower will be unable to bring the loan current within a reasonable time, the loan is classified as non-performing. All loans classified as non-performing, which includes all loans past due 90 days or more, are classified ason non-accrual status unless there is, in our opinion, compelling evidence the borrower will bring the loan current in the immediate future. At December 31, 2016,2018, there were twono loans which totaled $0.4 million, past due 90 days or more andthat were still accruing interest.
Upon classifying a loan as non-performing, we review available information and conditions that relate to the status of the loan, including the estimated value of the loan’s collateral and any legal considerations that may affect the borrower’s ability to continue to make payments. Based upon the available information, we will consider the sale of the loan or retention of the loan. If the loan is retained, we may continue to work with the borrower to collect the amounts due or start foreclosure proceedings. If a foreclosure action is initiated and the loan is not brought current, paid in full, or refinanced before the foreclosure sale, the real property securing the loan is sold at foreclosure or by us as soon thereafter as practicable.
Once the decision to sell a loan is made, we determine what we would consider adequate consideration to be obtained when that loan is sold, based on the facts and circumstances related to that loan. Investors and brokers are then contacted to seek interest in purchasing the loan. We have been successful in finding buyers for some of our non-performing loans offered for sale that are willing to pay what we consider to be adequate consideration. Terms of the sale include cash due upon closing of the sale, no contingencies or recourse to us, servicing is released to the buyer and time is of the essence. These sales usually close within a reasonably short time period.
This strategy of selling non-performing loans has allowed us to optimize our return by quickly converting our non-performing loans to cash, which can then be reinvested in earning assets. This strategy also allows us to avoid lengthy and costly legal proceedings that may occur with non-performing loans. There can be no assurances that we will continue this strategy in future periods, or if continued, we will be able to find buyers to pay adequate consideration.
The following tables show delinquent and non-performing loans sold during the period indicated:
| For the years ended December 31, | For the years ended December 31, | |||||||||||||||||||||||
| (Dollars in thousands) | 2016 | 2015 | 2014 | 2018 | 2017 | 2016 | ||||||||||||||||||
| Count | 26 | 23 | 34 | 12 | 17 | 26 | ||||||||||||||||||
| Proceeds | $ | 7,965 | $ | 8,986 | $ | 15,857 | $ | 8,739 | $ | 6,217 | $ | 7,965 | ||||||||||||
| Net recoveries | 48 | 134 | 357 | |||||||||||||||||||||
| Net (charge-offs) recoveries | 68 | (37 | ) | 48 | ||||||||||||||||||||
| Gross gains | 265 | 71 | 67 | 38 | 415 | 265 | ||||||||||||||||||
| Gross losses | - | 2 | - | 263 | - | - | ||||||||||||||||||
On mortgage loans or loan participations purchased by us for whom the seller retains the servicing rights, we receive monthly reports with which we monitor the loan portfolio. Based upon servicing agreements with the servicers of the loans, we rely upon the servicer to contact delinquent borrowers, collect delinquent amounts and initiate foreclosure proceedings, when necessary, all in accordance with applicable laws, regulations and the terms of the servicing agreements between us and our servicing agents. The servicers are required to submit monthly reports on their collection efforts on delinquent loans. At December 31, 2016, we held $742.6 million of loans that were serviced by others.
In the case of commercial business or other loans, we generally send the borrower a written notice of non-payment when the loan is first past due. In the event payment is not then received, additional letters and phone calls generally are made in order to encourage the borrower to meet with one of our representatives to discuss the delinquency. If the loan still is not brought current and it becomes necessary for us to take legal action, which typically occurs after a loan is delinquent 90 days or more, we may attempt to repossess personal or business property that secures an SBA loan, commercial business loan or consumer loan.
Troubled Debt Restructured . We have restructured certain problem loans for borrowers who are experiencing financial difficulties by either: reducing the interest rate until the next reset date, extending the amortization period thereby lowering the monthly payments, deferring a portion of the interest payment, or changing the loan to interest only payments for a limited time period. At times, certain problem loans have been restructured by combining more than one of these options. These restructurings have not included a reduction of principal balance. We believe that restructuring these loans in this manner will allow certain borrowers to become and remain current on their loans. These restructured loans are classified TDR. Loans which have been current for six consecutive months at the time they are restructured as TDR remain on accrual status. Loans which were delinquent at the time they are restructured as a TDR are placed on non-accrual status until they have made timely payments for six consecutive months.
The following table shows our recorded investment in loans classified as TDR that are performing according to their restructured terms at the periods indicated:
| At December 31, | ||||||||||||||||||||
| (Dollars in thousands) | 2016 | 2015 | 2014 | 2013 | 2012 | |||||||||||||||
| Multi-family residential | $ | 2,572 | $ | 2,626 | $ | 3,035 | $ | 3,087 | $ | 2,347 | ||||||||||
| Commercial real estate | 2,062 | 2,371 | 2,373 | 2,407 | 7,190 | |||||||||||||||
| One-to-four family mixed-use property | 1,800 | 2,052 | 2,381 | 2,692 | 2,336 | |||||||||||||||
| One-to-four family residential | 591 | 343 | 354 | 364 | 374 | |||||||||||||||
| Construction | - | - | - | 746 | 3,805 | |||||||||||||||
| Small Business Administration | - | 34 | - | - | - | |||||||||||||||
| Taxi medallion | 9,735 | - | - | - | - | |||||||||||||||
| Commercial business and other | 675 | 2,083 | 2,249 | 4,406 | 3,849 | |||||||||||||||
| Total performing troubled debt restructured | $ | 17,435 | $ | 9,509 | $ | 10,392 | $ | 13,702 | $ | 19,901 | ||||||||||
| At December 31, | ||||||||||||||||||||
| (In thousands) | 2018 | 2017 | 2016 | 2015 | 2014 | |||||||||||||||
| Accrual Status: | ||||||||||||||||||||
| Multi-family residential | $ | 1,916 | $ | 2,518 | $ | 2,572 | $ | 2,626 | $ | 3,035 | ||||||||||
| Commercial real estate | - | 1,986 | 2,062 | 2,371 | 2,373 | |||||||||||||||
| One-to-four family - mixed-use property | 1,692 | 1,753 | 1,800 | 2,052 | 2,381 | |||||||||||||||
| One-to-four family - residential | 552 | 572 | 591 | 343 | 354 | |||||||||||||||
| Small business administration | - | - | - | 34 | - | |||||||||||||||
| Taxi medallion | - | - | 9,735 | - | - | |||||||||||||||
| Commercial business and other | 279 | 462 | 420 | 2,083 | 2,249 | |||||||||||||||
| Total | 4,439 | 7,291 | 17,180 | 9,509 | 10,392 | |||||||||||||||
| Non-Accrual Status: | ||||||||||||||||||||
| Commercial business and other | - | - | 255 | - | - | |||||||||||||||
| Taxi medallion | 3,926 | 5,916 | - | - | - | |||||||||||||||
| Total | 3,926 | 5,916 | 255 | - | - | |||||||||||||||
| Total performing troubled debt restructured | $ | 8,365 | $ | 13,207 | $ | 17,435 | $ | 9,509 | $ | 10,392 | ||||||||||
Loans that are restructured as TDR but are not performing in accordance with the restructured terms are excluded from the TDR table above, as they are placed on non-accrual status and reported as non-performing loans. At December 31, 2016 and 2015,2018, there were two loans totaling $1.8 million which were restructured as TDR not performing in accordance with its restructured terms. At December 31, 2017, there was one loan for $0.4 million which was restructured as TDR which was not performing in accordance with its restructured terms.
Delinquent Loans and Non-performing Assets. We generally discontinue accruing interest on delinquent loans when a loan is 90 days past due or foreclosure proceedings have been commenced, whichever first occurs.due. At that time, previously accrued but uncollected interest is reversed from income. Loans in default 90 days or more as to their maturity date but not their payments, however, continue to accrue interest as long as the borrower continues to remit monthly payments.
The following table shows our non-performing assets including loans held for sale, at the dates indicated. During the years ended December 31, 2016, 20152018, 2017 and 2014,2016, the amounts of additional interest income that would have been recorded on non-accrual loans, had they been current, totaled $1.5$1.0 million, $1.7$1.1 million and $2.1$1.5 million, respectively. These amounts were not included in our interest income for the respective periods.
| At December 31, | At December 31, | |||||||||||||||||||||||||||||||||||||||
| (Dollars in thousands) | 2016 | 2015 | 2014 | 2013 | 2012 | 2018 | 2017 | 2016 | 2015 | 2014 | ||||||||||||||||||||||||||||||
| Loans 90 days or more past due | ||||||||||||||||||||||||||||||||||||||||
| and still accruing: | ||||||||||||||||||||||||||||||||||||||||
| Loans 90 days or more past due and still accruing: | ||||||||||||||||||||||||||||||||||||||||
| Multi-family residential | $ | - | $ | 233 | $ | 676 | $ | 52 | $ | - | $ | - | $ | - | $ | - | $ | 233 | $ | 676 | ||||||||||||||||||||
| Commercial real estate | - | 1,183 | 820 | - | - | - | 2,424 | - | 1,183 | 820 | ||||||||||||||||||||||||||||||
| One-to-four family mixed-use property | 386 | 611 | 405 | - | - | - | - | 386 | 611 | 405 | ||||||||||||||||||||||||||||||
| One-to-four family - residential | - | 13 | 14 | 15 | - | - | - | - | 13 | 14 | ||||||||||||||||||||||||||||||
| Construction | - | 1,000 | - | - | - | - | - | - | 1,000 | - | ||||||||||||||||||||||||||||||
| Commercial Business and other | - | 220 | 386 | 539 | 644 | - | - | - | 220 | 386 | ||||||||||||||||||||||||||||||
| Total | 386 | 3,260 | 2,301 | 606 | 644 | - | 2,424 | 386 | 3,260 | 2,301 | ||||||||||||||||||||||||||||||
| Non-accrual mortgage loans: | ||||||||||||||||||||||||||||||||||||||||
| Multi-family residential | 1,837 | 3,561 | 6,878 | 13,682 | 16,486 | 2,410 | 3,598 | 1,837 | 3,561 | 6,878 | ||||||||||||||||||||||||||||||
| Commercial real estate | 1,148 | 2,398 | 5,689 | 9,962 | 15,640 | 1,379 | 1,473 | 1,148 | 2,398 | 5,689 | ||||||||||||||||||||||||||||||
| One-to-four family mixed-use property | 4,025 | 5,952 | 6,936 | 9,063 | 18,280 | 928 | 1,867 | 4,025 | 5,952 | 6,936 | ||||||||||||||||||||||||||||||
| One-to-four family residential | 8,241 | 10,120 | 11,244 | 13,250 | 13,726 | 6,144 | 7,808 | 8,241 | 10,120 | 11,244 | ||||||||||||||||||||||||||||||
| Co-operative apartments | - | - | - | 57 | 234 | |||||||||||||||||||||||||||||||||||
| Construction | - | - | - | - | 7,695 | |||||||||||||||||||||||||||||||||||
| Total | 15,251 | 22,031 | 30,747 | 46,014 | 72,061 | 10,861 | 14,746 | 15,251 | 22,031 | 30,747 | ||||||||||||||||||||||||||||||
| Non-accrual non-mortgage loans: | ||||||||||||||||||||||||||||||||||||||||
| Small Business Administration | 1,886 | 218 | - | - | 283 | 1,267 | 46 | 1,886 | 218 | - | ||||||||||||||||||||||||||||||
| Taxi Medallion | 3,825 | - | - | - | - | |||||||||||||||||||||||||||||||||||
| Commercial Business and other | 68 | 568 | 1,143 | 2,348 | 16,860 | |||||||||||||||||||||||||||||||||||
| Taxi medallion(1) | 613 | 918 | 3,825 | - | - | |||||||||||||||||||||||||||||||||||
| Commercial business and other | 3,512 | - | 68 | 568 | 1,143 | |||||||||||||||||||||||||||||||||||
| Total | 5,779 | 786 | 1,143 | 2,348 | 17,143 | 5,392 | 964 | 5,779 | 786 | 1,143 | ||||||||||||||||||||||||||||||
| Total non-accrual loans | 21,030 | 22,817 | 31,890 | 48,362 | 89,204 | 16,253 | 15,710 | 21,030 | 22,817 | 31,890 | ||||||||||||||||||||||||||||||
| Total non-performing loans | 21,416 | 26,077 | 34,191 | 48,968 | 89,848 | 16,253 | 18,134 | 21,416 | 26,077 | 34,191 | ||||||||||||||||||||||||||||||
| Other non-performing assets: | ||||||||||||||||||||||||||||||||||||||||
| Real Estate Owned | 533 | 4,932 | 6,326 | 2,985 | 5,278 | - | - | 533 | 4,932 | 6,326 | ||||||||||||||||||||||||||||||
| Investment securities | - | - | - | 1,871 | 3,332 | |||||||||||||||||||||||||||||||||||
| Other assets acquired through foreclosure | 35 | - | - | - | - | |||||||||||||||||||||||||||||||||||
| Total | 533 | 4,932 | 6,326 | 4,856 | 8,610 | 35 | - | 533 | 4,932 | 6,326 | ||||||||||||||||||||||||||||||
| Total non-performing assets | $ | 21,949 | $ | 31,009 | $ | 40,517 | $ | 53,824 | $ | 98,458 | $ | 16,288 | $ | 18,134 | $ | 21,949 | $ | 31,009 | $ | 40,517 | ||||||||||||||||||||
| Non-performing loans to gross loans | 0.44 | % | 0.60 | % | 0.90 | % | 1.43 | % | 2.79 | % | 0.29 | % | 0.35 | % | 0.44 | % | 0.60 | % | 0.90 | % | ||||||||||||||||||||
| Non-performing assets to total assets | 0.36 | % | 0.54 | % | 0.80 | % | 1.14 | % | 2.21 | % | 0.24 | % | 0.29 | % | 0.36 | % | 0.54 | % | 0.80 | % | ||||||||||||||||||||
| (1) | Not included in the above analysis are non-accrual TDR taxi medallion loans totaling $3.9 million and $5.9 million for the years ended December 31, 2018 and 2017, respectively. |
The following table shows our delinquent loans that are less than 90 days past due and still accruing interest at the periods indicated:
| December 31, 2016 | December 31, 2015 | December 31, 2018 | December 31, 2017 | |||||||||||||||||||||||||||||
| 60 - 89 | 30 - 59 | 60 - 89 | 30 - 59 | 60 - 89 | 30 - 59 | 60 - 89 | 30 - 59 | |||||||||||||||||||||||||
| days | days | days | days | days | days | days | days | |||||||||||||||||||||||||
| (In thousands) | (In thousands) | (In thousands) | ||||||||||||||||||||||||||||||
| Multi-family residential | $ | 287 | $ | 2,575 | $ | 804 | $ | 9,422 | $ | 339 | $ | 1,887 | $ | 279 | $ | 2,533 | ||||||||||||||||
| Commercial real estate | 22 | 3,363 | 153 | 2,820 | - | 379 | 2,197 | 1,680 | ||||||||||||||||||||||||
| One-to-four family - mixed-use property | 762 | 4,671 | 1,257 | 8,630 | 322 | 1,003 | 860 | 1,570 | ||||||||||||||||||||||||
| One-to-four family - residential | - | 3,831 | 154 | 4,261 | - | 1,564 | 680 | 1,921 | ||||||||||||||||||||||||
| Construction loans | - | - | - | - | ||||||||||||||||||||||||||||
| Construction | 730 | - | - | - | ||||||||||||||||||||||||||||
| Small Business Administration | - | 13 | - | 42 | 68 | 4 | - | - | ||||||||||||||||||||||||
| Commercial business and other | 1 | 22 | 2 | - | 281 | 2,076 | - | 2 | ||||||||||||||||||||||||
| Total | $ | 1,072 | $ | 14,475 | $ | 2,370 | $ | 25,175 | $ | 1,740 | $ | 6,913 | $ | 4,016 | $ | 7,706 | ||||||||||||||||
Other Real Estate Owned.We aggressively market our Other Real Estate Owned (“OREO”) properties. At December 31, 2018 and 2017, we did not own any OREO properties. At December 31, 2016, we owned one OREO propertiesproperty with a fair value of $0.5 million. At December 31, 2015, we owned four OREO properties with a combined fair value of $4.9 million. At December 31, 2014, we owned eight OREO properties with a combined fair value of $6.3 million.
We may obtain physical possession of residential real estate collateralizing a consumer mortgage loan via foreclosure asthrough an in-substance repossession. During the year ended December 31, 2016,2018, we foreclosed on one residential real estate property for $0.6 million. During the year ended December 31, 2017 we did not foreclose on any consumer mortgages through in-substance repossession. At December 31, 2016, 2015 and 2014, we heldWe did not hold any foreclosed residential real estate totaling $0.5 million, $0.1 millionat December 31, 2018 and $1.3 million, respectively.2017. Included within net loans as of December 31, 20162018 and 2017, was a recorded investment of $11.4$7.2 million and $10.5 million, respectively, of consumer mortgage loans secured by residential real estate properties for which formal foreclosure proceedings were in process according to local requirements of the applicable jurisdiction.
Environmental Concerns Relating to Loans. We currently obtain environmental reports in connection with the underwriting of commercial real estate loans, and typically obtain environmental reports in connection with the underwriting of multi-family loans. For all other loans, we obtain environmental reports only if the nature of the current or, to the extent known to us, prior use of the property securing the loan indicates a potential environmental risk. However, we may not be aware of such uses or risks in any particular case, and, accordingly, there is no assurance that real estate acquired by us in foreclosure is free from environmental contamination or that, if any such contamination or other violation exists, whether we will have any liability.
Classified Assets. Our policy is to review our assets, focusing primarily on the loan portfolio, OREO and the investment portfolios, to ensure that the credit quality is maintained at the highest levels. When weaknesses are identified, immediate action is taken to correct the problem through direct contact with the borrower or issuer. We then monitor these assets, and, in accordance with our policy and current regulatory guidelines, we designate them as “Special Mention,” which is considered a “Criticized Asset,” and “Substandard,” “Doubtful,” or “Loss” which are considered “Classified Assets,” as deemed necessary. These loan designations are updated quarterly. We designate an asset as Substandard when a well-defined weakness is identified that jeopardizes the orderly liquidation of the debt. We designate an asset as Doubtful when it displays the inherent weakness of a Substandard asset with the added provision that collection of the debt in full, on the basis of existing facts, is highly improbable. We designate an asset as Loss if it is deemed the debtor is incapable of repayment. We do not hold any loans designated as loss, as loans that are designated as Loss are charged to the Allowance for Loan Losses. Assets that are non-accrual are designated as Substandard, Doubtful or Loss. We designate an asset as Special Mention if the asset does not warrant designation within one of the other categories, but does contain a potential weakness that deserves closer attention. Our total Criticized and Classified assets were $72.6Assets totaled $53.0 million at December 31, 2016, an increase2018, a decrease of $17.8$9.7 million from $54.8$62.7 million at December 31, 2015. The increase in criticized and classified assets was primarily due to an increase in special mention and substandard taxi medallion loans and special mention commercial business and other loans.2017.
The following table sets forth the Bank's Criticized and Classified assets at December 31, 2016:2018:
| (In thousands) | Special Mention | Substandard | Doubtful | Loss | Total | |||||||||||||||
| Loans: | ||||||||||||||||||||
| Multi-family residential | $ | 7,133 | $ | 3,351 | $ | - | $ | - | $ | 10,484 | ||||||||||
| Commercial real estate | 2,941 | 4,489 | - | - | 7,430 | |||||||||||||||
| One-to-four family - mixed-use property | 4,197 | 7,009 | - | - | 11,206 | |||||||||||||||
| One-to-four family - residential | 1,205 | 9,399 | - | - | 10,604 | |||||||||||||||
| Construction loans | - | - | - | - | - | |||||||||||||||
| Small Business Administration | 540 | 436 | - | - | 976 | |||||||||||||||
| Taxi medallion | 2,715 | 16,228 | 54 | - | 18,997 | |||||||||||||||
| Commercial business and other | 9,924 | 2,493 | - | - | 12,417 | |||||||||||||||
| Total loans | 28,655 | 43,405 | 54 | - | 72,114 | |||||||||||||||
| Other Real Estate Owned | - | 533 | - | - | 533 | |||||||||||||||
| Total | $ | 28,655 | $ | 43,938 | $ | 54 | $ | - | $ | 72,647 | ||||||||||
| (In thousands) | Special Mention | Substandard | Doubtful | Loss | Total | |||||||||||||||
| Loans: | ||||||||||||||||||||
| Multi-family residential | $ | 2,498 | $ | 4,166 | $ | - | $ | - | $ | 6,664 | ||||||||||
| Commercial real estate | 381 | 4,051 | - | - | 4,432 | |||||||||||||||
| One-to-four family - mixed-use property | 1,199 | 2,034 | - | - | 3,233 | |||||||||||||||
| One-to-four family - residential | 557 | 6,665 | - | - | 7,222 | |||||||||||||||
| Construction | 730 | - | - | - | 730 | |||||||||||||||
| Small Business Administration | 481 | 139 | - | - | 620 | |||||||||||||||
| Taxi medallion | - | 4,539 | - | - | 4,539 | |||||||||||||||
| Commercial business and other | 730 | 21,348 | 3,512 | - | 25,590 | |||||||||||||||
| Total | $ | 6,576 | $ | 42,942 | $ | 3,512 | $ | - | $ | 53,030 | ||||||||||
The following table sets forth the Bank's Criticized and Classified assets at December 31, 2015:2017:
| (In thousands) | Special Mention | Substandard | Doubtful | Loss | Total | Special Mention | Substandard | Doubtful | Loss | Total | ||||||||||||||||||||||||||||||
| Loans: | ||||||||||||||||||||||||||||||||||||||||
| Multi-family residential | $ | 4,361 | $ | 5,421 | $ | - | $ | - | $ | 9,782 | $ | 6,389 | $ | 4,793 | $ | - | $ | - | $ | 11,182 | ||||||||||||||||||||
| Commercial real estate | 1,821 | 3,812 | - | - | 5,633 | 2,020 | 8,871 | - | - | 10,891 | ||||||||||||||||||||||||||||||
| One-to-four family - mixed-use property | 3,087 | 10,990 | - | - | 14,077 | 2,835 | 3,691 | - | - | 6,526 | ||||||||||||||||||||||||||||||
| One-to-four family - residential | 1,437 | 12,255 | - | - | 13,692 | 2,076 | 9,115 | - | - | 11,191 | ||||||||||||||||||||||||||||||
| Construction loans | - | 1,000 | - | - | 1,000 | |||||||||||||||||||||||||||||||||||
| Small Business Administration | 229 | 224 | - | - | 453 | 548 | 108 | - | - | 656 | ||||||||||||||||||||||||||||||
| Taxi medallion | - | 2,118 | - | - | 2,118 | - | 6,834 | - | - | 6,834 | ||||||||||||||||||||||||||||||
| Commercial business and other | - | 3,123 | - | - | 3,123 | 14,859 | 545 | - | - | 15,404 | ||||||||||||||||||||||||||||||
| Total loans | 10,935 | 38,943 | - | - | 49,878 | |||||||||||||||||||||||||||||||||||
| Other Real Estate Owned | - | 4,932 | - | - | 4,932 | |||||||||||||||||||||||||||||||||||
| Total | $ | 10,935 | $ | 43,875 | $ | - | $ | - | $ | 54,810 | $ | 28,727 | $ | 33,957 | $ | - | $ | - | $ | 62,684 | ||||||||||||||||||||
On a quarterly basis all mortgage loans that are classified as Substandard or Doubtful are internally reviewed for impairment, based on updated cash flows for income producing properties, or updated independent appraisals. The loan balances of collateral dependent loans reviewed for impairment are then compared to the loans updated fair value. We consider fair value of collateral dependent loans to be 85% of the appraised or internally estimated value of the property, except for taxi medallion loans. The fair value of the underlying collateral of taxi medallion loans is the most recent reported arm’s length transaction. The balance which exceeds fair value is generally charged-off against the allowance for loan losses. At December 31, 2016, the current loan-to-value ratio on our collateral dependent loans reviewed for impairment was 48.15%.
We have established and maintain on our books an allowance for loan losses (“ALL”) that is designed to provide a reserve against estimated losses inherent in our overall loan portfolio. The allowance is established through a provision for loan losses based on management’s evaluation of the risk inherent in the various components of the loan portfolio and other factors, including historical loan loss experience (which is updated quarterly), current economic conditions, delinquency and non-accrual trends, classified loan levels, risk in the portfolio and volumes and trends in loan types, recent trends in charge-offs, changes in underwriting standards, experience, ability and depth of our lenders, collection policies and experience, internal loan review function and other external factors. Additionally,
In prior years we segregated our loans into two portfolios based on year of origination. One portfolio iswas reviewed for loans originated after December 31, 2009 and thea second portfolio for loans originated prior to January 1, 2010. Our decision to segregate the portfolio based upon origination datesThat segregation was based on changes made in our underwriting standards during 2009. ByFor the end2018 ALL calculation, however, we decided to no longer segregate loans by origination year and to collapse the two portfolios. Management based this decision on the age of 2009, all loans were being underwritten based on revisedthe older portfolio which represented approximately 11% of the total loan portfolio and tightened underwriting standards. Loans originated priorin which most losses have already been identified and incurred. In connection with this change in methodology we also combined the economic factors used to 2010calculate the qualitative component of the ALL. The combined impact of these changes in methodology reduced the ALL by approximately $0.2 million from what would have a higher delinquency ratebeen recorded if we had not changed our methodology. Additionally, during 2018 we updated our methodology by expanding the look-back period of historical losses used in the calculation of the quantitative component of the allowance from three years to five years and incorporated recoveries into our loss history. EachThe increase in the look-back period from three years to five years allows for more observation points and better reflects the likelihood of losses inherent in the loan portfolio, as it is more reflective of the yearscurrent economic environment. We believe the addition of recoveries net of historical losses used in the portfolio for loans originated prior to 2010 has a similar delinquency rate. look-back period is consistent with industry best practice. The impact of these change resulted in an increase of $0.6 million in the ALL at December 31, 2018.
| 16 |
The determination of the amount of the allowance for loan lossesALL includes estimates that are susceptible to significant changes due to changes in appraisal values of collateral, national and local economic conditions and other factors. We review our loan portfolio by separate categories with similar risk and collateral characteristics. Impaired loans are segregated and reviewed separately. All non-accrual loans are classified impaired. Impaired loans secured by collateral are reviewed based on the fair value of their collateral. For non-collateralized impaired loans, management estimates any recoveries that are anticipated for each loan. In connection with the determination of the allowance, the market value of collateral ordinarily is evaluated by our staff appraiser. On a quarterly basis, the estimated values of impaired mortgage loans are internally reviewed, based on updated cash flows for income producing properties, and at times an updated independent appraisal is obtained. The loan balances of collateral dependent impaired loans are then compared to the property’s updated fair value. We consider fair value of collateral dependent loans to be 85% of the appraised or internally estimated value of the property. The 85% is based on the actual net proceeds the Bank has received from the sale of OREO as a percentage of OREO’s appraised value. The fair value of the underlying collateral of taxi medallion loans is the value of the underlying medallion based upon the most recently reported arm’s length sales transaction. When there is no recent sale activity, the fair value is calculated using capitalization rates. In addition,All taxi medallion loans with a loan-to-value greater than 100% are classified as impaired at December 31, 2018. For collateral dependent mortgage loans and allocated ataxi medallion loans, the portion of the reserve in the amount of the excess of the loan-to-value over the loan’s principal balance. Theloan balance which exceeds fair value is generally charged-off, except for taxi medallion loans. The 85% is based on the actual net proceeds the Bank has received from the sale of OREO as a percentage of OREO’s appraised value.charged-off. When evaluating a loan for impairment, we do not rely on guarantees, and the amount of impairment, if any, is based on the fair value of the collateral. We do not carry loans at a value in excess of the fair value due to a guarantee from the borrower. Impaired mortgage loans that were written down resulted from quarterly reviews or updated appraisals that indicated the properties’ estimated value had declined from when the loan was originated. TheOur Board of Directors reviews and approves the adequacy of the allowance for loan lossesALL on a quarterly basis.
In assessing the adequacy of the allowance, we review our loan portfolio by separate categories which have similar risk and collateral characteristics, e.g., multi-family residential, commercial real estate, one-to-four family mixed-use property, one-to-four family residential, co-operative apartment, construction, SBA, commercial business, taxi medallion and consumer loans. General provisions are established against performing loans in our portfolio in amounts deemed prudent based on our qualitative analysis of the factors, including the historical loss experience, delinquency trends and local economic conditions. Non-performing loans totaled $21.4$16.3 million and $26.1$18.1 million at December 31, 20162018 and 2015,2017, respectively. The Bank’s underwriting standards generally require a loan-to-value ratio of no more than 75% at the time the loan is originated. At December 31, 2016,2018, the outstanding principal balance of our impaired mortgagenon-performing loans was approximately 39%34.9% of the estimated current value of the supporting collateral, after considering the charge-offs that have been recorded. We incurred total net recoveries (charge-offs) of $0.7 million$19,000 and ($2.6)net charge-offs of $11.7 million during the years ended December 31, 20162018 and 2015,2017, respectively. The improvement in non-performing loans allowed usFor the year ended December 31, 2018, we recorded a provision for loan losses totaling $0.6 million compared to not record a$9.9 million provision recorded for the year ended December 31, 20162017 and record a benefit innone for the year ended December 31, 2016. The charge-offs and provision for loan losses of $1.0 million and $6.0 million forrecorded in the yearsyear ended December 31, 2015 and 2014, respectively.2017, were primarily the result of a reduction in the fair value of the underlying collateral of our taxi medallion portfolio. Management has concluded, and the Board of Directors has concurred, that at December 31, 2016,2018, the allowance was sufficient to absorb losses inherent in our loan portfolio.
Our determination as to the classification of our assets and the amount of our valuation allowance is subject to review by our regulators, which can require the establishment of additional general allowances or specific loss allowances or require charge-offs. Such authorities may require us to make additional provisions to the allowance based on their judgments about information available to them at the time of their examination. A policy statement provides guidance for examiners in determining whether the levels of general valuation allowances for banking institutions are adequate. The policy statement requires that if a bank’s general valuation allowance policies and procedures are deemed to be inadequate, recommendations for correcting deficiencies, including any examiner concerns regarding the level of the allowance, should be noted in the report of examination. Additional supervisory action may also be taken based on the magnitude of the observed shortcomings in the allowance process, including the materiality of any error in the reported amount of the allowance.
During the year ended December 31, 2106,2018, the portion of the ALL related to the loss history declined. Charge-offs recordeddecreased slightly, primarily due to the addition of recoveries in the past twelve quarters have decreased as credit conditions have improved. The percentage of loans originated prior to 2009, compared to the total loan portfolio, is decreasing as scheduled amortization and repayments have occurred. These reductions in the ALL werecalculation, partially offset by an additional allocation to our taxi medallion portfolio coupled with an increase in the outstandinglook-back period and growth in the loan balances. Management believes that our current allowance forportfolio. During 2018, the portion of the ALL related to qualitative factors increased primarily due to growth in the loan losses is adequateportfolio. The impact from the above resulted in lightthe ALL totaling $20.9 million, an increase of current economic conditions,$0.6 million, or 2.9% from December 31, 2017. Based upon management consistently applying the compositionALL methodology and review of ourthe loan portfolio, management concluded a charge to earnings was warranted to maintain the level and typebalance of delinquent loans, our level of classified loans, charge-offs recorded and other available information and the Board of Directors concurs in this belief. AtALL at the appropriate level. The ALL at December 31, 2016, the total allowance for loan losses was $22.2 million, representing 103.80%2018, represented 0.38% of gross loans outstanding as compared to 0.39% of gross loans outstanding at December 31, 2017. The ALL represented 128.9% of non-performing loans and 101.28% of non-performing assets, compared to 82.58% of non-performing loans and 69.45% of non-performing assets at December 31, 2015. We continue2018 compared to monitor and, as necessary, modify the level of our allowance for loan losses in order to maintain the allowance112.2% at a level which we consider adequate to provide for probable loan losses based on available information.December 31, 2017.
Many factors may require additions to the allowance for loan lossesALL in future periods beyond those currently revealed. These factors include further adverse changes in economic conditions, changes in interest rates and changes in the financial capacity of individual borrowers (any of which may affect the ability of borrowers to make repayments on loans), changes in the real estate market within our lending area and the value of collateral, or a review and evaluation of our loan portfolio in the future. The determination of the amount of the allowance for loan lossesALL includes estimates that are susceptible to significant changes due to changes in appraised values of collateral, national and local economic conditions, interest rates and other factors. In addition, our overall level of credit risk inherent in our loan portfolio can be affected by the loan portfolio’s composition. At December 31, 2016,2018, multi-family residential, commercial real estate, construction and one-to-four family mixed-use property mortgage loans, totaled 82.9%80.2% of our gross loans. The greater risk associated with these loans, as well as commercial business loans, could require us to increase our provisions for loan losses and to maintain an allowance for loan lossesALL as a percentage of total loans that is in excess of the allowance we currently maintain. Provisions for loan losses are charged against net income. See “—Lending Activities” and “—Asset Quality.”
The following table sets forth changes in, and the balance of, our allowance for loan losses.ALL.
| At and for the years ended December 31, | At and for the years ended December 31, | |||||||||||||||||||||||||||||||||||||||
| (Dollars in thousands) | 2016 | 2015 | 2014 | 2013 | 2012 | 2018 | 2017 | 2016 | 2015 | 2014 | ||||||||||||||||||||||||||||||
| Balance at beginning of year | $ | 21,535 | $ | 25,096 | $ | 31,776 | $ | 31,104 | $ | 30,344 | $ | 20,351 | $ | 22,229 | $ | 21,535 | $ | 25,096 | $ | 31,776 | ||||||||||||||||||||
| Provision (benefit) for loan losses | - | (956 | ) | (6,021 | ) | 13,935 | 21,000 | 575 | 9,861 | - | (956 | ) | (6,021 | ) | ||||||||||||||||||||||||||
| Loans charged-off: | ||||||||||||||||||||||||||||||||||||||||
| Multi-family residential | (161 | ) | (474 | ) | (1,161 | ) | (3,585 | ) | (6,016 | ) | (99 | ) | (454 | ) | (161 | ) | (474 | ) | (1,161 | ) | ||||||||||||||||||||
| Commercial real estate | - | (32 | ) | (325 | ) | (1,051 | ) | (2,746 | ) | - | (4 | ) | - | (32 | ) | (325 | ) | |||||||||||||||||||||||
| One-to-four family mixed-use property | (144 | ) | (592 | ) | (423 | ) | (4,206 | ) | (4,286 | ) | (3 | ) | (39 | ) | (144 | ) | (592 | ) | (423 | ) | ||||||||||||||||||||
| One-to-four family residential | (114 | ) | (342 | ) | (103 | ) | (701 | ) | (1,583 | ) | (1 | ) | (415 | ) | (114 | ) | (342 | ) | (103 | ) | ||||||||||||||||||||
| Co-operative apartment | - | - | - | (108 | ) | (62 | ) | |||||||||||||||||||||||||||||||||
| Construction | - | - | - | (2,678 | ) | (4,591 | ) | |||||||||||||||||||||||||||||||||
| SBA | (529 | ) | (34 | ) | (49 | ) | (457 | ) | (324 | ) | (392 | ) | (212 | ) | (529 | ) | (34 | ) | (49 | ) | ||||||||||||||||||||
| Taxi Medallion | (142 | ) | - | - | - | - | ||||||||||||||||||||||||||||||||||
| Taxi medallion | (393 | ) | (11,283 | ) | (142 | ) | - | - | ||||||||||||||||||||||||||||||||
| Commercial business and other loans | (69 | ) | (2,371 | ) | (381 | ) | (2,057 | ) | (1,661 | ) | (44 | ) | (65 | ) | (69 | ) | (2,371 | ) | (381 | ) | ||||||||||||||||||||
| Total loans charged-off | (1,159 | ) | (3,845 | ) | (2,442 | ) | (14,843 | ) | (21,269 | ) | (932 | ) | (12,472 | ) | (1,159 | ) | (3,845 | ) | (2,442 | ) | ||||||||||||||||||||
| Recoveries: | ||||||||||||||||||||||||||||||||||||||||
| Mortgage loans | 1,493 | 888 | 1,515 | 1,407 | 838 | 711 | 595 | 1,493 | 888 | 1,515 | ||||||||||||||||||||||||||||||
| SBA, commercial business and other loans | 360 | 352 | 268 | 173 | 191 | 97 | 138 | 360 | 352 | 268 | ||||||||||||||||||||||||||||||
| Taxi medallion | 143 | - | - | - | - | |||||||||||||||||||||||||||||||||||
| Total recoveries | 1,853 | 1,240 | 1,783 | 1,580 | 1,029 | 951 | 733 | 1,853 | 1,240 | 1,783 | ||||||||||||||||||||||||||||||
| Net recoveries (charge-offs) | 694 | (2,605 | ) | (659 | ) | (13,263 | ) | (20,240 | ) | |||||||||||||||||||||||||||||||
| Net (charge-offs) recoveries | 19 | (11,739 | ) | 694 | (2,605 | ) | (659 | ) | ||||||||||||||||||||||||||||||||
| Balance at end of year | $ | 22,229 | $ | 21,535 | $ | 25,096 | $ | 31,776 | $ | 31,104 | $ | 20,945 | $ | 20,351 | $ | 22,229 | $ | 21,535 | $ | 25,096 | ||||||||||||||||||||
| Ratio of net (recoveries) charge-offs during the year | ||||||||||||||||||||||||||||||||||||||||
| to average loans outstanding during the year | -0.02 | % | 0.06 | % | 0.02 | % | 0.41 | % | 0.64 | % | ||||||||||||||||||||||||||||||
| Ratio of allowance for loan losses to | ||||||||||||||||||||||||||||||||||||||||
| gross loans at end of the year | 0.46 | % | 0.49 | % | 0.66 | % | 0.93 | % | 0.97 | % | ||||||||||||||||||||||||||||||
| Ratio of allowance for loan losses to | ||||||||||||||||||||||||||||||||||||||||
| non-performing loans at the end of the year | 103.80 | % | 82.58 | % | 73.40 | % | 64.89 | % | 34.62 | % | ||||||||||||||||||||||||||||||
| Ratio of allowance for loan losses to | ||||||||||||||||||||||||||||||||||||||||
| non-performing assets at the end of the year | 101.28 | % | 69.45 | % | 61.94 | % | 59.04 | % | 31.59 | % | ||||||||||||||||||||||||||||||
| Ratio of net charge-offs (recoveries) during the year to average loans outstanding during the year | 0.00 | % | 0.24 | % | (0.02 | %) | 0.06 | % | 0.02 | % | ||||||||||||||||||||||||||||||
| Ratio of allowance for loan losses to gross loans at end of the year | 0.38 | % | 0.39 | % | 0.46 | % | 0.49 | % | 0.66 | % | ||||||||||||||||||||||||||||||
| Ratio of allowance for loan losses to non-performing loans at the end of the year | 128.87 | % | 112.23 | % | 103.80 | % | 82.58 | % | 73.40 | % | ||||||||||||||||||||||||||||||
| Ratio of allowance for loan losses to non-performing assets at the end of the year | 128.60 | % | 112.23 | % | 101.28 | % | 69.45 | % | 61.94 | % | ||||||||||||||||||||||||||||||
The following table sets forth our allocation of the allowance for loan lossesALL to the total amount of loans in each of the categories listed at the dates indicated. The numbers contained in the “Amount” column indicate the allowance for loan lossesALL allocated for each particular loan category. The numbers contained in the column entitled “Percentage of Loans in Category to Total Loans” indicate the total amount of loans in each particular category as a percentage of our loan portfolio.
| At December 31, | ||||||||||||||||||||||||||||||||||||||||
| 2016 | 2015 | 2014 | 2013 | 2012 | ||||||||||||||||||||||||||||||||||||
| Percent | Percent | Percent | Percent | Percent | ||||||||||||||||||||||||||||||||||||
| of Loans in | of Loans in | of Loans in | of Loans in | of Loans in | ||||||||||||||||||||||||||||||||||||
| Category to | Category to | Category to | Category to | Category to | ||||||||||||||||||||||||||||||||||||
| Loan Category | Amount | Total loans | Amount | Total loans | Amount | Total loans | Amount | Total loans | Amount | Total loans | ||||||||||||||||||||||||||||||
| (Dollars in thousands) | ||||||||||||||||||||||||||||||||||||||||
| Mortgage loans: | ||||||||||||||||||||||||||||||||||||||||
| Multi-family residential | $ | 5,923 | 45.21 | % | $ | 6,718 | 46.98 | % | $ | 8,827 | 50.64 | % | $ | 12,084 | 50.02 | % | $ | 13,001 | 47.62 | % | ||||||||||||||||||||
| Commercial real estate | 4,487 | 25.86 | 4,239 | 22.90 | 4,202 | 16.36 | 4,959 | 14.97 | 5,705 | 16.00 | ||||||||||||||||||||||||||||||
| One-to-four family | ||||||||||||||||||||||||||||||||||||||||
| mixed-use property | 2,903 | 11.59 | 4,227 | 13.11 | 5,840 | 15.10 | 6,328 | 17.40 | 5,960 | 19.79 | ||||||||||||||||||||||||||||||
| One-to-four family | ||||||||||||||||||||||||||||||||||||||||
| residential | 1,015 | 3.85 | 1,227 | 4.30 | 1,690 | 4.94 | 2,079 | 5.66 | 1,999 | 6.18 | ||||||||||||||||||||||||||||||
| Co-operative apartment | - | 0.15 | - | 0.19 | - | 0.26 | 104 | 0.30 | 46 | 0.20 | ||||||||||||||||||||||||||||||
| Construction | 92 | 0.24 | 50 | 0.17 | 42 | 0.14 | 444 | 0.12 | 66 | 0.45 | ||||||||||||||||||||||||||||||
| Gross mortgage loans | 14,420 | 86.90 | 16,461 | 87.65 | 20,601 | 87.44 | 25,998 | 88.47 | 26,777 | 90.24 | ||||||||||||||||||||||||||||||
| Non-mortgage loans: | ||||||||||||||||||||||||||||||||||||||||
| Small Business Administration | 481 | 0.32 | 262 | 0.28 | 279 | 0.19 | 458 | 0.23 | 505 | 0.29 | ||||||||||||||||||||||||||||||
| Taxi Medallion | 2,243 | 0.39 | 343 | 0.48 | 11 | 0.59 | - | 0.38 | 7 | 0.31 | ||||||||||||||||||||||||||||||
| Commercial business and other | 4,492 | 12.39 | 4,469 | 11.59 | 4,205 | 11.78 | 5,320 | 10.92 | 3,815 | 9.16 | ||||||||||||||||||||||||||||||
| Gross non-mortgage loans | 7,216 | 13.10 | 5,074 | 12.35 | 4,495 | 12.56 | 5,778 | 11.53 | 4,327 | 9.76 | ||||||||||||||||||||||||||||||
| Unallocated | 593 | - | - | - | - | - | - | - | - | - | ||||||||||||||||||||||||||||||
| Total loans | $ | 22,229 | 100.00 | % | $ | 21,535 | 100.00 | % | $ | 25,096 | 100.00 | % | $ | 31,776 | 100.00 | % | $ | 31,104 | 100.00 | % | ||||||||||||||||||||
| At December 31, | ||||||||||||||||||||||||||||||||||||||||
| 2018 | 2017 | 2016 | 2015 | 2014 | ||||||||||||||||||||||||||||||||||||
| Percent | Percent | Percent | Percent | Percent | ||||||||||||||||||||||||||||||||||||
| of Loans in | of Loans in | of Loans in | of Loans in | of Loans in | ||||||||||||||||||||||||||||||||||||
| Category to | Category to | Category to | Category to | Category to | ||||||||||||||||||||||||||||||||||||
| Loan Category | Amount | Total loans | Amount | Total loans | Amount | Total loans | Amount | Total loans | Amount | Total loans | ||||||||||||||||||||||||||||||
| (Dollars in thousands) | ||||||||||||||||||||||||||||||||||||||||
| Mortgage loans: | ||||||||||||||||||||||||||||||||||||||||
| Multi-family residential | $ | 5,676 | 41.00 | % | $ | 5,823 | 44.08 | % | $ | 5,923 | 45.21 | % | $ | 6,718 | 46.98 | % | $ | 8,827 | 50.64 | % | ||||||||||||||||||||
| Commercial real estate | 4,315 | 27.86 | 4,643 | 26.51 | 4,487 | 25.86 | 4,239 | 22.90 | 4,202 | 16.36 | ||||||||||||||||||||||||||||||
| One-to-four family mixed-use property | 1,867 | 10.44 | 2,545 | 10.93 | 2,903 | 11.59 | 4,227 | 13.11 | 5,840 | 15.10 | ||||||||||||||||||||||||||||||
| One-to-four family residential | 749 | 3.44 | 1,082 | 3.50 | 1,015 | 3.85 | 1,227 | 4.30 | 1,690 | 4.94 | ||||||||||||||||||||||||||||||
| Co-operative apartment | - | 0.15 | - | 0.13 | - | 0.15 | - | 0.19 | - | 0.26 | ||||||||||||||||||||||||||||||
| Construction | 329 | 0.91 | 68 | 0.16 | 92 | 0.24 | 50 | 0.17 | 42 | 0.14 | ||||||||||||||||||||||||||||||
| Gross mortgage loans | 12,936 | 83.80 | 14,161 | 85.31 | 14,420 | 86.90 | 16,461 | 87.65 | 20,601 | 87.44 | ||||||||||||||||||||||||||||||
| Non-mortgage loans: | ||||||||||||||||||||||||||||||||||||||||
| Small Business Administration | 418 | 0.27 | 669 | 0.36 | 481 | 0.32 | 262 | 0.28 | 279 | 0.19 | ||||||||||||||||||||||||||||||
| Taxi medallion | - | 0.08 | - | 0.13 | 2,243 | 0.39 | 343 | 0.48 | 11 | 0.59 | ||||||||||||||||||||||||||||||
| Commercial business and other | 7,591 | 15.85 | 5,521 | 14.20 | 4,492 | 12.39 | 4,469 | 11.59 | 4,205 | 11.78 | ||||||||||||||||||||||||||||||
| Gross non-mortgage loans | 8,009 | 16.20 | 6,190 | 14.69 | 7,216 | 13.10 | 5,074 | 12.35 | 4,495 | 12.56 | ||||||||||||||||||||||||||||||
| Unallocated | - | - | - | - | 593 | - | - | - | - | - | ||||||||||||||||||||||||||||||
| Total loans | $ | 20,945 | 100.00 | % | $ | 20,351 | 100.00 | % | $ | 22,229 | 100.00 | % | $ | 21,535 | 100.00 | % | $ | 25,096 | 100.00 | % | ||||||||||||||||||||
General. Our investment policy, which is approved by the Board of Directors, is designed primarily to manage the interest rate sensitivity of our overall assets and liabilities, to generate a favorable return without incurring undue interest rate and credit risk, to complement our lending activities and to provide and maintain liquidity. In establishing our investment strategies, we consider our business and growth strategies, the economic environment, our interest rate risk exposure, our interest rate sensitivity “gap” position, the types of securities to be held, and other factors. See “Management’s Discussion and Analysis of Financial Condition and Results of Operations — Overview—Management Strategy” in Item 7 of this Annual Report.
Although we have authority to invest in various types of assets, we primarily invest in mortgage-backed securities, securities issued by mutual or bond funds that invest in government and government agency securities, municipal bonds, corporate bonds and collateralized loan obligations (“CLO”). We did not hold any issues of foreign sovereign debt at December 31, 20162018 and 2015.2017.
Our Investment Committee meets quarterly to monitor investment transactions and to establish investment strategy. The Board of Directors reviews the investment policy on an annual basis and investment activity on a monthly basis.
We classify our investment securities as available for sale when management intends to hold the securities for an indefinite period of time or when the securities may be utilized for tactical asset/liability purposes and may be sold from time to time to effectively manage interest rate exposure and resultant prepayment risk and liquidity needs. Securities are classified as held-to-maturity when management intends to hold the securities until maturity. We carry some of our investments under the fair value option.option, totaling $13.8 million at December 31, 2018. Unrealized gains and losses for investments carried under the fair value option are included in our Consolidated Statements of Income. Unrealized gains and losses on securities available for sale, other than unrealized credit losses considered other than temporary, are excluded from earnings and included in accumulated other comprehensive loss (a separate component of equity), net of taxes. Securities held-to-maturity are carried at their cost basis. At December 31, 2016,2018, we had $861.4$822.7 million in securities available for sale and $37.7$32.0 million in securities held-to-maturity, which together represented 14.83%12.51% of total assets. These securities had an aggregate market value at December 31, 20162018 that was approximately 1.71.5 times the amount of our equity at that date.
There were no credit related OTTIother-than-temporary impairment charges recorded during the years ended December 31, 2016, 20152018, 2017 and 2014.2016. As a result of the magnitude of our holdings of securities available for sale, changes in interest rates could produce significant changes in the value of such securities and could produce significant fluctuations in our operating results and equity. (See Notes 6 and 18 of Notes to Consolidated Financial Statements, included in Item 8 of this Annual Report.)
The table below sets forth certain information regarding the amortized cost and market values of our securities portfolio, interest-earning deposits and federal funds sold, at the dates indicated. Securities available for sale are recorded at market value. (See Notes 6 and 18 of Notes to Consolidated Financial Statements, included in Item 8 of this Annual Report.)
| At December 31, | At December 31, | |||||||||||||||||||||||||||||||||||||||||||||||
| 2016 | 2015 | 2014 | 2018 | 2017 | 2016 | |||||||||||||||||||||||||||||||||||||||||||
| Amortized | Fair | Amortized | Fair | Amortized | Fair | Amortized | Fair | Amortized | Fair | Amortized | Fair | |||||||||||||||||||||||||||||||||||||
| Cost | Value | Cost | Value | Cost | Value | Cost | Value | Cost | Value | Cost | Value | |||||||||||||||||||||||||||||||||||||
| (In thousands) | (In thousands) | |||||||||||||||||||||||||||||||||||||||||||||||
| Securities held-to-maturity | ||||||||||||||||||||||||||||||||||||||||||||||||
| Bonds and other debt securities: | ||||||||||||||||||||||||||||||||||||||||||||||||
| Municipal securities | $ | 37,735 | $ | 35,408 | $ | 6,180 | $ | 6,180 | $ | - | $ | - | $ | 24,065 | $ | 22,508 | $ | 22,913 | $ | 21,889 | $ | 37,735 | $ | 35,408 | ||||||||||||||||||||||||
| Total bonds and other debt securities | 37,735 | 35,408 | 6,180 | 6,180 | - | - | 24,065 | 22,508 | 22,913 | 21,889 | 37,735 | 35,408 | ||||||||||||||||||||||||||||||||||||
| Mortgage-backed securities: | ||||||||||||||||||||||||||||||||||||||||||||||||
| FNMA | 7,953 | 7,366 | 7,973 | 7,810 | - | - | ||||||||||||||||||||||||||||||||||||||||||
| Total mortgage-backed securities | 7,953 | 7,366 | 7,973 | 7,810 | - | - | ||||||||||||||||||||||||||||||||||||||||||
| Total securities held-to-maturity | 32,018 | 29,874 | 30,886 | 29,699 | 37,735 | 35,408 | ||||||||||||||||||||||||||||||||||||||||||
| Securities available for sale | ||||||||||||||||||||||||||||||||||||||||||||||||
| Bonds and other debt securities: | ||||||||||||||||||||||||||||||||||||||||||||||||
| Municipal securities | 124,984 | 126,903 | 127,696 | 131,583 | 145,864 | 148,896 | 46,231 | 46,574 | 101,680 | 103,199 | 124,984 | 126,903 | ||||||||||||||||||||||||||||||||||||
| Corporate debentures | 110,000 | 102,910 | 115,976 | 111,674 | 90,719 | 91,273 | 130,000 | 118,535 | 110,000 | 102,767 | 110,000 | 102,910 | ||||||||||||||||||||||||||||||||||||
| Collateralized loan obligations | 85,470 | 86,365 | 53,225 | 52,898 | - | - | 88,396 | 86,751 | 10,000 | 10,053 | 85,470 | 86,365 | ||||||||||||||||||||||||||||||||||||
| Total bonds and other debt securities | 320,454 | 316,178 | 296,897 | 296,155 | 236,583 | 240,169 | 264,627 | 251,860 | 221,680 | 216,019 | 320,454 | 316,178 | ||||||||||||||||||||||||||||||||||||
| Mutual funds | 21,366 | 21,366 | 21,290 | 21,290 | 21,118 | 21,118 | 11,586 | 11,586 | 11,575 | 11,575 | 21,366 | 21,366 | ||||||||||||||||||||||||||||||||||||
| Equity securities: | ||||||||||||||||||||||||||||||||||||||||||||||||
| Common stock | 1,019 | 1,019 | 871 | 871 | 864 | 864 | 1,256 | 1,256 | 1,110 | 1,110 | 1,019 | 1,019 | ||||||||||||||||||||||||||||||||||||
| Preferred stock | 6,344 | 6,342 | 6,343 | 6,341 | 6,234 | 6,226 | - | - | - | - | 6,344 | 6,342 | ||||||||||||||||||||||||||||||||||||
| Total equity securities | 7,363 | 7,361 | 7,214 | 7,212 | 7,098 | 7,090 | 1,256 | 1,256 | 1,110 | 1,110 | 7,363 | 7,361 | ||||||||||||||||||||||||||||||||||||
| Mortgage-backed securities: | ||||||||||||||||||||||||||||||||||||||||||||||||
| REMIC and CMO | 402,636 | 401,370 | 469,987 | 469,936 | 504,207 | 505,768 | 382,632 | 376,340 | 328,668 | 325,302 | 402,636 | 401,370 | ||||||||||||||||||||||||||||||||||||
| GNMA | 1,319 | 1,427 | 11,635 | 11,798 | 13,862 | 14,159 | 785 | 826 | 1,016 | 1,088 | 1,319 | 1,427 | ||||||||||||||||||||||||||||||||||||
| FNMA | 109,493 | 108,351 | 170,327 | 170,057 | 169,956 | 170,367 | 94,069 | 91,693 | 136,198 | 135,474 | 109,493 | 108,351 | ||||||||||||||||||||||||||||||||||||
| FHLMC | 5,378 | 5,328 | 16,961 | 16,949 | 14,505 | 14,639 | 90,377 | 89,094 | 48,103 | 47,786 | 5,378 | 5,328 | ||||||||||||||||||||||||||||||||||||
| Total mortgage-backed securities | 518,826 | 516,476 | 668,910 | 668,740 | 702,530 | 704,933 | 567,863 | 557,953 | 513,985 | 509,650 | 518,826 | 516,476 | ||||||||||||||||||||||||||||||||||||
| Total securities available for sale | 868,009 | 861,381 | 994,311 | 993,397 | 967,329 | 973,310 | 845,332 | 822,655 | 748,350 | 738,354 | 868,009 | 861,381 | ||||||||||||||||||||||||||||||||||||
| Interest-earning deposits and | ||||||||||||||||||||||||||||||||||||||||||||||||
| Federal funds sold | 25,771 | 25,771 | 32,825 | 32,825 | 22,977 | 22,977 | ||||||||||||||||||||||||||||||||||||||||||
| Interest-earning deposits and Federal funds sold | 105,761 | 105,761 | 39,362 | 39,362 | 25,771 | 25,771 | ||||||||||||||||||||||||||||||||||||||||||
| Total | $ | 931,515 | $ | 922,560 | $ | 1,033,316 | $ | 1,032,402 | $ | 990,306 | $ | 996,287 | $ | 983,111 | $ | 958,290 | $ | 818,598 | $ | 807,415 | $ | 931,515 | $ | 922,560 | ||||||||||||||||||||||||
Mortgage-backed securities. At December 31, 2016,2018, we had $516.5 million invested inavailable for sale and held-to-maturity mortgage-backed securities with a market value totaling $565.3 million, of which $2.8$1.9 million was invested in adjustable-rate mortgage-backed securities. The mortgage loans underlying these adjustable-rate securities generally are subject to limitations on annual and lifetime interest rate increases. We anticipate that investments in mortgage-backed securities may continue to be used in the future to supplement mortgage-lending activities. Mortgage-backed securities are more liquid than individual mortgage loans and may be used more easily to collateralize our obligations, including collateralizing of the governmental deposits of the Bank.
The following table sets forth our available for sale mortgage-backed securities purchases, sales and principal repayments for the years indicated:
| For the years ended December 31, | ||||||||||||
| 2016 | 2015 | 2014 | ||||||||||
| (In thousands) | ||||||||||||
| Balance at beginning of year | $ | 668,740 | $ | 704,933 | $ | 756,156 | ||||||
| Purchases of mortgage-backed securities | 90,572 | 169,383 | 125,897 | |||||||||
| Amortization of unearned premium, net of | ||||||||||||
| accretion of unearned discount | (2,086 | ) | (2,747 | ) | (2,699 | ) | ||||||
| Net change in unrealized gains on mortgage-backed | ||||||||||||
| securities available for sale | (2,180 | ) | (2,573 | ) | 11,117 | |||||||
| Net realized gains (losses) recorded on mortgage-backed | ||||||||||||
| securities carried at fair value | (33 | ) | 77 | 84 | ||||||||
| Net change in interest due on securities carried at fair value | - | (6 | ) | (8 | ) | |||||||
| Sales of mortgage-backed securities | (126,045 | ) | (103,100 | ) | (85,021 | ) | ||||||
| Principal repayments received on | ||||||||||||
| mortgage-backed securities | (112,492 | ) | (97,227 | ) | (100,593 | ) | ||||||
| Net decrease in mortgage-backed securities | (152,264 | ) | (36,193 | ) | (51,223 | ) | ||||||
| Balance at end of year | $ | 516,476 | $ | 668,740 | $ | 704,933 | ||||||
| For the years ended December 31, | ||||||||||||
| 2018 | 2017 | 2016 | ||||||||||
| (In thousands) | ||||||||||||
| Balance at beginning of year | $ | 509,650 | $ | 516,476 | $ | 668,740 | ||||||
| Purchases of mortgage-backed securities | 196,405 | 151,692 | 90,572 | |||||||||
| Amortization of unearned premium, net of accretion of unearned discount | (1,419 | ) | (1,593 | ) | (2,086 | ) | ||||||
| Net change in unrealized losses on mortgage-backed securities available for sale | (5,575 | ) | (1,985 | ) | (2,180 | ) | ||||||
| Net realized losses recorded on mortgage-backed securities carried at fair value | (89 | ) | (25 | ) | (33 | ) | ||||||
| Sales of mortgage-backed securities | (67,047 | ) | (78,685 | ) | (126,045 | ) | ||||||
| Principal repayments received on mortgage-backed securities | (73,972 | ) | (76,230 | ) | (112,492 | ) | ||||||
| Net increase (decrease) in mortgage-backed securities | 48,303 | (6,826 | ) | (152,264 | ) | |||||||
| Balance at end of year | $ | 557,953 | $ | 509,650 | $ | 516,476 | ||||||
While mortgage-backed securities carry a reduced credit risk as compared to whole loans, such securities remain subject to the risk that a fluctuating interest rate environment, along with other factors such as the geographic distribution of the underlying mortgage loans, may alter the prepayment rate of such mortgage loans and so affect both the prepayment speed and value of such securities.
The table below sets forth certain information regarding the amortized cost, fair value, annualized weighted average yields and maturities of our investment in debt and equity securities and interest-earning deposits at December 31, 2016.2018. The stratification of balances is based on stated maturities. Assumptions for repayments and prepayments are not reflected for mortgage-backed securities. Securities available for sale are carried at their fair value in the consolidated financial statements and securities held-to-maturity are carried at their amortized cost.
| One year or Less | One to Five Years | Five to Ten Years | More than Ten Years | Total Securities | ||||||||||||||||||||||||||||||||||||||||||||||||||||||||||||||||||||||||||||||||||||||||||||
| Average | One year or Less | One to Five Years | Five to Ten Years | More than Ten Years | Total Securities | |||||||||||||||||||||||||||||||||||||||||||||||||||||||||||||||||||||||||||||||||||||||||||
| Weighted | Weighted | Weighted | Weighted | Remaining | Weighted | Average | ||||||||||||||||||||||||||||||||||||||||||||||||||||||||||||||||||||||||||||||||||||||||||
| Amortized | Average | Amortized | Average | Amortized | Average | Amortized | Average | Years to | Amortized | Fair | Average | Weighted | Weighted | Weighted | Weighted | Remaining | Weighted | |||||||||||||||||||||||||||||||||||||||||||||||||||||||||||||||||||||||||||||||
| Cost | Yield | Cost | Yield | Cost | Yield | Cost | Yield | Maturity | Cost | Value | Yield | Amortized | Average | Amortized | Average | Amortized | Average | Amortized | Average | Years to | Amortized | Fair | Average | |||||||||||||||||||||||||||||||||||||||||||||||||||||||||||||||||||||||||
| (Dollars in thousands) | Cost | Yield | Cost | Yield | Cost | Yield | Cost | Yield | Maturity | Cost | Value | Yield | ||||||||||||||||||||||||||||||||||||||||||||||||||||||||||||||||||||||||||||||||||||
| (Dollars in thousands) | ||||||||||||||||||||||||||||||||||||||||||||||||||||||||||||||||||||||||||||||||||||||||||||||||
| Securities held-to-maturity | ||||||||||||||||||||||||||||||||||||||||||||||||||||||||||||||||||||||||||||||||||||||||||||||||
| Bonds and other debt securities: | ||||||||||||||||||||||||||||||||||||||||||||||||||||||||||||||||||||||||||||||||||||||||||||||||
| Municipal securities | $ | 15,870 | 1.04 | % | $ | - | - | % | $ | - | - | % | $ | 21,865 | 3.27 | % | 15.41 | $ | 37,735 | $ | 35,408 | 2.33 | % | $ | 2,568 | 2.60 | % | $ | - | - | % | $ | - | - | % | $ | 21,497 | 3.27 | % | 21.72 | $ | 24,065 | $ | 22,508 | 3.20 | % | ||||||||||||||||||||||||||||||||||||||||||||||||||
| Total bonds and other debt securities | 15,870 | 1.04 | - | - | - | - | 21,865 | 3.27 | 15.41 | 37,735 | 35,408 | 2.33 | 2,568 | 2.60 | - | - | - | - | 21,497 | 3.27 | 21.72 | 24,065 | 22,508 | 3.20 | ||||||||||||||||||||||||||||||||||||||||||||||||||||||||||||||||||||||||
| Mortgage-backed securities: | ||||||||||||||||||||||||||||||||||||||||||||||||||||||||||||||||||||||||||||||||||||||||||||||||
| FNMA | - | - | - | - | - | - | 7,953 | 3.28 | 14.34 | 7,953 | 7,366 | 3.28 | ||||||||||||||||||||||||||||||||||||||||||||||||||||||||||||||||||||||||||||||||||||
| Total mortgage-backed securities | - | - | - | - | - | - | 7,953 | 3.28 | 14.34 | 7,953 | 7,366 | 3.28 | ||||||||||||||||||||||||||||||||||||||||||||||||||||||||||||||||||||||||||||||||||||
| Securities available for sale | ||||||||||||||||||||||||||||||||||||||||||||||||||||||||||||||||||||||||||||||||||||||||||||||||
| Bonds and other debt securities: | ||||||||||||||||||||||||||||||||||||||||||||||||||||||||||||||||||||||||||||||||||||||||||||||||
| Municipal securities | $ | - | - | % | $ | 1,781 | 4.86 | % | $ | 19,430 | 4.52 | % | $ | 103,773 | 4.72 | % | 14.76 | $ | 124,984 | $ | 126,903 | 4.69 | % | - | - | - | - | 1,087 | 4.49 | 45,144 | 5.03 | 16.51 | 46,231 | 46,574 | 5.02 | |||||||||||||||||||||||||||||||||||||||||||||||||||||||||||||
| Corporate debentures | - | - | - | - | 55,000 | 2.89 | 55,000 | 4.05 | 9.17 | 110,000 | 102,910 | 3.47 | - | - | - | - | 130,000 | 3.28 | - | - | 7.90 | 130,000 | 118,535 | 3.28 | ||||||||||||||||||||||||||||||||||||||||||||||||||||||||||||||||||||||||
| CLO | - | - | - | - | 36,919 | 2.87 | 48,551 | 3.18 | 10.02 | 85,470 | 86,365 | 3.05 | - | - | - | - | - | - | 88,396 | 4.25 | 11.94 | 88,396 | 86,751 | 4.25 | ||||||||||||||||||||||||||||||||||||||||||||||||||||||||||||||||||||||||
| Total bonds and other debt securities | - | - | 1,781 | 4.86 | 111,349 | 3.17 | 207,324 | 4.18 | 11.58 | 320,454 | 316,178 | 3.83 | - | - | - | - | 131,087 | 3.29 | 133,540 | 4.51 | 10.75 | 264,627 | 251,860 | 3.91 | ||||||||||||||||||||||||||||||||||||||||||||||||||||||||||||||||||||||||
| Mutual funds | 21,366 | 1.84 | - | - | - | - | - | - | N/A | 21,366 | 21,366 | 1.84 | 11,586 | 2.31 | - | - | - | - | - | - | - | 11,586 | 11,586 | 2.31 | ||||||||||||||||||||||||||||||||||||||||||||||||||||||||||||||||||||||||
| Equity securities: | ||||||||||||||||||||||||||||||||||||||||||||||||||||||||||||||||||||||||||||||||||||||||||||||||
| Common stock | - | - | - | - | - | - | 1,019 | 4.28 | N/A | 1,019 | 1,019 | 4.28 | - | - | - | - | - | - | 1,256 | 6.07 | - | 1,256 | 1,256 | 6.07 | ||||||||||||||||||||||||||||||||||||||||||||||||||||||||||||||||||||||||
| Preferred stock | - | - | - | - | - | - | 6,344 | 6.95 | N/A | 6,344 | 6,342 | 6.95 | ||||||||||||||||||||||||||||||||||||||||||||||||||||||||||||||||||||||||||||||||||||
| Total equity securities | - | - | - | - | - | - | 7,363 | 6.58 | N/A | 7,363 | 7,361 | 6.58 | - | - | - | - | - | - | 1,256 | 6.07 | - | 1,256 | 1,256 | 6.07 | ||||||||||||||||||||||||||||||||||||||||||||||||||||||||||||||||||||||||
| Mortgage-backed securities: | ||||||||||||||||||||||||||||||||||||||||||||||||||||||||||||||||||||||||||||||||||||||||||||||||
| REMIC and CMO | - | - | 5,073 | 4.22 | 7,891 | 2.99 | 389,672 | 2.85 | 27.31 | 402,636 | 401,370 | 2.87 | - | - | 145 | 4.08 | - | - | 382,487 | 3.20 | 28.11 | 382,632 | 376,340 | 3.20 | ||||||||||||||||||||||||||||||||||||||||||||||||||||||||||||||||||||||||
| GNMA | - | - | - | - | - | - | 1,319 | 5.90 | 18.44 | 1,319 | 1,427 | 5.90 | - | - | - | - | 180 | 7.47 | 605 | 5.57 | 15.95 | 785 | 826 | 6.01 | ||||||||||||||||||||||||||||||||||||||||||||||||||||||||||||||||||||||||
| FNMA | 4 | 6.00 | 9,915 | 3.65 | 26,268 | 2.44 | 73,306 | 2.89 | 14.76 | 109,493 | 108,351 | 2.85 | - | - | 9,302 | 3.76 | 86 | 5.60 | 84,681 | 3.37 | 24.29 | 94,069 | 91,693 | 3.41 | ||||||||||||||||||||||||||||||||||||||||||||||||||||||||||||||||||||||||
| FHLMC | - | - | 65 | 6.41 | 1,195 | 4.27 | 4,118 | 3.33 | 23.55 | 5,378 | 5,328 | 3.58 | - | - | 104 | 6.70 | 21 | 3.95 | 90,252 | 3.73 | 21.24 | 90,377 | 89,094 | 3.73 | ||||||||||||||||||||||||||||||||||||||||||||||||||||||||||||||||||||||||
| Total mortgage-backed securities | 4 | 6.00 | 15,053 | 3.85 | 35,354 | 2.62 | 468,415 | 2.87 | 24.60 | 518,826 | 516,476 | 2.88 | - | - | 9,551 | 3.80 | 287 | 6.65 | 558,025 | 3.31 | 26.37 | 567,863 | 557,953 | 3.32 | ||||||||||||||||||||||||||||||||||||||||||||||||||||||||||||||||||||||||
| Interest-earning deposits | 25,771 | 0.75 | - | - | - | - | - | - | N/A | 25,771 | 25,771 | 0.75 | 105,761 | 2.40 | - | - | - | - | - | - | - | 105,761 | 105,761 | 2.40 | ||||||||||||||||||||||||||||||||||||||||||||||||||||||||||||||||||||||||
| Total | $ | 63,011 | 1.19 | % | $ | 16,834 | 3.96 | % | $ | 146,703 | 3.04 | % | $ | 704,967 | 3.31 | % | 20.32 | $ | 931,515 | $ | 922,560 | 3.13 | % | $ | 119,915 | 2.40 | % | $ | 9,551 | 3.80 | % | $ | 131,374 | 3.30 | % | $ | 722,271 | 3.54 | % | 21.63 | $ | 983,111 | $ | 958,290 | 3.36 | % | ||||||||||||||||||||||||||||||||||||||||||||||||||
General. Deposits, FHLB-NY borrowings, other borrowings, repurchase agreements, principal and interest payments on loans, mortgage-backed and other securities, and proceeds from sales of loans and securities are our primary sources of funds for lending, investing and other general purposes.
Deposits. We offer a variety of deposit accounts having a range of interest rates and terms. Our deposits primarily consist of savings accounts, money market accounts, demand accounts, NOW accounts and certificates of deposit. We have a relatively stable retail deposit base drawn from our market area through our 19 full-service offices. We seek to retain existing depositor relationships by offering quality service and competitive interest rates, while keeping deposit growth within reasonable limits. It is management’s intention to balance its goal to maintain competitive interest rates on deposits while seeking to manage its cost of funds to finance its strategies.
In addition to our full-service offices we have an internet branch “iGObanking.com®”, whichoperate the Internet Branch and a government banking unit. The Internet Branch currently offers savings accounts, money market accounts, checking accounts, and certificates of deposit. This allows us to compete on a national scale without the geographical constraints of physical locations. Since the number of U.S. households with accounts at Web-only banks has grown, our strategy was to join the market place by creating a branch that offers clients the simplicity and flexibility of a virtual online bank, which is a division of a stable, traditional bank that was established in 1929. At December 31, 20162018 and 2015,2017, total deposits for iGObanking.com®at our Internet Branch were $417.3$450.9 million and $323.7$401.0 million, respectively.
We have a The government banking division, which prior to the Merger in 2013 operated as the Commercial Bank, a New York State-chartered commercial bank, which providedunit provides banking services to public municipalities, including counties, cities, towns, villages, school districts, libraries, fire districts, and the various courts throughout the New York City metropolitan area as an additional source of deposits.area. At December 31, 20162018 and 2015,2017, total deposits in our government banking divisionunit totaled $1,062.1$1,339.7 million and $975.9$1,133.3 million, respectively.
Our core deposits, consisting of savings accounts, NOW accounts, money market accounts, and non-interest bearing demand accounts, are typically more stable and lower costing than other sources of funding. However, the flow of deposits into a particular type of account is influenced significantly by general economic conditions, changes in prevailing interest rates, and competition. We experienced an increase in our due to depositors’ during 20162018 of $309.7$575.3 million. During the year ended December 31, 2016,2018, the cost of our interest-bearing due to depositors’ accounts increased one50 basis pointpoints to 0.89%1.50% from 0.88%1.00% for the year ended December 31, 2015.2017. This increase in the cost of deposits was primarily due to increases in the cost of money market, NOW accounts and savings accountscertificate of 21deposits of 71 basis points, seven46 basis points and four43 basis points, respectively, partially offset by a decrease of nine basis points in the cost of certificates of deposit.respectively. The increase in the cost of money market accountsdeposits was primarily due to our shifting of Government NOW deposits to a money market product which does not require us to provide collateral, allowing us to invest these fundsan increase in higher yielding assets. The cost of NOW and savings accounts increased as we increased the raterates we pay on some of our products to attract additional deposits. The decreasemaintain competitive in the cost of certificates of deposit was primarily due to maturing issuances being replaced at lower rates.our market. While we are unable to predict the direction of future interest rate changes, if interest rates continue to rise during 2017,2019, the result could be an increase in our cost of deposits, which could reduce our net interest margin. Similarly, if interest rates remain at their current level or decline in 2017,2019, we could see a decline in our cost of deposits, which could increase our net interest margin.
Included in deposits are certificates of deposit with balances of $100,000 or more (excluding brokered deposits issued in $1,000 amounts under a master certificate of deposit) totaling $648.1$862.4 million, $484.7$681.2 million and $403.1$648.1 million at December 31, 2016, 20152018, 2017 and 2014,2016, respectively.
We utilize brokered deposits as an additional funding source and to assist in the management of our interest rate risk. We have obtained brokered certificates of deposit when the interest rate on these deposits is below the prevailing interest rate for non-brokered certificates of deposit with similar maturities in our market, or when obtaining them allowed us to extend the maturities of our deposits at favorable rates compared to borrowing funds with similar maturities, when we are seeking to extend the maturities of our funding to assist in the management of our interest rate risk. Brokered certificates of deposit provide a large deposit for us at a lower operating cost as compared to non-brokered certificates of deposit since we only have one account to maintain versus several accounts with multiple interest and maturity checks. The Depository Trust Company is used as the clearing house, maintaining each deposit under the name of CEDE & Co. These deposits are transferable just like a stock or bond investment and the customer can open the account with only a phone call, just like buying a stock or bond. Unlike non-brokered certificates of deposit, where the deposit amount can be withdrawn with a penalty for any reason, including increasing interest rates, a brokered certificate of deposit can only be withdrawn in the event of the death, or court declared mental incompetence, of the depositor. This allows us to better manage the maturity of our deposits and our interest rate risk. WeAt times, we also utilized brokers to obtain money market account deposits. The rate we pay on brokered money market accounts is the same or belowsimilar to the rate we pay on non-brokered money market accounts, and the rate is agreed to in a contract between the Bank and the broker. These accounts are similar to brokered certificates of deposit accounts in that we only maintain one account for the total deposit per broker, with the broker maintaining the detailed records of each depositor.
We also offer access to FDIC insurance coverage in excess of $250,000 through a Certificate of Deposit Account Registry Service (“CDARS®”) and through an Insured Cash Sweep service (“ICS”). CDARS® and ICS are deposit placement services. These networks arrange for placement of funds into certificate of deposit accounts or money market accounts issued by other member banks of the network in increments of less than $250,000 to ensure that both principal and interest are eligible for full FDIC deposit insurance. This allows us to accept deposits in excess of $250,000 from a depositor, and place the deposits through the network to other member banks to provide full FDIC deposit insurance coverage. During 2018, Section 29 of the Federal Deposit Insurance Act was amended to no longer consider reciprocal deposits, such as CDARS and ICS, held by an FDIC-insured depository institution brokered deposits. We may receive deposits from other member banks in exchange for the deposits we place into the network. We may also obtain deposits from other network member banks without placing deposits into the network. We will obtain deposits in this manner primarily as a short-term funding source. We also can place deposits with other member banks without receiving deposits from other member banks. Depositors are allowed to withdraw funds, with a penalty, from these accounts at one or more of the member banks that hold the deposits. Additionally, we place a portion of our government deposits in an ICS brokered money market product which does not require us to provide collateral. This allows us to invest our funds in higher yielding assets. At December 31, 20162018 and 20152017, the Bank held government ICS deposits totaling $539.0$684.0 million and $210.7$639.5 million, respectively.
We also utilize brokers to obtain money market account deposits. These accounts are similar to brokered certificate of deposit accounts in that we only maintain one account for the total deposit per broker, with the broker maintaining the detailed records of each depositor.
Traditional brokered deposits and funds obtained through the CDARS® and ICS networks are classified as brokered deposits for financial reporting purposes. At December 31, 2016,2018, we had $1,114.9$301.7 million classified as brokered deposits, with $458.8 million in brokered certificates of deposit, $655.0 million in brokered money market accounts and $1.1 million in brokered checking accounts. The brokered certificates of deposit include $28.8 million obtained through the CDARS® network and the brokered money market accounts include $539.0 million obtained through the ICS network.deposits.
The following table sets forth the distribution of our deposit accounts at the dates indicated and the weighted average nominal interest rates on each category of deposits presented.
| At December 31, | ||||||||||||||||||||||||||||||||||||
| 2016 | 2015 | 2014 | ||||||||||||||||||||||||||||||||||
| Weighted | Weighted | Weighted | ||||||||||||||||||||||||||||||||||
| Percent | Average | Percent | Average | Percent | Average | |||||||||||||||||||||||||||||||
| of Total | Nominal | of Total | Nominal | of Total | Nominal | |||||||||||||||||||||||||||||||
| Amount | Deposits | Rate | Amount | Deposits | Rate | Amount | Deposits | Rate | ||||||||||||||||||||||||||||
| (Dollars in thousands) | ||||||||||||||||||||||||||||||||||||
| Savings accounts | $ | 254,283 | 6.05 | % | 0.48 | % | $ | 261,748 | 6.72 | % | 0.45 | % | $ | 261,942 | 7.47 | % | 0.38 | % | ||||||||||||||||||
| NOW accounts (9) | 1,362,484 | 32.40 | 0.59 | 1,448,695 | 37.22 | 0.49 | 1,359,057 | 38.74 | 0.45 | |||||||||||||||||||||||||||
| Demand accounts (10) | 333,163 | 7.92 | - | 269,469 | 6.92 | - | 255,834 | 7.29 | - | |||||||||||||||||||||||||||
| Mortgagors' escrow deposits | 40,216 | 0.96 | 0.22 | 36,844 | 0.95 | 0.17 | 35,679 | 1.02 | 0.09 | |||||||||||||||||||||||||||
| Total | 1,990,146 | 47.32 | 0.47 | 2,016,756 | 51.81 | 0.42 | 1,912,512 | 54.51 | 0.37 | |||||||||||||||||||||||||||
| Money market accounts (8) | 843,370 | 20.05 | 0.67 | 472,489 | 12.14 | 0.46 | 290,263 | 8.27 | 0.32 | |||||||||||||||||||||||||||
| Certificate of deposit accounts | ||||||||||||||||||||||||||||||||||||
| with original maturities of: | ||||||||||||||||||||||||||||||||||||
| Less than 6 Months (2) | 31,432 | 0.75 | 0.64 | 19,615 | 0.50 | 0.40 | 7,059 | 0.20 | 0.10 | |||||||||||||||||||||||||||
| 6 to less than 12 Months (3) | 53,222 | 1.27 | 0.99 | 21,962 | 0.56 | 0.41 | 82,966 | 2.36 | 0.80 | |||||||||||||||||||||||||||
| 12 to less than 30 Months (4) | 588,751 | 14.00 | 1.18 | 496,343 | 12.75 | 1.08 | 275,828 | 7.86 | 0.89 | |||||||||||||||||||||||||||
| 30 to less than 48 Months (5) | 281,454 | 6.69 | 1.26 | 316,475 | 8.13 | 1.20 | 198,290 | 5.65 | 1.08 | |||||||||||||||||||||||||||
| 48 to less than 72 Months (6) | 369,630 | 8.79 | 1.83 | 461,843 | 11.86 | 1.73 | 622,908 | 17.75 | 2.06 | |||||||||||||||||||||||||||
| 72 Months or more (7) | 47,626 | 1.13 | 2.86 | 87,064 | 2.24 | 2.77 | 118,772 | 3.39 | 2.88 | |||||||||||||||||||||||||||
| Total certificate of deposit accounts | 1,372,115 | 32.63 | 1.41 | 1,403,302 | 36.05 | 1.41 | 1,305,823 | 37.22 | 1.65 | |||||||||||||||||||||||||||
| Total deposits (1) | $ | 4,205,631 | 100.00 | % | 0.82 | % | $ | 3,892,547 | 100.00 | % | 0.78 | % | $ | 3,508,598 | 100.00 | % | 0.84 | % | ||||||||||||||||||
| At December 31, | ||||||||||||||||||||||||||||||||||||
| 2018 | 2017 | 2016 | ||||||||||||||||||||||||||||||||||
| Weighted | Weighted | Weighted | ||||||||||||||||||||||||||||||||||
| Percent | Average | Percent | Average | Percent | Average | |||||||||||||||||||||||||||||||
| of Total | Nominal | of Total | Nominal | of Total | Nominal | |||||||||||||||||||||||||||||||
| Amount | Deposits | Rate | Amount | Deposits | Rate | Amount | Deposits | Rate | ||||||||||||||||||||||||||||
| (Dollars in thousands) | ||||||||||||||||||||||||||||||||||||
| Savings accounts | $ | 210,022 | 4.23 | % | 0.72 | % | $ | 290,280 | 6.62 | % | 0.64 | % | $ | 254,283 | 6.05 | % | 0.48 | % | ||||||||||||||||||
| NOW accounts (9) | 1,300,852 | 26.22 | 1.53 | 1,333,232 | 30.42 | 0.83 | 1,362,484 | 32.40 | 0.59 | |||||||||||||||||||||||||||
| Demand accounts (10) | 413,747 | 8.34 | - | 385,269 | 8.79 | - | 333,163 | 7.92 | - | |||||||||||||||||||||||||||
| Mortgagors' escrow deposits | 44,861 | 0.90 | 0.23 | 42,606 | 0.97 | 0.25 | 40,216 | 0.96 | 0.22 | |||||||||||||||||||||||||||
| Total | 1,969,482 | 39.70 | 1.10 | 2,051,387 | 46.80 | 0.65 | 1,990,146 | 47.32 | 0.47 | |||||||||||||||||||||||||||
| Money market accounts (8) | 1,427,992 | 28.79 | 1.93 | 979,958 | 22.36 | 1.05 | 843,370 | 20.05 | 0.67 | |||||||||||||||||||||||||||
| Certificate of deposit accounts | ||||||||||||||||||||||||||||||||||||
| with original maturities of: | ||||||||||||||||||||||||||||||||||||
| Less than 6 Months (2) | 67,472 | 1.36 | 2.05 | 113,306 | 2.59 | 1.30 | 31,432 | 0.75 | 0.64 | |||||||||||||||||||||||||||
| 6 to less than 12 Months (3) | 72,928 | 1.47 | 2.25 | 8,201 | 0.19 | 0.14 | 53,222 | 1.27 | 0.99 | |||||||||||||||||||||||||||
| 12 to less than 30 Months (4) | 1,003,206 | 20.22 | 2.07 | 679,966 | 15.51 | 1.41 | 588,751 | 14.00 | 1.18 | |||||||||||||||||||||||||||
| 30 to less than 48 Months (5) | 126,041 | 2.54 | 2.16 | 163,739 | 3.74 | 1.51 | 281,454 | 6.69 | 1.26 | |||||||||||||||||||||||||||
| 48 to less than 72 Months (6) | 264,237 | 5.33 | 2.08 | 350,719 | 8.00 | 1.87 | 369,630 | 8.79 | 1.83 | |||||||||||||||||||||||||||
| 72 Months or more (7) | 29,426 | 0.59 | 3.07 | 36,002 | 0.82 | 2.92 | 47,626 | 1.13 | 2.86 | |||||||||||||||||||||||||||
| Total certificate of deposit accounts | 1,563,310 | 31.51 | 2.10 | 1,351,933 | 30.84 | 1.57 | 1,372,115 | 32.63 | 1.41 | |||||||||||||||||||||||||||
| Total deposits (1) | $ | 4,960,784 | 100.00 | % | 1.65 | % | $ | 4,383,278 | 100.00 | % | 1.02 | % | $ | 4,205,631 | 100.00 | % | 0.82 | % | ||||||||||||||||||
| (1) | Included in the above balances are IRA and Keogh deposits totaling |
| (2) | Includes brokered deposits of |
| (3) |
| (4) | Includes brokered deposits of |
| (5) | Includes brokered deposits of |
| (6) | Includes brokered deposits of |
| (7) | Includes brokered deposits of |
| (8) | Includes brokered deposits of |
| (9) |
| (10) | Includes brokered deposits of |
The following table presents by various rate categories, the amount of time deposit accounts outstanding at the dates indicated, and the years to maturity of the certificate accounts outstanding at December 31, 2016.the periods indicated:
| At December 31, 2016 | ||||||||||||||||||||||||||||
| At December 31, | Within | One to | ||||||||||||||||||||||||||
| 2016 | 2015 | 2014 | One Year | Three Years | Thereafter | |||||||||||||||||||||||
| (In thousands) | ||||||||||||||||||||||||||||
| Interest rate: | ||||||||||||||||||||||||||||
| 1.99% or less | (1) | $ | 1,107,882 | $ | 1,074,229 | $ | 817,100 | $ | 631,816 | $ | 447,776 | $ | 28,290 | |||||||||||||||
| 2.00% to 2.99% | (2) | 237,122 | 279,688 | 301,445 | 12,516 | 200,078 | 24,528 | |||||||||||||||||||||
| 3.00% to 3.99% | (3) | 27,111 | 49,385 | 184,172 | 4 | 1,940 | 25,167 | |||||||||||||||||||||
| Total | $ | 1,372,115 | $ | 1,403,302 | $ | 1,302,717 | $ | 644,336 | $ | 649,794 | $ | 77,985 | ||||||||||||||||
| At December 31, 2018 | ||||||||||||||||||||||||
| At December 31, | Within | One to | ||||||||||||||||||||||
| 2018 | 2017 | 2016 | One Year | Three Years | Thereafter | |||||||||||||||||||
| (In thousands) | ||||||||||||||||||||||||
| Interest rate: | ||||||||||||||||||||||||
| 1.99% or less(1) | $ | 535,127 | $ | 1,051,876 | $ | 1,107,882 | $ | 432,408 | $ | 93,369 | $ | 9,350 | ||||||||||||
| 2.00% to 2.99%(2) | 971,812 | 272,475 | 237,122 | 584,770 | 359,173 | 27,869 | ||||||||||||||||||
| 3.00% to 3.99%(3) | 56,371 | 27,582 | 27,111 | - | 30,815 | 25,556 | ||||||||||||||||||
| Total | $ | 1,563,310 | $ | 1,351,933 | $ | 1,372,115 | $ | 1,017,178 | $ | 483,357 | $ | 62,775 | ||||||||||||
| (1) | Includes brokered deposits of |
| (2) | Includes brokered deposits of |
| (3) |
The following table presents by remaining maturity categories the amount of certificate of deposit accounts with balances of $100,000 or more at December 31, 20162018 and their annualized weighted average interest rates.
| Weighted | ||||||||
| Amount | Average Rate | |||||||
| (Dollars in thousands) | ||||||||
| Maturity Period: | ||||||||
| Three months or less | $ | 159,371 | 1.16 | % | ||||
| Over three through six months | 66,237 | 1.20 | ||||||
| Over six through 12 months | 47,632 | 1.37 | ||||||
| Over 12 months | 374,858 | 1.59 | ||||||
| Total | $ | 648,098 | 1.43 | % | ||||
| Weighted | ||||||||
| Amount | Average Rate | |||||||
| (Dollars in thousands) | ||||||||
| Maturity Period: | ||||||||
| Three months or less | $ | 143,200 | 1.85 | % | ||||
| Over three through six months | 216,743 | 1.99 | ||||||
| Over six through 12 months | 213,892 | 2.15 | ||||||
| Over 12 months | 288,567 | 2.43 | ||||||
| Total | $ | 862,402 | 2.16 | % | ||||
The above table does not include brokered deposits issued in $1,000 amounts under a master certificate of deposit totaling $393.5$301.7 million with a weighted average rate of 1.30%2.09%.
The following table presents the deposit activity, including mortgagors’ escrow deposits, for the periods indicated.
| For the year ended December 31, | ||||||||||||
| 2016 | 2015 | 2014 | ||||||||||
| (In thousands) | ||||||||||||
| Net deposits | $ | 278,793 | $ | 352,602 | $ | 244,830 | ||||||
| Amortization of premiums, net | 747 | 1,012 | 944 | |||||||||
| Interest on deposits | 33,350 | 30,336 | 30,044 | |||||||||
| Net increase in deposits | $ | 312,890 | $ | 383,950 | $ | 275,818 | ||||||
| For the year ended December 31, | ||||||||||||
| 2018 | 2017 | 2016 | ||||||||||
| (In thousands) | ||||||||||||
| Net deposits | $ | 512,558 | $ | 136,740 | $ | 278,793 | ||||||
| Amortization of premiums, net | 451 | 588 | 747 | |||||||||
| Interest on deposits | 64,497 | 40,319 | 33,350 | |||||||||
| Net increase in deposits | $ | 577,506 | $ | 177,647 | $ | 312,890 | ||||||
The following table sets forth the distribution of our average deposit accounts for the years indicated, the percentage of total deposit portfolio, and the average interest cost of each deposit category presented. Average balances for all years shown are derived from daily balances.
| At December 31, | At December 31, | |||||||||||||||||||||||||||||||||||||||||||||||||||||||||||||||||||||||
| 2016 | 2015 | 2014 | 2018 | 2017 | 2016 | |||||||||||||||||||||||||||||||||||||||||||||||||||||||||||||||||||
| Percent | Percent | Percent | Percent | Percent | Percent | |||||||||||||||||||||||||||||||||||||||||||||||||||||||||||||||||||
| Average | of Total | Average | Average | of Total | Average | Average | of Total | Average | Average | of Total | Average | Average | of Total | Average | Average | of Total | Average | |||||||||||||||||||||||||||||||||||||||||||||||||||||||
| Balance | Deposits | Cost | Balance | Deposits | Cost | Balance | Deposits | Cost | Balance | Deposits | Cost | Balance | Deposits | Cost | Balance | Deposits | Cost | |||||||||||||||||||||||||||||||||||||||||||||||||||||||
| (Dollars in thousands) | (Dollars in thousands) | |||||||||||||||||||||||||||||||||||||||||||||||||||||||||||||||||||||||
| Savings accounts | $ | 260,948 | 6.35 | % | 0.47 | % | $ | 264,891 | 7.10 | % | 0.43 | % | $ | 258,243 | 7.70 | % | 0.23 | % | $ | 233,392 | 4.93 | % | 0.59 | % | $ | 292,887 | 6.59 | % | 0.62 | % | $ | 260,948 | 6.35 | % | 0.47 | % | ||||||||||||||||||||||||||||||||||||
| NOW accounts | 1,496,712 | 36.41 | 0.53 | 1,432,609 | 38.38 | 0.46 | 1,390,899 | 41.47 | 0.45 | 1,407,945 | 29.73 | 1.13 | 1,444,944 | 32.49 | 0.67 | 1,496,712 | 36.41 | 0.53 | ||||||||||||||||||||||||||||||||||||||||||||||||||||||
| Demand accounts | 305,096 | 7.42 | - | 250,488 | 6.71 | - | 211,389 | 6.30 | - | 380,889 | 8.04 | - | 348,518 | 7.84 | - | 305,096 | 7.42 | - | ||||||||||||||||||||||||||||||||||||||||||||||||||||||
| Mortgagors' escrow deposits | 56,152 | 1.37 | 0.20 | 52,364 | 1.40 | 0.19 | 47,876 | 1.43 | 0.28 | 66,255 | 1.40 | 0.32 | 61,962 | 1.39 | 0.23 | 56,152 | 1.37 | 0.20 | ||||||||||||||||||||||||||||||||||||||||||||||||||||||
| Total | 2,118,908 | 51.55 | 0.44 | 2,000,352 | 53.59 | 0.39 | 1,908,407 | 56.90 | 0.37 | 2,088,481 | 44.10 | 0.84 | 2,148,311 | 48.31 | 0.54 | 2,118,908 | 51.55 | 0.44 | ||||||||||||||||||||||||||||||||||||||||||||||||||||||
| Money market accounts | 581,390 | 14.15 | 0.62 | 380,595 | 10.20 | 0.41 | 245,752 | 7.33 | 0.27 | 1,164,505 | 24.59 | 1.61 | 908,025 | 20.42 | 0.90 | 581,390 | 14.15 | 0.62 | ||||||||||||||||||||||||||||||||||||||||||||||||||||||
| Certificate of deposit accounts | 1,409,772 | 34.30 | 1.46 | 1,351,619 | 36.21 | 1.55 | 1,199,849 | 35.77 | 1.87 | 1,483,026 | 31.31 | 1.91 | 1,390,491 | 31.27 | 1.48 | 1,409,772 | 34.30 | 1.46 | ||||||||||||||||||||||||||||||||||||||||||||||||||||||
| Total deposits | $ | 4,110,070 | 100.00 | % | 0.81 | % | $ | 3,732,566 | 100.00 | % | 0.81 | % | $ | 3,354,008 | 100.00 | % | 0.90 | % | $ | 4,736,012 | 100.00 | % | 1.36 | % | $ | 4,446,827 | 100.00 | % | 0.91 | % | $ | 4,110,070 | 100.00 | % | 0.81 | % | ||||||||||||||||||||||||||||||||||||
Borrowings. Although deposits are our primary source of funds, we also use borrowings as an alternative and cost effective source of funds for lending, investing and other general purposes. The Bank is a member of, and is eligible to obtain advances from, the FHLB-NY. Such advances generally are secured by a blanket lien against the Bank’s mortgage portfolio and the Bank’s investment in the stock of the FHLB-NY. In addition, the Bank may pledge mortgage-backed securities to obtain advances from the FHLB-NY. See “— Regulation — Federal Home Loan Bank System.” The maximum amount that the FHLB-NY will advance for purposes other than for meeting withdrawals fluctuates from time to time in accordance with the policies of the FHLB-NY. The Bank may also enter into repurchase agreements with broker-dealers and the FHLB-NY. These agreements are recorded as financing transactions and the obligations to repurchase are reflected as a liability in our consolidated financial statements. In addition, we issued junior subordinated debentures with a total par of $61.9 million in June and July 2007. These junior subordinated debentures are carried at fair value in the Consolidated Statement of Financial Condition. During the year ended December 31,In 2016, the Holding Company issued subordinated debt with an aggregated principal amount of $75.0 million, receiving net proceeds totaling $73.4 million. The subordinated debt was issued at 5.25% fixed-to-floating rate maturing in 2026. The debt is callable at par quarterly through its maturity date beginning December 15, 2021.
In late 2017, the Company entered into forward interest rate swaps (the “Swaps”) with a notional amount of $441.5 million. These Swaps have five year terms and were entered to mitigate the impact interest rate increases have on our cost of funds. At December 31, 2018 and 2017, the Swaps had an average cost of 2.33% and 1.98%, respectively.
The average cost of borrowings was 1.67%2.16%, 1.76%1.81% and 2.49%1.67% for the years ended December 31, 2016, 20152018, 2017 and 2014,2016, respectively. The average balances of borrowings were $1,231,0$1,162.4 million, $1,104.4$1,169.8 million and $993.8$1,231.0 million for the same years, respectively.
The following table sets forth certain information regarding our borrowings at or for the periods ended on the dates indicated.
| At or for the years ended December 31, | At or for the years ended December 31, | |||||||||||||||||||||||
| 2016 | 2015 | 2014 | 2018 | 2017 | 2016 | |||||||||||||||||||
| (Dollars in thousands) | (Dollars in thousands) | |||||||||||||||||||||||
| Securities Sold with the Agreement to Repurchase | ||||||||||||||||||||||||
| Average balance outstanding | $ | 64,087 | $ | 116,000 | $ | 137,824 | $ | - | $ | - | $ | 64,087 | ||||||||||||
| Maximum amount outstanding at any month | ||||||||||||||||||||||||
| end during the period | 116,000 | 116,000 | 155,300 | - | - | 116,000 | ||||||||||||||||||
| Balance outstanding at the end of period | - | 116,000 | 116,000 | - | - | - | ||||||||||||||||||
| Weighted average interest rate during the period | 3.26 | % | 3.22 | % | 3.40 | % | - | % | - | % | 3.26 | % | ||||||||||||
| Weighted average interest rate at end of period | n/a | 3.18 | 3.18 | - | - | - | ||||||||||||||||||
| FHLB-NY Advances | ||||||||||||||||||||||||
| Average balance outstanding | $ | 1,123,411 | $ | 947,370 | $ | 826,132 | $ | 1,046,504 | $ | 1,058,466 | $ | 1,123,411 | ||||||||||||
| Maximum amount outstanding at any month | ||||||||||||||||||||||||
| end during the period | 1,337,265 | 1,106,658 | 936,813 | 1,137,318 | 1,317,087 | 1,337,265 | ||||||||||||||||||
| Balance outstanding at the end of period | 1,159,190 | 1,106,658 | 911,721 | 1,134,994 | 1,198,968 | 1,159,190 | ||||||||||||||||||
| Weighted average interest rate during the period | 1.46 | % | 1.48 | % | 1.60 | % | 1.77 | % | 1.38 | % | 1.46 | % | ||||||||||||
| Weighted average interest rate at end of period | 1.17 | 1.40 | 1.44 | 2.09 | 1.49 | 1.17 | ||||||||||||||||||
| Other Borrowings | ||||||||||||||||||||||||
| Average balance outstanding | $ | 43,516 | $ | 40,998 | $ | 29,834 | $ | 115,925 | $ | 111,325 | $ | 43,516 | ||||||||||||
| Maximum amount outstanding at any month | ||||||||||||||||||||||||
| end during the period | 107,373 | 89,479 | 30,352 | 115,849 | 110,685 | 107,373 | ||||||||||||||||||
| Balance outstanding at the end of period | 107,373 | 49,018 | 28,771 | 115,849 | 110,685 | 107,373 | ||||||||||||||||||
| Weighted average interest rate during the period | 4.76 | % | 4.02 | % | 5.30 | % | 5.66 | % | 5.86 | % | 4.76 | % | ||||||||||||
| Weighted average interest rate at end of period | 5.02 | 2.56 | 5.96 | 5.59 | 5.18 | 5.02 | ||||||||||||||||||
| Total Borrowings | ||||||||||||||||||||||||
| Average balance outstanding | $ | 1,231,014 | $ | 1,104,368 | $ | 993,790 | $ | 1,162,429 | $ | 1,169,791 | $ | 1,231,014 | ||||||||||||
| Maximum amount outstanding at any month | ||||||||||||||||||||||||
| end during the period | 1,560,639 | 1,312,137 | 1,112,201 | 1,250,843 | 1,427,772 | 1,560,639 | ||||||||||||||||||
| Balance outstanding at the end of period | 1,266,563 | 1,271,676 | 1,056,492 | 1,250,843 | 1,309,653 | 1,266,563 | ||||||||||||||||||
| Weighted average interest rate during the period | 1.67 | % | 1.76 | % | 1.96 | % | 2.16 | % | 1.81 | % | 1.67 | % | ||||||||||||
| Weighted average interest rate at end of period | 1.53 | 1.61 | 1.75 | 2.41 | 1.80 | 1.53 | ||||||||||||||||||
At December 31, 2016, Flushing Financial Corporation2018, the Holding Company had four wholly owned subsidiaries: the Bank and the Trusts. In addition, the Bank had three wholly owned subsidiaries: FSB Properties Inc. (“Properties”), Flushing Preferred Funding Corporation (“FPFC”), and Flushing Service Corporation.
(a) Properties, which is incorporated in the State of New York, was formed in 1976 under the Savings Bank’s New York State leeway investment authority. The original purpose of Properties was to engage in joint venture real estate equity investments. The Savings Bank discontinued these activities in 1986. The last joint venture in which Properties was a partner was dissolved in 1989, and the remaining property disposed. Properties is currently used to hold title to real estate owned that is obtained via foreclosure.
| · | FSB Properties Inc., which is incorporated in the State of New York, was formed in 1976 with the original purpose of engaging in joint venture real estate equity investments. These activities were discontinued in 1986 and no joint venture property remains. FSB Properties Inc. is currently used solely to hold title to real estate owned that is obtained via foreclosure. |
(b) FPFC, which is incorporated in the State of Delaware, was formed in 1997 as a real estate investment trust for the purpose of acquiring, holding and managing real estate mortgage assets. FPFC also provides an additional vehicle for access by the Company to the capital markets for future opportunities.
| · | Flushing Preferred Funding Corporation, which is incorporated in the State of Delaware, was formed in 1997 as a real estate investment trust for the purpose of acquiring, holding and managing real estate mortgage assets. It also is available as an additional vehicle for access by the Company to the capital markets for future opportunities. |
(c) Flushing Service Corporation, which is incorporated in the State of New York, was formed in 1998 to market insurance products and mutual funds.
| · | Flushing Service Corporation, which is incorporated in the State of New York, was formed in 1998 to market insurance products and mutual funds. |
At December 31, 2016,2018, we had 447456 full-time employees and 2324 part-time employees. None of our employees are represented by a collective bargaining unit, and we consider our relationship with our employees to be good. At the present time, Flushing Financial Corporationthe Holding Company only employs certain officers of the Bank. These employees do not receive any extra compensation as officers of Flushing Financial Corporation.the Holding Company.
29
The 2014 Omnibus Incentive Plan (“2014 Omnibus Plan”) became effective on May 20, 2014 after adoption by the Board of Directors and approval by the stockholders. The 2014 Omnibus Plan authorizes the Compensation Committee of the Company’s Board of Directors (the “Compensation Committee”) to grant a variety of equity compensation awards as well as long-term and annual cash incentive awards, all of which can, but need not, be structured so as to comply with Section 162(m) of the Internal Revenue Code of 1986, as amended (the “Internal Revenue Code”).awards. The 2014 Omnibus Plan authorizes the issuance of 1,100,000 shares. To the extent that an award under the 2014 Omnibus Plan is cancelled, expired, forfeited, settled in cash, settled by issuance of fewer shares than the number underlying the award, or otherwise terminated without delivery of shares to a participant in payment of the exercise price or taxes relating to an award, the shares retained by or returned to the Company will be available for future issuance under the 2014 Omnibus Plan. No further awards may be granted under the Company’s 2005 Omnibus Incentive Plan, 1996 Stock Option Incentive Plan, and 1996 Restricted Stock Incentive Plan. At DecemberOn May 31, 2016, there were 489,3202017, stockholders approved an amendment to the 2014 Omnibus Plan (the “Amendment”) authorizing an additional 672,000 shares available for deliveryfuture issuance. In addition, to increasing the number of shares for future grants, the Amendment eliminated, in connection with awardsthe case of stock options and SARs, the ability to recycle shares used to satisfy the exercise price or taxes for such awards. No other amendments to the 2014 Omnibus Plan were made. Including the additional shares authorized from the Amendment, 745,477 shares are available for future issuance under the 2014 Omnibus Plan.Plan at December 31, 2018.
For additional information concerning this plan, see “Note 11 of Notes to Consolidated Financial Statements” in Item 8 of this Annual Report.
FEDERAL, STATE AND LOCAL TAXATION
The following discussion of tax matters is intended only as a summary and does not purport to be a comprehensive description of the tax rules applicable to the Company.
General. We report our income using a calendar year and the accrual method of accounting. We are subject to the federal tax laws and regulations which apply to corporations generally, and, since the enactment of the Small Business Job Protection Act of 1996 (the “Act”), those laws and regulations governing the Bank’s deductions for bad debts, described below.
Bad Debt Reserves. Prior to the enactment of the Act, which was signed into law on August 20, 1996, savings institutions which met certain definitional tests primarily relating to their assets and the nature of their business (“qualifying thrifts”), such as the Savings Bank, were allowed deductions for bad debts under methods more favorable than those granted to other taxpayers. Qualifying thrifts could compute deductions for bad debts using either the specific charge off method of Section 166 of the Internal Revenue Code (the “Code”) or the reserve method of Section 593 of the Code. Section 1616(a) of the Act repealed the Section 593 reserve method of accounting for bad debts by qualifying thrifts, effective for taxable years beginning after 1995. Qualifying thrifts that are treated as large banks, such as the Savings Bank was, are required to use the specific charge off method, pursuant to which the amount of any debt may be deducted only as it actually becomes wholly or partially worthless.
Distributions. To the extent that the Bank makes “non-dividend distributions” to stockholders that are considered to result in distributions from its pre-1988 reserves or the supplemental reserve for losses on loans (“excess distributions”), then an amount based on the amount distributed will be included in the Bank’s taxable income. Non-dividend distributions include distributions in excess of the Bank’s current and post-1951 accumulated earnings and profits, as calculated for federal income tax purposes, distributions in redemption of stock and distributions in partial or complete liquidation. The amount of additional taxable income resulting from an excess distribution is an amount that when reduced by the tax attributable to the income is equal to the amount of the excess distribution. Thus, slightly more than one and one-half times the amount of the excess distribution made would be includable in gross income for federal income tax purposes, assuming a 35% federal corporate income tax rate. See “Regulation ¾ Restrictions on Dividends and Capital Distributions” for limits on the payment of dividends by the Bank. The Bank does not intend to pay dividends or make non-dividend distributions described above that would result in a recapture of any portion of its pre-1988 bad debt reserves.
Corporate Alternative Minimum Tax. The Code imposes an alternative minimum tax on corporations equal to the excess, if any, of 20% of alternative minimum taxable income (“AMTI”) over a corporation’s regular federal income tax liability. AMTI is equal to taxable income with certain adjustments. Generally, only 90% of AMTI can be offset by net operating loss carrybacks and carryforwards.
New York State and New York City Taxation. We are subject to the New York State Franchise Tax on Banking Corporations. New York State recently enacted several reforms (the "Tax Reform Package") to its tax structure, including changes to the franchise, sales, estate and personal income taxes. These changes generally became effective for tax years beginning on or after January 1, 2015. The Tax Reform Package simplified the existing corporate tax code for New York State businesses while remaining relatively neutral in relation to corporate tax receipts. Under the Tax Reform Package, the New York State corporate income tax rate was reduced, effective January 1, 2016, from 7.10% to 6.50%. The metropolitan commuter transportation district surcharge ("MTA Tax") increased to 28% of the surcharge base for tax years beginning on or after January 1, 2016. The MTA Tax rate for tax years beginning on or after January 1, 2017 will be adjusted based upon future Metropolitan Transit Authority budget projections.
Some of the most significant elements of the Tax Reform Package include the merger of the bank franchise tax regime into the general corporate franchise tax regime, expanded application of economic nexus, adoption of unitary reporting, and apportionment of source income solely by reference to customer location.
New York State formerly had imposed a franchise tax on general business corporations and a separate franchise tax on banking corporations. Under these statutes, New York State financial service companies and banks were previously taxed under different regimes. The Tax Reform Package repealed the prior bank franchise taxation regime and merged it into the corporate franchise tax regime. It also made certain subtraction modifications to the corporate franchise tax regime, most notably by providing a choice between three potential financial tax subtraction modifications: (i) a subtraction modification equal to 32% of New York State’s entire net income available to all thrifts and community banks with assets that do not exceed $8 billion, provided certain residential lending tests are met; (ii) a subtraction modification, available to both small thrifts and community banks with assets that do not exceed $8 billion, based upon 50% of the net interest income from loans multiplied by the fraction of interest received from loans secured by real estate located in New York State or small business loans made to New York State borrowers with a principal amount of $5 million or less divided by total interest income from all loans; and (iii) both small thrifts and community banks with assets that do not exceed $8 billion that owned a captive real estate investment trust as of April 1, 2014, may, for tax years beginning on or after January 1, 2015, subtract 160% of dividends received from the trust in determining New York State taxable income.
The Tax Reform Package requires that all firms meeting an ownership test of 50% or more be deemed a unitary business and required to file a combined tax return. Substantial intercompany transactions are eliminated, and a domestic corporation without any assets or customers in New York State, but engaged in a unitary business with a related New York taxpayer, could become part of the New York State unitary group. The Tax Reform Package also requires business income to be apportioned to and taxed by New York State using a single receipts factor based on the customer's location. These provisions also contain favorable apportionment rules for asset-backed securities that are beneficial to the Company.
The Company is subject to New York City franchise tax on a consolidated basis. New York City tax law generally was conformed to New York State tax law with provisions similar to those described above for York State purposes, with only a few minor differences. For tax years beginning on or after January 1, 2015, the New York City income tax rate applied to the Company apportioned New York City taxable income was and is 8.85%.
New Jersey State Taxation. The Bank is required to pay New Jersey State income tax based on the percentage of receipts from activity in New Jersey.
Delaware State Taxation. As a Delaware holding company not earning income in Delaware, we are exempt from Delaware corporate income tax but are required to file an annual report with and pay an annual franchise tax to the State of Delaware.
The Bank is a New York State-chartered commercial bank and its deposit accounts are insured under the Deposit Insurance Fund (the “DIF”) of the Federal Deposit Insurance Corporation (the “FDIC”) up to applicable legal limits. The Bank is subject to extensive regulation and supervision by the New York State Department of Financial Services (“NYDFS”), as its chartering agency, by the FDIC, as its insurer of deposits, and to a lesser extent by the Consumer Financial Protection Bureau (the “CFPB”), which was created under the Dodd-Frank Wall Street Reform and Consumer Protection Act (the “Dodd-Frank Act”) in 2011 to implement and enforce consumer protection laws applying to banks. The Bank must file reports with the NYDFS, the FDIC, and the CFPB concerning its activities and financial condition, in addition to obtaining regulatory approvals prior to entering into certain transactions such as mergers with, or acquisitions of, other depository institutions. Furthermore, the Bank is periodically examined by the NYDFS and the FDIC to assess compliance with various regulatory requirements, including safety and soundness considerations. This regulation and supervision establishes a comprehensive framework of activities in which a commercial bank can engage, and is intended primarily for the protection of the insurance fund and depositors. The regulatory structure also gives the regulatory authorities extensive discretion in connection with its supervisory and enforcement activities and examination policies, including policies with respect to the classification of assets and the establishment of adequate loan loss allowances for regulatory purposes. Any change in such regulation, whether by the NYDFS, the FDIC, or through legislation, could have a material adverse impact on the Company, the Bank and its operations, and the Company’s shareholders. While the regulatory environment has entered a period of rebalancing of the post financial crisis framework, we expect that our business will remain subject to extensive regulation and supervision.
The Company is required to file certain reports under, and otherwise comply with, the rules and regulations of the Federal Reserve Board of Governors (the “FRB”), the FDIC, the NYDFS, and the Securities and Exchange Commission (the “SEC”) under federal securities laws. In addition, the FRB periodically examines the Company. Certain of the regulatory requirements applicable to the Bank and the Company are referred to below or elsewhere herein. However, such discussion is not meant to be a complete explanation of all laws and regulations and is qualified in its entirety by reference to the actual laws and regulations.
The Dodd-Frank Act has significantly impacted the current bank regulatory structure and is expected to continue to affect, into the immediate future, the lending and investment activities and general operations of depository institutions and their holding companies. In addition to creating the CFPB, the Dodd-Frank Act requires the FRB to establish minimum consolidated capital requirements for bank holding companies that are as stringent as those required for insured depository institutions; the components of Tier 1 capital will be restricted to capital instruments that are currently considered to be Tier 1 capital for insured depository institutions. In addition, the proceeds of trust preferred securities will be excluded from Tier 1 capital unless (i) such securities are issued by bank holding companies with assets of less than $500 million, or (ii) such securities were issued prior to May 19, 2010 by bank or savings and loan holding companies with assets of less than $15 billion. The Dodd-Frank Act created a new supervisory structure for oversight of the U.S. financial system, including the establishment of a new council of regulators, the Financial Stability Oversight Council, to monitor and address systemic risks to the financial system. Non-bank financial companies that are deemed to be significant to the stability of the U.S. financial system and all bank holding companies with $50 billion or more in total consolidated assets will be subject to heightened supervision and regulation. The FRB will implement prudential requirements and prompt corrective action procedures for such companies.
30
The Dodd-Frank Act made many additional changes in banking regulation, including: authorizing depository institutions, for the first time, to pay interest on business checking accounts; requiring originators of securitized loans to retain a percentage of the risk for transferred loans; establishing regulatory rate-setting for certain debit card interchange fees; and establishing a number of reforms for mortgage lending and consumer protection.
The Dodd-Frank Act also broadened the base for FDIC insurance assessments. The FDIC was required to promulgate rules revising its assessment system so that it is based not on deposits, but on the average consolidated total assets less the tangible equity capital of an insured institution. That rule took effect April 1, 2011. The Dodd-Frank Act also permanently increased the maximum amount of deposit insurance for banks, savings institutions, and credit unions to $250,000 per depositor, retroactive to January 1, 2008, and provided non-interest-bearing transaction accounts with unlimited deposit insurance through December 31, 2012.
Some of the provisions of the Dodd-Frank Act are not yet in effect. The Dodd-Frank Act requires various federal agencies to promulgate numerous and extensive implementing regulations over the next several years.
On February 3, 2017, however, President Trump signed an executive order requiring a comprehensive review of financial system regulations, including the Dodd-Frank Act. President Trump has promised other significant changes to financial system regulations. Nonetheless, changes to these regulations are expected to be politically controversial and may be slow and unpredictable in enactment and effect. It is too early to predict when or what, if any, existing regulations affecting us will be repealed or amended and what if any new regulations affecting us will be adopted, leaving the bank regulatory environment particularly uncertain at present. Further, there can be no assurance as to the impact that any laws, regulations or governmental programs that may be introduced or implemented in the future will have on the financial markets and the economy.
In the summer of 2012, our primary federal regulators published two notices of proposed rulemaking (“NPRs”) that would have substantially revised the risk-based capital requirements applicable to bank holding companies and depository institutions, including
On January 1, 2015, the Company and the Bank comparedbecame subject to a new comprehensive capital framework for U.S. banking organizations that was issued by the then current U.S. risk-basedFDIC and FRB in July 2013 (the “Basel III Capital Rules”), subject to phase-in periods for certain components and other provisions. Under the Basel III Capital Rules, the minimum capital rules, which areratios effective as of January 1, 2015 are:
The Basel III Capital Rules also introduced a new “capital conservation buffer,” composed entirely of CET1, on top of these minimum risk-weighted asset ratios. The implementation of the capital conservation buffer began on January 1, 2016 at the 0.625% level and increased and will increase by 0.625% on each subsequent January 1, until it reaches 2.5% on January 1, 2019. Banking institutions with a ratio of CET1 to risk-weighted assets below the effective minimum (4.5% plus the capital conservation buffer) will face constraints on dividends, equity repurchases and compensation based on the international capital accordsamount of the shortfall. As of December 31, 2018, the Company and the Bank would meet all capital adequacy requirements under the Basel CommitteeIII Capital Rules on Banking Supervision, which are generally referred toa fully phased-in basis as “Basel I.”if such requirements had been in effect.
During July 2013, our primaryTogether with the FDIC, the Federal Reserve has issued proposed rules that would simplify the capital treatment of certain capital deductions and adjustments, and the final phase-in period for these capital deductions and adjustments has been indefinitely delayed. In addition, in December 2018, the federal regulators issued revised NPRsbanking agencies finalized rules that will revise and replace the agencies' current capital rules. The NPRs included numerous revisions to the existing capital regulations, including, but not limited to, the following:
The capital regulations became effective January 1, 2015 forwould permit bank holding companies and banks to phase-in, for regulatory capital purposes, the day-one impact of the new current expected credit loss accounting rule on retained earnings over a period of three years.
Economic Growth, Regulatory Relief, and Consumer Protection Act
The Economic Growth, Regulatory Relief, and Consumer Protection Act (The “Economic Growth Act”), which was signed into law on May 24, 2018, scales back certain requirements of the Dodd-Frank Act and provides other regulatory relief. Title II of the Economic Growth Act provides regulatory relief to community banks, which are generally characterized in the statute as banking organizations with less than $15$10 billion in total consolidated assets such as our Company and Bank. We continuewith limited trading activities. The Economic Growth Act requires the federal banking agencies to develop a “community bank leverage ratio” (the ratio of a bank’s tangible equity capital to average total consolidated assets) for financial institutions with assets of less than $10 billion. A financial institution can elect to be subject to this new definition. The federal banking agencies must set the minimum capital for this ratio at not less than 8% and not more than 10%. A community bank that exceeds this ratio will be deemed to be in compliance with all other capital and leverage requirements, including the capital requirements to be considered well-capitalized“well capitalized” under Basel III.the statutes that provide for prompt corrective action classifying insured depository institutions into five categories based on their relative capital levels. The federal banking agencies may consider a financial institution’s risk profile when evaluating whether it qualifies as a community bank for purposes of the capital ratio requirement. See “FDIC Regulations – Prompt Corrective Regulatory Action.”
31
The Truth in Lending Act (“TILA”) is the commonly used name for Title I of the Consumer Credit Protection Act, passed by Congress in 1968, which is the consumer protection law specifying what information lenders must share with borrowers before giving them a loan or line of credit. This information includes the annual percentage rate, loan terms, and total cost of the loan. Section 101 of the Economic Growth Act amends the TILA to add a safe harbor for "plain vanilla" mortgage loans originated by banking organizations and credit unions with less than $10 billion in total consolidated assets under existing qualified mortgage and ability to pay rules. This amendment would allow community banks to exercise greater discretion in lending decisions.
On December 10, 2013, our primary federal regulators adopted Section 619 of the Dodd-Frank Act, commonly referred to as the “Volcker Rule,” whichgenerally prohibits insured depository institutions and any company affiliated with an insured depository institution from engaging in short-term proprietary trading ofand from acquiring or retaining ownership interests in, sponsoring, or having certain securities, derivatives and other financial instruments for the firm’s own account,relationships with a hedge fund or private equity fund. These prohibitions are subject to certaina number of statutory exemptions, including market makingrestrictions, and risk-mitigating hedging. The Volcker Rule also imposes limits on banking entities’ investments in, and other relationships with, hedge funds and private equity funds. The financial industry has strongly opposeddefinitions. Under the Economic Growth Act, community banks are now exempt from the Volcker Rule which remains controversial and the subject of continuing debate. Further, as noted above, President Trump has indicated an intention to review many financial industry regulations. In this regard, in January 2017, the Treasury Secretary, Steven Mnuchin, publicly stated the intention that the regulatory impact of the Volcker Rule be loosened. At this time, it is too early to know whether any changes will be proposed or implemented or what impact any changes may have on the Bank or the Company.its proprietary trading prohibitions.
The rule as adopted prohibited banking entities from owning collateralized debt obligations backed primarily by trust preferred securities (“TruPS CDOs”) after July 21, 2015. At December 31, 2016 and 2015, the Company did not hold any TruPs CDOs.
The Bank derives its lending, investment, and other authority primarily from the applicable provisions of New York State Banking Law and the regulations of the NYDFS, as limited by FDIC regulations. Under these laws and regulations, banks, including the Bank, may invest in real estate mortgages, consumer and commercial loans, certain types of debt securities (including certain corporate debt securities, and obligations of federal, state, and local governments and agencies), certain types of corporate equity securities, and certain other assets. The lending powers of New York State-chartered commercial banks are not subject to percentage-of-assets or capital limitations, although there are limits applicable to loans to individual borrowers.
The exercise by an FDIC-insured commercial bank of the lending and investment powers under New York State Banking Law is limited by FDIC regulations and other federal laws and regulations. In particular, the applicable provisions of New York State Banking Law and regulations governing the investment authority and activities of an FDIC-insured state-chartered savings bank and commercial bank have been effectively limited by the Federal Deposit Insurance Corporation Improvement Act of 1991 (“FDICIA”) and the FDIC regulations issued pursuant thereto.
With certain limited exceptions, a New York State-chartered commercial bank may not make loans or extend credit for commercial, corporate, or business purposes (including lease financing) to a single borrower, the aggregate amount of which would be in excess of 15% of the bank’s net worth or up to 25% for loans secured by collateral having an ascertainable market value at least equal to the excess of such loans over the bank’s net worth. The Bank currently complies with all applicable loans-to-one-borrower limitations. At December 31, 2016,2018, the Bank’s largest aggregate amount of loans to one borrower was $74.0$83.1 million, all of which were performing according to their terms. See “— General — Lending Activities.”
Under New York State Banking Law, New York State-chartered stock-form commercial banks may declare and pay dividends out of its net profits, unless there is an impairment of capital, but approval of the NYDFS Superintendent (the “Superintendent”) is required if the total of all dividends declared by the bank in a calendar year would exceed the total of its net profits for that year combined with its retained net profits for the preceding two years less prior dividends paid.
New York State Banking Law gives the Superintendent authority to issue an order to a New York State-chartered banking institution to appear and explain an apparent violation of law, to discontinue unauthorized or unsafe practices, and to keep prescribed books and accounts. Upon a finding by the NYDFS that any director, trustee, or officer of any banking organization has violated any law, or has continued unauthorized or unsafe practices in conducting the business of the banking organization after having been notified by the Superintendent to discontinue such practices, such director, trustee, or officer may be removed from office after notice and an opportunity to be heard. The Superintendent also has authority to appoint a conservator or a receiver for a savings or commercial bank under certain circumstances.
In addition, onOn February 16, 2017, the NYDFS issued the final version of its cybersecurity regulation, which has an effective date of March 1, 2017. The regulation, which is detailed and broad in scope, covers five basic areas.
Governance: The regulation requires senior management and boards of directors must adopt a cybersecurity policy for protecting information systems and most sensitive information. Covered companies must also designate a Chief Information Security Officer, who must report to the board annually. The cybersecurity policy mustwas required to be in place, and the security officer designated, by August 28, 2017. Commencing September 4, 2018, we were required to have commenced mandatory annual reporting to the board by the Chief Information Security Officer concerning critical aspects of our cybersecurity program.
32
Testing: The regulation requires the conduct of cybersecurity tests and analyses, including a “risk assessment” to “evaluate and categorize risks,” evaluate the integrity and confidentiality of information systems and non-public information, and develop a process to mitigate any identified risks. These tests and assessments must be conducted by March 1, 2018.
Ongoing Requirements: The regulation imposes substantial day-to-day and technical requirements. Among others, we must develop and/or maintain access controls for our information systems, ensure the physical security of our computer systems, encrypt or protect personally identifiable information, perform reviews of in-house and externally created applications, train employees, and build an audit trail system. The timeline to ensure compliance with these rules ranges from one year to eighteen months.
Vendors: The new regulation also regulates third-party vendors with access to our information technology or non-public information. We will be required to develop and implement written policies and procedures to ensure the security of our information technology systems or non-public information that can be accessed by our vendors, including identifying the risks from third-party access, imposing minimum cybersecurity practices for vendors, and creating a due-diligence process for evaluating those vendors. We will have two years to satisfy these extensive requirements.
Reports: The new regulation imposes a notification process for any material cybersecurity event. Within 72 hours, a cybersecurity event that has a “reasonable likelihood” of “materially harming” us or that must be reported to another government or self-regulating agency must be reported to the NYDFS. In addition, an annual compliance certification to the NYDFS from either the board or a senior officer is required.
Capital Requirements. The FDIC has adopted risk-based capital guidelines to which the Bank is subject. The guidelines establish a systematic analytical framework that makes regulatory capital requirements sensitive to differences in risk profiles among banking organizations. The Bank is required to maintain certain levels of regulatory capital in relation to regulatory risk-weighted assets. The ratio of such regulatory capital to regulatory risk-weighted assets is referred to as a “risk-based capital ratio.” Risk-based capital ratios are determined by allocating assets and specified off-balance-sheet items to risk-weighted categories ranging from 0% to 1,250%, with higher levels of capital being required for the categories perceived as representing greater risk.
These guidelines divide an institution’s capital into two tiers. The first tier (“Tier 1”) includes common equity, retained earnings, certain non-cumulative perpetual preferred stock (excluding auction rate issues), and minority interests in equity accounts of consolidated subsidiaries, less goodwill and other intangible assets (except mortgage servicing rights and purchased credit card relationships subject to certain limitations). Supplementary (“Tier 2”) capital includes, among other items, cumulative perpetual and long-term limited-life preferred stock, mandatorily convertible securities, certain hybrid capital instruments, term subordinated debt, and the allowance for loan losses,ALL, subject to certain limitations, and up to 45% of pre-tax net unrealized gains on equity securities with readily determinable fair market values, less required deductions. Commercial banks are required to maintain a total risk-based capital ratio of at least 8%, of which at least 4% must be Tier 1 capital.
In addition, the FDIC has established regulations prescribing a minimum Tier 1 leverage capital ratio (the ratio of Tier 1 capital to adjusted average assets as specified in the regulations). These regulations provide for a minimum Tier 1 leverage capital ratio of at least 4%. The FDIC may, however, set higher leverage and risk-based capital requirements on individual institutions when particular circumstances warrant. Institutions experiencing or anticipating significant growth are expected to maintain capital ratios, including tangible capital positions, well above the minimum levels.
As of December 31, 2016, the Bank was deemed to be well capitalized under the regulatory framework for prompt corrective action. To be categorized as well capitalized, a bank must maintain a minimum Tier 1 leverage capital ratio of 5%, a minimum common equity Tier 1 capital ratio of 6.5%, a minimum Tier 1 risk-based capital ratio of 8%, and a minimum total risk-based capital ratio of 10%. For a summary of the regulatory capital ratios of the Bank at December 31, 2016, see “Note 14 of Notes to Consolidated Financial Statements” in Item 8 of this Annual Report.See “Prompt Corrective Regulatory Action” below.
The regulatory capital regulations of the FDIC and other federal banking agencies provide that the agencies will take into account the exposure of an institution’s capital and economic value to changes in interest rate risk in assessing capital adequacy. According to such agencies, applicable considerations include the quality of the institution’s interest rate risk management process, overall financial condition, and the level of other risks at the institution for which capital is needed. Institutions with significant interest rate risk may be required to hold additional capital. The agencies have issued a joint policy statement providing guidance on interest rate risk management, including a discussion of the critical factors affecting the agencies’ evaluation of interest rate risk in connection with capital adequacy. Institutions that engage in specified amounts of trading activity may be subject to adjustments in the calculation of the risk-based capital requirement to assure sufficient additional capital to support market risk.
Standards for Safety and Soundness. Federal law requires each federal banking agency to prescribe, for the depository institutions under its jurisdiction, standards that relate to, among other things, internal controls; information and audit systems; loan documentation; credit underwriting; the monitoring of interest rate risk; asset growth; compensation; fees and benefits; and such other operational and managerial standards as the agency deems appropriate. The federal banking agencies adopted final regulations and Interagency Guidelines Establishing Standards for Safety and Soundness (the “Guidelines”) to implement these safety and soundness standards. The Guidelines set forth the safety and soundness standards that the federal banking agencies use to identify and address problems at insured depository institutions before capital becomes impaired. If the appropriate federal banking agency determines that an institution fails to meet any standard prescribed by the Guidelines, the agency may require the institution to provide it with an acceptable plan to achieve compliance with the standard, as required by the Federal Deposit Insurance Act, as amended, (the “FDI Act”). The final regulations establish deadlines for the submission and review of such safety and soundness compliance plans.
33
Real Estate Lending Standards. The FDIC and the other federal banking agencies have adopted regulations that prescribe standards for extensions of credit that are (i) secured by real estate, or (ii) made for the purpose of financing construction or improvements on real estate. The FDIC regulations require each institution to establish and maintain written internal real estate lending standards that are consistent with safe and sound banking practices, and appropriate to the size of the institution and the nature and scope of its real estate lending activities. The standards also must be consistent with accompanying FDIC guidelines, which include loan-to-value limitations for the different types of real estate loans. Institutions are also permitted to make a limited amount of loans that do not conform to the proposed loan-to-value limitations so long as such exceptions are reviewed and justified appropriately. The FDIC guidelines also list a number of lending situations in which exceptions to the loan-to-value standard are justified.
Dividend Limitations. The FDIC has authority to use its enforcement powers to prohibit a commercial bank from paying dividends if, in its opinion, the payment of dividends would constitute an unsafe or unsound practice. Federal law prohibits the payment of dividends that will result in the institution failing to meet applicable capital requirements on a pro forma basis. The Bank is also subject to dividend declaration restrictions imposed by New York State law as previously discussed under “New York State Law.”
Investment Activities. Since the enactment of FDICIA, all state-chartered financial institutions, including commercial banks and their subsidiaries, have generally been limited to such activities as principal and equity investments of the type, and in the amount, authorized for national banks. State law, FDICIA, and FDIC regulations permit certain exceptions to these limitations. In addition, the FDIC is authorized to permit institutions to engage in state-authorized activities or investments not permitted for national banks (other than non-subsidiary equity investments) for institutions that meet all applicable capital requirements if it is determined that such activities or investments do not pose a significant risk to the insurance fund. The Gramm-Leach-Bliley Act of 1999 and FDIC regulations impose certain quantitative and qualitative restrictions on such activities and on a bank’s dealings with a subsidiary that engages in specified activities.
Prompt Corrective Regulatory Action. Federal law requires, among other things, that federal bank regulatory authorities take “prompt corrective action” with respect to institutions that do not meet minimum capital requirements. For such purposes, the law establishes five capital tiers: well capitalized, adequately capitalized, undercapitalized, significantly undercapitalized, and critically undercapitalized.
The FDIC has adopted regulations to implement prompt corrective action. Among other things, the regulations define the relevant capital measures for the five capital categories. An institution is deemed to be “well capitalized” if it has a total risk-based capital ratio of 10% or greater, a Tier 1 risk-based capital ratio of 8% or greater, a common equity Tier 1 risk-based capital ratio of 6.5% and a leverage capital ratio of 5% or greater, and is not subject to a regulatory order, agreement, or directive to meet and maintain a specific capital level for any capital measure. An institution is deemed to be “adequately capitalized” if it has a total risk-based capital ratio of 8% or greater, a Tier 1 risk-based capital ratio of 6% or greater, a common equity Tier 1 risk-based capital ratio of 4.5% or greater and a leverage capital ratio of 4% or greater. An institution is deemed to be “undercapitalized” if it has a total risk-based capital ratio of less than 8%, a Tier 1 risk-based capital ratio of less than 6%, a common equity Tier 1 risk-based capital ratio of less than 4.5% or a leverage capital ratio of less than 4%. An institution is deemed to be “significantly undercapitalized” if it has a total risk-based capital ratio of less than 6%, a Tier 1 risk-based capital ratio of less than 4% a common equity Tier 1 risk-based capital ratio of less than 3.0%3%, or a leverage capital ratio of less than 3%. An institution is deemed to be “critically undercapitalized” if it has a ratio of tangible equity (as defined in the regulations) to total assets that is equal to or less than 2%.
“Undercapitalized” institutions are subject For a summary of the regulatory capital ratios of the Bank at December 31, 2018, see “Note 14 of Notes to growth, capital distribution (including dividend), and other limitations, and are requiredConsolidated Financial Statements” in Item 8 of this Annual Report. An institution may be downgraded to, submitor deemed to be in, a capital restoration plan. An institution’s compliance with such plancategory that is requiredlower than indicated by its capital ratios if it is determined to be guaranteed by any company that controls the undercapitalized institution in an amount equalunsafe or unsound condition or if it receives an unsatisfactory examination rating with respect to certain matters. A bank’s capital category is determined solely for the lesserpurpose of 5%applying prompt corrective action regulations, and the capital category may not constitute an accurate representation of the bank’s total assets when deemed undercapitalizedoverall financial condition or the amount necessary to achieve the status of adequately capitalized. If an undercapitalized institution fails to submit an acceptable plan, it is treated as if it is “significantly undercapitalized.” Significantly undercapitalized institutions are subject to one or more additional restrictions including, but not limited to, an order by the FDIC to sell sufficient voting stock to become adequately capitalized; requirements to reduce total assets, cease receipt of deposits from correspondent banks, or dismiss directors or officers; and restrictions on interest rates paid on deposits, compensation of executive officers, and capital distributions by the parent holding company.prospects for other purposes.
Beginning 60 days after becoming “critically undercapitalized,” critically undercapitalized institutions also may not make any payment of principal or interest on certain subordinated debt, or extend credit for a highly leveraged transaction, or enter into any material transaction outside the ordinary course of business. In addition, subject to a narrow exception, the appointment of a receiver is required for a critically undercapitalized institution within 270 days after it obtains such status.
Insurance of Deposit Accounts. The Dodd-Frank Act made permanent the standard maximum amount of FDIC deposit insurance at $250,000 per depositor. In addition, the deposits of the Bank are insured up to applicable limits by the DIF. In this regard, insured depository institutions are required to pay quarterly deposit insurance assessments to the DIF. Assessments are based on average total assets minus average tangible equity. TheThrough the second quarter of 2016, the assessment rate iswas determined through a risk-based system. For depository institutions with less than $10 billion in assets, such as the Bank, under the FDIC’s risk-based assessment system, insured institutions arewere assigned to one of four risk categories based upon supervisory evaluations, regulatory capital level, and certain other factors, with less risky institutions paying lower assessments. AnThrough the second quarter of 2016, an institution’s assessment rate dependsdepended upon the category to which it iswas assigned and certain other factors. The initial base assessment rate currently rangesranged from five to 35 basis points on an annualized basis. The initial base assessment rate is then decreased depending on the institution's ratio of long-term unsecured debt to its assessment base (with such decrease not to exceed the lesser of five basis points or 50% of the initial base assessment rate) and, for institutions not in the highest risk category, increased if the institution's brokered deposits are more than ten percent of its domestic deposits (with such increase not to exceed ten basis points). The currentThrough the second quarter of 2016, the total base assessment rate iswas therefore from 2.5 to 45 basis points on an annualized basis.
34
Under a final rule adopted in April 2016, effective in the third quarter of 2016, the risk based system was amended for banks with less than $10.0 billion in assets that have been FDIC-insured for at least five years. The Dodd-Frank Act increasedfinal rule replaced the minimum target DIF ratio from 1.15%four risk categories for determining such a bank's assessment rate with a financial ratios method based on a statistical model estimating the bank's probability of estimated insured deposits to 1.35%failure over three years utilizing seven financial ratios (leverage ratio; net income before taxes/total assets; nonperforming loans and leases/gross assets; other real estate owned/gross assets; brokered deposit ratio; one year asset growth; and loan mix index) and a weighted average of estimated insured deposits.supervisory ratings components. The FDIC must seek to achieve the 1.35% ratio by September 30, 2020. Insured institutions with assets of $10 billion or more are supposed to fund the increase. The Dodd-Frank Actfinal rule also eliminated the 1.5% maximum fundbrokered deposit downward adjustment factor for such banks' assessment rates, providing a new brokered deposit ratio leaving it, instead,applicable to all small banks, whereby brokered deposits in excess of 10% of total assets (inclusive of reciprocal deposits if a bank is not well capitalized or has a composite supervisory rating other than a 1 or 2) as a result of which assessment rates may be increased for banks which experience rapid growth; lowers the discretionrange of assessment rates authorized to 1.5 basis points for an institution posing the least risk, to 40 basis points for an institution posing the most risk; and will further lower the range of assessment rates if the reserve ratio of the FDIC. The FDIC has exercised that discretion by establishing a long range fund ratio ofDIF increases to 2%, which could result or more. Banks with over $10.0 billion in our paying higher deposit insurance premiums in the future.
Insurance of deposits may be terminated by the FDIC upon a finding that the institution has engaged in unsafe or unsound practices, is in an unsafe or unsound condition to continue operations, or has violated any applicable law, regulation, rule, order, or condition imposed by the FDIC. Management does not know of any practice, condition, or violation that would lead to termination of the deposit insurance of the Bank.
As part of an omnibus appropriations bill, the Deposit Insurance Funds Act of 1996 (the “Funds Act”) was enacted. The Funds Actassets are required Bank Insurance Fund (“BIF”) institutions, including the Savings Bank, beginning January 1, 1997, to pay a portionsurcharge of 4.5 basis points on their assessment basis, subject to certain adjustments. The FDIC may also impose special assessments from time to time. At December 31, 2018, the interest due on the FinanceBank had $301.7 million in brokered deposit accounts.
FDIC deposit insurance expense includes deposit insurance assessments and Financing Corporation (“FICO”) assessments related to outstanding bonds issued in connection with the savings and loan association crisisby FICO in the late 1980s and required BIF institutions to pay their full pro rata share ofrecapitalize the FICO payments starting the earlier of January 1, 2000 or the date at which no savings institution continues to exist. We were required, as of January 1, 2000, to pay our full pro rata share of the FICO payments. The FICO assessment rate is subject to change.now defunct Federal Savings & Loan Insurance Corporation. The Bank paid $297,000, $278,000$175,000, $289,000 and $267,000$297,000 for their share of the interest due on FICO bonds in 2016, 20152018, 2017 and 2014,2016, respectively, which is included in FDIC insurance expense. These payments, which generally approximate 10% of the Bank's annual FDIC insurance payments, will continue until those bonds mature through 2019.
Brokered Deposits. The FDIC has promulgated regulations implementing the FDICIA limitations on brokered deposits. Under the regulations, well-capitalized institutions are not subject to brokered deposit limitations, while adequately capitalized institutions are able to accept, renew or roll over brokered deposits only with a waiver from the FDIC and subject to restrictions on the interest rate that can be paid on such deposits. Undercapitalized institutions are not permitted to accept brokered deposits and may not solicit deposits by offering an effective yield that exceeds by more than 75 basis points the prevailing effective yields on insured deposits of comparable maturity in the institution’s normal market area or in the market area in which such deposits are being solicited. Pursuant to the regulation, the Bank, as a well-capitalized institution, may accept brokered deposits. At December 31, 2016, the Bank had $1,114.9 million in brokered deposit accounts.
Under current federal law, transactions between depository institutions and their affiliates are governed by Sections 23A and 23B of the Federal Reserve Act and the FRB’s Regulation W promulgated thereunder. An affiliate of a commercial bank is any company or entity that controls, is controlled by, or is under common control with, the institution, other than a subsidiary. Generally, an institution’s subsidiaries are not treated as affiliates unless they are engaged in activities as principal that are not permissible for national banks. In a holding company context, at a minimum, the parent holding company of an institution, and any companies that are controlled by such parent holding company, are affiliates of the institution. Generally, Section 23A limits the extent to which the institution or its subsidiaries may engage in “covered transactions” with any one affiliate to an amount equal to 10% of the institution’s capital stock and surplus, and contains an aggregate limit on all such transactions with all affiliates to an amount equal to 20% of such capital stock and surplus. The term “covered transaction” includes the making of loans or other extensions of credit to an affiliate; the purchase of assets from an affiliate; the purchase of, or an investment in, the securities of an affiliate; the acceptance of securities of an affiliate as collateral for a loan or extension of credit to any person; or issuance of a guarantee, acceptance, or letter of credit on behalf of an affiliate. Section 23A also establishes specific collateral requirements for loans or extensions of credit to, or guarantees or acceptances on letters of credit issued on behalf of, an affiliate. Section 23B requires that covered transactions and a broad list of other specified transactions be on terms substantially the same as, or at least as favorable to, the institution or its subsidiary as similar transactions with non-affiliates.
The Sarbanes-Oxley Act of 2002 generally prohibits loans by the Company to its executive officers and directors. However, the Sarbanes-Oxley Act contains a specific exemption for loans by an institution to its executive officers and directors in compliance with federal banking laws. Section 22(h) of the Federal Reserve Act, and FRB Regulation O adopted thereunder, governs loans by a savings bank or commercial bank to directors, executive officers, and principal shareholders. Under Section 22(h), loans to directors, executive officers, and shareholders who control, directly or indirectly, 10% or more of voting securities of an institution, and certain related interests of any of the foregoing, may not exceed, together with all other outstanding loans to such persons and affiliated entities, the institution’s total capital and surplus. Section 22(h) also prohibits loans above amounts prescribed by the appropriate federal banking agency to directors, executive officers, and shareholders who control 10% or more of the voting securities of an institution, and its respective related interests, unless such loan is approved in advance by a majority of the board of the institution’s directors. Any “interested” director may not participate in the voting. The loan amount (which includes all other outstanding loans to such person) as to which such prior board of director approval is required, is the greater of $25,000 or 5% of capital and surplus or any loans aggregating over $500,000. Further, pursuant to Section 22(h), loans to directors, executive officers, and principal shareholders must be made on terms substantially the same as those offered in comparable transactions to other persons. There is an exception for loans made pursuant to a benefit or compensation program that is widely available to all employees of the institution and does not give preference to executive officers over other employees. Section 22(g) of the Federal Reserve Act places additional limitations on loans to executive officers.
35
Federal Regulation. Under the Community Reinvestment Act (“CRA”), as implemented by FDIC regulations, an institution has a continuing and affirmative obligation consistent with its safe and sound operation to help meet the credit needs of its entire community, including low and moderate income neighborhoods. The CRA does not establish specific lending requirements or programs for financial institutions, nor does it limit an institution’s discretion to develop the types of products and services that it believes are best suited to its particular community, consistent with the CRA. The CRA requires the FDIC, in connection with its examinations, to assess the institution’s record of meeting the credit needs of its community and to take such record into account in its evaluation of certain applications by such institution. The CRA requires public disclosure of an institution’s CRA rating and further requires the FDIC to provide a written evaluation of an institution’s CRA performance utilizing a four-tiered descriptive rating system. The Bank received a CRA rating of “Satisfactory”“Outstanding” in its most recent completed CRA examination, which was completed as of April 16, 2015.June 25, 2018. Institutions that receive less than a satisfactory rating may face difficulties in securing approval for new activities or acquisitions. The CRA requires all institutions to make public disclosures of their CRA ratings. As a special purpose commercial bank, the Commercial Bank was not required to comply with the CRA prior to the Merger. Since the Merger, the Bank is required to comply with CRA.
New York State Regulation. The Bank is also subject to provisions of the New York State Banking Law that impose continuing and affirmative obligations upon a banking institution organized in New York State to serve the credit needs of its local community (the “NYCRA”). Such obligations are substantially similar to those imposed by the CRA. The NYCRA requires the NYDFS to make a periodic written assessment of an institution’s compliance with the NYCRA, utilizing a four-tiered rating system, and to make such assessment available to the public. The NYCRA also requires the Superintendent to consider the NYCRA rating when reviewing an application to engage in certain transactions, including mergers, asset purchases, and the establishment of branch offices or ATMs, and provides that such assessment may serve as a basis for the denial of any such application.
Under FRB regulations, the Bank is required to maintain cash reserves against its transaction accounts.accounts (primarily interest-bearing demand deposit accounts and demand deposit accounts). The FRB regulations generally require that reserves be maintained against aggregate transaction accounts as follows: for that portion of transaction accounts aggregating $103.6between $16.0 million or lessand $122.3 million (subject to adjustment by the FRB), the reserve requirement is 3%; for amounts greater than $103.6$122.3 million, the reserve requirement is 10% (subject to adjustment by the FRB between 8% and 14%). The first $14.5$16.0 million of otherwise reservable balances (subject to adjustments by the FRB) are exempted from the reserve requirements. The Bank is in compliance with the foregoing requirements.
The Bank is a member of the FHLB-NY, one of 11 regional FHLBs comprising the FHLB system. Each regional FHLB manages its customer relationships, while the 11 FHLBs use its combined size and strength to obtain its necessary funding at the lowest possible cost. As a member of the FHLB-NY, the Bank is required to acquire and hold shares of FHLB-NY capital stock. Pursuant to this requirement, at December 31, 2016,2018, the Bank was required to maintain $59.2$57.3 million of FHLB-NY stock.
Holding Company RegulationRegulations
Subsequent to the Merger, theThe Company is subject to examination, regulation, and periodic reporting under the Bank Holding Company Act of 1956, as amended (the “BHCA”), as administered by the FRB. The Company is required to obtain the prior approval of the FRB to acquire all, or substantially all, of the assets of any bank or bank holding company. Prior FRB approval would be required for the Company to acquire direct or indirect ownership or control of any voting securities of any bank or bank holding company if, after giving effect to such acquisition, it would, directly or indirectly, own or control more than 5% of any class of voting shares of such bank or bank holding company. In addition before any bank acquisition can be completed, prior approval thereof may also be required to be obtained from other agencies having supervisory jurisdiction over the bank to be acquired, including the NYDFS.
FRB regulations generally prohibit a bank holding company from engaging in, or acquiring, direct or indirect control of more than 5% of the voting securities of any company engaged in non-banking activities. One of the principal exceptions to this prohibition is for activities found by the FRB to be so closely related to banking or managing or controlling Bank as to be a proper incident thereto. Some of the principal activities that the FRB has determined by regulation to be so closely related to banking are: (i) making or servicing loans; (ii) performing certain data processing services; (iii) providing discount brokerage services; (iv) acting as fiduciary, investment, or financial advisor; (v) leasing personal or real property; (vi) making investments in corporations or projects designed primarily to promote community welfare; and (vii) acquiring a savings and loan association.
36
The FRB has adopted capital adequacy guidelines for bank holding companies (on a consolidated basis). At December 31, 2016,2018, the Company’s consolidated capital exceeded these requirements. The Dodd-Frank Act required the FRB to issue consolidated regulatory capital requirements for bank holding companies that are at least as stringent as those applicable to insured depository institutions. Such regulations eliminated the use of certain instruments, such as cumulative preferred stock and trust preferred securities, as Tier 1 holding company capital.
Bank holding companies are generally required to give the FRB prior written notice of any purchase or redemption of its outstanding equity securities if the gross consideration for the purchase or redemption, when combined with the net consideration paid for all such purchases or redemptions during the preceding twelve months, is equal to 10% or more of the Company’s consolidated net worth. The FRB may disapprove such a purchase or redemption if it determines that the proposal would constitute an unsafe or unsound practice, or would violate any law, regulation, FRB order or directive, or any condition imposed by, or written agreement with, the FRB. The FRB has adopted an exception to this approval requirement for well-capitalized bank holding companies that meet certain other conditions.
The FRB has issued a policy statement regarding the payment of dividends by bank holding companies. In general, the FRB’s policies provide that dividends should be paid only out of current earnings and only if the prospective rate of earnings retention by the bank holding company appears consistent with the organization’s capital needs, asset quality, and overall financial condition. The FRB’s policies also require that a bank holding company serve as a source of financial strength to its subsidiary banks by standing ready to use available resources to provide adequate capital funds to those banks during periods of financial stress or adversity, and by maintaining the financial flexibility and capital-raising capacity to obtain additional resources for assisting its subsidiary banks where necessary. The Dodd-Frank Act codifies the source of financial strength policy and requires regulations to facilitate its application. Under the prompt corrective action laws, the ability of a bank holding company to pay dividends may be restricted if a subsidiary bank becomes undercapitalized. These regulatory policies could affect the ability of the Company to pay dividends or otherwise engage in capital distributions.
Under the FDI Act, a depository institution may be liable to the FDIC for losses caused the DIF if a commonly controlled depository institution were to fail. The Bank is commonly controlled within the meaning of that law.
The status of the Company as a registered bank holding company under the BHCA does not exempt it from certain federal and state laws and regulations applicable to corporations generally, including, without limitation, certain provisions of the federal securities laws.
The Company, the Bank, and their respective affiliates will be affected by the monetary and fiscal policies of various agencies of the United States Government, including the Federal Reserve System. In view of changing conditions in the national economy and in the money markets, it is difficult for management to accurately predict future changes in monetary policy or the effect of such changes on the business or financial condition of the Company or the Bank.
Acquisition of the Holding Company
Under the Federal Change in Bank Control Act (“CIBCA”), a notice must be submitted to the FRB if any person (including a company), or group acting in concert, seeks to acquire 10% or more of the Company’s shares of outstanding common stock, unless the FRB has found that the acquisition will not result in a change in control of the Company. Under the CIBCA, the FRB generally has 60 days within which to act on such notices, taking into consideration certain factors, including the financial and managerial resources of the acquirer; the convenience and needs of the communities served by the Company and the Bank; and the anti-trust effects of the acquisition. Under the BHCA, any company would be required to obtain approval from the FRB before it may obtain “control” of the Company within the meaning of the BHCA. Control generally is defined to mean the ownership or power to vote 25% or more of any class of voting securities of the Company or the ability to control in any manner the election of a majority of the Company’s directors. An existing bank holding company would, under the BHCA, be required to obtain the FRB’s approval before acquiring more than 5% of the Company’s voting stock. In addition to the CIBCA and the BHCA, New York State Banking Law generally requires prior approval of the New York State Banking Board before any action is taken that causes any company to acquire direct or indirect control of a banking institution that is organized in New York.
Consumer Financial Protection Bureau
Created under the Dodd-Frank Act, and given extensive implementation and enforcement powers, the CFPB has broad rulemaking authority for a wide range of consumer financial laws that apply to all banks, including, among other things, the authority to prohibit “unfair, deceptive, or abusive” acts and practices. Abusive acts or practices are defined as those that (1) materially interfere with a consumer’s ability to understand a term or condition of a consumer financial product or service, or (2) take unreasonable advantage of a consumer’s (a) lack of financial savvy, (b) inability to protect himself in the selection or use of consumer financial products or services, or (c) reasonable reliance on a covered entity to act in the consumer’s interests. The CFPB has the authority to investigate possible violations of federal consumer financial law, hold hearings and commence civil litigation. The CFPB can issue cease-and-desist orders against banks and other entities that violate consumer financial laws. The CFPB may also institute a civil action against an entity in violation of federal consumer financial law in order to impose a civil penalty or an injunction.
37
Mortgage Banking and Related Consumer Protection Regulations
The retail activities of the Bank, including lending and the acceptance of deposits, are subject to a variety of statutes and regulations designed to protect consumers. Interest and other charges collected or contracted for by the Bank are subject to state usury laws and federal laws concerning interest rates. Loan operations are also subject to federal laws applicable to credit transactions, such as:
| • | The federal Truth-In-Lending Act and Regulation Z issued by the FRB, governing disclosures of credit terms to consumer borrowers; | ||
| • | The Home Mortgage Disclosure Act and Regulation C issued by the FRB, requiring financial institutions to provide information to enable the public and public officials to determine whether a financial institution is fulfilling its obligation to help meet the housing needs of the community it serves; | ||
| • | The Equal Credit Opportunity Act and Regulation B issued by the FRB, prohibiting discrimination on the basis of race, creed or other prohibited factors in extending credit; | ||
| • | The Fair Credit Reporting Act and Regulation V issued by the FRB, governing the use and provision of information to consumer reporting agencies; | ||
| • | The Fair Debt Collection Act, governing the manner in which consumer debts may be collected by collection agencies; and | ||
| • | The guidance of the various federal agencies charged with the responsibility of implementing such federal laws. |
Deposit operations also are subject to:
| • | The Truth in Savings Act and Regulation DD issued by the FRB, which requires disclosure of deposit terms to consumers; | ||
| • | Regulation CC issued by the FRB, which relates to the availability of deposit funds to consumers; | ||
| • | The Right to Financial Privacy Act, which imposes a duty to maintain the confidentiality of consumer financial records and prescribes procedures for complying with administrative subpoenas of financial records; and | ||
| • | The Electronic Funds Transfer Act and Regulation E issued by the FRB, which governs automatic deposits to and withdrawals from deposit accounts and customers’ rights and liabilities arising from the use of automated teller machines and other electronic banking services. |
In addition, the Bank and its subsidiaries may also be subject to certain state laws and regulations designed to protect consumers.
Many of the foregoing laws and regulations are subject to change resulting from the provisions in the Dodd-Frank Act, which in many cases calls for revisions to implementing regulations. In addition, oversight responsibilities of these and other consumer protection laws and regulations will, in large measure, transfer from the Bank’s primary regulators to the CFPB. We cannot predict the effect that being regulated by a new, additional regulatory authority focused on consumer financial protection, or any new implementing regulations or revisions to existing regulations that may result from the establishment of this new authority, will have on our businesses.
We are a reporting company and file annual, quarterly and current reports, proxy statements and other information with the SEC. We make available free of charge on or through our web site at www.flushingbank.com our annual reports on Form 10-K, quarterly reports on Form 10-Q, current reports on Form 8-K and amendments to those reports filed or furnished pursuant to Section 13(a) or 15(d) of the Securities Exchange Act of 1934 as soon as reasonably practicable after we electronically file such material with, or furnish it to, the SEC. Our SEC filings are also available to the public free of charge over the Internet at the SEC’s web site at http://www.sec.gov.
You may also read and copy any document we file at the SEC’s public reference room located at 100 F. Street, N.E., Room 1580, Washington, D.C. 20549. You may obtain information about the operation of the public reference room by calling the SEC at 1-800-SEC-0330. You may request copies of these documents by writing to the SEC and paying a fee for the copying cost.
| Item 1A. | Risk Factors. |
In addition to the other information contained in this Annual Report, the following factors and other considerations should be considered carefully in evaluating us and our business.
Changes in Interest Rates May Significantly Impact Our Financial Condition and Results of Operations
Like most financial institutions, our results of operations depend to a large degree on our net interest income. When interest-bearing liabilities mature or reprice more quickly than interest-earning assets, a significant increase in market interest rates could adversely affect net interest income. Conversely, a significant decrease in market interest rates could result in increased net interest income. As a general matter, we seek to manage our business to limit our overall exposure to interest rate fluctuations. However, fluctuations in market interest rates are neither predictable nor controllable and may have a material adverse impact on our operations and financial condition. Additionally, in a rising interest rate environment, a borrower’s ability to repay adjustable rate mortgages can be negatively affected as payments increase at repricing dates.
Prevailing interest rates also affect the extent to which borrowers repay and refinance loans. In a declining interest rate environment, the number of loan prepayments and loan refinancing may increase, as well as prepayments of mortgage-backed securities. Call provisions associated with our investment in U.S. government agency and corporate securities may also adversely affect yield in a declining interest rate environment. Such prepayments and calls may adversely affect the yield of our loan portfolio and mortgage-backed and other securities as we reinvest the prepaid funds in a lower interest rate environment. However, we typically receive additional loan fees when existing loans are refinanced, which partially offset the reduced yield on our loan portfolio resulting from prepayments. In periods of low interest rates, our level of core deposits also may decline if depositors seek higher-yielding instruments or other investments not offered by us, which in turn may increase our cost of funds and decrease our net interest margin to the extent alternative funding sources are utilized. An increasing interest rate environment would tend to extend the average lives of lower yielding fixed rate mortgages and mortgage-backed securities, which could adversely affect net interest income. In addition, depositors tend to open longer term, higher costing certificate of deposit accounts which could adversely affect our net interest income if rates were to subsequently decline. Additionally, adjustable rate mortgage loans and mortgage-backed securities generally contain interim and lifetime caps that limit the amount the interest rate can increase or decrease at repricing dates. Significant increases in prevailing interest rates may significantly affect demand for loans and the value of bank collateral. See “— Local Economic Conditions.”
Our Lending Activities Involve Risks that May Be Exacerbated Depending on the Mix of Loan Types
At December 31, 2016,2018, our gross loan portfolio was $4,819.1$5,536.3 million, of which 86.9%83.8% was mortgage loans secured by real estate. The majority of these real estate loans were secured by multi-family residential property ($2,178.52,269.0 million), commercial real estate ($1,246.11,542.5 million) and one-to-four family mixed-use property ($558.5577.7 million), which combined represent 82.7%79.3% of our loan portfolio. Our loan portfolio is concentrated in the New York City metropolitan area. Multi-family residential, one-to-four family mixed-use property, commercial real estate mortgage loans, commercial business loans and construction loans, are generally viewed as exposing the lender to a greater risk of loss than fully underwritten one-to-four family residential mortgage loans and typically involve higher principal amounts per loan. Multi-family residential, one-to-four family mixed-use property and commercial real estate mortgage loans are typically dependent upon the successful operation of the related property, which is usually owned by a legal entity with the property being the entity’s only asset. If the cash flow from the property is reduced, the borrower’s ability to repay the loan may be impaired. If the borrower defaults, our only remedy may be to foreclose on the property, for which the market value may be less than the balance due on the related mortgage loan. We attempt to mitigate this risk by generally requiring a loan-to-value ratio of no more than 75% at a time the loan is originated, except for one-to-four family residential mortgage loans, where we require a loan-to value ratio of no more than 80%. Repayment of construction loans is contingent upon the successful completion and operation of the project. The repayment of commercial business loans (the increased origination of which is part of management’s strategy), is contingent on the successful operation of the related business. Changes in local economic conditions and government regulations, which are outside the control of the borrower or lender, also could affect the value of the security for the loan or the future cash flow of the affected properties. We continually review the composition of our mortgage loan portfolio to manage the risk in the portfolio.
In addition, prior to 2010, we have originated one-to-four family residential mortgage loans without verifying the borrower’s level of income. These loans involve a higher degree of risk as compared to our other fully underwritten one-to-four family residential mortgage loans. These risks are mitigated by our policy to generally limit the amount of one-to-four family residential mortgage loans to 80% of the appraised value or sale price, whichever is less, as well as charging a higher interest rate than when the borrower’s income is verified. At December 31, 2016, we had $9.0 million outstanding of one-to-four family residential properties originated to individuals based on stated income and verifiable assets, and $36.6 million advanced on home equity lines of credit for which we did not verify the borrower’s income. The total loans for which we did not verify the borrower’s income at December 31, 2016 was $45.6 million, or 0.9% of gross loans. These types of loans are generally referred to as “Alt A” loans since the borrower’s income was not verified. These loans are not as readily saleable in the secondary market as our other fully underwritten loans, either as whole loans or when pooled or securitized. We no longer originate one-to-four family residential mortgage loans or home equity lines of credit to individuals without verifying their income. We have not originated, nor do we hold in portfolio, any subprime loans.
Even in stable economic times, higher default rates may be expected for Alt A and similar loans. Although we attempted to incorporate the higher default rates associated with these loans into our pricing models, there can be no assurance that the premiums earned and the associated investment income will prove adequate to compensate for future losses from these loans. Worsening economic conditions, rising unemployment rates and/or other regional real estate price declines could even more significantly increase the default risks associated with these loans. In addition, these same negative economic and market conditions could also significantly increase the default risk on loans for which we did not assume higher default and claim rates.
In assessing our future earnings prospects, investors should consider, among other things, our level of origination of one-to-four family residential, multi-family residential, commercial real estate and one-to-four family mixed-use property mortgage loans, and commercial business and construction loans, and the greater risks associated with such loans. See “Business — Lending Activities” in Item 1 of this Annual Report.
39
Failure to Effectively Manage Our Liquidity Could Significantly Impact Our Financial Condition and Results of Operations
Our liquidity is critical to our ability to operate our business. Our primary sources of liquidity are deposits, both retail deposits from our branch network including iGObanking.com®,our Internet Branch, brokered deposits, and borrowed funds, primarily wholesale borrowing from the FHLB-NY. Funds are also provided by the repayment and sale of securities and loans. Our ability to obtain funds are influenced by many external factors, including but not limited to, local and national economic conditions, the direction of interest rates and competition for deposits in the markets we serve. Additionally, changes in the FHLB-NY underwriting guidelines may limit or restrict our ability to borrow. A decline in available funding caused by any of the above factors or could adversely impact our ability to originate loans, invest in securities, meet our expenses, or fulfill our obligations such as repaying our borrowings or meeting deposit withdrawal demands.
Our Ability to Obtain Brokered Deposits as an Additional Funding Source Could be Limited
We utilize brokered deposits as an additional funding source and to assist in the management of our interest rate risk. The Bank had $1,114.9$301.7 million, or 26.5%6.1% of total deposits, and $982.8$1,090.0 million, or 25.2%25.1% of total deposits, in brokered deposit accounts at December 31, 20162018 and 2015,2017, respectively. During 2018, Section 29 of the Federal Deposit Insurance Act was amended to no longer consider reciprocal deposits held by an FDIC-insured depository institution brokered deposits. At December 31, 2018 and 2017, reciprocal deposits totaled $685.3 million and $682.4 million, respectively. We have obtained brokered certificates of deposit when the interest rate on these deposits is below the prevailing interest rate for non-brokered certificates of deposit with similar maturities in our market, or when obtaining them allowed us to extend the maturities of our deposits at favorable rates compared to borrowing funds with similar maturities, when we are seeking to extend the maturities of our funding to assist in the management of our interest rate risk. Brokered certificates of deposit provide a large deposit for us at a lower operating cost as compared to non-brokered certificates of deposit since we only have one account to maintain versus several accounts with multiple interest and maturity checks. Unlike non-brokered certificates of deposit where the deposit amount can be withdrawn with a penalty for any reason, including increasing interest rates, a brokered certificate of deposit can only be withdrawn in the event of the death or court declared mental incompetence of the depositor. This allows us to better manage the maturity of our deposits and our interest rate risk. We also at times utilize brokers to obtain money market account deposits. The rate we pay on brokered money market accounts is the same or belowsimilar to the rate we pay on non-brokered money market accounts, and the rate is agreed to in a contract between the Bank and the broker. These accounts are similar to brokered certificates of deposit accounts in that we only maintain one account for the total deposit per broker, with the broker maintaining the detailed records of each depositor. Additionally, we place a portion of our government deposits in an ICS brokered money market product, which prior to 2018 was considered a brokered deposit, does not require us to provide collateral. This allows us to invest our funds in higher yielding assets. The Bank had $655.0 million and $339.8no brokered money market or brokered checking accounts at December 31, 2018, compared to $704.9 million in brokered money market accounts at December 31, 2016 and 2015, respectively. The Bank also had $1.1 million and $17.8$4.7 million in brokered checking accounts at December 31, 2016 and 2015, respectively.2017.
The FDIC has promulgated regulations implementing limitations on brokered deposits. Under the regulations, well-capitalized institutions, such as the Bank, are not subject to brokered deposit limitations, while adequately capitalized institutions are able to accept, renew or roll over brokered deposits only with a waiver from the FDIC and subject to restrictions on the interest rate that can be paid on such deposits. Undercapitalized institutions are not permitted to accept brokered deposits. Pursuant to the regulation, the Bank, as a well-capitalized institution, may accept brokered deposits. Should our capital ratios decline, this could limit our ability to replace brokered deposits when they mature.
The maturity of brokered certificates of deposit could result in a significant funding source maturing at one time. Should this occur, it might be difficult to replace the maturing certificates with new brokered certificates of deposit. We have used brokers to obtain these deposits which results in depositors with whom we have no other relationships since these depositors are outside of our market, and there may not be a sufficient source of new brokered certificates of deposit at the time of maturity. In addition, upon maturity, brokers could require us to offer some of the highest interest rates in the country to retain these deposits, which would negatively impact our earnings. The Bank mitigates this risk by obtaining brokered certificates of deposit with various maturities ranging up to six years, and attempts to avoid having a significant amount maturing in any one year.
The Markets in Which We Operate Are Highly Competitive
We face intense and increasing competition both in making loans and in attracting deposits. Our market area has a high density of financial institutions, many of which have greater financial resources, name recognition and market presence than us, and all of which are our competitors to varying degrees. Particularly intense competition exists for deposits and in all of the lending activities we emphasize. Our competition for loans comes principally from commercial banks, savings banks, savings and loan associations, mortgage banking companies, insurance companies, finance companies and credit unions. Management anticipates that competition for mortgage loans will continue to increase in the future. Our most direct competition for deposits historically has come from savings banks, commercial banks, savings and loan associations and credit unions. In addition, we face competition for deposits from products offered by brokerage firms, insurance companies and other financial intermediaries, such as money market and other mutual funds and annuities. Consolidation in the banking industry and the lifting of interstate banking and branching restrictions have made it more difficult for smaller, community-oriented banks, such as us, to compete effectively with large, national, regional and super-regional banking institutions. Our internet branch, “iGObanking.com®”, a division of the Bank,Internet Branch provides us access to consumers in markets outside our geographic locations. The internet banking arena exposes us to competition with many larger financial institutions that have greater financial resources, name recognition and market presence than we do.
40
Our Results of Operations May Be Adversely Affected by Changes in National and/or Local Economic Conditions
Our operating results are affected by national and local economic and competitive conditions, including changes in market interest rates, the strength of the local economy, government policies and actions of regulatory authorities. During the Great Recession, for example, unemployment increased, the housing market in the United States experienced a significant slowdown, and foreclosures rose. Adverse economic conditions can result in borrowers defaulting on their loans, or withdrawing their funds on deposit at the Bank to meet their financial obligations. A decline in the local or national economy or the New York City metropolitan area real estate market could adversely affect our financial condition and results of operations, including through decreased demand for loans or increased competition for good loans, increased non-performing loans and loan losses and resulting additional provisions for loan losses and for losses on real estate owned. Many factors could require additions to the allowance for loan lossesALL in future periods above those currently maintained. These factors include: (1) adverse changes in economic conditions and changes in interest rates that may affect the ability of borrowers to make payments on loans, (2) changes in the financial capacity of individual borrowers, (3) changes in the local real estate market and the value of our loan collateral, and (4) future review and evaluation of our loan portfolio, internally or by regulators. The amount of the allowance for loan lossesALL at any time represents good faith estimates that are susceptible to significant changes due to changes in appraisal values of collateral, national and local economic conditions, prevailing interest rates and other factors. See “Business — General — Allowance for Loan Losses” in Item 1 of this Annual Report.
These same factors could cause delinquencies to increase for the mortgages which are the collateral for the mortgage-backed securities we hold in our investment portfolio. Combining increased delinquencies with liquidity problems in the market could result in a decline in the market value of our investments in privately issued mortgage-backed securities. There can be no assurance that a decline in the market value of these investments will not result in other-than-temporary impairment charges in our financial statements.
Changes in Laws and Regulations Could Adversely Affect Our Business
From time to time, legislation, such as the Dodd-Frank Act, is enacted or regulations are promulgated that have the effect of increasing the cost of doing business, limiting or expanding permissible activities or affecting the competitive balance between banks and other financial institutions. Proposals to change the laws and regulations governing the operations and taxation of banks and other financial institutions are frequently made in Congress, in the New York legislature and before various bank regulatory agencies. In particular, on February 3, 2017, President Trump signed an executive order requiring a comprehensive review of financial system regulations, including the Dodd-Frank Act. President Trump has promised other significant changes to financial system regulations. Nonetheless, changes to these regulations are expected to be politically controversial and may be slow and unpredictable in enactment and effect. It is too early to predict when or what, if any, existing regulations affecting us will be repealed or amended and what if any new regulations affecting us will be adopted, leaving the bank regulatory environment particularly uncertain at present. Further, there can be no assurance as to the impact that any laws, regulations or governmental programs that may be introduced or implemented in the future will have on the financial markets and the economy. . For a discussion of regulations affecting us, see “Business —Regulation” and “Business—Federal, State and Local Taxation” in Item 1 of this Annual Report.
Current Conditions in, and Regulation of, the Banking Industry May Have a Material Adverse Effect on Our Results of Operations
Financial institutions have been the subject of significant legislative and regulatory changes, including the adoption of The Dodd Frank Act, which imposes a wide variety of regulations affecting us, and may be the subject of further significant legislation or regulation in the future, none of which is within our control. Significant new laws or regulations or changes in, or repeals of, existing laws or regulations, including those with respect to federal and state taxation, may cause our results of operations to differ materially. In addition, the cost and burden of compliance, over time, have significantly increased and could adversely affect our ability to operate profitably.
In particular, as noted aboveThe Bank faces several minimum capital requirements imposed by federal regulation. Failure to adhere to these minimums could limit the Dodd-Frank Act has been implemented in significant part. The Dodd-Frank Act imposes a varietydividends the Bank is allowed to pay, including the payment of regulations affecting us, including:
The Dodd-Frank Act also includes provisions, subject to further rulemaking by the federal bank regulatory agencies, that may affect our future operations, including provisions that create minimum standards for the origination of mortgages, restrict proprietary trading by banking entities, restrict the sponsorship of and investment in hedge funds and private equity funds by banking entities that remove certain obstaclesdividends to the conversionHolding Company, and could limit the annual growth of savings associationsthe Bank. Under the Dodd Frank Act, banks with assets greater than $10.0 billion in total assets are required to national banks. We will not be able to determine the impactcomplete stress tests, which predict capital levels under certain stress levels. Although, our total assets are currently $6.8 billion, as a best practice, we completed these tests. As of these provisions until final rules are promulgated to implement these provisions and other regulatory guidance is provided interpreting these provisions.
December 31, 2018, under all stress scenarios, we remained well capitalized per current regulations. See “Regulation.” At the New York State level, the Company and the Bank are subject to extensive supervision, regulation and examination by the NYDFS and the FDIC. Such regulation limits the manner in which the Company and Bank conduct business, undertake new investments and activities and obtain financing. This regulation is designed primarily for the protection of the deposit insurance funds and the Bank's depositors, and not to benefit the Bank or its creditors. The regulatory structure also provides the regulatory authorities extensive discretion in connection with their supervisory and enforcement activities and examination policies, including policies with respect to capital levels, the classification of assets and the establishment of adequate loan loss reserves for regulatory purposes. Failure to comply with applicable laws and regulations could subject the Company and Bank to regulatory enforcement action that could result in the assessment of significant civil money penalties against the Company and Bank.
41
The fiscal and monetary policies of the federal government and its agencies could have a material adverse effect on the Company's results of operations. The Federal Reserve regulates the supply of money and credit in the United States. Its policies determine in significant part the cost of funds for lending and investing and the return earned on those loans and investments, both of which affect the Company's net interest margin. Governmental policies can also adversely affect borrowers, potentially increasing the risk that they may fail to repay their loans. Changes in Federal Reserve or governmental policies are beyond the Company's control and difficult to predict; consequently, the impact of these changes on the Company's activities and results of operations is difficult to predict.
As noted above, financial institution regulation has been the subject of significant legislation in recent years, and may be the subject of further significant legislation in the future, especially in light of the uncertainty of initiatives suggested by the Trump administration in the context of a Republican-controlled Congress, none of which is within the control of the Company or the Bank. Significant new laws or changes in, or repeals of, existing laws, may cause the Company's results of operations to differ materially. Further, federal monetary policy significantly affects credit conditions for the Company, primarily through open market operations in United States government securities, the discount rate for bank borrowings and reserve requirements for liquid assets. A material change in any of these conditions could have a material adverse impact on the Bank, and therefore, on the Company's results of operations.
The FDIC’s Restoration Plan and Related Increased Assessment Rates May Have a Material Effect on Our Results of Operations
In 2016, the FDIC approved a final rule that imposes a surcharge on the quarterly assessments of institutions with total consolidated assets of $10 billion or more to increase the reserve ratio of the DIF from 1.15 percent to 1.35 percent, as required by the Dodd-Frank Act. If this surcharge is insufficient to increase the reserve ratio to 1.35 percent by December 31, 2018, a one-time shortfall assessment will be imposed on institutions with total consolidated assets of $10 billion (small banks) or more on March 31, 2019. The rule also provides assessment credits to institutions with total consolidated assets of less than $10 billion to offset the effect of the increase in the reserve ratio on these institutions, such as us. The final rule also noted that assessment rates for all established small banks will be determined using financial measures and supervisory ratings derived from a statistical model estimating the probability of failure over three years. The new pricing system eliminates risk categories, but establishes minimum and maximum assessment rates for established small banks based on the regulatory safety and soundness rating assigned to the Bank. The final rule is revenue neutral; that is, it leaves aggregate assessment revenue collected from small banks approximately the same as it would have been absent the final rule. Therefore, depending on what circumstances will achieve revenue neutrality and whether new rules applicable to us are adopted, the FDIC’s rulemaking and related new assessment rates may have a material adverse effect on our results of operations.
There is no guarantee that the rules described above be sufficient for the DIF to meet its funding requirements, which may necessitate further rulemaking, special assessments or increases in deposit insurance premiums. Any such future rulemaking, assessments or increases could have a further material impact on our results of operations.
Section 620 of the Dodd-Frank Act required federal banking agencies to conduct a study and report to Congress on the types of activities and investments permissible for banking entities such as us, the associated risks, and how banking entities mitigate those risks. The report was finalized and delivered in September 2016. Each regulatory agency prepared the section of the report relative to the banking entities that it supervises. Each of the three sections of the report includes a discussion of permissible activities, risk mitigation, legal limitations, and specific recommendations as required by the Dodd-Frank Act. It is too early to determine what if any regulatory new or changed regulatory measures may arise from the report, which adds to the currently uncertain regulatory landscape for us.
A Failure in or Breach of Our Operational or Security Systems or Infrastructure, or Those of Our Third Party Vendors and Other Service Providers, Including as a Result of Cyber Attacks, Could Disrupt Our Business, Result in the Disclosure or Misuse of Confidential or Proprietary Information, Damage Our Reputation, Increase Our Costs and Cause Losses.Losses
We depend upon our ability to process, record and monitor our client transactions on a continuous basis. As client, public and regulatory expectations regarding operational and information security have increased, our operational systems and infrastructure must continue to be safeguarded and monitored for potential failures, disruptions and breakdowns. Our business, financial, accounting and data processing systems, or other operating systems and facilities, may stop operating properly or become disabled or damaged as a result of a number of factors, including events that are wholly or partially beyond our control. For example, there could be electrical or telecommunications outages; natural disasters such as earthquakes, tornadoes and hurricanes; disease pandemics; events arising from local or larger scale political or social matters, including terrorist acts; and, as described below, cyber-attacks. Although we have business continuity plans and other safeguards in place, our business operations may be adversely affected by significant and widespread disruption to our physical infrastructure or operating systems that support our business and clients.
Information security risks for financial institutions such as ours have generally increased in recent years in part because of the proliferation of new technologies, the use of the internet and telecommunications technologies to conduct financial transactions, and the increased sophistication and activities of organized crime, hackers, terrorists, activists and other external parties. As noted above, our operations rely on the secure processing, transmission and storage of confidential information in our computer systems and networks. Our business relies on our digital technologies, computer and email systems, software and networks to conduct its operations. In addition, to access our products and services, our clients may use personal smartphones, tablet PC’s, personal computers and other mobile devices that are beyond our control systems. Although we have information security procedures and controls in place, our technologies, systems, networks and our clients’ devices may become the target of cyber-attacks or information security breaches that could result in the unauthorized release, gathering, monitoring, misuse, loss or destruction of our or our clients’ confidential, proprietary and other information, or otherwise disrupt our or our clients’ or other third parties’ business operations. We may be subject to increasingly more risk related to security systems for our Internet Branch as we expand our suite of online direct banking products, acquire new or outsource some of our business operations, expand our internal usage of web-based products and applications, and otherwise attempt to keep pace with rapid technological changes in the financial services industry.
42
Third parties with whom we do business or that facilitate our business activities, including financial intermediaries or vendors that provide services or security solutions for our operations, could also be sources of operational and information security risk to us, including from breakdowns or failures of their own systems or capacity constraints.
Although to date we have not experienced any material losses relating to cyber-attacks or other information security breaches, there can be no assurance that we will not suffer such losses in the future. Our risk and exposure to these matters remains heightened because of the evolving nature of these threats. As a result, cyber security and the continued development and enhancement of our controls, processes and practices designed to protect our systems, computers, software, data and networks from attack, damage or unauthorized access remain a focus for us. As threats continue to evolve, we may be required to expend additional resources to continue to modify or enhance our protective measures or to investigate and remediate information security vulnerabilities.
Disruptions or failures in the physical infrastructure or operating systems that support our business and clients, or cyber-attacks or security breaches of the networks, systems or devices that our clients use to access our products and services could result in significant legal and financial exposure, client attrition, regulatory fines, penalties or intervention, reputational damage, reimbursement or other compensation costs and/or additional compliance costs, a loss of confidence in the security of our systems, any of which may not be covered by insurance and could materially and adversely affect our financial condition or results of operations.
In addition, on February 16,in 2017, the NYDFS issued the final version of itsestablished comprehensive cybersecurity regulation, which has an effective date of March 1, 2017. The regulation, which is detailed and broad in scope, covers five basic areas.
Governance: The regulation requires senior management and boards of directors must adopt a cybersecurity policyrequirements for protecting information systems and most sensitive information. Coveredfinancial services companies, must also designate a Chief Information Security Officer, who must report to the board annually. The cybersecurity policy must be in place, and the security officer designated, by August 28, 2017.
Testing: The regulation requires the conduct of cybersecurity tests and analyses, including a “risk assessment” to “evaluate and categorize risks,” evaluate the integrity and confidentiality of information systems and non-public information, and develop a process to mitigate any identified risks. These tests and assessments must be conducted by March 1, 2018.
Ongoing Requirements: The regulation imposes substantial day-to-day and technical requirements. Among others, we must develop access controls for our information systems, ensure the physical security of our computer systems, encrypt or protect personally identifiable information, perform reviews of in-house and externally created applications, train employees, and build an audit trail system. The timeline to ensure compliance with these rules ranges from one year to eighteen months.
Vendors: The new regulation also regulates third-party vendors with access to our information technology or non-public information. We will be required to develop and implement written policies and procedures to ensure the security of our information technology systems or non-public information that can be accessed by our vendors, including identifying the risks from third-party access, imposing minimum cybersecurity practices for vendors, and creating a due-diligence process for evaluating those vendors. We will have two years to satisfy these extensive requirements.
Reports: The new regulation imposes a notification process for any material cybersecurity event. Within 72 hours, a cybersecurity event that has a “reasonable likelihood” of “materially harming” us or that must be reported to another government or self-regulating agency must be reported to the NYDFS. In addition, an annual compliance certification to the NYDFS from either the board or a senior officer is required.us. See Regulation – New York State Law.
In light of the newness of the cybersecurity regulation, it is impossible to determine the cost and other effects on us of full and timely compliance. In addition to resources that may be required, in the event that we do not timely and fully comply, we would be subject to enforcement and other consequences in addition to any other claims that might arise. There can be no assurance that we will achieve full and timely compliance with the regulation, in which event our business mat be materially adversely affected.
We May Experience Increased Delays in Foreclosure Proceedings
Foreclosure proceedings face increasing delays. While we cannot predict the ultimate impact of any delay in foreclosure sales, we may be subject to additional borrower and non-borrower litigation and governmental and regulatory scrutiny related to our past and current foreclosure activities. Delays in foreclosure sales, including any delays beyond those currently anticipated could increase the costs associated with our mortgage operations and make it more difficult for us to prevent losses in our loan portfolio.
We May Need to Recognize Other-Than-Temporary Impairment Charges in the Future
We conduct a periodic review and evaluation of the securities portfolio to determine if the decline in the fair value of any security below its cost basis is other-than-temporary. Factors which we consider in our analysis include, but are not limited to, the severity and duration of the decline in fair value of the security, the financial condition and near-term prospects of the issuer, whether the decline appears to be related to issuer conditions or general market or industry conditions, our intent and ability to retain the security for a period of time sufficient to allow for any anticipated recovery in fair value and the likelihood of any near-term fair value recovery. We generally view changes in fair value caused by changes in interest rates as temporary. However, we have recorded other-than-temporary impairment charges on some securities in our portfolio. If we deem such decline to be other-than-temporary, the security is written down to a new cost basis and the resulting loss is charged to earnings as a component of non-interest income.
We continue to monitor the fair value of our securities portfolio as part of our ongoing other-than-temporary impairment evaluation process. There can be no assurance that we will not need to recognize other-than-temporary impairment charges related to securities in the future.
Our Inability to Hire or Retain Key Personnel Could Adversely Affect Our Business
Our success depends, in large part, on our ability to retain and attract key personnel. We face intense competition from commercial banks, savings banks, savings and loan associations, mortgage banking companies, insurance companies, finance companies and credit unions. As a result, it could prove difficult to retain and attract key personnel. The inability to hire or retain key personnel may result in the loss of customer relationships and may adversely affect our financial condition or results of operations.
43
We Are Not Required to Pay Dividends on Our Common Stock
Holders of shares of our common stock are only entitled to receive such dividends as our Board of Directors may declare out of funds legally available for such payments. Although we have historically declared cash dividends on our common stock, we are not required to do so and may reduce or eliminate our common stock dividend in the future. ThisA reduction or elimination of our common stock dividend could adversely affect the market price of our common stock.
Goodwill Recorded as a Result of Acquisitions Could Become Impaired, Negatively Impacting Our Earnings and Capital
Goodwill is presumed to have an indefinite life and is tested annually, or when certain conditions are met, for impairment. If the fair value of the reporting unit is greater than the goodwill amount, no further evaluation is required and no impairment is recorded. If the fair value of the reporting unit is less than the goodwill amount, further evaluation would be required to compare the fair value of the reporting unit to the goodwill amount and determine if a write down is required. Management views the Company as operating as a single unit - a community bank. At December 31, 2016,2018, we had goodwill with a carrying amount of $16.1 million. Declines in the fair value of the reporting unit may result in a future impairment charge. Any such impairment charge could have a material effect on our earnings and capital.
We May Not Fully Realize the Expected Benefit of Our Deferred Tax Assets
At December 31, 2016,2018 and 2017, we had a deferred tax asset of $34.7 million.assets totaling $30.2 million and $24.4 million, respectively. This represents the anticipated federal, state and local tax benefits expected to be realized in future years upon the utilization of the underlying tax attributes comprising this balance. In order to use the future benefit of these deferred tax assets, we will need to report taxable income for federal, state and local tax purposes. Although we have reported taxable income for federal, state, and local tax purposes in each of the past three years, there can be no assurance that this will continue in the future.
Item 1B. Unresolved Staff Comments.Uncertainty about the future of LIBOR may adversely affect our business
LIBOR and certain other interest rate “benchmarks” are the subject of recent national, international, and other regulatory guidance and proposals for reform. These reforms may cause such benchmarks to perform differently than in the past or have other consequences which cannot be predicted. On July 27, 2017, the Chief Executive of the United Kingdom Financial Conduct Authority, which regulates LIBOR, announced that it intends to stop persuading or compelling banks to submit rates for the calculation of LIBOR to the administrator of LIBOR after 2021. The announcement indicates that the continuation of LIBOR on the current basis cannot and will not be guaranteed after 2021. It is impossible to predict whether, and to what extent, banks will continue to provide LIBOR submissions to the administrator of LIBOR or whether any additional reforms to LIBOR may be enacted in the United Kingdom or elsewhere. At this time, subject to the disclosure regarding SOFR as described below, it is impossible to predict the effect of any such alternatives on the value of LIBOR-based securities and variable rate loans, including the trust preferred securities owned by and junior subordinated debentures issued by the Company or other securities or financial arrangements, given LIBOR’s role in determining market interest rates globally. Uncertainty as to the nature of alternative reference rates and as to potential changes or other reforms to LIBOR may adversely affect LIBOR rates and other interest rates. In the event that a published LIBOR rate is unavailable after 2021, the dividend rate on the trust preferred securities owned by and junior subordinated debentures issued by the Company, which are currently, or in the future, based on the LIBOR rate, will be determined as set forth in the offering documents, and the value of such securities may be adversely affected. Currently, the manner and impact of this transition and related developments, as well as the effect of these developments on our funding costs, investment and trading securities portfolios and business, is uncertain.
Complicating the uncertainty described above, the Federal Reserve Board and the Federal Reserve Bank of New York convened the Alternative Reference Rates Committee (ARRC) to identify a set of alternative reference interest rates for possible use as market benchmarks. The ARRC has proposed the Secured Overnight Financing Rate (SOFR) as its recommended alternative to LIBOR, and the Federal Reserve Bank of New York began publishing SOFR rates in the second quarter of 2018. SOFR is based on a broad segment of the overnight Treasury repurchase market and is intended to be a measure of the cost of borrowing cash overnight collateralized by Treasury securities. The market transition away from LIBOR and towards SOFR is expected to be complicated, including the development of term and credit adjustments to accommodate differences between LIBOR and SOFR. Introduction of an alternative rate also may introduce additional basis risk for market participants, as an alternative index is utilized along with LIBOR. There can be no guarantee that SOFR will become widely used and that alternatives may or may not be developed with additional complications, nor what the effect of a possible transition to SOFR or an alternate replacement will have on the business, financial condition, and results of operations of the Company.
| Item 1B. | Unresolved Staff Comments. |
None.
| Item 2. | Properties. |
At December 31, 2016,2018, the Bank conducted its business through 19 full-service offices and its internet branch, “iGObanking.com®”.
Flushing Financial CorporationInternet Branch. The Holding Company neither owns nor leases any property but instead uses the premises and equipment of the Bank.
| Item 3. | Legal Proceedings. |
We are involved in various legal actions arising in the ordinary course of our business which, in the aggregate, involve amounts which are believed by management to be immaterial to our financial condition, results of operations and cash flows.
Item 4. Mine Safety Disclosures.
| Item 4. | Mine Safety Disclosures. |
Not applicable.
44
Item 5. Market for the Registrant’s Common Equity, Related Stockholder Matters and Issuer Purchases of Equity Securities.
| Item 5. | Market for the Registrant’s Common Equity, Related Stockholder Matters and Issuer Purchases of Equity Securities. |
Flushing Financial CorporationThe Holding Company’s Common Stock is traded on the NASDAQ Global Select Market® under the symbol “FFIC.” As of December 31, 2016,2018, we had approximately 707665 shareholders of record, not including the number of persons or entities holding stock in nominee or street name through various brokers and banks. Our stock closed at $29.39$21.53 on December 31, 2016.2018, the last trading day of 2018. The following table shows the high and low sales price of the Common Stock and the dividends declared on the Common Stock during the periods indicated. Such prices do not necessarily reflect retail markups, markdowns, or commissions. (See Note 13 of Notes to Consolidated Financial Statements in Item 8 of this Annual Report for dividend restrictions.)
| 2016 | 2015 | |||||||||||||||||||||||
| High | Low | Dividend | High | Low | Dividend | |||||||||||||||||||
| First Quarter | $ | 22.32 | $ | 19.02 | $ | 0.17 | $ | 20.75 | $ | 17.99 | $ | 0.16 | ||||||||||||
| Second Quarter | 21.72 | 18.95 | 0.17 | 22.00 | 18.77 | 0.16 | ||||||||||||||||||
| Third Quarter | 23.78 | 19.22 | 0.17 | 22.00 | 19.08 | 0.16 | ||||||||||||||||||
| Fourth Quarter | 29.90 | 20.95 | 0.17 | 23.07 | 19.01 | 0.16 | ||||||||||||||||||
| 2018 | 2017 | |||||||||||||||||||||||
| High | Low | Dividend | High | Low | Dividend | |||||||||||||||||||
| First Quarter | $ | 29.55 | $ | 26.20 | $ | 0.20 | $ | 31.96 | $ | 24.90 | $ | 0.18 | ||||||||||||
| Second Quarter | 27.91 | 25.10 | 0.20 | 31.69 | 24.27 | 0.18 | ||||||||||||||||||
| Third Quarter | 27.32 | 23.84 | 0.20 | 30.34 | 25.98 | 0.18 | ||||||||||||||||||
| Fourth Quarter | 24.59 | 20.27 | 0.20 | 31.45 | 24.59 | 0.18 | ||||||||||||||||||
The following table sets forth information regarding the shares of common stock repurchased by us during the quarter ended December 31, 2016:2018:
| Maximum | ||||||||||||||||
| Total Number of | Number of | |||||||||||||||
| Total | Shares Purchased | Shares That May | ||||||||||||||
| Number | as Part of Publicly | Yet Be Purchased | ||||||||||||||
| of Shares | Average Price | Announced Plans | Under the Plans | |||||||||||||
| Period | Purchased | Paid per Share | or Programs | or Programs | ||||||||||||
| October 1 to October 31, 2016 | 20,303 | $ | 21.47 | 20,303 | 500,602 | |||||||||||
| November 1 to November 30, 2016 | 4,697 | 21.76 | 4,697 | 495,905 | ||||||||||||
| December 1 to December 31, 2016 | - | - | - | 495,905 | ||||||||||||
| Total | 25,000 | $ | 21.52 | 25,000 | ||||||||||||
| Maximum | ||||||||||||||||
| Total Number of | Number of | |||||||||||||||
| Total | Shares Purchased | Shares That May | ||||||||||||||
| Number | as Part of Publicly | Yet Be Purchased | ||||||||||||||
| of Shares | Average Price | Announced Plans | Under the Plans | |||||||||||||
| Period | Purchased | Paid per Share | or Programs | or Programs | ||||||||||||
| October 1 to October 31, 2018 | 23,659 | $ | 22.12 | 23,659 | 485,668 | |||||||||||
| November 1 to November 30, 2018 | 5,000 | 22.61 | 5,000 | 480,668 | ||||||||||||
| December 1 to December 31, 2018 | 13,457 | 22.39 | 13,457 | 467,211 | ||||||||||||
| Total | 42,116 | 22.27 | 42,116 | |||||||||||||
OnDuring the year ended December 31, 2018, the Company completed the common stock repurchase program that was approved by the Company’s Board of Directors on June 16, 2015,2015. On February 27, 2018, the Company announced the authorization by the Board of Directors of a new common stock repurchase program, which authorizes the purchase of up to 1,000,000 shares of its common stock. During the years ended December 31, 20162018 and 2015,2017, the Company repurchased 403,695787,069 shares and 735,599241,625 shares, respectively, of the Company’s common stock at an average cost of $19.89$25.97 per share and $19.51$27.59 per share, respectively. At December 31, 2016, 495,9052018, 467,211 shares remain to be repurchased under the current stock repurchase program. Stock will be purchased under the current stock repurchase program from time to time, in the open market or through private transactions subject to market conditions and at the discretion of the management of the Company. There is no expiration or maximum dollar amount under this authorization.
The following table sets forth securities authorized for issuance under all equity compensation plans of the Company at December 31, 2016:2018:
| (c) | (c) | |||||||||||||||||||||||
| Number of securities | Number of securities | |||||||||||||||||||||||
| remaining available for | remaining available for | |||||||||||||||||||||||
| (a) | (b) | future issuance under | (a) | (b) | future issuance under | |||||||||||||||||||
| Number of securities to | Weighted-average | equity compensation | Number of securities to | Weighted-average | equity compensation | |||||||||||||||||||
| be issued upon exercise | exercise price of | plans (excluding | be issued upon exercise | exercise price of | plans (excluding | |||||||||||||||||||
| of outstanding options, | outstanding options, | securities reflected in | of outstanding options, | outstanding options, | securities reflected in | |||||||||||||||||||
| warrants and rights | warrants and rights | column (a) | warrants and rights | warrants and rights | column (a) | |||||||||||||||||||
| Equity compensation plans approved | ||||||||||||||||||||||||
| by security holders | 5,600 | $ | 9.61 | 489,320 | 300 | $ | 8.44 | 745,477 | ||||||||||||||||
| Equity compensation plans not | ||||||||||||||||||||||||
| approved by security holders | - | - | - | - | - | - | ||||||||||||||||||
| 5,600 | $ | 9.61 | 489,320 | 300 | $ | 8.44 | 745,477 | |||||||||||||||||
Stock Performance Graph
The following graph shows a comparison of cumulative total stockholder return on the Company’s common stock since December 31, 20112013 with the cumulative total returns of a broad equity market index as well as comparative published industry indices. The broad equity market index chosen was the Nasdaq Composite. The comparative published industry indices chosen were the SNL Bank $5 Billion to $10 Billion in Assets Index and the SNL Mid-Atlantic Bank Index. The SNL Mid-Atlantic Bank Index was chosen for inclusion in the Company’s Stock Performance Graph because the Company believes it provides valuable comparative information reflecting the Company’s geographic peer group. The SNL Bank $5 Billion to $10 Billion in Assets Index was chosen for inclusion in the Company’s Stock Performance Graph because it uses a broader group of banks and therefore more closely reflects the Company’s size. The Company believes that both geographic area and size are important factors in analyzing the Company’s performance against its peers. The graph below reflects historical performance only, which is not indicative of possible future performance of the common stock.
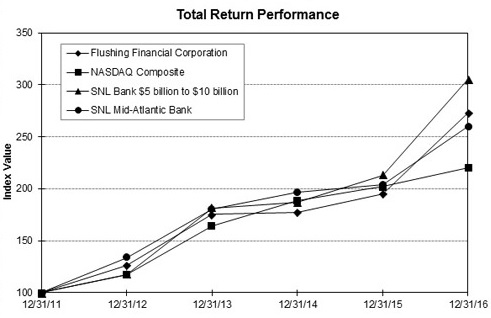 | ||
The total return assumes $100 invested on December 31, 20112013 and all dividends reinvested through the end of the Company’s fiscal year ended December 31, 2016.2018. The performance graph above is based upon closing prices on the trading date specified.
| Period Ending | ||||||||||||||||||||||||
| Index | 12/31/11 | 12/31/12 | 12/31/13 | 12/31/14 | 12/31/15 | 12/31/16 | ||||||||||||||||||
| Flushing Financial Corporation | 100.00 | 126.07 | 175.27 | 176.87 | 194.93 | 272.62 | ||||||||||||||||||
| NASDAQ Composite | 100.00 | 117.45 | 164.57 | 188.84 | 201.98 | 219.89 | ||||||||||||||||||
| SNL Bank $5 Billion to $10 Billion | 100.00 | 117.63 | 181.48 | 186.94 | 212.96 | 305.09 | ||||||||||||||||||
| SNL Mid-Atlantic Bank | 100.00 | 133.96 | 180.57 | 196.72 | 204.10 | 259.43 | ||||||||||||||||||
| Period Ending | ||||||||||||||||||||||||
| Index | 12/31/13 | 12/31/14 | 12/31/15 | 12/31/16 | 12/31/17 | 12/31/18 | ||||||||||||||||||
| Flushing Financial Corporation | 100.00 | 100.91 | 111.22 | 155.54 | 149.40 | 120.68 | ||||||||||||||||||
| NASDAQ Composite Index | 100.00 | 114.75 | 122.74 | 133.62 | 173.22 | 168.30 | ||||||||||||||||||
| SNL Bank $5B-$10B Index | 100.00 | 103.01 | 117.34 | 168.11 | 167.48 | 151.57 | ||||||||||||||||||
| SNL Mid-Atlantic Bank Index | 100.00 | 108.94 | 113.03 | 143.67 | 176.08 | 150.45 | ||||||||||||||||||
| Item 6. | Selected Financial Data. |
Item 6. Selected Financial Data.
| At or for the years ended December 31, | 2016 | 2015 | 2014 | 2013 | 2012 | 2018 | 2017 | 2016 | 2015 | 2014 | ||||||||||||||||||||||||||||||
| (Dollars in thousands, except per share data) | (Dollars in thousands, except per share data) | |||||||||||||||||||||||||||||||||||||||
| Selected Financial Condition Data | ||||||||||||||||||||||||||||||||||||||||
| Total assets | $ | 6,058,487 | $ | 5,704,634 | $ | 5,077,013 | $ | 4,721,501 | $ | 4,451,416 | $ | 6,834,176 | $ | 6,299,274 | $ | 6,058,487 | $ | 5,704,634 | $ | 5,077,013 | ||||||||||||||||||||
| Loans, net | 4,813,464 | 4,366,444 | 3,785,277 | 3,402,402 | 3,203,017 | 5,530,539 | 5,156,648 | 4,813,464 | 4,366,444 | 3,785,277 | ||||||||||||||||||||||||||||||
| Securities held to maturity | 37,735 | 6,180 | - | - | - | 32,018 | 30,886 | 37,735 | 6,180 | - | ||||||||||||||||||||||||||||||
| Securities available for sale | 861,381 | 993,397 | 973,310 | 1,017,790 | 949,566 | 822,655 | 738,354 | 861,381 | 993,397 | 973,310 | ||||||||||||||||||||||||||||||
| Deposits | 4,205,631 | 3,892,547 | 3,508,598 | 3,232,780 | 3,015,193 | 4,960,784 | 4,383,278 | 4,205,631 | 3,892,547 | 3,508,598 | ||||||||||||||||||||||||||||||
| Borrowed funds | 1,266,563 | 1,271,676 | 1,056,492 | 1,012,122 | 948,405 | 1,250,843 | 1,309,653 | 1,266,563 | 1,271,676 | 1,056,492 | ||||||||||||||||||||||||||||||
| Total stockholders' equity | 513,853 | 473,067 | 456,247 | 432,532 | 442,365 | 549,464 | 532,608 | 513,853 | 473,067 | 456,247 | ||||||||||||||||||||||||||||||
| Book value per common share (1) | $ | 17.95 | $ | 16.41 | $ | 15.52 | $ | 14.36 | $ | 14.39 | $ | 19.64 | $ | 18.63 | $ | 17.95 | $ | 16.41 | $ | 15.52 | ||||||||||||||||||||
| Selected Operating Data | ||||||||||||||||||||||||||||||||||||||||
| Interest and dividend income | $ | 220,997 | $ | 204,146 | $ | 197,128 | $ | 200,526 | $ | 213,714 | $ | 256,998 | $ | 234,585 | $ | 220,997 | $ | 204,146 | $ | 197,128 | ||||||||||||||||||||
| Interest expense | 53,911 | 49,726 | 49,554 | 52,284 | 63,275 | 89,592 | 61,478 | 53,911 | 49,726 | 49,554 | ||||||||||||||||||||||||||||||
| Net interest income | 167,086 | 154,420 | 147,574 | 148,242 | 150,439 | 167,406 | 173,107 | 167,086 | 154,420 | 147,574 | ||||||||||||||||||||||||||||||
| Provision (benefit) for loan losses | - | (956 | ) | (6,021 | ) | 13,935 | 21,000 | 575 | 9,861 | - | (956 | ) | (6,021 | ) | ||||||||||||||||||||||||||
| Net interest income after provision | ||||||||||||||||||||||||||||||||||||||||
| for loan losses | 167,086 | 155,376 | 153,595 | 134,307 | 129,439 | 166,831 | 163,246 | 167,086 | 155,376 | 153,595 | ||||||||||||||||||||||||||||||
| Non-interest income: | ||||||||||||||||||||||||||||||||||||||||
| Net gains on sales of securities | ||||||||||||||||||||||||||||||||||||||||
| Net (losses) gains on sales of securities | ||||||||||||||||||||||||||||||||||||||||
| and loans | 2,108 | 589 | 2,942 | 3,197 | 69 | (1,752 | ) | 417 | 2,108 | 589 | 2,942 | |||||||||||||||||||||||||||||
| Net gains on sales of building | 48,018 | 6,537 | - | - | - | - | - | 48,018 | 6,537 | - | ||||||||||||||||||||||||||||||
| Other-than-temporary credit impairment | ||||||||||||||||||||||||||||||||||||||||
| charge on securities | - | - | - | (1,419 | ) | (776 | ) | |||||||||||||||||||||||||||||||||
| Net (loss) gain from fair value adjustments | (3,434 | ) | (1,841 | ) | (2,568 | ) | (2,521 | ) | 55 | |||||||||||||||||||||||||||||||
| Net gains on sales of assets | 1,141 | - | - | - | - | |||||||||||||||||||||||||||||||||||
| Net loss from fair value adjustments | (4,122 | ) | (3,465 | ) | (3,434 | ) | (1,841 | ) | (2,568 | ) | ||||||||||||||||||||||||||||||
| Other income | 10,844 | 10,434 | 9,869 | 10,299 | 9,717 | 15,070 | 13,410 | 10,844 | 10,434 | 9,869 | ||||||||||||||||||||||||||||||
| Total non-interest income | 57,536 | 15,719 | 10,243 | 9,556 | 9,065 | 10,337 | 10,362 | 57,536 | 15,719 | 10,243 | ||||||||||||||||||||||||||||||
| Non-interest expense | 118,603 | 97,719 | 91,026 | 83,155 | 82,326 | 111,683 | 107,474 | 118,603 | 97,719 | 91,026 | ||||||||||||||||||||||||||||||
| Income before income tax provision | 106,019 | 73,376 | 72,812 | 60,708 | 56,178 | 65,485 | 66,134 | 106,019 | 73,376 | 72,812 | ||||||||||||||||||||||||||||||
| Income tax provision | 41,103 | 27,167 | 28,573 | 22,956 | 21,847 | 10,395 | 25,013 | 41,103 | 27,167 | 28,573 | ||||||||||||||||||||||||||||||
| Net income | $ | 64,916 | $ | 46,209 | $ | 44,239 | $ | 37,752 | $ | 34,331 | $ | 55,090 | $ | 41,121 | $ | 64,916 | $ | 46,209 | $ | 44,239 | ||||||||||||||||||||
| Basic earnings per common share (2) | $ | 2.24 | $ | 1.59 | $ | 1.49 | $ | 1.26 | $ | 1.13 | $ | 1.92 | $ | 1.41 | $ | 2.24 | $ | 1.59 | $ | 1.49 | ||||||||||||||||||||
| Diluted earnings per common share (2) | $ | 2.24 | $ | 1.59 | $ | 1.48 | $ | 1.26 | $ | 1.13 | $ | 1.92 | $ | 1.41 | $ | 2.24 | $ | 1.59 | $ | 1.48 | ||||||||||||||||||||
| Dividends declared per common share (2) | $ | 0.68 | $ | 0.64 | $ | 0.60 | $ | 0.52 | $ | 0.52 | ||||||||||||||||||||||||||||||
| Dividends declared per common share | $ | 0.80 | $ | 0.72 | $ | 0.68 | $ | 0.64 | $ | 0.60 | ||||||||||||||||||||||||||||||
| Dividend payout ratio | 30.4 | % | 40.3 | % | 40.3 | % | 41.3 | % | 46.0 | % | 41.7 | % | 51.1 | % | 30.4 | % | 40.3 | % | 40.3 | % | ||||||||||||||||||||
(Footnotes on the following page)
| At or for the years ended December 31, | 2016 | 2015 | 2014 | 2013 | 2012 | |||||||||||||||
| Selected Financial Ratios and Other Data | ||||||||||||||||||||
| Performance ratios: | ||||||||||||||||||||
| Return on average assets | 1.10 | % | 0.86 | % | 0.91 | % | 0.82 | % | 0.79 | % | ||||||||||
| Return on average equity | 13.07 | 9.93 | 9.82 | 8.73 | 7.99 | |||||||||||||||
| Average equity to average assets | 8.40 | 8.68 | 9.31 | 9.45 | 9.83 | |||||||||||||||
| Equity to total assets | 8.48 | 8.29 | 8.99 | 9.16 | 9.94 | |||||||||||||||
| Interest rate spread | 2.86 | 2.94 | 3.10 | 3.32 | 3.50 | |||||||||||||||
| Net interest margin | 2.97 | 3.04 | 3.22 | 3.43 | 3.65 | |||||||||||||||
| Non-interest expense to average assets | 2.01 | 1.82 | 1.77 | 1.76 | 1.88 | |||||||||||||||
| Efficiency ratio | 59.64 | 58.57 | 54.40 | 50.64 | 50.73 | |||||||||||||||
| Average interest-earning assets to average | ||||||||||||||||||||
| interest-bearing liabilities | 1.12 | x | 1.11 | x | 1.11 | x | 1.10 | x | 1.09 | x | ||||||||||
| Regulatory capital ratios: (3) | ||||||||||||||||||||
| Tier 1 leverage capital (well capitalized = 5%) | 10.12 | % | 8.89 | % | 9.63 | % | 9.48 | % | 9.62 | % | ||||||||||
| Common equity tier 1 risk-based capital (well capitalized = 6.5%) | 14.12 | 12.62 | n/a | n/a | n/a | |||||||||||||||
| Tier 1 risk-based capital (well capitalized =8%) | 14.12 | 12.62 | 13.87 | 14.59 | 14.38 | |||||||||||||||
| Total risk-based capital (well capitalized =10%) | 14.64 | 13.17 | 14.60 | 15.63 | 15.43 | |||||||||||||||
| Asset quality ratios: | ||||||||||||||||||||
| Non-performing loans to gross loans (4) | 0.44 | % | 0.60 | % | 0.90 | % | 1.43 | % | 2.79 | % | ||||||||||
| Non-performing assets to total assets (5) | 0.36 | 0.54 | 0.80 | 1.14 | 2.21 | |||||||||||||||
| Net (recoveries) charge-offs to average loans | (0.02 | ) | 0.06 | 0.02 | 0.41 | 0.64 | ||||||||||||||
| Allowance for loan losses to gross loans | 0.46 | 0.49 | 0.66 | 0.93 | 0.97 | |||||||||||||||
| Allowance for loan losses to total | ||||||||||||||||||||
| non-performing assets (5) | 101.28 | 69.45 | 61.94 | 59.04 | 31.59 | |||||||||||||||
| Allowance for loan losses to total | ||||||||||||||||||||
| non-performing loans (4) | 103.80 | 82.58 | 73.40 | 64.89 | 34.62 | |||||||||||||||
| Full-service customer facilities | 19 | 19 | 17 | 17 | 17 | |||||||||||||||
| At or for the years ended December 31, | 2018 | 2017 | 2016 | 2015 | 2014 | |||||||||||||||
| Selected Financial Ratios and Other Data | ||||||||||||||||||||
| Performance ratios: | ||||||||||||||||||||
| Return on average assets | 0.85 | % | 0.66 | % | 1.10 | % | 0.86 | % | 0.91 | % | ||||||||||
| Return on average equity | 10.30 | 7.75 | 13.07 | 9.93 | 9.82 | |||||||||||||||
| Average equity to average assets | 8.22 | 8.53 | 8.40 | 8.68 | 9.31 | |||||||||||||||
| Equity to total assets | 8.04 | 8.46 | 8.48 | 8.29 | 8.99 | |||||||||||||||
| Interest rate spread | 2.53 | 2.80 | 2.86 | 2.94 | 3.10 | |||||||||||||||
| Net interest margin | 2.70 | 2.93 | 2.97 | 3.04 | 3.22 | |||||||||||||||
| Non-interest expense to average assets | 1.72 | 1.73 | 2.01 | 1.82 | 1.77 | |||||||||||||||
| Efficiency ratio | 62.20 | 57.90 | 59.64 | 58.57 | 54.40 | |||||||||||||||
| Average interest-earning assets to average | ||||||||||||||||||||
| interest-bearing liabilities | 1.12 | x | 1.12 | x | 1.12 | x | 1.11 | x | 1.11 | x | ||||||||||
| Regulatory capital ratios: (3) | ||||||||||||||||||||
| Tier 1 leverage capital (well capitalized = 5%) | 9.85 | % | 10.11 | % | 10.12 | % | 8.89 | % | 9.63 | % | ||||||||||
| Common equity tier 1 risk-based capital (well capitalized = 6.5%) | 13.28 | 13.87 | 14.12 | 12.62 | n/a | |||||||||||||||
| Tier 1 risk-based capital (well capitalized =8%) | 13.28 | 13.87 | 14.12 | 12.62 | 13.87 | |||||||||||||||
| Total risk-based capital (well capitalized =10%) | 13.70 | 14.31 | 14.64 | 13.17 | 14.60 | |||||||||||||||
| Asset quality ratios: | ||||||||||||||||||||
| Non-performing loans to gross loans (4) | 0.29 | % | 0.35 | % | 0.44 | % | 0.60 | % | 0.90 | % | ||||||||||
| Non-performing assets to total assets (5) | 0.24 | 0.29 | 0.36 | 0.54 | 0.80 | |||||||||||||||
| Net charge-offs (recoveries) to average loans | - | 0.24 | (0.02 | ) | 0.06 | 0.02 | ||||||||||||||
| Allowance for loan losses to gross loans | 0.38 | 0.39 | 0.46 | 0.49 | 0.66 | |||||||||||||||
| Allowance for loan losses to total | ||||||||||||||||||||
| non-performing assets (5) | 128.60 | 112.23 | 101.28 | 69.45 | 61.94 | |||||||||||||||
| Allowance for loan losses to total | ||||||||||||||||||||
| non-performing loans (4) | 128.87 | 112.23 | 103.80 | 82.58 | 73.40 | |||||||||||||||
| Full-service customer facilities | 19 | 18 | 19 | 19 | 17 | |||||||||||||||
| (1) | Calculated by dividing stockholders’ equity of |
| (2) | The shares held in the Company’s Employee Benefit Trust are not included in shares outstanding for purposes of calculating earnings per share. |
| (3) | Represents the Bank’s capital ratios, which exceeded all minimum regulatory capital requirements during the periods presented. Common equity tier 1 risk-based capital was not a required ratio prior to 2015. |
| (4) | Non-performing loans consist of non-accrual loans and loans delinquent 90 days or more that are still accruing. |
| (5) | Non-performing assets consist of non-performing loans, real estate owned and non-performing investment securities. |
Item 7. Management’s Discussion and Analysis of Financial Condition and Results of Operations.
| Item 7. | Management’s Discussion and Analysis of Financial Condition and Results of Operations. |
As used in this discussion and analysis, the words “we,” “us,” “our” and the “Company” are used to refer to Flushing Financial Corporation (the “Holding Company”) and its direct and indirect wholly owned subsidiaries, Flushing Bank (the “Bank”), Flushing Preferred Funding Corporation, Flushing Service Corporation, and FSB Properties Inc.
We are a Delaware corporation organized in May 1994. The Bank was organized in 1929 as a New York State-chartered mutual savings bank. In 1994,Today the Bank converted to a federally chartered mutual savings bank and changed its name from Flushing Savings Bank to Flushing Savings Bank, FSB. The Bank converted from a federally chartered mutual savings bank to a federally chartered stock savings bank on November 21, 1995, at which time Flushing Financial Corporation acquired all of the stock of the Bank. On February 28, 2013, the Bank’s charter was changed tooperates as a full-service New York State chartered commercial bank, and its name was changed to Flushing Bank. As a resultbank. The primary business of the Bank’s change in charter to a full-service New York State chartered commercial bank,Holding Company has been the operation of the Bank. The Bank owns three subsidiaries: Flushing Preferred Funding Corporation, Flushing Service Corporation, and FSB Properties Inc. The Bank also operates an internet branch, which operates under the brands of iGObanking.com® and BankPurely® (the “Internet Branch”). The Bank’s primary regulator becameis the New York State Department of Financial Services, and its primary federal regulator becameis the Federal Deposit Insurance Corporation (“FDIC”). The Bank’s deposits are insured to the maximum allowable amount by the FDIC. The Bank owns three subsidiaries: Flushing Preferred Funding Corporation, Flushing Service Corporation, and FSB Properties Inc.
Flushing Financial CorporationThe Holding Company also owns Flushing Financial Capital Trust II, Flushing Financial Capital Trust III, and Flushing Financial Capital Trust IV (the “Trusts”), which are special purpose business trusts formed during 2007 to issue a total of $60.0 million of capital securities, and $1.9 million of common securities (which are the only voting securities). Flushing Financial CorporationThe Holding Company owns 100% of the common securities of the Trusts. The Trusts used the proceeds from the issuance of these securities to purchase junior subordinated debentures from Flushing Financial Corporation.the Holding Company. The Trusts are not included in our consolidated financial statements, as we would not absorb the losses of the Trusts if losses were to occur.
The following discussion of financial condition and results of operations includes the collective results of the Flushing Financial CorporationHolding Company and its subsidiaries (collectively, the “Company”), but reflects principally the Bank’s activities. Management views the Company as operating as a single unit - a community bank. Therefore, segment information is not provided.
The Bank has a business banking unit which focuses on the development of a full complement of commercial business deposit, loan and cash management products. As of December 31, 2016 and 2015, the business banking unit had $613.0 million and $525.3 million, respectively, in gross loans outstanding and $144.4 million and $146.3 million, respectively, of customer deposits.
The Bank has an internet branch, iGObanking.com®, which provides access to consumers in markets outside our geographic locations. Accounts can be opened online at www.iGObanking.com or by mail. IGObanking.com® does not currently accept loan applications. As of December 31, 2016 and 2015, iGObanking.com® had $417.3 million and $323.7 million, respectively, of customer deposits.
The Bank has a governmental banking unit, which provides banking services to public entities including counties, cities, towns, villages, school districts, libraries, fire districts and the various courts throughout the New York City metropolitan area. At December 31, 2016 and 2015, the government banking unit had $1,062.1 million and $975.9 million, respectively, in customer deposits.
Our principal business is attracting retail deposits from the general public and investing those deposits together with funds generated from ongoing operations and borrowings, primarily in (1) originations and purchases of multi-family residential properties, commercial business loans, commercial real estate mortgage loans and, to a lesser extent, one-to-four family (focusing on mixed-use properties, which are properties that contain both residential dwelling units and commercial units); (2) construction loans, primarily for residential properties;loans; (3) Small Business Administration (“SBA”) loans and other small business loans; (4) mortgage loan surrogates such as mortgage-backed securities; and (5) U.S. government securities, corporate fixed-income securities and other marketable securities. We also originate certain other consumer loans including overdraft lines of credit. Our results of operations depend primarily on net interest income, which is the difference between the income earned on its interest-earning assets and the cost of our interest-bearing liabilities. Net interest income is the result of our interest rate margin, which is the difference between the average yield earned on interest-earning assets and the average cost of interest-bearing liabilities, adjusted for the difference in the average balance of interest-earning assets as compared to the average balance of interest-bearing liabilities. We also generate non-interest income from loan fees, service charges on deposit accounts, mortgage servicing fees, and other fees, income earned on Bank Owned Life Insurance (“BOLI”), dividends on Federal Home Bank of New York (“FHLB-NY”) stock and net gains and losses on sales of securities and loans. Our operating expenses consist principally of employee compensation and benefits, occupancy and equipment costs, other general and administrative expenses and income tax expense. Our results of operations also can be significantly affected by our periodic provision for loan losses and specific provision for losses on real estate owned.
Management Strategy. Our strategy is to continue our focus on being an institution serving consumers, businesses, and governmental units in our local markets. In furtherance of this objective, we intend to:
| · |
| · | increase |
| · | enhance earnings power by |
| · | manage credit risk; |
| · |
| · | increase our commitment to the multi-cultural marketplace, with a particular focus on the Asian |
| · | manage enterprise-wide risk. |
50
There can be no assurance that we will be able to effectively implement this strategy. Our strategy is subject to change by the Board of Directors.
Increase core depositsManage cost of funds and continue to improve funding mix. We have a relatively stable retail deposit base drawn from our market area through our full-service offices. Although we seek to retain existing deposits and maintain depositor relationships by offering quality service and competitive interest rates to our customers, we also seek to keep deposit growth within reasonable limits and our strategic plan. In order to implement our strategic plan, we have built multi-channel deposit gathering capabilities. In addition to our full-service branches we gather deposits through our Internet Branch and a government banking unit. The Internet Branch currently offers savings accounts, money market accounts, checking accounts, and certificates of deposit. This allows us to compete on a national scale without the geographical constraints of physical locations. At December 31, 2018 and 2017, total deposits at our Internet Branch were $450.9 million and $401.0 million, respectively. The government banking unit provides banking services to public municipalities, including counties, cities, towns, villages, school districts, libraries, fire districts, and the various courts throughout the New York City metropolitan area. At December 31, 2018 and 2017, total deposits in our government banking unit totaled $1,339.7 million and $1,133.3 million, respectively. Additionally, we have a business banking operationgroup which was designed specifically to develop full business relationships thereby bringing in lower-costing checking and money market deposits. At December 31, 2016,2018, deposits balances in the business sector are $144.4banking group were $174.5 million. We also have “iGObanking.com®”, as a division of the Bank, to compete for deposits from sources outside the geographic footprint of our full-service offices. In creating iGObanking.com®, our strategy is to reduce our reliance on wholesale borrowings and reduce our funding costs. Deposit balances in iGObanking.com® were $417.3 million at December 31, 2016, at rates lower than our borrowings. We have a government banking division as an additional source of deposits. At December 31, 2016, deposits in our government banking division totaled $1,062.1 million at rates below our average cost of funds. We also obtain deposits through brokers and the CDARS® and ICS network. Management intends to balance its goal to maintain competitive interest rates on deposits while seeking to manage its overall cost of funds to finance its strategies. We generally rely on our deposit base as our principal source of funding. During 2016,2018, we realized an increase in due to depositors of $309.7$575.3 million, as core deposits increased $340.9$363.9 million whileand certificates of deposit decreased $31.2increased $211.4 million.
A significantgrowing portion of our lending and deposit customers do not have both their loans and deposits with us. We intend to continue to focus on obtaining additional deposits from our lending customers and originating additional loans to our deposit customers. Product offerings were expanded and are expected to be further expanded to accommodate perceived customer demands. In addition, specific employees are assigned responsibilities of generating these additional deposits and loans by coordinating efforts between lending and deposit gathering departments.
Increase net interest income by leveraging loan pricing opportunities.opportunities and portfolio mix. During 2016,2018, we repositionedcontinued our strategy to focusof focusing more on loan pricing as opposed to volume. We saw yields on originations increase for the third and fourth quartersfull year of 2016 as compared to the same period in 2015. The average interest rate obtained for third quarter 2016 originations was 3.74% as compared to 3.56% for the 2015 period. For fourth quarter 2016 originations, the average interest rate increased 132018 increase by 50 basis points to 3.81% as compared to 3.68%4.56% from 4.06% for the 2015full year of 2017. Additionally for the second consecutive year the yield of originations for the full year, exceeded the average yield on total interest-earning assets for the same period.
We have emphasized the strategic growth of multi-family residential mortgage loans, non-owner occupied commercial mortgage loans and floating rate commercial business loans. WeThe commercial business and other loans have re-enteredincreased to 15.85% of the higher-yielding non-owner occupied commercial real estate lending during 2015.entire loan portfolio as of December 31, 2018 compared to 14.20% at December 31, 2017. In the multi-family portfolio we allowed loans to prepay rather than refinance at a rate below our criteria. We continued to deemphasize one-to-four family – mixed-use property and construction lending and we no longer provideoriginate taxi medallion loans.
51
The following table shows loan originations and purchases during 2016,2018, and loan balances as of December 31, 2016.2018.
| Loan | Loan Balances | |||||||||||
| Originations and | December 31, | Percent of | ||||||||||
| Purchases | 2016 | Gross Loans | ||||||||||
| (Dollars in thousands) | ||||||||||||
| Multi-family residential | $ | 371,197 | $ | 2,178,504 | 45.21 | % | ||||||
| Commercial real estate | 322,721 | 1,246,132 | 25.86 | |||||||||
| One-to-four family ― mixed-use property | 62,735 | 558,502 | 11.59 | |||||||||
| One-to-four family ― residential | 24,820 | 185,767 | 3.85 | |||||||||
| Co-operative apartment | 470 | 7,418 | 0.15 | |||||||||
| Construction | 15,772 | 11,495 | 0.24 | |||||||||
| Small Business Administration | 8,447 | 15,198 | 0.32 | |||||||||
| Taxi Medallion | - | 18,996 | 0.39 | |||||||||
| Commercial Business and Other | 326,776 | 597,122 | 12.39 | |||||||||
| Total | $ | 1,132,938 | $ | 4,819,134 | 100.00 | % | ||||||
| Loan | Loan Balances | |||||||||||
| Originations and | December 31, | Percent of | ||||||||||
| Purchases | 2018 | Gross Loans | ||||||||||
| (Dollars in thousands) | ||||||||||||
| Multi-family residential | $ | 339,732 | $ | 2,269,048 | 41.00 | % | ||||||
| Commercial real estate | 270,785 | 1,542,547 | 27.86 | |||||||||
| One-to-four family ― mixed-use property | 74,156 | 577,741 | 10.44 | |||||||||
| One-to-four family ― residential | 42,660 | 190,350 | 3.44 | |||||||||
| Co-operative apartment | 2,448 | 8,498 | 0.15 | |||||||||
| Construction | 39,595 | 50,600 | 0.91 | |||||||||
| Small Business Administration | 3,843 | 15,210 | 0.27 | |||||||||
| Taxi medallion | - | 4,539 | 0.08 | |||||||||
| Commercial business and Other | 477,572 | 877,763 | 15.85 | |||||||||
| Total | $ | 1,250,791 | $ | 5,536,296 | 100.00 | % | ||||||
At December 31, 2016,2018, multi-family residential, commercial business and other loans and commercial real estate loans, totaled 83.5%84.7% of our gross loans. We have repositioned our loan growth since the Great Recession to reduce credit risk; however, our concentration in these types of loans could require us to increase our provisions for loan losses and to maintain an allowance for loan losses as a percentage of total loans in excess of the allowance currently maintained.
Enhance earnings power by managing net interest margin and improving scalability and efficiency. By taking advantage of loan pricing opportunitiesWe are improving scalability and continuing to maintain a lower cost of funds, we actively manage the net interest margin. During the year ended December 31, 2016, the cost of interest-bearing liabilities decreased one basis point to 1.07% from 1.08% for the year ended December 31, 2015. During 2017, approximately 47% ofefficiency by converting our borrowings and certificates of deposits are scheduled to mature or reprice. During 2016, we renovated two branches to the Universal Banker model and planwith our unique video banker service that gives customers face-to-face video chat access from 7am to renovate three branches during 2017.11pm daily via at our ATM terminals. The Universal Banker model will result in savings of both personnel and occupancy costs while providing ourprovides customers with cutting-edge technology.technology, including state-of-the-art ATMs and a higher-quality service experience, all while further reducing overall costs. We have been rolling this model out across our network as branches are renovated and new branches are opened. As of December 31, 2018, we had 15 locations operating under the Universal banker model and anticipate the remaining branches to convert to the Universal Banker model by the end of 2019. In the branches that have been converted to the Universal Banker model, almost 60% of customer transactions were completed at our high powered ATMs.
Manage credit riskrisk.. By adherence to our conservative underwriting standards, we have been able to minimize net losses from impaired loans, recordingexcluding the taxi medallion portfolio. We recorded net recoveries of $0.7$19,000 for the year ended December 31, 2018, compared to net charge-offs of $11.7 million for the year ended December 31, 2016 compared to2017. The net charge-offs recorded in 2017 were primarily the result of $2.6$11.3 million forin tax medallion charge-offs due to a reduction in the year endedfair value of the underlying collateral. At December 31, 2015.2018 the carrying value of the taxi medallion portfolio is $4.5 million. We seek to minimize losses by adhering to our strict underwriting standards, which among other things generally requires a debt service coverage ratio of at least 125% and loan to value ratio of 75% or less. The loan to value for the real estate dependent loan portfolio was 40.5%38.8% and the average loan to value for non-performing loans collateralized by real estate was 39.1%34.9% at December 31, 2016.2018. We seek to maintain our loans in performing status through, among other things, disciplined collection efforts, and consistently monitoring non-performing assets in an effort to return them to performing status. To this end, we review the quality of our loans and report to the Loan Committee of the Board of Directors of the Bank on a monthly basis. We sold 12 delinquent loans totaling $8.7 million, 17 delinquent loans totaling $6.2 million, and 26 delinquent loans totaling $8.0 million, 23 delinquent loans totaling $9.0 million, and 34 delinquent loans totaling $15.9 million during the years ended December 31, 2016, 20152018, 2017 and 2014,2016, respectively. We recorded net recoveries on delinquent loans that were sold during 2018 and 2016 2015of $68,000 and 2014$48,000, respectively and net charge-offs of $48,000, $0.1 million and $0.4 million.$37,000 on delinquent loan sales in 2017. We realized gross gains of $0.3 million, $0.1$38,000, $0.4 million and $0.1$0.3 million on the sale of delinquent loans for the years ended December 31, 2016, 20152018, 2017 and 2014,2016, respectively. We realized gross losses of $2,000$0.3 million for the year ended December 31, 2015.2018. We did not record any gross losses during the years ended December 31, 20162017 and 2014.2016. There can be no assurances that we will continue this strategy in future periods, or if continued, we will be able to find buyers to pay adequate consideration. Non-performing loans totaled $21.9$16.3 million and $31.0$18.1 million at December 31, 20162018 and 2015,2017, respectively. Non-performing assets as a percentage of total assets were 0.36%0.24% and 0.54%0.29% at December 31, 20162018 and 2015,2017, respectively.
52
MaintainRemain well capitalized levels under all stress test scenarios.capitalized. The Bank faces several minimum capital requirements imposed by federal regulation. Failure to adhere to these minimums could limit the dividends the Bank is allowed to pay, including the payment of dividends to Flushing Financial Corporation,the Holding Company, and could limit the annual growth of the Bank. Under the Dodd Frank Act, banks with assets greater than $10.0 billion in total assets are required to complete stress tests, which predict capital levels under certain stress levels. Although, our total assets are currently $6.1$6.8 billion, as a best practice, we completed these tests. As of December 31, 2016,2018, under all stress scenarios, we remainremained well capitalized per current regulations.
Increase Our Commitment to the Multi-Cultural Marketplace, with a Particular Focus on the Asian Community in Queens.Community. Our branches are all located in the New York City metropolitan area with particular concentration in the borough of Queens. Queens is characterized with a high level of ethnic diversity. An important element of our strategy is to service multi-ethnic consumers and businesses. We have a particular presence and concentration in Asian communities, including in particular the Chinese and Korean populations. Both groups are noted for high levels of savings, education and entrepreneurship. In order to service these and other important ethnic groups in our market, our staff speaks more than 3020 languages. We have an Asian advisory board to help broaden our links to the community by providing guidance and fostering awareness of our active role in the local community. ThroughIn the fourth quarter of 2018, we opened a branch in the NYC borough of Manhattan in the Chinatown district, expanding our branch footprint in Asian communities outside of the borough of Queens. As of December 31, 2018, we had five branches which have a particular focus on and commitment to the Asian community four in the borough of Queens where we have four branches, we have obtained approximately $500and one in the borough of Manhattan, with deposits totaling in excess of $650 million in deposits in these branches. We also have over $450 million of loans and lines of credit outstanding to borrowers in the Asian community.locations combined.
Manage Enterprise-Wide Risk. We identify, measure and attempt to mitigate risks that affect, or have the potential to affect, our business. Due to past economic crises and recent increases in government regulation, we devote significant resources to risk management. We have a seasoned risk officer to provide executive risk leadership, and an enterprise-wide risk management program. Several enterprise risk management analytical products are in use which include key risk indicators. We also have had a chief information security officer even before one will be required by recent NYDFS rulemaking not yet in effect. Our management of enterprise-wide risk enables us to recognize and monitor risks and establish procedures to disseminate the risk information across our organization and to our Board of Directors. The objective is to have a robust and focused risk management process capable of identifying and mitigating emerging threats to the Bank’s safety and soundness.
Trends and Contingencies. Our operating results are significantly affected by national and local economic and competitive conditions, including changes in market interest rates, the strength of the local economy, government policies and actions of regulatory authorities. We have remained strategically focused on the origination of multi-family residential mortgages, commercial mortgages and to a lesser extent, commercial real estate and one-to-four family mixed-use property mortgage loans. However, in late 2014 and throughout 2015 and 2016 we have increased our emphasis on the origination and purchase of business loans with a full banking relationships and commercial real estate loans. As a resultrelationship. Because of this strategy, we were able to continue to achieve a higher yield on our mortgage portfolio than we would have otherwise experienced.
As we have seen improvements in the local economy, our non-performing loans have decreased. The majority of our impaired loans are income producing residential properties located in the New York City metropolitan market. Due to the low vacancy rates for these types of properties, they have retained more of their value, thereby reducing their loss content. Non-performing loans totaled $21.4Loan originations and purchases were $1,250.8 million, $26.1$1,039.5 million and $34.2 million at December 31, 2016, 2015 and 2014, respectively. We have not experienced a significant increase in foreclosed properties despite an extended foreclosure process in our market. The extended foreclosure process in our market is due to the high number of foreclosure actions filed in the court system in the counties for which we are seeking foreclosure on delinquent mortgage loans. We have not encountered significant issues with documentation relating to mortgages for which we are seeking foreclosure as we maintain custody of all loan documents and review them prior to providing them to our legal counsel to initiate the foreclosure action. During the year ended December 31, 2016, we recorded net recoveries of $0.7 million compared to net charge-offs of $2.6 million and $0.7$1,132.9 million for the years ended December 31, 20152018, 2017 and 2014, respectively. This improvement in net charge-offs allowed us to not record a provision for loan losses during the year ended December 31, 2016, compared to benefits of $1.0 million and $6.0 million for the years ended December 31, 2015 and 2014, respectively. We cannot predict the effect of these economic conditions on the Company’s future financial condition or operating results.
Loan originations and purchases were $1,132.9 million, $1,233.5 million and $958.2 million for the years ended December 31, 2016, 2015 and 2014, respectively. While we primarily rely on originating our own loans, we purchased $186.7$294.7 million, $278.9$196.5 million and $169.9$186.7 million during the years ended December 31, 2016, 20152018, 2017 and 2014,2016, respectively. We purchase loans when the loans complement our loan portfolio strategy. Loans purchased must meet our underwriting standards when they were originated.
During the three-year period ended December 31, 2016,2018, the allocation of our loan portfolio has remained fairly consistent.consistent with a slight increase in non-mortgage loans. The majority of our loans are collateralized by real estate, which comprised 86.9%83.8% of our portfolio at December 31, 20162018 compared to 87.7%85.3% at December 31, 20152017 and 87.4%86.9% at December 31, 2014. Multi-family residential mortgage2016, while non-mortgage loans comprised 45.2%, 47.0% and 50.6%16.2% of our loan portfolio at December 31, 2016, 2015 and 2014, respectively. Commercial real estate mortgage loans comprised 25.9%, 22.9% and 16.4% of our loan portfolio2018, compared to 14.7% at December 31, 2016, 20152017 and 2014, respectively. One-to-four family mixed-use property mortgage loans comprised 11.6%, 13.1% and 15.1% of loan portfolio at December 31, 2016, 2015 and 2014, respectively. One-to-four family residential mortgage loans comprised 3.9%, 4.3% and 4.9% of loan portfolio at December 31, 2016, 2015 and 2014, respectively.2016.
Due to depositors increased $575.3 million, $175.3 million and $309.7 million $382.8 millionin 2018, 2017 and $272.9 million in 2016, 2015 and 2014, respectively. Lower-costing core deposits increased $363.9 million, $195.4 million and $340.9 million $285.3 millionin 2018, 2017 and $88.1 million in 2016, 2015 and 2014, respectively. Higher-costing certificates of deposit decreased $211.4 million during 2018 compared to a decrease of $20.2 million in 2017 and a decrease of $31.2 million during 2016 compared to increases $97.5 million during 2015 and $184.9 million during 2014.2016. Brokered deposits represented 26.5%6.1%, 25.2%24.9% and 21.8%26.5% of total deposits at December 31, 2018, 2017 and 2016, 2015respectively. During 2018, Section 29 of the Federal Deposit Insurance Act was amended to no longer consider reciprocal deposits held by an FDIC-insured depository institution brokered deposits. At December 31, 2018, 2017 and 2014,2016, reciprocal deposits totaled $685.3 million, $682.4 million and $567.8 million, respectively.
Prevailing interest rates affect the extent to which borrowers repay and refinance loans. In a declining interest rate environment, the number of loan prepayments and loan refinancing tends to increase, as do prepayments of mortgage-backed securities. Call provisions associated with our investments in U.S. government agency and corporate securities may also adversely affect yield in a declining interest rate environment. Such prepayments and calls may adversely affect the yield of our loan portfolio and mortgage-backed and other securities as we reinvest the prepaid funds in a lower interest rate environment. However, we typically receive additional loan fees when existing loans are refinanced, which partially offsets the reduced yield on our loan portfolio resulting from prepayments. In periods of low interest rates, our level of core deposits also may decline if depositors seek higher-yielding instruments or other investments not offered by us, which in turn may increase our cost of funds and decrease our net interest margin to the extent alternative funding sources, are utilized. By contrast, an increasing interest rate environment would tend to extend the average lives of lower yielding fixed rate mortgages and mortgage-backed securities, which could adversely affect net interest income. In addition, depositors tend to open longer term, higher costing certificate of deposit accounts which could adversely affect our net interest income if rates were to subsequently decline. Additionally, adjustable rate residential mortgage loans and mortgage-backed securities generally contain interim and lifetime caps that limit the amount the interest rate can increase at re-pricing dates.
We attempt to pursue the guarantor on all loans for which a loss has been incurred and for which a guarantee was obtained, when, after considering the benefits and costs, we have concluded we will be successful in recovering at least a portion of the loss we incurred. The success of this pursuit is based on the assets the guarantor holds when we obtain a judgment.
53
During 2016, we sought performance under guarantees on three business loans, seeking judgment of approximately $3.6 million. As of December 31, 2016, we had received $6,000 on these business loans. During the year ended December 31, 2016, we realized recoveries of approximately $50,000 on business loans for which we sought judgments prior to 2016. During 2015, we sought performance under guarantees on two business loans, seeking judgment of approximately $2.5 million. During the year ended December 31, 2015, we realized recoveries of approximately $0.3 million on business loans and $0.1 million on real estate mortgage loans for which we sought judgments prior to 2015.
During 2016 our netNet interest income increased $12.7decreased $5.7 million, or 8.20%3.3%, to $167.1$167.4 million for the twelve months ended December 31, 20162018 from $154.4$173.1 million for the comparable prior year, period, as a seven23 basis pointpoints decrease in the net interest margin to 2.97%2.70% for the twelve monthmonths ended December 31, 20162018 was more thanpartially offset by balance sheet growth. The decrease in the net interest margin for 20162018 was primarily due to a declinean increase in our funding costs, partially offset by an increase in the yield of our interest-earning assets, partially offset by a reduction in our funding costs.assets. The declineincrease in the yield of our interest earning assets was primarily due to rates earned on new loans originated and securities purchased during 2016 being lower than the yieldan increase of the existing portfolio. During 2016,$278.2 million in the average balance of total loans, net increased $567.2interest-earning assets to $6,194.2 million to $4,600.7 million. During 2016, the average balance of borrowed funds increased by $126.6 million to $1,231.0 million compared to $1,104.4 million for 2015, while the cost of borrowed funds decreased nine basis points to 1.67% for the year ended December 31, 20162018, combined with increases in the yield of new originations and adjustable rate loans resetting higher. During 2018, the cost of borrowed funds increased 35 basis points to 2.16% from 1.76%1.81% in the comparable period.period while the cost of interest-bearing deposits increased 50 basis points to 1.48% from 0.98% for the prior year. The cost of money market, NOW and certificates of depositdeposits accounts decreased nineincreased 71 basis points, for the twelve months ended December 31, 2016 from the prior year, while the cost of money market accounts, NOW and savings accounts increased 21 basis points, seven46 basis points and four43 basis points, respectively, for the twelve months ended December 31, 20162018 from the prior year. The cost of money market accounts increased primarily due to our shifting of Government NOW deposits to an Insured Cash Sweep service (“ICS”) brokered money market product, which does not require us to provide collateral. This allows us to invest our funds in higher yielding assets. The cost of savings and NOW accounts increased as we increased the rates we pay on certain accounts to attract additional deposits. This resulted in an increase in the cost of due to depositors of one basis point to 0.89% for the twelve months ended December 31, 2016 from 0.88% for the twelve months ended December 31, 2015. Overall, as a result of these changes to our funding mix we were able to reduce our cost of interest-bearing liabilities one basis point to 1.07% for the year ended December 31, 2016 from 1.08% for the year ended December 31, 2015.
We are unable to predict the direction or timing of future interest rate changes. Approximately 47%65% of our certificates of deposit accounts and borrowings will reprice or mature during the next year, which could result in a decreasean increase in the cost of our interest-bearing liabilities. Also, in a decreasingan increasing interest rate environment, mortgage loans and mortgage-backed securities with highermay prepay at slower rates tend to prepay,than experienced in the past, which could result in a reduction in the yield on our interest-earning assets.of prepayment penalty income.
Interest Rate Sensitivity Analysis
A financial institution’s exposure to the risks of changing interest rates may be analyzed, in part, by examining the extent to which its assets and liabilities are “interest rate sensitive” and by monitoring the institution’s interest rate sensitivity “gap.” An asset or liability is said to be interest rate sensitive within a specific time period if it will mature or reprice within that time period. The interest rate sensitivity gap is defined as the difference between the amount of interest-earning assets maturing or repricing within a specific time period and the amount of interest-bearing liabilities maturing or repricing within that time period. A gap is considered positive when the amount of interest-earning assets maturing or repricing exceeds the amount of interest-bearing liabilities maturing or repricing within the same period. A gap is considered negative when the amount of interest-bearing liabilities maturing or repricing exceeds the amount of interest-earning assets maturing or repricing within the same period. Accordingly, a positive gap may enhance net interest income in a rising rate environment and reduce net interest income in a falling rate environment. Conversely, a negative gap may enhance net interest income in a falling rate environment and reduce net interest income in a rising rate environment.
54
The table below sets forth the amounts of interest-earning assets and interest-bearing liabilities outstanding at December 31, 20162018 which are anticipated by the Company, based upon certain assumptions, to reprice or mature in each of the future time periods shown. Except as stated below, the amount of assets and liabilities shown that reprice or mature during a particular period was determined in accordance with the earlier of the term to repricing or the contractual terms of the asset or liability. Prepayment assumptions for mortgage loans and mortgage-backed securities are based on our experience and industry averages, which generally range from 6% to 36%25%, depending on the contractual rate of interest and the underlying collateral. MoneyNOW Accounts, money market accounts and savings accounts were assumed to have a withdrawal or “run-off” raterates of 14%7%, 16% and 23%14%, respectively, based on our experience. While management bases these assumptions on actual prepayments and withdrawals experienced by us, there is no guarantee that these trends will continue in the future.
| Interest Rate Sensitivity Gap Analysis at December 31, 2016 | Interest Rate Sensitivity Gap Analysis at December 31, 2018 | |||||||||||||||||||||||||||||||||||||||||||||||||||||||
| More Than | More Than | More Than | More Than | More Than | More Than | More Than | More Than | |||||||||||||||||||||||||||||||||||||||||||||||||
| Three | Three | One Year | Three Years | Five Years | Three | Three | One Year | Three Years | Five Years | |||||||||||||||||||||||||||||||||||||||||||||||
| Months | Months To | To Three | To Five | To Ten | More Than | Months | Months To | To Three | To Five | To Ten | More Than | |||||||||||||||||||||||||||||||||||||||||||||
| And Less | One Year | Years | Years | Years | Ten Years | Total | And Less | One Year | Years | Years | Years | Ten Years | Total | |||||||||||||||||||||||||||||||||||||||||||
| (Dollars in thousands) | (Dollars in thousands) | |||||||||||||||||||||||||||||||||||||||||||||||||||||||
| Interest-Earning Assets | ||||||||||||||||||||||||||||||||||||||||||||||||||||||||
| Mortgage loans | $ | 307,930 | $ | 683,651 | $ | 1,493,473 | $ | 1,140,190 | $ | 532,657 | $ | 29,917 | $ | 4,187,818 | $ | 338,558 | $ | 837,969 | $ | 1,727,461 | $ | 1,247,802 | $ | 401,855 | $ | 85,139 | $ | 4,638,784 | ||||||||||||||||||||||||||||
| Other loans | 147,119 | 113,512 | 182,555 | 105,015 | 79,659 | 3,456 | 631,316 | 579,085 | 38,925 | 85,311 | 104,874 | 89,317 | - | 897,512 | ||||||||||||||||||||||||||||||||||||||||||
| Short-term securities (1) | 25,771 | - | - | - | - | - | 25,771 | 105,761 | - | - | - | - | - | 105,761 | ||||||||||||||||||||||||||||||||||||||||||
| Securities held-to-maturity: | ||||||||||||||||||||||||||||||||||||||||||||||||||||||||
| Mortgage-backed securities | 328 | 984 | 3,937 | 2,704 | - | - | 7,953 | |||||||||||||||||||||||||||||||||||||||||||||||||
| Other | 1,330 | 14,540 | - | - | - | 21,865 | 37,735 | 1,568 | 1,000 | - | - | - | 21,497 | 24,065 | ||||||||||||||||||||||||||||||||||||||||||
| Securities available for sale: | - | |||||||||||||||||||||||||||||||||||||||||||||||||||||||
| Mortgage-backed securities | 22,331 | 71,257 | 129,933 | 84,419 | 95,006 | 113,530 | 516,476 | 16,628 | 50,047 | 129,082 | 102,422 | 175,783 | 83,991 | 557,953 | ||||||||||||||||||||||||||||||||||||||||||
| Other | 127,849 | 17,103 | 144,144 | 51,086 | 1,809 | 2,914 | 344,905 | 180,608 | 60,828 | 23,266 | - | - | - | 264,702 | ||||||||||||||||||||||||||||||||||||||||||
| Total interest-earning assets | 632,330 | 900,063 | 1,950,105 | 1,380,710 | 709,131 | 171,682 | 5,744,021 | 1,222,536 | 989,753 | 1,969,057 | 1,457,802 | 666,955 | 190,627 | 6,496,730 | ||||||||||||||||||||||||||||||||||||||||||
| Interest-Bearing Liabilities | ||||||||||||||||||||||||||||||||||||||||||||||||||||||||
| Savings accounts | 9,589 | 28,767 | 52,320 | 48,782 | 114,825 | - | 254,283 | 7,771 | 23,314 | 52,760 | 70,460 | 55,717 | - | 210,022 | ||||||||||||||||||||||||||||||||||||||||||
| NOW accounts | - | - | - | - | - | 1,362,484 | 1,362,484 | 44,476 | 65,921 | 209,424 | 524,561 | 456,470 | - | 1,300,852 | ||||||||||||||||||||||||||||||||||||||||||
| Money market accounts | 37,188 | 111,563 | 105,206 | 589,413 | - | - | 843,370 | 67,271 | 134,306 | 352,030 | 814,936 | 59,449 | - | 1,427,992 | ||||||||||||||||||||||||||||||||||||||||||
| Certificate of deposit accounts | 281,713 | 362,623 | 649,794 | 76,711 | 1,274 | - | 1,372,115 | 328,776 | 688,401 | 483,357 | 62,280 | 496 | - | 1,563,310 | ||||||||||||||||||||||||||||||||||||||||||
| Mortgagors' escrow deposits | - | - | - | - | - | 40,216 | 40,216 | - | - | - | - | - | 44,861 | 44,861 | ||||||||||||||||||||||||||||||||||||||||||
| Borrowings | 353,713 | 231,227 | 408,200 | 273,423 | - | - | 1,266,563 | 618,908 | 205,840 | 385,099 | 40,996 | - | - | 1,250,843 | ||||||||||||||||||||||||||||||||||||||||||
| Total interest-bearing liabilities (2) | $ | 682,203 | $ | 734,180 | $ | 1,215,520 | $ | 988,329 | $ | 116,099 | $ | 1,402,700 | $ | 5,139,031 | $ | 1,067,202 | $ | 1,117,782 | $ | 1,482,670 | $ | 1,513,233 | $ | 572,132 | $ | 44,861 | $ | 5,797,880 | ||||||||||||||||||||||||||||
| Interest rate sensitivity gap | $ | (49,873 | ) | $ | 165,883 | $ | 734,585 | $ | 392,381 | $ | 593,032 | $ | (1,231,018 | ) | $ | 604,990 | $ | 155,334 | $ | (128,029 | ) | $ | 486,387 | $ | (55,431 | ) | $ | 94,823 | $ | 145,766 | $ | 698,850 | ||||||||||||||||||||||||
| Cumulative interest-rate sensitivity gap | $ | (49,873 | ) | $ | 116,010 | $ | 850,595 | $ | 1,242,976 | $ | 1,836,008 | $ | 604,990 | $ | 155,334 | $ | 27,305 | $ | 513,692 | $ | 458,261 | $ | 553,084 | $ | 698,850 | |||||||||||||||||||||||||||||||
| Cumulative interest-rate sensitivity gap | ||||||||||||||||||||||||||||||||||||||||||||||||||||||||
| as a percentage of total assets | -0.82 | % | 1.91 | % | 14.04 | % | 20.52 | % | 30.30 | % | 9.99 | % | 2.27 | % | 0.40 | % | 7.52 | % | 6.71 | % | 8.09 | % | 10.23 | % | ||||||||||||||||||||||||||||||||
| Cumulative net interest-earning assets | ||||||||||||||||||||||||||||||||||||||||||||||||||||||||
| as a percentage of interest-bearing | ||||||||||||||||||||||||||||||||||||||||||||||||||||||||
| liabilities | 92.69 | % | 108.19 | % | 132.32 | % | 134.33 | % | 149.14 | % | 111.77 | % | 114.56 | % | 101.25 | % | 114.01 | % | 108.85 | % | 109.61 | % | 112.05 | % | ||||||||||||||||||||||||||||||||
(1) Consists of interest-earning deposits.
(2) Does not include non-interest bearing demand accounts totaling $333.2$413.7 million at December 31, 2016.2018.
Certain shortcomings are inherent in the method of analysis presented in the foregoing table. For example, although certain assets and liabilities may have similar estimated maturities or periods to repricing, they may react in differing degrees to changes in market interest rates and may bear rates that differ in varying degrees from the rates that would apply upon maturity and reinvestment or upon repricing. Also, the interest rates on certain types of assets and liabilities may fluctuate in advance of changes in market interest rates, while interest rates on other types may lag behind changes in market rates. Additionally, certain assets, such as ARM loans, have features that restrict changes in interest rates on a short-term basis and over the life of the asset. Further, in the event of a significant change in the level of interest rates, prepayments on loans and mortgage-backed securities, and deposit withdrawal or “run-off” levels, would likely deviate materially from those assumed in calculating the above table. In the event of an interest rate increase, some borrowers may be unable to meet the increased payments on their adjustable-rate debt. The interest rate sensitivity analysis assumes that the nature of the Company’s assets and liabilities remains static. Interest rates may have an effect on customer preferences for deposits and loan products. Finally, the maturity and repricing characteristics of many assets and liabilities as set forth in the above table are not governed by contract but rather by management’s best judgment based on current market conditions and anticipated business strategies.
55
Our Consolidated Financial Statements have been prepared in accordance with accounting principles generally accepted in the United States of America, which requires the measurement of financial position and operating results in terms of historical dollars without considering the changes in fair value of certain investments due to changes in interest rates. Generally, the fair value of financial investments such as loans and securities fluctuates inversely with changes in interest rates. As a result, increases in interest rates could result in decreases in the fair value of our interest-earning assets which could adversely affect our results of operations if such assets were sold, or, in the case of securities classified as available for sale, decreases in our stockholders’ equity if such securities were retained.
We manage the mix of interest-earning assets and interest-bearing liabilities on a continuous basis to maximize return and adjust our exposure to interest rate risk. On a quarterly basis, management prepares the “Earnings and Economic Exposure to Changes in Interest Rate” report for review by the Board of Directors, as summarized below. This report quantifies the potential changes in net interest income and net portfolio value should interest rates go up or down (shocked) 200 basis points, assuming the yield curves of the rate shocks will be parallel to each other. Net portfolio value is defined as the market value of assets net of the market value of liabilities. The market value of assets and liabilities is determined using a discounted cash flow calculation. The net portfolio value ratio is the ratio of the net portfolio value to the market value of assets. All changes in income and value are measured as percentage changes from the projected net interest income and net portfolio value at the base interest rate scenario. The base interest rate scenario assumes interest rates at December 31, 2015.2018. Various estimates regarding prepayment assumptions are made at each level of rate shock. Actual results could differ significantly from these estimates. At December 31, 2016,2018, we were within the guidelines established by the Board of Directors for each interest rate level.
| Projected Percentage Change In | Net Portfolio | Projected Percentage Change In | Net Portfolio | |||||||||||||||||||||||||||||||||||||||||||||
| Change in Interest Rate | Net Interest Income | Net Portfolio Value | Value Ratio | Net Interest Income | Net Portfolio Value | Value Ratio | ||||||||||||||||||||||||||||||||||||||||||
| 2016 | 2015 | 2016 | 2015 | 2016 | 2015 | 2018 | 2017 | 2018 | 2017 | 2018 | 2017 | |||||||||||||||||||||||||||||||||||||
| -200 basis points | 0.74 | % | -1.87 | % | 9.79 | % | 9.37 | % | 11.76 | % | 12.05 | % | 6.35 | % | 3.91 | % | 14.20 | % | 10.44 | % | 12.15 | % | 12.84 | % | ||||||||||||||||||||||||
| -100 basis points | 2.11 | 0.83 | 7.47 | 6.93 | 11.77 | 12.03 | 3.85 | 3.80 | 4.41 | 3.03 | 11.45 | 12.41 | ||||||||||||||||||||||||||||||||||||
| Base interest rate | ― | ― | ― | ― | 11.26 | 11.57 | ― | ― | ― | ― | 11.22 | 12.46 | ||||||||||||||||||||||||||||||||||||
| +100 basis points | -6.38 | -4.96 | -11.56 | -11.34 | 10.26 | 10.57 | -4.82 | -5.03 | -5.98 | -5.58 | 10.80 | 12.11 | ||||||||||||||||||||||||||||||||||||
| +200 basis points | -13.97 | -10.45 | -26.43 | -26.30 | 8.83 | 9.10 | -9.86 | -10.41 | -11.89 | -13.38 | 10.36 | 11.37 | ||||||||||||||||||||||||||||||||||||
Analysis of Net Interest Income
Net interest income represents the difference between income on interest-earning assets and expense on interest-bearing liabilities. Net interest income depends upon the relative amount of interest-earning assets and interest-bearing liabilities and the interest rate earned or paid on them.
The following table sets forth certain information relating to our Consolidated Statements of Financial Condition and Consolidated Statements of Income for the years ended December 31, 2016, 20152018, 2017 and 2014,2016, and reflects the average yield on assets and average cost of liabilities for the periods indicated. Such yields and costs are derived by dividing income or expense by the average balance of assets or liabilities, respectively, for the periods shown. Average balances are derived from average daily balances. The yields include amortization of fees that are considered adjustments to yields.
| For the year ended December 31, | For the year ended December 31, | |||||||||||||||||||||||||||||||||||||||||||||||||||||||||||||||||||||||
| 2016 | 2015 | 2014 | 2018 | 2017 | 2016 | |||||||||||||||||||||||||||||||||||||||||||||||||||||||||||||||||||
| Average | Yield/ | Average | Yield/ | Average | Yield/ | Average | Yield/ | Average | Yield/ | Average | Yield/ | |||||||||||||||||||||||||||||||||||||||||||||||||||||||||||||
| Balance | Interest | Cost | Balance | Interest | Cost | Balance | Interest | Cost | Balance | Interest | Cost | Balance | Interest | Cost | Balance | Interest | Cost | |||||||||||||||||||||||||||||||||||||||||||||||||||||||
| (Dollars in thousands) | (Dollars in thousands) | |||||||||||||||||||||||||||||||||||||||||||||||||||||||||||||||||||||||
| Interest-earning assets: | ||||||||||||||||||||||||||||||||||||||||||||||||||||||||||||||||||||||||
| Mortgage loans, net (1)(2) | $ | 4,014,734 | $ | 173,419 | 4.32 | % | $ | 3,524,331 | $ | 161,115 | 4.57 | % | $ | 3,075,055 | $ | 154,316 | 5.02 | % | $ | 4,494,210 | $ | 193,186 | 4.30 | % | $ | 4,304,889 | $ | 181,006 | 4.20 | % | $ | 4,014,734 | $ | 173,419 | 4.32 | % | ||||||||||||||||||||||||||||||||||||
| Other loans, net (1)(2) | 585,948 | 21,706 | 3.70 | 509,147 | 17,605 | 3.46 | 446,852 | 16,011 | 3.58 | 822,758 | 39,533 | 4.80 | 683,724 | 28,277 | 4.14 | 585,948 | 21,706 | 3.70 | ||||||||||||||||||||||||||||||||||||||||||||||||||||||
| Total loans, net | 4,600,682 | 195,125 | 4.24 | 4,033,478 | 178,720 | 4.43 | 3,521,907 | 170,327 | 4.84 | 5,316,968 | 232,719 | 4.38 | 4,988,613 | 209,283 | 4.20 | 4,600,682 | 195,125 | 4.24 | ||||||||||||||||||||||||||||||||||||||||||||||||||||||
| Taxable securities: | ||||||||||||||||||||||||||||||||||||||||||||||||||||||||||||||||||||||||
| Mortgage-backed | ||||||||||||||||||||||||||||||||||||||||||||||||||||||||||||||||||||||||
| securities | 581,505 | 14,231 | 2.45 | 693,893 | 17,309 | 2.49 | 740,190 | 19,872 | 2.68 | 539,771 | 15,065 | 2.79 | 526,934 | 13,686 | 2.60 | 581,505 | 14,231 | 2.45 | ||||||||||||||||||||||||||||||||||||||||||||||||||||||
| Other securities | 243,567 | 8,243 | 3.38 | 163,604 | 4,398 | 2.69 | 147,883 | 3,437 | 2.32 | 140,461 | 4,658 | 3.32 | 199,350 | 7,349 | 3.69 | 243,567 | 8,243 | 3.38 | ||||||||||||||||||||||||||||||||||||||||||||||||||||||
| Total taxable securities | 825,072 | 22,474 | 2.72 | 857,497 | 21,707 | 2.53 | 888,073 | 23,309 | 2.62 | 680,232 | 19,723 | 2.90 | 726,284 | 21,035 | 2.90 | 825,072 | 22,474 | 2.72 | ||||||||||||||||||||||||||||||||||||||||||||||||||||||
| Tax-exempt securities: (3) | ||||||||||||||||||||||||||||||||||||||||||||||||||||||||||||||||||||||||
| Other securities | 142,472 | 3,148 | 2.21 | 134,807 | 3,593 | 2.67 | 131,921 | 3,413 | 2.59 | 121,412 | 3,366 | 2.77 | 139,704 | 3,741 | 2.68 | 142,472 | 3,148 | 2.21 | ||||||||||||||||||||||||||||||||||||||||||||||||||||||
| Total tax-exempt securities | 142,472 | 3,148 | 2.21 | 134,807 | 3,593 | 2.67 | 131,921 | 3,413 | 2.59 | 121,412 | 3,366 | 2.77 | 139,704 | 3,741 | 2.68 | 142,472 | 3,148 | 2.21 | ||||||||||||||||||||||||||||||||||||||||||||||||||||||
| Interest-earning deposits | ||||||||||||||||||||||||||||||||||||||||||||||||||||||||||||||||||||||||
| and federal funds sold | 58,522 | 250 | 0.43 | 58,397 | 126 | 0.22 | 41,770 | 79 | 0.19 | 75,636 | 1,190 | 1.57 | 61,472 | 526 | 0.86 | 58,522 | 250 | 0.43 | ||||||||||||||||||||||||||||||||||||||||||||||||||||||
| Total interest-earning | ||||||||||||||||||||||||||||||||||||||||||||||||||||||||||||||||||||||||
| assets | 5,626,748 | 220,997 | 3.93 | 5,084,179 | 204,146 | 4.02 | 4,583,671 | 197,128 | 4.30 | 6,194,248 | 256,998 | 4.15 | 5,916,073 | 234,585 | 3.97 | 5,626,748 | 220,997 | 3.93 | ||||||||||||||||||||||||||||||||||||||||||||||||||||||
| Other assets | 286,786 | 276,965 | 254,741 | 310,350 | 301,673 | 286,786 | ||||||||||||||||||||||||||||||||||||||||||||||||||||||||||||||||||
| Total assets | $ | 5,913,534 | $ | 5,361,144 | $ | 4,838,412 | $ | 6,504,598 | $ | 6,217,746 | $ | 5,913,534 | ||||||||||||||||||||||||||||||||||||||||||||||||||||||||||||
| Interest-bearing liabilities: | ||||||||||||||||||||||||||||||||||||||||||||||||||||||||||||||||||||||||
| Deposits: | ||||||||||||||||||||||||||||||||||||||||||||||||||||||||||||||||||||||||
| Savings accounts | $ | 260,948 | 1,219 | 0.47 | $ | 264,891 | 1,151 | 0.43 | $ | 258,243 | 597 | 0.23 | $ | 233,392 | 1,370 | 0.59 | $ | 292,887 | 1,808 | 0.62 | $ | 260,948 | 1,219 | 0.47 | ||||||||||||||||||||||||||||||||||||||||||||||||
| NOW accounts | 1,496,712 | 7,891 | 0.53 | 1,432,609 | 6,593 | 0.46 | 1,390,899 | 6,227 | 0.45 | 1,407,945 | 15,896 | 1.13 | 1,444,944 | 9,640 | 0.67 | 1,496,712 | 7,891 | 0.53 | ||||||||||||||||||||||||||||||||||||||||||||||||||||||
| Money market accounts | 581,390 | 3,592 | 0.62 | 380,595 | 1,551 | 0.41 | 245,752 | 667 | 0.27 | 1,164,505 | 18,707 | 1.61 | 908,025 | 8,151 | 0.90 | 581,390 | 3,592 | 0.62 | ||||||||||||||||||||||||||||||||||||||||||||||||||||||
| Certificate of deposit | ||||||||||||||||||||||||||||||||||||||||||||||||||||||||||||||||||||||||
| accounts | 1,409,772 | 20,536 | 1.46 | 1,351,619 | 20,943 | 1.55 | 1,199,849 | 22,420 | 1.87 | 1,483,026 | 28,310 | 1.91 | 1,390,491 | 20,579 | 1.48 | 1,409,772 | 20,536 | 1.46 | ||||||||||||||||||||||||||||||||||||||||||||||||||||||
| Total due to depositors | 3,748,822 | 33,238 | 0.89 | 3,429,714 | 30,238 | 0.88 | 3,094,743 | 29,911 | 0.97 | 4,288,868 | 64,283 | 1.50 | 4,036,347 | 40,178 | 1.00 | 3,748,822 | 33,238 | 0.89 | ||||||||||||||||||||||||||||||||||||||||||||||||||||||
| Mortgagors' escrow | ||||||||||||||||||||||||||||||||||||||||||||||||||||||||||||||||||||||||
| accounts | 56,152 | 112 | 0.20 | 52,364 | 98 | 0.19 | 47,876 | 133 | 0.28 | 66,255 | 214 | 0.32 | 61,962 | 141 | 0.23 | 56,152 | 112 | 0.20 | ||||||||||||||||||||||||||||||||||||||||||||||||||||||
| Total interest-bearing | ||||||||||||||||||||||||||||||||||||||||||||||||||||||||||||||||||||||||
| deposits | 3,804,974 | 33,350 | 0.88 | 3,482,078 | 30,336 | 0.87 | 3,142,619 | 30,044 | 0.96 | 4,355,123 | 64,497 | 1.48 | 4,098,309 | 40,319 | 0.98 | 3,804,974 | 33,350 | 0.88 | ||||||||||||||||||||||||||||||||||||||||||||||||||||||
| Borrowings | 1,231,015 | 20,561 | 1.67 | 1,104,368 | 19,390 | 1.76 | 993,790 | 19,510 | 1.96 | 1,162,429 | 25,095 | 2.16 | 1,169,791 | 21,159 | 1.81 | 1,231,015 | 20,561 | 1.67 | ||||||||||||||||||||||||||||||||||||||||||||||||||||||
| Total interest-bearing | ||||||||||||||||||||||||||||||||||||||||||||||||||||||||||||||||||||||||
| liabilities | 5,035,989 | 53,911 | 1.07 | 4,586,446 | 49,726 | 1.08 | 4,136,409 | 49,554 | 1.20 | 5,517,552 | 89,592 | 1.62 | 5,268,100 | 61,478 | 1.17 | 5,035,989 | 53,911 | 1.07 | ||||||||||||||||||||||||||||||||||||||||||||||||||||||
| Non interest-bearing | ||||||||||||||||||||||||||||||||||||||||||||||||||||||||||||||||||||||||
| demand deposits | 305,096 | 250,488 | 211,389 | 380,889 | 348,518 | 305,096 | ||||||||||||||||||||||||||||||||||||||||||||||||||||||||||||||||||
| Other liabilities | 75,629 | 59,016 | 40,217 | 71,422 | 70,828 | 75,629 | ||||||||||||||||||||||||||||||||||||||||||||||||||||||||||||||||||
| Total liabilities | 5,416,714 | 4,895,950 | 4,388,015 | 5,969,863 | 5,687,446 | 5,416,714 | ||||||||||||||||||||||||||||||||||||||||||||||||||||||||||||||||||
| Equity | 496,820 | 465,194 | 450,397 | 534,735 | 530,300 | 496,820 | ||||||||||||||||||||||||||||||||||||||||||||||||||||||||||||||||||
| Total liabilities and | ||||||||||||||||||||||||||||||||||||||||||||||||||||||||||||||||||||||||
| equity | $ | 5,913,534 | $ | 5,361,144 | $ | 4,838,412 | $ | 6,504,598 | $ | 6,217,746 | $ | 5,913,534 | ||||||||||||||||||||||||||||||||||||||||||||||||||||||||||||
| Net interest income / | ||||||||||||||||||||||||||||||||||||||||||||||||||||||||||||||||||||||||
| net interest rate spread (4), (6) | $ | 167,086 | 2.86 | % | $ | 154,420 | 2.94 | % | $ | 147,574 | 3.10 | % | ||||||||||||||||||||||||||||||||||||||||||||||||||||||||||||
| net interest rate spread (4) | $ | 167,406 | 2.53 | % | $ | 173,107 | 2.80 | % | $ | 167,086 | 2.86 | % | ||||||||||||||||||||||||||||||||||||||||||||||||||||||||||||
| Net interest-earning assets / | ||||||||||||||||||||||||||||||||||||||||||||||||||||||||||||||||||||||||
| net interest margin (5),(6) | $ | 590,759 | 2.97 | % | $ | 497,733 | 3.04 | % | $ | 447,262 | 3.22 | % | ||||||||||||||||||||||||||||||||||||||||||||||||||||||||||||
| net interest margin (5) | $ | 676,696 | 2.70 | % | $ | 647,973 | 2.93 | % | $ | 590,759 | 2.97 | % | ||||||||||||||||||||||||||||||||||||||||||||||||||||||||||||
| Ratio of interest-earning | ||||||||||||||||||||||||||||||||||||||||||||||||||||||||||||||||||||||||
| assets to interest-bearing | ||||||||||||||||||||||||||||||||||||||||||||||||||||||||||||||||||||||||
| liabilities | 1.12 | X | 1.11 | X | 1.11 | X | 1.12 | X | 1.12 | X | 1.12 | X | ||||||||||||||||||||||||||||||||||||||||||||||||||||||||||||
| (1) | Average balances include non-accrual loans. |
| (2) | Loan interest income includes loan fee income (which includes net amortization of deferred fees and costs, late charges, and prepayment penalties) of approximately |
| (3) | Interest income on tax-exempt securities does not include the tax benefit of the tax-exempt securities. |
| (4) | Interest rate spread represents the difference between the average rate on interest-earning assets and the average cost of interest-bearing liabilities. |
| (5) | Net interest margin represents net interest income before the provision for loan losses divided by average interest-earning assets. |
57
The following table presents the impact of changes in interest rates and in the volume of interest-earning assets and interest-bearing liabilities on the Company’s interest income and interest expense during the periods indicated. Information is provided in each category with respect to (1) changes attributable to changes in volume (changes in volume multiplied by the prior rate), (2) changes attributable to changes in rate (changes in rate multiplied by the prior volume) and (3) the net change. The changes attributable to the combined impact of volume and rate have been allocated proportionately to the changes due to volume and the changes due to rate.
| Increase (Decrease) in Net Interest Income | Increase (Decrease) in Net Interest Income | |||||||||||||||||||||||||||||||||||||||||||||||
| Year Ended December 31, 2016 | Year Ended December 31, 2015 | Year Ended December 31, 2018 | Year Ended December 31, 2017 | |||||||||||||||||||||||||||||||||||||||||||||
| Compared to | Compared to | Compared to | Compared to | |||||||||||||||||||||||||||||||||||||||||||||
| Year Ended December 31, 2015 | Year Ended December 31, 2014 | Year Ended December 31, 2017 | Year Ended December 31, 2016 | |||||||||||||||||||||||||||||||||||||||||||||
| Due to | Due to | Due to | Due to | |||||||||||||||||||||||||||||||||||||||||||||
| Volume | Rate | Net | Volume | Rate | Net | Volume | Rate | Net | Volume | Rate | Net | |||||||||||||||||||||||||||||||||||||
| (Dollars in thousands) | (Dollars in thousands) | |||||||||||||||||||||||||||||||||||||||||||||||
| Interest-Earning Assets: | ||||||||||||||||||||||||||||||||||||||||||||||||
| Mortgage loans, net | $ | 21,481 | $ | (9,177 | ) | $ | 12,304 | $ | 21,366 | $ | (14,567 | ) | $ | 6,799 | $ | 7,902 | $ | 4,278 | $ | 12,180 | $ | 12,441 | $ | (4,854 | ) | $ | 7,587 | |||||||||||||||||||||
| Other loans, net | 2,809 | 1,292 | 4,101 | 2,149 | (555 | ) | 1,594 | 6,309 | 4,947 | 11,256 | 3,837 | 2,734 | 6,571 | |||||||||||||||||||||||||||||||||||
| Mortgage-backed securities | (2,800 | ) | (278 | ) | (3,078 | ) | (1,202 | ) | (1,361 | ) | (2,563 | ) | 345 | 1,034 | 1,379 | (1,384 | ) | 842 | (542 | ) | ||||||||||||||||||||||||||||
| Other securities | 2,531 | 869 | 3,400 | 473 | 668 | 1,141 | (2,391 | ) | (675 | ) | (3,066 | ) | (1,467 | ) | 1,163 | (304 | ) | |||||||||||||||||||||||||||||||
| Interest-earning deposits and | ||||||||||||||||||||||||||||||||||||||||||||||||
| federal funds sold | - | 124 | 124 | 33 | 14 | 47 | 145 | 519 | 664 | 14 | 262 | 276 | ||||||||||||||||||||||||||||||||||||
| Total interest-earning assets | 24,021 | (7,170 | ) | 16,851 | 22,819 | (15,801 | ) | 7,018 | 12,310 | 10,103 | 22,413 | 13,441 | 147 | 13,588 | ||||||||||||||||||||||||||||||||||
| Interest-Bearing Liabilities: | ||||||||||||||||||||||||||||||||||||||||||||||||
| Deposits: | ||||||||||||||||||||||||||||||||||||||||||||||||
| Savings accounts | (20 | ) | 88 | 68 | 16 | 538 | 554 | (354 | ) | (84 | ) | (438 | ) | 163 | 426 | 589 | ||||||||||||||||||||||||||||||||
| NOW accounts | 295 | 1,003 | 1,298 | 210 | 156 | 366 | (253 | ) | 6,509 | 6,256 | (282 | ) | 2,031 | 1,749 | ||||||||||||||||||||||||||||||||||
| Money market accounts | 1,036 | 1,005 | 2,041 | 454 | 430 | 884 | 2,783 | 7,773 | 10,556 | 2,527 | 2,032 | 4,559 | ||||||||||||||||||||||||||||||||||||
| Certificate of deposit accounts | 862 | (1,269 | ) | (407 | ) | 2,636 | (4,113 | ) | (1,477 | ) | 1,441 | 6,290 | 7,731 | (260 | ) | 303 | 43 | |||||||||||||||||||||||||||||||
| Mortgagors' escrow accounts | 8 | 6 | 14 | 12 | (47 | ) | (35 | ) | 11 | 62 | 73 | 12 | 17 | 29 | ||||||||||||||||||||||||||||||||||
| Borrowings | 2,185 | (1,014 | ) | 1,171 | 2,532 | (7,839 | ) | (5,307 | ) | (134 | ) | 4,070 | 3,936 | (1,060 | ) | 1,658 | 598 | |||||||||||||||||||||||||||||||
| Total interest-bearing liabilities | 4,366 | (181 | ) | 4,185 | 5,860 | (10,875 | ) | (5,015 | ) | 3,494 | 24,620 | 28,114 | 1,100 | 6,467 | 7,567 | |||||||||||||||||||||||||||||||||
| Net change in net interest income | $ | 19,655 | $ | (6,989 | ) | $ | 12,666 | $ | 16,959 | $ | (4,926 | ) | $ | 12,033 | $ | 8,816 | $ | (14,517 | ) | $ | (5,701 | ) | $ | 12,341 | $ | (6,320 | ) | $ | 6,021 | |||||||||||||||||||
Comparison of Operating Results for the Years Ended December 31, 20162018 and 20152017
General. Net income for the twelve months ended December 31, 20162018 was $64.9$55.1 million, an increase of $18.7$14.0 million, or 40.48%33.97%, compared to $46.2$41.1 million for the twelve months ended December 31, 2015.2017. Diluted earnings per common share were $2.24$1.92 for the twelve months ended December 31, 2016,2018, an increase of $0.65,$0.51, or 40.88%36.17%, from $1.59$1.41 for the twelve months ended December 31, 2015.
2017. Return on average equity increased to 13.07%10.30% for the twelve months ended December 31, 2016,2018, from 9.93%7.75% for the prior year. Return on average assets increased to 1.10%0.85% for the twelve months ended December 31, 2016,2018, from 0.86%0.66% for the prior year.
Interest Income. Interest income increased $16.9$22.4 million, or 8.25%9.55%, to $221.0$257.0 million for the year ended December 31, 20162018 from $204.1$234.6 million for the year ended December 31, 2015.2017. The increase in interest income was primarily due to an increase of $542.6$278.2 million in the average balance of interest-earning assets to $5,626.7$6,194.2 million for the year ended December 31, 20162018 from $5,084.2$5,916.1 million for the year ended December 31, 2015, which was partially offset by a nine2017, combined with an increase of 18 basis point reductionpoints in the yield of interest-earning assets to 3.93%4.15% for the year ended December 31, 20162018 from 4.02%3.97% for the year ended December 31, 2015.2017. The nine18 basis point declineincrease in the yield of interest-earning assets was primarily due to an increase of $328.4 million in the average balance of higher yielding total loans, net to $5,317.0 million for the year ended December 31, 2018, combined with a 19decrease of $64.3 million in the average balance of lower yielding total securities to $801.6 million for the year ended December 31, 2018. Additionally, the 18 basis point reductionimprovement in the yield of interest-earning assets was aided by an 18 basis point increase in the yield on the loan portfoliototal loans to 4.24%4.38% for the twelve months ended December 31, 20162018 from 4.43% for the twelve months ended4.20% from December 31, 2015, partially offset by2017, coupled with a 10two basis point increase in the yield on total securities to 2.65%2.88% for the twelve monthsyear ended December 31, 20162018 from 2.55%2.86% for the prior year. The 1918 basis point decreaseincrease in the yield on the loan portfolio was primarily due to loan yields repricing upwards. The yield on the loan portfolio, excluding prepayment penalty income increased 19 basis points to 4.28% for the twelve months ended December 31, 2018 from 4.09 % for the twelve months ended December 31, 2017.
58
Interest Expense. Interest expense increased $28.1 million, or 45.73%, to $89.6 million for the year ended December 31, 2018 from $61.5 million for the year ended December 31, 2017. The increase in interest expense was primarily due to an increase of 45 basis points in the average cost of interest-bearing liabilities to 1.62% for the year ended December 31, 2018 from 1.17% for the year ended December 31, 2017, combined with an increase of $249.5 million in the average balance of interest-bearing liabilities to $5,517.6 million for the year ended December 31, 2018, from $5,268.1 million for the prior year. The 45 basis point increase in the cost of interest-bearing liabilities was primarily due to the Bank raising the rates we pay on some of our deposit products to stay competitive within our market and an increase in borrowing costs from increases in the federal funds rate.
Net Interest Income. Net interest income for the year ended December 31, 2018 totaled $167.4 million, a decrease of $5.7 million, or 3.29%, from $173.1 million for 2017. The decrease in net interest income was primarily due to a 27 basis point decrease in the net interest spread to 2.53% for the twelve months ended December 31, 2018 from 2.80% for the prior year. The yield on interest-earning assets increased 18 basis points to 4.15% for the year ended December 31, 2018 from 3.97% for the year ended December 31, 2017, and the cost of interest-bearing liabilities increased 45 basis point to 1.62% for the year ended December 31, 2018 from 1.17% for the prior year. The net interest margin decreased 23 basis points to 2.70% for the year ended December 31, 2018 from 2.93% for the year ended December 31, 2017. Excluding prepayment penalty income, the net interest margin would have been 2.62% and 2.84% for the years ended December 31, 2018 and 2017, respectively.
Provision for Loan Losses. Provision for loan losses of $0.6 million was recorded for the year ended December 31, 2018, compared to $9.9 million during the prior year. The $0.6 million provision was recorded due to the analysis of the adequacy of the allowance for loan losses indicating that the provision was necessary to maintain the reserve at an appropriate level. During the twelve months ended December 31, 2018, non-accrual loans increased $0.5 million to $16.3 million from $15.7 million at December 31, 2017. During the twelve months ended December 31, 2018, the Bank recorded net recoveries totaling $19,000. The current average loan-to-value ratio for our non-performing loans collateralized by real estate was 34.9% at December 31, 2018. The Bank continues to maintain conservative underwriting standards. We anticipate that we will continue to see low loss content in our loan portfolio.
Non-Interest Income. Non-interest income for the twelve months ended December 31, 2018 was $10.3 million, a decrease of $25,000, or 0.24%, from $10.4 million for the twelve months ended December 31, 2017. Non-interest income decreased due to an increase in net losses from the sale of securities of $1.7 million, partially offset by an increase in gains from life insurance proceeds of $1.6 million.
Non-Interest Expense. Non-interest expense was $111.7 million for the twelve months ended December 31, 2018, an increase of $4.2 million, or 3.92%, from $107.5 million for the twelve months ended December 31, 2017. The increase in non-interest expense was primarily due to increases in salaries and employee benefits, professional services and depreciation and amortization expense due to the growth of the Bank.
Income Tax Provisions. Income tax expense for the year ended December 31, 2018 decreased $14.6 million, or 58.4%, to $10.4 million, compared to $25.0 million for the year ended December 31, 2017. The decrease was primarily due to a decrease in the effective tax rate to 15.9% for the year ended December 31, 2018 from 37.8% in the prior year and the $0.6 million decrease in income before income taxes. The decrease in the effective tax rate was primarily due to the release of a previously accrued tax liability totaling $3.5 million and the impact of the top federal tax rate declining to 21% in 2018 from 35% in 2017, as a result of the Tax Cuts and Jobs Act (the “TCJA”). Additionally, the year ended December 31, 2017 included $3.8 million in additional tax expense from the revaluation of our net deferred tax assets, resulting from the TCJA.
Comparison of Operating Results for the Years Ended December 31, 2017 and 2016
General. Net income for the twelve months ended December 31, 2017 was $41.1 million, a decrease of $23.8 million, or 36.66%, compared to $64.9 million for the twelve months ended December 31, 2016. Diluted earnings per common share were $1.41 for the twelve months ended December 31, 2017, a decrease of $0.83, or 37.1%, from $2.24 for the twelve months ended December 31, 2016. Included in net income for the year ended December 31, 2016 was a gain on sale of buildings totaling $48.0 million, whereas there was no such gain in the recent year.
Return on average equity decreased to 7.75% for the twelve months ended December 31, 2017, from 13.07% for the prior year. Return on average assets decreased to 0.66% for the twelve months ended December 31, 2017, from 1.10% for the prior year.
59
Interest Income. Interest income increased $13.6 million, or 6.15%, to $234.6 million for the year ended December 31, 2017 from $221.0 million for the year ended December 31, 2016. The increase in interest income was primarily due to an increase of $289.3 million in the average balance of interest-earning assets to $5,916.1 million for the year ended December 31, 2017 from $5,626.7 million for the year ended December 31, 2016, combined with an increase of four basis points in the yield of interest-earning assets to 3.97% for the year ended December 31, 2017 from 3.93% for the year ended December 31, 2016. The four basis point increase in the yield of interest-earning assets was primarily due to an increase of $387.9 million in the average balance of higher yielding total loans, net to $4,988.6 million for the year ended December 31, 2017, combined with a decrease of $101.6 million in the average balance of lower yielding total securities to $866.0 million for the year ended December 31, 2017. Additionally, the four basis point improvement the yield of interest-earning assets was aided by a 21 basis point increase in the yield on total securities to 2.86% for the twelve months ended December 31, 2017 from 2.65% for the twelve months ended December 31, 2016, partially offset by a four basis point decline in the rates earnedyield on new loan originations and existingthe total loans modified to lower rates.4.20% for the twelve months ended December 31, 2017 from 4.24% for the prior year. The 1021 basis point increase in the yield on the securities portfolio was primarily due to the purchase of new securities at higher yields than the existing portfolio. The four basis point decrease in the yield on the loan portfolio was primarily due to a decline in prepayment penalty income collected in 2017 compared to 2016. The yield on the loan portfolio, excluding prepayment penalty income on loans, decreased 17one basis points to 4.10%4.09% for the twelve months ended December 31, 20162017 from 4.274.10 % for the twelve months ended December 31, 2015.2016.
Interest Expense. Interest expense increased $4.2$7.6 million, or 8.42%14.04%, to $61.5 million for the year ended December 31, 2017 from $53.9 million for the year ended December 31, 2016. The increase in interest expense was primarily due to an increase of 10 basis points in the average cost of interest-bearing liabilities to 1.17% for the year ended December 31, 2017 from 1.07% for the year ended December 31, 2016, from $49.7combined with an increase of $232.1 million in the average balance of interest-bearing liabilities to $5,268.1 million for the year ended December 31, 2015.2017, from $5,036.0 million for the prior year. The 10 basis point increase in the cost of interest-bearing liabilities was primarily attributabledue to the Bank raising the rates we pay on some of our deposit products to stay competitive within our market. This increase in rates was partially offset by an increase of $449.5 millionimprovement in our funding mix, as the combined average balance of interest-bearing liabilitieslower costing savings, NOW and money market deposits increased $306.8 million to $5,036.0$2,645.9 million for the year ended December 31, 20162017 from $4,586.4$2,339.1 million for the prior year, while the combined average balance of higher costing certificates of deposit and borrowed funds decreased $80.5 million to $2,560.3 million for the year ended December 31, 2015, which was partially offset by a decrease of one basis point in the cost of interest-bearing liabilities to 1.07% for the year ended December 31, 20162017 from 1.08% for the year ended December 31, 2015. The one basis point decrease in the cost of interest-bearing liabilities was primarily attributable to decreases of nine basis points in each of the cost of certificates of deposit and borrowed funds. The decrease in the cost of certificates of deposit and borrowed funds was primarily due to maturing issuances being replaced at lower rates. Additionally, the cost of borrowed funds benefited from the early extinguishment of $130.0 million in FHLB-NY advances at an average cost of 2.82% and $78.0 million in securities sold under agreements to repurchase, at an average cost of 3.80% during 2016. These decreases were partially offset by increases of 21 basis points, seven basis points and four basis points in the cost of money market, NOW and savings accounts, respectively, for the twelve months ended December 31, 2016 from the comparable prior year period. The cost of money market accounts increased primarily due to our shifting of Government NOW deposits to a money market product which does not require us to provide collateral, allowing us to invest these funds in higher yielding assets. The cost of NOW and savings accounts increased as we increased the rate we pay on some of our products to attract additional deposits. Additionally, the cost of interest-bearing liabilities was negatively affected by increases of $126.6 million and $58.2 million in the average balance of higher costing borrowed funds and certificates of deposit, during the twelve months ended December 31, 2016, which was partially offset by an increase of $261.0 million in the average balance of lower-costing core deposits during the twelve months ended December 31, 2016 to $2,339.1 million from $2,078.1$2,640.8 million for the comparable prior year period.year.
Net Interest Income. Net interest income for the year ended December 31, 20162017 totaled $167.1$173.1 million, an increase of $12.7$6.0 million, or 8.20%3.60%, from $154.4$167.1 million for 2015.2016. The increase in net interest income was primarily due to the growth of net interest-earning assets. These improvements to net interest income were partially offset by a decrease in the net interest spread of eightsix basis points to 2.86%2.80% for the twelve months ended December 31, 20162017 from 2.94%2.86% for the prior year. The yield on interest-earning assets decreased nineincreased four basis points to 3.97% for the year ended December 31, 2017 from 3.93% for the year ended December 31, 2016, from 4.02%while the cost of interest-bearing liabilities increased 10 basis point to 1.17% for the year ended December 31, 2015, while2017 from 1.07% for the cost of interest-bearing liabilitiesprior year. The net interest margin decreased onefour basis pointpoints to 1.07%2.93% for the year ended December 31, 20162017 from 1.08% for the prior year period. The net interest margin decreased seven basis points to 2.97% for the year ended December 31, 2016 from 3.04% for the year ended December 31, 2015.2016. Excluding prepayment penalty income, the net interest margin would have been 2.85%2.84% and 2.91%2.85% for the years ended December 31, 20162017 and 2015,2016, respectively.
Provision (Benefit) for Loan Losses. PThere was no provision or benefitrovision for loan losses of $9.9 million was recorded for the twelve monthsyear ended December 31, 2016,2017, compared to a benefit of $1.0 millionno provision during the prior year. The provision recorded during the comparable prior year period. No provision2017 was recorded during the twelve months ended December 31, 2016 due to the Company’s analysisestimated fair value of the adequacy of the allowance for loan losses indicating that the reserve was at an appropriate level.NYC taxi medallions being lowered based on most recent sales data. During the twelve months ended December 31, 2016,2017, non-accrual loans decreased $1.8$5.3 million to $21.0$15.7 million from $22.8$21.0 million at December 31, 2015.2016. During the twelve months ended December 31, 2016,2017, the Bank recorded net recoveriescharge-offs totaling $0.7$11.7 million, or two24 basis points of average loans. The current average loan-to-value ratio for our non-performingnon-performing loans collateralized by real estate was 39.1%39.8% at December 31, 2016.2017. When we have obtained properties through foreclosure, we have been able to quickly sell the properties at amounts that approximate book value. The Bank continues to maintain conservative underwriting standards. We anticipate that we will continue to see low loss content in our loan portfolio.
Non-Interest Income. Non-interest income for the twelve months ended December 31, 20162017 was $57.5$10.4 million, an increasea decrease of $41.8$47.2 million, or 266.03%81.99%, from $15.7$57.5 million for the twelve months ended December 31, 2015.2016. The increasedecrease in non-interest income was primarily due to an increase of $41.5 million in net gains on the sale of buildings of $48.0 million, as we sold three of our branch buildings during each of the yearsyear ending December 31, 2016 and 2015 in sale-leaseback transactions. Additionally, non-interest income increaseddecreased due to an increasea decrease in net gains from the sale of securities of $1.4$1.7 million and a gainpartially offset by an increase in gains from life insurance proceeds of $0.5$0.9 million. These increases were partially offset by a $1.6 million increase in net losses from fair value adjustments.
Non-Interest Expense. Non-interest expense was $107.5 million for the twelve months ended December 31, 2017, a decrease of $11.1 million, or 9.38%, from $118.6 million for the twelve months ended December 31, 2016, an increase of $20.9 million, or 21.37%, from $97.7 million for the twelve months ended December 31, 2015.2016. The increasedecrease in non-interest expense was primarily due to increases ofthe year ended December 31, 2016 including $10.4 million in prepayment penalties from the early extinguishment of debt during 2016, $7.7 million in salaries and benefits expense, $1.6 million in other operating expenses, $0.9 million in depreciation and amortization expense and $0.6 million in professional services expense from increases in legal and consulting expenses. The increase in salaries and benefits was primarily due to annual salary increases and additions in staffing in retail, audit and compliance departments, as well as increases in production incentives and the cost of split dollar life insurance benefits. The increase in other operating expenses was due to a $1.4 million increase in net losses on the sale of OREO recorded during the twelve months ended December 31, 2016, primarily due to the write-down and subsequent sale of one OREO. The growth in depreciation and amortization expense was primarily due to the opening of two new branches along with the move to our new corporate headquarters both occurring during 2015. The efficiency ratio was 59.6% for the twelve months ended December 31, 2016 compared to 58.6% for the twelve months ended December 31, 2015.debt.
60
Income Tax Provisions. Income tax expense for the year ended December 31, 2016 increased $13.92017 decreased $16.1 million, or 51.30%39.15%, to $41.1$25.0 million, compared to $27.2$41.1 million for the year ended December 31, 2015.2016. The increasedecrease was primarily due to a $32.6decrease of $39.9 million increase in income before income taxes and an increasea decrease in the effective tax rate to 38.8%37.8% for the twelve months ended December 31, 20162017 from 37.0%38.8% in the comparable prior year period.year. The increasedecrease in the effective tax rate reflects the reduced impact that preferential tax items had on the Company’s tax liability during the twelve months ended December 31, 20162017 compared to the twelve months ended December 31, 2015.
Comparison of Operating Results for the Years Ended December 31, 2015 and 2014
General. Net income for the twelve months ended December 31, 2015 was $46.2 million, an increase of $2.0 million, or 4.45%, compared to $44.2 million for the twelve months ended December 31, 2014. Diluted earnings per common share were $1.59 for the twelve months ended December 31, 2015, an increase of $0.11, or 7.43%, from $1.48 for the twelve months ended December 31, 2014.
Return on average equity increased to 9.93% for the twelve months ended December 31, 2015, from 9.82% for the prior year. Return on average assets decreased to 0.86% for the twelve months ended December 31, 2015, from 0.91% for the prior year.
The prepayment penalty for the extinguishment of debt totaling $5.2 million, recorded during the year ended December 31, 2014, has been reclassified from interest expense to non-interest expense to conform to the presentation for the year ended December 31, 2016.
Interest Income. Interest income increased $7.0 million, or 3.56%, to $204.1 million for the year ended December 31, 2015 from $197.1 million for the year ended December 31, 2014. The increase in interest income was primarily due to an increase of $500.5 million in the average balance of interest-earning assets to $5,084.2 million for the year ended December 31, 2015 from $4,583.7 million for the year ended December 31, 2014, which This was partially offset by a 28 basis point reduction in the yield of interest-earning assets to 4.02% for the year ended December 31, 2015 from 4.30% for the year ended December 31, 2014. The 28 basis point decline in the yield of interest-earning assets was primarily due to a 41 basis point reduction in the yield on the loan portfolio to 4.43% for the twelve months ended December 31, 2015 from 4.84% for the twelve months ended December 31, 2014, combined with a seven basis point decline in the yield on total securities to 2.55% for the twelve months ended December 31, 2015 from 2.62% for the prior year. The 41 basis point decrease in the yield on the loan portfolio was primarily due to a decline in the rates earned on new loan originations and existing loans modified to lower rates. The seven basis point decrease in the yield on the securities portfolio was primarily due to the purchase of new securities at lower yields than the existing portfolio. The yield on the loan portfolio, excluding prepayment penalty income on loans, decreased 40 basis points to 4.27% for the twelve months ended December 31, 2015 from 4.67 % for the twelve months ended December 31, 2014.
Interest Expense. Interest expense increased $0.2 million, or 0.35%, to $49.7 million for the year ended December 31, 2015 from $49.6 million for the year ended December 31, 2014. The increase in the cost of interest-bearing liabilities was primarily attributable to an increase of $450.0$3.8 million in the average balance of interest-bearing liabilities to $4,586.4 million for the year ended December 31, 2015 from $4,136.4 million for the year ended December 31, 2014, which was partially offset by a decrease of 12 basis points in the cost of interest-bearing liabilities to 1.08% for the year ended December 31, 2015 from 1.20% for the year ended December 31, 2014. The 12 basis point decrease in the cost of interest-bearing liabilities was primarily attributable to decreases of 32 basis points and 20 basis points in the cost of certificates of deposit and borrowed funds, respectively. The decrease in the cost of certificates of deposit and borrowed funds was primarily due to maturing issuances being replaced at lower rates. These decreases were partially offset by increases of 20 basis points and 14 basis points in the cost of savings and money market accounts, respectively, for the twelve months ended December 31, 2015additional tax expense recorded during 2017 from the comparable prior year period. The cost of savings accounts increased as we increased the rate we pay on somerevaluation of our savings products to attract additional deposits. The cost of money market accounts increased primarily due to our shifting of Government NOW deposits to a money market product which does not require us to provide collateral, allowing us to invest these funds in higher yielding assets. Additionally, the cost of interest-bearing liabilities was negatively affected by increases of $151.8 million and $110.6 million in the average balance of higher costing certificates of deposit and borrowed funds, respectively, during the twelve months ended December 31, 2015, which was partially offset by an increase of $183.2 million in the average balance of lower-costing core deposits during the twelve months ended December 31, 2015 to $2,078.1 million from $1,894.9 million for the comparable prior year period.
Net Interest Income. Net interest income for the year ended December 31, 2015 totaled $154.4 million, an increase of $6.8 million, or 4.64%, from $147.6 million for 2014. The increase in net interest income was due to the growth of net interest-earningdeferred tax assets, and an increase in prepayment penalty income. These improvements to net interest income were partially offset by a decrease in the net interest spread of 16 basis points to 2.94% for the twelve months ended December 31, 2015 from 3.10% for the prior year. The yield on interest-earning assets decreased 28 basis points to 4.02% for the year ended December 31, 2015 from 4.30% for the year ended December 31, 2014, while the cost of interest-bearing liabilities decreased 12 basis points to 1.08% for the year ended December 31, 2015 from 1.20% for the prior year period. The net interest margin decreased 18 basis points to 3.04% for the year ended December 31, 2015 from 3.22% for the year ended December 31, 2014. Excluding prepayment penalty income, the net interest margin would have been 2.91% and 3.09% for the years ended December 31, 2015 and 2014, respectively.
Provision (Benefit) for Loan Losses. The benefit for loan losses for the twelve months ended December 31, 2015 was $1.0 million, a decrease of $5.1 million, or 84.12%, from a benefit of $6.0 million during the comparable prior year period. The benefit recorded during the twelve months ended December 31, 2015 was primarily due to the continued improvement in both credit conditions and, the qualitative factors used in the calculation of the allowance for loan losses. During the twelve months ended December 31, 2015, non-accrual loans decreased $9.1 million to $22.8 million from $31.9 million at December 31, 2014. During the twelve months ended December 31, 2015, net charge-offs totaled $2.6 million, or six basis points of average loans, primarily as a result of two business loans which the Bank deemed unrecoverable. The current average loan-to-value ratio for our non-performing loans collateralized by real estate was 41.4% at December 31, 2015. When we have obtained properties through foreclosure, we have been able to quickly sell the properties at amounts that approximate book value. The Bank continues to maintain conservative underwriting standards. We anticipate that we will continue to see low loss content in our loan portfolio. As a result of the quarterly analysis of the allowance for loans losses, a reduction in the allowance was warranted and, as such, the Company recorded a benefit of $1.0 million for the twelve months ended December 31, 2015.
Non-Interest Income. Non-interest income for the twelve months ended December 31, 2015 was $15.7 million, an increase of $5.5 million, or 53.46%, from $10.2 million for the twelve months ended December 31, 2014. The increase in non-interest income was primarily due to an increase of $6.5 million in net gains on the sale of buildings, as we sold and leased back our Brooklyn branch buildings, and increases of $0.4 million in net gains on the sale of loans and $0.3 million in other income. Additionally, non-interest income increased due to a decrease of $0.7 million in net losses from fair value adjustments. These improvements to non-interest income were partially offset by a decrease of $2.7 million in net gains on the sale of securities, primarily due to the comparable prior year period including a net gain on the sale of securities totaling $2.9 million which was comprised of net gains on the sale of securities, as part of a balance sheet deleveraging and net losses on the sale of securitiesresulting from the sale of substandard trust preferred securities.
Non-Interest Expense. Non-interest expenseTax Cuts and Jobs Act (the “TCJA”), which reduced our federal income tax rate from 35% to 21%, effective January 1, 2018. Additionally, on December 22, 2017, Staff Accounting Bulletin No. 118 (“SAB 118”) was $97.7 million forreleased by the twelve months ended December 31, 2015, an increase of $6.7 million, or 7.35%, from $91.0 million for the twelve months ended December 31, 2014. The increase in non-interest expense was primarily dueSEC to increases of $4.1 million in salaries and benefits, $3.3 million in other operating expenses and $2.2 million in occupancy and equipment expense. The increase in salaries and benefits was primarily due to annual salary increases, increases in staffing in the technology, risk/compliance and retail departments, as well as an increase in restricted stock expense. The increase in other operating expenses was primarily due to $1.0 million in expensesaddress any concerns related to the move of our corporate headquarters, $0.9 million in expenses related to the growth of the Company, $0.7 million in net losses on the sale of OREO and $0.5 million in additional temporary staffing and hiring fees. Other operating expenses also included $0.3 million in ATM fraud losses recorded in 2015. The growth in occupancy and equipment expense was primarily due to increases in rent expense of $1.4 millionaccounting for our new corporate headquarters and new branch at the same location and $0.6 million from additional space in Manhattan for Business Bankers and a new branch location, which opened in September 2015. Occupancy and equipment expense also included $0.2 million recorded in 2015 for temporary staff for additional security to guard against further ATM fraud losses. Additionally, during the twelve months ended December 31, 2015, the Company also experienced increases of $1.1 million in professional services, primarily due to increased legal and compliance costs and $0.8 million, $0.5 million and $0.3 million in depreciation and amortization expense, FDIC insurance expense and data processing expense, respectively, primarily due to the growth of the Bank. OREO/foreclosure expenses decreased $0.4 million during the twelve months ended December 31, 2015 due to such period including recoveries of legal fees and a reduction in the level of non-performing loans. These increases were partially offset by the prior year including a $5.2 million prepayment penalty recorded on borrowingsincome tax effects as a result of the Bank prepaying $66.9 millionTCJA in long-term FHLB-NY advances and $30.0 millionsituations where a registrant may not have the necessary information available, prepared, or analyzed in repurchase agreements. The efficiency ratio increasedreasonable detail to 58.6% forcomplete the twelve months ended December 31, 2015 from 54.4% for the twelve months ended December 31, 2014, primarily due to the increased expenses discussed above.
Income Tax Provisions. Income tax expense for the year ended December 31, 2015 decreased $1.4 million, or 4.92%, to $27.2 million, compared to $28.6 million for the year ended December 31, 2014. The decrease was primarily due to a reductionrequired accounting in the effective tax ratereporting period including the enactment date. SAB 118 allows for a measurement period not to 37.0% forextend beyond one year from the twelve months ended December 31, 2015 from 39.2% inTCJA enactment date to complete the comparable prior year period, partially offset by an increase of $0.6 million in income before income taxes. The decrease in the effective tax rate reflects the impact of a change in New York City tax law enacted in 2015, which based on the Company’s lending mix and certain other factors, reduced our New York City tax liability. Additionally, the decrease in the effective tax rate reflects the greater impact that preferential tax items had on the Company’s tax liability during the twelve months ended December 31, 2015 compared to the twelve months ended December 31, 2014.necessary accounting.
Liquidity, Regulatory Capital and Capital Resources
Our primary sources of funds are deposits, borrowings, principal and interest payments on loans, mortgage-backed and other securities, and proceeds from sales of securities and loans. Deposit flows and mortgage prepayments, however, are greatly influenced by general interest rates, economic conditions and competition. At December 31, 2016,2018, the Bank was able to borrow up to $2,703.1$2,943.0 million from the FHLB-NY in Federal Home Loan Bank advances and letters of credit. As of December 31, 2016,2018, the Bank had $1,506.4$1,794.5 million outstanding in combined balances of FHLB-NY advances and letters of credit. At December 31, 2015,2018, the Bank also has unsecured lines of credit with other commercial banks totaling $100.0 million. In addition, Flushing Financial Corporationthe Holding Company has subordinated debentures totaling $73.4$74.0 million and junior subordinated debentures with a face amount of $61.9 million and a carrying amount of $34.0$41.8 million (which are both included in Borrowed Funds). (See Note 9 of Notes to the Consolidated Financial Statements in Item 8 of this Annual Report.) Management believes its available sources of funds are sufficient to fund current operations.
Our most liquid assets are cash and cash equivalents, which include cash and due from banks, overnight interest-earning deposits and federal funds sold with original maturities of 90 days or less. The level of these assets is dependent on our operating, financing, lending and investing activities during any given period. At December 31, 2016,2018, cash and cash equivalents totaled $35.9$118.6 million, a decreasean increase of $6.5$67.0 million from December 31, 2015.2017. We also held marketable securities available for sale with a market value of $861.4$822.7 million at December 31, 2016.2018.
At December 31, 2016,2018, we had commitments to extend credit (principally real estate mortgage loans) of $78.1$64.9 million and open lines of credit for borrowers (principally business lines of credit and home equity loan lines of credit) of $244.6$248.7 million. Since generally all of the loan commitments are expected to be drawn upon, the total loan commitments approximate future cash requirements, whereas the amounts of lines of credit may not be indicative of our future cash requirements. The loan commitments generally expire in 90 days, while construction loan lines of credit mature within 18 months and home equity loan lines of credit mature within 10 years. We use the same credit policies in making commitments and conditional obligations as we do for on-balance-sheet instruments.
Our total interest expense and operatingnon-interest expense in 20162018 were $53.9$89.6 million and $118.6$111.7 million, respectively.
We maintain three postretirement defined benefit plans for our employees: a noncontributory defined benefit pension plan which was frozen as of September 30, 2006, a contributory medical plan, and a noncontributory life insurance plan. The life insurance plan was amended to discontinue providing life insurance benefits to future retirees after January 1, 2010 and the medical plan was frozen as of January 1, 2011. We also maintain a noncontributory defined benefit plan for certain of our non-employee directors, which was frozen as of January 1, 2004. The employee pension plan is the only plan that we have funded. During 2016,2018, we incurred cash expenditures of $0.1 million for each of the medical and life insurance plans and $0.1 million for the non-employee director plan; weplan. We did not make a contribution to the employee pension plan in 2016.2018. We expect to pay similar amounts for these plans in 2016.2019. (See Note 12 of Notes to Consolidated Financial Statements in Item 8 of this Annual Report.)
The amounts reported in our financial statements are obtained from reports prepared by independent actuaries, and are based on significant assumptions. The most significant assumption is the discount rate used to determine the accumulated postretirement benefit obligation (“APBO”) for these plans. The APBO is the present value of projected benefits that employees and retirees have earned to date. The discount rate is a single rate at which the liabilities of the plans are discounted into today’s dollars and could be effectively settled or eliminated. The discount rate used is based on the FTSE Pension Discount Curve (formerly the Citigroup Pension Liability Index,Index), and reflects a rate that could be earned on bonds over a similar period that we anticipate the plans’ liabilities will be paid. An increase in the discount rate would reduce the APBO, while a reduction in the discount rate would increase the APBO. During the past several years, when interest rates have been at historically low levels, the discount rate used for our plans has declined from 7.25% for 2001 to 3.88%4.06% for 2016.2018. This decline in the discount rate has resulted in an increase in our APBO.
61
The Company’s actuaries use several other assumptions that could have a significant impact on our APBO and periodic expense for these plans. These assumptions include, but are not limited to, expected rate of return on plan assets, future increases in medical and life insurance premiums, turnover rates of employees, and life expectancy. The accounting standards for postretirement plans involve mechanisms that serve to limit the volatility of earnings by allowing changes in the value of plan assets and benefit obligations to be amortized over time when actual results differ from the assumptions used, there are changes in the assumptions used, or there are plan amendments. At December 31, 2016,2018, our employee pension plan and medical and life insurance plan have unrecognized losses of $8.1$3.2 million and $0.6 million,$35,000, respectively. The non-employee director plan has a $0.5$0.6 million unrecognized gain, due to experience different from what had been estimated and changes in actuarial assumptions. The employee pension plan’s unrecognized loss is primarily attributed to the reduction in the discount rate and change in the Plan’s mortality table. The medical and life insurance plans’ unrecognized loss is attributed to the reduction in the discount rate over the past several years. In addition, the non-employee director pension plan has anno unrecognized past service liability of $0.1 million due to plan amendments in prior years and the medical and life insurance plan have a $0.5$0.3 million past service credit due to plan amendments. The net after tax effect of the unrecognized gains and losses associated with these plans has been recorded in accumulated other comprehensive loss in stockholders’ equity, resulting in a reduction of stockholders’ equity of $4.5$1.7 million as of December 31, 2016.2018.
The change in the discount rate, the Pension Plan’s mortality table and the reduction in medical premiums are the only significant changes made to the assumptions used for these plans for each of the three years ended December 31, 2015.2018. During the years ended December 31, 2016, 20152018, 2017 and 2014,2016, the actual return on the employee pension plan assets was approximately 90%94%, 31%255% and 74%90%, respectively, of the assumed return used to determine the periodic pension expense for that respective year.
The market value of the assets of our employee pension plan is $20.5$22.4 million at December 31, 2016,2018, which is $2.3$2.1 million less than the projected benefit obligation. We do not anticipate a change in the market value of these assets which would have a significant effect on liquidity, capital resources, or results of operations.
During 2016,2018, funds provided by the Company's operating activities amounted to $42.4$77.3 million. These funds combined with $273.3$467.7 million provided from financing activities and $42.4 million available at the beginning of the period were utilized to fund net investing activities of $322.2$478.0 million. The Company's primary business objective is the origination and purchase of multi-family residential loans, commercial business loans and commercial real estate mortgage loans and to a lesser extent one-to-four family (including mixed-use properties) and SBA loans.. During the year ended December 31, 2016,2018, the net total of loan originations and purchases less loan repayments and sales was $442.7$379.6 million. During the year ended December 31, 2016,2018, the Company also purchased $179.4$307.7 million in securities. During 2016,2018, funds were provided by net increases of $312.3$577.1 million and $178.5$165.3 million in total deposits and short-term borrowed funds, respectively, and $300.0$41.0 million in long-term borrowings. Additionally, funds were provided by $270.8$203.9 million in proceeds from maturities, sales, calls and prepayments of securities, $73.4 million from the issuance of subordinated debentures and $49.3 million in proceeds from the sale of buildings.securities. The Company also used funds of $562.4$270.1 million, $19.7$22.9 million and $9.9$22.6 million for the repayment of long-term borrowed funds, dividend payments and purchases of treasury stock, respectively, during the year ended December 31, 2015.2018.
At the time of the Bank’s conversion from a federally chartered mutual savings bank to a federally chartered stock savings bank, the Bank was required by its primary regulator to establish a liquidation account which is reduced as and to the extent that eligible account holders reduce their qualifying deposits. Upon completion of the Merger, the liquidation account was assumed by the Bank. The balance of the liquidation account at December 31, 20162018 was $0.7$0.5 million. In the unlikely event of a complete liquidation of the Bank, each eligible account holder will be entitled to receive a distribution from the liquidation account. The Bank is not permitted to declare or pay a dividend or to repurchase any of its capital stock if the effect would be to cause the Bank’s regulatory capital to be reduced below the amount required for the liquidation account but approval of the NYDFS Superintendent is required if the total of all dividends declared by the Bank in a calendar year would exceed the total of its net profits for that year combined with its retained net profits for the preceding two years less prior dividends paid. Flushing Financial CorporationThe Holding Company is subject to the same regulatory restrictions on the declaration of dividends as the Bank.
Regulatory Capital Position. Under applicable regulatory capital regulations, the Bank and the Company are required to comply with each of four separate capital adequacy standards: leverage capital, common equity Tier I risk-based capital, Tier I risk-based capital and total risk-based capital. Such classifications are used by the FDIC and other bank regulatory agencies to determine matters ranging from each institution’s quarterly FDIC deposit insurance premium assessments, to approvals of applications authorizing institutions to grow their asset size or otherwise expand business activities. At December 31, 20162018 and 2015,2017, the Bank and the Company exceeded each of their four regulatory capital requirements. (See Note 14 of Notes to Consolidated Financial Statements included in Item 8 of this Annual Report.)
62
The Company’s accounting policies are integral to understanding the results of operations and statement of financial condition. These policies are described in the Notes to Consolidated Financial Statements. Several of these policies require management’s judgment to determine the value of the Company’s assets and liabilities. The Company has established detailed written policies and control procedures to ensure consistent application of these policies. The Company has identified four accounting policies that require significant management valuation judgment: the allowance for loan losses, fair value of financial instruments, including other-than-temporary impairment assessment, goodwill impairment and income taxes.
Allowance for Loan Losses. An allowance for loan losses (“ALL”) is provided to absorb probable estimated losses inherent in the loan portfolio. Management reviews the adequacy of the allowance for loan lossesALL by reviewing all impaired loans on an individual basis. The remaining portfolio is evaluated based on the Company's historical loss experience, recent trends in losses, collection policies and collection experience, trends in the volume of non-performing loans, changes in the composition and volume of the gross loan portfolio, and local and national economic conditions. Judgment is required to determine how many years of historical loss experience are to be included when reviewing historical loss experience. A full credit cycle must be used, or loss estimates may be inaccurate. This evaluation is inherently subjective, as it requires estimates that are susceptible to significant revisions as more information becomes available.
Notwithstanding the judgment required in assessing the components of the allowance for loan losses,ALL, the Company believes that the allowance for loan lossesALL is adequate to cover losses inherent in the loan portfolio. The policy has been applied on a consistent basis for all periods presented in the Consolidated Financial Statements.
Fair Value of Financial Instruments. The Company carries certain financial assets and financial liabilities at fair value under the fair value option. Fair value is considered the price that would be received to sell an asset or paid to transfer a liability in an orderly transaction between market participants at the measurement date. Management selected the fair value option for certain investment securities, primarily mortgage-backed securities, and certain borrowings. Changes in the fair value of financial instruments for which the fair value election is made are recorded in the Consolidated Statements of Income. At December 31, 2016,2018, financial assets and financial liabilities with fair values of $30.4$13.8 million and $34.0$41.8 million, respectively, are carried at fair value under the fair value option.
The securities portfolio also consists of mortgage-backed and other securities for which the fair value election was not selected. These securities are classified as available for sale or held-to-maturity. Securities classified as available for sale are carried at fair value in the Consolidated Statements of Financial Condition, with changes in fair value recorded in Accumulatedaccumulated other comprehensive loss. Securities held-to-maturity are carried at their amortized cost in the Consolidated Statements of Financial Condition. If any decline in fair value for securities classified available for sale or held-to-maturity is deemed other-than-temporary, the security is written down to a new cost basis with the resulting loss recorded in the Consolidated Statements of Income. During 20162018 and 2015,2017, no other-than-temporary impairment charges were recorded.
Financial assets and financial liabilities reported at fair value are required to be measured based on the following alternatives: (1) quoted prices in active markets for identical financial instruments (Level 1), (2) significant other observable inputs (Level 2), or (3) significant unobservable inputs (Level 3). Judgment is required in selecting the appropriate level to be used to determine fair value. The majority of financial assets and financial liabilities for which the fair value election was made, and the majority of investments classified as available for sale and held-to-maturity, were measured using Level 2 inputs, which require judgment to determine the fair value. The trust preferred securities held in the investment portfolio, and the Company’s junior subordinated debentures, were measured using Level 3 inputs due to the inactive market for these securities.
Goodwill Impairment. Goodwill is presumed to have an indefinite life and is tested for impairment, rather than amortized, on at least an annual basis. For the purpose of goodwill impairment testing, management has concluded that the Company has one reporting unit. If the fair value of the reporting unit exceeds its carrying amount, there is no impairment of goodwill. However, if the fair value of the reporting unit is less than its carrying amount, further evaluation is required to determine if a write down of goodwill is required.
Quoted market prices in active markets are the best evidence of fair value and are to be used as the basis for measurement, when available. Other acceptable valuation methods include an asset approach, which determines a fair value based upon the value of assets net of liabilities, an income approach, which determines fair value using one or more methods that convert anticipated economic benefits into a present single amount, and a market approach, which determines a fair value based on the similar businesses that have been sold.
63
The Company conducts its annual qualitative impairment testing of goodwill as of December 31. The impairment testing as of December 31, 2016, 20152018, 2017 and 20142016 did not show an impairment of goodwill based on the fair value of the Company.
Income Taxes. The Company estimates its income taxes payable based on the amounts it expects to owe to the various taxing authorizes (i.e. federal, state and local). In estimating income taxes, management assesses the relative merits and risks of the tax treatment of transactions, taking into account statutory, judicial and regulatory guidance in the context of the Company’s tax position. Management also relies on tax opinions, recent audits, and historical experience.
The Company also recognizes deferred tax assets and liabilities for the future tax consequences of differences between the financial statement carrying amounts of existing assets and liabilities and their respective tax bases. A valuation allowance is required for deferred tax assets that the Company estimates are more likely than not to be unrealizable, based on evidence available at the time the estimate is made. These estimates can be affected by changes to tax laws, statutory tax rates, and future income levels.
| Payments Due By Period | ||||||||||||||||||||
| More | ||||||||||||||||||||
| Less Than | 1 - 3 | 3 - 5 | Than | |||||||||||||||||
| Total | 1 Year | Years | Years | 5 Years | ||||||||||||||||
| (In thousands) | ||||||||||||||||||||
| Borrowings | $ | 1,266,563 | $ | 550,980 | $ | 408,201 | $ | 273,423 | $ | 33,959 | ||||||||||
| Deposits | 4,205,631 | 3,477,852 | 649,794 | 76,711 | 1,274 | |||||||||||||||
| Loan commitments | 322,724 | 322,724 | - | - | - | |||||||||||||||
| Operating lease obligations | 58,002 | 6,068 | 12,477 | 12,746 | 26,711 | |||||||||||||||
| Purchase obligations | 7,390 | 5,738 | 1,652 | - | - | |||||||||||||||
| Pension and other postretirement | ||||||||||||||||||||
| benefits | 13,063 | 503 | 1,076 | 1,114 | 10,370 | |||||||||||||||
| Deferred compensation plans | 18,811 | 1,355 | 2,711 | 2,711 | 12,034 | |||||||||||||||
| Total | $ | 5,892,184 | $ | 4,365,220 | $ | 1,075,911 | $ | 366,705 | $ | 84,348 | ||||||||||
| Payments Due By Period | ||||||||||||||||||||
| More | ||||||||||||||||||||
| Less Than | 1 - 3 | 3 - 5 | Than | |||||||||||||||||
| Total | 1 Year | Years | Years | 5 Years | ||||||||||||||||
| (In thousands) | ||||||||||||||||||||
| Borrowings | $ | 1,250,843 | $ | 782,899 | $ | 385,099 | $ | 40,996 | $ | 41,849 | ||||||||||
| Deposits | 4,960,784 | 4,414,651 | 483,357 | 62,280 | 496 | |||||||||||||||
| Loan commitments | 313,565 | 313,565 | - | - | - | |||||||||||||||
| Operating lease obligations | 60,714 | 7,959 | 15,310 | 13,790 | 23,655 | |||||||||||||||
| Purchase obligations | 16,407 | 5,532 | 7,753 | 3,122 | - | |||||||||||||||
| Pension and other postretirement | ||||||||||||||||||||
| benefits | 10,783 | 548 | 1,128 | 1,189 | 7,918 | |||||||||||||||
| Deferred compensation plans | 16,066 | 467 | 934 | 934 | 13,731 | |||||||||||||||
| Total | $ | 6,629,162 | $ | 5,525,621 | $ | 893,581 | $ | 122,311 | $ | 87,649 | ||||||||||
We have significant obligations that arise in the normal course of business. We finance our assets with deposits and borrowings. We also use borrowings to manage our interest-rate risk. Borrowings with call provisions are included in the period of the next call date. We have the means to refinance these borrowings as they mature or are called through financing arrangements with the FHLB-NY and our ability to arrange repurchase agreements with broker-dealers and the FHLB-NY. (See Notes 8 and 9 of Notes to Consolidated Financial Statements in Item 8 of this Annual Report.)
We focus our balance sheet growth on the origination of mortgage loans. At December 31, 2016,2018, we had commitments to extend credit and lines of credit of $322.7$313.6 million for mortgage and other loans. These loans will be funded through principal and interest payments received on existing mortgage loans and mortgage-backed securities, growth in customer deposits, and, when necessary, additional borrowings. (See Note 15 of Notes to Consolidated Financial Statements in Item 8 of this Annual Report.)
At December 31, 2016,2018, the Bank had 19 branches, which were all leased. The Bank leases its branch locations primarily when it is not the sole tenant. Whether the Bank will purchase its future branch locations will depend in part on the availability of suitable locations and the availability of properties. In addition, we lease our executive offices. We currently outsource our data processing, loan servicing and check processing functions. We believe that this is the most cost effective method for obtaining these services. These arrangements are usually volume dependent and have varying terms. The contracts for these services usually include annual increases based on the increase in the consumer price index. The amounts shown above for purchase obligations represent the current term and volume of activity of these contracts. We expect to renew these contracts as they expire.
The amounts shown for pension and other postretirement benefits reflect our directors’ pension plan and the supplemental retirement benefits of our president, and amounts due under our plan for medical and life insurance benefits for retired employees. The amount shown in the “Less Than 1 Year” column represents our current estimate for these benefits, some of which are based on information supplied by actuaries. The amounts shown in columns reflecting periods over one year represent our current estimate based on the past year’s actual disbursements and information supplied by actuaries. The amounts do not include an increase for possible future retirees or increases in health plan costs. The amount shown in the “More Than 5 Years” column represents the amount required to increase the total amount to the projected benefit obligation of the directors’ plan and the medical and life insurance benefit plans, since these are unfunded plans and the underfunded portion of the employee pension plan. (See Note 12 of Notes to Consolidated Financial Statements in Item 8 of this Annual Report.)
64
We currently provide a non-qualified deferred compensation plan for officers who have achieved the designated level and completed one year of service. However, certain officers who have not reached the designated level but were already participants remain eligible to participate in the Plan. In addition to the amounts deferred by the officers, we match 50% of their contributions, generally up to a maximum of 5% of the officer’s salary. These plans generally require the deferred balance to be credited with earnings at a rate earned by certain mutual funds. Through December 31, 2011, employees could not receive a distribution from these plans until their employment was terminated. The amounts shown in the columns for less than five years represent the estimate of the amounts we will contribute to a rabbi trust with respect to matching contributions under these plans. The amount shown in the “More Than 5 Years” column represents the current accrued liability for these plans, adjusted for the activity in the columns for less than five years. This expense is provided in the Consolidated Statements of Income, and the liability has been provided in the Consolidated Statements of Financial Condition.
Item 7A. Quantitative and Qualitative Disclosures About Market Risk.
| Item 7A. | Quantitative and Qualitative Disclosures About Market Risk. |
This information is contained in the section captioned “Interest Rate Risk” on page 6456 and in Notes 15 and 16 of the Notes to Consolidated Financial Statements in Item 8 of this Annual Report.
| Item 8. | Financial Statements and Supplementary Data. |
Item 8. Financial Statements and Supplementary Data.
FLUSHING FINANCIAL CORPORATION AND SUBSIDIARIES
Consolidated Statements of Financial Condition
| December 31, | December 31, | |||||||
| 2018 | 2017 | |||||||
| (Dollars in thousands, except per share data) | ||||||||
| Assets | ||||||||
| Cash and due from banks | $ | 118,561 | $ | 51,546 | ||||
| Securities held-to-maturity: | ||||||||
| Mortgage-backed securities (include assets pledged of $4,796 and none at December 31, 2018 and 2017, respectively; fair value of $7,366 and $7,810 at December 31, 2018 and 2017, respectively) | 7,953 | 7,973 | ||||||
| Other securities (none pledged; fair value of $22,508 and $21,889 at December 31, 2018 and 2017, respectively) | 24,065 | 22,913 | ||||||
| Securities available for sale, at fair value: | ||||||||
| Mortgage-backed securities (including assets pledged of $152,670 and $148,505 at December 31, 2018 and 2017, respectively; $967 and $1,590 at fair value pursuant to the fair value option at December 31, 2018 and 2017, respectively) | 557,953 | 509,650 | ||||||
| Other securities (including assets pledged of $28,871 and $44,052 at December 31, 2018 and 2017, respectively; $12,843 and $12,685 at fair value pursuant to the fair value option at December 31, 2018 and 2017, respectively) | 264,702 | 228,704 | ||||||
| Loans, net of fees and costs | 5,551,484 | 5,176,999 | ||||||
| Less: Allowance for loan losses | (20,945 | ) | (20,351 | ) | ||||
| Net loans | 5,530,539 | 5,156,648 | ||||||
| Interest and dividends receivable | 25,485 | 21,405 | ||||||
| Bank premises and equipment, net | 30,418 | 30,836 | ||||||
| Federal Home Loan Bank of New York stock, at cost | 57,282 | 60,089 | ||||||
| Bank owned life insurance | 131,788 | 131,856 | ||||||
| Goodwill | 16,127 | 16,127 | ||||||
| Other assets | 69,303 | 61,527 | ||||||
| Total assets | $ | 6,834,176 | $ | 6,299,274 | ||||
| Liabilities | ||||||||
| Due to depositors: | ||||||||
| Non-interest bearing | $ | 413,747 | $ | 385,269 | ||||
| Interest-bearing | 4,502,176 | 3,955,403 | ||||||
| Mortgagors' escrow deposits | 44,861 | 42,606 | ||||||
| Borrowed funds: | ||||||||
| Federal Home Loan Bank advances | 1,134,993 | 1,198,968 | ||||||
| Subordinated debentures | 74,001 | 73,699 | ||||||
| Junior subordinated debentures, at fair value | 41,849 | 36,986 | ||||||
| Total borrowed funds | 1,250,843 | 1,309,653 | ||||||
| Other liabilities | 73,085 | 73,735 | ||||||
| Total liabilities | 6,284,712 | 5,766,666 | ||||||
| Commitments and contingencies (Note 15) | ||||||||
| Stockholders' Equity | ||||||||
| Preferred stock ($0.01 par value; 5,000,000 shares authorized; none issued) | - | - | ||||||
| Common stock ($0.01 par value; 100,000,000 shares authorized; 31,530,595 shares issued at December 31, 2018 and 2017; 27,983,637 shares and 28,588,266 shares outstanding at December 31, 2018 and 2017, respectively) | 315 | 315 | ||||||
| Additional paid-in capital | 222,720 | 217,906 | ||||||
| Treasury stock, at average cost (3,546,958 shares and 2,942,329 at December 31, 2018 and 2017, respectively) | (75,146 | ) | (57,675 | ) | ||||
| Retained earnings | 414,327 | 381,048 | ||||||
| Accumulated other comprehensive loss, net of taxes | (12,752 | ) | (8,986 | ) | ||||
| Total stockholders' equity | 549,464 | 532,608 | ||||||
| Total liabilities and stockholders' equity | $ | 6,834,176 | $ | 6,299,274 | ||||
The accompanying notes are an integral part of these consolidated financial statements.
66
FLUSHING FINANCIAL CORPORATION AND SUBSIDIARIES
Consolidated Statements of Income
| For the years ended December 31, | ||||||||||||
| 2018 | 2017 | 2016 | ||||||||||
| (In thousands, except per share data) | ||||||||||||
| Interest and dividend income | ||||||||||||
| Interest and fees on loans | $ | 232,719 | $ | 209,283 | $ | 195,125 | ||||||
| Interest and dividends on securities: | ||||||||||||
| Interest | 23,022 | 24,489 | 25,141 | |||||||||
| Dividends | 67 | 287 | 481 | |||||||||
| Other interest income | 1,190 | 526 | 250 | |||||||||
| Total interest and dividend income | 256,998 | 234,585 | 220,997 | |||||||||
| Interest expense | ||||||||||||
| Deposits | 64,497 | 40,319 | 33,350 | |||||||||
| Other interest expense | 25,095 | 21,159 | 20,561 | |||||||||
| Total interest expense | 89,592 | 61,478 | 53,911 | |||||||||
| Net interest income | 167,406 | 173,107 | 167,086 | |||||||||
| Provision for loan losses | 575 | 9,861 | - | |||||||||
| Net interest income after benefit for loan losses | 166,831 | 163,246 | 167,086 | |||||||||
| Non-interest income | ||||||||||||
| Banking services fee income | 4,030 | 4,156 | 3,758 | |||||||||
| Net gain on sale of loans | 168 | 603 | 584 | |||||||||
| Net (loss) gain on sale of securities | (1,920 | ) | (186 | ) | 1,524 | |||||||
| Net gain on sale of assets | 1,141 | - | - | |||||||||
| Net gain on sale of buildings | - | - | 48,018 | |||||||||
| Net loss from fair value adjustments | (4,122 | ) | (3,465 | ) | (3,434 | ) | ||||||
| Federal Home Loan Bank of New York stock dividends | 3,576 | 3,081 | 2,664 | |||||||||
| Life insurance proceeds | 2,998 | 1,405 | 460 | |||||||||
| Bank owned life insurance | 3,099 | 3,227 | 2,797 | |||||||||
| Other income | 1,367 | 1,541 | 1,165 | |||||||||
| Total non-interest income | 10,337 | 10,362 | 57,536 | |||||||||
| Non-interest expense | ||||||||||||
| Salaries and employee benefits | 64,560 | 62,087 | 60,825 | |||||||||
| Occupancy and equipment | 10,079 | 10,409 | 9,848 | |||||||||
| Professional services | 8,360 | 7,500 | 7,720 | |||||||||
| FDIC deposit insurance | 2,115 | 1,815 | 2,993 | |||||||||
| Data processing | 5,663 | 5,238 | 4,364 | |||||||||
| Depreciation and amortization of bank premises and equipment | 5,792 | 4,832 | 4,450 | |||||||||
| Other real estate owned / foreclosure (benefit) expense | (94 | ) | 404 | 1,307 | ||||||||
| Prepayment penalty on borrowings | - | - | 10,356 | |||||||||
| Net (gain) loss from sales of real estate owned | (27 | ) | (50 | ) | 2,001 | |||||||
| Other operating expenses | 15,235 | 15,239 | 14,739 | |||||||||
| Total non-interest expense | 111,683 | 107,474 | 118,603 | |||||||||
| Income before income taxes | 65,485 | 66,134 | 106,019 | |||||||||
| Provision for income taxes | ||||||||||||
| Federal | 8,574 | 22,844 | 33,580 | |||||||||
| State and local | 1,821 | 2,169 | 7,523 | |||||||||
| Total provision for income taxes | 10,395 | 25,013 | 41,103 | |||||||||
| Net income | $ | 55,090 | $ | 41,121 | $ | 64,916 | ||||||
| Basic earnings per common share | $ | 1.92 | $ | 1.41 | $ | 2.24 | ||||||
| Diluted earnings per common share | $ | 1.92 | $ | 1.41 | $ | 2.24 | ||||||
The accompanying notes are an integral part of these consolidated financial statements.
| December 31, 2016 | December 31, 2015 | |||||||
| (Dollars in thousands, except per share data) | ||||||||
| Assets | ||||||||
| Cash and due from banks | $ | 35,857 | $ | 42,363 | ||||
| Securities held-to-maturity: | ||||||||
| Other securities (none pledged; fair value of $35,408 and $6,180 at December 31, 2016 and 2015, respectively) | 37,735 | 6,180 | ||||||
| Securities available for sale, at fair value: | ||||||||
| Mortgage-backed securities (including assets pledged of $145,860 and $496,121 at December 31, 2016 and 2015, respectively; $2,016 and $2,527 at fair value pursuant to the fair value option at December 31, 2016 and 2015, respectively) | 516,476 | 668,740 | ||||||
| Other securities (including assets pledged of $82,064 and none at December 31, 2016 and 2015, respectively ; $28,429 and $28,205 at fair value pursuant to the fair value option at December 31, 2016 and 2015, respectively) | 344,905 | 324,657 | ||||||
| Loans, net of fees and costs | 4,835,693 | 4,387,979 | ||||||
| Less: Allowance for loan losses | (22,229 | ) | (21,535 | ) | ||||
| Net loans | 4,813,464 | 4,366,444 | ||||||
| Interest and dividends receivable | 20,228 | 18,937 | ||||||
| Bank premises and equipment, net | 26,561 | 25,622 | ||||||
| Federal Home Loan Bank of New York stock, at cost | 59,173 | 56,066 | ||||||
| Bank owned life insurance | 132,508 | 115,536 | ||||||
| Goodwill | 16,127 | 16,127 | ||||||
| Other assets | 55,453 | 63,962 | ||||||
| Total assets | $ | 6,058,487 | $ | 5,704,634 | ||||
| Liabilities | ||||||||
| Due to depositors: | ||||||||
| Non-interest bearing | $ | 333,163 | $ | 269,469 | ||||
| Interest-bearing | 3,832,252 | 3,586,234 | ||||||
| Mortgagors' escrow deposits | 40,216 | 36,844 | ||||||
| Borrowed funds: | ||||||||
| Federal Home Loan Bank advances | 1,159,190 | 1,106,658 | ||||||
| Securities sold under agreements to repurchase | - | 116,000 | ||||||
| Federal funds purchased | - | 20,000 | ||||||
| Subordinated debentures | 73,414 | - | ||||||
| Junior subordinated debentures, at fair value | 33,959 | 29,018 | ||||||
| Total borrowed funds | 1,266,563 | 1,271,676 | ||||||
| Other liabilities | 72,440 | 67,344 | ||||||
| Total liabilities | 5,544,634 | 5,231,567 | ||||||
| Commitments and contingencies (Note 15) | ||||||||
| Stockholders' Equity | ||||||||
| Preferred stock ($0.01 par value; 5,000,000 shares authorized; none issued) | - | - | ||||||
| Common stock ($0.01 par value; 100,000,000 shares authorized; 31,530,595 shares issued at December 31, 2016 and 2015; 28,632,904 shares and 28,830,558 shares outstanding at December 31, 2016 and 2015, respectively) | 315 | 315 | ||||||
| Additional paid-in capital | 214,462 | 210,652 | ||||||
| Treasury stock, at average cost (2,897,691 shares and 2,700,037 at December 31, 2016 and 2015, respectively) | (53,754 | ) | (48,868 | ) | ||||
| Retained earnings | 361,192 | 316,530 | ||||||
| Accumulated other comprehensive loss, net of taxes | (8,362 | ) | (5,562 | ) | ||||
| Total stockholders' equity | 513,853 | 473,067 | ||||||
| Total liabilities and stockholders' equity | $ | 6,058,487 | $ | 5,704,634 | ||||
67
FLUSHING FINANCIAL CORPORATION AND SUBSIDIARIES
Consolidated Statements of Comprehensive Income
| For the years ended December 31, | ||||||||||||
| 2018 | 2017 | 2016 | ||||||||||
| (in thousands) | ||||||||||||
| Net income | $ | 55,090 | $ | 41,121 | $ | 64,916 | ||||||
| Other comprehensive income (loss), net of tax: | ||||||||||||
| Amortization of prior service credits, net of taxes of $12, $12 and $18 for the years ended December 31, 2018, 2017 and 2016, respectively | (27 | ) | (33 | ) | (27 | ) | ||||||
| Amortization of net actuarial losses, net of taxes of ($167), ($249) and ($238) for the years ended December 31, 2018, 2017 and 2016, respectively | 363 | 356 | 330 | |||||||||
| Unrecognized actuarial gains (losses), net of taxes of ($1,162), ($146) and ($367) for the years ended December 31, 2018, 2017 and 2016, respectively | 2,484 | 485 | 235 | |||||||||
| Change in net unrealized losses on securities available for sale, net of taxes of $4,473, $1,783 and $,1737 for the years ended December 31, 2018, 2017 and 2016, respectively | (10,127 | ) | (1,771 | ) | (2,452 | ) | ||||||
| Reclassification adjustment for net losses (gains) included in net income, net of taxes of ($595), ($78) and $638 for the years ended December 31, 2018, 2017 and 2016, respectively | 1,325 | 108 | (886 | ) | ||||||||
| Net unrealized gain on cashflow hedges, net of taxes of ($1,538) and ($179) for the year ended December 31, 2018 and 2017, respectively | 3,423 | 231 | - | |||||||||
| Change in fair value of liabilities related to instrument-specific credit risk, net of taxes of ($35) the year ended December 31, 2018 | 87 | - | - | |||||||||
| Total other comprehensive loss, net of tax | (2,472 | ) | (624 | ) | (2,800 | ) | ||||||
| Comprehensive net income | $ | 52,618 | $ | 40,497 | $ | 62,116 | ||||||
The accompanying notes are an integral part of these consolidated financial statements.
68
FLUSHING FINANCIAL CORPORATION AND SUBSIDIARIES
Consolidated Statements of IncomeChanges in Stockholders’ Equity
| For the years ended December 31, | ||||||||||||
| 2016 | 2015 | 2014 | ||||||||||
| (In thousands, except per share data) | ||||||||||||
| Interest and dividend income | ||||||||||||
| Interest and fees on loans | $ | 195,125 | $ | 178,720 | $ | 170,327 | ||||||
| Interest and dividends on securities: | ||||||||||||
| Interest | 25,141 | 24,827 | 25,969 | |||||||||
| Dividends | 481 | 473 | 753 | |||||||||
| Other interest income | 250 | 126 | 79 | |||||||||
| Total interest and dividend income | 220,997 | 204,146 | 197,128 | |||||||||
| Interest expense | ||||||||||||
| Deposits | 33,350 | 30,336 | 30,044 | |||||||||
| Other interest expense | 20,561 | 19,390 | 19,510 | |||||||||
| Total interest expense | 53,911 | 49,726 | 49,554 | |||||||||
| Net interest income | 167,086 | 154,420 | 147,574 | |||||||||
| Benefit for loan losses | - | (956 | ) | (6,021 | ) | |||||||
| Net interest income after benefit for loan losses | 167,086 | 155,376 | 153,595 | |||||||||
| Non-interest income | ||||||||||||
| Banking services fee income | 3,758 | 3,805 | 3,394 | |||||||||
| Net gain on sale of loans | 584 | 422 | 67 | |||||||||
| Net gain on sale of securities | 1,524 | 167 | 2,875 | |||||||||
| Net gain on sale of buildings | 48,018 | 6,537 | - | |||||||||
| Net loss from fair value adjustments | (3,434 | ) | (1,841 | ) | (2,568 | ) | ||||||
| Federal Home Loan Bank of New York stock dividends | 2,664 | 1,969 | 1,898 | |||||||||
| Gains from life insurance proceeds | 460 | - | - | |||||||||
| Bank owned life insurance | 2,797 | 2,880 | 3,050 | |||||||||
| Other income | 1,165 | 1,780 | 1,527 | |||||||||
| Total non-interest income | 57,536 | 15,719 | 10,243 | |||||||||
| Non-interest expense | ||||||||||||
| Salaries and employee benefits | 60,825 | 53,093 | 48,998 | |||||||||
| Occupancy and equipment | 9,848 | 10,206 | 7,998 | |||||||||
| Professional services | 7,720 | 7,074 | 5,982 | |||||||||
| FDIC deposit insurance | 2,993 | 3,236 | 2,707 | |||||||||
| Data processing | 4,364 | 4,471 | 4,194 | |||||||||
| Depreciation and amortization of bank premises and equipment | 4,450 | 3,579 | 2,813 | |||||||||
| Other real estate owned / foreclosure expense | 1,307 | 942 | 1,338 | |||||||||
| Prepayment penalty on borrowings | 10,356 | - | 5,187 | |||||||||
| Other operating expenses | 16,740 | 15,118 | 11,809 | |||||||||
| Total non-interest expense | 118,603 | 97,719 | 91,026 | |||||||||
| Income before income taxes | 106,019 | 73,376 | 72,812 | |||||||||
| Provision for income taxes | ||||||||||||
| Federal | 33,580 | 21,843 | 20,912 | |||||||||
| State and local | 7,523 | 5,324 | 7,661 | |||||||||
| Total provision for income taxes | 41,103 | 27,167 | 28,573 | |||||||||
| Net income | $ | 64,916 | $ | 46,209 | $ | 44,239 | ||||||
| Basic earnings per common share | $ | 2.24 | $ | 1.59 | $ | 1.49 | ||||||
| Diluted earnings per common share | $ | 2.24 | $ | 1.59 | $ | 1.48 | ||||||
| Total | Common Stock | Additional Paid-in Capital | Treasury Stock | Retained Earnings | Accumulated Other Comprehensive Loss | |||||||||||||||||||
| (Dollars in thousands, except per share data) | ||||||||||||||||||||||||
| Balance at December 31, 2015 | $ | 473,067 | $ | 315 | $ | 210,652 | $ | (48,868 | ) | $ | 316,530 | $ | (5,562 | ) | ||||||||||
| Net Income | 64,916 | - | - | - | 64,916 | - | ||||||||||||||||||
| Award of common shares released from Employee Benefit Trust (142,065 shares) | 2,057 | - | 2,057 | - | - | - | ||||||||||||||||||
| Vesting of restricted stock unit awards (245,311 shares) | - | - | (4,049 | ) | 4,446 | (397 | ) | - | ||||||||||||||||
| Exercise of stock options (103,530 shares) | 328 | - | (30 | ) | 526 | (168 | ) | - | ||||||||||||||||
| Stock-based compensation expense | 5,120 | - | 5,120 | - | - | - | ||||||||||||||||||
| Stock-based income tax benefit | 712 | - | 712 | - | - | - | ||||||||||||||||||
| Purchase of treasury shares (403,695 shares) | (8,031 | ) | - | - | (8,031 | ) | - | - | ||||||||||||||||
| Repurchase of shares to satisfy tax obligation (85,982 shares) | (1,827 | ) | - | - | (1,827 | ) | - | - | ||||||||||||||||
| Dividends on common stock ($0.68 per share) | (19,689 | ) | - | - | - | (19,689 | ) | - | ||||||||||||||||
| Other comprehensive loss, net of tax | (2,800 | ) | - | - | - | - | (2,800 | ) | ||||||||||||||||
| Balance at December 31, 2016 | 513,853 | 315 | 214,462 | (53,754 | ) | 361,192 | (8,362 | ) | ||||||||||||||||
| Net Income | 41,121 | - | - | - | 41,121 | - | ||||||||||||||||||
| Award of common shares released from Employee Benefit Trust (118,371 shares) | 2,512 | - | 2,512 | - | - | - | ||||||||||||||||||
| Vesting of restricted stock unit awards (284,595 shares) | - | - | (5,052 | ) | 5,323 | (271 | ) | - | ||||||||||||||||
| Exercise of stock options (4,400 shares) | - | - | (6 | ) | 46 | (40 | ) | - | ||||||||||||||||
| Stock-based compensation expense | 5,990 | - | 5,990 | - | - | - | ||||||||||||||||||
| Purchase of treasury shares (241,625 shares) | (6,666 | ) | - | - | (6,666 | ) | - | - | ||||||||||||||||
| Repurchase of shares to satisfy tax obligation (90,779 shares) | (2,624 | ) | - | - | (2,624 | ) | - | - | ||||||||||||||||
| Dividends on common stock ($0.72 per share) | (20,954 | ) | - | - | - | (20,954 | ) | - | ||||||||||||||||
| Other comprehensive loss, net of tax | (624 | ) | - | - | - | - | (624 | ) | ||||||||||||||||
| Balance at December 31, 2017 | 532,608 | 315 | 217,906 | (57,675 | ) | 381,048 | (8,986 | ) | ||||||||||||||||
| Reclassification of the Income Tax Effects of the Tax Cuts and Jobs Act from Accumulated Other Comprehensive Income (Loss) to Retained Earnings | - | - | - | - | 2,073 | (2,073 | ) | |||||||||||||||||
| Impact of adoption of Accounting Standard Update 2016-01 | - | - | - | - | (779 | ) | 779 | |||||||||||||||||
| Net income | 55,090 | - | - | - | 55,090 | - | ||||||||||||||||||
| Award of common shares released from Employee Benefit Trust (129,601 shares) | 2,728 | - | 2,728 | - | - | - | ||||||||||||||||||
| Vesting of restricted stock unit awards (258,567 shares) | - | - | (4,929 | ) | 5,104 | (175 | ) | - | ||||||||||||||||
| Exercise of stock options (900 shares) | 6 | - | (1 | ) | 10 | (3 | ) | - | ||||||||||||||||
| Stock-based compensation expense | 7,016 | - | 7,016 | - | - | - | ||||||||||||||||||
| Purchase of treasury shares (787,069 shares) | (20,438 | ) | - | - | (20,438 | ) | - | - | ||||||||||||||||
| Repurchase of shares to satisfy tax obligation (76,698 shares) | (2,147 | ) | - | - | (2,147 | ) | - | - | ||||||||||||||||
| Dividends on common stock ($0.80 per share) | (22,927 | ) | - | - | - | (22,927 | ) | - | ||||||||||||||||
| Other comprehensive loss, net of tax | (2,472 | ) | - | - | - | - | (2,472 | ) | ||||||||||||||||
| Balance at December 31, 2018 | $ | 549,464 | $ | 315 | $ | 222,720 | $ | (75,146 | ) | $ | 414,327 | $ | (12,752 | ) | ||||||||||
The accompanying notes are an integral part of these consolidated financial statements.
| 69 |
FLUSHING FINANCIAL CORPORATION AND SUBSIDIARIES
Consolidated Statements of Cash Flows
| For the years ended December 31, | ||||||||||||
| 2018 | 2017 | 2016 | ||||||||||
| (In thousands) | ||||||||||||
| Operating Activities | ||||||||||||
| Net income | $ | 55,090 | $ | 41,121 | $ | 64,916 | ||||||
| Adjustments to reconcile net income to net cash provided by operating activities: | ||||||||||||
| Provision for loan losses | 575 | 9,861 | - | |||||||||
| Depreciation and amortization of premises and equipment | 5,792 | 4,832 | 4,450 | |||||||||
| Net gain on sales of loans | (168 | ) | (603 | ) | (584 | ) | ||||||
| Net loss (gain) on sales of securities | 1,920 | 186 | (1,524 | ) | ||||||||
| Net (gain) loss on sales of OREO | (27 | ) | (50 | ) | 238 | |||||||
| Net gain on sales of assets | (1,141 | ) | - | - | ||||||||
| Net gain on sales of buildings | - | - | (48,018 | ) | ||||||||
| Amortization of premium, net of accretion of discount | 8,146 | 7,509 | 8,453 | |||||||||
| Fair value adjustment for financial assets and financial liabilities | 4,122 | 3,465 | 3,434 | |||||||||
| Income from bank owned life insurance | (3,099 | ) | (3,227 | ) | (2,797 | ) | ||||||
| Life insurance proceeds | (2,998 | ) | (1,405 | ) | (460 | ) | ||||||
| Stock-based compensation expense | 7,016 | 5,990 | 5,884 | |||||||||
| Deferred compensation | (3,061 | ) | (4,154 | ) | (4,033 | ) | ||||||
| Excess tax benefits from stock-based payment arrangements | - | - | (712 | ) | ||||||||
| Deferred income tax provision (benefit) | (2,664 | ) | 8,735 | (1,540 | ) | |||||||
| Decrease in other assets | 824 | 5,205 | 4,932 | |||||||||
| Increase in other liabilities | 6,976 | 6,061 | 9,756 | |||||||||
| Net cash provided by operating activities | 77,303 | 83,526 | 42,395 | |||||||||
| Investing Activities | ||||||||||||
| Purchases of premises and equipment | (5,409 | ) | (9,434 | ) | (6,655 | ) | ||||||
| Net purchases (redemptions) of Federal Home Loan Bank-NY shares | 2,807 | (916 | ) | (3,107 | ) | |||||||
| Purchases of securities held-to-maturity | (2,653 | ) | (9,030 | ) | (40,205 | ) | ||||||
| Proceeds from calls of securities held-to-maturity | 1,130 | 15,870 | 8,515 | |||||||||
| Proceeds from prepayments of securities held-to-maturity | 377 | - | - | |||||||||
| Purchases of securities available for sale | (305,059 | ) | (161,939 | ) | (139,186 | ) | ||||||
| Proceeds from sales and calls of securities available for sale | 128,474 | 194,799 | 143,819 | |||||||||
| Proceeds from maturities and prepayments of securities available for sale | 73,968 | 76,230 | 118,498 | |||||||||
| Proceeds from sale of assets | 1,184 | - | - | |||||||||
| Proceeds from sale of buildings | - | - | 49,284 | |||||||||
| Purchase of bank owned life insurance | - | - | (16,000 | ) | ||||||||
| Proceeds from life insurance | 6,165 | 5,284 | 2,432 | |||||||||
| Net originations of loans | (111,351 | ) | (225,449 | ) | (267,446 | ) | ||||||
| Purchases of loans | (282,703 | ) | (196,456 | ) | (186,717 | ) | ||||||
| Proceeds from sale of loans | 14,410 | 56,344 | 11,499 | |||||||||
| Proceeds from sale of OREO, net | 665 | 583 | 3,037 | |||||||||
| Net cash used in investing activities | (477,995 | ) | (254,114 | ) | (322,232 | ) | ||||||
Continued
The accompanying notes are an integral part of these consolidated financial statements.
FLUSHING FINANCIAL CORPORATION AND SUBSIDIARIES
Consolidated Statements of Comprehensive Income
| For the years ended December 31, | ||||||||||||
| 2016 | 2015 | 2014 | ||||||||||
| (in thousands) | ||||||||||||
| Net income | $ | 64,916 | $ | 46,209 | $ | 44,239 | ||||||
| Other comprehensive income (loss), net of tax: | ||||||||||||
| Amortization of prior service credits, net of taxes of $18, $20 and $20 for the years ended December 31, 2016, 2015 and 2014, respectively | (27 | ) | (26 | ) | (26 | ) | ||||||
| Amortization of net actuarial losses, net of taxes of ($238), ($509) and ($330) for the years ended December 31, 2016, 2015 and 2014, respectively | 330 | 669 | 370 | |||||||||
| Unrecognized actuarial gains (losses), net of taxes of ($367), ($465) and $2,880 for the years ended December 31, 2016, 2015 and 2014, respectively | 235 | 615 | (3,790 | ) | ||||||||
| Change in net unrealized (losses) gains on securities available for sale, net of taxes of $1,737, $2,911 and ($10,441) for the years ended December 31, 2016, 2015 and 2014, respectively | (2,452 | ) | (3,818 | ) | 13,548 | |||||||
| Reclassification adjustment for net gains included in net income, net of taxes of $638, $72 and $1,241 for the years ended December 31, 2016, 2015 and 2014, respectively | (886 | ) | (95 | ) | (1,634 | ) | ||||||
| Total other comprehensive income (loss), net of tax | (2,800 | ) | (2,655 | ) | 8,468 | |||||||
| Comprehensive income | $ | 62,116 | $ | 43,554 | $ | 52,707 | ||||||
The accompanying notes are an integral part of these consolidated financial statements.
70
FLUSHING FINANCIAL CORPORATION AND SUBSIDIARIES
Consolidated Statements of Changes in Stockholders’ Equity
| Total | Common Stock | Additional Paid-in Capital | Treasury Stock | Retained Earnings | Accumulated Other Comprehensive Loss | |||||||||||||||||||
| (Dollars in thousands, except per share data) | ||||||||||||||||||||||||
| Balance at December 31, 2013 | $ | 432,532 | $ | 315 | $ | 201,902 | $ | (22,053 | ) | $ | 263,743 | $ | (11,375 | ) | ||||||||||
| Net Income | 44,239 | - | - | - | 44,239 | - | ||||||||||||||||||
| Award of common shares released from Employee Benefit Trust (136,559 shares) | 2,075 | - | 2,075 | - | - | - | ||||||||||||||||||
| Vesting of restricted stock unit awards (202,466 shares) | - | - | (2,775 | ) | 3,205 | (430 | ) | - | ||||||||||||||||
| Exercise of stock options (150,115 shares) | 565 | - | 143 | 499 | (77 | ) | - | |||||||||||||||||
| Stock-based compensation expense | 4,246 | - | 4,246 | - | - | - | ||||||||||||||||||
| Stock-based income tax benefit | 846 | - | 846 | - | - | - | ||||||||||||||||||
| Purchase of treasury shares (914,671 shares) | (17,644 | ) | - | - | (17,644 | ) | - | - | ||||||||||||||||
| Repurchase of shares to satisfy tax obligation (59,821 shares) | (1,228 | ) | - | - | (1,228 | ) | - | - | ||||||||||||||||
| Dividends on common stock ($0.60 per share) | (17,852 | ) | - | - | - | (17,852 | ) | - | ||||||||||||||||
| Other comprehensive income | 8,468 | - | - | - | - | 8,468 | ||||||||||||||||||
| Balance at December 31, 2014 | 456,247 | 315 | 206,437 | (37,221 | ) | 289,623 | (2,907 | ) | ||||||||||||||||
| Net Income | 46,209 | - | - | - | 46,209 | - | ||||||||||||||||||
| Award of common shares released from Employee Benefit Trust (147,616 shares) | 2,092 | - | 2,092 | - | - | - | ||||||||||||||||||
| Vesting of restricted stock unit awards (204,310 shares) | - | - | (3,076 | ) | 3,580 | (504 | ) | - | ||||||||||||||||
| Exercise of stock options (45,785 shares) | 145 | - | (51 | ) | 378 | (182 | ) | - | ||||||||||||||||
| Stock-based compensation expense | 4,676 | - | 4,676 | - | - | - | ||||||||||||||||||
| Stock-based income tax benefit | 574 | - | 574 | - | - | - | ||||||||||||||||||
| Purchase of treasury shares (735,599 shares) | (14,351 | ) | - | - | (14,351 | ) | - | - | ||||||||||||||||
| Repurchase of shares to satisfy tax obligation (65,666 shares) | (1,254 | ) | - | - | (1,254 | ) | - | - | ||||||||||||||||
| Dividends on common stock ($0.64 per share) | (18,616 | ) | - | - | - | (18,616 | ) | - | ||||||||||||||||
| Other comprehensive loss | (2,655 | ) | - | - | - | - | (2,655 | ) | ||||||||||||||||
| Balance at December 31, 2015 | 473,067 | 315 | 210,652 | (48,868 | ) | 316,530 | (5,562 | ) | ||||||||||||||||
| Net Income | 64,916 | - | - | - | 64,916 | - | ||||||||||||||||||
| Award of common shares released from Employee Benefit Trust (142,065 shares) | 2,057 | - | 2,057 | - | - | - | ||||||||||||||||||
| Vesting of restricted stock unit awards (245,311 shares) | - | - | (4,049 | ) | 4,446 | (397 | ) | - | ||||||||||||||||
| Exercise of stock options (103,530 shares) | 328 | - | (30 | ) | 526 | (168 | ) | - | ||||||||||||||||
| Stock-based compensation expense | 5,120 | - | 5,120 | - | - | - | ||||||||||||||||||
| Stock-based income tax benefit | 712 | - | 712 | - | - | - | ||||||||||||||||||
| Purchase of treasury shares (403,695 shares) | (8,031 | ) | - | - | (8,031 | ) | - | - | ||||||||||||||||
| Repurchase of shares to satisfy tax obligation (85,982 shares) | (1,827 | ) | - | - | (1,827 | ) | - | - | ||||||||||||||||
| Dividends on common stock ($0.68 per share) | (19,689 | ) | - | - | - | (19,689 | ) | - | ||||||||||||||||
| Other comprehensive loss | (2,800 | ) | - | - | - | - | (2,800 | ) | ||||||||||||||||
| Balance at December 31, 2016 | $ | 513,853 | $ | 315 | $ | 214,462 | $ | (53,754 | ) | $ | 361,192 | $ | (8,362 | ) | ||||||||||
The accompanying notes are an integral part of these consolidated financial statements.
FLUSHING FINANCIAL CORPORATION AND SUBSIDIARIES
Consolidated Statements of Cash Flows
| For the years ended December 31, | ||||||||||||
| 2016 | 2015 | 2014 | ||||||||||
| (In thousands) | ||||||||||||
| Operating Activities | ||||||||||||
| Net income | $ | 64,916 | $ | 46,209 | $ | 44,239 | ||||||
| Adjustments to reconcile net income to net cash provided by operating activities: | ||||||||||||
| Benefit for loan losses | - | (956 | ) | (6,021 | ) | |||||||
| Depreciation and amortization of premises and equipment | 4,450 | 3,579 | 2,813 | |||||||||
| Net gain on sales of loans (including delinquent loans) | (584 | ) | (422 | ) | (67 | ) | ||||||
| Net gain on sales of securities | (1,524 | ) | (167 | ) | (2,875 | ) | ||||||
| Net gain on sales of buildings | (48,018 | ) | (6,537 | ) | - | |||||||
| Amortization of premium, net of accretion of discount | 8,453 | 8,986 | 7,292 | |||||||||
| Fair value adjustment for financial assets and financial liabilities | 3,434 | 1,841 | 2,568 | |||||||||
| Income from bank owned life insurance | (2,797 | ) | (2,880 | ) | (3,050 | ) | ||||||
| Gain from life insurance proceeds | (460 | ) | - | - | ||||||||
| Stock-based compensation expense | 5,884 | 4,845 | 4,263 | |||||||||
| Deferred compensation | (4,033 | ) | (3,561 | ) | (2,514 | ) | ||||||
| Excess tax benefits from stock-based payment arrangements | (712 | ) | (574 | ) | (846 | ) | ||||||
| Deferred income tax provision (benefit) | (1,540 | ) | (5,210 | ) | 4,154 | |||||||
| (Increase) decrease in other assets | 5,170 | (5,284 | ) | 8,110 | ||||||||
| Increase (decrease) in other liabilities | 9,756 | 4,861 | (690 | ) | ||||||||
| Net cash provided by operating activities | 42,395 | 44,730 | 57,376 | |||||||||
| Investing Activities | ||||||||||||
| Purchases of premises and equipment | (6,655 | ) | (11,089 | ) | (4,325 | ) | ||||||
| Net purchases of Federal Home Loan Bank-NY shares | (3,107 | ) | (9,142 | ) | (899 | ) | ||||||
| Purchases of securities held-to-maturity | (40,205 | ) | (5,100 | ) | - | |||||||
| Proceeds from maturities of securities held-to-maturity | 8,515 | 3,430 | - | |||||||||
| Purchases of securities available for sale | (139,186 | ) | (313,822 | ) | (162,830 | ) | ||||||
| Proceeds from sales and calls of securities available for sale | 143,819 | 163,158 | 115,294 | |||||||||
| Proceeds from maturities and prepayments of securities available for sale | 118,498 | 114,097 | 112,137 | |||||||||
| Proceeds from sale of buildings | 49,284 | 20,209 | - | |||||||||
| Purchase of Bank Owned Life Insurance | (16,000 | ) | - | - | ||||||||
| Proceeds from Life Insurance | 2,432 | - | - | |||||||||
| Net originations of loans | (267,446 | ) | (301,766 | ) | (248,073 | ) | ||||||
| Purchases of loans | (186,717 | ) | (278,928 | ) | (169,860 | ) | ||||||
| Proceeds from sale of loans | 11,499 | 16,252 | 15,857 | |||||||||
| Proceeds from sale of Other Real Estate Owned, net | 3,037 | 2,185 | 3,123 | |||||||||
| Net cash used in investing activities | (322,232 | ) | (600,516 | ) | (339,576 | ) | ||||||
Continued
The accompanying notes are an integral part of these consolidated financial statements.
FLUSHING FINANCIAL CORPORATION AND SUBSIDIARIES
Consolidated Statements of Cash Flows (continued)
| For the years ended December 31, | For the years ended December 31, | |||||||||||||||||||||||
| 2016 | 2015 | 2014 | 2018 | 2017 | 2016 | |||||||||||||||||||
| (In thousands) | (In thousands) | |||||||||||||||||||||||
| Financing Activities | ||||||||||||||||||||||||
| Net increase in non interest-bearing deposits | 63,694 | 13,635 | 58,491 | $ | 28,478 | $ | 52,106 | $ | 63,694 | |||||||||||||||
| Net increase in interest-bearing deposits | 245,271 | 368,137 | 213,502 | 546,322 | 122,563 | 245,271 | ||||||||||||||||||
| Net increase in mortgagors' escrow deposits | 3,372 | 1,165 | 2,881 | 2,255 | 2,390 | 3,372 | ||||||||||||||||||
| Net proceeds from short-term borrowed funds | 178,500 | 30,000 | 30,500 | 165,250 | 92,000 | 178,500 | ||||||||||||||||||
| Proceeds from long-term borrowings | 300,000 | 310,000 | 180,000 | 40,996 | 230,000 | 300,000 | ||||||||||||||||||
| Repayment of long-term borrowings | (562,401 | ) | (125,551 | ) | (167,081 | ) | (270,088 | ) | (282,538 | ) | (562,401 | ) | ||||||||||||
| Issuance of subordinated debentures, net of issuance costs of $1,598 | 73,402 | - | - | - | - | 73,402 | ||||||||||||||||||
| Purchases of treasury stock | (9,858 | ) | (15,605 | ) | (18,872 | ) | (22,585 | ) | (9,290 | ) | (9,858 | ) | ||||||||||||
| Excess tax benefits from stock-based payment arrangements | 712 | 574 | 846 | - | - | 712 | ||||||||||||||||||
| Proceeds from issuance of common stock upon exercise of stock options | 328 | 145 | 565 | 6 | - | 328 | ||||||||||||||||||
| Cash dividends paid | (19,689 | ) | (18,616 | ) | (17,852 | ) | (22,927 | ) | (20,954 | ) | (19,689 | ) | ||||||||||||
| Net cash provided by financing activities | 273,331 | 563,884 | 282,980 | 467,707 | 186,277 | 273,331 | ||||||||||||||||||
| Net (decrease) increase in cash and cash equivalents | (6,506 | ) | 8,098 | 780 | ||||||||||||||||||||
| Net increase (decrease) in cash and cash equivalents | 67,015 | 15,689 | (6,506 | ) | ||||||||||||||||||||
| Cash and cash equivalents, beginning of year | 42,363 | 34,265 | 33,485 | 51,546 | 35,857 | 42,363 | ||||||||||||||||||
| Cash and cash equivalents, end of year | $ | 35,857 | $ | 42,363 | $ | 34,265 | $ | 118,561 | $ | 51,546 | $ | 35,857 | ||||||||||||
| Supplemental Cash Flow Disclosure | ||||||||||||||||||||||||
| Interest paid | $ | 53,755 | $ | 48,467 | $ | 53,965 | $ | 85,112 | $ | 59,868 | $ | 53,755 | ||||||||||||
| Income taxes paid | 36,813 | 32,574 | 24,943 | 6,616 | 23,899 | 36,813 | ||||||||||||||||||
| Taxes paid if excess tax benefits on stock-based compensation were not tax deductible | 37,525 | 33,148 | 25,789 | 7,245 | 25,450 | 37,525 | ||||||||||||||||||
| Non-cash activities: | ||||||||||||||||||||||||
| Securities transferred from available for sale to held-to-maturity | - | 4,510 | - | |||||||||||||||||||||
| Loans transferred to Other Real Estate Owned | 639 | 1,667 | 7,112 | |||||||||||||||||||||
| Loans provided for the sale of Other Real Estate Owned | - | 280 | 712 | |||||||||||||||||||||
| Loans transferred to other real estate owned | 673 | - | 639 | |||||||||||||||||||||
| Loans held for investment transferred to loans held for sale | - | 300 | 1,150 | - | 30,565 | - | ||||||||||||||||||
| Securities transferred to other assets | - | 7,000 | - | |||||||||||||||||||||
| Reclassification of the income tax effects of Tax Cuts and Jobs Act from accumulated other comprehensive income to retained earnings | 2,073 | - | - | |||||||||||||||||||||
The accompanying notes are an integral part of these consolidated financial statements.
71
FLUSHING FINANCIAL CORPORATION AND SUBSIDIARIES
Notes to Consolidated Financial Statements
For the years ended December 31, 2016, 20152018, 2017 and 20142016
1. Nature of Operations
Flushing Financial Corporation (the “Holding Company”), a Delaware business corporation, is the bank holding company of its wholly-owned subsidiary Flushing Bank (the “Bank”). The Holding Company and its direct and indirect wholly-owned subsidiaries, including the Bank, Flushing Preferred Funding Corporation (“FPFC”), Flushing Service Corporation (“FSC”), and FSB Properties Inc. (“Properties”), are collectively herein referred to as the “Company.”
The Company’s principal business is attracting retail deposits from the general public and investing those deposits together with funds generated from ongoing operations and borrowings, primarily in (1) originations and purchases of multi-family residential properties, commercial business loans, commercial real estate mortgage loans and, to a lesser extent, one-to-four family (focusing on mixed-use properties, which are properties that contain both residential dwelling units and commercial units); (2) construction loans, primarily for residential properties; (3) Small Business Administration (“SBA”) loans and other small business loans; (4) mortgage loan surrogates such as mortgage-backed securities; and (5) U.S. government securities, corporate fixed-income securities and other marketable securities. The Bank also originates certain other consumer loans including overdraft lines of credit. The Bank primarily conducts its business through nineteen full-service banking offices, nineeight of which are located in Queens County, three in Nassau County, five in Kings County (Brooklyn), and twothree in New York County (Manhattan), New York. The Bank also operates “iGObanking.com®”, an internet branch, which operates under the brands of iGObanking.com® and BankPurely® (the “Internet Branch”), offering checking, savings, money market and certificates of deposit accounts.
2. Summary of Significant Accounting Policies
The accounting and reporting policies of the Company follow accounting principles generally accepted in the United States of America (“GAAP”) and general practices within the banking industry. The policies which materially affect the determination of the Company’s financial position, results of operations and cash flows are summarized below.
Principles of Consolidation:
The accompanying consolidated financial statements include the accounts of the Holding Company and the following direct and indirect wholly-owned subsidiaries of the Holding Company: the Bank, FPFC, FSC, and Properties. FPFC is a real estate investment trust formed to hold a portion of the Bank’s mortgage loans to facilitate access to capital markets. FSC was formed to market insurance products and mutual funds. Properties is currently used to hold title to real estate owned acquired via foreclosure. Amounts held in a rabbi trust for certain non-qualified deferred compensation plans are included in the consolidated financial statements. All intercompany transactions and accounts are eliminated in consolidation. The Holding Company currently has three unconsolidated subsidiaries in the form of wholly-owned statutory business trusts, which were formed to issue guaranteed capital debentures (“capital securities”). See Note 9, “Borrowed Funds,” for additional information regarding these trusts.
When necessary, certain reclassifications were made to prior-year amounts to conform to the current-year presentation. The presentation of other interest expense in the Consolidated Statements of Income for the year ended December 31, 2014, excludes prepayment penalties on borrowings incurred from the extinguishment of debt to conform to the presentation for the year ended December 31, 2016. These penalties are reflected in non-interest expense.
Use of Estimates:
The preparation of financial statements in conformity with GAAP requires management to make estimates and assumptions that affect the reported amounts of assets and liabilities, and disclosure of contingent assets and liabilities at the date of the financial statements, and reported amounts of revenue and expenses during the reporting period. Estimates that are particularly susceptible to change in the near term are used in connection with the determination of the allowance for loan losses (“ALL”), the evaluation of goodwill for impairment, the review of the need for a valuation allowance of the Company’s deferred tax assets, the fair value of financial instruments including the evaluation of other-than-temporary impairment (“OTTI”) on securities. Actual results could differ from these estimates.
Cash and Cash Equivalents:
For the purpose of reporting cash flows, the Company defines cash and due from banks, overnight interest-earning deposits and federal funds sold with original maturities of 90 days or less as cash and cash equivalents. At December 31, 20162018 and 2015,2017, the Company’s cash and cash equivalents totaled $35.9$118.6 million and $42.4$51.5 million, respectively. Included in cash and cash equivalents at those dates were $27.2$105.8 million and $23.0$39.4 million in interest-earning deposits in other financial institutions, primarily due from the Federal Reserve Bank of New York and the Federal Home Loan Bank of New York (“FHLB-NY”). The Bank is required to maintain cash reserves equal to a percentage of certain deposits. The reserve requirement is included in cash and cash equivalents and totaled $10.1$4.4 million and $9.9$9.7 million at December 31, 20162018 and 2015,2017, respectively.
72
Debt and Equity Securities:
Securities are classified as held-to-maturity when management intends to hold the securities until maturity. Securities are classified as available for sale when management intends to hold the securities for an indefinite period of time or when the securities may be utilized for tactical asset/liability purposes and may be sold from time to time to effectively manage interest rate exposure and resultant prepayment risk and liquidity needs. Premiums and discounts are amortized or accreted, respectively, using the level-yield method. Realized gains and losses on the sales of securities are determined using the specific identification method. Unrealized gains and losses (other than unrealized losses considered other-than-temporaryOTTI which are recognized in the Consolidated Statements of Income) on securities available for sale are excluded from earnings and reported as part of accumulated other comprehensive loss, net of taxes. In estimating other-than-temporary impairment losses,OTTI management considers (1) the length of time and the extent to which the fair value has been less than amortized cost, (2) the current interest rate environment, (3) the financial condition and near-term prospects of the issuer, if applicable, and (4) the intent and ability of the Company to retain its investment in the issuer for a period of time sufficient to allow for any anticipated recovery in fair value. Other-than-temporary impairmentOTTI losses for debt securities are measured using a discounted cash flow model. Other-than-temporary impairment losses for equity securities are measured using quoted market prices, when available, or, when market quotes are not available due to an illiquid market, we use an impairment model from a third party or quotes from investment brokers. See Note 6, “Debt and Equity Securities,“Securities,” for additional information regarding other-than-temporary impairmentOTTI for debt securities. The Company recorded tax exempt interest income totaling $3.4 million, $3.7 million and equity securities.$3.1 million during the years ended December 31, 2018, 2017 and 2016, respectively.
Goodwill:
Goodwill is presumed to have an indefinite life and is tested annually, or more frequently when certain conditions are met, for impairment. If the fair value of the reporting unit is greater than the goodwill amount, no further evaluation is required. If the fair value of the reporting unit is less than the goodwill amount, further evaluation would be required to compare the fair value of the reporting unit to the goodwill amount and determine if impairment is required.
In performing the goodwill impairment testing, the Company has identified a single reporting unit. The Company performed the qualitative assessment in reviewing the carrying value of goodwill as of December 31, 2016, 20152018, 2017 and 2014,2016, concluding that there was no goodwill impairment. At December 31, 20162018 and 2015,2017, the carrying amount of goodwill totaled $16.1 million. The identification of additional reporting units, the use of other valuation techniques and/or changes to input assumptions used in the analysis could result in materially different evaluations of goodwill impairment.
Loans:
Loans are reported at their outstanding principal outstanding balance net of any unearned income, charge-offs, deferred loan fees and costs on originated loans and unamortized premiums or discounts on purchased loans. Loan fees and certain loan origination costs are deferred. Net loan origination costs and premiums or discounts on loans purchased are amortized into interest income over the contractual life of the loans using the level-yield method. Prepayment penalties received on loans which pay in full prior to their scheduled maturity are included in interest income in the period they are collected.
Interest on loans is recognized on the accrual basis. The accrual of income on loans is generally discontinued when certain factors, such as contractual delinquency of 90 days or more, indicate reasonable doubt as to the timely collectability of such income. Uncollected interest previously recognized on non-accrual loans is reversed from interest income at the time the loan is placed on non-accrual status. A non-accrual loan can be returned to accrual status when contractual delinquency returns to less than 90 days delinquent. Subsequent cash paymentsPayments received on non-accrual loans that do not bring the loan to less than 90 days delinquent are recorded on a cash basis. Subsequent cash paymentsPayments can also be applied first as a reduction of principal until all principal is recovered and then subsequently to interest, if in management’s opinion, it is evident that recovery of all principal due is unlikelynot likely to occur. Loan fees and certain loan origination costs are deferred and amortized into interest income over the contractual life of the loans using the level-yield method. Prepayment penalties received on loans which pay in full prior to their scheduled maturity are included in interest income in the period they are collected.
The BankCompany may purchase loans to supplement originations. Loan purchases are evaluated at the time of purchase to determine the appropriate accounting treatment. Performing loans purchased at a premium/discount are recorded at the purchase price with the premium/discount being amortized/accreted into interest income over the life of the loan. All loans purchased during the years ended December 31, 20162018 and 20152017 were performing loans that did not display credit deterioration from origination at the time of purchase and therefore were not considered impaired when purchased.
Allowance for Loan Losses:
The Company maintains an allowance for loan losses at an amount which in management’s judgment, is adequate to absorb probable estimated losses inherent in the loan portfolio. Management’s judgment in determining the adequacy of the allowance for loan losses is based on evaluation of the collectability of loans. This evaluation is inherently subjective, as it requires estimates that are susceptible to significant revisions as more information becomes available. An unallocated component is maintained to cover uncertainties that could affect management's estimate of probable losses. The unallocated component of the allowance reflects the margin of imprecision inherent in the underlying assumptions used in the methodologies for estimating specific and general losses in the portfolio.
The allowance for loan losses is established through a provision for loan losses based on management’s evaluation of the risk inherent in the various components of the loan portfolio and other factors, including historical loan loss experience (which is updated quarterly), current economic conditions, delinquency and non-accrual trends, classified loan levels, risk in the portfolio and volumes and trends in loan types, recent trends in charge-offs, changes in underwriting standards, experience, ability and depth of the Company’s lenders, collection policies and experience, internal loan review function and other external factors. The Company segregated the loans into two portfolios based on the loans year of origination. One portfolio was reviewed for loans originated after December 31, 2009 and a second portfolio for loans originated prior to January 1, 2010. Our decision to segregate the portfolio based upon origination dates was based on changes made in our underwriting standards during 2009. By the end of 2009, all loans were being underwritten based on revised and tightened underwriting standards. Loans originated prior to 2010 have a higher delinquency rate and loss history. Each of the years in the portfolio for loans originated prior to 2010 has a similar delinquency rate. The determination of the amount of the allowance for loan losses includes estimates that are susceptible to significant changes due to changes in appraisal values of collateral, national and local economic conditions and other factors. We review our loan portfolio by separate categories with similar risk and collateral characteristics. Impaired loans are segregated and reviewed separately. The Company’s Board of Directors reviews and approves management’s evaluation of the adequacy of the allowance for loan losses on a quarterly basis.
The allowance for loan losses is established through charges to earnings in the form of a provision for loan losses. Increases and decreases in the allowance for loan losses other than charge-offs and recoveries are included in the provision for loan losses. When a loan or a portion of a loan is determined to be uncollectible, the portion deemed uncollectible is charged against the allowance for loan losses, and subsequent recoveries, if any, are credited to the allowance for loan losses.
The Company recognizes a loan as non-performing when the borrower has demonstrated the inability to bring the loan current, or due to other circumstances which, in management’s opinion, indicate the borrower will be unable to bring the loan current within a reasonable time. All loans classified as non-performing, which includes all loans past due 90 days or more, are classified as non-accrual unless the loan is well secured and there is, in our opinion, compelling evidence the borrower will bring the loan current in the immediate future. Appraisals are obtainedPrior to a real estate secured loan becoming 90 days delinquent, an updated appraisal is ordered and/or updatedan internal evaluations are prepared as soon as practical, but before the loan becomes 90 days delinquent. The loan balances of collateral dependent impaired loans are compared to the property’s updated fair value. The Company considers fair value of collateral dependent loans to be 85% of the appraised or internally estimated value of the property, except for taxi medallion loans. The fair value of the underlying collateral of taxi medallion loansevaluation is the most recent reported transaction. The balance which exceeds fair value is generally charged-off. Management reviews the allowance for loan losses on a quarterly basis, and records as a provision or benefit for the amount deemed appropriate, after considering items such as, current year charge-offs, charge-off trends, new loan production, current balance by particular loan categories, and delinquent loans by particular loan categories.prepared.
73
A loan is considered impaired when, based upon current information, the Company believes it is probable that it will be unable to collect all amounts due, both principal and interest, in accordance with the original terms of the loan. Impaired loans are measured based on the present value of the expected future cash flows discounted at the loan’s effective interest rate or at the loan’s observable market price or, as a practical expedient, the fair value of the collateral, less cost to sell, if the loan is collateral dependent. Interest income on impairedAll non-accrual loans is recorded on the cash basis. The Company’s management considers all non-accrual loansare considered impaired.
The Company maintains an allowance for loan losses at an amount, which, in management’s judgment, is adequate to absorb probable estimated losses inherent in the loan portfolio. Management’s judgment in determining the adequacy of the allowance is based on evaluations of the collectability of loans. This evaluation is inherently subjective, as it requires estimates that are susceptible to significant revisions as more information becomes available. An unallocated component may at times be maintained to cover uncertainties that could affect management's estimate of probable losses. When necessary an unallocated component of the allowance will reflect the margin of imprecision inherent in the underlying assumptions used in the methodologies for estimating specific and general losses in the portfolio.
The allowance is established through charges to earnings in the form of a provision for loan losses based on management’s evaluation of the risk inherent in the various components of the loan portfolio and other factors, including historical loan loss experience, current economic conditions, delinquency and non-accrual trends, classified loan levels, risk in the portfolio and volumes and trends in loan types, recent trends in charge-offs, changes in underwriting standards, experience, ability and depth of the Company’s lenders, collection policies and experience, internal loan review function and other external factors. When a loan or a portion of a loan is determined to be uncollectible, the portion deemed uncollectible is charged against the allowance, and subsequent recoveries, if any, are credited to the allowance.
The determination of the amount of the allowance for loan losses includes estimates that are susceptible to significant changes due to changes in appraisal values of collateral, national and local economic conditions and other factors. We review our loan portfolio by separate categories with similar risk and collateral characteristics. Impaired loans are segregated and reviewed separately. The Company reviews each impaired loan on an individual basis to determine if either a charge-off or a valuation allowance needs to be allocated to the loan. The Company does not charge-off or allocate a valuation allowance to loans for which management has concluded the current value of the underlying collateral will allow for recovery of the loan balance either through the sale of the loan or by foreclosure and sale of the property.
In prior years we segregated our loans into two portfolios based on year of origination. One portfolio was reviewed for loans originated after December 31, 2009 and a second portfolio for loans originated prior to January 1, 2010. That segregation was based on changes made in our underwriting standards during 2009. For the 2018 ALL calculation, however, we decided to no longer segregate loans by origination year and to collapse the two portfolios. Management based this decision on the age of the older portfolio which represented approximately 11% of the total loan portfolio and in which most losses have already been identified and incurred. In connection with this change in methodology we also combined the economic factors used to calculate the qualitative component of the ALL. The combined impact of these changes in methodology reduced the ALL by approximately $0.2 million from what would have been recorded if we had not changed our methodology. Additionally, during 2018 we updated our methodology by expanding the look-back period of historical losses used in the calculation of the quantitative component of the allowance from three years to five years and incorporated recoveries into our loss history. The increase in the look-back period from three years to five years allows for more observation points and better reflects the likelihood of losses inherent in the loan portfolio, as it is more reflective of the current economic environment. We believe the addition of recoveries net of historical losses used in the look-back period is consistent with industry best practice. The impact of these change resulted in an increase of $0.6 million in the ALL at December 31, 2018. The Company’s Board of Directors reviews and approves management’s evaluation of the adequacy of the ALL on a quarterly basis.
The Company considers fair value of collateral dependent mortgage loans to be 85% of the appraised or internally estimated value. The 85% is based on the actual net proceeds the Company has received from the sale of other real estate owned (“OREO”) as a percentage of OREO’s appraised value. For collateral dependent taxi medallion loans, the Company considers fair value to be the value of the underlying medallion based upon the most recently reported arm’s length sales transaction. When there is no recent sale activity, the fair value is calculated using capitalization rates. For both collateral dependent mortgage loans and taxi medallion loans, the amount by which the loan’s book value exceeds fair value is charged-off.
74
The Company evaluates the underlying collateral through a third party appraisal, or when a third party appraisal is not available, the Company will use an internal evaluation. The internal evaluations are prepared using an income approach or a sales approach. The income approach is used for income producing properties and uses current revenues less operating expenses to determine the net cash flow of the property. Once the net cash flow is determined, the value of the property is calculated using an appropriate capitalization rate for the property. The sales approach uses comparable sales prices in the market. When an internal evaluation is used, we place greater reliance on the income approach to value the collateral.
In preparing internal evaluations of property values, the Company seeks to obtain current data on the subject property from various sources, including: (1) the borrower; (2) copies of existing leases; (3) local real estate brokers and appraisers; (4) public records (such as for real estate taxes and water and sewer charges); (5) comparable sales and rental data in the market; (6) an inspection of the property and (7) interviews with tenants. These internal evaluations primarily focus on the income approach and comparable sales data to value the property.
As of December 31, 2016,2018, we utilized recent third party appraisals of the collateral to measure impairment for $43.3$17.0 million, or 87.5%83.0%, of collateral dependent impaired loans, and used internal evaluations of the property’s value for $6.2$3.5 million, or 12.5%17.0%, of collateral dependent impaired loans.
The Company may restructure a loan to enable a borrower experiencing financial difficulties to continue making payments when it is deemed to be in the Company’s best long-term interest. This restructure may include reducing the interest rate or amount of the monthly payment for a specified period of time, after which the interest rate and repayment terms revert to the original terms of the loan. We classify these loans as Troubled Debt Restructured (“TDR”).
These restructurings have not included a reduction of principal balance. The Company believes that restructuring these loans in this manner will allow certain borrowers to become and remain current on their loans. All loans classified as TDR are considered impaired, however TDR loansimpaired. TDRs which have been current for six consecutive months at the time they are restructured as TDR remain on accrual status and are not included as part of non-performing loans. Loans which were delinquent at the time they are restructured as a TDR are placed on non-accrual status and reported as non-performingnon-accrual performing TDR loans until they have made timely payments for six consecutive months. Loans that are restructured as TDR but are not performing in accordance with the restructured terms are placed on non-accrual status and reported as non-performing loans.
The allocation of a portion of the allowance for loan lossesALL for a performing TDR loan is based upon the present value of the future expected cash flows discounted at the loan’s original effective rate, or for a non-performing TDR which is collateral dependent, the fair value of the collateral. At December 31, 2016,2018, there were no commitments to lend additional funds to borrowers whose loans were modified to a TDR. The modification of loans to a TDR did not have a significant effect on our operating results, nor did it require a significant allocation of the allowance for loan losses.ALL.
Loans Held for Sale:
Loans held for sale are carried at the lower of cost or estimated fair value. At December 31, 20162018 and 2015,2017, there were no loans classified as held for sale.
Bank Owned Life Insurance:
Bank owned life insurance (“BOLI”) represents life insurance on the lives of certain current and past employees who have provided positive consent allowing the BankCompany to be the beneficiary of such policies. BOLI is carried in the Consolidated Statements of Financial Condition at its cash surrender value. Increases in the cash value of the policies, as well as proceeds received, are recorded in other non-interest income, and are not subject to income taxes.
Other Real Estate Owned:
Other real estate owned (“OREO”)OREO consists of property acquired through foreclosure. TheseAt the time of foreclosure these properties are acquired at fair value and subsequently carried at fair value, less estimated selling costs. The fair value is based on appraised value through a current appraisal, or at times through an internal review, additionally adjusted by the estimated costs to sell the property. This determination is made on an individual asset basis. If the fair value of a property is less than the carrying amount, the difference is recognized as a valuation allowance. Further decreases to the estimated value will be charged directly to expense. There was no OREO at December 31, 2018 and 2017.
Bank Premises and Equipment:
Bank premises and equipment are stated at cost, less depreciation accumulated on a straight-line basis over the estimated useful lives of the related assets (3assets. For equipment and furniture the useful life is between 3 to 40 years).10 years. Leasehold improvements are amortized on a straight-line basis over the term of the related leases or the lives of the assets, whichever is shorter. Maintenance, repairs and minor improvements are charged to non-interest expense in the period incurred.
75
Federal Home Loan Bank Stock:
The FHLB-NY has assigned to the BankCompany a mandated membership stock ownership requirement, based on its asset size. In addition, for all borrowing activity, the BankCompany is required to purchase shares of FHLB-NY non-marketable capital stock at par. Such shares are redeemed by FHLB-NY at par with reductions in the Bank’sCompany’s borrowing levels. The BankCompany carries its investment in FHLB-NY stock at historical cost. The Company periodically reviews its FHLB-NY stock to determine if impairment exists. At December 31, 2016,2018, the Company considered among other things the earnings performance, credit rating and asset quality of the FHLB-NY. Based on this review, the Company did not consider the value of our investment in FHLB-NY stock to be impaired at December 31, 2016.
Securities Sold Under Agreements to Repurchase:
Securities sold under agreements to repurchase are accounted for as collateralized financing and are carried at amounts at which the securities will be subsequently reacquired as specified in the respective agreements. Interest incurred under these agreements is included in other interest expense. During 2016, the Company repaid all outstanding securities sold under agreements to repurchase.2018.
Income Taxes:
Deferred income tax assets and liabilities are determined using the asset and liability (or balance sheet) method. Under this method, the net deferred tax asset or liability is determined based on the tax effects of the temporary differences between book and tax bases of the various balance sheet assets and liabilities. A deferred tax liability is recognized on all taxable temporary differences and a deferred tax asset is recognized on all deductible temporary differences and operating losses and tax credit carry-forwards. A valuation allowance is recognized to reduce the potential deferred tax asset if it is “more likely than not” that all or some portion of that potential deferred tax asset will not be realized. Uncertain tax positions that meet the more likely than not recognition threshold are measured to determine the amount of benefit to recognize. An uncertain tax position is measured at the amount of benefit that management believes has a greater than 50% likelihood of realization upon settlement. The Company must also take into account changes in tax laws or rates when valuing the deferred income tax amounts it carries on its Consolidated Statements of Financial Condition.
Stock Compensation Plans:
The Company accounts for its stock-based compensation using a fair-value-based measurement method for share-based payment transactions with employees and directors. The Company measures the cost of employee and directors services received in exchange for an award of an equity instrument based on the grant date fair value of the award. That cost is recognized over the period during which the employee and directors are required to provide services in exchange for the award. The requisite service period is usually the vesting period.
Benefit Plans:
The Company sponsors a qualified pension, 401(k), and profit sharing plan for its employees. The Company also sponsors postretirement health care and life insurance benefits plans for its employees, a non-qualified deferred compensation plan for officers who have achieved the level of at least senior vice president, and a non-qualified pension plan for its outside directors.
The Company recognizes the funded status of a benefit plan – measured as the difference between plan assets at fair value and the benefit obligation – in the Consolidated Statements of Financial Condition, with the unrecognized credits and charges recognized, net of taxes, as a component of accumulated other comprehensive loss. These credits or charges arose as a result of gains or losses and prior service costs or credits that arose during prior periods but were not recognized as components of net periodic benefit cost.
Treasury Stock:
The Company records treasury stock at cost. Treasury stock is reissued at average cost.
Derivatives:
Derivatives are recorded on the Consolidated Statements of Financial Condition at fair value. The Company records derivativesvalue on a gross basis in “Other assets” andand/or “Other liabilities” in the Consolidated Statements of Financial Condition.. The accounting for changes in value of a derivative depends on the type of hedge and on whether or not the transaction has been designated and qualifies for hedge accounting. Derivatives that are not designated as hedges are reported and measured at fair value through earnings.
To qualify for hedge accounting, a derivative must be highly effective at reducing the risk associated with the exposure being hedged. In addition, for a derivative to be designated as a hedge, the risk management objective and strategy must be documented. Hedge documentation must identify the derivative hedging instrument, the asset or liability or forecasted transaction and type of risk to be hedged, and how the effectiveness of the derivative is assessedprospectively and retrospectively. The extent to which a derivative has been, and is expected to continue to be, effective at offsetting changes in the fair value of the hedged item must be assessed and documented at least quarterly. For cash flow hedges, the effective portion of changes in the fair value of the derivative is initially recorded as a component of accumulated other comprehensive income or loss, net of tax, and subsequently reclassified into earnings when the hedged transaction effects earnings. Any hedge ineffectiveness must be(gain or loss) is reported in current-period earnings. For fair value hedges, the gain or loss on the derivative, as well as the offsetting loss or gain on the hedged item attributable to the hedged risk, is recognized in earnings. If it is determined that a derivative is not highly effective at hedging the designated exposure, hedge accounting is discontinued. Changes in the fair value of derivatives are disclosed in the Consolidated Statements of Cash Flows within operating activities in the line item Fair Value Adjustment for Financial Assets and Financial Liabilities.
76
Comprehensive Income
Comprehensive income consists of net income and other comprehensive income (loss). Other comprehensive income (loss) includes changes in unrealized gains and losses on securities available for sale and cash flow hedges arising during the period, adjustments to net periodic pension costs and reclassification adjustments for realized gains and losses on securities available for sale and OTTI charges includedchanges in net income.the fair value of instrument-specific credit risk from the Company’s liabilities carried at fair value pursuant to the fair value option.
Segment Reporting:
Management views the Company as operating as a single unit, a community bank. Therefore, segment information is not provided.
Advertising Expense:
Costs associated with advertising are expensed as incurred. The Company recorded advertising expenses of $2.2 million, $2.4 million $2.1 million and $1.8$2.4 million for the years ended December 31, 2016, 20152018, 2017 and 2014,2016, respectively.
Earnings per Common Share:
Basic earnings per common share is computed by dividing net income available to common shareholders by the total weighted average number of common shares outstanding, which includes unvested participating securities. Unvested share-based payment awards that contain nonforfeitable rights to dividends or dividend equivalents (whether paid or unpaid) are participating securities and as such are included in the calculation of earnings per share. The Company’s unvested restricted stock unit awards are considered participating securities. Therefore, weighted average common shares outstanding used for computing basic earnings per common share includes common shares outstanding plus unvested restricted stock unit awards. The computation of diluted earnings per share includes the additional dilutive effect of stock options outstanding and other common stock equivalents during the period. Common stock equivalents that are anti-dilutive are not included in the computation of diluted earnings per common share. The numerator for calculating basic and diluted earnings per common share is net income available to common shareholders. The shares held in the Company’s Employee Benefit Trust are not included in shares outstanding for purposes of calculating earnings per common share.
Earnings per common share have been computed based on the following, for the years ended December 31:
| 2016 | 2015 | 2014 | 2018 | 2017 | 2016 | |||||||||||||||||||
| (In thousands, except per share data) | (In thousands, except per share data) | |||||||||||||||||||||||
| Net income, as reported | $ | 64,916 | $ | 46,209 | $ | 44,239 | $ | 55,090 | $ | 41,121 | $ | 64,916 | ||||||||||||
| Divided by: | ||||||||||||||||||||||||
| Weighted average common shares outstanding | 28,957 | 29,106 | 29,788 | 28,709 | 29,080 | 28,957 | ||||||||||||||||||
| Weighted average common stock equivalents | 13 | 20 | 29 | 1 | 2 | 13 | ||||||||||||||||||
| Total weighted average common shares outstanding and common stock equivalents | 28,970 | 29,126 | 29,817 | 28,710 | 29,082 | 28,970 | ||||||||||||||||||
| Basic earnings per common share | $ | 2.24 | $ | 1.59 | $ | 1.49 | $ | 1.92 | $ | 1.41 | $ | 2.24 | ||||||||||||
| Diluted earnings per common share | $ | 2.24 | $ | 1.59 | $ | 1.48 | $ | 1.92 | $ | 1.41 | $ | 2.24 | ||||||||||||
| Dividend Payout ratio | 30.4 | % | 40.3 | % | 40.3 | % | 41.7 | % | 51.1 | % | 30.4 | % | ||||||||||||
There were no options that were anti-dilutive for the years ended December 31, 2016, 20152018, 2017 and 2014.2016.
3. Loans and Allowance for Loan Losses
The composition of loans is as follows at December 31:
| 2016 | 2015 | |||||||
| (In thousands) | ||||||||
| Multi-family residential | $ | 2,178,504 | $ | 2,055,228 | ||||
| Commercial real estate | 1,246,132 | 1,001,236 | ||||||
| One-to-four family ― mixed-use property | 558,502 | 573,043 | ||||||
| One-to-four family ― residential | 185,767 | 187,838 | ||||||
| Co-operative apartments | 7,418 | 8,285 | ||||||
| Construction | 11,495 | 7,284 | ||||||
| Small Business Administration | 15,198 | 12,194 | ||||||
| Taxi medallion | 18,996 | 20,881 | ||||||
| Commercial business and other | 597,122 | 506,622 | ||||||
| Gross loans | 4,819,134 | 4,372,611 | ||||||
| Net unamortized premiums and unearned loan fees | 16,559 | 15,368 | ||||||
| Total loans | $ | 4,835,693 | $ | 4,387,979 | ||||
77
| 2018 | 2017 | |||||||
| (In thousands) | ||||||||
| Multi-family residential | $ | 2,269,048 | $ | 2,273,595 | ||||
| Commercial real estate | 1,542,547 | 1,368,112 | ||||||
| One-to-four family ― mixed-use property | 577,741 | 564,206 | ||||||
| One-to-four family ― residential | 190,350 | 180,663 | ||||||
| Co-operative apartments | 8,498 | 6,895 | ||||||
| Construction | 50,600 | 8,479 | ||||||
| Small Business Administration | 15,210 | 18,479 | ||||||
| Taxi medallion | 4,539 | 6,834 | ||||||
| Commercial business and other | 877,763 | 732,973 | ||||||
| Gross loans | 5,536,296 | 5,160,236 | ||||||
| Net unamortized premiums and unearned loan fees | 15,188 | 16,763 | ||||||
| Total loans, net of fees and costs | $ | 5,551,484 | $ | 5,176,999 | ||||
The majority of our loan portfolio is invested in multi-family residential, commercial real estate and commercial business and other loans, which totaled 83.5%84.7% and 84.8% of our gross loans at December 31, 2016.2018 and 2017, respectively. Our concentration in these types of loans increases the overall level of credit risk inherent in our loan portfolio. The greater risk associated with these types of loans could require us to increase our provisionsprovision for loan losses and to maintain an allowance for loan lossesALL as a percentage of total loans in excess of the allowance currently maintained. At December 31, 2018, we were servicing $36.5 million of mortgage loans and $18.4 million of SBA loans for others.
Loans secured by multi-family residential property and commercial real estate generally involve a greater degree of risk than residential mortgage loans and generally carry larger loan balances. The increased credit risk is the result of several factors, including the concentration of principal in a smaller number of loans and borrowers, the effects of general economic conditions on income producing properties and the increased difficulty in evaluating and monitoring these types of loans. Furthermore, the repayments of loans secured by these types of properties are typically dependent upon the successful operation of the related property, which is usually owned by a legal entity with the property being the entity’s only asset. If the cash flow from the property is reduced, the borrower’s ability to repay the loan may be impaired. If the borrower defaults, our only remedy may be to foreclose on the property, for which the market value may be less than the balance due on the related mortgage loan.
Loans secured by commercial business and other loans involve a greater degree of risk for the same reasons as for multi-family residential and commercial real estate loans with the added risk that many of the loans are not secured by improved properties.
To minimize the risks involved in the origination of multi-family residential, commercial real estate and commercial business and other loans, the BankCompany adheres to strict underwriting standards, which include reviewing the expected net operating income generated by the real estate collateral securing the loan, the age and condition of the collateral, the financial resources and income level of the borrower and the borrower’s experience in owning or managing similar properties. We typically require debt service coverage of at least 125% of the monthly loan payment. We generally originate these loans up to a maximum of 75% of the appraised value or the purchase price of the property, whichever is less. Any loan with a final loan-to-value ratio in excess of 75% must be approved by the Bank’s Board of Directors or the Loan Committee as an exception to policy. We generally rely on the income generated by the property as the primary means by which the loan is repaid. However, personal guarantees may be obtained for additional security from these borrowers. Additionally, for commercial business and other loans which are not secured by improved properties, the Bank will secure these loans with business assets, including accounts receivables, inventory and real estate and generally require personal guarantees.
78
The following tables show loans modified and classified as TDR during the periods indicated:
| For the year ended December 31, 2016 | For the year ended December 31, 2018 | |||||||||||||||||||
| (Dollars in thousands) | Number | Balance | Modification description | Number | Balance | Modification description | ||||||||||||||
| One-to-four family - residential | 2 | $ | 263 | Received a below market interest rate and the loans amortization were extended | ||||||||||||||||
| Taxi medallion | 12 | 9,764 | Nine loans received a below market interest rate and three had their loan amortization extended | |||||||||||||||||
| Commercial business and other | 1 | 324 | Received a below market interest rate and the loan amortization was extended | 1 | $ | 1,620 | Loan amortization extension. | |||||||||||||
| Total | 15 | $ | 10,351 | 1 | $ | 1,620 | ||||||||||||||
| For the year ended December 31, 2015 | For the year ended December 31, 2017 | |||||||||||||||||||
| (Dollars in thousands) | Number | Balance | Modification description | Number | Balance | Modification description | ||||||||||||||
| Small Business Administration | 1 | $ | 41 | Received a below market interest rate and the loan amortization was extended | ||||||||||||||||
| Taxi medallion | 10 | $ | 6,741 | Four loans received a below market interest rate and the loan amortization was extended. Six loans had loan amortization extensions. | ||||||||||||||||
| Total | 1 | $ | 41 | 10 | $ | 6,741 | ||||||||||||||
| For the year ended December 31, 2016 | ||||||||||
| (Dollars in thousands) | Number | Balance | Modification description | |||||||
| One-to-four family - residential | 2 | $ | 263 | Received a below market interest rate and the loans amortization were extended | ||||||
| Taxi medallion | 12 | 9,764 | Nine loans received a below market interest rate and three had their loan amortization extended | |||||||
| Commercial business and other | 1 | 324 | Received a below market interest rate and the loan amortization was extended | |||||||
| Total | 15 | $ | 10,351 | |||||||
The recorded investment of the loans modified and classified to aas TDR, presented in the tables above, were unchanged as there was no principal forgiven in these modifications. Additionally, during the year ended December 31, 2015, one commercial existing TDR was re-modified by extending the term and advancing an additional $28,000.
There were no loans modified and classified as TDR during the year ended December 31, 2014.
The following table shows our recorded investment for loans classified as TDR that are performing according to their restructured terms at the periods indicated:
| December 31, 2016 | December 31, 2015 | December 31, 2018 | December 31, 2017 | |||||||||||||||||||||||||||||
| (Dollars in thousands) | Number of contracts | Recorded investment | Number of contracts | Recorded investment | Number of contracts | Recorded investment | Number of contracts | Recorded investment | ||||||||||||||||||||||||
| Multi-family residential | 9 | $ | 2,572 | 9 | $ | 2,626 | 7 | $ | 1,916 | 9 | $ | 2,518 | ||||||||||||||||||||
| Commercial real estate | 2 | 2,062 | 3 | 2,371 | - | - | 2 | 1,986 | ||||||||||||||||||||||||
| One-to-four family - mixed-use property | 5 | 1,800 | 6 | 2,052 | 5 | 1,692 | 5 | 1,753 | ||||||||||||||||||||||||
| One-to-four family - residential | 3 | 591 | 1 | 343 | 3 | 552 | 3 | 572 | ||||||||||||||||||||||||
| Small Business Administration | - | - | 1 | 34 | ||||||||||||||||||||||||||||
| Taxi medallion | 12 | 9,735 | 15 | 3,926 | 20 | 5,916 | ||||||||||||||||||||||||||
| Commercial business and other | 2 | 675 | 4 | 2,083 | 1 | 279 | 2 | 462 | ||||||||||||||||||||||||
| Total performing troubled debt restructured | 33 | $ | 17,435 | 24 | $ | 9,509 | ||||||||||||||||||||||||||
| Total performing | 31 | $ | 8,365 | 41 | $ | 13,207 | ||||||||||||||||||||||||||
During the year ended December 31, 2016,2018, we sold one commercial real estate TDR loan totaling $1.8 million, for a loss of $0.3 million, four taxi medallion TDR loan’s paid-off totaling $1.4 million and one taxi medallion loan for $0.1 million was foreclosed and is included in other assets. Additionally, one commercial business and other loan which was modified as TDR in 2018 was transferred to non-performing status, as it was no longer performing according to its modified terms. During 2017, there were no TDR loans transferred to non-performing status. DuringTaxi medallion loans in the year ended December 31, 2016, three loans paid-in-full and three loans were transferred fromtable above continue to pay as agreed, however the TDR classification. During the year ended December 31, 2015, one TDR loan for $0.4 million was transferred to non-performing status, resulting in this loan being included in non-performing loans. During the year ended December 31, 2014, three TDR loans totaling $2.7 million were transferred to non-performing status, resulting in these loans being included in non-performing loans. Subsequent to being transferred to non-performing loans, two of these loans were paid in full during the year ended December 31, 2014.Company records interest received on a cash basis.
The following table shows our recorded investment for loans classified as TDR that are not performing according to their restructured terms at the periods indicated:
| December 31, 2016 | December 31, 2015 | December 31, 2018 | December 31, 2017 | |||||||||||||||||||||||||||||
| (Dollars in thousands) | Number of contracts | Recorded investment | Number of contracts | Recorded investment | Number of contracts | Recorded investment | Number of contracts | Recorded investment | ||||||||||||||||||||||||
| Multi-family residential | 1 | $ | 396 | 1 | $ | 391 | 1 | $ | 388 | 1 | $ | 383 | ||||||||||||||||||||
| Commercial business and other | 1 | 1,397 | - | - | ||||||||||||||||||||||||||||
| Total troubled debt restructurings that subsequently defaulted | 1 | $ | 396 | 1 | $ | 391 | ||||||||||||||||||||||||||
| Total TDR's that subsequently defaulted | 2 | $ | 1,785 | 1 | $ | 383 | ||||||||||||||||||||||||||
The following table shows our non-performing loans at the periods indicated:
| At December 31, | At December 31, | |||||||||||||||
| (In thousands) | 2016 | 2015 | 2018 | 2017 | ||||||||||||
| Loans ninety days or more past due and still accruing: | ||||||||||||||||
| Multi-family residential | $ | - | $ | 233 | ||||||||||||
| Commercial real estate | - | 1,183 | $ | - | $ | 2,424 | ||||||||||
| One-to-four family mixed-use property | 386 | 611 | ||||||||||||||
| One-to-four family residential | - | 13 | ||||||||||||||
| Construction | - | 1,000 | ||||||||||||||
| Commercial business and other | - | 220 | ||||||||||||||
| Total | 386 | 3,260 | - | 2,424 | ||||||||||||
| Non-accrual mortgage loans: | ||||||||||||||||
| Multi-family residential | 1,837 | 3,561 | 2,410 | 3,598 | ||||||||||||
| Commercial real estate | 1,148 | 2,398 | 1,379 | 1,473 | ||||||||||||
| One-to-four family mixed-use property | 4,025 | 5,952 | 928 | 1,867 | ||||||||||||
| One-to-four family residential | 8,241 | 10,120 | 6,144 | 7,808 | ||||||||||||
| Total | 15,251 | 22,031 | 10,861 | 14,746 | ||||||||||||
| Non-accrual non-mortgage loans: | ||||||||||||||||
| Small Business Administration | 1,886 | 218 | 1,267 | 46 | ||||||||||||
| Taxi medallion | 3,825 | - | 613 | 918 | ||||||||||||
| Commercial business and other | 68 | 568 | 3,512 | - | ||||||||||||
| Total | 5,779 | 786 | 5,392 | 964 | ||||||||||||
| Total non-accrual loans | 21,030 | 22,817 | 16,253 | 15,710 | ||||||||||||
| Total non-performing loans | $ | 21,416 | $ | 26,077 | $ | 16,253 | $ | 18,134 | ||||||||
81
The following is a summary of interest foregone on non-accrual loans and loans classified as TDR for the years ended December 31:
| 2016 | 2015 | 2014 | ||||||||||||||||||||||
| (In thousands) | 2018 | 2017 | 2016 | |||||||||||||||||||||
| (In thousands) | ||||||||||||||||||||||||
| Interest income that would have been recognized had the loans performed in accordance with their original terms | $ | 1,963 | $ | 2,387 | $ | 2,919 | $ | 1,604 | $ | 1,705 | $ | 1,963 | ||||||||||||
| Less: Interest income included in the results of operations | 455 | 702 | 796 | 623 | 619 | 455 | ||||||||||||||||||
| Total foregone interest | $ | 1,508 | $ | 1,685 | $ | 2,123 | $ | 981 | $ | 1,086 | $ | 1,508 | ||||||||||||
The following table shows by delinquency an age analysis of our recorded investment in loans at December 31, 2016:2018:
| (in thousands) | 30 - 59 Days Past Due | 60 - 89 Days Past Due | Greater than 90 Days | Total Past Due | Current | Total Loans | 30 - 59 Days Past Due | 60 - 89 Days Past Due | Greater than 90 Days | Total Past Due | Current | Total Loans | ||||||||||||||||||||||||||||||||||||
| Multi-family residential | $ | 2,575 | $ | 287 | $ | 1,837 | $ | 4,699 | $ | 2,173,805 | $ | 2,178,504 | $ | 1,887 | $ | 339 | $ | 2,410 | $ | 4,636 | $ | 2,264,412 | $ | 2,269,048 | ||||||||||||||||||||||||
| Commercial real estate | 3,363 | 22 | 1,148 | 4,533 | 1,241,599 | 1,246,132 | 379 | - | 1,379 | 1,758 | 1,540,789 | 1,542,547 | ||||||||||||||||||||||||||||||||||||
| One-to-four family - mixed-use property | 4,671 | 762 | 4,411 | 9,844 | 548,658 | 558,502 | 1,003 | 322 | 928 | 2,253 | 575,488 | 577,741 | ||||||||||||||||||||||||||||||||||||
| One-to-four family - residential | 3,831 | 194 | 8,047 | 12,072 | 173,695 | 185,767 | 1,564 | - | 6,144 | 7,708 | 182,642 | 190,350 | ||||||||||||||||||||||||||||||||||||
| Co-operative apartments | - | - | - | - | 7,418 | 7,418 | - | - | - | - | 8,498 | 8,498 | ||||||||||||||||||||||||||||||||||||
| Construction loans | - | - | - | - | 11,495 | 11,495 | - | 730 | - | 730 | 49,870 | 50,600 | ||||||||||||||||||||||||||||||||||||
| Small Business Administration | 13 | - | 1,814 | 1,827 | 13,371 | 15,198 | 4 | 68 | 1,267 | 1,339 | 13,871 | 15,210 | ||||||||||||||||||||||||||||||||||||
| Taxi medallion | - | - | 3,825 | 3,825 | 15,171 | 18,996 | - | - | - | - | 4,539 | 4,539 | ||||||||||||||||||||||||||||||||||||
| Commercial business and other | 22 | 1 | - | 23 | 597,099 | 597,122 | 2,076 | 281 | 2,216 | 4,573 | 873,190 | 877,763 | ||||||||||||||||||||||||||||||||||||
| Total | $ | 14,475 | $ | 1,266 | $ | 21,082 | $ | 36,823 | $ | 4,782,311 | $ | 4,819,134 | $ | 6,913 | $ | 1,740 | $ | 14,344 | $ | 22,997 | $ | 5,513,299 | $ | 5,536,296 | ||||||||||||||||||||||||
The following table shows by delinquency an age analysis of our recorded investment in loans at December 31, 2015:2017:
| (in thousands) | 30 - 59 Days Past Due | 60 - 89 Days Past Due | Greater than 90 Days | Total Past Due | Current | Total Loans | 30 - 59 Days Past Due | 60 - 89 Days Past Due | Greater than 90 Days | Total Past Due | Current | Total Loans | ||||||||||||||||||||||||||||||||||||
| Multi-family residential | $ | 9,421 | $ | 804 | $ | 3,794 | $ | 14,019 | $ | 2,041,209 | $ | 2,055,228 | $ | 2,533 | $ | 279 | $ | 3,598 | $ | 6,410 | $ | 2,267,185 | $ | 2,273,595 | ||||||||||||||||||||||||
| Commercial real estate | 2,820 | 153 | 3,580 | 6,553 | 994,683 | 1,001,236 | 1,680 | 2,197 | 3,897 | 7,774 | 1,360,338 | 1,368,112 | ||||||||||||||||||||||||||||||||||||
| One-to-four family - mixed-use property | 8,630 | 1,258 | 6,563 | 16,451 | 556,592 | 573,043 | 1,570 | 860 | 1,867 | 4,297 | 559,909 | 564,206 | ||||||||||||||||||||||||||||||||||||
| One-to-four family - residential | 4,261 | 154 | 10,134 | 14,549 | 173,289 | 187,838 | 1,921 | 680 | 7,623 | 10,224 | 170,439 | 180,663 | ||||||||||||||||||||||||||||||||||||
| Co-operative apartments | - | - | - | - | 8,285 | 8,285 | - | - | - | - | 6,895 | 6,895 | ||||||||||||||||||||||||||||||||||||
| Construction loans | - | - | 1,000 | 1,000 | 6,284 | 7,284 | - | - | - | - | 8,479 | 8,479 | ||||||||||||||||||||||||||||||||||||
| Small Business Administration | 42 | - | 218 | 260 | 11,934 | 12,194 | - | - | - | - | 18,479 | 18,479 | ||||||||||||||||||||||||||||||||||||
| Taxi medallion | - | - | - | - | 20,881 | 20,881 | - | 108 | - | 108 | 6,726 | 6,834 | ||||||||||||||||||||||||||||||||||||
| Commercial business and other | - | 2 | 228 | 230 | 506,392 | 506,622 | 2 | - | - | 2 | 732,971 | 732,973 | ||||||||||||||||||||||||||||||||||||
| Total | $ | 25,174 | $ | 2,371 | $ | 25,517 | $ | 53,062 | $ | 4,319,549 | $ | 4,372,611 | $ | 7,706 | $ | 4,124 | $ | 16,985 | $ | 28,815 | $ | 5,131,421 | $ | 5,160,236 | ||||||||||||||||||||||||
The following tables show the activity in the allowance for loan losses for the periods indicated:
| For the year ended December 31, 2016 | ||||||||||||||||||||||||||||||||||||||||||||||||||||||||||||||||||||||||||||||||||||
| For the year ended December 31, 2018 | For the year ended December 31, 2018 | |||||||||||||||||||||||||||||||||||||||||||||||||||||||||||||||||||||||||||||||||||
| (in thousands) | Multi-family residential | Commercial real estate | One-to-four family - mixed-use property | One-to-four family - residential | Co-operative apartments | Construction loans | Small Business Administration | Taxi medallion | Commercial business and other | Unallocated | Total | Multi-family residential | Commercial real estate | One-to-four family - mixed-use property | One-to-four family - residential | Co-operative apartments | Construction loans | Small Business Administration | Taxi medallion | Commercial business and other | Total | |||||||||||||||||||||||||||||||||||||||||||||||||||||||||||||||
| Allowance for credit losses: | ||||||||||||||||||||||||||||||||||||||||||||||||||||||||||||||||||||||||||||||||||||
| Beginning balance | $ | 6,718 | $ | 4,239 | $ | 4,227 | $ | 1,227 | $ | - | $ | 50 | $ | 262 | $ | 343 | $ | 4,469 | $ | - | $ | 21,535 | $ | 5,823 | $ | 4,643 | $ | 2,545 | $ | 1,082 | $ | - | $ | 68 | $ | 669 | $ | - | $ | 5,521 | $ | 20,351 | ||||||||||||||||||||||||||||||||||||||||||
| Charge-off's | (161 | ) | - | (144 | ) | (114 | ) | - | - | (529 | ) | (142 | ) | (69 | ) | - | (1,159 | ) | (99 | ) | - | (3 | ) | (1 | ) | - | - | (392 | ) | (393 | ) | (44 | ) | (932 | ) | |||||||||||||||||||||||||||||||||||||||||||||||||
| Recoveries | 339 | 11 | 777 | 366 | - | - | 99 | - | 261 | - | 1,853 | 6 | - | 136 | 569 | - | - | 51 | 143 | 46 | 951 | |||||||||||||||||||||||||||||||||||||||||||||||||||||||||||||||
| Provision (benefit) | (973 | ) | 237 | (1,957 | ) | (464 | ) | - | 42 | 649 | 2,042 | (169 | ) | 593 | - | (54 | ) | (328 | ) | (811 | ) | (901 | ) | - | 261 | 90 | 250 | 2,068 | 575 | |||||||||||||||||||||||||||||||||||||||||||||||||||||||
| Ending balance | $ | 5,923 | $ | 4,487 | $ | 2,903 | $ | 1,015 | $ | - | $ | 92 | $ | 481 | $ | 2,243 | $ | 4,492 | $ | 593 | $ | 22,229 | $ | 5,676 | $ | 4,315 | $ | 1,867 | $ | 749 | $ | - | $ | 329 | $ | 418 | $ | - | $ | 7,591 | $ | 20,945 | ||||||||||||||||||||||||||||||||||||||||||
| For the year ended December 31, 2015 | ||||||||||||||||||||||||||||||||||||||||||||||||||||||||||||||||||||||||||||||||||||
| For the year ended December 31, 2017 | For the year ended December 31, 2017 | |||||||||||||||||||||||||||||||||||||||||||||||||||||||||||||||||||||||||||||||||||
| (in thousands) | Multi-family residential | Commercial real estate | One-to-four family - mixed-use property | One-to-four family - residential | Co-operative apartments | Construction loans | Small Business Administration | Taxi medallion | Commercial business and other | Total | Multi-family residential | Commercial real estate | One-to-four family - mixed-use property | One-to-four family - residential | Co-operative apartments | Construction loans | Small Business Administration | Taxi medallion | Commercial business and other | Unallocated | Total | |||||||||||||||||||||||||||||||||||||||||||||||||||||||||||||||
| Allowance for credit losses: | ||||||||||||||||||||||||||||||||||||||||||||||||||||||||||||||||||||||||||||||||||||
| Beginning balance | $ | 8,827 | $ | 4,202 | $ | 5,840 | $ | 1,690 | $ | - | $ | 42 | $ | 279 | $ | 11 | $ | 4,205 | $ | 25,096 | $ | 5,923 | $ | 4,487 | $ | 2,903 | $ | 1,015 | $ | - | $ | 92 | $ | 481 | $ | 2,243 | $ | 4,492 | $ | 593 | $ | 22,229 | ||||||||||||||||||||||||||||||||||||||||||
| Charge-off's | (474 | ) | (32 | ) | (592 | ) | (342 | ) | - | - | (34 | ) | - | (2,371 | ) | (3,845 | ) | (454 | ) | (4 | ) | (39 | ) | (415 | ) | - | - | (212 | ) | (11,283 | ) | (65 | ) | - | (12,472 | ) | ||||||||||||||||||||||||||||||||||||||||||||||||
| Recoveries | 269 | 168 | 76 | 375 | - | - | 40 | - | 312 | 1,240 | 300 | 96 | 108 | 91 | - | - | 80 | - | 58 | - | 733 | |||||||||||||||||||||||||||||||||||||||||||||||||||||||||||||||
| Provision (benefit) | (1,904 | ) | (99 | ) | (1,097 | ) | (496 | ) | - | 8 | (23 | ) | 332 | 2,323 | (956 | ) | 54 | 64 | (427 | ) | 391 | - | (24 | ) | 320 | 9,040 | 1,036 | (593 | ) | 9,861 | ||||||||||||||||||||||||||||||||||||||||||||||||||||||
| Ending balance | $ | 6,718 | $ | 4,239 | $ | 4,227 | $ | 1,227 | $ | - | $ | 50 | $ | 262 | $ | 343 | $ | 4,469 | $ | 21,535 | $ | 5,823 | $ | 4,643 | $ | 2,545 | $ | 1,082 | $ | - | $ | 68 | $ | 669 | $ | - | $ | 5,521 | $ | - | $ | 20,351 | ||||||||||||||||||||||||||||||||||||||||||
| For the year ended December 31, 2016 | ||||||||||||||||||||||||||||||||||||||||||||
| (in thousands) | Multi-family residential | Commercial real estate | One-to-four family - mixed-use property | One-to-four family - residential | Co-operative apartments | Construction loans | Small Business Administration | Taxi medallion | Commercial business and other | Unallocated | Total | |||||||||||||||||||||||||||||||||
| Allowance for credit losses: | ||||||||||||||||||||||||||||||||||||||||||||
| Beginning balance | $ | 6,718 | $ | 4,239 | $ | 4,227 | $ | 1,227 | $ | - | $ | 50 | $ | 262 | $ | 343 | $ | 4,469 | $ | - | $ | 21,535 | ||||||||||||||||||||||
| Charge-off's | (161 | ) | - | (144 | ) | (114 | ) | - | - | (529 | ) | (142 | ) | (69 | ) | - | (1,159 | ) | ||||||||||||||||||||||||||
| Recoveries | 339 | 11 | 777 | 366 | - | - | 99 | - | 261 | - | 1,853 | |||||||||||||||||||||||||||||||||
| Provision (benefit) | (973 | ) | 237 | (1,957 | ) | (464 | ) | - | 42 | 649 | 2,042 | (169 | ) | 593 | - | |||||||||||||||||||||||||||||
| Ending balance | $ | 5,923 | $ | 4,487 | $ | 2,903 | $ | 1,015 | $ | - | $ | 92 | $ | 481 | $ | 2,243 | $ | 4,492 | $ | 593 | $ | 22,229 | ||||||||||||||||||||||
| For the year ended December 31, 2014 | ||||||||||||||||||||||||||||||||||||||||
| (in thousands) | Multi-family residential | Commercial real estate | One-to-four family - mixed-use property | One-to-four family - residential | Co-operative apartments | Construction loans | Small Business Administration | Taxi medallion | Commercial business and other | Total | ||||||||||||||||||||||||||||||
| Allowance for credit losses: | ||||||||||||||||||||||||||||||||||||||||
| Beginning balance | $ | 12,084 | $ | 4,959 | $ | 6,328 | $ | 2,079 | $ | 104 | $ | 444 | $ | 458 | $ | - | $ | 5,320 | $ | 31,776 | ||||||||||||||||||||
| Charge-off's | (1,161 | ) | (325 | ) | (423 | ) | (103 | ) | - | - | (49 | ) | - | (381 | ) | (2,442 | ) | |||||||||||||||||||||||
| Recoveries | 150 | 481 | 608 | 269 | 7 | - | 92 | - | 176 | 1,783 | ||||||||||||||||||||||||||||||
| Provision (benefit) | (2,246 | ) | (913 | ) | (673 | ) | (555 | ) | (111 | ) | (402 | ) | (222 | ) | 11 | (910 | ) | (6,021 | ) | |||||||||||||||||||||
| Ending balance | $ | 8,827 | $ | 4,202 | $ | 5,840 | $ | 1,690 | $ | - | $ | 42 | $ | 279 | $ | 11 | $ | 4,205 | $ | 25,096 | ||||||||||||||||||||
83
The following tables show the manner in which loans were evaluated for impairment at the periods indicated:
| At December 31, 2016 | ||||||||||||||||||||||||||||||||||||||||||||||||||||||||||||||||||||||||||||||||||||
| At December 31, 2018 | At December 31, 2018 | |||||||||||||||||||||||||||||||||||||||||||||||||||||||||||||||||||||||||||||||||||
| (in thousands) | Multi-family residential | Commercial real estate | One-to-four family - mixed-use property | One-to-four family- residential | Co-operative apartments | Construction loans | Small Business Administration | Taxi Medallion | Commercial business and other | Unallocated | Total | Multi-family residential | Commercial real estate | One-to-four family - mixed-use property | One-to-four family- residential | Co-operative apartments | Construction loans | Small Business Administration | Taxi medallion | Commercial business and other | Total | |||||||||||||||||||||||||||||||||||||||||||||||||||||||||||||||
| Financing Receivables: | ||||||||||||||||||||||||||||||||||||||||||||||||||||||||||||||||||||||||||||||||||||
| Ending Balance | $ | 2,178,504 | $ | 1,246,132 | $ | 558,502 | $ | 185,767 | $ | 7,418 | $ | 11,495 | $ | 15,198 | $ | 18,996 | $ | 597,122 | $ | - | $ | 4,819,134 | $ | 2,269,048 | $ | 1,542,547 | $ | 577,741 | $ | 190,350 | $ | 8,498 | $ | 50,600 | $ | 15,210 | $ | 4,539 | $ | 877,763 | $ | 5,536,296 | ||||||||||||||||||||||||||||||||||||||||||
| Ending balance: individually evaluated for impairment | $ | 5,923 | $ | 6,551 | $ | 8,809 | $ | 9,989 | $ | - | $ | - | $ | 1,937 | $ | 16,282 | $ | 2,492 | $ | - | $ | 51,983 | $ | 4,500 | $ | 1,435 | $ | 3,098 | $ | 6,889 | $ | - | $ | - | $ | 1,267 | $ | 4,539 | $ | 3,791 | $ | 25,519 | ||||||||||||||||||||||||||||||||||||||||||
| Ending balance: collectively evaluated for impairment | $ | 2,172,581 | $ | 1,239,581 | $ | 549,693 | $ | 175,778 | $ | 7,418 | $ | 11,495 | $ | 13,261 | $ | 2,714 | $ | 594,630 | $ | - | $ | 4,767,151 | $ | 2,264,548 | $ | 1,541,112 | $ | 574,643 | $ | 183,461 | $ | 8,498 | $ | 50,600 | $ | 13,943 | $ | - | $ | 873,972 | $ | 5,510,777 | ||||||||||||||||||||||||||||||||||||||||||
| Allowance for credit losses: | ||||||||||||||||||||||||||||||||||||||||||||||||||||||||||||||||||||||||||||||||||||
| Ending balance: individually evaluated for impairment | $ | 232 | $ | 179 | $ | 417 | $ | 60 | $ | - | $ | - | $ | 90 | $ | 2,236 | $ | 12 | $ | - | $ | 3,226 | $ | 100 | $ | - | $ | 143 | $ | 51 | $ | - | $ | - | $ | - | $ | - | $ | 866 | $ | 1,160 | ||||||||||||||||||||||||||||||||||||||||||
| Ending balance: collectively evaluated for impairment | $ | 5,691 | $ | 4,308 | $ | 2,486 | $ | 955 | $ | - | $ | 92 | $ | 391 | $ | 7 | $ | 4,480 | $ | 593 | $ | 19,003 | $ | 5,576 | $ | 4,315 | $ | 1,724 | $ | 698 | $ | - | $ | 329 | $ | 418 | $ | - | $ | 6,725 | $ | 19,785 | ||||||||||||||||||||||||||||||||||||||||||
| At December 31, 2015 | ||||||||||||||||||||||||||||||||||||||||||||||||||||||||||||||||||||||||||||||||||||
| At December 31, 2017 | At December 31, 2017 | |||||||||||||||||||||||||||||||||||||||||||||||||||||||||||||||||||||||||||||||||||
| (in thousands) | Multi-family residential | Commercial real estate | One-to-four family - mixed-use property | One-to-four family- residential | Co-operative apartments | Construction loans | Small Business Administration | Taxi Medallion | Commercial business and other | Unallocated | Total | Multi-family residential | Commercial real estate | One-to-four family - mixed-use property | One-to-four family- residential | Co-operative apartments | Construction loans | Small Business Administration | Taxi medallion | Commercial business and other | Total | |||||||||||||||||||||||||||||||||||||||||||||||||||||||||||||||
| Financing Receivables: | ||||||||||||||||||||||||||||||||||||||||||||||||||||||||||||||||||||||||||||||||||||
| Ending Balance | $ | 2,055,228 | $ | 1,001,236 | $ | 573,043 | $ | 187,838 | $ | 8,285 | $ | 7,284 | $ | 12,194 | $ | 20,881 | $ | 506,622 | $ | - | $ | 4,372,611 | $ | 2,273,595 | $ | 1,368,112 | $ | 564,206 | $ | 180,663 | $ | 6,895 | $ | 8,479 | $ | 18,479 | $ | 6,834 | $ | 732,973 | $ | 5,160,236 | ||||||||||||||||||||||||||||||||||||||||||
| Ending balance: individually evaluated for impairment | $ | 8,047 | $ | 6,183 | $ | 12,828 | $ | 12,598 | $ | - | $ | 1,000 | $ | 310 | $ | 2,118 | $ | 4,716 | $ | - | $ | 47,800 | $ | 7,311 | $ | 9,089 | $ | 5,445 | $ | 9,686 | $ | - | $ | - | $ | 137 | $ | 6,834 | $ | 661 | $ | 39,163 | ||||||||||||||||||||||||||||||||||||||||||
| Ending balance: collectively evaluated for impairment | $ | 2,047,181 | $ | 995,053 | $ | 560,215 | $ | 175,240 | $ | 8,285 | $ | 6,284 | $ | 11,884 | $ | 18,763 | $ | 501,906 | $ | - | $ | 4,324,811 | $ | 2,266,284 | $ | 1,359,023 | $ | 558,761 | $ | 170,977 | $ | 6,895 | $ | 8,479 | $ | 18,342 | $ | - | $ | 732,312 | $ | 5,121,073 | ||||||||||||||||||||||||||||||||||||||||||
| Allowance for credit losses: | ||||||||||||||||||||||||||||||||||||||||||||||||||||||||||||||||||||||||||||||||||||
| Ending balance: individually evaluated for impairment | $ | 252 | $ | 180 | $ | 502 | $ | 51 | $ | - | $ | - | $ | - | $ | 333 | $ | 112 | $ | - | $ | 1,430 | $ | 205 | $ | 177 | $ | 198 | $ | 56 | $ | - | $ | - | $ | - | $ | - | $ | 6 | $ | 642 | ||||||||||||||||||||||||||||||||||||||||||
| Ending balance: collectively evaluated for impairment | $ | 6,466 | $ | 4,059 | $ | 3,725 | $ | 1,176 | $ | - | $ | 50 | $ | 262 | $ | 10 | $ | 4,357 | $ | - | $ | 20,105 | $ | 5,618 | $ | 4,466 | $ | 2,347 | $ | 1,026 | $ | - | $ | 68 | $ | 669 | $ | - | $ | 5,515 | $ | 19,709 | ||||||||||||||||||||||||||||||||||||||||||
The following table shows our recorded investment, unpaid principal balance and allocated allowance for loan losses for loans that were considered impaired at December 31, 2016 and 2015:at:
| December 31, 2016 | December 31, 2015 | |||||||||||||||||||||||||||||||||||||||||||||||
| Recorded Investment | Unpaid Principal Balance | Related Allowance | Recorded Investment | Unpaid Principal Balance | Related Allowance | December 31, 2018 | December 31, 2017 | |||||||||||||||||||||||||||||||||||||||||
| Recorded Investment | Unpaid Principal Balance | Related Allowance | Recorded Investment | Unpaid Principal Balance | Related Allowance | |||||||||||||||||||||||||||||||||||||||||||
| (In thousands) | (In thousands) | |||||||||||||||||||||||||||||||||||||||||||||||
| With no related allowance recorded: | ||||||||||||||||||||||||||||||||||||||||||||||||
| Mortgage loans: | ||||||||||||||||||||||||||||||||||||||||||||||||
| Multi-family residential | $ | 3,660 | $ | 3,796 | $ | - | $ | 5,742 | $ | 6,410 | $ | - | $ | 3,225 | $ | 3,568 | $ | - | $ | 5,091 | $ | 5,539 | $ | - | ||||||||||||||||||||||||
| Commercial real estate | 4,489 | 4,516 | - | 3,812 | 3,869 | - | 1,435 | 1,435 | - | 7,103 | 7,103 | - | ||||||||||||||||||||||||||||||||||||
| One-to-four family mixed-use property | 6,435 | 6,872 | - | 10,082 | 11,335 | - | 1,913 | 2,113 | - | 4,218 | 4,556 | - | ||||||||||||||||||||||||||||||||||||
| One-to-four family residential | 9,560 | 11,117 | - | 12,255 | 14,345 | - | 6,490 | 6,643 | - | 9,272 | 10,489 | - | ||||||||||||||||||||||||||||||||||||
| Co-operative apartments | - | - | - | - | - | - | ||||||||||||||||||||||||||||||||||||||||||
| Construction | - | - | - | 1,000 | 1,000 | - | ||||||||||||||||||||||||||||||||||||||||||
| Non-mortgage loans: | ||||||||||||||||||||||||||||||||||||||||||||||||
| Small Business Administration | 416 | 509 | - | 276 | 276 | - | 1,267 | 1,609 | - | 137 | 151 | - | ||||||||||||||||||||||||||||||||||||
| Taxi Medallion | 2,334 | 2,476 | - | - | - | - | ||||||||||||||||||||||||||||||||||||||||||
| Commercial Business and other | 2,072 | 2,443 | - | 2,682 | 5,347 | - | ||||||||||||||||||||||||||||||||||||||||||
| Taxi medallion | 4,539 | 12,788 | - | 6,834 | 18,063 | - | ||||||||||||||||||||||||||||||||||||||||||
| Commercial business and other | - | - | - | 313 | 682 | - | ||||||||||||||||||||||||||||||||||||||||||
| Total loans with no related allowance recorded | 28,966 | 31,729 | - | 35,849 | 42,582 | - | 18,869 | 28,156 | - | 32,968 | 46,583 | - | ||||||||||||||||||||||||||||||||||||
| With an allowance recorded: | ||||||||||||||||||||||||||||||||||||||||||||||||
| Mortgage loans: | ||||||||||||||||||||||||||||||||||||||||||||||||
| Multi-family residential | 2,263 | 2,263 | 232 | 2,305 | 2,305 | 252 | 1,275 | 1,275 | 100 | 2,220 | 2,220 | 205 | ||||||||||||||||||||||||||||||||||||
| Commercial real estate | 2,062 | 2,062 | 179 | 2,371 | 2,371 | 180 | - | - | - | 1,986 | 1,986 | 177 | ||||||||||||||||||||||||||||||||||||
| One-to-four family mixed-use property | 2,374 | 2,376 | 417 | 2,746 | 2,746 | 502 | 1,185 | 1,185 | 143 | 1,227 | 1,227 | 198 | ||||||||||||||||||||||||||||||||||||
| One-to-four family residential | 429 | 429 | 60 | 343 | 343 | 51 | 399 | 399 | 51 | 414 | 414 | 56 | ||||||||||||||||||||||||||||||||||||
| Co-operative apartments | - | - | - | - | - | - | ||||||||||||||||||||||||||||||||||||||||||
| Construction | - | - | - | - | - | - | ||||||||||||||||||||||||||||||||||||||||||
| Non-mortgage loans: | ||||||||||||||||||||||||||||||||||||||||||||||||
| Small Business Administration | 1,521 | 1,909 | 90 | 34 | 34 | - | ||||||||||||||||||||||||||||||||||||||||||
| Taxi Medallion | 13,948 | 13,948 | 2,236 | 2,118 | 2,118 | 333 | ||||||||||||||||||||||||||||||||||||||||||
| Commercial Business and other | 420 | 420 | 12 | 2,034 | 2,034 | 112 | ||||||||||||||||||||||||||||||||||||||||||
| Commercial business and other | 3,791 | 3,791 | 866 | 348 | 348 | 6 | ||||||||||||||||||||||||||||||||||||||||||
| Total loans with an allowance recorded | 23,017 | 23,407 | 3,226 | 11,951 | 11,951 | 1,430 | 6,650 | 6,650 | 1,160 | 6,195 | 6,195 | 642 | ||||||||||||||||||||||||||||||||||||
| Total Impaired Loans: | ||||||||||||||||||||||||||||||||||||||||||||||||
| Total mortgage loans | $ | 31,272 | $ | 33,431 | $ | 888 | $ | 40,656 | $ | 44,724 | $ | 985 | $ | 15,922 | $ | 16,618 | $ | 294 | $ | 31,531 | $ | 33,534 | $ | 636 | ||||||||||||||||||||||||
| Total non-mortgage loans | $ | 20,711 | $ | 21,705 | $ | 2,338 | $ | 7,144 | $ | 9,809 | $ | 445 | $ | 9,597 | $ | 18,188 | $ | 866 | $ | 7,632 | $ | 19,244 | $ | 6 | ||||||||||||||||||||||||
The following table shows our average recorded investment and interest income recognized for loans that were considered impaired for the three years ended December 31, 2016:ended:
| December 31, 2016 | December 31, 2015 | December 31, 2014 | ||||||||||||||||||||||||||||||||||||||||||||||
| Average Recorded Investment | Interest Income Recognized | Average Recorded Investment | Interest Income Recognized | Average Recorded Investment | Interest Income Recognized | December 31, 2018 | December 31, 2017 | December 31, 2016 | ||||||||||||||||||||||||||||||||||||||||
| Average Recorded Investment | Interest Income Recognized | Average Recorded Investment | Interest Income Recognized | Average Recorded Investment | Interest Income Recognized | |||||||||||||||||||||||||||||||||||||||||||
| (In thousands) | (In thousands) | |||||||||||||||||||||||||||||||||||||||||||||||
| With no related allowance recorded: | ||||||||||||||||||||||||||||||||||||||||||||||||
| Mortgage loans: | ||||||||||||||||||||||||||||||||||||||||||||||||
| Multi-family residential | $ | 4,762 | $ | 96 | $ | 8,285 | $ | 92 | $ | 14,168 | $ | 194 | $ | 3,957 | $ | 76 | $ | 3,260 | $ | 80 | $ | 4,762 | $ | 96 | ||||||||||||||||||||||||
| Commercial real estate | 4,753 | 169 | 4,926 | 7 | 11,329 | 51 | 4,334 | 176 | 6,187 | 300 | 4,753 | 169 | ||||||||||||||||||||||||||||||||||||
| One-to-four family mixed-use property | 7,914 | 141 | 10,295 | 244 | 12,852 | 321 | 3,298 | 125 | 5,104 | 168 | 7,914 | 141 | ||||||||||||||||||||||||||||||||||||
| One-to-four family residential | 10,233 | 82 | 12,985 | 138 | 13,015 | 103 | 7,603 | 33 | 9,865 | 108 | 10,233 | 82 | ||||||||||||||||||||||||||||||||||||
| Co-operative apartments | - | - | 153 | - | - | - | ||||||||||||||||||||||||||||||||||||||||||
| Construction | 285 | 7 | 250 | - | 285 | - | 183 | 10 | 596 | 22 | 285 | 7 | ||||||||||||||||||||||||||||||||||||
| Non-mortgage loans: | ||||||||||||||||||||||||||||||||||||||||||||||||
| Small Business Administration | 369 | 20 | 299 | 1 | - | - | 711 | 33 | 207 | 11 | 369 | 20 | ||||||||||||||||||||||||||||||||||||
| Taxi Medallion | 3,110 | 67 | - | - | - | - | ||||||||||||||||||||||||||||||||||||||||||
| Commercial Business and other | 2,217 | 181 | 3,912 | 253 | 3,428 | 137 | ||||||||||||||||||||||||||||||||||||||||||
| Taxi medallion | 5,865 | 313 | 4,537 | 161 | 3,110 | 67 | ||||||||||||||||||||||||||||||||||||||||||
| Commercial business and other | 10,170 | 792 | 1,267 | 98 | 2,217 | 181 | ||||||||||||||||||||||||||||||||||||||||||
| Total loans with no related allowance recorded | 33,643 | 763 | 41,105 | 735 | 55,077 | 806 | 36,121 | 1,558 | 31,023 | 948 | 33,643 | 763 | ||||||||||||||||||||||||||||||||||||
| With an allowance recorded: | ||||||||||||||||||||||||||||||||||||||||||||||||
| Mortgage loans: | ||||||||||||||||||||||||||||||||||||||||||||||||
| Multi-family residential | 2,279 | 116 | 2,343 | 117 | 2,936 | 149 | 1,741 | 96 | 2,348 | 136 | 2,279 | 116 | ||||||||||||||||||||||||||||||||||||
| Commercial real estate | 2,145 | 100 | 997 | 167 | 3,242 | 167 | - | - | 2,026 | 95 | 2,145 | 100 | ||||||||||||||||||||||||||||||||||||
| One-to-four family mixed-use property | 2,560 | 138 | 2,983 | 151 | 3,249 | 170 | 1,201 | 54 | 1,341 | 65 | 2,560 | 138 | ||||||||||||||||||||||||||||||||||||
| One-to-four family residential | 410 | 15 | 347 | 14 | 358 | 14 | 405 | 16 | 420 | 16 | 410 | 15 | ||||||||||||||||||||||||||||||||||||
| Co-operative apartments | - | - | - | - | - | - | ||||||||||||||||||||||||||||||||||||||||||
| Construction | - | - | - | - | 187 | - | ||||||||||||||||||||||||||||||||||||||||||
| Non-mortgage loans: | ||||||||||||||||||||||||||||||||||||||||||||||||
| Small Business Administration | 616 | 42 | 38 | 2 | - | - | - | - | - | - | 616 | 42 | ||||||||||||||||||||||||||||||||||||
| Taxi Medallion | 7,244 | 147 | 1,062 | 66 | - | - | ||||||||||||||||||||||||||||||||||||||||||
| Commercial Business and other | 827 | 45 | 2,692 | 102 | 3,149 | 115 | ||||||||||||||||||||||||||||||||||||||||||
| Taxi medallion | - | - | 10,997 | 166 | 7,244 | 147 | ||||||||||||||||||||||||||||||||||||||||||
| Commercial business and other | 1,178 | 25 | 375 | 22 | 827 | 45 | ||||||||||||||||||||||||||||||||||||||||||
| Total loans with an allowance recorded | 16,081 | 603 | 10,462 | 619 | 13,121 | 615 | 4,525 | 191 | 17,507 | 500 | 16,081 | 603 | ||||||||||||||||||||||||||||||||||||
| Total Impaired Loans: | ||||||||||||||||||||||||||||||||||||||||||||||||
| Total mortgage loans | $ | 35,341 | $ | 864 | $ | 43,564 | $ | 930 | $ | 61,621 | $ | 1,169 | $ | 22,722 | $ | 586 | $ | 31,147 | $ | 990 | $ | 35,341 | $ | 864 | ||||||||||||||||||||||||
| Total non-mortgage loans | $ | 14,383 | $ | 502 | $ | 8,003 | $ | 424 | $ | 6,577 | $ | 252 | $ | 17,924 | $ | 1,163 | $ | 17,383 | $ | 458 | $ | 14,383 | $ | 502 | ||||||||||||||||||||||||
In accordance with our policy and the current regulatory guidelines, we designate loans as “Special Mention,” which are considered “Criticized Loans,” and “Substandard,” “Doubtful,” or “Loss,” which are considered “Classified Loans”. If a loan does not fall within one of the previouspreviously mentioned categories then the loan would be considered “Pass.” These loan designations are updated quarterly. We designate a loan as Substandard when a well-defined weakness is identified that jeopardizes the orderly liquidation of the debt. We designate a loan Doubtful when it displays the inherent weakness of a Substandard loan with the added provision that collection of the debt in full, on the basis of existing facts, is highly improbable. We designate a loan as Loss if it is deemed the debtor is incapable of repayment. The Company does not hold any loans designated as loss, as loans that are designated as Loss are charged to the Allowance for Loan Losses.ALL. Loans that are non-accrual are designated as Substandard, Doubtful or Loss. We designate a loan as Special Mention if the asset does not warrant classification within one of the other classifications, but does contain a potential weakness that deserves closer attention.
The following table sets forth the recorded investment in loans designated as Criticized or Classified at December 31, 2016:2018:
| (In thousands) | Special Mention | Substandard | Doubtful | Loss | Total | Special Mention | Substandard | Doubtful | Loss | Total | ||||||||||||||||||||||||||||||
| Multi-family residential | $ | 7,133 | $ | 3,351 | $ | - | $ | - | $ | 10,484 | $ | 2,498 | $ | 4,166 | $ | - | $ | - | $ | 6,664 | ||||||||||||||||||||
| Commercial real estate | 2,941 | 4,489 | - | - | 7,430 | 381 | 4,051 | - | - | 4,432 | ||||||||||||||||||||||||||||||
| One-to-four family - mixed-use property | 4,197 | 7,009 | - | - | 11,206 | 1,199 | 2,034 | - | - | 3,233 | ||||||||||||||||||||||||||||||
| One-to-four family - residential | 1,205 | 9,399 | - | - | 10,604 | 557 | 6,665 | - | - | 7,222 | ||||||||||||||||||||||||||||||
| Co-operative apartments | - | - | - | - | - | |||||||||||||||||||||||||||||||||||
| Construction loans | - | - | - | - | - | 730 | - | - | - | 730 | ||||||||||||||||||||||||||||||
| Small Business Administration (1) | 540 | 436 | - | - | 976 | |||||||||||||||||||||||||||||||||||
| Taxi Medallion | 2,715 | 16,228 | 54 | - | 18,997 | |||||||||||||||||||||||||||||||||||
| Small Business Administration | 481 | 139 | - | - | 620 | |||||||||||||||||||||||||||||||||||
| Taxi medallion | - | 4,539 | - | - | 4,539 | |||||||||||||||||||||||||||||||||||
| Commercial business and other | 9,924 | 2,493 | - | - | 12,417 | 730 | 21,348 | 3,512 | - | 25,590 | ||||||||||||||||||||||||||||||
| Total loans | $ | 28,655 | $ | 43,405 | $ | 54 | $ | - | $ | 72,114 | $ | 6,576 | $ | 42,942 | $ | 3,512 | $ | - | $ | 53,030 | ||||||||||||||||||||
The following table sets forth the recorded investment in loans designated as Criticized or Classified at December 31, 2015:2017:
| (In thousands) | Special Mention | Substandard | Doubtful | Loss | Total | (In thousands) | Special Mention | Substandard | Doubtful | Loss | Total | ||||||||||||||||||||||||||||||
| Multi-family residential | $ | 4,361 | $ | 5,421 | $ | - | $ | - | $ | 9,782 | $ | 6,389 | $ | 4,793 | $ | - | $ | - | $ | 11,182 | |||||||||||||||||||||
| Commercial real estate | 1,821 | 3,812 | - | - | 5,633 | 2,020 | 8,871 | - | - | 10,891 | |||||||||||||||||||||||||||||||
| One-to-four family - mixed-use property | 3,087 | 10,990 | - | - | 14,077 | 2,835 | 3,691 | - | - | 6,526 | |||||||||||||||||||||||||||||||
| One-to-four family - residential | 1,437 | 12,255 | - | - | 13,692 | 2,076 | 9,115 | - | - | 11,191 | |||||||||||||||||||||||||||||||
| Co-operative apartments | - | - | - | - | - | ||||||||||||||||||||||||||||||||||||
| Construction loans | - | 1,000 | - | - | 1,000 | ||||||||||||||||||||||||||||||||||||
| Small Business Administration (1) | 229 | 224 | - | - | 453 | ||||||||||||||||||||||||||||||||||||
| Taxi Medallion | - | 2,118 | - | - | 2,118 | ||||||||||||||||||||||||||||||||||||
| Small Business Administration | 548 | 108 | - | - | 656 | ||||||||||||||||||||||||||||||||||||
| Taxi medallion | - | 6,834 | - | - | 6,834 | ||||||||||||||||||||||||||||||||||||
| Commercial business and other | - | 3,123 | - | - | 3,123 | 14,859 | 545 | - | - | 15,404 | |||||||||||||||||||||||||||||||
| Total loans | $ | 10,935 | $ | 38,943 | $ | - | $ | - | $ | 49,878 | $ | 28,727 | $ | 33,957 | $ | - | $ | - | $ | 62,684 | |||||||||||||||||||||
4. Loans held for sale
Loans held for sale are carried at the lower of cost or estimated fair value. At December 31, 2018 and 2017, the Company did not have any loans held for sale.
The Company has implemented a strategy of selling certain delinquent and non-performing loans. Once the Company has decided to sell a loan, the sale usually will closecloses in a short period of time, generally within the same quarter. Loans designated held for sale are reclassified from loans held for investment to loans held for sale. Terms of sale generally include cash due upon the closing of the sale, no contingencies or recourse to the Company and servicing is released to the buyer. Additionally, at times the Company may sell participating interests in performing loans.
The following tables show delinquent and non-performing loans sold during the period indicated:
| For the year ended December 31, 2016 | ||||||||||||||||
| (Dollars in thousands) | Loans sold | Proceeds | Net recoveries | Net gain | ||||||||||||
| Multi-family residential | 9 | $ | 2,680 | $ | 1 | $ | 3 | |||||||||
| Commercial real estate | 2 | 192 | - | - | ||||||||||||
| One-to-four family - mixed-use property | 15 | 5,093 | 47 | 262 | ||||||||||||
| Total | 26 | $ | 7,965 | $ | 48 | $ | 265 | |||||||||
The above table does not include the sale of six performing Small Business Administration loans for proceeds totaling $3.5 million, recording a net gain of $0.3 million during the year ended December 31, 2016.
| For the year ended December 31, 2015 | ||||||||||||||||
| (Dollars in thousands) | Loans sold | Proceeds | Net recoveries | Net gain (loss) | ||||||||||||
| Multi-family residential | 9 | $ | 3,540 | $ | 134 | $ | (1 | ) | ||||||||
| Commercial real estate | 4 | 2,615 | - | 13 | ||||||||||||
| One-to-four family - mixed-use property | 10 | 2,831 | - | 57 | ||||||||||||
| Total | 23 | $ | 8,986 | $ | 134 | $ | 69 | |||||||||
The above table does not include the sale of one performing commercial real estate loan for proceeds of $3.1 million and the sale of five performing small business administration loans for proceeds totaling $4.2 million during the year ended December 31, 2015. These loans were sold for a combined net gain on sale of $0.3 million.
| For the year ended December 31, 2014 | ||||||||||||||||
| Net (charge-offs) | ||||||||||||||||
| (Dollars in thousands) | Loans sold | Proceeds | recoveries | Net gain | ||||||||||||
| Multi-family residential | 12 | $ | 5,759 | $ | (80 | ) | $ | 9 | ||||||||
| Commercial real estate | 6 | 4,635 | 295 | 8 | ||||||||||||
| One-to-four family - mixed-use property | 14 | 5,399 | 122 | 50 | ||||||||||||
| Commercial business and other | 2 | 64 | 20 | - | ||||||||||||
| Total | 34 | $ | 15,857 | $ | 357 | $ | 67 | |||||||||
| For the year ended December 31, 2018 | ||||||||||||||||
| (Dollars in thousands) | Loans sold | Proceeds | Net (charge-offs) recoveries | Net gain (loss) | ||||||||||||
| Delinquent and non-performing loans | ||||||||||||||||
| Multi-family residential | 4 | $ | 1,559 | $ | - | $ | - | |||||||||
| Commercial real estate | 4 | 6,065 | - | (235 | ) | |||||||||||
| One-to-four family - mixed-use property | 2 | 725 | (4 | ) | - | |||||||||||
| One-to-four family - residential | 2 | 390 | 72 | 10 | ||||||||||||
| Total | 12 | $ | 8,739 | $ | 68 | $ | (225 | ) | ||||||||
| Performing loans | ||||||||||||||||
| Small Business Administration | 9 | $ | 5,671 | $ | - | $ | 393 | |||||||||
| Total | 9 | $ | 5,671 | $ | - | $ | 393 | |||||||||
| For the year ended December 31, 2017 | ||||||||||||||||
| (Dollars in thousands) | Loans sold | Proceeds | Net charge-offs | Net gain (loss) | ||||||||||||
| Delinquent and non-performing loans | ||||||||||||||||
| Multi-family residential | 3 | $ | 872 | $ | - | $ | 38 | |||||||||
| Commercial real estate | 5 | 1,821 | (4 | ) | 34 | |||||||||||
| One-to-four family - mixed-use property | 9 | 3,523 | (33 | ) | 343 | |||||||||||
| Total | 17 | $ | 6,216 | $ | (37 | ) | $ | 415 | ||||||||
| Performing loans | ||||||||||||||||
| Multi-family residential | 12 | $ | 18,784 | $ | - | $ | (36 | ) | ||||||||
| Commercial real estate | 7 | 26,283 | - | (28 | ) | |||||||||||
| Small Business Administration | 8 | 5,061 | - | 252 | ||||||||||||
| Total | 27 | $ | 50,128 | $ | - | $ | 188 | |||||||||
| For the year ended December 31, 2016 | ||||||||||||||||
| (Dollars in thousands) | Loans sold | Proceeds | Net recoveries | Net gain | ||||||||||||
| Delinquent and non-performing loans | ||||||||||||||||
| Multi-family residential | 9 | $ | 2,680 | $ | 1 | $ | 3 | |||||||||
| Commercial real estate | 2 | 192 | - | - | ||||||||||||
| One-to-four family - mixed-use property | 15 | 5,093 | 47 | 262 | ||||||||||||
| Total | 26 | $ | 7,965 | $ | 48 | $ | 265 | |||||||||
| Performing loans | ||||||||||||||||
| Small Business Administration | 6 | $ | 3,534 | $ | - | $ | 319 | |||||||||
| Total | 6 | $ | 3,534 | $ | - | $ | 319 | |||||||||
5. Other Real Estate Owned
The following table shows the activity in OREO during the periods indicated:
| For the years ended December 31, | For the years ended December 31, | |||||||||||||||||||||||
| 2016 | 2015 | 2014 | 2018 | 2017 | 2016 | |||||||||||||||||||
| (In thousands) | (In thousands) | |||||||||||||||||||||||
| Balance at beginning of year | $ | 4,932 | $ | 6,326 | $ | 2,985 | $ | - | $ | 533 | $ | 4,932 | ||||||||||||
| Acquisitions | 639 | 1,667 | 7,112 | |||||||||||||||||||||
| Additions | 638 | - | 639 | |||||||||||||||||||||
| Reductions to carrying value | (1,763 | ) | (896 | ) | (5 | ) | - | - | (1,763 | ) | ||||||||||||||
| Sales | (3,275 | ) | (2,165 | ) | (3,766 | ) | (638 | ) | (533 | ) | (3,275 | ) | ||||||||||||
| Balance at end of year | $ | 533 | $ | 4,932 | $ | 6,326 | $ | - | $ | - | $ | 533 | ||||||||||||
OREO isbalances are included in “Other assets” within our Consolidated Statements of Financial Condition.
The following table shows the gross gains, gross losses and write-downs of OREO reported in the Consolidated Statements of Income in “Other operating expenses” during the periods presented:
| For the years ended December 31, | For the years ended December 31, | |||||||||||||||||||||||
| 2016 | 2015 | 2014 | 2018 | 2017 | 2016 | |||||||||||||||||||
| (In thousands) | (In thousands) | |||||||||||||||||||||||
| Gross gains | $ | 37 | $ | 306 | $ | 178 | $ | 27 | $ | 50 | $ | 37 | ||||||||||||
| Gross losses | (275 | ) | (6 | ) | (109 | ) | - | - | (275 | ) | ||||||||||||||
| Write-down of carrying value | (1,763 | ) | (896 | ) | (5 | ) | - | - | (1,763 | ) | ||||||||||||||
| Total | $ | (2,001 | ) | $ | (596 | ) | $ | 64 | ||||||||||||||||
| Total income (expense) | $ | 27 | $ | 50 | $ | (2,001 | ) | |||||||||||||||||
89
We may obtain physical possession of residential real estate collateralizing a consumer mortgage loan via foreclosure onthrough an in-substance repossession. During the year ended December 31, 2016,2018, we foreclosed on one residential real estate property for $0.6 million. During the year ended December 31, 2017 we did not foreclose on any consumer mortgages through in-substance repossession. We helddid not hold any foreclosed residential real estate totaling $0.5 million and $0.1 million at December 31, 20162018 and 2015, respectively.2017. Included within net loans as of December 31, 2016,2018 and 2017, was a recorded investment of $11.4$7.2 million and $10.5 million, respectively, of consumer mortgage loans secured by residential real estate properties for which formal foreclosure proceedings were in process according to local requirements of the applicable jurisdiction.
6. Debt and Equity Securities
The Company’s investments in equity securities that have readily determinable fair values and all investments in debt securities are classified in one of the following three categories and accounted for accordingly: (1) trading securities, (2) securities available for sale and (3) securities held-to-maturity.
The Company did not hold any trading securities at December 31, 20162018 and 2015.2017. Securities available for sale are recorded at fair value. Securities held-to-maturity are recorded at amortized cost.
The following table summarizes the Company’s portfolio of securities held-to-maturity at December 31, 2016:2018:
| Gross | Gross | Amortized Cost | Fair Value | Gross Unrealized Gains | Gross Unrealized Losses | |||||||||||||||||||||||||||
| Amortized | Unrealized | Unrealized | (In thousands) | |||||||||||||||||||||||||||||
| Cost | Fair Value | Gains | Losses | |||||||||||||||||||||||||||||
| (In thousands) | ||||||||||||||||||||||||||||||||
| Securites held-to-maturity: | ||||||||||||||||||||||||||||||||
| Securities held-to-maturity: | ||||||||||||||||||||||||||||||||
| Municipals | $ | 37,735 | $ | 35,408 | $ | - | $ | 2,327 | $ | 24,065 | $ | 22,508 | $ | - | $ | 1,557 | ||||||||||||||||
| Total municipals | 24,065 | 22,508 | - | 1,557 | ||||||||||||||||||||||||||||
| FNMA | 7,953 | 7,366 | - | 587 | ||||||||||||||||||||||||||||
| Total mortgage-backed securities | 7,953 | 7,366 | - | 587 | ||||||||||||||||||||||||||||
| Total | $ | 37,735 | $ | 35,408 | $ | - | $ | 2,327 | $ | 32,018 | $ | 29,874 | $ | - | $ | 2,144 | ||||||||||||||||
The following table summarizes the Company’s portfolio of securities held-to-maturity at December 31, 2015:2017:
| Amortized Cost | Fair Value | Gross Unrealized Gains | Gross Unrealized Losses | |||||||||||||
| (In thousands) | ||||||||||||||||
| Securities held-to-maturity: | ||||||||||||||||
| Municipals | $ | 22,913 | $ | 21,889 | $ | - | $ | 1,024 | ||||||||
| Total municipals | 22,913 | 21,889 | - | 1,024 | ||||||||||||
| FNMA | 7,973 | 7,810 | - | 163 | ||||||||||||
| Total mortgage-backed securities | 7,973 | 7,810 | - | 163 | ||||||||||||
| Total | $ | 30,886 | $ | 29,699 | $ | - | $ | 1,187 | ||||||||
| Gross | Gross | |||||||||||||||
| Amortized | Unrealized | Unrealized | ||||||||||||||
| Cost | Fair Value | Gains | Losses | |||||||||||||
| (In thousands) | ||||||||||||||||
| Securites held-to-maturity: | ||||||||||||||||
| Municipals | $ | 6,180 | $ | 6,180 | $ | - | $ | - | ||||||||
| Total | $ | 6,180 | $ | 6,180 | $ | - | $ | - | ||||||||
90
The following table summarizes the Company’s portfolio of securities available for sale at December 31, 2018:
| Amortized Cost | Fair Value | Gross Unrealized Gains | Gross Unrealized Losses | |||||||||||||
| (In thousands) | ||||||||||||||||
| Corporate | $ | 130,000 | $ | 118,535 | $ | - | $ | 11,465 | ||||||||
| Municipals | 46,231 | 46,574 | 343 | - | ||||||||||||
| Mutual funds | 11,586 | 11,586 | - | - | ||||||||||||
| Collateralized loan obligations | 88,396 | 86,751 | - | 1,645 | ||||||||||||
| Other | 1,256 | 1,256 | - | - | ||||||||||||
| Total other securities | 277,469 | 264,702 | 343 | 13,110 | ||||||||||||
| REMIC and CMO | 382,632 | 376,340 | 885 | 7,177 | ||||||||||||
| GNMA | 785 | 826 | 41 | - | ||||||||||||
| FNMA | 94,069 | 91,693 | 72 | 2,448 | ||||||||||||
| FHLMC | 90,377 | 89,094 | 113 | 1,396 | ||||||||||||
| Total mortgage-backed securities | 567,863 | 557,953 | 1,111 | 11,021 | ||||||||||||
| Total securities available for sale | $ | 845,332 | $ | 822,655 | $ | 1,454 | $ | 24,131 | ||||||||
The following table summarizes the Company’s portfolio of securities available for sale at December 31, 2016:2017:
| Gross | Gross | |||||||||||||||||||||||||||||||
| Amortized | Unrealized | Unrealized | ||||||||||||||||||||||||||||||
| Cost | Fair Value | Gains | Losses | Amortized Cost | Fair Value | Gross Unrealized Gains | Gross Unrealized Losses | |||||||||||||||||||||||||
| (In thousands) | (In thousands) | |||||||||||||||||||||||||||||||
| Corporate | $ | 110,000 | $ | 102,910 | $ | - | $ | 7,090 | $ | 110,000 | $ | 102,767 | $ | - | $ | 7,233 | ||||||||||||||||
| Municipals | 124,984 | 126,903 | 1,983 | 64 | 101,680 | 103,199 | 1,519 | - | ||||||||||||||||||||||||
| Mutual funds | 21,366 | 21,366 | - | - | 11,575 | 11,575 | - | - | ||||||||||||||||||||||||
| Collateralized loan obligations | 85,470 | 86,365 | 895 | - | 10,000 | 10,053 | 53 | - | ||||||||||||||||||||||||
| Other | 7,363 | 7,361 | - | 2 | 1,110 | 1,110 | - | - | ||||||||||||||||||||||||
| Total other securities | 349,183 | 344,905 | 2,878 | 7,156 | 234,365 | 228,704 | 1,572 | 7,233 | ||||||||||||||||||||||||
| REMIC and CMO | 402,636 | 401,370 | 1,607 | 2,873 | 328,668 | 325,302 | 595 | 3,961 | ||||||||||||||||||||||||
| GNMA | 1,319 | 1,427 | 108 | - | 1,016 | 1,088 | 72 | - | ||||||||||||||||||||||||
| FNMA | 109,493 | 108,351 | 463 | 1,605 | 136,198 | 135,474 | 330 | 1,054 | ||||||||||||||||||||||||
| FHLMC | 5,378 | 5,328 | 35 | 85 | 48,103 | 47,786 | 18 | 335 | ||||||||||||||||||||||||
| Total mortgage-backed securities | 518,826 | 516,476 | 2,213 | 4,563 | 513,985 | 509,650 | 1,015 | 5,350 | ||||||||||||||||||||||||
| Total securities available for sale | $ | 868,009 | $ | 861,381 | $ | 5,091 | $ | 11,719 | $ | 748,350 | $ | 738,354 | $ | 2,587 | $ | 12,583 | ||||||||||||||||
Mortgage-backed securities shown in the tabletables above includes one private issue collateralized mortgage obligations (“CMO”) that is collateralized by commercial real estate mortgages with an amortized cost and market value of $0.2 million$21,000 at December 31, 2016.
The following table summarizes the Company’s portfolio of securities available for sale at December 31, 2015:
| Gross | Gross | |||||||||||||||
| Amortized | Unrealized | Unrealized | ||||||||||||||
| Cost | Fair Value | Gains | Losses | |||||||||||||
| (In thousands) | ||||||||||||||||
| Corporate | $ | 115,976 | $ | 111,674 | $ | 134 | $ | 4,436 | ||||||||
| Municipals | 127,696 | 131,583 | 3,887 | - | ||||||||||||
| Mutual funds | 21,290 | 21,290 | - | - | ||||||||||||
| Collateralized loan obligations | 53,225 | 52,898 | - | 327 | ||||||||||||
| Other | 7,214 | 7,212 | - | 2 | ||||||||||||
| Total other securities | 325,401 | 324,657 | 4,021 | 4,765 | ||||||||||||
| REMIC and CMO | 469,987 | 469,936 | 3,096 | 3,147 | ||||||||||||
| GNMA | 11,635 | 11,798 | 302 | 139 | ||||||||||||
| FNMA | 170,327 | 170,057 | 1,492 | 1,762 | ||||||||||||
| FHLMC | 16,961 | 16,949 | 87 | 99 | ||||||||||||
| Total mortgage-backed securities | 668,910 | 668,740 | 4,977 | 5,147 | ||||||||||||
| Total securities available for sale | $ | 994,311 | $ | 993,397 | $ | 8,998 | $ | 9,912 | ||||||||
Mortgage-backed securities shown in the table above includes one2017. We did not hold any private issue collateralized mortgage obligations (“CMO”)CMO’s that isare collateralized by commercial real estate mortgages with an amortized cost and market value of $7.7 million at December 31, 2015.2018.
The corporate securities held by the Company at December 31, 20162018 and 20152017 are issued by U.S. banking institutions.
91
The following table details the amortized cost and fair value of the Company’s securities classified as held-to-maturity at December 31, 2016,2018, by contractual maturity.
| Amortized | ||||||||
| Cost | Fair Value | |||||||
| (In thousands) | ||||||||
| Due in one year or less | $ | 15,870 | $ | 15,870 | ||||
| Due after ten years | 21,865 | 19,538 | ||||||
| Total securities held-to-maturity | $ | 37,735 | $ | 35,408 | ||||
The amortized cost and fair value of the Company’s securities, classified as available for sale at December 31, 2016, by contractual maturity, are shown below. Expected maturities will differ from contractual maturities because borrowers may have the right to call or prepay obligations with or without call or prepayment penalties.
| Amortized Cost | Fair Value | |||||||
| (In thousands) | ||||||||
| Due in one year or less | $ | 2,568 | $ | 2,568 | ||||
| Due after ten years | 21,497 | 19,940 | ||||||
| Total other securities | 24,065 | 22,508 | ||||||
| Mortgage-backed securities | 7,953 | 7,366 | ||||||
| Total securities held-to-maturity | $ | 32,018 | $ | 29,874 | ||||
The amortized cost and fair value of the Company’s securities, classified as available for sale at December 31, 2018, by contractual maturity, are shown below.
| Amortized | Amortized Cost | Fair Value | ||||||||||||||
| Cost | Fair Value | (In thousands) | ||||||||||||||
| (In thousands) | ||||||||||||||||
| Due in one year or less | $ | - | $ | - | ||||||||||||
| Due after one year through five years | 1,781 | 1,784 | ||||||||||||||
| Due after five years through ten years | 111,348 | 108,604 | $ | 131,087 | $ | 119,622 | ||||||||||
| Due after ten years | 214,688 | 213,151 | 134,796 | 133,494 | ||||||||||||
| Total other securities | 327,817 | 323,539 | 265,883 | 253,116 | ||||||||||||
| Mutual funds | 21,366 | 21,366 | 11,586 | 11,586 | ||||||||||||
| Mortgage-backed securities | 518,826 | 516,476 | 567,863 | 557,953 | ||||||||||||
| Total securities available for sale | $ | 868,009 | $ | 861,381 | $ | 845,332 | $ | 822,655 | ||||||||
92
The following table shows the Company’s securities with gross unrealized losses and their fair value, aggregated by category and length of time that individual securities have been in a continuous unrealized loss position, at December 31, 2016.
2018.
| Total | Less than 12 months | 12 months or more | ||||||||||||||||||||||||||||||||||||||||||||||||||||||
| Unrealized | Unrealized | Unrealized | Total | Less than 12 months | 12 months or more | |||||||||||||||||||||||||||||||||||||||||||||||||||
| Count | Fair Value | Losses | Fair Value | Losses | Fair Value | Losses | Count | Fair Value | Unrealized Losses | Fair Value | Unrealized Losses | Fair Value | Unrealized Losses | |||||||||||||||||||||||||||||||||||||||||||
| (Dollars in thousands) | (Dollars in thousands) | |||||||||||||||||||||||||||||||||||||||||||||||||||||||
| Held-to-maturity securities | ||||||||||||||||||||||||||||||||||||||||||||||||||||||||
| Municipals | 1 | $ | 19,538 | $ | 2,327 | $ | 19,538 | $ | 2,327 | $ | - | $ | - | 1 | $ | 19,940 | $ | 1,557 | $ | - | $ | - | $ | 19,940 | $ | 1,557 | ||||||||||||||||||||||||||||||
| Total other securities | 1 | 19,940 | 1,557 | - | - | 19,940 | 1,557 | |||||||||||||||||||||||||||||||||||||||||||||||||
| FNMA | 1 | 7,366 | 587 | - | - | 7,366 | 587 | |||||||||||||||||||||||||||||||||||||||||||||||||
| Total mortgage-backed securities | 1 | 7,366 | 587 | - | - | 7,366 | 587 | |||||||||||||||||||||||||||||||||||||||||||||||||
| Total securities held-to-maturity | 1 | $ | 19,538 | $ | 2,327 | $ | 19,538 | $ | 2,327 | $ | - | $ | - | 2 | $ | 27,306 | $ | 2,144 | $ | - | $ | - | $ | 27,306 | $ | 2,144 | ||||||||||||||||||||||||||||||
| Available for sale securities | ||||||||||||||||||||||||||||||||||||||||||||||||||||||||
| Corporate | 14 | $ | 102,910 | $ | 7,090 | $ | 28,476 | $ | 1,524 | $ | 74,434 | $ | 5,566 | 16 | $ | 118,535 | $ | 11,465 | $ | 19,113 | $ | 888 | $ | 99,422 | $ | 10,577 | ||||||||||||||||||||||||||||||
| Municipals | 4 | 16,047 | 64 | 16,047 | 64 | - | - | 3 | 4,220 | - | 4,220 | - | - | - | ||||||||||||||||||||||||||||||||||||||||||
| Other | 1 | 298 | 2 | - | - | 298 | 2 | |||||||||||||||||||||||||||||||||||||||||||||||||
| CLO | 11 | 86,752 | 1,645 | 86,752 | 1,645 | - | - | |||||||||||||||||||||||||||||||||||||||||||||||||
| Total other securities | 19 | 119,255 | 7,156 | 44,523 | 1,588 | 74,732 | 5,568 | 30 | 209,507 | 13,110 | 110,085 | 2,533 | 99,422 | 10,577 | ||||||||||||||||||||||||||||||||||||||||||
| REMIC and CMO | 35 | 222,807 | 2,873 | 208,827 | 2,268 | 13,980 | 605 | 39 | 243,756 | 7,177 | 17,308 | 200 | 226,448 | 6,977 | ||||||||||||||||||||||||||||||||||||||||||
| GNMA | 1 | 51 | - | 51 | - | - | - | |||||||||||||||||||||||||||||||||||||||||||||||||
| FNMA | 18 | 80,924 | 1,605 | 74,972 | 1,250 | 5,952 | 355 | 14 | 85,046 | 2,448 | 6,372 | 17 | 78,674 | 2,431 | ||||||||||||||||||||||||||||||||||||||||||
| FHLMC | 1 | 3,993 | 85 | 3,993 | 85 | - | - | 3 | 51,288 | 1,396 | 10,116 | 95 | 41,172 | 1,301 | ||||||||||||||||||||||||||||||||||||||||||
| Total mortgage-backed securities | 54 | 307,724 | 4,563 | 287,792 | 3,603 | 19,932 | 960 | 57 | 380,141 | 11,021 | 33,847 | 312 | 346,294 | 10,709 | ||||||||||||||||||||||||||||||||||||||||||
| Total securities available for sale | 73 | $ | 426,979 | $ | 11,719 | $ | 332,315 | $ | 5,191 | $ | 94,664 | $ | 6,528 | 87 | $ | 589,648 | $ | 24,131 | $ | 143,932 | $ | 2,845 | $ | 445,716 | $ | 21,286 | ||||||||||||||||||||||||||||||
The Company did not hold any securities classified as held-to-maturity which had an unrealized loss at December 31, 2015.
The following table shows the Company’s available for sale securities with gross unrealized losses and their fair value, aggregated by category and length of time that individual securities have been in a continuous unrealized loss position, at December 31, 2015.2017.
| Total | Less than 12 months | 12 months or more | Total | Less than 12 months | 12 months or more | |||||||||||||||||||||||||||||||||||||||||||||||||||
| Unrealized | Unrealized | Unrealized | Count | Fair Value | Unrealized Losses | Fair Value | Unrealized Losses | Fair Value | Unrealized Losses | |||||||||||||||||||||||||||||||||||||||||||||||
| Count | Fair Value | Losses | Fair Value | Losses | Fair Value | Losses | (Dollars in thousands) | |||||||||||||||||||||||||||||||||||||||||||||||||
| Held-to-maturity securities | ||||||||||||||||||||||||||||||||||||||||||||||||||||||||
| (Dollars in thousands) | ||||||||||||||||||||||||||||||||||||||||||||||||||||||||
| Municipals | 1 | $ | 20,844 | $ | 1,024 | $ | 20,844 | $ | 1,024 | $ | - | $ | - | |||||||||||||||||||||||||||||||||||||||||||
| Total other securities | 1 | 20,844 | 1,024 | 20,844 | 1,024 | - | - | |||||||||||||||||||||||||||||||||||||||||||||||||
| FNMA | 1 | 7,810 | 163 | 7,810 | 163 | - | - | |||||||||||||||||||||||||||||||||||||||||||||||||
| Total mortgage-backed securities | 1 | 7,810 | 163 | 7,810 | 163 | - | - | |||||||||||||||||||||||||||||||||||||||||||||||||
| Total securities held-to-maturity | 2 | $ | 28,654 | $ | 1,187 | $ | 28,654 | $ | 1,187 | $ | - | $ | - | |||||||||||||||||||||||||||||||||||||||||||
| Available for sale securities | ||||||||||||||||||||||||||||||||||||||||||||||||||||||||
| Corporate | 12 | $ | 85,563 | $ | 4,436 | $ | 76,218 | $ | 3,782 | $ | 9,345 | $ | 654 | 14 | $ | 102,767 | $ | 7,233 | $ | 9,723 | $ | 277 | $ | 93,044 | $ | 6,956 | ||||||||||||||||||||||||||||||
| Municipals | 7 | 52,898 | 327 | 52,898 | 327 | - | - | |||||||||||||||||||||||||||||||||||||||||||||||||
| Other | 1 | 298 | 2 | - | - | 298 | 2 | |||||||||||||||||||||||||||||||||||||||||||||||||
| Total other securities | 20 | 138,759 | 4,765 | 129,116 | 4,109 | 9,643 | 656 | 14 | 102,767 | 7,233 | 9,723 | 277 | 93,044 | 6,956 | ||||||||||||||||||||||||||||||||||||||||||
| REMIC and CMO | 33 | 238,132 | 3,147 | 182,010 | 1,642 | 56,122 | 1,505 | 36 | 249,596 | 3,961 | 162,781 | 1,406 | 86,815 | 2,555 | ||||||||||||||||||||||||||||||||||||||||||
| GNMA | 1 | 6,977 | 139 | 6,977 | 139 | - | - | |||||||||||||||||||||||||||||||||||||||||||||||||
| FNMA | 20 | 102,225 | 1,762 | 75,769 | 1,043 | 26,456 | 719 | 17 | 120,510 | 1,054 | 109,258 | 850 | 11,252 | 204 | ||||||||||||||||||||||||||||||||||||||||||
| FHLMC | 3 | 14,715 | 99 | 14,715 | 99 | - | - | 2 | 46,829 | 335 | 43,258 | 294 | 3,571 | 41 | ||||||||||||||||||||||||||||||||||||||||||
| Total mortgage-backed securities | 57 | 362,049 | 5,147 | 279,471 | 2,923 | 82,578 | 2,224 | 55 | 416,935 | 5,350 | 315,297 | 2,550 | 101,638 | 2,800 | ||||||||||||||||||||||||||||||||||||||||||
| Total securities available for sale | 77 | $ | 500,808 | $ | 9,912 | $ | 408,587 | $ | 7,032 | $ | 92,221 | $ | 2,880 | 69 | $ | 519,702 | $ | 12,583 | $ | 325,020 | $ | 2,827 | $ | 194,682 | $ | 9,756 | ||||||||||||||||||||||||||||||
93
OTTI losses on impaired securities must be fully recognized in earnings if an investor has the intent to sell the debt security or if it is more likely than not that the investor will be required to sell the debt security before recovery of its amortized cost. However, even if an investor does not expect to sell a debt security in an unrealized loss position, the investor must evaluate the expected cash flows to be received and determine if a credit loss has occurred. In the event that a credit loss has occurred, only the amount of impairment associated with the credit loss is recognized in earnings in the Consolidated Statements of Income. Amounts relating to factors other than credit losses are recorded in accumulated other comprehensive loss (“AOCL”) within Stockholders’ Equity. Unrealized losses on available for sale securities, that are deemed to be temporary, are recorded in AOCL, net of tax.
The Company reviewed each investment that had an unrealized loss at December 31, 20162018 and 2015. An unrealized loss exists when the current fair value of an investment is less than its amortized cost basis.2017. The unrealized losslosses in held-to-maturity municipal securities held-to-maturity at December 31, 2016 was2018 and 2017 were caused by illiquidity in the market and movements in interest rates. The unrealized losses in totalheld-to-maturity FNMA securities at December 31, 2018 and 2017 were caused by movements in interest rates. The unrealized losses in securities available for sale at December 31, 20162018 and 20152017 were caused by movements in interest rates.
It is not anticipated that these securities would be settled at a price that is less than the amortized cost of the Company’s investment. Each of these securities is performing according to its terms and, in the opinion of management, will continue to perform according to its terms. The Company does not have the intent to sell these securities and it is more likely than not the Company will not be required to sell the securities before recovery of the securities’ amortized cost basis. This conclusion is based upon considering the Company’s cash and working capital requirements and contractual and regulatory obligations, none of which the Company believes would cause the sale of the securities. Therefore, the Company did not consider these investments to be other-than-temporarily impaired at December 31, 20162018 and 2015.2017.
The following table representsCompany did not record any credit related OTTI charges during the activity related to the credit loss component recognized in earnings on debt securities held by the Company for which a portion of OTTI was recognized in AOCL for the periods indicated:years ended December 31, 2018, 2017 and 2016.
| For the years ended December 31, | ||||||||||||
| 2016 | 2015 | 2014 | ||||||||||
| (In thousands) | ||||||||||||
| Beginning balance | $ | - | $ | - | $ | 3,738 | ||||||
| Recognition of actual losses | - | - | - | |||||||||
| OTTI charges due to credit loss recorded in earnings | - | - | - | |||||||||
| Securities sold during the period | - | - | (3,738 | ) | ||||||||
| Ending balance | $ | - | $ | - | $ | - | ||||||
The Company sold available for sale securities with bookcarrying values at the time of sale totaling $126.0$120.3 million, $163.0$112.4 million and $112.4$126.0 million during the years ended December 31, 2016, 20152018, 2017 and 2014,2016, respectively.
The following table represents the gross gains and gross losses realized from the sale of securities available for sale for the periods indicated:
| For the years ended | ||||||||||||||||||||||||
| December 31, | For the years ended December 31, | |||||||||||||||||||||||
| 2016 | 2015 | 2014 | 2018 | 2017 | 2016 | |||||||||||||||||||
| (In thousands) | (In thousands) | |||||||||||||||||||||||
| Gross gains from the sale of securities | $ | 2,370 | $ | 2,899 | $ | 5,247 | $ | 105 | $ | 401 | $ | 2,370 | ||||||||||||
| Gross losses from the sale of securities | (846 | ) | (2,732 | ) | (2,372 | ) | (2,025 | ) | (587 | ) | (846 | ) | ||||||||||||
| Net gains from the sale of securities | $ | 1,524 | $ | 167 | $ | 2,875 | ||||||||||||||||||
| Net (losses) gains from the sale of securities | $ | (1,920 | ) | $ | (186 | ) | $ | 1,524 | ||||||||||||||||
Included in “Other assets” within our Consolidated Statements of Financial Condition are amounts held in a rabbi trust for certain non-qualified deferred compensation plans totaling $15.7$17.3 million and $14.8$17.0 million at December 31, 20162018 and 2015,2017, respectively.
94
7. Bank Premises and Equipment, Net
Bank premises and equipment are as follows at December 31:
| 2016 | 2015 | 2018 | 2017 | |||||||||||||
| (In thousands) | (In thousands) | |||||||||||||||
| Land | $ | - | $ | 745 | ||||||||||||
| Building and leasehold improvements | 29,795 | 29,610 | ||||||||||||||
| Leasehold improvements | $ | 39,703 | $ | 37,044 | ||||||||||||
| Equipment and furniture | 21,924 | 19,770 | 24,582 | 22,489 | ||||||||||||
| Total | 51,719 | 50,125 | 64,285 | 59,533 | ||||||||||||
| Less: Accumulated depreciation and amortization | 25,158 | 24,503 | 33,867 | 28,697 | ||||||||||||
| Bank premises and equipment, net | $ | 26,561 | $ | 25,622 | $ | 30,418 | $ | 30,836 | ||||||||
During the year ended December 31, 2016, we sold three branch buildings, realizing a pre-tax gain of $48.0 million. Simultaneous with the sale, leasebacks were entered into for terms of one year or less. During the year ended December 31, 2015, we sold three branch buildings in sale-leaseback transactions, realizing a pre-tax gain of $12.7 million, of which $6.5 million was recognized in earnings during the year ended December 31, 2015 and $6.2 million was deferred and is being amortized over the 10-year term of the branch leases. We have no continuing involvement in any of the sold branch buildings other than as an ordinary lessee.
8. Deposits
Total deposits at December 31, 20162018 and 2015,2017, and the weighted average rate on deposits at December 31, 2016,2018, are as follows:
| Weighted | ||||||||||||||||||||||||
| Average | ||||||||||||||||||||||||
| Rate | ||||||||||||||||||||||||
| 2016 | 2015 | 2016 | 2018 | 2017 | Weighted Average Rate 2018 | |||||||||||||||||||
| (Dollars in thousands) | (Dollars in thousands) | |||||||||||||||||||||||
| Interest-bearing deposits: | ||||||||||||||||||||||||
| Certificate of deposit accounts | $ | 1,372,115 | $ | 1,403,302 | 1.41 | % | $ | 1,563,310 | $ | 1,351,933 | 2.10 | % | ||||||||||||
| Savings accounts | 254,283 | 261,748 | 0.48 | 210,022 | 290,280 | 0.72 | ||||||||||||||||||
| Money market accounts | 843,370 | 472,489 | 0.67 | 1,427,992 | 979,958 | 1.93 | ||||||||||||||||||
| NOW accounts | 1,362,484 | 1,448,695 | 0.59 | 1,300,852 | 1,333,232 | 1.53 | ||||||||||||||||||
| Total interest-bearing deposits | 3,832,252 | 3,586,234 | 4,502,176 | 3,955,403 | ||||||||||||||||||||
| Non-interest bearing demand deposits | 333,163 | 269,469 | 413,747 | 385,269 | ||||||||||||||||||||
| Total due to depositors | 4,165,415 | 3,855,703 | 4,915,923 | 4,340,672 | ||||||||||||||||||||
| Mortgagors' escrow deposits | 40,216 | 36,844 | 0.22 | 44,861 | 42,606 | |||||||||||||||||||
| Total deposits | $ | 4,205,631 | $ | 3,892,547 | $ | 4,960,784 | $ | 4,383,278 | ||||||||||||||||
The aggregate amount of time deposits with denominations of $250,000 or more (excluding brokered deposits issued in $1,000 amounts under a master certificate of deposit) was $214.0$366.7 million and $169.2$238.8 million at December 31, 20162018 and 2015,2017, respectively. The aggregate amount of brokered deposits was $1,114.9$301.7 million and $982.8$1,090.0 million at December 31, 20162018 and 2015,2017, respectively.
Deposits obtainedDuring 2018, Section 29 of the Federal Deposit Insurance Act was amended to no longer consider reciprocal deposits held by the government banking divisionan FDIC-insured depository institution brokered deposits. At December 31, 2018 and 2017, reciprocal deposits totaled $685.3 million and $682.4 million, respectively.
Government deposits are collateralized by either securities, letters of credit issued by FHLB-NY or are placed in an Insured Cash Sweep service (“ICS”). ICS deposits are considered brokered deposits. The letters of credit are collateralized by mortgage loans pledged by the Bank.Company.
At December 31, 2016,2018, government banking division deposits totaled $1,062.1$1,339.7 million, of which $539.0$661.5 million were ICS deposits and $523.1$678.2 million were collateralized by $218.8$178.9 million in securities and $382.5$659.6 million of letters of credit. At December 31, 2015,2017, government banking division deposits totaled $975.9$1,133.3 million, of which $210.7$639.5 million were ICS deposits and $765.2$493.8 million were collateralized by $364.7$183.9 million in securities and $494.0$402.1 million of letters of credit.
95
Interest expense on deposits is summarized as follows for the years ended December 31:
| 2016 | 2015 | 2014 | 2018 | 2017 | 2016 | |||||||||||||||||||
| (In thousands) | (In thousands) | |||||||||||||||||||||||
| Certificate of deposit accounts | $ | 20,536 | $ | 20,943 | $ | 22,420 | $ | 28,310 | $ | 20,579 | $ | 20,536 | ||||||||||||
| Savings accounts | 1,219 | 1,151 | 597 | 1,370 | 1,808 | 1,219 | ||||||||||||||||||
| Money market accounts | 3,592 | 1,551 | 667 | 18,707 | 8,151 | 3,592 | ||||||||||||||||||
| NOW accounts | 7,891 | 6,593 | 6,227 | 15,896 | 9,640 | 7,891 | ||||||||||||||||||
| Total due to depositors | 33,238 | 30,238 | 29,911 | 64,283 | 40,178 | 33,238 | ||||||||||||||||||
| Mortgagors' escrow deposits | 112 | 98 | 133 | 214 | 141 | 112 | ||||||||||||||||||
| Total interest expense on deposits | $ | 33,350 | $ | 30,336 | $ | 30,044 | $ | 64,497 | $ | 40,319 | $ | 33,350 | ||||||||||||
Scheduled remaining maturities of certificate of deposit accounts are summarized as follows for the years ended December 31:
| 2016 | 2015 | 2018 | 2017 | |||||||||||||
| (In thousands) | (In thousands) | |||||||||||||||
| Within 12 months | $ | 644,336 | $ | 448,229 | $ | 1,017,177 | $ | 759,360 | ||||||||
| More than 12 months to 24 months | 475,858 | 478,361 | 404,930 | 449,293 | ||||||||||||
| More than 24 months to 36 months | 173,936 | 247,349 | 78,427 | 95,626 | ||||||||||||
| More than 36 months to 48 months | 34,038 | 167,529 | 10,915 | 42,928 | ||||||||||||
| More than 48 months to 60 months | 42,673 | 35,558 | 51,365 | 2,648 | ||||||||||||
| More than 60 months | 1,274 | 26,276 | 496 | 2,078 | ||||||||||||
| Total certificate of deposit accounts | $ | 1,372,115 | $ | 1,403,302 | $ | 1,563,310 | $ | 1,351,933 | ||||||||
9. Borrowed Funds
Borrowed funds are summarized as follows at December 31:
| 2016 | 2015 | |||||||||||||||
| Weighted | Weighted | |||||||||||||||
| Average | Average | |||||||||||||||
| Amount | Rate | Amount | Rate | |||||||||||||
| (Dollars in thousands) | ||||||||||||||||
| FHLB-NY advances - fixed rate: | ||||||||||||||||
| Due in 2016 | $ | - | - | % | $ | 386,152 | 1.04 | % | ||||||||
| Due in 2017 | 550,981 | 1.02 | 250,708 | 1.29 | ||||||||||||
| Due in 2018 | 259,088 | 1.27 | 265,088 | 1.30 | ||||||||||||
| Due in 2019 | 149,112 | 1.48 | 94,710 | 1.64 | ||||||||||||
| Due in 2020 | 105,206 | 1.42 | 110,000 | 2.98 | ||||||||||||
| Due in 2021 | 94,803 | 1.47 | - | - | ||||||||||||
| Total FHLB-NY advances | 1,159,190 | 1.21 | 1,106,658 | 1.40 | ||||||||||||
| Repurchase agreements- fixed rate: | ||||||||||||||||
| Due in 2016 | - | - | 38,000 | 1.92 | ||||||||||||
| Due in 2017 | - | - | 38,000 | 4.16 | ||||||||||||
| Due in 2020 | - | - | 40,000 | 3.45 | ||||||||||||
| Total repurchase agreements | - | - | 116,000 | 3.18 | ||||||||||||
| Federal funds purchased | ||||||||||||||||
| Due in 2016 | - | - | 20,000 | 0.56 | ||||||||||||
| Subordinated debentures - fixed rate through 2021 | ||||||||||||||||
| Due in 2026 | 73,414 | 5.36 | - | - | ||||||||||||
| Junior subordinated debentures - adjustable rate | ||||||||||||||||
| Due in 2037 | 33,959 | 4.28 | 29,018 | 5.67 | ||||||||||||
| Total borrowings | $ | 1,266,563 | 1.53 | % | $ | 1,271,676 | 1.65 | % | ||||||||
| 2018 | 2017 | |||||||||||||||
| Amount | Weighted Average Rate | Amount | Weighted Average Rate | |||||||||||||
| (Dollars in thousands) | ||||||||||||||||
| FHLB-NY advances - fixed rate: | ||||||||||||||||
| Due in 2018 | $ | - | - | % | $ | 630,588 | 1.41 | % | ||||||||
| Due in 2019 | 782,899 | 2.23 | 257,216 | 1.55 | ||||||||||||
| Due in 2020 | 186,082 | 1.64 | 186,148 | 1.64 | ||||||||||||
| Due in 2021 | 125,016 | 1.57 | 125,016 | 1.57 | ||||||||||||
| Due in 2022 | 25,000 | 2.83 | - | - | ||||||||||||
| Due in 2023 | 15,996 | 3.14 | - | - | ||||||||||||
| Total FHLB-NY advances | 1,134,993 | 2.09 | 1,198,968 | 1.49 | ||||||||||||
| Subordinated debentures - fixed rate through 2021 Due in 2026 | 74,001 | 5.32 | 73,699 | 5.34 | ||||||||||||
| Junior subordinated debentures - adjustable rate Due in 2037 | 41,849 | 6.07 | 36,986 | 4.86 | ||||||||||||
| Total borrowings | $ | 1,250,843 | 2.41 | % | $ | 1,309,653 | 1.80 | % | ||||||||
96
The FHLB-NY advances are fixed rate borrowings with no call provisions. The borrowings terms range from one day to five years.
During 2016, $130.0 million in FHLB-NY advances at an average cost of 2.82% and $78.0 million in securities sold under agreements to repurchase, at an average cost of 3.80%, were extinguished prior to their scheduled maturity dates, incurring a prepayment penalty totaling $10.4 million. During 2015, $80.0 million in FHLB-NY fixed rate advances were modified from an average cost of 4.41% to an average cost of 3.46%. This modification extended the maturity on the advances by an average of 2.3 years without incurring a prepayment penalty. During 2014, $66.9 million in long-term FHLB-NY advances at an average cost of 2.98% and $30.0 million in securities sold under agreements to repurchase at an average cost of 4.98%, were prepaid while incurring a prepayment penalty totaling $5.2 million.
At December 31, 2016,2018, the BankCompany was able to borrow up to $2,703.1$2,943.0 million from the FHLB-NY in Federal Home Loan Bank advances and letters of credit. As of December 31, 2016,2018, the Bank had $1,506.4$1,794.5 million outstanding in combined balances of FHLB-NY advances and letters of credit. At December 31, 2016,2018, the Bank also has unsecured lines of credit with other commercial banks totaling $100.0 million.
As part of the Company’s strategy to finance investment opportunities and manage its cost of funds, the Company can enter into repurchase agreements with broker-dealers and the FHLB-NY. These agreements are recorded as financing transactions and the obligations to repurchase are reflected as a liability in the Consolidated Statements of Financial Condition. The securities underlying the agreements are delivered to the broker-dealers or the FHLB-NY who arrange the transaction. The securities remain registered in the name of the Company and are returned upon the maturity of the agreement. The Company retains the right of substitution of collateral throughout the terms of the agreements. As a condition of the repurchase agreements the Company is required to provide sufficient collateral. If the fair value of the collateral were to fall below the required level, the Company is obligated to pledge additional collateral. All the repurchase agreements were collateralized by mortgage-backed securities. At December 31, 2016, the Company did not have any repurchase agreements outstanding.
Information relating to these agreements at or for the years ended December 31 is as follows:
| 2016 | 2015 | 2014 | ||||||||||
| (Dollars in thousands) | ||||||||||||
| Book value of collateral | $ | - | $ | 131,421 | $ | 142,925 | ||||||
| Estimated fair value of collateral | - | 131,421 | 142,925 | |||||||||
| Average balance of outstanding agreements during the year | 64,087 | 116,000 | 137,824 | |||||||||
| Maximum balance of outstanding agreements at a month end during the year | 116,000 | 116,000 | 155,300 | |||||||||
| Average interest rate of outstanding agreements during the year | 3.26 | % | 3.22 | % | 3.40 | % | ||||||
Pursuant to a blanket collateral agreement with the FHLB-NY, advances are secured by all of the Bank’s stock in the FHLB-NY and certain qualifying mortgage loans in an amount at least equal to 110% of the advances outstanding. The Bank may also pledge mortgage-backed and mortgage-related securities, and other securities not otherwise pledged.
During the year ended December 31, 2016, the Holding Company issued subordinated debt with an aggregated principal amount of $75.0 million, receiving net proceeds totaling $73.4 million. The subordinated debt was issued at 5.25% fixed-to-floating rate maturing in 2026. The debt is fixed-rate for the first five years, after which it resets quarterly. Additionally, the debt is callable at par quarterly through its maturity date beginning December 15, 2021. The subordinated debentures were structured to qualify as Tier 2 capital for regulatory purposes. Subordinated debt totaled $73.4 million at December 31, 2016, which included $1.6 million of unamortized debt issuance costs. These costs are being amortized over the life of the debt.
The following table shows the terms of the subordinated debt issued by the Holding Company:
| Subordinated Debentures | ||||
| Issue Date | December 12, 2016 | |||
| Initial Rate | ||||
| First Reset Date | December 15, 2021 | |||
| First Call Date | December 15, 2021 | |||
| Spread over 3-month LIBOR | ||||
| Maturity Date | December 15, 2026 |
We may not redeem the subordinated debt prior to December 15, 2021, except that the Company may redeem the subordinated debt at any time, at its option, in whole but not in part, subject to obtaining any required regulatory approvals, if (i) a change or prospective change in law occurs that could prevent the Company from deducting interest payable on the subordinated debt for U.S. federal income tax purposes, (ii) a subsequent event occurs that precludes the subordinated debt from being recognized as Tier 2 capital for regulatory capital purposes, or (iii) the Company is required to register as an investment company under the Investment Company Act of 1940, as amended, in each case, at a redemption price equal to 100% of the principal amount of the subordinated debt plus any accrued and unpaid interest through, but excluding, the redemption date.
The Holding Company has three trusts formed under the laws of the State of Delaware for the purpose of issuing capital and common securities, and investing the proceeds thereof in junior subordinated debentures of the Holding Company. Each of these trusts issued $20.6 million of securities which had a fixed-rate for the first five years, after which they reset quarterly based on a spread over 3-month LIBOR. The securities were first callable at par after five years, and pay cumulative dividends. The Holding Company has guaranteed the payment of these trusts’ obligations under their capital securities. The terms of the junior subordinated debentures are the same as those of the capital securities issued by the trusts. The junior subordinated debentures issued by the Holding Company are carried at fair value in the consolidated financial statements.
The table below shows the terms of the securities issued by the trusts.
| Flushing Financial Capital Trust II | Flushing Financial Capital Trust III | Flushing Financial Capital Trust IV | Flushing Financial Capital Trust II | Flushing Financial Capital Trust III | Flushing Financial Capital Trust IV | |||||||||||||
| Issue Date | June 20, 2007 | June 21, 2007 | July 3, 2007 | June 20, 2007 | June 21, 2007 | July 3, 2007 | ||||||||||||
| Initial Rate | 7.14 | % | 6.89 | % | 6.85 | % | 7.14% | 6.89% | 6.85% | |||||||||
| First Reset Date | September 1, 2012 | June 15, 2012 | July 30, 2012 | September 1, 2012 | June 15, 2012 | July 30, 2012 | ||||||||||||
| Spread over 3-month LIBOR | 1.41 | % | 1.44 | % | 1.42 | % | 1.41% | 1.44% | 1.42% | |||||||||
| Maturity Date | September 1, 2037 | September 15, 2037 | July 30, 2037 | September 1, 2037 | September 15, 2037 | July 30, 2037 | ||||||||||||
The consolidated financial statements do not include the securities issued by the trusts, but rather include the junior subordinated debentures of the Holding Company.
97
10. Income Taxes
Flushing Financial Corporation files consolidated Federal and combined New York State and New York City income tax returns with its subsidiaries, with the exception of the trusts, which file separate Federal income tax returns as trusts, and FPFC, which files a separate Federal income tax return as a real estate investment trust. Additionally, theThe Bank also files New Jersey State tax returns. The Company is undergoing examinations of its Federal income tax return for 2015, New York State income tax returns for 2014, 2015 and 2016 and its New York City income tax return for 2014. Additionally, the Company remains subject to examination for its Federal, New York State and New Jersey income tax returns for the years ending on or after December 31, 2013.2015. The Company is undergoing an examination of its New York City income tax returnsbelieves it has accrued for 2011, 2012 and 2013.all potential amounts that may be due to all taxing authorities.
Income tax provisions are summarized as follows for the years ended December 31:
| 2016 | 2015 | 2014 | 2018 | 2017 | 2016 | |||||||||||||||||||
| (In thousands) | (In thousands) | |||||||||||||||||||||||
| Federal: | ||||||||||||||||||||||||
| Current | $ | 34,996 | $ | 25,319 | $ | 18,052 | $ | 9,183 | $ | 14,859 | $ | 34,996 | ||||||||||||
| Deferred | (1,416 | ) | (3,476 | ) | 2,860 | (609 | ) | 7,985 | (1,416 | ) | ||||||||||||||
| Total federal tax provision | 33,580 | 21,843 | 20,912 | 8,574 | 22,844 | 33,580 | ||||||||||||||||||
| State and Local: | ||||||||||||||||||||||||
| Current | 7,647 | 7,059 | 6,369 | 3,876 | 1,419 | 7,647 | ||||||||||||||||||
| Deferred | (124 | ) | (1,735 | ) | 1,292 | (2,055 | ) | 750 | (124 | ) | ||||||||||||||
| Total state and local tax provision | 7,523 | 5,324 | 7,661 | 1,821 | 2,169 | 7,523 | ||||||||||||||||||
| Total income tax provision | $ | 41,103 | $ | 27,167 | $ | 28,573 | $ | 10,395 | $ | 25,013 | $ | 41,103 | ||||||||||||
On December 22, 2017, the Tax Cuts and Jobs Act (the “TCJA”) was enacted, which among other things, reduced the federal income tax rate for corporations from 35% to 21% effective January 1, 2018. We recorded $3.8 million in additional tax expense during 2017 from the revaluation of our net deferred tax assets, resulting from the TCJA.
The income tax provision in the Consolidated Statements of Income has been provided at effective rates of 38.8%15.9%, 37.0%37.8% and 39.2%38.8% for the years ended December 31, 2016, 20152018, 2017 and 2014,2016, respectively. The effective rates differ from the statutory federal income tax rate as follows for the years ended December 31:
| 2018 | 2017 | 2016 | ||||||||||||||||||||||
| (Dollars in thousands) | ||||||||||||||||||||||||
| Taxes at federal statutory rate | $ | 13,752 | 21.0 | % | $ | 23,147 | 35.0 | % | $ | 37,106 | 35.0 | % | ||||||||||||
| Increase (reduction) in taxes resulting from: | ||||||||||||||||||||||||
| State and local income tax, net of Federal income tax benefit | 1,439 | 2.2 | 1,410 | 2.1 | 4,890 | 4.6 | ||||||||||||||||||
| TCJA | - | - | 3,770 | 5.7 | - | - | ||||||||||||||||||
| Tax exempt | (1,961 | ) | (3.0 | ) | (2,429 | ) | (3.7 | ) | (1,750 | ) | (1.7 | ) | ||||||||||||
| Other | (2,835 | ) | (4.3 | ) | (885 | ) | (1.3 | ) | 857 | 0.9 | ||||||||||||||
| Taxes at effective rate | $ | 10,395 | 15.9 | % | $ | 25,013 | 37.8 | % | $ | 41,103 | 38.8 | % | ||||||||||||
| 2016 | 2015 | 2014 | ||||||||||||||||||||||
| (Dollars in thousands) | ||||||||||||||||||||||||
| Taxes at federal statutory rate | $ | 37,106 | 35.0 | % | $ | 25,681 | 35.0 | % | $ | 25,484 | 35.0 | % | ||||||||||||
| Increase (reduction) in taxes resulting from: | ||||||||||||||||||||||||
| State and local income tax, net of Federal income tax benefit | 4,890 | 4.6 | 3,461 | 4.7 | 4,980 | 6.8 | ||||||||||||||||||
| Other | (893 | ) | (0.8 | ) | (1,975 | ) | (2.7 | ) | (1,891 | ) | (2.6 | ) | ||||||||||||
| Taxes at effective rate | $ | 41,103 | 38.8 | % | $ | 27,167 | 37.0 | % | $ | 28,573 | 39.2 | % | ||||||||||||
98
The components of the net deferred tax assets are as follows at December 31:
| 2016 | 2015 | 2018 | 2017 | |||||||||||||
| (In thousands) | (In thousands) | |||||||||||||||
| Deferred tax asset: | ||||||||||||||||
| Deferred tax assets: | ||||||||||||||||
| Postretirement benefits | $ | 7,800 | $ | 6,798 | $ | 6,489 | $ | 6,047 | ||||||||
| Allowance for loan losses | 9,518 | 9,437 | 6,490 | 6,414 | ||||||||||||
| Stock based compensation | 3,525 | 3,404 | 2,717 | 2,808 | ||||||||||||
| Depreciation | 2,135 | 1,941 | 615 | 1,057 | ||||||||||||
| Unrealized loss on securities available for sale | 2,770 | 395 | 7,028 | 3,150 | ||||||||||||
| Derivative financial instruments | 1,027 | 1,724 | ||||||||||||||
| Fair value adjustment on financial assets carried at fair value | 227 | 168 | ||||||||||||||
| Fair value hedges | 638 | 939 | ||||||||||||||
| Adjustment required to recognize funded status of postretirement pension plans | 3,246 | 3,833 | 751 | 2,068 | ||||||||||||
| Gain on sale of buildings | 2,211 | 2,531 | 1,220 | 1,434 | ||||||||||||
| Other | 2,434 | 2,460 | 3,113 | 299 | ||||||||||||
| Deferred tax asset | 34,666 | 32,523 | ||||||||||||||
| Net operating loss (NYC) | 928 | - | ||||||||||||||
| Deferred tax assets | 30,216 | 24,384 | ||||||||||||||
| Deferred tax liability: | ||||||||||||||||
| Fair value adjustment on financial assets carried at fair value | 150 | 187 | ||||||||||||||
| Deferred tax liabilities: | ||||||||||||||||
| FPFC deferred income | 2,263 | 1,916 | ||||||||||||||
| Cashflow hedges | 1,664 | 129 | ||||||||||||||
| Fair value adjustment on financial liabilities carried at fair value | 11,943 | 14,364 | 5,815 | 7,800 | ||||||||||||
| Entity specific fair value | 382 | - | ||||||||||||||
| Other | 4,684 | 3,411 | 6,132 | 4,239 | ||||||||||||
| Deferred tax liability | 16,777 | 17,962 | ||||||||||||||
| Deferred tax liabilities | 16,256 | 14,084 | ||||||||||||||
| Net deferred tax asset included in other assets | $ | 17,889 | $ | 14,561 | $ | 13,960 | $ | 10,300 | ||||||||
The Company has recorded a deferred tax asset of $34.7$30.2 million. This represents the anticipated net federal, state and local tax benefits expected to be realized in future years upon the utilization of the underlying tax attributes comprising this balance. The Company has reported taxable income for federal, state, and local tax purposes in each of the past three years. In management’s opinion, in view of the Company’s previous, current and projected future earnings trend, the probability that some of the Company’s $16.8$16.3 million deferred tax liability can be used to offset a portion of the deferred tax asset as well as certain tax planning strategies, it is more likely than not that the deferred tax asset will be fully realized. Accordingly, no valuation allowance was deemed necessary for the deferred tax asset at December 31, 20162018 and 2015.2017.
The Company does not have uncertain tax positions that are deemed material. The Company’s policy is to recognize interest and penalties on income taxes in operating expenses.tax expense. During the three years ended December 31, 2016,2018, the Company did not recognize any material amounts of interest or penalties on income taxes.
11. Stock-Based Compensation
For the years ended December 31, 2016, 20152018, 2017 and 20142016 the Company’s net income, as reported, includes $6.5 million, $5.9 million $4.8 million and $4.3$5.9 million, respectively, of stock-based compensation costs, including the benefit or expense of phantom stock awards, and $2.3$1.4 million, $1.7$1.9 million and $1.3$2.3 million, respectively, of income tax benefits related to the stock-based compensation plans.
The Company estimates the fair value of stock options using the Black-Scholes valuation model at the date of grant. The Company uses the fair value of the common stock on the date of award to measure compensation cost for restricted stock unit awards. Compensation cost is recognized over the vesting period of the award using the straight line method. The Company has not granted stock options since 2009. There were 337,175, 318,120280,590, 276,900 and 266,895337,175 restricted stock units granted for the years ended December 31, 2016, 20152018, 2017 and 2014,2016, respectively.
No stock options have been granted by the Company since 2009. At December 31, 2018, there are 300 stock options outstanding at an exercise price of $8.44.
99
The 2014 Omnibus Incentive Plan (“2014 Omnibus Plan”) became effective on May 20, 2014 after adoption by the Board of Directors and approval by the stockholders. The 2014 Omnibus Plan authorizes the Compensation Committee of the Company’s Board of Directors (the “Compensation Committee”) to grant a variety of equity compensation awards as well as long-term and annual cash incentive awards, all of which can, but need not, be structured so as to comply with Section 162(m) of the Internal Revenue Code of 1986, as amended (the “Internal Revenue Code”).awards. The 2014 Omnibus Plan authorizes the issuance of 1,100,000 shares. To the extent that an award under the 2014 Omnibus Plan is cancelled, expired, forfeited, settled in cash, settled by issuance of fewer shares than the number underlying the award, or otherwise terminated without delivery of shares to a participant in payment of the exercise price or taxes relating to an award, the shares retained by or returned to the Company will be available for future issuance under the 2014 Omnibus Plan. No further awards may be granted under the Company’s 2005 Omnibus Incentive Plan, 1996 Stock Option Incentive Plan, and 1996 Restricted Stock Incentive Plan (“Prior Plans”). At DecemberOn May 31, 2016, there were 489,3202017, stockholders approved an amendment to the 2014 Omnibus Plan (the “Amendment”) authorizing an additional 672,000 shares available for deliveryfuture issuance. In addition, to increasing the number of shares for future grants, the Amendment eliminated, in connection with awardsthe case of stock options and SARs, the ability to recycle shares used to satisfy the exercise price or taxes for such awards. No other amendments to the 2014 Omnibus Plan were made. Including the additional shares authorized from the Amendment, 745,477 shares are available for future issuance under the 2014 Omnibus Plan.Plan at December 31, 2018. To satisfy stock option exercises or fund restricted stock and restricted stock unit awards or option exercises, shares are issued from treasury stock, if available; otherwise new shares are issued. The exercise price per share of a stock option grant may not be less than the fair market value of the common stock of the Company, as defined in the 2014 Omnibus Plan, on the date of grant and may not be re-priced without the approval of the Company’s stockholders. Options, stock appreciation rights, restricted stock, restricted stock units and other stock-based awards granted under the 2014 Omnibus Plan are generally subject to a minimum vesting period of three years with stock options having a 10-year maximum contractual term. Other awards do not have a contractual term of expiration. The Compensation Committee is authorized to grant awards that vest upon a participant’s retirement. These amounts are included in stock-based compensation expense at the time of the participant’s retirement eligibility.
The following table summarizes the Company’s restricted stock unit (“RSU”) awards under the 2014 Omnibus Plan and the Prior Plans in the aggregate for the year ended December 31, 2016:2018:
| Weighted-Average | Shares | Weighted-Average Grant-Date Fair Value | ||||||||||||||
| Grant-Date | ||||||||||||||||
| Shares | Fair Value | |||||||||||||||
| Non-vested at December 31, 2015 | 415,909 | $ | 18.10 | |||||||||||||
| Non-vested at December 31, 2017 | 497,322 | $ | 22.46 | |||||||||||||
| Granted | 337,175 | 19.85 | 280,590 | 28.19 | ||||||||||||
| Vested | (238,995 | ) | 18.70 | (256,414 | ) | 23.70 | ||||||||||
| Forfeited | (25,310 | ) | 18.71 | (18,840 | ) | 25.01 | ||||||||||
| Non-vested at December 31, 2016 | 488,779 | $ | 18.99 | |||||||||||||
| Non-vested at December 31, 2018 | 502,658 | $ | 24.93 | |||||||||||||
| Vested but unissued at December 31, 2016 | 283,910 | $ | 19.27 | |||||||||||||
| Vested but unissued at December 31, 2018 | 241,924 | $ | 25.10 | |||||||||||||
As of December 31, 2016,2018, there was $6.5$8.2 million of total unrecognized compensation cost related to RSU awards granted under the 2014 Omnibus Plan and the Prior Plans. That cost is expected to be recognized over a weighted-average period of 3.12.8 years. The total fair value of awards vested for the years ended December 31, 2018, 2017 and 2016 2015 and 2014 were $4.9$7.1 million, $4.9$7.0 million and $4.4$4.9 million, respectively. The vested but unissued RSU awards consist of awards made to employees and directors who are eligible for retirement. According to the terms of these awards, which provide for vesting upon retirement, these employees and directors have no risk of forfeiture. These shares will be issued at the original contractual vesting and settlement dates. As of December 31, 2016,2018, there is no remaining unrecognized compensation cost related to stock options granted.
The following table summarizes certain information regarding the stock option awards under the 2014 Omnibus Plan and the Prior Plans in the aggregate for the year ended December 31, 2016:
| Weighted- | Weighted-Average | Aggregate | ||||||||||||||
| Average | Remaining | Intrinsic | ||||||||||||||
| Exercise | Contractual | Value | ||||||||||||||
| Shares | Price | (years) | ($000)* | |||||||||||||
| Outstanding at December 31, 2015 | 109,130 | $ | 16.14 | |||||||||||||
| Granted | - | - | ||||||||||||||
| Exercised | (103,530 | ) | 16.49 | |||||||||||||
| Forfeited | - | - | ||||||||||||||
| Outstanding at December 31, 2016 | 5,600 | $ | 9.61 | 2.0 | $ | 111 | ||||||||||
| Exercisable shares at December 31, 2016 | 5,600 | $ | 9.61 | 2.0 | $ | 111 | ||||||||||
* The intrinsic value of a stock option is the difference between the market value of the underlying stock and the exercise price of the option.
Cash proceeds, fair value received, tax benefits, and intrinsic value related to stock options exercised, and the weighted average grant date fair value for options granted, during the years ended December 31, 2016, 20152018, 2017 and 20142016 are provided in the following table:
| (In thousands) | 2016 | 2015 | 2014 | 2018 | 2017 | 2016 | ||||||||||||||||||
| Proceeds from stock options exercised | $ | 328 | $ | 145 | $ | 565 | $ | 6 | $ | - | $ | 328 | ||||||||||||
| Fair value of shares received upon exercise of stock options | 1,380 | 447 | 1,962 | 8 | 37 | 1,380 | ||||||||||||||||||
| Tax benefit related to stock options exercised | 185 | 99 | 88 | 1 | 39 | 185 | ||||||||||||||||||
| Intrinsic value of stock options exercised | 841 | 330 | 488 | 9 | 96 | 841 | ||||||||||||||||||
| Weighted average fair value on grant date | n/a | n/a | n/a | |||||||||||||||||||||
100
Phantom Stock Plan: The Company maintains a non-qualified phantom stock plan as a supplement to its profit sharing plan for officers who have achieved the designated level and completed one year of service. However, certain officers who have not reached the designated level but were already participants remain eligible to participate in the Plan. Awards are made under this plan on certain compensation not eligible for contributions made under the profit sharing plan, due to the terms of the profit sharing plan and the Internal Revenue Code.Code of 1986, as amended (the “Internal Revenue Code”). Employees receive awards under this plan proportionate to the amount they would have received under the profit sharing plan, but for limits imposed by the profit sharing plan and the Internal Revenue Code. The awards are made as cash awards, and then converted to common stock equivalents (phantom shares) at the then current fair value of the Company’s common stock. Dividends are credited to each employee’s account in the form of additional phantom shares each time the Company pays a dividend on its common stock. In the event of a change of control (as defined in this plan), an employee’s interest is converted to a fixed dollar amount and deemed to be invested in the same manner as histheir interest in the Bank’s non-qualified deferred compensation plan. Employees vest under this plan 20% per year for the first 5 years of employment and are 100% vested thereafter. Employees also become 100% vested upon a change of control. Employees receive their vested interest in this plan in the form of a cash lump sum payment or installments, as elected by the employee, after termination of employment. The Company adjusts its liability under this plan to the fair value of the shares at the end of each period.
The following table summarizes the Company’s Phantom Stock Plan at or for the year ended December 31, 2016:2018:
| Phantom Stock Plan | Shares | Fair Value | ||||||
| Outstanding at December 31, 2015 | 79,440 | $ | 21.64 | |||||
| Granted | 12,056 | 20.49 | ||||||
| Forfeited | - | - | ||||||
| Distributions | (2,157 | ) | 20.76 | |||||
| Outstanding at December 31, 2016 | 89,339 | $ | 29.39 | |||||
| Vested at December 31, 2016 | 89,164 | $ | 29.39 | |||||
| Phantom Stock Plan | Shares | Fair Value | ||||||
| Outstanding at December 31, 2017 | 89,180 | $ | 27.50 | |||||
| Granted | 10,673 | 26.94 | ||||||
| Distributions | (540 | ) | 22.66 | |||||
| Outstanding at December 31, 2018 | 99,313 | $ | 21.53 | |||||
| Vested at December 31, 2018 | 98,914 | $ | 21.53 | |||||
The Company recorded stock-based compensation (benefit) expense for the phantom stock plan of $0.7($0.5) million, $0.2($0.1) million and $17,000$0.7 million for the years ended December 31, 2016, 20152018, 2017 and 2014,2016, respectively. The total fair value of distributions from the phantom stock plan were $45,000, $12,000, $247,000 and $35,000$45,000 for the years ended December 31, 2016, 20152018, 2017 and 2014,2016, respectively.
12. Pension and Other Postretirement Benefit Plans
The amounts recognized in accumulated other comprehensive loss, on a pre-tax basis, consist of the following, as of December 31:
| Net Actuarial | Prior Service | |||||||||||||||||||||||||||||||||||||||||||||||||||||||||||||||||||||||
| loss (gain) | cost (credit) | Total | Net Actuarial Loss (Gain) | Prior Service Cost (Credit) | Total | |||||||||||||||||||||||||||||||||||||||||||||||||||||||||||||||||||
| 2016 | 2015 | 2014 | 2016 | 2015 | 2014 | 2016 | 2015 | 2014 | 2018 | 2017 | 2016 | 2018 | 2017 | 2016 | 2018 | 2017 | 2016 | |||||||||||||||||||||||||||||||||||||||||||||||||||||||
| (In thousands) | (In thousands) | |||||||||||||||||||||||||||||||||||||||||||||||||||||||||||||||||||||||
| Employee Retirement Plan | $ | 8,055 | $ | 8,589 | $ | 9,938 | $ | - | $ | - | $ | - | $ | 8,055 | $ | 8,589 | $ | 9,938 | $ | 3,238 | $ | 6,166 | $ | 8,055 | $ | - | $ | - | $ | - | $ | 3,238 | $ | 6,166 | $ | 8,055 | ||||||||||||||||||||||||||||||||||||
| Other Postretirement Benefit Plans | 636 | 1,296 | 2,130 | (453 | ) | (538 | ) | (623 | ) | 183 | 758 | 1,507 | 35 | 1,223 | 636 | (283 | ) | (368 | ) | (453 | ) | (248 | ) | 855 | 183 | |||||||||||||||||||||||||||||||||||||||||||||||
| Outside Directors Plan | (540 | ) | (562 | ) | (488 | ) | 52 | 91 | 131 | (488 | ) | (471 | ) | (357 | ) | (566 | ) | (472 | ) | (540 | ) | - | 12 | 52 | (566 | ) | (460 | ) | (488 | ) | ||||||||||||||||||||||||||||||||||||||||||
| Total | $ | 8,151 | $ | 9,323 | $ | 11,580 | $ | (401 | ) | $ | (447 | ) | $ | (492 | ) | $ | 7,750 | $ | 8,876 | $ | 11,088 | $ | 2,707 | $ | 6,917 | $ | 8,151 | $ | (283 | ) | $ | (356 | ) | $ | (401 | ) | $ | 2,424 | $ | 6,561 | $ | 7,750 | ||||||||||||||||||||||||||||||
Amounts in accumulated other comprehensive loss to be recognized as components of net periodic expense for these plans in 20172019 are as follows:
| Net Actuarial | Prior Service | |||||||||||||||||||||||
| loss (gain) | cost (credit) | Total | Net Actuarial Loss (Gain) | Prior Service Cost (Credit) | Expense (Benefit) | |||||||||||||||||||
| (In thousands) | (In thousands) | |||||||||||||||||||||||
| Employee Retirement Plan | $ | 697 | $ | - | $ | 697 | $ | 269 | $ | - | $ | 269 | ||||||||||||
| Other Postretirement Benefit Plans | - | (85 | ) | (85 | ) | - | (85 | ) | (85 | ) | ||||||||||||||
| Outside Directors Plan | (92 | ) | 40 | (52 | ) | (141 | ) | - | (141 | ) | ||||||||||||||
| Total | $ | 605 | $ | (45 | ) | $ | 560 | $ | 128 | $ | (85 | ) | $ | 43 | ||||||||||
101
Employee Retirement Plan:
The BankCompany has a funded noncontributory defined benefit retirement plan covering substantially all of its salaried employees who were hired before September 1, 2005 (the “Retirement Plan”). The benefits are based on years of service and the employee’s compensation during the three consecutive years out of the final ten years of service, which was completed prior to September 30, 2006, the date the Retirement Plan was frozen, that produces the highest average. The Bank’s funding policy is to contribute annually the amount recommended by the Retirement Plan’s actuary. The Bank’s Retirement Plan investshistorically invested in diversified equity and fixed-income funds, which are independently managed by a third party. In 2018, the Company repositioned its investments out of a mix of equity and fixed-income funds into 100% fixed-income funds. The Company did not make a contribution to the Retirement Plan during the years ended December 31, 2016, 20152018, 2017 and 2014.2016. The Company uses a December 31 measurement date for the Retirement Plan.
The following table sets forth, for the Retirement Plan, the change in benefit obligation and assets, and for the Company, the amounts recognized in the Consolidated Statements of Financial Condition at December 31:
| 2016 | 2015 | 2018 | 2017 | |||||||||||||
| (In thousands) | (In thousands) | |||||||||||||||
| Change in benefit obligation: | ||||||||||||||||
| Projected benefit obligation at beginning of year | $ | 22,764 | $ | 24,097 | $ | 23,605 | $ | 22,769 | ||||||||
| Interest cost | 902 | 889 | 781 | 864 | ||||||||||||
| Actuarial (gain) loss | 130 | (1,208 | ) | |||||||||||||
| Actuarial loss | (2,389 | ) | 962 | |||||||||||||
| Benefits paid | (1,027 | ) | (1,014 | ) | (1,653 | ) | (990 | ) | ||||||||
| Projected benefit obligation at end of year | 22,769 | 22,764 | 20,344 | 23,605 | ||||||||||||
| Change in plan assets: | ||||||||||||||||
| Market value of assets at beginning of year | 19,924 | 20,509 | 22,702 | 20,146 | ||||||||||||
| Actual return on plan assets | 1,249 | 429 | 1,370 | 3,546 | ||||||||||||
| Benefits paid | (1,027 | ) | (1,014 | ) | (1,653 | ) | (990 | ) | ||||||||
| Market value of plan assets at end of year | 20,146 | 19,924 | 22,419 | 22,702 | ||||||||||||
| Accrued pension liability included in other liabilities | $ | (2,623 | ) | $ | (2,840 | ) | ||||||||||
| Accrued pension asset/liability included in other assets (liabilities) | $ | 2,075 | $ | (903 | ) | |||||||||||
The accumulated benefit obligation for the Retirement Plan was $22.8 million at December 31, 2016 and 2015.
Assumptions used to determine the Retirement Plan’s benefit obligations are as follows at December 31:
| 2016 | 2015 | 2018 | 2017 | |||||||||
| Weighted average discount rate | 3.88 | % | 4.06 | % | 4.06% | 3.42% | ||||||
| Rate of increase in future compensation levels | n/a | n/a | n/a | n/a | ||||||||
The mortality assumptions for 20162018 were based on the RP-2014 Adjusted to 2006 Total Dataset with Scale MP-2016MP-2018 and the mortality assumptions for 20152017 were based on the RP-2014 Adjusted to 2006 Total Dataset with Scale MP-2015.MP-2017.
102
The components of the net pension expense for the Retirement Plan are as follows for the years ended December 31:
| 2016 | 2015 | 2014 | 2018 | 2017 | 2016 | |||||||||||||||||||
| (In thousands) | (In thousands) | |||||||||||||||||||||||
| Interest cost | $ | 902 | $ | 889 | $ | 891 | $ | 781 | $ | 864 | $ | 902 | ||||||||||||
| Amortization of unrecognized loss | 809 | 1,112 | 759 | 621 | 697 | 809 | ||||||||||||||||||
| Expected return on plan assets | (1,394 | ) | (1,400 | ) | (1,344 | ) | (1,452 | ) | (1,392 | ) | (1,394 | ) | ||||||||||||
| Net pension expense | 317 | 601 | 306 | |||||||||||||||||||||
| Net pension (benefit) expense | (50 | ) | 169 | 317 | ||||||||||||||||||||
| Current year actuarial (gain) loss | 275 | (237 | ) | 4,798 | (2,307 | ) | (1,192 | ) | 275 | |||||||||||||||
| Amortization of actuarial loss | (809 | ) | (1,112 | ) | (759 | ) | (621 | ) | (697 | ) | (809 | ) | ||||||||||||
| Total recognized in other comprehensive income | (534 | ) | (1,349 | ) | 4,039 | (2,928 | ) | (1,889 | ) | (534 | ) | |||||||||||||
| Total recognized in net pension cost (benefit) and other comprehensive income | $ | (217 | ) | $ | (748 | ) | $ | 4,345 | ||||||||||||||||
| Total recognized in net pension cost (benefit) and other comprehensive loss | $ | (2,978 | ) | $ | (1,720 | ) | $ | (217 | ) | |||||||||||||||
Assumptions used to develop periodic pension cost for the Retirement Plan for the years ended December 31:
| 2016 | 2015 | 2014 | 2018 | 2017 | 2016 | |||||||||||||
| Weighted average discount rate | 4.06 | % | 3.76 | % | 4.60 | % | 3.42% | 3.88% | 4.06% | |||||||||
| Rate of increase in future compensation levels | n/a | n/a | n/a | n/a | n/a | n/a | ||||||||||||
| Expected long-term rate of return on assets | 7.25 | % | 7.50 | % | 7.50 | % | 7.00% | 7.00% | 7.25% | |||||||||
The following benefit payments which reflect expected future service, are expected to be paid by the Retirement Plan:Plan for the years ending December 31:
| For the years ending December 31: | Future Benefit Payments | |||
| (In thousands) | ||||
| 2017 | $ | 1,190 | ||
| 2018 | 1,183 | |||
| 2019 | 1,197 | |||
| 2020 | 1,197 | |||
| 2021 | 1,239 | |||
| 2022 – 2026 | 6,561 | |||
| Future Benefit Payments | ||||
| (In thousands) | ||||
| 2019 | $ | 1,300 | ||
| 2020 | 1,133 | |||
| 2021 | 1,177 | |||
| 2022 | 1,205 | |||
| 2023 | 1,228 | |||
| 2024 – 2028 | 6,033 | |||
The long-term rate-of-return-on-assetsrate of return on assets assumption was set based on historical returns earned by equities and fixed income securities, adjusted to reflect expectations of future returns as applied to the plan's target allocation of asset classes. Equities and fixed income securities were assumed to earn real rates of return in the ranges of 8-10% and 3-5%, respectively. When these overall return expectations are applied to the plans target allocation, the result is an expected rate return of 7.00%5.25% for 2017.2018.
The Retirement Plan’s weighted average asset allocations at December 31, by asset category were:at December 31:
| 2016 | 2015 | 2018 | 2017 | |||||||||||||
| Equity securities | 69 | % | 70 | % | 0 | % | 72 | % | ||||||||
| Debt securities | 31 | % | 30 | % | 100 | % | 28 | % | ||||||||
At December 31, 2018, Plan assets are invested in a diversified mix of stock and bond investment funds on the pooled account, group annuity platform of Prudential Retirement Services. Each fund has its own investment objectives, investment strategies and risks as detailed in its prospectus.fixed income funds.
103
The long-term investment objectives are to maintain plan assets at a level that will sufficiently cover long-term obligations and to generate a return on plan assets that will meet or exceed the rate at which long-term obligations will grow. AHistorically, a combination of equity and fixed income portfolios arewere used to help achieve these objectives based on a long-term, liability based strategic mix of 60% equities and 40% fixed income. In 2018 the strategic mix was changed to 100% fixed income in order to remove market volatility and lock in gains. Adjustments to this mix are made periodically based on current capital market conditions and plan funding levels. Performance of the investment fund managers is monitored on an ongoing basis using modern portfolio risk analysis and appropriate index benchmarks.
The BankCompany does not expect to make a contribution to the Retirement Plan in 2017.2019.
The following table sets forth the Retirement Plan’s assets at the periods indicated:
| At December 31, | ||||||||
| 2018 | 2017 | |||||||
| (In thousands) | ||||||||
| Pooled Separate Accounts | ||||||||
| Long duration bond fund (a) | $ | 10,045 | $ | - | ||||
| Long corporate bond fund (b) | 4,471 | - | ||||||
| Prudential short term (c) | 360 | 77 | ||||||
| U.S. large-cap growth (d) | - | 5,822 | ||||||
| U.S. large-cap value (e) | - | 5,164 | ||||||
| U.S. small-cap blend (f) | - | 2,735 | ||||||
| International blend (g) | - | 2,566 | ||||||
| Bond fund (h) | - | 6,338 | ||||||
| Mutual Fund | ||||||||
| Investment grade bond fund (i) | 7,543 | - | ||||||
| Total | $ | 22,419 | $ | 22,702 | ||||
| a. | Comprised of fixed income securities with durations of longer than six years that seek to maximize total return consistent with the preservation of capital and prudent investment management. |
| b. | Comprised of corporate bonds with an average duration within 0.25 years of the benchmark and its average credit quality is no lower than BBB. The fund seeks to outperform the Bloomberg Barclays Long Corporate Bond Index. |
| c. | Comprised of money market instruments with an emphasis on safety and liquidity. |
| d. | Comprised of large-cap stocks seeking to outperform, over the long term, the Russell 1000 Growth Index. The portfolio will typically hold between 55 and 70 stocks. |
| e. | Comprised of large-cap stocks seeking to outperform the Russell 1000 Value benchmark over the rolling three and five year periods, or a full market cycle, whichever is longer. |
| f. | Comprised of stocks with market capitalization of between $100 million and the market capitalization of the largest stock in the Russell 2000 index at the time of purchase. The portfolio will typically hold between 40 and 100 stocks. |
| g. | Comprised of non-U.S. domiciled stocks. The portfolio will typically hold between 80 and 90 stocks. |
| h. | Comprised of a portfolio of fixed income securities including U.S agency mortgage-backed securities, corporate bonds, U.S. government bonds and high yield bonds. |
| i. | Comprised of high quality corporate bonds diversified broadly across industries, issuers and regions. The funds primary benchmark is the Bloomberg Barclays U.S. Credit Index. |
The fair value of the mutual fund is determined daily using quoted market prices in an open market (level 1). The fair value of the pooled separate accounts is determined by the investment manager and is based on the value of the underlying assets held at December 31, 20162018 and 2015.2017. These are measured at net asset value under the practical expedient with future redemption dates.
The fair values of the Plan’s investments in pooled separate accounts are calculated each business day. All investments can be redeemed on a daily basis without restriction. The investments in pooled separate accounts, which are valued at net asset value, have not been classified in the fair value hierarchy in accordance with Accounting Standards UpdateASU No. 2015-07.
The following table sets forth the Retirement Plan’s assets at the periods indicated:2015-07 “Disclosures for Investments in Certain Entities That Calculate Net Asset Value per Share (or Its Equivalent)”.
| At December 31, | ||||||||
| 2016 | 2015 | |||||||
| (In thousands) | ||||||||
| Pooled Separate Accounts | ||||||||
| U.S. large-cap growth (a) | $ | 4,702 | $ | 5,114 | ||||
| U.S. large-cap value (b) | 4,789 | 4,619 | ||||||
| U.S. small-cap blend (c) | 2,362 | 2,094 | ||||||
| International blend (d) | 2,017 | 2,079 | ||||||
| Bond fund (e) | 5,950 | 5,671 | ||||||
| Prudential short term (f) | 326 | 347 | ||||||
| Total | $ | 20,146 | $ | 19,924 | ||||
104
Other Postretirement Benefit Plans:
The Company sponsors two unfunded postretirement benefit plans (the “Postretirement Plans”) that cover all retirees hired prior to January 1, 2011, who were full-time permanent employees with at least five years of service, and their spouses. Effective January 1, 2011, the Postretirement Plans are no longer available for new hires. One plan provides medical benefits through a 50% cost sharing arrangement. Effective January 1, 2000, the spouses of future retirees were required to pay 100% of the premiums for their coverage. The other plan provides life insurance benefits and is noncontributory. Effective January 1, 2010, life insurance benefits are not available for future retirees. Under these programs, eligible retirees receive lifetime medical and life insurance coverage for themselves and lifetime medical coverage for their spouses. The Company reserves the right to amend or terminate these plans at its discretion.
Comprehensive medical plan benefits equal the lesser of the normal plan benefit or the total amount not paid by Medicare. Life insurance benefits for retirees are based on annual compensation and age at retirement. As of December 31, 2016,2018, the Company has not funded these plans. The Company used a December 31 measurement date for these plans.
The following table sets forth, for the Postretirement Plans, the change in benefit obligation and assets, and for the Company, the amounts recognized in the Consolidated Statements of Financial Condition at December 31:
| 2016 | 2015 | 2018 | 2017 | |||||||||||||
| (In thousands) | (In thousands) | |||||||||||||||
| Change in benefit obligation: | ||||||||||||||||
| Projected benefit obligation at beginning of year | $ | 7,977 | $ | 8,073 | $ | 9,104 | $ | 7,978 | ||||||||
| Service cost | 359 | 382 | 350 | 316 | ||||||||||||
| Interest cost | 320 | 300 | 307 | 305 | ||||||||||||
| Actuarial gain | (613 | ) | (715 | ) | ||||||||||||
| Actuarial (gain) loss | (1,155 | ) | 588 | |||||||||||||
| Benefits paid | (65 | ) | (63 | ) | (88 | ) | (83 | ) | ||||||||
| Projected benefit obligation at end of year | 7,978 | 7,977 | 8,518 | 9,104 | ||||||||||||
| Change in plan assets: | ||||||||||||||||
| Market value of assets at beginning of year | - | - | - | - | ||||||||||||
| Employer contributions | 65 | 63 | 88 | 83 | ||||||||||||
| Benefits paid | (65 | ) | (63 | ) | (88 | ) | (83 | ) | ||||||||
| Market value of plan assets at end of year | - | - | - | - | ||||||||||||
| Accrued pension cost included in other liabilities | $ | (7,978 | ) | $ | (7,977 | ) | $ | (8,518 | ) | $ | (9,104 | ) | ||||
The accumulated benefit obligation for the Postretirement Plans was $8.0 million at December 31, 2016 and 2015.
Assumptions used in determining the actuarial present value of the accumulated postretirement benefit obligations at December 31 are as follows:
| 2016 | 2015 | 2018 | 2017 | |||||||||
| Discount rate | 3.88 | % | 4.06 | % | 4.06% | 3.42% | ||||||
| Rate of increase in health care costs | ||||||||||||
| Initial | 8.00 | % | 7.00 | % | 7.00% | 7.00% | ||||||
| Ultimate (year 2018) | 5.00 | % | 5.00 | % | ||||||||
| Ultimate (year 2023) | 5.00% | 5.00% | ||||||||||
| Annual rate of salary increase for life insurance | n/a | n/a | n/a | n/a | ||||||||
The mortality assumptions for 20162018 were based on the RP-2014 Adjusted to 2006 White Collar Mortality Table with Scale MP-2016MP-2018 and the mortality assumptions for 20152017 were based on the RP-2014 Adjusted to 2006 White Collar Mortality Table with Scale MP-2015.
MP-2017.
| 105 |
The resulting net periodic postretirement expense consisted of the following components for the years ended December 31:
| 2016 | 2015 | 2014 | 2018 | 2017 | 2016 | |||||||||||||||||||
| (In thousands) | (In thousands) | |||||||||||||||||||||||
| Service cost | $ | 359 | $ | 382 | $ | 358 | $ | 350 | $ | 316 | $ | 359 | ||||||||||||
| Interest cost | 320 | 300 | 253 | 307 | 305 | 320 | ||||||||||||||||||
| Amortization of unrecognized loss | 47 | 119 | - | 33 | - | 47 | ||||||||||||||||||
| Amortization of past service credit | (85 | ) | (85 | ) | (85 | ) | (85 | ) | (85 | ) | (85 | ) | ||||||||||||
| Net postretirement benefit expense | 641 | 716 | 526 | 605 | 536 | 641 | ||||||||||||||||||
| Current year actuarial (gain) loss | (613 | ) | (715 | ) | 1,925 | (1,155 | ) | 587 | (613 | ) | ||||||||||||||
| Amortization of actuarial loss | (47 | ) | (119 | ) | - | (33 | ) | - | (47 | ) | ||||||||||||||
| Amortization of prior service credit | 85 | 85 | 85 | 85 | 85 | 85 | ||||||||||||||||||
| Total recognized in other comprehensive income | (575 | ) | (749 | ) | 2,010 | (1,103 | ) | 672 | (575 | ) | ||||||||||||||
| Total recognized in net postretirement expense and other comprehensive income | $ | 66 | $ | (33 | ) | $ | 2,536 | |||||||||||||||||
| Total recognized in net postretirement expense and other comprehensive loss | $ | (498 | ) | $ | 1,208 | $ | 66 | |||||||||||||||||
Assumptions used to develop periodic postretirement expense for the Postretirement Plans for the years ended December 31 were:31:
| 2016 | 2015 | 2014 | 2018 | 2017 | 2016 | |||||||||||||
| Rate of return on plan assets | n/a | n/a | n/a | n/a | n/a | n/a | ||||||||||||
| Discount rate | 4.06 | % | 3.76 | % | 4.60 | % | 3.42% | 3.88% | 4.06% | |||||||||
| Rate of increase in health care costs | ||||||||||||||||||
| Initial | 7.00 | % | 8.00 | % | 9.00 | % | 7.00% | 8.00% | 7.00% | |||||||||
| Ultimate (year 2018) | 5.00 | % | 5.00 | % | 5.00 | % | ||||||||||||
| Ultimate (year 2023) | 5.00% | 5.00% | 5.00% | |||||||||||||||
| Annual rate of salary increase for life insurance | n/a | n/a | n/a | n/a | n/a | n/a | ||||||||||||
The health care cost trend rate assumptions have a significant effect on the amounts reported. A one percentage point change in assumed health care trend rates would have the following effects:
| Increase | Decrease | Increase | Decrease | |||||||||||||
| (In thousands) | (In thousands) | |||||||||||||||
| Effect on postretirement benefit obligation | $ | 1,614 | $ | (1,230 | ) | $ | 1,652 | $ | (1,277 | ) | ||||||
| Effect on total service and interest cost | 159 | (118 | ) | 147 | (111 | ) | ||||||||||
The Company expects to pay benefits of $0.2 million under its Postretirement Plans in 2017.
The following benefit payments under the Postretirement Plan, which reflect expected future service, are expected to be paid:paid for the years ending December 31:
| For the years ending December 31: | Future Benefit Payments | |||
| (In thousands) | ||||
| 2017 | $ | 215 | ||
| 2018 | 248 | |||
| 2019 | 268 | |||
| 2020 | 265 | |||
| 2021 | 274 | |||
| 2022 – 2026 | 1,519 | |||
| Future Benefit Payments | ||||
| (In thousands) | ||||
| 2019 | $ | 260 | ||
| 2020 | 266 | |||
| 2021 | 286 | |||
| 2022 | 319 | |||
| 2023 | 326 | |||
| 2024 – 2028 | 1,755 | |||
106
Defined Contribution Plans:
The CompanyBank maintains a tax qualified 401(k) plan which covers substantially all salaried employees who have completed one year of service. Currently, annual matching contributions under the Bank’s 401(k) plan equal 50% of the employee’s contributions, up to a maximum of 3% of the employee’s base salary. In addition, the 401(k) plan includes the Defined Contribution Retirement Plan (“DCRP”), under which the Bank contributes an amount equal to 4% of an employee’s eligible compensation as defined in the plan, and the Profit Sharing Plan (“PSP”), under which at the discretion of the Company’s Board of Directors a contribution is made. Contributions for the DCRP and PSP are made in the form of Company common stock at or after the end of each year. Annual contributions under these plans are subject to the limits imposed under the Internal Revenue Code. Contributions by the Company into the 401(k) plan vest 20% per year over the employee's first five years of service. Contributions to these plans are 100% vested upon a change of control (as defined in the applicable plan). Compensation expense recorded by the Company for these plans amounted to $3.3$4.1 million, $3.0$3.4 million and $3.1$3.3 million for the years ended December 31, 2016, 20152018, 2017 and 2014,2016, respectively.
The Bank provides a non-qualified deferred compensation plan as an incentive for officers who have achieved the designated level and completed one year of service. However, certain officers who have not reached the designated level but were already participants remain eligible to participate in the Plan. In addition to the amounts deferred by the officers, the Bank matches 50% of their contributions, generally up to a maximum of 5% of the officers’ base salary. Matching contributions under this plan vest 20% per year for five years. The non-qualified deferred compensation plan assets are held in a rabbi trust totaling $10.4$11.4 million and $10.6$11.5 million at December 31, 20162018 and 2015,2017, respectively. Contributions become 100% vested upon a change of control (as defined in the plan). Compensation expense recorded by the Company for this plan amounted to $0.5 million, $0.4 million and $0.4 million for each of the years ended December 31, 2018, 2017 and 2016, 2015 and 2014.respectively.
Employee Benefit Trust:
An Employee Benefit Trust (“EBT”) has been established to assist the Company in funding its benefit plan obligations. In connection with the Bank’s conversion to a federal stock savings bank in 1995, the EBT borrowed $7.9 million from the Company and used $7,000 of cash received from the Bank to purchase 2,328,750 shares of the common stock of the Company. The loan was repaid from the Company’s discretionary contributions to the EBT and dividend payments received on common stock held by the EBT. During the year ended December 31, 2010, the loan was fully repaid. Dividend payments received subsequent 2010 are used to purchase additional shares of common stock. Shares released are used solely for funding matching contributions under the Bank’s 401(k) plan, contributions to the 401(k) plan for the DCRP, and contributions to the PSP. For the years ended December 31, 2016, 20152018, 2017 and 2014,2016, the Company funded $2.8$3.6 million, $2.8$3.2 million and $2.7$2.8 million, respectively, of employer contributions to the 401(k), DCRP and profit sharing plans from the EBT.
Upon a change of control (as defined in the EBT), the EBT will terminate and any trust assets remaining after certain benefit plan contributions will be distributed to all full-time employees of the Company with at least one year of service, in proportion to their compensation over the four most recently completed calendar years plus the portion of the current year prior to the termination of the EBT.
As shares are released from the suspense account, the Company reports compensation expense equal to the current market price of the shares, and the shares become outstanding for earnings per share computations.
The EBT shares are as follows at December 31:
| 2016 | 2015 | 2018 | 2017 | |||||||||||||
| Shares owned by Employee Benefit Trust, beginning balance | 675,436 | 800,950 | 445,022 | 551,762 | ||||||||||||
| Shares purchased | 18,391 | 22,102 | 13,669 | 11,631 | ||||||||||||
| Shares released and allocated | (142,065 | ) | (147,616 | ) | (129,601 | ) | (118,371 | ) | ||||||||
| Shares owned by Employee Benefit Trust, ending balance | 551,762 | 675,436 | 329,090 | 445,022 | ||||||||||||
| Market value of unallocated shares. | $ | 16,216,285 | $ | 14,616,435 | ||||||||||||
| Market value of unallocated shares | $ | 7,085,308 | $ | 12,238,105 | ||||||||||||
Outside Director Retirement Plan:
The Bank has an unfunded noncontributory defined benefit Outside Director Retirement Plan (the “Directors’ Plan”), which provides benefits to each non-employee director who became a non-employee director before January 1, 2004, who has at least five years of service as a non-employee director and whose years of service as a non-employee director plus age equals or exceeds 55. Any person who became a non-employee director after January 1, 2004 is not eligible to participate in the Directors’ Plan.2004. Upon termination an eligible director will be paid an annual retirement benefit equal to $48,000. Such benefit will be paid in equal monthly installments for 120 months. In the event of a termination of Board service due to a change of control, a eligible non-employee director will receive a cash lump sum payment equal to 120 months of benefit. In the event of the director’s death, the surviving spouse will receive the equivalent benefit. No benefits will be payable to a director who is removed for cause. The Holding Company has guaranteed the payment of benefits under the Directors’ Plan, for this reason the Bank has assets held in a rabbi trust totaling $4.2$4.8 million and $4.4 million at December 31, 20162018 and 2015. Upon adopting the Directors’ Plan, the Bank elected to immediately recognize the effect of adopting the Directors’ Plan. Subsequent plan amendments are amortized as a past service liability.2017, respectively. The Bank uses a December 31 measurement date for the Directors’ Plan.
107
The following table sets forth, for the Directors’ Plan, the change in benefit obligation and assets, and for the Company, the amounts recognized in the Consolidated Statements of Financial Condition at December 31:
| 2016 | 2015 | 2018 | 2017 | |||||||||||||
| (In thousands) | (In thousands) | |||||||||||||||
| Change in benefit obligation: | ||||||||||||||||
| Projected benefit obligation at beginning of year | $ | 2,530 | $ | 2,663 | $ | 2,425 | $ | 2,462 | ||||||||
| Service cost | 42 | 45 | 42 | 42 | ||||||||||||
| Interest cost | 97 | 95 | 78 | 89 | ||||||||||||
| Actuarial gain | (63 | ) | (129 | ) | (184 | ) | (24 | ) | ||||||||
| Benefits paid | (144 | ) | (144 | ) | (96 | ) | (144 | ) | ||||||||
| Projected benefit obligation at end of year | 2,462 | 2,530 | 2,265 | 2,425 | ||||||||||||
| Change in plan assets: | ||||||||||||||||
| Market value of assets at beginning of year | - | - | - | - | ||||||||||||
| Employer contributions | 144 | 144 | 96 | 144 | ||||||||||||
| Benefits paid | (144 | ) | (144 | ) | (96 | ) | (144 | ) | ||||||||
| Market value of plan assets at end of year | - | - | - | - | ||||||||||||
| Accrued pension cost included in other liabilities | $ | (2,462 | ) | $ | (2,530 | ) | $ | (2,265 | ) | $ | (2,425 | ) | ||||
The accumulated benefit obligation for the Directors’ Plan was $2.5 million at December 31, 2016 and 2015, respectively.
The components of the net pension expense for the Directors’ Plan are as follows for the years ended December 31:
| 2016 | 2015 | 2014 | 2018 | 2017 | 2016 | |||||||||||||||||||
| (In thousands) | (In thousands) | |||||||||||||||||||||||
| Service cost | $ | 42 | $ | 45 | $ | 54 | $ | 42 | $ | 42 | $ | 42 | ||||||||||||
| Interest cost | 97 | 95 | 116 | 78 | 89 | 97 | ||||||||||||||||||
| Amortization of unrecognized gain | (86 | ) | (56 | ) | (60 | ) | (91 | ) | (92 | ) | (86 | ) | ||||||||||||
| Amortization of past service liability | 40 | 40 | 40 | 12 | 40 | 40 | ||||||||||||||||||
| Net pension expense | 93 | 124 | 150 | 41 | 79 | 93 | ||||||||||||||||||
| Current actuarial gain | (63 | ) | (130 | ) | (52 | ) | (184 | ) | (24 | ) | (63 | ) | ||||||||||||
| Amortization of actuarial gain | 86 | 56 | 60 | 91 | 92 | 86 | ||||||||||||||||||
| Amortization of prior service cost | (40 | ) | (40 | ) | (40 | ) | (12 | ) | (40 | ) | (40 | ) | ||||||||||||
| Total recognized in other comprehensive income | (17 | ) | (114 | ) | (32 | ) | (105 | ) | 28 | (17 | ) | |||||||||||||
| Total recognized in net pension expense and other comprehensive income | $ | 76 | $ | 10 | $ | 118 | $ | (64 | ) | $ | 107 | $ | 76 | |||||||||||
Assumptions used to determine benefit obligations and periodic pension expense for the Directors’ Plan for the years ended December 31:
| 2016 | 2015 | 2014 | 2018 | 2017 | 2016 | |||||||||||||
| Weighted average discount rate for the benefit obligation | 3.88 | % | 4.06 | % | 3.76 | % | 4.06% | 3.42% | 3.88% | |||||||||
| Weighted average discount rate for periodic pension benefit expense | 4.06 | % | 3.76 | % | 4.60 | % | 3.42% | 3.88% | 4.06% | |||||||||
| Rate of increase in future compensation levels | n/a | n/a | n/a | n/a | n/a | n/a | ||||||||||||
108
The following benefit payments under the Directors’ Plan, which reflect expected future service, are expected to be paid:paid for the years ending December 31:
| For the years ending December 31: | Future Benefit Payments | |||
| (In thousands) | ||||
| 2017 | $ | 288 | ||
| 2018 | 272 | |||
| 2019 | 288 | |||
| 2020 | 288 | |||
| 2021 | 288 | |||
| 2022 – 2026 | 1,148 | |||
| Future Benefit Payments | ||||
| (In thousands) | ||||
| 2019 | $ | 288 | ||
| 2020 | 288 | |||
| 2021 | 288 | |||
| 2022 | 288 | |||
| 2023 | 256 | |||
| 2024 – 2028 | 988 | |||
The Company expects to make payments of $0.3 million under its Directors’ Plan in 2017.2019.
13. Stockholders’ Equity
Dividend Restrictions on the Bank:
In connection with the Bank’s conversion from mutual to stock form in November 1995, a special liquidation account was established at the time of conversion, in accordance with the requirements of its primary regulator, which was equal to its capital as of June 30, 1995. The liquidation account is reduced as and to the extent that eligible account holders have reduced their qualifying deposits. Subsequent increases in deposits do not restore an eligible account holder’s interest in the liquidation account. In the event of a complete liquidation of the Bank, each eligible account holder will be entitled to receive a distribution from the liquidation account in an amount proportionate to the current adjusted qualifying balances for accounts then held. As of December 31, 2016,2018 and 2017, the Bank’s liquidation account was $0.7$0.5 million and $0.6 million, respectively, and was presented within retained earnings.
In addition to the restriction described above, New York State and Federal banking regulations place certain restrictions on dividends paid by the Bank to the Holding Company. The total amount of dividends which may be paid at any date is generally limited to the net income of the Bank for the current year and prior two years, less any dividends previously paid from those earnings. As of December 31, 2016,2018, the Bank had $91.2$97.0 million in retained earnings available to distribute to the Holding Company in the form of cash dividends.
In addition, dividends paid by the Bank to the Holding Company would be prohibited if the effect thereof would cause the Bank’s capital to be reduced below applicable minimum capital requirements.
As a bank holding company, the Holding Company is subject to similar dividend restrictions.
Treasury Stock Transactions:
The Holding Company repurchased 403,695787,069 common shares at an average cost of $19.89$25.97 and 735,599241,625 common shares at an average cost of $19.51$27.59 during the years ended December 31, 20162018 and 2015,2017, respectively. At December 31, 2016, 495,9052018, 467,211 shares remainremained subject to be repurchasedrepurchase under the currentauthorized stock repurchase program. Stock will be purchased under the currentauthorized stock repurchase program from time to time, in the open market or through private transactions, subject to market conditions and at the discretion of the management of the Company. There is no expiration or maximum dollar amount under this authorization.
109
Accumulated Other Comprehensive Loss:
The following are changes in accumulated other comprehensive loss by component, net of tax, for the years ended December 31, 2016, 2015 and 2014:ended:
| Unrealized Gains (Losses) on Available for Sale Securities | Unrealized Gains (Losses) on Cash flow Hedges | Defined Benefit Pension Items | Fair Value Option Elected on Liabilities | Total | ||||||||||||||||
| December 31, 2018 | (In thousands) | |||||||||||||||||||
| Beginning balance, net of tax | $ | (5,522 | ) | $ | 231 | $ | (3,695 | ) | $ | - | $ | (8,986 | ) | |||||||
| Reclassification of the Income Tax Effects of the Tax Cuts and Jobs Act from AOCL to Retained Earnings | (1,325 | ) | 50 | (798 | ) | - | (2,073 | ) | ||||||||||||
| Impact of adoption of Accounting Standard Update 2016-01 | - | - | - | 779 | 779 | |||||||||||||||
| Other comprehensive income before reclassifications, net of tax | (10,127 | ) | 3,351 | 2,484 | 87 | (4,205 | ) | |||||||||||||
| Amounts reclassified from accumulated other comprehensive income (loss), net of tax | 1,325 | 72 | 336 | - | 1,733 | |||||||||||||||
| Net current period other comprehensive income, net of tax | (8,802 | ) | 3,423 | 2,820 | 87 | (2,472 | ) | |||||||||||||
| Ending balance, net of tax | $ | (15,649 | ) | $ | 3,704 | $ | (1,673 | ) | $ | 866 | $ | (12,752 | ) | |||||||
| December 31, 2017 | Unrealized Gains (Losses) on Available for Sale Securities | Unrealized Gains (Losses) on Cash flow Hedges | Defined Benefit Pension Items | Total | ||||||||||||
| (In thousands) | ||||||||||||||||
| Beginning balance, net of tax | $ | (3,859 | ) | $ | - | $ | (4,503 | ) | $ | (8,362 | ) | |||||
| Other comprehensive income (loss) before reclassifications, net of tax | (1,771 | ) | 105 | 485 | (1,181 | ) | ||||||||||
| Amounts reclassified from accumulated other comprehensive income (loss), net of tax | 108 | 126 | 323 | 557 | ||||||||||||
| Net current period other comprehensive income (loss), net of tax | (1,663 | ) | 231 | 808 | (624 | ) | ||||||||||
| Ending balance, net of tax | $ | (5,522 | ) | $ | 231 | $ | (3,695 | ) | $ | (8,986 | ) | |||||
| December 31, 2016 | Unrealized Gains (Losses) on Available for Sale Securities | Defined Benefit Pension Items | Total | |||||||||
| (In thousands) | ||||||||||||
| Beginning balance, net of tax | $ | (521 | ) | $ | (5,041 | ) | $ | (5,562 | ) | |||
| Other comprehensive income (loss) before reclassifications, net of tax | (2,452 | ) | 235 | (2,217 | ) | |||||||
| Amounts reclassified from accumulated other comprehensive income (loss), net of tax | (886 | ) | 303 | (583 | ) | |||||||
| Net current period other comprehensive income (loss), net of tax | (3,338 | ) | 538 | (2,800 | ) | |||||||
| Ending balance, net of tax | $ | (3,859 | ) | $ | (4,503 | ) | $ | (8,362 | ) | |||
| Unrealized Gains | ||||||||||||
| (Losses) on | ||||||||||||
| Available for Sale | Defined Benefit | |||||||||||
| December 31, 2016 | Securities | Pension Items | Total | |||||||||
| (In thousands) | ||||||||||||
| Beginning balance, net of tax | $ | (521 | ) | $ | (5,041 | ) | $ | (5,562 | ) | |||
| Other comprehensive income (loss) before reclassifications, net of tax | (2,452 | ) | 235 | (2,217 | ) | |||||||
| Amounts reclassified from accumulated other comprehensive income (loss), net of tax | (886 | ) | 303 | (583 | ) | |||||||
| Net current period other comprehensive income (loss), net of tax | (3,338 | ) | 538 | (2,800 | ) | |||||||
| Ending balance, net of tax | $ | (3,859 | ) | $ | (4,503 | ) | $ | (8,362 | ) | |||
110
| Unrealized Gains | ||||||||||||
| (Losses) on | ||||||||||||
| Available for Sale | Defined Benefit | |||||||||||
| December 31, 2015 | Securities | Pension Items | Total | |||||||||
| (In thousands) | ||||||||||||
| Beginning balance, net of tax | $ | 3,392 | $ | (6,299 | ) | $ | (2,907 | ) | ||||
| Other comprehensive income (loss) before reclassifications, net of tax | (3,818 | ) | 615 | (3,203 | ) | |||||||
| Amounts reclassified from accumulated other comprehensive income (loss), net of tax | (95 | ) | 643 | 548 | ||||||||
| Net current period other comprehensive income (loss), net of tax | (3,913 | ) | 1,258 | (2,655 | ) | |||||||
| Ending balance, net of tax | $ | (521 | ) | $ | (5,041 | ) | $ | (5,562 | ) | |||
| Unrealized Gains | ||||||||||||
| (Losses) on | ||||||||||||
| Available for Sale | Defined Benefit | |||||||||||
| December 31, 2014 | Securities | Pension Items | Total | |||||||||
| (In thousands) | ||||||||||||
| Beginning balance, net of tax | $ | (8,522 | ) | $ | (2,853 | ) | $ | (11,375 | ) | |||
| Other comprehensive income (loss) before reclassifications, net of tax | 13,548 | (3,790 | ) | 9,758 | ||||||||
| Amounts reclassified from accumulated other comprehensive income (loss), net of tax | (1,634 | ) | 344 | (1,290 | ) | |||||||
| Net current period other comprehensive income (loss), net of tax | 11,914 | (3,446 | ) | 8,468 | ||||||||
| Ending balance, net of tax | $ | 3,392 | $ | (6,299 | ) | $ | (2,907 | ) | ||||
The following tables set forth significant amounts reclassified out of accumulated other comprehensive loss by component for the periods indicated:
| For the year ended December 31, 2016 | ||||||||
| Amounts Reclassified from | ||||||||
| Details about Accumulated Other | Accumulated Other | Affected Line Item in the Statement | ||||||
| Comprehensive Income Components | Comprehensive Income | Where Net Income is Presented | ||||||
| (Dollars in thousands) | ||||||||
| Unrealized gains (losses) on available | ||||||||
| for sale securities: | $ | 1,524 | Net gain on sale of securities | |||||
| (638 | ) | Tax expense | ||||||
| $ | 886 | Net of tax | ||||||
| Amortization of defined benefit pension items: | ||||||||
| Actuarial losses | $ | (568 | )(1) | Other operating expenses | ||||
| Prior service credits | 45 | (1) | Other operating expenses | |||||
| (523 | ) | Total before tax | ||||||
| 220 | Tax benefit | |||||||
| $ | (303 | ) | Net of tax | |||||
| For the year ended December 31, 2018 | ||||||
| Details about Accumulated Other Comprehensive Income Components | Amounts Reclassified from Accumulated Other Comprehensive Income | Affected Line Item in the Statement Where Net Income is Presented | ||||
| (Dollars in thousands) | ||||||
| Unrealized gains (losses) on available for sale securities: | $ | (1,920 | ) | Net loss on sale of securities | ||
| 595 | Tax expense | |||||
| $ | (1,325 | ) | Net of tax | |||
| Cash flow hedges: | ||||||
| Interest rate swaps | $ | (104 | ) | Interest expense | ||
| 32 | Tax expense | |||||
| $ | (72 | ) | Net of tax | |||
| Amortization of defined benefit pension items: | ||||||
| Actuarial losses | $ | (530 | )(1) | Other operating expenses | ||
| Prior service credits | 39 | (1) | Other operating expenses | |||
| (491 | ) | Total before tax | ||||
| 155 | Tax expense | |||||
| $ | (336 | ) | Net of tax | |||
(1) These accumulated other comprehensive loss components are included in the computation of net periodic pension cost (see Note 12 of the Notes to Consolidated Financial Statements “Pension and Other Postretirement Benefit Plans”).
| For the year ended December 31, 2017 | ||||||
Details about Accumulated Other Comprehensive Income Components | Amounts Reclassified from Accumulated Other Comprehensive Income | Affected Line Item in the Statement Where Net Income is Presented | ||||
| (Dollars in thousands) | ||||||
| Unrealized gains (losses) on available for sale securities: | $ | (186 | ) | Net loss on sale of securities | ||
| 78 | Tax expense | |||||
| $ | (108 | ) | Net of tax | |||
| Cash flow hedges: | ||||||
| Interest rate swaps | $ | (184 | ) | Interest expense | ||
| 58 | Tax expense | |||||
| $ | (126 | ) | Net of tax | |||
| Amortization of defined benefit pension items: | ||||||
| Actuarial losses | $ | (605 | )(1) | Other operating expenses | ||
| Prior service credits | 45 | (1) | Other operating expenses | |||
| (560 | ) | Total before tax | ||||
| 237 | Tax expense | |||||
| $ | (323 | ) | Net of tax | |||
(1) These accumulated other comprehensive loss components are included in the computation of net periodic pension cost (see Note 12 of the Notes to Consolidated Financial Statements “Pension and Other Postretirement Benefit Plans”).
| For the year ended December 31, 2015 | ||||||||
| Amounts Reclassified from | ||||||||
| Details about Accumulated Other | Accumulated Other | Affected Line Item in the Statement | ||||||
| Comprehensive Income Components | Comprehensive Income | Where Net Income is Presented | ||||||
| (Dollars in thousands) | ||||||||
| Unrealized gains (losses) on available | ||||||||
| for sale securities: | $ | 167 | Net gain on sale of securities | |||||
| (72 | ) | Tax expense | ||||||
| $ | 95 | Net of tax | ||||||
| Amortization of defined benefit pension items: | ||||||||
| Actuarial losses | $ | (1,178 | )(1) | Other operating expenses | ||||
| Prior service credits | 46 | (1) | Other operating expenses | |||||
| (1,132 | ) | Total before tax | ||||||
| 489 | Tax benefit | |||||||
| $ | (643 | ) | Net of tax | |||||
| For the year ended December 31, 2016 | ||||||
| Details about Accumulated Other Comprehensive Income Components | Amounts Reclassified from Accumulated Other Comprehensive Income | Affected Line Item in the Statement Where Net Income is Presented | ||||
| (Dollars in thousands) | ||||||
| Unrealized gains (losses) on available for sale securities: | $ | 1,524 | Net gain on sale of securities | |||
| (638 | ) | Tax expense | ||||
| $ | 886 | Net of tax | ||||
| Amortization of defined benefit pension items: | ||||||
| Actuarial losses | $ | (568 | )(1) | Other operating expenses | ||
| Prior service credits | 45 | (1) | Other operating expenses | |||
| (523 | ) | Total before tax | ||||
| 220 | Tax benefit | |||||
| $ | (303 | ) | Net of tax | |||
(1) These accumulated other comprehensive loss components are included in the computation of net periodic pension cost (see Note 12 of the Notes to Consolidated Financial Statements “Pension and Other Postretirement Benefit Plans”).
| For the year ended December 31, 2014 | ||||||||
| Amounts Reclassified from | ||||||||
| Details about Accumulated Other | Accumulated Other | Affected Line Item in the Statement | ||||||
| Comprehensive Income Components | Comprehensive Income | Where Net Income is Presented | ||||||
| (Dollars in thousands) | ||||||||
| Unrealized gains (losses) on available | ||||||||
| for sale securities: | $ | 2,875 | Net gain on sale of securities | |||||
| (1,241 | ) | Tax expense | ||||||
| $ | 1,634 | Net of tax | ||||||
| Amortization of defined benefit pension items: | ||||||||
| Actuarial losses | $ | (700 | )(1) | Other operating expenses | ||||
| Prior service credits | 45 | (1) | Other operating expenses | |||||
| (655 | ) | Total before tax | ||||||
| 311 | Tax benefit | |||||||
| $ | (344 | ) | Net of tax | |||||
112
14. Regulatory Capital
The federal banking agencies have substantially amended the regulatory risk-basedUnder current capital rules applicable to the Bank. The amendments implemented the “Basel III” regulatory capital reforms and changes required by the Dodd-Frank Act. The amended rules included new minimum risk-based capital and leverage ratios, which became effective in January 2015, with certain requirements phased in during 2016, and refined the definition of what constitutes “capital” for purposes of calculating those ratios.
The new minimum capital level requirements applicable toregulations, the Bank include: (i) a new common equity Tier 1 risk-basedis required to comply with four separate capital ratio of 4.5%; (ii) a Tier 1 risk-based capital ratio of 6% (increased from 4%); (iii) a total risk-based capital ratio of 8% (unchanged from prior rules); and (iv) a Tier 1 leverage ratio of 4% for all institutions. The amended rules also establish a “capital conservation buffer” of 2.5% above the new regulatory minimum capital ratios, and would result in the following minimum ratios: (i) a common equity Tier 1 risk-based capital ratio of 7.0%; (ii) a Tier 1 risk-based capital ratio of 8.5%; and (iii) a total risk-based capital ratio of 10.5%. The capital conservation buffer requirement for 2016 was 0.625% of risk-weighted assets and will increase each year until fully implemented in January 2019. An institution will be subject to limitations on paying dividends, engaging in share repurchases, and paying discretionary bonuses if its capital level falls below the buffer amount. These limitations will establish a maximum percentage of eligible retained income that could be utilized for such actions.
adequacy standards. As of December 31, 2016,2018, the Bank continuescontinued to be categorized as “well-capitalized” under the prompt corrective action regulations and continuescontinued to exceed all regulatory capital requirements. In 2016, a Capital Conservation Buffer (“CCB”) requirement became effective for banks. The Bank hadCCB is designed to establish a capital conservation buffer of 6.64%range above minimum capital requirements and impose constraints on dividends, share buybacks and discretionary bonus payments when capital levels fall below prescribed levels. The minimum CCB in 2018 was 1.875% and increases 0.625% annually through 2019 to 2.5%. The CCB for the Bank at December 31, 2016.2018 and 2017 was 5.70% and 6.31%, respectively.
Set forth below is a summary of the Bank’s compliance with banking regulatory capital standards.
| December 31, 2016 | December 31, 2015 | |||||||||||||||||||||||||||||||
| Percent of | Percent of | December 31, 2018 | December 31, 2017 | |||||||||||||||||||||||||||||
| Amount | Assets | Amount | Assets | Amount | Percent of Assets | Amount | Percent of Assets | |||||||||||||||||||||||||
| (Dollars in thousands) | (Dollars in thousands) | |||||||||||||||||||||||||||||||
| Tier I (leverage) capital: | ||||||||||||||||||||||||||||||||
| Capital level | $ | 607,033 | 10.12 | % | $ | 494,690 | 8.89 | % | $ | 660,782 | 9.85 | % | $ | 631,285 | 10.11 | % | ||||||||||||||||
| Requirement to be well capitalized | 299,848 | 5.00 | 278,175 | 5.00 | 335,512 | 5.00 | 312,343 | 5.00 | ||||||||||||||||||||||||
| Excess | 307,185 | 5.12 | 216,515 | 3.89 | 325,270 | 4.85 | 318,942 | 5.11 | ||||||||||||||||||||||||
| Common Equity Tier I risk-based capital: | ||||||||||||||||||||||||||||||||
| Capital level | $ | 607,033 | 14.12 | % | $ | 494,690 | 12.62 | % | $ | 660,782 | 13.28 | % | $ | 631,285 | 13.87 | % | ||||||||||||||||
| Requirement to be well capitalized | 279,443 | 6.50 | 254,768 | 6.50 | 323,386 | 6.50 | 295,937 | 6.50 | ||||||||||||||||||||||||
| Excess | 327,590 | 7.62 | 239,922 | 6.12 | 337,396 | 6.78 | 335,348 | 7.37 | ||||||||||||||||||||||||
| Tier I risk-based capital: | ||||||||||||||||||||||||||||||||
| Capital level | $ | 607,033 | 14.12 | % | $ | 494,690 | 12.62 | % | $ | 660,782 | 13.28 | % | $ | 631,285 | 13.87 | % | ||||||||||||||||
| Requirement to be well capitalized | 343,930 | 8.00 | 313,560 | 8.00 | 398,014 | 8.00 | 364,230 | 8.00 | ||||||||||||||||||||||||
| Excess | 263,103 | 6.12 | 181,130 | 4.62 | 262,768 | 5.28 | 267,055 | 5.87 | ||||||||||||||||||||||||
| Total risk-based capital: | ||||||||||||||||||||||||||||||||
| Capital level | $ | 629,262 | 14.64 | % | $ | 516,226 | 13.17 | % | $ | 681,727 | 13.70 | % | $ | 651,636 | 14.31 | % | ||||||||||||||||
| Requirement to be well capitalized | 429,913 | 10.00 | 391,950 | 10.00 | 497,517 | 10.00 | 455,288 | 10.00 | ||||||||||||||||||||||||
| Excess | 199,349 | 4.64 | 124,276 | 3.17 | 184,210 | 3.70 | 196,348 | 4.31 | ||||||||||||||||||||||||
The Holding Company is subject to the same regulatory capital requirements as the Bank. As of December 31, 2016,2018, the Holding Company continues to be categorized as “well-capitalized” under the prompt corrective action regulations and continues to exceed all regulatory capital requirements. The CCB for the Holding Company had a capital conservation buffer of 6.56% at December 31, 2016.2018 and 2017 was 5.72% and 6.38%, respectively.
| 113 |
Set forth below is a summary of the Holding Company’s compliance with banking regulatory capital standards.
| December 31, 2016 | December 31, 2015 | |||||||||||||||||||||||||||||||
| Percent of | Percent of | December 31, 2018 | December 31, 2017 | |||||||||||||||||||||||||||||
| Amount | Assets | Amount | Assets | Amount | Percent of Assets | Amount | Percent of Assets | |||||||||||||||||||||||||
| (Dollars in thousands) | (Dollars in thousands) | |||||||||||||||||||||||||||||||
| Tier I (leverage) capital: | ||||||||||||||||||||||||||||||||
| Capital level | $ | 539,228 | 9.00 | % | $ | 490,919 | 8.84 | % | $ | 586,582 | 8.74 | % | $ | 563,426 | 9.02 | % | ||||||||||||||||
| Requirement to be well capitalized | 299,654 | 5.00 | 277,611 | 5.00 | 335,616 | 5.00 | 312,278 | 5.00 | ||||||||||||||||||||||||
| Excess | 239,574 | 4.00 | 213,308 | 3.84 | 250,966 | 3.74 | 251,148 | 4.02 | ||||||||||||||||||||||||
| Common Equity Tier I risk-based capital: | ||||||||||||||||||||||||||||||||
| Capital level | $ | 506,432 | 11.79 | % | $ | 462,883 | 11.83 | % | $ | 546,230 | 10.98 | % | $ | 527,727 | 11.59 | % | ||||||||||||||||
| Requirement to be well capitalized | 279,121 | 6.50 | 254,335 | 6.50 | 323,382 | 6.50 | 295,865 | 6.50 | ||||||||||||||||||||||||
| Excess | 227,311 | 5.29 | 208,548 | 5.33 | 222,848 | 4.48 | 231,862 | 5.09 | ||||||||||||||||||||||||
| Tier I risk-based capital: | ||||||||||||||||||||||||||||||||
| Capital level | $ | 539,228 | 12.56 | % | $ | 490,919 | 12.55 | % | $ | 586,582 | 11.79 | % | $ | 563,426 | 12.38 | % | ||||||||||||||||
| Requirement to be well capitalized | 343,534 | 8.00 | 313,028 | 8.00 | 398,008 | 8.00 | 364,141 | 8.00 | ||||||||||||||||||||||||
| Excess | 195,694 | 4.56 | 177,891 | 4.55 | 188,574 | 3.79 | 199,285 | 4.38 | ||||||||||||||||||||||||
| Total risk-based capital: | ||||||||||||||||||||||||||||||||
| Capital level | $ | 636,457 | 14.82 | % | $ | 512,454 | 13.10 | % | $ | 682,527 | 13.72 | % | $ | 658,777 | 14.47 | % | ||||||||||||||||
| Requirement to be well capitalized | 429,417 | 10.00 | 391,285 | 10.00 | 497,511 | 10.00 | 455,177 | 10.00 | ||||||||||||||||||||||||
| Excess | 207,040 | 4.82 | 121,169 | 3.10 | 185,016 | 3.72 | 203,600 | 4.47 | ||||||||||||||||||||||||
15. Commitments and Contingencies
Commitments:
The Company is a party to financial instruments with off-balance-sheet risk in the normal course of business to meet the financing needs of its customers. These financial instruments include commitments to extend credit and lines of credit. The instruments involve, to varying degrees, elements of credit and market risks in excess of the amount recognized in the consolidated financial statements.
The Company’s exposure to credit loss in the event of nonperformance by the counterparty to the financial instrument for loan commitments and lines of credit is represented by the contractual amounts of these instruments.
Commitments to extend credit (principally real estate mortgage loans) and lines of credit (principally business lines of credit and home equity lines of credit) amounted to $78.1$64.9 million and $244.6$248.7 million, respectively, at December 31, 2016.2018. Included in these commitments were $12.3$26.6 million of fixed-rate commitments at a weighted average rate of 4.65%4.80% and $310.5$286.9 million of adjustable-rate commitments with a weighted average rate of 3.66%5.45%, as of December 31, 2016.2018. Since generally all of the loan commitments are expected to be drawn upon, the total loan commitments approximate future cash requirements, whereas the amounts of lines of credit may not be indicative of the Company’s future cash requirements. The loan commitments generally expire in 90 days, while construction loan lines of credit mature within eighteen months and home equity lines of credit mature within ten years. The Company uses the same credit policies in making commitments and conditional obligations as it does for on-balance-sheet instruments.
Commitments to extend credit are legally binding agreements to lend to a customer as long as there is no violation of any condition established in the contract. Commitments generally have fixed expiration dates and require payment of a fee. The Company evaluates each customer’s creditworthiness on a case-by-case basis. Collateral held consists primarily of real estate.
The Bank collateralized a portion of its deposits with letters of credit issued by FHLB-NY. At December 31, 2016,2018 and 2017, there were $382.5$659.6 million and $402.1 million, respectively, of letters of credit outstanding. The letters of credit are collateralized by mortgage loans pledged by the Bank.
114
The Trusts issued capital securities with a par value of $61.9 million in June and July 2007. The Holding Company has guaranteed the payment of the Trusts’ obligations under these capital securities.
The Company’s minimum annual rental payments for Bank facilities due under non-cancelable leases are as follows:
| Minimum Rental | Minimum Rental | |||||||
| (In thousands) | (In thousands) | |||||||
| Years ended December 31: | ||||||||
| 2017 | $ | 6,068 | ||||||
| 2018 | 5,793 | |||||||
| 2019 | 6,684 | $ | 7,605 | |||||
| 2020 | 6,756 | 7,977 | ||||||
| 2021 | 5,990 | 7,214 | ||||||
| 2022 | 6,822 | |||||||
| 2023 | 6,961 | |||||||
| Thereafter | 26,711 | 23,655 | ||||||
| Total minimum payments required | $ | 58,002 | $ | 60,234 | ||||
The leases have escalation clauses for operating expenses and real estate taxes. The Company’s non-cancelable operating lease agreements expire through 2031.2032. Rent expense under these leases for the years ended December 31, 2016, 20152018, 2017 and 20142016 was approximately $6.1 million, $6.3 million and $5.8 million, $5.8respectively.
The Company has an additional $0.5 million in minimum lease payments due on other equipment and $3.8 million, respectively.Company cars not shown in the table above.
Contingencies:
The Company is a defendant in various lawsuits. Management of the Company, after consultation with outside legal counsel, believes that the resolution of these various matters will not result in any material adverse effect on the Company’s consolidated financial condition, results of operations or cash flows.
16. Concentration of Credit Risk
The Company’s lending is concentrated in the New York City metropolitan area. The Company evaluates each customer’s creditworthiness on a case-by-case basis under the Company’s established underwriting policies. The collateral obtained by the Company generally consists of first liens on one-to-four family residential, multi-family residential, and commercial real estate. At December 31, 2016,2018, the largest amount the Bank could lend to one borrower was approximately $91.1$99.1 million, and at that date, the Bank’s largest aggregate amount of loans to one borrower was $74.0$83.1 million, all of which were performing according to their terms.
17. Related Party Transactions
At December 31, 2016, one loan for $8,000 was2018 and 2017, there were no outstanding to an executive officer of the Company and at December 31, 2015, one loan for $18,000 was outstanding to an executive officer of the Company and one loan for $356,000 was outstandingloans to a relative of a Director of the Company. The loans in both years were made in the ordinary course of business and were fully approved in accordance with all of the Company’s credit underwriting standards and were made at market rates of interest and other normal terms but with reduced origination fees. No such loans were made during 2016, 2015 and 2014. The Company believes that such loans do not involve more than the normal risk of collectability or present other unfavorable features.related party. Deposits of related parties totaled $13.2$11.5 million and $10.4$13.8 million at December 31, 20162018 and 2015,2017, respectively.
18. Fair Value of Financial Instruments
The Company carries certain financial assets and financial liabilities at fair value in accordance with GAAP which defines fair value as the price that would be received to sell an asset or paid to transfer a liability in an orderly transaction between market participants at the measurement date, establishes a framework for measuring fair value and expands disclosures about fair value measurements. GAAP permits entities to choose to measure many financial instruments and certain other items at fair value. At December 31, 2016,2018, the Company carried financial assets and financial liabilities under the fair value option with fair values of $30.4$13.8 million and $34.0$41.8 million, respectively. At December 31, 2015,2017, the Company carried financial assets and financial liabilities under the fair value option with fair values of $30.7$14.3 million and $29.0$37.0 million, respectively. The Company did not purchase or sell any financial assets or liabilities under the fair value option during the years ended December 31, 20162018 and 2015.2017 and did not sell any financial liabilities under the fair value option during the years ended December 31, 2018 and 2017. The Company sold financial assets carried under the fair value option totaling $0.2 million and $3.0 million during the years ended December 31, 2018 and 2017, respectively.
115
Management selected the fair value option for certain investment securities, and certain borrowed funds as the yield, at the time of election, on the financial assets was below-market, while the rate on the financial liabilities was above-market rate. Management also considered the average duration of these instruments, which, for investment securities, was longer than the average for the portfolio of securities, and, for borrowings, primarily represented the longer-term borrowings of the Company. Choosing these instruments for the fair value option adjusted the carrying value of these financial assets and financial liabilities to their current fair value, and more closely aligned the financial performance of the Company with the economic value of these financial instruments. Management believed that electing the fair value option for these financial assets and financial liabilities allows them to better react to changes in interest rates. At the time of election, Management did not elect the fair value option for investment securities and borrowings with shorter duration, adjustable rates, and yields that approximated the then current market rate, as management believed that these financial assets and financial liabilities approximated their economic value.
The following table presents the financial assets and financial liabilities reported at fair value under the fair value option at December 31, 20162018 and 2015,2017, and the changes in fair value included in the Consolidated Statement of Income – Net loss from fair value adjustments, for the years ended December 31, 2016, 2015 and 2014:adjustments:
| Fair Value | Fair Value | Changes in Fair Values For Items Measured at Fair Value | Fair Value | Fair Value | Changes in Fair Values For Items Measured at Fair Value | |||||||||||||||||||||||||||||||||||
| Measurements | Measurements | Pursuant to Election of the Fair Value Option | Measurements | Measurements | Pursuant to Election of the Fair Value Option | |||||||||||||||||||||||||||||||||||
| at December 31, | at December 31, | For the year ended December 31, | at December 31, | at December 31, | For the year ended December 31, | |||||||||||||||||||||||||||||||||||
| Description | 2016 | 2015 | 2016 | 2015 | 2014 | 2018 | 2017 | 2018 | 2017 | 2016 | ||||||||||||||||||||||||||||||
| (Dollars in thousands) | ||||||||||||||||||||||||||||||||||||||||
| Mortgage-backed securities | $ | 2,016 | $ | 2,527 | $ | (25 | ) | $ | (59 | ) | $ | 75 | $ | 967 | $ | 1,590 | $ | (19 | ) | $ | (26 | ) | $ | (25 | ) | |||||||||||||||
| Other securities | 28,429 | 28,205 | (38 | ) | 53 | 598 | 12,843 | 12,685 | (109 | ) | 134 | (38 | ) | |||||||||||||||||||||||||||
| Borrowed funds | 33,959 | 29,018 | (4,908 | ) | (238 | ) | 802 | 41,849 | 36,986 | (4,913 | ) | (2,993 | ) | (4,908 | ) | |||||||||||||||||||||||||
| Net gain (loss) from fair value adjustments (1) | $ | (4,971 | ) | $ | (244 | ) | $ | 1,475 | ||||||||||||||||||||||||||||||||
| Net loss from fair value adjustments (1) | $ | (5,041 | ) | $ | (2,885 | ) | $ | (4,971 | ) | |||||||||||||||||||||||||||||||
| (1) | The net |
Included in the fair value of the financial assets and financial liabilities selected for the fair value option is the accrued interest receivable or payable for the related instrument. The Company reports as interest income or interest expense in the Consolidated Statement of Income, the interest receivable or payable on the financial instruments selected for the fair value option at their respective contractual rates.
The borrowed funds have a contractual principal amount of $61.9 million at December 31, 20162018 and 2015.2017. The fair value of borrowed funds includes accrued interest payable of $0.1$0.2 million at December 31, 20162018 and 2015.2017.
The Company generally holds its earning assets, other than securities available for sale, to maturity and settles its liabilities at maturity. However, fair value estimates are made at a specific point in time and are based on relevant market information. These estimates do not reflect any premium or discount that could result from offering for sale at one time the Company’s entire holdings of a particular instrument. Accordingly, as assumptions change, such as interest rates and prepayments, fair value estimates change and these amounts may not necessarily be realized in an immediate sale.
Disclosure of fair value does not require fair value information for items that do not meet the definition of a financial instrument or certain other financial instruments specifically excluded from its requirements. These items include core deposit intangibles and other customer relationships, premises and equipment, leases, income taxes and equity.
Further, fair value disclosure does not attempt to value future income or business. These items may be material and accordingly, the fair value information presented does not purport to represent, nor should it be construed to represent, the underlying “market” or franchise value of the Company.
Financial assets and financial liabilities reported at fair value are required to be measured based on either: (1) quoted prices in active markets for identical financial instruments (Level 1); (2) significant other observable inputs (Level 2); or (3) significant unobservable inputs (Level 3).
A description of the methods and significant assumptions utilized in estimating the fair value of the Company’s assets and liabilities that are carried at fair value on a recurring basis are as follows:
116
Level 1 – where quoted market prices are available in an active market. The Company did not value any of its assets or liabilities that are carried at fair value on a recurring basis asAt December 31, 2018 and 2017, Level 1 at December 31, 2016 and 2015.included one mutual fund.
Level 2 – when quoted market prices are not available, fair value is estimated using quoted market prices for similar financial instruments and adjusted for differences between the quoted instrument and the instrument being valued. Fair value can also be estimated by using pricing models, or discounted cash flows. Pricing models primarily use market-based or independently sourced market parameters as inputs, including, but not limited to, yield curves, interest rates, equity or debt prices and credit spreads. In addition to observable market information, models also incorporate maturity and cash flow assumptions. At December 31, 20162018 and 2015,2017, Level 2 included mortgage related securities, corporate debt, municipals and interest rate swaps.
Level 3 – when there is limited activity or less transparency around inputs to the valuation, financial instruments are classified as Level 3. At December 31, 20162018 and 2015,2017, Level 3 included trust preferred securities owned by and junior subordinated debentures issued by the Company. Additionally, at December 31, 2014, Level 3 trust preferred securities owned and junior subordinated debentures issued by the Company and a single issuer trust preferred security.
The methods described above may produce fair values that may not be indicative of net realizable value or reflective of future fair values. While the Company believes its valuation methods are appropriate and consistent with those of other market participants, the use of different methodologies, assumptions and models to determine fair value of certain financial instruments could produce different estimates of fair value at the reporting date.
The following table sets forth the Company's assets and liabilities that are carried at fair value on a recurring basis, including those reported at fair value under the fair value option, and the level that was used to determine their fair value, at December 31:
| Quoted Prices | ||||||||||||||||||||||||||||||||||||||||||||||||||||||||||||||||
| in Active Markets | Significant Other | Significant Other | ||||||||||||||||||||||||||||||||||||||||||||||||||||||||||||||
| for Identical Assets | Observable Inputs | Unobservable Inputs | Total carried at fair value | |||||||||||||||||||||||||||||||||||||||||||||||||||||||||||||
| (Level 1) | (Level 2) | (Level 3) | on a recurring basis | Quoted Prices in Active Markets for Identical Assets (Level 1) | Significant Other Observable Inputs (Level 2) | Significant Other Unobservable Inputs (Level 3) | Total carried at fair value on a recurring basis | |||||||||||||||||||||||||||||||||||||||||||||||||||||||||
| 2016 | 2015 | 2016 | 2015 | 2016 | 2015 | 2016 | 2015 | 2018 | 2017 | 2018 | 2017 | 2018 | 2017 | 2018 | 2017 | |||||||||||||||||||||||||||||||||||||||||||||||||
| (In thousands) | ||||||||||||||||||||||||||||||||||||||||||||||||||||||||||||||||
| Assets: | ||||||||||||||||||||||||||||||||||||||||||||||||||||||||||||||||
| Securities available for sale | ||||||||||||||||||||||||||||||||||||||||||||||||||||||||||||||||
| Mortgage-backed Securities | $ | - | $ | - | $ | 516,476 | $ | 668,740 | $ | - | $ | - | $ | 516,476 | $ | 668,740 | $ | - | $ | - | $ | 557,953 | $ | 509,650 | $ | - | $ | - | $ | 557,953 | $ | 509,650 | ||||||||||||||||||||||||||||||||
| Other securities | - | - | 337,544 | 317,445 | 7,361 | 7,212 | 344,905 | 324,657 | 11,586 | 11,575 | 251,860 | 216,019 | 1,256 | 1,110 | 264,702 | 228,704 | ||||||||||||||||||||||||||||||||||||||||||||||||
| Interest rate swaps | - | - | 6,350 | 48 | - | - | 6,350 | 48 | - | - | 15,961 | 7,388 | - | - | 15,961 | 7,388 | ||||||||||||||||||||||||||||||||||||||||||||||||
| Total assets | $ | - | $ | - | $ | 860,370 | $ | 986,233 | $ | 7,361 | $ | 7,212 | $ | 867,731 | $ | 993,445 | $ | 11,586 | $ | 11,575 | $ | 825,774 | $ | 733,057 | $ | 1,256 | $ | 1,110 | $ | 838,616 | $ | 745,742 | ||||||||||||||||||||||||||||||||
| Liabilities: | ||||||||||||||||||||||||||||||||||||||||||||||||||||||||||||||||
| Borrowings | $ | - | $ | - | $ | - | $ | - | $ | 33,959 | $ | 29,018 | $ | 33,959 | $ | 29,018 | $ | - | $ | - | $ | - | $ | - | $ | 41,849 | $ | 36,986 | $ | 41,849 | $ | 36,986 | ||||||||||||||||||||||||||||||||
| Interest rate swaps | - | - | 3,386 | 4,314 | - | - | 3,386 | 4,314 | - | - | 2,239 | 3,758 | - | - | 2,239 | 3,758 | ||||||||||||||||||||||||||||||||||||||||||||||||
| Total liabilities | $ | - | $ | - | $ | 3,386 | $ | 4,314 | $ | 33,959 | $ | 29,018 | $ | 37,345 | $ | 33,332 | $ | - | $ | - | $ | 2,239 | $ | 3,758 | $ | 41,849 | $ | 36,986 | $ | 44,088 | $ | 40,744 | ||||||||||||||||||||||||||||||||
During the year ended December 31, 2017, one mutual fund security for $11.6 million was transferred from Level 2 into Level 1. There were no other transfers between Levels 1, 2 and 3 during the years ended December 31, 2018 and 2017.
117
The following tables set forth the Company's assets and liabilities that are carried at fair value on a recurring basis, classified within Level 3 of the valuation hierarchy for the periods indicated:
| For the year ended | ||||||||||||||||||||||||
| For the year ended December 31, 2016 | December 31, 2018 | December 31, 2017 | ||||||||||||||||||||||
| Trust preferred | Junior subordinated | Trust preferred securities | Junior subordinated debentures | Trust preferred securities | Junior subordinated debentures | |||||||||||||||||||
| securities | debentures | (In thousands) | ||||||||||||||||||||||
| Beginning balance | $ | 7,212 | $ | 29,018 | $ | 1,110 | $ | 36,986 | $ | 7,361 | $ | 33,959 | ||||||||||||
| Security call | - | - | (6,300 | ) | - | |||||||||||||||||||
| Net gain from fair value adjustment of financial assets (1) | 149 | - | 145 | - | 134 | - | ||||||||||||||||||
| Net loss from fair value adjustment of financial liabilities (1) | - | 4,908 | - | 4,913 | - | 2,993 | ||||||||||||||||||
| Increase in accrued interest payable | - | 33 | ||||||||||||||||||||||
| Change in unrealized gains included in other comprehensive income | - | - | ||||||||||||||||||||||
| Increase(Decrease) in accrued interest | 1 | 66 | (87 | ) | 34 | |||||||||||||||||||
| Change in unrealized losses included in other comprehensive loss | - | (116 | ) | 2 | - | |||||||||||||||||||
| Ending balance | $ | 7,361 | $ | 33,959 | $ | 1,256 | $ | 41,849 | $ | 1,110 | $ | 36,986 | ||||||||||||
| Changes in unrealized held at period end | $ | - | $ | - | $ | - | $ | - | $ | - | $ | - | ||||||||||||
| For the year ended December 31, 2015 | ||||||||||||
| Trust preferred | Junior subordinated | |||||||||||
| Municipals | securities | debentures | ||||||||||
| (In thousands) | ||||||||||||
| Beginning balance | $ | 15,519 | $ | 7,090 | $ | 28,771 | ||||||
| Transfers to held-to-maturity | (4,510 | ) | - | - | ||||||||
| Purchases | 1,000 | - | - | |||||||||
| Principal repayments | (8,009 | ) | - | - | ||||||||
| Maturities | (4,000 | ) | - | - | ||||||||
| Sales | - | - | - | |||||||||
| Net gain from fair value adjustment of financial assets (1) | - | 117 | - | |||||||||
| Net loss from fair value adjustment of financial liabilities (1) | - | - | 238 | |||||||||
| Increase in accrued interest payable | - | - | 9 | |||||||||
| Change in unrealized gains included in other comprehensive income | - | 5 | - | |||||||||
| Ending balance | $ | - | $ | 7,212 | $ | 29,018 | ||||||
| Changes in unrealized held at period end | $ | - | $ | 5 | $ | - | ||||||
(1) These totals in the table above are presented in the Consolidated Statement of Income under net loss from fair value adjustments.
During the years ended December 31, 2016 and 2015, there were no transfers between Levels 1, 2 and 3.
The following tables present the quantitativequalitative information about recurring Level 3 fair value of financial instruments and the fair value measurements at the periods indicated:
| December 31, 2016 | ||||||||||||||||||||||||||||||||||||
| December 31, 2018 | ||||||||||||||||||||||||||||||||||||
| Fair Value | Valuation Technique | Unobservable Input | Range | Weighted Average | Fair Value | Valuation Technique | Unobservable Input | Range | Weighted Average | |||||||||||||||||||||||||||
| (Dollars in thousands) | (Dollars in thousands) | |||||||||||||||||||||||||||||||||||
| Assets: | ||||||||||||||||||||||||||||||||||||
| Trust preferred securities | $ | 7,361 | Discounted cash flows | Discount rate | 6.3% | - | 7.1% | 7.0 | % | $ | 1,256 | Discounted cash flows | Discount rate | n/a | 4.9 | % | ||||||||||||||||||||
| Liabilities: | ||||||||||||||||||||||||||||||||||||
| Junior subordinated debentures | $ | 33,959 | Discounted cash flows | Discount rate | 6.3% | 6.3 | % | $ | 41,849 | Discounted cash flows | Discount rate | n/a | 4.9 | % | ||||||||||||||||||||||
| December 31, 2015 | ||||||||||||||||||||||||||||||||||||
| December 31, 2017 | ||||||||||||||||||||||||||||||||||||
| Fair Value | Valuation Technique | Unobservable Input | Range | Weighted Average | Fair Value | Valuation Technique | Unobservable Input | Range | Weighted Average | |||||||||||||||||||||||||||
| (Dollars in thousands) | (Dollars in thousands) | |||||||||||||||||||||||||||||||||||
| Assets: | ||||||||||||||||||||||||||||||||||||
| Trust preferred securities | $ | 7,212 | Discounted cash flows | Discount rate | 7.0% | - | 7.07% | 7.1 | % | $ | 1,110 | Discounted cash flows | Discount rate | n/a | 5.7 | % | ||||||||||||||||||||
| Liabilities: | ||||||||||||||||||||||||||||||||||||
| Junior subordinated debentures | $ | 29,018 | Discounted cash flows | Discount rate | 7.0% | 7.0 | % | $ | 36,986 | Discounted cash flows | Discount rate | n/a | 5.7 | % | ||||||||||||||||||||||
The significant unobservable inputs used in the fair value measurement of the Company’s trust preferred securities and junior subordinated debentures valued under Level 3 at December 31, 20162018 and 2015,2017, are the effective yields used in the cash flow models. Significant increases or decreases in the effective yield in isolation would result in a significantly lower or higher fair value measurement.
118
The following table sets forth the Company's assets that are carried at fair value on a non-recurring basis, and the level that was used to determine their fair value, at December 31:
| Quoted Prices | ||||||||||||||||||||||||||||||||||||||||||||||||||||||||||||||||
| in Active Markets | Significant Other | Significant Other | ||||||||||||||||||||||||||||||||||||||||||||||||||||||||||||||
| for Identical Assets | Observable Inputs | Unobservable Inputs | Total carried at fair value | |||||||||||||||||||||||||||||||||||||||||||||||||||||||||||||
| (Level 1) | (Level 2) | (Level 3) | on a non-recurring basis | Quoted Prices in Active Markets for Identical Assets (Level 1) | Significant Other Observable Inputs (Level 2) | Significant Other Unobservable Inputs (Level 3) | Total carried at fair value on a non-recurring basis | |||||||||||||||||||||||||||||||||||||||||||||||||||||||||
| 2016 | 2015 | 2016 | 2015 | 2016 | 2015 | 2016 | 2015 | 2018 | 2017 | 2018 | 2017 | 2018 | 2017 | 2018 | 2017 | |||||||||||||||||||||||||||||||||||||||||||||||||
| (In thousands) | ||||||||||||||||||||||||||||||||||||||||||||||||||||||||||||||||
| Assets: | ||||||||||||||||||||||||||||||||||||||||||||||||||||||||||||||||
| Impaired loans | $ | - | $ | - | $ | - | $ | - | $ | 14,968 | $ | 15,360 | $ | 14,968 | $ | 15,360 | $ | - | $ | - | $ | - | $ | - | $ | 4,111 | $ | 8,504 | $ | 4,111 | $ | 8,504 | ||||||||||||||||||||||||||||||||
| Other real estate owned | - | - | - | - | 533 | 4,932 | 533 | 4,932 | ||||||||||||||||||||||||||||||||||||||||||||||||||||||||
| Other repossesed assets | - | - | - | - | 35 | - | 35 | - | ||||||||||||||||||||||||||||||||||||||||||||||||||||||||
| Total assets | $ | - | $ | - | $ | - | $ | - | $ | 15,501 | $ | 20,292 | $ | 15,501 | $ | 20,292 | $ | - | $ | - | $ | - | $ | - | $ | 4,146 | $ | 8,504 | $ | 4,146 | $ | 8,504 | ||||||||||||||||||||||||||||||||
The following tables present the qualitative information about non-recurring Level 3 fair value measurements of financial instruments at the periods indicated:
| At December 31, 2016 | At December 31, 2018 | |||||||||||||||||||||||||||||||||
| Fair Value | Valuation Technique | Unobservable Input | Range | Weighted Average | Fair Value | Valuation Technique | Unobservable Input | Range | Weighted Average | |||||||||||||||||||||||||
| (Dollars in thousands) | (Dollars in thousands) | |||||||||||||||||||||||||||||||||
| Assets: | ||||||||||||||||||||||||||||||||||
| Impaired loans | $ | 2,007 | Income approach | Capitalization rate | 6.0% | to | 7.5% | 7.0 | % | $ | 204 | Income approach | Capitalization rate | 8.5% | 8.5% | |||||||||||||||||||
| Reduction for planned expedited disposal | 15.0% | 15.0 | % | Reduction for planned expedited disposal | 15.0% | 15.0% | ||||||||||||||||||||||||||||
| Impaired loans | $ | 8,703 | Sales approach | Adjustment to sales comparison value to reconcile differences between comparable sales | -40.0% | to | 16.2% | -1.5 | % | $ | 2,724 | Sales approach | Adjustment to sales comparison value to reconcile differences between comparable sales | 0.0% | 0.0% | |||||||||||||||||||
| Reduction for planned expedited disposal | 0% | to | 15.0% | 7.7 | % | Reduction for planned expedited disposal | -36.5% | to | 15.0% | 10.4% | ||||||||||||||||||||||||
| Impaired loans | $ | 4,258 | Blended income and sales approach | Adjustment to sales comparison value to reconcile differences between comparable sales | -50.0% | to | 25.0% | -0.6 | % | $ | 1,183 | Blended income and sales approach | Adjustment to sales comparison value to reconcile differences between comparable sales | -30.0% | to | 10.0% | -7.8% | |||||||||||||||||
| Capitalization rate | 5.3% | to | 9.5% | 7.2 | % | Capitalization rate | 7.4% | to | 9.8% | 8.7% | ||||||||||||||||||||||||
| Reduction planned for expedited disposal | 15.0% | 15.0 | % | Reduction for planned expedited disposal | 15.0% | 15.0% | ||||||||||||||||||||||||||||
| Other real estate owned | $ | 533 | Sales approach | Adjustment to sales comparison value to reconcile differences between comparable sales | 3.3% | to | 18.6% | 11.0 | % | |||||||||||||||||||||||||
| Other repossesed assets | $ | 35 | Sales approach | Reduction for planned expediated disposal | 0.0% | 0.0% | ||||||||||||||||||||||||||||
| At December 31, 2015 | At December 31, 2017 | |||||||||||||||||||||||||||||||||
| Fair Value | Valuation Technique | Unobservable Input | Range | Weighted Average | Fair Value | Valuation Technique | Unobservable Input | Range | Weighted Average | |||||||||||||||||||||||||
| (Dollars in thousands) | (Dollars in thousands) | |||||||||||||||||||||||||||||||||
| Assets: | ||||||||||||||||||||||||||||||||||
| Impaired loans | $ | 3,878 | Income approach | Capitalization rate | 7.3% | to | 8.5% | 7.7 | % | $ | 204 | Income approach | Capitalization rate | 8.5% | 8.5% | |||||||||||||||||||
| Loss severity discount | 15.0% | 15.0 | % | Reduction for planned expedited disposal | 15.0% | 15.0% | ||||||||||||||||||||||||||||
| Impaired loans | $ | 5,555 | Sales approach | Adjustment to sales comparison value to reconcile differences between comparable sales | -50.0% | to | 40.0% | -2.2 | % | $ | 6,868 | Sales approach | Adjustment to sales comparison value to reconcile differences between comparable sales | -50.0% | to | 15.0% | -0.1% | |||||||||||||||||
| Loss severity discount | 15.0% | 15.0 | % | Reduction for planned expedited disposal | 0.0% | to | 15.0% | 0.1% | ||||||||||||||||||||||||||
| Impaired loans | $ | 5,927 | Blended income and sales approach | Adjustment to sales comparison value to reconcile differences between comparable sales | -50.0% | to | 25.0% | -2.2 | % | $ | 1,432 | Blended income and sales approach | Adjustment to sales comparison value to reconcile differences between comparable sales | -30.0% | to | 10.0% | -7.6% | |||||||||||||||||
| Capitalization rate | 5.3% | to | 9.0% | 7.0 | % | Capitalization rate | 7.4%% | to | 9.8% | 8.8% | ||||||||||||||||||||||||
| Loss severity discount | 5.2% | to | 15.0% | 13.7 | % | Reduction for planned expedited disposal | 0.0% | 0.0% | ||||||||||||||||||||||||||
| Other real estate owned | $ | 3,750 | Income approach | Capitalization rate | 9.0% | 9.0 | % | |||||||||||||||||||||||||||
| Other real estate owned | $ | 366 | Sales approach | Adjustment to sales comparison value to reconcile differences between comparable sales | -5.0% | to | 25.0% | 12.0 | % | |||||||||||||||||||||||||
| Other real estate owned | $ | 816 | Blended income and sales approach | Adjustment to sales comparison value to reconcile differences between comparable sales | -10.0% | to | 15.0% | 2.5 | % | |||||||||||||||||||||||||
| Capitalization rate | 8.6% | 8.6 | % | |||||||||||||||||||||||||||||||
The Company did not have any liabilities that were carried at fair value on a non-recurring basis at December 31, 20162018 and 2015.2017.
The fair value of each material class of financial instruments at December 31, 2016 and 2015 and the related methods and assumptions used to estimate fair value at December 31, 2018 and 2017 are as follows:
Cash and Due from Banks, Overnight Interest-Earning Deposits and Federal Funds Sold:
The fair values of financial instruments that are short-term or reprice frequently and have little or no risk are considered to have a fair value that approximates carrying value.Securities:
FHLB-NY stock:
The fair value is based upon the par value of the stock which equals its carrying value.
Securities:
The fair values of securities are contained in Note 6 of Notes to Consolidated Financial Statements. Fair value is based upon quoted market prices, where available. If a quoted market price is not available, fair value is estimated using quoted market prices for similar securities and adjusted for differences between the quoted instrument and the instrument being valued. When there is limited activity or less transparency around inputs to the valuation, securities are valued using discounted cash flows.
Impaired Loans:
The fair value of loans is estimated by discounting the expected future cash flows using the current rates at which similar loans would be made to borrowers with similar credit ratings and remaining maturities.
For non-accruing loans, fair value is generally estimated by discounting management’s estimate of future cash flows with a discount rate commensurate with the risk associated with such assets or, for collateral dependent loans, 85% of the appraised or internally estimated value of the property, except for taxi medallion loans. The fair value of the underlying collateral of taxi medallion loans is the most recent reported arm’s length transaction. When there is no recent sale activity, the fair value is calculated using capitalization rates.
Other Real Estate Owned:Owned and Other Repossessed Assets:
OREO and other repossessed assets are carried at fair value less selling costs. The fair value for OREO is based on appraised value through a current appraisal, or sometimes through an internal review, additionally adjusted by the estimated costs to sell the property.
Accrued Interest Receivable:
The carrying amount is a reasonable estimate of fair value due to its short-term nature.
Due to Depositors:
The fair values of demand, passbook savings, NOW, money market deposits and escrow deposits are, by definition, equal to the amount payable on demand at the reporting dates (i.e. their carrying value). The fair value of certificates of depositsfor other repossessed assets are estimated by discountingbased upon the expected future cash flowsmost recently reported arm’s length sales transaction. When there is no recent sale activity, the fair value is calculated using the rates currently offered for deposits of similar remaining maturities.capitalization rates.
Borrowings:Junior Subordinated Debentures:
The fair value of borrowings is estimated by discounting the contractual cash flows using interest rates in effect for borrowings with similar maturities and collateral requirements or using a market-standard model. The fair value of the junior subordinated debentures was developed using a credit spread based on the subordinated debt issued by the Company adjusting for differences in the junior subordinated debt’s credit rating, liquidity and time to maturity.
Accrued Interest Payable:
The carrying amount is a reasonable estimate ofunrealized net gain/loss attributable to changes in our own credit risk was determined by adjusting the fair value due to its short-term nature.as determined in the proceeding sentence by the average rate of default on debt instruments with a similar debt rating as our junior subordinated debentures, with the difference from the original calculation and this calculation resulting in the instrument-specific unrealized gain/loss.
Interest Rate Swaps:
The fair value of interest rate swaps is based upon broker quotes.
120
Other Financial Instruments:
The fair values of commitments to sell, lend or borrow are estimated using the fees currently charged or paid to enter into similar agreements, taking into account the remaining terms of the agreements and the present creditworthiness of the counterparties or on the estimated cost to terminate them or otherwise settle with the counterparties at the reporting date. For fixed-rate loan commitments to sell, lend or borrow, fair values also consider the difference between current levels of interest rates and committed rates (where applicable). At December 31, 2016 and 2015, the fair values of the above financial instruments approximate the recorded amounts of the related fees and were not considered to be material.
The following tables set forth the carrying amounts and fair values of selected financial instruments based on the assumptions described above used by the Company in estimating fair value at the periods indicated:
| December 31, 2016 | ||||||||||||||||||||||||||||||||||||||||
| Carrying | Fair | December 31, 2018 | ||||||||||||||||||||||||||||||||||||||
| Amount | Value | Level 1 | Level 2 | Level 3 | Carrying Amount | Fair Value | Level 1 | Level 2 | Level 3 | |||||||||||||||||||||||||||||||
| (In thousands) | (In thousands) | |||||||||||||||||||||||||||||||||||||||
| Assets: | ||||||||||||||||||||||||||||||||||||||||
| Cash and due from banks | $ | 35,857 | $ | 35,857 | $ | 35,857 | $ | - | $ | - | $ | 118,561 | $ | 118,561 | $ | 118,561 | $ | - | $ | - | ||||||||||||||||||||
| Securities held-to-maturity | ||||||||||||||||||||||||||||||||||||||||
| Mortgage-backed securities | 7,953 | 7,366 | - | 7,366 | - | |||||||||||||||||||||||||||||||||||
| Other securities | 37,735 | 35,408 | - | - | 35,408 | 24,065 | 22,508 | - | - | 22,508 | ||||||||||||||||||||||||||||||
| Securities available for sale | ||||||||||||||||||||||||||||||||||||||||
| Mortgage-backed securities | 516,476 | 516,476 | - | 516,476 | - | 557,953 | 557,953 | - | 557,953 | - | ||||||||||||||||||||||||||||||
| Other securities | 344,905 | 344,905 | - | 337,544 | 7,361 | 264,702 | 264,702 | 11,586 | 251,860 | 1,256 | ||||||||||||||||||||||||||||||
| Loans | 4,835,693 | 4,814,840 | - | - | 4,814,840 | 5,551,484 | 5,496,266 | - | - | 5,496,266 | ||||||||||||||||||||||||||||||
| FHLB-NY stock | 59,173 | 59,173 | - | 59,173 | - | 57,282 | 57,282 | - | 57,282 | - | ||||||||||||||||||||||||||||||
| Accrued interest receivable | 25,485 | 25,485 | 54 | 2,756 | 22,675 | |||||||||||||||||||||||||||||||||||
| Interest rate swaps | 6,350 | 6,350 | - | 6,350 | - | 15,961 | 15,961 | - | 15,961 | - | ||||||||||||||||||||||||||||||
| Total assets | $ | 5,836,189 | $ | 5,813,009 | $ | 35,857 | $ | 919,543 | $ | 4,857,609 | ||||||||||||||||||||||||||||||
| Liabilities: | ||||||||||||||||||||||||||||||||||||||||
| Deposits | $ | 4,205,631 | $ | 4,213,714 | $ | 2,833,516 | $ | 1,380,198 | $ | - | $ | 4,960,784 | $ | 4,955,077 | $ | 3,397,474 | $ | 1,557,603 | $ | - | ||||||||||||||||||||
| Borrowings | 1,266,563 | 1,255,283 | - | 1,221,324 | 33,959 | 1,250,843 | 1,241,745 | - | 1,199,896 | 41,849 | ||||||||||||||||||||||||||||||
| Accrued interest payable | 5,890 | 5,890 | - | 5,890 | - | |||||||||||||||||||||||||||||||||||
| Interest rate swaps | 3,386 | 3,386 | - | 3,386 | - | 2,239 | 2,239 | - | 2,239 | - | ||||||||||||||||||||||||||||||
| Total liabilities | $ | 5,475,580 | $ | 5,472,383 | $ | 2,833,516 | $ | 2,604,908 | $ | 33,959 | ||||||||||||||||||||||||||||||
| December 31, 2017 | ||||||||||||||||||||
| Carrying Amount | Fair Value | Level 1 | Level 2 | Level 3 | ||||||||||||||||
| (In thousands) | ||||||||||||||||||||
| Assets: | ||||||||||||||||||||
| Cash and due from banks | $ | 51,546 | $ | 51,546 | $ | 51,546 | $ | - | $ | - | ||||||||||
| Securities held-to-maturity | ||||||||||||||||||||
| Mortgage-backed securities | 7,973 | 7,810 | - | 7,810 | - | |||||||||||||||
| Other securities | 22,913 | 21,889 | - | - | 21,889 | |||||||||||||||
| Securities available for sale | ||||||||||||||||||||
| Mortgage-backed securities | 509,650 | 509,650 | - | 509,650 | - | |||||||||||||||
| Other securities | 228,704 | 228,704 | 11,575 | 216,019 | 1,110 | |||||||||||||||
| Loans | 5,176,999 | 5,169,108 | - | - | 5,169,108 | |||||||||||||||
| FHLB-NY stock | 60,089 | 60,089 | - | 60,089 | - | |||||||||||||||
| Accrued interest receivable | 21,405 | 21,405 | 16 | 1,916 | 19,473 | |||||||||||||||
| Interest rate swaps | 7,388 | 7,388 | - | 7,388 | - | |||||||||||||||
| Liabilities: | ||||||||||||||||||||
| Deposits | $ | 4,383,278 | $ | 4,380,174 | $ | 3,031,345 | $ | 1,348,829 | $ | - | ||||||||||
| Borrowings | 1,309,653 | 1,310,487 | - | 1,273,501 | 36,986 | |||||||||||||||
| Accrued interest payable | 2,659 | 2,659 | - | 2,659 | - | |||||||||||||||
| Interest rate swaps | 3,758 | 3,758 | - | 3,758 | - | |||||||||||||||
| December 31, 2015 | ||||||||||||||||||||
| Carrying | Fair | |||||||||||||||||||
| Amount | Value | Level 1 | Level 2 | Level 3 | ||||||||||||||||
| (In thousands) | ||||||||||||||||||||
| Assets: | ||||||||||||||||||||
| Cash and due from banks | $ | 42,363 | $ | 42,363 | $ | 42,363 | $ | - | $ | - | ||||||||||
| Securities held-to-maturity | ||||||||||||||||||||
| Other securities | 6,180 | 6,180 | - | - | 6,180 | |||||||||||||||
| Securities available for sale | ||||||||||||||||||||
| Mortgage-backed securities | 668,740 | 668,740 | - | 668,740 | - | |||||||||||||||
| Other securities | 324,657 | 324,657 | - | 317,445 | 7,212 | |||||||||||||||
| Loans | 4,387,979 | 4,434,079 | - | - | 4,434,079 | |||||||||||||||
| FHLB-NY stock | 56,066 | 56,066 | - | 56,066 | - | |||||||||||||||
| Interest rate swaps | 48 | 48 | - | 48 | - | |||||||||||||||
| Total assets | $ | 5,486,033 | $ | 5,532,133 | $ | 42,363 | $ | 1,042,299 | $ | 4,447,471 | ||||||||||
| Liabilities: | ||||||||||||||||||||
| Deposits | $ | 3,892,547 | $ | 3,902,888 | $ | 2,489,245 | $ | 1,413,643 | $ | - | ||||||||||
| Borrowings | 1,271,676 | 1,279,946 | - | 1,250,928 | 29,018 | |||||||||||||||
| Interest rate swaps | 4,314 | 4,314 | - | 4,314 | - | |||||||||||||||
| Total liabilities | $ | 5,168,537 | $ | 5,187,148 | $ | 2,489,245 | $ | 2,668,885 | $ | 29,018 | ||||||||||
19. Derivative Financial Instruments
At December 31, 20162018 and 2015,2017, the Company’s derivative financial instruments consist of interest rate swaps. The Company’s interest rate swaps are used for two purposes. The first purpose isthree purposes: 1) to mitigate the Company’s exposure to rising interest rates on a portion ($18.0 million) of its floating rate junior subordinated debentures that have a contractual value of $61.9 million, at both December 31, 20162018 and 2015. The second purpose is2017; 2) to mitigate the Company’s exposure to rising interest rates on certain fixed rate loans totaling $235.4$286.1 million and $146.9$280.2 million at December 31, 20162018 and 2015, respectively.2017 respectively; and 3) to mitigate exposure to rising interest rates on certain short-term advances totaling $441.5 million at December 31, 2018 and 2017.
The Company’s derivative instruments are carried at fair value in the Company’s financial statements as part of Other Assets for derivatives with positive fair values and Other Liabilities for derivatives with negative fair values. The accounting for changes in the fair value of a derivative instrument is dependent upon whether or not it qualifies and has been designated as a hedge for accounting purposes, and further, by the type of hedging relationship.
At December 31, 20162018 and 2015,2017, we held derivatives designated as cash flow hedges, fair value hedges and certain derivatives not designated as hedges.
At December 31, 2018 and 2017, derivatives with a combined notional amount of $36.3 million were not designated as hedges. At December 31, 20162018 and 2015,2017, derivatives with a combined notional amount of $217.1$267.8 million and $128.5$261.9 million respectively, were designated as fair value hedges. At December 31, 2018 and 2017, derivatives with a combined notional amount of $441.5 million were designated as cash flow hedges.
For cash flow hedges, the effective portion of changes in the fair value of the derivative is reported in AOCL, net of tax, with the ineffective portion of changes in the fair value of the derivative is recognized directly in earnings. Amounts in accumulated other comprehensive income are reclassified into earnings in the same period during which the hedged forecasted transaction effects earnings. During each of the years ended December 31, 2018 and 2017, $0.1 million was reclassified from accumulated other comprehensive loss to interest expense.
Changes in the fair value of interest rate swaps not designated as hedges are reflected in “Net loss from fair value adjustments” in the Consolidated Statements of Income.
The following table sets forth information regarding the Company’s derivative financial instruments at the periods indicated:
| December 31, 2016 | December 31, 2015 | December 31, 2018 | December 31, 2017 | |||||||||||||||||||||||||||||
| Notional | Net Carrying | Notional | Net Carrying | Notional Amount | Fair Value (1) | Notional Amount | Fair Value (1) | |||||||||||||||||||||||||
| Amount | Value (1) | Amount | Value (1) | (In thousands) | ||||||||||||||||||||||||||||
| Interest rate swaps (hedge) | $ | 182,177 | $ | 6,350 | $ | 28,588 | $ | 48 | ||||||||||||||||||||||||
| Interest rate swaps (hedge) | 34,916 | (658 | ) | 99,955 | (1,515 | ) | ||||||||||||||||||||||||||
| Interest rate swaps (fair value hedge) | $ | 248,330 | $ | 10,593 | $ | 199,341 | $ | 6,971 | ||||||||||||||||||||||||
| Interest rate swaps (fair value hedge) | 19,468 | (502 | ) | 62,564 | (921 | ) | ||||||||||||||||||||||||||
| Interest rate swaps (cash flow hedge) | 441,500 | 5,368 | 250,000 | 417 | ||||||||||||||||||||||||||||
| Interest rate swaps (cash flow hedge) | - | - | 191,500 | (7 | ) | |||||||||||||||||||||||||||
| Interest rate swaps (non-hedge) | 36,321 | (2,728 | ) | 36,321 | (2,799 | ) | 36,321 | (1,737 | ) | 36,321 | (2,830 | ) | ||||||||||||||||||||
| Total derivatives | $ | 253,414 | $ | 2,964 | $ | 164,864 | $ | (4,266 | ) | $ | 745,619 | $ | 13,722 | $ | 739,726 | $ | 3,630 | |||||||||||||||
| (1) | Derivatives in a net positive position are recorded as “Other assets” and derivatives in a net negative position are recorded as “Other liabilities” in the Consolidated Statements of Financial Condition. |
123
The following table sets forth the effect of derivative instruments on the Consolidated Statements of Income for the periods indicated:
| For the year ended | ||||||||||||||||||||||||
| December 31, | For the year ended December 31, | |||||||||||||||||||||||
| (In thousands) | 2016 | 2015 | 2014 | 2018 | 2017 | 2016 | ||||||||||||||||||
| Financial Derivatives: | ||||||||||||||||||||||||
| Interest rate swaps (non-hedge) | $ | 71 | $ | (561 | ) | $ | (3,919 | ) | $ | 1,094 | $ | (102 | ) | $ | 71 | |||||||||
| Interest rate swaps (hedge) | 1,466 | (1,036 | ) | (124 | ) | |||||||||||||||||||
| Net Gain (loss) (1) | $ | 1,537 | $ | (1,597 | ) | $ | (4,043 | ) | ||||||||||||||||
| Interest rate swaps (fair value hedge) | (175 | ) | (478 | ) | 1,466 | |||||||||||||||||||
| Net gain (loss) (1) | $ | 919 | $ | (580 | ) | $ | 1,537 | |||||||||||||||||
| (1) | Net gains (losses) are recorded as part of “Net loss from fair value adjustments” in the Consolidated Statements of Income. |
During the years ended December 31, 2018, 2017 and 2016, the Company did not record any hedge ineffectiveness.
The Company’s interest rate swaps are subject to master netting arrangements between the Company and are all with the same counterparty.its two designated counterparties. The Company has not made a policy election to offset its derivative positions.
The following tables present the effect of the master netting arrangements on the presentation of the derivative assets and liabilities in the Consolidated Statements of Condition as of the dates indicated:
| December 31, 2018 | ||||||||||||||||||||||||
| Gross Amounts Not Offset in the Consolidated Statement of Condition | ||||||||||||||||||||||||
| (In thousands) | Gross Amount of Recognized Assets | Gross Amount Offset in the Statement of Condition | Net Amount of Assets Presented in the Statement of Condition | Financial Instruments | Cash Collateral Received | Net Amount | ||||||||||||||||||
| Interest rate swaps | $ | 15,961 | $ | - | $ | 15,961 | $ | - | $ | 14,960 | $ | 1,001 | ||||||||||||
| December 31, 2016 | ||||||||||||||||||||||||||||||||||||||||||||||||
| Gross Amounts Not Offset in the Consolidated Statement of Condition | Gross Amounts Not Offset in the Consolidated Statement of Condition | |||||||||||||||||||||||||||||||||||||||||||||||
| (In thousands) | Gross Amount of Recognized Assets | Gross Amount Offset in the Statement of Condition | Net Amount of Assets Presented in the Statement of Condition | Financial Instruments | Cash Collateral Received | Net Amount | Gross Amount of Recognized Liabilities | Gross Amount Offset in the Statement of Condition | Net Amount of Liabilities Presented in the Statement of Condition | Financial Instruments | Cash Collateral Pledged | Net Amount | ||||||||||||||||||||||||||||||||||||
| Interest rate swaps | $ | 6,350 | $ | - | $ | 6,350 | $ | 3,386 | $ | 2,964 | $ | - | $ | 2,239 | $ | - | $ | 2,239 | $ | - | $ | - | $ | 2,239 | ||||||||||||||||||||||||
| December 31, 2017 | ||||||||||||||||||||||||
| Gross Amounts Not Offset in the Consolidated Statement of Condition | ||||||||||||||||||||||||
| (In thousands) | Gross Amount of Recognized Assets | Gross Amount Offset in the Statement of Condition | Net Amount of Assets Presented in the Statement of Condition | Financial Instruments | Cash Collateral Received | Net Amount | ||||||||||||||||||
| Interest rate swaps | $ | 7,388 | $ | - | $ | 7,388 | $ | - | $ | 3,660 | $ | 3,728 | ||||||||||||
| Gross Amounts Not Offset in the Consolidated Statement of Condition | ||||||||||||||||||||||||
| (In thousands) | Gross Amount of Recognized Liabilities | Gross Amount Offset in the Statement of Condition | Net Amount of Liabilities Presented in the Statement of Condition | Financial Instruments | Cash Collateral Pledged | Net Amount | ||||||||||||||||||
| Interest rate swaps | $ | 3,386 | $ | - | $ | 3,386 | $ | 3,386 | $ | - | $ | - | ||||||||||||
| Gross Amounts Not Offset in the Consolidated Statement of Condition | ||||||||||||||||||||||||
| (In thousands) | Gross Amount of Recognized Liabilities | Gross Amount Offset in the Statement of Condition | Net Amount of Liabilities Presented in the Statement of Condition | Financial Instruments | Cash Collateral Pledged | Net Amount | ||||||||||||||||||
| Interest rate swaps | $ | 3,758 | $ | - | $ | 3,758 | $ | - | $ | - | $ | 3,758 | ||||||||||||
| December 31, 2015 | ||||||||||||||||||||||||
| Gross Amounts Not Offset in the Consolidated Statement of Condition | ||||||||||||||||||||||||
| (In thousands) | Gross Amount of Recognized Assets | Gross Amount Offset in the Statement of Condition | Net Amount of Assets Presented in the Statement of Condition | Financial Instruments | Cash Collateral Received | Net Amount | ||||||||||||||||||
| Interest rate swaps | $ | 48 | $ | - | $ | 48 | $ | 48 | $ | - | $ | - | ||||||||||||
| Gross Amounts Not Offset in the Consolidated Statement of Condition | ||||||||||||||||||||||||
| (In thousands) | Gross Amount of Recognized Liabilities | Gross Amount Offset in the Statement of Condition | Net Amount of Liabilities Presented in the Statement of Condition | Financial Instruments | Cash Collateral Pledged | Net Amount | ||||||||||||||||||
| Interest rate swaps | $ | 4,314 | $ | - | $ | 4,314 | $ | 48 | $ | 4,266 | $ | - | ||||||||||||
20. New Authoritative Accounting Pronouncements
Accounting Standards Adopted in 2018:
In January 2017,February 2018, the Financial Accounting Standards Board (“FASB”) issued Accounting Standards Update (“ASU”) No. 2017-04, Intangibles - Goodwill2018-02, “Income Statement – Reporting Comprehensive Income (Topic 220).”As a result of the Tax Cuts and Other (Topic 350): SimplifyingJobs Act (the “TCJA”), concerns arose regarding the Testguidance which requires deferred tax assets and liabilities to be adjusted for Goodwill Impairment. The ASU simplifies the subsequent measurement of goodwill and eliminates Step 2 from the goodwill impairment test. The Company should perform its goodwill impairment test by comparing the fair valueeffect of a reporting unitchange in tax laws or rates with its carrying amount. An impairment charge should be recognized for the amount by which the carrying amount exceedseffect included in income from continuing operations in the reporting unit's fair value. The impairment charge is limited toperiod that includes the amount of goodwill allocated to that reporting unit.enactment date. The amendments in this updateASU require a reclassification for stranded tax effects from accumulated other comprehensive income to retained earnings, furthermore eliminating the stranded tax effects resulting from the TCJA. The amount of the reclassification is the difference between the previous corporate income tax rate of 35% and the newly enacted corporate income tax rate of 21%. The amendments of this ASU are effective for fiscal years beginning after December 15, 2019, including2018, and interim periods within those fiscal years. Earlyyears, with early adoption is permitted for goodwill impairment tests performed on testing dates afterin any interim period or fiscal year before the effective date. We have elected to early adopt this guidance as of January 1, 2017. The guidance is not expected2018. Our Consolidated Statements of Financial Condition reflect adoption of this ASU and reclassification of $2.1 million in stranded tax effects from accumulated other comprehensive income to have a significant impact on the Company's financial positions, results of operations or disclosuresretained earnings. See Note 10 “Income Taxes” for additional information.
In August 2016, the FASB issued ASU No. 2016-15 “Classification of Certain Cash Receipts and Cash Payments”, to clarify how certain cash receipts and cash payments are presented and classified in the statements of cash flows. The amendments are intended to reduce diversity in practice by clarifying whether the following items should be categorized as operating, investing or financing in the statement of cash flows: (i) debt prepayments and extinguishment costs, (ii) settlement of zero-coupon debt, (iii) settlement of contingent consideration, (iv) insurance proceeds, (v) settlement of corporate-owned life insurance (COLI) and bank-owned life insurance (BOLI) policies, (vi) distributions from equity method investees, (vii) beneficial interests in securitization transactions, and (viii) receipts and payments with aspects of more than one class of cash flows. The ASU will be effective for fiscal years, and interim periods within those fiscal years, beginning after December 15, 2017. Early adoption is permitted. If an entity early adopts the amendments in an interim period, any adjustments should be reflected as of the beginning of the fiscal year that includes that interim period. An entity that elects early adoption must adopt all of the amendments in the same period. The Company doesThis ASU was adopted on January 1, 2018 and did not expect adoption of this ASU will have a material effectsignificant impact on its consolidated financial statements.the presentation of our cash flows.
125
In June 2016, the FASB issued ASU No. 2016-13, “Financial Instruments – Credit Losses” which sets forth a “current expected credit loss” (“CECL”) model which requires the Company to measure all expected credit losses for financial instruments held at the reporting date based on historical experience, current conditions and reasonable supportable forecasts. This replaces the existing incurred loss model and will apply to the measurement of credit losses on financial assets measured at amortized cost and to some off-balance sheet credit exposures. This ASU will be effective for fiscal years beginning after December 15, 2019, including interim periods within those fiscal years. The Company has begun collecting and evaluating data and system requirements to implement this standard. The adoption of this update could have a material impact on the Company’s consolidated results of operations and financial condition. The extent of the impact is still unknown and will depend on many factors, such as the composition of the Company’s loan portfolio and expected loss history at adoption.
In March 2016, the FASB issued ASU No. 2016-09, “Compensation – Stock Compensation”, which introduces targeted amendments intended to simplify the accounting for stock compensation. Specifically, the ASU requires all excess tax benefits and tax deficiencies (including tax benefits of dividends on share-based payment awards) to be recognized as income tax expense or benefit in the income statement. The tax effects of exercised or vested awards should be treated as discrete items in the reporting period in which they occur. An entity also should recognize excess tax benefits, and assess the need for a valuation allowance, regardless of whether the benefit reduces taxes payable in the current period. That is, off balance sheet accounting for net operating losses stemming from excess tax benefits would no longer be required and instead such net operating losses would be recognized when they arise. Existing net operating losses that are currently tracked off balance sheet would be recognized, net of a valuation allowance if required, through an adjustment to opening retained earnings in the period of adoption. Entities will no longer need to maintain and track an additional paid in capital pool. The ASU also requires excess tax benefits to be classified along with other income tax cash flows as an operating activity in the statement of cash flows. In addition, the ASU elevates the statutory tax withholding threshold to qualify for equity classification up to the maximum statutory tax rates in the applicable jurisdiction(s). The ASU also clarifies that cash paid by an employer when directly withholding shares for tax withholding purposes should be classified as a financing activity. The ASU provides an optional accounting policy election (with limited exceptions), to be applied on an entity-wide basis, to either estimate the number of awards that are expected to vest (consistent with existing GAAP) or account for forfeitures when they occur. The amendments are effective for public business entities for annual periods beginning after December 15, 2016, and interim periods within those annual periods. Early adoption is permitted. We do not expect adoption of this ASU to have a material effect on our consolidated results of operations, financial condition or cash flows.
In February 2016, the FASB issued ASU No. 2016-02, “Leases”. From the lessee's perspective, the new standard establishes a right-of-use (“ROU”) model that requires a lessee to record a ROU asset and a lease liability on the balance sheet for all leases with terms longer than 12 months. Leases will be classified as either finance or operating, with classification affecting the pattern of expense recognition in the income statement for a lessee. From the lessor's perspective, the new standard requires a lessor to classify leases as either sales-type, finance or operating. A lease will be treated as a sale if it transfers all of the risks and rewards, as well as control of the underlying asset, to the lessee. If risks and rewards are conveyed without the transfer of control, the lease is treated as a financing. If the lessor doesn’t convey risks and rewards or control, an operating lease results. The new standard is effective for fiscal years beginning after December 15, 2018, including interim periods within those fiscal years. A modified retrospective transition approach is required for lessees for capital and operating leases existing at, or entered into after, the beginning of the earliest comparative period presented in the financial statements, with certain practical expedients available. A modified retrospective transition approach is required for lessors for sales-type, direct financing, and operating leases existing at, or entered into after, the beginning of the earliest comparative period presented in the financial statements, with certain practical expedients available. The Company has not adopted a new accounting policy as of the filing date. Management is continuing to evaluate the standard, but the effects of recognizing most operating leases on the Consolidated Statements of Financial Condition is expected to be material. The Company expects to recognize right-of-use assets and lease liabilities for substantially all of its operating lease commitments disclosed in Note 15 based on the present value of unpaid lease payments as of the date of adoption.
In January 2016, FASB issued ASU No. 2016-01 “Financial Instruments” which requires an entity to: (i) measure equity investments at fair value through net income, with certain exceptions; (ii) present in other comprehensive income the changes in instrument-specific credit risk for financial liabilities measured using the fair value option; (iii) present financial assets and financial liabilities by measurement category and form of financial asset; (iv) calculate the fair value of financial instruments for disclosure purposes based on an exit price and; (v) assess a valuation allowance on deferred tax assets related to unrealized losses of available for sale debt securities in combination with other deferred tax assets. The ASU provides an election to subsequently measure certain nonmarketable equity investments at cost less any impairment and adjusted for certain observable price changes. The ASU also requires a qualitative impairment assessment of such equity investments and amends certain fair value disclosure requirements. The amendments areThis ASU became effective for public business entities for fiscal years,us on January 1, 2018. The adoption of the guidance resulted in a cumulative-effect adjustment totaling $0.8 million and interim periods within those fiscal years, beginning after December 15, 2017. Early adoption isdid not permitted for the changes that affect the Company. We are currently evaluating thehave a significant impact of adopting this new guidance on our consolidated results of operations, financial condition and financial condition.
In May 2015, the FASB issued ASU 2015-07, “Disclosures for Investments in Certain Entities That Calculate Net Asset Value per Share (or Its Equivalent)” which seeks to eliminate diversity in practice surrounding how investments measured at net asset value under the practical expedient, with future redemption dates, have been categorized in the fair value hierarchy. The guidance is effective for fiscal years beginning after December 15, 2015, and requires retrospective presentation. These Notes to Financial Statements reflect adoption.cash flows.
In May 2014, the FASB issued ASU 2014-09, “Revenue from Contracts with Customers”Customers (Topic 606)”. This ASU establishes a comprehensive revenue recognition standard for virtually all industries under U.S. GAAP, including those that previously followed industry-specific guidance such as real estate, construction and software industries. The revenue standard’s core principle is built on the contract between a vendor and a customer for the provision of goods and services. It attempts to depict the exchange of rights and obligations between the parties in the pattern of revenue recognition based on the consideration to which the vendor is entitled. The guidance in this ASU for public companies is effective for the annual periods beginning after December 15, 2016, including interim periods therein. ASU 2014-09 does not apply to the majority of our revenue streams. In August 2015, the FASB approved a one-year delay of the effective date of this standard. The deferral would require public entitiesstandard to apply the standard for annual reporting periods beginning after December 15, 2017. Public companies would be permittedThis ASU allows for either full retrospective adoption or modified retrospective adoption. This ASU became effective for us on January 1, 2018. We adopted this standard through the modified retrospective transition method. The modified retrospective method requires application of ASU 2014-09 to elect to early adopt for annual reportinguncompleted contracts at the date of adoption; however, periods beginning after December 15, 2016. The Company is in the process of comparing our current revenue recognition policiesprior to the requirementsdate of this ASU. While weadoption have not identified anybeen retrospectively revised as the impact of the new standard on uncompleted contracts as the date of adoption was not material differencesas such a cumulative effective adjustment to opening retained earnings was not deemed necessary.
Topic 606 does not apply to the majority of our revenue streams which are primarily comprised of interest and dividend income and associated fees within those revenue streams. The revenue streams derived by the Company that are within the scope of Topic 606 are primarily certain banking service fees, including wire transfer fees, ATM fees, account maintenance fees, overdraft fees and other deposit fees. We generally satisfy our performance obligations on contracts with customers as services are rendered, and the transaction prices are typically fixed and charged either on a periodic basis or based on activity. Being that performance obligations are satisfied as services are rendered and the transaction prices are fixed, there is little judgment involved in applying Topic 606 that significantly affects the determination of the amount and timing of revenue recognitionfrom contracts with customers. Additionally, the Company will receive revenue from the sale of investment products through a third party as part of a revenue sharing agreement. This revenue is included in “Other Income” in the Consolidated Statements of Income. These fees are remitted to the Company monthly as our performance obligation is satisfied. We have evaluated the nature of our contracts with customers and determined that further disaggregation of revenue from contracts with customers into more granular categories beyond what is present in the Consolidated Statements of Income was not necessary.
Accounting Standards Pending Adoption:
In August 2018, the FASB issued ASU No. 2018-14, “Compensation – Retirement Benefits – Defined Benefit Plans – General (Subtopic 715-20)”providing targeted improvements to the disclosures required for the revenue streams we have reviewedDefined Benefit Plans. The amendments in in this Update are effective for fiscal years ended after December 15, 2020. Early adoption is permitted. The amendments are to date, our evaluation is not complete, and we have not concluded our determination ofbe applied on a retrospective basis to all periods presented.We are currently evaluating the overall impact of adopting this new guidance on our disclosures.
In August 2018, the FASB issued ASU No. 2018-13, “Fair Value Measurement (Topic 820)”. The amendments in this Update modify the disclosure requirements on fair value measurements in Topic 820.The amendments in in this Update are effective for fiscal years, and interim periods within those fiscal years beginning after December 15, 2019. Early adoption is permitted. The amendments are to be applied on a retrospective basis to all periods presented.We are currently evaluating the impact of adopting this new guidance on our disclosures.
In August 2017, the FASB issued ASU No. 2017-12, “Derivatives and Hedging (Topic 815)”providing targeted improvements to the accounting for hedging activities, which is effective January 1, 2019, with early adoption permitted in any interim period or fiscal year before the effective date. The guidance introduces a number of amendments, several of which are optional, that are designed to simplify the application of hedge accounting, improve financial statement transparency and more closely align hedge accounting with an entity’s risk management strategies. This ASU eliminates the requirement to separately measure and report hedge ineffectiveness and changes the presentation so that all items that affect earnings are in the same income statement line as the hedged item. The guidance is not expected to have an impact on the Company's financial positions, results of operations or disclosures.
126
In March 2017, the FASB issued ASU No. 2017-08, “Premium Amortization on Purchased Callable Debt Securities” which shortens the amortization period for premiums on purchased callable debt securities to the earliest call date, rather than amortizing over the full contractual term. The ASU does not change the accounting for securities held at a discount. The amendments in this ASU require companies to reset the effective yield using the payment terms of the debt security if the call option is not exercised on the earliest call date. If the security has additional future call dates, any excess of the amortized cost basis over the amount repayable by the issuer at the next call date should be amortized to the next call date. The amendments in this update are effective for fiscal years beginning after December 15, 2018, including interim periods within those fiscal years. Early adoption is permitted, including adoption in an interim period. If an entity early adopts the amendments in an interim period, any adjustments should be reflected as of the beginning of the fiscal year that includes that interim period. The guidance is not expected to have an impact on the Company's financial positions, results of operations or disclosures.
In January 2017, the FASB issued ASU No. 2017-04, “Intangibles - Goodwill and Other (Topic 350): Simplifying the Test for Goodwill Impairment.” The ASU simplifies the subsequent measurement of goodwill and eliminates Step 2 from the goodwill impairment test. Under this ASU, the Company should perform its goodwill impairment test by comparing the fair value of a reporting unit with its carrying amount. An impairment charge should be recognized for the amount by which the carrying amount exceeds the reporting unit's fair value. The impairment charge is limited to the amount of goodwill allocated to that reporting unit. The amendments in this update are effective for fiscal years beginning after December 15, 2019, including interim periods within those fiscal years. Early adoption is permitted for goodwill impairment tests performed on testing dates after January 1, 2017. The guidance is not expected to have a significant impact on the Company's financial positions, results of operations or disclosures.
In June 2016, the FASB issued ASU No. 2016-13, “Financial Instruments – Credit Losses” which sets forth a “current expected credit loss” (“CECL”) model which requires the Company to measure all expected credit losses for financial instruments held at the reporting date based on historical experience, current conditions and reasonable supportable forecasts. This replaces the existing incurred loss model and will apply to the measurement of credit losses on financial assets measured at amortized cost and to some off-balance sheet credit exposures. This ASU will be effective for fiscal years beginning after December 15, 2019, including interim periods within those fiscal years. The Company has been collecting and evaluating data and system requirements to implement this standard. Management has developed inter-departmental steering and working committees to evaluate and implement CECL. We have chosen a vendor solution to model CECL results and are in the beginning stages of implementing this solution. The adoption of this update could have a material impact on the Company’s consolidated results of operations and financial conditioncondition. The extent of the impact is still unknown and will depend on many factors, such as the composition of the Company’s loan portfolio and expected loss history at adoption.
In February 2016, the FASB issued ASU No. 2016-02, “Leases” which requires lessees to recognize leases on-balance sheet, makes targeted changes to lessor accounting, and disclose key information about leasing arrangements. Topic 842 was subsequently amended by ASU No. 2018-01, Land Easement Practical Expedient for Transition to Topic 842; ASU No. 2018-10, Codification Improvements to Topic 842, Leases; and ASU No. 2018-11, Targeted Improvements.
ASC 842 is effective for fiscal years, and interim periods within those fiscal years, beginning after December 31, 2018. A modified retrospective transition approach is required, applying the new standard to all leases existing at the date of initial application. An entity may choose to use either (1) the effective date or (2) the beginning of the earliest comparative period presented in the financial statements as its date of initial application. The Company has elected to use the effective date, January 1, 2019, as the date of initial application. Consequently, financial information will not be updated and the disclosures required under the new standard will not be provided for dates and periods before January 1, 2019.
From the lessee's perspective, the new standard establishes a right-of-use (“ROU”) model that requires a lessee to recognize a ROU asset and a corresponding lease liability on the balance sheet for all leases with terms longer than 12 months, subject to a policy election. The Company has elected the short-term lease recognition exemption such that the Company will not recognize ROU assets or lease liabilities for leases with a term of less than 12 months from the commencement date. Leases will be classified as either finance or operating, with classification affecting the pattern of expense recognition in the income statement for a lessee. Additionally, the ASU expands quantitative and qualitative disclosures to help financial statement users better understand the amount, timing, and uncertainty of cash flows. arising from leases.
127
The new leasing standard provides a number of optional practical expedients in transition. The Company has elected the “package of practical expedients”, which permits the Company not to reassess prior conclusions about lease identification, lease classification and initial direct costs. The Company does not expect to elect the use-of-hindsight or the practical expedient pertaining to land easements; the latter not being applicable to the Company. ASC 842 also provides certain accounting policy elections for an entity’s ongoing accounting. For operating leases wherein the Company is the lessee, the Company has elected the practical expedient to not separate lease and non-lease components.
Under legacy lease accounting, all of the Company’s leases, which primarily relate to office space and bank branches, were classified as operating leases and, as such, are not recognized on the Company’s Consolidated Balance Sheet for periods prior to the adoption of ASC 842. The Company currently estimates recognizing lease liabilities ranging from $40 million to $50 million, with corresponding ROU assets of the same amount, decreasing the Bank’s and Company’s regulatory capital ratios approximately one to six basis points, due to an increase in total assets and risk-weighted assets. The Company does not expect material changes to the recognition of operating lease expense as presented in Occupancy and Equipment expense in its Consolidated Statements of Income.
21. Quarterly Financial Data (unaudited)
Selected unaudited quarterly financial data for the fiscal years ended December 31, 20162018 and 20152017 is presented below:
| 2016 | 2015 | |||||||||||||||||||||||||||||||
| 4th | 3rd | 2nd | 1st | 4th | 3rd | 2nd | 1st | |||||||||||||||||||||||||
| (In thousands, except per share data) | ||||||||||||||||||||||||||||||||
| Quarterly operating data: | ||||||||||||||||||||||||||||||||
| Interest income | $ | 56,019 | $ | 55,524 | $ | 55,091 | $ | 54,363 | $ | 52,468 | $ | 51,913 | $ | 50,222 | $ | 49,543 | ||||||||||||||||
| Interest expense | 13,668 | 13,811 | 13,202 | 13,230 | 13,052 | 12,603 | 12,082 | 11,989 | ||||||||||||||||||||||||
| Net interest income | 42,351 | 41,713 | 41,889 | 41,133 | 39,416 | 39,310 | 38,140 | 37,554 | ||||||||||||||||||||||||
| Provision (benefit) for loan losses | - | - | - | - | 664 | (370 | ) | (516 | ) | (734 | ) | |||||||||||||||||||||
| Other operating income | 15,426 | 1,853 | 37,717 | 2,540 | 2,145 | 1,697 | 9,947 | 1,930 | ||||||||||||||||||||||||
| Other operating expense | 35,375 | 26,277 | 28,454 | 28,497 | 23,824 | 23,708 | 24,248 | 25,939 | ||||||||||||||||||||||||
| Income before income tax expense | 22,402 | 17,289 | 51,152 | 15,176 | 17,073 | 17,669 | 24,355 | 14,279 | ||||||||||||||||||||||||
| Income tax expense | 8,116 | 6,655 | 20,717 | 5,615 | 5,439 | 6,661 | 9,521 | 5,546 | ||||||||||||||||||||||||
| Net income | $ | 14,286 | $ | 10,634 | $ | 30,435 | $ | 9,561 | $ | 11,634 | $ | 11,008 | $ | 14,834 | $ | 8,733 | ||||||||||||||||
| Basic earnings per common share | $ | 0.50 | $ | 0.37 | $ | 1.05 | $ | 0.33 | $ | 0.40 | $ | 0.38 | $ | 0.51 | $ | 0.30 | ||||||||||||||||
| Diluted earnings per common share | $ | 0.50 | $ | 0.37 | $ | 1.05 | $ | 0.33 | $ | 0.40 | $ | 0.38 | $ | 0.51 | $ | 0.30 | ||||||||||||||||
| Dividends per common share | $ | 0.17 | $ | 0.17 | $ | 0.17 | $ | 0.17 | $ | 0.16 | $ | 0.16 | $ | 0.16 | $ | 0.16 | ||||||||||||||||
| Average common shares outstanding for: | ||||||||||||||||||||||||||||||||
| Basic earnings per share | 28,850 | 28,861 | 29,022 | 29,097 | 28,862 | 28,927 | 29,246 | 29,397 | ||||||||||||||||||||||||
| Diluted earnings per share | 28,860 | 28,875 | 29,034 | 29,111 | 28,879 | 28,946 | 29,268 | 29,419 | ||||||||||||||||||||||||
| 2018 | 2017 | |||||||||||||||||||||||||||||||
| 4th | 3rd | 2nd | 1st | 4th | 3rd | 2nd | 1st | |||||||||||||||||||||||||
| (In thousands, except per share data) | ||||||||||||||||||||||||||||||||
| Quarterly operating data: | ||||||||||||||||||||||||||||||||
| Interest income | $ | 67,433 | $ | 65,486 | $ | 63,293 | $ | 60,786 | $ | 59,697 | $ | 59,319 | $ | 58,315 | $ | 57,254 | ||||||||||||||||
| Interest expense | 26,797 | 23,965 | 20,653 | 18,177 | 16,637 | 16,278 | 14,698 | 13,865 | ||||||||||||||||||||||||
| Net interest income | 40,636 | 41,521 | 42,640 | 42,609 | 43,060 | 43,041 | 43,617 | 43,389 | ||||||||||||||||||||||||
| Provision for loan losses | 422 | - | - | 153 | 6,595 | 3,266 | - | - | ||||||||||||||||||||||||
| Other operating income (loss) | (986 | ) | 4,955 | 3,168 | 3,200 | 3,064 | 1,661 | 1,948 | 3,689 | |||||||||||||||||||||||
| Other operating expense | 25,760 | 27,233 | 27,396 | 31,294 | 25,879 | 25,966 | 26,065 | 29,564 | ||||||||||||||||||||||||
| Income before income tax expense | 13,468 | 19,243 | 18,412 | 14,362 | 13,650 | 15,470 | 19,500 | 17,514 | ||||||||||||||||||||||||
| Income tax expense | 1,046 | 1,910 | 4,489 | 2,950 | 7,693 | 5,291 | 6,775 | 5,254 | ||||||||||||||||||||||||
| Net income | $ | 12,422 | $ | 17,333 | $ | 13,923 | $ | 11,412 | $ | 5,957 | $ | 10,179 | $ | 12,725 | $ | 12,260 | ||||||||||||||||
| Basic earnings per common share | $ | 0.44 | $ | 0.61 | $ | 0.48 | $ | 0.39 | $ | 0.21 | $ | 0.35 | $ | 0.44 | $ | 0.42 | ||||||||||||||||
| Diluted earnings per common share | $ | 0.44 | $ | 0.61 | $ | 0.48 | $ | 0.39 | $ | 0.21 | $ | 0.35 | $ | 0.44 | $ | 0.42 | ||||||||||||||||
| Dividends per common share | $ | 0.20 | $ | 0.20 | $ | 0.20 | $ | 0.20 | $ | 0.18 | $ | 0.18 | $ | 0.18 | $ | 0.18 | ||||||||||||||||
| Average common shares outstanding for: | ||||||||||||||||||||||||||||||||
| Basic earnings per share | 28,422 | 28,604 | 28,845 | 28,974 | 29,045 | 29,120 | 29,135 | 29,019 | ||||||||||||||||||||||||
| Diluted earnings per share | 28,423 | 28,604 | 28,846 | 28,975 | 29,046 | 29,120 | 29,136 | 29,023 | ||||||||||||||||||||||||
22. Parent Company Only Financial Information
Earnings of the Bank are recognized by the Holding Company using the equity method of accounting. Accordingly, earnings of the Bank are recorded as increases in the Holding Company’s investment, any dividends would reduce the Holding Company’s investment in the Bank, and any changes in the Bank’s unrealized gain or loss on securities available for sale, net of taxes, would increase or decrease, respectively, the Holding Company’s investment in the Bank.
| 128 |
The condensed financial statements for the Holding Company are presented below:
| December 31, | December 31, | |||||||
| Condensed Statements of Financial Condition | 2016 | 2015 | ||||||
| (Dollars in thousands) | ||||||||
| Assets: | ||||||||
| Cash and due from banks | $ | 13,972 | $ | 5,654 | ||||
| Securities available for sale: | ||||||||
| Other securities ($1,019 and $872 at fair value pursuant to the fair value option at December 31, 2016 and 2015, respectively) | 1,317 | 1,170 | ||||||
| Interest receivable | 4 | 4 | ||||||
| Investment in subsidiaries | 612,374 | 502,798 | ||||||
| Goodwill | 2,185 | 2,185 | ||||||
| Other assets | 3,704 | 4,251 | ||||||
| Total assets | $ | 633,556 | $ | 516,062 | ||||
| Liabilities: | ||||||||
| Subordinated debentures | $ | 73,414 | $ | - | ||||
| Junior subordinated debentures, at fair value | 33,959 | 29,018 | ||||||
| Other liabilities | 12,330 | 13,977 | ||||||
| Total liabilities | 119,703 | 42,995 | ||||||
| Stockholders' Equity: | ||||||||
| Preferred stock | - | - | ||||||
| Common stock | 315 | 315 | ||||||
| Additional paid-in capital | 214,462 | 210,652 | ||||||
| Treasury stock, at average cost (2,897,691 shares and 2,700,037 at December 31, 2016 and 2015, respectively) | (53,754 | ) | (48,868 | ) | ||||
| Retained earnings | 361,192 | 316,530 | ||||||
| Accumulated other comprehensive loss, net of taxes | (8,362 | ) | (5,562 | ) | ||||
| Total equity | 513,853 | 473,067 | ||||||
| Total liabilities and equity | $ | 633,556 | $ | 516,062 | ||||
| Condensed Statements of Financial Condition | December 31, 2018 | December 31, 2017 | ||||||
| (Dollars in thousands) | ||||||||
| Assets: | ||||||||
| Cash and due from banks | $ | 4,351 | $ | 10,198 | ||||
| Securities available for sale: | ||||||||
| Other securities | 1,256 | 1,110 | ||||||
| Interest receivable | - | - | ||||||
| Investment in Bank | 661,044 | 634,056 | ||||||
| Goodwill | 2,185 | 2,185 | ||||||
| Other assets | 2,929 | 3,645 | ||||||
| Total assets | $ | 671,765 | $ | 651,194 | ||||
| Liabilities: | ||||||||
| Subordinated debentures | $ | 74,001 | $ | 73,699 | ||||
| Junior subordinated debentures, at fair value | 41,849 | 36,986 | ||||||
| Other liabilities | 6,451 | 7,901 | ||||||
| Total liabilities | 122,301 | 118,586 | ||||||
| Stockholders' Equity: | ||||||||
| Preferred stock | - | - | ||||||
| Common stock | 315 | 315 | ||||||
| Additional paid-in capital | 222,720 | 217,906 | ||||||
| Treasury stock, at average cost (3,546,958 shares and 2,942,329 at December 31, 2018 and 2017, respectively) | (75,146 | ) | (57,675 | ) | ||||
| Retained earnings | 414,327 | 381,048 | ||||||
| Accumulated other comprehensive loss, net of taxes | (12,752 | ) | (8,986 | ) | ||||
| Total equity | 549,464 | 532,608 | ||||||
| Total liabilities and equity | $ | 671,765 | $ | 651,194 | ||||
| For the years ended December 31, | ||||||||||||
| Condensed Statements of Income | 2018 | 2017 | 2016 | |||||||||
| (In thousands) | ||||||||||||
| Dividends from the Bank | $ | 34,000 | $ | 21,500 | $ | 24,000 | ||||||
| Interest income | 275 | 505 | 247 | |||||||||
| Interest expense | (6,479 | ) | (5,860 | ) | (1,324 | ) | ||||||
| Net loss from fair value adjustments | (4,769 | ) | (2,903 | ) | (4,761 | ) | ||||||
| Other operating expenses | (1,391 | ) | (1,354 | ) | (1,611 | ) | ||||||
| Income before taxes and equity in undistributed earnings of subsidiary | 21,636 | 11,888 | 16,551 | |||||||||
| Income tax benefit | 3,907 | 6,926 | 3,198 | |||||||||
| Income before equity in undistributed earnings of subsidiary | 25,543 | 18,814 | 19,749 | |||||||||
| Equity in undistributed earnings of the Bank | 29,547 | 22,307 | 45,167 | |||||||||
| Net income | 55,090 | 41,121 | 64,916 | |||||||||
| Other comprehensive loss, net of tax | (2,472 | ) | (624 | ) | (2,800 | ) | ||||||
| Comprehensive net income | $ | 52,618 | $ | 40,497 | $ | 62,116 | ||||||
| For the years ended December 31, | ||||||||||||
| Condensed Statements of Income | 2016 | 2015 | 2014 | |||||||||
| (In thousands) | ||||||||||||
| Dividends from the Bank | $ | 24,000 | $ | 26,000 | $ | 20,000 | ||||||
| Interest income | 247 | 242 | 512 | |||||||||
| Interest expense | (1,324 | ) | (1,075 | ) | (1,039 | ) | ||||||
| Net gain (loss) from fair value adjustments | (4,761 | ) | (231 | ) | 779 | |||||||
| Other operating expenses | (1,611 | ) | (1,298 | ) | (786 | ) | ||||||
| Income before taxes and equity in undistributed earnings of subsidiary | 16,551 | 23,638 | 19,466 | |||||||||
| Income tax benefit | 3,198 | 687 | 668 | |||||||||
| Income before equity in undistributed earnings of subsidiary | 19,749 | 24,325 | 20,134 | |||||||||
| Equity in undistributed earnings of the Bank | 45,167 | 21,884 | 24,105 | |||||||||
| Net income | 64,916 | 46,209 | 44,239 | |||||||||
| Other comprehensive (loss) income, net of tax | (2,800 | ) | (2,655 | ) | 8,468 | |||||||
| Comprehensive income | $ | 62,116 | $ | 43,554 | $ | 52,707 | ||||||
| For the years ended December 31, | For the years ended December 31, | |||||||||||||||||||||||
| Condensed Statements of Cash Flows | 2016 | 2015 | 2014 | 2018 | 2017 | 2016 | ||||||||||||||||||
| (In thousands) | (In thousands) | |||||||||||||||||||||||
| Operating activities: | ||||||||||||||||||||||||
| Net income | $ | 64,916 | $ | 46,209 | $ | 44,239 | $ | 55,090 | $ | 41,121 | $ | 64,916 | ||||||||||||
| Adjustments to reconcile net income to net cash provided by operating activities: | ||||||||||||||||||||||||
| Equity in undistributed earnings of the Bank | (45,167 | ) | (21,884 | ) | (24,105 | ) | (29,547 | ) | (22,307 | ) | (45,167 | ) | ||||||||||||
| Deferred income tax (benefit) provision | (2,316 | ) | 575 | 17 | ||||||||||||||||||||
| Deferred income tax benefit | (1,915 | ) | (3,990 | ) | (2,316 | ) | ||||||||||||||||||
| Fair value adjustments for financial assets and financial liabilities | 4,761 | 231 | (779 | ) | 4,769 | 2,903 | 4,761 | |||||||||||||||||
| Stock-based compensation expense | 5,120 | 4,676 | 4,246 | 7,016 | 5,990 | 5,120 | ||||||||||||||||||
| Net change in operating assets and liabilities | 3,318 | 2,174 | 2,088 | 4,246 | 2,453 | 3,318 | ||||||||||||||||||
| Net cash provided by operating activities | 30,632 | 31,981 | 25,706 | 39,659 | 26,170 | 30,632 | ||||||||||||||||||
| Investing activities: | ||||||||||||||||||||||||
| Investment in Bank | (66,497 | ) | - | - | - | - | (66,497 | ) | ||||||||||||||||
| Purchases of securities available for sale | - | - | (22 | ) | ||||||||||||||||||||
| Proceeds from sales and calls of securities available for sale | - | - | 1,699 | - | 300 | - | ||||||||||||||||||
| Net cash (used in) provided by investing activities | (66,497 | ) | - | 1,677 | ||||||||||||||||||||
| Net cash provided (used in) investing activities | - | 300 | (66,497 | ) | ||||||||||||||||||||
| Financing activities: | ||||||||||||||||||||||||
| Issuance of subordinated debt, net | 73,402 | - | - | - | - | 73,402 | ||||||||||||||||||
| Purchase of treasury stock | (9,858 | ) | (15,605 | ) | (18,872 | ) | (22,585 | ) | (9,290 | ) | (9,858 | ) | ||||||||||||
| Cash dividends paid | (19,689 | ) | (18,616 | ) | (17,852 | ) | (22,927 | ) | (20,954 | ) | (19,689 | ) | ||||||||||||
| Stock options exercised | 328 | 145 | 565 | 6 | - | 328 | ||||||||||||||||||
| Net cash provided by (used in) financing activities | 44,183 | (34,076 | ) | (36,159 | ) | |||||||||||||||||||
| Net cash (used in) provided by financing activities | (45,506 | ) | (30,244 | ) | 44,183 | |||||||||||||||||||
| Net decrease in cash and cash equivalents | 8,318 | (2,095 | ) | (8,776 | ) | |||||||||||||||||||
| Net (decrease) increase in cash and cash equivalents | (5,847 | ) | (3,774 | ) | 8,318 | |||||||||||||||||||
| Cash and cash equivalents, beginning of year | 5,654 | 7,749 | 16,525 | 10,198 | 13,972 | 5,654 | ||||||||||||||||||
| Cash and cash equivalents, end of year | $ | 13,972 | $ | 5,654 | $ | 7,749 | $ | 4,351 | $ | 10,198 | $ | 13,972 | ||||||||||||
Report of Independent Registered Public Accounting Firm
Board of Directors and Stockholders
Flushing Financial CorporationsCorporation
Uniondale, New York
Opinion on the Consolidated Financial Statements
We have audited the accompanying consolidated statements of financial condition of Flushing Financial Corporation and subsidiariesSubsidiaries (the “Company”) as of December 31, 20162018 and 2015 and2017, the related consolidated statements of income, comprehensive income, changes in stockholders’ equity, and cash flows for the years then ended. These financial statements are the responsibilityeach of the Company’s management. Our responsibility is to express an opinion on these financial statements based on our audits.
We conducted our audits in accordance with the standards of the Public Company Accounting Oversight Board (United States). Those standards require that we plan and perform the audit to obtain reasonable assurance about whether the financial statements are free of material misstatement. An audit includes examining, on a test basis, evidence supporting the amounts and disclosuresthree years in the period ended December 31, 2018, and the related notes (collectively referred to as the “consolidated financial statements, assessing the accounting principles used and significant estimates made by management, as well as evaluating the overall financial statement presentation. We believe that our audits provide a reasonable basis for our opinion.
statements”). In our opinion, the consolidated financial statements referred to above present fairly, in all material respects, the financial position of Flushing Financial Corporation and subsidiariesthe Company at December 31, 20162018 and 2015,2017, and the results of their operations and their cash flows for each of the three years thenin the period ended December 31, 2018, in conformity with accounting principles generally accepted in the United States of America.
We also have audited, in accordance with the standards of the Public Company Accounting Oversight Board (United States) (“PCAOB”), the Company’sCompany's internal control over financial reporting as of December 31, 2016,2018, based on criteria established inInternal Control – Integrated Framework (2013) issued by the Committee of Sponsoring Organizations of the Treadway Commission (COSO)(“COSO”) and our report dated March 13, 20171, 2019 expressed an unqualified opinion thereon.
Basis for Opinion
/s/ BDO USA, LLP
New York, New York
March 13, 2017
Report of Independent Registered Public Accounting Firm
Board of Directors and Shareholders
Flushing Financial Corporation
We have audited the accompanyingThese consolidated statements of income, comprehensive income, changes in shareholders’ equity, and cash flows of Flushing Financial Corporation (a Delaware corporation) and subsidiaries (the “Company”) for the year ended December 31, 2014. These financial statements are the responsibility of the Company’s management. Our responsibility is to express an opinion on thesethe Company’s consolidated financial statements based on our audit.audits. We are a public accounting firm registered with the PCAOB and are required to be independent with respect to the Company in accordance with the U.S. federal securities laws and the applicable rules and regulations of the Securities and Exchange Commission and the PCAOB.
We conducted our auditaudits in accordance with the standards of the Public Company Accounting Oversight Board (United States).PCAOB. Those standards require that we plan and perform the audit to obtain reasonable assurance about whether the consolidated financial statements are free of material misstatement. An audit includesmisstatement, whether due to error or fraud.
Our audits included performing procedures to assess the risks of material misstatement of the consolidated financial statements, whether due to error or fraud, and performing procedures that respond to those risks. Such procedures included examining, on a test basis, evidence supportingregarding the amounts and disclosures in the consolidated financial statements. An auditOur audits also includes assessingincluded evaluating the accounting principles used and significant estimates made by management, as well as evaluating the overall presentation of the consolidated financial statement presentation.statements. We believe that our audit providesaudits provide a reasonable basis for our opinion.
In our opinion,
We have served as the consolidated financial statements referred to above present fairly, in all material respects, the results of operations and cash flows of Flushing Financial Corporation and subsidiaries as of December 31, 2014, in conformity with accounting principles generally accepted in the United States of America.
Company's auditor since 2015.
/s/ GRANT THORNTONS/ BDO USA, LLP
New York, New York
March 16, 20151, 2019
131
Report of Independent Registered Public Accounting Firm
Board of Directors and Stockholders
Flushing Financial Corporation
Uniondale, New York
Opinion on Internal Control over Financial Reporting
We have audited Flushing Financial Corporation and subsidiaries’Subsidiaries’ (the “Company”“Company’s”) internal control over financial reporting as of December 31, 2016,2018, based on criteria established inInternal Control – Integrated Framework (2013) issued by the Committee of Sponsoring Organizations of the Treadway Commission (the “COSO criteria”). In our opinion, the Company maintained, in all material respects, effective internal control over financial reporting as of December 31, 2018, based on the COSO criteria). criteria.
We also have audited, in accordance with the standards of the Public Company Accounting Oversight Board (United States) (“PCAOB”), the consolidated statements of financial condition of Flushing Financial Corporation and Subsidiaries (the “Company”) as of December 31, 2018 and 2017, the related consolidated statements of income, comprehensive income, changes in stockholders’ equity, and cash flows for each of the three years in the period ended December 31, 2018, and the related notes and our report dated March 1, 2019 expressed an unqualified opinion thereon.
Basis for Opinion
The Company’s management is responsible for maintaining effective internal control over financial reporting and for its assessment of the effectiveness of internal control over financial reporting, included in the accompanying Item 9A, Management’s Report on Internal Control over Financial Reporting.Reporting. Our responsibility is to express an opinion on the Company’s internal control over financial reporting based on our audit. We are a public accounting firm registered with the PCAOB and are required to be independent with respect to the Company in accordance with U.S. federal securities laws and the applicable rules and regulations of the Securities and Exchange Commission and the PCAOB.
We conducted our audit of internal control over financial reporting in accordance with the standards of the Public Company Accounting Oversight Board (United States).PCAOB. Those standards require that we plan and perform the audit to obtain reasonable assurance about whether effective internal control over financial reporting was maintained in all material respects. Our audit included obtaining an understanding of internal control over financial reporting, assessing the risk that a material weakness exists, and testing and evaluating the design and operating effectiveness of internal control based on the assessed risk. Our audit also included performing such other procedures as we considered necessary in the circumstances. We believe that our audit provides a reasonable basis for our opinion.
Definition and Limitations of Internal Control over Financial Reporting
A company’s internal control over financial reporting is a process designed to provide reasonable assurance regarding the reliability of financial reporting and the preparation of financial statements for external purposes in accordance with generally accepted accounting principles. A company’s internal control over financial reporting includes those policies and procedures that (1) pertain to the maintenance of records that, in reasonable detail, accurately and fairly reflect the transactions and dispositions of the assets of the company; (2) provide reasonable assurance that transactions are recorded as necessary to permit preparation of financial statements in accordance with generally accepted accounting principles, and that receipts and expenditures of the company are being made only in accordance with authorizations of management and directors of the company; and (3) provide reasonable assurance regarding prevention or timely detection of unauthorized acquisition, use, or disposition of the company’s assets that could have a material effect on the financial statements.
Because of its inherent limitations, internal control over financial reporting may not prevent or detect misstatements. Also, projections of any evaluation of effectiveness to future periods are subject to the risk that controls may become inadequate because of changes in conditions, or that the degree of compliance with the policies or procedures may deteriorate.
In our opinion, the Company maintained, in all material respects, effective internal control over financial reporting as of December 31, 2016, based on the COSO criteria.
We also have audited, in accordance with the standards of the Public Company Accounting Oversight Board (United States), the consolidated statements of financial condition of the Company as of December 31, 2016 and 2015, and the related consolidated statements of income, comprehensive income, changes in stockholders’ equity, and cash flows for the years then ended and our report dated March 13, 2017 expressed an unqualified opinion thereon.
/s/S/ BDO USA, LLP
New York, New York
March 13, 20171, 2019
Item 9. Changes in and Disagreements with Accountants on Accounting and Financial Disclosure.
| Item 9. | Changes in and Disagreements with Accountants on Accounting and Financial Disclosure. |
None.
Item 9A. Controls and Procedures.
| Item 9A. | Controls and Procedures. |
Disclosure Controls and Procedures
The Company carried out, under the supervision and with the participation of the Company's management, including its Chief Executive Officer and Chief Financial Officer, an evaluation of the effectiveness of the design and operation of the Company’s disclosure controls and procedures (as defined in Rule 13a-15(e) under the Securities Exchange Act of 1934) as of the end of the period covered by this Annual Report. Based upon that evaluation, the Chief Executive Officer and Chief Financial Officer concluded that, as of December 31, 2016,2018, the design and operation of these disclosure controls and procedures were effective. During the period covered by this Annual Report, there have been no changes in the Company's internal control over financial reporting that have materially affected, or are reasonably likely to materially affect, the Company's internal control over financial reporting.
Management’s Report on Internal Control over Financial Reporting
Management is responsible for establishing and maintaining adequate internal control over financial reporting, and for performing an assessment of the effectiveness of internal control over financial reporting as of December 31, 2016.2018. Internal control over financial reporting is defined in Rule 13a-15(f) or 15d-15(f) promulgated under the Securities Exchange Act of 1934 as a process designed by, or under the supervision of, the Company’s principal executive and principal financial officers and effected by the Company’s Board of Directors, management and other personnel, to provide reasonable assurance regarding the reliability of financial reporting and the preparation of financial statements for external purposes in accordance with generally accepted accounting principles. Internal control over financial reporting includes those policies and procedures that (1) pertain to the maintenance of records that, in reasonable detail, accurately and fairly reflect the transactions and dispositions of the assets of the Company; (2) provide reasonable assurance that transactions are recorded as necessary to permit preparation of financial statements in accordance with generally accepted accounting principles, and that receipts and expenditures of the Company are being made only in accordance with authorizations of management and directors of the Company; and (3) provide reasonable assurance regarding prevention or timely detection of unauthorized acquisition, use or disposition of the Company’s assets that could have a material effect on the financial statements.
Because of its inherent limitations, internal control over financial reporting may not prevent or detect misstatements. Also, projections of any evaluation of effectiveness to future periods are subject to the risk that controls may become inadequate because of changes in conditions, or that the degree of compliance with the policies or procedures may deteriorate.
Management performed an assessment of the effectiveness of the Company’s internal control over financial reporting as of December 31, 20162018 based upon criteria in Internal Control – Integrated Framework issued by the Committee of Sponsoring Organizations of the Treadway Commission (2013 Framework) (“COSO”). Based on this assessment, management concluded that the Company’s internal control over financial reporting was effective as of December 31, 20162018 based on those criteria issued by COSO.
BDO USA, LLP, the Company’s independent registered public accounting firm that audited the Company’s consolidated financial statements included in this Annual Report on Form 10-K, has issued a report on the effectiveness of the Company’s internal control over financial reporting as of December 31, 2016,2018, as stated in its report which appears on page 143.report.
| Item 9B. | Other Information. |
None.
133
Item 10. Directors, Executive Officers and Corporate Governance.
| Item 10. | Directors, Executive Officers and Corporate Governance. |
Other than the disclosures below, information regarding the directors and executive officers of the Company appears in the Company’s Proxy Statement for the Annual Meeting of Stockholders to be held May 31, 201729, 2019 (“Proxy Statement”) under the captions “Board Nominees,” “Continuing Directors,” “Executive Officers Who Are Not Directors” and “Meeting and Committees of the Board of Directors – Audit Committee” and is incorporated herein by this reference. Information regarding Section 16(a) beneficial ownership appears in the Company’s Proxy Statement under the caption “Section 16(a) Beneficial Ownership Reporting Compliance” and is incorporated herein by this reference.
Code of Ethics. The Company has adopted a Code of Business Conduct and Ethics that applies to all of its directors, officers and employees. This code is publicly available on the Company’s website at: https https:http://www.snl.com/platform.mi.spglobal.com/Cache/1001213939.PDF?Y=&O=1001240240.PDF?O=PDF&T=&Y=&D=&FID=1001213939&T=&IID=1001240240&iid=102398
Any substantive amendments to the code and any grant of a waiver from a provision of the code requiring disclosure under applicable SEC or NASDAQ rules will be disclosed in a report on Form 8-K.
Audit Committee Financial Expert. The Board of Directors of the Company has determined that Louis C. Grassi, the Chairman of the Audit Committee, is an “audit committee financial expert” as defined under Item 401(h) of Regulation S-K, and that he is independent as defined under applicable NASDAQ listing standards. Mr. Grassi is a certified public accountant and a certified fraud examiner.
Item 11. Executive Compensation.
| Item 11. | Executive Compensation. |
Information regarding executive compensation appears in the Proxy Statement under the caption “Executive Compensation” and is incorporated herein by this reference.
Item 12. Security Ownership of Certain Beneficial Owners and Management and Related Stockholder Matters.
| Item 12. | Security Ownership of Certain Beneficial Owners and Management and Related Stockholder Matters. |
Information regarding security ownership of certain beneficial owners appears in the Proxy Statement under the caption “Stock Ownership of Certain Beneficial Owners” and is incorporated herein by this reference.
Information regarding security ownership of management appears in the Proxy Statement under the caption “Stock Ownership of Management” and is incorporated herein by this reference.
Item 13. Certain Relationships and Related Transactions, and Director Independence.
| Item 13. | Certain Relationships and Related Transactions, and Director Independence. |
Information regarding certain relationships and related transactions and directors independence appears in the Proxy Statement under the captions “Compensation Committee Interlocks and Insider Participation” and “Related Party Transactions” and is incorporated herein by this reference.
Item 14. Principal Accounting Fees and Services.
| Item 14. | Principal Accounting Fees and Services. |
Information regarding fees paid to the Company’s independent auditor appears in the Proxy Statement under the caption “Schedule of Fees to Independent Auditors” and is hereby incorporated by this reference.
134
Item 15. Exhibits, Financial Statement Schedules.
| Item 15. | Exhibits, Financial Statement Schedules. |
The following financial statements are included in Item 8 of this Annual Report and are incorporated herein by this reference:
| · | Consolidated Statements of Financial Condition at December 31, |
| · | Consolidated Statements of Income for each of the three years in the period ended December 31, |
| · | Consolidated Statements of Comprehensive Income for each of the three years in the period ended December 31, |
| · | Consolidated Statements of Changes in Stockholders’ Equity for each of the three years in the period ended December 31, |
| · | Consolidated Statements of Cash Flows for each of the three years in the period ended December 31, |
| · | Notes to Consolidated Financial Statements |
| · | Reports of Independent Registered Public Accounting Firm |
2. Financial Statement Schedules
Financial Statement Schedules have been omitted because they are not applicable or the required information is shown in the Consolidated Financial Statements or Notes thereto included in Item 8 of this Annual Report and are incorporated herein by this reference.
3. Exhibits Required by Securities and Exchange Commission Regulation S-K
136
| 21.1 | Subsidiaries information incorporated herein by reference to Part I – Subsidiary Activities |
| 23.1 | Consent of Independent Registered Public Accounting Firm (filed herewith) | |
| 31.1 | Certification pursuant to Section 302 of the Sarbanes-Oxley Act of 2002 by the Chief Executive Officer (filed herewith) | |
| 31.2 | Certification pursuant to Section 302 of the Sarbanes-Oxley Act of 2002 by the Chief Financial Officer (filed herewith) | |
| 32.1 | ||
| 32.2 | Certification Pursuant to 18 U.S.C, Section 1350, as adopted pursuant to Section 906 of the Sarbanes-Oxley Act of 2002 by the Chief Financial Officer (furnished herewith) | |
| 101.INS | XBRL Instance Document (filed herewith) | |
| 101.SCH | XBRL Taxonomy Extension Schema Document (filed herewith) | |
| 101.CAL | XBRL Taxonomy Extension Calculation Linkbase Document (filed herewith) | |
| 101.DEF | XBRL Taxonomy Extension Definition Linkbase Document (filed herewith) | |
| 101.LAB | XBRL Taxonomy Extension Label Linkbase Document (filed herewith) | |
| 101.PRE | XBRL Taxonomy Extension Presentation Linkbase Document (filed herewith) |
* Indicates compensatory plan or arrangement.
__________________________
| (1) | Incorporated by reference to Exhibits filed with the Registration Statement on Form S-1 filed September 1, 1995, Registration No. 33-96488. (P: Indicates a filing submitted in paper) |
| (2) | Incorporated by reference to Exhibits filed with Form 10-Q for the quarter ended September 30, 1996. |
| (3) | Incorporated by reference to Exhibits filed with Form 10-K for the year ended December 31, 1997. |
| (4) | Incorporated by reference to Exhibits filed with Form 10-Q for the quarter ended September 30, 2000. |
| (5) | Incorporated by reference to Exhibits filed with Form S-8 filed May 31, 2002. |
| (6) | Incorporated by reference to Exhibits filed with Form 10-Q for the quarter ended September 30, 2002. |
| (7) | Incorporated by reference to Exhibits filed with Form 10-K for the year ended December 31, 2004. |
| (8) | Incorporated by reference to Exhibits filed with Form 10-Q for the quarter ended March 31, 2006. |
| (9) | Incorporated by reference to Exhibit filed with Form 8-K filed December 12, 2016. |
| (10) | Incorporated by reference to Exhibit filed with Form 8-K filed September 27, 2006. |
| (11) | Incorporated by reference to Appendices filed with Proxy Statement on Schedule 14A filed April 7, 2011. |
| (12) | Incorporated by reference to Exhibits filed with Form 10-Q for the quarter ended September 30, 2011. |
| (13) | Incorporated by reference to Exhibits filed with Form 10-K for the year ended December 31, 2011. |
| (14) | Incorporated by reference to Exhibits filed with Form 10-Q for the quarter ended June 30, 2013. |
| (15) | Incorporated by reference to Exhibits filed with Form 10-Q for the quarter ended June 30, 2014. |
| (16) | Incorporated by reference to Exhibits filed with Form 10-K for the year ended December 31, 2014. |
| (17) | Incorporated by reference to Exhibits filed with Form 10-K for the year ended December 31, 2015. |
| (18) | Incorporated by reference to Exhibits filed with Form 10-Q for the quarter ended March 31, 2016. |
137
Pursuant to the requirements of Section 13 or 15(d) the Securities Exchange Act of 1934, the Company has duly caused this report, to be signed on its behalf by the undersigned, thereunto duly authorized, in New York, New York, on March 13, 2017.1, 2019.
FLUSHING FINANCIAL CORPORATION | ||||
| By | /S/JOHN R. BURAN | |||
| John R. Buran | ||||
President and CEO | ||||
We, the undersigned directors and officers of Flushing Financial Corporation (the “Company”) hereby severally constitute and appoint John R. Buran and Susan K. Cullen as our true and lawful attorneys and agents, each acting alone and with full power of substitution and re-substitution, to do any and all things in our names in the capacities indicated below which said John R. Buran or Susan K. Cullen may deem necessary or advisable to enable the Company to comply with the Securities Exchange Act of 1934, and any rules, regulations and requirements of the Securities and Exchange Commission, in connection with the report on Form 10-K, or amendment thereto, including specifically, but not limited to, power and authority to sign for us in our names in the capacities indicated below the report on Form 10-K, or amendment thereto; and we hereby approve, ratify and confirm all that said John R. Buran or Susan K. Cullen shall do or cause to be done by virtue thereof.
Pursuant to the requirements of the Securities Exchange Act of 1934, this report on Form 10-K, has been signed by the following persons in the capacities and on the dates indicated.
| Signature | Title | Date
| ||
| /S/ JOHN R. BURAN | Director, President (Principal Executive Officer) | |||
| John R. Buran | ||||
| /S/ALFRED A. DELLIBOVI | Director, Chairman | |||
| Alfred A. DelliBovi | ||||
| /S/ SUSAN K. CULLEN | Treasurer (Principal Financial and Accounting Officer) | |||
| Susan K. Cullen | ||||
| /S/ JAMES D. BENNETT | Director | |||
James D. Bennett | ||||
| /S/ STEVEN J. D'IORIO | Director | |||
| Steven J. D'Iorio | ||||
138
| /S/ LOUIS C. GRASSI | Director | |||
| Louis C. Grassi | ||||
| /S/ SAM S. HAN | Director | |||
| Sam S. Han | ||||
| /S/ JOHN J. MCCABE | Director | |||
| John J. McCabe | ||||
| /S/ DONNA M. O'BRIEN | Director | |||
| Donna M. O'Brien | ||||
| /S/ MICHAEL J. RUSSO | Director | |||
| Michael J. Russo | ||||
| /S/ THOMAS S. GULOTTA | Director | |||
| Thomas S. Gulotta | ||||
| /S/ CAREN C. YOH | Director | |||
| Caren C. Yoh |
150
139